UNITED STATES
SECURITIES AND EXCHANGE COMMISSION
Washington, D.C. 20549
FORM 6-K
REPORT OF FOREIGN PRIVATE ISSUER
PURSUANT TO RULE 13A-16 OR 15D-16 OF
THE SECURITIES EXCHANGE ACT OF 1934
For the month of June 2025
Commission File Number: 001-34244
HUDBAY MINERALS INC.
(Translation of registrant’s name into English)
25 York Street, Suite 800
Toronto, Ontario
M5J 2V5, Canada
(Address of principal executive offices)
Indicate by check mark whether the registrant files or will file annual reports under cover of Form 20-F or Form 40-F.
Form 20-F [ ] Form 40-F [X]
Indicate by check mark whether the registrant by furnishing the information contained in this Form is also thereby furnishing the information to the Commission pursuant to Rule 12g3-2(b) under the Securities Exchange Act of 1934.
Yes [ ] No [X]
EXPLANATORY NOTE
If “Yes” is marked, indicate below the file number assigned to the registrant in connection with Rule 12g3-2(b): 82- _____________________________ On August 13, 2025, Hudbay Minerals Inc. (“Hudbay”) filed on the Canadian Securities Administrators’ System for Electronic Document Analysis and Retrieval (SEDAR) website at www.sedarplus.ca the following documents: (1) Unaudited Condensed Consolidated Interim Financial Statements for the period ended June 30, 2025, (2) Management's Discussion and Analysis for the period ended June 30, 2025, (3) News Release dated August 13, 2025, (4) Form 52-109F2 Certification of Interim Filings Full Certificate - CEO, (5) Form 52-109F2 Certification of Interim Filings Full Certificate - CFO.
Copies of the filings are attached to this Form 6-K and incorporated herein by reference, as follows:
Exhibit 99.1 — Unaudited Condensed Consolidated Interim Financial Statements for the period ended June 30, 2025
Exhibit 99.2 — Management's Discussion and Analysis for the period ended June 30, 2025
Exhibit 99.3 — News Release dated August 13, 2025
Exhibit 99.4 — Form 52-109F2 Certification of Interim Filings Full Certificate - CEO
Exhibit 99.5 — Form 52-109F2 Certification of Interim Filings Full Certificate - CFO Pursuant to the requirements of the Securities Exchange Act of 1934, the registrant has duly caused this report to be signed on its behalf by the undersigned, thereunto duly authorized.
2
SIGNATURE
| HUDBAY MINERALS INC. | ||
| (registrant) | ||
| By: | /s/ Eugene Lei | |
| Name: | Eugene Lei | |
| Title: | Chief Financial Officer | |
Date: August 14, 2025
3
EXHIBIT INDEX
The following exhibits are furnished as part of this Form 6-K:
4
Unaudited Condensed Consolidated Interim Financial Statements
(In US dollars)
HUDBAY MINERALS INC.
For the three and six months ended June 30, 2025 and 2024
| HUDBAY MINERALS INC. Condensed Consolidated Interim Balance Sheets (Unaudited and in millions of US dollars) |
| Jun. 30, | Dec. 31, | ||||||
| Note | 2025 | 2024 | |||||
| Assets | |||||||
| Current assets | |||||||
| Cash and cash equivalents | $ | 625.5 | $ | 541.8 | |||
| Short-term investments | 6 | - | 40.0 | ||||
| Trade and other receivables | 7 | 237.2 | 235.5 | ||||
| Inventories | 8 | 164.2 | 197.4 | ||||
| Prepaid expenses and other current assets | 10.7 | 17.4 | |||||
| Other financial assets | 9 | 0.9 | 15.3 | ||||
| Taxes receivable | 0.8 | 1.1 | |||||
| 1,039.3 | 1,048.5 | ||||||
| Taxes receivable | 15.2 | 12.9 | |||||
| Inventories | 8 | 17.2 | 16.6 | ||||
| Other financial assets | 9 | 39.3 | 12.1 | ||||
| Intangibles and other assets | 10 | 50.7 | 44.3 | ||||
| Property, plant and equipment | 11 | 4,316.1 | 4,181.4 | ||||
| Deferred tax assets | 77.8 | 102.6 | |||||
| Goodwill | 73.0 | 69.2 | |||||
| $ | 5,628.6 | $ | 5,487.6 | ||||
| Liabilities | |||||||
| Current liabilities | |||||||
| Trade and other payables | $ | 259.9 | $ | 270.2 | |||
| Taxes payable | 37.7 | 100.7 | |||||
| Other liabilities | 12 | 44.5 | 34.4 | ||||
| Other financial liabilities | 13 | 53.0 | 38.3 | ||||
| Lease liabilities | 14 | 35.6 | 30.5 | ||||
| Current portion of long-term debt | 15 | 523.8 | - | ||||
| Deferred revenue | 16 | 58.0 | 63.1 | ||||
| 1,012.5 | 537.2 | ||||||
| Other financial liabilities | 13 | 152.0 | 114.4 | ||||
| Lease liabilities | 14 | 41.5 | 44.3 | ||||
| Long-term debt | 15 | 535.8 | 1,107.5 | ||||
| Deferred revenue | 16 | 279.1 | 309.1 | ||||
| Pension obligations | 7.1 | 6.2 | |||||
| Other employee benefits | 82.2 | 80.3 | |||||
| Environmental and other provisions | 17 | 315.5 | 300.8 | ||||
| Deferred tax liabilities | 339.6 | 340.4 | |||||
| 2,765.3 | 2,840.2 | ||||||
| Equity | |||||||
| Share capital | 19b | 2,652.3 | 2,641.3 | ||||
| Reserves | 98.1 | 14.3 | |||||
| Retained earnings | 112.9 | (102.4 | ) | ||||
| Equity attributable to owners of the Company | 2,863.3 | 2,553.2 | |||||
| Non-controlling interest | 4 | - | 94.2 | ||||
| $ | 5,628.6 | $ | 5,487.6 | ||||
| Commitments (note 22) |
| HUDBAY MINERALS INC. Condensed Consolidated Interim Statements of Income (Loss) (Unaudited and in millions of US dollars, except per share amounts) |
| Three months ended June 30, |
Six months ended June 30, |
||||||||||||
| 2025 | 2024 | 2025 | 2024 | ||||||||||
| Revenue | 5a | $ | 536.4 | $ | 425.5 | $ | 1,131.3 | $ | 950.5 | ||||
| Cost of sales | |||||||||||||
| Mine operating costs | 263.5 | 250.3 | 519.0 | 514.0 | |||||||||
| Depreciation and amortization | 5b | 96.4 | 97.6 | 204.5 | 206.9 | ||||||||
| 359.9 | 347.9 | 723.5 | 720.9 | ||||||||||
| Gross profit | 176.5 | 77.6 | 407.8 | 229.6 | |||||||||
| Selling and administrative expenses | 20.7 | 18.4 | 34.4 | 35.0 | |||||||||
| Exploration expenses | 9.4 | 6.0 | 23.3 | 18.6 | |||||||||
| Other expenses | 5c | 7.1 | 11.2 | 12.3 | 27.5 | ||||||||
| Re-evaluation adjustment - environmental provision | 17 | (13.8 | ) | (2.7 | ) | (1.0 | ) | (8.0 | ) | ||||
| Results from operating activities | 153.1 | 44.7 | 338.8 | 156.5 | |||||||||
| Net interest expense on long term debt | 5d | 15.6 | 18.5 | 31.5 | 37.7 | ||||||||
| Accretion on streaming arrangements | 5d | 5.2 | 6.0 | 9.6 | 12.2 | ||||||||
| Change in fair value of financial instruments | 5d | (4.1 | ) | 13.2 | (9.3 | ) | 20.2 | ||||||
| Other net finance (income) costs | 5d | (16.7 | ) | 6.6 | (17.4 | ) | 18.2 | ||||||
| Net finance expense | - | 44.3 | 14.4 | 88.3 | |||||||||
| Income before tax | 153.1 | 0.4 | 324.4 | 68.2 | |||||||||
| Tax expense | 18 | 38.4 | 20.7 | 110.5 | 70.0 | ||||||||
| Net income (loss) for the period | $ | 114.7 | $ | (20.3 | ) | $ | 213.9 | $ | (1.8 | ) | |||
| Attributable to: | |||||||||||||
| Owners of the Company | $ | 117.7 | $ | (16.5 | ) | $ | 218.1 | $ | 5.8 | ||||
| Non-controlling interest | (3.0 | ) | (3.8 | ) | (4.2 | ) | (7.6 | ) | |||||
| Net income (loss) for the period | $ | 114.7 | $ | (20.3 | ) | $ | 213.9 | $ | (1.8 | ) | |||
| Earnings (loss) per share attributable to owners | |||||||||||||
| Basic and diluted | $ | 0.30 | $ | (0.04 | ) | $ | 0.55 | $ | 0.02 | ||||
| Weighted average number of common shares outstanding: | |||||||||||||
| Basic | 20 | 395,085,907 | 368,344,407 | 395,018,364 | 359,562,824 | ||||||||
| Diluted | 20 | 395,827,311 | 368,344,407 | 395,759,554 | 360,052,424 | ||||||||
| HUDBAY MINERALS INC. Condensed Consolidated Interim Statements of Comprehensive Income (Unaudited and in millions of US dollars) |
| Three months ended June 30, | Six months ended June 30, | |||||||||||
| 2025 | 2024 | 2025 | 2024 | |||||||||
| Net income (loss) for the period | $ | 114.7 | $ | (20.3 | ) | $ | 213.9 | $ | (1.8 | ) | ||
| Other comprehensive income: | ||||||||||||
| Item that will be reclassified subsequently to profit or loss: | ||||||||||||
| Recognized directly in equity: | ||||||||||||
| Net gain (loss) on translation of foreign currency balances | 26.4 | (6.2 | ) | 26.8 | (23.0 | ) | ||||||
| Items that will not be reclassified subsequently to profit or loss: | ||||||||||||
| Recognized directly in equity: | ||||||||||||
| Remeasurement - actuarial gain | 1.2 | 12.3 | 2.5 | 15.9 | ||||||||
| Tax effect | 0.1 | (2.6 | ) | (0.1 | ) | (2.6 | ) | |||||
| 1.3 | 9.7 | 2.4 | 13.3 | |||||||||
| Other comprehensive income (loss) net of tax, for the period | 27.7 | 3.5 | 29.2 | (9.7 | ) | |||||||
| Total comprehensive income (loss) for the period | $ | 142.4 | $ | (16.8 | ) | $ | 243.1 | $ | (11.5 | ) | ||
| Attributable to: | ||||||||||||
| Owners of the Company | $ | 142.3 | $ | (13.0 | ) | 244.1 | (1.2 | ) | ||||
| Non-controlling interest | 0.1 | (3.8 | ) | (1.0 | ) | (10.3 | ) | |||||
| Total comprehensive income (loss) for the period | 142.4 | (16.8 | ) | $ | 243.1 | $ | (11.5 | ) | ||||
| HUDBAY MINERALS INC. Condensed Consolidated Interim Statements of Cash Flows (Unaudited and in millions of US dollars) |
| Three months ended June 30, | Six months ended June 30, | ||||||||||||
| Note | 2025 | 2024 | 2025 | 2024 | |||||||||
| Cash generated from operating activities: | |||||||||||||
| Net income (loss) for the period | $ | +114.7 | $ | (20.3 | ) | $ | 213.9 | $ | (1.8 | ) | |||
| Items not affecting cash: | |||||||||||||
| Tax expense | 18 | 38.4 | 20.7 | 110.5 | 70.0 | ||||||||
| Depreciation and amortization | 5b | 96.8 | 98.0 | 205.3 | 207.8 | ||||||||
| Share-based compensation | 5e | 10.8 | 8.8 | 14.8 | 14.6 | ||||||||
| Net finance expense | 5d | - | 44.3 | 14.4 | 88.3 | ||||||||
| Inventory adjustments | 8 | 3.5 | - | 4.7 | - | ||||||||
| Amortization of deferred revenue and variable consideration | 5a | (15.4 | ) | (11.6 | ) | (44.7 | ) | (34.8 | ) | ||||
| Pension and other employee benefit payments, net of accruals | 0.9 | 2.1 | 4.1 | 5.3 | |||||||||
| Amortization of community agreements | 3.1 | 5.1 | 5.0 | 8.1 | |||||||||
| Re-evaluation adjustment - environmental obligation | 17 | (13.8 | ) | (2.7 | ) | (1.0 | ) | (8.0 | ) | ||||
| Write-down/loss on disposal of PP&E | 5c | 0.3 | 2.0 | 0.9 | 11.1 | ||||||||
| Decommissioning and restoration payments | (0.4 | ) | (0.2 | ) | (0.5 | ) | (0.3 | ) | |||||
| Other | 23a | (1.1 | ) | (0.9 | ) | (8.6 | ) | (3.7 | ) | ||||
| Taxes paid | (43.9 | ) | (21.6 | ) | (161.4 | ) | (85.4 | ) | |||||
| Operating cash flow before change in non-cash working capital | 193.9 | 123.7 | 357.4 | 271.2 | |||||||||
| Change in non-cash working capital | 23b | 66.0 | 16.5 | 27.3 | 8.6 | ||||||||
| 259.9 | 140.2 | 384.7 | 279.8 | ||||||||||
| Cash used in investing activities: | |||||||||||||
| Acquisition of property, plant and equipment | (121.7 | ) | (89.5 | ) | (213.1 | ) | (151.9 | ) | |||||
| Acquisition of intangibles | (0.8 | ) | - | (2.4 | ) | - | |||||||
| Community agreements | (5.2 | ) | (2.6 | ) | (9.0 | ) | (3.9 | ) | |||||
| Grants received | 11 | - | - | - | 2.4 | ||||||||
| Purchase of investments | 9 | - | - | (13.8 | ) | - | |||||||
| Proceeds from disposition of property, plant and equipment | - | - | 0.1 | - | |||||||||
| Change in restricted cash | 0.6 | - | 0.8 | - | |||||||||
| Maturity of (investment in) short-term investments | 6 | 20.0 | (40.0 | ) | 40.0 | (40.0 | ) | ||||||
| Investment income received | 6.5 | 2.9 | 12.5 | 5.3 | |||||||||
| (100.6 | ) | (129.2 | ) | (184.9 | ) | (188.1 | ) | ||||||
| Cash (used in) generated from financing activities: | |||||||||||||
| Repayment of revolving credit facility | 15b | - | (90.0 | ) | - | (100.0 | ) | ||||||
| Repurchase of senior unsecured notes, net of discount | (50.0 | ) | (33.8 | ) | (50.0 | ) | (33.8 | ) | |||||
| Copper Mountain non-controlling interest acquisition payment | 4 | (6.0 | ) | - | (6.0 | ) | - | ||||||
| Equity issuance, net of share issuance costs | 19b | 4.2 | 386.2 | 4.2 | 386.2 | ||||||||
| Interest paid on long-term debt | (29.9 | ) | (32.4 | ) | (29.9 | ) | (33.3 | ) | |||||
| Financing costs | (2.9 | ) | (5.3 | ) | (6.1 | ) | (10.6 | ) | |||||
| Lease payments | 14 | (9.3 | ) | (8.1 | ) | (18.4 | ) | (15.9 | ) | ||||
| Equipment financing payments | (4.6 | ) | (2.3 | ) | (8.9 | ) | (3.2 | ) | |||||
| Gold prepayment repayments | - | (24.0 | ) | - | (45.4 | ) | |||||||
| Net payments on settlement of non-QP hedges | (1.6 | ) | (1.6 | ) | (3.4 | ) | (1.6 | ) | |||||
| Net proceeds from exercise of stock options and warrants | 1.2 | 1.1 | 1.6 | 2.4 | |||||||||
| Dividends paid | 19b | - | - | (2.8 | ) | (2.6 | ) | ||||||
| (98.9 | ) | 189.8 | (119.7 | ) | 142.2 | ||||||||
| Effect of movement in exchange rates on cash | 2.5 | (1.4 | ) | 3.6 | 0.1 | ||||||||
| Net increase in cash and cash equivalents | 62.9 | 199.4 | 83.7 | 234.0 | |||||||||
| Cash and cash equivalents, beginning of the period | 562.6 | 284.4 | 541.8 | 249.8 | |||||||||
| Cash and cash equivalents, end of the period | $ | 625.5 | $ | 483.8 | $ | 625.5 | $ | 483.8 | |||||
| HUDBAY MINERALS INC. Condensed Consolidated Interim Statements of Changes in Equity (Unaudited and in millions of US dollars) |
| Share capital (note 19) |
Other capital reserves |
Foreign currency translation reserve |
Remeasurement |
Retained earnings |
Total | Non- controlling interest |
Total equity | |||||||||||||||||
| Balance, January 1, 2024 | $ | 2,240.2 | $ | 61.3 | $ | (5.4 | ) | $ | (25.7 | ) | $ | (173.6 | ) | $ | 2,096.8 | $ | 110.0 | $ | 2,206.8 | |||||
| Net income (loss) | - | - | - | - | 5.8 | 5.8 | (7.6 | ) | (1.8 | ) | ||||||||||||||
| Other comprehensive (loss) income | - | - | (20.3 | ) | 13.3 | - | (7.0 | ) | (2.7 | ) | (9.7 | ) | ||||||||||||
| Total comprehensive (loss) income | - | - | (20.3 | ) | 13.3 | 5.8 | (1.2 | ) | (10.3 | ) | (11.5 | ) | ||||||||||||
| Contributions by and distributions to owners: | ||||||||||||||||||||||||
| Dividends (note 19b) | - | - | - | - | (2.6 | ) | (2.6 | ) | - | (2.6 | ) | |||||||||||||
| Stock options | - | 1.0 | - | - | - | 1.0 | - | 1.0 | ||||||||||||||||
| Shares issued on equity raise, net of share issuance costs | 386.2 | - | - | - | - | 386.2 | - | 386.2 | ||||||||||||||||
| Issuance of shares related to stock options and warrants exercised | 3.5 | (1.1 | ) | - | - | - | 2.4 | - | 2.4 | |||||||||||||||
| Total contributions by and distributions to owners | 389.7 | (0.1 | ) | - | - | (2.6 | ) | 387.0 | - | 387.0 | ||||||||||||||
| Balance, June 30, 2024 | $ | 2,629.9 | $ | 61.2 | $ | (25.7 | ) | $ | (12.4 | ) | $ | (170.4 | ) | $ | 2,482.6 | $ | 99.7 | $ | 2,582.3 | |||||
| Net income | - | - | - | - | 70.9 | 70.9 | (1.3 | ) | 69.6 | |||||||||||||||
| Other comprehensive (loss) income | - | - | (22.7 | ) | 13.6 | - | (9.1 | ) | (4.2 | ) | (13.3 | ) | ||||||||||||
| Total comprehensive (loss) income | - | - | (22.7 | ) | 13.6 | 70.9 | 61.8 | (5.5 | ) | 56.3 | ||||||||||||||
| Contributions by and distributions to owners: | ||||||||||||||||||||||||
| Dividends (note 19b) | - | - | - | - | (2.9 | ) | (2.9 | ) | - | (2.9 | ) | |||||||||||||
| Flow-through shares issued, net of share issuance costs (note 19b) | 8.6 | - | - | - | - | 8.6 | - | 8.6 | ||||||||||||||||
| Stock options | - | 1.1 | - | - | - | 1.1 | - | 1.1 | ||||||||||||||||
| Issuance of shares related to stock options and warrants exercised | 2.8 | (0.8 | ) | - | - | - | 2.0 | - | 2.0 | |||||||||||||||
| Total contributions by and distributions to owners | 11.4 | 0.3 | - | - | (2.9 | ) | 8.8 | - | 8.8 | |||||||||||||||
| Balance, December 31, 2024 | $ | 2,641.3 | $ | 61.5 | $ | (48.4 | ) | $ | 1.2 | $ | (102.4 | ) | $ | 2,553.2 | $ | 94.2 | $ | 2,647.4 |
| HUDBAY MINERALS INC. Condensed Consolidated Interim Statements of Changes in Equity (Unaudited and in millions of US dollars) |
| Share capital (note 19) |
Other capital reserves |
Foreign currency translation reserve |
Remeasurement reserve |
Retained earnings |
Total | Non- controlling interest |
Total equity | |||||||||||||||||
| Balance, January 1, 2025 | $ | 2,641.3 | $ | 61.5 | $ | (48.4 | ) | $ | 1.2 | $ | (102.4 | ) | $ | 2,553.2 | $ | 94.2 | $ | 2,647.4 | ||||||
| Net income (loss) | - | - | - | - | 218.1 | 218.1 | (4.2 | ) | 213.9 | |||||||||||||||
| Other comprehensive income | - | - | 23.6 | 2.4 | - | 26.0 | 3.2 | 29.2 | ||||||||||||||||
| Total comprehensive income (loss) | - | - | 23.6 | 2.4 | 218.1 | 244.1 | (1.0 | ) | 243.1 | |||||||||||||||
| Contributions by and distributions to owners: | ||||||||||||||||||||||||
| Dividends (note 19b) | - | - | - | - | (2.8 | ) | (2.8 | ) | - | (2.8 | ) | |||||||||||||
| Shares issued on equity raise, net of share issuance costs | 4.2 | - | - | - | - | 4.2 | - | 4.2 | ||||||||||||||||
| Copper Mountain non-controlling interest acquisition (note 4) | 61.3 | (4.0 | ) | - | - | 57.3 | (93.2 | ) | (35.9 | ) | ||||||||||||||
| Stock options | - | 1.3 | - | - | - | 1.3 | - | 1.3 | ||||||||||||||||
| Issuance of shares related to stock options and warrants exercised | 2.4 | (0.8 | ) | - | - | - | 1.6 | - | 1.6 | |||||||||||||||
| Tax adjustments in respect of prior years | 4.4 | - | - | - | - | 4.4 | - | 4.4 | ||||||||||||||||
| Total contributions by and distributions to owners | 11.0 | 61.8 | (4.0 | ) | - | (2.8 | ) | 66.0 | (93.2 | ) | (27.2 | ) | ||||||||||||
| Balance, June 30, 2025 | $ | 2,652.3 | $ | 123.3 | $ | (28.8 | ) | $ | 3.6 | $ | 112.9 | $ | 2,863.3 | $ | - | $ | 2,863.3 |
| HUDBAY MINERALS INC. Notes to Unaudited Condensed Consolidated Interim Financial Statements (in millions of US dollars, except where otherwise noted) For the three and six months ended June 30, 2025 and 2024 |
1. Reporting entity
Hudbay Minerals Inc. ("HMI" or the "Company") is a company existing under the Canada Business Corporations Act. The address of the Company's principal executive office is 25 York Street, Suite 800, Toronto, Ontario. The unaudited condensed consolidated interim financial statements ("financial statements") of the Company for the three and six months ended June 30, 2025 and 2024 represent the financial position and the financial performance of the Company and its subsidiaries (together referred to as "Hudbay").
Wholly owned subsidiaries as at June 30, 2025 included Copper Mountain Mine (BC) Ltd. ("CMBC"), HudBay Peru Inc., HudBay Peru S.A.C. ("Hudbay Peru"), HudBay (BVI) Inc., Hudbay Arizona Inc., Copper World, Inc. ("Copper World") and Mason Resources (US) Inc. ("Mason").
Hudbay is a diversified mining company with long-life assets in North and South America. Hudbay's operations in Cusco (Peru) produce copper with gold, silver and molybdenum by-products. Hudbay's operations in Manitoba (Canada) produce gold with copper, zinc and silver by-products. Hudbay's operations in British Columbia (Canada) produce copper with gold and silver by-products. Hudbay has a development pipeline that includes copper development projects in Arizona and Nevada (United States), and a focused growth strategy on exploration, development, operation, and optimization of properties that Hudbay already controls, as well as other mineral assets that Hudbay may acquire that fit the Company's strategic criteria. The Company is governed by the Canada Business Corporations Act and its shares are listed under the symbol "HBM" on the Toronto Stock Exchange, New York Stock Exchange and Bolsa de Valores de Lima.
2. Basis of preparation
(a) Statement of compliance:
These interim financial statements have been prepared in accordance with IAS 34, Interim Financial Reporting as issued by the International Accounting Standards Board ("IASB") and do not include all of the information required for annual financial statements prepared in accordance with IFRS® Accounting Standards as issued by the IASB.
These interim financial statements should be read in conjunction with the Company's audited consolidated financial statements for the year ended December 31, 2024 which includes information necessary or useful to understanding the Company's business and financial statement presentation. In particular, the Company's material accounting policies are presented in note 3 in the Company's audited consolidated financial statements for the year ended December 31, 2024 and have been consistently applied in the preparation of these interim financial statements, except as noted below.
Impairment of non-financial assets
The Company will perform the Copper Mountain goodwill impairment test on an annual basis as at July 1 each year to better align with the timing of the annual long-range planning process. This represents a change in accounting policy regarding the timing of the annual goodwill impairment test which was previously performed December 31. All other material accounting policies related to the impairment of non-financial assets remain consistent as presented in Note 3 of the Company's audited consolidated financial statements for the year ended December 31, 2024.
As a result of the acquisition of Mitsubishi Materials Corporation's ("MMC") 25% interest in CMBC on April 30, 2025, the Company's interim financial statements also reflect the following relevant accounting policies.
Contingent Payments from the purchase of non-controlling interest outside the scope of Business Combination
Contingent payments arising from the purchase of non-controlling interest are initially recognized as a financial liability at their fair value on the date the obligation arises. The fair value is determined by discounting the payments to its present value using a company credit adjusted discount rate that reflects current market assessments of the time value of money and the risks specific to the company. The contingent consideration will be classified as a financial liability at amortized cost, with subsequent remeasurements recognized in profit or loss. Additionally, the liability will then be accreted and amortized until the maturity date, with the accretion expense flowing through profit or loss (note 4).
| HUDBAY MINERALS INC. Notes to Unaudited Condensed Consolidated Interim Financial Statements (in millions of US dollars, except where otherwise noted) For the three and six months ended June 30, 2025 and 2024 |
The Board of Directors approved these interim financial statements on August 12, 2025.
(b) Use of judgements and estimates:
The preparation of the interim financial statements in conformity with IFRS® Accounting Standards requires Hudbay to make judgements, estimates and assumptions, in applying accounting policies that affect reported amounts of assets and liabilities and disclosure of contingent assets and liabilities at the date of the interim financial statements, as well as reported amounts of revenue and expenses during the reporting period. Actual results may differ from these judgements, estimates and assumptions. The interim financial statements reflect the judgements and estimates outlined by Hudbay in its audited consolidated financial statements for the year ended December 31, 2024.
3. New standards
New standards issued but not yet effective
(a) IFRS 18 - Presentation and Disclosure in Financial Statements
In April 2024, the IASB released IFRS 18 Presentation and Disclosure in Financial Statements. IFRS 18 will replace IAS 1 Presentation of Financial Statements. The standard amends the presentation of the statement of income by introducing a newly defined 'operating profit' subtotal and a requirement for income and expenses to be allocated between three new distinct categories based on a company's main business activities, which are Operating, Financing and Investing. In addition, organizations will need to disclose certain 'non-GAAP' measures known as management-defined performance measures. The standard will be effective from January 1, 2027 with early adoption permitted and requires retrospective application. The Company is assessing the impact of adoption of this amendment on its consolidated financial statements.
(b) Amendments to IFRS 9 - Financial Instruments and IFRS 7 - Financial Instruments: Disclosures
In May 2024, the IASB issued amendments to IFRS 9 and 7 to clarify the recognition or derecognition of a financial asset or liability, with a new exception for some financial liabilities settled through an electronic cash transfer system. The amendments also add guidance for assessing whether a financial asset meets the solely payments of principal and interest (SPPI) criterion, by introducing an additional SPPI test for financial assets with contingent features that are not related directly to a change in basic lending risks or costs. In addition, the amendments will add new disclosures for certain instruments with contractual terms that can change cash flows. Lastly, the amendments will require additional disclosures for equity instruments designated at fair value through other comprehensive income. The amendments will apply for reporting periods beginning on or after January 1, 2026, with early application permitted. The Company is assessing the impact of adoption of this amendment on its consolidated financial statements.
In December 2024, the IASB issued amendments to IFRS 9 and 7 to clarify the application of the 'own-use' exemption and provide guidance on hedge accounting for companies that hedge their purchase or sales of electricity using renewable power purchase agreements. The amendments also introduce new disclosure requirements. The amendments will apply for reporting periods beginning on or after January 1, 2026, with early application permitted. The Company is assessing the impact of adoption of this amendment on its consolidated financial statements.
| HUDBAY MINERALS INC. Notes to Unaudited Condensed Consolidated Interim Financial Statements (in millions of US dollars, except where otherwise noted) For the three and six months ended June 30, 2025 and 2024 |
4. Copper Mountain non-controlling interest acquisition
On April 30, 2025, Hudbay completed the acquisition of MMC's 25% interest in CMBC (the "Transaction"). The cash consideration of the Transaction consisted of:
• $4.5 million on closing date of the Transaction,
• $21.0 million in seven annual deferred payments of $3.0 million each, commencing on the 12-month anniversary of the closing date of the Transaction, and
• up to $18.75 million in five additional contingent payments of $3.75 million each, payable in the years following New Ingerbelle achieving certain minimum annual operating thresholds. MMC's right to the contingent payments concludes on the 15-year anniversary of the closing date of the Transaction.
As a result of the Transaction, Hudbay increased its ownership of the Copper Mountain mine from 75% to 100%.
The company recorded $35.9 million of total consideration for the Transaction which included the cash payment of $4.5 million on the closing date, $16.6 million of deferred payments and $13.3 million of contingent consideration recorded as financial liability at amortized cost (note 13) and $1.5 million of transaction costs recorded within equity.
As a result of the Transaction, the Company recorded an increase to equity as follows:
| As at June 30, 2025 | |||
| Carrying value of non-controlling interest as at April 30, 2025 | $ | 93.2 | |
| Transfer of net gain on translation of foreign currency balances | 4.0 | ||
| Less: total consideration | (35.9 | ) | |
| Surplus - recorded in equity | 61.3 |
There were no substantive changes to the Company's ownership in CMBC during the year ended December 31, 2024.
| HUDBAY MINERALS INC. Notes to Unaudited Condensed Consolidated Interim Financial Statements (in millions of US dollars, except where otherwise noted) For the three and six months ended June 30, 2025 and 2024 |
5. Revenue and expenses
(a) Revenue
Hudbay's revenue by significant product types:
| Three months ended June 30, | Six months ended June 30, | |||||||||||
| 2025 | 2024 | 2025 | 2024 | |||||||||
| Copper | $ | 297.1 | $ | 259.3 | $ | 599.4 | $ | 544.5 | ||||
| Gold | 189.2 | 119.5 | 383.4 | 297.7 | ||||||||
| Zinc | 7.1 | 15.5 | 21.4 | 30.4 | ||||||||
| Silver | 13.9 | 10.9 | 28.2 | 23.1 | ||||||||
| Molybdenum | 19.1 | 16.0 | 40.0 | 34.2 | ||||||||
| Other | - | 0.5 | (0.2 | ) | 0.5 | |||||||
| Revenue from contracts | 526.4 | 421.7 | 1,072.2 | 930.4 | ||||||||
| Non-cash streaming arrangement items: 1 | ||||||||||||
| Amortization of deferred revenue - gold | 5.9 | 5.5 | 14.3 | 21.9 | ||||||||
| Amortization of deferred revenue - silver | 9.5 | 6.1 | 20.5 | 16.7 | ||||||||
| Amortization of deferred revenue - variable consideration adjustments - prior periods |
- | - | 9.9 | (3.8 | ) | |||||||
| 15.4 | 11.6 | 44.7 | 34.8 | |||||||||
| Pricing and volume adjustments 2 | (2.1 | ) | 14.7 | 31.7 | 35.6 | |||||||
| 539.7 | 448.0 | 1,148.6 | 1,000.8 | |||||||||
| Treatment and refining charges | (3.3 | ) | (22.5 | ) | (17.3 | ) | (50.3 | ) | ||||
| $ | 536.4 | $ | 425.5 | $ | 1,131.3 | $ | 950.5 | |||||
| 1 See note 16. | ||||||||||||
| 2 Pricing and volume adjustments represent mark-to-market adjustments on initial estimate of provisionally priced sales, realized and unrealized changes to fair value of quotational pricing hedge derivative contracts and adjustments to originally invoiced weights and assays. | ||||||||||||
Consideration from the Company's stream agreements is considered variable (note 16). Gold and silver stream revenue can be subject to cumulative adjustments when the amount of precious metals to be delivered under the contract changes. As a result of changes in the Company's mineral reserve and resource estimate in the first quarter of 2025, the amortization rate by which deferred revenue is drawn down into income was adjusted and, as required, a variable consideration adjustment was made for all prior year stream revenues since the stream agreement inception date. This variable consideration adjustment for the six months ended June 30, 2025 resulted in an increase in revenue of $9.9 million (six months ended June 30, 2024 - decrease in revenue of $3.8 million).
(b) Depreciation and amortization
Depreciation of property, plant and equipment and amortization of intangible assets are reflected in the condensed consolidated interim statements of income as follows:
| Three months ended June 30, |
Six months ended June 30, |
|||||||||||
| 2025 | 2024 | 2025 | 2024 | |||||||||
| Cost of sales | $ | 96.4 | $ | 97.6 | $ | 204.5 | $ | 206.9 | ||||
| Selling and administrative expenses | 0.4 | 0.4 | 0.8 | 0.9 | ||||||||
| $ | 96.8 | $ | 98.0 | $ | 205.3 | $ | 207.8 | |||||
| HUDBAY MINERALS INC. Notes to Unaudited Condensed Consolidated Interim Financial Statements (in millions of US dollars, except where otherwise noted) For the three and six months ended June 30, 2025 and 2024 |
(c) Other expenses
| Three months ended June 30, |
Six months ended June 30, |
|||||||||||
| 2025 | 2024 | 2025 | 2024 | |||||||||
| Regional costs | $ | 1.4 | $ | 1.3 | $ | 3.0 | $ | 2.8 | ||||
| Write-down/loss on disposal of PP&E | 0.3 | 2.0 | 0.9 | 11.1 | ||||||||
| Amortization of community costs (other assets) | 1.7 | 3.7 | 2.3 | 5.5 | ||||||||
| Restructuring | - | 0.3 | 0.1 | 1.2 | ||||||||
| Wildfire evacuation costs | 2.1 | - | 2.1 | - | ||||||||
| Care & maintenance - Manitoba | 2.9 | 3.7 | 6.3 | 6.8 | ||||||||
| Evaluation costs | 0.3 | 0.1 | 1.5 | 0.7 | ||||||||
| Reduction of obligation to renounce flow-through share expenditures, net of provisions | (1.2 | ) | (0.3 | ) | (3.1 | ) | (1.0 | ) | ||||
| Option agreement proceeds (Marubeni) | (1.0 | ) | - | (2.5 | ) | (0.4 | ) | |||||
| Other | 0.6 | 0.4 | 1.7 | 0.8 | ||||||||
| $ | 7.1 | $ | 11.2 | $ | 12.3 | $ | 27.5 | |||||
During the second quarter of 2025, the Manitoba business unit incurred costs related to emergency and evacuation activities of $2.1 million as a result of regional wildfires in Snow Lake, Flin Flon and surrounding areas.
The Flin Flon concentrator and tailings impoundment is on care and maintenance to provide optionality should another mineral discovery occur in the Flin Flon area. During the three and six months ended June 30, 2025, care & maintenance costs were $2.9 million and $6.3 million, respectively (three and six months ended June 30, 2024 - $3.7 million and $6.8 million, respectively).
The Arizona business unit held an option to acquire water rights and land, which expired during the first quarter of 2024 without being extended or exercised. The previously capitalized cost to maintain the option, net of accrued interest, of $8.1 million is presented as part of write-down of PP&E.
| HUDBAY MINERALS INC. Notes to Unaudited Condensed Consolidated Interim Financial Statements (in millions of US dollars, except where otherwise noted) For the three and six months ended June 30, 2025 and 2024 |
(d) Net finance expense
| Three months ended June 30, |
Six months ended June 30, |
|||||||||||
| 2025 | 2024 | 2025 | 2024 | |||||||||
| Net interest expense on long-term debt | ||||||||||||
| Net interest expense on long-term debt | $ | 15.6 | $ | 18.5 | $ | 31.5 | $ | 37.7 | ||||
| Accretion on streaming arrangements (note 16) | ||||||||||||
| Additions | 5.2 | 6.0 | 10.2 | 12.0 | ||||||||
| Variable consideration adjustments - prior periods | - | - | (0.6 | ) | 0.2 | |||||||
| 5.2 | 6.0 | 9.6 | 12.2 | |||||||||
| Change in fair value of financial instruments | ||||||||||||
| Gold prepayment liability | - | 1.9 | - | 5.4 | ||||||||
| Unrealized (gain) loss on non-quotational pricing hedges | (1.1 | ) | 8.5 | - | 11.8 | |||||||
| Realized loss on non-quotational pricing hedges | 0.4 | 2.6 | 2.3 | 2.6 | ||||||||
| Investments at fair value through profit or loss | (3.4 | ) | 0.2 | (11.6 | ) | 0.4 | ||||||
| (4.1 | ) | 13.2 | (9.3 | ) | 20.2 | |||||||
| Other net finance (income) costs | ||||||||||||
| Net foreign exchange (gain) loss | (18.9 | ) | 2.0 | (22.0 | ) | 6.8 | ||||||
| Accretion on community agreements measured at amortized cost | 1.4 | 1.7 | 2.7 | 2.6 | ||||||||
| Accretion on environmental provisions | 2.7 | 2.6 | 5.4 | 5.3 | ||||||||
| Accretion on Wheaton refund liability | 0.1 | 0.2 | 0.3 | 0.3 | ||||||||
| Accretion on deferred and contingent liability (note 13) | 0.3 | - | 0.3 | - | ||||||||
| Withholding taxes | - | 0.8 | - | 1.7 | ||||||||
| Interest on equipment financing and leases | 2.3 | 1.4 | 4.6 | 3.9 | ||||||||
| Interest income | (5.5 | ) | (3.5 | ) | (11.0 | ) | (5.9 | ) | ||||
| Other finance expense | 0.9 | 1.4 | 2.3 | 3.5 | ||||||||
| (16.7 | ) | 6.6 | (17.4 | ) | 18.2 | |||||||
| Net finance expense | $ | - | $ | 44.3 | $ | 14.4 | $ | 88.3 | ||||
Other finance expense relates primarily to standby fees on Hudbay's revolving credit facilities.
Commencing in the first quarter of 2024, Hudbay has entered into copper forward sales, copper costless collars and gold costless collars which are non-quotational pricing ("non-QP") contracts (note 21b). Subsequent movements in the fair value of non-QP contracts are recognized in change in fair value of financial instruments in the condensed consolidated interim statements of income. As of June 30, 2025, there are no non-QP hedges outstanding.
During the third quarter of 2024, the Company completed the final delivery and settled the obligation for the gold prepayment liability.
| HUDBAY MINERALS INC. Notes to Unaudited Condensed Consolidated Interim Financial Statements (in millions of US dollars, except where otherwise noted) For the three and six months ended June 30, 2025 and 2024 |
(e) Share-based compensation expense
| Three months ended June 30, |
Six months ended June 30, |
|||||||||||
| 2025 | 2024 | 2025 | 2024 | |||||||||
| Cost of sales | $ | 1.0 | $ | 0.7 | $ | 1.6 | $ | 1.0 | ||||
| Selling and administrative expenses | 9.5 | 7.7 | 12.8 | 13.0 | ||||||||
| Other expense | 0.3 | 0.4 | 0.4 | 0.6 | ||||||||
| $ | 10.8 | $ | 8.8 | $ | 14.8 | $ | 14.6 | |||||
Share-based compensation expense included within cost of sales, selling and administrative expenses, and other expenses relates to deferred share units, restricted share units, performance shares units and the Company's stock option plan. The increase in share-based compensation expense during the three and six months ended June 30, 2025 compared with the same periods last year primarily relates to the change in the Company's share price, partially offset by adjustments to the performance based multiplier on certain share units.
6. Short-term investments
Short-term investments include guaranteed investment certificates held with Canadian financial institutions. The Company currently holds nil guaranteed investment certificates. As at December 31, 2024, the Company held two $20.0 million guaranteed investment certificates that matured in March 2025 and June 2025, respectively.
7. Trade and other receivables
| Jun. 30, 2025 | Dec. 31, 2024 | |||||
| Trade receivables | $ | 209.7 | $ | 179.1 | ||
| Statutory receivables | 23.3 | 50.0 | ||||
| Other receivables | 4.2 | 6.4 | ||||
| $ | 237.2 | $ | 235.5 |
| HUDBAY MINERALS INC. Notes to Unaudited Condensed Consolidated Interim Financial Statements (in millions of US dollars, except where otherwise noted) For the three and six months ended June 30, 2025 and 2024 |
8. Inventories
| Jun. 30, 2025 | Dec. 31, 2024 | |||||
| Current | ||||||
| Stockpile | $ | 23.3 | $ | 26.9 | ||
| Finished goods | 44.8 | 81.6 | ||||
| Materials and supplies | 96.1 | 88.9 | ||||
| 164.2 | 197.4 | |||||
| Non-current | ||||||
| Stockpile | 1.8 | 2.2 | ||||
| Low grade stockpile1 | 5.8 | 5.5 | ||||
| Materials and supplies | 9.6 | 8.9 | ||||
| 17.2 | 16.6 | |||||
| $ | 181.4 | $ | 214.0 | |||
| 1Primarily all of the low grade stockpile inventory is expected to be processed at the end of the Copper Mountain mine life. | ||||||
The cost of inventories recognized as an expense, including depreciation, and included in cost of sales amounted to $313.9 million and $630.3 million, respectively, for the three and six months ended June 30, 2025 (three and six months ended June 30, 2024 - $311.7 million and $640.2 million, respectively).
During the three and six months ended June 30, 2025, Hudbay recognized an expense of $1.1 million and $1.5 million, respectively, in cost of sales primarily related to adjustments of the carrying value of copper concentrate inventory to net realizable value (three and six months ended June 30, 2024 - nil).
During the three and six months ended June 30, 2025, Hudbay recognized an expense of $2.4 million and $3.3 million, respectively, in cost of sales related to the write-off of provision on certain non-current inventory supplies.
9. Other financial assets
| Jun. 30, 2025 | Dec. 31, 2024 | |||||
| Current | ||||||
| Derivative assets | $ | 0.7 | $ | 14.3 | ||
| Collateral deposit (note 15) | - | 0.6 | ||||
| Restricted cash | 0.2 | 0.4 | ||||
| 0.9 | 15.3 | |||||
| Non-current | ||||||
| Investments at fair value through profit or loss | 39.3 | 12.1 | ||||
| 39.3 | 12.1 | |||||
| $ | 40.2 | $ | 27.4 |
Investments at fair value through profit or loss increased to $39.3 million as at June 30, 2025, from $12.1 million as at December 31, 2024. The increase primarily relates to the acquisition of 11,852,064 common shares of Arizona Sonoran in January 2025 at a price of C$1.68 per share, for a total investment of $13.8 million. The remainder of the movement is primarily attributable to mark-to-market adjustments recognized during the period.
| HUDBAY MINERALS INC. Notes to Unaudited Condensed Consolidated Interim Financial Statements (in millions of US dollars, except where otherwise noted) For the three and six months ended June 30, 2025 and 2024 |
10. Intangibles and other assets
Intangibles and other assets of $50.7 million (December 31, 2024 - $44.3 million) includes $43.4 million of other assets (December 31, 2024 - $38.8 million) and $7.3 million of intangibles (December 31, 2024 - $5.5 million).
Other assets represent the carrying value of certain future community costs that relate to original agreements with communities for the Constancia operation which allow Hudbay to extract minerals over the useful life of the Peru operation. The liability remaining for these costs is recorded in agreements with communities recorded at amortized cost (note 13). Amortization of the carrying amount is recorded in the condensed consolidated interim statements of income within other expenses (note 5c) or exploration expenses, depending on the nature of the agreement.
Intangibles mainly represent computer software costs.
11. Property, plant and equipment
| Jun. 30, 2025 | Cost | Accumulated depreciation and amortization |
Carrying amount |
||||||
| Exploration and evaluation assets | $ | 106.2 | $ | - | $ | 106.2 | |||
| Capital works in progress | 917.0 | - | 917.0 | ||||||
| Mining properties | 2,734.9 | (1,379.4 | ) | 1,355.5 | |||||
| Plant and equipment | 3,489.4 | (1,649.2 | ) | 1,840.2 | |||||
| Plant and equipment-ROU assets1 | 275.1 | (177.9 | ) | 97.2 | |||||
| $ | 7,522.6 | $ | (3,206.5 | ) | $ | 4,316.1 | |||
| Dec. 31, 2024 | Cost | Accumulated depreciation and amortization |
Carrying amount | ||||||
| Exploration and evaluation assets | $ | 103.4 | $ | - | $ | 103.4 | |||
| Capital works in progress | 873.3 | - | 873.3 | ||||||
| Mining properties | 2,578.3 | (1,274.4 | ) | 1,303.9 | |||||
| Plant and equipment | 3,335.9 | (1,524.6 | ) | 1,811.3 | |||||
| Plant and equipment - ROU assets1 | 255.1 | (165.6 | ) | 89.5 | |||||
| $ | 7,146.0 | $ | (2,964.6 | ) | $ | 4,181.4 | |||
| 1 Includes $4.5 million of capital works in progress - ROU assets (cost) that relate to the Arizona segment (December 31, 2024 - $3.8 million related to the Arizona segment). | |||||||||
During the first quarter of 2024, Hudbay received a grant of $2.4 million from the Environment and Climate Change Canada related to the purchase of an electric mining shovel in the third quarter of 2023. The carrying amount of the shovel has been deducted by the amount of the grant received. The grant will be recognized in profit or loss over the life of the shovel as a reduced depreciation expense. There were no significant unfulfilled conditions attached to the grant.
| HUDBAY MINERALS INC. Notes to Unaudited Condensed Consolidated Interim Financial Statements (in millions of US dollars, except where otherwise noted) For the three and six months ended June 30, 2025 and 2024 |
12. Other liabilities
| Jun. 30, 2025 | Dec. 31, 2024 | |||||
| Environmental and other provisions (note 17) | 35.0 | 29.9 | ||||
| Pension obligations | 2.8 | 1.0 | ||||
| Other employee benefits | 6.7 | 3.5 | ||||
| $ | 44.5 | $ | 34.4 |
13. Other financial liabilities
| Jun. 30, 2025 | Dec. 31, 2024 | |||||
| Current | ||||||
| Derivative liabilities | $ | 11.1 | $ | 0.3 | ||
| Equipment financing | 19.6 | 16.3 | ||||
| Deferred Copper Mountain acquisition consideration | 2.9 | - | ||||
| Agreements with communities recorded at amortized cost | 19.4 | 21.7 | ||||
| 53.0 | 38.3 | |||||
| Non-current | ||||||
| Equipment financing | 59.9 | 60.4 | ||||
| Agreements with communities recorded at amortized cost | 57.2 | 46.7 | ||||
| Deferred Copper Mountain acquisition consideration | 13.9 | - | ||||
| Contingent Copper Mountain acquisition consideration | 13.4 | - | ||||
| Wheaton refund liability | 7.6 | 7.3 | ||||
| 152.0 | 114.4 | |||||
| $ | 205.0 | $ | 152.7 |
Equipment financing represents agreements that Hudbay has entered into to purchase mining equipment. Hudbay owns the assets and finances the payment of these assets over the specified term. These agreements expire between 2025 and 2032 with interest rates between 2.25% and 7.55% per annum. During the six months ended June 30, 2025, $8.2 million (December 31, 2024 - $71.0 million) of capital additions related to the recognition of property, plant and equipment that has been financed (note 23).
Agreements with communities recorded at amortized cost relate to agreements with communities near the Constancia operation which allow Hudbay to extract minerals over the useful life of the Constancia operation, carry out exploration and evaluation activities in the area and provide Hudbay with community support to operate in the region. During the six months ended June 30, 2025, Hudbay entered into two additional two-year community agreements, resulting in net additions of $9.9 million related to agreements with communities.
As part of the acquisition of remaining 25% interest in CMBC (note 4), the Company recorded $16.6 million of deferred payment consideration and $13.3 million of contingent consideration as a financial liability at amortized cost on the closing of the transaction. During the three and six months ended June 30, 2025, accretion related to these liabilities were $0.3 million (note 5d).
As part of the streaming agreement for the 777 mine, Hudbay must repay, with precious metals credits, the stream deposit by August 1, 2052, the expiry date of the agreement. If the stream deposit is not fully repaid with precious metals credits from 777 production by the expiry date, a payment for the remaining amount will be due at the expiry date of the agreement. As the 777 mine has concluded all mining activities following the depletion of reserves and finalized the sales of produced concentrate, Hudbay concluded that the remaining stream deposit will not be repaid by means of precious metals credits from 777 production. The repayment amount is recorded as a Wheaton refund liability, which is and will be discounted at the 9.0% rate inherent in the original 777 stream agreement and accreted over the remaining term of the agreement.
| HUDBAY MINERALS INC. Notes to Unaudited Condensed Consolidated Interim Financial Statements (in millions of US dollars, except where otherwise noted) For the three and six months ended June 30, 2025 and 2024 |
14. Lease liabilities
| Balance, January 1, 2024 | $ | 90.3 | |
| Additional capitalized leases | 25.5 | ||
| Lease payments | (31.4 | ) | |
| Derecognized leases | (11.5 | ) | |
| Accretion and other movements | 1.9 | ||
| Balance, December 31, 2024 | $ | 74.8 | |
| Additional capitalized leases | 20.7 | ||
| Lease payments | (18.4 | ) | |
| Derecognized leases | (0.9 | ) | |
| Accretion and other movements | 0.9 | ||
| Balance, June 30, 2025 | $ | 77.1 |
Lease liabilities are reflected in the condensed consolidated interim balance sheets as follows:
| Jun. 30, 2025 | Dec. 31, 2024 | |||||
| Current | $ | 35.6 | $ | 30.5 | ||
| Non-current | 41.5 | 44.3 | ||||
| $ | 77.1 | $ | 74.8 |
Hudbay has entered into leases which expire between 2025 and 2037. The interest rates on leases which were capitalized have interest rates between 2.50% and 8.49%, per annum. The range of interest rates utilized for discounting the lease depends mostly on Hudbay acting as a lessee and duration of the lease. For certain leases, Hudbay has the option to purchase the equipment and vehicles leased at the end of the terms of the leases. Hudbay's obligations under these leases are secured by the lessor's title to the leased assets. The present value of applicable lease payments has been recognized as an ROU asset, which was included as a non-cash addition to property, plant and equipment, and a corresponding amount as a lease liability.
There are no restrictions placed on Hudbay by entering into these leases.
The following outlines expenses recognized within the Company's condensed consolidated interim statements of income, relating to leases for which a recognition exemption was applied.
| Three months ended June 30, | Six months ended June 30, | |||||||||||
| 2025 | 2024 | 2025 | 2024 | |||||||||
| Short-term leases | $ | 3.4 | $ | 1.7 | $ | 5.5 | $ | 2.6 | ||||
| Low value leases | 0.1 | 0.1 | 0.2 | 0.2 | ||||||||
| Variable leases | 4.8 | 7.5 | 9.0 | 13.9 | ||||||||
| Total | $ | 8.3 | $ | 9.3 | $ | 14.7 | $ | 16.7 | ||||
Payments made for short-term, low value and variable leases would mostly be captured as expenses in the condensed consolidated interim statements of income, however, certain amounts may be capitalized to PP&E for the Arizona segment during its development phase and certain amounts may be reported in inventories given the timing of sales. Variable payment leases include equipment used for heavy civil works at Constancia.
| HUDBAY MINERALS INC. Notes to Unaudited Condensed Consolidated Interim Financial Statements (in millions of US dollars, except where otherwise noted) For the three and six months ended June 30, 2025 and 2024 |
15. Long-term debt
| Jun. 30, 2025 | Dec. 31, 2024 | |||||
| Current: | ||||||
| Senior unsecured notes (a) | $ | 523.8 | $ | - | ||
| Non-current: | ||||||
| Senior unsecured notes (a) | 538.7 | 1,111.1 | ||||
| Senior secured revolving credit facilities (b) | (2.9 | ) | (3.6 | ) | ||
| 535.8 | 1,107.5 | |||||
| Total debt | $ | 1,059.6 | $ | 1,107.5 |
(a) Senior unsecured notes
| Balance, January 1, 2024 | $ | 1,190.6 | |
| Repurchases | (82.6 | ) | |
| Write-down of unamortized transaction costs | 0.6 | ||
| Accretion of transaction costs and premiums | 2.5 | ||
| Balance, December 31, 2024 | $ | 1,111.1 | |
| Repurchases | (50.0 | ) | |
| Write-down of unamortized transaction costs | 0.1 | ||
| Accretion of transaction costs and premiums | 1.3 | ||
| Balance, June 30, 2025 | $ | 1,062.5 |
As at June 30, 2025, $1,067.4 million aggregate principal amount of senior notes were outstanding in two series: (i) a series of 4.50% senior notes due April 2026 ("2026 notes") in an aggregate principal amount of $525.0 million and (ii) a series of 6.125% senior notes due April 2029 ("2029 notes") in an aggregate principal amount of $542.4 million. During the second quarter of 2025, the Company repurchased and retired $50.0 million of the 2026 notes. To date, the Company repurchased and retired a total of $75.0 million of the 2026 notes and $57.6 million of the 2029 notes at a discount. For the six months ended June 30, 2025, the discount of $0.3 million (December 31, 2024 - $0.7 million) was recorded as Other expenses in the condensed consolidated interim statements of income.
Upon the repurchase and retirement of the additional $50.0 million of senior unsecured notes in the second quarter of 2025, the unamortized transaction costs related to this principal amount were recorded as a finance expense in the condensed consolidated interim statements of income.
The senior notes are guaranteed on a senior unsecured basis by substantially all of the Company's subsidiaries, other than HudBay (BVI) Inc. and certain excluded or unrestricted subsidiaries, and subsidiaries that hold the Copper World and Mason projects as well as any newly formed or acquired subsidiaries that primarily hold or may develop non-producing mineral assets that are in the pre-construction phase of development.
| HUDBAY MINERALS INC. Notes to Unaudited Condensed Consolidated Interim Financial Statements (in millions of US dollars, except where otherwise noted) For the three and six months ended June 30, 2025 and 2024 |
(b) Senior secured revolving credit facilities
| Balance, January 1, 20241 | $ | 96.9 | |
| Repayments | (100.0 | ) | |
| Accretion of transaction costs | 2.0 | ||
| Transaction costs | (2.5 | ) | |
| Balance, December 31, 20241 | $ | (3.6 | ) |
| Accretion of transaction costs | 0.7 | ||
| Balance, June 30, 20251 | $ | (2.9 | ) |
| 1 Balance, representing deferred transaction costs, is in an asset position. | |||
Hudbay has two senior secured revolving credit facilities with total commitments of $450.0 million and substantially similar terms and conditions for its Canadian and Peruvian businesses. Hudbay's revolving credit facilities are secured against substantially all of the Company's assets, other than those associated with the Copper Mountain mine and the Copper World and Mason projects. During 2024, Hudbay repaid $10.0 million under its Canadian revolving credit facility and $90.0 million under the Peruvian revolving credit facility. During the fourth quarter of 2024, the two senior secured revolving credit facilities were extended by three years from October 2025 to November 2028. The newly extended $450.0 million revolving credit facility includes an accordion feature to increase the facility by an additional $150 million at Hudbay's discretion during the four-year tenor. Hudbay incurred $2.4 million of transactions costs associated with the extension which were deferred and amortized over the new term of the credit facilities.
As at June 30, 2025, there were nil draws under the Canadian and Peruvian revolving credit facilities, other than letters of credit to support reclamation and pension obligations as described below.
As at June 30, 2025, the Peru segment had nil in letters of credit issued under the Peru revolving credit facility to support its reclamation obligations and the Manitoba segment had $25.3 million in letters of credit issued under the Canadian revolving credit facility to support its reclamation and pension obligations. As at June 30, 2025, we were in compliance with our covenants under the revolving credit facilities.
Surety bonds
The Arizona segment had $18.4 million in surety bonds issued to support future reclamation and closure obligations. No cash collateral is required to be posted under these surety bonds.
The British Columbia segment had $48.1 million in surety bonds issued to support future reclamation and closure obligations. The British Columbia segment had $1.0 million in surety bonds issued to BC Hydro in relation to the BC Hydro transmission system at the Copper Mountain Mine, and to Fisheries and Oceans Canada for fish monitoring. No cash collateral is required to be posted under these surety bonds.
The Peru segment had $23.3 million in surety bonds issued to support future reclamation and closure obligations. No cash collateral is required to be posted under these surety bonds.
Other letters of credit
The Peru segment had $111.7 million in letters of credit issued with various Peruvian financial institutions to support future reclamation and other operating matters. No cash collateral is required to be posted under these letters of credit.
Hudbay has a C$130.0 million bilateral letter of credit facility ("LC Facility") with a major Canadian financial institution. As at June 30, 2025, the Manitoba segment had $56.7 million in letters of credit issued under the LC Facility to support its reclamation and pension obligations.
| HUDBAY MINERALS INC. Notes to Unaudited Condensed Consolidated Interim Financial Statements (in millions of US dollars, except where otherwise noted) For the three and six months ended June 30, 2025 and 2024 |
16. Deferred revenue
Peru Stream Agreement
For the three and six months ended June 30, 2025, the drawdown rates for the Peru stream agreement for gold and silver were $860 and $15.06 per ounce, respectively (year ended December 31, 2024 - $817 and $14.56 per ounce, respectively).
The following table summarizes changes in deferred revenue:
| Balance, January 1, 2024 | $ | 418.5 | |
| Amortization of deferred revenue | |||
| Liability drawdown | (74.3 | ) | |
| Variable consideration adjustments - prior periods | 3.8 | ||
| Accretion on streaming arrangements | |||
| Current year additions | 24.0 | ||
| Variable consideration adjustments - prior periods | 0.2 | ||
| Balance, December 31, 2024 | $ | 372.2 | |
| Amortization of deferred revenue (note 5a) | |||
| Liability drawdown | (34.8 | ) | |
| Variable consideration adjustments - prior periods | (9.9 | ) | |
| Accretion on streaming arrangements (note 5d) | |||
| Current year-to-date additions | 10.2 | ||
| Variable consideration adjustments - prior periods | (0.6 | ) | |
| Balance, June 30, 2025 | $ | 337.1 |
Consideration from the Company's stream agreement is considered variable. Gold and silver stream revenue can be subject to cumulative adjustments when the number of ounces to be delivered under the contract changes. As a result of changes in the Company's mineral reserve and resource estimate in the first quarter of 2025, the amortization rate by which deferred revenue is drawn down into income was adjusted and, as required, a current period variable adjustment was made for all prior period stream revenues since the stream agreement inception date. This variable consideration adjustment resulted in an increase in revenue of $9.9 million and a decrease of finance expense of $0.6 million for the six months ended June 30, 2025 (year ended December 31, 2024 - decrease in revenue of $3.8 million and an increase of finance expense of $0.2 million).
Deferred revenue is reflected in the condensed consolidated interim balance sheets as follows:
| Jun. 30, 2025 | Dec. 31, 2024 | |||||
| Current | $ | 58.0 | $ | 63.1 | ||
| Non-current | 279.1 | 309.1 | ||||
| $ | 337.1 | $ | 372.2 |
| HUDBAY MINERALS INC. Notes to Unaudited Condensed Consolidated Interim Financial Statements (in millions of US dollars, except where otherwise noted) For the three and six months ended June 30, 2025 and 2024 |
17. Environmental and other provisions
Reflected in the condensed consolidated interim balance sheets as follows:
| Jun. 30, 2025 | Decommissioning, restoration and similar liabilities |
Deferred share units |
Restricted share units |
Performance share units |
Other 1 | Total | ||||||||||||
| Current (note 12) | $ | 7.6 | $ | 15.2 | $ | 5.8 | $ | 4.1 | $ | 2.3 | $ | 35.0 | ||||||
| Non-current | 307.0 | - | 4.2 | 3.0 | 1.3 | 315.5 | ||||||||||||
| $ | 314.6 | $ | 15.2 | $ | 10.0 | $ | 7.1 | $ | 3.6 | $ | 350.5 | |||||||
| Dec. 31, 2024 | Decommissioning, restoration and similar liabilities |
Deferred share units |
Restricted share units |
Performance share units |
Other 1 | Total | ||||||||||||
| Current (note 12) | $ | 4.0 | $ | 12.3 | $ | 6.4 | $ | 1.9 | $ | 5.3 | $ | 29.9 | ||||||
| Non-current | 292.9 | - | 3.2 | 3.6 | 1.1 | 300.8 | ||||||||||||
| $ | 296.9 | $ | 12.3 | $ | 9.6 | $ | 5.5 | $ | 6.4 | $ | 330.7 | |||||||
| 1 Relates primarily to flow-through share premiums, restructuring costs and other non-capital provisions. | ||||||||||||||||||
Decommissioning and restoration obligations ("DRO") are remeasured at each reporting date to reflect changes in discount rates, exchange rates, and timing and extent of cash outflows which can significantly affect the liabilities. This provision has been recorded based on estimates and assumptions that management believes are reasonable; however, actual decommissioning and restoration costs may differ from expectations.
During the six months ended June 30, 2025, the Company recorded a non-cash gain of $1.0 million in the condensed consolidated interim statements of income mainly related to a revaluation adjustment to the Flin Flon environmental reclamation provision. The re-evaluation adjustment was impacted by an increase in long term, risk-free real discount rates based on changes in Canadian bond yields. Typically, an operating location will reflect any revaluation adjustments to the environmental reclamation provision against its reclamation assets. However, as the Flin Flon operations closed in June 2022, the corresponding Flin Flon assets have been fully depreciated and cannot be reduced below residual value resulting in the remaining impact being recorded as a loss in the condensed consolidated interim statements of income.
As at June 30, 2025, decommissioning, restoration and similar liabilities have been discounted to their present value at rates ranging from 2.61% to 4.89% per annum (December 31, 2024 - 2.87% to 4.88%), using pre-tax, nominal risk-free interest rates that reflect the estimated maturity of each specific liability.
During the six months ended June 30, 2024, the Company recorded a non-cash gain of $8.0 million in the condensed consolidated interim statements of income mainly related to a revaluation adjustment to the Flin Flon environmental reclamation provision.
| HUDBAY MINERALS INC. Notes to Unaudited Condensed Consolidated Interim Financial Statements (in millions of US dollars, except where otherwise noted) For the three and six months ended June 30, 2025 and 2024 |
18. Income and mining taxes
The tax expense is applicable as follows:
| Three months ended June 30, |
Six months ended June 30, |
|||||||||||
| 2025 | 2024 | 2025 | 2024 | |||||||||
| Current | ||||||||||||
| Income tax expense | $ | 30.3 | $ | 20.5 | $ | 64.8 | $ | 55.9 | ||||
| Mining tax expense | 17.6 | 10.8 | 38.9 | 23.5 | ||||||||
| Adjustments in respect of prior years | - | - | (1.9 | ) | (0.1 | ) | ||||||
| 47.9 | 31.3 | 101.8 | 79.3 | |||||||||
| Deferred | ||||||||||||
| Income tax (recovery) expense - origination, revaluation and/or reversal of temporary differences | (10.5 | ) | (8.7 | ) | 10.9 | (5.4 | ) | |||||
| Mining tax expense (recovery) - origination, revaluation and/or reversal of temporary difference | 1.0 | (1.9 | ) | (1.4 | ) | (4.1 | ) | |||||
| Adjustments in respect of prior years | - | - | (0.8 | ) | 0.2 | |||||||
| (9.5 | ) | (10.6 | ) | 8.7 | (9.3 | ) | ||||||
| $ | 38.4 | $ | 20.7 | $ | 110.5 | $ | 70.0 | |||||
Adjustments in respect of prior years refers to amounts changing due to the filing of tax returns and assessments from government authorities as well as any change identified that would result in a difference to our current or deferred tax balances as reported in the prior fiscal year end.
| HUDBAY MINERALS INC. Notes to Unaudited Condensed Consolidated Interim Financial Statements (in millions of US dollars, except where otherwise noted) For the three and six months ended June 30, 2025 and 2024 |
19. Share capital
(a) Preference shares:
Authorized: Unlimited preference shares without par value.
Issued and fully paid: Nil.
(b) Common shares:
Authorized: Unlimited common shares without par value.
Issued and fully paid:
| Six months ended Jun. 30, 2025 |
Year ended Dec. 31, 2024 |
|||||||||||
| Common shares |
Amount | Common shares |
Amount | |||||||||
| Balance, beginning of year | 394,932,374 | $ | 2,641.3 | 350,728,536 | $ | 2,240.2 | ||||||
| Shares issued on equity raise, net of share issuance costs | - | - | 42,366,000 | 386.2 | ||||||||
| Flow through shares, net of share issuance costs and implied premium | - | - | 968,900 | 8.6 | ||||||||
| Exercise of options | 258,886 | 2.3 | 482,028 | 3.6 | ||||||||
| Exercise of warrants | 11,824 | 0.1 | 386,910 | 2.7 | ||||||||
| Shares issued through private placement, net of issuance costs | 465,394 | 4.2 | - | - | ||||||||
| Tax adjustments in respect of prior years | - | 4.4 | - | - | ||||||||
| Balance, end of the period | 395,668,478 | $ | 2,652.3 | 394,932,374 | $ | 2,641.3 | ||||||
During the six months ended June 30, 2025, the Company declared a dividend of C$0.01 per share. The Company paid $2.8 million in dividends on March 21, 2025 to shareholders of record as of March 4, 2025.
On June 24, 2025, the Company closed a private placement deal to issue 465,394 common shares at a price of C$13.30 per Common Share for aggregate gross proceeds of $4.5 million. Associated with the private placement were $0.3 million of share issuance costs resulting in net equity raised of $4.2 million. The net proceeds of this private placement were used to fund the $4.5 million cash consideration on closing of the acquisition of MMC's 25% interest in CMBC (note 4).
On May 24, 2024, the Company closed an equity financing with a syndicate of underwriters ("the Offering"). Pursuant to the Offering, the Underwriters purchased on a bought deal basis from the Company a total of 42,366,000 common shares at a price of $9.50 per Common Share for aggregate gross proceeds of $402.5 million. Transaction costs related to the Offering were $16.1 million resulting in net proceeds to the Company of $386.4 million. Associated with the Offering were $0.2 million of share issuance costs resulting in net equity raised of $386.2 million.
During the year ended December 31, 2024, the Company completed a Canadian Development Expense and Canadian Exploration Expense flow-through financing. The flow-through share liability was recognized in earnings as eligible expenditures were made. The Company issued 968,900 common shares for proceeds, net of transaction costs, of $11.8 million. The implied premium on the flow-through shares of $3.2 million was recorded as a flow-through share liability. At June 30, 2025, the Company has incurred $5.6 million in qualifying expenditures related to this flow-through financing. The flow-through share liability will be recognized in earnings as eligible expenditures are made.
During the year ended December 31, 2024, the Company declared two semi-annual dividends of C$0.01 per share. The Company paid $2.6 million and $2.9 million in dividends on March 22, 2024 and September 20, 2024 to shareholders of record as of March 5, 2024 and September 3, 2024.
| HUDBAY MINERALS INC. Notes to Unaudited Condensed Consolidated Interim Financial Statements (in millions of US dollars, except where otherwise noted) For the three and six months ended June 30, 2025 and 2024 |
(c) Equity-settled share-based compensation
Stock Options
The Company's stock option plan was approved in June 2005 and amended in May 2008 (the "Plan"). Under the amended Plan, the Company may grant to employees, officers, directors or consultants of the Company or its affiliates options to purchase up to a maximum of 13 million common shares of Hudbay. The Company has determined that the appropriate accounting treatment is to classify the stock options as equity settled transactions.
The following table outlines the changes in the number of stock options outstanding:
| Jun. 30, 2025 | Dec. 31, 2024 | |||||||||||
| Number of shares subject to option |
Weighted- average exercise price C$ |
Number of shares subject to option |
Weighted average exercise price C$ |
|||||||||
| Balance, beginning of year | 2,484,107 | $ | 7.42 | 2,182,970 | $ | 7.23 | ||||||
| Number of units granted | 828,720 | $ | 10.81 | 902,874 | $ | 7.50 | ||||||
| Exercised | (258,886 | ) | $ | 7.93 | (482,029 | ) | $ | 6.56 | ||||
| Forfeited | (14,614 | ) | $ | 8.25 | (106,850 | ) | $ | 7.62 | ||||
| Expired | (3,863 | ) | $ | 7.50 | (12,858 | ) | $ | 10.03 | ||||
| Balance, end of period | 3,035,464 | $ | 8.30 | 2,484,107 | $ | 7.42 | ||||||
The following table outlines stock options outstanding and exercisable:
| Jun. 30, 2025 | |||||||||||||||
| Range of exercise prices C$ |
Number of options outstanding |
Weighted average remaining contractual life (years) |
Weighted average exercise price C$ |
Number of options exercisable |
Weighted average share price at exercise date C$ |
||||||||||
| $3.76 - $5.26 | 344,072 | 1.66 | $ | 3.76 | 344,072 | $ | 3.76 | ||||||||
| $5.27 - $7.13 | 565,842 | 4.67 | $ | 6.75 | 326,003 | $ | 6.75 | ||||||||
| $7.14 - $8.71 | 765,120 | 5.66 | $ | 7.50 | 201,374 | $ | 7.50 | ||||||||
| $8.72 - $10.60 | 535,046 | 3.23 | $ | 10.13 | 535,046 | $ | 10.13 | ||||||||
| $10.61 - $13.50 | 825,384 | 6.64 | $ | 10.81 | 3,561 | $ | 12.08 | ||||||||
| Dec. 31, 2024 | |||||||||||||||
| Range of exercise prices C$ |
Number of options outstanding |
Weighted average remaining contractual life (years) |
Weighted average exercise price C$ |
Number of options exercisable |
Weighted average share price at exercise date C$ |
||||||||||
| $3.76 - $5.26 | 361,658 | 2.15 | $ | 3.76 | 361,658 | $ | 3.76 | ||||||||
| $5.27 - $6.90 | 631,984 | 5.16 | $ | 6.75 | 152,408 | $ | 6.75 | ||||||||
| $6.91 - $8.71 | 866,543 | 6.15 | $ | 7.50 | - | $ | - | ||||||||
| $8.72 - $10.17 | 365,988 | 4.16 | $ | 9.92 | 223,287 | $ | 9.92 | ||||||||
| $10.18 - $10.42 | 257,934 | 3.15 | $ | 10.42 | 257,934 | $ | 10.42 | ||||||||
Hudbay estimates expected life of options and expected volatility based on historical data, which may differ from actual outcomes.
| HUDBAY MINERALS INC. Notes to Unaudited Condensed Consolidated Interim Financial Statements (in millions of US dollars, except where otherwise noted) For the three and six months ended June 30, 2025 and 2024 |
Warrants
The following table outlines the changes in the number of Hudbay warrants outstanding:
| Jun. 30, 2025 | Dec. 31, 2024 | |||||||||||
| Number of shares subject to warrants |
Weighted- average exercise price C$ |
Number of shares subject to warrants |
Weighted average exercise price C$ |
|||||||||
| Balance, beginning of year | 70,708 | $ | 7.38 | 457,617 | $ | 7.38 | ||||||
| Exercised | (11,824 | ) | $ | 7.38 | (386,909 | ) | $ | 7.38 | ||||
| Balance, end of period | 58,884 | $ | 7.38 | 70,708 | $ | 7.38 | ||||||
20. Earnings per share
| Three months ended June 30, | Six months ended June 30, | |||||||||||
| 2025 | 2024 | 2025 | 2024 | |||||||||
| Weighted average common shares outstanding | ||||||||||||
| Basic | 395,085,907 | 368,344,407 | 395,018,364 | 359,562,824 | ||||||||
| Plus net incremental shares from: | ||||||||||||
| Assumed conversion: stock options | 719,932 | - | 719,637 | 400,401 | ||||||||
| Assumed conversion: warrants | 21,472 | - | 21,553 | 89,199 | ||||||||
| Diluted weighted average common shares outstanding | 395,827,311 | 368,344,407 | 395,759,554 | 360,052,424 | ||||||||
The calculation of dilutive weighted-average number of common shares excludes the impact of 274,405 and 197,982 shares for the three and six months ended June 30, 2025 (three and six months ended June 30, 2024 - 58,344 and 79,912). The shares related to stock options and warrants were excluded as the exercise price related to the particular security exceeded the average market price of the Company's common shares for the period, or the inclusion of the share units had an anti-dilutive effect on net income.
| HUDBAY MINERALS INC. Notes to Unaudited Condensed Consolidated Interim Financial Statements (in millions of US dollars, except where otherwise noted) For the three and six months ended June 30, 2025 and 2024 |
21. Financial instruments
(a) Fair value and carrying value of financial instruments:
The following presents the fair value ("FV") and carrying value ("CV") of Hudbay's financial instruments and non-financial derivatives:
| Jun. 30, 2025 | Dec. 31, 2024 | |||||||||||
| FV | CV | FV | CV | |||||||||
| Financial assets at amortized cost | ||||||||||||
| Cash and cash equivalents1 | $ | 625.5 | $ | 625.5 | $ | 541.8 | $ | 541.8 | ||||
| Short-term investments1 | - | - | 40.0 | 40.0 | ||||||||
| Collateral deposits1 | - | - | 0.6 | 0.6 | ||||||||
| Restricted cash1 | 0.2 | 0.2 | 0.4 | 0.4 | ||||||||
| Fair value through profit or loss | ||||||||||||
| Trade and other receivables2,3 | 213.9 | 213.9 | 185.5 | 185.5 | ||||||||
| Non-hedge derivative assets 4 | 0.7 | 0.7 | 14.3 | 14.3 | ||||||||
| Investments at fair value through profit or loss 5 | 39.3 | 39.3 | 12.1 | 12.1 | ||||||||
| Total financial assets | $ | 879.6 | $ | 879.6 | $ | 794.7 | $ | 794.7 | ||||
| Financial liabilities at amortized cost | ||||||||||||
| Trade and other payables1, 2 | $ | 246.0 | $ | 246.0 | $ | 255.2 | $ | 255.2 | ||||
| Deferred Copper Mountain acquisition consideration6 | 17.1 | 16.8 | - | - | ||||||||
| Contingent Copper Mountain acquisition consideration6 | 13.8 | 13.4 | - | - | ||||||||
| Agreements with communities 7 | 78.8 | 76.6 | 70.4 | 68.4 | ||||||||
| Wheaton refund liability8 | 13.3 | 7.6 | 9.9 | 7.3 | ||||||||
| Senior unsecured notes 9 | 1,073.9 | 1,062.5 | 1,111.6 | 1,111.1 | ||||||||
| Senior secured revolving credit facilities10 | (2.9 | ) | (2.9 | ) | (3.6 | ) | (3.6 | ) | ||||
| Fair value through profit or loss | ||||||||||||
| Non-hedge derivative liabilities 4 | 11.1 | 11.1 | 0.3 | 0.3 | ||||||||
| Total financial liabilities | $ | 1,451.1 | $ | 1,431.1 | $ | 1,443.8 | $ | 1,438.7 | ||||
| 1 Cash and cash equivalents, short-term investments, collateral deposits, restricted cash, trade and other payables are recorded at carrying value, which approximates fair value due to their short-term nature and generally negligible credit losses. | |||||||||||
| 2 Excludes tax and other statutory amounts. | |||||||||||
| 3 Trade and other receivables contain receivables including provisionally priced receivables classified as FVTPL and various other items at amortized cost. The fair value of provisionally priced receivables is determined using forward metals prices (level 2). | |||||||||||
| 4 Derivatives are carried at their fair value, which is determined based on observable forward market commodity prices corresponding to the maturity of the contract (level 2), | |||||||||||
| 5 All investments are carried at their fair value, which is determined using quoted market bid prices in active markets for listed shares. | |||||||||||
| 6 Fair value of the deferred and contingent Copper Mountain acquisition consideration has been determined using an applicable credit-risk adjusted discount rate (level 3). | |||||||||||
| 7 These financial liabilities relate to agreements with communities near the Constancia mine in Peru (note 13). Fair values have been determined using an applicable credit-risk adjusted discounted rate and foreign exchange rates (level 3). | |||||||||||
| 8 Discounted value based on a market rate at inception of the applicable Wheaton contract for carrying value (note 13) and fair value using an applicable credit-risk adjusted discount rate (level 3). | |||||||||||
| 9 Fair value of the senior unsecured notes (note 15a) has been determined using an applicable credit-risk adjusted discount rate (level 3). | |||||||||||
| 10 Fair value of the senior secured revolving credit facility, when drawn, is valued using an applicable credit adjusted discount rate (level 3). |
| HUDBAY MINERALS INC. Notes to Unaudited Condensed Consolidated Interim Financial Statements (in millions of US dollars, except where otherwise noted) For the three and six months ended June 30, 2025 and 2024 |
Fair value hierarchy
The table below provides an analysis by valuation method of financial instruments that are measured at fair value subsequent to recognition as well as financial instruments not measured at fair value but for which a fair value is disclosed. Levels 1 to 3 are defined based on the degree to which fair value inputs are observable and have a significant effect on the recorded fair value, as follows:
- Level 1: Quoted prices in active markets for identical assets or liabilities;
- Level 2: Valuation techniques use significant observable inputs, either directly or indirectly, or
valuations are based on quoted prices for similar instruments; and,
- Level 3: Valuation techniques use significant inputs that are not based on observable market
data.
| June 30, 2025 | Level 1 | Level 2 | Level 3 | Total | ||||||||
| Financial assets at FVTPL: | ||||||||||||
| Provisionally priced receivables | $ | - | $ | 179.0 | $ | - | $ | 179.0 | ||||
| Non-hedge derivatives | - | 0.7 | - | $ | 0.7 | |||||||
| Investments | 37.5 | - | 1.8 | 39.3 | ||||||||
| $ | 37.5 | $ | 179.7 | $ | 1.8 | $ | 219.0 | |||||
| Financial liabilities at FVTPL: | ||||||||||||
| Non-hedge derivatives | $ | - | $ | 11.1 | $ | - | $ | 11.1 | ||||
| Financial liabilities at amortized cost: | ||||||||||||
| Deferred Copper Mountain acquisition consideration | - | - | 17.1 | 17.1 | ||||||||
| Contingent Copper Mountain acquisition consideration | - | - | 13.8 | 13.8 | ||||||||
| Agreements with communities | - | - | 78.8 | 78.8 | ||||||||
| Wheaton refund liability | - | - | 13.3 | 13.3 | ||||||||
| Senior unsecured notes | 1,073.9 | - | - | 1,073.9 | ||||||||
| $ | 1,073.9 | $ | 11.1 | $ | 123.0 | $ | 1,208.0 |
| December 31, 2024 | Level 1 | Level 2 | Level 3 | Total | ||||||||
| Financial assets at FVTPL: | ||||||||||||
| Provisionally priced receivables | $ | - | $ | 171.3 | $ | - | 171.3 | |||||
| Non-hedge derivatives | - | 14.3 | - | 14.3 | ||||||||
| Investments | 12.1 | - | - | 12.1 | ||||||||
| $ | 12.1 | $ | 185.6 | $ | - | $ | 197.7 | |||||
| Financial liabilities at FVTPL: | ||||||||||||
| Non-hedge derivatives | $ | - | $ | 0.3 | $ | - | $ | 0.3 | ||||
| Financial liabilities at amortized cost: | ||||||||||||
| Agreements with communities | - | - | 70.4 | 70.4 | ||||||||
| Wheaton refund liability | - | - | 9.9 | 9.9 | ||||||||
| Senior unsecured notes | 1,111.6 | - | - | 1,111.6 | ||||||||
| $ | 1,111.6 | $ | 0.3 | $ | 80.3 | $ | 1,192.2 |
The Company's policy is to recognize transfers into and transfers out of fair value hierarchy levels as of the date of the event or change in circumstances that caused the transfer. During the six months ended June 30, 2025 and year ended December 31, 2024, Hudbay did not make any such transfers.
Valuation techniques used for instruments categorized in Levels 2 and 3 are consistent with the year ended December 31, 2024.
| HUDBAY MINERALS INC. Notes to Unaudited Condensed Consolidated Interim Financial Statements (in millions of US dollars, except where otherwise noted) For the three and six months ended June 30, 2025 and 2024 |
(b) Derivatives and hedging:
Copper fixed for floating swaps
Hudbay enters into copper fixed for floating swaps in order to manage the risk associated with provisional pricing terms in copper concentrate sales agreements. As at June 30, 2025, Hudbay had 66.7 million pounds of net copper swaps outstanding at an effective average price of $4.33/lb and settling from July to November 2025. As at December 31, 2024, Hudbay had 61.7 million pounds of net copper swaps outstanding at an effective average price of $4.19/lb and settling from January to May 2025. The aggregate fair value of the transactions at June 30, 2025 was a liability of $10.1 million (December 31, 2024 - an asset position of $13.7 million).
Zinc fixed for floating swaps
Hudbay enters into zinc fixed for floating swaps in order to manage the risk associated with provisional pricing terms in zinc concentrate sales agreements. As at June 30, 2025, Hudbay had 7.9 million pounds of net zinc swaps outstanding at an effective average price of $1.21/lb and settling in July 2025. As at December 31, 2024, Hudbay had 9.7 million pounds of net zinc swaps outstanding at an effective average price of $1.38/lb and settling from January to April 2025. The aggregate fair value of the transactions at June 30, 2025 was a liability of $0.3 million (December 31, 2024 - an asset position of $0.3 million).
Copper forward sales
As at June 30, 2025, Hudbay had nil pounds of copper forwards outstanding. As at December 31, 2024, Hudbay had 5.3 million pounds of copper forwards outstanding at an effective average price of $3.95/lb and settling from January to April 2025. The aggregate fair value of the transactions at June 30, 2025 was nil (December 31, 2024 - a liability position of $0.1 million).
Copper costless collars
As at June 30, 2025, Hudbay had nil pounds of copper collars outstanding. As at December 31, 2024, Hudbay had 6.6 million pounds of copper collars outstanding settling from January to April 2025 at an average floor price of $3.88/lb and an average cap price of $4.14/lb. The aggregate fair value of the position at June 30, 2025 was nil (December 31, 2024 - an asset position of $0.1 million).
(c) Provisionally priced receivables
Changes in fair value of provisionally priced receivables
Hudbay records changes in fair value of provisionally priced receivables related to provisional pricing in concentrate purchase, concentrate sale and certain other sale contracts. Under the terms of these contracts, prices are subject to final adjustment at the end of a future period after title transfers based on quoted market prices during the quotation period specified in the contract. The period between provisional pricing and final pricing is typically up to three months.
Changes in fair value of provisionally priced receivables are presented in trade and other receivables when they relate to sales contracts and in trade and other payables when they relate to purchase contracts. At each reporting date, provisionally priced metals are marked-to-market based on the forward market price for the quotation period stipulated in the contract, with changes in fair value recognized in revenue for sales contracts and in inventory or cost of sales for purchase concentrate contracts. Cash flows related to changes in fair value of provisionally priced receivables are classified in operating activities.
| HUDBAY MINERALS INC. Notes to Unaudited Condensed Consolidated Interim Financial Statements (in millions of US dollars, except where otherwise noted) For the three and six months ended June 30, 2025 and 2024 |
As at June 30, 2025 and December 31, 2024, Hudbay's net position consisted of contracts awaiting final pricing are as indicated below:
| Metal in concentrate | Sales awaiting final pricing | Average YTD price ($/unit) | |||||||||||
| Unit | Jun. 30, 2025 | Dec. 31, 2024 | Jun. 30, 2025 | Dec. 31, 2024 | |||||||||
| Copper | pounds (in 000s) | 75,194 | 85,731 | 4.51 | 3.96 | ||||||||
| Gold | troy ounces | 32,709 | 47,075 | 3,301 | 2,638 | ||||||||
| Silver | troy ounces | 193,513 | 238,149 | 35.91 | 29.02 | ||||||||
| Zinc | pounds (in 000s) | 8,840 | 12,102 | 1.25 | 1.34 | ||||||||
The aggregate fair value of provisionally priced receivables within the copper and zinc concentrate at June 30, 2025 was an asset position of $14.5 million (December 31, 2024 - a liability position of $13.9 million).
22. Commitments
Capital commitments
As at June 30, 2025, Hudbay had outstanding capital commitments in Manitoba of approximately $9.2 million of which $8.2 million can be terminated, approximately $19.7 million in British Columbia of which $2.2 million can be terminated, approximately $33.7 million in Peru all of which can be terminated, and approximately $74.3 million in Arizona, primarily related to the Copper World Complex, of which $72.1 million can be terminated.
23. Supplementary cash flow information
(a) Other operating activities:
| Three months ended June 30, | Six months ended June 30, | |||||||||||
| 2025 | 2024 | 2025 | 2024 | |||||||||
| Share-based compensation paid | $ | (1.1 | ) | $ | (1.5 | ) | $ | (9.8 | ) | $ | (4.1 | ) |
| Other | - | 0.6 | 1.2 | 0.4 | ||||||||
| $ | (1.1 | ) | $ | (0.9 | ) | $ | (8.6 | ) | $ | (3.7 | ) | |
(b) Change in non-cash working capital:
| Three months ended June 30, | Six months ended June 30, | |||||||||||
| 2025 | 2024 | 2025 | 2024 | |||||||||
| Change in: | ||||||||||||
| Trade and other receivables | $ | 31.0 | $ | 12.8 | $ | (1.4 | ) | $ | 16.7 | |||
| Other financial assets/liabilities | 2.7 | (11.7 | ) | 24.5 | (11.9 | ) | ||||||
| Inventories | 11.8 | 9.6 | 14.6 | 15.3 | ||||||||
| Prepaid expenses | 4.8 | 1.5 | 7.0 | (6.5 | ) | |||||||
| Trade and other payables | 18.7 | 8.1 | (14.7 | ) | (4.3 | ) | ||||||
| Provisions and other liabilities | (3.0 | ) | (3.8 | ) | (2.7 | ) | (0.7 | ) | ||||
| $ | 66.0 | $ | 16.5 | $ | 27.3 | $ | 8.6 | |||||
| HUDBAY MINERALS INC. Notes to Unaudited Condensed Consolidated Interim Financial Statements (in millions of US dollars, except where otherwise noted) For the three and six months ended June 30, 2025 and 2024 |
(c) Non-cash transactions:
During the six months ended June 30, 2025 and 2024, Hudbay entered into the following non-cash investing and financing activities which are not reflected in the condensed consolidated interim statements of cash flows:
- Remeasurement of Hudbay's decommissioning and restoration liabilities led to a net increase in related property, plant and equipment assets of $0.5 million (June 30, 2024 - a net decrease of $8.2 million), mainly related to changes to real discount rates associated with remeasurement of the liabilities.
- Property, plant and equipment included $20.7 million (June 30, 2024 - $11.0 million) of capital additions related to the recognition of ROU assets and $8.2 million (June 30, 2024 - $26.7 million) of capital additions related to the recognition of property, plant and equipment that has been financed. Property, plant and equipment and other assets include $9.9 million in net capital additions related to agreements with communities (June 30, 2024 - $1.8 million). Property, plant and equipment includes $1.5 million of deduction for accrued grants related to equipment eligible for credits (June 30, 2024 - nil).
| HUDBAY MINERALS INC. Notes to Unaudited Condensed Consolidated Interim Financial Statements (in millions of US dollars, except where otherwise noted) For the three and six months ended June 30, 2025 and 2024 |
24. Segmented information
Hudbay has the following reportable segments identified by the individual mining operations of Manitoba, British Columbia, Peru, as well as Arizona which holds our Copper World project. Corporate and other activities are not considered an operating segment and are included as a reconciliation to total consolidated results. Corporate and other activities include the Company's exploration activities in Chile, Canada and the State of Nevada. These exploration entities are not individually significant, as they do not meet the minimum quantitative thresholds for standalone segment disclosure.
| Three months ended June 30, 2025 | ||||||||||||||||||
| Peru | Manitoba | British Columbia |
Arizona | Corporate and other activities |
Total | |||||||||||||
| Revenue from external customers | $ | 259.6 | $ | 193.0 | $ | 83.8 | $ | - | $ | - | $ | 536.4 | ||||||
| Cost of sales | ||||||||||||||||||
| Mine operating costs | 127.8 | 74.3 | 61.4 | - | - | 263.5 | ||||||||||||
| Depreciation and amortization | 56.0 | 23.6 | 16.8 | - | - | 96.4 | ||||||||||||
| Gross profit | 75.8 | 95.1 | 5.6 | - | - | 176.5 | ||||||||||||
| Selling and administrative expenses | - | - | - | - | 20.7 | 20.7 | ||||||||||||
| Exploration expenses | 5.4 | 4.0 | - | - | - | 9.4 | ||||||||||||
| Other expenses (income) | 3.4 | 4.2 | 0.7 | 0.1 | (1.3 | ) | 7.1 | |||||||||||
| Re-evaluation adjustment - environmental provision | - | (13.8 | ) | - | - | - | (13.8 | ) | ||||||||||
| Results from operating activities | $ | 67.0 | $ | 100.7 | $ | 4.9 | $ | (0.1 | ) | $ | (19.4 | ) | $ | 153.1 | ||||
| Net interest expense on long term debt | 15.6 | |||||||||||||||||
| Accretion on streaming arrangements | 5.2 | |||||||||||||||||
| Change in fair value of financial instruments | (4.1 | ) | ||||||||||||||||
| Other net finance income | (16.7 | ) | ||||||||||||||||
| Income before tax | 153.1 | |||||||||||||||||
| Tax expense | 38.4 | |||||||||||||||||
| Net income for the period | $ | 114.7 | ||||||||||||||||
| HUDBAY MINERALS INC. Notes to Unaudited Condensed Consolidated Interim Financial Statements (in millions of US dollars, except where otherwise noted) For the three and six months ended June 30, 2025 and 2024 |
| Three months ended June 30, 2024 | ||||||||||||||||||
| Peru | Manitoba | British Columbia |
Arizona | Corporate and other activities |
Total | |||||||||||||
| Revenue from external customers | $ | 204.8 | $ | 142.6 | $ | 78.1 | $ | - | $ | - | $ | 425.5 | ||||||
| Cost of sales | ||||||||||||||||||
| Mine operating costs | 116.8 | 71.7 | 61.8 | - | - | 250.3 | ||||||||||||
| Depreciation and amortization | 58.9 | 24.7 | 14.0 | - | - | 97.6 | ||||||||||||
| Gross profit | 29.1 | 46.2 | 2.3 | - | - | 77.6 | ||||||||||||
| Selling and administrative expenses | - | - | - | - | 18.4 | 18.4 | ||||||||||||
| Exploration expenses | 4.1 | 2.2 | (0.3 | ) | - | - | 6.0 | |||||||||||
| Other expenses | 5.0 | 3.7 | 2.4 | - | 0.1 | 11.2 | ||||||||||||
| Re-evaluation adjustment - environmental provision | - | (2.7 | ) | - | - | - | (2.7 | ) | ||||||||||
| Results from operating activities | $ | 20.0 | $ | 43.0 | $ | 0.2 | $ | - | $ | (18.5 | ) | $ | 44.7 | |||||
| Net interest expense on long term debt | 18.5 | |||||||||||||||||
| Accretion on streaming arrangements | 6.0 | |||||||||||||||||
| Change in fair value of financial instruments | 13.2 | |||||||||||||||||
| Other net finance costs | 6.6 | |||||||||||||||||
| Income before tax | 0.4 | |||||||||||||||||
| Tax expense | 20.7 | |||||||||||||||||
| Net loss for the period | $ | (20.3 | ) | |||||||||||||||
| HUDBAY MINERALS INC. Notes to Unaudited Condensed Consolidated Interim Financial Statements (in millions of US dollars, except where otherwise noted) For the three and six months ended June 30, 2025 and 2024 |
| Six months ended June 30, 2025 | ||||||||||||||||||
| Peru | Manitoba | British Columbia |
Arizona | Corporate and other activities |
Total | |||||||||||||
| Revenue from external customers | $ | 549.3 | $ | 417.8 | $ | 164.2 | $ | - | $ | - | $ | 1,131.3 | ||||||
| Cost of sales | ||||||||||||||||||
| Mine operating costs | 256.3 | 146.8 | 115.9 | - | - | 519.0 | ||||||||||||
| Depreciation and amortization | 124.2 | 47.5 | 32.8 | - | - | 204.5 | ||||||||||||
| Gross profit | 168.8 | 223.5 | 15.5 | - | - | 407.8 | ||||||||||||
| Selling and administrative expenses | - | - | - | - | 34.4 | 34.4 | ||||||||||||
| Exploration expenses | 8.7 | 14.6 | - | - | - | 23.3 | ||||||||||||
| Other expenses (income) | 5.4 | 6.7 | 2.4 | 0.2 | (2.4 | ) | 12.3 | |||||||||||
| Re-evaluation adjustment - environmental provision | - | (1.0 | ) | - | - | - | (1.0 | ) | ||||||||||
| Results from operating activities | $ | 154.7 | $ | 203.2 | $ | 13.1 | $ | (0.2 | ) | $ | (32.0 | ) | $ | 338.8 | ||||
| Net interest expense on long term debt | 31.5 | |||||||||||||||||
| Accretion on streaming arrangements | 9.6 | |||||||||||||||||
| Change in fair value of financial instruments | (9.3 | ) | ||||||||||||||||
| Other net finance income | (17.4 | ) | ||||||||||||||||
| Income before tax | 324.4 | |||||||||||||||||
| Tax expense | 110.5 | |||||||||||||||||
| Net income for the period | $ | 213.9 | ||||||||||||||||
| HUDBAY MINERALS INC. Notes to Unaudited Condensed Consolidated Interim Financial Statements (in millions of US dollars, except where otherwise noted) For the three and six months ended June 30, 2025 and 2024 |
| Six months ended June 30, 2024 | ||||||||||||||||||
| Peru | Manitoba | British Columbia |
Arizona | Corporate and other activities |
Total | |||||||||||||
| Revenue from external customers | $ | 492.7 | $ | 311.8 | $ | 146.0 | $ | - | $ | - | $ | 950.5 | ||||||
| Cost of sales | ||||||||||||||||||
| Mine operating costs | 245.6 | 149.7 | 118.7 | - | - | 514.0 | ||||||||||||
| Depreciation and amortization | 129.9 | 51.3 | 25.7 | - | - | 206.9 | ||||||||||||
| Gross profit | 117.2 | 110.8 | 1.6 | - | - | 229.6 | ||||||||||||
| Selling and administrative expenses | - | - | - | - | 35.0 | 35.0 | ||||||||||||
| Exploration expenses | 6.3 | 10.7 | - | - | 1.6 | 18.6 | ||||||||||||
| Other expenses | 8.2 | 6.9 | 3.6 | 8.2 | 0.6 | 27.5 | ||||||||||||
| Re-evaluation adjustment - environmental provision | - | (8.0 | ) | - | - | - | (8.0 | ) | ||||||||||
| Results from operating activities | $ | 102.7 | $ | 101.2 | $ | (2.0 | ) | $ | (8.2 | ) | $ | (37.2 | ) | $ | 156.5 | |||
| Net interest expense on long term debt | 37.7 | |||||||||||||||||
| Accretion on streaming arrangements | 12.2 | |||||||||||||||||
| Change in fair value of financial instruments | 20.2 | |||||||||||||||||
| Other net finance costs | 18.2 | |||||||||||||||||
| Income before tax | 68.2 | |||||||||||||||||
| Tax expense | 70.0 | |||||||||||||||||
| Net loss for the period | $ | (1.8 | ) | |||||||||||||||
| HUDBAY MINERALS INC. Notes to Unaudited Condensed Consolidated Interim Financial Statements (in millions of US dollars, except where otherwise noted) For the three and six months ended June 30, 2025 and 2024 |
| June 30, 2025 | ||||||||||||||||||
| Peru | Manitoba | British Columbia |
Arizona | Corporate and other activities |
Total | |||||||||||||
| Total assets | $ | 2,380.7 | $ | 499.4 | $ | 1,234.1 | $ | 785.5 | $ | 728.9 | $ | 5,628.6 | ||||||
| Total liabilities | 887.9 | 410.0 | 303.8 | 16.1 | 1,147.5 | 2,765.3 | ||||||||||||
| Property, plant and equipment1 | 1,885.9 | 616.0 | 999.6 | 773.9 | 40.7 | 4,316.1 | ||||||||||||
| Other Non-Current Assets2 | 52.4 | 19.8 | 10.2 | 0.2 | 0.5 | 83.1 | ||||||||||||
| 1 Included in Corporate and other activities are $27.7 million of property, plant and equipment that is located in Nevada. | ||||||||||||||||||
| 2 Other non-current assets includes receivables, inventory, intangibles and other assets. | ||||||||||||||||||
| December 31, 2024 | ||||||||||||||||||
| Peru | Manitoba | British Columbia |
Arizona |
Corporate |
Total | |||||||||||||
| Total assets | $ | 2,410.0 | $ | 547.4 | $ | 1,076.0 | $ | 757.3 | $ | 696.9 | $ | 5,487.6 | ||||||
| Total liabilities | 960.0 | 421.3 | 281.9 | 14.7 | 1,162.3 | 2,840.2 | ||||||||||||
| Property, plant and equipment1 | 1,897.1 | 595.1 | 900.7 | 747.1 | 41.4 | 4,181.4 | ||||||||||||
| Other Non-Current Assets2 | 47.8 | 17.2 | 8.0 | 0.2 | 0.6 | 73.8 | ||||||||||||
| 1 Included in Corporate and other activities is $27.7 million of property, plant and equipment that is located in Nevada. | ||||||||||||||||||
| 2 Other non-current assets includes receivables, inventory, intangibles and other assets. | ||||||||||||||||||
25. Events after reporting period
Manitoba Temporary Wildfire Evacuation Orders
On July 10, 2025, a mandatory wildfire evacuation order was issued for the town of Snow Lake resulting in a temporary suspension of the Manitoba operations through to the date of this report. Essential personnel, authorized by emergency services, have remained onsite when safe to do so in order to continue supporting fire mitigation activities and safeguarding Hudbay's assets. There has been no structural damage to Hudbay's onsite surface infrastructure and facilities as of the date of this report. As of August 12, 2025, the wildfire situation near Snow Lake has improved and Hudbay anticipates returning to normal operations later in August.
Strategic Investment Transaction Copper World
On August 12, 2025, Hudbay entered into an agreement with Mitsubishi Corporation ("Mitsubishi") pursuant to which Mitsubishi will make a strategic investment in Copper World (the "Strategic Investment Transaction"). The terms of the Strategic Investment Transaction consist of the following:
- $600 million of initial cash contribution will consist of $420 million at closing and $180 million matching contribution payable within 18 months of closing.
- Mitsubishi will also fund its pro-rata share of future equity capital contributions.
The Strategic Investment Transaction is expected to close in late 2025 or early 2026 and is conditioned upon receipt of certain regulatory approvals and the satisfaction of other customary closing conditions.

Management's Discussion and Analysis of
Results of Operations and Financial Condition
For the three and six months ended
June 30, 2025
August 12, 2025
INTRODUCTION
This Management's Discussion and Analysis ("MD&A") dated August 12, 2025 is intended to supplement Hudbay Minerals Inc.'s unaudited condensed consolidated interim financial statements and related notes for the three and six months ended June 30, 2025 and 2024 (the "consolidated interim financial statements"). The consolidated interim financial statements have been prepared in accordance with IFRS® Accounting Standards ("IFRS" or "GAAP") as issued by the International Accounting Standards Board ("IASB").
References to "Hudbay" or the "Company" refer to Hudbay Minerals Inc. and its direct and indirect subsidiaries as at June 30, 2025.
Readers should be aware that:
- This MD&A contains certain "forward-looking statements" and "forward-looking information" (collectively, "forward-looking information") that are subject to risk factors set out in a cautionary note contained in Hudbay's MD&A.
- This MD&A has been prepared in accordance with the requirements of the securities laws in effect in Canada, which may differ materially from the requirements of United States securities laws applicable to US issuers.
- Hudbay uses a number of non-GAAP financial performance measures in Hudbay's MD&A, which do not have standardized meaning under IFRS. For further information and detailed reconciliations of such measures, please see the discussion under the "Non-GAAP Financial Performance Measures" section herein.
- The technical and scientific information in this MD&A has been approved by qualified persons based on a variety of assumptions and estimates. Please see the discussion under the "Qualified Persons and NI 43-101" section herein.
Readers are also urged to review the "Notes to Reader" section beginning on page 70 of this MD&A.
Additional information regarding Hudbay, including the risks related to its business and those that are reasonably likely to affect its consolidated interim financial statements in the future, is contained in Hudbay's continuous disclosure materials, including its most recent Annual Information Form, consolidated interim financial statements and Management Information Circular available on SEDAR+ at www.sedarplus.ca and on EDGAR at www.sec.gov.
All amounts are in US dollars unless otherwise noted.
HUDBAY'S BUSINESS
Hudbay is a copper-focused critical minerals company with three long-life operations and a world-class pipeline of copper growth projects in tier-one mining jurisdictions of Canada, Peru and the United States. Hudbay's operating portfolio includes the Constancia mine in Cusco (Peru), the Snow Lake operations in Manitoba (Canada) and the Copper Mountain mine in British Columbia (Canada). Copper is the primary metal produced by the company, which is complemented by meaningful gold production and by-product zinc, silver and molybdenum. The Company's growth pipeline includes the Copper World project in Arizona (United States), the Mason project in Nevada (United States), the Llaguen project in La Libertad (Peru) and several expansion and exploration opportunities near its existing operations. Hudbay is governed by the Canada Business Corporations Act and its shares are listed under the symbol "HBM" on the Toronto Stock Exchange, New York Stock Exchange and Bolsa de Valores de Lima.
HUDBAY'S PURPOSE
The value Hudbay creates and the impact it has is embodied in its purpose statement: "We care about our people, our communities and our planet. Hudbay provides the metals the world needs. We work sustainably, transform lives and create better futures for communities."
Hudbay transforms lives: Hudbay invests in its employees, their families and local communities through long-term employment, local procurement and economic development to improve their quality of life and ensure the communities benefit from the Company's presence.
Hudbay operates responsibly: From exploration to closure, Hudbay operates safely and responsibly, welcomes innovation and strives to minimize its environmental footprint while following leading operating practices in all facets of mining.
Hudbay provides critical metals: Hudbay produces copper and other metals needed for everyday products and essential for applications to support the energy transition toward a more sustainable future.
SUMMARY
Delivered Strong Second Quarter Financial Results; Production Reaffirmed and Cost Guidance Improved
• Achieved revenue of $536.4 million and adjusted EBITDA1 of $245.2 million in the second quarter of 2025.
• Strong financial results were driven by attractive operating cost margins and significant exposure to copper and gold across Hudbay's diversified operating portfolio.
• Steady production continued into the second quarter with consolidated copper production of 29,956 tonnes and consolidated gold production of 56,271 ounces.
• Industry-leading cost performance continued in the second quarter with consolidated cash cost1 and sustaining cash cost1 per pound of copper produced, net of by-product credits, of $(0.02) and $1.65, respectively.
• Reaffirmed full year 2025 consolidated production guidance of 117,000 to 149,000 tonnes of copper and 247,500 to 308,000 ounces of gold.
• Improved full year 2025 consolidated cash cost1 guidance to $0.65 to $0.85 per pound from $0.80 to $1.00 per pound, as year-to-date results are trending well below the low end of the cost ranges due to increased exposure to gold by-product credits and continued strong cost control across all operations.
• Peru operations produced 21,710 tonnes of copper and 7,366 ounces of gold in the second quarter, in line with quarterly cadence expectations, despite lower average mill throughput of approximately 83,100 tonnes per day due to a planned semi-annual mill maintenance shutdown in the second quarter. Peru cash cost1 per pound of copper produced, net of by-product credits, was $1.45 in the second quarter, in line with the annual guidance range.
• Manitoba operations produced 43,235 ounces of gold in the second quarter, slightly lower than quarterly cadence expectations as a result of a temporary shutdown of operations due to wildfire evacuation orders, partially offset by continued strong gold grades at Lalor and mill throughput outperformance at New Britannia. Manitoba cash cost1 per ounce of gold produced, net of by-product credits, was $710 in the second quarter, in line with the annual guidance range.
• British Columbia operations produced 6,634 tonnes of copper at a cash cost1 per pound of copper produced, net of by-product credits, of $2.39 in the second quarter, reflecting efficiency benefits from Hudbay's optimization initiatives.
• Second quarter net earnings attributable to owners and earnings per share attributable to owners were $117.7 million and $0.30, respectively, a 17% and 20% increase, respectively, compared to the first quarter of 2025 and a significant increase compared to the second quarter of 2024, driven by higher gross margins and strong cost control. After adjusting for various non-cash items, second quarter adjusted earnings1 per share attributable to owners was $0.19.
• Cash and cash equivalents increased by $62.9 million to $625.5 million during the second quarter and total liquidity2 was $1,050.2 million as at June 30, 2025.
Continued Free Cash Flow Generation Driving Further Debt Reduction and Balance Sheet Resilience
• Hudbay's unique copper and gold diversification across its operations provides exposure to higher copper and gold prices, which together with a focus on cost control across the business, continues to expand margins and generate attractive free cash flow1.
• While the majority of revenues continue to be derived from copper production, gold represented more than 36% of total revenues in the second quarter of 2025.
• Delivered the eighth consecutive quarter of meaningful free cash flow1 generation with $87.8 million achieved during the second quarter of 2025, resulting in more than $400 million in annual free cash flow1 over the last twelve months.
• Achieved adjusted EBITDA1 of $245.2 million in the second quarter of 2025, resulting in record annual trailing twelve-month adjusted EBITDA1 of $995.9 million.
• Repurchased and retired an additional $50 million of senior unsecured notes through open market purchases at a discount to par during the second quarter, reducing total principal debt to $1.07 billion as of June 30, 2025.
• Approximately $295 million in total debt repayments and gold prepayment liability reductions have been achieved since the beginning of 2024.
• Net debt1 significantly reduced to $434.1 million as at June 30, 2025 compared to $525.7 million at December 31, 2024, a decrease of $91.6 million in the first half of 2025.
• Net debt to adjusted EBITDA ratio1 was 0.4x at the end of the second quarter of 2025, an improvement from 0.6x at the end of the first quarter of 2025 and 0.8x at the end of the second quarter of 2024. This is the lowest net leverage level achieved since Hudbay developed Constancia over a decade ago.
• Current balance sheet expected to be further enhanced with proceeds from the $600 million Copper World joint venture transaction, as mentioned below. On a pro-forma basis, as at June 30, 2025, this would increase cash and cash equivalents to more than $1.0 billion and total liquidity to more than $1.5 billion, while reducing net debt1 to zero.
Prudently Advancing Copper World with Accretive Minority Joint Venture Transaction, Enhanced Stream Transaction and Successful Achievement of "3-P" Plan
• Announced $600 million Copper World joint venture transaction with Mitsubishi Corporation ("Mitsubishi") for a 30% minority interest ("JV Transaction").
◦ Implies a significant premium to consensus net asset value for Copper World3.
◦ Mitsubishi's $600 million initial investment will consist of $420 million at closing and $180 million within 18 months of closing.
◦ Mitsubishi will also fund its pro-rata 30% share of future equity capital contributions.
◦ Increases levered project IRR to Hudbay to approximately 90% based on pre-feasibility study ("PFS") estimates4.
• Secures a premier long-term strategic partner in Mitsubishi, one of the largest Japanese trading houses with a global mining presence and a significant U.S. based business.
◦ Mitsubishi is the strategic partner of choice with investments in a world-class portfolio of large and high-quality copper assets, including five of the top twenty copper mines globally by 2024 production.
◦ Mitsubishi's wholly owned U.S. subsidiary, Mitsubishi Corporation (Americas), has over 50 subsidiaries and affiliates across various business sectors, including mineral resources, oil & gas, real estate, mobility, food, power, etc., and manages the company's strategic investments with approximately $9 billion in total assets and trading businesses in North America, which encompass trading activity with a substantial volume of copper, precious metals, and aluminum in the U.S. market.
◦ Strategic partnership validates the attractive long-term value of Copper World as a world-class copper asset and endorses the strong technical capabilities of Hudbay.
• Agreed on terms with Wheaton Precious Metals Corp. ("Wheaton") to amend the existing precious metals streaming agreement.
◦ In addition to the initial $230 million stream deposit, provides an additional contingent payment of up to $70 million on a future potential mill expansion recognizing the long-term potential at Copper World.
◦ Ongoing payments for gold and silver amended from fixed pricing to 15% of spot prices to provide upside exposure to higher precious metals prices.
◦ Updated structure aligns with the current development plan for Copper World and the joint venture agreement.
• Successfully completes key elements of Hudbay's prudent financial strategy as part of the three prerequisites ("3-P") plan for Copper World with the announcements of the JV Transaction and the enhanced Wheaton stream, together with the achievements of stated balance sheet targets.
◦ Before accounting for proceeds from this Transaction, Hudbay had achieved more than $600 million of cash and cash equivalents and a 0.4x net debt to adjusted EBITDA ratio1, as of June 30, 2025, far exceeding the stated balance sheet targets.
◦ The Mitsubishi initial investment and its pro-rata equity capital contributions, together with the amended Wheaton stream, provide significant financial flexibility by reducing Hudbay's estimated share of the remaining capital contributions to approximately $200 million based on PFS estimates4, and defers Hudbay's first capital contribution until 2028 at the earliest.
• Well positioned to advance Copper World towards a sanction decision in 2026.
◦ Feasibility study for Copper World is underway with expected completion of a definitive feasibility study ("DFS") by mid-2026.
◦ With this successful de-risking milestone at Copper World, Hudbay expects to accelerate detailed engineering, some key long lead items and other de-risking activities by advancing $20 million in growth capital expenditures to 2025 from future years, and is updating total 2025 Arizona growth spending guidance to $110 million from $90 million on a 100% basis.
Reinvesting in High-return Growth Initiatives to Further Enhance Copper and Gold Exposure
• Advancing high-return brownfield mill enhancement initiatives and greenfield copper projects to drive near-term and long-term production growth with $33.1 million in growth capital expenditures during the second quarter of 2025.
• Optimization efforts at Copper Mountain are focused on executing the planned accelerated stripping program and mill throughput improvement projects. The planned conversion of the third ball mill to a second SAG mill remains on budget and on schedule, with completion of the initial phase achieved on July 10 and ramp up of the final phase expected in the fourth quarter of 2025.
• Mining of first zinc ore from the exploration and haulage drifts at 1901 was achieved in the second quarter, and planned activities over the next two years are expected to de-risk the path towards full production in 2027.
• Large exploration program in Snow Lake continues to execute threefold strategy focused on near-mine exploration to increase near-term production and mineral reserves, testing regional satellite deposits for additional ore feed to utilize available capacity at the Stall mill, and exploring the large land package for a potential new anchor deposit to meaningfully extend mine life.
• Drilling commenced at the Talbot copper-zinc-gold deposit near Snow Lake as part of a large summer exploration program.
• Continuing to advance Flin Flon tailings reprocessing opportunities through metallurgical test work and economic evaluation to assess the possibility of producing critical minerals and precious metals in an environmentally friendly manner.
• Completed transaction with Mitsubishi Materials Corporation to consolidate Hudbay's 100% ownership of the Copper Mountain mine in a highly accretive transaction to further increase Hudbay's exposure to a long-life, high-quality copper asset in a tier-1 mining jurisdiction, resulting in an expected 200% increase in attributable copper production from Copper Mountain in 2027 compared to 20245.
• Permitting application for the New Ingerbelle growth project at Copper Mountain was accepted for review by the B.C. Major Mines Office in May and is proceeding through the Mine Review Committee review process.
• Continuing to enhance stakeholder engagement and advance additional metallurgical studies at the Mason copper project in Nevada.
Summary of Second Quarter Results
Steady production continued into the second quarter of 2025 with consolidated copper production of 29,956 tonnes and consolidated gold production of 56,271 ounces. Consolidated copper and gold production was lower than the first quarter of 2025 primarily due to the impacts of a temporary suspension of operations in Manitoba as a result of mandatory wildfire evacuation orders. Consolidated silver production of 814,989 ounces and zinc production of 5,130 tonnes in the second quarter of 2025 were also lower than the first quarter of 2025 for the aforementioned reason.
Cash generated from operating activities of $259.9 million increased compared to the same period in 2024 and the first quarter of 2025 as a result of higher gross margins driven by stable copper production, higher realized prices and positive working capital management with reductions in finished goods inventories and receivable balances. Operating cash flow before change in non-cash working capital was $193.9 million during the second quarter of 2025, reflecting an increase of $70.2 million compared to the same period in 2024 and an increase of $30.4 million compared to the first quarter of 2025. The increase compared to the second quarter of 2024 reflects the higher gold realized price during the quarter, strong operating cost performance and higher sales volume partially offset by higher cash taxes paid. The increase compared to the first quarter of 2025 was primarily the result of lower cash taxes paid, offset by lower gold and copper sales volume in Manitoba.
Second quarter adjusted EBITDA1 was $245.2 million, a 15% decrease compared to $287.2 million in the first quarter of 2025 due to lower sales volume, partially offset by higher gold prices. Second quarter adjusted EBITDA1 increased by 69% compared to $145.0 million in the second quarter of 2024 as a result of higher sales volume and higher realized gold prices during the quarter.
Net earnings attributable to owners in the second quarter of 2025 was $117.7 million, or $0.30 per share, compared to $100.4 million, or $0.25 per share, in the first quarter of 2025 and net loss attributable to owners and loss per share attributable to owners of $16.5 million, or $0.04 per share, in the second quarter of 2024. The increase in earnings compared to the first quarter of 2025 is the result of high gross margins from strong revenue growth on the back of stable copper production and higher realized gold prices. In addition, the quarter benefited from various non-cash charges for revaluation gain of closed sites reclamation provisions, and significantly reduced net finance expenses, among other items, more than offsetting the high mining and income tax expense experienced in the current quarter.
Adjusted net earnings attributable to owners1 and adjusted net earnings per share attributable to owners1 in the second quarter of 2025 were $75.5 million and $0.19 per share, respectively, after adjusting for various non-cash items on a pre-tax basis such as a non-cash $18.9 million foreign exchange gain, a non-cash gain of $13.8 million related to quarterly revaluation of Hudbay's closed site environmental reclamation provision, a $6.3 million mark-to-market revaluation gain on various instruments such as investments and share-based compensation, and a $1.2 million gain related to flow-through share expenditures, among other items. This compares to adjusted net earnings attributable to owners1 and net earnings per share attributable to owners1 of $0.2 million and nil per share in the second quarter of 2024 and $93.8 million and $0.24 per share in the first quarter of 2025. The sharp increase in adjusted net earnings attributable to owners1 and adjusted net earnings per share attributable to owners1 compared to second quarter of 2024 is for the same reasons discussed above for net earnings.
In the second quarter of 2025, consolidated cash cost per pound of copper produced, net of by-product credits1, was $(0.02), compared to $(0.45) in the first quarter of 2025 as the Company continued to demonstrate industry-leading cost performance. The change from the first quarter was a result of lower by-product credits and lower production levels in Manitoba during the second quarter. When compared to the second quarter of 2024, consolidated cash cost per pound of copper, net of by-product credits1 decreased by $1.16 as a result of higher by-product credits, higher production and stronger cost performance across all business units.
Consolidated sustaining cash cost per pound of copper produced, net of by-product credits1, was $1.65 in the second quarter of 2025, compared to $0.72 in the first quarter of 2025. The increase was driven by planned higher sustaining capital expenditures and the aforementioned variance in cash cost. Consolidated sustaining cash cost was lower than $2.65 in the second quarter of 2024, primarily due to the same factors impacting consolidated cash cost and partially offset by higher sustaining capital expenditures.
Consolidated all-in sustaining cash cost per pound of copper produced, net of by-product credits1, was $2.03 in the second quarter of 2025, higher than $0.97 in the first quarter of 2025 mainly due to the same reasons outlined above as well as higher corporate G&A from the revaluation of the Company's stock based compensation due to relative higher share prices. Consolidated all-in sustaining cash cost was lower than $3.07 in the same period in 2024 due to the same reasons outlined above as well as lower accretion and amortization of community agreements, partially offset with higher corporate G&A costs.
As at June 30, 2025, total liquidity was $1,050.2 million, including $625.5 million in cash and cash equivalents, and undrawn availability of $424.7 million under Hudbay's revolving credit facilities. Net debt1 at the end of the second quarter was $434.1 million, marking a $92.0 million improvement from the first quarter of 2025 as a result of deleverging activities. Hudbay expects that the current liquidity together with cash flows from operations will be sufficient to meet the Company's liquidity needs for the year.
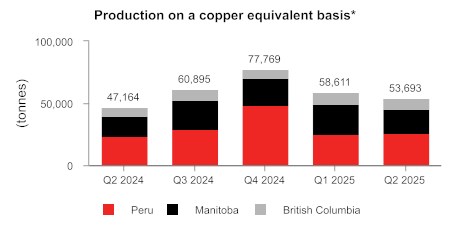
*Copper equivalent production is calculated using the quarter average LME prices for each metal.
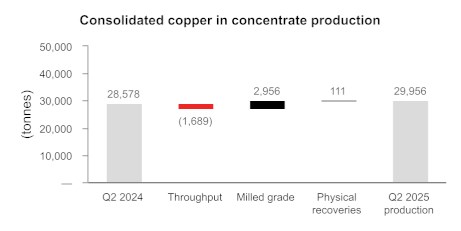
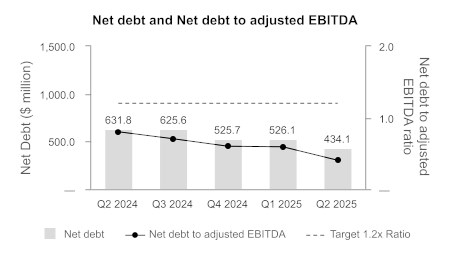
1 Adjusted net earnings (loss) - attributable to owners and adjusted net earnings (loss) per share - attributable to owners, adjusted EBITDA, cash cost, sustaining cash cost, all-in sustaining cash cost per pound of copper produced, net of by-product credits, cash cost, sustaining cash cost per ounce of gold produced, net of by-product credits, combined unit cost, net debt, net debt to adjusted EBITDA ratio and free cash flow are non-GAAP financial performance measures with no standardized definition under IFRS. For further information and a detailed reconciliation, please see the discussion under the "Non-GAAP Financial Performance Measures" section of this MD&A.
2 Liquidity includes $625.5 million in cash and cash equivalents as well as undrawn total availability of $424.7 million under Hudbay's revolving credit facilities.
3 Average analyst consensus net asset value estimate for 100% of Copper World is approximately $1.16 billion as of August 12, 2025.
4 Based on the initial capital investment and the $3.75 per pound copper price used in the PFS published on September 8, 2023 with assumptions of approximately $145 million for pre-sanctioning costs, $230 million from the precious metals stream, $350 million from project-level financing and approximately $700 million from the joint venture partner earn-in, matching contribution and capital contribution.
5 Copper Mountain copper production comparison based on the mid-point of the 2027 guidance range compared to 2024 actuals.
KEY FINANCIAL RESULTS
| Financial Condition | ||||||
| (in $ millions, except net debt to adjusted EBITDA ratio) | Jun. 30, 2025 | Dec. 31, 2024 | ||||
| Cash and cash equivalents and short-term investments | $ | 625.5 | $ | 581.8 | ||
| Total debt | 1,059.6 | 1,107.5 | ||||
| Net debt1 | 434.1 | 525.7 | ||||
| Working capital2 | 26.8 | 511.3 | ||||
| Total assets | 5,628.6 | 5,487.6 | ||||
| Equity attributable to owners of the Company | 2,863.3 | 2,553.2 | ||||
| Net debt to adjusted EBITDA 1 | 0.4 | 0.6 |
| 1 Net debt and net debt to adjusted EBITDA are non-GAAP financial performance measures with no standardized definition under IFRS. For further information and a detailed reconciliation, please see discussion under the "Non-GAAP Financial Performance Measures" section of this MD&A. | |||||
| 2 Working capital is determined as total current assets less total current liabilities as defined under IFRS and disclosed on the consolidated interim financial statements. Working capital as of June 30, 2025 was impacted by an increase in the current portion of long-term debt of $523.8 million as the 2026 Notes are now maturing within one year. |
| Financial Performance | Three months ended | Six months ended | |||||||||||||
| (in $ millions, except per share amounts or as noted below) | Jun. 30, 2025 | Mar. 31, 2025 | Jun. 30, 2024 | Jun. 30, 2025 | Jun. 30, 2024 | ||||||||||
| Revenue | $ | 536.4 | $ | 594.9 | $ | 425.5 | $ | 1,131.3 | $ | 950.5 | |||||
| Cost of sales | 359.9 | 363.6 | 347.9 | 723.5 | 720.9 | ||||||||||
| Earnings before tax | 153.1 | 171.3 | 0.4 | 324.4 | 68.2 | ||||||||||
| Net earnings (loss) | 114.7 | 99.2 | (20.3 | ) | 213.9 | (1.8 | ) | ||||||||
| Net earnings (loss) attributable to owners | 117.7 | 100.4 | (16.5 | ) | 218.1 | 5.8 | |||||||||
| Basic and diluted earnings (loss) per share - attributable | 0.30 | 0.25 | (0.04 | ) | 0.55 | 0.02 | |||||||||
| Adjusted earnings per share - attributable1 | 0.19 | 0.24 | 0.00 | 0.43 | 0.17 | ||||||||||
| Operating cash flow before change in non-cash working capital | 193.9 | 163.5 | 123.7 | 357.4 | 271.2 | ||||||||||
| Adjusted EBITDA1 | 245.2 | 287.2 | 145.0 | 532.4 | 360.0 | ||||||||||
| Free cash flow1 | 87.8 | 87.4 | 32.5 | 175.2 | 119.7 | ||||||||||
| 1 Adjusted earnings per share - attributable to owners, adjusted EBITDA and free cash flow are non-GAAP financial performance measures with no standardized definition under IFRS. For further information and a detailed reconciliation, please see discussion under the "Non-GAAP Financial Performance Measures" section of this MD&A. | |||||||||||||||
KEY PRODUCTION RESULTS
| Three months ended | Six months ended | Guidance | |||||
| Jun. 30, 2025 |
Mar. 31, 2025 |
Jun. 30, 2024 |
Jun. 30, 2025 |
Jun. 30, 2024 |
Annual 2025 | ||
| Contained metal in concentrate and doré produced1 | |||||||
| Copper | tonnes | 29,956 | 30,958 | 28,578 | 60,914 | 63,327 | 117,000 - 149,000 |
| Gold | oz | 56,271 | 73,784 | 58,614 | 130,055 | 149,006 | 247,500 - 308,000 |
| Silver | oz | 814,989 | 919,775 | 738,707 | 1,734,764 | 1,686,624 | 3,520,000 - 4,390,000 |
| Zinc | tonnes | 5,130 | 6,265 | 8,087 | 11,395 | 16,885 | 21,000 - 27,000 |
| Molybdenum | tonnes | 375 | 397 | 369 | 772 | 766 | 1,300 - 1,500 |
| Payable metal sold | |||||||
| Copper | tonnes | 30,354 | 31,768 | 25,799 | 62,122 | 59,407 | |
| Gold2 | oz | 62,466 | 75,092 | 61,295 | 137,558 | 169,376 | |
| Silver2 | oz | 894,160 | 1,006,968 | 667,036 | 1,901,128 | 1,735,884 | |
| Zinc | tonnes | 2,871 | 4,857 | 5,133 | 7,728 | 11,252 | |
| Molybdenum | tonnes | 427 | 448 | 347 | 875 | 762 | |
| 1 Metal reported in concentrate is prior to deductions associated with smelter contract terms. | |||||||
| 2 Includes total payable gold and silver in concentrate and in doré sold. | |||||||
KEY COST RESULTS
| Three months ended | Six months ended | Guidance | ||||||||
| Jun. 30, 2025 |
Mar. 31, 2025 |
Jun. 30, 2024 |
Jun. 30, 2025 |
Jun. 30, 2024 |
Annual 20252 |
|||||
| Peru cash cost per pound of copper produced | ||||||||||
| Cash cost1 | $/lb | 1.45 | 1.11 | 1.78 | 1.29 | 1.02 | 1.35 - 1.65 | |||
| Sustaining cash cost1 | $/lb | 2.63 | 1.92 | 2.60 | 2.29 | 1.71 | ||||
| Manitoba cash cost per ounce of gold produced | ||||||||||
| Cash cost1 | $/oz | 710 | 376 | 771 | 515 | 751 | 650 - 850 | |||
| Sustaining cash cost1 | $/oz | 1,025 | 626 | 1,163 | 793 | 1,042 | ||||
| British Columbia cash cost per pound of copper produced | ||||||||||
| Cash cost1 | $/lb | 2.39 | 2.44 | 2.67 | 2.41 | 3.09 | 2.45 - 3.45 | |||
| Sustaining cash cost1 | $/lb | 5.18 | 4.24 | 5.56 | 4.69 | 5.20 | ||||
| Consolidated cash cost per pound of copper produced | ||||||||||
| Cash cost1 | $/lb | (0.02 | ) | (0.45 | ) | 1.14 | (0.24 | ) | 0.60 | 0.65 - 0.85 |
| Sustaining cash cost1 | $/lb | 1.65 | 0.72 | 2.65 | 1.18 | 1.74 | 2.25 - 2.65 | |||
| All-in sustaining cash cost1 | $/lb | 2.03 | 0.97 | 3.07 | 1.49 | 2.09 | ||||
| 1 Cash cost, sustaining cash cost, all-in sustaining cash cost per pound of copper produced, net of by-product credits, gold cash cost, sustaining cash cost per ounce of gold produced, and net of by-product credits are non-GAAP financial performance measures with no standardized definition under IFRS. For further information and a detailed reconciliation, please see the discussion under the "Non-GAAP Financial Performance Measures" section of this MD&A. | ||||||||||
| 2 Improved full year 2025 consolidated copper cash cost guidance range to $0.65 to $0.85 per pound from the original guidance range of $0.80 to $1.00 per pound. | ||||||||||
RECENT DEVELOPMENTS
Continued Free Cash Flow Generation from Strong Copper and Gold Exposure
Hudbay has delivered eight consecutive quarters of meaningful free cash flow1 generation as a result of steady operating performance, expanding margins from strong copper and gold exposure and a focus on cost control across the business:
• Achieved record trailing twelve-month adjusted EBITDA1 of $995.9 million.
• Delivered more than $400 million in annual free cash flow1 generation over the last twelve months.
• Increased cash and cash equivalents balance to $625.5 million, the highest level achieved in more than a decade.
• Gold continues to represent more than 36% of total revenues, which together with Hudbay's primary copper revenue business provides unique copper and gold commodity diversification.
Significant Debt Reduction
As a result of the continued free cash flow1 generation and prudent balance sheet management, Hudbay was able to repurchase and retire $50.0 million of senior unsecured notes at a discount to par, during the second quarter of 2025. This has contributed to approximately $295 million in total debt repayments and gold prepayment liability reductions since the beginning of 2024:
• Repurchased and retired a total of $132.6 million of senior unsecured notes in 2024 and year-to-date 2025.
• Repaid $100 million of prior drawdowns under the revolving credit facilities in 2024.
• Fully repaid the gold prepay facility with $62.3 million in gold deliveries in 2024 and the final payment completed in August 2024.
These deleveraging achievements have reduced total principal debt to $1.07 billion as of June 30, 2025, which together with Hudbay's increased cash balance, has substantially reduced net debt1 to $434.1 million, compared to $631.8 million as of June 30, 2024. Incorporating higher levels of adjusted EBITDA1 over the last twelve months, Hudbay's net debt to adjusted EBITDA ratio1 has significantly improved to 0.4x.
Secured Premier Long-term Strategic Partner in Copper World JV Transaction
The joint venture will be structured as a new limited liability corporation, Copper World LLC. Under the JV Transaction, the initial contribution of $600 million for a 30% equity interest in Copper World LLC, will consist of $420 million upon closing and a $180 million matching contribution payable no later than 18 months following closing. Hudbay will retain 100% of its existing U.S. federal net operating losses of approximately $275 million and Arizona state losses of $210 million.
Hudbay welcomes a premier, long-term, strategic partner with deep technical expertise and a proven trading platform which Mitsubishi has established throughout its demonstrated history of industry partnerships. Mitsubishi's impressive track record in co-developing and operating some of the world's largest and highest quality copper projects will complement Hudbay's proven track record as a successful mine builder and operator.
Mitsubishi will be contributing 30% of the ongoing costs beginning August 31, 2025 and will participate in the funding of the DFS as well as the final project design, project financing, and project construction for Copper World.
The JV Transaction is expected to close in late 2025 or early 2026 and is conditioned upon receipt of certain regulatory approvals and the satisfaction of other customary closing conditions.
Enhanced Wheaton Precious Metals Stream
Hudbay is also pleased to announce that it has concurrently executed a non-binding term sheet to amend its existing Wheaton stream agreement for 100% of the gold and silver produced at Copper World (the "Wheaton Stream"), which will increase the value of the project and provide upside exposure to higher precious metal prices.
Key terms of this enhanced Wheaton Stream to include (subject to execution of definitive documentation):
• Up to $70 million contingent payment upon achieving potential mill expansion milestones in the future recognizing the long-term potential at Copper World.
• Amended ongoing payments for gold and silver from a fixed price to 15% of spot gold and silver prices providing upside exposure to higher precious metals prices.
• Initial $230 million stream deposit during project construction remains unchanged.
• Hudbay agreed to maintain existing fixed recoveries in the existing Constancia precious metals stream while Pampacancha is in production as well as provided a corporate guarantee for the existing Constancia stream in connection with the Wheaton Stream enhancement.
"Successfully Completed "3-P" Plan for Advancing Copper World Towards a Sanction Decision in 2026
As part of Hudbay's disciplined financial planning approach to developing Copper World, the Company implemented its 3-P plan in late 2022, including specific leverage targets that it would need to achieve prior to making an investment decision in the project:
1. Permits - Completed - Hudbay received all required state level permits.
2. Plan - Well Underway - Hudbay commenced activities related to the feasibility study for Copper World in late 2024 and expects to continue to advance definitive feasibility study activities throughout 2025 with completion by mid-2026.
3. Prudent Financing Strategy - Completed - Hudbay achieved all key elements of its multi-faceted financing strategy, including:
✓ Minimum cash balance of $600 million - As of June 30, 2025, Hudbay has over $625 million in cash and cash equivalents;
✓ Net debt to EBITDA ratio of less than 1.2x - As of June 30, 2025, Hudbay's net debt to adjusted EBITDA ratio1 is 0.4x, meaningfully below the targeted ratio to ensure financial flexibility during the sanctioning and construction of Copper World;
✓ Renegotiated precious metals stream agreement - Announced an enhanced Wheaton Stream that aligns with the current development plan for Copper World, reflects amended ongoing payments for gold and silver deliveries from a fixed pricing to 15% of spot prices to provide upside exposure to higher precious metals prices, while also providing additional contingent payments of up to $70 million related to potential future mill expansion milestones; and,
✓ Minority joint venture partner - Announced a $600 million transaction with Mitsubishi for a 30% minority joint venture interest in a highly accretive transaction, which creates a long-term partnership with a premier strategic partner that has a global mining presence and an established U.S. based metals trading business.
As a result of the completion of the prudent financing strategy, Hudbay's estimated share of the remaining capital contributions for the construction of Copper World is approximately $200 million2, and Hudbay's first capital contribution is deferred until 2028 at the earliest based on PFS estimates. Based on Hudbay's pro-forma cash and cash equivalents of more than $1.0 billion and total liquidity of more than $1.5 billion, using figures as at June 30, 2025, the Company has significant financial flexibility to fund its share of the remaining equity contributions at Copper World while continuing to maintain a strong balance sheet throughout the project construction period.
Manitoba Temporary Wildfire Evacuation Orders
Since the end of May, seasonal wildfires in northern Manitoba have resulted in evacuation orders in the regions where Hudbay operates. Emergency preparedness protocols were immediately activated and Hudbay has continued to work closely with local and provincial authorities to ensure the safety and well-being of its employees and nearby communities. The first mandatory wildfire evacuation orders resulted in Hudbay temporarily suspending operations in June for 13 days and operating with a reduced workforce since the end of May, before and after the operation suspension. The Company committed over C$2 million in funding support in June, including C$1.6 million in direct financial support for evacuated Hudbay employees and a C$500,000 donation to the Canadian Red Cross to support wildfire emergency relief and rebuilding efforts in northern Manitoba. The Company's Canadian Red Cross donation was part of a collective C$1.25 million donation that was made by the three leading mining companies that operate in Manitoba, including Hudbay, Vale Base Metals and Alamos Gold Inc. In addition, Hudbay established a Community Relief Donations Fund whereby Hudbay doubled the amounts donated by its employees to the Canadian Red Cross, further multiplying the support for emergency response efforts in the region.
Hudbay's Manitoba team continues to show remarkable resilience as demonstrated by the tremendous effort and unwavering commitment during this unprecedented wildfire season. They have tirelessly safeguarded the Company's assets and collaborated closely with local communities and provincial authorities, providing essential support to emergency response efforts.
On July 10, 2025, a second mandatory wildfire evacuation order was issued for the town of Snow Lake and a controlled, safe and orderly temporary suspension of the Snow Lake operations was implemented. As of August 12, 2025, the wildfire situation near Snow Lake has improved and Hudbay anticipates returning to normal operations later in August. The Company continues to expect to achieve its 2025 annual guidance metrics for all metals in Manitoba, despite the temporary wildfire impacts.
British Columbia Mill Optimization Project Achieves Key Milestone
In July, shortly following the end of the second quarter, Hudbay reached a significant milestone on the Copper Mountain mill optimization project to convert the third ball mill to a second SAG mill. The mill project is intended to increase nominal processing capacity to its permitted capacity of 50,000 tonnes per day starting in 2026.
The initial phase of the project achieved first ore production on July 10, a key milestone to ramp up mill capacity. The first phase was completed on time with more than 41,000 hours worked and zero lost-time incidents, which is a testament to the dedication and safety culture of Hudbay's team. The project remains on budget as it moves into the final phase of the project, which includes converting an interim feed arrangement to a permanent configuration and remains on track for completion in the second half of 2025.
New Ingerbelle Permit Application Achieves Key Milestone
On May 12, 2025, Hudbay's permitting application for the New Ingerbelle growth project at Copper Mountain was successfully accepted into review by the B.C. Major Mines Office and is now proceeding through a Mine Review Committee process. The Copper Mountain team continues ongoing engagement with First Nations and other local stakeholder groups as part of the Company's commitment to cultivating transparency and mutually beneficial relationships.
Exploration Update
Large Snow Lake Exploration Program Continues to Execute Threefold Strategy
Hudbay continues to execute the largest exploration program in Snow Lake in the Company's history through extensive geophysical surveying and multi-phased drilling campaigns as part of Hudbay's threefold exploration strategy:
• Near-mine exploration at Lalor and 1901 further increase near-term production and extend mine life - Following the positive initial step-out drilling from the exploration drift at the 1901 deposit earlier this year, Hudbay completed the development of the drift in the second quarter of 2025, and in June, the first zinc-rich ore from the 1901 mining area was delivered for processing at Stall. Activities at 1901 over the next two years will prioritize exploration, definition drilling, orebody access, and establishing critical infrastructure for full production in 2027. The additional exploration at 1901 planned for later in 2025 will target additional step-out drill holes to potentially extend the ore body and infill drilling to convert inferred mineral resources in the gold lenses to mineral reserves. The Company also expects to continue drilling down plunge of lenses 27 and 17 at Lalor once wildfire conditions improve.
• Testing regional satellite deposits to utilize available processing capacity and increase production - Hudbay increased its regional land package by more than 250% in 2023 through the acquisition of Rockcliff Metals Corp., which included the addition of several known deposits located within trucking distance of the Snow Lake processing infrastructure. The deposits acquired as part of the Rockcliff Metals Corp. acquisition, together with several deposits already owned by Hudbay in Snow Lake, have created an attractive portfolio of regional deposits in Snow Lake, including the Talbot, Rail, Pen II, Watts, 3 Zone and WIM deposits. The continued strong performance from the New Britannia mill has freed up processing capacity at the Stall mill, where there is approximately 1,500 tonnes per day of available capacity which could be utilized by the regional satellite deposits to increase production and extend the life of the Snow Lake operations beyond 2037. Hudbay commenced an extensive summer drill program at the Talbot deposit in July focused on expanding the known mineralization and testing geophysical targets.
• Exploring large land package for new anchor deposit to significantly extend mine life - A majority of the land claims acquired as part of the Rockcliff Metals Corp. acquisition have been untested by modern deep geophysics, which was the discovery method for the Lalor deposit. A large geophysics program is currently underway consisting of surface electromagnetic surveys using cutting edge techniques that enable the team to detect targets at depths of almost 1,000 metres below surface. The planned geophysics program in 2025 is the largest geophysics program in Hudbay's history and includes 800 kilometres of ground electromagnetic surveys and an extensive airborne geophysics survey. The summer geophysics program is currently paused due to the regional wildfires and is expected to resume once the conditions improve and the evacuation orders are lifted.
Maria Reyna and Caballito Drill Permits Update
Hudbay controls a large, contiguous block of mineral rights with the potential to host satellite mineral deposits in close proximity to the Constancia processing facility, including the past producing Caballito property and the highly prospective Maria Reyna property. The Company commenced the drill permitting process at Maria Reyna and Caballito after completing a surface rights exploration agreement with the community of Uchucarcco in August 2022. As part of the drill permitting process, environmental impact assessment (EIA) applications were approved by the government in June 2024 for Maria Reyna and September 2024 for Caballito. The remaining steps in the drill permitting process include the completion by the government of the Consulta Previa consultation process with the local community.
Senior Management Team Appointments
In May 2025, Hudbay promoted Robert Carter to Senior Vice President, Canada and John O'Shaughnessy to Vice President, Manitoba Business Unit.
In his new role, Mr. Carter is responsible for the strategic oversight of Hudbay's business activities in Manitoba and British Columbia. Mr. Carter previously held the role of Vice President, Manitoba Business Unit since April 2022 and prior to that was the General Manager of Hudbay's Manitoba mines since 2018. He has over 25 years of mining industry experience in technical, operational and senior leadership roles, with a majority of those years at Hudbay.
As the new leader of the Manitoba Business Unit, Mr. O'Shaughnessy is responsible for the strategic and operational performance of Hudbay's activities in Manitoba. He previously held the role of Vice President, Business Development at Hudbay where he provided expert oversight and strategic leadership of the global mine planning process. He has over 25 years of mining industry experience, including numerous progressive engineering, operational and leadership roles at Vale's mining operations in Ontario and Newfoundland and Labrador.
Dividend Declared
A semi-annual dividend of C$0.01 per share was declared on August 12, 2025. The dividend will be paid out on September 19, 2025 to shareholders of record as of close of business on September 2, 2025.
1 Adjusted EBITDA, net debt, net debt to adjusted EBITDA ratio and free cash flow are non-GAAP financial performance measures with no standardized definition under IFRS. For further information and a detailed reconciliation, please see the discussion under the "Non-GAAP Financial Performance Measures" section of this MD&A.
2 Based on the initial capital investment and the $3.75 per pound copper price used in the PFS published on September 8, 2023 with assumptions of approximately $145 million for pre-sanctioning costs, $230 million from the precious metals stream, $350 million from project-level financing and approximately $700 million from the joint venture partner earn-in, matching contribution and capital contribution.
PERU OPERATIONS REVIEW
| Three months ended | Six months ended | |||||
| Jun. 30, 2025 | Mar. 31, 2025 | Jun. 30, 2024 | Jun. 30, 2025 | Jun. 30, 2024 | ||
| Constancia ore mined1 | tonnes | 6,735,316 | 8,628,279 | 5,277,654 | 15,363,595 | 7,837,201 |
| Copper | % | 0.34 | 0.28 | 0.29 | 0.31 | 0.30 |
| Gold | g/tonne | 0.03 | 0.03 | 0.03 | 0.03 | 0.03 |
| Silver | g/tonne | 3.26 | 3.14 | 2.50 | 3.19 | 2.60 |
| Molybdenum | % | 0.02 | 0.02 | 0.01 | 0.02 | 0.01 |
| Pampacancha ore mined1 | tonnes | 762,172 | 389,189 | 1,288,789 | 1,151,361 | 3,503,143 |
| Copper | % | 0.26 | 0.44 | 0.41 | 0.32 | 0.51 |
| Gold | g/tonne | 0.24 | 0.26 | 0.20 | 0.25 | 0.28 |
| Silver | g/tonne | 4.59 | 3.68 | 3.83 | 4.28 | 4.34 |
| Molybdenum | % | 0.01 | 0.01 | 0.02 | 0.01 | 0.02 |
| Total ore mined | tonnes | 7,497,488 | 9,017,468 | 6,566,443 | 16,514,956 | 11,340,344 |
| Strip ratio2 | 1.47 | 1.02 | 1.74 | 1.22 | 1.83 | |
| Ore milled | tonnes | 7,559,047 | 8,114,024 | 7,718,962 | 15,673,071 | 15,796,923 |
| Copper | % | 0.34 | 0.30 | 0.30 | 0.32 | 0.33 |
| Gold | g/tonne | 0.05 | 0.05 | 0.07 | 0.05 | 0.11 |
| Silver | g/tonne | 3.58 | 3.22 | 2.85 | 3.39 | 3.17 |
| Molybdenum | % | 0.01 | 0.01 | 0.01 | 0.01 | 0.01 |
| Copper concentrate | tonnes | 94,813 | 92,171 | 89,629 | 186,984 | 203,728 |
| Concentrate grade | % Cu | 22.90 | 22.02 | 21.44 | 22.46 | 21.50 |
| Copper recovery | % | 84.5 | 84.6 | 83.1 | 84.6 | 84.1 |
| Gold recovery | % | 56.0 | 56.5 | 61.4 | 56.2 | 69.7 |
| Silver recovery | % | 63.5 | 66.0 | 63.9 | 64.7 | 67.7 |
| Molybdenum recovery | % | 38.7 | 35.7 | 46.3 | 37.1 | 44.6 |
| Combined unit operating costs3,4 | $/tonne | 13.59 | 11.09 | 12.68 | 12.29 | 11.78 |
| 1 Reported tonnes and grade for ore mined are estimates based on mine plan assumptions and may not reconcile fully to ore milled. | ||||||
| 2 Strip ratio is calculated as waste mined divided by ore mined. | ||||||
| 3 Reflects combined mine, mill and general and administrative ("G&A") costs per tonne of ore milled. Reflects the deduction of expected capitalized stripping costs. | ||||||
| 4 Combined unit costs is a non-GAAP financial performance measure with no standardized definition under IFRS. For further information and a detailed reconciliation, please see the discussion under the "Non-GAAP Financial Performance Measures" section of this MD&A. | ||||||
| Three months ended | Six months ended | |||||
| Jun. 30, 2025 | Mar. 31, 2025 | Jun. 30, 2024 | Jun. 30, 2025 | Jun. 30, 2024 | ||
| Contained metal in concentrate produced | ||||||
| Copper | tonnes | 21,710 | 20,293 | 19,217 | 42,003 | 43,793 |
| Gold | oz | 7,366 | 7,869 | 10,672 | 15,235 | 39,816 |
| Silver | oz | 551,979 | 554,692 | 450,833 | 1,106,671 | 1,090,551 |
| Molybdenum | tonnes | 375 | 397 | 369 | 772 | 766 |
| Payable metal sold | ||||||
| Copper | tonnes | 21,418 | 22,890 | 16,806 | 44,308 | 40,560 |
| Gold | oz | 9,721 | 14,362 | 13,433 | 24,083 | 56,110 |
| Silver | oz | 616,578 | 714,654 | 400,302 | 1,331,233 | 1,154,009 |
| Molybdenum | tonnes | 427 | 448 | 347 | 875 | 762 |
| Cost per pound of copper produced | ||||||
| Cash cost1 | $/lb | 1.45 | 1.11 | 1.78 | 1.29 | 1.02 |
| Sustaining cash cost1 | $/lb | 2.63 | 1.92 | 2.60 | 2.29 | 1.71 |
| 1 Cash cost and sustaining cash costs per pound of copper produced, net of by-product credits, are not recognized under IFRS. For more detail on these non-GAAP financial performance measures, please see the discussion under the "Non-GAAP Financial Performance Measures" section of this MD&A. | ||||||
Overview
The Peru operations continued to demonstrate steady operating performance with production and costs in line with expectations. Copper production increased in the second quarter of 2025 compared to the same period in 2024 due to higher copper grade in ore mined from Constancia and higher copper recoveries. Copper production was also higher than the first quarter of 2025 as milled copper grades exceeded first quarter levels, partially offset by planned lower mill throughput due to a scheduled mill maintenance shutdown in the second quarter.
The last major stripping program at Pampacancha was completed in the second quarter of 2025, which included higher amounts of waste stripping than planned. As a result, the Company replaced higher grade Pampacancha ore with higher grade Constancia ore in the second quarter and the Pampacancha deposit is now expected to be depleted in the first quarter of 2026 rather than in late 2025. Protests that started early in the third quarter temporarily impacted the transportation of supplies and concentrate to and from the Constancia site and has affected mine sequencing. The Constancia mill has continued to operate during this period, and the road blockades along the concentrate transportation route have since reopened, allowing Hudbay to reduce site concentrate inventory levels and replenish supplies. Despite short-term mine plan changes the Company remains on track to achieve its 2025 production guidance for all metals in Peru.
Mining Activities
Total ore mined in Peru in the second quarter of 2025 increased by 14% compared to the same period in 2024, in line with mine plan expectations.
Year-to-date ore mined in Peru was 46% higher than the same period in 2024 but in line with mine plan expectations.
Milling Activities
Mill throughput levels averaged approximately 83,100 tonnes per day in the second quarter of 2025, lower than the first quarter of 2025 due to the planned semi-annual mill maintenance shutdown during the current quarter, but fairly in line with the same period in 2024. Milled copper grades increased by 13% compared to the comparative periods, primarily due to higher grades in the Constancia pit. Milled gold grades in the second quarter of 2025 were lower than the same period in 2024 due to lower ore feed from Pampacancha, but remained consistent with gold grades in the first quarter of 2025 as Pampacancha stripping activities were underway in both quarters. The mill achieved higher copper recoveries of 85% in the second quarter of 2025 compared to the same period in 2024 and remained consistent with the first quarter of 2025. Recoveries of gold and silver during the second quarter of 2025 were in line with Hudbay's metallurgical models for the ore that was being processed.
Ore milled during the first half of 2025 was relatively unchanged from the comparative 2024 period. Milled copper grades in the first half of 2025 were consistent with the same period in 2024, while milled gold grades decreased by 55% as a result of less ore feed from Pampacancha. Recoveries of copper during the first half of 2025 were 85%, representing an increase of 1%, compared with the 2024 period, despite being impacted by supplemental ore feed from stockpiles during pit stripping activities early in the year. Gold and silver recoveries during the first half of 2025 were 56% and 65%, respectively, representing a decrease of 19% and 4%, respectively, but were in line with Hudbay's metallurgical models.
Production and Sales Performance
The Peru operations produced 21,710 tonnes of copper, 7,366 ounces of gold, 551,979 ounces of silver and 375 tonnes of molybdenum during the second quarter of 2025, in line with mine plan quarterly cadence expectations. Production of copper was higher than the comparative periods primarily due to higher grades from the Constancia pit. Production of all other metals were relatively in line with the first quarter of 2025 and higher than the same period in 2024, with the exception of gold production which was lower than the same period in 2024 due to a lower portion of Pampacancha ore feed.
Year-to-date production of copper and gold in 2025 was 42,003 tonnes and 15,235 ounces, respectively, representing a decrease of 4% and 62%, respectively, from the comparative 2024 period primarily due to lower grades since more material was mined from Constancia and reclaimed from the stockpile during 2025 compared with the prior year.
Quantities of metal sold during the three and six months ended 2025 were in line with the variances in production previously outlined.
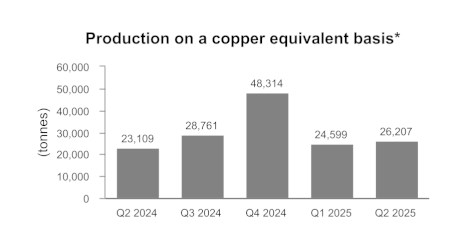
*Copper equivalent production is calculated using the quarter average LME prices for each metal excluding molybdenum.
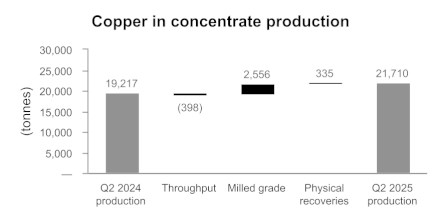
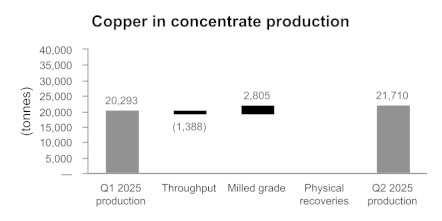
Cost Performance
Combined mine, mill and G&A unit operating cost in the second quarter of 2025 was $13.59 per tonne, 7% higher than the same period in 2024 primarily due to higher plant maintenance costs associated with the planned semi-annual mill maintenance shutdown, partially offset by the impacts of higher stripping. Combined unit operating cost was 23% higher than the first quarter of 2025, as expected, due to higher plant maintenance costs and lower tonnes processed associated with the planned semi-annual mill maintenance shutdown. Combined mine, mill and G&A unit operating costs for the six months ended June 30, 2025 was $12.29 per tonne, a 4% increase compared to the same period in 2024 due to higher plant maintenance costs as mentioned above.
Cash cost per pound of copper produced, net of by-product credits, in the second quarter of 2025 was $1.45, a 19% decrease compared to the same period in 2024 as a result of lower treatment and refining charges and higher copper production. Cash cost per pound of copper produced, net of by-product credits, increased by 31% compared to the first quarter of 2025 due to planned higher maintenance costs and lower by-product credits, partially offset by lower treatment and refining charges and higher copper production.
Year-to-date 2025 cash cost per pound of copper produced, net of by-product credits2 was $1.29, an increase from $1.02 in the same period of 2024 due to lower gold by-product credits, partially offset by lower treatment and refining charges.
Sustaining cash cost per pound of copper produced, net of by-product credits2, was $2.63 in the second quarter of 2025, an increase of 1% compared to the same period in 2024 due to higher plant and mine maintenance costs, higher community payments and finance leases, partially offset by the factors described above for the cash cost variance. Sustaining cash cost per pound of copper produced, net of by-product credits, increased by 37% compared to the first quarter of 2025 due to planned higher sustaining capital typically associated with the period after the rainy season is complete, as well as the same factors affecting cash costs. On a year-to-date basis, sustaining cash cost per pound of copper produced, net of by-products credits2, was $2.29, higher than the $1.71 for the comparable period in 2024 due to higher plant and mine maintenance costs, finance lease payments and community payments.
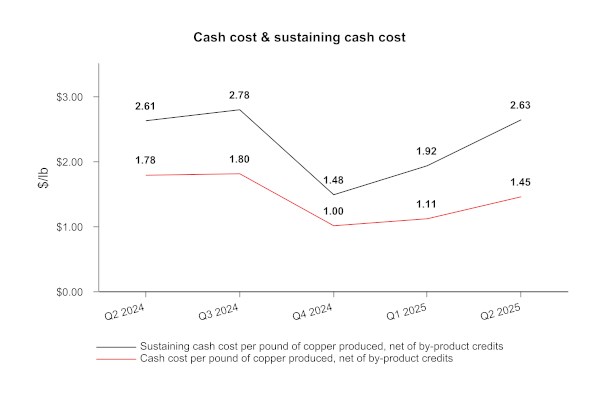
Peru Guidance Outlook
| Three months ended | Six months ended | Guidance | ||||
| Jun. 30, 2025 | Jun. 30, 2024 | Jun. 30, 2025 | Jun. 30, 2024 | Annual 2025 | ||
| Contained metal in concentrate produced | ||||||
| Copper | tonnes | 21,710 | 19,217 | 42,003 | 43,793 | 80,000 - 97,000 |
| Gold | oz | 7,366 | 10,672 | 15,235 | 39,816 | 49,000 - 60,000 |
| Silver | oz | 551,979 | 450,833 | 1,106,671 | 1,090,551 | 2,475,000 - 3,025,000 |
| Molybdenum | tonnes | 375 | 369 | 772 | 766 | 1,300 - 1,500 |
| Cost per pound of copper produced | ||||||
| Cash cost1 | $/lb | 1.45 | 1.78 | 1.29 | 1.02 | 1.35 - 1.65 |
| 1 Cash cost per pound of copper produced, net of by-product credits, are not recognized under IFRS. For more detail on these non-GAAP financial performance measures, please see the discussion under the "Non-GAAP Financial Performance Measures" section of this MD&A. | ||||||
Despite short-term mine plan changes Hudbay is on track to achieve its 2025 production guidance for all metals in Peru. With cash costs in the first half of the year outperforming the low end of the cash cost guidance range. Hudbay is reaffirming its full year 2025 cash cost guidance range in Peru.
MANITOBA OPERATIONS REVIEW
| Three months ended | Six months ended | |||||
| Jun. 30, 2025 | Mar. 31, 2025 | Jun. 30, 2024 | Jun. 30, 2025 | Jun. 30, 2024 | ||
| Lalor ore mined | tonnes | 303,062 | 384,234 | 385,478 | 687,296 | 793,186 |
| Gold | g/tonne | 4.97 | 5.46 | 3.75 | 5.25 | 4.31 |
| Copper | % | 0.61 | 0.95 | 0.69 | 0.80 | 0.77 |
| Zinc | % | 2.46 | 2.42 | 2.76 | 2.44 | 2.84 |
| Silver | g/tonne | 29.94 | 31.23 | 22.29 | 30.67 | 22.88 |
| New Britannia ore milled | tonnes | 162,934 | 189,124 | 167,899 | 352,058 | 338,308 |
| Gold | g/tonne | 6.48 | 7.37 | 5.31 | 6.96 | 6.18 |
| Copper | % | 0.65 | 1.18 | 0.94 | 0.94 | 1.04 |
| Zinc | % | 1.01 | 1.00 | 0.92 | 1.01 | 0.87 |
| Silver | g/tonne | 30.29 | 33.35 | 24.42 | 31.93 | 23.00 |
| Copper concentrate | tonnes | 6,278 | 14,396 | 9,350 | 20,674 | 20,997 |
| Concentrate grade | % Cu | 14.73 | 14.02 | 15.96 | 14.24 | 15.97 |
| Gold recovery1 | % | 89.4 | 90.3 | 90.0 | 89.9 | 89.2 |
| Copper recovery | % | 87.4 | 90.3 | 94.4 | 89.3 | 95.4 |
| Silver recovery1 | % | 78.0 | 81.6 | 83.1 | 80.0 | 82.6 |
| Contained metal in concentrate produced | ||||||
| Gold | oz | 17,801 | 26,486 | 18,050 | 44,287 | 43,645 |
| Copper | tonnes | 926 | 2,019 | 1,492 | 2,945 | 3,353 |
| Silver | oz | 80,516 | 120,237 | 85,759 | 200,753 | 162,975 |
| Metal in doré produced2 | ||||||
| Gold | oz | 15,379 | 15,111 | 10,843 | 30,490 | 27,338 |
| Silver | oz | 46,311 | 45,312 | 37,675 | 91,623 | 76,733 |
| Stall ore milled | tonnes | 144,204 | 215,286 | 229,527 | 359,490 | 448,885 |
| Gold | g/tonne | 3.19 | 3.86 | 3.02 | 3.60 | 3.05 |
| Copper | % | 0.56 | 0.76 | 0.59 | 0.68 | 0.61 |
| Zinc | % | 4.20 | 3.44 | 4.05 | 3.74 | 4.29 |
| Silver | g/tonne | 29.55 | 29.53 | 21.74 | 29.54 | 23.07 |
| Copper concentrate | tonnes | 3,854 | 6,708 | 6,202 | 10,562 | 13,369 |
| Concentrate grade | % Cu | 17.79 | 21.62 | 18.54 | 20.22 | 18.23 |
| Zinc concentrate | tonnes | 9,739 | 12,584 | 15,280 | 22,323 | 33,118 |
| Concentrate grade | % Zn | 52.68 | 49.78 | 52.92 | 51.05 | 50.98 |
| Gold recovery | % | 67.9 | 70.1 | 65.5 | 69.3 | 66.7 |
| Copper recovery | % | 84.7 | 88.3 | 85.4 | 87.1 | 88.6 |
| Zinc recovery | % | 84.8 | 84.7 | 87.1 | 84.7 | 87.7 |
| Silver recovery | % | 51.9 | 58.7 | 54.2 | 56.0 | 57.1 |
| Contained metal in concentrate produced | ||||||
| Gold | oz | 10,055 | 18,758 | 14,595 | 28,812 | 29,336 |
| Copper | tonnes | 686 | 1,450 | 1,150 | 2,136 | 2,438 |
| Zinc | tonnes | 5,130 | 6,265 | 8,087 | 11,395 | 16,885 |
| Silver | oz | 71,143 | 120,054 | 87,213 | 191,197 | 190,762 |
| 1 Gold and silver recovery includes total recovery from concentrate and doré. | ||||||
| 2 Doré includes sludge, slag and carbon fines. | ||||||
| Three months ended | Six months ended | |||||
| Jun. 30, 2025 | Mar. 31, 2025 | Jun. 30, 2024 | Jun. 30, 2025 | Jun. 30, 2024 | ||
| Total contained metal in concentrate and doré produced1 | ||||||
| Gold | oz | 43,235 | 60,354 | 43,488 | 103,589 | 100,319 |
| Copper | tonnes | 1,612 | 3,469 | 2,642 | 5,081 | 5,791 |
| Zinc | tonnes | 5,130 | 6,265 | 8,087 | 11,395 | 16,885 |
| Silver | oz | 197,970 | 285,603 | 210,647 | 483,573 | 430,470 |
| Payable metal sold in concentrate and doré | ||||||
| Gold | oz | 46,932 | 55,765 | 42,763 | 102,697 | 104,766 |
| Copper | tonnes | 2,133 | 2,725 | 2,429 | 4,858 | 5,350 |
| Zinc | tonnes | 2,871 | 4,857 | 5,133 | 7,728 | 11,252 |
| Silver | oz | 209,594 | 232,255 | 197,486 | 441,848 | 429,327 |
| Unit Operating Costs2 | ||||||
| Lalor | C$/tonne | 153.08 | 143.19 | 150.06 | 147.55 | 148.36 |
| New Britannia | C$/tonne | 67.98 | 68.12 | 71.49 | 68.05 | 74.78 |
| Stall | C$/tonne | 51.53 | 35.97 | 38.45 | 42.21 | 39.54 |
| Combined unit operating costs3,4,5 | C$/tonne | 241 | 214 | 225 | 225 | 230 |
| Cost per ounce of gold produced | ||||||
| Cash cost5,6 | $/oz | 710 | 376 | 771 | 515 | 751 |
| Sustaining cash cost5 | $/oz | 1,025 | 626 | 1,163 | 793 | 1,042 |
| 1 Metal reported in concentrate is prior to deductions associated with smelter terms. | ||||||
| 2 Reflects costs per tonne of ore mined/milled. | ||||||
| 3 Reflects combined mine, mill and G&A costs per tonne of milled ore. | ||||||
| 4 Excludes $3.2 million or C$14 per tonne of overhead costs incurred during temporary suspension during the three months ended June 30, 2025 and $3.2 million or C$6 per tonne during the six month ended June 30, 2025. | ||||||
| 5 Combined unit costs, cash cost and sustaining cash cost per ounce of gold produced, net of by-product credits, are non-GAAP financial performance measures with no standardized definition under IFRS. For further information and a detailed reconciliation, please see the discussion under the "Non-GAAP Financial Performance Measures" section of this MD&A. | ||||||
| 6 Excludes $3.2 million or $74 per ounce of overhead costs incurred during temporary suspension during the three months ended June 30, 2025 and $3.2 million or $31 per ounce during the six month ended June 30, 2025. |
Overview
Despite significant disruptions from the mandatory wildfire evacuation orders in May and June of this year, the Manitoba operations showed remarkable resilience and achieved several key milestones in the second quarter of 2025. Notably, the New Britannia mill achieved record monthly production in April, the 1901 mining area delivered its first ore for processing in June, and Hudbay signed an exploration agreement with Mosakahiken Cree Nation to explore the Talbot deposit.
Hudbay's dedicated operations team demonstrated tremendous effort and unwavering commitment during the unprecedented wildfire situation near the Company's Flin Flon and Snow Lake operations during the second quarter. The team tirelessly safeguarded Hudbay's assets and collaborated closely with local communities and provincial authorities, providing essential support to emergency response efforts. These efforts resulted in no damage to Hudbay's infrastructure and facilities.
The Lalor mine managed through a period of reduced workforce prior to and after the 13-day temporary suspension of operations in June due to regional mandatory wildfire evacuation orders. Despite these challenges, the mine averaged 3,300 tonnes per day in the second quarter, strategically prioritizing mining from gold zones to ensure a consistent feed for the New Britannia mill.
Continuous improvement efforts at Lalor focused on ore quality and advancing stope modifications to enhance mucking productivity. Capital development continued, aiming to secure high-grade copper-gold mineralization from Zone 27 and prepare Zone 17 for the next copper-gold mining front.
The New Britannia mill achieved record monthly production levels in April, exceeding 2,300 tonnes per day. This significant milestone is a testament to ongoing low-capital projects and recent piping improvements that boosted throughput and maintained gold recoveries.
Exploration and haulage drifts advanced towards the 1901 deposit, where initial zinc-rich massive sulphides were mined and processed in June. The next two years at 1901 will prioritize exploration, definition drilling, orebody access, and establishing critical infrastructure for full production in 2027.
Mining Activities
Total ore mined in Manitoba in the second quarter of 2025 was lower than the comparable periods, reflecting the impacts from the wildfires. Gold grades were better than expected in the second quarter of 2025, resulting in a 33% increase from the second quarter of 2024, despite being lower than the exceptional gold grade mined in the first quarter of 2025. Copper, zinc and silver grades were in line with mine plan expectations. The second quarter of 2025 saw significant improvements in ore quality, aligned with improvements in mining techniques, most notably in longhole muck fragmentation, and anticipated higher grade precious metal sequences.
Total ore mined at Hudbay's Manitoba operations during the first half of 2025 was 13% lower than the same period in 2024, as a result of the same quarterly factors noted above. Gold, copper, and silver grades mined at Lalor during the first half of 2025 were 22%, 4%, and 34% higher, respectively, compared with the same period in 2024. Zinc grades mined during the first half of 2025 were 14% lower than the same period in 2024.
Milling Activities
Consistent with Hudbay's strategy of allocating more Lalor ore feed to New Britannia to maximize gold recoveries, the New Britannia mill throughput averaged approximately 1,800 tonnes per day in the second quarter of 2025, reflecting record levels of more than 2,300 tonnes per day achieved in April, offset by lower throughput levels in June associated with the wildfire evacuation shutdown. Gold recovery in the second quarter of 2025 was 89% remaining relatively consistent with the same period in 2024 and the first quarter of 2025.
In the second quarter, the Stall mill continued to process less ore compared to prior periods, which is aligned with Hudbay's strategy of allocating more Lalor ore feed to New Britannia, as noted above. The Stall mill achieved gold recoveries of 68% in the second quarter of 2025, reflecting benefits from recent recovery improvement programs.
Production and Sales Performance
The Manitoba operations delivered strong results in the second quarter of 2025, producing 43,235 ounces of gold, 1,612 tonnes of copper, 5,130 tonnes of zinc and 197,970 ounces of silver. Compared to the second quarter of 2024, production of gold was relatively unchanged despite lower production in June associated with the wildfire evacuation shutdown as higher grades offset lower throughput. Production of copper, silver, and zinc decreased by 39%, 6% and 37%, respectively, compared to the second quarter of 2024, primarily due to prioritizing the mining of gold grade areas during the wildfire evacuation shutdown in June to maximize gold ore feed to the New Britannia mill. Compared to the first quarter of 2025, production of gold, copper, silver and zinc in the second quarter of 2025 decreased by 28%, 54%, 31% and 18%, respectively, for the same reason mentioned above, in addition to the first quarter of 2025 having significantly better than expected gold grades.
Year-to-date production of gold and silver in 2025 was higher by 3% and 12%, respectively, than the comparative 2024 period as a result of higher grades and higher New Britannia mill throughput despite throughput limitations in June. Copper and zinc production in the first half of 2025 decreased by 12% and 33%, respectively, aligned with forecasted production and the strategy to mine more gold ore at Lalor, resulting in less mill throughput at Stall as mentioned above.
Quantities of copper, gold and silver sold during the second quarter of 2025 were higher than production levels as unsold copper inventory at the end of March was sold during the second quarter. Zinc metal sold during the second quarter of 2025 was impacted by higher zinc concentrate inventory at the end of June which is expected to be sold during the third quarter of 2025. During the six months ended June 30, 2025, quantities sold for all metals were relatively in line with variances in production, with the exception of zinc sales which were impacted by higher zinc concentrate inventory levels at the end of June 2025.
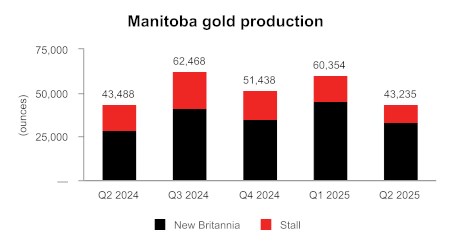
Cost Performance
The Manitoba operations continued to drive operating efficiencies despite temporary disruptions from wildfire evacuations orders in June.
Combined mine, mill and G&A unit operating costs in the second quarter were C$241 per tonne, higher than the comparative periods primarily due to lower total throughput in June, partially offset by continued strong cost performance at New Britannia. Mining costs per tonne of ore milled during the second quarter of 2025 were relatively unchanged from the same period in 2024, as lower costs from efficiency improvement initiatives at Lalor over the past year have offset lower tonnes mined in June, while mining costs per tonne of ore milled were higher than in the first quarter of 2025 as a result of the wildfires in June. Milling costs per tonne of ore milled were higher than the comparative periods as a result of higher unit costs at Stall associated with lower throughput as mentioned above, offset by strong unit cost performance at New Britannia as a result of higher daily throughput levels.
Cash cost per ounce of gold produced, net of by-product credits, in the second quarter of 2025 was $710, an 8% decrease compared to the same period in 2024. This improvement in performance is mostly the result of lower mining and milling costs from robust cost improvement measures undertaken and significantly lower treatment and refining charges. Compared to the first quarter of 2025, cash costs increased primarily due to lower gold production and lower by-product credits as per the production variances discussed above.
Sustaining cash cost per ounce of gold produced, net of by-product credits, in the second quarter of 2025 was $1,025, a 12% decrease compared to the same period in 2024 and a 64% increase compared to the first quarter of 2025, primarily due to the same factors affecting cash cost, partially offset by lower sustaining capital costs during the quarter.
Cash cost per ounce of gold produced, net of by-product credits, during the six months ended June 30, 2025 was $515. These costs were 31% lower compared to the same period in 2024 primarily due to higher gold production and lower mining and milling costs, together with lower treatment and refining charges, partially offset by higher G&A costs resulting from higher employee profit sharing costs. Sustaining cash cost per ounce of gold produced, net of by-product credits, for the six months ended June 30, 2025 was $793 per ounce, a decrease of 24% from the same period in 2024 primarily due to the same factors affecting cash cost noted above, together with slightly lower sustaining capital expenditures compared to the prior year.
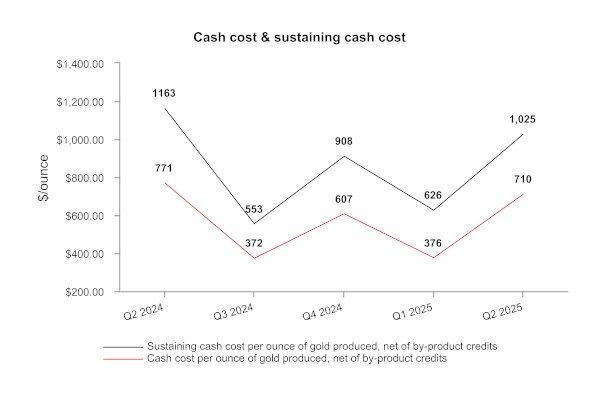
Manitoba Guidance Outlook
| Three months ended | Six months ended | Guidance | ||||
| Jun. 30, 2025 |
Jun. 30, 2024 |
Jun. 30, 2025 |
Jun. 30, 2024 |
Annual 2025 | ||
| Total contained metal in concentrate and doré produced1 | ||||||
| Gold2 | oz | 43,235 | 43,488 | 103,589 | 100,319 | 180,000 - 220,000 |
| Copper | tonnes | 1,612 | 2,642 | 5,081 | 5,791 | 9,000 - 11,000 |
| Zinc | tonnes | 5,130 | 8,087 | 11,395 | 16,885 | 21,000 - 27,000 |
| Silver3 | oz | 197,970 | 210,647 | 483,573 | 430,470 | 800,000 - 1,000,000 |
| Cost per ounce of gold produced | ||||||
| Cash cost4,5 | $/oz | 710 | 771 | 515 | 751 | 650 - 850 |
| 1 Metal reported in concentrate is prior to deductions associated with smelter terms. | |||||
| 2 Gold production guidance includes gold contained in concentrate produced and gold in doré. | |||||
| 3 Silver production guidance includes silver contained in concentrate produced and silver in doré. | |||||
| 4 Combined unit costs, cash cost per ounce of gold produced, net of by-product credits, are non-GAAP financial performance measures with no standardized definition under IFRS. For further information and a detailed reconciliation, please see the discussion under the "Non-GAAP Financial Performance Measures" section of this MD&A. | |||||
| 5 Excludes $3.2 million or $74 per ounce of overhead costs incurred during temporary suspension during the three months ended June 30, 2025 and $3.2 million or $31 per ounce during the six month ended June 30, 2025. |
On July 10, 2025, a second mandatory wildfire evacuation order was issued for the town of Snow Lake and a controlled, safe and orderly temporary suspension of the Snow Lake operations was implemented. Essential personnel, authorized by emergency services, have remained onsite when safe to do so in order to continue supporting fire mitigation activities and safeguarding Hudbay's assets. To-date, there has been no structural damage to Hudbay's onsite surface infrastructure and facilities. As of August 12, 2025, the wildfire situation near Snow Lake has improved and Hudbay anticipates returning to normal operations later in August. The Company continues to expect to achieve its 2025 annual guidance metrics for all metals in Manitoba, despite the impact from the wildfires. Similarly, with cash costs in the first half of the year outperforming the low end of the cash cost guidance range, Hudbay is well positioned to achieve the 2025 cash cost guidance range in Manitoba.
BRITISH COLUMBIA OPERATIONS REVIEW
| Three months ended5 | Six months ended5 | |||||
| Jun. 30, 2025 | Mar. 31, 2025 | Jun. 30, 2024 | Jun. 30, 2025 | Jun. 30, 2024 | ||
| Ore mined1 | tonnes | 2,509,969 | 2,648,094 | 2,164,722 | 5,158,063 | 5,887,218 |
| Strip ratio2 | 7.50 | 6.73 | 7.61 | 7.11 | 5.39 | |
| Ore milled | tonnes | 2,900,008 | 2,760,986 | 3,232,427 | 5,660,994 | 6,412,576 |
| Copper | % | 0.28 | 0.33 | 0.25 | 0.31 | 0.26 |
| Gold | g/tonne | 0.09 | 0.10 | 0.07 | 0.09 | 0.07 |
| Silver | g/tonne | 0.97 | 1.28 | 1.01 | 1.12 | 1.10 |
| Copper concentrate | tonnes | 28,198 | 31,234 | 29,275 | 59,432 | 59,925 |
| Concentrate grade | % Cu | 23.5 | 23.0 | 23.0 | 23.3 | 22.9 |
| Copper recovery | % | 81.0 | 78.3 | 82.3 | 79.5 | 82.8 |
| Gold recovery | % | 68.2 | 63.4 | 57.2 | 65.7 | 59.0 |
| Silver recovery | % | 71.8 | 69.8 | 73.9 | 70.7 | 73.1 |
| Combined unit operating costs3,4 | C$/tonne | 24.51 | 25.98 | 19.65 | 25.12 | 21.65 |
| 1 Reported tonnes and grade for ore mined are estimates based on mine plan assumptions and may not reconcile fully to ore milled. | ||||||
| 2 Strip ratio is calculated as waste mined divided by ore mined. | ||||||
| 3 Reflects combined mine, mill and general and administrative ("G&A") costs per tonne of ore milled. Reflects the deduction of expected capitalized stripping costs. | ||||||
| 4 Combined unit costs is a non-GAAP financial performance measure with no standardized definition under IFRS. For further information and a detailed reconciliation, please see the discussion under the "Non-GAAP Financial Performance Measures" section of this MD&A. | ||||||
| 5 Copper Mountain mine results are stated at 100%. On April 30, 2025 Hudbay completed the acquisition of the remaining 25% interest in the Copper Mountain mine and now owns 100%. |
| Three months ended2 | Six months ended2 | |||||
| Jun. 30, 2025 | Mar. 31, 2025 | Jun. 30, 2024 | Jun. 30, 2025 | Jun. 30, 2024 | ||
| Contained metal in concentrate produced | ||||||
| Copper | tonnes | 6,634 | 7,196 | 6,719 | 13,830 | 13,743 |
| Gold | oz | 5,670 | 5,561 | 4,454 | 11,231 | 8,871 |
| Silver | oz | 65,040 | 79,480 | 77,227 | 144,520 | 165,603 |
| Payable metal sold | ||||||
| Copper | tonnes | 6,803 | 6,153 | 6,564 | 12,956 | 13,497 |
| Gold | oz | 5,813 | 4,965 | 5,099 | 10,778 | 8,500 |
| Silver | oz | 67,988 | 60,059 | 69,248 | 128,047 | 152,548 |
| Cost per pound of copper produced | ||||||
| Cash cost1 | $/lb | 2.39 | 2.44 | 2.67 | 2.41 | 3.09 |
| Sustaining cash cost1 | $/lb | 5.18 | 4.24 | 5.56 | 4.69 | 5.20 |
| 1 Cash cost and sustaining cash cost, net of by-product credits, are non-GAAP financial performance measures with no standardized definition under IFRS. For further information and a detailed reconciliation, please see the discussion under the "Non-GAAP Financial Performance Measures" section of this MD&A. | ||||||
| 2 Copper Mountain mine results are stated at 100%. On April 30, 2025 Hudbay completed the acquisition of the remaining 25% interest in the Copper Mountain mine and now owns 100%. |
Overview
Hudbay continues its focus on advancing optimization plans at the Copper Mountain mine, including ramping up mining activities to optimize the mine ore feed to the plant and implementing site improvement initiatives that mirror Hudbay's successful processes at Constancia. These optimization initiatives have successfully increased the total tonnes moved and improved mill reliability.
Mining activities are focused on continuing to execute the three-year accelerated stripping program intended to bring higher grade ore into the mine plan. During the first half of 2025, Hudbay made significant progress on the key mill improvement project to ultimately increase the nominal plant capacity to its permitted level of 50,000 tonnes per day. The project entails the conversion of the third ball mill to a second SAG mill, and the initial phase of this project was successfully completed shortly following the end of the second quarter on time and on budget with the achievement of first ore production on July 10. The final phase of the project involves converting an interim feed arrangement to a permanent configuration and remains on target for completion in the second half of 2025.
Mining Activities
Total ore mined at Copper Mountain in the second quarter of 2025 was 2.5 million tonnes, an increase of 16% compared to the second quarter of 2024, as the mine continues to execute operational improvement initiatives. Planned ore stockpiles were utilized as ore feed to the mill while the mine operation team continued to increase waste stripping activities to expose additional ore mining fronts. Total ore mined decreased by 5% compared to the first quarter of 2025 due to unplanned production loading fleet activities, despite an increase in total material moved in the quarter as a result of effective usage of the mining fleet to execute the accelerated stripping program to access higher grade phases in the pit. The continued focus in the second quarter of 2025 was on mining efficiencies, including a significant improvement with blasted muck inventories and operator recruitment to effectively utilize the available haul truck fleet. As a result, total material moved is expected to increase quarter-over-quarter in 2025 as per the mine plan.
Total ore mined at Copper Mountain during the six months ended June 30, 2025 was 12% lower than the same period in 2024, for the same reason mentioned above.
Milling Activities
The mill processed 2.9 million tonnes of ore during the second quarter of 2025, lower than the second quarter of 2024 but higher than the first quarter of 2025. Mill throughput in the second quarter of 2025 was limited by both planned and unplanned maintenance, elevated clay material which impacted the secondary crushing circuit, and the planned lowering of the main crushed live ore pile feeding the mill due to area constraints related to the completion of the ball mill to SAG conversion project. Several mill initiatives were implemented in 2025, including recovery improvements, crushing circuit chute modifications, installation of advanced semi-autogenous grinding control instrumentation, and redesigned SAG liner package. Progressive mill improvements and updated operational procedures are expected to continue through 2025.
Milled copper grades during the second quarter of 2025 were 12% higher than the second quarter of 2024 as the accelerated stripping efforts continue to unlock higher grades. Milled copper grades in the second quarter were lower than the first quarter due to higher amounts of ore processed from stockpile in the second quarter, as mentioned above, as well as the mining of a high-grade mining sequence during the first quarter of 2025. Copper recoveries were 81% in the second quarter of 2025, an increase from 78% in the first quarter of 2025 despite lower copper head grades. Milled gold grades were higher in the second quarter of 2025 compared to the same period in 2024, resulting in higher gold recoveries of 68% in the second quarter of 2025. Gold recoveries were also higher than the first quarter of 2025, despite slightly lower gold head grades.
Milled copper grades during the first half of 2025 were higher than the same period in 2024 as accelerated stripping efforts unlocked a high-grade mining sequence. Year-to-date 2025 copper recoveries of 80% were lower than 2024 as a result of the composition of ore feed to the mill and the impacts of mill maintenance shutdowns. Operational strategy improvements, including reagent selection and dose modifications are in progress. Milled gold grades during the first half of 2025 were higher than the same period in 2024, resulting in higher gold recoveries of 66% in the first half of 2025.
Production and Sales Performance
The British Columbia operations produced 6,634 tonnes of copper, 5,670 ounces of gold and 65,040 ounces of silver during the second quarter of 2025. Production of copper and silver decreased, compared to prior periods primarily as a result of lower head grades from the use of stockpiled ore. Production of gold significantly increased compared to the second quarter of 2024 due to higher grades and recoveries. Production of gold was also higher than the first quarter of 2025, largely due to higher recoveries.
During the first half of 2025, production of copper, gold and silver was 13,830 tonnes, 11,231 ounces and 144,520 ounces, respectively. Year-to-date copper and gold production was higher than the same period in 2024 and silver production was lower as a result of the same quarterly variances mentioned above.
Quantities of copper, gold and silver sold during the second quarter of 2025 were higher than the first quarter of 2025 as the Company reduced copper concentrate inventory levels that were elevated at the end of March 2025. Year-to-date sales quantity changes compared to the same period in 2024 reflect the changes in production during the periods.
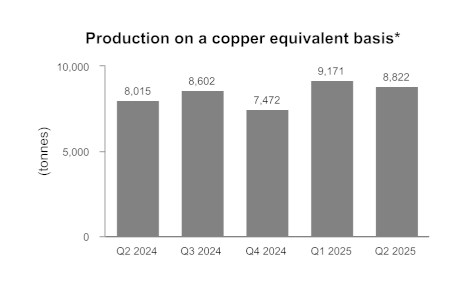
*Copper equivalent production is calculated using the quarter average LME prices for each metal. Copper Mountain mine production are stated at 100%. On April 30, 2025 Hudbay completed the acquisition of the remaining 25% interest in the Copper Mountain mine and now owns 100%.
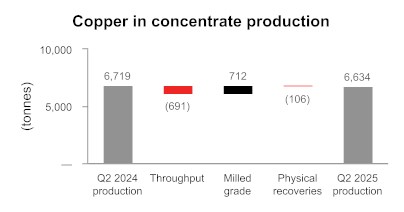
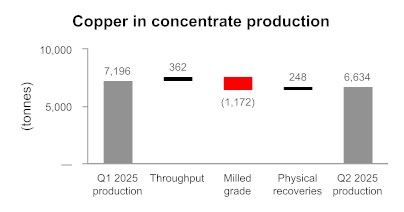
Cost Performance
Combined mine, mill and G&A unit operating costs in the second quarter of 2025 were C$24.51 per tonne milled, higher than the second quarter of 2024, but lower than the first quarter of 2025. The increase compared to the second quarter of 2024 was primarily due to lower ore milled. The decrease compared to the first quarter of 2025 was due to lower milling and G&A costs and higher ore milled, partially offset by higher mining costs.
Combined mine, mill and G&A unit operating costs during the six months ended June 30, 2025 were C$25.12 per tonne milled versus C$21.65 per tonne milled in the first half of 2024 primarily due to lower tonnes milled.
Cash cost and sustaining cash cost per pound of copper produced, net of by-product credits, in the second quarter of 2025 were $2.39 and $5.18, respectively. Cash costs were 11% and 2% lower than in the second quarter of 2024 and first quarter of 2025, respectively, largely due to higher by-product credits. Sustaining cash costs were 7% lower than the second quarter of 2024 mainly as a result of improvements to cash costs, partially offset by higher capital including planned higher capitalized stripping costs in accordance with Hudbay's accelerated stripping program to access higher grade ore. Sustaining cash costs were 22% higher than the first quarter of 2025 due to higher sustaining capital including higher capitalized stripping costs.
Cash cost and sustaining cash cost per pound of copper produced, net of by-product credits, during the six months ended June 30, 2025 were $2.41 and $4.69, respectively. Variances with the same period last year were for largely the same factors affecting the quarterly variances.
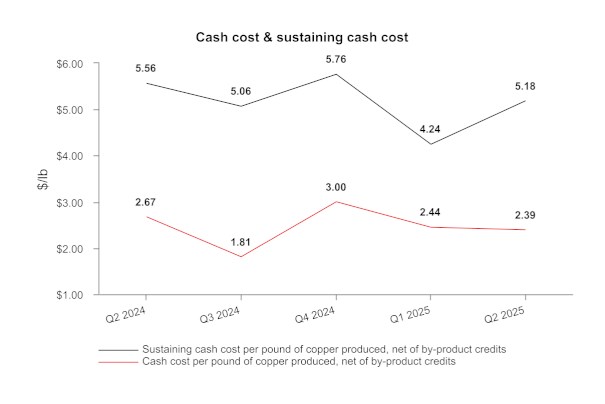
British Columbia Guidance Outlook
| Three months ended2 | Six months ended2 | Guidance | ||||
| Jun. 30, 2025 | Jun. 30, 2024 | Jun. 30, 2025 | Jun. 30, 2024 | Annual 2025 | ||
| Contained metal in concentrate produced | ||||||
| Copper | tonnes | 6,634 | 6,719 | 13,830 | 13,743 | 28,000 - 41,000 |
| Gold | oz | 5,670 | 4,454 | 11,231 | 8,871 | 18,500 - 28,000 |
| Silver | oz | 65,040 | 77,227 | 144,520 | 165,603 | 245,000 - 365,000 |
| Cost per pound of copper produced | ||||||
| Cash cost1 | $/lb | 2.39 | 2.67 | 2.41 | 3.09 | 2.45 - 3.45 |
| 1 Cash cost, net of by-product credits, are non-GAAP financial performance measures with no standardized definition under IFRS. For further information and a detailed reconciliation, please see the discussion under the "Non-GAAP Financial Performance Measures" section of this MD&A. | ||||||
| 2 Copper Mountain mine results are stated at 100%. On April 30, 2025 Hudbay completed the acquisition of the remaining 25% interest in the Copper Mountain mine and now owns 100%. |
Hudbay remains on track to achieve its 2025 production guidance for all metals in British Columbia and continues to expect higher production in the second half of the year as the mill improvement projects take effect. With cash costs in the first half of the year at the low-end of the 2025 guidance range, Hudbay is well positioned to achieve the full year 2025 cash cost guidance range in British Columbia.
FINANCIAL REVIEW
Financial Results
In the second quarter of 2025, Hudbay recorded net earnings attributable to owners of $117.7 million compared to a net loss on the same basis of $16.5 million in the second quarter of 2024, representing an increase in net earnings attributable to owners of $134.2 million. Year-to-date in 2025, Hudbay recorded net earnings attributable to owners of $218.1 million compared to net earnings on the same basis of $5.8 million for the same period in 2024, representing an increase in earnings attributable to owners of $212.3 million.
The following table provides further details on the makeup of this variance:
| (in $ millions) | Three months ended June 30, 2025 |
Six months ended June 30, 2025 |
| Increase (decrease) in components of earnings: | ||
| Revenues | 110.9 | 180.8 |
| Cost of sales | ||
| Mine operating costs | (13.2) | (5.0) |
| Depreciation and amortization | 1.2 | 2.4 |
| Selling and administrative expenses | (2.3) | 0.6 |
| Exploration expenses | (3.4) | (4.7) |
| Re-evaluation adjustment - environmental obligation | 11.1 | (7.0) |
| Other expenses | 4.1 | 15.2 |
| Net finance expense | 44.3 | 73.9 |
| Tax expense | (17.7) | (40.5) |
| Increase in net earnings for the period | 135.0 | 215.7 |
| Change in non-controlling interest | (0.8) | (3.4) |
| Increase in net earnings attributable to owners for the period | 134.2 | 212.3 |
Revenue
Revenue for the second quarter of 2025 was $536.4 million, $110.9 million higher than the same period in 2024, primarily due to higher sales volume of copper, gold and silver, and strong copper and gold realized price in the second quarter of 2025.
Revenue during the six months ended June 30, 2025 was $1,131.3 million, $180.8 million higher than in 2024, primarily as a result of higher metal prices and higher copper and silver sales volumes.
While a majority of revenues continue to be from copper, gold represented a significant portion of total revenues at 36% for the three months ended June 30, 2025. This is as a result of exposure to higher gold prices compared to the second quarter of 2024, increasing commodity diversification and improving overall revenues.
The following table provides further details on these variances:
| (in $ millions) | Three months ended June 30, 2025 |
Six months ended June 30, 2025 |
||||
| Metals prices1 | ||||||
| (Lower) higher copper prices | (12.7 | ) | 32.4 | |||
| Higher gold prices | 57.0 | 140.1 | ||||
| (Lower) higher zinc prices | (1.1 | ) | 0.8 | |||
| (Lower) higher silver prices | (0.9 | ) | 4.5 | |||
| Sales volumes | ||||||
| Higher copper sales volumes | 45.8 | 25.1 | ||||
| Higher (lower) gold sales volumes | 2.6 | (65.0 | ) | |||
| Lower zinc sales volumes | (6.6 | ) | (9.2 | ) | ||
| Higher silver sales volumes | 6.2 | 3.9 | ||||
| Other | ||||||
| Molybdenum and other volume and pricing differences | 1.4 | 1.6 | ||||
| Variable consideration adjustments | - | 13.7 | ||||
| Effect of lower treatment and refining charges | 19.2 | 32.9 | ||||
| Increase in revenue in 2025 compared to 2024 | 110.9 | 180.8 |
| 1 See discussion below for further information regarding metals prices. | |||||
| 2 Copper Mountain mine results are stated at 100%. |
Hudbay's revenue by significant product type is summarized below:
| Three months ended | Six months ended | ||||||||||||||
| (in $ millions) | Jun. 30, 2025 | Mar. 31, 2025 | Jun. 30, 2024 | Jun. 30, 2025 | Jun. 30, 2024 | ||||||||||
| Copper | 297.1 | 302.3 | 259.3 | 599.4 | 544.5 | ||||||||||
| Gold | 189.2 | 194.2 | 119.5 | 383.4 | 297.7 | ||||||||||
| Zinc | 7.1 | 14.3 | 15.5 | 21.4 | 30.4 | ||||||||||
| Silver | 13.9 | 14.3 | 10.9 | 28.2 | 23.1 | ||||||||||
| Molybdenum | 19.1 | 20.9 | 16.0 | 40.0 | 34.2 | ||||||||||
| Other metals | - | (0.2 | ) | 0.5 | (0.2 | ) | 0.5 | ||||||||
| Revenue from contracts | 526.4 | 545.8 | 421.7 | 1,072.2 | 930.4 | ||||||||||
| Amortization of deferred revenue - gold | 5.9 | 8.4 | 5.5 | 14.3 | 21.9 | ||||||||||
| Amortization of deferred revenue - silver | 9.5 | 11.0 | 6.1 | 20.5 | 16.7 | ||||||||||
| Amortization of deferred revenue - variable consideration adjustments - prior periods | - | 9.9 | - | 9.9 | (3.8 | ) | |||||||||
| Pricing and volume adjustments1 | (2.1 | ) | 33.8 | 14.7 | 31.7 | 35.6 | |||||||||
| Treatment and refining charges | (3.3 | ) | (14.0 | ) | (22.5 | ) | (17.3 | ) | (50.3 | ) | |||||
| Revenue | 536.4 | 594.9 | 425.5 | 1,131.3 | 950.5 | ||||||||||
| 1 Pricing and volume adjustments represents mark-to-market adjustments on provisionally prices sales, realized and unrealized changes to fair value for non-hedge derivative contracts (QP hedges) and adjustments to originally invoiced weights and assays. | |||||||||||||||
For further detail on variable consideration adjustments, refer to note 16 of Hudbay's consolidated interim financial statements.
Realized sales prices
This measure is intended to enable management and investors to understand the average realized price of metals sold to third parties in each reporting period. The average realized price per unit sold does not have any standardized meaning prescribed by IFRS, is unlikely to be comparable to similar measures presented by other issuers and should not be considered in isolation or a substitute for measures of performance prepared in accordance with IFRS.
For sales of copper, zinc, gold and silver Hudbay may enter into non-hedge derivatives ("QP hedges") which are intended to manage the provisional pricing risk arising from quotational period terms in concentrate sales agreements. The gains and losses on QP hedges are included in the calculation of realized prices. Hudbay expects that gains and losses on QP hedges will offset provisional pricing adjustments on concentrate sales contracts.
Hudbay's realized prices for the three months and three and six months ended June 30, 2025 and 2024, respectively, are summarized below:
| Realized prices1 for the | Realized prices1 for the | |||||||
| Three months ended | Six months ended | |||||||
| Prices | LME QTD 20252 |
Jun. 30, 2025 |
Mar. 31, 2025 |
Jun. 30, 2024 |
LME YTD 20252 |
Jun. 30, 2025 |
Jun. 30, 2024 |
|
| Copper | $/lb | 4.32 | 4.36 | 4.49 | 4.56 | 4.28 | 4.41 | 4.19 |
| Gold3 | $/oz | 3,289 | 3,135 | 3,002 | 2,222 | 3,075 | 3,062 | 2,043 |
| Zinc | $/lb | 1.15 | 1.29 | 1.33 | 1.24 | 1.19 | ||
| Silver3 | $/oz | 26.17 | 25.91 | 27.13 | 26.04 | 23.68 | ||
| 1 Realized prices exclude refining and treatment charges and are on the sale of finished metal or metal in concentrate. Realized prices include the effect of provisional pricing adjustments on prior period sales. | ||||||||
| 2 London Metal Exchange average for Cash copper and zinc prices. | ||||||||
| 3 Sales of gold and silver from Constancia mine are subject to Hudbay's precious metals stream agreement with Wheaton, pursuant to which Hudbay recognizes deferred revenue for precious metals deliveries and also receive cash payments. Stream sales are included within realized prices and their respective deferred revenue and cash payment rates can be found on page 35 of this MD&A. |
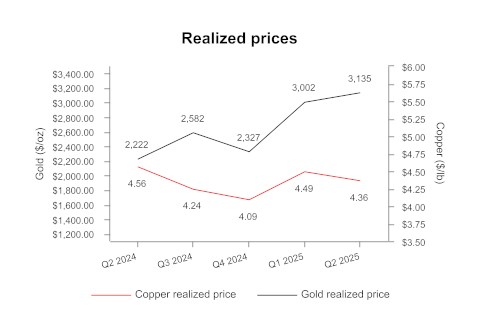
In addition to QP hedges, the Company may periodically undertake metal price hedging in accordance with Board approved policies to achieve strategic objectives, including locking in favourable metal prices to ensure minimum cash flows during or after the construction of a mine or during a period of reduced liquidity, to manage cash flows at shorter life or higher cost operations or as part of a financing arrangement. The realized prices, denoted in the table above, excludes the impact of derivative mark-to-market gains and losses on these non-QP hedges, which are included in change in fair value of financial instruments in Hudbay's condensed consolidated interim statements of income.
As of June 30, 2025, Hudbay had no non-QP hedges outstanding.
The following tables provide a reconciliation of average realized price per unit sold, by metal, to revenues as shown in the consolidated interim financial statements.
| Three months ended June 30, 2025 | |||||||||||||||||||||
| (in $ millions except for realized price and payable metal sold) 1 | Copper | Gold | Zinc | Silver | Molybdenum | Other | Total | ||||||||||||||
| Revenue from contracts | 297.1 | 189.2 | 7.1 | 13.9 | 19.1 | - | 526.4 | ||||||||||||||
| Amortization of deferred revenue | - | 5.9 | - | 9.5 | - | - | 15.4 | ||||||||||||||
| Pricing and volume adjustments 3 | (4.7 | ) | 0.7 | 0.2 | - | 1.7 | - | (2.1 | ) | ||||||||||||
| Revenue, including mark-to-market on QP hedges 4 | 292.4 | 195.8 | 7.3 | 23.4 | 20.8 | - | 539.7 | ||||||||||||||
| Realized non-QP derivative mark-to-market | (0.4 | ) | - | - | - | - | - | (0.4 | ) | ||||||||||||
| By-product credits 5 | 292.0 | 195.8 | 7.3 | 23.4 | 20.8 | - | 539.3 | ||||||||||||||
| Payable metal in concentrate and doré sold 6 | 30,354 | 62,466 | 2,871 | 894,160 | - | - | - | ||||||||||||||
| Realized price 7 | 4.36 | 3,135 | 1.15 | 26.17 | - | - | - | ||||||||||||||
| Three months ended March 31, 2025 | |||||||||||||||||||||
| Revenue from contracts | 302.3 | 194.2 | 14.3 | 14.3 | 20.9 | (0.2 | ) | 545.8 | |||||||||||||
| Amortization of deferred revenue | - | 8.4 | - | 11.0 | - | - | 19.4 | ||||||||||||||
| Pricing and volume adjustments 3 | 12.0 | 22.8 | (0.5 | ) | 0.8 | (1.3 | ) | - | 33.8 | ||||||||||||
| Revenue, including mark-to-market on QP hedges 4 | 314.3 | 225.4 | 13.8 | 26.1 | 19.6 | (0.2 | ) | 599.0 | |||||||||||||
| Realized non-QP derivative mark-to-market | (1.9 | ) | - | - | - | - | - | (1.9 | ) | ||||||||||||
| By-product credits 5 | 312.4 | 225.4 | 13.8 | 26.1 | 19.6 | (0.2 | ) | 597.1 | |||||||||||||
| Payable metal in concentrate and doré sold 6 | 31,768 | 75,092 | 4,857 | 1,006,968 | - | - | - | ||||||||||||||
| Realized price 7 | 4.49 | 3,002 | 1.29 | 25.91 | - | - | - | ||||||||||||||
| Three months ended June 30, 2024 | |||||||||||||||||||||
| Revenue from contracts 2 | 259.3 | 119.5 | 15.5 | 10.9 | 16.0 | 0.5 | 421.7 | ||||||||||||||
| Amortization of deferred revenue | - | 5.5 | - | 6.1 | - | - | 11.6 | ||||||||||||||
| Pricing and volume adjustments 3 | - | 11.2 | (0.5 | ) | 1.1 | 2.9 | - | 14.7 | |||||||||||||
| Revenue, including mark-to-market on QP hedges 4 | 259.3 | 136.2 | 15.0 | 18.1 | 18.9 | 0.5 | 448.0 | ||||||||||||||
| Realized non-QP derivative mark-to-market 5 | (2.6 | ) | - | - | - | - | - | (2.6 | ) | ||||||||||||
| By-product credits 4 | 256.7 | 136.2 | 15.0 | 18.1 | 18.9 | 0.5 | 445.4 | ||||||||||||||
| Payable metal in concentrate and doré sold 6 | 25,799 | 61,295 | 5,133 | 667,036 | - | - | - | ||||||||||||||
| Realized price 7 | 4.56 | 2,222 | 1.33 | 27.13 | - | - | - | ||||||||||||||
| 1 Average realized price per unit sold may not calculate based on amounts presented in this table due to rounding. | ||||||||||||||||||||
| 2 As per consolidated interim financial statements. | ||||||||||||||||||||
| 3 Pricing and volume adjustments represents mark-to-market adjustments on provisionally priced sales, realized and unrealized changes to fair value for QP hedge derivative contracts and adjustments to originally invoiced weights and assays. | ||||||||||||||||||||
| 4 Revenue, including mark-to-market on QP hedges is used in the calculation of realized price. | ||||||||||||||||||||
| 5 By-product credits subtotal is used in the calculated of cash cost per pound of copper and ounce of gold produced, net of by-product credits. Cash cost per pound of copper and per ounce of gold produced, net of by-product credits, are non-GAAP financial performance measures with no standardized definition under IFRS. For further information and a detailed reconciliation, please see the discussion under the "Non-GAAP Financial Performance Measures" section of this MD&A. | ||||||||||||||||||||
| 6 Copper and zinc shown in metric tonnes and gold and silver shown in ounces. | ||||||||||||||||||||
| 7 Realized price for copper and zinc in $/lb and realized price for gold and silver in $/oz. |
| Six months ended June 30, 2025 | |||||||||||||||||||||
| (in $ millions except for realized price and payable metal sold) 1 | Copper | Gold | Zinc | Silver | Molybdenum | Other | Total | ||||||||||||||
| Revenue from contracts | 599.4 | 383.4 | 21.4 | 28.2 | 40.0 | (0.2 | ) | 1,072.2 | |||||||||||||
| Amortization of deferred revenue | - | 14.3 | - | 20.5 | - | - | 34.8 | ||||||||||||||
| Pricing and volume adjustments 3 | 7.3 | 23.5 | (0.3 | ) | 0.8 | 0.4 | - | 31.7 | |||||||||||||
| Revenue, including mark-to-market on QP hedges 4 | 606.7 | 421.2 | 21.1 | 49.5 | 40.4 | (0.2 | ) | 1,138.7 | |||||||||||||
| Realized non-QP derivative mark-to-market | (2.3 | ) | - | - | - | - | - | (2.3 | ) | ||||||||||||
| By-product credits 5 | 604.4 | 421.2 | 21.1 | 49.5 | 40.4 | (0.2 | ) | 1,136.4 | |||||||||||||
| Payable metal in concentrate and doré sold 6 | 62,122 | 137,558 | 7,728 | 1,901,128 | - | - | - | ||||||||||||||
| Realized price 7 | 4.41 | 3,062 | 1.24 | 26.04 | - | - | - | ||||||||||||||
| Six months ended June 30, 2024 | |||||||||||||||||||||
| (in $ millions except for realized price and payable metal sold) 1 | Copper | Gold | Zinc | Silver | Molybdenum | Other | Total | ||||||||||||||
| Revenue from contracts 2 | 544.5 | 297.7 | 30.4 | 23.1 | 34.2 | 0.5 | 930.4 | ||||||||||||||
| Amortization of deferred revenue | - | 21.9 | - | 16.7 | - | - | 38.6 | ||||||||||||||
| Pricing and volume adjustments 3 | 4.7 | 26.5 | (0.9 | ) | 1.3 | 4.0 | - | 35.6 | |||||||||||||
| Revenue, including mark-to-market on QP hedges 4 | 549.2 | 346.1 | 29.5 | 41.1 | 38.2 | 0.5 | 1,004.6 | ||||||||||||||
| Realized non-QP derivative mark-to-market | (2.6 | ) | - | - | - | - | - | (2.6 | ) | ||||||||||||
| By-product credits 5 | 546.6 | 346.1 | 29.5 | 41.1 | 38.2 | 0.5 | 1,002.0 | ||||||||||||||
| Payable metal in concentrate and doré sold 6 | 59,407 | 169,376 | 11,252 | 1,735,884 | - | - | - | ||||||||||||||
| Realized price 7 | 4.19 | 2,043 | 1.19 | 23.68 | - | - | - | ||||||||||||||
| 1 Average realized price per unit sold may not calculate based on amounts presented in this table due to rounding. | ||||||||||||||||||||
| 2 As per financial statements. | ||||||||||||||||||||
| 3 Pricing and volume adjustments represents mark-to-market adjustments on provisionally priced sales, realized and unrealized changes to fair value for QP hedge derivative contracts and adjustments to originally invoiced weights and assays. | ||||||||||||||||||||
| 4 Revenue, including mark-to-market on QP hedges is used in the calculation of realized price. | ||||||||||||||||||||
| 5 By-product credits subtotal is used in the calculated of cash cost per pound of copper and ounce of gold produced, net of by-product credits. Cash cost per pound of copper and per ounce of gold produced, net of by-product credits, are non-GAAP financial performance measures with no standardized definition under IFRS. For further information and a detailed reconciliation, please see the discussion under the "Non-GAAP Financial Performance Measures" section of this MD&A. | ||||||||||||||||||||
| 6 Copper and zinc shown in metric tonnes and gold and silver shown in ounces. | ||||||||||||||||||||
| 7 Realized price for copper and zinc in $/lb and realized price for gold and silver in $/oz. |
The price, quantity and mix of metals sold affect Hudbay's revenue, operating cash flow and gross profit. Revenue from metals sales can vary from quarter to quarter due to production levels, shipping volumes and transfer of risk and title to customers.
Precious metals - stream sales and realized price breakdown
The following table shows a breakdown of realized prices for precious metals inclusive of stream and offtaker revenue. It further identifies the components of the realized price for stream revenues between the amortized drawdown rate and cash payment rate.
| (in $ millions except for realized price and payable metal sold) | Gold | Silver | |||||||
| Three months ended | Six months ended | Three months ended | Six months ended | ||||||
| Revenue | Jun. 30, 2025 |
Jun. 30, 2024 |
Jun. 30, 2025 |
Jun. 30, 2024 |
Jun. 30, 2025 |
Jun. 30, 2024 |
Jun. 30, 2025 |
Jun. 30, 2024 |
|
| Stream | 8.8 | 8.2 | 21.4 | 33.1 | 13.3 | 8.8 | 28.9 | 23.8 | |
| Offtaker | 187.0 | 128.0 | 399.8 | 313.0 | 10.1 | 9.3 | 20.6 | 17.3 | |
| Revenue, including mark-to-market on QP hedges 3 | 195.8 | 136.2 | 421.2 | 346.1 | 23.4 | 18.1 | 49.5 | 41.1 | |
| Payable metal sold | |||||||||
| Stream | oz | 6,827 | 6,640 | 16,615 | 26,763 | 624,787 | 421,623 | 1,354,674 | 1,147,738 |
| Offtaker | oz | 55,639 | 54,655 | 120,943 | 142,613 | 269,373 | 245,413 | 546,454 | 588,146 |
| Total payable metal sold | oz | 62,466 | 61,295 | 137,558 | 169,376 | 894,160 | 667,036 | 1,901,128 | 1,735,884 |
| Deferred revenue drawdown rate1 | $/oz | 860 | 817 | 860 | 817 | 15.06 | 14.56 | 15.06 | 14.56 |
| Cash rate2 | $/oz | 425 | 420 | 425 | 420 | 6.26 | 6.20 | 6.26 | 6.20 |
| Stream realized price | $/oz | 1,285 | 1,237 | 1,285 | 1,237 | 21.32 | 20.76 | 21.32 | 20.76 |
| Offtaker realized price | $/oz | 3,361 | 2,342 | 3,306 | 2,195 | 37.49 | 37.90 | 37.70 | 29.41 |
| Realized price | $/oz | 3,135 | 2,222 | 3,062 | 2,043 | 26.17 | 27.13 | 26.04 | 23.68 |
| 1 Deferred revenue drawdown rates for gold and silver do not include variable consideration adjustments. | |||||||||
| 2 The gold and silver cash rate for Peru increased by 1% from $400/oz and $5.90/oz effective August 4, 2019. Subsequently every year, on August 4, the cash rate will increase by 1% compounded. | |||||||||
| 3 Revenue, including mark-to-market on QP hedges is used in the calculation of realized price. | |||||||||
Subsequent to the variable consideration adjustment recorded on January 1, 2025, the deferred revenue amortization is recorded in Peru at $860 per ounce gold and $15.06 per ounce silver (June 30, 2024 - $817 per ounce gold and $14.56 per ounce silver).
Cost of Sales
Hudbay's detailed cost of sales is summarized as follows:
| (in $ millions) | Three months ended | Six months ended | |||||||||||||
| Jun. 30, 2025 | Mar. 31, 2025 | Jun. 30, 2024 | Jun. 30, 2025 | Jun. 30, 2024 | |||||||||||
| Peru | |||||||||||||||
| Mining | 28.1 | 31.0 | 31.3 | 59.1 | 60.5 | ||||||||||
| Milling | 57.8 | 44.4 | 51.3 | 102.2 | 95.0 | ||||||||||
| Changes in product inventory | 4.0 | 13.8 | 1.1 | 17.8 | 15.2 | ||||||||||
| Depreciation and amortization | 56.0 | 68.2 | 58.9 | 124.2 | 129.9 | ||||||||||
| G&A | 23.4 | 22.6 | 19.6 | 46.0 | 42.7 | ||||||||||
| Inventory adjustments | 1.1 | 0.4 | - | 1.5 | - | ||||||||||
| Freight, royalties and other charges | 13.4 | 16.3 | 13.5 | 29.7 | 32.2 | ||||||||||
| Total Peru cost of sales | 183.8 | 196.7 | 175.7 | 380.5 | 375.5 | ||||||||||
| Manitoba | |||||||||||||||
| Mining | 33.5 | 38.3 | 42.3 | 71.8 | 86.6 | ||||||||||
| Milling | 13.4 | 14.4 | 15.2 | 27.8 | 31.7 | ||||||||||
| Changes in product inventory | 3.8 | (1.0 | ) | (2.4 | ) | 2.8 | (2.9 | ) | |||||||
| Depreciation and amortization | 23.6 | 23.9 | 24.7 | 47.5 | 51.3 | ||||||||||
| Overhead costs incurred during temporary suspension (cash) | 3.2 | - | - | 3.2 | - | ||||||||||
| Inventory adjustments | 1.0 | - | - | 1.0 | - | ||||||||||
| G&A | 14.3 | 15.1 | 10.9 | 29.4 | 22.5 | ||||||||||
| Freight, royalties and other charges | 5.1 | 5.7 | 5.7 | 10.8 | 11.8 | ||||||||||
| Total Manitoba cost of sales | 97.9 | 96.4 | 96.4 | 194.3 | 201.0 | ||||||||||
| British Columbia1 | |||||||||||||||
| Mining` | 24.2 | 21.9 | 19.5 | 46.1 | 48.0 | ||||||||||
| Milling | 21.4 | 21.8 | 21.5 | 43.2 | 44.9 | ||||||||||
| Changes in product inventory | 3.6 | (0.8 | ) | 11.3 | 2.8 | 7.3 | |||||||||
| Depreciation and amortization | 16.8 | 16.0 | 14.0 | 32.8 | 25.7 | ||||||||||
| G&A | 6.3 | 6.6 | 5.4 | 12.9 | 9.3 | ||||||||||
| Inventory adjustments | 1.4 | 0.8 | - | 2.2 | - | ||||||||||
| Freight, royalties and other charges | 4.5 | 4.2 | 4.1 | 8.7 | 9.2 | ||||||||||
| Total British Columbia cost of sales | 78.2 | 70.5 | 75.8 | 148.7 | 144.4 | ||||||||||
| Cost of sales | 359.9 | 363.6 | 347.9 | 723.5 | 720.9 | ||||||||||
1 Copper Mountain mine results are stated at 100%.
Total cost of sales for the second quarter of 2025 was $359.9 million, reflecting an increase of $12.0 million compared to the second quarter of 2024. Peru cost of sales increased by $8.1 million in the second quarter of 2025, compared to the same period of 2024 mainly due to higher milling costs in line with higher production, G&A and change in product inventory. Manitoba cost of sales increased by $1.5 million in the second quarter of 2025 when compared to the same period of 2024, primarily due to change in product inventory, higher G&A and direct charges to cost of sales related to overhead costs during the temporary suspension of operations in Manitoba in June related to the wildfire evacuation orders. These increases have been offset with a decrease in mining and milling costs due to decreased production during the shutdown. British Columbia cost of sales increased by $2.4 million primarily driven by higher mining, depreciation and inventory adjustments, partially offset by changes in product inventory.
Total cost of sales for the six months ended June 30, 2025 was $723.5 million, reflecting an increase of $2.6 million from the same period in 2024 in part due to $4.3 million of incremental operating costs from British Columbia. In addition, Peru cost of sales increased by $5.0 million as a result of an increase in milling and G&A costs offset by decrease in depreciation and amortization. Manitoba cost of sales decreased by $6.7 million as a result of a decrease in mining and milling costs due to decreased production, offset by changes in product inventory and higher G&A costs.
For details on unit operating costs, refer to the respective tables in the "Operations Review" section of this MD&A.
For the second quarter of 2025, other significant variances in expenses, compared to the same period in 2024, include the following:
- Net finance expenses decreased by $44.3 million, primarily due to a decrease in foreign exchange loss of $20.9 million, decrease in losses of $11.8 million from non-QP hedges, a decrease in mark-to-market loss of $3.6 million from investments, a decrease of $2.9 million from interest expense on long-term debt benefiting from the retirement of some senior notes, an increase of $2.0 million from interest income and a $1.9 million decrease in the relative revaluation loss of the gold prepayment liability.
- Other expenses decreased by $4.1 million, primarily due to a decrease of $2.0 million in the amortization of community costs, decrease of $1.7 million in the write-off of previously capitalized PP&E costs, an increase of $1.0 million from Marubeni option agreement proceeds, an increase of $0.9 million in the amortization of obligation related to flow through share deferred liability and a decrease of $0.8 million in care and maintenance related to the Flin Flon assets. These were partially offset by $2.1 million in costs related to the Manitoba wildfire emergency response efforts during the second quarter.
- Re-evaluation adjustment - environmental gain increased by $11.1 million compared to the same period of 2024 due to the relative revaluation of the environmental reclamation provision on Hudbay's Manitoba non-producing sites from changes in long term risk-free discount rates and inflation rates.
Given the long term nature of the reclamation cash flows, the related environmental reclamation provision is highly sensitive to changes in inflation rates and long-term risk-free discount rates and, as such, Hudbay may continue to experience significant quarterly environmental reclamation provision revaluations.
For the year-to-date 2025, other significant variances in expenses, compared to the same period in 2024, included the following:
- Net finance expenses decreased by $73.9 million due to a $28.8 million decrease in net foreign exchange loss, decrease in losses of $12.1 million from non-QP hedges, a decrease in mark-to-market loss of $12.0 million from investments, a $6.2 million decrease in interest expense on long-term debt, a decrease in the relative revaluation loss of the gold prepayment liability of $5.4 million, and an increase of $5.1 million in interest income.
- Other expenses decreased by $15.2 million, primarily due to a decrease of $10.2 million in write-off of previously capitalized PP&E costs, a decrease of $3.2 million in the amortization of community costs, an increase of $2.1 million from Marubeni option agreement proceeds, an increase of $2.1 million in the amortization of obligation related to flow through share deferred liability, a decrease of $1.1 million in restructuring and a decrease of $0.5 million in care and maintenance. These were partially offset by $2.1 million in costs related to the Manitoba wildfire emergency response efforts during the second quarter of 2025 and an increase of $0.8 million in evaluation costs.
- Exploration expenses increased by $4.7 million, primarily due to Hudbay's planned Snow Lake exploration program consisting of modern geophysical programs and multi-phased drilling campaigns, much of which was funded by flow-through financing.
- Re-evaluation adjustment - environmental provision gain decreased by $7.0 million due to the same reasons as outlined above in the quarterly variance analysis.
Tax Expense
For the three and six months ended June 30, 2025, tax expense increased by $17.7 million and $40.5 million, respectively, compared to the same period in 2024. The following table provides further details:
| (in $ millions) | Three months ended | Six months ended | ||||||||||
| Jun. 30, 2025 | Jun. 30, 2024 | Jun. 30, 2025 | Jun. 30, 2024 | |||||||||
| Current tax expense - income tax | 30.3 | 20.5 | 65.5 | 55.8 | ||||||||
| Deferred tax (recovery) expense - income tax1 | (10.5 | ) | (8.7 | ) | 10.2 | (5.2 | ) | |||||
| Total income tax expense | 19.8 | 11.8 | 75.7 | 50.6 | ||||||||
| Current tax expense - mining tax | 17.6 | 10.8 | 36.2 | 23.5 | ||||||||
| Deferred tax expense (recovery) - mining tax1 | 1.0 | (1.9 | ) | (1.4 | ) | (4.1 | ) | |||||
| Total mining tax expense | 18.6 | 8.9 | 34.8 | 19.4 | ||||||||
| Tax expense | 38.4 | 20.7 | 110.5 | 70.0 | ||||||||
| 1 Deferred tax expense (recovery) represents Hudbay's draw down/increase of non-cash deferred income and mining tax assets/liabilities. | ||||||||||||
Income Tax Expense/Recovery
Applying the estimated Canadian statutory income tax rate of 26.7% to Hudbay's net earnings before taxes of $324.4 million for the year-to-date of 2025 would have resulted in a tax expense of approximately $86.6 million; however, Hudbay recorded an income tax expense of $75.7 million. The primary items causing Hudbay's effective income tax rate to be different than the 26.7% estimated Canadian statutory income tax rate are the following:
- Foreign exchange on the translation of deferred tax balances to group currency, resulting in a deferred tax recovery of $17.9 million
- The tax expense with respect to Hudbay's foreign operations is recorded using an income tax rate other than the Canadian statutory income tax rate of 26.7%, resulting in a tax expense of $20.6 million.
- Current mining tax deductions resulted in a tax recovery of $11.1 million.
Mining Tax Expense
For the year-to-date of 2025, Hudbay recorded a mining tax expense of $34.8 million. Effective mining tax rates can vary significantly based on the composition of Hudbay's earnings and the expected amount of mining taxable profits. Corporate costs and other costs not related to mining operations are not deductible in computing mining profits. A brief description of how mining taxes are calculated in Hudbay's various business units is discussed below.
Manitoba
The Province of Manitoba imposes mining tax on earnings related to the sale of mineral products mined in the Province of Manitoba (mining taxable profit) at the following rates:
- 10% of total mining taxable earnings if mining profit is C$50 million or less;
- Between mining earnings of C$50 and $C55 million, mining tax is equal to a minimum of C$5 million plus mining earnings less C$50 million multiplied by 65%;
- 15% of total mining taxable earnings if mining profits are between C$55 million and C$100 million;
- Between mining earnings of C$100 million and C$105 million, mining tax is equal to a minimum of C$15 million plus mining earnings less C$100 million multiplied by 57%; and
- 17% of total mining taxable earnings if mining profits exceed C$105 million.
Hudbay estimates that the deferred tax rate that will be applicable when temporary differences reverse will be approximately 10.0%.
Peru
The Peruvian government imposes two parallel mining tax regimes, the Special Mining Tax and the Modified Royalty, on companies' operating mining income on a sliding scale, with progressive rates ranging from 2.0% to 8.4% and 1.0% to 12.0%, respectively. Based on financial forecasts, Hudbay has recorded a deferred tax liability as at June 30, 2025, at the tax rate expected to apply when temporary differences reverse.
British Columbia
The Province of British Columbia imposes a 13% net revenue tax on the sale of mineral products mined in the province of British Columbia after the mine owner has recovered the capital invested in the mine and its "Cumulative Expenditure Account" ("CEA") no longer has a balance. The tax is paid on the profit in excess of the capital that has been invested in the mine. British Columbia mineral tax is deductible for federal and provincial income tax purposes.
While there is a balance in the CEA account, the mine owner must pay a "Net Current Proceeds" ("NCP") tax of 2%. Any amounts paid as NCP can then be claimed in the future against net revenue taxes payable.
Hudbay estimates that the effective tax rate that will be applicable when temporary differences reverse will be approximately 9.49%.
LIQUIDITY AND CAPITAL RESOURCES
As at June 30, 2025, Hudbay's total liquidity of $1,050.2 million includes $625.5 million in cash as well as undrawn total availability of $424.7 million under Hudbay's revolving credit facilities.
Senior Unsecured Notes
As at June 30, 2025, Hudbay had $525.0 million aggregate principal amount of 2026 Notes and $542.4 million aggregate principal amount of 2029 Notes.
During the second quarter of 2025, the Company made open market purchases of $50 million of Hudbay's 4.5% senior notes due April 2026 ("2026 Notes"), at a discount to par. As at June 30, 2025, Hudbay has presented all of the 2026 Notes as a current liability amounting to $523.8 million, which affected working capital in the quarter.
Senior Secured Revolving Credit Facilities
Hudbay has two senior secured revolving credit facilities with total commitments of $450 million ("the Credit Facilities") for its Canadian and Peruvian businesses on substantially similar terms and conditions. These facilities include an accordion feature that allows Hudbay the option to increase the facility by an additional $150 million at Hudbay's discretion over the four-year term.
As at June 30, 2025, there were no cash drawings under the Credit Facilities and $25.3 million in letters of credit secured under the Canadian Facility.
As at June 30, 2025, Hudbay was in compliance with its covenants under the Credit Facilities.
C$130 Million Bilateral Letter of Credit Facility
Hudbay has a C$130.0 million bilateral letter of credit facility ("LC Facility") with a major Canadian financial institution. The LC Facility has no financial covenants and enables Hudbay to issue up to C$130.0 million of letters of credit to beneficiaries on an unsecured basis at attractive rates, including C$30.0 million sub-limit for financial letters of credit. As at June 30, 2025, the Manitoba business unit had drawn $56.7 million in letters of credit under the LC Facility.
Surety Bonds and Letters of Credit
As at June 30, 2025, the Arizona business unit had $18.4 million in surety bonds issued to support future reclamation and closure obligations and the Peru business unit had $135.0 million in letters of credit and surety bonds issued with various Peruvian financial institutions to support future reclamation and other operating matters. In addition, the British Columbia business unit had $48.1 million in surety bonds issued to support future reclamation and $1.0 million in surety bonds issued to support the hydro used at Copper Mountain mine, and to Fisheries and Oceans Canada for fish monitoring. No cash collateral is required to be posted under these surety bonds.
Working Capital
Working capital decreased by $484.5 million to $26.8 million from December 31, 2024 to June 30, 2025, primarily due to an increase in current portion of long-term debt of $523.8 million as the 2026 Notes are now maturing within one year, a decrease in short-term investment of $40.0 million from the release of guaranteed investment certificates, a decrease in inventories of $33.2 million primarily from decreasing finished goods inventory levels, an increase in other liabilities of $10.1 million, a decrease in prepaid and other current assets of $6.7 million and an increase in lease liabilities of $5.1 million. Partially offsetting these items was an increase in cash and cash equivalents of $83.7 million, a decrease in taxes payable of $63.0 million, a decrease in trade and other payables of $10.3 million and, a decrease in deferred revenue of $5.1 million.
Cash Flows
The following table summarizes Hudbay's cash flows for the three months ended June 30, 2025, March 31, 2025 and June 30, 2024:
| (in $ millions) | Three months ended | Six months ended | |||||||||||||
| Jun. 30, 2025 | Mar. 31, 2025 | Jun. 30, 2024 | Jun. 30, 2025 | Jun. 30, 2024 | |||||||||||
| Operating cash flow before change in non-cash working capital | 193.9 | 163.5 | 123.7 | 357.4 | 271.2 | ||||||||||
| Change in non-cash working capital | 66.0 | (38.7 | ) | 16.5 | 27.3 | 8.6 | |||||||||
| Cash generated from operating activities | 259.9 | 124.8 | 140.2 | 384.7 | 279.8 | ||||||||||
| Cash used in investing activities | (100.6 | ) | (84.3 | ) | (129.2 | ) | (184.9 | ) | (188.1 | ) | |||||
| Cash (used in) generated from financing activities | (98.9 | ) | (20.8 | ) | 189.8 | (119.7 | ) | 142.2 | |||||||
| Effect of movement in exchange rates on cash | 2.5 | 1.1 | (1.4 | ) | 3.6 | 0.1 | |||||||||
| Net increase in cash | 62.9 | 20.8 | 199.4 | 83.7 | 234.0 | ||||||||||
Cash Flow from Operating Activities
Operating cash flow before change in non-cash working capital was $193.9 million during the second quarter of 2025, reflecting an increase of $70.2 million compared to the second quarter of 2024. Cash generated from operating activities was $259.9 million during the second quarter of 2025, an increase of $119.7 million compared to the same period in 2024. The increase in operating cash flows before change in working capital compared with the second quarter of 2024 was primarily the result of higher sales volume for majority of the metals, and stronger realized gold prices partially offset by higher cash taxes paid which are a function of higher profits in earlier quarters in Peru and Manitoba that were subsequently payable.
Year-to-date cash generated from operating activities was $384.7 million in 2025, an increase of $104.9 million compared to the same period in 2024. Operating cash flow before changes in non-cash working capital for the first half of 2025 was $357.4 million, an increase of $86.2 million compared to the same period in 2024. The increase in operating cash flow before changes in working capital was primarily the result of higher metal prices for all metals and higher copper sales volumes. This was partially offset by lower gold sales volumes and by a significant increase in cash taxes paid of $76.0 million mainly at Hudbay's Manitoba and Peru operations, compared to the same period in 2024.
Cash Flow from Investing and Financing Activities
During the second quarter of 2025, Hudbay spent $199.5 million in investing and financing activities, primarily driven by $121.7 million in capital expenditures, $50.0 million toward the repurchase of senior unsecured notes, $29.9 million in interest paid on Hudbay's long-term debt, $13.9 million in capitalized lease and equipment financing payments, $6.0 million in the Copper Mountain non-controlling interest acquisition payment including associated transaction costs and $5.2 million in community agreement payments. These cash outflows were partially offset by cash inflows of $20.0 million from the release of the guaranteed investment certificates, $6.5 million of investment income received and $4.2 million of proceeds from equity issuance, net of share issuance costs.
Year-to-date, Hudbay spent $304.6 million in investing and financing activities, primarily driven by $213.1 million in capital expenditures, $50.0 million of Hudbay's senior unsecured notes repurchased, $29.9 million in interest paid on Hudbay's long-term debt, $27.3 million in capitalized lease and equipment financing payments, $13.8 million in purchase of investments, $9.0 million in community agreement payments, $6.1 million in financing costs paid and $6.0 million in the Copper Mountain non-controlling interest acquisition payment and related transaction costs. This was offset by cash inflows of $40.0 million from the release of the guaranteed investment certificates, $12.5 million of investment income received and $4.2 million of proceeds from equity issuance, net of share issuance costs.
Capital Expenditures
The following summarizes accrued and cash additions to capital assets for the periods indicated:
| Three months ended | Six months ended | Guidance | ||||||||||||||||
| Jun. 30, 2025 |
Mar. 31, 2025 |
Jun. 30, 2024 |
Jun. 30, 2025 |
Jun. 30, 2024 |
Annual | |||||||||||||
| (in $ millions) | 20252 | |||||||||||||||||
| Peru sustaining capital expenditures1 | 44.4 | 28.5 | 29.5 | 72.9 | 54.7 | 170.0 | ||||||||||||
| Manitoba sustaining capital expenditures | 11.3 | 12.5 | 14.6 | 23.8 | 24.3 | 60.0 | ||||||||||||
| British Columbia sustaining capital expenditures1,3 | 32.9 | 21.5 | 36.9 | 54.4 | 53.2 | 135.0 | ||||||||||||
| Total sustaining capital expenditures | 88.6 | 62.5 | 81.0 | 151.1 | 132.2 | 365.0 | ||||||||||||
| Arizona capitalized costs4 | 13.7 | 11.4 | 5.4 | 25.1 | 9.8 | 110.0 | ||||||||||||
| Peru growth capitalized expenditures | 1.3 | 0.9 | 0.1 | 2.2 | 0.2 | 25.0 | ||||||||||||
| Manitoba growth capitalized expenditures | 1.6 | 2.2 | 1.6 | 3.9 | 2.9 | 15.0 | ||||||||||||
| British Columbia growth capitalized expenditures | 16.5 | 11.0 | 0.7 | 27.5 | 1.0 | 75.0 | ||||||||||||
| Capitalized exploration | 3.5 | 1.1 | 2.0 | 4.5 | 4.5 | 10.0 | ||||||||||||
| Right-of-use asset and equipment financing additions | 13.9 | 15.0 | 22.5 | 28.9 | 37.7 | |||||||||||||
| Community agreement additions | 0.6 | - | - | 0.6 | 1.8 | |||||||||||||
| Non-cash capitalized stripping | 8.5 | 6.4 | 5.3 | 14.9 | 9.1 | |||||||||||||
| Grants | (0.6 | ) | (0.9 | ) | - | (1.5 | ) | (2.4 | ) | |||||||||
| Other capitalized costs | (0.2 | ) | (0.1 | ) | - | (0.3 | ) | - | ||||||||||
| Total other capitalized expenditures | 58.8 | 47.0 | 37.6 | 105.8 | 64.6 | |||||||||||||
| Total accrued capital additions | 147.4 | 109.5 | 118.6 | 256.9 | 196.8 | |||||||||||||
| Reconciliation to cash capital additions: | ||||||||||||||||||
| Other capitalized costs2 | (23.0 | ) | (21.4 | ) | (27.8 | ) | (44.4 | ) | (48.6 | ) | ||||||||
| Change in capital accruals and other | (2.7 | ) | 3.3 | (1.3 | ) | 0.6 | 3.6 | |||||||||||
| Acquisition of property, plant & equipment - cash | 121.7 | 91.4 | 89.5 | 213.1 | 151.8 | |||||||||||||
| 1 Peru and British Columbia sustaining capital expenditures include capitalized stripping costs. | |||||
| 2 Other capitalized costs primarily include right-of-use lease and equipment financing additions, which are excluded from guidance in 2025, community agreement additions and non-cash capitalized stripping | |||||
| 3 Includes 100% of Copper Mountain mine production. On April 30, 2025 Hudbay completed the acquisition of the remaining 25% interest in the Copper Mountain mine and now owns 100%. | |||||
| 4 With the announcement of the JV Transaction Hudbay expects to accelerate detailed engineering, long lead items and other de-risking activities by advancing $20 million in growth capital expenditures to 2025 from future years, updating total 2025 Arizona growth spending guidance to $110 million compared to the original 2025 guidance of $90 million. |
For the three and six months ended June 30, 2025, total capital additions increased by $28.8 million and $60.1 million, respectively, compared to the same period in 2024, primarily due to an increase in Peru sustaining capital expenditures, British Columbia growth capitalized expenditures, Arizona capitalized costs and non-cash capitalized stripping. These capital increases were planned as sustaining capital typically increases in the second quarter in Peru after the rainy season is complete, and growth capital was expected to increase as Hudbay continues to execute its growth plans in British Columbia and Arizona. This was partially offset by reduced sustaining capital expenditures in Manitoba and British Columbia and a decrease in lease and equipment financing additions.
Sustaining capital expenditures in Peru for the three and six months ended June 30, 2025 were $44.4 million and $72.9 million, respectively, representing an increase of $14.9 million and $18.2 million, respectively, compared to the same periods in 2024 as a result of the timing of various stripping campaigns and civil work projects. Sustaining capital expenditures in Manitoba for the three and six months ended June 30, 2025 were $11.3 million and $23.8 million, respectively, representing a decrease of $3.3 million and $0.5 million, respectively, compared to the same periods in 2024 mostly due to lower capital development at Lalor. Sustaining capital expenditures in British Columbia for the three and six months ended June 30, 2025 were $32.9 million and $54.4 million, respectively, which included $24.3 million and $38.9 million, respectively, of capitalized stripping related to Hudbay's planned three-year accelerated stripping campaign to access higher grade ore.
Growth capital expenditures in Peru for the three and six months ended June 30, 2025 were $1.3 million and $2.2 million, respectively, representing an increase of $1.2 million and $2.0 million, respectively. The increase mainly relates to the implementation of the pebble crusher in Peru. Growth capital spending in Manitoba for the three and six months ended June 30, 2025 was $1.6 million and $3.9 million, respectively, primarily related to the exploration and haulage drifts advancement towards the 1901 deposit. Arizona's capital expenditures for the three and six months ended June 30, 2025 were $13.7 million and $25.1 million, respectively, mainly related to feasibility study activities and ongoing carrying costs for Copper World. Growth capital expenditures in British Columbia for the three and six months ended June 30, 2025 were $16.5 million and $27.5 million, respectively, representing an increase of $15.8 million and an increase of $26.5 million, respectively compared to the same periods in 2024. The increase mainly relates to the Copper Mountain mill optimization project to convert Ball Mill 3 to a second SAG Mill, which is intended to increase nominal capacity at Copper Mountain.
Capitalized exploration for the three months and six months ended June 30, 2025 was $3.5 million and $4.5 million, respectively.
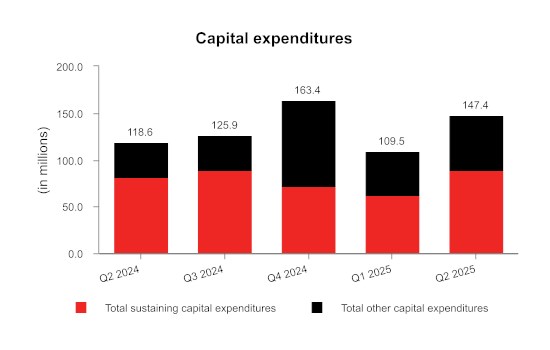
Capital Commitments
As at June 30, 2025, Hudbay had outstanding capital commitments in Canada of approximately $28.9 million, of which $10.4 million can be terminated, approximately $33.7 million in Peru primarily related to sustaining capital commitments and exploration option agreements, all of which can be terminated, and approximately $74.3 million in Arizona, primarily related to Hudbay's Copper World project, of which $72.1 million can be terminated.
Contractual Obligations
The following table summarizes Hudbay's significant contractual obligations as at June 30, 2025:
| Total | Less than 12 months |
13 - 36 months |
37 - 60 months |
More than 60 months |
|
| Payment Schedule (in $ millions) | |||||
| Long-term debt obligations1 | 1,232.1 | 584.3 | 71.4 | 576.4 | - |
| Equipment financing and lease obligations | 206.5 | 78.2 | 81.5 | 33.3 | 13.5 |
| Purchase obligation - capital commitments | 136.9 | 86.0 | 19.5 | 20.6 | 10.8 |
| Purchase obligation - other commitments2 | 1,318.3 | 498.3 | 348.0 | 123.1 | 348.9 |
| Deferred payment and contingent obligations | 39.8 | 3.0 | 6.0 | 13.5 | 17.3 |
| Pension and other employee future benefits obligations3 | 94.2 | 6.3 | 12.9 | 8.1 | 66.9 |
| Community agreement obligations4, 5 | 108.7 | 26.6 | 25.7 | 8.7 | 47.7 |
| Decommissioning and restoration obligations5 | 497.5 | 8.6 | 15.9 | 9.2 | 463.8 |
| Total | 3,634.0 | 1,291.3 | 580.9 | 792.9 | 968.9 |
| 1 Long-term debt obligations include scheduled interest payments, as well as principal repayments | |||||
| 2 Primarily made up of trades payables, accrued liabilities, long-term agreements with operational suppliers, obligations for power purchases, concentrate handling and fleet and port services. | |||||
| 3 Discounted. | |||||
| 4 Represents community agreement obligations and various finalized land user agreements, including Pampacancha. | |||||
| 5 Undiscounted before inflation. | |||||
In addition to the contractual obligations included in the above payment schedule, Hudbay also has the following commitments which impact Hudbay's financial position:
- A profit-sharing plan with most Manitoba employees;
- A profit-sharing plan with all Peru employees;
- Share-based compensation;
- Wheaton precious metals stream agreement for the Constancia mine;
- Government royalty payments related to the Constancia mines;
- Participation agreements related to the Copper Mountain mine, and
- Contracts related to future production and sales, such as royalties.
Outstanding Share Data
As of August 11, 2025, the final trading day prior to the date of this MD&A, there were 395,679,988 common shares of Hudbay issued and outstanding. In addition, there were 2,948,231 stock options and 50,820 common share purchase warrants outstanding.
FINANCIAL RISK MANAGEMENT
The Financial Risk Management risks in this MD&A are not exhaustive. Please also refer to the heading "Risk Factors" in Hudbay's most recent Annual Information Form, for a discussion of the additional risk factors that may affect Hudbay's business, operations and financial condition, a copy of which is available on the Company's SEDAR+ and EDGAR profiles.
TREND ANALYSIS AND QUARTERLY REVIEW
A detailed quarterly and annual summary of financial and operating performance can be found in the "Summary of Results" section at the end of this MD&A. The following table sets forth selected consolidated financial information for each of Hudbay's eight most recently completed quarters:
| (in $ millions, except per share amounts, production on a copper equivalent basis and average realized copper price) | 2025 | 2024 | 2023 | |||||||||||||||||||||
| Q2 | Q1 | Q42 | Q3 | Q2 | Q1 | Q42 | Q3 | |||||||||||||||||
| Production on a copper equivalent basis (tonnes) | 53,693 | 58,611 | 77,769 | 60,895 | 47,164 | 62,120 | 77,951 | 71,335 | ||||||||||||||||
| Average realized copper price ($/lb) | 4.36 | 4.49 | 4.09 | 4.24 | 4.56 | 3.91 | 3.77 | 3.77 | ||||||||||||||||
| Average realized gold price ($/oz) | 3,135 | 3,002 | 2,327 | 2,582 | 2,222 | 1,941 | 2,062 | 1,738 | ||||||||||||||||
| Revenue | 536.4 | 594.9 | 584.9 | 485.8 | 425.5 | 525.0 | 602.2 | 480.5 | ||||||||||||||||
| Gross profit | 176.5 | 231.3 | 184.4 | 139.8 | 77.6 | 152.0 | 196.8 | 106.4 | ||||||||||||||||
| Income before tax | 153.1 | 171.3 | 103.7 | 79.7 | 0.4 | 67.8 | 81.0 | 84.1 | ||||||||||||||||
| Net income (loss) | 114.7 | 99.2 | 19.3 | 50.4 | (20.3 | ) | 18.5 | 33.5 | 45.5 | |||||||||||||||
| Net income (loss) - attributable | 117.7 | 100.4 | 21.2 | 49.8 | (16.5 | ) | 22.4 | 30.7 | 45.1 | |||||||||||||||
| Adjusted net earnings1 - attributable | 75.5 | 93.8 | 70.3 | 50.3 | 0.2 | 59.4 | 68.6 | 24.3 | ||||||||||||||||
| Earnings (loss) per share attributable: | ||||||||||||||||||||||||
| Basic and diluted | 0.30 | 0.25 | 0.05 | 0.13 | (0.04 | ) | 0.06 | 0.09 | 0.13 | |||||||||||||||
| Adjusted net earnings1 per share - attributable | 0.19 | 0.24 | 0.18 | 0.13 | 0.00 | 0.17 | 0.20 | 0.07 | ||||||||||||||||
| Operating cash flow before change in non-cash working capital | 193.9 | 163.5 | 231.5 | 186.3 | 123.7 | 147.5 | 246.5 | 182.0 | ||||||||||||||||
| Adjusted EBITDA1 | 245.2 | 287.2 | 257.3 | 206.2 | 145.0 | 215.0 | 274.4 | 190.7 | ||||||||||||||||
| Adjusted EBITDA LTM1 | 995.9 | 895.7 | 823.3 | 840.6 | 825.1 | 761.3 | 647.8 | 498.5 | ||||||||||||||||
| 1 Adjusted net earnings (loss) - attributable to owners, adjusted net earnings (loss) per share - attributable to owners, adjusted EBITDA, and adjusted EBITDA last twelve months ("LTM") are non-GAAP financial performance measure with no standardized definition under IFRS. For further information and a detailed reconciliation, please see the discussion under the "Non-GAAP Financial Performance Measures" section of this MD&A | |||||||||||||||||||||||
| 2 Annual consolidated results may not calculate based on amounts presented in this table due to rounding. |
On a quarterly basis, the Company's revenue is primarily impacted by metal prices, production mix and sales volumes of the key metals Hudbay produces. In addition to these factors, gross profit, net earnings (loss) attributable, earnings (loss) per share attributable, operating cash flow before change in non-cash working capital and adjusted EBITDA are also impacted by input costs. Net earnings (loss) and earnings (loss) per share are further impacted by net finance expense and re-evaluation adjustments of Hudbay's closed site environmental provision.
During the second quarter of 2025, copper equivalent production decreased to 53,693 tonnes because of reduced copper, gold and silver output. This was primarily due to the temporary suspension of operations in Manitoba in June related to the wildfire evacuation order. This was partially offset by record average gold prices and high copper prices which positively impacted gross profits and contributing to increased net income and higher earnings per share in the second quarter of 2025. While higher profitability led to significant cash taxes paid of $43.9 million, the business's strong operating performance caused the overall impact to operating cash flow before changes in non-cash working capital to remain positive. Higher foreign exchange gains due to the strengthening of the Canadian dollar along with declining net interest cost as a result of Hudbay's deleveraging efforts led to reduced net finance expenses in the second quarter. Adjusted EBITDA over the last twelve months hit a record high of $995.9 million as a result of strong operating performances at the Manitoba and Peru operations resulting in higher sales volumes, benefiting from high copper and gold prices. Net debt to EBITDA is now at its lowest level since the development of the Peru operation more than a decade ago given the business's strong operating performance in conjunction with the same aforementioned deleveraging efforts. The lower net debt and stronger cash position is despite larger reinvestment in the business through growing capital expenditures in recent years.
During the first quarter of 2025, copper equivalent production decreased to 58,611 tonnes as expected, reflecting lower production of copper, gold and silver primarily related to lower planned grades in Peru as the final stripping phase at the Pampacancha deposit was underway. This was partially offset by higher gold production in Manitoba and record average gold prices and high copper prices which positively impacted gross profits.
The Manitoba operations delivered strong quarterly throughput as expected and unlocked better-than-expected grades, resulting in higher production that exceeded Hudbay's quarterly cadence expectations. Strong cost control, a weakening Canadian dollar and meaningful exposure to gold by-product credits resulted in consolidated cash cost1 and sustaining cash cost1 per pound of copper produced, net of by-product credits, in the first quarter of 2025 of $(0.45) and $0.72, respectively, contributing to the increased gross margin and very strong growth in adjusted EBITDA. Higher profits since 2023 in Peru and Canada have resulted in significant cash taxes paid of $117.5 million in the first quarter of 2025, which is reflected in operating cash flow before changes in non-cash working capital. In addition, deleveraging efforts including the repurchases of the Company's senior secured notes over the course of 2024 led to declining net interest cost to service Hudbay's long term debt.
During the fourth quarter of 2024, copper equivalent production increased to 77,769 tonnes. Hudbay's Manitoba and Peru operations delivered strong quarterly production as expected and unlocked higher grade helping the Company exceed 2024 annual gold guidance. Strong cost control and meaningful exposure to gold by-product credits resulted in consolidated cash cost1 and sustaining cash cost1 per pound of copper produced, net of by-product credits1, in the fourth quarter of 2024 of $0.45 and $1.37, respectively, contributing to Hudbay's outperformance of its improved full year 2024 cost guidance. Furthermore, the settlement of the gold prepayment liability in the third quarter of 2024, allowed Hudbay to capitalize on surging gold prices. Since acquiring Copper Mountain in June 2023, Hudbay has moved to optimization efforts which have been focused on ramping up the mining fleet to execute a planned accelerated stripping campaign to gain access to higher grades, as well as plant improvement initiatives to improve mill reliability and recoveries.
During the third quarter of 2024, profitability and cash flows grew compared to the second quarter of 2024. This strength was attributable in part to higher gold, copper and zinc production compared to the second quarter of 2024, along with returning strength in commodity prices including record gold prices. These impacts offset planned lower mined grades observed in Peru in the third quarter of 2024 and the higher cash mining taxes paid in Peru resulting from higher profitability over the past several quarters. Strong operating cost control continued into the third quarter of 2024 resulting from a number of operational initiatives and high levels of mill throughput being experienced throughout the business.
During the second quarter of 2024, realized copper and gold prices continued to climb which overcame the decline in sales volumes of concentrate compared to the first quarter of 2024. Expected lower mined grades observed for the same metals in Peru and Manitoba were the primary factor for the decline in production since the first quarter of the year. Cost control remained favourable as Hudbay continued to track within cost guidance given the expected cadence in the year's production profile. Higher mining taxes continued as Hudbay experienced higher profitability over the past several quarters. Lastly, volatile inter-period copper and gold prices led to relatively high mark-to-market adjustments for Hudbay's strategic non-QP hedging program and high share prices for Hudbay's common shares led to higher share-based compensation expenses. This led to a total of $19.5 million in mark-to-market adjustments to be added back in Hudbay's adjusted net earnings - attributable to owners measure.
The first quarter of 2024 and the fourth quarter of 2023 reflected the continuation of strong copper, gold and silver production that commenced in the third quarter of 2023. The increase in copper, gold and silver prices in the first quarter of 2024 also contributed to strong revenue and profitability in the quarter.
Third quarter of 2023 results reflected significantly higher copper and gold production and sales volumes from the high grade zones of the Pampacancha deposit and higher gold and copper grade zones at Lalor resulting in a significant increase in Hudbay's revenues, gross profits and earnings.
NON-GAAP FINANCIAL PERFORMANCE MEASURES
Adjusted net earnings (loss) attributable to owners, adjusted net earnings (loss) per share attributable to owners, adjusted EBITDA, realized prices, net debt, net debt to adjusted EBITDA, free cash flow, cash cost, sustaining and all-in sustaining cash cost per pound of copper produced, cash cost and sustaining cash cost per ounce of gold produced, combined unit cost and ratios based on these measures are non-GAAP performance measures. These measures do not have a meaning prescribed by IFRS and are therefore unlikely to be comparable to similar measures presented by other issuers. These measures should not be considered in isolation or as a substitute for measures prepared in accordance with IFRS and are not necessarily indicative of gross profit or cash flow from operations as determined under IFRS. Other companies may calculate these measures differently.
Management believes adjusted net earnings (loss) attributable to owners and adjusted net earnings (loss) per share attributable to owners provides an alternate measure of the Company's performance for the current period and gives insight into its expected performance in future periods. These measures are used internally by the Company to evaluate the performance of its underlying operations and to assist with its planning and forecasting of future operating results. As such, the Company believes these measures are useful to investors in assessing the Company's underlying performance. Hudbay provides adjusted EBITDA to help users analyze Hudbay's results and to provide additional information about its ongoing cash generating potential in order to assess its capacity to service and repay debt, carry out investments and cover working capital needs. Net debt is shown because it is a performance measure used by the Company to assess its financial position. Net debt to adjusted EBITDA is shown because it is a performance measure used by the Company to assess its financial leverage and debt capacity. Realized price is shown to understand the average realized price of metals sold to third parties in each reporting period. Free cash flow is shown as it provides investors and management additional information in assessing the Company's ability to generate cash flow from current operations after investing in capital to sustain the operations. Cash cost, sustaining and all-in sustaining cash cost per pound of copper produced are shown because Hudbay believes they help investors and management assess the performance of its operations, including the margin generated by the operations and the Company. Cash cost and sustaining cash cost per ounce of gold produced are shown because Hudbay believes they help investors and management assess the performance of its Manitoba operations. Combined unit cost is shown because Hudbay believes it helps investors and management assess the cost structure and margins that are not impacted by variability in by-product commodity prices.
Adjusted Net Earnings - Attributable to owners
Adjusted net earnings attributable to owners represents net earnings (loss) excluding certain impacts such as mark-to-market adjustments, foreign exchange (gains) loss, revaluation adjustment - environmental provisions for closed sites, variable consideration adjustment related to stream agreements, impairment charges and reversal of impairment charges on assets, (gain) loss on disposal of assets, other items that are not indicative of the underlying operating performance of Hudbay's core business; and tax effect and non-controlling interest of the previously discussed items. These measures are not necessarily indicative of net earnings (loss) as determined under IFRS. The following table provides a reconciliation of net earnings and non-controlling interest per the condensed consolidated interim statements of income, to adjusted net earnings attributable to owners of the Company for the three months ended June 30 and March 31, 2025 and June 30, 2024 and six months ended June 30, 2025 and 2024.
| Three months ended | Six months ended | ||||||||||||||
| (in $ millions) | Jun. 30, 2025 |
Mar. 31, 2025 |
Jun. 30, 2024 |
Jun. 30, 2025 |
Jun. 30, 2024 |
||||||||||
| Earnings (loss) for the period | 114.7 | 99.2 | (20.3) | 213.9 | (1.8) | ||||||||||
| Tax expense | 38.4 | 72.1 | 20.7 | 110.5 | 70.0 | ||||||||||
| Earnings before tax | 153.1 | 171.3 | 0.4 | 324.4 | 68.2 | ||||||||||
| Adjusting items: | |||||||||||||||
| Mark-to-market adjustments1 | 6.3 | (3.1) | 19.5 | 3.2 | 32.2 | ||||||||||
| Foreign exchange (gain) loss | (18.9 | ) | (3.1 | ) | 2.1 | (22.0 | ) | 6.9 | |||||||
| Re-evaluation adjustment - environmental provision | (13.8 | ) | 12.8 | (2.7 | ) | (1.0 | ) | (8.0 | ) | ||||||
| Manitoba cost of sales and other expense from temporary shutdown | 5.3 | - | - | 5.3 | - | ||||||||||
| Variable consideration adjustment - stream revenue and accretion | - | (10.5 | ) | - | (10.5 | ) | 4.0 | ||||||||
| Inventory adjustments | 3.5 | 1.2 | - | 4.7 | - | ||||||||||
| Restructuring charges | - | 0.1 | 0.3 | 0.1 | 1.2 | ||||||||||
| Reduction of obligation to renounce flow-through share expenditures, net of provisions | (1.2 | ) | (1.9 | ) | (0.3 | ) | (3.1 | ) | (1.0 | ) | |||||
| Write-down/loss on disposal of PP&E | 0.3 | 0.6 | 2.1 | 0.9 | 11.1 | ||||||||||
| Changes in other provisions (non-capital) | - | 0.7 | - | 0.7 | - | ||||||||||
| Adjusted earnings before income taxes | 134.6 | 168.1 | 21.4 | 302.7 | 114.6 | ||||||||||
| Tax expense | (38.4 | ) | (72.1 | ) | (20.7 | ) | (110.5 | ) | (70.0 | ) | |||||
| Tax impact of adjusting items | (23.0 | ) | (2.8 | ) | (2.4 | ) | (25.8 | ) | 11.2 | ||||||
| Adjusted net earnings (loss) | 73.2 | 93.2 | (1.7 | ) | 166.4 | 55.8 | |||||||||
| Adjusted net earnings attributable to non-controlling interest: | |||||||||||||||
| Net loss for the period | 3.0 | 1.2 | 3.8 | 4.2 | 7.6 | ||||||||||
| Adjusting items, including tax impact | (0.7 | ) | (0.6 | ) | (1.9 | ) | (1.1 | ) | (3.9 | ) | |||||
| Adjusted net earnings - attributable to owners | 75.5 | 93.8 | 0.2 | 169.5 | 59.5 | ||||||||||
| Adjusted net earnings ($/share) - attributable to owners | 0.19 | 0.24 | 0.00 | 0.43 | 0.17 | ||||||||||
| Basic weighted average number of common shares outstanding (millions) | 395.1 | 395.0 | 368.3 | 395.0 | 359.6 | ||||||||||
| 1 Includes changes in fair value of the gold prepayment liability, Canadian junior mining investments, other financial assets and liabilities at fair value through net earnings and share-based compensation expenses (recoveries). Also includes gains and losses on disposition of investments. | |||||||||||||||
After adjusting reported net earnings for those items not considered representative of the Company's core business or indicative of future operations, the Company had adjusted net earnings - attributable in the second quarter of 2025 of $75.5 million or $0.19 earnings per share.
Adjusted EBITDA
Adjusted EBITDA is net earnings before net finance expense/income, tax expense/recoveries, depreciation and amortization of property, plant and equipment and deferred revenue, as well as certain other adjustments. Hudbay calculates adjusted EBITDA by excluding certain adjustments included within Hudbay's adjusted net earnings attributable measure which reflects the underlying performance of Hudbay's core operating activities. The measure also removes the impact of non-cash items and financing costs that are not associated with measuring the underlying performance of Hudbay's operations. However, Hudbay's adjusted EBITDA is not the measure defined as EBITDA under Hudbay's senior notes or revolving credit facilities and may not be comparable with performance measures with the same name reported by other companies. Adjusted EBITDA should not be considered as a substitute for earnings, which is calculated in accordance with IFRS. Hudbay provides adjusted EBITDA to help users analyze their results and to provide additional information about Hudbay's ongoing cash generating potential in order to assess its capacity to service and repay debt, carry out investments and cover working capital needs.
The following table presents the reconciliation of earnings per the condensed consolidated interim statements of income, to adjusted EBITDA for the three months ended June 30 and March 31, 2025 and June 30, 2024 and six months ended June 30, 2025 and 2024:
| Three months ended | Six months ended | ||||||||||||||
| (in $ millions) | Jun. 30, 2025 |
Mar. 31, 2025 |
Jun. 30, 2024 |
Jun. 30, 2025 |
Jun. 30, 2024 |
||||||||||
| Earnings (loss) for the period | 114.7 | 99.2 | (20.3) | 213.9 | (1.8) | ||||||||||
| Add back: | |||||||||||||||
| Tax expense | 38.4 | 72.1 | 20.7 | 110.5 | 70.0 | ||||||||||
| Net finance expense | - | 14.4 | 44.3 | 14.4 | 88.3 | ||||||||||
| Other expense | 7.1 | 5.2 | 11.2 | 12.3 | 27.5 | ||||||||||
| Depreciation and amortization | 96.4 | 108.1 | 97.6 | 204.5 | 206.9 | ||||||||||
| Amortization of deferred revenue and variable consideration adjustment | (15.4 | ) | (29.3 | ) | (11.5 | ) | (44.7 | ) | (34.7 | ) | |||||
| Adjusting items (pre-tax): | |||||||||||||||
| Re-evaluation adjustment - environmental provision | (13.8 | ) | 12.8 | (2.7 | ) | (1.0 | ) | (8.0 | ) | ||||||
| Inventory adjustments | 3.5 | 1.2 | - | 4.7 | - | ||||||||||
| Manitoba cost of sales charge from temporary shutdown. | 3.2 | - | - | 3.2 | - | ||||||||||
| Option agreement proceeds (Marubeni) | 1.0 | 1.5 | - | 2.5 | 0.4 | ||||||||||
| Realized loss on non-QP hedges | (0.4 | ) | (1.9 | ) | (2.6 | ) | (2.3 | ) | (2.6 | ) | |||||
| Share-based compensation expense 1 | 10.5 | 3.9 | 8.3 | 14.4 | 14.0 | ||||||||||
| Adjusted EBITDA | 245.2 | 287.2 | 145.0 | 532.4 | 360.0 | ||||||||||
| 1 Share-based compensation expense reflected in cost of sales and selling and administrative expenses. | |||||||||||||||
Net Debt
The following table presents Hudbay's calculation of net debt as at June 30, 2025 and December 31, 2024:
| (in $ millions) | Jun. 30, 2025 |
Dec. 31, 2024 |
||||
| Total debt | 1,059.6 | 1,107.5 | ||||
| Cash and cash equivalents | (625.5 | ) | (541.8 | ) | ||
| Short-term investments | - | (40.0 | ) | |||
| Net debt | 434.1 | 525.7 |
Net Debt to Adjusted EBITDA Ratio
The following table presents Hudbay's calculation of net debt to adjusted EBITDA, both metrics have been reconciled above to the most comparable IFRS measure, as at June 30, 2025 and December 31, 2024:
| (in $ millions, except net debt to adjusted EBITDA ratio) | Jun. 30, 2025 |
Dec. 31, 2024 |
| Net debt | 434.1 | 525.7 |
| Adjusted EBITDA for the last twelve months | 995.9 | 823.3 |
| Net debt to adjusted EBITDA | 0.4 | 0.6 |
The following table presents the reconciliation of earnings per the condensed consolidated interim statements of income, to adjusted EBITDA for the twelve months ended June 30, 2025 and December 31, 2024:
| Twelve months ended | ||||||
| (in $ millions) | Jun. 30, 2025 |
Dec. 31, 2024 |
||||
| Earnings for the period | 283.6 | 67.8 | ||||
| Add back: | ||||||
| Tax expense | 224.2 | 183.8 | ||||
| Net finance expense | 74.8 | 148.7 | ||||
| Other expense | 42.3 | 57.4 | ||||
| Depreciation and amortization | 424.2 | 426.6 | ||||
| Amortization of deferred revenue and variable consideration adjustment | (80.4 | ) | (70.5 | ) | ||
| Adjusting items (pre-tax): | ||||||
| Re-evaluation adjustment - environmental provision | 3.5 | (3.5 | ) | |||
| Inventory adjustments | 7.6 | 2.9 | ||||
| Manitoba cost of sales charge from temporary shutdown. | 3.2 | - | ||||
| Option agreement proceeds (Marubeni) | 2.5 | 0.4 | ||||
| Realized loss on non-QP hedges | (8.6 | ) | (8.9 | ) | ||
| Share-based compensation expense 1 | 19.0 | 18.6 | ||||
| Adjusted EBITDA for the last twelve months | 995.9 | 823.3 | ||||
| 1 Share-based compensation expense reflected in cost of sales and selling and administrative expenses. |
The following table presents the calculation of the last twelve months adjusted EBITDA:
| Three months ended | LTM1 | ||||||||||||||
| Trailing Adjusted EBITDA (in $ millions) |
Jun. 30, 2025 | Mar. 31, 2025 | Dec. 31, 2024 | Sept. 30, 2024 | |||||||||||
| Earnings for the period | 114.7 | 99.2 | 19.3 | 50.4 | 283.6 | ||||||||||
| Add back: | |||||||||||||||
| Tax expense | 38.4 | 72.1 | 84.4 | 29.3 | 224.2 | ||||||||||
| Net finance expense | - | 14.4 | 34.4 | 26.0 | 74.8 | ||||||||||
| Other expenses | 7.1 | 5.2 | 22.1 | 7.9 | 42.3 | ||||||||||
| Depreciation and amortization | 96.4 | 108.1 | 122.2 | 97.5 | 424.2 | ||||||||||
| Amortization of deferred revenue and variable consideration adjustment | (15.4 | ) | (29.3 | ) | (26.2 | ) | (9.5 | ) | (80.4 | ) | |||||
| Adjusting items (pre-tax): | |||||||||||||||
| Re-evaluation adjustment - environmental provision | (13.8 | ) | 12.8 | 2.5 | 2.0 | 3.5 | |||||||||
| Inventory adjustments | 3.5 | 1.2 | 1.3 | 1.6 | 7.6 | ||||||||||
| Cash portion of Manitoba cost of sales direct charge from temporary shutdown | 3.2 | - | - | - | 3.2 | ||||||||||
| Realized loss on non-QP hedges | (0.4 | ) | (1.9 | ) | (4.2 | ) | (2.1 | ) | (8.6 | ) | |||||
| Option agreement proceeds (Marubeni) | 1.0 | 1.5 | - | - | 2.5 | ||||||||||
| Share-based compensation expenses2 | 10.5 | 3.9 | 1.5 | 3.1 | 19.0 | ||||||||||
| Adjusted EBITDA | 245.2 | 287.2 | 257.3 | 206.2 | 995.9 | ||||||||||
| 1 LTM (last twelve months) as of June 30, 2025. | ||||||||||||||
| 2 Share-based compensation expense reflected in cost of sales and administrative expenses. |
Free Cash Flow
Hudbay defines free cash flow as cash generated from operations adjusted for changes in non-cash working capital, sustaining capital expenditures and cash payments from operating sites related to leases, equipment financings and community agreements. Free cash flow is intended to provide additional information only and should not be considered in isolation or as a substitute for measures of performance prepared in accordance with IFRS Accounting Standards. This measure is not necessarily indicative of cash flow from operations as determined under IFRS Accounting Standards. The following table presents Hudbay's calculation of free cash flow and reconciles to the most directly comparable IFRS measure:
| Three months ended | Six months ended | |||
| (in $ millions) | Jun. 30, 2025 |
Jun. 30, 2024 |
Jun. 30, 2025 |
Jun. 30, 2024 |
| Cash generated from operations | 259.9 | 140.2 | 384.7 | 279.8 |
| Add back: | ||||
| Change in non-cash working capital | 66.0 | 16.5 | 27.3 | 8.6 |
| Cash sustaining capital expenditures1 | 106.1 | 91.2 | 182.2 | 151.5 |
| Free cash flow | 87.8 | 32.5 | 175.2 | 119.7 |
| Cash sustaining capital expenditures1 | ||||
| Total sustaining capital costs2 | 88.6 | 80.9 | 151.1 | 132.2 |
| Capitalized lease and equipment financing cash payments - operating sites | 13.4 | 9.6 | 26.2 | 17.8 |
| Community agreement cash payments | 4.1 | 0.7 | 4.9 | 1.5 |
| Cash sustaining capital expenditures1 | 106.1 | 91.2 | 182.2 | 151.5 |
| 1 Excludes amortization of decommissioning and restoration PP&E assets and accretion of decommissioning and restoration liabilities related to producing sites. | ||||
| 2 See reconciliation to property, plant & equipment additions on page 61 of this MD&A. | ||||
The following table presents the calculation of the last twelve months free cash flow:
| Three months ended | LTM1 | ||||||||||||||
| (in $ millions) | Jun. 30, 2025 | Mar. 31, 2025 | Dec. 31, 2024 | Sept. 30, 2024 | |||||||||||
| Cash generated from operations | 259.9 | 124.8 | 238.1 | 148.2 | 771.0 | ||||||||||
| Add back: | |||||||||||||||
| Change in non-cash working capital | 66.0 | (38.7 | ) | 6.6 | (40.1 | ) | (6.2 | ) | |||||||
| Cash sustaining capital expenditures2 | 106.1 | 76.1 | 82.6 | 99.9 | 364.7 | ||||||||||
| Free cash flow | 87.8 | 87.4 | 148.9 | 88.4 | 412.5 | ||||||||||
| Cash sustaining capital expenditures2 | |||||||||||||||
| Total sustaining capital costs3 | 88.6 | 62.5 | 71.6 | 89.4 | 312.1 | ||||||||||
| Capitalized lease and equipment financing cash payments - operating sites | 13.4 | 12.8 | 10.3 | 10.2 | 46.7 | ||||||||||
| Community agreement cash payments | 4.1 | 0.8 | 0.7 | 0.3 | 5.9 | ||||||||||
| Cash sustaining capital expenditures2 | 106.1 | 76.1 | 82.6 | 99.9 | 364.7 | ||||||||||
| 1 LTM (last twelve months) as at June 30, 2025 | ||||||||||||||
| 2 Excludes amortization of decommissioning and restoration PP&E assets and accretion of decommissioning and restoration liabilities related to producing sites. | ||||||||||||||
| 3 See reconciliation to property, plant & equipment additions on page 61 of this MD&A. |
Cash Cost, Sustaining and All-in Sustaining Cash Cost (Copper Basis)
Cash cost per pound of copper produced ("cash cost") is a non-GAAP measure that management uses as a key performance indicator to assess the performance of its operations. Hudbay's calculation designates copper as the primary metal of production as it has been the largest component of revenues. The calculation is presented in four manners:
- Cash cost, before by-product credits - This measure is gross of by-product revenues and is a function of the efforts and costs incurred to mine and process all ore mined. However, the measure divides this aggregate cost over only pounds of copper produced, Hudbay's primary metal of production. This measure is generally less volatile from period to period, as it is not affected by changes in the price received for by-product metals. It is, however, affected by the relative mix of copper concentrate and zinc concentrate production, where an increase in production of zinc concentrate will tend to result in an increase in cash cost under this measure.
- Cash cost, net of by-product credits - In order to calculate the net cost to produce and sell copper, the net of by-product credits measure subtracts the revenues realized from the sale of the metals other than copper. The by-product revenues from zinc, gold, and silver are significant and are integral to the economics of Hudbay's operations. The economics that support Hudbay's decision to produce and sell copper would be different if Hudbay did not receive revenues from the other significant metals being extracted and processed. This measure provides management and investors with an indication of the minimum copper price consistent with positive operating margins, assuming realized by-product metal prices are consistent with those prevailing during the reporting period. It also serves as an important operating statistic that management and investors utilize to measure its operating performance versus that of its competitors. However, it is important to understand that if by-product metal prices decline alongside copper prices, the cash cost net of by-product credits would increase, requiring a higher copper price than that reported to maintain positive cash flows and operating margins.
- Sustaining cash cost, net of by-product credits - This measure is an extension of cash cost that includes cash sustaining capital expenditures, including payments on capitalized leases, capitalized sustaining exploration, net smelter returns royalties, payments on certain long-term community agreements, as well as accretion and amortization for expected decommissioning activities for producing assets. It does not include corporate selling and administrative expenses. It provides a more fulsome measurement of the cost of sustaining production than cash cost, which is focused on operating costs only.
- All-in sustaining cash cost, net of by-product credits - This measure is an extension of sustaining cash cost that includes corporate G&A, regional costs, accretion and amortization for community agreements relating to current operations, and accretion for expected decommissioning activities for non-producing sites. Due to the inclusion of corporate selling and administrative expenses, all-in sustaining cash cost is presented on a consolidated basis only.
The tables below present a detailed build-up of cash cost and sustaining cash cost, net of by-product credits, by business unit in addition to consolidated all-in sustaining cash cost, net of by-product credits, and reconciliations between cash cost, net of by-product credits, to the most comparable IFRS measures of cost of sales for the three months ended June 30, and March 31, 2025 and June 30, 2024 and six months ended June 30, 2025 and June 30, 2024. Cash cost, net of by-product credits may not calculate exactly based on amounts presented in the tables below due to rounding.
| Consolidated | Three months ended | Six months ended | ||||||||||||
| (in thousands) | Jun. 30, 2025 | Mar. 31, 2025 | Jun. 30, 2024 | Jun. 30, 2025 | Jun. 30, 2024 | |||||||||
| Peru | 47,863 | 44,738 | 42,366 | 92,601 | 96,547 | |||||||||
| Manitoba | 3,554 | 7,648 | 5,825 | 11,202 | 12,767 | |||||||||
| British Columbia | 14,626 | 15,864 | 14,813 | 30,490 | 30,298 | |||||||||
| Net pounds of copper produced1 | 66,043 | 68,250 | 63,004 | 134,293 | 139,612 | |||||||||
| 1 Contained copper in concentrate. | ||||||||||||||
| Consolidated | Three months ended | |||||||||||||||||
| Jun. 30, 2025 | Mar. 31, 2025 | Jun. 30, 2024 | ||||||||||||||||
| Cash cost per pound of copper produced | $ millions | $/lb | $ millions | $/lb | $ millions | $/lb | ||||||||||||
| Cash cost, before by-product credits | 245.6 | 3.72 | 253.7 | 3.72 | 260.7 | 4.13 | ||||||||||||
| By-product credits | (247.3 | ) | (3.74 | ) | (284.7 | ) | (4.17 | ) | (188.7 | ) | (2.99 | ) | ||||||
| Cash cost, net of by-product credits | (1.7 | ) | (0.02 | ) | (31.0 | ) | (0.45 | ) | 72.0 | 1.14 | ||||||||
| Consolidated | Six months ended | |||||||||||
| Jun. 30, 2025 | Jun. 30, 2024 | |||||||||||
| Cash cost per pound of copper produced | $ millions | $/lb | $ millions | $/lb | ||||||||
| Cash cost, before by-product credits | 499.3 | 3.72 | 539.3 | 3.86 | ||||||||
| By-product credits | (532.0 | ) | (3.96 | ) | (455.4 | ) | (3.26 | ) | ||||
| Cash cost, net of by-product credits | (32.7 | ) | (0.24 | ) | 83.9 | 0.60 | ||||||
| Consolidated | Three months ended | |||||
| Jun. 30, 2025 | Mar. 31, 2025 | Jun. 30, 2024 | ||||
| Cash cost per pound of copper produced | $ millions | $/lb | $ millions | $/lb | $ millions | $/lb |
| Mining | 85.8 | 1.30 | 91.2 | 1.34 | 93.1 | 1.47 |
| Milling | 92.6 | 1.40 | 80.6 | 1.18 | 88.0 | 1.40 |
| G&A | 43.1 | 0.66 | 43.6 | 0.64 | 35.3 | 0.56 |
| Onsite costs | 221.5 | 3.36 | 215.4 | 3.16 | 216.4 | 3.43 |
| Treatment & refining | 3.3 | 0.05 | 14.0 | 0.21 | 22.5 | 0.36 |
| Freight & other | 20.8 | 0.31 | 24.3 | 0.35 | 21.8 | 0.34 |
| Cash cost, before by-product credits | 245.6 | 3.72 | 253.7 | 3.72 | 260.7 | 4.13 |
| Consolidated | Six months ended | |||
| Jun. 30, 2025 | Jun. 30, 2024 | |||
| Cash cost per pound of copper produced | $ millions | $/lb | $ millions | $/lb |
| Mining | 177.0 | 1.32 | 195.1 | 1.40 |
| Milling | 173.2 | 1.29 | 171.6 | 1.23 |
| G&A | 86.7 | 0.64 | 73.5 | 0.52 |
| Onsite costs | 436.9 | 3.25 | 440.2 | 3.15 |
| Treatment & refining | 17.3 | 0.13 | 50.3 | 0.36 |
| Freight & other | 45.1 | 0.34 | 48.8 | 0.35 |
| Cash cost, before by-product credits | 499.3 | 3.72 | 539.3 | 3.86 |
| Consolidated | Three months ended | |||||||||||||||||
| Jun. 30, 2025 | Mar. 31, 2025 | Jun. 30, 2024 | ||||||||||||||||
| Supplementary cash cost information | $ millions | $/lb 1 | $ millions | $/lb 1 | $ millions | $/lb 1 | ||||||||||||
| By-product credits2: | ||||||||||||||||||
| Zinc | 7.3 | 0.11 | 13.8 | 0.20 | 14.9 | 0.23 | ||||||||||||
| Gold3 | 195.8 | 2.96 | 225.4 | 3.30 | 136.2 | 2.16 | ||||||||||||
| Silver3 | 23.4 | 0.35 | 26.1 | 0.38 | 18.1 | 0.29 | ||||||||||||
| Molybdenum & other | 20.8 | 0.32 | 19.4 | 0.29 | 19.5 | 0.31 | ||||||||||||
| Total by-product credits | 247.3 | 3.74 | 284.7 | 4.17 | 188.7 | 2.99 | ||||||||||||
| Reconciliation to IFRS: | ||||||||||||||||||
| Cash cost, net of by-product credits | (1.7 | ) | (31.0 | ) | 72.0 | |||||||||||||
| By-product credits | 247.3 | 284.7 | 188.7 | |||||||||||||||
| Treatment and refining charges | (3.3 | ) | (14.0 | ) | (22.5 | ) | ||||||||||||
| Inventory adjustments | 3.5 | 1.2 | - | |||||||||||||||
| Share-based compensation expense | 0.9 | 0.7 | 0.6 | |||||||||||||||
| Change in product inventory | 11.4 | 12.0 | 10.0 | |||||||||||||||
| Royalties | 2.2 | 1.9 | 1.5 | |||||||||||||||
| Overhead costs incurred during temporary suspension | 3.2 | - | - | |||||||||||||||
| Depreciation and amortization4 | 96.4 | 108.1 | 97.6 | |||||||||||||||
| Cost of sales5 | 359.9 | 363.6 | 347.9 | |||||||||||||||
| 1 Per pound of copper produced. | ||||||
| 2 By-product credits are computed as revenue per financial statements, including amortization of deferred revenue and pricing and volume adjustments. For more information, please see the realized price reconciliation table on page 33 of this MD&A for these figures. | ||||||
| 3 Gold and silver by-product credits do not include variable consideration adjustments with respect to stream arrangements. Variable consideration adjustments are cumulative adjustments to gold and silver stream deferred revenue primarily associated with the net change in mineral reserves and resources or amendments to the mine plan that would change the total expected deliverable ounces under the precious metal streaming arrangement. For the three months ended June 30, 2025 the variable consideration adjustments amounted to $nil (three months ended June 30, 2024 - $nil and March 31, 2025 - gain of $9.9 million). | ||||||
| 4 Depreciation is based on concentrate sold. | ||||||
| 5 As per consolidated interim financial statements. |
| Consolidated | Six months ended | |||||||||||
| Jun. 30, 2025 | Jun. 30, 2024 | |||||||||||
| Supplementary cash cost information | $ millions | $/lb1 | $ millions | $/lb1 | ||||||||
| By-product credits2: | ||||||||||||
| Zinc | 21.1 | 0.16 | 29.5 | 0.21 | ||||||||
| Gold3 | 421.2 | 3.13 | 346.0 | 2.48 | ||||||||
| Silver3 | 49.5 | 0.37 | 41.2 | 0.29 | ||||||||
| Molybdenum & other | 40.2 | 0.30 | 38.7 | 0.28 | ||||||||
| Total by-product credits | 532.0 | 3.96 | 455.4 | 3.26 | ||||||||
| Reconciliation to IFRS: | ||||||||||||
| Cash cost, net of by-product credits | (32.7 | ) | 83.9 | |||||||||
| By-product credits | 532.0 | 455.4 | ||||||||||
| Treatment and refining charges | (17.3 | ) | (50.3 | ) | ||||||||
| Inventory adjustments | 4.7 | - | ||||||||||
| Share-based compensation expense | 1.6 | 1.0 | ||||||||||
| Change in product inventory | 23.4 | 19.6 | ||||||||||
| Royalties | 4.1 | 4.4 | ||||||||||
| Overhead costs incurred during temporary suspension | 3.2 | - | ||||||||||
| Depreciation and amortization4 | 204.5 | 206.9 | ||||||||||
| Cost of sales5 | 723.5 | 720.9 | ||||||||||
| 1 Per pound of copper produced. | |||||||||||
| 2 By-product credits are computed as revenue per financial statements, including amortization of deferred revenue and pricing and volume adjustments. For more information, please see the realized price reconciliation table on page 33 of this MD&A for these figures. | |||||||||||
| 3 Gold and silver by-product credits do not include variable consideration adjustments with respect to stream arrangements. Variable consideration adjustments are cumulative adjustments to gold and silver stream deferred revenue primarily associated with the net change in mineral reserves and resources or amendments to the mine plan that would change the total expected deliverable ounces under the precious metal streaming arrangement. For the six months ended June 30, 2025 the variable consideration adjustments amounted to a gain of $9.9 million (six months ended June 30, 2024 - loss of $3.8 million). | |||||||||||
| 4 Depreciation is based on concentrate sold. | |||||||||||
| 5 As per consolidated interim financial statements. |
| Peru | Three months ended | Six months ended | |||
| (in thousands) | Jun. 30, 2025 | Mar. 31, 2025 | Jun. 30, 2024 | Jun. 30, 2025 | Jun. 30, 2024 |
| Net pounds of copper produced1 | 47,863 | 44,738 | 42,366 | 92,601 | 96,547 |
| 1 Contained copper in concentrate. | |||||
| Peru | Three months ended | |||||||||||||||||
| Jun. 30, 2025 | Mar. 31, 2025 | Jun. 30, 2024 | ||||||||||||||||
| Cash cost per pound of copper produced | $ millions | $/lb | $ millions | $/lb | $ millions | $/lb | ||||||||||||
| Mining | 28.1 | 0.59 | 31.0 | 0.69 | 31.3 | 0.74 | ||||||||||||
| Milling | 57.8 | 1.21 | 44.4 | 0.99 | 51.3 | 1.21 | ||||||||||||
| G&A | 23.2 | 0.48 | 22.5 | 0.51 | 19.4 | 0.46 | ||||||||||||
| Onsite costs | 109.1 | 2.28 | 97.9 | 2.19 | 102.0 | 2.41 | ||||||||||||
| Treatment & refining | (0.1 | ) | 0.00 | 6.7 | 0.15 | 11.1 | 0.26 | |||||||||||
| Freight & other | 12.4 | 0.25 | 15.2 | 0.34 | 12.6 | 0.30 | ||||||||||||
| Cash cost, before by-product credits | 121.4 | 2.53 | 119.8 | 2.68 | 125.7 | 2.97 | ||||||||||||
| By-product credits | (51.8 | ) | (1.08 | ) | (70.2 | ) | (1.57 | ) | (50.3 | ) | (1.19 | ) | ||||||
| Cash cost, net of by-product credits | 69.6 | 1.45 | 49.6 | 1.11 | 75.4 | 1.78 | ||||||||||||
| Peru | Six months ended | |||||||||||
| Jun. 30, 2025 | Jun. 30, 2024 | |||||||||||
| Cash cost per pound of copper produced | $ millions | $/lb | $ millions | $/lb | ||||||||
| Mining | 59.1 | 0.64 | 60.5 | 0.63 | ||||||||
| Milling | 102.2 | 1.10 | 95.0 | 0.98 | ||||||||
| G&A | 45.7 | 0.50 | 42.4 | 0.44 | ||||||||
| Onsite costs | 207.0 | 2.24 | 197.9 | 2.05 | ||||||||
| Treatment & refining | 6.6 | 0.07 | 26.1 | 0.27 | ||||||||
| Freight & other | 27.6 | 0.30 | 29.2 | 0.30 | ||||||||
| Cash cost, before by-product credits | 241.2 | 2.61 | 253.2 | 2.62 | ||||||||
| By-product credits | (122.0 | ) | (1.32 | ) | (154.6 | ) | (1.60 | ) | ||||
| Cash cost, net of by-product credits | 119.2 | 1.29 | 98.6 | 1.02 | ||||||||
| Peru | Three months ended | |||||||||||||||||
| Jun. 30, 2025 | Mar. 31, 2025 | Jun. 30, 2024 | ||||||||||||||||
| Supplementary cash cost information | $ millions | $/lb 1 | $ millions | $/lb 1 | $ millions | $/lb 1 | ||||||||||||
| By-product credits2: | ||||||||||||||||||
| Gold3 | 17.3 | 0.36 | 35.0 | 0.78 | 21.6 | 0.51 | ||||||||||||
| Silver3 | 13.7 | 0.29 | 15.6 | 0.35 | 9.7 | 0.23 | ||||||||||||
| Molybdenum | 20.8 | 0.43 | 19.6 | 0.44 | 19.0 | 0.45 | ||||||||||||
| Total by-product credits | 51.8 | 1.08 | 70.2 | 1.57 | 50.3 | 1.19 | ||||||||||||
| Reconciliation to IFRS: | ||||||||||||||||||
| Cash cost, net of by-product credits | 69.6 | 49.6 | 75.4 | |||||||||||||||
| By-product credits | 51.8 | 70.2 | 50.3 | |||||||||||||||
| Treatment and refining charges | 0.1 | (6.7 | ) | (11.1 | ) | |||||||||||||
| Inventory adjustments | 1.1 | 0.4 | - | |||||||||||||||
| Share-based compensation expenses | 0.2 | 0.1 | 0.2 | |||||||||||||||
| Change in product inventory | 4.0 | 13.8 | 1.1 | |||||||||||||||
| Royalties | 1.0 | 1.1 | 0.9 | |||||||||||||||
| Depreciation and amortization4 | 56.0 | 68.2 | 58.9 | |||||||||||||||
| Cost of sales5 | 183.8 | 196.7 | 175.7 | |||||||||||||||
| 1 Per pound of copper produced. | ||||||
| 2 By-product credits are computed as revenue per financial statements, including amortization of deferred revenue and pricing and volume adjustments. For more information, please see the realized price reconciliation table on page 33 of this MD&A. | ||||||
| 3 Gold and silver by-product credits do not include variable consideration adjustments with respect to stream arrangements. | ||||||
| 4 Depreciation is based on concentrate sold. | ||||||
| 5 As per the consolidated interim financial statements. |
| Peru | Six months ended | |||||||||||
| Jun. 30, 2025 | Jun. 30, 2024 | |||||||||||
| Supplementary cash cost information | $ millions | $/lb 1 | $ millions | $/lb 1 | ||||||||
| By-product credits2: | ||||||||||||
| Gold3 | 52.3 | 0.56 | 91.1 | 0.94 | ||||||||
| Silver3 | 29.3 | 0.32 | 25.3 | 0.26 | ||||||||
| Molybdenum | 40.4 | 0.44 | 38.2 | 0.40 | ||||||||
| Total by-product credits | 122.0 | 1.32 | 154.6 | 1.60 | ||||||||
| Reconciliation to IFRS: | ||||||||||||
| Cash cost, net of by-product credits | 119.2 | 98.6 | ||||||||||
| By-product credits | 122.0 | 154.6 | ||||||||||
| Treatment and refining charges | (6.6 | ) | (26.1 | ) | ||||||||
| Inventory adjustments | 1.5 | - | ||||||||||
| Share-based compensation expenses | 0.3 | 0.3 | ||||||||||
| Change in product inventory | 17.8 | 15.2 | ||||||||||
| Royalties | 2.1 | 3.0 | ||||||||||
| Depreciation and amortization4 | 124.2 | 129.9 | ||||||||||
| Cost of sales5 | 380.5 | 375.5 | ||||||||||
| 1 Per pound of copper produced. | |||||||||||
| 2 By-product credits are computed as revenue per financial statements, including amortization of deferred revenue and pricing and volume adjustments. For more information, please see the realized price reconciliation table on page 33 of this MD&A. | |||||||||||
| 3 Gold and silver by-product credits do not include variable consideration adjustments with respect to stream arrangements. | |||||||||||
| 4 Depreciation is based on concentrate sold. | |||||||||||
| 5 As per the consolidated interim financial statements. |
| British Columbia | Three months ended | Six months ended | |||
| (in thousands) | Jun. 30, 2025 | Mar. 31, 2025 | Jun. 30, 2024 | Jun. 30, 2025 | Jun. 30, 2024 |
| Net pounds of copper produced1 | 14,626 | 15,864 | 14,813 | 30,490 | 30,298 |
| 1 Contained copper in concentrate. | |||||
| British Columbia | Three months ended | |||||||||||||||||
| Jun. 30, 2025 | Mar. 31, 2025 | Jun. 30, 2024 | ||||||||||||||||
| Cash cost per pound of copper produced | $ millions | $/lb | $ millions | $/lb | $ millions | $/lb | ||||||||||||
| Mining | 24.2 | 1.65 | 21.9 | 1.38 | 19.5 | 1.31 | ||||||||||||
| Milling | 21.4 | 1.46 | 21.8 | 1.37 | 21.5 | 1.45 | ||||||||||||
| G&A | 6.1 | 0.42 | 6.3 | 0.40 | 5.4 | 0.37 | ||||||||||||
| Onsite costs | 51.7 | 3.53 | 50.0 | 3.15 | 46.4 | 3.13 | ||||||||||||
| Treatment & refining | 2.1 | 0.14 | 3.6 | 0.23 | 4.2 | 0.29 | ||||||||||||
| Freight & other | 3.3 | 0.24 | 3.4 | 0.21 | 3.5 | 0.23 | ||||||||||||
| Cash cost, before by-product credits | 57.1 | 3.91 | 57.0 | 3.59 | 54.1 | 3.65 | ||||||||||||
| By-product credits | (22.2 | ) | (1.52 | ) | (18.3 | ) | (1.15 | ) | (14.5 | ) | (0.98 | ) | ||||||
| Cash cost, net of by-product credits | 34.9 | 2.39 | 38.7 | 2.44 | 39.6 | 2.67 | ||||||||||||
| British Columbia | Six months ended | |||||||||||
| Jun. 30, 2025 | Jun. 30, 2024 | |||||||||||
| Cash cost per pound of copper produced | $ millions | $/lb | $ millions | $/lb | ||||||||
| Mining | 46.1 | 1.51 | 48.0 | 1.58 | ||||||||
| Milling | 43.2 | 1.42 | 44.9 | 1.48 | ||||||||
| G&A | 12.4 | 0.41 | 9.3 | 0.31 | ||||||||
| Onsite costs | 101.7 | 3.34 | 102.2 | 3.37 | ||||||||
| Treatment & refining | 5.7 | 0.19 | 7.7 | 0.25 | ||||||||
| Freight & other | 6.7 | 0.21 | 7.8 | 0.26 | ||||||||
| Cash cost, before by-product credits | 114.1 | 3.74 | 117.7 | 3.88 | ||||||||
| By-product credits | (40.5 | ) | (1.33 | ) | (24.1 | ) | (0.79 | ) | ||||
| Cash cost, net of by-product credits | 73.6 | 2.41 | 93.6 | 3.09 | ||||||||
| British Columbia | Three months ended | |||||||||||||||||
| Jun. 30, 2025 | Mar. 31, 2025 | Jun. 30, 2024 | ||||||||||||||||
| Supplementary cash cost information | $ millions | $/lb 1 | $ millions | $/lb 1 | $ millions | $/lb 1 | ||||||||||||
| By-product credits2: | ||||||||||||||||||
| Gold | 19.8 | 1.35 | 16.1 | 1.01 | 12.2 | 0.82 | ||||||||||||
| Silver | 2.4 | 0.17 | 2.2 | 0.14 | 2.3 | 0.16 | ||||||||||||
| Total by-product credits | 22.2 | 1.52 | 18.3 | 1.15 | 14.5 | 0.98 | ||||||||||||
| Reconciliation to IFRS: | ||||||||||||||||||
| Cash cost, net of by-product credits | 34.9 | 38.7 | 39.6 | |||||||||||||||
| By-product credits | 22.2 | 18.3 | 14.5 | |||||||||||||||
| Treatment and refining charges | (2.1 | ) | (3.6 | ) | (4.2 | ) | ||||||||||||
| Inventory adjustments | 1.4 | 0.8 | - | |||||||||||||||
| Change in product inventory | 3.6 | (0.8 | ) | 11.3 | ||||||||||||||
| Share based payment | 0.2 | 0.3 | - | |||||||||||||||
| Royalties | 1.2 | 0.8 | 0.6 | |||||||||||||||
| Depreciation and amortization3 | 16.8 | 16.0 | 14.0 | |||||||||||||||
| Cost of sales4 | 78.2 | 70.5 | 75.8 | |||||||||||||||
| 1 Per pound of copper produced. | |||||||||||||||||
| 2 By-product credits are computed as revenue per financial statements, including amortization of deferred revenue and pricing and volume adjustments. For more information, please see the realized price reconciliation table on page 33 of this MD&A. | |||||||||||||||||
| 3 Depreciation is based on concentrate sold. | |||||||||||||||||
| 4 As per consolidated interim financial statements. |
| British Columbia | Six months ended | |||||||||||
| Jun. 30, 2025 | Jun. 30, 2024 | |||||||||||
| Supplementary cash cost information | $ millions | $/lb 1 | $ millions | $/lb 1 | ||||||||
| By-product credits2: | ||||||||||||
| Gold | 35.9 | 1.18 | 19.8 | 0.65 | ||||||||
| Silver | 4.6 | 0.15 | 4.3 | 0.14 | ||||||||
| Total by-product credits | 40.5 | 1.33 | 24.1 | 0.79 | ||||||||
| Reconciliation to IFRS: | ||||||||||||
| Cash cost, net of by-product credits | 73.6 | 93.6 | ||||||||||
| By-product credits | 40.5 | 24.1 | ||||||||||
| Treatment and refining charges | (5.7 | ) | (7.7 | ) | ||||||||
| Inventory adjustments | 2.2 | - | ||||||||||
| Change in product inventory | 2.8 | 7.3 | ||||||||||
| Share based payment | 0.5 | - | ||||||||||
| Royalties | 2.0 | 1.4 | ||||||||||
| Depreciation and amortization3 | 32.8 | 25.7 | ||||||||||
| Cost of sales4 | 148.7 | 144.4 | ||||||||||
| 1 Per pound of copper produced. | ||||
| 2 By-product credits are computed as revenue per financial statements, including amortization of deferred revenue and pricing and volume adjustments. For more information, please see the realized price reconciliation table on page 33 of this MD&A. | ||||
| 3 Depreciation is based on concentrate sold. | ||||
| 4 As per consolidated interim financial statements. |
| Consolidated | Three months ended | |||||||||||||||||
| Jun. 30, 2025 | Mar. 31, 2025 | Jun. 30, 2024 | ||||||||||||||||
| All-in sustaining cash cost per pound of copper produced | $ millions | $/lb | $ millions | $/lb | $ millions | $/lb | ||||||||||||
| Cash cost, net of by-product credits | (1.7 | ) | (0.02 | ) | (31.0 | ) | (0.45 | ) | 72.0 | 1.14 | ||||||||
| Cash sustaining capital expenditures | 108.3 | 1.64 | 78.2 | 1.14 | 93.0 | 1.48 | ||||||||||||
| Royalties | 2.2 | 0.03 | 1.9 | 0.03 | 1.5 | 0.03 | ||||||||||||
| Sustaining cash cost, net of by-product credits | 108.8 | 1.65 | 49.1 | 0.72 | 166.5 | 2.65 | ||||||||||||
| Corporate selling and administrative expenses & regional costs | 22.1 | 0.33 | 15.3 | 0.22 | 19.8 | 0.32 | ||||||||||||
| Accretion and amortization of decommissioning and community agreements1 | 3.2 | 0.05 | 2.0 | 0.03 | 6.6 | 0.10 | ||||||||||||
| All-in sustaining cash cost, net of by-product credits | 134.1 | 2.03 | 66.4 | 0.97 | 192.9 | 3.07 | ||||||||||||
| Reconciliation to property, plant and equipment additions: | ||||||||||||||||||
| Property, plant and equipment additions | 93.6 | 68.2 | 75.2 | |||||||||||||||
| Capitalized stripping net additions | 53.8 | 41.3 | 43.4 | |||||||||||||||
| Total accrued capital additions | 147.4 | 109.5 | 118.6 | |||||||||||||||
| Less other non-sustaining capital costs2 | 58.8 | 47.0 | 37.7 | |||||||||||||||
| Total sustaining capital costs | 88.6 | 62.5 | 80.9 | |||||||||||||||
| Capitalized lease & equipment financing cash payments - operating sites | 13.4 | 12.8 | 9.6 | |||||||||||||||
| Community agreement cash payments | 4.1 | 0.8 | 0.7 | |||||||||||||||
| Accretion and amortization of decommissioning and restoration obligations 3 | 2.2 | 2.1 | 1.8 | |||||||||||||||
| Cash sustaining capital expenditures | 108.3 | 78.2 | 93.0 | |||||||||||||||
| 1 Includes accretion of decommissioning liability relating to non-producing sites, and accretion and amortization of community agreements capitalized to Other assets. | |||||||||||||||||
| 2 Other non-sustaining capital costs include Arizona capitalized costs, capitalized interest, capitalized exploration, right-of-use lease asset additions, equipment financing asset additions, growth capital expenditures and reclassification related to capital spares. | |||||||||||||||||
| 3 Includes amortization of decommissioning and restoration PP&E assets and accretion of decommissioning and restoration liabilities related to producing sites. |
| Consolidated | Six months ended | |||||||||||
| Jun. 30, 2025 | Jun. 30, 2024 | |||||||||||
| All-in sustaining cash cost per pound of copper produced | $ millions | $/lb | $ millions | $/lb | ||||||||
| Cash cost, net of by-product credits | (32.7 | ) | (0.24 | ) | 83.9 | 0.60 | ||||||
| Cash sustaining capital expenditures | 186.5 | 1.39 | 155.3 | 1.11 | ||||||||
| Royalties | 4.1 | 0.03 | 4.4 | 0.03 | ||||||||
| Sustaining cash cost, net of by-product credits | 157.9 | 1.18 | 243.6 | 1.74 | ||||||||
| Corporate selling and administrative expenses & regional costs | 37.4 | 0.27 | 37.8 | 0.27 | ||||||||
| Accretion and amortization of decommissioning and community agreements1 | 5.2 | 0.04 | 10.6 | 0.08 | ||||||||
| All-in sustaining cash cost, net of by-product credits | 200.5 | 1.49 | 292.0 | 2.09 | ||||||||
| Reconciliation to property, plant and equipment additions: | ||||||||||||
| Property, plant and equipment additions | 161.8 | 121.4 | ||||||||||
| Capitalized stripping net additions | 95.1 | 75.4 | ||||||||||
| Total accrued capital additions | 256.9 | 196.8 | ||||||||||
| Less other non-sustaining capital costs2 | 105.8 | 64.6 | ||||||||||
| Total sustaining capital costs | 151.1 | 132.2 | ||||||||||
| Capitalized lease & equipment financing cash payments - operating sites | 26.2 | 17.8 | ||||||||||
| Community agreement cash payments | 4.9 | 1.5 | ||||||||||
| Accretion and amortization of decommissioning and restoration obligations 3 | 4.3 | 3.8 | ||||||||||
| Cash sustaining capital expenditures | 186.5 | 155.3 | ||||||||||
| 1 Includes accretion of decommissioning liability relating to non-producing sites, and accretion and amortization of community agreements capitalized to Other assets. | |||||||||||
| 2 Other non-sustaining capital costs include Arizona capitalized costs, capitalized interest, capitalized exploration, right-of-use lease asset additions, equipment financing asset additions, growth capital expenditures and reclassification related to capital spares. | |||||||||||
| 3 Includes amortization of decommissioning and restoration PP&E assets and accretion of decommissioning and restoration liabilities related to producing sites. |
| Peru | Three months ended | |||||
| Jun. 30, 2025 | Mar. 31, 2025 | Jun. 30, 2024 | ||||
| Sustaining cash cost per pound of copper produced | $ millions | $/lb | $ millions | $/lb | $ millions | $/lb |
| Cash cost, net of by-product credits | 69.6 | 1.45 | 49.6 | 1.11 | 75.4 | 1.78 |
| Cash sustaining capital expenditures | 55.1 | 1.15 | 35.3 | 0.79 | 33.8 | 0.80 |
| Royalties | 1.0 | 0.03 | 1.1 | 0.02 | 0.9 | 0.02 |
| Sustaining cash cost per pound of copper produced | 125.7 | 2.63 | 86.0 | 1.92 | 110.1 | 2.60 |
| Peru | Six months ended | |||
| Jun. 30, 2025 | Jun. 30, 2024 | |||
| Sustaining cash cost per pound of copper produced | $ millions | $/lb | $ millions | $/lb |
| Cash cost, net of by-product credits | 119.2 | 1.29 | 98.6 | 1.02 |
| Cash sustaining capital expenditures | 90.4 | 0.98 | 63.6 | 0.66 |
| Royalties | 2.1 | 0.02 | 3.0 | 0.03 |
| Sustaining cash cost per pound of copper produced | 211.7 | 2.29 | 165.2 | 1.71 |
| British Columbia | Three months ended | |||||
| Jun. 30, 2025 | Mar. 31, 2025 | Jun. 30, 2024 | ||||
| Sustaining cash cost per pound of copper produced | $ millions | $/lb | $ millions | $/lb | $ millions | $/lb |
| Cash cost, net of by-product credits | 34.9 | 2.39 | 38.7 | 2.44 | 39.6 | 2.67 |
| Cash sustaining capital expenditures | 39.6 | 2.71 | 27.8 | 1.75 | 42.1 | 2.84 |
| Royalties | 1.2 | 0.08 | 0.8 | 0.05 | 0.6 | 0.05 |
| Sustaining cash cost per pound of copper produced | 75.7 | 5.18 | 67.3 | 4.24 | 82.3 | 5.56 |
| British Columbia | Six months ended | |||
| Jun. 30, 2025 | Jun. 30, 2024 | |||
| Sustaining cash cost per pound of copper produced | $ millions | $/lb | $ millions | $/lb |
| Cash cost, net of by-product credits | 73.6 | 2.41 | 93.6 | 3.09 |
| Cash sustaining capital expenditures | 67.4 | 2.21 | 62.5 | 2.06 |
| Royalties | 2.0 | 0.07 | 1.4 | 0.05 |
| Sustaining cash cost per pound of copper produced | 143.0 | 4.69 | 157.5 | 5.20 |
Gold Cash Cost and Gold Sustaining Cash Cost
Cash cost per ounce of gold produced ("gold cash cost") is a non-GAAP measure that management uses as a key performance indicator to assess the performance of Hudbay's Manitoba operations. This alternative cash cost calculation designates gold as the primary metal of production as it represents a substantial component of revenues for Hudbay's Manitoba business unit and should therefore be less volatile over time than Manitoba cash cost per pound of copper. The calculation is presented in three manners:
- Gold cash cost, before by-product credits - This measure is gross of by-product revenues and is a function of the efforts and costs incurred to mine and process all ore mined. However, the measure divides this aggregate cost over only ounces of gold produced, the assumed primary metal of production. This measure is generally less volatile from period to period, as it is not affected by changes in the price received for by-product metals.
- Gold cash cost, net of by-product credits - In order to calculate the net cost to produce and sell gold, the net of by-product credits measure subtracts the revenues realized from the sale of the metals other than gold. The by-product revenues from copper, zinc, and silver are significant and are integral to the economics of Hudbay's Manitoba operation. The economics that support its decision to produce and sell gold would be different if Hudbay did not receive revenues from the other significant metals being extracted and processed. This measure provides management and investors with an indication of the minimum gold price consistent with positive operating margins, assuming realized by-product metal prices are consistent with those prevailing during the reporting period. It also serves as an important operating statistic that management and investors utilize to measure Hudbay's operating performance at its Manitoba operation versus that of its competitors. However, it is important to understand that if by-product metal prices decline alongside gold prices, the gold cash cost net of by-product credits would increase, requiring a higher gold price than that reported to maintain positive cash flows and operating margins.
- Gold sustaining cash cost, net of by-product credits - This measure is an extension of gold cash cost that includes cash sustaining capital expenditures, capitalized exploration, net smelter returns royalties, as well as accretion and amortization for expected decommissioning activities for producing assets. It does not include corporate selling and administrative expenses. It provides a more fulsome measurement of the cost of sustaining production than gold cash cost, which is focused on operating costs only.
The tables below present a detailed build-up of gold cash cost and gold sustaining cash cost, net of by-product credits, for the Manitoba business unit, and reconciliations between gold cash cost, net of by-product credits, to the most comparable IFRS measures of cost of sales for the three months ended June 30, and March 31, 2025 and June 30, 2024 and six months ended June 30, 2025 and 2024. Gold cash cost, net of by-product credits, may not calculate exactly based on amounts presented in the tables below due to rounding.
| Manitoba | Three months ended | Six months ended | |||
| (in thousands) | Jun. 30, 2025 | Mar. 31, 2025 | Jun. 30, 2024 | Jun. 30, 2025 | Jun. 30, 2024 |
| Net ounces of gold produced1 | 43,235 | 60,354 | 43,488 | 103,589 | 100,319 |
| 1 Contained gold in concentrate and doré. | |||||
| Manitoba | Three months ended | |||||||||||||||||
| Jun. 30, 2025 | Mar. 31, 2025 | Jun. 30, 2024 | ||||||||||||||||
| Cash cost per ounce of gold produced | $ millions | $/oz1 | $ millions | $/oz1 | $ millions | $/oz1 | ||||||||||||
| Mining | 33.5 | 775 | 38.3 | 634 | 42.3 | 973 | ||||||||||||
| Milling | 13.4 | 310 | 14.4 | 239 | 15.2 | 350 | ||||||||||||
| G&A | 13.8 | 319 | 14.8 | 245 | 10.5 | 240 | ||||||||||||
| Onsite costs | 60.7 | 1,404 | 67.5 | 1,118 | 68.0 | 1,563 | ||||||||||||
| Treatment & refining | 1.3 | 30 | 3.7 | 61 | 7.2 | 167 | ||||||||||||
| Freight & other | 5.1 | 118 | 5.7 | 95 | 5.7 | 130 | ||||||||||||
| Cash cost, before by-product credits | 67.1 | 1,552 | 76.9 | 1,274 | 80.9 | 1,860 | ||||||||||||
| By-product credits | (36.4 | ) | (842 | ) | (54.2 | ) | (898 | ) | (47.4 | ) | (1,090 | ) | ||||||
| Gold cash cost, net of by-product credits | 30.7 | 710 | 22.7 | 376 | 33.5 | 771 | ||||||||||||
| Manitoba | Six months ended | ||||||||||||
| Jun. 30, 2025 | Jun. 30, 2024 | ||||||||||||
| Cash cost per ounce of gold produced | $ millions | $/oz1 | $ millions | $/oz1 | |||||||||
| Mining | 71.8 | 693 | 86.6 | 864 | |||||||||
| Milling | 27.8 | 268 | 31.7 | 316 | |||||||||
| G&A | 28.6 | 277 | 21.8 | 217 | |||||||||
| Onsite costs | 128.2 | 1,238 | 140.1 | 1,397 | |||||||||
| Treatment & refining | 5.0 | 48 | 16.5 | 164 | |||||||||
| Freight & other | 10.8 | 104 | 11.8 | 118 | |||||||||
| Cash cost, before by-product credits | 144.0 | 1,390 | 168.4 | 1,679 | |||||||||
| By-product credits | (90.6 | ) | (875 | ) | (93.1 | ) | (928 | ) | |||||
| Gold cash cost, net of by-product credits | 53.4 | 515 | 75.3 | 751 | |||||||||
| Manitoba | Three months ended | |||||||||||||||||
| Supplementary cash cost information | Jun. 30, 2025 | Mar. 31, 2025 | Jun. 30, 2024 | |||||||||||||||
| $ millions | $/oz 1 | $ millions | $/oz1 | $ millions | $/oz 1 | |||||||||||||
| By-product credits2: | ||||||||||||||||||
| Copper | 21.8 | 504 | 32.3 | 535 | 25.9 | 596 | ||||||||||||
| Zinc | 7.3 | 169 | 13.8 | 228 | 14.9 | 343 | ||||||||||||
| Silver | 7.3 | 169 | 8.3 | 138 | 6.1 | 140 | ||||||||||||
| Other | - | - | (0.2 | ) | (3 | ) | 0.5 | 11 | ||||||||||
| Total by-product credits | 36.4 | 842 | 54.2 | 898 | 47.4 | 1,090 | ||||||||||||
| Reconciliation to IFRS: | ||||||||||||||||||
| Cash cost, net of by-product credits | 30.7 | 22.7 | 33.5 | |||||||||||||||
| By-product credits | 36.4 | 54.2 | 47.4 | |||||||||||||||
| Treatment and refining charges | (1.3 | ) | (3.7 | ) | (7.2 | ) | ||||||||||||
| Share-based compensation expenses | 0.5 | 0.3 | 0.4 | |||||||||||||||
| Inventory adjustments | 1.0 | - | - | |||||||||||||||
| Change in product inventory | 3.8 | (1.0 | ) | (2.4 | ) | |||||||||||||
| Overhead costs incurred during temporary suspension | 3.2 | - | - | |||||||||||||||
| Depreciation and amortization3 | 23.6 | 23.9 | 24.7 | |||||||||||||||
| Cost of sales4 | 97.9 | 96.4 | 96.4 | |||||||||||||||
| 1 Per ounce of gold produced. | |||||||||||||||||
| 2 By-product credits are computed as revenue per financial statements, amortization of deferred revenue and pricing and volume adjustments. For more information, please see the realized price reconciliation table on page 33 of this MD&A. | |||||||||||||||||
| 3 Depreciation is based on concentrate sold. | |||||||||||||||||
| 4 As per consolidated interim financial statements. |
| Manitoba | Six months ended | |||||||||||
| Supplementary cash cost information | Jun. 30, 2025 | Jun. 30, 2024 | ||||||||||
| $ millions | $/oz 1 | $ millions | $/oz 1 | |||||||||
| By-product credits2: | ||||||||||||
| Copper | 54.1 | 522 | 51.5 | 514 | ||||||||
| Zinc | 21.1 | 204 | 29.5 | 294 | ||||||||
| Silver | 15.6 | 151 | 11.6 | 115 | ||||||||
| Other | (0.2 | ) | (2 | ) | 0.5 | 5 | ||||||
| Total by-product credits | 90.6 | 875 | 93.1 | 928 | ||||||||
| Reconciliation to IFRS: | ||||||||||||
| Cash cost, net of by-product credits | 53.4 | 75.3 | ||||||||||
| By-product credits | 90.6 | 93.1 | ||||||||||
| Treatment and refining charges | (5.0 | ) | (16.5 | ) | ||||||||
| Share-based compensation expenses | 0.8 | 0.7 | ||||||||||
| Inventory adjustments | 1.0 | - | ||||||||||
| Change in product inventory | 2.8 | (2.9 | ) | |||||||||
| Overhead costs related to suspension of activities (cash) | 3.2 | - | ||||||||||
| Depreciation and amortization3 | 47.5 | 51.3 | ||||||||||
| Cost of sales4 | 194.3 | 201.0 | ||||||||||
| 1 Per ounce of gold produced. | |||||||||||
| 2 By-product credits are computed as revenue per financial statements, amortization of deferred revenue and pricing and volume adjustments. For more information, please see the realized price reconciliation table on page 33 of this MD&A. | |||||||||||
| 3 Depreciation is based on concentrate sold. | |||||||||||
| 4 As per consolidated interim financial statements. |
| Manitoba | Three months ended | |||||
| Jun. 30, 2025 | Mar. 31, 2025 | Jun. 30, 2024 | ||||
| Sustaining cash cost per ounce of gold produced | $ millions | $/oz | $ millions | $/oz | $ millions | $/oz |
| Gold cash cost, net of by-product credits | 30.7 | 710 | 22.7 | 376 | 33.5 | 771 |
| Cash sustaining capital expenditures | 13.6 | 315 | 15.1 | 250 | 17.1 | 392 |
| Sustaining cash cost per ounce of gold produced | 44.3 | 1,025 | 37.8 | 626 | 50.6 | 1,163 |
| Manitoba | Six months ended | |||
| Jun. 30, 2025 | Jun. 30, 2024 | |||
| Sustaining cash cost per ounce of gold produced | $ millions | $/oz | $ millions | $/oz |
| Gold cash cost, net of by-product credits | 53.4 | 515 | 75.3 | 751 |
| Cash sustaining capital expenditures | 28.7 | 278 | 29.2 | 291 |
| Sustaining cash cost per ounce of gold produced | 82.1 | 793 | 104.5 | 1,042 |
Combined Unit Cost
Combined unit cost ("unit cost") and zinc plant unit cost is a non-GAAP measure that management uses as a key performance indicator to assess the performance of Hudbay's mining and milling operations. Combined unit cost is calculated by dividing the cost of sales by mill throughput. This measure is utilized by management and investors to assess Hudbay's cost structure and margins and compare it to similar information provided by other companies in the industry. Unlike cash cost, this measure is not impacted by variability in by-product commodity prices since there are no by-product deductions; costs associated with profit-sharing and similar costs are excluded because of their correlation to external metal prices. In addition, the unit costs are reported in the functional currency of the operation which minimizes the impact of foreign currency fluctuations. In all, the unit cost measures provide an alternative perspective on operating cost performance with minimal impact from external market prices.
The tables below present a detailed combined unit cost for the Peru and Manitoba business units, and reconciliations between these measures to the most comparable IFRS measures of cost of sales for the three months ended June 30, 2025 and 2024 and March 31, 2025 and six months ended June 30, 2025 and 2024.
| Peru | Three months ended | Six months ended | |||||||||||||
| (in millions except ore tonnes milled and unit cost per tonne) | Jun. 30, 2025 | Mar. 31, 2025 |
Jun. 30, 2024 | Jun. 30, 2025 | Jun. 30, 2024 | ||||||||||
| Combined unit cost per tonne processed | |||||||||||||||
| Mining | 28.1 | 31.0 | 31.3 | 59.1 | 60.5 | ||||||||||
| Milling | 57.8 | 44.4 | 51.3 | 102.2 | 95.0 | ||||||||||
| G&A1 | 23.2 | 22.5 | 19.4 | 45.7 | 42.4 | ||||||||||
| Less: Other G&A2 | (6.4 | ) | (7.9 | ) | (4.1 | ) | (14.3 | ) | (11.8 | ) | |||||
| Unit cost | 102.7 | 90.0 | 97.9 | 192.7 | 186.1 | ||||||||||
| Tonnes ore milled | 7,559 | 8,114 | 7,719 | 15,673 | 15,797 | ||||||||||
| Combined unit cost per tonne | 13.59 | 11.09 | 12.68 | 12.29 | 11.78 | ||||||||||
| Reconciliation to IFRS: | |||||||||||||||
| Unit cost | 102.7 | 90.0 | 97.9 | 192.7 | 186.1 | ||||||||||
| Freight & other | 12.4 | 15.2 | 12.6 | 27.6 | 29.2 | ||||||||||
| Other G&A | 6.4 | 7.9 | 4.1 | 14.3 | 11.8 | ||||||||||
| Share-based compensation expenses | 0.2 | 0.1 | 0.2 | 0.3 | 0.3 | ||||||||||
| Inventory adjustments | 1.1 | 0.4 | - | 1.5 | - | ||||||||||
| Change in product inventory | 4.0 | 13.8 | 1.1 | 17.8 | 15.2 | ||||||||||
| Royalties | 1.0 | 1.1 | 0.9 | 2.1 | 3.0 | ||||||||||
| Depreciation and amortization | 56.0 | 68.2 | 58.9 | 124.2 | 129.9 | ||||||||||
| Cost of sales3 | 183.8 | 196.7 | 175.7 | 380.5 | 375.5 | ||||||||||
| 1 G&A as per cash cost reconciliation above. | ||||||||||||||
| 2 Other G&A primarily includes profit sharing costs. | ||||||||||||||
| 3 As per consolidated interim financial statements. |
| Manitoba | Three months ended | Six months ended | |||||||||||||
| (in millions except tonnes ore milled and unit cost per tonne) | Jun. 30, 2025 |
Mar. 31, 2025 |
Jun. 30, 2024 |
Jun. 30, 2025 |
Jun. 30, 2024 |
||||||||||
| Combined unit cost per tonne processed | |||||||||||||||
| Mining | 33.5 | 38.3 | 42.3 | 71.8 | 86.6 | ||||||||||
| Milling | 13.4 | 14.4 | 15.2 | 27.8 | 31.7 | ||||||||||
| G&A1 | 13.8 | 14.8 | 10.5 | 28.6 | 21.8 | ||||||||||
| Less: Other G&A related to profit sharing costs | (7.2 | ) | (7.2 | ) | (3.4 | ) | (14.4 | ) | (7.6 | ) | |||||
| Unit cost | 53.5 | 60.3 | 64.6 | 113.8 | 132.5 | ||||||||||
| USD/CAD implicit exchange rate | 1.38 | 1.43 | 1.38 | 1.41 | 1.37 | ||||||||||
| Unit cost - C$ | 73.9 | 86.5 | 89.3 | 160.4 | 181.1 | ||||||||||
| Tonnes ore milled | 307,138 | 404,410 | 397,426 | 711,548 | 787,193 | ||||||||||
| Combined unit cost per tonne - C$2 | 241 | 214 | 225 | 225 | 230 | ||||||||||
| Reconciliation to IFRS: | |||||||||||||||
| Unit cost | 53.5 | 60.3 | 64.6 | 113.8 | 132.5 | ||||||||||
| Freight & other | 5.1 | 5.7 | 5.7 | 10.8 | 11.8 | ||||||||||
| Other G&A related to profit sharing | 7.2 | 7.2 | 3.4 | 14.4 | 7.6 | ||||||||||
| Share-based compensation expenses | 0.5 | 0.3 | 0.4 | 0.8 | 0.7 | ||||||||||
| Inventory adjustments | 1.0 | - | - | 1.0 | - | ||||||||||
| Change in product inventory | 3.8 | (1.0 | ) | (2.4 | ) | 2.8 | (2.9 | ) | |||||||
| Overhead costs related to suspension of activities (cash) | 3.2 | - | - | 3.2 | - | ||||||||||
| Depreciation and amortization | 23.6 | 23.9 | 24.7 | 47.5 | 51.3 | ||||||||||
| Cost of sales3 | 97.9 | 96.4 | 96.4 | 194.3 | 201.0 | ||||||||||
| 1 G&A as per cash cost reconciliation above. | ||||||||||||||
| 2 Excludes $3.2 million or C$14 per tonne of overhead costs incurred during temporary suspension during the three months ended June 30, 2025 and $3.2 million or C$6 per tonne during the six month ended June 30, 2025. | ||||||||||||||
| 3 As per consolidated interim financial statements. |
| British Columbia | Three months ended | Six months ended | |||||||||||||
| (in millions except tonnes ore milled and unit cost per tonne) | Jun. 30, 2025 |
Mar. 31, 2025 |
Jun. 30, 2024 |
Jun. 30, 2025 |
Jun. 30, 2024 |
||||||||||
| Combined unit cost per tonne processed | |||||||||||||||
| Mining | 24.2 | 21.9 | 19.5 | 46.1 | 48.0 | ||||||||||
| Milling | 21.4 | 21.8 | 21.5 | 43.2 | 44.9 | ||||||||||
| G&A1 | 6.1 | 6.3 | 5.4 | 12.4 | 9.3 | ||||||||||
| Unit cost | 51.7 | 50.0 | 46.4 | 101.7 | 102.2 | ||||||||||
| USD/CAD implicit exchange rate | 1.38 | 1.43 | 1.36 | 1.40 | 1.35 | ||||||||||
| Unit cost - C$ | 71.1 | 71.7 | 63.5 | 142.2 | 138.8 | ||||||||||
| Tonnes ore milled | 2,900 | 2,761 | 3,232 | 5,661 | 6,413 | ||||||||||
| Combined unit cost per tonne - C$ | 24.51 | 25.98 | 19.65 | 25.12 | 21.65 | ||||||||||
| Reconciliation to IFRS: | |||||||||||||||
| Unit cost | 51.7 | 50.0 | 46.4 | 101.7 | 102.2 | ||||||||||
| Freight & other | 3.3 | 3.4 | 3.5 | 6.7 | 7.8 | ||||||||||
| Change in product inventory | 3.6 | (0.8 | ) | 11.3 | 2.8 | 7.3 | |||||||||
| Shared based compensation | 0.2 | 0.3 | - | 0.5 | - | ||||||||||
| Inventory adjustments | 1.4 | 0.8 | - | 2.2 | - | ||||||||||
| Royalties | 1.2 | 0.8 | 0.6 | 2.0 | 1.4 | ||||||||||
| Depreciation and amortization | 16.8 | 16.0 | 14.0 | 32.8 | 25.7 | ||||||||||
| Cost of sales2 | 78.2 | 70.5 | 75.8 | 148.7 | 144.4 | ||||||||||
| 1 G&A as per cash cost reconciliation above. | ||||||||||||||
| 2 As per consolidated interim financial statements. |
ACCOUNTING CHANGES AND CRITICAL ESTIMATES
New standards issued but not yet effective
For information on new standards issued but not yet effective, refer to note 3 of Hudbay's June 30, 2025 consolidated interim financial statements.
Estimates and judgements
The preparation of the consolidated interim financial statements in accordance with IFRS requires Hudbay to make judgements, estimates and assumptions that affect the application of accounting policies, reported amounts of assets and liabilities, disclosure of contingent assets and liabilities at the date of the consolidated interim financial statements, and reported amounts of revenue and expenses during the reporting period. Actual results may differ from these estimates.
Hudbay reviews these estimates and underlying assumptions on an ongoing basis based on its experience and other factors, including expectations of future events that Hudbay believes to be reasonable under the circumstances. Revisions to accounting estimates are recognized in the period in which the estimates are revised and in any future periods affected. Certain accounting estimates and judgements have been identified as being "critical" to the presentation of Hudbay's financial condition and results of operations because they require Hudbay to make subjective and/or complex judgments about matters that are inherently uncertain; or there is a reasonable likelihood that materially different amounts could be reported under different conditions or using different assumptions and estimates.
For more information on judgements and estimates, refer to note 2 of Hudbay's June 30, 2025 consolidated interim financial statements.
CHANGES IN INTERNAL CONTROL OVER FINANCIAL REPORTING
Management is responsible for establishing and maintaining adequate internal control over financial reporting ("ICFR"). ICFR is designed to provide reasonable assurance regarding the reliability of financial reporting and the preparation of consolidated interim financial statements for external purposes in accordance with IFRS.
Hudbay did not make any changes to ICFR during the three months ended June 30, 2025 that materially affected or are reasonably likely to materially affect Hudbay's ICFR.
NOTES TO READER
Forward-Looking Information
This MD&A contains forward-looking information within the meaning of applicable Canadian and United States securities legislation. All information contained in this MD&A, other than statements of current and historical fact, is forward-looking information. Often, but not always, forward-looking information can be identified by the use of words such as "plans", "expects", "budget", "guidance", "scheduled", "estimates", "forecasts", "strategy", "target", "intends", "objective", "goal", "understands", "anticipates" and "believes" (and variations of these or similar words) and statements that certain actions, events or results "may", "could", "would", "should", "might" "occur" or "be achieved" or "will be taken" (and variations of these or similar expressions). All of the forward-looking information in this MD&A is qualified by this cautionary note.
Forward-looking information includes, but is not limited to, statements with respect to Hudbay's production, cost and capital and exploration expenditure guidance and the potential impact thereon from wildfires and any related evacuation or government orders in Manitoba and British Columbia or social unrest in Peru, the Snow Lake operations' ability to ramp up to full production in a timely manner after its suspension of operations, expectations regarding reductions in discretionary spending and capital expenditures, Hudbay's ability to advance and complete the optimization of the Copper Mountain mine operation including with respect to the ongoing SAG mill conversion and configuration project, the implementation of stripping strategies and the expected benefits therefrom, the estimated timelines and pre-requisites for sanctioning the Copper World project, the consummation and timing of the JV Transaction, the satisfaction of the conditions precedent to the JV Transaction, including but not limited to receipt of regulatory approvals, expectations regarding the anticipated benefits of the JV Transaction to Hudbay, and the United States, the consummation and timing of the DFS, expectations regarding the results of any challenges to the permits for the Copper World project and the potential impact of recent policy decisions from the United States government, the expected benefits of the sanctioning of Copper World project, and the benefits, timing and consummation of the amended Wheaton Stream, the expected benefits of Manitoba growth initiatives, including the use of the exploration drift at the 1901 deposit, and the potential utilization of excess capacity at the Stall mill, Hudbay's future deleveraging strategies and Hudbay's ability to deleverage and repay debt as needed, expectations regarding Hudbay's cash balance and liquidity, expectations regarding tax synergies, expectations regarding the ability to conduct exploration work and execute on exploration programs on its properties and to advance related drill plans, including the advancement of the exploration program at Maria Reyna and Caballito and the status and anticipated timing of the related drill permit application process, expectations regarding the prospective nature of the Maria Reyna and Caballito properties, the ability to continue mining higher-grade ore in the Pampacancha pit and Hudbay's expectations resulting therefrom, Hudbay's evaluation and assessment of opportunities to reprocess tailings using various metallurgical technologies, the anticipated impact of brownfield and greenfield growth projects on Hudbay's performance, anticipated expansion opportunities and extension of mine life in Snow Lake and Hudbay's ability to find a new anchor deposit near Hudbay's Snow Lake operations, anticipated future drill programs and exploration activities and any results expected therefrom, anticipated mine plans, anticipated metals prices and the anticipated sensitivity of Hudbay's financial performance to metals prices, events that may affect Hudbay's operations and development projects, anticipated cash flows from operations and related liquidity requirements, the anticipated effect of external factors on revenue, such as commodity prices, estimation of mineral reserves and resources, mine life projections, reclamation costs, economic outlook, government regulation of mining operations, and business and acquisition strategies. Forward-looking information is not, and cannot be, a guarantee of future results or events. Forward-looking information is based on, among other things, opinions, assumptions, estimates and analyses that, while considered reasonable by Hudbay at the date the forward-looking information is provided, inherently are subject to significant risks, uncertainties, contingencies and other factors that may cause actual results and events to be materially different from those expressed or implied by the forward-looking information.
The material factors or assumptions that Hudbay has identified and were applied in drawing conclusions or making forecasts or projections set out in the forward-looking information include, but are not limited to:
- the ability to achieve production, cost and capital and exploration expenditure guidance;
- no significant interruptions to Hudbay's operations due to social or political unrest in the regions Hudbay operates, including the navigation of the complex political and social environment in Peru and the resolution of grievances raised by local communities and their residents;
- the ability to ramp up to full production in a timely manner following the suspension of operations in Manitoba;
- the closing of the JV Transaction; - no interruptions to Hudbay's plans for advancing the Copper World project, including with respect to any successful challenges to the Copper World permits;
- Hudbay's ability to successfully advance and complete the optimization of the Copper Mountain operations, obtain required permits and develop and maintain good relations with key stakeholders;
- the ability to execute on its exploration plans and to advance related drill plans;
- the ability to advance the exploration program at the Maria Reyna and Caballito properties;
- the success of mining, processing, exploration and development activities;
- the scheduled maintenance and availability of Hudbay's processing facilities;
- the accuracy of geological, mining and metallurgical estimates;
- anticipated metals prices and the costs of production;
- the supply and demand for metals Hudbay produces;
- the supply and availability of all forms of energy and fuels at reasonable prices;
- no significant unanticipated operational or technical difficulties;
- no significant interruptions to operations due to adverse effects from extreme weather events, including forest fires that have affected and may continue to affect the regions in which Hudbay operates;
- the execution of Hudbay's business and growth strategies, including the success of its strategic investments and initiatives;
- the availability of additional financing, if needed;
- the ability to deleverage and repay debt, as needed;
- the ability to complete project targets on time and on budget and other events that may affect Hudbay's ability to develop Hudbay's projects;
- the timing and receipt of various regulatory and governmental approvals;
- the availability of personnel for Hudbay's exploration, development and operational projects and ongoing employee relations;
- maintaining good relations with the employees at Hudbay's operations;
- maintaining good relations with the labour unions that represent certain of Hudbay employees in Manitoba and Peru;
- maintaining good relations with the communities in which Hudbay operates, including the neighbouring Indigenous communities and local governments;
- no significant unanticipated challenges with stakeholders at Hudbay's various projects;
- no significant unanticipated events or changes relating to regulatory, environmental, health and safety matters;
- no contests over title to Hudbay's properties, including as a result of rights or claimed rights of Indigenous peoples or challenges to the validity of Hudbay's unpatented mining claims;
- the timing and possible outcome of pending litigation and no significant unanticipated litigation;
- certain tax matters, including, but not limited to current tax laws and regulations, changes in taxation policies and the refund of certain value added taxes from the Canadian and Peruvian governments; and
- no significant and continuing adverse changes in general economic conditions or conditions in the financial markets (including commodity prices and foreign exchange rates).
The risks, uncertainties, contingencies and other factors that may cause actual results to differ materially from those expressed or implied by the forward-looking information may include, but are not limited to, risks associated with satisfying the conditions to the closing of the JV Transaction, including the timing, receipt and any conditions associated with regulatory approvals, risks associated with reaching a definitive agreement with Wheaton in respect of the enhanced precious metals stream, risks related to the failure to effectively advance and complete the optimization of the Copper Mountain mine operations including with respect to the ongoing SAG mill conversion and configuration project, political and social risks in the regions Hudbay operates, including the complex political and social environment in Peru and potential disruptions to operations arising from community protests and grievances, risks generally associated with the mining industry and the current geopolitical environment, including future commodity prices, the potential implementation or expansion of tariffs, currency and interest rate fluctuations, energy and consumable prices, supply chain constraints and general cost escalation in the current inflationary environment, uncertainties related to the development and operation of Hudbay's projects, the risk of an indicator of impairment or impairment reversal relating to a material mineral property, risks related to the Copper World project, including in relation to project delivery and financing risks, risks related to the Lalor mine plan, including the ability to convert inferred mineral resource estimates to higher confidence categories, dependence on key personnel and employee and union relations, risks related to political or social instability, unrest or change, risks in respect of Indigenous and community relations, rights and title claims, operational risks and hazards, including the cost of maintaining and upgrading Hudbay's tailings management facilities and any unanticipated environmental, industrial and geological events and developments and the inability to insure against all risks (including any unanticipated significant interruptions to operations due to adverse effects from extreme weather events), failure of plant, equipment, processes, transportation and other infrastructure to operate as anticipated, compliance with government and environmental regulations, including permitting requirements and anti-bribery legislation, depletion of Hudbay's reserves, volatile financial markets and interest rates that may affect Hudbay's ability to obtain additional financing on acceptable terms, the failure to obtain required approvals or clearances from government authorities on a timely basis, uncertainties related to the geology, continuity, grade and estimates of mineral reserves and resources, and the potential for variations in grade and recovery rates, uncertain costs of reclamation activities, Hudbay's ability to comply with Hudbay's pension and other post-retirement obligations, Hudbay's ability to abide by the covenants in Hudbay's debt instruments and other material contracts, tax refunds, hedging transactions, as well as the risks discussed under the heading "Risk Factors" in Hudbay's most recent Annual Information Form which is available on the Company's SEDAR+ profile at www.sedarplus.ca and the Company's EDGAR profile at www.sec.gov.
Should one or more risk, uncertainty, contingency or other factor materialize or should any factor or assumption prove incorrect, actual results could vary materially from those expressed or implied in the forward-looking information. Accordingly, you should not place undue reliance on forward-looking information. Hudbay does not assume any obligation to update or revise any forward-looking information after the date of this MD&A or to explain any material difference between subsequent actual events and any forward-looking information, except as required by applicable law.
Note to United States Investors
This MD&A has been prepared in accordance with the requirements of the securities laws in effect in Canada, which may differ materially from the requirements of United States securities laws applicable to U.S. issuers.
Qualified Persons and NI 43-101
The technical and scientific information in this MD&A related to Hudbay's material mineral projects other than the Copper Mountain mine has been approved by Olivier Tavchandjian, P. Geo, Senior Vice President, Exploration and Technical Services. Mr. Tavchandjian is a qualified person pursuant to National Instrument 43-101 - Standards of Disclosure for Mineral Projects ("NI 43-101").
The technical and scientific information in this MD&A related to the Copper Mountain mine has been approved by Marc-Andre Brulotte, P. Geo, Director, Global Exploration and Resource Evaluation. Mr. Brulotte is a qualified person pursuant to NI 43-101.
For a description of the key assumptions, parameters and methods used to estimate mineral reserves and resources at Hudbay's material mineral properties, as well as data verification procedures and a general discussion of the extent to which the estimates of scientific and technical information may be affected by any known environmental, permitting, legal title, taxation, sociopolitical, marketing or other relevant factors, please see the technical reports for Hudbay's material properties as filed by the Company on SEDAR+ at www.sedarplus.ca and EDGAR at www.sec.gov.
SUMMARY OF HISTORICAL RESULTS
The following unaudited tables set out a summary of quarterly and annual results for the Company.
| Q2 2025 | Q1 2025 | 2024 4 | Q4 2024 | Q3 2024 | Q2 2024 | Q1 2024 | 2023 4 | Q4 2023 | Q3 2023 | Q2 2023 | ||||||||||||||||||||||||
| Consolidated Financial Condition ($ millions) | ||||||||||||||||||||||||||||||||||
| Cash and cash equivalents and short-term investments | $ | 625.5 | $ | 582.6 | $ | 581.8 | $ | 581.8 | $ | 483.3 | $ | 523.8 | $ | 284.4 | $ | 249.8 | $ | 249.8 | $ | 245.2 | $ | 179.7 | ||||||||||||
| Total long-term debt | 1,059.6 | 1,108.7 | 1,107.5 | 1,107.5 | 1,108.9 | 1,155.6 | 1,278.6 | 1,287.5 | 1,287.5 | 1,377.4 | 1,370.7 | |||||||||||||||||||||||
| Net debt1 | 434.1 | 526.1 | 525.7 | 525.7 | 625.6 | 631.8 | 994.2 | 1,037.7 | 1,037.7 | 1,132.2 | 1,190.9 | |||||||||||||||||||||||
| Free cash flow | 87.8 | 87.4 | 357.1 | 148.9 | 88.4 | 32.5 | 87.2 | 320.2 | 160.5 | 111.6 | 9.0 | |||||||||||||||||||||||
| Consolidated Financial Performance ($ millions except per share amounts) | ||||||||||||||||||||||||||||||||||
| Revenue | $ | 536.4 | $ | 594.9 | $ | 2,021.2 | $ | 584.9 | $ | 485.8 | $ | 425.5 | $ | 525.0 | $ | 1,690.0 | $ | 602.2 | $ | 480.5 | $ | 312.2 | ||||||||||||
| Cost of sales | 359.9 | 363.6 | 1,467.4 | 400.5 | 346.0 | 347.9 | 373.0 | 1,297.5 | 405.4 | 374.1 | 289.3 | |||||||||||||||||||||||
| Earnings (loss) before tax | 153.1 | 171.3 | 251.6 | 103.7 | 79.7 | 0.4 | 67.8 | 151.8 | 81.0 | 84.1 | (30.7 | ) | ||||||||||||||||||||||
| Net income (loss) earnings | 114.7 | 99.2 | 67.8 | 19.3 | 50.4 | (20.3 | ) | 18.5 | 69.5 | 33.5 | 45.5 | (14.9 | ) | |||||||||||||||||||||
| Net earnings (loss) attributable to owners1 | 117.7 | 100.4 | 76.7 | 21.2 | 49.8 | (16.5 | ) | 22.3 | 66.4 | 30.7 | 45.1 | (14.9 | ) | |||||||||||||||||||||
| Basic and diluted earnings (loss) per share attributable to owners | $ | 0.30 | $ | 0.25 | $ | 0.20 | $ | 0.05 | $ | 0.13 | $ | (0.04 | ) | $ | 0.06 | $ | 0.22 | $ | 0.09 | $ | 0.13 | $ | (0.05 | ) | ||||||||||
| Adjusted earnings (loss) per share attributable to owners 1 | $ | 0.19 | $ | 0.24 | $ | 0.48 | $ | 0.18 | $ | 0.13 | $ | 0.00 | $ | 0.17 | $ | 0.23 | $ | 0.20 | $ | 0.07 | $ | (0.07 | ) | |||||||||||
| Operating cash flow before change in non-cash working capital | 193.9 | 163.5 | 691.1 | 231.5 | 188.3 | 123.7 | 147.5 | 570.0 | 246.5 | 182.0 | 55.9 | |||||||||||||||||||||||
| Adjusted EBITDA 1 | 245.2 | 287.2 | 823.3 | 257.3 | 206.2 | 145.0 | 215.0 | 647.8 | 274.4 | 190.7 | 81.2 | |||||||||||||||||||||||
| Consolidated Operational Performance | ||||||||||||||||||||||||||||||||||
| Contained metal in concentrate and doré produced 2 | ||||||||||||||||||||||||||||||||||
| Copper | tonnes | 29,956 | 30,958 | 137,943 | 43,262 | 31,354 | 28,578 | 34,749 | 131,691 | 45,450 | 41,964 | 21,715 | ||||||||||||||||||||||
| Gold | ounces | 56,271 | 73,784 | 332,240 | 94,161 | 89,073 | 58,614 | 90,392 | 310,429 | 112,776 | 101,417 | 48,996 | ||||||||||||||||||||||
| Silver | ounces | 814,989 | 919,775 | 3,983,851 | 1,311,658 | 985,569 | 738,707 | 947,917 | 3,575,234 | 1,197,082 | 1,063,032 | 612,310 | ||||||||||||||||||||||
| Zinc | tonnes | 5,130 | 6,265 | 33,339 | 8,385 | 8,069 | 8,087 | 8,798 | 34,642 | 5,747 | 10,291 | 8,758 | ||||||||||||||||||||||
| Molybdenum | tonnes | 375 | 397 | 1,323 | 195 | 362 | 369 | 397 | 1,566 | 397 | 466 | 414 | ||||||||||||||||||||||
| Payable metal in concentrate and doré sold | ||||||||||||||||||||||||||||||||||
| Copper | tonnes | 30,354 | 31,768 | 125,094 | 37,927 | 27,760 | 25,799 | 33,608 | 124,996 | 44,006 | 39,371 | 23,078 | ||||||||||||||||||||||
| Gold | ounces | 62,466 | 75,092 | 335,342 | 92,734 | 73,232 | 61,295 | 108,081 | 276,893 | 104,840 | 74,799 | 47,533 | ||||||||||||||||||||||
| Silver | ounces | 894,160 | 1,006,968 | 3,549,816 | 1,150,518 | 663,413 | 667,036 | 1,068,848 | 3,145,166 | 1,048,877 | 748,955 | 805,448 | ||||||||||||||||||||||
| Zinc 3 | tonnes | 2,871 | 4,857 | 25,120 | 5,261 | 8,607 | 5,133 | 6,119 | 28,779 | 7,385 | 7,125 | 8,641 | ||||||||||||||||||||||
| Molybdenum | tonnes | 427 | 448 | 1,287 | 182 | 343 | 347 | 415 | 1,462 | 468 | 426 | 314 | ||||||||||||||||||||||
| Cash cost 1 | $/lb | $ | (0.02 | ) | $ | (0.45 | ) | $ | 0.46 | $ | 0.45 | $ | 0.18 | $ | 1.14 | $ | 0.16 | $ | 0.80 | $ | 0.16 | $ | 1.10 | $ | 1.60 | |||||||||
| Sustaining cash cost 1 | $/lb | $ | 1.65 | $ | 0.72 | $ | 1.62 | $ | 1.37 | $ | 1.71 | $ | 2.65 | $ | 1.00 | $ | 1.72 | $ | 1.09 | $ | 1.89 | $ | 2.73 | |||||||||||
| All-in sustaining cash cost 1 | $/lb | $ | 2.03 | $ | 0.97 | $ | 1.88 | $ | 1.53 | $ | 1.95 | $ | 3.07 | $ | 1.29 | $ | 1.92 | $ | 1.31 | $ | 2.04 | $ | 2.98 | |||||||||||
1Net debt, adjusted earnings (loss) per share attributable to owners, adjusted EBITDA, cash cost, sustaining cash cost and all-in sustaining cash cost per pound of copper produced, net of by-product credits, are non-GAAP financial performance measures with no standardized definition under IFRS. For further information and a detailed reconciliation, please see discussion under the "Non-GAAP Financial Performance Measures" section of this MD&A. The above table sets forth selected non-GAAP financial performance measures for each of the Company's nine most recently completed quarters and three most recently completed years; detailed reconciliations for non-comparable prior periods can be found in Hudbay's MD&A for these prior periods in the "Non-GAAP Financial Performance Measures" section of these documents.
2 Metal reported in concentrate is prior to deductions associated with smelter contract terms.
3 Includes refined zinc metal sold.
4 Annual consolidated results may not calculate based on amounts presented in this table due to rounding.
| Q2 2025 | Q1 2025 | 2024 4 | Q4 2024 | Q3 2024 | Q2 2024 | Q1 2024 | 2023 4 | Q4 2023 | Q3 2023 | Q2 2023 | ||||||||||||||||||||||||
| Peru Operations | ||||||||||||||||||||||||||||||||||
| Constancia ore mined1 | tonnes | 6,735,316 | 8,628,279 | 15,046,190 | 4,186,058 | 3,022,931 | 5,277,654 | 2,559,547 | 9,265,954 | 973,176 | 1,242,198 | 3,647,399 | ||||||||||||||||||||||
| Copper | % | 0.34 | 0.28 | 0.34 | 0.40 | 0.36 | 0.29 | 0.31 | 0.32 | 0.30 | 0.30 | 0.31 | ||||||||||||||||||||||
| Gold | g/tonne | 0.03 | 0.03 | 0.04 | 0.04 | 0.04 | 0.03 | 0.04 | 0.04 | 0.04 | 0.04 | 0.04 | ||||||||||||||||||||||
| Silver | g/tonne | 3.26 | 3.14 | 3.08 | 3.88 | 3.20 | 2.50 | 2.79 | 2.53 | 2.26 | 2.91 | 2.49 | ||||||||||||||||||||||
| Molybdenum | % | 0.02 | 0.02 | 0.01 | 0.02 | 0.02 | 0.01 | 0.01 | 0.01 | 0.01 | 0.01 | 0.01 | ||||||||||||||||||||||
| Pampacancha ore mined1 | tonnes | 762,172 | 389,189 | 9,317,499 | 4,037,264 | 1,777,092 | 1,288,789 | 2,214,354 | 14,756,416 | 5,556,613 | 5,894,013 | 2,408,495 | ||||||||||||||||||||||
| Copper | % | 0.26 | 0.44 | 0.55 | 0.63 | 0.48 | 0.41 | 0.56 | 0.51 | 0.56 | 0.53 | 0.36 | ||||||||||||||||||||||
| Gold | g/tonne | 0.24 | 0.26 | 0.32 | 0.38 | 0.27 | 0.20 | 0.32 | 0.33 | 0.32 | 0.30 | 0.34 | ||||||||||||||||||||||
| Silver | g/tonne | 4.59 | 3.68 | 5.61 | 6.43 | 6.23 | 3.83 | 4.64 | 4.28 | 4.84 | 4.22 | 2.81 | ||||||||||||||||||||||
| Molybdenum | % | 0.01 | 0.01 | 0.01 | 0.00 | 0.01 | 0.02 | 0.02 | 0.01 | 0.01 | 0.02 | 0.02 | ||||||||||||||||||||||
| Strip Ratio | 1.47 | 1.02 | 1.78 | 1.22 | 2.62 | 1.74 | 1.95 | 1.51 | 1.26 | 1.36 | 1.74 | |||||||||||||||||||||||
| Ore milled | tonnes | 7,559,047 | 8,114,024 | 31,933,624 | 7,999,453 | 8,137,248 | 7,718,962 | 8,077,962 | 30,720,929 | 7,939,044 | 7,895,109 | 7,223,048 | ||||||||||||||||||||||
| Copper | % | 0.34 | 0.30 | 0.36 | 0.48 | 0.32 | 0.30 | 0.36 | 0.39 | 0.48 | 0.43 | 0.31 | ||||||||||||||||||||||
| Gold | g/tonne | 0.05 | 0.05 | 0.14 | 0.20 | 0.11 | 0.07 | 0.15 | 0.16 | 0.25 | 0.21 | 0.09 | ||||||||||||||||||||||
| Silver | g/tonne | 3.58 | 3.22 | 3.84 | 5.28 | 3.70 | 2.85 | 3.48 | 3.62 | 4.20 | 3.75 | 2.78 | ||||||||||||||||||||||
| Molybdenum | % | 0.01 | 0.01 | 0.01 | 0.01 | 0.01 | 0.01 | 0.01 | 0.01 | 0.01 | 0.02 | 0.01 | ||||||||||||||||||||||
| Copper recovery | % | 84.5 | 84.6 | 85.0 | 87.8 | 82.6 | 83.1 | 84.9 | 84.2 | 87.4 | 85.2 | 80.0 | ||||||||||||||||||||||
| Gold recovery | % | 56.0 | 56.5 | 70.7 | 73.3 | 68.1 | 61.4 | 73.4 | 71.8 | 77.6 | 74.8 | 61.1 | ||||||||||||||||||||||
| Silver recovery | % | 63.5 | 66.0 | 68.8 | 71.4 | 67.0 | 63.9 | 70.7 | 70.0 | 78.0 | 73.2 | 65.1 | ||||||||||||||||||||||
| Molybdenum recovery | % | 38.7 | 35.7 | 41.7 | 37.1 | 39.0 | 46.3 | 43.2 | 35.8 | 33.6 | 37.2 | 40.5 | ||||||||||||||||||||||
| Contained metal in concentrate | ||||||||||||||||||||||||||||||||||
| Copper | tonnes | 21,710 | 20,293 | 99,001 | 33,988 | 21,220 | 19,217 | 24,576 | 100,487 | 33,207 | 29,081 | 17,682 | ||||||||||||||||||||||
| Gold | ounces | 7,366 | 7,869 | 98,226 | 38,079 | 20,331 | 10,672 | 29,144 | 114,218 | 49,418 | 40,596 | 12,998 | ||||||||||||||||||||||
| Silver | ounces | 551,979 | 554,692 | 2,708,262 | 969,502 | 648,209 | 450,833 | 639,718 | 2,505,229 | 836,208 | 697,211 | 419,642 | ||||||||||||||||||||||
| Molybdenum | tonnes | 375 | 397 | 1,323 | 195 | 362 | 369 | 397 | 1,566 | 397 | 466 | 414 | ||||||||||||||||||||||
| Payable metal sold | ||||||||||||||||||||||||||||||||||
| Copper | tonnes | 21,418 | 22,890 | 88,138 | 28,775 | 18,803 | 16,806 | 23,754 | 96,213 | 31,200 | 27,490 | 21,207 | ||||||||||||||||||||||
| Gold | ounces | 9,721 | 14,362 | 103,364 | 37,459 | 9,795 | 13,433 | 42,677 | 97,176 | 38,114 | 32,757 | 14,524 | ||||||||||||||||||||||
| Silver | ounces | 616,578 | 714,654 | 2,343,820 | 824,613 | 365,198 | 400,302 | 753,707 | 2,227,419 | 703,679 | 460,001 | 671,532 | ||||||||||||||||||||||
| Molybdenum | tonnes | 427 | 448 | 1,287 | 182 | 343 | 347 | 415 | 1,462 | 468 | 426 | 314 | ||||||||||||||||||||||
| Unit cost 2,3 | $/tonne | $ | 13.59 | $ | 11.09 | $ | 12.91 | $ | 15.25 | $ | 12.78 | $ | 12.68 | $ | 10.92 | $ | 12.47 | $ | 12.24 | $ | 12.20 | $ | 14.07 | |||||||||||
| Peru cash cost3 | $/lb | $ | 1.45 | $ | 1.11 | $ | 1.18 | $ | 1.00 | $ | 1.80 | $ | 1.78 | $ | 0.43 | $ | 1.07 | $ | 0.54 | $ | 0.83 | $ | 2.14 | |||||||||||
| Peru sustaining cash cost3 | $/lb | $ | 2.63 | $ | 1.92 | $ | 1.86 | $ | 1.48 | $ | 2.78 | $ | 2.60 | $ | 1.02 | $ | 1.81 | $ | 1.21 | $ | 1.51 | $ | 3.06 | |||||||||||
| 1 Reported tonnes and grade for ore mined are estimates based on mine plan assumptions and may not fully reconcile to ore milled. | |||||||||||||||||||||||||||||||||
| 2 Reflects combined mine, mill and general and administrative ("G&A") costs per tonne of ore milled. Reflects the deduction of expected capitalized stripping costs. | |||||||||||||||||||||||||||||||||
| 3 Combined unit costs, cash cost, and sustaining cash cost per pound of copper produced, net of by-product credits, are non-GAAP financial performance measures with no standardized definition under IFRS. For further information and a detailed reconciliation, please see the discussion under the "Non-GAAP Financial Performance Measures" section of this MD&A. The above table sets forth selected non-GAAP financial performance measures for each of the Company's nine most recently completed quarters and three most recently completed years; detailed reconciliations for non-comparable prior periods can be found in Hudbay's MD&A for these prior periods in the "Non-GAAP Financial Performance Measures" section of these documents. | |||||||||||||||||||||||||||||||||
| 4 Annual consolidated results may not calculate based on amounts presented in this table due to rounding. |
| Q2 2025 | Q1 2025 | 2024 1 | Q4 2024 | Q3 2024 | Q2 2024 | Q1 2024 | 2023 1 | Q4 2023 | Q3 2023 | Q2 2023 | ||
| Manitoba Operations | ||||||||||||
| Lalor ore mined | tonnes | 303,062 | 384,234 | 1,626,935 | 422,454 | 411,295 | 385,478 | 407,708 | 1,526,729 | 372,384 | 367,491 | 413,255 |
| Gold | g/tonne | 4.97 | 5.46 | 4.68 | 4.61 | 5.45 | 3.75 | 4.84 | 4.74 | 5.92 | 5.08 | 4.07 |
| Copper | % | 0.61 | 0.95 | 0.85 | 0.95 | 0.91 | 0.69 | 0.84 | 0.86 | 1.04 | 1.02 | 0.81 |
| Zinc | % | 2.46 | 2.42 | 2.84 | 2.95 | 2.73 | 2.76 | 2.92 | 3.00 | 2.20 | 3.31 | 3.14 |
| Silver | g/tonne | 29.94 | 31.23 | 27.14 | 31.91 | 30.45 | 22.29 | 23.44 | 24.51 | 28.92 | 27.80 | 23.27 |
| Stall Concentrator: | ||||||||||||
| Ore milled | tonnes | 144,204 | 215,286 | 893,510 | 222,004 | 222,621 | 229,527 | 219,358 | 965,567 | 228,799 | 255,516 | 238,633 |
| Gold | g/tonne | 3.19 | 3.86 | 3.42 | 3.36 | 4.23 | 3.02 | 3.07 | 3.45 | 4.22 | 3.70 | 3.12 |
| Copper | % | 0.56 | 0.76 | 0.71 | 0.73 | 0.89 | 0.59 | 0.64 | 0.74 | 0.73 | 0.77 | 0.85 |
| Zinc | % | 4.20 | 3.44 | 4.33 | 4.62 | 4.12 | 4.05 | 4.54 | 4.36 | 3.20 | 4.88 | 4.47 |
| Silver | g/tonne | 29.55 | 29.53 | 26.54 | 29.90 | 30.20 | 21.74 | 24.46 | 24.19 | 28.63 | 28.82 | 22.15 |
| Gold recovery | % | 67.9 | 70.1 | 68.6 | 69.6 | 70.5 | 65.5 | 68.0 | 64.8 | 67.5 | 67.8 | 59.9 |
| Copper recovery | % | 84.7 | 88.3 | 87.4 | 84.4 | 88.3 | 85.4 | 91.7 | 90.4 | 92.0 | 93.9 | 88.5 |
| Zinc recovery | % | 84.8 | 84.7 | 86.2 | 81.7 | 88.1 | 87.1 | 88.4 | 82.2 | 78.5 | 82.6 | 82.2 |
| Silver recovery | % | 51.9 | 58.7 | 56.8 | 55.1 | 57.8 | 54.2 | 59.8 | 61.4 | 61.8 | 64.9 | 60.3 |
| New Britannia Concentrator: | ||||||||||||
| Ore milled | tonnes | 162,934 | 189,124 | 715,198 | 185,592 | 191,298 | 167,899 | 170,409 | 596,912 | 165,038 | 146,927 | 141,905 |
| Gold | g/tonne | 6.48 | 7.37 | 6.29 | 5.99 | 6.77 | 5.31 | 7.03 | 6.76 | 8.03 | 6.93 | 5.82 |
| Copper | % | 0.65 | 1.18 | 1.04 | 1.17 | 0.93 | 0.94 | 1.13 | 1.03 | 1.46 | 1.22 | 0.77 |
| Zinc | % | 1.01 | 1.00 | 0.99 | 1.08 | 1.12 | 0.92 | 0.82 | 0.84 | 0.85 | 0.90 | 0.85 |
| Silver | g/tonne | 30.29 | 33.35 | 27.78 | 33.97 | 30.24 | 24.42 | 21.60 | 25.11 | 27.97 | 23.88 | 25.79 |
| Gold recovery - concentrate and doré | % | 89.4 | 90.3 | 89.7 | 90.2 | 90.0 | 90.0 | 88.6 | 88.6 | 89.0 | 88.8 | 88.6 |
| Copper recovery | % | 87.4 | 90.3 | 93.6 | 91.3 | 92.8 | 94.4 | 96.2 | 93.3 | 91.6 | 97.4 | 91.2 |
| Silver recovery - concentrate and doré | % | 78.0 | 81.6 | 80.9 | 79.6 | 79.9 | 83.1 | 82.0 | 81.5 | 83.2 | 82.0 | 79.6 |
| 1 Annual consolidated results may not calculate based on amounts presented in this table due to rounding. | ||||||||||||
| Q2 2025 | Q1 2025 | 2024 4 | Q4 2024 | Q3 2024 | Q2 2024 | Q1 2024 | 2023 4 | Q4 2023 | Q3 2023 | Q2 2023 | ||||||||||||||||||||||||
| Manitoba Operations (continued) | ||||||||||||||||||||||||||||||||||
| Total Manitoba contained metal in concentrate and doré produced5 | ||||||||||||||||||||||||||||||||||
| Gold | ounces | 43,235 | 60,354 | 214,225 | 51,438 | 62,468 | 43,488 | 56,831 | 187,363 | 59,863 | 56,213 | 35,253 | ||||||||||||||||||||||
| Copper | tonnes | 1,612 | 3,469 | 12,536 | 3,347 | 3,398 | 2,642 | 3,149 | 12,154 | 3,735 | 3,580 | 2,794 | ||||||||||||||||||||||
| Zinc | tonnes | 5,130 | 6,265 | 33,339 | 8,385 | 8,069 | 8,087 | 8,798 | 34,642 | 5,747 | 10,291 | 8,758 | ||||||||||||||||||||||
| Silver | ounces | 197,970 | 285,603 | 995,090 | 283,223 | 281,397 | 210,647 | 219,823 | 851,723 | 255,579 | 264,752 | 180,750 | ||||||||||||||||||||||
| Total Manitoba payable metal sold in concentrate and doré | ||||||||||||||||||||||||||||||||||
| Gold | ounces | 46,932 | 55,765 | 212,243 | 50,239 | 57,238 | 42,763 | 62,003 | 171,297 | 63,635 | 36,713 | 33,009 | ||||||||||||||||||||||
| Copper | tonnes | 2,133 | 2,725 | 11,602 | 3,321 | 2,931 | 2,429 | 2,921 | 10,708 | 3,687 | 2,925 | 1,871 | ||||||||||||||||||||||
| Zinc1 | tonnes | 2,871 | 4,857 | 25,120 | 5,261 | 8,607 | 5,133 | 6,119 | 28,779 | 7,385 | 7,125 | 8,641 | ||||||||||||||||||||||
| Silver | ounces | 209,594 | 232,255 | 956,460 | 282,158 | 244,974 | 197,486 | 231,841 | 728,304 | 246,757 | 197,952 | 133,916 | ||||||||||||||||||||||
| Combined unit cost 2,3 | C$/tonne | $ | 241 | $ | 214 | $ | 226 | $ | 233 | $ | 211 | $ | 225 | $ | 235 | $ | 217 | $ | 216 | $ | 217 | $ | 220 | |||||||||||
| Gold cash cost 3 | $/oz | $ | 710 | $ | 376 | $ | 606 | $ | 607 | $ | 372 | $ | 771 | $ | 736 | $ | 727 | $ | 434 | $ | 670 | $ | 1,097 | |||||||||||
| Sustaining gold cash cost 3 | $/oz | $ | 1,025 | $ | 626 | $ | 868 | $ | 908 | $ | 553 | $ | 1,163 | $ | 950 | $ | 1,077 | $ | 788 | $ | 939 | $ | 1,521 | |||||||||||
| 1 Includes refined zinc metal sold. | |||||||||||||||||||||||||||||||||
| 2 Reflects combined mine, mill and G&A costs per tonne of milled ore. | |||||||||||||||||||||||||||||||||
| 3 Combined unit costs, cash cost, and sustaining cash cost per pound of copper produced, cash cost, and sustaining cash cost per ounce of gold produced, net of by-product credits, are non-GAAP financial performance measures with no standardized definition under IFRS. For further information and a detailed reconciliation, please see the discussion under the "Non-GAAP Financial Performance Measures" section of this MD&A. The above table sets forth selected non-GAAP financial performance measures for each of the Company's nine most recently completed quarters and three most recently completed years; detailed reconciliations for non-comparable prior periods can be found in Hudbay's MD&A for these prior periods in the "Non-GAAP Financial Performance Measures" section of these documents. | |||||||||||||||||||||||||||||||||
| 4 Annual consolidated results may not calculate based on amounts presented in this table due to rounding. 5 Metal reported in concentrate is prior to deductions associated with smelter terms |
| Q2 2025 | Q1 2025 | 2024 6 | Q4 2024 | Q3 2024 | Q2 2024 | Q1 2024 | 2023 6 | Q4 2023 | Q3 2023 | Q2 2023 5 | ||||||||||||||||||||||||
| British Columbia Operations 4 | ||||||||||||||||||||||||||||||||||
| Ore mined1 | tonnes | 2,509,969 | 2,648,094 | 11,360,125 | 2,374,044 | 3,098,863 | 2,164,722 | 3,722,496 | 6,975,389 | 2,627,398 | 3,792,568 | 555,423 | ||||||||||||||||||||||
| Strip Ratio | 7.50 | 6.73 | 5.98 | 7.36 | 6.05 | 7.61 | 4.10 | 3.82 | 5.34 | 2.96 | - | |||||||||||||||||||||||
| Ore milled | tonnes | 2,900,008 | 2,760,986 | 12,656,679 | 2,880,927 | 3,363,176 | 3,232,427 | 3,180,149 | 6,862,152 | 3,261,891 | 3,158,006 | 442,255 | ||||||||||||||||||||||
| Copper | % | 0.28 | 0.33 | 0.25 | 0.26 | 0.24 | 0.25 | 0.27 | 0.35 | 0.33 | 0.36 | - | ||||||||||||||||||||||
| Gold | g/tonne | 0.09 | 0.10 | 0.08 | 0.09 | 0.09 | 0.07 | 0.07 | 0.07 | 0.06 | 0.08 | - | ||||||||||||||||||||||
| Silver | g/tonne | 0.97 | 1.28 | 0.96 | 0.92 | 0.73 | 1.01 | 1.19 | 1.36 | 1.36 | 1.40 | 1 | ||||||||||||||||||||||
| Copper recovery | % | 81.0 | 78.3 | 82.4 | 79.5 | 84.1 | 82.3 | 83.4 | 79.7 | 78.8 | 80.90 | 78 | ||||||||||||||||||||||
| Gold recovery | % | 68.2 | 63.4 | 60.5 | 55.8 | 67.3 | 57.2 | 61.8 | 55.9 | 54.1 | 56.10 | 68 | ||||||||||||||||||||||
| Silver recovery | % | 71.8 | 69.8 | 71.8 | 69.0 | 71.2 | 73.9 | 72.4 | 73.0 | 73.8 | 71.30 | 79 | ||||||||||||||||||||||
| Contained metal in concentrate produced | ||||||||||||||||||||||||||||||||||
| Copper | tonnes | 6,634 | 7,196 | 26,406 | 5,927 | 6,736 | 6,719 | 7,024 | 19,050 | 8,508 | 9,303 | 1,239 | ||||||||||||||||||||||
| Gold | ounces | 5,670 | 5,561 | 19,789 | 4,644 | 6,274 | 4,454 | 4,417 | 8,848 | 3,495 | 4,608 | 745 | ||||||||||||||||||||||
| Silver | ounces | 65,040 | 79,480 | 280,499 | 58,933 | 55,963 | 77,227 | 88,376 | 218,282 | 105,295 | 101,069 | 11,918 | ||||||||||||||||||||||
| Payable metal sold | ||||||||||||||||||||||||||||||||||
| Copper | tonnes | 6,803 | 6,153 | 25,354 | 5,831 | 6,026 | 6,564 | 6,933 | 18,075 | 9,119 | 8,956 | - | ||||||||||||||||||||||
| Gold | ounces | 5,813 | 4,965 | 19,735 | 5,036 | 6,199 | 5,099 | 3,401 | 8,420 | 3,091 | 5,329 | - | ||||||||||||||||||||||
| Silver | ounces | 67,988 | 60,059 | 249,536 | 43,747 | 53,241 | 69,248 | 83,300 | 189,443 | 98,441 | 91,002 | - | ||||||||||||||||||||||
| Combined unit cost 2,3 | C$/tonne | $ | 24.51 | $ | 25.98 | $ | 20.39 | $ | 23.22 | $ | 15.58 | $ | 19.65 | $ | 23.67 | $ | 21.38 | $ | 20.90 | $ | 24.88 | - | ||||||||||||
| Cash cost3 | $/lb | $ | 2.39 | $ | 2.44 | $ | 2.74 | $ | 3.00 | $ | 1.81 | $ | 2.67 | $ | 3.49 | $ | 2.49 | $ | 2.67 | $ | 2.67 | - | ||||||||||||
| Sustaining cash cost 3 | $/lb | $ | 5.18 | $ | 4.24 | $ | 5.29 | $ | 5.76 | $ | 5.06 | $ | 5.56 | $ | 4.85 | $ | 3.41 | $ | 3.93 | $ | 3.39 | - | ||||||||||||
| 1 Reported tonnes and grade for ore mined are estimates based on mine plan assumptions and may not fully reconcile to ore milled. | ||||||||||||
| 2 Reflects combined mine, mill and general and administrative ("G&A") costs per tonne of ore milled. Reflects the deduction of expected capitalized stripping costs. | ||||||||||||
| 3 Combined unit costs, cash cost, and sustaining cash cost per pound of copper produced, net of by-product credits, are non-GAAP financial performance measures with no standardized definition under IFRS. For further information and a detailed reconciliation, please see the discussion under the "Non-GAAP Financial Performance Measures" section of this MD&A. The above table sets forth selected non-GAAP financial performance measures for each of the Company's nine most recently completed quarters and three most recently completed years; detailed reconciliations for non-comparable prior periods can be found in Hudbay's MD&A for these prior periods in the "Non-GAAP Financial Performance Measures" section of these documents. | ||||||||||||
| 4 Includes 100% of Copper Mountain mine production. As at March 31, 2025, Hudbay owned 75% of the Copper Mountain mine. Subsequent to quarter end, Hudbay completed an acquisition of the remaining 25% interest and as at June 30, 2025 Hudbay owns 100% of the Copper Mountain mine. | ||||||||||||
| 5 Production results from Copper Mountain operations represents the period from the June 20, 2023 acquisition date through to the end of the second quarter of 2023. | ||||||||||||
| 6 Annual consolidated results may not calculate based on amounts presented in this table due to rounding. |
|
|
TSX, NYSE - HBM 2025 No. 23 |
| 25 York Street, Suite 800 Toronto, Ontario Canada M5J 2V5 tel 416 362-8181 fax 416 362-7844 hudbay.com |
News Release |
Hudbay Delivers Strong Second Quarter 2025 Results
Toronto, Ontario, August 13, 2025 - Hudbay Minerals Inc. ("Hudbay" or the "Company") (TSX, NYSE: HBM) today released its second quarter 2025 financial results. All amounts are in U.S. dollars, unless otherwise noted.
"We delivered another quarter of significant free cash flow generation driven by continued industry-leading cost margins and diversified exposure to copper and gold," said Peter Kukielski, President and Chief Executive Officer. "Our strong financial performance enabled us to further reduce long-term debt, invest in our many high-return growth projects and further strengthen our balance sheet to its best position in over a decade. With the strong performance in the first half of the year, we are reaffirming our full year consolidated production guidance and are favourably tracking well below our full year consolidated cost guidance for 2025. The announcement of our Copper World joint venture agreement with Mitsubishi further solidifies our financial strength and significantly reduces our funding requirement for project development. We are delighted to have secured the premier joint venture partner and look forward to establishing a long-term strategic partnership that will unlock significant value in our copper growth pipeline. Through a highly accretive joint venture, an agreement to enhance the Copper World precious metals stream terms, and the achievement of our financial targets, we have successfully realized the key elements of our prudent financial plan and significantly de-risked the Copper World project as we advance towards a sanction decision in 2026."
Delivered Strong Second Quarter Financial Results; Production Reaffirmed and Cost Guidance Improved
|
|
TSX, NYSE - HBM 2025 No. 23 |
Continued Free Cash Flow Generation Driving Further Debt Reduction and Balance Sheet Resilience
Prudently Advancing Copper World with Accretive Minority Joint Venture Transaction, Enhanced Stream Transaction and Successful Achievement of "3-P" Plan
|
|
TSX, NYSE - HBM 2025 No. 23 |
Reinvesting in High-return Growth Initiatives to Further Enhance Copper and Gold Exposure
|
|
TSX, NYSE - HBM 2025 No. 23 |
Summary of Second Quarter Results
Steady production continued into the second quarter of 2025 with consolidated copper production of 29,956 tonnes and consolidated gold production of 56,271 ounces. Consolidated copper and gold production was lower than the first quarter of 2025 primarily due to the impacts of a temporary suspension of operations in Manitoba as a result of mandatory wildfire evacuation orders. Consolidated silver production of 814,989 ounces and zinc production of 5,130 tonnes in the second quarter of 2025 were also lower than the first quarter of 2025 for the aforementioned reason.
Cash generated from operating activities of $259.9 million increased compared to the first quarter of 2025 as a result of higher gross margins driven by stable copper production, higher realized prices and positive working capital management with reductions in finished goods inventories and receivable balances. Operating cash flow before change in non-cash working capital was $193.9 million during the second quarter of 2025, reflecting an increase of $30.4 million compared to the first quarter of 2025. The increase compared to the first quarter of 2025 was primarily the result of lower cash taxes paid offset by lower gold and copper sales volume in Manitoba. Second quarter adjusted EBITDAi was $245.2 million, a 15% decrease compared to $287.2 million in the first quarter of 2025 due to lower sales volume partially offset by higher gold prices.
Net earnings attributable to owners in the second quarter of 2025 was $117.7 million, or $0.30 per share, compared to $100.4 million, or $0.25 per share, in the first quarter of 2025. The increase in earnings is the result of high gross margins from strong revenue growth on the back of stable copper production and higher realized gold prices. In addition, the quarter benefited from various non-cash charges for revaluation gain of closed sites reclamation provisions, and significantly reduced net finance expenses, among other items, more than offsetting the high mining and income tax expense experienced in the current quarter.
Adjusted net earnings attributable to ownersi and adjusted net earnings per share attributable to ownersi in the second quarter of 2025 were $75.5 million and $0.19 per share, respectively, after adjusting for various non-cash items on a pre-tax basis such as a non-cash $18.9 million foreign exchange gain, a non-cash gain of $13.8 million related to quarterly revaluation of Hudbay's closed site environmental reclamation provision, a $6.3 million mark-to-market revaluation gain on various instruments such as investments and share-based compensation, and a $1.2 million gain related to flow-through share expenditures, among other items. This compares to adjusted net earnings attributable to ownersi and net earnings per share attributable to ownersi of $93.8 million and $0.24 per share in the first quarter of 2025.
|
|
TSX, NYSE - HBM 2025 No. 23 |
In the second quarter of 2025, consolidated cash costi per pound of copper produced, net of by-product credits, was $(0.02), compared to $(0.45) in the first quarter of 2025 as the Company continued to demonstrate industry-leading cost performance. The change from the first quarter was a result of lower by-product credits and lower production levels in Manitoba during the second quarter. Consolidated sustaining cash costi per pound of copper produced, net of by-product credits, was $1.65 in the second quarter of 2025, compared to $0.72 in the first quarter of 2025. The increase was driven by planned higher sustaining capital expenditures and the aforementioned variance in cash cost. Consolidated all-in sustaining cash costi per pound of copper produced, net of by-product credits, was $2.03 in the second quarter of 2025, higher than $0.97 in the first quarter of 2025 mainly due to the same reasons outlined above as well as higher corporate G&A from the revaluation of the Company's stock based compensation due to relative higher share prices.
As at June 30, 2025, total liquidity was $1,050.2 million, including $625.5 million in cash and cash equivalents, and undrawn availability of $424.7 million under Hudbay's revolving credit facilities. Net debti at the end of the second quarter was $434.1 million, marking a $92.0 million improvement from the first quarter of 2025 as a result of deleveraging activities.
| Consolidated Financial Condition (in $ millions, except net debt to adjusted EBITDA ratio) |
Jun. 30, 2025 | Mar. 31, 2025 | Dec. 31, 2024 |
| Cash and cash equivalents and short-term investments | 625.5 | 582.6 | 581.8 |
| Total long-term debt | 1,059.6 | 1,108.7 | 1,107.5 |
| Net debt1 | 434.1 | 526.1 | 525.7 |
| Working capital2 | 26.8 | 598.0 | 511.3 |
| Total assets | 5,628.6 | 5,507.0 | 5,487.6 |
| Equity attributable to owners of the Company | 2,863.3 | 2,653.2 | 2,553.2 |
| Net debt to adjusted EBITDA1,3 | 0.4 | 0.6 | 0.6 |
1 Net debt and net debit to adjusted EBITDA are non-GAAP financial performance measures with no standardized definition under IFRS. For further information, please see the "Non-GAAP Financial Performance Measures" section of this news release.
2 Working capital is determined as total current assets less total current liabilities as defined under IFRS and disclosed on the consolidated financial statements. Working capital as of June 30, 2025 was impacted by an increase in the current portion of long-term debt of $523.8 million as the 2026 Notes are now maturing within one year.
3 Net debt to adjusted EBITDA for the 12 month period.
|
|
TSX, NYSE - HBM 2025 No. 23 |
| Consolidated Financial Performance | Three Months Ended | |||
| Jun. 30, 2025 | Mar. 31, 2025 | Jun. 30, 2024 | ||
| Revenue | $000s | 536.4 | 594.9 | 425.5 |
| Cost of sales | $000s | 359.9 | 363.6 | 347.9 |
| Earnings before tax | $000s | 153.1 | 171.3 | 0.4 |
| Net earnings | $000s | 114.7 | 99.2 | (20.3) |
| Net earnings attributable to owners | $000s | 117.7 | 100.4 | (16.5) |
| Basic and diluted attributable earnings per share1 | $/share | 0.30 | 0.25 | (0.04) |
| Adjusted earnings attributable per share1 | $/share | 0.19 | 0.24 | 0.00 |
| Operating cash flow before change in non-cash working capital | $ millions | 193.9 | 163.5 | 123.7 |
| Adjusted EBITDA1 | $ millions | 245.2 | 287.2 | 145.0 |
| Free cash flow1 | $ millions | 87.8 | 87.4 | 32.5 |
| 1 Adjusted earnings per share - attributable to owners, adjusted EBITDA and free cash flow are non-GAAP financial performance measures with no standardized definition under IFRS. For further information and a detailed reconciliation, please see discussion under the "Non-GAAP Financial Performance Measures" section of this news release. | ||||
| Consolidated Production and Cost Performance | Three Months Ended | |||
| Jun. 30, 2025 | Mar. 31, 2025 | Jun. 30, 2024 | ||
| Contained metal in concentrate and doré produced1 | ||||
| Copper | tonnes | 29,956 | 30,958 | 28,578 |
| Gold | ounces | 56,271 | 73,784 | 58,614 |
| Silver | ounces | 814,989 | 919,775 | 738,707 |
| Zinc | tonnes | 5,130 | 6,265 | 8,087 |
| Molybdenum | tonnes | 375 | 397 | 369 |
| Payable metal sold | ||||
| Copper | tonnes | 30,354 | 31,768 | 25,799 |
| Gold2 | ounces | 62,466 | 75,092 | 61,295 |
| Silver2 | ounces | 894,160 | 1,006,968 | 667,036 |
| Zinc | tonnes | 2,871 | 4,857 | 5,133 |
| Molybdenum | tonnes | 427 | 448 | 347 |
| Consolidated cash cost per pound of copper produced3 | ||||
| Cash cost | $/lb | (0.02) | (0.45) | 1.14 |
| Sustaining cash cost | $/lb | 1.65 | 0.72 | 2.65 |
| All-in sustaining cash cost | $/lb | 2.03 | 0.97 | 3.07 |
| 1 Metal reported in concentrate is prior to deductions associated with smelter contract terms. | ||||
| 2 Includes total payable gold and silver in concentrate and in doré sold. | ||||
| 3 Cash cost, sustaining cash cost and all-in sustaining cash cost per pound of copper produced, net of by-product credits, are non-IFRS financial performance measures with no standardized definition under IFRS. For further information, please see the "Non-IFRS Financial Performance Measures" section of this news release. | ||||
|
|
TSX, NYSE - HBM 2025 No. 23 |
Peru Operations Review
| Peru Operations | Three Months Ended | |||
| Jun. 30, 2025 | Mar. 31, 2025 | Jun. 30, 2024 | ||
| Constancia ore mined1 | tonnes | 6,735,316 | 8,628,279 | 5,277,654 |
| Copper | % | 0.34 | 0.28 | 0.29 |
| Gold | g/tonne | 0.03 | 0.03 | 0.03 |
| Silver | g/tonne | 3.26 | 3.14 | 2.50 |
| Molybdenum | % | 0.02 | 0.02 | 0.01 |
| Pampacancha ore mined1 | tonnes | 762,172 | 389,189 | 1,288,789 |
| Copper | % | 0.26 | 0.44 | 0.41 |
| Gold | g/tonne | 0.24 | 0.26 | 0.20 |
| Silver | g/tonne | 4.59 | 3.68 | 3.83 |
| Molybdenum | % | 0.01 | 0.01 | 0.02 |
| Total ore mined | tonnes | 7,497,488 | 9,017,468 | 6,566,443 |
| Strip ratio4 | 1.47 | 1.02 | 1.74 | |
| Ore milled | tonnes | 7,559,047 | 8,114,024 | 7,718,962 |
| Copper | % | 0.34 | 0.30 | 0.30 |
| Gold | g/tonne | 0.05 | 0.05 | 0.07 |
| Silver | g/tonne | 3.58 | 3.22 | 2.85 |
| Molybdenum | % | 0.01 | 0.01 | 0.01 |
| Copper recovery | % | 84.5 | 84.6 | 83.1 |
| Gold recovery | % | 56.0 | 56.5 | 61.4 |
| Silver recovery | % | 63.5 | 66.0 | 63.9 |
| Molybdenum recovery | % | 38.7 | 35.7 | 46.3 |
| Contained metal in concentrate | ||||
| Copper | tonnes | 21,710 | 20,293 | 19,217 |
| Gold | ounces | 7,366 | 7,869 | 10,672 |
| Silver | ounces | 551,979 | 554,692 | 450,833 |
| Molybdenum | tonnes | 375 | 397 | 369 |
| Payable metal sold | ||||
| Copper | tonnes | 21,418 | 22,890 | 16,806 |
| Gold | ounces | 9,721 | 14,362 | 13,433 |
| Silver | ounces | 616,578 | 714,654 | 400,302 |
| Molybdenum | tonnes | 427 | 448 | 347 |
| Combined unit operating cost2,3 | $/tonne | 13.59 | 11.09 | 12.68 |
| Cash cost3 | $/lb | 1.45 | 1.11 | 1.78 |
| Sustaining cash cost3 | $/lb | 2.63 | 1.92 | 2.60 |
| 1 Reported tonnes and grade for ore mined are estimates based on mine plan assumptions and may not reconcile fully to ore milled. | ||||
| 2 Reflects combined mine, mill and general and administrative ("G&A") costs per tonne of ore milled. Reflects the deduction of expected capitalized stripping costs. | ||||
| 3 Combined unit costs, cash cost and sustaining cash cost per pound of copper produced, net of by-product credits, are non-IFRS financial performance measures with no standardized definition under IFRS. For further information, please see the "Non-IFRS Financial Performance Measures" section of this news release. | ||||
| 4 Strip ratio is calculated as waste mined divided by ore mined. | ||||
|
|
TSX, NYSE - HBM 2025 No. 23 |
The Peru operations continued to demonstrate steady operating performance with production and costs in line with expectations. During the second quarter of 2025, the Peru operations produced 21,710 tonnes of copper, 7,366 ounces of gold, 551,979 ounces of silver and 375 tonnes of molybdenum. Copper production increased in the second quarter of 2025 compared to the first quarter of 2025 as milled copper grades exceeded first quarter levels, partially offset by planned lower mill throughput due to a scheduled mill maintenance shutdown in the second quarter. Production of all other metals were relatively in line with the first quarter of 2025.
The last major stripping program at Pampacancha was completed in the second quarter of 2025, which included higher amounts of waste stripping than planned. As a result, the Company replaced higher grade Pampacancha ore with higher grade Constancia ore in the second quarter and the Pampacancha deposit is now expected to be depleted in the first quarter of 2026 rather than in late 2025. Protests that started early in the third quarter temporarily impacted the transportation of supplies and concentrate to and from the Constancia site and has affected mine sequencing. The Constancia mill has continued to operate during this period, and the road blockades along the concentrate transportation route have since reopened, allowing Hudbay to reduce site concentrate inventory levels and replenish supplies. Despite short-term mine plan changes, the Company remains on track to achieve its 2025 production guidance for all metals in Peru.
Total ore mined in Peru in the second quarter of 2025 was lower than the first quarter of 2025 but remained in line with mine plan expectations.
Mill throughput levels averaged approximately 83,100 tonnes per day in the second quarter of 2025, lower than the first quarter of 2025 due to the planned semi-annual mill maintenance shutdown during the current quarter. Milled copper grades increased by 13% relative to the first quarter of 2025 due to higher grades in the Constancia pit. Milled gold grades in the second quarter remained consistent with gold grades in the first quarter of 2025 as Pampacancha stripping activities were underway in both quarters. The mill achieved copper recoveries of 85% in the second quarter of 2025, remaining consistent with the first quarter of 2025. Recoveries of gold and silver during the quarter were in line with Hudbay's metallurgical models for the ore that was being processed.
Combined mine, mill and G&A unit operating costi in the second quarter of 2025 was $13.59 per tonne, 23% higher than the first quarter, as expected, due to higher plant maintenance costs and lower tonnes processed associated with the planned semi-annual mill maintenance shutdown.
Cash costi per pound of copper produced, net of by-product credits, in the second quarter of 2025 was $1.45, an increase of 31% compared to the first quarter of 2025 due to planned higher maintenance costs and lower by-product credits, partially offset by lower treatment and refining charges and higher copper production. Sustaining cash costi per pound of copper produced, net of by-product credits, was $2.63 in the second quarter of 2025, an increase compared to the first quarter of 2025 due to planned higher sustaining capital typically associated with the period after the rainy season is complete, as well as the same factors affecting cash costs. Hudbay is reaffirming its full year 2025 cash cost guidance range in Peru.
|
|
TSX, NYSE - HBM 2025 No. 23 |
Manitoba Operations Review
| Manitoba Operations | Three Months Ended | |||
| Jun. 30, 2025 | Mar. 31, 2025 | Jun. 30, 2024 | ||
| Lalor | ||||
| Ore mined | tonnes | 303,062 | 384,234 | 385,478 |
| Gold | g/tonne | 4.97 | 5.46 | 3.75 |
| Copper | % | 0.61 | 0.95 | 0.69 |
| Zinc | % | 2.46 | 2.42 | 2.76 |
| Silver | g/tonne | 29.94 | 31.23 | 22.29 |
| New Britannia | ||||
| Ore milled | tonnes | 162,934 | 189,124 | 167,899 |
| Gold | g/tonne | 6.48 | 7.37 | 5.31 |
| Copper | % | 0.65 | 1.18 | 0.94 |
| Zinc | % | 1.01 | 1.00 | 0.92 |
| Silver | g/tonne | 30.29 | 33.35 | 24.42 |
| Gold recovery1 | % | 89.4 | 90.3 | 90.0 |
| Copper recovery | % | 87.4 | 90.3 | 94.4 |
| Silver recovery1 | % | 78.0 | 81.6 | 83.1 |
| Stall Concentrator | ||||
| Ore milled | tonnes | 144,204 | 215,286 | 229,527 |
| Gold | g/tonne | 3.19 | 3.86 | 3.02 |
| Copper | % | 0.56 | 0.76 | 0.59 |
| Zinc | % | 4.20 | 3.44 | 4.05 |
| Silver | g/tonne | 29.55 | 29.53 | 21.74 |
| Gold recovery | % | 67.9 | 70.1 | 65.5 |
| Copper recovery | % | 84.7 | 88.3 | 85.4 |
| Zinc recovery | % | 84.8 | 84.7 | 87.1 |
| Silver recovery | % | 51.9 | 58.7 | 54.2 |
| Total contained metal in concentrate and doré2 | ||||
| Gold | ounces | 43,235 | 60,354 | 43,488 |
| Copper | tonnes | 1,612 | 3,469 | 2,642 |
| Zinc | tonnes | 5,130 | 6,265 | 8,087 |
| Silver | ounces | 197,970 | 285,603 | 210,647 |
| Total payable metal sold | ||||
| Gold | ounces | 46,932 | 55,765 | 42,763 |
| Copper | tonnes | 2,133 | 2,725 | 2,429 |
| Zinc | tonnes | 2,871 | 4,857 | 5,133 |
| Silver | ounces | 209,594 | 232,255 | 197,486 |
| Combined unit operating cost3,4,5 | C$/tonne | 241 | 214 | 225 |
| Gold cash cost4,5 | $/oz | 710 | 376 | 771 |
| Gold sustaining cash cost4 | $/oz | 1,025 | 626 | 1,163 |
1 Gold and silver recovery includes total recovery from concentrate and doré. Doré includes sludge, slag and carbon fines
2 Metal reported in concentrate is prior to deductions associated with smelter terms.
3 Reflects combined mine, mill and G&A costs per tonne of milled ore.
4 Combined unit cost, cash cost, sustaining cash cost per pound of copper produced, net of by-product credits, gold cash cost and sustaining cash cost per ounce of gold produced, net of by-product credits, are non-GAAP financial performance measures with no standardized definition under IFRS. For further information, please see the "Non-GAAP Financial Performance Measures" section of this news release.
5 Excludes $3.2 million (C$14 per tonne or $74 per ounce) of overhead costs incurred during temporary suspension during the three months ended June 30, 2025.
|
|
TSX, NYSE - HBM 2025 No. 23 |
Despite significant disruptions from the mandatory wildfire evacuation orders in May and June of this year, the Manitoba operations showed remarkable resilience and achieved several key milestones in the second quarter of 2025. Notably, the New Britannia mill achieved record monthly production in April, the 1901 mining area delivered its first ore for processing in June, and Hudbay signed an exploration agreement with Mosakahiken Cree Nation to explore the Talbot deposit.
The Manitoba operations delivered strong results in the second quarter of 2025, producing 43,235 ounces of gold, 1,612 tonnes of copper, 5,130 tonnes of zinc and 197,970 ounces of silver. Compared to the first quarter of 2025, production of gold, copper, silver and zinc in the second quarter of 2025 decreased by 28%, 54%, 31% and 18%, respectively, due to lower production in June associated with the wildfire evacuation shutdown, in addition to the first quarter of 2025 having significantly better than expected gold grades.
Hudbay's dedicated on-site team demonstrated tremendous effort and unwavering commitment during the unprecedented wildfire situation near the Company's Flin Flon and Snow Lake operations during the second quarter. The team tirelessly safeguarded Hudbay's assets and collaborated closely with local communities and provincial authorities, providing essential support to emergency response efforts. These efforts resulted in no damage to Hudbay's infrastructure and facilities.
The Lalor mine managed through a period of reduced workforce prior to and after the 13-day temporary suspension of operations in June due to mandatory wildfire evacuation orders. Despite these challenges, the mine averaged 3,300 tonnes per day in the second quarter, strategically prioritizing mining from gold zones to ensure a consistent feed for the New Britannia mill. Gold grades were in line with mine plan expectations, while being lower than the exceptional gold grade mined in the first quarter of 2025. Copper, zinc and silver grades were also consistent with mine plan expectations for the quarter. Continuous improvement efforts at Lalor focused on ore quality and advancing stope modifications to enhance mucking productivity. Capital development continued, aiming to secure high-grade copper-gold mineralization from Zone 27 and prepare Zone 17 for the next copper-gold mining front.
The New Britannia mill achieved record monthly production levels in April, exceeding 2,300 tonnes per day. This significant milestone is a testament to ongoing low-capital projects and recent piping improvements that boosted throughput and maintained gold recoveries. The New Britannia mill throughput averaged approximately 1,800 tonnes per day in the second quarter of 2025, reflecting the record levels achieved in April, offset by lower throughput levels in June associated with the wildfire evacuation shutdown. Gold recovery in the second quarter of 2025 was 89%, remaining relatively consistent with the first quarter of 2025.
In the second quarter, the Stall mill continued to process less ore compared to prior periods, which is aligned with Hudbay's strategy of allocating more Lalor ore feed to New Britannia to maximize gold recoveries. The Stall mill achieved gold recoveries of 68% in the second quarter of 2025, reflecting benefits from recent recovery improvement programs.
The Manitoba operations continued to drive operating efficiencies despite temporary disruptions from wildfire evacuations orders in June. Combined mine, mill and G&A unit operating costsi in the second quarter were C$241 per tonne, higher than the comparative period primarily due to lower total throughput in June, partially offset by continued strong cost performance at New Britannia. Mining costs were higher than in the first quarter of 2025 as a result of the wildfires in June; milling costs were higher as a result of higher unit costs at Stall associated with lower throughput as mentioned above, offset by strong unit cost performance at New Britannia.
Cash costi per ounce of gold produced, net of by-product credits, in the second quarter of 2025 was $710, an increase from the first quarter of 2025 primarily due to lower gold production and lower by-product credits as per the production variances mentioned above. Sustaining cash costi per ounce of gold produced, net of by-product credits, in the second quarter of 2025 was $1,025, an increase compared to the first quarter of 2025, primarily due to the same factors affecting cash cost, partially offset by lower sustaining capital costs during the quarter. With the first half of the year outperforming the low end of the cash cost guidance range, Hudbay is well positioned to achieve the 2025 cash cost guidance range in Manitoba.
|
|
TSX, NYSE - HBM 2025 No. 23 |
On July 10, 2025, a second mandatory wildfire evacuation order was issued for the town of Snow Lake and a controlled, safe and orderly temporary suspension of the Snow Lake operations was implemented. Essential personnel, authorized by emergency services, have remained onsite when safe to do so in order to continue supporting fire mitigation activities and safeguarding Hudbay's assets. To-date, there has been no structural damage to Hudbay's onsite surface infrastructure and facilities. As of August 12, 2025, the wildfire situation near Snow Lake has improved and Hudbay anticipates returning to normal operations later in August. The Company continues to expect to achieve its 2025 annual guidance metrics for all metals in Manitoba, despite the impact from the wildfires.
British Columbia Operations Review
| British Columbia Operations1 | Three Months Ended | |||
| Jun. 30, 2025 | Mar. 31, 2025 | Jun. 30, 2024 | ||
| Ore mined2 | tonnes | 2,509,969 | 2,648,094 | 2,164,722 |
| Strip ratio3 | 7.50 | 6.73 | 7.61 | |
| Ore milled | tonnes | 2,900,008 | 2,760,986 | 3,232,427 |
| Copper | % | 0.28 | 0.33 | 0.25 |
| Gold | g/tonne | 0.09 | 0.10 | 0.07 |
| Silver | g/tonne | 0.97 | 1.28 | 1.01 |
| Copper recovery | % | 81.0 | 78.3 | 82.3 |
| Gold recovery | % | 68.2 | 63.4 | 57.2 |
| Silver recovery | % | 71.8 | 69.8 | 73.9 |
| Total contained metal in concentrate | ||||
| Copper | tonnes | 6,634 | 7,196 | 6,719 |
| Gold | ounces | 5,670 | 5,561 | 4,454 |
| Silver | ounces | 65,040 | 79,480 | 77,227 |
| Total payable metal sold | ||||
| Copper | tonnes | 6,803 | 6,153 | 6,564 |
| Gold | ounces | 5,813 | 4,965 | 5,099 |
| Silver | ounces | 67,988 | 60,059 | 69,248 |
| Combined unit operating cost4,5 | C$/tonne | 24.51 | 25.98 | 19.65 |
| Cash cost5 | $/lb | 2.39 | 2.44 | 2.67 |
| Sustaining cash cost5 | $/lb | 5.18 | 4.24 | 5.56 |
| 1 Copper Mountain mine results are stated at 100%. On April 30, 2025, Hudbay completed the acquisition of the remaining 25% interest in the Copper Mountain mine and now owns 100%. | ||||
| 2 Reported tonnes and grade for ore mined are estimates based on mine plan assumptions and may not reconcile fully to ore milled. | ||||
| 3 Strip ratio is calculated as waste mined divided by ore mined. | ||||
| 4 Reflects combined mine, mill and general and administrative ("G&A") costs per tonne of ore milled. Reflects the deduction of expected capitalized stripping costs. | ||||
| 5 Combined unit operating cost, cash cost and sustaining cash cost per pound of copper produced, net of by-product credits, are non-GAAP financial performance measures with no standardized definition under IFRS. For further information, please see the "Non-GAAP Financial Performance Measures" section of this news release. | ||||
Hudbay continues its focus on advancing optimization plans at the Copper Mountain mine, including ramping up mining activities to optimize the mine ore feed to the plant and implementing site improvement initiatives that mirror Hudbay's successful processes at Constancia. These optimization initiatives have successfully increased the total tonnes moved and improved mill reliability.
|
|
TSX, NYSE - HBM 2025 No. 23 |
The British Columbia operations produced 6,634 tonnes of copper, 5,670 ounces of gold and 65,040 ounces of silver during the second quarter of 2025. Production of copper and silver decreased compared to the first quarter of 2025 primarily as a result of lower head grades from the use of stockpiled ore. Production of gold was higher than the first quarter of 2025, largely due to higher recoveries. Hudbay remains on track to achieve its 2025 production guidance for all metals in British Columbia and continues to expect higher production in the second half of the year as the mill improvement projects take effect.
Mining activities are focused on continuing to execute the three-year accelerated stripping program intended to bring higher grade ore into the mine plan. During the first half of 2025, Hudbay made significant progress on the key mill improvement project to ultimately increase the nominal plant capacity to its permitted level of 50,000 tonnes per day. The project entails the conversion of the third ball mill to a second SAG mill, and the initial phase of this project was successfully completed shortly following the end of the second quarter on time and on budget with the achievement of first ore production on July 10. The final phase of the project involves converting an interim feed arrangement to a permanent configuration and remains on target for completion in the second half of 2025.
Total ore mined at Copper Mountain in the second quarter of 2025 was 2.5 million tonnes, a 5% decrease compared to the first quarter of 2025 due to unplanned production loading fleet activities, despite an increase in total material moved in the quarter as a result of effective usage of the mining fleet to execute the accelerated stripping program to access higher grade phases in the pit. Planned ore stockpiles were utilized as ore feed to the mill while the mine operation team continued to increase waste stripping activities to expose additional ore mining fronts. The continued focus in the second quarter of 2025 was on mining efficiencies, including a significant improvement with blasted muck inventories and operator recruitment to effectively utilize the available haul truck fleet. As a result, total material moved is expected to increase quarter-over-quarter in 2025 as per the mine plan.
The mill processed 2.9 million tonnes of ore during the second quarter of 2025, higher than the first quarter of 2025, but was limited by both planned and unplanned maintenance, elevated clay material which impacted the secondary crushing circuit, and the planned lowering of the main crushed live ore pile feeding the mill due to area constraints related to the completion of the ball mill to SAG conversion project. Several mill initiatives were implemented in 2025, including recovery improvements, crushing circuit chute modifications, installation of advanced semi-autogenous grinding control instrumentation, and redesigned SAG liner package. Progressive mill improvements and updated operational procedures are expected to continue through 2025.
Milled copper grades during the second quarter of 2025 were lower than the first quarter due to higher amounts of ore processed from stockpile in the second quarter, as mentioned above, as well as the mining of a high-grade mining sequence during the first quarter of 2025. Copper recoveries were 81% in the second quarter of 2025, an increase from 78% in the first quarter of 2025 despite lower copper head grades. Gold recoveries of 68% in the second quarter of 2025 were higher than the first quarter of 2025, despite slightly lower gold head grades.
Combined mine, mill and G&A unit operating costsi in the second quarter of 2025 were C$24.51 per tonne milled, lower than the first quarter of 2025 due to lower milling and G&A costs and higher ore milled, partially offset by higher mining costs.
Cash costi and sustaining cash costi per pound of copper produced, net of by-product credits, in the second quarter of 2025 were $2.39 and $5.18, respectively. Cash costs were 2% lower than in the first quarter of 2025, largely due to higher by-product credits. Sustaining cash costs were 22% higher than the first quarter of 2025 due to higher sustaining capital including higher capitalized stripping costs. With cash costsi in the first half of the year at the low-end of the 2025 guidance range, Hudbay is well positioned to achieve the full year 2025 cash cost guidance range in British Columbia.
|
|
TSX, NYSE - HBM 2025 No. 23 |
Continued Free Cash Flow Generation from Strong Copper and Gold Exposure
Hudbay has delivered eight consecutive quarters of meaningful free cash flowi generation as a result of steady operating performance, expanding margins from strong copper and gold exposure and a focus on cost control across the business:
Significant Debt Reduction
As a result of the continued free cash flowi generation and prudent balance sheet management, Hudbay was able to repurchase and retire $50.0 million of senior unsecured notes at a discount to par, during the second quarter of 2025. This has contributed to approximately $295 million in total debt repayments and gold prepayment liability reductions since the beginning of 2024:
These deleveraging achievements have reduced total principal debt to $1.07 billion as of June 30, 2025, which together with Hudbay's increased cash balance, has substantially reduced net debti to $434.1 million, compared to $631.8 million as of June 30, 2024. Incorporating higher levels of adjusted EBITDAi over the last twelve months, Hudbay's net debt to adjusted EBITDA ratioi has significantly improved to 0.4x.
Secured Premier Long-term Strategic Partner in Copper World JV Transaction
The joint venture will be structured as a new limited liability corporation, Copper World LLC. Under the JV Transaction, the initial contribution of $600 million for a 30% equity interest in Copper World LLC, will consist of $420 million upon closing and a $180 million matching contribution payable no later than 18 months following closing. Hudbay will retain 100% of its existing U.S. federal net operating losses of approximately $275 million and Arizona state losses of $210 million.
Hudbay welcomes a premier, long-term, strategic partner with deep technical expertise and a proven trading platform which Mitsubishi has established throughout its demonstrated history of industry partnerships. Mitsubishi's impressive track record in co-developing and operating some of the world's largest and highest quality copper projects will complement Hudbay's proven track record as a successful mine builder and operator.
Mitsubishi will be contributing 30% of the ongoing costs beginning August 31, 2025 and will participate in the funding of the DFS as well as the final project design, project financing, and project construction for Copper World.
The JV Transaction is expected to close in late 2025 or early 2026 and is conditioned upon receipt of certain regulatory approvals and the satisfaction of other customary closing conditions.
|
|
TSX, NYSE - HBM 2025 No. 23 |
Enhanced Wheaton Precious Metals Stream
Hudbay is also pleased to announce that it has concurrently executed a non-binding term sheet to amend its existing Wheaton stream agreement for 100% of the gold and silver produced at Copper World (the "Wheaton Stream"), which will increase the value of the project and provide upside exposure to higher precious metal prices.
Key terms of this enhanced Wheaton Stream to include (subject to execution of definitive documentation):
Successfully Completed "3-P" Plan for Advancing Copper World Towards a Sanction Decision in 2026
As part of Hudbay's disciplined financial planning approach to developing Copper World, the Company implemented its 3-P plan in late 2022, including specific leverage targets that it would need to achieve prior to making an investment decision in the project:
1. Permits - Completed - Hudbay received all required state level permits.
2. Plan - Well Underway - Hudbay commenced activities related to the feasibility study for Copper World in late 2024 and expects to continue to advance definitive feasibility study activities throughout 2025 with completion by mid-2026.
3. Prudent Financing Strategy - Completed - Hudbay achieved all key elements of its multi-faceted financing strategy, including:
✓ Minimum cash balance of $600 million - As of June 30, 2025, Hudbay has over $625 million in cash and cash equivalents;
✓ Net debt to EBITDA ratio of less than 1.2x - As of June 30, 2025, Hudbay's net debt to adjusted EBITDA ratioi is 0.4x, meaningfully below the targeted ratio to ensure financial flexibility during the sanctioning and construction of Copper World;
✓ Renegotiated precious metals stream agreement - Announced an enhanced Wheaton Stream that aligns with the current development plan for Copper World, reflects amended ongoing payments for gold and silver deliveries from a fixed pricing to 15% of spot prices to provide upside exposure to higher precious metals prices, while also providing additional contingent payments of up to $70 million related to potential future mill expansion milestones; and,
✓ Minority joint venture partner - Announced a $600 million transaction with Mitsubishi for a 30% minority joint venture interest in a highly accretive transaction, which creates a long-term partnership with a premier strategic partner that has a global mining presence and an established U.S. based metals trading business.
As a result of the completion of the prudent financing strategy, Hudbay's estimated share of the remaining capital contributions for the construction of Copper World is approximately $200 millioniii, and Hudbay's first capital contribution is deferred until 2028 at the earliest based on PFS estimates. Based on Hudbay's pro-forma cash and cash equivalents of more than $1.0 billion and total liquidity of more than $1.5 billion, using figures as at June 30, 2025, the Company has significant financial flexibility to fund its share of the remaining equity contributions at Copper World while continuing to maintain a strong balance sheet throughout the project construction period.
|
|
TSX, NYSE - HBM 2025 No. 23 |
Manitoba Temporary Wildfire Evacuation Orders
Since the end of May, seasonal wildfires in northern Manitoba have resulted in evacuation orders in the regions where Hudbay operates. Emergency preparedness protocols were immediately activated and Hudbay has continued to work closely with local and provincial authorities to ensure the safety and well-being of its employees and nearby communities. The first mandatory wildfire evacuation orders resulted in Hudbay temporarily suspending operations in June for 13 days and operating with a reduced workforce since the end of May, before and after the operation suspension. The Company committed over C$2 million in funding support in June, including C$1.6 million in direct financial support for evacuated Hudbay employees and a C$500,000 donation to the Canadian Red Cross to support wildfire emergency relief and rebuilding efforts in northern Manitoba. The Company's Canadian Red Cross donation was part of a collective C$1.25 million donation that was made by the three leading mining companies that operate in Manitoba, including Hudbay, Vale Base Metals and Alamos Gold Inc. In addition, Hudbay established a Community Relief Donations Fund whereby Hudbay doubled the amounts donated by its employees to the Canadian Red Cross, further multiplying the support for emergency response efforts in the region.
Hudbay's Manitoba team continues to show remarkable resilience as demonstrated by the tremendous effort and unwavering commitment during this unprecedented wildfire season. They have tirelessly safeguarded the Company's assets and collaborated closely with local communities and provincial authorities, providing essential support to emergency response efforts.
On July 10, 2025, a second mandatory wildfire evacuation order was issued for the town of Snow Lake and a controlled, safe and orderly temporary suspension of the Snow Lake operations was implemented. As of August 12, 2025, the wildfire situation near Snow Lake has improved and Hudbay anticipates returning to normal operations later in August. The Company continues to expect to achieve its 2025 annual guidance metrics for all metals in Manitoba, despite the temporary wildfire impacts.
British Columbia Mill Optimization Project Achieves Key Milestone
In July, shortly following the end of the second quarter, Hudbay reached a significant milestone on the Copper Mountain mill optimization project to convert the third ball mill to a second SAG mill. The mill project is intended to increase nominal processing capacity to its permitted capacity of 50,000 tonnes per day starting in 2026.
The initial phase of the project achieved first ore production on July 10, a key milestone to ramp up mill capacity. The first phase was completed on time with more than 41,000 hours worked and zero lost-time incidents, which is a testament to the dedication and safety culture of Hudbay's team. The project remains on budget as it moves into the final phase of the project, which includes converting an interim feed arrangement to a permanent configuration and remains on track for completion in the second half of 2025.
New Ingerbelle Permit Application Achieves Key Milestone
On May 12, 2025, Hudbay's permitting application for the New Ingerbelle growth project at Copper Mountain was successfully accepted into review by the B.C. Major Mines Office and is now proceeding through a Mine Review Committee process. The Copper Mountain team continues ongoing engagement with First Nations and other local stakeholder groups as part of the Company's commitment to cultivating transparency and mutually beneficial relationships.
|
|
TSX, NYSE - HBM 2025 No. 23 |
Exploration Update
Large Snow Lake Exploration Program Continues to Execute Threefold Strategy
Hudbay continues to execute the largest exploration program in Snow Lake in the Company's history through extensive geophysical surveying and multi-phased drilling campaigns as part of Hudbay's threefold exploration strategy:
|
|
TSX, NYSE - HBM 2025 No. 23 |
Maria Reyna and Caballito Drill Permits Update
Hudbay controls a large, contiguous block of mineral rights with the potential to host satellite mineral deposits in close proximity to the Constancia processing facility, including the past producing Caballito property and the highly prospective Maria Reyna property. The Company commenced the drill permitting process at Maria Reyna and Caballito after completing a surface rights exploration agreement with the community of Uchucarcco in August 2022. As part of the drill permitting process, environmental impact assessment (EIA) applications were approved by the government in June 2024 for Maria Reyna and September 2024 for Caballito. The remaining steps in the drill permitting process include the completion by the government of the Consulta Previa consultation process with the local community.
Senior Management Team Appointments
In May 2025, Hudbay promoted Robert Carter to Senior Vice President, Canada and John O'Shaughnessy to Vice President, Manitoba Business Unit.
In his new role, Mr. Carter is responsible for the strategic oversight of Hudbay's business activities in Manitoba and British Columbia. Mr. Carter previously held the role of Vice President, Manitoba Business Unit since April 2022 and prior to that was the General Manager of Hudbay's Manitoba mines since 2018. He has over 25 years of mining industry experience in technical, operational and senior leadership roles, with a majority of those years at Hudbay.
As the new leader of the Manitoba Business Unit, Mr. O'Shaughnessy is responsible for the strategic and operational performance of Hudbay's activities in Manitoba. He previously held the role of Vice President, Business Development at Hudbay where he provided expert oversight and strategic leadership of the global mine planning process. He has over 25 years of mining industry experience, including numerous progressive engineering, operational and leadership roles at Vale's mining operations in Ontario and Newfoundland and Labrador.
Dividend Declared
A semi-annual dividend of C$0.01 per share was declared on August 12, 2025. The dividend will be paid out on September 19, 2025 to shareholders of record as of close of business on September 2, 2025.
|
|
TSX, NYSE - HBM 2025 No. 23 |
Website Links
Hudbay: www.hudbay.com
Management's Discussion and Analysis:
https://www.hudbayminerals.com/MDA825
Financial Statements:
https://www.hudbayminerals.com/FS825
Conference Call and Webcast
| Date: | Wednesday, August 13, 2025 |
| Time: | 11:00 a.m. ET |
| Webcast: | www.hudbay.com |
| Dial in: | 647-846-8185 or 1-833-752-3516 |
Qualified Person and NI 43-101
The technical and scientific information in this news release related to all of Hudbay's material mineral projects other than the Copper Mountain mine has been approved by Olivier Tavchandjian, P. Geo., Senior Vice President, Exploration and Technical Services. The technical and scientific information in this news release related to the Copper Mountain mine has been approved by Marc-Andre Brulotte, P. Geo., Director, Global Exploration and Resource Evaluation. Messrs. Tavchandjian and Brulotte are qualified persons pursuant to NI 43-101.
For a description of the key assumptions, parameters and methods used to estimate mineral reserves and resources at Hudbay's material mineral properties, as well as data verification procedures and a general discussion of the extent to which the estimates of scientific and technical information may be affected by any known environmental, permitting, legal title, taxation, sociopolitical, marketing or other relevant factors, please see the technical reports for the Company's material properties are available on SEDAR+ at www.sedarplus.ca and EDGAR at www.sec.gov.
|
|
TSX, NYSE - HBM 2025 No. 23 |
Non-GAAP Financial Performance Measures
Adjusted net earnings (loss) attributable to owners, adjusted net earnings (loss) per share attributable to owners, adjusted EBITDA, net debt, net debt to adjusted EBITDA, free cash flow, cash cost, sustaining and all-in sustaining cash cost per pound of copper produced, cash cost and sustaining cash cost per ounce of gold produced, combined unit cost and ratios based on these measures are non-GAAP performance measures. These measures do not have a meaning prescribed by IFRS and are therefore unlikely to be comparable to similar measures presented by other issuers. These measures should not be considered in isolation or as a substitute for measures prepared in accordance with IFRS and are not necessarily indicative of operating profit or cash flow from operations as determined under IFRS. Other companies may calculate these measures differently.
Management believes adjusted net earnings (loss) attributable to owners and adjusted net earnings (loss) per share attributable to owners provides an alternate measure of the Company's performance for the current period and gives insight into its expected performance in future periods. These measures are used internally by the Company to evaluate the performance of its underlying operations and to assist with its planning and forecasting of future operating results. As such, the Company believes these measures are useful to investors in assessing the Company's underlying performance. Hudbay provides adjusted EBITDA to help users analyze the Company's results and to provide additional information about its ongoing cash generating potential in order to assess its capacity to service and repay debt, carry out investments and cover working capital needs. Net debt is shown because it is a performance measure used by the Company to assess its financial position. Net debt to adjusted EBITDA is shown because it is a performance measure used by the Company to assess its financial leverage and debt capacity. Free cash flow is shown as it provides investors and management additional information in assessing the Company's ability to generate cash flow from current operations after investing in capital to sustain the operations. Cash cost, sustaining and all-in sustaining cash cost per pound of copper produced are shown because the Company believes they help investors and management assess the performance of its operations, including the margin generated by the operations and the Company. Cash cost and sustaining cash cost per ounce of gold produced are shown because the Company believes they help investors and management assess the performance of its Manitoba operations. Combined unit cost is shown because Hudbay believes it helps investors and management assess the Company's cost structure and margins that are not impacted by variability in by-product commodity prices.
The following tables provide detailed reconciliations to the most comparable IFRS measures.
|
|
TSX, NYSE - HBM 2025 No. 23 |
Adjusted Net Earnings (Loss) Reconciliation
| Three Months Ended | |||||||||
| (in $ millions) | Jun. 30, 2025 | Mar. 31, 2025 | Jun. 30, 2024 | ||||||
| Net earnings for the period | 114.7 | 99.2 | (20.3 | ) | |||||
| Tax expense | 38.4 | 72.1 | 20.7 | ||||||
| Earnings before tax | 153.1 | 171.3 | 0.4 | ||||||
| Adjusting items: | |||||||||
| Mark-to-market adjustments1 | 6.3 | (3.1 | ) | 19.5 | |||||
| Foreign exchange (gain) loss | (18.9 | ) | (3.1 | ) | 2.1 | ||||
| Re-evaluation adjustment - environmental provision | (13.8 | ) | 12.8 | (2.7 | ) | ||||
| Manitoba cost of sales and other expense from temporary shutdown | 5.3 | - | - | ||||||
| Variable consideration adjustment - stream revenue and accretion | - | (10.5 | ) | - | |||||
| Inventory adjustments | 3.5 | 1.2 | - | ||||||
| Reduction of obligation to renounce flow-through share expenditures, net of provisions | (1.2 | ) | (1.9 | ) | (0.3 | ) | |||
| Restructuring charges | - | 0.1 | 0.3 | ||||||
| Write-down/loss on disposal of PP&E | 0.3 | 0.6 | 2.1 | ||||||
| Changes in other provisions (non-capital) | - | 0.7 | - | ||||||
| Adjusted earnings before income taxes | 134.6 | 168.1 | 21.4 | ||||||
| Tax expense | (38.4 | ) | (72.1 | ) | (20.7 | ) | |||
| Tax impact on adjusting items | (23.0 | ) | (2.8 | ) | (2.4 | ) | |||
| Adjusted net earnings | 73.2 | 93.2 | (1.7 | ) | |||||
| Adjusted net earnings attributable to non-controlling interest: | |||||||||
| Net loss for the period | 3.0 | 1.2 | 3.8 | ||||||
| Adjusting items, including tax impact | (0.7 | ) | (0.6 | ) | (1.9 | ) | |||
| Adjusted net earnings - attributable to owners | 75.5 | 93.8 | 0.2 | ||||||
| Adjusted net earnings ($/share) - attributable to owners | 0.19 | 0.24 | 0.00 | ||||||
| Basic weighted average number of common shares outstanding (millions) | 395.1 | 395.0 | 368.3 | ||||||
1 Includes changes in fair value of the gold prepayment liability, Canadian junior mining investments, other financial assets and liabilities at fair value through net earnings and share-based compensation (recoveries) expenses. Also includes gains and losses on disposition of investments.
|
|
TSX, NYSE - HBM 2025 No. 23 |
Adjusted EBITDA Reconciliation
| Three Months Ended | |||||||||
| (in $ millions) | Jun. 30, 2025 | Mar. 31, 2025 | Jun. 30, 2024 | ||||||
| Net earnings for the period | 114.7 | 99.2 | (20.3 | ) | |||||
| Add back: | |||||||||
| Tax expense | 38.4 | 72.1 | 20.7 | ||||||
| Net finance expense | - | 14.4 | 44.3 | ||||||
| Other expenses | 7.1 | 5.2 | 11.2 | ||||||
| Depreciation and amortization | 96.4 | 108.1 | 97.6 | ||||||
| Amortization of deferred revenue and variable consideration adjustment | (15.4 | ) | (29.3 | ) | (11.5 | ) | |||
| Adjusting items (pre-tax): | |||||||||
| Re-evaluation adjustment - environmental provision | (13.8 | ) | 12.8 | (2.7 | ) | ||||
| Inventory adjustments | 3.5 | 1.2 | - | ||||||
| Manitoba cost of sales charge from temporary shutdown. | 3.2 | - | - | ||||||
| Option agreement proceeds (Marubeni) | 1.0 | 1.5 | - | ||||||
| Realized loss on non-QP hedges | (0.4 | ) | (1.9 | ) | (2.6 | ) | |||
| Share-based compensation expenses1 | 10.5 | 3.9 | 8.3 | ||||||
| Adjusted EBITDA | 245.2 | 287.2 | 145.0 | ||||||
1 Share-based compensation expenses reflected in cost of sales and selling and administrative expenses.
|
|
TSX, NYSE - HBM 2025 No. 23 |
Net Debt Reconciliation
| (in $ millions) | |||||||||
| Jun. 30, 2025 | Mar. 31, 2025 | Dec. 31, 2024 | |||||||
| Total debt | 1,059.6 | 1,108.7 | 1,107.5 | ||||||
| Less: Cash and cash equivalents | (625.5 | ) | (562.6 | ) | (541.8 | ) | |||
| Less: Short-term investments | - | (20.0 | ) | (40.0 | ) | ||||
| Net debt | 434.1 | 526.1 | 525.7 | ||||||
| (in $ millions, except net debt to adjusted EBITDA ratio) | |||||||||
| Net debt | 434.1 | 526.1 | 525.7 | ||||||
| Adjusted EBITDA (12-month period) | 995.9 | 895.7 | 823.3 | ||||||
| Net debt to adjusted EBITDA | 0.4 | 0.6 | 0.6 | ||||||
| Trailing Adjusted EBITDA | Three Months Ended | ||||||||||||||
| (in $ millions) | Jun. 30, 2025 |
Mar. 31, 2025 |
Dec. 31, 2024 |
Sept. 30, 2024 |
Jun. 30, 2024 |
||||||||||
| Earnings (loss) for the period | 114.7 | 99.2 | 19.3 | 50.4 | (20.4 | ) | |||||||||
| Add back: | |||||||||||||||
| Tax expense | 38.4 | 72.1 | 84.4 | 29.3 | 20.8 | ||||||||||
| Net finance expense | - | 14.4 | 34.4 | 26.0 | 44.3 | ||||||||||
| Other expenses | 7.1 | 5.2 | 22.1 | 7.9 | 11.2 | ||||||||||
| Depreciation and amortization | 96.4 | 108.1 | 122.2 | 97.5 | 97.6 | ||||||||||
| Amortization of deferred revenue and variable consideration adjustment | (15.4 | ) | (29.3 | ) | (26.2 | ) | (9.5 | ) | (11.5 | ) | |||||
| Adjusting items (pre-tax): | |||||||||||||||
| Re-evaluation adjustment - environmental provision | (13.8 | ) | 12.8 | 2.5 | 2.0 | (2.7 | ) | ||||||||
| Inventory adjustments | 3.5 | 1.2 | 1.3 | 1.6 | - | ||||||||||
| Cash portion of Manitoba cost of sales direct charge from temporary shutdown | 3.2 | - | - | - | - | ||||||||||
| Realized loss on non-QP hedges | (0.4 | ) | (1.9 | ) | (4.2 | ) | (2.1 | ) | (2.6 | ) | |||||
| Option agreement proceeds (Marubeni) | 1.0 | 1.5 | - | - | - | ||||||||||
| Share-based compensation expenses1 | 10.5 | 3.9 | 1.5 | 3.1 | 8.3 | ||||||||||
| Adjusted EBITDA | 245.2 | 287.2 | 257.3 | 206.2 | 145.0 | ||||||||||
| LTM2 | 995.9 | 895.7 | 823.3 | ||||||||||||
1 Share-based compensation expense reflected in cost of sales and administrative expenses.
2 LTM (last twelve months) as of June 30, 2025, March 31, 2025 and December 31, 2024. Annual consolidated results may not be calculated based on the amounts presented in this table due to rounding.
|
|
TSX, NYSE - HBM 2025 No. 23 |
Free Cash Flow Reconciliation
| (in $ millions) | Three Months Ended | ||||||||
| Jun. 30, 2025 | Mar. 31, 2025 | Jun. 30, 2024 | |||||||
| Cash generated from operations | 259.9 | 124.8 | 140.2 | ||||||
| Adjusting items: | |||||||||
| Change in non-cash working capital | 66.0 | (38.7 | ) | 16.5 | |||||
| Cash sustaining capital expenditures1 | 106.1 | 76.1 | 91.2 | ||||||
| Free cash flow | 87.8 | 87.4 | 32.5 | ||||||
| Cash sustaining capital expenditures1 | |||||||||
| Total sustaining capital costs | 88.6 | 62.5 | 80.9 | ||||||
| Capitalized lease and equipment financing cash payments - operating sites | 13.4 | 12.8 | 9.6 | ||||||
| Community agreement cash payments | 4.1 | 0.8 | 0.7 | ||||||
| Cash sustaining capital expenditures1 | 106.1 | 76.1 | 91.2 | ||||||
| Three Months Ended | |||||||||||||||
| (in $ millions) | Jun. 30, 2025 |
Mar. 31, 2025 |
Dec. 31, 2024 |
Sept. 30, 2024 |
LTM2 | ||||||||||
| Cash generated from operations | 259.9 | 124.8 | 238.1 | 148.2 | 771.0 | ||||||||||
| Adjusting items: | |||||||||||||||
| Change in non-cash working capital | 66.0 | (38.7 | ) | 6.6 | (40.1 | ) | (6.2 | ) | |||||||
| Cash sustaining capital expenditures1 | 106.1 | 76.1 | 82.6 | 99.9 | 364.7 | ||||||||||
| Free cash flow | 87.8 | 87.4 | 148.9 | 88.4 | 412.5 | ||||||||||
| Cash sustaining capital expenditures1 | |||||||||||||||
| Total sustaining capital costs | 88.6 | 62.5 | 71.6 | 89.4 | 312.1 | ||||||||||
| Capitalized lease and equipment financing cash payments - operating sites | 13.4 | 12.8 | 10.3 | 10.2 | 46.7 | ||||||||||
| Community agreement cash payments | 4.1 | 0.8 | 0.7 | 0.3 | 5.9 | ||||||||||
| Cash sustaining capital expenditures1 | 106.1 | 76.1 | 82.6 | 99.9 | 364.7 | ||||||||||
1 Excludes amortization of decommissioning and restoration PP&E assets and accretion of decommissioning and restoration liabilities related to producing sites.
2 LTM (last twelve months) as at June 30, 2025Copper Cash Cost Reconciliation
|
|
TSX, NYSE - HBM 2025 No. 23 |
| Consolidated | Three Months Ended | ||||||||
| Net pounds of copper produced1 | |||||||||
| (in thousands) | Jun. 30, 2025 | Mar. 31, 2025 | Jun. 30, 2024 | ||||||
| Peru | 47,863 | 44,738 | 42,366 | ||||||
| Manitoba | 3,554 | 7,648 | 5,825 | ||||||
| British Columbia | 14,626 | 15,864 | 14,813 | ||||||
| Net pounds of copper produced | 66,043 | 68,250 | 63,004 | ||||||
1 Contained copper in concentrate.
| Consolidated | Three Months Ended | |||||||||||||||||
| Jun. 30, 2025 | Mar. 31, 2025 | Jun. 30, 2024 | ||||||||||||||||
| Cash cost per pound of copper produced | $ millions | $/lb | $ millions | $/lb | $ millions | $/lb | ||||||||||||
| Mining | 85.8 | 1.30 | 91.2 | 1.34 | 93.1 | 1.47 | ||||||||||||
| Milling | 92.6 | 1.40 | 80.6 | 1.18 | 88.0 | 1.40 | ||||||||||||
| G&A | 43.1 | 0.66 | 43.6 | 0.64 | 35.3 | 0.56 | ||||||||||||
| Onsite costs | 221.5 | 3.36 | 215.4 | 3.16 | 216.4 | 3.43 | ||||||||||||
| Treatment & refining | 3.3 | 0.05 | 14.0 | 0.21 | 22.5 | 0.36 | ||||||||||||
| Freight & other | 20.8 | 0.31 | 24.3 | 0.35 | 21.8 | 0.34 | ||||||||||||
| Cash cost, before by-product credits | 245.6 | 3.72 | 253.7 | 3.72 | 260.7 | 4.13 | ||||||||||||
| By-product credits | (247.3 | ) | (3.74 | ) | (284.7 | ) | (4.17 | ) | (188.7 | ) | (2.99 | ) | ||||||
| Cash cost, net of by-product credits | (1.7 | ) | (0.02 | ) | (31.0 | ) | (0.45 | ) | 72.0 | 1.14 | ||||||||
| Consolidated | Three Months Ended | |||||||||||||||||
| Jun. 30, 2025 | Mar. 31, 2025 | Jun. 30, 2024 | ||||||||||||||||
| Supplementary cash cost information | $ millions | $/lb1 | $ millions | $/lb1 | $ millions | $/lb1 | ||||||||||||
| By-product credits2: | ||||||||||||||||||
| Zinc | 7.3 | 0.11 | 13.8 | 0.20 | 14.9 | 0.23 | ||||||||||||
| Gold3 | 195.8 | 2.96 | 225.4 | 3.30 | 136.2 | 2.16 | ||||||||||||
| Silver3 | 23.4 | 0.35 | 26.1 | 0.38 | 18.1 | 0.29 | ||||||||||||
| Molybdenum & other | 20.8 | 0.32 | 19.4 | 0.29 | 19.5 | 0.31 | ||||||||||||
| Total by-product credits | 247.3 | 3.74 | 284.7 | 4.17 | 188.7 | 2.99 | ||||||||||||
| Reconciliation to IFRS: | ||||||||||||||||||
| Cash cost, net of by-product credits | (1.7 | ) | (31.0 | ) | 72.0 | |||||||||||||
| By-product credits | 247.3 | 284.7 | 188.7 | |||||||||||||||
| Treatment and refining charges | (3.3 | ) | (14.0 | ) | (22.5 | ) | ||||||||||||
| Share-based compensation expense | 0.9 | 0.7 | 0.6 | |||||||||||||||
| Inventory adjustments | 3.5 | 1.2 | - | |||||||||||||||
| Change in product inventory | 11.4 | 12.0 | 10.0 | |||||||||||||||
| Royalties | 2.2 | 1.9 | 1.5 | |||||||||||||||
| Overhead costs incurred during temporary suspension | 3.2 | - | - | |||||||||||||||
| Depreciation and amortization3 | 96.4 | 108.1 | 97.6 | |||||||||||||||
| Cost of sales | 359.9 | 363.6 | 347.9 | |||||||||||||||
1 Per pound of copper produced.
2 By-product credits are computed as revenue per consolidated financial statements, including amortization of deferred revenue and pricing and volume adjustments.
3 Gold and silver by-product credits do not include variable consideration adjustments with respect to stream arrangements. Variable consideration adjustments are cumulative adjustments to gold and silver stream deferred revenue primarily associated with the net change in mineral reserves and resources or amendments to the mine plan that would change the total expected deliverable ounces under the precious metal streaming arrangement. For the three months ended June 30, 2025 the variable consideration adjustments amounted to $nil (three months ended June 30, 2024 - $nil and March 31, 2025 - gain of $9.9 million).
4 Depreciation is based on concentrate sold.
|
|
TSX, NYSE - HBM 2025 No. 23 |
| Peru | Three Months Ended | ||||||||
| (in thousands) | Jun. 30, 2025 | Mar. 31, 2025 | Jun. 30, 2024 | ||||||
| Net pounds of copper produced1 | 47,863 | 44,738 | 42,366 | ||||||
1 Contained copper in concentrate.
| Peru | Three Months Ended | |||||||||||||||||
| Jun. 30, 2025 | Mar. 31, 2025 | Jun. 30, 2024 | ||||||||||||||||
| Cash cost per pound of copper produced | $ millions | $/lb | $ millions | $/lb | $ millions | $/lb | ||||||||||||
| Mining | 28.1 | 0.59 | 31.0 | 0.69 | 31.3 | 0.74 | ||||||||||||
| Milling | 57.8 | 1.21 | 44.4 | 0.99 | 51.3 | 1.21 | ||||||||||||
| G&A | 23.2 | 0.48 | 22.5 | 0.51 | 19.4 | 0.46 | ||||||||||||
| Onsite costs | 109.1 | 2.28 | 97.9 | 2.19 | 102.0 | 2.41 | ||||||||||||
| Treatment & refining | (0.1 | ) | (0.00 | ) | 6.7 | 0.15 | 11.1 | 0.26 | ||||||||||
| Freight & other | 12.4 | 0.25 | 15.2 | 0.34 | 12.6 | 0.30 | ||||||||||||
| Cash cost, before by-product credits | 121.4 | 2.53 | 119.8 | 2.68 | 125.7 | 2.97 | ||||||||||||
| By-product credits | (51.8 | ) | (1.08 | ) | (70.2 | ) | (1.57 | ) | (50.3 | ) | (1.19 | ) | ||||||
| Cash cost, net of by-product credits | 69.6 | 1.45 | 49.6 | 1.11 | 75.4 | 1.78 | ||||||||||||
| Peru | Three Months Ended | |||||||||||||||||
| Jun. 30, 2025 | Mar. 31, 2025 | Jun. 30, 2024 | ||||||||||||||||
| Supplementary cash cost information | $ millions | $/lb1 | $ millions | $/lb1 | $ millions | $/lb1 | ||||||||||||
| By-product credits2: | ||||||||||||||||||
| Gold3 | 17.3 | 0.36 | 35.0 | 0.78 | 21.6 | 0.51 | ||||||||||||
| Silver3 | 13.7 | 0.29 | 15.6 | 0.35 | 9.7 | 0.23 | ||||||||||||
| Molybdenum | 20.8 | 0.43 | 19.6 | 0.44 | 19.0 | 0.45 | ||||||||||||
| Total by-product credits | 51.8 | 1.08 | 70.2 | 1.57 | 50.3 | 1.19 | ||||||||||||
| Reconciliation to IFRS: | ||||||||||||||||||
| Cash cost, net of by-product credits | 69.6 | 49.6 | 75.4 | |||||||||||||||
| By-product credits | 51.8 | 70.2 | 50.3 | |||||||||||||||
| Treatment and refining charges | 0.1 | (6.7 | ) | (11.1 | ) | |||||||||||||
| Inventory adjustments | 1.1 | 0.4 | - | |||||||||||||||
| Share-based compensation expenses | 0.2 | 0.1 | 0.2 | |||||||||||||||
| Change in product inventory | 4.0 | 13.8 | 1.1 | |||||||||||||||
| Royalties | 1.0 | 1.1 | 0.9 | |||||||||||||||
| Depreciation and amortization4 | 56.0 | 68.2 | 58.9 | |||||||||||||||
| Cost of sales5 | 183.8 | 196.7 | 175.7 | |||||||||||||||
1 Per pound of copper produced.
2 By-product credits are computed as revenue per consolidated financial statements, including amortization of deferred revenue and pricing and volume adjustments.
3 Gold and silver by-product credits do not include variable consideration adjustments with respect to stream arrangements.
4 Depreciation is based on concentrate sold.
5 As per the consolidated financial statements.
|
|
TSX, NYSE - HBM 2025 No. 23 |
| British Columbia | Three Months Ended | ||
| (in thousands) | Jun. 30, 2025 | Mar. 31, 2025 | Jun. 30, 2024 |
| Net pounds of copper produced1 | 14,626 | 15,864 | 14,813 |
1 Contained copper in concentrate.
| British Columbia | Three Months Ended | |||||||||||||||||
| Jun. 30, 2025 | Mar. 31, 2025 | Jun. 30, 2024 | ||||||||||||||||
| Cash cost per pound of copper produced | $ millions | $/lb | $ millions | $/lb | $ millions | $/lb | ||||||||||||
| Mining | 24.2 | 1.65 | 21.9 | 1.38 | 19.5 | 1.31 | ||||||||||||
| Milling | 21.4 | 1.46 | 21.8 | 1.37 | 21.5 | 1.45 | ||||||||||||
| G&A | 6.1 | 0.42 | 6.3 | 0.40 | 5.4 | 0.37 | ||||||||||||
| Onsite costs | 51.7 | 3.53 | 50.0 | 3.15 | 46.4 | 3.13 | ||||||||||||
| Treatment & refining | 2.1 | 0.14 | 3.6 | 0.23 | 4.2 | 0.29 | ||||||||||||
| Freight & other | 3.3 | 0.24 | 3.4 | 0.21 | 3.5 | 0.23 | ||||||||||||
| Cash cost, before by-product credits | 57.1 | 3.91 | 57.0 | 3.59 | 54.1 | 3.65 | ||||||||||||
| By-product credits | (22.2 | ) | (1.52 | ) | (18.3 | ) | (1.15 | ) | (14.5 | ) | (0.98 | ) | ||||||
| Cash cost, net of by-product credits | 34.9 | 2.39 | 38.7 | 2.44 | 39.6 | 2.67 | ||||||||||||
| British Columbia | Three Months Ended | |||||||||||||||||
| Jun. 30, 2025 | Mar. 31, 2025 | Jun. 30, 2024 | ||||||||||||||||
| Supplementary cash cost information | $ millions | $/lb1 | $ millions | $/lb1 | $ millions | $/lb1 | ||||||||||||
| By-product credits2: | ||||||||||||||||||
| Gold | 19.8 | 1.35 | 16.1 | 1.01 | 12.2 | 0.82 | ||||||||||||
| Silver | 2.4 | 0.17 | 2.2 | 0.14 | 2.3 | 0.16 | ||||||||||||
| Total by-product credits | 22.2 | 1.52 | 18.3 | 1.15 | 14.5 | 0.98 | ||||||||||||
| Reconciliation to IFRS: | ||||||||||||||||||
| Cash cost, net of by-product credits | 34.9 | 38.7 | 39.6 | |||||||||||||||
| By-product credits | 22.2 | 18.3 | 14.5 | |||||||||||||||
| Treatment and refining charges | (2.1 | ) | (3.6 | ) | (4.2 | ) | ||||||||||||
| Share based payment | 0.2 | 0.3 | - | |||||||||||||||
| Change in product inventory | 3.6 | (0.8 | ) | 11.3 | ||||||||||||||
| Inventory adjustments | 1.4 | 0.8 | - | |||||||||||||||
| Royalties | 1.2 | 0.8 | 0.6 | |||||||||||||||
| Depreciation and amortization3 | 16.8 | 16.0 | 14.0 | |||||||||||||||
| Cost of sales4 | 78.2 | 70.5 | 75.8 | |||||||||||||||
1 Per pound of copper produced.
2 By-product credits are computed as revenue per consolidated financial statements, including amortization of deferred revenue and pricing and volume adjustments.
3 Depreciation is based on concentrate sold.
4 As per consolidated financial statements.
|
|
TSX, NYSE - HBM 2025 No. 23 |
Sustaining and All-in Sustaining Cash Cost Reconciliation
| Consolidated | Three Months Ended | |||||||||||||||||
| Jun. 30, 2025 | Mar. 31, 2025 | Jun. 30, 2024 | ||||||||||||||||
| All-in sustaining cash cost per pound of copper produced | $ millions | $/lb | $ millions | $/lb | $ millions | $/lb | ||||||||||||
| Cash cost, net of by-product credits | (1.7 | ) | (0.02 | ) | (31.0 | ) | (0.45 | ) | 72.0 | 1.14 | ||||||||
| Cash sustaining capital expenditures | 108.3 | 1.64 | 78.2 | 1.14 | 93.0 | 1.48 | ||||||||||||
| Royalties | 2.2 | 0.03 | 1.9 | 0.03 | 1.5 | 0.03 | ||||||||||||
| Sustaining cash cost, net of by-product credits | 108.8 | 1.65 | 49.1 | 0.72 | 166.5 | 2.65 | ||||||||||||
| Corporate selling and administrative expenses & regional costs | 22.1 | 0.33 | 15.3 | 0.22 | 19.8 | 0.32 | ||||||||||||
| Accretion and amortization of decommissioning and community agreements1 | 3.2 | 0.05 | 2.0 | 0.03 | 6.6 | 0.10 | ||||||||||||
| All-in sustaining cash cost, net of by-product credits | 134.1 | 2.03 | 66.4 | 0.97 | 192.9 | 3.07 | ||||||||||||
| Reconciliation to property, plant and equipment additions | ||||||||||||||||||
| Property, plant and equipment additions | 93.6 | 68.2 | 75.2 | |||||||||||||||
| Capitalized stripping net additions | 53.8 | 41.3 | 43.4 | |||||||||||||||
| Total accrued capital additions | 147.4 | 109.5 | 118.6 | |||||||||||||||
| Less other non-sustaining capital costs2 | 58.8 | 47.0 | 37.7 | |||||||||||||||
| Total sustaining capital costs | 88.6 | 62.5 | 80.9 | |||||||||||||||
| Capitalized lease & equipment financing cash payments - operating sites | 13.4 | 12.8 | 9.6 | |||||||||||||||
| Community agreement cash payments | 4.1 | 0.8 | 0.7 | |||||||||||||||
| Accretion and amortization of decommissioning and restoration obligations3 | 2.2 | 2.1 | 1.8 | |||||||||||||||
| Cash sustaining capital expenditures | 108.3 | 78.2 | 93.0 | |||||||||||||||
1 Includes accretion of decommissioning relating to non-productive sites, and accretion and amortization of community agreements capitalized to Other assets.
2 Other non-sustaining capital costs include Arizona capitalized costs, capitalized interest, capitalized exploration, right-of-use lease asset additions, equipment financing asset additions, growth capital expenditures and reclassification related to capital spares.
3 Includes amortization of decommissioning and restoration PP&E assets and accretion of decommissioning and restoration liabilities related to producing sites.
| Peru | Three Months Ended | |||||||||||||||||
| Jun. 30, 2025 | Mar. 31, 2025 | Jun. 30, 2024 | ||||||||||||||||
| Sustaining cash cost per pound of copper produced | $ millions | $/lb | $ millions | $/lb | $ millions | $/lb | ||||||||||||
| Cash cost, net of by-product credits | 69.6 | 1.45 | 49.6 | 1.11 | 75.4 | 1.78 | ||||||||||||
| Cash sustaining capital expenditures | 55.1 | 1.15 | 35.3 | 0.79 | 33.8 | 0.80 | ||||||||||||
| Royalties | 1.0 | 0.03 | 1.1 | 0.02 | 0.9 | 0.02 | ||||||||||||
| Sustaining cash cost per pound of copper produced | 125.7 | 2.63 | 86.0 | 1.92 | 110.1 | 2.60 | ||||||||||||
|
|
TSX, NYSE - HBM 2025 No. 23 |
| British Columbia | Three Months Ended | |||||||||||||||||
| Jun. 30, 2025 | Mar. 31, 2025 | Jun. 30, 2024 | ||||||||||||||||
| Sustaining cash cost per pound of copper produced | $ millions | $/lb | $ millions | $/lb | $ millions | $/lb | ||||||||||||
| Cash cost, net of by-product credits | 34.9 | 2.39 | 38.7 | 2.44 | 39.6 | 2.67 | ||||||||||||
| Cash sustaining capital expenditures | 39.6 | 2.71 | 27.8 | 1.75 | 42.1 | 2.84 | ||||||||||||
| Royalties | 1.2 | 0.08 | 0.8 | 0.05 | 0.6 | 0.05 | ||||||||||||
| Sustaining cash cost per pound of copper produced | 75.7 | 5.18 | 67.3 | 4.24 | 82.3 | 5.56 | ||||||||||||
Gold Cash Cost and Sustaining Cash Cost Reconciliation
| Manitoba | Three Months Ended | ||
| (in thousands) | Jun. 30, 2025 | Mar. 31, 2025 | Jun. 30, 2024 |
| Net ounces of gold produced1 | 43,235 | 60,354 | 43,488 |
1 Contained gold in concentrate and doré.
| Manitoba | Three Months Ended | |||||||||||||||||
| Jun. 30, 2025 | Mar. 31, 2025 | Jun. 30, 2024 | ||||||||||||||||
| Cash cost per ounce of gold produced | $millions | $/oz | $millions | $/oz | $millions | $/oz | ||||||||||||
| Mining | 33.5 | 775 | 38.3 | 634 | 42.3 | 973 | ||||||||||||
| Milling | 13.4 | 310 | 14.4 | 239 | 15.2 | 350 | ||||||||||||
| G&A | 13.8 | 319 | 14.8 | 245 | 10.5 | 240 | ||||||||||||
| Onsite costs | 60.7 | 1,404 | 67.5 | 1,118 | 68.0 | 1,563 | ||||||||||||
| Treatment & refining | 1.3 | 30 | 3.7 | 61 | 7.2 | 167 | ||||||||||||
| Freight & other | 5.1 | 118 | 5.7 | 95 | 5.7 | 130 | ||||||||||||
| Cash cost, before by-product credits | 67.1 | 1,552 | 76.9 | 1,274 | 80.9 | 1,860 | ||||||||||||
| By-product credits | (36.4 | ) | (842 | ) | (54.2 | ) | (898 | ) | (47.4 | ) | (1,090 | ) | ||||||
| Gold cash cost, net of by-product credits | 30.7 | 710 | 22.7 | 376 | 33.5 | 771 | ||||||||||||
|
|
TSX, NYSE - HBM 2025 No. 23 |
| Manitoba | Three Months Ended | |||||||||||||||||
| Jun. 30, 2025 | Mar. 31, 2025 | Jun. 30, 2024 | ||||||||||||||||
| Supplementary cash cost information | $millions | $/oz1 | $millions | $/oz1 | $millions | $/oz1 | ||||||||||||
| By-product credits2: | ||||||||||||||||||
| Copper | 21.8 | 504 | 32.3 | 535 | 25.9 | 596 | ||||||||||||
| Zinc | 7.3 | 169 | 13.8 | 228 | 14.9 | 343 | ||||||||||||
| Silver | 7.3 | 169 | 8.3 | 138 | 6.1 | 140 | ||||||||||||
| Other | - | - | (0.2 | ) | (3 | ) | 0.5 | 11 | ||||||||||
| Total by-product credits | 36.4 | 842 | 54.2 | 898 | 47.4 | 1,090 | ||||||||||||
| Reconciliation to IFRS: | ||||||||||||||||||
| Cash cost, net of by-product credits | 30.7 | 22.7 | 33.5 | |||||||||||||||
| By-product credits | 36.4 | 54.2 | 47.4 | |||||||||||||||
| Treatment and refining charges | (1.3 | ) | (3.7 | ) | (7.2 | ) | ||||||||||||
| Inventory adjustments | 1.0 | - | - | |||||||||||||||
| Past service cost | - | - | - | |||||||||||||||
| Share-based compensation expenses | 0.5 | 0.3 | 0.4 | |||||||||||||||
| Change in product inventory | 3.8 | (1.0 | ) | (2.4 | ) | |||||||||||||
| Overhead costs incurred during temporary suspension | 3.2 | - | - | |||||||||||||||
| Depreciation and amortization3 | 23.6 | 23.9 | 24.7 | |||||||||||||||
| Cost of sales4 | 97.9 | 96.4 | 96.4 | |||||||||||||||
1 Per ounce of gold produced.
2 By-product credits are computed as revenue per consolidated financial statements, amortization of deferred revenue, pricing and volume adjustments.
3 Depreciation is based on concentrate sold.
4 As per consolidated financial statements.
| Manitoba | Three Months Ended | |||||||||||||||||
| Jun. 30, 2025 | Mar. 31, 2025 | Jun. 30, 2024 | ||||||||||||||||
| Sustaining cash cost per pound of gold produced | $millions | $/oz | $millions | $/oz | $millions | $/oz | ||||||||||||
| Gold cash cost, net of by-product credits | 30.7 | 710 | 22.7 | 376 | 33.5 | 771 | ||||||||||||
| Cash sustaining capital expenditures | 13.6 | 315 | 15.1 | 250 | 17.1 | 392 | ||||||||||||
| Sustaining cash cost per pound of gold produced | 44.3 | 1,025 | 37.8 | 626 | 50.6 | 1,163 | ||||||||||||
|
|
TSX, NYSE - HBM 2025 No. 23 |
Combined Unit Cost Reconciliation
| Peru | Three Months Ended | ||||||||
| (in millions except ore tonnes milled and unit cost per tonne) | |||||||||
| Combined unit cost per tonne processed | Jun. 30, 2025 | Mar. 31, 2025 | Jun. 30, 2024 | ||||||
| Mining | 28.1 | 31.0 | 31.3 | ||||||
| Milling | 57.8 | 44.4 | 51.3 | ||||||
| G&A1 | 23.2 | 22.5 | 19.4 | ||||||
| Other G&A2 | (6.4 | ) | (7.9 | ) | (4.1 | ) | |||
| Unit cost | 102.7 | 90.0 | 97.9 | ||||||
| Tonnes ore milled | 7,559 | 8,114 | 7,719 | ||||||
| Combined unit cost per tonne | 13.59 | 11.09 | 12.68 | ||||||
| Reconciliation to IFRS: | |||||||||
| Unit cost | 102.7 | 90.0 | 97.9 | ||||||
| Freight & other | 12.4 | 15.2 | 12.6 | ||||||
| Inventory adjustments | 1.1 | 0.4 | - | ||||||
| Other G&A | 6.4 | 7.9 | 4.1 | ||||||
| Share-based compensation expenses | 0.2 | 0.1 | 0.2 | ||||||
| Change in product inventory | 4.0 | 13.8 | 1.1 | ||||||
| Royalties | 1.0 | 1.1 | 0.9 | ||||||
| Depreciation and amortization | 56.0 | 68.2 | 58.9 | ||||||
| Cost of sales3 | 183.8 | 196.7 | 175.7 | ||||||
1 G&A as per cash cost reconciliation above.
2 Other G&A primarily includes profit sharing costs.
3 As per consolidated financial statements.
| British Columbia | Three Months Ended | ||||||||
| (in millions except tonnes ore milled and unit cost per tonne) | |||||||||
| Combined unit cost per tonne processed | Jun. 30, 2025 | Mar. 31, 2025 | Jun. 30, 2024 | ||||||
| Mining | 24.2 | 21.9 | 19.5 | ||||||
| Milling | 21.4 | 21.8 | 21.5 | ||||||
| G&A1 | 6.1 | 6.3 | 5.4 | ||||||
| Unit cost | 51.7 | 50.0 | 46.4 | ||||||
| USD/CAD implicit exchange rate | 1.38 | 1.43 | 1.36 | ||||||
| Unit cost - C$ | 71.1 | 71.7 | 63.5 | ||||||
| Tonnes ore milled | 2,900 | 2,761 | 3,232 | ||||||
| Combined unit cost per tonne - C$ | 24.51 | 25.98 | 19.65 | ||||||
| Reconciliation to IFRS: | |||||||||
| Unit cost | 51.7 | 50.0 | 46.4 | ||||||
| Freight & other | 3.3 | 3.4 | 3.5 | ||||||
| Share-based compensation expenses | 0.2 | 0.3 | - | ||||||
| Change in product inventory | 3.6 | (0.8 | ) | 11.3 | |||||
| Inventory adjustments | 1.4 | 0.8 | - | ||||||
| Royalties | 1.2 | 0.8 | 0.6 | ||||||
| Depreciation and amortization | 16.8 | 16.0 | 14.0 | ||||||
| Cost of sales2 | 78.2 | 70.5 | 75.8 | ||||||
1 G&A as per cash cost reconciliation above
2 As per consolidated interim financial statements.
|
|
TSX, NYSE - HBM 2025 No. 23 |
| Manitoba | Three Months Ended | ||||||||
| (in millions except ore tonnes milled and unit cost per tonne) | |||||||||
| Combined unit cost per tonne processed | Jun. 30, 2025 | Mar. 31, 2025 | Jun. 30, 2024 | ||||||
| Mining | 33.5 | 38.3 | 42.3 | ||||||
| Milling | 13.4 | 14.4 | 15.2 | ||||||
| G&A1 | 13.8 | 14.8 | 10.5 | ||||||
| Less: Other G&A related to profit sharing costs | (7.2 | ) | (7.2 | ) | (3.4 | ) | |||
| Unit cost | 53.5 | 60.3 | 64.6 | ||||||
| USD/CAD implicit exchange rate | 1.38 | 1.43 | 1.38 | ||||||
| Unit cost - C$ | 73.9 | 86.5 | 89.3 | ||||||
| Tonnes ore milled | 307,138 | 404,410 | 397,426 | ||||||
| Combined unit cost per tonne2 - C$ | 241 | 214 | 225 | ||||||
| Reconciliation to IFRS: | |||||||||
| Unit cost | 53.5 | 60.3 | 64.6 | ||||||
| Freight & other | 5.1 | 5.7 | 5.7 | ||||||
| Other G&A related to profit sharing | 7.2 | 7.2 | 3.4 | ||||||
| Share-based compensation expenses | 0.5 | 0.3 | 0.4 | ||||||
| Inventory adjustments | 1.0 | - | - | ||||||
| Change in product inventory | 3.8 | (1.0 | ) | (2.4 | ) | ||||
| Overhead costs incurred during temporary suspension | 3.2 | - | - | ||||||
| Depreciation and amortization | 23.6 | 23.9 | 24.7 | ||||||
| Cost of sales3 | 97.9 | 96.4 | 96.4 | ||||||
1 G&A as per cash cost reconciliation above.
2 Excludes $3.2 million (C$14 per tonne) of overhead costs incurred during temporary suspension during the three months ended June 30, 2025.
3 As per consolidated interim financial statements.
|
|
TSX, NYSE - HBM 2025 No. 23 |
Forward-Looking Information
This news release contains forward-looking information within the meaning of applicable Canadian and United States securities legislation. All information contained in this news release, other than statements of current and historical fact, is forward-looking information. Often, but not always, forward-looking information can be identified by the use of words such as "plans", "expects", "budget", "guidance", "scheduled", "estimates", "forecasts", "strategy", "target", "intends", "objective", "goal", "understands", "anticipates" and "believes" (and variations of these or similar words) and statements that certain actions, events or results "may", "could", "would", "should", "might" "occur" or "be achieved" or "will be taken" (and variations of these or similar expressions). All of the forward-looking information in this news release is qualified by this cautionary note.
Forward-looking information includes, but is not limited to, statements with respect to Hudbay's production, cost and capital and exploration expenditure guidance, and the potential impact thereon from wildfires and any related evacuation or government orders in Manitoba and British Columbia or social unrest in Peru, the Snow Lake operations' ability to ramp up to full production in a timely manner after its suspension of operations, expectations regarding reductions in discretionary spending and capital expenditures, Hudbay's ability to advance and complete the optimization of the Copper Mountain mine operation including with respect to the ongoing SAG mill conversion and configuration project, the implementation of stripping strategies and the expected benefits therefrom, the estimated timelines and pre-requisites for sanctioning the Copper World project, the consummation and timing of the JV Transaction, the satisfaction of the conditions precedent to the JV Transaction, including but not limited to receipt of regulatory approvals, expectations regarding the anticipated benefits of the JV Transaction to Hudbay, and the United States, the consummation and timing of the DFS, expectations regarding the results of any challenges to the permits for the Copper World project and the potential impact of recent policy decisions from the United States government, the expected benefits of the sanctioning of Copper World project, and the benefits, timing and consummation of the amended Wheaton Stream, the expected benefits of Manitoba growth initiatives, including the use of the exploration drift at the 1901 deposit, and the potential utilization of excess capacity at the Stall mill, Hudbay's future deleveraging strategies and Hudbay's ability to deleverage and repay debt as needed, expectations regarding Hudbay's cash balance and liquidity, expectations regarding tax synergies, expectations regarding the ability to conduct exploration work and execute on exploration programs on its properties and to advance related drill plans, including the advancement of the exploration program at Maria Reyna and Caballito and the status and anticipated timing of the related drill permit application process, expectations regarding the prospective nature of the Maria Reyna and Caballito properties, the ability to continue mining higher-grade ore in the Pampacancha pit and Hudbay's expectations resulting therefrom, Hudbay's evaluation and assessment of opportunities to reprocess tailings using various metallurgical technologies, the anticipated impact of brownfield and greenfield growth projects on Hudbay's performance, anticipated expansion opportunities and extension of mine life in Snow Lake and Hudbay's ability to find a new anchor deposit near Hudbay's Snow Lake operations, anticipated future drill programs and exploration activities and any results expected therefrom, anticipated mine plans, anticipated metals prices and the anticipated sensitivity of Hudbay's financial performance to metals prices, events that may affect Hudbay's operations and development projects, anticipated cash flows from operations and related liquidity requirements, the anticipated effect of external factors on revenue, such as commodity prices, estimation of mineral reserves and resources, mine life projections, reclamation costs, economic outlook, government regulation of mining operations, and business and acquisition strategies. Forward-looking information is not, and cannot be, a guarantee of future results or events. Forward-looking information is based on, among other things, opinions, assumptions, estimates and analyses that, while considered reasonable by Hudbay at the date the forward-looking information is provided, inherently are subject to significant risks, uncertainties, contingencies and other factors that may cause actual results and events to be materially different from those expressed or implied by the forward-looking information.
|
|
TSX, NYSE - HBM 2025 No. 23 |
The material factors or assumptions that Hudbay has identified and were applied in drawing conclusions or making forecasts or projections set out in the forward-looking information include, but are not limited to:
|
|
TSX, NYSE - HBM 2025 No. 23 |
The risks, uncertainties, contingencies and other factors that may cause actual results to differ materially from those expressed or implied by the forward-looking information may include, but are not limited to, risks associated with satisfying the conditions to the closing of the JV Transaction, including the timing, receipt and any conditions associated with regulatory approvals, risks associated with reaching a definitive agreement with Wheaton in respect of the enhanced precious metals stream, risks related to the failure to effectively advance and complete the optimization of the Copper Mountain mine operations including with respect to the ongoing SAG mill conversion and configuration project, political and social risks in the regions Hudbay operates, including the complex political and social environment in Peru and potential disruptions to operations arising from community protests and grievances, risks generally associated with the mining industry and the current geopolitical environment, including future commodity prices, the potential implementation or expansion of tariffs, currency and interest rate fluctuations, energy and consumable prices, supply chain constraints and general cost escalation in the current inflationary environment, uncertainties related to the development and operation of Hudbay's projects, the risk of an indicator of impairment or impairment reversal relating to a material mineral property, risks related to the Copper World project, including in relation to project delivery and financing risks, risks related to the Lalor mine plan, including the ability to convert inferred mineral resource estimates to higher confidence categories, dependence on key personnel and employee and union relations, risks related to political or social instability, unrest or change, risks in respect of Indigenous and community relations, rights and title claims, operational risks and hazards, including the cost of maintaining and upgrading Hudbay's tailings management facilities and any unanticipated environmental, industrial and geological events and developments and the inability to insure against all risks (including any unanticipated significant interruptions to operations due to adverse effects from extreme weather events), failure of plant, equipment, processes, transportation and other infrastructure to operate as anticipated, compliance with government and environmental regulations, including permitting requirements and anti-bribery legislation, depletion of Hudbay's reserves, volatile financial markets and interest rates that may affect Hudbay's ability to obtain additional financing on acceptable terms, the failure to obtain required approvals or clearances from government authorities on a timely basis, uncertainties related to the geology, continuity, grade and estimates of mineral reserves and resources, and the potential for variations in grade and recovery rates, uncertain costs of reclamation activities, Hudbay's ability to comply with Hudbay's pension and other post-retirement obligations, Hudbay's ability to abide by the covenants in Hudbay's debt instruments and other material contracts, tax refunds, hedging transactions, as well as the risks discussed under the heading "Risk Factors" in Hudbay's most recent Annual Information Form which is available on the Company's SEDAR+ profile at www.sedarplus.ca and the Company's EDGAR profile at www.sec.gov.
Should one or more risk, uncertainty, contingency or other factor materialize or should any factor or assumption prove incorrect, actual results could vary materially from those expressed or implied in the forward-looking information. Accordingly, you should not place undue reliance on forward-looking information. Hudbay does not assume any obligation to update or revise any forward-looking information after the date of this news release or to explain any material difference between subsequent actual events and any forward-looking information, except as required by applicable law.
Note to United States Investors
This news release has been prepared in accordance with the requirements of the securities laws in effect in Canada, which may differ materially from the requirements of United States securities laws applicable to U.S. issuers.
About Hudbay
Hudbay (TSX, NYSE: HBM) is a copper-focused critical minerals mining company with three long-life operations and a world-class pipeline of copper growth projects in tier-one mining jurisdictions of Canada, Peru and the United States.
Hudbay's operating portfolio includes the Constancia mine in Cusco (Peru), the Snow Lake operations in Manitoba (Canada) and the Copper Mountain mine in British Columbia (Canada). Copper is the primary metal produced by the Company, which is complemented by meaningful gold production and by-product zinc, silver and molybdenum. Hudbay's growth pipeline includes the Copper World project in Arizona (United States), the Mason project in Nevada (United States), the Llaguen project in La Libertad (Peru) and several expansion and exploration opportunities near its existing operations.
|
|
TSX, NYSE - HBM 2025 No. 23 |
The value Hudbay creates and the impact it has is embodied in its purpose statement: "We care about our people, our communities and our planet. Hudbay provides the metals the world needs. We work sustainably, transform lives and create better futures for communities." Hudbay's mission is to create sustainable value and strong returns by leveraging its core strengths in community relations, focused exploration, mine development and efficient operations.
For further information, please contact:
Candace Brûlé
Vice President, Investor Relations, Financial Analysis and External Communications
(416) 814-4387
investor.relations@hudbay.com
____________________
i Adjusted net earnings (loss) - attributable to owners and adjusted net earnings (loss) per share - attributable to owners, adjusted EBITDA, cash cost, sustaining cash cost, all-in sustaining cash cost per pound of copper produced, net of by-product credits, cash cost, sustaining cash cost per ounce of gold produced, net of by-product credits, combined unit cost, net debt, net debt to adjusted EBITDA ratio and free cash flow are non-GAAP financial performance measures with no standardized definition under IFRS. For further information and a detailed reconciliation, please see the discussion under the "Non-GAAP Financial Performance Measures" section of this news release.
ii Average analyst consensus net asset value estimate for 100% of Copper World is approximately $1.16 billion as of August 12, 2025.
iii Based on the initial capital investment and the $3.75 per pound copper price used in the PFS published on September 8, 2023 with assumptions of approximately $145 million for pre-sanctioning costs, $230 million from the precious metals stream, $350 million from project-level financing and approximately $700 million from the joint venture partner earn-in, matching contribution and capital contribution.
iv Copper Mountain copper production comparison based on the mid-point of the 2027 guidance range compared to 2024 actuals.
FORM 52-109F2
CERTIFICATION OF INTERIM FILINGS
FULL CERTIFICATE
I, Peter Kukielski, President and Chief Executive Officer of Hudbay Minerals Inc., certify the following:
1. Review: I have reviewed the interim financial report and interim MD&A (together, the "interim filings") of Hudbay Minerals Inc. (the "issuer") for the interim period ended June 30, 2025.
2. No misrepresentations: Based on my knowledge, having exercised reasonable diligence, the interim filings do not contain any untrue statement of a material fact or omit to state a material fact required to be stated or that is necessary to make a statement not misleading in light of the circumstances under which it was made, with respect to the period covered by the interim filings.
3. Fair presentation: Based on my knowledge, having exercised reasonable diligence, the interim financial report together with the other financial information included in the interim filings fairly present in all material respects the financial condition, financial performance and cash flows of the issuer, as of the date of and for the periods presented in the interim filings.
4. Responsibility: The issuer's other certifying officer and I are responsible for establishing and maintaining disclosure controls and procedures (DC&P) and internal control over financial reporting (ICFR), as those terms are defined in National Instrument 52-109 Certification of Disclosure in Issuers' Annual and Interim Filings, for the issuer.
5. Design: Subject to the limitations, if any, described in paragraphs 5.2 and 5.3, the issuer's other certifying officer and I have, as at the end of the period covered by the interim filings
(a) designed DC&P, or caused it to be designed under our supervision, to provide reasonable assurance that
(i) material information relating to the issuer is made known to us by others, particularly during the period in which the interim filings are being prepared; and
(ii) information required to be disclosed by the issuer in its annual filings, interim filings or other reports filed or submitted by it under securities legislation is recorded, processed, summarized and reported within the time periods specified in securities legislation; and
(b) designed ICFR, or caused it to be designed under our supervision, to provide reasonable assurance regarding the reliability of financial reporting and the preparation of financial statements for external purposes in accordance with the issuer's GAAP.
5.1 Control framework: The control framework the issuer's other certifying officer and I used to design the issuer's ICFR is the Internal Control - Integrated Framework (2013) issued by the Committee of Sponsoring Organizations of the Treadway Commission.
5.2 N/A
5.3 N/A
6. Reporting changes in ICFR: The issuer has disclosed in its interim MD&A any change in the issuer's ICFR that occurred during the period beginning on April 1, 2025 and ended on June 30, 2025 that has materially affected, or is reasonably likely to materially affect, the issuer's ICFR.
Date: August 13, 2025
(signed) "Peter Kukielski"
Peter Kukielski
President and Chief Executive Officer
FORM 52-109F2
CERTIFICATION OF INTERIM FILINGS
FULL CERTIFICATE
I, Eugene Lei, Chief Financial Officer of Hudbay Minerals Inc., certify the following:
1. Review: I have reviewed the interim financial report and interim MD&A (together, the "interim filings") of Hudbay Minerals Inc. (the "issuer") for the interim period ended June 30, 2025.
2. No misrepresentations: Based on my knowledge, having exercised reasonable diligence, the interim filings do not contain any untrue statement of a material fact or omit to state a material fact required to be stated or that is necessary to make a statement not misleading in light of the circumstances under which it was made, with respect to the period covered by the interim filings.
3. Fair presentation: Based on my knowledge, having exercised reasonable diligence, the interim financial report together with the other financial information included in the interim filings fairly present in all material respects the financial condition, financial performance and cash flows of the issuer, as of the date of and for the periods presented in the interim filings.
4. Responsibility: The issuer's other certifying officer and I are responsible for establishing and maintaining disclosure controls and procedures (DC&P) and internal control over financial reporting (ICFR), as those terms are defined in National Instrument 52-109 Certification of Disclosure in Issuers' Annual and Interim Filings, for the issuer.
5. Design: Subject to the limitations, if any, described in paragraphs 5.2 and 5.3, the issuer's other certifying officer and I have, as at the end of the period covered by the interim filings
(a) designed DC&P, or caused it to be designed under our supervision, to provide reasonable assurance that
(i) material information relating to the issuer is made known to us by others, particularly during the period in which the interim filings are being prepared; and
(ii) information required to be disclosed by the issuer in its annual filings, interim filings or other reports filed or submitted by it under securities legislation is recorded, processed, summarized and reported within the time periods specified in securities legislation; and
(b) designed ICFR, or caused it to be designed under our supervision, to provide reasonable assurance regarding the reliability of financial reporting and the preparation of financial statements for external purposes in accordance with the issuer's GAAP.
5.1 Control framework: The control framework the issuer's other certifying officer and I used to design the issuer's ICFR is the Internal Control - Integrated Framework (2013) issued by the Committee of Sponsoring Organizations of the Treadway Commission.
5.2 N/A
5.3 N/A
6. Reporting changes in ICFR: The issuer has disclosed in its interim MD&A any change in the issuer's ICFR that occurred during the period beginning on April 1, 2025 and ended on June 30, 2025 that has materially affected, or is reasonably likely to materially affect, the issuer's ICFR.
Date: August 13, 2025
(signed) "Eugene Lei"
Eugene Lei
Chief Financial Officer