UNITED STATES
SECURITIES AND EXCHANGE COMMISSION
Washington, D.C. 20549
FORM 6-K
REPORT OF FOREIGN PRIVATE ISSUER
PURSUANT TO RULE 13A-16 OR 15D-16 OF
THE SECURITIES EXCHANGE ACT OF 1934
For the month of February 2025
Commission File Number: 001-34244
HUDBAY MINERALS INC.
(Translation of registrant’s name into English)
25 York Street, Suite 800
Toronto, Ontario
M5J 2V5, Canada
(Address of principal executive offices)
Indicate by check mark whether the registrant files or will file annual reports under cover of Form 20-F or Form 40-F.
Form 20-F [ ] Form 40-F [X]
Indicate by check mark if the registrant is submitting the Form 6-K in paper as permitted by Regulation S-T Rule 101(b)(1): [ ]
Indicate by check mark if the registrant is submitting the Form 6-K in paper as permitted by Regulation S-T Rule 101(b)(7): [ ]
Indicate by check mark whether the registrant by furnishing the information contained in this Form is also thereby furnishing the information to the Commission pursuant to Rule 12g3-2(b) under the Securities Exchange Act of 1934.
Yes [ ] No [X]
EXPLANATORY NOTE
If “Yes” is marked, indicate below the file number assigned to the registrant in connection with Rule 12g3-2(b): 82- _____________________________ On February 19, 2025, Hudbay Minerals Inc. (“Hudbay”) filed on the Canadian Securities Administrators’ System for Electronic Document Analysis and Retrieval (SEDAR) website at www.sedarplus.ca the following documents: (1) Audited Consolidated Financial Statements for the years ended December 31, 2024 and 2023, (2) Management's Discussion and Analysis for the year ended December 31, 2024, (3) News Release dated February 19, 2025.
Copies of the filings are attached to this Form 6-K and incorporated herein by reference, as follows:
Exhibit 99.1 — Audited Consolidated Financial Statements for the years ended December 31, 2024 and 2023
Exhibit 99.2 — Management's Discussion and Analysis for the year ended December 31, 2024
Exhibit 99.3 — News Release dated February 19, 2025
2
SIGNATURE
Pursuant to the requirements of the Securities Exchange Act of 1934, the registrant has duly caused this report to be signed on its behalf by the undersigned, thereunto duly authorized.
| HUDBAY MINERALS INC. | ||
| (registrant) | ||
| By: | /s/ Eugene Lei | |
| Name: | Eugene Lei | |
| Title: | Chief Financial Officer | |
Date: February 20, 2025
3
EXHIBIT INDEX
The following exhibits are furnished as part of this Form 6-K:
4
Consolidated Financial Statements
(In US dollars)
HUDBAY MINERALS INC.
Years ended December 31, 2024 and 2023
MANAGEMENT'S REPORT ON INTERNAL CONTROL OVER FINANCIAL REPORTING
Management of Hudbay Minerals Inc. ("Hudbay" or the "Company") is responsible for establishing and maintaining internal control over financial reporting ("ICFR").
Under the supervision of and with the participation of the Chief Executive Officer and the Chief Financial Officer, Hudbay's management assessed the effectiveness of the Company's ICFR as of December 31, 2024 based upon the Internal Control - Integrated Framework (2013) issued by the Committee of Sponsoring Organizations of the Treadway Commission. Based on this evaluation, management concluded that Hudbay's ICFR was effective as of December 31, 2024.
The effectiveness of the Company's ICFR as of December 31, 2024 has been audited by Deloitte LLP, Independent Registered Public Accounting Firm, as stated in their report immediately preceding the Company's audited consolidated financial statements for the year ended December 31, 2024.
| Peter Kukielski | Eugene Lei |
| President and Chief Executive Officer | Chief Financial Officer |
| Toronto, Canada | |
| February 18, 2025 |
Report of Independent Registered Public Accounting Firm
To the shareholders and the Board of Directors of Hudbay Minerals Inc.
Opinion on the Financial Statements
We have audited the accompanying consolidated balance sheets of Hudbay Minerals Inc. and subsidiaries (the "Company") as of December 31, 2024 and 2023, the related consolidated statements of income, comprehensive income, changes in equity, and cash flows, for each of the two years in the period ended December 31, 2024, and the related notes (collectively referred to as the "financial statements"). In our opinion, the financial statements present fairly, in all material respects, the financial position of the Company as of December 31, 2024 and 2023, and its financial performance and its cash flows for each of the two years in the period ended December 31, 2024, in accordance with IFRS Accounting Standards as issued by the International Accounting Standards Board.
We have also audited, in accordance with the standards of the Public Company Accounting Oversight Board (United States) (PCAOB), the Company's internal control over financial reporting as of December 31, 2024, based on criteria established in Internal Control - Integrated Framework (2013) issued by the Committee of Sponsoring Organizations of the Treadway Commission and our report dated February 18, 2025, expressed an unqualified opinion on the Company's internal control over financial reporting.
Basis for Opinion
These financial statements are the responsibility of the Company's management. Our responsibility is to express an opinion on the Company's financial statements based on our audits. We are a public accounting firm registered with the PCAOB and are required to be independent with respect to the Company in accordance with the U.S. federal securities laws and the applicable rules and regulations of the Securities and Exchange Commission and the PCAOB.
We conducted our audits in accordance with the standards of the PCAOB. Those standards require that we plan and perform the audit to obtain reasonable assurance about whether the financial statements are free of material misstatement, whether due to error or fraud. Our audits included performing procedures to assess the risks of material misstatement of the financial statements, whether due to error or fraud, and performing procedures that respond to those risks. Such procedures included examining, on a test basis, evidence regarding the amounts and disclosures in the financial statements. Our audits also included evaluating the accounting principles used and significant estimates made by management, as well as evaluating the overall presentation of the financial statements. We believe that our audits provide a reasonable basis for our opinion.
Critical Audit Matters
The critical audit matters communicated below are matters arising from the current-period audit of the financial statements that were communicated or required to be communicated to the audit committee and that (1) relate to accounts or disclosures that are material to the financial statements and (2) involved our especially challenging, subjective, or complex judgments. The communication of critical audit matters does not alter in any way our opinion on the financial statements, taken as a whole, and we are not, by communicating the critical audit matters below, providing separate opinions on the critical audit matters or on the accounts or disclosures to which they relate.
Critical Audit Matter Description
Impairment - Assessment of Whether Indicators of Impairment or Impairment Reversal Exist in Non- financial Assets - Refer to Notes 2d and 3i to the financial statements
The Company's determination of whether an indicator of impairment or impairment reversal exists in non-financial assets at the cash generating unit ("CGU") level requires significant management judgment.
While there are several inputs that are required to determine whether or not an indicator of impairment or impairment reversal exists, the judgments with the highest degree of subjectivity are the future long- term copper price and the discount rate. Auditing these estimates and inputs required a high degree of subjectivity in applying audit procedures and in evaluating the results of those procedures. This resulted in an increased extent of audit effort, including the involvement of fair value specialists.
How the Critical Audit Matter Was Addressed in the Audit
Our audit procedures related to the future long-term copper price, and the discount rate in the assessment of indicators of impairment or impairment reversal included the following, among others:
- Evaluated the future long-term copper price by comparing management's forecasts to third party forecasts,
- Evaluated the reasonableness of the discount rate by comparing the key inputs to independent market data.
Copper Mountain Mining Corporation ("Copper Mountain") Annual Goodwill Impairment Test - Refer to Notes 2d, and 14 of the financial statements
Critical Audit Matter Description
On June 20, 2023, the Company acquired 100% of the issued and outstanding shares of Copper Mountain. The purchase price was allocated to the fair value of assets acquired and liabilities assumed, which included mineral properties that were valued using a discounted cash flow model. The excess of the purchase price was allocated to goodwill. As required by accounting standards, the Company tested the goodwill of the Copper Mountain CGU at December 31, 2024 for impairment by determining the recoverable amount using a discounted cash flow model. The discounted cash flow models required management to make significant estimates and assumptions related to future short-term and long-term copper price, production based on current estimates of recoverable resources, value beyond proven and probable "VBPP", discount rate, future foreign exchange rate, and future operating and capital costs. The Company determined that there was no impairment of the Copper Mountain CGU's goodwill based on its annual goodwill impairment test.
While there are several estimates and assumptions that are required to determine the recoverable amount of the Copper Mountain CGU at December 31, 2024, the estimates and assumptions with the highest degree of subjectivity are future short-term and long-term copper price, VBPP, discount rate, and future short-term and long-term foreign exchange rate. Auditing these estimates and assumptions required a high degree of auditor judgment in applying audit procedures and in evaluating the results of those procedures. This resulted in an increased extent of audit effort, including the involvement of fair value specialists.
How the Critical Audit Matter Was Addressed in the Audit
Our audit procedures related to the future short-term and long-term copper price, VBPP, and discount rate used to determine the recoverable amount of the Peru CGU included the following procedures, among others:
- Evaluated the future short-term and long-term copper price by comparing management forecasts to third party forecasts, and
- Evaluate the reasonableness of the VBPP by developing a range of independent VBPP valuation estimates from market transactions and comparing to the VBPP valuation selected by management, and
- Evaluate the reasonableness of the discount rate by testing the source information underlying the determination of the discount rate and developed a range of independent estimates for the discount rate and compared to the discount rate selected by management.
/s/ Deloitte LLP
Chartered Professional Accountants
Licensed Public Accountants
Toronto, Canada
February 18, 2025
We have served as the Company's auditor since 2005.
Report of Independent Registered Public Accounting Firm
To the shareholders and the Board of Directors of Hudbay Minerals Inc.
Opinion on Internal Control over Financial Reporting
We have audited the internal control over financial reporting of Hudbay Minerals Inc. and subsidiaries (the "Company") as of December 31, 2024, based on criteria established in Internal Control - Integrated Framework (2013) issued by the Committee of Sponsoring Organizations of the Treadway Commission (COSO). In our opinion, the Company maintained, in all material respects, effective internal control over financial reporting as of December 31, 2024, based on criteria established in Internal Control - Integrated Framework (2013) issued by COSO.
We have also audited, in accordance with the standards of the Public Company Accounting Oversight Board (United States) (PCAOB), the consolidated financial statements as of and for the year ended December 31, 2024 of the Company and our report dated February 18, 2025, expressed an unqualified opinion on those financial statements.
Basis for Opinion
The Company's management is responsible for maintaining effective internal control over financial reporting and for its assessment of the effectiveness of internal control over financial reporting, included in the accompanying Management's Report on Internal Control over Financial Reporting. Our responsibility is to express an opinion on the Company's internal control over financial reporting based on our audit. We are a public accounting firm registered with the PCAOB and are required to be independent with respect to the Company in accordance with the U.S. federal securities laws and the applicable rules and regulations of the Securities and Exchange Commission and the PCAOB.
We conducted our audit in accordance with the standards of the PCAOB. Those standards require that we plan and perform the audit to obtain reasonable assurance about whether effective internal control over financial reporting was maintained in all material respects. Our audit included obtaining an understanding of internal control over financial reporting, assessing the risk that a material weakness exists, testing and evaluating the design and operating effectiveness of internal control based on the assessed risk, and performing such other procedures as we considered necessary in the circumstances. We believe that our audit provides a reasonable basis for our opinion.
Definition and Limitations of Internal Control over Financial Reporting
A company's internal control over financial reporting is a process designed to provide reasonable assurance regarding the reliability of financial reporting and the preparation of financial statements for external purposes in accordance with generally accepted accounting principles. A company's internal control over financial reporting includes those policies and procedures that (1) pertain to the maintenance of records that, in reasonable detail, accurately and fairly reflect the transactions and dispositions of the assets of the company; (2) provide reasonable assurance that transactions are
recorded as necessary to permit preparation of financial statements in accordance with generally accepted accounting principles, and that receipts and expenditures of the company are being made only in accordance with authorizations of management and directors of the company; and (3) provide reasonable assurance regarding prevention or timely detection of unauthorized acquisition, use, or disposition of the company's assets that could have a material effect on the financial statements.
Because of its inherent limitations, internal control over financial reporting may not prevent or detect misstatements. Also, projections of any evaluation of effectiveness to future periods are subject to the risk that controls may become inadequate because of changes in conditions, or that the degree of compliance with the policies or procedures may deteriorate.
/s/ Deloitte LLP
Chartered Professional Accountants
Licensed Public Accountants
Toronto, Canada
February 18, 2025
| HUDBAY MINERALS INC. Consolidated Balance Sheets (In millions of US dollars) |
| Dec. 31, | Dec. 31, | ||||||
| Note | 2024 | 2023 | |||||
| Assets | |||||||
| Current assets | |||||||
| Cash and cash equivalents | 8 | $ | 541.8 | $ | 249.8 | ||
| Short-term investments | 9 | 40.0 | - | ||||
| Trade and other receivables | 10 | 235.5 | 203.4 | ||||
| Inventories | 11 | 197.4 | 207.3 | ||||
| Prepaid expenses and other current assets | 17.4 | 6.3 | |||||
| Other financial assets | 12 | 15.3 | 4.1 | ||||
| Taxes receivable | 1.1 | 2.3 | |||||
| 1,048.5 | 673.2 | ||||||
| Receivable | 10 | 12.9 | 12.2 | ||||
| Inventories | 11 | 16.6 | 24.4 | ||||
| Other financial assets | 12 | 12.1 | 7.1 | ||||
| Intangibles and other assets | 13 | 44.3 | 52.5 | ||||
| Property, plant and equipment | 15 | 4,181.4 | 4,316.0 | ||||
| Deferred tax assets | 26b | 102.6 | 151.9 | ||||
| Goodwill | 14 | 69.2 | 75.3 | ||||
| $ | 5,487.6 | $ | 5,312.6 | ||||
| Liabilities | |||||||
| Current liabilities | |||||||
| Trade and other payables | 16 | $ | 270.2 | $ | 239.3 | ||
| Taxes payable | 100.7 | 53.4 | |||||
| Other liabilities | 17 | 34.4 | 30.0 | ||||
| Other financial liabilities | 18 | 38.3 | 42.2 | ||||
| Gold prepayment liability | 19 | - | 55.9 | ||||
| Lease liabilities | 20 | 30.5 | 28.9 | ||||
| Deferred revenue | 22 | 63.1 | 87.7 | ||||
| 537.2 | 537.4 | ||||||
| Other financial liabilities | 18 | 114.4 | 51.7 | ||||
| Lease liabilities | 20 | 44.3 | 61.4 | ||||
| Long-term debt | 21a | 1,107.5 | 1,287.5 | ||||
| Deferred revenue | 22 | 309.1 | 330.8 | ||||
| Pension obligations | 24 | 6.2 | 6.0 | ||||
| Other employee benefits | 25 | 80.3 | 101.9 | ||||
| Environmental and other provisions | 23 | 300.8 | 321.9 | ||||
| Deferred tax liabilities | 26b | 340.4 | 407.2 | ||||
| 2,840.2 | 3,105.8 | ||||||
| Equity | |||||||
| Share capital | 27b | 2,641.3 | 2,240.2 | ||||
| Reserves | 14.3 | 30.2 | |||||
| Retained earnings | (102.4 | ) | (173.6 | ) | |||
| Equity attributable to owners of the Company | 2,553.2 | 2,096.8 | |||||
| Non-controlling interest | 35 | 94.2 | 110.0 | ||||
| $ | 5,487.6 | $ | 5,312.6 | ||||
| Commitments (note 32) |
| HUDBAY MINERALS INC. Consolidated Statements of Income (In millions of US dollars, except per share amounts) |
| Year ended December 31, | |||||||
| Note | 2024 | 2023 | |||||
| Revenue | 7a | $ | 2,021.2 | $ | 1,690.0 | ||
| Cost of sales | |||||||
| Mine operating costs | 1,040.8 | 905.8 | |||||
| Depreciation and amortization | 7b | 426.6 | 391.7 | ||||
| 1,467.4 | 1,297.5 | ||||||
| Gross profit | 553.8 | 392.5 | |||||
| Selling and administrative expenses | 57.0 | 39.2 | |||||
| Exploration expenses | 42.6 | 29.3 | |||||
| Other expenses | 7e | 57.4 | 38.3 | ||||
| Re-evaluation adjustment - environmental provision | 23 | (3.5 | ) | (11.4 | ) | ||
| Results from operating activities | 400.3 | 297.1 | |||||
| Net interest expense on long term debt | 7f | 69.8 | 76.2 | ||||
| Accretion on streaming arrangements | 7f | 24.2 | 26.3 | ||||
| Change in fair value of financial instruments | 7f | 16.6 | 14.0 | ||||
| Other net finance costs | 7f | 38.1 | 28.8 | ||||
| Net finance expense | 148.7 | 145.3 | |||||
| Income before tax | 251.6 | 151.8 | |||||
| Tax expense | 26a | 183.8 | 82.3 | ||||
| Net income for the year | $ | 67.8 | $ | 69.5 | |||
| Attributable to: | |||||||
| Owners of the Company | $ | 76.7 | $ | 66.4 | |||
| Non-controlling interest | (8.9 | ) | 3.1 | ||||
| Net income for the year | $ | 67.8 | $ | 69.5 | |||
| Earnings per share | |||||||
| Basic and diluted | $ | 0.20 | $ | 0.22 | |||
| Weighted average number of common shares outstanding: | |||||||
| Basic | 29 | 376,785,518 | 310,845,281 | ||||
| Diluted | 29 | 377,291,211 | 310,953,110 | ||||
| HUDBAY MINERALS INC. Consolidated Statements of Comprehensive Income (In millions of US dollars) |
| Year ended December 31, | |||||||
| 2024 | 2023 | ||||||
| Net income for the year | $ | 67.8 | $ | 69.5 | |||
| Other comprehensive income: | |||||||
| Item that will be reclassified subsequently to profit or loss: | |||||||
| Recognized directly in equity: | |||||||
| Net (loss) gain on translation of foreign currency balances | (49.9 | ) | 9.2 | ||||
| Items that will not be reclassified subsequently to profit or loss: | |||||||
| Recognized directly in equity: | |||||||
| Gold prepayment revaluation | 19 | 4.3 | (0.2 | ) | |||
| Tax effect | (1.1 | ) | 0.1 | ||||
| Remeasurement - actuarial gain (loss) | 25.7 | (8.0 | ) | ||||
| Tax effect | (2.0 | ) | (0.3 | ) | |||
| 26.9 | (8.4 | ) | |||||
| Other comprehensive (loss) income net of tax, for the year | (23.0 | ) | 0.8 | ||||
| Total comprehensive income for the year | $ | 44.8 | $ | 70.3 | |||
| Attributable to: | |||||||
| Owners of the Company | 60.6 | 67.3 | |||||
| Non-controlling interest | (15.8 | ) | 3.0 | ||||
| Total comprehensive income for the year | $ | 44.8 | $ | 70.3 | |||
| HUDBAY MINERALS INC. Consolidated Statements of Cash Flows (In millions of US dollars) |
| Year ended December 31, | |||||||
| Note | 2024 | 2023 | |||||
| Cash generated from operating activities: | |||||||
| Net income for the year | $ | 67.8 | $ | 69.5 | |||
| Items not affecting cash: | |||||||
| Tax expense | 26a | 183.8 | 82.3 | ||||
| Depreciation and amortization | 7b | 428.0 | 393.1 | ||||
| Share-based compensation | 7c | 19.3 | 7.4 | ||||
| Net finance expense | 7f | 148.7 | 145.3 | ||||
| Inventory adjustments | 11 | 2.9 | 2.3 | ||||
| Amortization of deferred revenue and variable consideration | 22 | (70.5 | ) | (77.3 | ) | ||
| Pension and other employee benefit payments, net of accruals | 24, 25 | 11.9 | 7.0 | ||||
| Amortization of community agreements | 13.7 | 12.2 | |||||
| Re-evaluation adjustment - environmental obligation | 23 | (3.5 | ) | (11.4 | ) | ||
| Write-down/loss on disposal of PP&E | 27.4 | - | |||||
| Decommissioning and restoration payments | 23 | (2.1 | ) | (2.1 | ) | ||
| Other | 34a | (3.8 | ) | (3.5 | ) | ||
| Taxes paid | (132.5 | ) | (54.8 | ) | |||
| Operating cash flow before change in non-cash working capital | 691.1 | 570.0 | |||||
| Change in non-cash working capital | 34a | (24.9 | ) | (93.1 | ) | ||
| 666.2 | 476.9 | ||||||
| Cash used in investing activities: | |||||||
| Acquisition of property, plant and equipment | (347.1 | ) | (281.1 | ) | |||
| Acquisition of intangibles | (1.8 | ) | - | ||||
| Community agreements | (9.1 | ) | (10.7 | ) | |||
| Grants received | 15 | 3.1 | - | ||||
| Cash and cash equivalents acquired in acquisitions, net of cash paid | 5, 6 | - | 11.0 | ||||
| Net (purchase) sale of investments | (3.2 | ) | 0.1 | ||||
| Proceeds from disposition of property, plant and equipment | - | 0.8 | |||||
| Change in restricted cash | 0.8 | 0.1 | |||||
| Short-term investments | 9 | (40.0 | ) | - | |||
| Interest received | 14.4 | 8.0 | |||||
| (382.9 | ) | (271.8 | ) | ||||
| Cash generated from (used in) financing activities: | |||||||
| (Repayment) of/proceeds from revolving credit facility | 21b | (100.0 | ) | 100.0 | |||
| Repurchase of senior unsecured notes, net of discount | 21a | (81.9 | ) | - | |||
| Principal repayments on Copper Mountain bonds | 21c | - | (143.0 | ) | |||
| Premium paid on redemption of Copper Mountain bonds | 21c | - | (3.0 | ) | |||
| Equity issuance, net of share issuance costs | 27b | 398.0 | 14.2 | ||||
| Change in restricted cash debt service account | - | 3.7 | |||||
| Interest paid on long-term debt | (67.9 | ) | (74.0 | ) | |||
| Financing costs | (15.1 | ) | (12.2 | ) | |||
| Lease payments | 20 | (31.4 | ) | (25.2 | ) | ||
| Equipment financing payments | (10.2 | ) | (1.9 | ) | |||
| Gold prepayment repayments | 19 | (62.3 | ) | (26.7 | ) | ||
| Deferred Rosemont acquisition payment | (10.0 | ) | (10.0 | ) | |||
| Net payments on settlement of non-QP hedges (note 3(I)ii) | (7.9 | ) | - | ||||
| Net proceeds from exercise of stock options and warrants | 4.4 | 0.2 | |||||
| Dividends paid | 27b | (5.5 | ) | (4.5 | ) | ||
| 10.2 | (182.4 | ) | |||||
| Effect of movement in exchange rates on cash | (1.5 | ) | 1.4 | ||||
| Net increase in cash and cash equivalents | 292.0 | 24.1 | |||||
| Cash and cash equivalents, beginning of the year | 249.8 | 225.7 | |||||
| Cash and cash equivalents, end of the year | $ | 541.8 | $ | 249.8 | |||
| HUDBAY MINERALS INC. Consolidated Statements of Changes in Equity (In millions of US dollars) |
| Share capital (note 27) |
Other capital reserves |
Foreign currency translation reserve |
Remeasurement reserve |
Retained earnings |
Total | Non- controlling interest |
Total equity | |||||||||||||||||
| Balance, January 1, 2023 | $ | 1,780.8 | $ | 58.5 | $ | (14.8 | ) | $ | (17.2 | ) | $ | (235.5 | ) | $ | 1,571.8 | $ | - | $ | 1,571.8 | |||||
| Net income | - | - | - | - | 66.4 | 66.4 | 3.1 | 69.5 | ||||||||||||||||
| Other comprehensive income (loss) | - | - | 9.4 | (8.5 | ) | - | 0.9 | (0.1 | ) | 0.8 | ||||||||||||||
| Other comprehensive income (loss) | - | - | 9.4 | (8.5 | ) | 66.4 | 67.3 | 3.0 | 70.3 | |||||||||||||||
| Contributions by and distributions to owners: | ||||||||||||||||||||||||
| Dividends (note 27b) | - | - | - | - | (4.5 | ) | (4.5 | ) | - | (4.5 | ) | |||||||||||||
| Shares issued on acquisition of Copper Mountain, net of share issuance costs (note 5) | 436.5 | - | - | - | - | 436.5 | 107.0 | 543.5 | ||||||||||||||||
| Shares and warrants issued on acquisition of Rockcliff (note 6) | 12.5 | 0.7 | - | - | - | 13.2 | - | 13.2 | ||||||||||||||||
| Flow-through shares issued, net of share issuance costs (note 27b) | 10.1 | - | - | - | - | 10.1 | - | 10.1 | ||||||||||||||||
| Stock options | - | 2.2 | - | - | - | 2.2 | - | 2.2 | ||||||||||||||||
| Issuance of shares related to stock options exercised | 0.3 | (0.1 | ) | - | - | - | 0.2 | - | 0.2 | |||||||||||||||
| Total contributions by and distributions to owners | 459.4 | 2.8 | - | - | (4.5 | ) | 457.7 | 107.0 | 564.7 | |||||||||||||||
| Balance, December 31, 2023 | $ | 2,240.2 | $ | 61.3 | $ | (5.4 | ) | $ | (25.7 | ) | $ | (173.6 | ) | $ | 2,096.8 | $ | 110.0 | $ | 2,206.8 |
| HUDBAY MINERALS INC. Consolidated Statements of Changes in Equity (In millions of US dollars) |
| Share capital (note 27) |
Other capital reserves |
Foreign currency translation reserve |
Remeasurement reserve |
Retained earnings |
Total | Non- controlling interest |
Total equity | |||||||||||||||||
| Balance, January 1, 2024 | $ | 2,240.2 | $ | 61.3 | $ | (5.4 | ) | $ | (25.7 | ) | $ | (173.6 | ) | $ | 2,096.8 | $ | 110.0 | $ | 2,206.8 | |||||
| Net income | - | - | - | - | 76.7 | 76.7 | (8.9 | ) | 67.8 | |||||||||||||||
| Other comprehensive (loss) income | - | - | (43.0 | ) | 26.9 | - | (16.1 | ) | (6.9 | ) | (23.0 | ) | ||||||||||||
| Total comprehensive (loss) income | - | - | (43.0 | ) | 26.9 | 76.7 | 60.6 | (15.8 | ) | 44.8 | ||||||||||||||
| Contributions by and distributions to owners: | ||||||||||||||||||||||||
| Dividends (note 27b) | - | - | - | - | (5.5 | ) | (5.5 | ) | - | (5.5 | ) | |||||||||||||
| Flow-through shares issued, net of share issuance costs (note 27b) | 8.6 | - | - | - | - | 8.6 | - | 8.6 | ||||||||||||||||
| Shares issued on equity raise, net of share issuance costs | 386.2 | - | - | - | - | 386.2 | - | 386.2 | ||||||||||||||||
| Stock options | - | 2.1 | - | - | - | 2.1 | - | 2.1 | ||||||||||||||||
| Issuance of shares related to stock options and warrants exercised | 6.3 | (1.9 | ) | - | - | - | 4.4 | - | 4.4 | |||||||||||||||
| Total contributions by and distributions to owners | 401.1 | 0.2 | - | - | (5.5 | ) | 395.8 | - | 395.8 | |||||||||||||||
| Balance, December 31, 2024 | $ | 2,641.3 | $ | 61.5 | $ | (48.4 | ) | $ | 1.2 | $ | (102.4 | ) | $ | 2,553.2 | $ | 94.2 | $ | 2,647.4 |
| HUDBAY MINERALS INC. Notes to Audited Consolidated Financial Statements (in millions of US dollars, except where otherwise noted) Years ended December 31, 2024 and 2023 |
1. Reporting entity
Hudbay Minerals Inc. ("HMI" or the "Company") is a company existing under the Canada Business Corporations Act. The address of the Company's principal executive office is 25 York Street, Suite 800, Toronto, Ontario. The consolidated financial statements ("financial statements") of the Company for the year ended December 31, 2024 and 2023 represent the financial position and the financial performance of the Company and its subsidiaries (together referred to as "Hudbay").
Wholly owned subsidiaries as at December 31, 2024 included HudBay Peru Inc., HudBay Peru S.A.C. ("Hudbay Peru"), HudBay (BVI) Inc., Hudbay Arizona Inc., Copper World, Inc. ("Copper World") and Mason Resources (US) Inc. ("Mason"). The Company also holds a 75% interest in Copper Mountain Mine (BC) Ltd. ("CMBC"). Mitsubishi Materials Corporation ("MMC"), an arms-length party, owns the remaining 25% interest in CMBC.
Hudbay is a diversified mining company with long-life assets in North and South America. Hudbay's operations in Cusco (Peru) produce copper with gold, silver and molybdenum by-products. Hudbay's operations in Manitoba (Canada) produce gold with copper, zinc and silver by-products. Hudbay's operations in British Columbia (Canada) produce copper with gold and silver by-products. Hudbay has a development pipeline that includes copper development projects in Arizona and Nevada (United States), and a focused growth strategy on exploration, development, operation, and optimization of properties that Hudbay already controls, as well as other mineral assets that Hudbay may acquire that fit the Company's strategic criteria. The Company is governed by the Canada Business Corporations Act and its shares are listed under the symbol "HBM" on the Toronto Stock Exchange, New York Stock Exchange and Bolsa de Valores de Lima.
2. Basis of preparation
(a) Statement of compliance:
These consolidated financial statements have been prepared in accordance with IFRS® Accounting Standards as issued by the International Accounting Standards Board ("IASB") effective for the year ended December 31, 2024.
The Board of Directors approved these consolidated financial statements on February 18, 2025.
(b) Functional and presentation currency:
Hudbay's consolidated financial statements are presented in US dollars, which is the Company's and all material subsidiaries' functional currency, except the Company's Manitoba and British Columbia business units, which have a functional currency of Canadian dollars. All values are expressed in millions except where otherwise indicated.
(c) Basis of measurement:
The consolidated financial statements have been prepared on the historical cost basis except for the following items in the consolidated balance sheets:
- Derivatives, embedded derivatives, other financial instruments, and financial assets measured at fair value through profit or loss ("FVTPL");
- Liabilities for cash-settled share-based compensation arrangements are measured at fair value; and,
- A defined benefit liability is recognized as the net total of the plan assets, unrecognized past service costs and unrecognized actuarial losses, less unrecognized actuarial gains and the present value of the defined benefit obligation.
| HUDBAY MINERALS INC. Notes to Audited Consolidated Financial Statements (in millions of US dollars, except where otherwise noted) Years ended December 31, 2024 and 2023 |
(d) Use of judgements and estimates:
The preparation of the consolidated financial statements requires Hudbay to make judgements, estimates and assumptions that affect the application of accounting policies, reported amounts of assets and liabilities and disclosure of contingent assets and liabilities at the date of the consolidated financial statements, and reported amounts of revenue and expenses during the reporting period. Actual results may differ from these estimates.
Hudbay reviews these estimates and underlying assumptions on an ongoing basis, based on experience and other factors, including expectations of future events that the Company believes to be reasonable under the circumstances. Revisions to accounting estimates are recognized prospectively in the period in which the estimates are revised and in any future periods affected.
The following are critical and significant judgements and estimates impacting the consolidated financial statements:
- Indicators and testing of impairment (reversal of impairment) of non-financial assets (notes 3h, 3i, 14 and 15) - There are a number of potential indicators that could trigger non-financial asset impairment or reversal of impairment. These indicators may require critical judgements to determine the extent that external and/or internal environmental business changes may impact Hudbay's overall assessment of the recoverability of non-financial assets. Such business changes include changes to the life of mine ("LOM") plan, changes to budget, changes to closure plans, changes to discount rates and changes to long-term commodity prices. If an impairment or impairment reversal indicator is identified then there are also critical estimates involved in the determination of the recoverable amount of cash generating units ("CGU"). A CGU to which goodwill has been allocated is tested for impairment at least annually or when events or circumstances indicate that an assessment for impairment is required. Recoverable amounts are calculated using discounted after-tax cash flows based on cash flow projections and assumptions in Hudbay's most recent LOM plans. LOM plans are based on optimized mine and processing plans and the assessment of capital expenditure requirements of a mine site. LOM plans incorporate management's best estimates of key assumptions which include future commodity prices, the value of mineral resources not included in the applicable LOM plans, production based on current estimates of recoverable reserves, discount rates, future operating and capital costs and future foreign exchange rates. Most critical to the value of the recoverable amount are the assumptions of future commodity prices and the value of mineral resources not included in the applicable LOM plans. Expected future cash flows used to determine the recoverable amount during impairment testing are inherently uncertain and could materially change over time. Should management's estimate of the future not reflect actual events, impairments may be identified, which could have a material effect on the financial statements. Although it is reasonably possible for a change in key assumptions to occur, the possible effects of a change in any single assumption may not fairly reflect the impact of CGU's fair value as the assumptions are inextricably linked.
- Mineral reserves and resources (notes 3g, 3k and 3i) - Hudbay estimates mineral reserves and resources to determine future recoverable mine production based on assessment of geological, engineering and metallurgical analyses, estimates of future production costs, capital costs and reclamation costs, as well as long term commodity prices and foreign exchange rates. There are numerous uncertainties inherent in estimating mineral reserves and resources, including many factors beyond Hudbay's control. The estimates are based on information compiled by appropriately qualified persons relating to the geological data on the size, depth and shape of the ore body and interpreting this data requires complex geological judgements. Changes in assumptions, including economic assumptions such as metals prices and market conditions, could have a material effect on the financial position and results of operations.
Changes in the mineral reserve or resource estimates may affect:
- the carrying value of exploration and evaluation assets, capital works in progress, mining properties and plant and equipment, goodwill;
- depreciation expense for assets depreciated either on a unit-of-production basis or on a straight line basis where useful lives are restricted by the life of the related mine plan;
- the provision for decommissioning, restoration and similar liabilities;
- the carrying value of deferred tax assets, and
- amortization of deferred revenue.
| HUDBAY MINERALS INC. Notes to Audited Consolidated Financial Statements (in millions of US dollars, except where otherwise noted) Years ended December 31, 2024 and 2023 |
- Property plant and equipment (notes 3h and 15) - The carrying amounts of property, plant and equipment and exploration and evaluation assets on Hudbay's consolidated balance sheets are significant and reflect multiple estimates and applications of judgement. Management exercises judgement in determining whether the costs related to exploration and evaluation are eligible for capitalization and whether they are likely to be recoverable by future exploration, which may be based on assumptions about future events and circumstances. Judgement and estimates are used when determining whether exploration and evaluation assets should be transferred to capital works in progress within property, plant and equipment. For mines in the production stage, management applies judgement to determine development costs to be capitalized based on the extent they are incurred in order to access reserves mineable over more than one year. For depreciable property, plant and equipment assets, management makes estimates to determine depreciation. For assets depreciated using the straight line method, residual value and useful lives of the assets or components are estimated. A significant estimate is required to determine the total production basis for units-of-production depreciation. The most currently available reserve and resource report is utilized in determining the basis which has material impacts on the amount of depreciation recorded through inventories and the consolidated statements of income. There are numerous uncertainties inherent in estimating mineral reserves, and assumptions that were valid at the reporting date may change when new information becomes available. The actual volume of ore extracted and any changes in these assumptions could affect prospective depreciation rates and carrying values. In determining whether stripping costs incurred during the production phase of a mining property relate to mineral reserves and mineral resources that will be mined in a future period and therefore should be capitalized, Hudbay makes estimates of the proportion of stripping activity which relates to extracting current ore and the proportion which relates to obtaining access to ore reserves which will be mined in the future.
- Tax provisions (notes 3m and 26) - Management makes estimates in determining the measurement and recognition of deferred tax assets and liabilities recorded on the consolidated balance sheets. The measurement of deferred tax assets and deferred tax liabilities is based on tax rates that are expected to apply in the period that the asset is realized or liability is settled based on tax rates that have been enacted or substantively enacted by the end of the reporting period. Deferred tax assets, including those arising from unutilized tax losses, require management to assess the likelihood of taxable income in the future periods in order to utilize recognized deferred tax assets. Estimates of future taxable income are based on forecasted cash flows from operations and the application of existing tax laws in each jurisdiction. To the extent that future cash flows and taxable income differ significantly from estimates, the ability to realize the net deferred tax assets recorded at the balance sheet date could be affected. At the end of each reporting period, management reassesses the period that the assets are expected to be realized or liabilities are settled and the likelihood of taxable income in future periods in order to support and adjust the deferred tax assets and deferred tax liabilities recognized on the consolidated balance sheets.
- Assaying utilized to determine revenue and recoverability of inventories (notes 3c and 3f) - Assaying of contained metal is a key estimate in determining the amount of revenues recorded in the consolidated statements of income. The estimate is finalized after final surveying is completed, which may extend to six months in certain transactions. Since assays are utilized to determine the value of recorded revenues, significant differences in given assays may result in a material misstatement of revenues on the consolidated statements of income. Assay survey results are also a factor utilized to determine if inventories on hand have a net realizable value that exceeds cost. Material differences in assay results may lead to misstatements of inventory balances in the consolidated balance sheets.
- Decommissioning and restoration obligations (notes 3k and 23) - Significant judgement and estimates are utilized in the determination of the decommissioning and restoration provisions in the consolidated balance sheets. Judgement is involved in determining the timing and extent of cash outflows required to satisfy constructive obligations based on the timing of site closures in the LOM plans, expected unit costs to determine cash obligations to remediate disturbances and regulatory and constructive requirements, as well as technological changes to determine the extent and timing of the remediation required. The timing of cash outflows and discount rates associated with discounting the provision are also key estimates. Changes in these estimates may result in a change in classification of the provision between non-current and current as well as material differences in the total provision recorded in the consolidated balance sheets.
| HUDBAY MINERALS INC. Notes to Audited Consolidated Financial Statements (in millions of US dollars, except where otherwise noted) Years ended December 31, 2024 and 2023 |
- Pension and other employee benefit (notes 3j, 24 and 25) - Hudbay's post retirement obligations relate mainly to ongoing health care benefits plans. Hudbay estimates obligations related to the pension and other employee benefits plans using actuarial determinations that incorporate assumptions using management's best estimates of factors including plan performance, salary escalation, retirement dates of employees and drug cost escalation rates. Due to the complexity of the valuation, the underlying assumptions and its long term nature, the defined benefit obligation is highly sensitive to changes in these assumptions. Management reviews all assumptions at each reporting date. In determining the appropriate discount rate, Hudbay considers the interest rates on corporate bonds in the respective currency with at least an AA rating, with extrapolated maturities corresponding to the expected duration of the defined benefit obligation. The mortality rate is based on publicly available mortality tables for the specific country, and Hudbay bases future salary increases and pension increases on expected future inflation rates for the respective country.
- Valuation of an acquired business (note 5) - As the Company concluded that the acquisition of Copper Mountain was a business combination, a valuation was required to determine the allocation of the purchase price. The fair values of the net assets acquired were calculated using significant estimates and judgements. In particular, the fair values of the net assets, including mineral properties, other property, plant and equipment have been determined using an independent valuation involving discounted cash flow calculations and other finance models. Such calculations and models were required to estimate, amongst other items, future production, future commodity prices, operating and capital input costs, discount rates and currency rates. If estimates or judgements differed, this could result in a materially different allocation of net assets to the consolidated balance sheets and could result in a change in the amount of goodwill recognized. Changes to the preliminary values of assets acquired and liabilities assumed, deferred income taxes and resulting goodwill, if any, are retrospectively adjusted when the final measurements are determined if related to conditions existing at the date of acquisition (within one year of acquisition).
- Valuation of assets in an asset acquisition (note 6) - As the Company acquired Rockcliff through the issuance of the Company's common shares and the Company concluded Rockcliff is not a business but an asset acquisition, a valuation was required to the fair value of the net assets acquired. The fair values of the net assets acquired were calculated using significant estimates and judgements. In particular, the fair value of the exploration property has been determined using an independent valuation involving discounted cash flow calculations. Such calculations and models were required to estimate, amongst other items, future production, future commodity prices, operating and capital input costs, discount rates and currency rates.
3. Material accounting policies
The accounting policies set out below have been applied consistently to all periods presented in these consolidated financial statements and by all Hudbay's entities.
(a) Basis of consolidation:
Intercompany balances and transactions are eliminated upon consolidation. When a Hudbay entity transacts with an associate or jointly controlled entity of the Company, unrealized profits and losses are eliminated to the extent of Hudbay's interest in the relevant associate or joint venture. The accounting policies of Hudbay's entities are changed when necessary to align them with the policies adopted by the Company.
Subsidiaries
A subsidiary is an entity controlled by Hudbay. The financial statements of subsidiaries are included in the consolidated financial statements from the date that control commences until the date that control ceases.
Non-controlling interest
Non-controlling interest in subsidiaries are identified separately from the Company's equity in the subsidiaries. The interest of non-controlling shareholders may be initially measured either at fair value or at the non-controlling interest proportionate share of the fair value of the acquiree's identifiable net assets. The choice of measurement basis is made on an acquisition-by-acquisition basis. Subsequent to acquisition, the carrying amount of non-controlling interest is the amount of that interest at initial recognition plus the non-controlling interest share of subsequent changes in equity. Total comprehensive income is attributed to non-controlling interest even if this results in the non-controlling interest having a deficit balance.
| HUDBAY MINERALS INC. Notes to Audited Consolidated Financial Statements (in millions of US dollars, except where otherwise noted) Years ended December 31, 2024 and 2023 |
Business combinations and goodwill
Should Hudbay make an acquisition, it first determines whether the assets acquired and liabilities assumed constitute a business, in which case the acquisition requires accounting as a business combination. Management applies judgement in determining whether the acquiree is capable of being conducted and managed for the purpose of providing a return, considering the inputs of the acquiree and processes applied to those inputs that have the ability to create outputs.
Hudbay applies the acquisition method of accounting to business combinations, whereby the goodwill is measured at the acquisition date as the fair value of the consideration transferred including the recognized amount of any non-controlling interest in the acquiree. When the excess is negative, a bargain purchase gain is recognized immediately in the consolidated statements of income. The assessment of fair values on acquisition includes those mineral reserves and resources that are able to be reliably measured. In determining these fair values, management must also apply judgement in areas including future cash flows, metal prices, exchange rates and appropriate discount rates. Changes in such estimates and assumptions could result in significant differences in the amount of goodwill recognized.
The consideration transferred is the aggregate of the fair values, at the date of the acquisition, of the sum of the assets transferred, the liabilities incurred or assumed, and the equity instruments issued by the acquirer in exchange for control of the acquiree. Acquisition-related costs are recognized in the consolidated statements of income as incurred, unless they relate to issuance of debt or equity securities.
Where applicable, the consideration transferred includes any asset or liability resulting from a contingent consideration arrangement and measured at its acquisition date fair value. Subsequent changes in such fair values are adjusted against the cost of acquisition where they qualify as measurement period adjustments. All other subsequent changes in the fair value of contingent consideration classified as an asset or liability are accounted for in accordance with relevant IFRS Accounting Standards. Changes in the fair value of contingent consideration classified as equity are not recognized.
Where a business combination is achieved in stages, the Company's previously held interest in the acquired entity are remeasured to fair value at the acquisition date, which is the date Hudbay attains control, and any resulting gain or loss is recognized in the consolidated statements of income. Amounts previously recognized in other comprehensive income ("OCI") related to interest in the acquiree prior to the acquisition date are reclassified to the consolidated statements of income, where such treatment would be appropriate if that interest were disposed of.
After initial recognition, goodwill is measured at cost less any accumulated impairment losses. For the purpose of impairment testing, goodwill acquired in a business combination is, from the acquisition date, allocated to each of Hudbay's CGUs that are expected to benefit from the synergies of the combination, irrespective of whether other assets or liabilities of the acquiree are assigned to those units. Goodwill is allocated to the lowest level at which it is monitored for internal management purposes and is not larger than an operating segment before aggregation. Where goodwill forms part of a CGU and part of the operation within that unit is disposed of, the goodwill associated with the disposed operation is included in the determination of any gain or loss on disposal.
Goodwill is not amortized and is tested for impairment annually and whenever there is an indication of impairment. If any such indication exists, the recoverable amount of the CGU is estimated in order to determine the extent of the impairment, if any. The recoverable amount is determined as the higher of fair value less direct costs to sell and the CGU's value in use. When the recoverable amount of the CGU is less than the carrying amount of that CGU, the impairment loss is allocated to reduce the carrying amount of any goodwill allocated to that CGU first, and then to the other assets of that CGU on a pro-rata basis of the carrying amount of each asset in the CGU. An impairment loss in respect of goodwill is not reversed.
Fair value for mineral interest and related goodwill is generally determined as the present value of the estimated future cash flows expected to arise from the continued use of the asset, including any expansion prospects, and its eventual disposal, using assumptions that an independent market participant may take into account.
Value in use is determined as the present value of the estimated future cash flows expected to arise from the continued use of the asset in its present form and its eventual disposal. Value in use is determined by applying assumptions specific to Hudbay's continued use and cannot take into account future development.
The weighted average cost of capital of Hudbay or comparable market participants is used as a starting point for determining the discount rates, with appropriate adjustments for the risk profile of the countries in which the individual CGUs operate and the specific risks related to the development of the project.
Where the asset does not generate cash flows that are independent of other assets, Hudbay estimates the recoverable amount of the CGU to which the asset belongs. If the carrying amount of an asset or CGU exceeds its recoverable amount, the carrying amount of the asset or CGU is reduced to its recoverable amount. An impairment loss is recognized as an expense in the consolidated statements of income.
| HUDBAY MINERALS INC. Notes to Audited Consolidated Financial Statements (in millions of US dollars, except where otherwise noted) Years ended December 31, 2024 and 2023 |
(b) Translation of foreign currencies:
Management determines the functional currency of each Hudbay entity as the currency of the primary economic environment in which the entity operates.
Foreign currency transactions
Transactions in foreign currencies are translated to the respective functional currencies of Hudbay's entities at exchange rates in effect at the transaction dates.
At the end of each reporting period, monetary assets and liabilities denominated in foreign currencies are translated to the functional currency using the closing exchange rate. Non-monetary assets and liabilities measured at fair value are translated using the exchange rates at the date when fair value was determined. Non-monetary assets and liabilities measured at historical cost in a foreign currency are translated using exchange rates that were in effect at the transaction dates. The same translations are applied when an entity prepares its financial statements from books and records maintained in a currency other than its functional currency, except revenue and expenses may be translated at monthly average exchange rates that approximate those in effect at the transaction dates.
Foreign currency gains and losses arising on period-end revaluations are recognized in the consolidated statements of income, except for a financial liability designated as a hedge of a net investment in a foreign operation, or qualifying cash flow hedges, which are recognized in OCI.
Foreign operations
For the purpose of the consolidated financial statements, assets and liabilities of Hudbay's entities that have functional currencies other than the US dollar are translated to US dollars at the reporting date using the closing exchange rate. Revenue and expenses are translated at monthly average exchange rates that approximate those in effect at the transaction dates. Differences arising from these foreign currency translations are recognized in OCI and presented within equity in the foreign currency translation reserve. When a foreign operation is disposed, the relevant exchange differences accumulated in the foreign currency translation reserve are transferred to the consolidated statements of income as part of the profit or loss on disposal. On the partial disposal of a subsidiary that includes a foreign operation, the relevant proportion of such amount is reattributed to non-controlling interest. On disposal of a partial investment in an associate or joint venture that includes a foreign operation while retaining significant influence or joint control, the relevant proportion is reclassified to profit or loss.
Net investment in a foreign operation
Foreign currency gains and losses arising on translation of a monetary item receivable from or payable to a foreign operation for which settlement is neither planned nor likely to occur in the foreseeable future are considered to form part of a net investment in the foreign operation. Such gains and losses are recognized in OCI and presented within equity in the foreign currency translation reserve.
(c) Revenue recognition:
Revenue from the sale of goods is measured at the fair value of the consideration received or receivable, net of treatment and refining charges. Revenue from the sale of by-products is included within revenue.
Revenue is recognized when control of the goods sold has been transferred to the customer. Control is deemed to have passed to the customer when significant risk and reward of the product has passed to the customer, Hudbay has a present right to payment, and physical possession of the product has been transferred to the customer. Sales of doré are recorded when a trade confirmation is duly signed and executed between Hudbay and the end purchaser. Sale of concentrate and finished zinc frequently occur under the following terms, and management has assessed these terms in order to determine timing of transfer of control and revenue recognition as generally outlined in the following table.
| HUDBAY MINERALS INC. Notes to Audited Consolidated Financial Statements (in millions of US dollars, except where otherwise noted) Years ended December 31, 2024 and 2023 |
|
Incoterms used by Hudbay |
Revenue recognized when goods: |
|
Cost, Insurance and Freight (CIF) |
Are loaded on board the vessel |
|
Free on Board (FOB) |
Are loaded on board the vessel |
|
Delivered at place (DAP) |
Arrive at the named place of destination |
|
Delivered at terminal (DAT) |
Arrive at the named place of destination |
|
Free Carrier (FCA) |
Arrive at the named place of delivery |
Sales of copper and zinc concentrate and certain other products are provisionally priced. For these contracts, sales prices are subject to final adjustment at the end of a future period after shipment, based on quoted market prices during the quotational period specified in the contract. Revenue is recognized when the above criteria are achieved, using weight and assay results and forward market prices to estimate the fair value of the total consideration receivable. Therefore, revenue is initially recorded based on an initial provisional invoice. Subsequently, at each reporting date, until the provisionally priced sale is finalized, sales receivables are marked to market, with adjustments (both gains and losses) recorded within revenue separately as "Pricing and volume adjustments" in the notes to the consolidated financial statements and in trade and other receivables on the consolidated balance sheets. As per IFRS 15 Revenue from contracts with customers, variability in price is deemed to be fair value movements on provisionally priced receivables under the scope of IFRS 9 Financial Instruments; variability in quantities is deemed to be variable consideration. The variable consideration from weights and assay changes to quantities has been assessed to be insignificant to warrant precluding revenue being recorded as a result of possible future sales reversals. An annual analysis of the accuracy of our weights and assays is completed, and if the accuracy rate falls below a certain threshold, management then evaluates whether revenue from future sales should be constrained as a result of it being highly probable that there would be a significant revenue reversal in the future.
Hudbay only includes in the transaction price an amount which is not highly likely to be subject to significant subsequent revenue reversal. Within sales contracts with customers, separate performance obligations may arise pertaining to the shipping of goods sold. If applicable, costs and the transaction price are allocated on a relative standalone selling basis to any separate performance obligations and are recognized over the period of time the goods sold are shipped, on a gross basis.
Hudbay recognizes deferred revenue in the event it receives payments from customers before a sale meets criteria for revenue recognition.
Precious metals stream contracts, which at inception of the contract are determined that they can be satisfied through the delivery of Hudbay's own production of non-financial items (i.e. gold and silver credits) rather than cash or other financial assets, are accounted for as deferred revenue. If settlement with Hudbay's own production of gold and silver is not possible, the stream transaction is recognized as a financial liability since settlement may require a cash payment. This would cause a change to the accounting treatment, resulting in the revaluation of the agreement to the fair value through the consolidated statements of income on a recurring basis.
Deferred revenue associated with precious metals stream contracts are subject to variable consideration and contain a significant financing component since funds were received in advance of the delivery of concentrate. When a significant financing component is recognized, finance expense will be higher and revenues will be higher as the larger deferred revenue balance is amortized to revenues. A market-based discount rate is utilized at the inception of each of the respective stream agreements to determine a discount rate for computing the interest charges for the significant financing component of the deferred revenue balance. As product is delivered, the deferred revenue amount including accreted interest will be drawn down. The draw down rate requires the use of proven and probable reserves and certain resources in the calculation that are beyond proven and probable reserves which management is reasonably confident will be transferable to reserves. Key estimates used in determining the significant financing component include the discount rate and the reserve and resources assumed for conversion.
(d) Cost of sales:
Cost of sales consists of those costs previously included in the measurement of inventory sold during the period, as well as certain costs not included in the measurement of inventory, such as the cost of warehousing and distribution to customers, provisional pricing adjustments related to purchased concentrates, profit sharing, royalty payments, share-based compensation expense and other indirect expenses related to producing operations.
Cost of sales also include non-cash net realizable value adjustments to inventory, one-time adjustments related to overheads incurred when not operating at normal capacity and one-time labour charges related to facilitating the production of inventories for past service pension costs, curtailment gains and severance.
| HUDBAY MINERALS INC. Notes to Audited Consolidated Financial Statements (in millions of US dollars, except where otherwise noted) Years ended December 31, 2024 and 2023 |
(e) Cash and cash equivalents:
Cash and cash equivalents include cash, demand deposits and short-term, highly liquid investments that are readily convertible to known amounts of cash and are subject to an insignificant risk of changes in value. Cash equivalents have maturities of three months or less at the date of acquisition. Interest earned is included in finance income on the consolidated statements of income and in investing activities on the consolidated statements of cash flows.
Amounts that are restricted from being used for at least twelve months after the reporting date or are not available for general disbursement, like a debt service account are classified as non-current assets and presented in other financial assets on the consolidated balance sheets. Changes in restricted cash balances are classified as investing or financing activities on the consolidated statements of cash flows.
(f) Inventories:
Inventories consist of stockpiles, finished goods inventory (concentrates and metals), materials and supplies. Concentrates, doré, metals and all other saleable products are valued at the lower of cost and estimated net realizable value. Net realizable value represents the estimated selling price for inventories less all estimated direct and indirect costs of completion and costs necessary to make the sale. Where the net realizable value is less than cost, the difference is charged to the consolidated statements of income as an impairment charge in cost of sales. Costs associated with stripping activities in an open pit mine are capitalized to inventory and recorded through cost of sales unless the stripping activity can be shown to improve access to further quantities of ore that will be mined in future periods, in which case, the stripping costs are capitalized to property, plant and equipment.
Cost of production of concentrate inventory is determined on a weighted average cost basis and the cost of production of finished metal inventory is determined using the first in first out basis. The cost of production includes direct costs associated with conversion of production inventory based on normal production capacity: material, labour, contractor expenses, purchased concentrates, and an attributable portion of production overheads and depreciation of all property, plant and equipment involved with the mining and production process. Hudbay measures in-process inventories based on assays of material received at metallurgical plants and estimates of recoveries in the production processes. Due to significant uncertainty associated with volume and metal content, immaterial costs are not allocated to routine operating levels of stockpiled ore. Estimates and judgements are required to assess the nature of any significant changes to levels of ore stockpiles and determining whether allocation of costs is required.
Supplies are valued at the lower of average cost and net realizable value.
(g) Exploration and evaluation expenditures:
Exploration and evaluation activity begins when Hudbay obtains legal rights to explore a specific area and involves the search for mineral reserves, the determination of technical feasibility, and the assessment of commercial viability of an identified resource. Expenditures incurred in the exploration and evaluation phase include the cost of acquiring interest in mineral rights, licenses and properties and the costs of Hudbay's exploration activities, such as researching and analyzing existing exploration data, gathering data through geological studies, exploratory drilling, trenching, sampling, and certain feasibility studies.
Hudbay expenses the cost of its exploration and evaluation activities and capitalizes the cost of acquiring interest in mineral rights, licenses and properties in business combinations, asset acquisitions or option agreements. Amounts capitalized are recognized as exploration and evaluation assets and presented in property, plant and equipment. Exploration and evaluation assets acquired as a result of an asset acquisition or option agreement are initially recognized at cost, and those acquired in a business combination are recognized at fair value on the acquisition date. They are subsequently carried at cost less accumulated impairment. No depreciation is charged during the exploration and evaluation phase. Hudbay expenses the cost of subsequent exploration and evaluation activity related to acquired exploration and evaluation assets. Cash flows associated with acquiring exploration and evaluation assets are classified as investing activities in the consolidated statements of cash flows; those associated with exploration and evaluation expenses are classified as operating activities.
Judgement is required in determining whether the respective costs are eligible for capitalization where applicable, and whether they are likely to be recoverable, which may be based on assumptions about future events and circumstances. Estimates and assumptions made may change if new information becomes available.
Hudbay monitors exploration and evaluation assets for factors that may indicate their carrying amounts are not recoverable. If such indicators are identified, the Company tests the exploration and evaluation assets or their CGUs, as applicable, for impairment. Hudbay also tests for impairment when assets reach the end of the exploration and evaluation phase.
| HUDBAY MINERALS INC. Notes to Audited Consolidated Financial Statements (in millions of US dollars, except where otherwise noted) Years ended December 31, 2024 and 2023 |
Exploration and evaluation assets are transferred to capital works in progress within property, plant and equipment once the Company determines that probable future economic benefits will be generated as a result of the expenditures. Hudbay's determination of probable future economic benefit is based on management's evaluation of the technical feasibility and commercial viability of the geological properties of a given ore body based on information obtained through evaluation activities, including metallurgical testing, resource and reserve estimates and the economic assessment of whether the ore body can be mined economically. Tools that may be used to determine this include a preliminary feasibility study, confidence in converting resources into reserves and the probability that the property could be developed into a mine site. At that time, the property is considered to enter the development phase, and subsequent evaluation costs are capitalized.
(h) Property, plant and equipment:
Hudbay measures items of property, plant and equipment at cost less accumulated depreciation and any accumulated impairment losses.
The initial cost of an item of property, plant and equipment includes its purchase price or construction costs, including import duties and non-refundable purchase taxes, any costs directly attributable to bringing the asset into operation, and for qualifying assets, borrowing costs. The initial cost of property, plant and equipment also includes the initial estimate of the cost of dismantling and removing the item and restoring the site on which it is located, the obligation which Hudbay incurs either when the item is acquired or as a consequence of having used the item during a particular period for purposes other than to produce inventories during that period.
Capitalization of costs ceases once an asset is in the location and condition necessary for it to be capable of operating in the manner intended by management. At this time, depreciation commences. For a new mine, this occurs upon commencement of commercial production. Any revenues less cost to produce, earned prior to commencement of commercial production, are included in the consolidated statements of income.
Carrying amounts of property, plant and equipment, including right-of-use ("ROU") assets, are depreciated to their estimated residual value over the estimated useful lives of the assets or the estimated life of the related mine or plant, if shorter. Where components of an asset have different useful lives, depreciation is calculated on each separate component. Components may be physical or non-physical, including the cost of regular major inspections and overhauls required in order to continue operating an item of property, plant and equipment.
Certain items of property, plant and equipment are depreciated on a unit-of-production basis. The unit-of-production method is based on proven and probable tonnes of ore reserves. There are numerous uncertainties inherent in estimating ore reserves, and assumptions that were valid at the reporting date may change when new information becomes available. The actual volume of ore extracted and any changes in these assumptions could affect prospective depreciation rates and carrying values.
The carrying amount of an item of property, plant and equipment is derecognized on disposal or when no future economic benefits are expected from its use or disposal. Upon derecognition of an item of property, plant and equipment, the difference between its carrying value and net sales proceeds, if any, is presented as a gain or loss in other operating income or expense in the consolidated statements of income.
i. Capital works in progress:
Capital works in progress consist of items of property, plant and equipment in the course of construction or mineral properties in the course of development, including those transferred upon completion of the exploration and evaluation phase. On completion of construction or development, costs are transferred to plant and equipment and/or mining properties as appropriate. Capital works in progress are not depreciated.
ii. Mining properties:
Mining properties consist of costs transferred from capital works in progress when a mining property reaches commercial production, costs of subsequent mine and exploration development, and acquired mining properties in the production stage.
Mining properties include costs directly attributable to bringing a mineral asset into the state where it is capable of operating in the manner intended by management and includes such costs as the cost of shafts, ramps, track haulage drifts, ancillary drifts, pumps, electrical substations, refuge stations, ventilation raises, permanent manways, and ore and waste pass raises. The determination of development costs to be capitalized during the production stage of a mine operation requires the use of judgements and estimates such as estimates of tonnes of waste to be removed over the life of the mining area and economically recoverable reserves extracted as a result.
| HUDBAY MINERALS INC. Notes to Audited Consolidated Financial Statements (in millions of US dollars, except where otherwise noted) Years ended December 31, 2024 and 2023 |
A mining property is considered to be capable of operating in a manner intended by management when it commences commercial production based on pre-established criteria. Upon commencement of commercial production, a mining property is depreciated on a unit-of-production method. Unit-of-production depreciation rates are determined based on the related proven and probable mineral reserves and associated future development costs.
Subsequent mine development costs are capitalized to the extent they are incurred in order to access reserves mineable over more than one year. Ongoing maintenance and development expenditures are expensed as incurred and included in cost of sales in profit or loss. These include ore stope access drifts, footwall and hangingwall drifts in stopes, drawpoints, drill drifts, sublevels, slots, drill raises, stope manway access raises and definition diamond drilling.
iii. Plant and equipment:
Plant and equipment consists of buildings and fixtures, surface and underground fixed and mobile equipment and assets under lease.
Plant and equipment are depreciated on either unit-of-production or straight-line basis based on factors including the production life of assets and mineable reserves. In general, mining assets are depreciated using a unit-of-production method; equipment is depreciated using the straight-line method, based on the shorter of its useful life and that of the related mine or facility; and plants are depreciated using the straight-line method, with useful lives limited by those of related mining assets.
iv. Right-of-use lease assets:
At inception of a contract, Hudbay assesses whether a contract is, or contains, a lease. A contract is, or contains, a lease if the contract conveys the right to control the use of an identified asset for a period of time in exchange for consideration. The Company assesses the following criteria in the determination of whether a contract conveys the right to control the use of an identified asset:
• The contract involves the use of an identified asset - this may be specified explicitly or implicitly, and should be physically distinct or represent substantially all of the capacity of a physically distinct asset. If the supplier has substantive substitution rights, then the asset is not identified;
• Hudbay has the right to obtain substantially all of the economic benefits from use of the asset throughout the period of use; and
• Hudbay has the right to direct the use of the asset by means of decision making rights that are most relevant to changing how and for what purpose the asset is used. In the case where decisions about the asset's purpose is predetermined, Hudbay is deemed to have the right to direct the use of the asset if either:
▪ Hudbay has the right to operate the asset; or,
▪ Hudbay designed the asset in a way that predetermines how and for what purpose it will be used.
The Company recognizes a ROU asset and lease liability at the lease commencement date. The initial measurement of the ROU asset is on a present value basis. This is based on the calculated lease liability plus any initial direct costs incurred, an estimate of removal or restoration costs, and any payments made prior to commencement of the lease less any lease incentives received.
The right of use asset is subsequently depreciated using the straight-line method from the commencement date to the earlier of the end of the useful life of the right-of-use asset or the end of the lease term. The estimated useful lives of the right-of-use assets are determined on the same basis as those of property and equipment. In addition, the right-of-use asset is periodically reduced by impairment losses, if any, and adjusted for certain remeasurements of the lease liability.
The lease liability is measured at the present value of the lease payments that are yet to be paid at the commencement date, discounted using the interest rate implicit in the lease or, if that rate cannot be easily determined, Hudbay's incremental borrowing rate. Generally, the Company uses its incremental borrowing rate as the discount rate for applicable leases.
Lease payments included in the measurement of the lease liability comprise fixed payments including in substance fixed payments and variable payments that depend on an index or rate, amounts expected to be payable under a residual value guarantee and the additional costs Hudbay reasonably expects to incur due to purchase options, extension options and termination options reasonably expected to be exercised.
| HUDBAY MINERALS INC. Notes to Audited Consolidated Financial Statements (in millions of US dollars, except where otherwise noted) Years ended December 31, 2024 and 2023 |
The lease liability is measured at amortized cost using the effective interest method. It is remeasured when there is a change in the expected future cash flows of a leasing contract either due to a change in index or rate, or due to a change in terms of the contract. When the lease liability is remeasured in this way, a corresponding adjustment is made to the carrying amount of the right-of-use asset, or is recorded in profit or loss if the carrying amount of the right-of-use asset is zero.
Hudbay has elected not to separate non-lease components and account for the lease and non-lease components as a single lease component for lease contracts of all asset classes.
The Company has elected not to recognize ROU assets and lease liabilities for short-term leases of machinery that have a lease term of 12 months or less and leases of low-value assets. Hudbay recognizes the lease payments associated with these leases as an expense on a straight-line basis over the lease term.
Hudbay does not enter into transactions where the Company acts as a lessor.
The incremental borrowing rate used to discount leases and to compute interest for new ROU leases is considered a key management judgement.
v. Depreciation rates of major categories of assets:
• Capital works in progress - not depreciated
• Mining properties - unit-of-production
• Mining asset - unit-of-production
• Plant and Equipment
◦ Equipment - straight-line over 1 to 20 years
◦ Other plant assets - straight-line over 1 to 20 years/unit-of-production
• ROU Assets - straight-line over 1 to 20 years
Hudbay reviews its depreciation methods, remaining useful lives and residual values at least annually and accounts for changes in estimates prospectively.
vi. Commercial production:
Commercial production is the level of activities intended by management for a mine, or a mine and mill complex, to be capable of operating in the manner intended by management. Hudbay considers a range of factors when determining the level of activity that represents commercial production for a particular project, including a predetermined percentage of design capacity for the mine and mill; achievement of continuous production, ramp-ups, or other output; or specific factors such as recoveries, grades, or inventory build-ups. In a phased mining approach, management may consider achievement of specific milestones at each phase of completion. In a non-phased mining approach, management considers average actual metrics that are at least 60% of average design capacity or plan over a continuous period. Management assesses the operation's ability to sustain production over a period of approximately one to three months, depending on the complexity related to the stability of continuous operation. Commercial production is considered to have commenced, and depreciation expense is recognized, at the beginning of the month after criteria have been met.
vii. Capitalized borrowing costs:
The Company capitalizes borrowing costs that are directly attributable to the acquisition, construction or production of qualifying assets, which are assets that necessarily take a substantial period of time, generally one year or more, to get ready for their intended use or sale. Capitalization of borrowing costs ceases once the qualifying assets commence commercial production or are otherwise ready for their intended use or sale.
Where funds are borrowed specifically to finance a project, the amount capitalized represents the actual borrowing costs incurred. Where the funds used to finance a project form part of general borrowings, the amount capitalized is calculated using a weighted average of interest rates applicable to relevant general borrowings of Hudbay during the period, to a maximum of actual borrowing costs incurred. Investment income earned by temporarily investing specific borrowings pending their expenditure on qualifying assets is deducted from the borrowing costs eligible for capitalization. Capitalization of interest is suspended during extended periods in which active development is interrupted.
All other borrowing costs are recognized in the consolidated statements of income in the period in which they are incurred.
| HUDBAY MINERALS INC. Notes to Audited Consolidated Financial Statements (in millions of US dollars, except where otherwise noted) Years ended December 31, 2024 and 2023 |
viii. Capitalized stripping costs:
Costs associated with stripping activities in an open pit mine are capitalized to inventory and recorded through cost of sales unless the stripping activity can be shown to improve access to further quantities of ore that will be mined in future periods, in which case, the stripping costs are capitalized to property, plant and equipment. Capitalized stripping costs are included in "mining properties" within property, plant and equipment.
Capitalized stripping costs are depreciated using a units-of-production method over the expected reserves within a given phase of mine development.
(i) Impairment of non-financial assets:
At the end of each reporting period, Hudbay reviews the carrying amounts of property, plant and equipment, exploration and evaluation assets and intangible assets - computer software to determine whether there is any indication of impairment. If any such indication exists, the Company estimates the recoverable amount of the asset in order to determine the extent of the impairment loss, if any. Hudbay generally assesses impairment at the level of CGUs, which are the smallest identifiable groups of assets that generate cash inflows that are largely independent of cash inflows from other assets.
Hudbay's CGUs consist of Manitoba, British Columbia, Peru, Arizona and greenfield exploration assets.
The Company allocates near mine exploration and evaluation assets to CGUs based on their operating segment, geographic location and management's intended use for the property. Near mine exploration and evaluation assets are allocated to CGUs separate from those containing producing or development-phase assets, except where such exploration and evaluation assets have the potential to significantly affect the future production of producing or development-phase assets.
Goodwill is tested for impairment annually and whenever there is an indication that the asset may be impaired. The Company performs goodwill impairment tests on an annual basis as at December 31 each year. If the carrying value of the CGU or group of CGUs to which goodwill is assigned exceeds its recoverable amount, an impairment loss is recognized. Goodwill impairment losses are recorded in the consolidated statements of income and they are not subsequently reversed.
Where an indicator of impairment exists, a formal estimate of the recoverable amount of the asset or CGU is made. The recoverable amount is the higher of the fair value less costs of disposal and value in use:
- Fair value less costs of disposal is the amount obtainable from the sale of the asset or CGU in an arm's length transaction between knowledgeable, willing parties, less costs of disposal. Fair value for mineral assets is often determined as the present value of the estimated future cash flows expected to arise from the continued use of the asset, including any expansion prospects, and its eventual disposal, using assumptions that an independent market participant may take into account. These cash flows are discounted by an appropriate discount rate that reflects current market assessments of the time value of money and the risks specific to the asset to arrive at a net present value of the asset.
- Value in use is determined as the present value of the estimated future cash flows expected to arise from the continued use of the asset or CGU in its present form and its eventual disposal, discounted using a pre-tax rate that reflects current market assessments of the time value of money and risks specific to the asset for which estimates of future cash flows have not been adjusted. Value in use calculations apply assumptions specific to the Company's continued use and cannot take into account future development. These assumptions are different to those used in calculating fair value, and consequently the value in use calculation is likely to give a different result to a fair value calculation.
Hudbay estimates future cash flows based on estimated future recoverable mine production, expected sales prices (considering current and historical commodity prices, price trends and related factors), production levels and cash costs of production, all based on detailed engineering LOM plans. Future recoverable mine production is determined from reserves and resources after taking into account estimated dilution and recoveries during mining, and estimated losses during ore processing and treatment. Estimates of recoverable production from measured, indicated and inferred mineral resources not included in the LOM plan are assessed for economic recoverability and may also be included in the valuation of fair value less costs of disposal. Gains from the expected disposal of assets are not included in estimated future cash flows. Assumptions underlying future cash flow estimates are subject to risks and uncertainties. Changes in estimates may affect the expected recoverability of the Company's investments in mining properties.
| HUDBAY MINERALS INC. Notes to Audited Consolidated Financial Statements (in millions of US dollars, except where otherwise noted) Years ended December 31, 2024 and 2023 |
If the carrying amount of an asset or CGU exceeds its recoverable amount, the carrying amount is reduced to the recoverable amount, and an impairment loss is recognized in the consolidated statements of income in the expense category consistent with the function of the impaired asset or CGU. Hudbay presents impairment losses on the consolidated statements of income as part of results from operating activities. Impairment losses recognized in respect of a CGU are allocated first to reduce the carrying amount of any goodwill allocated to the CGU and then to reduce the carrying amounts of other assets in the CGU on a pro-rata basis for depreciable assets.
The Company assesses previously recognized impairment losses each reporting date for any indications that the losses have decreased or no longer exist. Such an impairment loss is reversed, in full or in part, if there have been significant changes with a positive effect on the estimates used to determine the recoverable amount. An impairment loss is reversed only to the extent that the asset's carrying amount does not exceed the carrying amount that would have been determined, net of depreciation or amortization, if no impairment loss had been recognized for the asset in prior years. Such reversals of impairment losses are recognized in the consolidated statements of income. An impairment loss recognized in relation to goodwill is not reversed for subsequent increases in the recoverable amount.
(j) Pension and other employee benefits:
Hudbay has non-contributory and contributory defined benefit programs for the majority of its Canadian employees. The defined benefit pension benefits are based on years of service and final average salary for the salaried plans and are based on a flat dollar amount combined with years of service for the hourly plans. The Company provides non pension health and other post-employment benefits to certain active employees and pensioners (post-employment benefits) and also provides disability income, health benefits and other post-employment benefits to hourly and salaried disabled employees (other long-term employee benefits).
Hudbay accrues its obligations under the defined benefit plans as the employees render the services necessary to earn the pension and post-employment benefits. The actuarial determination of the accrued benefit obligations for pensions and post-employment benefits uses the projected benefit method pro-rated on service (which incorporates management's best estimate of future salary levels, other cost escalation, retirement ages of employees and other actuarial factors). For other long-term employee benefits, the Company recognizes the full cost of the benefit obligation at the time the employee becomes disabled. Actuarial advice is provided by external consultants.
For the funded defined benefit plans, Hudbay recognizes the deficit or excess of the fair value of plan assets over the present value of the defined benefit obligation as a liability or an asset in the consolidated balance sheets. However, the Company recognizes an excess of assets only to the extent that it represents a future economic benefit which is available in the form of refunds from the plan or reductions in future contributions to the plan. When these criteria are not met, it is not recognized but is disclosed in the notes to the consolidated financial statements. Impacts of minimum funding requirements in relation to past service are considered when determining the balance sheet position.
Defined benefit costs are categorized as follows:
- Service costs (including current service cost, past service cost, as well as gains and losses on curtailments and settlements and administration costs);
- Net interest expense or income; and,
- Remeasurement.
The first two components of defined benefit costs shown above are recognized in the consolidated statements of income. Past service cost as well as curtailment gains are recognized in the consolidated statements of income in the period of a plan amendment. Net interest is calculated by applying the discount rate at the beginning of the period to the net defined benefit liability or asset.
Purchases and sales of plan assets are recorded on settlement date.
Remeasurement, comprising actuarial gains and losses, the effect of changes to the asset ceiling (if applicable) and the return on plan assets (excluding interest), is reflected immediately in the consolidated balance sheets with a gain or loss recognized in OCI in the period in which they occur. Remeasurement recognized in OCI is reflected in the remeasurement reserve and will not be reclassified to the consolidated statements of income. For the other long-term employee benefits plan, remeasurements are recognized immediately in the consolidated statements of income.
Actuarial determinations used in estimating obligations relating to these plans incorporate assumptions using management's best estimates of factors including plan performance, salary escalation, retirement dates of employees and healthcare cost escalation rates. Due to the complexity of the valuation, the underlying assumptions and its long-term nature, a defined benefit obligation is highly sensitive to changes in these assumptions. All assumptions are reviewed at each reporting date. In determining the appropriate discount rate, management considers the interest rates on corporate bonds in the respective currency with at least an AA rating, with extrapolated maturities corresponding to the expected duration of the defined benefit obligation. The mortality rate is based on publicly available mortality tables for the specific country. Future salary increases and pension increases are based on expected future inflation rates for the respective country.
| HUDBAY MINERALS INC. Notes to Audited Consolidated Financial Statements (in millions of US dollars, except where otherwise noted) Years ended December 31, 2024 and 2023 |
Hudbay also has defined contribution plans providing pension benefits for certain of its salaried employees and certain of its US employees utilizing 401K plans. The Company recognizes the cost of the defined contribution plans based on the contributions required to be made during each period.
Termination benefits are recognized as an expense when Hudbay is committed demonstrably, without realistic possibility of withdrawal, to a formal detailed plan to either terminate employment before the normal retirement date, or to provide termination benefits as a result of an offer made to encourage voluntary redundancy. Termination benefits for voluntary redundancies are recognized as an expense if the Company has made an offer of voluntary redundancy, it is probable that the offer will be accepted, and the number of acceptances can be estimated reliably. Benefits that are payable more than one year after the reporting period are discounted to their present value.
(k) Environmental and other provisions:
Provisions are recognized when Hudbay has a present obligation (legal or constructive) as a result of a past event, it is probable that an outflow of resources will be required to settle the obligation, and a reliable estimate can be made. The provisions are recorded as management's best estimate of the amount required to settle an obligation.
Provisions are stated at their present value, which is determined by discounting the expected future cash flows at a pre-tax rate that reflects current market assessments of the time value of money and the risks specific to the liability.
Decommissioning, restoration and similar liabilities
Provisions are recorded for legal and constructive obligations associated with the future costs of rehabilitating the Company's current and previous operating and development sites. Such costs are associated with decommissioning and restoration activities such as dismantling and removing structures, rehabilitating mines and tailings, and reclamation and re-vegetation of affected areas.
The present value of estimated costs is recorded in the period in which the asset is installed or the environment is disturbed and a reasonable estimate of future costs and discount rates can be made. The provision is discounted using a risk-free rate, and estimates of future cash flows are adjusted to reflect risk.
Subsequent to the initial measurement, the obligation is adjusted to reflect the passage of time and changes in the estimated future cash flows underlying the obligation. The increase in the provision due to the passage of time is recognized as finance expense, whereas increases and decreases due to changes in the estimated future cash flows, which are not the result of current inventory production, are capitalized and depreciated over the life of the related operating asset. Actual costs incurred upon settlement of the site restoration obligation are charged against the provision to the extent the provision was established for those costs. Upon settlement of the liability, a gain or loss may be recorded. For closed sites, changes to estimated costs are recognized immediately in the consolidated statements of income within other expenses.
Hudbay assesses the reasonableness of its estimates and assumptions each year and when conditions change, the estimates are revised accordingly. Judgement is required to determine the scope and timing of future decommissioning and restoration activities, as well as best available estimates and assumptions including discount rates, expected timing of decommissioning and restoration costs, inflationary factors and market risks. Changes in cost estimates, which may arise from changes in technology and pricing of the individual components of the cost may result in offsetting changes to the asset and liability and corresponding changes to the associated depreciation and finance costs. In view of the uncertainties concerning these future obligations, the ultimate timing and cost of reclamation and mine closure may differ materially from these estimates.
If the change in estimate results in a significant increase in the decommissioning liability and therefore an addition to the carrying value of the asset, the Company considers whether this is an indication of impairment of the asset as a whole and, if so, tests for impairment in accordance with IAS 36, Impairment of non-financial assets. If, for mature mines, the revised mine assets net of decommissioning and restoration liabilities exceeds the recoverable value, that portion of the increase is charged directly to expense as an impairment loss, within the gross profit / (loss) line.
In view of the uncertainties concerning environmental remediation, the ultimate cost of decommissioning and restoration liabilities could differ materially from the estimated amounts provided. The estimate of the total liability is subject to change based on amendments to laws and regulations and as new information concerning Hudbay's operations becomes available. Future changes, if any, to the estimated total liability as a result of amended requirements, laws, regulations and operating assumptions, as well as discount rates, may be significant and would be recognized prospectively as a change in accounting estimate, when applicable. Environmental laws, regulations and technology are continually evolving in all regions in which the Company operates. Hudbay is not able to determine the impact, if any, of environmental laws, regulations and technology that may be enacted in the future on its results of operations or financial position due to the uncertainty surrounding the ultimate form that such future laws and regulations may take.
| HUDBAY MINERALS INC. Notes to Audited Consolidated Financial Statements (in millions of US dollars, except where otherwise noted) Years ended December 31, 2024 and 2023 |
Onerous contracts
A contract is considered to be onerous when the unavoidable costs of meeting obligations under the contract exceed the economic benefits expected to be received under it. Hudbay records a provision for any onerous contracts at the lesser of costs to comply with a contract and costs to terminate it.
Restructuring provisions
A provision for restructuring is recognized when management, with appropriate authority within Hudbay, has approved a detailed and formal restructuring plan, and the restructuring has either commenced or has been announced publicly. Future operating costs are not provided for.
(l) Financial instruments:
Non-derivative financial instruments are initially recognized at fair value plus, in the case of a financial asset or financial liability not measured at fair value through profit or loss, directly attributable transaction costs. Measurement in subsequent periods depends on the financial instrument's classification. Hudbay uses trade date accounting for regular way purchases or sales of financial assets. The Company determines the classification of its financial instruments and non-financial derivatives at initial recognition.
Financial assets and liabilities are offset and the net amount presented in the consolidated balance sheets when, and only when, Hudbay has a legal right to offset the amounts and intends either to settle on a net basis or to realize the asset and settle the liability simultaneously.
The classification of financial assets is based on the results of the contractual characteristics test and the business model assessment which will result in the financial asset being classified as either: amortized cost, fair value through profit or loss ("FVTPL") or fair value through other comprehensive income ("FVTOCI").
i. Non-derivative financial instruments - classification:
Financial assets at fair value through profit or loss
Provisionally priced copper and zinc concentrate sales receivables, warrants and investments in securities of junior mining companies are classified as financial assets at fair value through profit or loss and are measured at fair value. The gains or losses related to changes in fair value are reported in the consolidated statements of income.
Amortized cost
Cash, certain receivables, other assets related to agreements with communities near the Peru operations, trade and other payables, long-term debt and restricted cash are classified as and measured at amortized cost and are carried at amortized cost using the effective interest rate method, less impairment losses, if any.
Non-derivative financial liabilities
Accounts payable and senior unsecured notes are initially recognized at fair value and subsequently accounted for at amortized cost, using the effective interest method. The amortization of senior unsecured notes issue costs is calculated using the effective interest rate method.
ii. Derivatives:
Derivatives are initially recognized at fair value when Hudbay becomes a party to the derivative contract and are subsequently re-measured to fair value at the end of each reporting period. The resulting gain or loss is recognized in the consolidated statements of income immediately unless the derivative is designated and effective as a hedging instrument. Derivatives with positive fair value are recognized as assets; derivatives with negative fair value are recognized as liabilities.
Derivatives contracts that are entered to economically hedge a risk exposure but are not designated as a hedging instrument for hedge accounting purposes, and are physically settled, are initially and subsequently measured at fair value. Subsequent movements in fair value are recognized within the revenue line item in the consolidated statements of income.
| HUDBAY MINERALS INC. Notes to Audited Consolidated Financial Statements (in millions of US dollars, except where otherwise noted) Years ended December 31, 2024 and 2023 |
Hudbay enters into derivatives contracts to hedge commodity price risk exposure associated with quotational pricing terms in our sales contract as well as for non-quotational pricing ("non-QP"), which are not designated as hedging instrument for hedge accounting purposes. These non-quotational pricing derivative contracts are not physically settled and are referred to as non-QP hedges. These are initially and subsequently measured at fair value. Subsequent movements in fair value of these non-QP hedges are recognized in change in fair value of financial instruments on the consolidated statement of income.
iii. Embedded derivatives:
Hudbay considers whether a contract contains an embedded derivative when it becomes a party to the contract. Derivatives embedded in other financial liabilities or other non-financial host contracts are treated as separate derivatives when their risks and characteristics are not closely related to those of the host contracts and the host contracts are not measured at FVTPL.
iv. Fair value of financial instruments:
The fair value of a financial instrument is the amount for which an asset could be exchanged, or a liability settled, between knowledgeable, willing parties in an arm's length transaction.
Fair values of financial instruments traded in active markets are determined based on quoted market prices, where available. Bid prices are generally used for assets held or liabilities to be issued; asking prices are generally used for assets to be acquired or liabilities held.
For financial instruments not traded in an active market, fair values are determined based on appropriate valuation techniques. Such techniques may include discounted cash flow analysis, using recent arm's length market transactions, reference to the current fair value of another instrument that is substantially the same, and other valuation models.
The Company applies a hierarchy to classify valuation methods used to measure financial instruments carried at fair value. Levels 1 to 3 are defined based on the degree to which fair value inputs are observable and have a significant effect on the recorded fair value, as follows:
- Level 1: Quoted prices (unadjusted) in active markets for identical assets or liabilities;
- Level 2: Valuation techniques use significant observable inputs, either directly (i.e. as prices) or indirectly (i.e. derived from prices), or valuations are based on quoted prices for similar instruments; and,
- Level 3: Valuation techniques use significant inputs that are not based on observable market data (unobservable inputs).
An analysis of fair values of financial instruments is provided in note 31.
v. Impairment of financial instruments:
Hudbay recognizes loss allowances for Expected Credit Losses ("ECL") for trade receivables not measured at FVTPL.
Loss allowances for trade receivables are measured at an amount equal to lifetime ECL. ECL is a probability-weighted estimate measured at the present value of all cash shortfalls including the impact of forward-looking information.
Hudbay has established a provision based on the Company's historical credit loss experience, adjusted for forward-looking factors specific to the debtors and the economic environment.
vi. Derecognition of financial instruments:
Hudbay derecognizes financial assets when the contractual rights to the cash flows from the assets expire, or when the Company transfers the rights to receive the contractual cash flows on the financial assets in a transaction in which substantially all the risks and rewards of ownership of the financial asset are transferred. Any interest in the transferred financial assets that is created or retained by Hudbay is recognized as a separate asset or liability.
| HUDBAY MINERALS INC. Notes to Audited Consolidated Financial Statements (in millions of US dollars, except where otherwise noted) Years ended December 31, 2024 and 2023 |
Hudbay derecognizes financial liabilities when its contractual obligations are discharged, cancelled or expire or when its terms are modified and the cash flows of the modified liability are substantially different.
(m) Taxation:
Current Tax
Current income tax assets and liabilities for the current and prior periods are measured at the amount expected to be recovered from or paid to the taxation authorities. The tax rates and tax laws used to compute the amount are those that are enacted or substantively enacted by the balance sheet date.
Hudbay is subject to income taxes in numerous jurisdictions. Significant judgement is required in determining the worldwide provision for income taxes due to the complexity of legislation. There are many transactions and calculations for which the ultimate tax determination is uncertain during the ordinary course of business. The Company recognizes liabilities for anticipated tax issues based on estimates of whether additional taxes will be due. Where the final tax outcome of these matters is different from the amounts that were initially recorded, such differences will affect the income tax and deferred tax provisions in the period in which such determination is made.
Additionally, future changes in tax laws in the jurisdictions in which Hudbay operates could limit the ability of the Company to obtain tax deductions in future periods.
Deferred Tax
Deferred tax is recognized using the balance sheet method in respect of temporary differences at the balance sheet date between the tax basis of assets and liabilities, and their carrying amounts for financial reporting purposes.
Deferred income tax liabilities are recognized for all taxable temporary differences, except:
- where the deferred income tax liability arises from the initial recognition of goodwill, or the initial recognition of an asset or liability in a transaction that is not a business combination and, at the time of the transaction, affects neither the accounting profit nor taxable profit or loss; and
- in respect of taxable temporary differences associated with investments in subsidiaries, associates and interest in joint ventures, where the timing of the reversal of the temporary differences can be controlled and it is probable that the temporary differences will not reverse in the foreseeable future.
Deferred income tax assets are recognized for all deductible temporary differences, carry-forward of unused tax assets and unused tax losses, to the extent that it is probable that taxable profit will be available against which the deductible temporary differences, and the carry-forward of unused tax assets and unused tax losses can be utilized, except:
- where the deferred income tax asset relating to the deductible temporary difference arises from the initial recognition of an asset or liability in a transaction that is not a business combination and, at the time of the transaction, affects neither the accounting profit nor taxable profit or loss; and
- in respect of deductible temporary differences associated with investments in subsidiaries, associates and interest in joint ventures, deferred tax assets are recognized only to the extent that it is probable that the temporary differences will reverse in the foreseeable future and taxable profit will be available against which the temporary differences can be utilized.
To the extent that it is probable that taxable profit will be available to offset the deductible temporary differences, Hudbay recognizes the deferred tax asset regarding the temporary difference on decommissioning, restoration and similar liabilities and recognizes the corresponding deferred tax liability regarding the temporary difference on the related assets.
The carrying amount of deferred income tax assets is reviewed at each balance sheet date and reduced to the extent that it is no longer probable that sufficient taxable profit will be available to allow all or part of the deferred income tax asset to be utilized. Unrecognized deferred income tax assets are reassessed at each balance sheet date and are recognized to the extent that it has become probable that future taxable profit will be available to allow the deferred tax asset to be recovered.
Judgement is required in determining whether deferred tax assets are recognized on the consolidated balance sheets. Deferred tax assets, including those arising from unutilized tax losses, require management to assess the likelihood of taxable profit in future periods in order to utilize recognized deferred tax assets. Estimates of future taxable income are based on forecast cash flows from operations and the application of existing tax laws in each jurisdiction. To the extent that future cash flows and taxable income differ significantly from estimates, the ability to realize the net deferred tax assets recorded at the balance sheet date could be affected.
| HUDBAY MINERALS INC. Notes to Audited Consolidated Financial Statements (in millions of US dollars, except where otherwise noted) Years ended December 31, 2024 and 2023 |
Deferred tax is measured on an undiscounted basis at the tax rates that are expected to apply in the periods in which the asset is realized or the liability is settled, based on tax rates and tax laws enacted or substantively enacted at the balance sheet date.
Deferred income tax assets and deferred income tax liabilities are offset if a legally enforceable right exists to offset current tax assets against current tax liabilities and the deferred income taxes relate to the same taxable entity and the same taxation authority.
Current and deferred taxes relating to items recognized outside profit or loss (whether in other comprehensive income or directly in equity) are recognized outside profit or loss and not in the consolidated statements of income. Mining taxes and royalties are treated and disclosed as current and deferred taxes if they have the characteristics of an income tax.
(n) Share capital and reserves:
Transaction costs
Transaction costs directly attributable to equity transactions are recognized as a deduction from equity.
Other capital reserve
The other capital reserve is used for equity-settled share-based compensation and includes amounts for stocks options granted and not exercised.
Foreign currency translation reserve
The foreign currency translation reserve is used to record exchange differences arising from the translation of the financial statements of foreign operations. Exchange differences arising from the translation of the financial statements of foreign operations form part of the net investment in the foreign operation. Translation gains and losses remain in the reserve until disposal of all or a portion of the foreign operation.
(o) Flow-through shares
Resource expenditure deductions for income tax purposes related to exploration activities funded by flow-through share arrangements are renounced to investors under Canadian income tax legislation. On issuance, the Corporation separates the flow-through share into i) a flow-through share premium, equal to the difference between the current market price of the Corporation's common shares and the issue price of the flow-through share and ii) share capital. Upon qualifying exploration and/or development expenditures being incurred, the sale of tax deductions is recognized as other income in the statement of income and the related liability is reduced. The Company may also be subject to a Part XII.6 tax on flow-through proceeds renounced, in accordance with the Canadian Income Tax Act flow-through regulations. When applicable, the estimated tax payable is accrued until paid.
(p) Share-based compensation:
Hudbay compensates its employees in part through the use of a Deferred Share Unit ("DSU") plan for non-employee members of the Board of Directors, a Restricted Share Unit ("RSU") plan for employees, a Performance Share Unit ("PSU") plan for employees and a stock option plan for employees. These plans are included in provisions on the consolidated balance sheets and further described in note 28. Changes in the fair value of the liabilities are recorded in the consolidated statements of income.
Cash-settled transactions, consisting of DSUs, RSUs and PSUs, are initially measured at fair value and recognized as an obligation at the grant date. The liabilities are remeasured to fair value at each reporting date up to and including the settlement date, with changes in fair value recognized in the consolidated statements of income. Hudbay values the liabilities based on the change in the Company's share price. Additional DSUs, RSUs and PSUs are credited to reflect dividends paid on Hudbay common shares over the vesting period. The current portion of the liability reflects those grants that have vested or that are expected to vest within twelve months.
DSUs vest on the grant date and are redeemable when a participant is no longer a member of the Board of Directors. Issue and redemption prices of DSUs are based on the average closing price of the Company's common shares for the five trading days prior to issuance or redemption.
| HUDBAY MINERALS INC. Notes to Audited Consolidated Financial Statements (in millions of US dollars, except where otherwise noted) Years ended December 31, 2024 and 2023 |
RSUs and PSUs are issued under Hudbay's Long Term Equity Plan ("LTEP Plan") and vest on or before the third anniversary of the grant. RSUs and PSUs granted under the LTEP Plan may be settled in the form of the Company's common shares or, at the option of Hudbay, the cash equivalent based on the market price of the common shares as of the vesting date. Hudbay has historically settled RSUs in cash. Except in specified circumstances, RSUs and PSUs terminate when an employee ceases to be employed by the Company. Valuations of RSUs and PSUs reflect estimated forfeitures.
Equity-settled transactions with employees relate to stock options and are measured by reference to the fair value at the earlier of the grant date and the date that the employee unconditionally became entitled to the award. Fair value is determined using a Black-Scholes option pricing model, which relies on estimates of the future risk-free interest rate, future dividend payments, future share price volatility and the expected average life of the options. Hudbay believes this model adequately captures the substantive features of the option awards and is appropriate to calculate their fair values. The fair value determined at the grant date is recognized over the vesting period in accordance with vesting terms and conditions, with a corresponding increase to other capital reserves. The amount recognized as an expense is adjusted to reflect the number of awards for which the related service and non-market vesting conditions are expected to be met.
(q) Earnings per share:
The Company presents basic and diluted earnings (loss) per share ("EPS") data for its common shares. Basic EPS is calculated by dividing the profit or loss attributable to common shareholders of the Company by the weighted average number of common shares outstanding during the period. Diluted EPS is determined by adjusting the profit or loss attributable to common shareholders and the weighted average number of common shares outstanding for the effects of all dilutive potential common shares, which previously consisted of stock options granted to employees and warrants.
When calculating earnings per share for periods where the Company has a loss, Hudbay's calculation of diluted earnings per share excludes any incremental shares from the assumed conversion of stock options as they would be anti-dilutive.
(r) Leases:
Leases, under which substantially all the risks and rewards incidental to ownership of the leased item are transferred to Hudbay, are capitalized as assets at the inception of the lease at the lower of fair value or the present value of the minimum lease payments. Lease payments are apportioned between finance charges and the reduction of the liability so as to achieve a constant periodic rate of interest on the remaining balance of the liability. Finance charges are reflected in the consolidated statements of income as finance costs.
Non-ROU lease payments are recognized as an expense in the consolidated statements of income on a straight-line basis over the lease term.
(s) Segment reporting:
An operating segment is a component of the Company that engages in business activities from which it may earn revenue and incur expenses and for which discrete financial information is available. Hudbay's chief executive officer regularly reviews the operating results of each operating segment to make decisions about resources to be allocated to the segment and assess its performance. In determining operating segments, Hudbay considers location and decision-making authorities. Refer to note 36.
4. New standards
New standards and interpretations adopted
(a) Amendment to IAS 1 - Presentation of Financial Statements
The amendments to IAS 1 clarify that only covenants with which an entity is required to comply on or before the reporting date affect the classification of a liability as current or non-current. In addition, an entity has to disclose information in the notes that enables users of financial statements to understand the risk that non-current liabilities with covenants could become repayable within twelve months. Classification is unaffected by the expectations that the entity will exercise its right to defer settlement of a liability. Lastly, the amendments clarify that settlement refers to the transfer to the counterparty of cash, equity instruments, other assets. The amendments are effective for annual periods beginning on or after January 1, 2024. The amendments have been adopted by the Company and the amendments did not result in any changes to the consolidated financial statements.
| HUDBAY MINERALS INC. Notes to Audited Consolidated Financial Statements (in millions of US dollars, except where otherwise noted) Years ended December 31, 2024 and 2023 |
New standards issued but not yet effective
(b) IFRS 18 - Presentation and Disclosure in Financial Statements
In April 2024, the IASB released IFRS 18 Presentation and Disclosure in Financial Statements. IFRS 18 will replace IAS 1 Presentation of Financial Statements. The standard amends the presentation of the statement of income by introducing a newly defined 'operating profit' subtotal and a requirement for income and expenses to be allocated between three new distinct categories based on a company's main business activities, which are Operating, Financing and Investing. In addition, organizations will need to disclose certain 'non-GAAP' measures known as management-defined performance measures. The standard will be effective from January 1, 2027 with early adoption is permitted and requires retrospective application. The Company is still assessing the impact of adoption of this amendment on its consolidated financial statements.
(c) Amendment to IFRS 9 - Financial Instruments and IFRS 7 - Financial Instruments: Disclosures
In May 2024, the IASB issued amendments to IFRS 9 and 7 to clarify the recognition or derecognition of a financial asset or liability, with a new exception for some financial liabilities settled through an electronic cash transfer system. The amendments also add guidance for assessing whether a financial asset meets the solely payments of principal and interest (SPPI) criterion, by introducing an additional SPPI test for financial assets with contingent features that are not related directly to a change in basic lending risks or costs. In addition, the amendments will add new disclosures for certain instruments with contractual terms that can change cash flows. Lastly, the amendments will require additional disclosures for equity instruments designated at fair value through other comprehensive income. The amendments will apply for reporting periods beginning on or after January 1, 2026, with early application permitted. The Company is assessing the impact of adoption of this amendment on its consolidated financial statements.
5. Acquisition of Copper Mountain Mining Corporation
On June 20, 2023, Hudbay acquired all of the issued and outstanding common shares of Copper Mountain Mining Inc. (formerly, Copper Mountain Mining Corp., and referred to herein as "Copper Mountain"), as part of a court-approved plan of arrangement. At the time, Copper Mountain held 75% of CMBC, the entity that owns 100% of the Copper Mountain mine. MMC owns the remaining 25% interest in CMBC as a non-controlling interest.
As a result of the acquisition, Hudbay obtained control of Copper Mountain on June 20, 2023.
Management determined that the assets and processes comprised a business and therefore accounted for the transaction as a business combination, using the acquisition method of accounting.
Consideration transferred:
The purchase consideration paid by Hudbay was for 100% of the net assets of Copper Mountain and their 100% owned subsidiaries ("100% owned entities") and a 75% ownership in CMBC. The aggregate purchase consideration for the acquired assets, net of the liabilities assumed is as follows:
| Equity instruments (84,165,617 common shares of Hudbay) | $ | 436.7 | |
| Cash | 3.8 | ||
| Consideration transferred - June 20, 2023 | $ | 440.5 |
The fair value of the common shares issued was based on Hudbay's listed share price of C$6.87 at the June 20, 2023 acquisition date. Immediately prior to the acquisition, Copper Mountain settled its outstanding restricted share units and performance share units through the issuance of shares and settled its stock options for replacement Hudbay options that were immediately settled in cash.
Hudbay incurred acquisition related costs of $6.9 million during the year ended December 31, 2023, mainly relating to external legal and advisory fees and due diligence costs, which were recorded in other expense in the consolidated statements of income. In addition, Hudbay incurred share issuance costs of $0.2 million and presented these as a deduction from share capital.
Identifiable assets acquired and liabilities assumed:
The fair value of the net assets was determined using a combination of market, income and cost methods. The fair value of the non-controlling interest was then computed at a 25% of the equity interest in CMBC.
| HUDBAY MINERALS INC. Notes to Audited Consolidated Financial Statements (in millions of US dollars, except where otherwise noted) Years ended December 31, 2024 and 2023 |
The following presents the allocation of the final purchase price, resulting in recognized fair value amounts of identifiable assets acquired and liabilities assumed as follows:
| Fair value of net assets acquired / (liabilities) assumed | Final | ||
| Cash and cash equivalent | $ | 14.5 | |
| Trade and other receivables | 19.1 | ||
| Inventories | 47.9 | ||
| Prepaid expenses | 3.1 | ||
| Other financial assets | 8.5 | ||
| Property, plant and equipment | 434.8 | ||
| Mineral properties | 369.0 | ||
| Inventories - low grade stockpile | 6.0 | ||
| Trade and other payables | (77.1 | ) | |
| Advances from Hudbay | (3.4 | ) | |
| Lease liabilities | (34.6 | ) | |
| Other financial liabilities | (9.6 | ) | |
| Long-term debt | (145.0 | ) | |
| Environmental and other provisions | (12.7 | ) | |
| Deferred tax liabilities | (148.2 | ) | |
| Total fair value of net identifiable assets acquired | $ | 472.3 |
The fair values of mineral properties, low grade stockpile and other property, plant and equipment have been determined based on an independent valuation, using a combination of market, income and cost methods. In particular, the fair values of the mineral properties and low grade stockpile have been calculated using significant judgements and estimates.
Trade receivables acquired as part of the acquisition have a fair value of $8.8 million which is equal to their gross contractual value. Other receivables acquired have a fair value of $10.3 million which is equal to their gross contractual value. Trade and other receivables are expected to be collected during the next 12 months.
Hudbay provided advances to Copper Mountain prior to the acquisition date, which have been recorded as a purchaser loan.
Hudbay recognized goodwill as a result of the acquisition as follows:
| Final | |||
| Total consideration transferred | $ | 440.5 | |
| Non-controlling interest | 107.0 | ||
| Less: value of net identifiable assets acquired | (472.3 | ) | |
| Goodwill upon acquisition at June 20, 2023 | $ | 75.2 |
The goodwill balance arose from the requirement to record deferred income tax liabilities measured at the tax effect of the difference between the fair values of the assets acquired and liabilities assumed and their tax bases. None of the goodwill recognized is expected to be deductible for income tax purposes.
The results of operations have been consolidated with those of the Company from the date of acquisition and included in the British Columbia operating segment. Had the business combination been affected at January 1, 2023, revenue and profit of the combined entity would have been $1,824,713 and $27,406, respectively. The revenue and net profit contributed from the acquisition of Copper Mountain has been $165,438 and $13,376, respectively.
| HUDBAY MINERALS INC. Notes to Audited Consolidated Financial Statements (in millions of US dollars, except where otherwise noted) Years ended December 31, 2024 and 2023 |
6. Acquisition of Rockcliff Metals Corporation
On September 14, 2023, Hudbay acquired all of the issued and outstanding common shares of Rockcliff, as part of a court-approved plan of arrangement. In doing so, Hudbay obtained control of Rockcliff on September 14, 2023.
Management determined that substantially all of the fair value of the gross assets acquired is concentrated in the Talbot exploration property and therefore accounted for the transaction as an asset acquisition.
The purchase consideration paid was 2,675,324 Hudbay common shares and 517,460 Hudbay warrants. For asset acquisitions settled with equity, entities are required to record the net assets acquired based on the fair value of the assets received in exchange for the equity issued, unless that fair value cannot be estimated reliably. Hudbay incurred acquisition related costs of $0.5 million during the third quarter of 2023, mainly relating to external legal and advisory fees and due diligence costs, which were capitalized and included as a cost of acquiring the net assets.
The fair value of the net assets acquired was determined using a combination of income and cost methods. In particular, the fair values of the exploration property have been calculated using significant judgements and estimates. The following presents the fair value amounts of identifiable assets acquired and liabilities assumed:
| Fair value of net assets acquired / (liabilities) assumed | Final | ||
| Cash and cash equivalents | $ | 0.3 | |
| Accounts receivable and prepaid expenses | 0.1 | ||
| Exploration property | 14.2 | ||
| Accounts payable and accrued liabilities | (0.3 | ) | |
| Advance from Hudbay | (0.5 | ) | |
| Total fair value of net identifiable assets acquired | $ | 13.8 |
| HUDBAY MINERALS INC. Notes to Audited Consolidated Financial Statements (in millions of US dollars, except where otherwise noted) Years ended December 31, 2024 and 2023 |
7. Revenue and expenses
(a) Revenue
Hudbay's revenue by significant product types:
| Year ended December 31, | ||||||
| 2024 | 2023 | |||||
| Copper | $ | 1,154.8 | $ | 1,065.8 | ||
| Gold | 673.6 | 463.0 | ||||
| Zinc | 71.1 | 76.6 | ||||
| Silver | 51.5 | 35.6 | ||||
| Molybdenum | 60.1 | 79.4 | ||||
| Other | 1.7 | 0.2 | ||||
| Revenue from contracts | 2,012.8 | 1,720.6 | ||||
| Non-cash streaming arrangement items 1 | ||||||
| Amortization of deferred revenue - gold | 40.7 | 39.8 | ||||
| Amortization of deferred revenue - silver | 33.6 | 32.6 | ||||
| Amortization of deferred revenue - variable consideration adjustments - prior periods |
(3.8 | ) | 4.9 | |||
| 70.5 | 77.3 | |||||
| Pricing and volume adjustments 2 | 35.2 | 5.8 | ||||
| 2,118.5 | 1,803.7 | |||||
| Treatment and refining charges | (97.3 | ) | (113.7 | ) | ||
| $ | 2,021.2 | $ | 1,690.0 | |||
| 1 See note 22. | ||||||
| 2 Pricing and volume adjustments represent mark-to-market adjustments on initial estimate of provisionally priced sales, realized and unrealized changes to fair value of quotational pricing hedge derivative contracts and adjustments to originally invoiced weights and assays. | ||||||
Consideration from the Company's stream agreements is considered variable (note 22). Gold and silver stream revenue can be subject to cumulative adjustments when the amount of precious metals to be delivered under the contract changes. As a result of changes in the Company's mineral reserve and resource estimate in the first quarter of 2024, the amortization rate by which deferred revenue is drawn down into income was adjusted and, as required, a variable consideration adjustment was made for all prior year stream revenues since the stream agreement inception date. This variable consideration adjustment for the year ended December 31, 2024 resulted in a decrease in revenue of $3.8 million (December 31, 2023 - increase in revenue of $4.9 million).
(b) Depreciation and amortization
Depreciation of property, plant and equipment and amortization of intangible assets are reflected in the consolidated statements of income as follows:
| Year ended December 31, | ||||||
| 2024 | 2023 | |||||
| Cost of sales | $ | 426.6 | $ | 391.7 | ||
| Selling and administrative expenses | 1.4 | 1.4 | ||||
| $ | 428.0 | $ | 393.1 | |||
| HUDBAY MINERALS INC. Notes to Audited Consolidated Financial Statements (in millions of US dollars, except where otherwise noted) Years ended December 31, 2024 and 2023 |
(c) Share-based compensation expenses
Share-based compensation expenses are reflected in the consolidated statements of income as follows:
| Cash-settled | Total share- based compensation expense |
||||||||||||||
| RSUs | DSUs | PSUs | Stock options |
||||||||||||
| Year ended December 31, 2024 | |||||||||||||||
| Cost of sales | $ | 2.0 | $ | - | $ | - | $ | - | $ | 2.0 | |||||
| Selling and administrative | 4.0 | 6.3 | 4.2 | 2.1 | 16.6 | ||||||||||
| Other expenses | 0.7 | - | - | - | 0.7 | ||||||||||
| $ | 6.7 | $ | 6.3 | $ | 4.2 | $ | 2.1 | $ | 19.3 | ||||||
| Year ended December 31, 2023 | |||||||||||||||
| Cost of sales | $ | 0.6 | $ | - | $ | - | $ | - | $ | 0.6 | |||||
| Selling and administrative | 2.1 | 1.7 | 0.6 | $ | 2.2 | 6.6 | |||||||||
| Other expenses | 0.2 | - | - | - | 0.2 | ||||||||||
| $ | 2.9 | $ | 1.7 | $ | 0.6 | $ | 2.2 | $ | 7.4 | ||||||
During the year ended December 31, 2024, the Company granted 902,874 stock options (year ended December 31, 2023 - 801,661). For further details on stock options, see note 28b.
| HUDBAY MINERALS INC. Notes to Audited Consolidated Financial Statements (in millions of US dollars, except where otherwise noted) Years ended December 31, 2024 and 2023 |
(d) Employee benefits expense
This table presents employee benefit expense recognized in the consolidated statements of income, including amounts transferred from inventory upon sale of goods:
|
Year ended December 31, |
||||||
| 2024 | 2023 | |||||
| Current employee benefits1 | $ | 239.2 | $ | 193.5 | ||
| Profit-sharing plan expense | 51.1 | 28.7 | ||||
| Share-based compensation (notes 7c, 23, 28) | ||||||
| Equity settled stock options | 2.1 | 2.2 | ||||
| Cash-settled restricted share units | 6.7 | 2.9 | ||||
| Cash-settled deferred share units | 6.3 | 1.7 | ||||
| Cash-settled performance share units | 4.2 | 0.6 | ||||
| Employee share purchase plan | 1.8 | 1.8 | ||||
| Post-employee pension benefits | ||||||
| Defined benefit plans | 4.4 | 0.8 | ||||
| Defined contribution plans | 2.1 | 0.7 | ||||
| Past service cost (note 24, 25) | 4.3 | 0.1 | ||||
| Other post-retirement employee benefits | 7.5 | - | ||||
| Termination benefits | 1.7 | 4.5 | ||||
| $ | 331.4 | $ | 237.5 | |||
| 1As Copper Mountain was acquired on June 20, 2023, the results for the year ended December 31, 2023 represents the period from the acquisition date, June 20, 2023, through to the end of the fourth quarter of 2023. | ||||||
Manitoba has a profit sharing plan required by the collective bargaining agreement whereby 10% of Manitoba's after tax profit (excluding provisions or recoveries for deferred income tax and deferred mining tax) for any given fiscal year will be distributed to all eligible employees in the Flin Flon/Snow Lake operations, with the exception of executive officers and key management personnel.
Peru has a profit sharing plan required by Peruvian law whereby 8% of Peru's taxable income will be distributed to all employees within Peru's operations.
The Company has an employee share purchase plan for executives and other eligible employees where participants may contribute between 1% and 10% of their pre-tax base salary to acquire Hudbay shares. The Company makes a matching contribution of 75% of the participant's contribution.
In addition, the Company recognized a past service cost provision adjustment related to pensions and post-employment plans for certain Manitoba employees of $4.3 million.
See note 24 for a description of Hudbay's pension plans and note 25 for Hudbay's other employee benefit plans.
| HUDBAY MINERALS INC. Notes to Audited Consolidated Financial Statements (in millions of US dollars, except where otherwise noted) Years ended December 31, 2024 and 2023 |
(e) Other expenses
|
Year ended December 31, |
||||||
| 2024 | 2023 | |||||
| Regional costs | $ | 5.4 | $ | 4.3 | ||
| Write-down/loss on disposal of PP&E | 27.4 | 7.4 | ||||
| Amortization of community costs (other assets) | 8.5 | 7.0 | ||||
| Copper Mountain related acquisition costs (note 5) | - | 6.9 | ||||
| Restructuring | 1.2 | 2.9 | ||||
| Care & maintenance - Manitoba | 14.6 | 17.1 | ||||
| Evaluation costs | 1.2 | 0.8 | ||||
| Insurance recovery | - | (4.2 | ) | |||
| Value-added-tax recovery | - | (3.9 | ) | |||
| Reduction of obligation to renounce flow-through share expenditures, net of provisions | (2.0 | ) | - | |||
| Option agreement proceeds (Marubeni) | (0.4 | ) | - | |||
| Other | 1.5 | - | ||||
| $ | 57.4 | $ | 38.3 | |||
The Arizona business unit held an option to acquire water rights and land, which expired during the first quarter of 2024 without being extended or exercised. The previously capitalized cost to maintain the option, net of accrued interest, of $8.1 million is presented as part of write-down of PP&E.
The British Columbia business unit has recognized an impairment loss on a ball mill that is no longer being used in its operation. As a result, the carrying value of the asset has been written down to its recoverable amount, and $7.2 million is presented as part of write-down of PP&E. Furthermore, the British Columbia business unit recognized a loss of $7.8 million resulting from the replacement of components of mobile equipment and disposal of other mill equipment.
On March 7, 2024, Hudbay and Marubeni Corporation executed an option agreement whereby Marubeni will fund certain minimum annual exploration expenditures for agreed upon properties. During the year ended December 31, 2024, proceeds of $0.4 million were received and recorded as other income.
The Flin Flon concentrator and tailings impoundment is on care and maintenance to provide optionality should another mineral discovery occur in the Flin Flon area. During the year ended December 31, 2024, care & maintenance costs were $14.6 million (year ended December 31, 2023 - $17.1 million).
| HUDBAY MINERALS INC. Notes to Audited Consolidated Financial Statements (in millions of US dollars, except where otherwise noted) Years ended December 31, 2024 and 2023 |
(f) Net finance expense
| Year ended December 31, |
||||||
| 2024 | 2023 | |||||
| Net interest expense on long-term debt | ||||||
| Net interest expense on long-term debt | $ | 69.8 | $ | 76.2 | ||
| Accretion on streaming arrangements (note 22) | ||||||
| Additions | 24.0 | 26.4 | ||||
| Variable consideration adjustments - prior periods | 0.2 | (0.1 | ) | |||
| 24.2 | 26.3 | |||||
| Change in fair value of financial instruments | ||||||
| Gold prepayment liability (note 19) | 10.7 | 11.2 | ||||
| Unrealized loss on non-quotational pricing hedges | 0.2 | - | ||||
| Realized loss on non-quotational pricing hedges | 8.9 | - | ||||
| Investments | (3.2 | ) | 2.8 | |||
| 16.6 | 14.0 | |||||
| Other net finance costs | ||||||
| Net foreign exchange loss | 21.0 | 5.3 | ||||
| Accretion on community agreements measured at amortized cost | 4.7 | 4.2 | ||||
| Accretion on environmental provisions | 10.5 | 9.9 | ||||
| Accretion on Wheaton refund liability | 0.6 | 0.5 | ||||
| Withholding taxes | 2.2 | 6.0 | ||||
| Loss on disposal of investments | 0.1 | 0.7 | ||||
| Interest on equipment financing and leases | 6.7 | 3.4 | ||||
| Interest income | (15.7 | ) | (8.1 | ) | ||
| Other finance expense | 8.0 | 6.9 | ||||
| 38.1 | 28.8 | |||||
| Net finance expense | $ | 148.7 | $ | 145.3 | ||
Other finance expense relates primarily to standby fees on Hudbay's revolving credit facilities.
Commencing in the first quarter of 2024, Hudbay has entered into copper forward sales, copper costless collars and gold costless collars which are non-quotational pricing ("non-QP") contracts (note 31b). Subsequent movements in the fair value of non-QP contracts are recognized in change in fair value of financial instruments in the consolidated statements of income.
| HUDBAY MINERALS INC. Notes to Audited Consolidated Financial Statements (in millions of US dollars, except where otherwise noted) Years ended December 31, 2024 and 2023 |
8. Cash and cash equivalents
Cash and cash equivalents balances represent demand deposits and deposits with an original maturity date of less than 3 months.
9. Short-term investments
Short-term investments include guaranteed investment certificates held with Canadian financial institutions. The Company currently holds two $20.0 million guaranteed investment certificates that mature in March 2025 and June 2025, respectively.
10. Trade and other receivables
| Dec. 31, 2024 | Dec. 31, 2023 | |||||
| Current | ||||||
| Trade receivables | $ | 179.1 | $ | 169.8 | ||
| Statutory receivables | 50.0 | 27.2 | ||||
| Other receivables | 6.4 | 6.4 | ||||
| 235.5 | 203.4 | |||||
| Non-current | ||||||
| Taxes receivable | 12.9 | 12.2 | ||||
| $ | 248.4 | $ | 215.6 |
11. Inventories
| Dec. 31, 2024 | Dec. 31, 2023 | |||||
| Current | ||||||
| Stockpile | $ | 26.9 | $ | 52.4 | ||
| Finished goods | 81.6 | 61.3 | ||||
| Materials and supplies | 88.9 | 93.6 | ||||
| 197.4 | 207.3 | |||||
| Non-current | ||||||
| Stockpile | 2.2 | 9.6 | ||||
| Low grade stockpile1 | 5.5 | 5.8 | ||||
| Materials and supplies | 8.9 | 9.0 | ||||
| 16.6 | 24.4 | |||||
| $ | 214.0 | $ | 231.7 | |||
| 1Primarily all of the low grade stockpile inventory is expected to be processed at the end of the Copper Mountain mine life. | ||||||
The cost of inventories recognized as an expense, including depreciation, and included in cost of sales amounted to $1,288.4 million for the year ended December 31, 2024 (year ended December 31, 2023 - $1,159.9 million).
During the year ended December 31, 2024, Hudbay recognized an expense of $2.9 million in cost of sales primarily related to write-down of the carrying value of certain long term inventory supplies (year ended December 31, 2023 - $2.3 million).
| HUDBAY MINERALS INC. Notes to Audited Consolidated Financial Statements (in millions of US dollars, except where otherwise noted) Years ended December 31, 2024 and 2023 |
12. Other financial assets
| Dec. 31, 2024 | Dec. 31, 2023 | |||||
| Current | ||||||
| Derivative assets | $ | 14.3 | $ | 1.4 | ||
| Collateral deposit (note 21) | 0.6 | 0.7 | ||||
| Restricted cash | 0.4 | 2.0 | ||||
| 15.3 | 4.1 | |||||
| Non-current | ||||||
| Investments at fair value through profit or loss | 12.1 | 6.5 | ||||
| Collateral deposit | - | 0.6 | ||||
| 12.1 | 7.1 | |||||
| $ | 27.4 | $ | 11.2 |
13. Intangibles and other assets
Intangibles and other assets of $44.3 million (December 31, 2023 - $52.5 million) includes $38.8 million of other assets (December 31, 2023 - $48.5 million) and $5.5 million of intangibles (December 31, 2023 - $4.0 million).
Other assets represent the carrying value of certain future community costs that relate to agreements with communities near the Peru operations which allow Hudbay to extract or explore minerals over the useful life of Peru operations. The liability remaining for these costs is recorded in agreements with communities recorded at amortized cost (note 18). Amortization of the carrying amount is recorded in the consolidated statements of income within other expenses (note 7e) or exploration expenses, depending on the nature of the agreement.
Intangibles mainly represent computer software costs. The following table summarizes changes in intangibles:
| Dec. 31, 2024 | Dec. 31, 2023 | |||||
| Cost | ||||||
| Balance, beginning of year | $ | 21.2 | $ | 23.8 | ||
| Additions | 2.5 | 0.5 | ||||
| Disposals | - | (3.4 | ) | |||
| Effects of movement in exchange rates | (1.2 | ) | 0.3 | |||
| Balance, end of year | 22.5 | 21.2 | ||||
| Accumulated amortization | ||||||
| Balance, beginning of year | 17.2 | 19.0 | ||||
| Depreciation for the year | 0.8 | 0.6 | ||||
| Disposals | - | (2.7 | ) | |||
| Effects of movement in exchange rates | (1.0 | ) | 0.3 | |||
| Balance, end of year | 17.0 | 17.2 | ||||
| Intangibles, net book value | $ | 5.5 | $ | 4.0 |
| HUDBAY MINERALS INC. Notes to Audited Consolidated Financial Statements (in millions of US dollars, except where otherwise noted) Years ended December 31, 2024 and 2023 |
14. Goodwill
The following table summarizes changes in goodwill:
| Balance, January 1, 2023 | $ | - | |
| Goodwill recognized on business combination (note 5) | 75.2 | ||
| Effects of changes in foreign exchange | 0.1 | ||
| Balance, January 1, 2024 | $ | 75.3 | |
| Effects of changes in foreign exchange | (6.1 | ) | |
| Balance, December 31, 2024 | $ | 69.2 |
Goodwill resulted from purchase price allocation associated with the Copper Mountain acquisition (note 5).
As of December 31, 2024, all goodwill relates to the British Columbia CGU. Goodwill is tested for impairment annually on December 31 or when circumstances indicate that the carrying value may not be recoverable. Goodwill impairment is determined by assessing the recoverable amount of the CGU.
For the impairment test completed at December 31, 2024, Fair Value Less Cost of Disposal, ("FVLCD") was used to determine the recoverable amount since it is higher than value in use. FVLCD was calculated using discounted after-tax cash flows based on cash flow projections and assumptions in Hudbay's most current LOM. The fair value measurement in its entirety is categorized as Level 3 based on the degree to which fair value inputs are observable and have a significant effect on the recorded fair value. LOM plans are based on optimized mine and processing plans and the assessment of capital expenditure requirements of a mine site.
Management used judgement in determining estimates and assumptions with respect to discount rates, future production levels including amounts of recoverable reserves, resources and exploration potential, operating and capital costs, long-term metal prices, value of mineral resources not included in the LOM plan and future foreign exchange rates. Metal pricing assumptions were based on consensus forecast pricing, and the discount rates were based on a weighted average cost of capital, adjusted for country risk and other risks specific to the CGU. Cash flows were projected through to 2044. Changes in any of the assumptions or estimates used in determining the fair values could impact the impairment analysis.
The discount rate was based on the CGU's weighted average cost of capital, of which the two main components are the cost of equity and the after-tax cost of debt. Cost of equity was calculated based on the capital asset pricing model, incorporating the risk-free rate of return based on the Canadian Government's marketable bond yields as at the valuation date, the Company's beta coefficient adjustment to the market equity risk premium based on the volatility of the Company's return in relation to that of a comparable market portfolio, plus a country risk premium, size premium and company-specific risk factor. Cost of debt was determined by applying an appropriate market indication of the Company's borrowing capabilities and the corporate income tax rate applicable to the segment's jurisdiction. A real discount rate of 7.25% for the British Columbia CGU was used to calculate the estimated after- tax discounted future net cash flows, commensurate with its individual estimated level of risk.
Commodity prices used in the impairment assessment were determined by reference to external market participant sources. The key commodity price for this assessment is the price of copper. The cash flow calculations were based on estimates of future production levels applying forecasts for metal prices, which included forecasts for each year from 2025 to 2029 and long-term forecasts for years beginning in 2030. The cash flow calculations utilized a copper price of $4.10/lb starting in 2025. The cash flow calculations utilized a long-term copper price of $4.15/lb, and capital, operating and reclamation costs based on the most current LOM plans. A value of $276.1 million was utilized to estimate the value of mineral resources not included in the LOM plan.
Expected future cash flows used to determine the FVLCD in the impairment test are inherently uncertain and could materially change over time. The Company has conducted an analysis of the sensitivity of the impairment test to changes in the key assumptions used to determine the recoverable amount for the CGUs to which goodwill is allocated. Management believes that any reasonably possible change in the key assumptions on which the recoverable amount is based would not cause the aggregate carrying amount to exceed the aggregate recoverable amount of the related CGU.
The estimated recoverable amount of the British Columbia CGU including goodwill exceeded its carrying amount as at December 31, 2024, accordingly no impairment was recorded.
| HUDBAY MINERALS INC. Notes to Audited Consolidated Financial Statements (in millions of US dollars, except where otherwise noted) Years ended December 31, 2024 and 2023 |
15. Property, plant and equipment
| Dec. 31, 2024 | Exploration and evaluation assets |
Capital works in progress |
Mining properties |
Plant and equipment |
Plant and equipment - ROU assets1 |
Total | ||||||||||||
| Balance, Jan. 1, 2024 | $ | 96.9 | $ | 803.3 | $ | 2,482.7 | $ | 3,275.5 | $ | 243.5 | $ | 6,901.9 | ||||||
| Additions | 8.6 | 238.6 | 14.5 | 38.5 | 25.5 | 325.7 | ||||||||||||
| Capitalized stripping and development | - | - | 160.5 | - | - | 160.5 | ||||||||||||
| Decommissioning and restoration | - | - | 13.5 | (18.2 | ) | - | (4.7 | ) | ||||||||||
| Capitalized accretion and depreciation | - | 2.4 | - | (0.2 | ) | (1.6 | ) | 0.6 | ||||||||||
| Transfers and other movements | - | (168.4 | ) | (3.7 | ) | 174.6 | (2.5 | ) | - | |||||||||
| Disposals | - | (0.6 | ) | - | (35.0 | ) | (7.4 | ) | (43.0 | ) | ||||||||
| Effects of movements in exchange rates | (2.1 | ) | (2.0 | ) | (89.2 | ) | (99.3 | ) | (3.4 | ) | (196.0 | ) | ||||||
| Balance, Dec. 31, 2024 | 103.4 | 873.3 | 2,578.3 | 3,335.9 | 254.1 | 7,145.0 | ||||||||||||
| Accumulated depreciation | ||||||||||||||||||
| Balance, Jan. 1, 2024 | - | - | 1,093.9 | 1,348.9 | 143.1 | 2,585.9 | ||||||||||||
| Depreciation for the year | - | - | 216.0 | 216.8 | 24.0 | 456.7 | ||||||||||||
| Disposals | - | - | - | (9.4 | ) | (2.0 | ) | (11.5 | ) | |||||||||
| Effects of movement in exchange rates | - | - | (35.5 | ) | (31.7 | ) | (0.3 | ) | (67.5 | ) | ||||||||
| Balance, Dec. 31, 2024 | - | - | 1,274.4 | 1,524.6 | 164.8 | 2,963.6 | ||||||||||||
| Net book value | $ | 103.4 | $ | 873.3 | $ | 1,303.9 | $ | 1,811.3 | $ | 89.3 | $ | 4,181.4 | ||||||
| 1 Includes $3.8 million of capital works in progress - ROU assets (costs) that relate to the Arizona business unit | ||||||||||||||||||
| HUDBAY MINERALS INC. Notes to Audited Consolidated Financial Statements (in millions of US dollars, except where otherwise noted) Years ended December 31, 2024 and 2023 |
| Dec. 31, 2023 | Exploration and evaluation assets |
Capital works in progress |
Mining properties |
Plant and equipment |
Plant and equipment- ROU assets1 |
Total | ||||||||||||
| Balance, Jan. 1, 2023 | $ | 76.0 | $ | 778.9 | $ | 1,952.8 | $ | 2,742.6 | $ | 202.4 | $ | 5,752.7 | ||||||
| Additions | 20.6 | 125.2 | 10.6 | 34.8 | 21.4 | 212.6 | ||||||||||||
| Acquisition of PP&E from Copper Mountain | - | 27.5 | 369.0 | 383.3 | 24.0 | 803.8 | ||||||||||||
| Capitalized stripping and development | - | - | 111.2 | - | - | 111.2 | ||||||||||||
| Decommissioning and restoration | - | - | 19.8 | 0.8 | - | 20.6 | ||||||||||||
| Capitalized accretion and depreciation | - | 2.8 | - | (0.2 | ) | (1.2 | ) | 1.4 | ||||||||||
| Transfers and other movements | - | (131.1 | ) | 4.4 | 126.7 | - | - | |||||||||||
| Disposals | (0.1 | ) | (0.6 | ) | (0.1 | ) | (28.9 | ) | (3.9 | ) | (33.6 | ) | ||||||
| Effects of movements in exchange rates | 0.4 | 0.6 | 15.0 | 16.4 | 0.8 | 33.2 | ||||||||||||
| Balance, Dec. 31, 2023 | 96.9 | 803.3 | 2,482.7 | 3,275.5 | 243.5 | 6,901.9 | ||||||||||||
| Accumulated depreciation | ||||||||||||||||||
| Balance, Jan. 1, 2023 | - | - | 891.8 | 1,181.2 | 127.3 | 2,200.3 | ||||||||||||
| Depreciation for the year | - | - | 193.2 | 181.1 | 18.6 | 392.9 | ||||||||||||
| Disposals | - | - | - | (21.6 | ) | (3.0 | ) | (24.6 | ) | |||||||||
| Effects of movement in exchange rates | - | - | 8.9 | 8.2 | 0.2 | 17.3 | ||||||||||||
| Balance, Dec. 31, 2023 | - | - | 1,093.9 | 1,348.9 | 143.1 | 2,585.9 | ||||||||||||
| Net book value | $ | 96.9 | $ | 803.3 | $ | 1,388.8 | $ | 1,926.6 | $ | 100.4 | $ | 4,316.0 |
1 Includes $4.5 million of capital works in progress - ROU assets (costs) that relate to the Arizona business unit.
During the first quarter of 2024, Hudbay received a grant of $3.1 million from the Environment and Climate Change Canada related to the purchase of an electric mining shovel in the third quarter of 2023. The carrying amount of the shovel has been deducted by the amount of the grant received. The grant will be recognized in profit or loss over the life of the shovel as a reduced depreciation expense. There were no significant unfulfilled conditions attached to the grant.
During the first quarter of 2023, an indicator of impairment was identified as a result of an updated life of mine ("LOM") plan for Peru which included updated costs reflecting recently experienced inflationary pressures. As a result of the higher operating costs experienced at the Peru mine site, a full impairment test was completed. The recoverable amount was determined using FVLCD since it is higher than value in use. The fair value measurement in its entirety is categorized as Level 3 based on the degree to which fair value inputs are observable and have a significant effect on the recorded fair value. Management determined that the fair value less cost to dispose exceeded the carrying value of the Peru CGU, and accordingly no impairment was recorded.
| HUDBAY MINERALS INC. Notes to Audited Consolidated Financial Statements (in millions of US dollars, except where otherwise noted) Years ended December 31, 2024 and 2023 |
16. Trade and other payables
| Dec. 31, 2024 | Dec. 31, 2023 | |||||
| Trade payables | $ | 66.7 | $ | 69.3 | ||
| Accruals and payables | 173.4 | 133.2 | ||||
| Accrued interest | 15.1 | 16.9 | ||||
| Statutory payables | 15.0 | 19.9 | ||||
| $ | 270.2 | $ | 239.3 |
Accruals and payables include operational and capital costs and employee benefit amounts owing.
17. Other liabilities
| Dec. 31, 2024 | Dec. 31, 2023 | |||||
| Unearned revenue | $ | - | $ | 0.6 | ||
| Environmental and other provisions (note 23) | 29.9 | 22.3 | ||||
| Pension obligations (note 24) | 1.0 | 3.3 | ||||
| Other employee benefits (note 25) | 3.5 | 3.8 | ||||
| $ | 34.4 | $ | 30.0 |
| HUDBAY MINERALS INC. Notes to Audited Consolidated Financial Statements (in millions of US dollars, except where otherwise noted) Years ended December 31, 2024 and 2023 |
18. financial liabilities
| Dec. 31, 2024 | Dec. 31, 2023 | |||||
| Current | ||||||
| Derivative liabilities | $ | 0.3 | $ | 11.8 | ||
| Equipment financing | 16.3 | 3.3 | ||||
| Agreements with communities recorded at amortized cost | 21.7 | 17.4 | ||||
| Deferred Rosemont acquisition consideration | - | 9.7 | ||||
| 38.3 | 42.2 | |||||
| Non-current | ||||||
| Equipment financing | 60.4 | 7.5 | ||||
| Agreements with communities recorded at amortized cost | 46.7 | 37.5 | ||||
| Wheaton refund liability | 7.3 | 6.7 | ||||
| 114.4 | 51.7 | |||||
| $ | 152.7 | $ | 93.9 |
Agreements with communities recorded at amortized cost relate to agreements with communities near the Constancia operation which allow Hudbay to extract minerals over the useful life of the Constancia operation, carry out exploration and evaluation activities in the area and provide Hudbay with community support to operate in the region.
The movement in the deferred Rosemont acquisition consideration was driven by the repayment of the full outstanding consideration amount.
Equipment financing represents agreements that Hudbay has entered into to purchase mining equipment. Hudbay owns the assets and finances the payment of these assets over the specified term. These agreements expire between 2025 and 2032 with interest rates between 2.25% and 7.55% per annum. During the year ended December 31, 2024, $71.0 million (December 31, 2023 - nil) of capital additions related to the recognition of property, plant and equipment that has been financed (note 34).
As part of the streaming agreement for the 777 mine, Hudbay must repay, with precious metals credits, the stream deposit by August 1, 2052, the expiry date of the agreement. If the stream deposit is not fully repaid with precious metals credits from 777 production by the expiry date, a payment for the remaining amount will be due at the expiry date of the agreement. As the 777 mine has concluded all mining activities following the depletion of reserves and finalized the sales of produced concentrate, Hudbay concluded that the remaining stream deposit will not be repaid by means of precious metals credits from 777 production. The repayment amount is recorded as a Wheaton refund liability, which is and will be discounted at the 9.0% rate inherent in the original 777 stream agreement and accreted over the remaining term of the agreement. The following table summarizes changes in agreements with communities recorded at amortized cost Gold prepayment liabilities are reflected in the consolidated balance sheets as follows:
| HUDBAY MINERALS INC. Notes to Audited Consolidated Financial Statements (in millions of US dollars, except where otherwise noted) Years ended December 31, 2024 and 2023 |
| Balance, January 1, 2023 | $ | 42.5 | |
| Net additions | 17.3 | ||
| Disbursements | (10.7 | ) | |
| Accretion (note 7f) | 4.2 | ||
| Effects of changes in foreign exchange | 1.6 | ||
| Balance, December 31, 2023 | $ | 54.9 | |
| Net additions | 18.6 | ||
| Disbursements | (9.1 | ) | |
| Accretion (note 7f) | 4.7 | ||
| Effects of changes in foreign exchange | (0.7 | ) | |
| Balance, December 31, 2024 | $ | 68.4 |
19. Gold prepayment liability
| Dec. 31, 2024 | Dec. 31, 2023 | |||||
| Current | $ | - | $ | 55.9 |
The following table summarizes changes in the gold prepayment liability:
| Beginning balance, January 1 | $ | 55.9 | $ | 71.2 | ||
| Change in fair value recorded in statement of income (note 7f) | 10.7 | 11.2 | ||||
| Change in fair value recorded in other comprehensive income | (4.3 | ) | 0.2 | |||
| Repayments | (62.3 | ) | (26.7 | ) | ||
| Ending balance, December 31 | $ | - | $ | 55.9 |
During the third quarter of 2024, the Company completed the final delivery and the obligation for the gold prepayment liability.
20. Lease liabilities
| Balance, January 1, 2023 | $ | 61.0 | |
| Acquired through the acquisition of Copper Mountain | 34.6 | ||
| Additional capitalized leases | 21.4 | ||
| Lease payments | (25.2 | ) | |
| Derecognized leases | (0.7 | ) | |
| Accretion and other movements | (0.8 | ) | |
| Balance, December 31, 2023 | $ | 90.3 | |
| Additional capitalized leases | 25.5 | ||
| Lease payments | (31.4 | ) | |
| Derecognized leases | (11.5 | ) | |
| Accretion and other movements | 1.9 | ||
| Balance, December 31, 2024 | $ | 74.8 |
Lease liabilities are reflected in the consolidated balance sheets as follows:
| HUDBAY MINERALS INC. Notes to Audited Consolidated Financial Statements (in millions of US dollars, except where otherwise noted) Years ended December 31, 2024 and 2023 |
| Dec. 31, 2024 | Dec. 31, 2023 | |||||
| Current | $ | 30.5 | $ | 28.9 | ||
| Non-current | 44.3 | 61.4 | ||||
| $ | 74.8 | $ | 90.3 |
Hudbay has entered into leases which expire between 2025 and 2037. The interest rates on leases which were capitalized have interest rates between 2.50% and 8.49%, per annum. The range of interest rates utilized for discounting the lease depends mostly on Hudbay acting as a lessee and duration of the lease. For certain leases, Hudbay has the option to purchase the equipment and vehicles leased at the end of the terms of the leases. Hudbay's obligations under these leases are secured by the lessor's title to the leased assets. The present value of applicable lease payments has been recognized as an ROU asset, which was included as a non-cash addition to property, plant and equipment, and a corresponding amount as a lease liability.
There are no restrictions placed on Hudbay by entering into these leases.
The following outlines expenses recognized within the Company's consolidated statements of income, relating to leases for which a recognition exemption was applied.
| Year ended December 31, | ||||||
| 2024 | 2023 | |||||
| Short-term leases | $ | 9.7 | $ | 9.2 | ||
| Low value leases | 0.4 | 0.6 | ||||
| Variable leases | 23.0 | 27.5 | ||||
| Total | $ | 33.1 | $ | 37.3 | ||
Payments made for short-term, low value and variable leases would mostly be captured as expenses in the consolidated statements of income, however, certain amounts may be capitalized to PP&E for the Arizona segment during its development phase and certain amounts may be reported in inventories given the timing of sales. Variable payment leases include equipment used for heavy civil works at Constancia.
| HUDBAY MINERALS INC. Notes to Audited Consolidated Financial Statements (in millions of US dollars, except where otherwise noted) Years ended December 31, 2024 and 2023 |
21. Long-term debt
Long-term debt is comprised of the following:
| Dec. 31, 2024 | Dec. 31, 2023 | |||||
| Senior unsecured notes (a) | $ | 1,111.1 | $ | 1,190.6 | ||
| Senior secured revolving credit facilities (b) | (3.6 | ) | 96.9 | |||
| $ | 1,107.5 | $ | 1,287.5 |
(a) Senior unsecured notes
| Balance, January 1, 2023 | $ | 1,188.1 | |
| Accretion of transaction costs and premiums | 2.5 | ||
| Balance, December 31, 2023 | $ | 1,190.6 | |
| Repurchases | (82.6 | ) | |
| Write-down of unamortized transaction costs | 0.6 | ||
| Accretion of transaction costs and premiums | 2.5 | ||
| Balance, December 31, 2024 | $ | 1,111.1 |
As at December 31, 2024, $1,117.4 million aggregate principal amount of senior notes were outstanding in two series: (i) a series of 4.50% senior notes due 2026 ("2026 Notes") in an aggregate principal amount of $575.0 million and (ii) a series of 6.125% senior notes due 2029 ("2029 Notes") in an aggregate principal amount of $542.4 million. During the year ended December 31, 2024, the Company repurchased and retired $25.0 million of the 2026 Notes and $57.6 million of the 2029 Notes at a discount. For the year ended December 31, 2024, the discount of $0.7 million was recorded as Other expenses in the consolidated statements of income.
Upon the repurchase and retirement of $82.6 million of senior unsecured notes during the year, the unamortized transaction costs related to this principal amount were recorded as a finance expense in the consolidated statements of income.
The senior notes are guaranteed on a senior unsecured basis by substantially all of the Company's subsidiaries, other than HudBay (BVI) Inc. and certain excluded or unrestricted subsidiaries, which includes CMBC (the Company's 75% owned subsidiary that owns the Copper Mountain mine), and subsidiaries that hold the Copper World and Mason projects as well as any newly formed or acquired subsidiaries that primarily hold or may develop non-producing mineral assets that are in the pre-construction phase of development.
| HUDBAY MINERALS INC. Notes to Audited Consolidated Financial Statements (in millions of US dollars, except where otherwise noted) Years ended December 31, 2024 and 2023 |
(b) Senior secured revolving credit facilities
| Balance, January 1, 20231 | $ | (4.0 | ) |
| Proceeds from drawdown, net of repayments | 100.0 | ||
| Accretion of transaction costs | 1.6 | ||
| Transaction costs | (0.7 | ) | |
| Balance, December 31, 2023 | $ | 96.9 | |
| Repayments | (100.0 | ) | |
| Accretion of transaction costs | 2.0 | ||
| Transaction costs | (2.5 | ) | |
| Balance, December 31, 20241 | $ | (3.6 | ) |
| 1 Balance, representing deferred transaction costs, is in an asset position. |
Hudbay has two senior secured revolving credit facilities with total commitments of $450.0 million and substantially similar terms and conditions for its Canadian and Peruvian businesses. Hudbay's revolving credit facilities are secured against substantially all of the Company's assets, other than those associated with the Copper Mountain mine and the Copper World and Mason projects. During the year ended December 31, 2024, Hudbay repaid $10.0 million under its Canadian revolving credit facility and $90.0 million under the Peruvian revolving credit facility. During the fourth quarter of 2024, the two senior secured revolving credit facilities were extended by three years from October 2025 to November 2028. The newly extended $450.0 million revolving credit facility includes an accordion feature to increase the facility by an additional $150 million at Hudbay's discretion during the four-year tenor. Hudbay incurred $2.4 million of transactions costs associated with the extension which were deferred and amortized over the new term of the credit facilities.
As at December 31, 2024, there were nil draws under the Canadian and Peruvian revolving credit facilities, other than letters of credit to support reclamation and pension obligations as described below.
As at December 31, 2024, the Peru segment had nil in letters of credit issued under the Peru revolving credit facility to support its reclamation obligations and the Manitoba segment had $24.0 million in letters of credit issued under the Canadian revolving credit facility to support its reclamation and pension obligations. As at December 31, 2024, we were in compliance with our covenants under the revolving credit facilities.
Surety bonds
The Arizona segment had $18.4 million in surety bonds issued to support future reclamation and closure obligations. No cash collateral is required to be posted under these surety bonds.
The British Columbia segment had $45.6 million in surety bonds issued to support future reclamation and closure obligations and $1.0 million in surety bonds with BC Hydro in relation to the BC Hydro transmission system at the Copper Mountain Mine. No cash collateral is required to be posted under these surety bonds.
The Peru segment had $37.0 million in surety bonds issued to support future reclamation and closure obligations. No cash collateral is required to be posted under these surety bonds.
| HUDBAY MINERALS INC. Notes to Audited Consolidated Financial Statements (in millions of US dollars, except where otherwise noted) Years ended December 31, 2024 and 2023 |
Other letters of credit
The Peru segment had $89.1 million in letters of credit issued with various Peruvian financial institutions to support future reclamation and other operating matters. No cash collateral is required to be posted under these letters of credit.
The British Columbia segment had $0.6 million in letters of credit issued with various Canadian financial institutions related to other operating matters. Cash collateral deposit has been posted under these letters of credit (note 12).
Hudbay has a C$130.0 million bilateral letter of credit facility ("LC Facility") with a major Canadian financial institution. As at December 31, 2024, the Manitoba segment had $52.7 million in letters of credit issued under the LC Facility to support its reclamation and pension obligations.
(c) Copper Mountain Bonds
On April 9, 2021, Copper Mountain completed an offering of $250.0 million of secured bonds ("the Bonds"). The Bonds provided the bondholders with the right to put all or part of the principal amount of the outstanding Bonds to Copper Mountain at a price of 101%, plus accrued interest, following a change of control events. With the acquisition of Copper Mountain on June 20, 2023, the change of control event was triggered and all outstanding Bonds were available to be put to Copper Mountain within a predefined period of time immediately following the acquisition date.
The change in control put option expired on July 17, 2023, at which time, $83.3 million of the Bonds were put to Copper Mountain. The principal and premium amounted to $84.1 million, which was repaid on July 24, 2023.
During the fourth quarter of 2023, Hudbay made a scheduled principal repayment of $5.0 million and exercised the early redemption option and redeemed the remaining $54.7 million principal amount outstanding of Copper Mountain bonds on November 30, 2023 at a call price of 104%, plus accrued and unpaid interest to the date of redemption.
22. Deferred revenue
Peru Stream Agreement
For the year ended December 31, 2024, the drawdown rates for the Peru stream agreement for gold and silver were $817 and $14.56 per ounce, respectively (year ended December 31, 2023 - $820 and $15.26 per ounce, respectively).
The following table summarizes changes in deferred revenue:
| Balance, January 1, 2023 | $ | 469.5 | |
| Amortization of deferred revenue | |||
| Liability drawdown | (72.4 | ) | |
| Variable consideration adjustments - prior periods | (4.9 | ) | |
| Accretion on streaming arrangements | |||
| Current year additions | 26.4 | ||
| Variable consideration adjustments - prior periods | (0.1 | ) | |
| Balance, December 31, 2023 | $ | 418.5 | |
| Amortization of deferred revenue (note 7a) | |||
| Liability drawdown | (74.3 | ) | |
| Variable consideration adjustments - prior periods | 3.8 | ||
| Accretion on streaming arrangements (note 7f) | |||
| Current year-to-date additions | 24.0 | ||
| Variable consideration adjustments - prior periods | 0.2 | ||
| Balance, December 31, 2024 | $ | 372.2 |
| HUDBAY MINERALS INC. Notes to Audited Consolidated Financial Statements (in millions of US dollars, except where otherwise noted) Years ended December 31, 2024 and 2023 |
Consideration from the Company's stream agreement is considered variable. Gold and silver stream revenue can be subject to cumulative adjustments when the number of ounces to be delivered under the contract changes. As a result of changes in the Company's mineral reserve and resource estimate in the first quarter of 2024, the amortization rate by which deferred revenue is drawn down into income was adjusted and, as required, a current period variable adjustment was made for all prior period stream revenues since the stream agreement inception date. This variable consideration adjustment resulted in a decrease in revenue of $3.8 million and an increase of finance expense of $0.2 million for the year ended December 31, 2024 (year ended December 31, 2023 - increase in revenue of $4.9 million and a decrease of finance expense of $0.1 million).
Deferred revenue is reflected in the consolidated balance sheets as follows:
| Dec. 31, 2024 | Dec. 31, 2023 | |||||
| Current | $ | 63.1 | $ | 87.7 | ||
| Non-current | 309.1 | 330.8 | ||||
| $ | 372.2 | $ | 418.5 |
| HUDBAY MINERALS INC. Notes to Audited Consolidated Financial Statements (in millions of US dollars, except where otherwise noted) Years ended December 31, 2024 and 2023 |
23. Environmental and other provisions
| Decommis- sioning, restoration and similar liabilities |
Deferred share units3 |
Restricted share units1, 3 |
Performance share units3 |
Other2 | Total | |||||||||||||
| Balance, January 1, 2024 | $ | 315.4 | $ | 8.7 | $ | 5.0 | $ | 2.6 | $ | 12.5 | $ | 344.2 | ||||||
| Net change in provision | 14.5 | 1.1 | 5.6 | 3.1 | 0.8 | 25.1 | ||||||||||||
| Disbursements | (2.1 | ) | (1.6 | ) | (2.2 | ) | (0.9 | ) | (4.8 | ) | (11.6 | ) | ||||||
| Reduction of obligation to renounce flow-through share expenditures, net of provisions | - | - | - | - | (2.0 | ) | (2.0 | ) | ||||||||||
| Unwinding of discount (note 7f) | 10.5 | - | - | - | - | 10.5 | ||||||||||||
| Effect of change in discount rate | (22.7 | ) | - | - | - | - | (22.7 | ) | ||||||||||
| Effect of foreign exchange | (18.7 | ) | (1.1 | ) | (0.5 | ) | (0.4 | ) | (0.1 | ) | (20.8 | ) | ||||||
| Effect of change in share price | - | 5.2 | 1.7 | 1.1 | - | 8.0 | ||||||||||||
| Balance, December 31, 2024 | $ | 296.9 | $ | 12.3 | $ | 9.6 | $ | 5.5 | $ | 6.4 | $ | 330.7 |
1 Certain amounts relating to the Arizona segment are capitalized.
2 Relates primarily to flow-through share premiums, restructuring costs and other non-capital provisions.
3 Please refer to note 28a for further information.
Provisions are reflected in the consolidated balance sheets as follows:
| December 31, 2024 | Decommis- sioning, restoration and similar liabilities |
Deferred share units |
Restricted share units |
Performance share units |
Other | Total | ||||||||||||
| Current (note 17) | $ | 4.0 | $ | 12.3 | $ | 6.4 | $ | 1.9 | $ | 5.3 | $ | 29.9 | ||||||
| Non-current | 292.9 | - | 3.2 | 3.6 | 1.1 | 300.8 | ||||||||||||
| $ | 296.9 | $ | 12.3 | $ | 9.6 | $ | 5.5 | $ | 6.4 | $ | 330.7 |
| Decommis- sioning, restoration and similar liabilities |
Deferred share units3 |
Restricted share units1,3 |
Performance share units3 |
Other2 | Total | |||||||||||||
| Balance, January 1, 2023 | $ | 276.4 | $ | 6.9 | $ | 6.8 | $ | 3.0 | $ | 10.2 | $ | 303.3 | ||||||
| Net additional provisions made | (4.0 | ) | 1.1 | 3.0 | 0.4 | 4.6 | 5.1 | |||||||||||
| Copper Mountain, acquired provision | 12.7 | - | - | - | - | 12.7 | ||||||||||||
| Disbursements | (2.0 | ) | - | (5.2 | ) | (1.1 | ) | (2.4 | ) | (10.7 | ) | |||||||
| Unwinding of discount (note 7f) | 9.9 | - | - | - | - | 9.9 | ||||||||||||
| Effect of change in discount rate | 18.5 | - | - | - | - | 18.5 | ||||||||||||
| Effect of foreign exchange | 3.9 | 0.1 | - | 0.1 | 0.1 | 4.2 | ||||||||||||
| Effect of change in share price | - | 0.6 | 0.4 | 0.2 | - | 1.2 | ||||||||||||
| Balance, December 31, 2023 | $ | 315.4 | $ | 8.7 | $ | 5.0 | $ | 2.6 | $ | 12.5 | $ | 344.2 |
1 Certain amounts relating to the Arizona segment are capitalized.
2 Relates primarily to restructuring costs and other non-capital provisions.
3 Please refer to note 28a for further information.
| HUDBAY MINERALS INC. Notes to Audited Consolidated Financial Statements (in millions of US dollars, except where otherwise noted) Years ended December 31, 2024 and 2023 |
| December 31, 2023 | Decommis- sioning, restoration and similar liabilities |
Deferred share units |
Restricted share units |
Performance share units |
Other | Total | ||||||||||||
| Current (note 17) | $ | 1.4 | $ | 8.7 | $ | 2.1 | $ | 0.7 | $ | 9.4 | $ | 22.3 | ||||||
| Non-current | 314.0 | - | 2.9 | 1.9 | 3.1 | 321.9 | ||||||||||||
| $ | 315.4 | $ | 8.7 | $ | 5.0 | $ | 2.6 | $ | 12.5 | $ | 344.2 |
Decommissioning, restoration and similar liabilities are remeasured at each reporting date to reflect changes in discount rates, which can significantly affect the liabilities.
Decommissioning, restoration and similar liabilities ("DRO")
Hudbay's decommissioning, restoration and similar liabilities relate to the rehabilitation and closure of currently operating mines and metallurgical plants, development-phase properties and closed properties. The amount of the provision has been recorded based on estimates and assumptions that management believes are reasonable; however, actual decommissioning and restoration costs may differ from expectations.
DRO are remeasured at each reporting date to reflect changes in discount rates, inflation, exchange rates, and timing and extent of cash outflows which can significantly affect the liabilities. The amount of this provision has been recorded based on estimates and assumptions that management believes are reasonable; however, actual decommissioning and restoration costs may differ from expectations.
During the year ended December 31, 2024, the Company recorded a non-cash gain of $3.5 million in the consolidated statements of income mainly related to a revaluation adjustment of Flin Flon's environmental reclamation provision (December 31, 2023 - $11.4 million). This was primarily caused by a general increase in long term, risk-free discount rates during 2024 based on movements in Canadian bond yields, as well as the impact of lower inflation rates on future cash outflows. Typically, an operating site will reflect any revaluation adjustments of its environmental reclamation provision against its reclamation assets. However, since the Flin Flon operations closed in June 2022, the corresponding Flin Flon assets have been fully depreciated and cannot be reduced below their residual value, resulting in the remaining impact being recorded as a non-cash gain in re-evaluation adjustment - environmental provision in the consolidated statements of income.
Hudbay's decommissioning and restoration liabilities relate mainly to its Manitoba, Peru and British Columbia operations. Management has placed the remaining Flin Flon assets on care and maintenance. The majority of closure activities will occur once all mining activities in Manitoba are completed. These provisions also reflect estimated post-closure cash flows that extend to the year 2123 for ongoing monitoring and water treatment requirements. Management anticipates most decommissioning and restoration activities for the Peru operation will occur from 2039 to 2103, which include ongoing monitoring and water treatment requirements. Management anticipates most decommissioning and restoration activities for the British Columbia operation will occur from 2041 to 2142, which include ongoing monitoring and water treatment requirements.
As at December 31, 2024, decommissioning, restoration and similar liabilities have been discounted to their present value at rates ranging from 2.87% to 4.88% per annum (December 31, 2023 - 3.01% to 4.86%), using pre-tax, risk-free interest rates that reflect the estimated maturity of each specific liability.
| HUDBAY MINERALS INC. Notes to Audited Consolidated Financial Statements (in millions of US dollars, except where otherwise noted) Years ended December 31, 2024 and 2023 |
24. Pension obligations
Hudbay maintains non-contributory and contributory defined benefit pension plans for certain of its employees.
The Company uses a December 31 measurement date for all of its plans. For Hudbay's significant plans, the most recent actuarial valuations filed for funding purposes were performed during 2024 using the latest data available as at December 31, 2023. For these plans, the next actuarial valuation required for funding purposes will be performed during 2025 using the data as of December 31, 2024.
During 2023, an annuity purchase transaction was entered into in which the defined benefit obligations associated with certain defined benefit plan members were assumed by a third-party insurer in exchange for a lump sum payment of $34.9 million from plan assets.
Movements in the present value of the defined benefit obligation in the current and previous years were as follows:
| Year ended | ||||||
| Dec. 31, 2024 | Dec. 31, 2023 | |||||
| Opening defined benefit obligation: | $ | 115.3 | $ | 145.1 | ||
| Current service costs | 4.7 | 5.2 | ||||
| Past service cost (note 7d) | 2.7 | 0.1 | ||||
| Loss on settlements | - | 0.2 | ||||
| Interest cost | 4.8 | 6.3 | ||||
| Benefits paid from plan | (10.1 | ) | (13.7 | ) | ||
| Benefits paid from employer | (1.3 | ) | (1.1 | ) | ||
| Settlement payments from plan assets | - | (34.9 | ) | |||
| Remeasurement actuarial losses/(gains): | ||||||
| Arising from changes in demographic assumptions | (6.2 | ) | - | |||
| Arising from changes in financial assumptions | 1.3 | 7.0 | ||||
| Arising from experience adjustments | (0.5 | ) | (1.9 | ) | ||
| Effects of movements in exchange rates | (9.3 | ) | 3.0 | |||
| Closing defined benefit obligation | $ | 101.4 | $ | 115.3 | ||
The defined benefit obligation closing balance, by member group, is as follows:
| Dec. 31, 2024 | Dec. 31, 2023 | |||||
| Active members | $ | 88.4 | $ | 103.5 | ||
| Deferred members | 2.8 | 2.3 | ||||
| Retired members | 10.2 | 9.5 | ||||
| Closing defined benefit obligation | $ | 101.4 | $ | 115.3 |
| HUDBAY MINERALS INC. Notes to Audited Consolidated Financial Statements (in millions of US dollars, except where otherwise noted) Years ended December 31, 2024 and 2023 |
Movements in the fair value of the pension plan assets in the current and previous years were as follows:
| Year ended | ||||||
| Dec. 31, 2024 | Dec. 31, 2023 | |||||
| Opening fair value of plan assets: | $ | 106.0 | $ | 137.7 | ||
| Interest income | 4.6 | 6.0 | ||||
| Contributions from the employer | 1.1 | 2.3 | ||||
| Employer direct benefit payments | 1.3 | 1.1 | ||||
| Contributions from plan participants | 0.1 | - | ||||
| Benefit payment from employer | (1.3 | ) | (1.1 | ) | ||
| Administrative expenses paid from plan assets | (0.1 | ) | (0.1 | ) | ||
| Benefits paid | (10.1 | ) | (13.7 | ) | ||
| Settlement payments from plan assets | - | (34.9 | ) | |||
| Remeasurement adjustment: | ||||||
| Return on plan assets (excluding amounts included in net interest expense) | 1.0 | 6.2 | ||||
| Effects of changes in foreign exchange rates | (8.4 | ) | 2.5 | |||
| Closing fair value of plan assets | $ | 94.2 | $ | 106.0 | ||
The amount included in the consolidated balance sheets arising from the entity's obligation in respect of its defined benefit plans is as follows:
| Dec. 31, 2024 | Dec. 31, 2023 | |||||
| Present value of funded defined benefit obligation | $ | 87.1 | $ | 100.0 | ||
| Fair value of plan assets | (94.2 | ) | (106.0 | ) | ||
| Present value of unfunded defined benefit obligation | 14.3 | 15.3 | ||||
| Net liability arising from defined benefit obligation | $ | 7.2 | $ | 9.3 |
Reflected in the consolidated balance sheets as follows:
| Dec. 31, 2024 | Dec. 31, 2023 | |||||
| Pension obligation - current (note 17) | $ | 1.0 | $ | 3.3 | ||
| Pension obligation - non-current | 6.2 | 6.0 | ||||
| Total pension obligations | $ | 7.2 | $ | 9.3 |
| HUDBAY MINERALS INC. Notes to Audited Consolidated Financial Statements (in millions of US dollars, except where otherwise noted) Years ended December 31, 2024 and 2023 |
Pension expense is as follows:
| Dec. 31, 2024 | Dec. 31, 2023 | |||||
| Service costs: | ||||||
| Current service cost | $ | 4.7 | $ | 5.2 | ||
| Past service cost | 2.8 | - | ||||
| Curtailment | - | - | ||||
| Loss on settlement | - | 0.2 | ||||
| Total service cost | 7.5 | 5.4 | ||||
| Net interest expense | 0.2 | 0.3 | ||||
| Administration cost | 0.1 | 0.1 | ||||
| Defined benefit pension expense | $ | 7.8 | $ | 5.8 | ||
| Defined contribution pension expense (note 7d) | $ | 2.1 | $ | 0.7 |
Remeasurement on the net defined benefit liability:
| Dec. 31, 2024 | Dec. 31, 2023 | |||||
| Return on plan assets (excluding amounts included in net interest expense) | $ | (1.0 | ) | $ | (6.2 | ) |
| Actuarial gain arising from changes in demographic assumptions | (6.2 | ) | - | |||
| Actuarial loss arising from changes in financial assumptions | 1.3 | 7.0 | ||||
| Actuarial gain arising from experience adjustments | (0.5 | ) | (1.9 | ) | ||
| Defined benefit gain related to remeasurement | $ | (6.4 | ) | $ | (1.1 | ) |
| Total pension cost | $ | 3.5 | $ | 5.4 |
Pension amounts recognized include those directly related to production of inventory; such amounts are recognized initially as costs of inventory and are expensed in the consolidated statements of income within cost of sales upon sale of the inventory.
The current service cost, the interest cost and administration cost for the year are included in the employee benefits expense. The remeasurement of the net defined benefit liability is included in OCI.
| HUDBAY MINERALS INC. Notes to Audited Consolidated Financial Statements (in millions of US dollars, except where otherwise noted) Years ended December 31, 2024 and 2023 |
The defined benefit pension plans typically expose Hudbay to actuarial risks such as: investment risk, interest rate risk, longevity risk and salary risk.
|
Investment risk |
The present value of the liabilities for the defined benefit plans is calculated using a discount rate determined by reference to high quality corporate bond yields; if the return on plan assets is below this rate, it will create a plan deficit. Hudbay's primary quantitative investment objectives are maximization of the long term real rate of return, subject to an acceptable degree of investment risk and preservation of principal. Risk tolerance is established through consideration of several factors including past performance, current market condition and the funded status of the plan. |
|
Interest risk |
A decrease in the bond interest rate will increase the pension plan liabilities; however, this will be partially offset by an increase in the return on the plan's debt investments. |
|
Longevity risk |
The present value of the defined benefit plans liabilities is calculated by reference to the best estimate of the mortality of plan participants both during and after their employment. An increase in the life expectancy of the plan participants will increase the pension plans liabilities. |
|
Salary risk |
The present value of the defined benefit plans liabilities for some of the pension plans is calculated by reference to the future salaries of plan participants. As such, an increase in the salary of the plan participants will increase the plans' liabilities. |
The principal assumptions used for the purposes of the actuarial valuations were as follows:
|
|
2024 |
2023 |
|
Defined benefit cost: |
|
|
|
Discount rate - benefit obligations |
4.64% |
5.22% |
|
Discount rate - service cost |
4.64% |
5.27% |
|
Expected rate of salary increase1,3 |
2.75% |
3.50% |
|
Average longevity at retirement age for current pensioners (years)2 : |
|
|
|
Males |
20.5 |
20.4 |
|
Females |
23.9 |
23.8 |
|
Defined benefit obligation: |
|
|
|
Discount rate |
4.66% |
4.64% |
|
Expected rate of salary increase1,3 |
2.75% |
3.00% |
|
Average longevity at retirement age for current pensioners (years)2 : |
|
|
|
Males |
20.6 |
20.5 |
|
Females |
24.0 |
23.9 |
|
Average longevity at retirement age for current employees (future pensioners) (years)2 : |
|
|
|
Males |
22.5 |
22.4 |
|
Females |
25.6 |
25.6 |
|
1 Plus merit and promotional scale based on member's age |
||
|
2 Revised retirement pension plan only - CPM2014 Priv with MI-2017 projection scale with loading of 1.25 and 1.15 for males and females |
||
|
3The defined benefit obligation rate of salary increase is 3.0% for 2024 and 2.75% thereafter. The defined benefit cost rate of salary increase is 3.5% for 2024 and 2.75% thereafter. |
||
| HUDBAY MINERALS INC. Notes to Audited Consolidated Financial Statements (in millions of US dollars, except where otherwise noted) Years ended December 31, 2024 and 2023 |
Hudbay reviews the assumptions used to measure pension costs (including the discount rate) on an annual basis. Economic and market conditions at the measurement date affect these assumptions from year to year. In determining the discount rate, Hudbay uses the cash flow approach.
Significant actuarial assumptions for the determination of the defined benefit obligation are discount rate, expected salary increase and mortality. The sensitivity analysis below has been determined based on reasonably possible changes of the respective assumptions occurring at the end of the reporting periods, while holding other assumptions constant:
- If the discount rate is 50 basis points higher (lower), the defined benefit obligation would decrease by $8.6 million (increase by $9.8 million).
- If the expected salary growth increases (decreases) by 1%, the defined benefit obligation would increase by $1.3 million (decrease $1.1 million).
- If the life expectancy increases (decreases) by one year for both men and women, the defined benefit obligation would increase by $0.9 million (decrease by $0.9 million).
The sensitivity analysis presented above may not be representative of the actual change in the defined benefit obligation as it is unlikely that the change in assumptions would occur in isolation of one another as some of the assumptions may be correlated.
Furthermore, in presenting the above sensitivity analysis, the present value of the defined benefit obligation has been calculated using the projected unit credit method at the end of the reporting period, which is the same as that applied in calculating the defined benefit obligation liability recognized in the consolidated balance sheets.
The Company's main pension plans are registered federally with the Office of the Superintendent of Financial Institution and with the Canada Revenue Agency. The registered pension plans are governed in accordance with the Pension Benefits Standards Act and the Income Tax Act. The sponsor contributes the amount needed to maintain adequate funding as dictated by the prevailing regulations.
Expected employer contribution to the pension plans for the fiscal year ending December 31, 2024 is $2.4 million.
The average duration of the pension obligation at December 31, 2024 is 18.7 years (2023 - 18.0 years). This number can be broken down as follows:
- Active members: 19.8 years (2023: 18.8 years)
- Deferred members: 17.8 years (2023: 19.2 years)
- Retired members: 9.4 years (2023: 9.0 years)
Asset-Liability-Matching studies are performed periodically to analyze the investment policies in terms of risk and-return profiles.
The pension plans do not invest directly in either securities or property/real estate of the Company.
With the exception of fixed income investments and certain equity instruments, the plan assets are actively managed by investment managers, with the goal of attaining returns that potentially outperform passively managed investments. Within appropriate limits, the actual composition of the invested funds may vary from the prescribed investment mix.
| HUDBAY MINERALS INC. Notes to Audited Consolidated Financial Statements (in millions of US dollars, except where otherwise noted) Years ended December 31, 2024 and 2023 |
The following is a summary of the fair value classification levels for investment:
| December 31, 2024 | Level 1 | Level 2 | Level 3 | Total | ||||||||
| Investments: | ||||||||||||
| Money market instruments | $ | 1.1 | $ | - | $ | - | $ | 1.1 | ||||
| Pooled equity funds | 33.0 | - | - | 33.0 | ||||||||
| Pooled fixed income funds | - | 59.6 | - | 59.6 | ||||||||
| Alternative investment funds | - | - | - | - | ||||||||
| Balanced funds | - | 0.5 | - | 0.5 | ||||||||
| $ | - | $ | 60.1 | $ | - | $ | 94.2 |
| December 31, 2023 | Level 1 | Level 2 | Level 3 | Total | ||||||||
| Investments: | ||||||||||||
| Money market instruments | $ | 1.2 | $ | - | $ | - | $ | 1.2 | ||||
| Pooled equity funds | 33.9 | - | - | 33.9 | ||||||||
| Pooled fixed income funds | - | 69.9 | - | 69.9 | ||||||||
| Alternative investment funds | - | - | - | - | ||||||||
| Balanced funds | - | 0.1 | - | 0.1 | ||||||||
| $ | 35.1 | $ | 70.0 | $ | - | $ | 105.1 |
| HUDBAY MINERALS INC. Notes to Audited Consolidated Financial Statements (in millions of US dollars, except where otherwise noted) Years ended December 31, 2024 and 2023 |
25. Other employee benefits
Hudbay sponsors both other long-term employee benefit plans and non-pension post-employment benefits plans and uses a December 31 measurement date. These obligations relate mainly to commitments for post-retirement health benefits. Information about Hudbay's post-employment and other long-term employee benefits is as follows:
Movements in the present value of the defined benefit obligation in the current and previous years were:
| Year ended | ||||||
| Dec. 31, 2024 | Dec. 31, 2023 | |||||
| Opening defined benefit obligation | $ | 103.2 | $ | 87.2 | ||
| Current service cost1 | 2.8 | 2.8 | ||||
| Past service cost | 1.6 | - | ||||
| Interest cost | 4.5 | 4.5 | ||||
| Benefits paid | (2.9 | ) | (2.7 | ) | ||
| Remeasurement actuarial (gain)/loss: | ||||||
| Arising from changes in demographic assumptions | (12.8 | ) | 0.5 | |||
| Arising from changes in financial assumptions | (1.2 | ) | 9.3 | |||
| Arising from experience adjustments | (5.3 | ) | (0.7 | ) | ||
| Effects of movements in exchange rates | (8.4 | ) | 2.3 | |||
| Closing defined benefit obligation | $ | 81.5 | $ | 103.2 | ||
1 Includes remeasurement of other long term employee benefits
The defined benefit obligation closing balance, by group member, is as follows:
| Dec. 31, 2024 | Dec. 31, 2023 | |||||
| Active members | $ | 26.7 | $ | 36.9 | ||
| Inactive members | 54.8 | 66.3 | ||||
| Closing defined benefit obligation | $ | 81.5 | $ | 103.2 |
Movements in the fair value of defined benefit amounts in the current and previous years were as follows:
| Dec. 31, 2024 | Dec. 31, 2023 | |||||
| Employer contributions | $ | 2.9 | $ | 2.7 | ||
| Benefits paid | (2.9 | ) | (2.7 | ) | ||
| Closing fair value of assets | $ | - | $ | - |
The non-pension employee benefit plan obligations are unfunded.
| HUDBAY MINERALS INC. Notes to Audited Consolidated Financial Statements (in millions of US dollars, except where otherwise noted) Years ended December 31, 2024 and 2023 |
Reconciliation of assets and liabilities recognized in the consolidated balance sheets:
| Dec. 31, 2024 | Dec. 31, 2023 | |||||
| Unfunded benefit obligation | $ | 81.5 | $ | 103.2 | ||
| Vacation accrual and other - non-current | 2.3 | 2.5 | ||||
| Net liability | $ | 83.8 | $ | 105.7 |
Reflected in the consolidated balance sheets as follows:
| Dec. 31, 2024 | Dec. 31, 2023 | |||||
| Other employee benefits liability - current (note 17) | $ | 3.5 | $ | 3.8 | ||
| Other employee benefits liability - non-current | 80.3 | 101.9 | ||||
| Net liability | $ | 83.8 | $ | 105.7 |
Other employee future benefit expense includes the following:
| Dec. 31, 2024 | Dec. 31, 2023 | |||||
| Current service cost 1 | $ | 2.8 | $ | 2.8 | ||
| Past service cost | 1.6 | - | ||||
| Net interest cost | 4.5 | 4.5 | ||||
| Components recognized in consolidated statements of income | $ | 8.9 | $ | 7.3 | ||
| 1 Includes remeasurement of other long term employee benefit and curtailment | ||||||
| Dec. 31, 2024 | Dec. 31, 2023 | |||||
| Remeasurement on the net defined benefit liability: | ||||||
| Actuarial (gain) loss arising from changes in demographic assumptions | $ | (12.8 | ) | $ | 0.5 | |
| Actuarial (gain) loss arising from changes in financial assumptions | (1.2 | ) | 9.2 | |||
| Actuarial gain arising from changes experience adjustments | (5.3 | ) | (0.6 | ) | ||
| Components recognized in statements of comprehensive income |
$ | (19.3 | ) | $ | 9.1 | |
| Total other employee future benefit (income) / expense | $ | (10.4 | ) | $ | 16.4 |
Other employee benefit amounts recognized include those directly related to production of inventory; such amounts are recognized initially as costs of inventory and are expensed in the consolidated statements of income within cost of sales upon sale of the inventory.
| HUDBAY MINERALS INC. Notes to Audited Consolidated Financial Statements (in millions of US dollars, except where otherwise noted) Years ended December 31, 2024 and 2023 |
|
|
Dec. 31, 2024 |
Dec. 31, 2023 |
|
Defined benefit cost: |
|
|
|
Discount rate |
4.64% |
5.27% |
|
Initial weighted average health care trend rate |
5.82% |
5.92% |
|
Ultimate weighted average health care trend rate |
4.00% |
4.00% |
|
Average longevity at retirement age for current pensioners (years)1 : |
|
|
|
Males |
20.5 |
20.4 |
|
Females |
23.9 |
23.8 |
|
|
Dec. 31, 2024 |
Dec. 31, 2023 |
|
Defined benefit obligation: |
|
|
|
Discount rate |
4.74% |
4.64% |
|
Initial weighted average health care trend rate |
5.67% |
5.82% |
|
Ultimate weighted average health care trend rate |
4.00% |
4.00% |
|
Average longevity at retirement age for current pensioners (years)1 : |
|
|
|
Males |
20.6 |
20.5 |
|
Females |
24.0 |
23.9 |
|
Average longevity at retirement age for current employees (future pensioners) (years)1 : |
|
|
|
Males |
22.5 |
22.4 |
|
Females |
25.6 |
25.6 |
1 CPM2014 Priv with MI-2017 projection scale with loading of 1.25 and 1.15 for males and females.
Hudbay reviews the assumptions used to measure other employee benefit costs (including the discount rate) on an annual basis.
The other employee benefit costs typically expose Hudbay to actuarial risks such as: interest rate risk, health care cost inflation risk and longevity risk.
| Interest risk | A decrease in the bond interest rate will increase the plan liabilities. |
| Health care cost inflation risk |
The majority of the plan's benefit obligations are linked to health care cost inflation and higher inflation will lead to higher liabilities. |
| Longevity risk | The majority of the plans' benefit liability is calculated by reference to the best estimate of the mortality of plan participants both during and after their employment. An increase in the life expectancy of the plan participants will increase the plans' liabilities. This is particularly significant for benefits subject to health care cost inflation where increases in inflation result in higher sensitivity to changes in life expectancy. |
| HUDBAY MINERALS INC. Notes to Audited Consolidated Financial Statements (in millions of US dollars, except where otherwise noted) Years ended December 31, 2024 and 2023 |
The sensitivity analyses below have been determined based on reasonably possible changes of the respective assumptions occurring at the end of the reporting period, while holding other assumptions constant:
- If the discount rate is 50 basis points higher (lower), the defined benefit obligation would decrease by $5.7 million (increase by $6.4 million).
- If the health care cost assumption increases (decreases) by 1%, the defined benefit obligation would increase by $12.9 million (decrease by $10.3 million).
- If the life expectancy increases (decreases) by one year for both men and women, the defined benefit obligations would increase by $3.2 million (decrease by $3.2 million).
The average duration of the non-pension post-employment obligation at December 31, 2024 is 15.0 years (2023: 15.8 years).
This number can be broken down as follows:
- Active members: 23.0 years (2023: 22.9 years)
- Inactive members: 11.3 years (2023: 12.0 years)
26. Income and mining taxes
(a) Tax expense:
The tax expense is applicable as follows:
| Year ended December 31, | ||||||
| 2024 | 2023 | |||||
| Current: | ||||||
| Income taxes | $ | 119.7 | $ | 87.5 | ||
| Mining taxes | 57.0 | 22.0 | ||||
| Adjustments in respect of prior years | 0.2 | (4.4 | ) | |||
| 176.9 | 105.1 | |||||
| Deferred: | ||||||
| Income tax expense (recovery) - origination, revaluation and/or reversal of temporary differences | 15.3 | (25.9 | ) | |||
| Mining tax recovery - origination, revaluation and/or reversal of temporary difference | (5.6 | ) | (2.4 | ) | ||
| Adjustments in respect of prior years | (2.8 | ) | 5.5 | |||
| 6.9 | (22.8 | ) | ||||
| $ | 183.8 | $ | 82.3 | |||
Adjustments in respect of prior years refers to amounts changing due to the filing of tax returns and assessments from government authorities as well as any change identified that would result in a difference to our current or deferred tax balances as reported in the prior fiscal year end.
| HUDBAY MINERALS INC. Notes to Audited Consolidated Financial Statements (in millions of US dollars, except where otherwise noted) Years ended December 31, 2024 and 2023 |
(b) Deferred tax assets and liabilities as represented on the consolidated balance sheets:
| Dec. 31, 2024 | Dec. 31, 2023 | |||||
| Deferred income tax asset | $ | 102.6 | $ | 151.9 | ||
| Deferred income tax liability | (305.5 | ) | (362.8 | ) | ||
| Deferred mining tax liability | (34.9 | ) | (44.4 | ) | ||
| (340.4 | ) | (407.2 | ) | |||
| Net deferred tax liability balance, end of year | $ | (237.8 | ) | $ | (255.3 | ) |
(c) Changes in deferred tax assets and liabilities:
| Year ended December 31, | ||||||
| 2024 | 2023 | |||||
| Net deferred tax liability balance, beginning of year | $ | (255.3 | ) | $ | (125.7 | ) |
| Deferred tax (expense) recovery (note 26a) | (6.9 | ) | 22.8 | |||
| OCI transactions | (3.2 | ) | (0.2 | ) | ||
| Foreign currency translation on the deferred tax liability | 27.6 | (4.0 | ) | |||
| Acquisition of Copper Mountain mining (note 5) | - | (148.2 | ) | |||
| Net deferred tax liability balance, end of year | $ | (237.8 | ) | $ | (255.3 | ) |
| HUDBAY MINERALS INC. Notes to Audited Consolidated Financial Statements (in millions of US dollars, except where otherwise noted) Years ended December 31, 2024 and 2023 |
(d) Reconciliation to statutory tax rate:
As a result of its mining operations, the Company is subject to both income and mining taxes. Generally, most expenditures incurred are deductible in computing income tax, whereas mining tax legislation, although based on a measure of profitability from carrying on mining operations, is more restrictive in respect of the deductions permitted in computing income subject to mining tax. These restrictions include costs unrelated to mining operations as well as deductions for financing expenses, such as interest and royalties. In addition, income unrelated to carrying on mining operations is not subject to mining tax.
A reconciliation between tax expense and the product of accounting profit multiplied by the Company's statutory income tax rate for the years ended December 31, 2024 and 2023 is as follows:
| Year ended December 31, | ||||||
| 2024 | 2023 | |||||
| Income before tax | $ | 251.6 | $ | 151.8 | ||
| Statutory tax rate | 26.7% | 26.2% | ||||
| Tax expense at statutory rate | 67.2 | 39.8 | ||||
| Effect of: | ||||||
| Deductions related to mining taxes | (16.3 | ) | (6.9 | ) | ||
| Adjusted income taxes | 50.9 | 32.9 | ||||
| Mining tax expense | 50.0 | 18.8 | ||||
| 100.9 | 51.7 | |||||
| Permanent differences related to: | ||||||
| Capital items | 0.5 | 0.4 | ||||
| Other income tax permanent differences | 4.1 | 0.9 | ||||
| Withholding tax on dividends | 1.8 | 11.8 | ||||
| Impact of remeasurement on decommissioning liability | 6.5 | (6.4 | ) | |||
| Temporary income tax differences not recognized | 8.3 | 5.4 | ||||
| Recognition of previously unrecognized deferred tax assets | - | (5.3 | ) | |||
| Impact related to differences in tax rates in foreign operations | 36.7 | 27.9 | ||||
| Impact of changes to statutory tax rates | (4.4 | ) | 0.9 | |||
| Effect of flow through shares | 3.9 | - | ||||
| Foreign exchange on non-monetary items | 26.2 | (7.4 | ) | |||
| Impact related to tax assessments and tax return amendments | (1.2 | ) | 1.9 | |||
| Other | 0.5 | 0.5 | ||||
| Tax expense | $ | 183.8 | $ | 82.3 | ||
| HUDBAY MINERALS INC. Notes to Audited Consolidated Financial Statements (in millions of US dollars, except where otherwise noted) Years ended December 31, 2024 and 2023 |
(e) Income tax effect of temporary differences - recognized:
The tax effects of temporary differences that give rise to significant portions of the deferred tax assets and deferred tax liabilities at December 31, 2024 and 2023 are as follows:
| Balance sheet | ||||||
| Dec. 31, 2024 | Dec. 31, 2023 | |||||
| Deferred income tax (liability) asset | ||||||
| Property, plant and equipment | $ | (54.5 | ) | $ | (50.4 | ) |
| Pension obligation | 2.0 | 2.5 | ||||
| Other employee benefits | 25.1 | 26.9 | ||||
| Decommissioning and restoration provision | 19.3 | 20.0 | ||||
| Non-capital losses | 107.3 | 135.3 | ||||
| Share issuance and debt cost | 3.8 | 6.7 | ||||
| Deferred revenue | 1.7 | 1.5 | ||||
| Other | (2.1 | ) | 9.4 | |||
| Deferred income tax asset | 102.6 | 151.9 | ||||
| Deferred income tax liability (asset) | ||||||
| Property, plant and equipment | 451.6 | 478.7 | ||||
| Other employee benefits | (1.2 | ) | (1.2 | ) | ||
| Decommissioning and restoration provision | (11.8 | ) | (19.2 | ) | ||
| Non-capital losses | (116.7 | ) | (92.0 | ) | ||
| Other | (16.4 | ) | (3.5 | ) | ||
| Deferred income tax liability | 305.5 | 362.8 | ||||
| Deferred income tax liability | $ | (202.9 | ) | $ | (210.9 | ) |
The above reconciling items are disclosed at the tax rates that apply in the jurisdiction where they have arisen.
(f) Income tax temporary differences - not recognized:
The Company has not recognized a deferred tax asset on $57.2 million of non-capital losses (December 31, 2023 - $43.1 million), $158.7 million of capital losses (December 31, 2023 - $183.2 million) and $651.3 million (December 31, 2023 - $482.9 million) of other deductible temporary differences since the realization of any related tax benefit through future taxable profits is not probable. The capital losses have no expiry dates and the other deductible temporary differences do not expire under current tax legislation.
The Canadian non-capital losses were incurred between 2013 and 2024 and have a twenty-year carry forward period. The United States net operating losses incurred between 2004 and 2017 have a twenty-year carry forward period. United States net operating losses incurred between 2018 and 2024 may be carried forward indefinitely but are restricted to being applied against a maximum of 80% of taxable income.
| HUDBAY MINERALS INC. Notes to Audited Consolidated Financial Statements (in millions of US dollars, except where otherwise noted) Years ended December 31, 2024 and 2023 |
(g) Mining tax effect of temporary differences:
The tax effects of temporary differences that give rise to significant portions of the deferred mining tax assets and liabilities at December 31, 2024 and 2023 are as follows:
| Canada |
Dec. 31, 2024 | Dec. 31, 2023 | ||||
| Property, plant and equipment | $ | (40.2 | ) | $ | (52.6 | ) |
| Other | 12.8 | 17.6 | ||||
| $ | (27.4 | ) | $ | (35.0 | ) | |
| Peru | Dec. 31, 2024 | Dec. 31, 2023 | ||||
| Property, plant and equipment | $ | (7.5 | ) | $ | (9.4 | ) |
For the year ended December 31, 2024, Hudbay had unrecognized deferred mining tax assets of approximately $9.1 million (December 31, 2023 - $9.7 million).
(h) Unrecognized taxable temporary differences associated with investments:
There are no taxable temporary differences associated with investments in subsidiaries, associates and joint ventures, for which a deferred tax liability has not been recognized.
(i) Taxes receivable/payable:
The timing of payments results in significant variances in period-to-period comparisons of the tax receivable and tax payable balances.
(j) Other disclosure:
The tax rules and regulations applicable to mining companies are highly complex and subject to interpretation. The Company may be subject in the future to a review of its historic income and other tax filings and, in connection with such reviews, disputes can arise with tax authorities over the interpretation or application of certain tax rules and regulations in respect of the Company's business. These reviews may alter the timing or amount of taxable income or deductions. The amount ultimately reassessed upon resolution of issues raised may differ from the amount accrued.
| HUDBAY MINERALS INC. Notes to Audited Consolidated Financial Statements (in millions of US dollars, except where otherwise noted) Years ended December 31, 2024 and 2023 |
27. Share capital
(a) Preference shares:
Authorized: Unlimited preference shares without par value.
Issued and fully paid: Nil.
(b) Common shares:
Authorized: Unlimited common shares without par value.
Issued and fully paid:
| Year ended Dec. 31, 2024 |
Year ended Dec. 31, 2023 |
|||||||||||
| Common shares |
Amount | Common shares | Amount | |||||||||
| Balance, beginning of year | 350,728,536 | $ | 2,240.2 | 262,019,857 | $ | 1,780.8 | ||||||
| Shares issued on equity raise, net of share issuance costs | 42,366,000 | 386.2 | - | - | ||||||||
| Flow through shares, net of share issuance costs and implied premium | 968,900 | 8.6 | 1,960,000 | 10.1 | ||||||||
| Exercise of options | 482,028 | 3.6 | 67,145 | 0.3 | ||||||||
| Exercise of warrants | 386,910 | 2.7 | - | - | ||||||||
| Shares issued on acquisition of Copper Mountain, net of share issuance costs | - | - | 84,165,617 | 436.5 | ||||||||
| Shares issued on acquisition of Rockcliff | - | - | 2,675,324 | 12.5 | ||||||||
| Cancelled shares | - | - | (159,407 | ) | - | |||||||
| Balance, end of period | 394,932,374 | $ | 2,641.3 | 350,728,536 | $ | 2,240.2 | ||||||
During the year ended December 31, 2024, the Company declared two semi-annual dividends of C$0.01 per share. The Company paid $2.6 million and $2.9 million in dividends on March 22, 2024 and September 20, 2024 to shareholders of record as of March 5, 2024 and September 3, 2024.
On May 24, 2024, the Company closed an equity financing with a syndicate of underwriters ("the Offering"). Pursuant to the Offering, the Underwriters purchased on a bought deal basis from the Company a total of 42,366,000 common shares at a price of $9.50 per Common Shares for aggregate gross proceeds of $402.5 million. Transaction costs related to the Offering were $16.1 million resulting in net proceeds to the Company of $386.4 million. Associated with the Offering were $0.2 million of share issuance costs resulting in net equity raised of $386.2 million.
During the year ended December 31, 2024, the Company completed a Canadian Development Expense and Canadian Exploration Expense flow-through financing. The flow-through share liability will be recognized in earnings as eligible expenditures are made. The Company issued 968,900 common shares for proceeds, net of transaction costs, of $11.8 million. The implied premium on the flow-through shares of $3.2 million was recorded as a flow-through share liability.
During the year ended December 31, 2023, the Company declared two semi-annual dividends of C$0.01 per share. The Company paid $1.9 million and $2.6 million in dividends on March 24, 2023 and September 22, 2023 to shareholders of record as of March 7, 2023 and September 1, 2023.
During the year ended December 31, 2023, the Company completed a Canadian Development Expense and Canadian Exploration Expense flow-through financing. The Company issued 1,960,000 common shares for proceeds, net of transaction costs, of $14.4 million. The implied premium on the flow-through shares of $4.3 million was recorded as a flow-through share liability. At December 31, 2024, $4.1 million of flow-through share liability was renounced and recognized in other expenses (note 7e) on the consolidated statements of income.
| HUDBAY MINERALS INC. Notes to Audited Consolidated Financial Statements (in millions of US dollars, except where otherwise noted) Years ended December 31, 2024 and 2023 |
28. Share-based compensation
(a) Cash-settled share-based compensation:
Hudbay has three cash-settled share-based compensation plans, as described below.
Deferred Share Units (DSU)
At December 31, 2024, the carrying amount and the intrinsic value of the outstanding liability related to the DSU plan was $12.3 million (December 31, 2023 - $8.7 million) (note 23). The following table outlines information related to DSUs granted, expenses recognized and payments made during the year.
| Year ended | ||||||
| Dec. 31, 2024 | Dec. 31, 2023 | |||||
| Number of units, beginning of year | 1,571,160 | 1,360,688 | ||||
| Number of units granted during the year | 143,527 | 210,472 | ||||
| Number of units released/paid | (195,187 | ) | $ | - | ||
| Number of units, end of year | 1,519,500 | 1,571,160 | ||||
| Weighted average price (C$/unit) | $ | 10.05 | $ | 7.02 | ||
| Expenses recognized during the year1 (notes 7c, 7d) | $ | 6.3 | $ | 1.7 | ||
| Payments made during the year (note 23) | $ | 1.6 | $ | - | ||
1 This expense relates to the grant of DSUs, as well as mark-to-market adjustments, and is presented within selling and administrative expenses on the consolidated statements of income.
Restricted Share Units (RSU)
RSUs granted under the LTEP Plan may be settled in the form of Hudbay common shares or, at the option of the Company, the cash equivalent based on the market price of the common shares as of the vesting date. RSUs may also be granted under Hudbay's Share Unit Plan; however, the RSUs granted under the Share Unit Plan may only be settled in cash. Hudbay has historically settled all RSUs in cash. The Company has determined that the appropriate accounting treatment is to classify the RSUs as cash settled transactions.
At December 31, 2024, the carrying amount of the outstanding liability related to the RSU plan was $9.6 million (December 31, 2023 - $5.0 million) (note 23). The following table outlines information related to RSUs granted, expenses recognized and payments made in the year.
| Year ended | ||||||
| Dec. 31, 2024 | Dec. 31, 2023 | |||||
| Number of units, beginning of year | 1,787,728 | 2,082,990 | ||||
| Number of units granted during the year | 984,758 | 873,371 | ||||
| Credits for dividends | 4,618 | 5,594 | ||||
| Number of units forfeited during the year | (158,125 | ) | (122,992 | ) | ||
| Number of units released/paid | (395,742 | ) | (1,051,235 | ) | ||
| Number of units, end of year | 2,223,237 | 1,787,728 | ||||
| Weighted average price - granted (C$/unit) | $ | 7.56 | $ | 6.59 | ||
| Expenses recognized during the year1 (note 7c, 7d) | $ | 6.7 | $ | 2.9 | ||
| Payments made during the year (note 23) | $ | 2.2 | $ | 5.1 | ||
1 This net expense reflects recognition of RSU expense over the service period, as well as mark-to-market adjustments, and is presented mainly within cost of sales and selling and administrative expenses. Certain amounts related to the Arizona segment are capitalized.
| HUDBAY MINERALS INC. Notes to Audited Consolidated Financial Statements (in millions of US dollars, except where otherwise noted) Years ended December 31, 2024 and 2023 |
Performance Share Units (PSU)
PSUs granted under the LTEP Plan may be settled in the form of Hudbay common shares or, at the option of the Company, the cash equivalent based on the market price of the common shares as of the vesting date. Hudbay has historically settled similar share-based compensation units in cash. The Company has determined that the appropriate accounting treatment is to classify the PSUs as cash settled transactions. The PSUs contain a performance based multiplier element which will be computed upon vesting.
At December 31, 2024, the carrying amount of the outstanding liability related to PSU plan was $5.5 million (December 31, 2023 - $2.6 million) (note 23). The following table outlines information related to PSUs granted, expenses recognized and payments made in the year.
| Year ended | ||||||
| Dec. 31, 2024 | Dec. 31, 2023 | |||||
| Number of units, beginning of year | 1,172,803 | 1,373,063 | ||||
| Number of units granted during the year | 600,572 | 580,275 | ||||
| Credits for dividends | 2,997 | 3,559 | ||||
| Number of units forfeited during the year | (169,436 | ) | (577,900 | ) | ||
| Number of units released/paid | (160,739 | ) | (206,194 | ) | ||
| Number of units, end of year | 1,446,197 | 1,172,803 | ||||
| Weighted average price - granted (C$/unit) | $ | 7.35 | $ | 6.59 | ||
| Expense recognized during the year (note 7c) | $ | 4.2 | $ | 0.6 | ||
| Payments made during the year (note 23) | $ | 0.9 | $ | 1.1 | ||
(b) Equity-settled share-based compensation
Stock Options
The Company's stock option plan was approved in June 2005 and amended in May 2008 (the "Plan"). Under the amended Plan, the Company may grant to employees, officers, directors or consultants of the Company or its affiliates options to purchase up to a maximum of 13 million common shares of Hudbay. The Company has determined that the appropriate accounting treatment is to classify the stock options as equity settled transactions.
During the year ended December 31, 2024, the Company granted 902,874 stock options (year ended December 31, 2023 - 801,661).
The following table outlines the changes in the number of stock options outstanding:
| Year ended | Year ended | |||||||||||
| Dec. 31, 2024 | Dec. 31, 2023 | |||||||||||
| Number of shares subject to option |
Weighted- average exercise price C$ |
Number of shares subject to option |
Weighted average exercise price C$ |
|||||||||
| Balance, beginning of year | 2,182,970 | $ | 7.23 | 1,528,760 | $ | 7.38 | ||||||
| Number of units granted during the year | 902,874 | $ | 7.50 | 801,661 | $ | 6.75 | ||||||
| Exercised | (482,029 | ) | $ | 6.56 | (67,145 | ) | $ | 3.79 | ||||
| Forfeited | (106,850 | ) | $ | 7.62 | (80,306 | ) | $ | 8.33 | ||||
| Expired | (12,858 | ) | $ | 10.03 | - | $ | - | |||||
| Balance, end of year | 2,484,107 | $ | 7.42 | 2,182,970 | $ | 7.23 | ||||||
| HUDBAY MINERALS INC. Notes to Audited Consolidated Financial Statements (in millions of US dollars, except where otherwise noted) Years ended December 31, 2024 and 2023 |
The following table presents the weighted average fair value assumptions used in the Black-Scholes valuation of these options:
| For options granted during the year ended | Dec. 31, 2024 | Dec. 31, 2023 | ||||
| Weighted average share price at grant date (CAD) | $ | 7.50 | $ | 6.75 | ||
| Risk-free rate | 3.49% | 3.40% | ||||
| Expected dividend yield | 0.3% | 0.3% | ||||
| Expected stock price volatility (based on historical volatility) | 51.4% | 56.0% | ||||
| Expected life of option (months) | 84 | 84 | ||||
| Weighted average per share fair value of stock options granted (CAD) | $ | 4.11 | $ | 3.90 |
The following table outlines stock options outstanding and exercisable:
| Dec. 31, 2024 | |||||||||||||||
| Range of exercise prices C$ |
Number of options outstanding |
Weighted average remaining contractual life (years) |
Weighted average exercise price C$ |
Number of options exercisable |
Weighted average share price at exercise date C$ |
||||||||||
| $3.76 - $5.26 | 361,658 | 2.15 | $ | 3.76 | 361,658 | $ | 3.76 | ||||||||
| $5.27 - $6.90 | 631,984 | 5.16 | $ | 6.75 | 152,408 | $ | 6.75 | ||||||||
| $6.91 - $8.71 | 866,543 | 6.15 | $ | 7.50 | - | $ | - | ||||||||
| $8.72 - $10.17 | 365,988 | 4.16 | $ | 9.92 | 223,287 | $ | 9.92 | ||||||||
| $10.18 - $10.42 | 257,934 | 3.15 | $ | 10.42 | 257,934 | $ | 10.42 | ||||||||
| Dec. 31, 2023 | |||||||||||||||
| Range of exercise prices C$ |
Number of options outstanding |
Weighted average remaining contractual life (years) |
Weighted average exercise price C$ |
Number of options exercisable |
Weighted average share price at exercise date C$ |
||||||||||
| $3.76 - $4.82 | 568,801 | 3.15 | $ | 3.76 | 568,801 | $ | 3.76 | ||||||||
| $5.91 - $6.75 | 779,959 | 6.17 | $ | 6.75 | - | $ | - | ||||||||
| $6.76 - $10.17 | 488,340 | 5.17 | $ | 9.76 | 174,989 | $ | 9.57 | ||||||||
| $10.18 - $10.42 | 345,870 | 4.15 | $ | 10.42 | 230,514 | $ | 10.42 | ||||||||
Hudbay estimates expected life of options and expected volatility based on historical data, which may differ from actual outcomes.
| HUDBAY MINERALS INC. Notes to Audited Consolidated Financial Statements (in millions of US dollars, except where otherwise noted) Years ended December 31, 2024 and 2023 |
Warrants
The following table outlines the changes in the number of Hudbay warrants outstanding:
| Year ended | Year ended | |||||||||||
| Dec. 31, 2024 | Dec. 31, 2023 | |||||||||||
| Number of shares subject to warrants |
Weighted- average exercise price C$ |
Number of shares subject to warrants |
Weighted average exercise price C$ |
|||||||||
| Balance, beginning of year | 457,617 | $ | 7.38 | 59,843 | $ | 2.27 | ||||||
| Warrants granted | - | $ | - | 457,617 | $ | 7.38 | ||||||
| Exercised | (386,909 | ) | $ | 7.38 | - | $ | - | |||||
| Expired | - | $ | - | (59,843 | ) | $ | 2.27 | |||||
| Balance, end of year | 70,708 | $ | 7.38 | 457,617 | $ | 7.38 | ||||||
During the year ended December 31, 2023, the Company granted 457,617 warrants with a weighted average per share fair value of C$7.38.
29. Earnings per share
| Year ended December 31, | ||||||
| 2024 | 2023 | |||||
| Weighted average common shares outstanding | ||||||
| Basic | 376,785,518 | 310,845,281 | ||||
| Plus net incremental shares from: | ||||||
| Assumed conversion: stock options | 483,149 | 107,829 | ||||
| Assumed conversion: warrants | 22,544 | - | ||||
| Diluted weighted average common shares outstanding | 377,291,211 | 310,953,110 | ||||
The calculation of dilutive weighted-average number of common shares excludes the impact of 4,127 shares for the year ended December 31, 2024 (year ended December 31, 2023 - 14,530). The shares related to stock options and warrants were excluded as the exercise price related to the particular security exceeded the average market price of the Company's common shares for the period, or the inclusion of the share units had an anti-dilutive effect on net income.
30. Capital management
The Company's definition of capital includes total equity and long-term debt. Hudbay's long-term debt balance as at December 31, 2024 was $1,107.5 million (December 31, 2023 - $1,287.5 million).
The Company's objectives when managing capital are to maintain a strong capital base in order to:
- Advance Hudbay's corporate strategies to create long-term value for its stakeholders; and,
- Sustain Hudbay's operations and growth throughout metals and materials cycles.
| HUDBAY MINERALS INC. Notes to Audited Consolidated Financial Statements (in millions of US dollars, except where otherwise noted) Years ended December 31, 2024 and 2023 |
Hudbay monitors its capital and capital structure on an ongoing basis to ensure they are sufficient to achieve the Company's short-term and long-term strategic objectives in a capital intensive industry. Hudbay faces several risks, including volatile metals prices, inflationary pressures on costs, access to capital, and risk of delays and cost escalation associated with major capital projects. The Company continually assesses the adequacy of its capital structure to ensure its objectives are met. Hudbay monitors its cash, which was $541.8 million as at December 31, 2024 (2023 - $249.8 million), together with availability under its committed credit facilities. Hudbay invests its cash primarily in Canadian bankers' acceptances, deposits at major Canadian and Peruvian banks, or treasury bills issued by the federal or provincial governments. In addition to the requirement to maintain sufficient cash balances to fund continuing operations, Hudbay must maintain sufficient cash to fund the interest expense on the long-term debt outstanding (note 21). As part of the Company's capital management activities, Hudbay monitors interest coverage ratios and leverage ratios.
| HUDBAY MINERALS INC. Notes to Audited Consolidated Financial Statements (in millions of US dollars, except where otherwise noted) Years ended December 31, 2024 and 2023 |
31. Financial instruments
(a) Fair value and carrying value of financial instruments:
The following presents the fair value ("FV") and carrying value ("CV") of Hudbay's financial instruments and non-financial derivatives:
| Dec. 31, 2024 | Dec. 31, 2023 | |||||||||||
| FV | CV | FV | CV | |||||||||
| Financial assets at amortized cost | ||||||||||||
| Cash and cash equivalents1 | $ | 541.8 | $ | 541.8 | $ | 249.8 | $ | 249.8 | ||||
| Short-term investments1 | 40.0 | 40.0 | - | - | ||||||||
| Collateral deposits1 | 0.6 | 0.6 | 1.4 | 1.4 | ||||||||
| Restricted cash1 | 0.4 | 0.4 | 2.0 | 2.0 | ||||||||
| Fair value through profit or loss | ||||||||||||
| Trade and other receivables2,3 | 185.5 | 185.5 | 176.2 | 176.2 | ||||||||
| Non-hedge derivative assets 4 | 14.3 | 14.3 | 1.3 | 1.3 | ||||||||
| Investments 5 | 12.1 | 12.1 | 6.5 | 6.5 | ||||||||
| Total financial assets | $ | 794.7 | $ | 794.7 | $ | 437.2 | $ | 437.2 | ||||
| Financial liabilities at amortized cost | ||||||||||||
| Trade and other payables1, 2 | $ | 255.2 | $ | 255.2 | $ | 219.3 | $ | 219.3 | ||||
| Deferred Rosemont acquisition consideration 8 | - | - | 9.7 | 9.7 | ||||||||
| Agreements with communities 6 | 70.4 | 68.4 | 53.5 | 54.9 | ||||||||
| Wheaton refund liability10 | 9.9 | 7.3 | 10.3 | 6.7 | ||||||||
| Senior unsecured notes 7 | 1,111.6 | 1,111.1 | 1,176.3 | 1,190.6 | ||||||||
| Senior secured revolving credit facilities11 | (3.6 | ) | (3.6 | ) | 96.9 | 96.9 | ||||||
| Fair value through profit or loss | ||||||||||||
| Gold prepayment liability9 | - | - | 55.9 | 55.9 | ||||||||
| Non-hedge derivative liabilities 4 | 0.3 | 0.3 | 11.8 | 11.8 | ||||||||
| Total financial liabilities | $ | 1,443.8 | $ | 1,438.7 | $ | 1,633.7 | $ | 1,645.8 | ||||
| 1 Cash and cash equivalents, short-term investments, collateral deposits, restricted cash, trade and other payables are recorded at carrying value, which approximates fair value due to their short-term nature and generally negligible credit losses. | ||||||||||||
| 2 Excludes tax and other statutory amounts. | ||||||||||||
| 3 Trade and other receivables contain receivables including provisionally priced receivables classified as FVTPL and various other items at amortized cost. The fair value of provisionally priced receivables is determined using forward metals prices (level 2). | ||||||||||||
| 4 Derivatives are carried at their fair value, which is determined based on observable forward market commodity prices corresponding to the maturity of the contract (level 2), | ||||||||||||
| 5 All investments are carried at their fair value, which is determined using quoted market bid prices in active markets for listed shares. | ||||||||||||
| 6 These financial liabilities relate to agreements with communities near the Constancia project in Peru (note 18). Fair values have been determined using an applicable credit-risk adjusted discounted rate and foreign exchange rates (level 3). | ||||||||||||
| 7 Fair value of the senior unsecured notes (note 21) has been determined using an applicable credit-risk adjusted discount rate (level 3). | ||||||||||||
| 8 Discounted value based on a risk adjusted discount rate. | ||||||||||||
| 9 The gold prepayment liability (note 19) is designated as fair value through profit or loss under the fair value option. Fair value is determined using observable gold forward prices corresponding to the delivery of gold ounces in the contract along with an estimate of credit-risk for similar instruments (level 3). Gains and losses related to the Company's own credit-risk have been recorded at fair value through other comprehensive income. The fair value adjustment recorded in other comprehensive income for the year ended December 31, 2024 was a loss of $4.3 million (year ended December 31, 2023 was a loss of $0.2 million). | ||||||||||||
| 10 Discounted value based on a market rate at inception of the applicable Wheaton contract for carrying value (note 18) and fair value using an applicable credit-risk adjusted discount rate (level 3). | ||||||||||||
| 11 Fair value of the senior secured revolving credit facility is valued using an applicable credit adjusted discount rate (level 3). | ||||||||||||
| HUDBAY MINERALS INC. Notes to Audited Consolidated Financial Statements (in millions of US dollars, except where otherwise noted) Years ended December 31, 2024 and 2023 |
Fair value hierarchy
The table below provides an analysis by valuation method of financial instruments that are measured at fair value subsequent to recognition as well as financial instruments not measured at fair value but for which a fair value is disclosed. Levels 1 to 3 are defined based on the degree to which fair value inputs are observable and have a significant effect on the recorded fair value, as follows:
- Level 1: Quoted prices in active markets for identical assets or liabilities;
- Level 2: Valuation techniques use significant observable inputs, either directly or indirectly, or
valuations are based on quoted prices for similar instruments; and,
- Level 3: Valuation techniques use significant inputs that are not based on observable market
data.
| December 31, 2024 | Level 1 | Level 2 | Level 3 | Total | ||||||||
| Financial assets at FVTPL: | ||||||||||||
| Provisionally priced receivables | $ | - | $ | 171.3 | $ | - | $ | 171.3 | ||||
| Non-hedge derivatives | - | 14.3 | - | $ | 14.3 | |||||||
| Investments | 12.1 | - | - | 12.1 | ||||||||
| $ | 12.1 | $ | 14.3 | $ | - | $ | 26.4 | |||||
| Financial liabilities at FVTPL: | ||||||||||||
| Non-hedge derivatives | $ | - | $ | 0.3 | $ | - | $ | 0.3 | ||||
| Financial liabilities at amortized cost: | ||||||||||||
| Agreements with communities | - | - | 70.4 | 70.4 | ||||||||
| Wheaton refund liability | - | - | 9.9 | 9.9 | ||||||||
| Senior unsecured notes | 1,111.6 | - | - | 1,111.6 | ||||||||
| $ | 1,111.6 | $ | 0.3 | $ | 80.3 | $ | 1,192.2 |
| December 31, 2023 | Level 1 | Level 2 | Level 3 | Total | ||||||||
| Financial assets at FVTPL: | ||||||||||||
| Provisionally priced receivables | $ | - | $ | 166.9 | $ | - | $ | - | ||||
| Non-hedge derivatives | - | 1.4 | - | 1.4 | ||||||||
| Investments | 6.5 | - | - | 6.5 | ||||||||
| $ | 6.5 | $ | 1.4 | $ | - | $ | 7.9 | |||||
| Financial liabilities at FVTPL: | ||||||||||||
| Non-hedge derivatives | $ | - | $ | 11.8 | $ | - | $ | 11.8 | ||||
| Gold prepayment liability | - | 55.9 | - | 55.9 | ||||||||
| Financial liabilities at amortized cost: | ||||||||||||
| Agreements with communities | - | - | 53.5 | 53.5 | ||||||||
| Wheaton refund liability | - | - | 10.3 | 10.3 | ||||||||
| Senior secured revolving credit facilities | - | - | 96.9 | 96.9 | ||||||||
| Senior unsecured notes | 1,176.3 | - | - | 1,176.3 | ||||||||
| $ | 1,176.3 | $ | 67.7 | $ | 160.7 | $ | 1,404.7 |
The Company's policy is to recognize transfers into and transfers out of fair value hierarchy levels as of the date of the event or change in circumstances that caused the transfer. During the year ended December 31, 2024 and year ended December 31, 2023, Hudbay did not make any such transfers.
Valuation techniques used for instruments categorized in Levels 2 and 3 are consistent with the year ended December 31, 2023.
| HUDBAY MINERALS INC. Notes to Audited Consolidated Financial Statements (in millions of US dollars, except where otherwise noted) Years ended December 31, 2024 and 2023 |
(b) Derivatives and hedging:
Copper fixed for floating swaps
Hudbay enters into copper fixed for floating swaps in order to manage the risk associated with provisional pricing terms in copper concentrate sales agreements. As at December 31, 2024, Hudbay had 61.7 million pounds of net copper swaps outstanding at an effective average price of $4.19/lb and settling from January 2025 to May 2025. As at December 31, 2023, Hudbay had 90.6 million pounds of net copper swaps outstanding at an effective average price of $3.74/lb and settling from January to May 2024. The aggregate fair value of the transactions at December 31, 2024 was an asset of $13.7 million (December 31, 2023 - a liability position of $9.5 million).
Zinc fixed for floating swaps
Hudbay enters into zinc fixed for floating swaps in order to manage the risk associated with provisional pricing terms in zinc concentrate sales agreements. As at December 31, 2024, Hudbay had 9.7 million pounds of net zinc swaps outstanding at an effective average price of $1.38/lb and settling from January 2025 to April 2025. As at December 31, 2023, Hudbay had 13.9 million pounds of net zinc swaps outstanding at an effective average price of $1.14/lb and settling from January to March 2024. The aggregate fair value of the transactions at December 31, 2024 was an asset of $0.3 million (December 31, 2023 - a liability position of $0.9 million).
Copper forward sales
As at December 31, 2024, Hudbay had 5.3 million pounds of copper forwards outstanding at an effective average price of $3.95/lb and settling from January 2025 to April 2025. As at December 31, 2023, Hudbay had 7.9 million pounds of copper forwards outstanding at an effective average price of $3.93/lb and settling from May 2024 to April 2025. The aggregate fair value of the transactions at December 31, 2024 was a liability of $0.1 million (December 31, 2023 - nil).
Copper costless collars
As at December 31, 2024, Hudbay had 6.6 million pounds of copper collars outstanding settling from January 2025 to April 2025 at an average floor price of $3.88/lb and an average cap price of $4.14/lb. As at December 31, 2023, Hudbay had 13.2 million pounds of copper collars outstanding settling from May 2024 to April 2025 at an average floor price of $3.83/lb and an average cap price of $4.03/lb. The aggregate fair value of the position at December 31, 2024 was an asset of $0.1 million (December 31, 2023 - nil).
Gold costless collars
During the year ended December 31, 2024, Hudbay entered into zero-cost collar program. As at December 31, 2024, nil ounces of gold collars were unsettled (December 31, 2023 - nil). The aggregate fair value of the position at December 31, 2024 was nil (December 31, 2023 - nil).
(c) Provisionally priced receivables
Changes in fair value of provisionally priced receivables
Hudbay records changes in fair value of provisionally priced receivables related to provisional pricing in concentrate purchase, concentrate sale and certain other sale contracts. Under the terms of these contracts, prices are subject to final adjustment at the end of a future period after title transfers based on quoted market prices during the quotation period specified in the contract. The period between provisional pricing and final pricing is typically up to three months.
Changes in fair value of provisionally priced receivables are presented in trade and other receivables when they relate to sales contracts and in trade and other payables when they relate to purchase contracts. At each reporting date, provisionally priced metals are marked-to-market based on the forward market price for the quotation period stipulated in the contract, with changes in fair value recognized in revenue for sales contracts and in inventory or cost of sales for purchase concentrate contracts. Cash flows related to changes in fair value of provisionally priced receivables are classified in operating activities.
| HUDBAY MINERALS INC. Notes to Audited Consolidated Financial Statements (in millions of US dollars, except where otherwise noted) Years ended December 31, 2024 and 2023 |
As at December 31, 2024 and December 31, 2023, Hudbay's net position consisted of contracts awaiting final pricing are as indicated below:
| Metal in concentrate |
Sales awaiting final pricing | Average YTD price ($/unit) | |||||||||||
| Unit | Dec. 31, 2024 | Dec. 31, 2023 | Dec. 31, 2024 | Dec. 31, 2023 | |||||||||
| Copper | pounds (in 000s) | 85,731 | 111,069 | 3.96 | 3.87 | ||||||||
| Gold | troy ounces | 47,075 | 50,563 | 2,638 | 2,072 | ||||||||
| Silver | troy ounces | 238,149 | 205,579 | 29.02 | 23.94 | ||||||||
| Zinc | pounds (in 000s) | 12,102 | 16,416 | 1.34 | 1.20 | ||||||||
The aggregate fair value of provisionally priced receivables within the copper and zinc concentrate at December 31, 2024, was a liability position of $13.9 million (December 31, 2023 - an asset position of $22.6 million).
(d) Other financial liabilities
Gold prepayment liability
The gold prepayment liability (note 19) requires settlement by physical delivery of gold ounces or equivalent gold credits. As at December 31, 2024, the liability was settled. The fair value of the financial liability at December 31, 2024 was nil (December 31, 2023 - a liability of $55.9 million).
(e) Financial risk management
Hudbay's financial risk management activities are governed by Board-approved policies addressing risk identification, hedging authorization procedures and limits and reporting. The Company's policy objective, when hedging activities are undertaken, is to reduce the volatility of future profit and cash flow within the strategic and economic goals of Hudbay. From time to time, the Company employs derivative financial instruments, including forward and option contracts, to manage risk originating from exposures to commodity price risk, foreign exchange risk and interest rate risk. Significant derivative transactions are approved by the Board of Directors, and hedge accounting is applied when certain criteria have been met. Hudbay does not use derivative financial instruments for trading or speculation purposes. The following is a discussion of the Company's risk exposures.
(i) Market risk
Market risk is the risk that changes in market prices, including foreign exchange rates, commodity prices, share prices, and interest rates will cause fluctuations in the fair value or future cash flows of a financial instrument.
Foreign currency risk
Hudbay's primary exposure to foreign currency risk arises from:
- Translation of Canadian dollar denominated costs and, to a lesser extent, Peruvian soles cost into US dollars. Substantially all of the Company's revenue are denominated in US dollars, while the majority of its operating costs are denominated in either the Canadian dollar or Peruvian sol. Generally, with gross profit, appreciation of the US dollar relative to the Canadian dollar will increase Hudbay's profit.
- Translation of foreign currency denominated cash, trade and other receivables, trade and other payables, as well as other financial liabilities. Appreciation of the US dollar relative to a foreign currency will decrease the net asset value of these balances once they have been translated to US dollars, resulting in foreign currency translation losses on foreign currency denominated assets and gains on foreign currency denominated liabilities.
The Manitoba and British Columbia segment's primary financial instrument foreign currency exposure is on US denominated cash, trade and other receivables and other financial liabilities. The Peru segment's primary financial instrument foreign currency exposure is on Peruvian soles cash, trade and other payables and other financial liabilities.
| HUDBAY MINERALS INC. Notes to Audited Consolidated Financial Statements (in millions of US dollars, except where otherwise noted) Years ended December 31, 2024 and 2023 |
The Company's economic exposure to foreign currency risk was as follows based on notional financial instrument amounts stated in US equivalent dollars:
| Dec. 31, 2024 | Dec. 31, 2023 | |||||||||||||||||
| CAD1 | USD2 | PEN3 | CAD1 | USD2 | PEN3 | |||||||||||||
| Cash | $ | 6.4 | $ | 13.9 | $ | 3.8 | $ | 19.0 | $ | 16.7 | $ | 2.0 | ||||||
| Trade and other receivables | 0.1 | 116.4 | 0.4 | - | 76.3 | 0.3 | ||||||||||||
| Restricted cash | 0.2 | - | - | - | - | - | ||||||||||||
| Other financial assets | 12.1 | - | - | 6.5 | - | - | ||||||||||||
| Trade and other payables | (5.7 | ) | (1.9 | ) | (15.9 | ) | (6.1 | ) | - | (21.0 | ) | |||||||
| Other financial liabilities | - | (7.3 | ) | (68.4 | ) | - | (6.7 | ) | (55.0 | ) | ||||||||
| $ | 13.1 | $ | 121.1 | $ | (80.1 | ) | $ | 19.4 | $ | 86.3 | $ | (73.7 | ) | |||||
| 1 HMI is exposed to foreign currency risk on CAD. | ||||||||||||||||||
| 2 The Manitoba and British Columbia segments are exposed to foreign currency risk on USD. | ||||||||||||||||||
| 3 The Peru segment is exposed to foreign currency risk on PEN. | ||||||||||||||||||
The following sensitivity analysis for foreign currency risk relates solely to financial instruments and non-financial derivatives that were outstanding as at the year-end date; each sensitivity calculation assumes all other variables are held constant. This analysis is based on values as at December 31, 2024 and does not reflect the overall effect that changes in market variables would have on the Company's operating results.
| December 31, 2024 | Change of: | Would have changed 2024 after-tax earnings by: |
||
| USD/CAD exchange rate1 | + 10% | $ | 6.0 | |
| USD/CAD exchange rate1 | - 10% | (7.4 | ) | |
| USD/PEN exchange rate2 | + 10% | 4.4 | ||
| USD/PEN exchange rate2 | - 10% | (6.2 | ) | |
| December 31, 2023 | Change of: | Would have changed 2023 after-tax earnings by: |
||
| USD/CAD exchange rate1 | + 10% | $ | 3.3 | |
| USD/CAD exchange rate1 | - 10% | (4.1 | ) | |
| USD/PEN exchange rate2 | + 10% | 4.4 | ||
| USD/PEN exchange rate2 | - 10% | (5.3 | ) | |
| 1 Effect on profit due to foreign currency remeasurements of balances denominated in a currency different from a Hudbay subsidiary's functional currency. | ||||
| 2 Effect on profit due to foreign currency remeasurement of balances denominated in Peruvian Sol. | ||||
Commodity price risk
Hudbay is exposed to market risk from prices for the commodities the Company produces and sells, such as copper, zinc, gold and silver. From time to time, Hudbay maintains price protection programs and conducts commodity price risk management through the use of derivative contracts. The following sensitivity analysis for commodity price risk relates solely to financial instruments and non-financial derivatives that were outstanding as at the year-end date; each sensitivity calculation assumes all other variables are held constant. This analysis is based on values as at December 31, 2024 and does not reflect the overall effect that changes in market variables would have on the Company's operating results.
| HUDBAY MINERALS INC. Notes to Audited Consolidated Financial Statements (in millions of US dollars, except where otherwise noted) Years ended December 31, 2024 and 2023 |
| December 31, 2024 | Change of: | Would have changed 2024 after-tax earnings by: |
||||
| Copper prices ($/lb)1 | + | $0.30 | $ | 3.4 | ||
| Copper prices ($/lb)1 | - | $0.30 | (3.5 | ) | ||
| Zinc prices ($/lb)2 | + | $0.10 | 0.1 | |||
| Zinc prices ($/lb)2 | - | $0.10 | (0.1 | ) | ||
| December 31, 2023 | Change of: | Would have changed 2023 after-tax earnings by: |
||||
| Copper prices ($/lb)1 | + | $0.30 | 2.6 | |||
| Copper prices ($/lb)1 | - | $0.30 | (2.0 | ) | ||
| Zinc prices ($/lb)2 | + | $0.10 | 0.1 | |||
| Zinc prices ($/lb)2 | - | $0.10 | (0.1 | ) | ||
| 1 Effect on profit due to provisional pricing derivatives (note 31c) and copper fixed for floating swaps (note 31b). | ||||||
| 2 Effect on profit due to provisional pricing derivatives (note 31c), non-hedge zinc derivatives and zinc fixed for floating swaps (note 31b). | ||||||
Share price risk
Hudbay is exposed to market risk from share prices of the Company's investments in listed Canadian metals and mining entities. These investments are made to foster strategic relationships, in connection with joint venture agreements and for investment purposes. Management monitors the value of these investments for the purposes of determining whether to add or reduce Hudbay's positions. The following sensitivity analysis of share price risk relates solely to financial instruments that were outstanding as at the year-end date. This analysis is based on values as at December 31, 2024 and does not reflect the overall effect that changes in market variables would have on the Company's finance expenses.
| December 31, 2024 | Change of: | Would have changed 2024 after-tax earnings by: |
|||
| Share prices | + | 25% | $ | 3.0 | |
| Share prices | - | 25% | (3.0 | ) | |
| December 31, 2023 | Change of: | Would have changed 2023 after-tax earnings by: |
|||
| Share prices | + | 25% | $ | 1.6 | |
| Share prices | - | 25% | (1.6 | ) | |
Interest rate risk
Hudbay is exposed to the following interest rate risks:
- cash flow interest rate risk on its cash and cash equivalents; and,
- interest rate risk on its senior secured revolving credit facilities.
The only relevant risks at December 31, 2024 is interest rate risk on cash and short-term investments. The revolving credit facilities remain undrawn as at December 31, 2024. Neither the 2026 Notes nor the 2029 Notes contain embedded derivatives that require bifurcation from the host contract.
As at December 31, 2023, the interest rate risk relates to cash on hand and the drawn balance of our revolving credit facilities Credit risk is the risk of financial loss to Hudbay if a customer or counterparty to a financial instrument fails to meet its obligations.
| HUDBAY MINERALS INC. Notes to Audited Consolidated Financial Statements (in millions of US dollars, except where otherwise noted) Years ended December 31, 2024 and 2023 |
| December 31, 2024 | Change of: | Would have changed 2024 after-tax earnings by: |
|||
| Interest rates | + | 2.00% | $ | 8.5 | |
| Interest rates | - | 2.00% | (8.5 | ) | |
| December 31, 2023 | Change of: | Would have changed 2023 after-tax earnings by: |
|||
| Interest rates | + | 2.00% | $ | 3.0 | |
| Interest rates | - | 2.00% | (3.0 | ) | |
(ii) Credit risk
The Company's maximum exposure to credit risk at the reporting date is represented by the carrying amount, net of any impairment losses recognized, of financial assets and non-financial derivative assets recorded on the consolidated balance sheets.
A large portion of Hudbay's cash are on deposit with major Schedule 1 Canadian banks. Deposits with Schedule 1 Canadian banks represented 87% of total cash as at December 31, 2024 (2023 - 62%). Hudbay's investment policy requires it to comply with a list of approved investments, concentration and maturity limits, as well as credit quality. Credit concentrations in the Company's short-term investments are monitored on an ongoing basis.
Transactions involving derivatives are with counterparties Hudbay believes to be creditworthy.
At December 31, 2024, 36% of Hudbay's trade receivables were secured by letters of credit (2023 - 76% were insured or payable by letters of credit). Any additional exposure to credit risk is monitored and approved on an ongoing basis. Expected credit losses on trade and other receivables at December 31, 2024 and December 31, 2023, are insignificant.
Two customers accounted for approximately 39% and 28% of total trade receivables as at December 31, 2024 (2023 - two customers accounted for approximately 24% and 17% of total trade receivables). Credit risk for these customers is assessed as low. As at December 31, 2024, none of the Company's trade receivables were aged more than 30 days (2023 - nil).
(iii) Liquidity risk
Liquidity risk is the risk that the Company will not be able to meet its obligations associated with financial liabilities. Hudbay's objective is to maintain sufficient liquid resources to meet operational and investing requirements.
The following summarizes the contractual undiscounted cash flows of the Company's non-derivative and derivative financial liabilities, including any interest payments, by remaining contractual maturity and financial assets used to manage liquidity risk. The table includes all instruments held at the reporting date for which payments had been contractually agreed at the reporting date. The undiscounted amounts shown are gross amounts, unless the liabilities will be settled net. Amounts in foreign currency are translated at the closing rate at the reporting date. When a counterparty has a choice of when an amount is paid, the liability is allocated to the earliest possible time period.
| HUDBAY MINERALS INC. Notes to Audited Consolidated Financial Statements (in millions of US dollars, except where otherwise noted) Years ended December 31, 2024 and 2023 |
| Dec. 31, 2024 | Carrying amount |
Contractual cash flows |
Less than 1 Year |
1 - 3 Years | 3 -5 Years | More than 5 Years |
||||||||||||
| Assets used to manage liquidity risk | ||||||||||||||||||
| Cash | $ | 541.8 | $ | 541.8 | $ | 541.8 | $ | - | $ | - | $ | - | ||||||
| Short-term investments | 40.0 | 40.0 | 40.0 | |||||||||||||||
| Collateral deposits | 0.6 | 0.6 | 0.6 | |||||||||||||||
| Restricted cash | 0.4 | 0.4 | 0.4 | - | - | - | ||||||||||||
| Trade and other receivables | 185.5 | 185.5 | 185.5 | - | - | - | ||||||||||||
| Non-hedge derivative assets | 14.3 | 14.3 | 14.3 | - | - | - | ||||||||||||
| $ | 782.6 | $ | 782.6 | $ | 782.6 | $ | - | $ | - | $ | - | |||||||
| Non-derivative financial liabilities | ||||||||||||||||||
| Trade and other payables, including embedded derivatives | $ | (255.2 | ) | $ | (255.2 | ) | $ | (255.2 | ) | $ | - | $ | - | $ | - | |||
| Agreements with communities 1 | (68.4 | ) | (99.0 | ) | (26.1 | ) | (17.0 | ) | (8.3 | ) | (47.6 | ) | ||||||
| Senior unsecured notes | (1,111.1 | ) | (1,305.7 | ) | (59.1 | ) | (654.4 | ) | (592.2 | ) | - | |||||||
| Wheaton refund liability | (7.3 | ) | (79.2 | ) | - | - | - | (79.2 | ) | |||||||||
| $ | (1,442.0 | ) | $ | (1,739.1 | ) | $ | (340.4 | ) | $ | (671.4 | ) | $ | (600.5 | ) | $ | (126.8 | ) | |
| Derivative financial liabilities | ||||||||||||||||||
| Non hedge derivative contracts | $ | (0.3 | ) | $ | (0.3 | ) | $ | (0.3 | ) | $ | - | $ | - | $ | - | |||
| $ | (0.3 | ) | $ | (0.3 | ) | $ | (0.3 | ) | $ | - | $ | - | $ | - | ||||
| 1 Represents the Peru community agreement obligation, excluding interest. | ||||||||||||||||||
| HUDBAY MINERALS INC. Notes to Audited Consolidated Financial Statements (in millions of US dollars, except where otherwise noted) Years ended December 31, 2024 and 2023 |
| Dec. 31, 2023 | Carrying amount |
Contractual cash flows |
Less than 1 Year |
1 - 3 Years | 3 - 5 Years | More than 5 Years |
||||||||||||
| Assets used to manage liquidity risk | ||||||||||||||||||
| Cash | $ | 249.8 | $ | 249.8 | $ | 249.8 | $ | - | $ | - | $ | - | ||||||
| Restricted cash | 2.0 | 2.0 | 2.0 | - | - | - | ||||||||||||
| Trade and other receivables | 176.2 | 176.2 | 176.2 | - | - | - | ||||||||||||
| Non-hedge derivative assets | 1.4 | 1.4 | 1.4 | - | - | - | ||||||||||||
| $ | 429.4 | $ | 429.4 | $ | 429.4 | $ | - | $ | - | $ | - | |||||||
| Non-derivative financial liabilities | ||||||||||||||||||
| Trade and other payables, including embedded derivatives | $ | (219.3 | ) | $ | (219.3 | ) | $ | (219.3 | ) | $ | - | $ | - | $ | - | |||
| Agreements with communities 1 | (55.0 | ) | (79.5 | ) | (20.4 | ) | (10.6 | ) | (8.1 | ) | (40.4 | ) | ||||||
| Deferred Rosemont acquisition consideration | (9.7 | ) | (10.0 | ) | (10.0 | ) | - | - | - | |||||||||
| Senior unsecured notes | (1,190.6 | ) | (1,469.6 | ) | (63.7 | ) | (714.0 | ) | (73.5 | ) | (618.4 | ) | ||||||
| Senior secured revolving credit facilities | (96.9 | ) | (120.7 | ) | (11.4 | ) | (109.3 | ) | - | - | ||||||||
| Gold prepayment obligation 2 | (55.9 | ) | (55.9 | ) | (55.9 | ) | - | - | - | |||||||||
| Wheaton refund liability | (6.7 | ) | (79.2 | ) | - | - | - | (79.2 | ) | |||||||||
| $ | (1,634.1 | ) | $ | (2,034.2 | ) | $ | (380.7 | ) | $ | (833.9 | ) | $ | (81.6 | ) | $ | (738.0 | ) | |
| Derivative financial liabilities | ||||||||||||||||||
| Non-hedge derivative contracts | $ | (11.8 | ) | $ | (11.8 | ) | $ | (11.8 | ) | $ | - | $ | - | $ | - | |||
| $ | (11.8 | ) | $ | (11.8 | ) | $ | (11.8 | ) | $ | - | $ | - | $ | - | ||||
| 1 Represents the Peru community agreement obligation, excluding interest. | ||||||||||||||||||
| 2 Discounted. | ||||||||||||||||||
32. Commitments
(a) Capital commitments
As at December 31, 2024, Hudbay had outstanding capital commitments in Manitoba of approximately $1.8 million of which $0.2 million can be terminated, approximately $15.0 million in British Columbia of which $1.4 million can be terminated, approximately $37.1 million in Peru, all of which can be terminated, and approximately $35.2 million in Arizona, primarily related to the Copper World Complex, of which none can be terminated.
(b) Non capitalized lease commitments
Hudbay has entered into various non-capitalized lease commitments for facilities and equipment. The leases expire in periods ranging from one to two years. There are no restrictions placed on the Company by entering into these leases. Future minimum lease payments under such cancellable leases recognized within results from operating activities at December 31 are:
| 2024 | 2023 | |||||
| Within one year | $ | 16.7 | $ | 20.7 | ||
| After one year but not more than five years | 7.7 | 9.5 | ||||
| More than five years | 2.9 | 4.1 | ||||
| $ | 27.3 | $ | 34.3 |
| HUDBAY MINERALS INC. Notes to Audited Consolidated Financial Statements (in millions of US dollars, except where otherwise noted) Years ended December 31, 2024 and 2023 |
(c) Contingent liabilities
Hudbay is involved in various claims, litigation and other matters arising in the ordinary course and conduct of business. While it is not possible to determine the ultimate outcome of such actions at this time, and inherent uncertainties exist in predicting such outcomes, it is Hudbay's belief that the ultimate resolution of such actions is not reasonably likely to have a material adverse effect on its consolidated financial position or results of operations. The assessment of contingencies inherently involves the exercise of significant judgement and estimates of the outcome of future events. As a result of the assessment, management believes that no significant contingent liabilities exist.
33. Related parties
(a) Group companies
The financial statements include the financial statements of the Company and the following significant subsidiaries:
| Beneficial ownership of ultimate controlling party (Hudbay Minerals Inc.) |
|||||
| Name | Jurisdiction | Business | Entity's Parent |
2024 | 2023 |
| HudBay Peru Inc. | British Columbia | Holding company | HMI | 100% | 100% |
| HudBay Peru S.A.C. | Peru | Exploration/development | HudBay Peru Inc. | 100% | 100% |
| HudBay (BVI) Inc. | British Virgin Islands | Precious metals sales | HudBay Peru Inc. | 100% | 100% |
| Hudbay Arizona Inc. | British Columbia | Holding company | HMI | 100% | 100% |
| Copper World, Inc. | Arizona | Exploration/development | HudBay Arizona (US) Holding Corporation | 100% | 100% |
| Mason Resources (US) Inc. | Nevada | Exploration/development | Hudbay Arizona (US) | 100% | 100% |
| HudBay Arizona (Barbados) SRL | Barbados | Precious metals sales | Hudbay Arizona Inc. | 100% | 100% |
| Copper Mountain Mine (BC) Ltd. | British Columbia | Exploration/development | HMI | 75% | 75% |
Transactions between the Company and its subsidiaries, which are related parties of the Company, have been eliminated on consolidation and are not disclosed in this note.
| HUDBAY MINERALS INC. Notes to Audited Consolidated Financial Statements (in millions of US dollars, except where otherwise noted) Years ended December 31, 2024 and 2023 |
(b) Compensation of key management personnel
The Company's key management includes members of the Board of Directors, Hudbay's Chief Executive Officer, Hudbay's senior vice presidents and vice presidents. Total compensation to key management personnel was as follows:
| Year ended December 31, | ||||||
| 2024 | 2023 | |||||
| Short-term employee benefits1 | $ | 11.1 | $ | 10.7 | ||
| Post-employment benefits | 0.9 | 0.8 | ||||
| Termination benefits | 0.7 | - | ||||
| Long-term share-based awards | 5.8 | 2.9 | ||||
| $ | 18.5 | $ | 14.4 | |||
1 Such as salaries and social security contributions, paid annual leave and paid sick leave, profit-sharing, termination benefits, bonuses and non-monetary benefits (such as medical care, housing, cars and free or subsidized goods or services) for current employees.
(c) Transaction with related parties
All transactions with related parties have occurred in the normal course of the Company's operations.
i. During the year ended December 31, 2024, the Company sold copper concentrate under the provision of a long-term contract with MMC for revenues totaling $274.1 million (December 31, 2023 - $165.4 million) including pricing adjustments. As at December 31, 2024, the Company had $45.3 million (December 31, 2023 - $23.1 million) of trade receivables due from MMC outstanding.
ii. During the year ended December 31, 2024 and December 31, 2023, the Company obtained cash advances on certain concentrate shipments from MMC. For the year ended December 31, 2024, interest expense on these advances amounted to $0.9 million (December 31, 2023 - $0.9 million).
iii. During the year ended December 31, 2024, the Company recorded unrealized foreign exchange losses and foreign currency translation gains on intra-group loan balances totaling $20.7 million (December 31, 2023 - nil) .
34. Supplementary cash flow information
(a) Other operating activities:
| Year ended December 31, | ||||||
| 2024 | 2023 | |||||
| Share-based compensation paid | $ | (4.5 | ) | $ | (5.8 | ) |
| Share-based compensation and change of control payments made upon acquisition of Copper Mountain | - | (6.7 | ) | |||
| Other | 0.7 | 1.5 | ||||
| $ | (3.8 | ) | $ | (11.0 | ) | |
| HUDBAY MINERALS INC. Notes to Audited Consolidated Financial Statements (in millions of US dollars, except where otherwise noted) Years ended December 31, 2024 and 2023 |
(b) Change in non-cash working capital:
| Year ended December 31, | ||||||
| 2024 | 2023 | |||||
| Change in: | ||||||
| Trade and other receivables | $ | (36.5 | ) | $ | (70.3 | ) |
| Other financial assets/liabilities | (29.4 | ) | (7.0 | ) | ||
| Inventories | 10.0 | 18.2 | ||||
| Prepaid expenses | (11.8 | ) | 16.4 | |||
| Trade and other payables | 43.2 | (31.5 | ) | |||
| Provisions and other liabilities | (0.4 | ) | (18.9 | ) | ||
| $ | (24.9 | ) | $ | (93.1 | ) | |
(c) Non-cash transactions:
During the year ended December 31, 2024 and 2023, Hudbay entered into the following non-cash investing and financing activities which are not reflected in the consolidated statements of cash flows:
- Remeasurement of Hudbay's decommissioning and restoration liabilities led to a net decrease in related property, plant and equipment assets of $4.7 million (December 31, 2023 - a net increase of $20.6 million), mainly related to changes to real discount rates associated with remeasurement of the liabilities.
- Property, plant and equipment included $25.5 million (December 31, 2023 - $21.4 million) of capital additions related to the recognition of ROU assets and $71.0 million (December 31, 2023 - nil) of capital additions related to the recognition of property, plant and equipment that has been financed. Property, plant and equipment and other assets include $18.6 million of capital additions related to agreements with communities (December 31, 2023 - $17.3 million). Property, plant and equipment as of December 31, 2023 included $14.2 million of capital additions related to exploration and evaluation assets acquired through the acquisition of Rockcliff.
| HUDBAY MINERALS INC. Notes to Audited Consolidated Financial Statements (in millions of US dollars, except where otherwise noted) Years ended December 31, 2024 and 2023 |
35. Non-Controlling Interest
As part of the British Columbia operating segment, the Company owns 75% of CMBC. The remaining 25% ownership stake is held by MMC. The continuity of non-controlling interest balance is disclosed in the consolidated statements of changes in equity.
Summarized financial information for the Copper Mountain mine on an 100% basis is as follows:
Summarized Balance Sheets
| December 31, 2024 |
December 31, 2023 |
|||||
| Assets | ||||||
| Cash and cash equivalents | $ | 12.9 | $ | 10.0 | ||
| Trade and other receivables | 44.1 | 31.2 | ||||
| Inventories - current | 37.5 | 42.1 | ||||
| Property, plant and equipment | 902.9 | 857.8 | ||||
| Other assets | 11.1 | 9.2 | ||||
| 1,008.5 | 950.3 | |||||
| Liabilities | ||||||
| Trade and other payables | 37.5 | 38.0 | ||||
| Amounts due to related parties | 422.6 | 301.6 | ||||
| Environmental and other provisions | 35.5 | 37.8 | ||||
| Lease liabilities | 20.1 | 48.9 | ||||
| Deferred tax liabilities | 119.9 | 147.3 | ||||
| Other liabilities | 68.9 | 0.8 | ||||
| 704.5 | 574.4 |
| HUDBAY MINERALS INC. Notes to Audited Consolidated Financial Statements (in millions of US dollars, except where otherwise noted) Years ended December 31, 2024 and 2023 |
Summarized statement of income and Comprehensive (Loss)/Income
| Year ended December 31, 2024 |
Year ended December 31, 2023 |
|||||
| Total revenue | $ | 274.1 | $ | 165.4 | ||
| Mine operating costs | 210.8 | 124.9 | ||||
| Depreciation and amortization | 50.1 | 11.7 | ||||
| Gross profit | 13.2 | 28.8 | ||||
| Other expenses | 20.2 | 2.3 | ||||
| Finance expense - related parties | 31.3 | 9.1 | ||||
| Other net finance costs | 16.6 | 2.8 | ||||
| Tax (recovery) expense | (19.4 | ) | 1.9 | |||
| Net (loss) income for the year | $ | (35.5 | ) | $ | 12.7 | |
| Total comprehensive (loss) income | (63.1 | ) | $ | 12.2 | ||
| 1As Copper Mountain was acquired on June 20, 2023, the results for the year ended December 31, 2023 represents the period from the acquisition date, June 20, 2023, through to the end of the fourth quarter of 2023. | ||||||
The above information is presented before inter-company eliminations.
| HUDBAY MINERALS INC. Notes to Audited Consolidated Financial Statements (in millions of US dollars, except where otherwise noted) Years ended December 31, 2024 and 2023 |
36. Segmented information
Hudbay is an integrated metals producer. When making decisions on expansions, opening or closing mines, as well as day to day operations, management evaluates the results from operating activities of the Company. Hudbay has the following reportable segments identified by the individual mining operations of Manitoba, British Columbia, Peru, as well as Arizona which holds our Copper World project. The Manitoba, British Columbia and Peru segments generate Hudbay's revenue. The Manitoba segment sells copper concentrate (containing copper, gold and silver), silver/gold doré, zinc concentrate (containing zinc and gold) and other products. The Peru segment consists of Hudbay's Constancia operation and sells copper concentrate and molybdenum concentrate. The British Columbia segment consists of the Copper Mountain operation and sells copper concentrate. Hudbay's Arizona segment consists of the Copper World project located in Arizona. Corporate and other activities include the Company's exploration activities in Chile, Canada and the State of Nevada. The exploration entities are not individually significant, as they do not meet the minimum quantitative thresholds. Corporate activities are not considered a segment and are included as a reconciliation to total consolidated results. Accounting policies for each reported segment are the same as those of the Company. Results from operating activities represents the profit earned by each segment without allocation of corporate costs. This is the measure reported to the chief operating decision-maker, Hudbay's President and Chief Executive Officer, for the purposes of resource allocation and the assessment of segment performance. Total assets and liabilities do not reflect intercompany balances, which have been eliminated on consolidation.
| Year ended December 31, 2024 | ||||||||||||||||||
| Peru | Manitoba | British Columbia |
Arizona | Corporate and other activities |
Total | |||||||||||||
| Revenue from external customers | $ | 1,049.7 | $ | 697.4 | $ | 274.1 | $ | - | $ | - | $ | 2,021.2 | ||||||
| Cost of sales | ||||||||||||||||||
| Mine operating costs | 517.4 | 312.6 | 210.8 | - | - | 1,040.8 | ||||||||||||
| Depreciation and amortization | 270.3 | 106.2 | 50.1 | - | - | 426.6 | ||||||||||||
| Gross profit | 262.0 | 278.6 | 13.2 | - | - | 553.8 | ||||||||||||
| Selling and administrative expenses | - | - | - | - | 57.0 | 57.0 | ||||||||||||
| Exploration expenses | 16.5 | 24.4 | - | - | 1.7 | 42.6 | ||||||||||||
| Other expenses | 15.7 | 15.8 | 17.1 | 8.3 | 0.5 | 57.4 | ||||||||||||
| Re-evaluation adjustment - environmental provision | - | (3.5 | ) | - | - | - | (3.5 | ) | ||||||||||
| Results from operating activities | $ | 229.8 | $ | 241.9 | $ | (3.9 | ) | $ | (8.3 | ) | $ | (59.2 | ) | $ | 400.3 | |||
| Net interest expense on long term debt | 69.8 | |||||||||||||||||
| Accretion on streaming arrangements | 24.2 | |||||||||||||||||
| Change in fair value of financial instruments | 16.6 | |||||||||||||||||
| Other net finance costs | 38.1 | |||||||||||||||||
| Income before tax | 251.6 | |||||||||||||||||
| Tax expense | 183.8 | |||||||||||||||||
| Net income for the year | $ | 67.8 | ||||||||||||||||
| HUDBAY MINERALS INC. Notes to Audited Consolidated Financial Statements (in millions of US dollars, except where otherwise noted) Years ended December 31, 2024 and 2023 |
| Year ended December 31, 2023 | ||||||||||||||||||
| Peru | Manitoba | British Columbia |
Arizona | Corporate and other activities |
Total | |||||||||||||
| Revenue from external customers | $ | 1,040.3 | $ | 484.3 | $ | 165.4 | $ | - | $ | - | $ | 1,690.0 | ||||||
| Cost of sales | ||||||||||||||||||
| Mine operating costs | 494.5 | 286.4 | 124.9 | - | - | 905.8 | ||||||||||||
| Depreciation and amortization | 275.7 | 104.3 | 11.7 | - | - | 391.7 | ||||||||||||
| Gross profit | 270.1 | 93.6 | 28.8 | - | - | 392.5 | ||||||||||||
| Selling and administrative expenses | - | - | - | - | 39.2 | 39.2 | ||||||||||||
| Exploration expenses | 15.2 | 8.2 | 3.4 | - | 2.5 | 29.3 | ||||||||||||
| Other expenses (income) | 17.4 | 18.0 | (0.1 | ) | 0.4 | 2.6 | 38.3 | |||||||||||
| Re-evaluation adjustment - environmental provision | - | (13.8 | ) | 2.4 | - | - | (11.4 | ) | ||||||||||
| Results from operating activities | $ | 237.5 | $ | 81.2 | $ | 23.1 | $ | (0.4 | ) | $ | (44.3 | ) | $ | 297.1 | ||||
| Net interest expense on long term debt | 76.2 | |||||||||||||||||
| Accretion on streaming arrangements | 26.3 | |||||||||||||||||
| Change in fair value of financial instruments | 14.0 | |||||||||||||||||
| Other net finance costs | 28.8 | |||||||||||||||||
| Income before tax | 151.8 | |||||||||||||||||
| Tax expense | 82.3 | |||||||||||||||||
| Net income for the year | $ | 69.5 | ||||||||||||||||
| December 31, 2024 | ||||||||||||||||||
| Peru | Manitoba | British Columbia |
Arizona | Corporate and other activities |
Total | |||||||||||||
| Total assets | $ | 2,410.0 | $ | 547.4 | $ | 1,076.0 | $ | 757.3 | $ | 696.9 | $ | 5,487.6 | ||||||
| Total liabilities | 960.0 | 421.3 | 281.9 | 14.7 | 1,162.3 | 2,840.2 | ||||||||||||
| Property, plant and equipment1 | 1,897.1 | 595.1 | 900.7 | 747.1 | 41.4 | 4,181.4 | ||||||||||||
| Other Non-Current Assets2 | 47.8 | 17.2 | 8.0 | 0.2 | 0.6 | 73.8 | ||||||||||||
| 1Included in Corporate and Other activities is $27.7 million of property, plant and equipment that is located in Nevada. | ||||||||||||||||||
| 2Other non-current assets includes receivables, inventory, intangibles and other assets. | ||||||||||||||||||
| December 31, 2024 | ||||||||||||||||||
| Peru | Manitoba | British Columbia |
Arizona | Corporate and other activities |
Total | |||||||||||||
| Additions to property, plant and equipment | $ | 177.8 | $ | 63.3 | $ | 214.9 | $ | 30.2 | $ | - | $ | 486.2 | ||||||
| HUDBAY MINERALS INC. Notes to Audited Consolidated Financial Statements (in millions of US dollars, except where otherwise noted) Years ended December 31, 2024 and 2023 |
| December 31, 2023 | ||||||||||||||||||
| Peru | Manitoba | British Columbia |
Arizona | Corporate and other activities |
Total | |||||||||||||
| Total assets | $ | 2,406.2 | $ | 672.9 | $ | 1,028.0 | $ | 736.7 | $ | 468.8 | $ | 5,312.6 | ||||||
| Total liabilities | 1,086.2 | 413.3 | 276.7 | 23.5 | 1,306.1 | 3,105.8 | ||||||||||||
| Property, plant and equipment1 | 2,001.7 | 693.9 | 853.1 | 727.9 | 39.4 | 4,316.0 | ||||||||||||
| Other Non-Current Assets2 | 64.8 | 17.0 | 6.1 | 0.3 | 0.8 | 89.0 | ||||||||||||
1Included in Corporate and Other activities is $27.6 million of property, plant and equipment that is located in Nevada.
2Other non-current assets includes receivables, inventory, intangibles and other assets.
| December 31, 2023 | ||||||||||||||||||
| Peru | Manitoba | British Columbia |
Arizona | Corporate and other activities |
Total | |||||||||||||
| Additions to property, plant and equipment | $ | 160.9 | $ | 90.6 | $ | 50.1 | $ | 22.3 | $ | - | $ | 323.9 | ||||||
| HUDBAY MINERALS INC. Notes to Audited Consolidated Financial Statements (in millions of US dollars, except where otherwise noted) Years ended December 31, 2024 and 2023 |
Geographical Segments
The following tables represent revenue information regarding Hudbay's geographical segments for the years ended December 31, 2024 and 2023:
| 2024 | 2023 | |||||
| Revenue by customer location 1 | ||||||
| China | 755.0 | 282.2 | ||||
| Canada | $ | 741.1 | $ | 501.2 | ||
| Japan | 274.1 | 203.3 | ||||
| India | 82.0 | - | ||||
| United States | 67.4 | 30.1 | ||||
| Philippines | 63.9 | 20.7 | ||||
| South Korea | 23.0 | 27.6 | ||||
| Switzerland | 13.6 | 268.2 | ||||
| Belgium | 1.1 | 79.1 | ||||
| Hong Kong | - | 176.7 | ||||
| Singapore | - | 53.6 | ||||
| Peru | - | 44.4 | ||||
| Chile | - | 2.9 | ||||
| $ | 2,021.2 | $ | 1,690.0 |
1 Presented based on the ultimate destination of the product if known. If the eventual destination of the product sold through traders is not known then revenue is allocated to the location of the customer's business office and not the ultimate destination of the product.
During the year ended December 31, 2024, six customers accounted for approximately 24%, 14%, 9%, 8%, 7% and 6%, respectively, of total revenue during the year. Revenue from these customers has been presented in the Manitoba, British Columbia and Peru operating segments.
During the year ended December 31, 2023, five customers accounted for approximately 20%, 11%, 10%, 9%, and 7% respectively, of total revenue during the year. Revenue from these customers has been presented in the Manitoba, British Columbia and Peru operating segments.

Management's Discussion and Analysis of
Results of Operations and Financial Condition
For the year ended
December 31, 2024
February 18, 2025
INTRODUCTION
This Management's Discussion and Analysis ("MD&A") dated February 18, 2025 is intended to supplement Hudbay Minerals Inc.'s audited consolidated financial statements and related notes for the year ended December 31, 2024 and 2023 (the "consolidated financial statements"). The consolidated financial statements have been prepared in accordance with IFRS® Accounting Standards ("IFRS" or "GAAP") as issued by the International Accounting Standards Board ("IASB").
References to "Hudbay", the "Company", "we", "us", "our" or similar terms refer to Hudbay Minerals Inc. and its direct and indirect subsidiaries as at December 31, 2024.
Readers should be aware that:
- This MD&A contains certain "forward-looking statements" and "forward-looking information" (collectively, "forward-looking information") that are subject to risk factors set out in a cautionary note contained in our MD&A.
- This MD&A includes information with respect to Hudbay's acquisition of Copper Mountain, which was completed on June 20, 2023, including the results of the Copper Mountain mine's operations from the date of acquisition, June 20, 2023.
- This MD&A has been prepared in accordance with the requirements of the securities laws in effect in Canada, which may differ materially from the requirements of United States securities laws applicable to US issuers.
- We use a number of non-GAAP financial performance measures in our MD&A, which do not have standardized meaning under IFRS. For further information and detailed reconciliations of such measures, please see the discussion under the "Non-GAAP Financial Performance Measures" section herein.
- The technical and scientific information in this MD&A has been approved by qualified persons based on a variety of assumptions and estimates. Please see the discussion under the "Qualified Person and NI 43-101" section herein.
Readers are also urged to review the "Notes to Reader" section beginning on page 75 of this MD&A.
Additional information regarding Hudbay, including the risks related to our business and those that are reasonably likely to affect our consolidated financial statements in the future, is contained in our continuous disclosure materials, including our most recent AIF, consolidated financial statements and Management Information Circular available on SEDAR+ at www.sedarplus.ca and on EDGAR at www.sec.gov.
All amounts are in US dollars unless otherwise noted.
OUR BUSINESS
We are a copper-focused critical minerals company with three long-life operations and a world-class pipeline of copper growth projects in tier-one mining jurisdictions of Canada, Peru and the United States. Hudbay's operating portfolio includes the Constancia mine in Cusco (Peru), the Snow Lake operations in Manitoba (Canada) and the Copper Mountain mine in British Columbia (Canada). Copper is the primary metal produced by the company, which is complemented by meaningful gold production and by-product zinc, silver and molybdenum. Hudbay's growth pipeline includes the Copper World project in Arizona (United States), the Mason project in Nevada (United States), the Llaguen project in La Libertad (Peru) and several expansion and exploration opportunities near its existing operations. We are governed by the Canada Business Corporations Act and our shares are listed under the symbol "HBM" on the Toronto Stock Exchange, New York Stock Exchange and Bolsa de Valores de Lima.
OUR PURPOSE
We care about our people, our communities and our planet. Hudbay provides the metals the world needs. We work sustainably, transform lives and create better futures for communities.
We transform lives: We invest in our employees, their families and local communities through long-term employment, local procurement and economic development to improve their quality of life and ensure the communities benefit from our presence.
We operate responsibly: From exploration to closure, we operate safely and responsibly, we welcome innovation and we strive to minimize our environmental footprint while following leading operating practices in all facets of mining.
We provide critical metals: We produce copper and other metals needed for everyday products and essential for applications to support the energy transition toward a more sustainable future.
OUR STRATEGY
Our mission is to create sustainable value and strong returns by leveraging our core strengths in community relations, focused exploration, mine development and efficient operations.
We believe that copper is the commodity with the best long-term supply/demand fundamentals and offers shareholders the greatest opportunity for sustained risk-adjusted returns. Copper is essential for achieving energy transition and AI technology needs - it is one of the most heavily utilized metals in renewable energy systems and is a key component for power networks, circuit boards and cooling systems in data processing centres. Through the discovery and successful development of economic mineral deposits, and through highly efficient low-cost operations to extract the metals, we believe sustainable value will be created for all stakeholders.
Hudbay's successful development, ramp-up and operation of the Constancia open-pit mine in Peru, our long history of underground mining and full life-cycle experience in northern Manitoba, our track record of reserve expansion through effective exploration, and our organic pipeline of copper development projects including Copper World and Mason provide us with a competitive advantage to deliver sustainable value relative to other mining companies of similar scale.
Over the past decade, we have built a world-class asset portfolio by executing a consistent long-term growth strategy focused on copper. We continuously work to generate strong free cash flow and optimize the value of our producing assets through exploration, brownfield expansion projects and efficient and safe operations. Furthermore, we intend to sustainably grow Hudbay through the exploration and development of our robust project pipeline, as well as through the acquisition of other properties that fit our stringent strategic criteria.
To ensure that any investment in our existing assets or acquisition of other mineral assets is consistent with our purpose and mission, we have established a number of criteria for evaluating these opportunities. The criteria include the following:
- Sustainability: We are focused on jurisdictions that support responsible mining activity. Our current geographic focus is on select investment grade countries in the Americas, with strong rule of law and respect for human rights consistent with our long-standing focus on environmental, social and governance ("ESG") principles;
- Copper Focus: We believe copper is the commodity with the best long-term supply/demand fundamentals. Global copper mine supply is challenged due to declining industry grades, limited exploration success and an insufficient pipeline of development-ready projects while demand will continue to increase through global decarbonization initiatives and the rapid growth in AI data processing centres. We believe this long-term supply/demand gap will create opportunities for increased risk-adjusted returns. While our primary focus is on copper, we recognize and value the polymetallic nature of copper deposits and, in particular, the counter-cyclical nature of gold in our portfolio;
- Quality: We are focused on investing in long-life, low-cost, expandable, high-quality assets that can capture peak pricing of multiple commodity price cycles and can generate free cash flow through the troughs of price cycles;
- Potential: We consider the full spectrum of acquisition and investment opportunities, from early-stage exploration to producing assets, that offer significant incremental potential for exploration, development, expansion and optimization beyond the stated resources and mine plan;
- Process: We develop a clear understanding of how an investment or acquisition can create value through our robust due diligence and capital allocation process that applies our technical, social, operational and project execution expertise;
- Operatorship: We believe value is created through leveraging Hudbay's competitive advantages in safe and efficient operations and effective exploration and project development and community relations. While operatorship is a key criterion, we are open to joint ventures and partnerships that de-risk our portfolio and increase risk-adjusted returns; and
- Capital Allocation: We pursue investments and acquisitions that are accretive to Hudbay on a per share basis. Given that our strategic focus includes allocating capital to assets at various stages of development, when evaluating accretion, we will consider measures such as internal rate of return ("IRR"), return on invested capital ("ROIC"), net asset value per share and the contained value of reserves and resources per share.
Our key objectives for 2025 are to:
- Deliver strong copper and gold production levels from diversified operating platform;
- Maintain strong operating cost performance, achieving industry-leading margins;
- Generate strong cash flow to further enhance Hudbay's financial position to reinvest in high-return brownfield projects and unlock industry-leading copper growth pipeline;
- Maintain focus on financial discipline with stringent capital allocation criteria to guide discretionary spending and generate strong returns on invested capital;
- Maintain record performance at our New Britannia mill and continuous improvement initiatives throughout our Snow Lake operations;
- Implement mill optimization projects at Copper Mountain to drive improved operating performance;
- Evaluate the potential to increase mill throughput at Constancia with the installation of a pebble crusher;
- Advance the Copper World project through definitive feasibility studies and the remaining elements of the three pre-requisites plan required for sanctioning, including a potential joint venture partnership;
- Drill the 1901 deposit from the new underground access drift to test for gold and copper extensions and upgrade resources;
- Advance plans to drill the prospective Maria Reyna and Caballito properties near Constancia;
- Execute extensive exploration program on the large land package in Snow Lake to target new discoveries to utilize excess capacity at the Stall mill and further enhance production;
- Advance economic studies for the reprocessing of Flin Flon tailings;
- Explore for new discoveries within trucking distance of the Flin Flon processing facilities as part of the exploration partnership with Marubeni;
- Continue to identify and evaluate opportunities to further reduce greenhouse gas emissions and update corporate targets based on further studies and the Copper Mountain acquisition;
- Assess growth opportunities that meet our stringent strategic criteria and allocate capital to pursue those opportunities that create sustainable value for the company and our stakeholders; and
- As always, continue to operate safely and sustainably, aligned with our company purpose to ensure that our activities have a positive impact on our people, our communities and our planet.
SUMMARY
Delivered Record Annual Results, Led by Record Gold Production from Manitoba Operations and Record Revenues; 2024 Consolidated Production and Cost Guidance Achieved
- Achieved record annual revenue of $2,021.2 million and record annual adjusted EBITDA1 of $822.5 million.
- Enhanced operating platform achieved 2024 consolidated production guidance for all metals with record gold production exceeding the top end of the 2024 guidance range. Full-year consolidated copper production of 137,943 tonnes, gold production of 332,240 ounces and silver production of 3,983,851 ounces increased by 5%, 7% and 11% respectively, compared to full year 2023.
- Significantly outperformed our twice-improved 2024 consolidated cash cost guidance. Strong cost control and meaningful exposure to gold by-product credits resulted in better-than-expected consolidated 2024 cash cost1 and sustaining cash cost1 per pound of copper produced, net of by-product credits, of $0.46 and $1.62, respectively, an improvement of 43% and 6%, respectively, compared to 2023.
- Peru full year copper production was within the 2024 guidance range while gold production exceeded the top end of guidance as additional gold benches were prioritized in the fourth quarter. Peru full year cash costs of $1.18 per pound outperformed the 2024 annual guidance range.
- Manitoba full year gold production of 214,225 ounces exceeded the top end of the 2024 guidance range of 170,000 to 200,000 ounces. Manitoba full year cash costs of $606 per ounce outperformed the lower end of 2024 annual guidance range of $700 to $900 per ounce.
- British Columbia full year copper production was below the low end of the 2024 guidance range, as expected, while full year gold production was in line with the 2024 annual guidance range. Copper production was lower than the guidance range as a result of lower grades in stockpiled ore and lower mill throughput during the ramp-up of stabilization and optimization efforts throughout the year. British Columbia continues to advance mill optimization initiatives with the goal to achieve higher mill throughput in 2025.
- Cash and cash equivalents and short-term investments increased by $332.0 million to $581.8 million during 2024 due to a successful equity offering and strong operating cash flows bolstered by higher copper and gold prices, which enabled a $512.0 million reduction in net debt1 during 2024.
Delivered Strong Fourth Quarter Operating and Financial Results
- Fourth quarter consolidated copper production of 43,262 tonnes was in line with quarterly production cadence expectations and increased 38% from the third quarter of 2024. Consolidated gold production of 94,161 ounces significantly exceeded expectations and represented an increase of 6% from the strong levels achieved in the third quarter of 2024.
- Strong operating cost performance with consolidated cash cost1 and sustaining cash cost1 per pound of copper produced, net of by-product credits1, in the fourth quarter of 2024 of $0.45 and $1.37, respectively, representing another quarter of industry-leading cost performance.
- Peru operations continued to benefit from strong and consistent mill throughput, achieving averages of approximately 87,000 tonnes per day in the fourth quarter, despite a planned semi-annual mill maintenance shutdown. The on-time completion of the Pampacancha stripping program contributed to higher grade ore during the fourth quarter. Peru operations produced 33,988 tonnes of copper and 38,079 ounces of gold in the fourth quarter of 2024, in line with quarterly cadence expectations. Peru cash cost per pound of copper produced, net of by-product credits1, was $1.00 in the fourth quarter, demonstrating continued strong cost performance.
- Manitoba operations produced 51,438 ounces of gold in the fourth quarter of 2024, significantly exceeding management's expectations in both production and efficiency. Manitoba cash cost per ounce of gold produced, net of by-product credits1, was $607 during the fourth quarter, reflecting better-than-expected operating performance and continued strong operating cost margins.
- British Columbia operations produced 5,927 tonnes of copper at a cash cost per pound of copper produced, net of by-product credits1, of $3.00 in the fourth quarter of 2024, reflecting reduced mill throughput versus the third quarter of 2024 as a result of ramp-up periods following mill maintenance shutdowns during the quarter.
- Achieved revenue of $584.9 million and operating cash flow before change in non-cash working capital of $231.5 million in the fourth quarter of 2024, a 20% and 24% increase, respectively, from the third quarter of 2024. Strong financial results were driven by higher realized gold prices as well as strong copper production in Peru, while delivering on higher grades, throughput and cost control initiatives across all business units.
- Fourth quarter net earnings attributable to owners and earnings per share attributable to owners were $21.2 million and $0.05, respectively. After adjusting for items on a pre-tax basis such as a non-cash $17.4 million foreign exchange loss, a $14.1 million write-down of PP&E, a $10.3 million mark-to-market revaluation gain on various instruments such as unrealized strategic copper hedges, investments and share-based compensation, and a non-cash loss of $2.5 million related to a quarterly revaluation of our closed site environmental reclamation provision, among other items, fourth quarter adjusted earnings1 per share attributable to owners was $0.18.
- Adjusted EBITDA1 was $257.3 million during the fourth quarter of 2024, a 25% increase compared to the third quarter of 2024.
- Financial results in the fourth quarter would have been even higher if excess copper inventory in Peru at the end of December 2024 was sold. A total of approximately 30,000 wet metric tonnes of copper concentrate was unsold at the end of December, compared to normal levels of 15,000 wet metric tonnes. The excess copper concentrate inventory in Peru is expected to be sold in the first quarter of 2025.
Achieved Significant Debt Reduction and Transformed Balance Sheet
- Hudbay's unique copper and gold diversification in Peru and Canada provides exposure to higher copper and gold prices and attractive free cash flow generation.
- While the majority of revenues continue to be derived from copper production, gold represented an increasing portion of total revenues at 35% in 2024 compared to 29% in 2023, which was driven by high gold prices and record gold production in Manitoba.
- Impressive operating cash flow and free cash flow generation in 2024 reflects continued strong copper and gold production in Peru and higher gold production from Manitoba following the full repayment of our gold prepayment liability in August 2024, as well as operating cash flow contributions from British Columbia.
- Strong operating cash flow generation and the net proceeds from the equity offering in May 2024 allowed the Company to significantly deleverage and transform the balance sheet with $245 million of combined debt repayments and gold prepayment liability reductions in 2024.
- Further reduced net debt1 to $525.7 million in the fourth quarter of 2024, representing the fourth consecutive quarter of lower net debt as a result of deleveraging efforts and capitalizing on strong operating cash flow generation.
- Record annual adjusted EBITDA1 of $822.5 million in 2024 was a substantial increase from $647.8 million in 2023.
- The increase in cash and reduction in long-term debt significantly reduced our net debt to adjusted EBITDA ratio1 to 0.6x at the end of 2024 compared to 1.6x at the end of 2023, well within the targeted 1.2x net debt to adjusted EBITDA ratio outlined in our three prerequisites plan (the "3-P plan") for advancing Copper World, and transforming Hudbay from one of the highest leverage positions to the lowest leverage position among industry peers .
- In November 2024, further improved long-term balance sheet resilience with a proactive three-year extension of the Company's senior secured revolving credit facilities from October 2025 to November 2028. The extended credit facilities provide increased financial flexibility to accretively maintain the 4.50% coupon 2026 senior unsecured notes outstanding to maturity and advance Copper World towards a sanctioning decision in accordance with the 3-P plan. The $450 million revolving credit facilities include an improved pricing grid reflecting the enhanced financial position of Hudbay and feature an opportunity to increase the facility by an additional $150 million at Hudbay's discretion during the four-year tenor, providing additional financial flexibility.
- Total liquidity substantially increased by 76% to $1,007.8 million at the end of 2024 from $573.7 million at the end of 2023.
Advancing Growth Initiatives to Further Enhance Copper and Gold Exposure
- Received all major permits required for the development and operation of Copper World with the receipt of the Air Quality Permit in January 2025 and the Aquifer Protection Permit in August 2024. Copper World is now the highest grade and lowest capital intensity fully permitted copper project in the Americas.
- Continuing to progress the 3-P plan for Copper World in 2025 with definitive feasibility study activities and minority joint venture partner process underway.
- The successful completion of the planned stripping program at Pampacancha in September unlocked significantly higher copper and gold grades in the fourth quarter of 2024, which together with maintaining strong operating performance at Constancia has generated meaningful free cash flow in Peru.
- The New Britannia mill continued to exceed throughput expectations, driving continued strong gold production and free cash flow generation in Manitoba. The New Britannia mill achieved throughput levels of approximately 2,020 tonnes per day in the fourth quarter, exceeding its original design capacity of 1,500 tonnes per day and its 2024 budgeted capacity of 1,800 tonnes per day due to the successful implementation of process improvement initiatives and effective preventative maintenance measures. After three years of operations, a post-project review of the New Britannia refurbishment investment has increased the unlevered IRR to 36% from 19% at project sanction in 2020.
- We have successfully implemented post-acquisition plans to stabilize the Copper Mountain operations through mining fleet ramp-up activities and increased mill reliability and performance. Efforts are now focused on optimizing the operations in 2025 through execution of the planned accelerated stripping program and mill throughput improvement projects.
- Drill permitting for highly prospective Maria Reyna and Caballito properties near Constancia continues to advance through the multi-step regulatory process with the conclusion of the process expected in 2025.
- The development of an access drift to the 1901 deposit in Snow Lake is progressing well and first ore mining is expected in the second quarter of 2025 to enable confirmation of the optimal mining method for the deposit. Underground step-out drilling to-date has intersected copper-gold mineralization and additional drilling is planned for 2025. The development of an adjacent haulage drift has been initiated to de-risk planned full production in 2027.
- Large 2024 exploration program in Snow Lake continued testing targets near Lalor and regional satellite properties throughout the winter months with encouraging results. 2025 exploration plans include a large geophysics program and follow-up drilling at Lalor Northwest located 400 metres from Lalor's underground infrastructure, along with the testing of a deep geophysical target at the Cook Lake North property.
- Continuing to advance Flin Flon tailings reprocessing opportunities through metallurgical test work and early economic evaluation to assess the possibility of producing critical minerals and precious metals while reducing the environmental footprint.
2025 Guidance Reflects Stable Copper and Gold Production at Industry-leading Margins
- Consolidated copper production of 133,000 tonnes, based on the midpoint of the 2025 guidance range, is expected to remain stable with 2024 levels, reflecting higher expected production in British Columbia as mill throughput optimization plans are implemented, offset by a lower portion of ore feed from the high-grade Pampacancha satellite deposit in Peru.
- Consolidated gold production of 277,750 ounces, based on the midpoint of the 2025 guidance range, is expected to be lower than 2024 production, reflecting a lower portion of ore feed from Pampacancha in 2025 and the accelerated mining of high-grade gold benches in late 2024, partially offset by continued strong gold production in Manitoba.
- Consolidated cash cost, net of by-product credits, in 2025 is expected to be within $0.80 to $1.00 per pound as we continue to focus on maintaining strong cost control across the business, driving industry-leading margins.
- Total sustaining capital expenditures are expected to be $365 million in 2025, reflecting some deferrals from 2024 and higher sustaining spending at the operations.
- Total growth capital expenditures are expected to be $205 million in 2025 as we reinvest in several high-return growth projects in 2025 to deliver increased copper exposure. This includes $55 million for mill throughput improvement projects in British Columbia, $25 million for mill throughput improvement projects in Peru, and $65 million for Copper World de-risking activities and feasibility studies.
- Exploration expenditures are expected to total $40 million in 2025 as we continue to execute our large multi-year exploration program in the Snow Lake region, which continues to be partially funded by critical minerals premium flow-through financing that was completed in the fourth quarter.
Summary of Fourth Quarter Results
Cash generated from operating activities of $238.1 million increased by $92.1 million in the fourth quarter of 2024 compared to the third quarter of 2024, and was higher by $9.1 million compared to the fourth quarter of 2023. Operating cash flow before change in non-cash working capital was $231.5 million during the fourth quarter of 2024, reflecting an increase of $45.4 million from the third quarter of 2024 and a decrease of $15.0 million compared to the fourth quarter of 2023. The increase compared to the third quarter of 2024 reflects higher copper and gold sales volumes driven by higher grades in Peru and continued strong gold production in Manitoba. The decrease compared to the fourth quarter of 2023 was primarily the result of lower copper sales volumes in Peru due to higher unsold copper concentrate inventory levels at year end 2024 as a result of a strong ramp-up of production of higher grade ore during the quarter. In addition, operating cash flow was impacted by lower copper production from Copper Mountain due to planned and unplanned maintenance activities at the mill. This was partially offset by strong operational cost performance across the business and higher realized metal prices.
Consolidated copper production of 43,262 tonnes in the fourth quarter of 2024 was in line with quarterly production cadence and represented a significant increase of 38% from the third quarter of 2024. Consolidated gold production of 94,161 ounces significantly exceeded expectations and represented an increase of 6% from the third quarter of 2024. Consolidated copper and gold production in the fourth quarter of 2024 decreased by 5% and 17%, respectively, compared to the same period in 2023 primarily due to lower gold production and lower planned ore grades in Peru and Manitoba as well as lower copper production at Copper Mountain due to mill maintenance. Consolidated silver and zinc production in the fourth quarter of 2024 increased by 10% and 46%, respectively compared to the same period in 2023 primarily due to higher grades and higher throughput in Peru, as we completed planned stripping activities.
Net earnings attributable to owners in the fourth quarter of 2024 was $21.2 million, or $0.05 per share, compared to $30.7 million, or $0.10 per share, in the fourth quarter of 2023. The fourth quarter of 2024 was impacted by various non-cash charges for foreign exchange losses, write-offs of previously capitalized PP&E and revaluation of share-based compensation due to a higher share price.
Adjusted net earnings attributable to owners1 and adjusted net earnings per share attributable to owners1 in the fourth quarter of 2024 were $70.3 million and $0.18 per share, respectively, after adjusting for items on a pre-tax basis such as a non-cash $17.4 million foreign exchange loss, a $14.1 million write-down of PP&E, a $10.3 million mark-to-market revaluation gain on various instruments such as unrealized strategic copper hedges, investments and stock based compensation, and a non-cash loss of $2.5 million related to a quarterly revaluation of our closed site environmental reclamation provision, among other items. This compares to adjusted net earnings attributable to owners1 and net earnings per share attributable to owners1 of $68.9 million and $0.20 per share in the same period of 2023.
Fourth quarter adjusted EBITDA1 was $257.3 million, a 25% increase compared to $206.2 million in the third quarter of 2024 as higher copper and gold grades led to increased sales volumes. Fourth quarter adjusted EBITDA declined by 6% compared to $274.4 million in the fourth quarter of 2023 as a result of the aforementioned lower copper and gold sales volumes. In addition, in Peru copper concentrate inventory levels totaled approximately 30,000 wet metric tonnes at the end of the quarter, higher than normal levels of 15,000 wet metric tonnes were unsold at the end of the quarter because of the strong production ramp-up late in the year. The excess copper concentrate in Peru is expected to be sold in the first quarter of 2025.
In the fourth quarter of 2024, consolidated cash cost per pound of copper produced, net of by-product credits1, was $0.45 compared to $0.18 in the third quarter of 2024, as higher production more than offset higher mining, milling and G&A costs in the fourth quarter, but by-product credits were lower on a per pound basis. Fourth quarter consolidated cash cost per pound of copper, net of by-product credits1 increased compared to $0.16 in the same period in 2023. This increase was mainly the result of higher mining, milling and G&A costs as well as lower copper production.
Consolidated sustaining cash cost per pound of copper produced, net of by-product credits1, was $1.37 in the fourth quarter of 2024 compared to $1.71 in the third quarter of 2024, with the decrease is driven by strong cost control and lower sustaining capital expenditures in the fourth quarter. Fourth quarter consolidated sustaining cash cost per pound of copper produced, net of by-product credit1, was higher compared to $1.09 in the same period in 2023. This increase was primarily due to the same reasons outlined above, partially offset by lower sustaining capital expenditures.
Consolidated all-in sustaining cash cost per pound of copper produced, net of by-product credits1, was $1.53 in the fourth quarter of 2024, lower than $1.95 in the third quarter of 2024 mainly due to the same reason outlined above as well as lower corporate G&A and regional costs in the fourth quarter. Fourth quarter consolidated all-in sustaining cash cost per pound of copper produced, net of by-product credits1, was higher than $1.31 in the same period in 2023 due to the same reasons outlined above.
As at December 31, 2024, total liquidity was $1,007.8 million, including $541.8 million in cash and cash equivalents, $40.0 million in short-term investments as well as undrawn availability of $426.0 million under our revolving credit facilities. Net debt1 declined to $525.7 million at the end of 2024 compared to $1,037.7 million at the end of 2023. We expect that our current liquidity together with cash flows from operations will be sufficient to meet our liquidity needs for the next year.
Summary of Full Year Results
We achieved our 2024 consolidated production guidance for all metals and significantly exceeded our 2024 production guidance for gold. On a business unit stand-alone basis, Peru exceeded the top end of the gold production guidance and achieved the guidance ranges for all other metals. Manitoba exceeded the top end of the gold and copper guidance ranges and achieved the guidance ranges for all other metals. In British Columbia production of gold was within the guidance range, whereas copper production was below the low end of guidance range as a result of lower grades in stockpiled ore and reduced throughput during the mill stabilization period.
Consolidated copper, gold and silver production for the full year 2024 increased by 5%, 7% and 11%, respectively, compared to the same period in 2023 primarily due to the incremental production from Copper Mountain and higher throughput and operating performance in Manitoba.
Cash generated from operating activities increased to $666.2 million in 2024 from $476.9 million in 2023. Operating cash flow before change in non-cash working capital increased to a record $691.1 million in 2024 from $570.0 million in 2023. The increase in operating cash flow before changes in working capital was primarily the result of higher metal prices and gold sales volumes, as well as the incremental contribution margin from the Copper Mountain mine. This was partially offset by a significant increase in cash taxes paid of $132.5 million, compared to $54.8 million in 2023 mainly at our Peru operations.
Net earnings attributable to owners for 2024 was $76.7 million, or $0.20 per share, compared to $66.4 million, or $0.22 per share, in 2023. Full year 2024 net earnings were positively impacted by increases in sales volumes and higher realized prices for all metals, partially offset by various non-cash charges related to foreign exchange losses, write-offs of previously capitalized PP&E, mark-to-market revaluation losses on various instruments such as unrealized strategic copper hedges, investments and share-based compensation and higher mining and income tax expenses.
Adjusted net earnings attributable to owners1 and adjusted net earnings per share attributable to owners1 for 2024 were $181.4 million and $0.48 per share, respectively, after adjusting for items on a pre-tax basis such as a $27.4 million write-down of PP&E, a $27.1 million mark-to-market revaluation loss on various instruments such as the gold prepayment liability, unrealized strategic copper and gold hedges, investments and stock based compensation, a non-cash $21.0 million foreign exchange loss and a non-cash gain of $3.5 million related to the revaluation of our closed site environmental reclamation provision, among other items. This compares to adjusted net earnings attributable to owners1 and net earnings per share attributable to owners1 of $69.0 million and $0.23 per share in the same period of 2023.
Adjusted EBITDA1 was $822.5 million in 2024, a 27% increase compared to $647.8 million in 2023. The increase is the result of higher realized metal prices and higher sales volumes during the year.
Consolidated cash cost per pound of copper produced, net of by-product credits1, was $0.46, compared to $0.80 in 2023 which outperformed our twice-improved 2024 annual cost guidance. The improvement was mainly the result of higher copper production and higher gold by-product credits, partially offset by higher mining, milling and G&A costs. Consolidated sustaining cash cost per pound of copper produced, net of by-product credits1, of $1.62 in 2024 decreased from $1.72 in 2023 due to the same reasons outlined above partially offset by higher cash sustaining capital expenditures.
Consolidated all-in sustaining cash cost per pound of copper produced, net of by-product credits1, was $1.88 in 2024, slightly lower than $1.92 in 2023 as a result of the same reasons outlined above partially offset by higher corporate selling and administrative costs primarily due to a revaluation of share-based compensation associated with a higher share price.
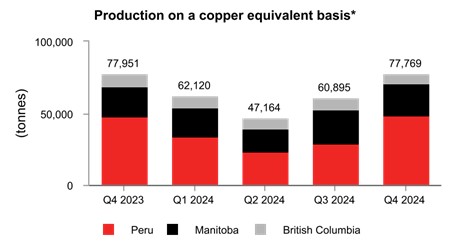
*Copper equivalent production is calculated using the quarter average LME prices for each metal.
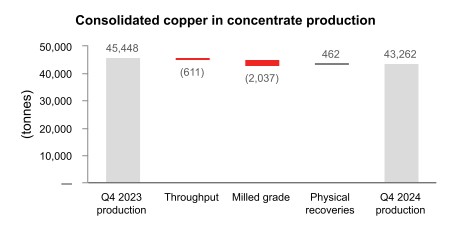
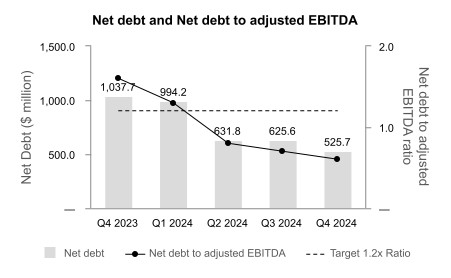
|
|
1 Adjusted net earnings (loss) - attributable to owners and adjusted net earnings (loss) per share - attributable to owners, adjusted EBITDA, cash cost, sustaining cash cost, all-in sustaining cash cost per pound of copper produced, net of by-product credits, cash cost, sustaining cash cost per ounce of gold produced, net of by-product credits, combined unit cost, net debt and net debt to adjusted EBITDA ratio are non-GAAP financial performance measures with no standardized definition under IFRS. For further information and a detailed reconciliation, please see the discussion under the "Non-GAAP Financial Performance Measures" section of this MD&A.
KEY FINANCIAL RESULTS
| Financial Condition | ||||||
| (in $ millions, except net debt to adjusted EBITDA ratio) | Dec. 31, 2024 | Dec. 31, 2023 | ||||
| Cash and cash equivalents and short-term investments | $ | 581.8 | $ | 249.8 | ||
| Total long-term debt | 1,107.5 | 1,287.5 | ||||
| Net debt1 | 525.7 | 1,037.7 | ||||
| Working capital2 | 511.3 | 135.8 | ||||
| Total assets | 5,487.6 | 5,312.6 | ||||
| Equity attributable to owners of the Company | 2,553.2 | 2,096.8 | ||||
| Net debt to adjusted EBITDA 1 | 0.6 | 1.6 |
1 Net debt and net debt to adjusted EBITDA are non-GAAP financial performance measures with no standardized definition under IFRS. For further information and a detailed reconciliation, please see discussion under the "Non-GAAP Financial Performance Measures" section of this MD&A.
2 Working capital is determined as total current assets less total current liabilities as defined under IFRS and disclosed on the consolidated financial statements.
| Financial Performance | Three months ended | Year ended | ||||||||||
| (in $ millions, except per share amounts or as noted below) | Dec. 31, 2024 | Dec. 31, 2023 | Dec. 31, 2024 | Dec. 31, 2023 | ||||||||
| Revenue | $ | 584.9 | $ | 602.2 | $ | 2,021.2 | $ | 1,690.0 | ||||
| Cost of sales | 400.5 | 405.4 | 1,467.4 | 1,297.5 | ||||||||
| Earnings before tax | 103.7 | 81.0 | 251.6 | 151.8 | ||||||||
| Net earnings | 19.3 | 33.5 | 67.8 | 69.5 | ||||||||
| Net earnings attributable to owners | 21.2 | 30.7 | 76.7 | 66.4 | ||||||||
| Basic and diluted earnings per share - attributable | 0.05 | 0.10 | 0.20 | 0.22 | ||||||||
| Adjusted earnings per share - attributable1 | 0.18 | 0.20 | 0.48 | 0.23 | ||||||||
| Operating cash flow before change in non-cash working capital | 231.5 | 246.5 | 691.1 | 570.0 | ||||||||
| Adjusted EBITDA1 | 257.3 | 274.4 | 822.5 | 647.8 | ||||||||
1 Adjusted earnings per share - attributable to owners and adjusted EBITDA are non-GAAP financial performance measures with no standardized definition under IFRS. For further information and a detailed reconciliation, please see discussion under the "Non-GAAP Financial Performance Measures" section of this MD&A.
KEY PRODUCTION RESULTS
| Three months ended | Three months ended | ||||||||||||||||||||||||
| Dec. 31, 2024 | Dec. 31, 2023 | ||||||||||||||||||||||||
| Peru | Manitoba | British Columbia3 |
Total | Peru | Manitoba | British Columbia3 |
Total | ||||||||||||||||||
| Contained metal in concentrate and doré produced1 | |||||||||||||||||||||||||
| Copper | tonnes | 33,988 | 3,347 | 5,927 | 43,262 | 33,207 | 3,735 | 8,508 | 45,450 | ||||||||||||||||
| Gold | oz | 38,079 | 51,438 | 4,644 | 94,161 | 49,418 | 59,863 | 3,495 | 112,776 | ||||||||||||||||
| Silver | oz | 969,502 | 283,223 | 58,933 | 1,311,658 | 836,208 | 255,579 | 105,295 | 1,197,082 | ||||||||||||||||
| Zinc | tonnes | - | 8,385 | - | 8,385 | - | 5,747 | - | 5,747 | ||||||||||||||||
| Molybdenum | tonnes | 195 | - | - | 195 | 397 | - | - | 397 | ||||||||||||||||
| Payable metal sold | |||||||||||||||||||||||||
| Copper | tonnes | 28,775 | 3,321 | 5,831 | 37,927 | 31,200 | 3,687 | 9,119 | 44,006 | ||||||||||||||||
| Gold2 | oz | 37,459 | 50,239 | 5,036 | 92,734 | 38,114 | 63,635 | 3,091 | 104,840 | ||||||||||||||||
| Silver2 | oz | 824,613 | 282,158 | 43,747 | 1,150,518 | 703,679 | 246,757 | 98,441 | 1,048,877 | ||||||||||||||||
| Zinc | tonnes | - | 5,261 | - | 5,261 | - | 7,385 | - | 7,385 | ||||||||||||||||
| Molybdenum | tonnes | 182 | - | - | 182 | 468 | - | - | 468 | ||||||||||||||||
| Year ended | Year ended | ||||||||||||||||||||||||
| Dec. 31, 2024 | Dec. 31, 2023 | ||||||||||||||||||||||||
| Peru | Manitoba | British Columbia3 |
Total | Peru | Manitoba | British Columbia 3 |
Total | ||||||||||||||||||
| Contained metal in concentrate and doré produced1 | |||||||||||||||||||||||||
| Copper | tonnes | 99,001 | 12,536 | 26,406 | 137,943 | 100,487 | 12,154 | 19,050 | 131,691 | ||||||||||||||||
| Gold | oz | 98,226 | 214,225 | 19,789 | 332,240 | 114,218 | 187,363 | 8,848 | 310,429 | ||||||||||||||||
| Silver | oz | 2,708,262 | 995,090 | 280,499 | 3,983,851 | 2,505,229 | 851,723 | 218,282 | 3,575,234 | ||||||||||||||||
| Zinc | tonnes | - | 33,339 | - | 33,339 | - | 34,642 | - | 34,642 | ||||||||||||||||
| Molybdenum | tonnes | 1,323 | - | - | 1,323 | 1,566 | - | - | 1,566 | ||||||||||||||||
| Payable metal sold | |||||||||||||||||||||||||
| Copper | tonnes | 88,138 | 11,602 | 25,354 | 125,094 | 96,213 | 10,708 | 18,075 | 124,996 | ||||||||||||||||
| Gold2 | oz | 103,364 | 212,243 | 19,735 | 335,342 | 97,176 | 171,297 | 8,420 | 276,893 | ||||||||||||||||
| Silver2 | oz | 2,343,820 | 956,460 | 249,536 | 3,549,816 | 2,227,419 | 728,304 | 189,443 | 3,145,166 | ||||||||||||||||
| Zinc | tonnes | - | 25,120 | - | 25,120 | - | 28,779 | - | 28,779 | ||||||||||||||||
| Molybdenum | tonnes | 1,287 | - | - | 1,287 | 1,462 | - | - | 1,462 | ||||||||||||||||
1 Metal reported in concentrate is prior to deductions associated with smelter contract terms.
2 Includes total payable gold and silver in concentrate and in doré sold.
3 Includes 100% of Copper Mountain mine production. Hudbay owns 75% of Copper Mountain mine. As Copper Mountain was acquired on June 20, 2023, the production for the year ended December 31, 2023 represents the period from acquisition date, June 20, 2023, through to year end December 31, 2023.
KEY COST RESULTS
| Three months ended | Year ended | Guidance | ||||||||||||||
| Dec. 31, 2024 |
Dec. 31, 2023 |
Dec. 31, 2024 |
Dec. 31, 2023 |
Annual 20242 |
||||||||||||
| Peru cash cost per pound of copper produced | ||||||||||||||||
| Cash cost1 | $/lb | 1.00 | 0.54 | 1.18 | 1.07 | 1.25 - 1.60 | ||||||||||
| Sustaining cash cost1 | $/lb | 1.48 | 1.21 | 1.86 | 1.81 | |||||||||||
| Manitoba cash cost per ounce of gold produced | ||||||||||||||||
| Cash cost1 | $/oz | 607 | 434 | 606 | 727 | 700 - 900 | ||||||||||
| Sustaining cash cost1 | $/oz | 908 | 788 | 868 | 1,077 | |||||||||||
| British Columbia cash cost per pound of copper produced3 | ||||||||||||||||
| Cash cost1 | $/lb | 3.00 | 2.67 | 2.74 | 2.49 | 2.00 - 2.50 | ||||||||||
| Sustaining cash cost1 | $/lb | 5.76 | 3.93 | 5.29 | 3.41 | |||||||||||
| Consolidated cash cost per pound of copper produced | ||||||||||||||||
| Cash cost1 | $/lb | 0.45 | 0.16 | 0.46 | 0.80 | 0.65 - 0.85 | ||||||||||
| Sustaining cash cost1 | $/lb | 1.37 | 1.09 | 1.62 | 1.72 | 1.75 - 2.20 | ||||||||||
| All-in sustaining cash cost1 | $/lb | 1.53 | 1.31 | 1.88 | 1.92 | |||||||||||
1 Cash cost, sustaining cash cost, all-in sustaining cash cost per pound of copper produced, net of by-product credits, gold cash cost, sustaining cash cost per ounce of gold produced, net of by-product credits, and unit operating cost are non-GAAP financial performance measures with no standardized definition under IFRS. For further information and a detailed reconciliation, please see the discussion under the "Non-GAAP Financial Performance Measures" section of this MD&A.
2 We previously improved our 2024 annual consolidated cash cost guidance range to $0.65 to $0.85 per pound from the original guidance range of $1.05 to $1.25 per pound. We also previously improved our 2024 annual consolidated sustaining cash cost guidance range to $1.75 to $2.20 per pound from the original guidance range of $2.00 to $2.45 per pound.
3As Copper Mountain was acquired on June 20, 2023, the results for the year ended December 31, 2023 represents the period from the acquisition date, June 20, 2023, through to the year ended 2023.
RECENT DEVELOPMENTS
Significant Debt Reduction and Transformed Balance Sheet
We took several prudent measures in 2024 to significantly improve the strength of our balance sheet and improve financial flexibility, including a total of $245 million of combined debt repayments and gold prepayment liability reductions:
• In May 2024, we completed a successful equity offering issuing common shares for gross proceeds of $402.5 million, resulting in net proceeds of $386.2 million after transaction costs.
• Repurchased and retired a total of $82.6 million of senior unsecured notes during the year.
• Repaid $100 million of prior drawdowns under our revolving credit facilities during the year.
• Fully repaid the gold prepay facility, with $62.3 million in gold deliveries in 2024 and the final payment completed in August.
• In November, we proactively extended our senior secured revolving credit facilities by three years from October 2025 to November 2028 and negotiated the flexibility to leave our 4.50% 2026 senior unsecured notes outstanding to maturity as Copper World advances towards a sanctioning decision in accordance with the 3-P plan. The newly extended $450 million revolving credit facilities include an improved pricing grid reflecting the enhanced financial position of Hudbay and feature an opportunity to increase the facility by an additional $150 million at our discretion during the four-year tenor, providing additional financial flexibility.
We have delivered six consecutive quarters of meaningful free cash flow generation as a result of recent brownfield investments, continuous operational improvement efforts and steady cost control across the business. As a result of the continued cash flow generation and our deleveraging efforts, we have substantially reduced our net debt[1] to $525.7 million as of December 31, 2024, as compared to $1,037.7 million at the end of 2023. The net debt reduction, together with higher levels of adjusted EBITDA1 over the last twelve months, has significantly improved our net debt to adjusted EBITDA ratio1 to 0.6x compared to 1.6x at the end of 2023.
Copper World Permitting Completed
On January 2, 2025, Hudbay received the Air Quality Permit for the Copper World project from the Arizona Department of Environmental Quality ("ADEQ"). The issuance of this permit is a significant milestone in the advancement of the project as it is the final major permit required for the development and operation of Copper World. Copper World is expected to produce 85,000 tonnes of copper per year over an initial 20-year mine life.
Hudbay has now received all three key state permits required for Copper World development and operation:
• Mined Land Reclamation Plan - Completed - the Mined Land Reclamation Plan was initially approved by the Arizona State Mine Inspector in October 2021 and was subsequently amended and approved to reflect a larger private land project footprint. This approval was challenged in state court, but the challenge was dismissed in May 2023.
• Aquifer Protection Permit - Completed - the Aquifer Protection Permit was received on August 29, 2024 from the ADEQ following a robust process that included detailed analysis by the agency and Hudbay, along with a public comment period that was completed in the second quarter of 2024.
• Air Quality Permit - Completed - the Air Quality Permit was received on January 2, 2025 from the ADEQ following a similarly robust process, including a public comment period that concluded in the third quarter of 2024. An administrative appeal was filed by certain opponents in late January, as expected and the Company is confident the permit will be upheld, similar to the project's other state-level permits .
Hudbay received the Aquifer Protection Permit and Air Quality Permit on schedule after a thorough public consultation process, and the Company is pleased with the level of local support it has received. Hudbay looks forward to providing significant benefits for the community and local economy in Arizona. Once in production, Copper World is expected to be a meaningful copper producer in the U.S. domestic copper supply chain, which will be required to help secure growing U.S. metal demand related to increased manufacturing capacity, infrastructure development, increased energy independence, domestic battery supply chain and strengthening the nation's security.
Now that the major permits for Copper World have been received, Hudbay commenced a minority joint venture partner process early in 2025. It is anticipated that any minority joint venture partner would participate in the funding of definitive feasibility study activities in 2025 as well as in the final project design and construction for Copper World.
The sanctioning of Copper World is not expected until 2026 based on current estimated timelines.
____________________________________________ 1 Adjusted EBITDA and net debt to adjusted EBITDA ratio are non-GAAP financial performance measures with no standardized definition under IFRS. For further information and a detailed reconciliation, please see discussion under the "Non-GAAP Financial Performance Measures" section of this MD&A As we advance the many brownfield and greenfield growth opportunities within our portfolio, we have enhanced the senior management team with additional technical expertise and expanded the U.S. team to build bench strength and establish key leadership positions.
Bolstering Technical Capabilities
Hudbay's Senior Vice President of the U.S. Business Unit, Javier Del Rio, has been focusing his time solely on leading the Copper World project, leveraging his project development and operational expertise as the former head of Hudbay's South America Business Unit where he oversaw the development and operation of the Company's flagship Constancia mine in Peru. In addition, Warren Flannery, Hudbay's Vice President of Business Planning and Reclamation, relocated to Arizona in September 2024 to take on the role of Vice President of Copper World. In his new role, Mr. Flannery is leading the operational readiness of Copper World as the company advances through definitive feasibility study activities in 2025.
Adding to the U.S. expertise, in August 2024, Hudbay hired Robert Comer as Executive Director, External Affairs & Legal in Arizona. As an experienced attorney, Mr. Comer brings more than 30 years of U.S. permitting and mining law expertise. During his career, Mr. Comer has held senior leadership positions with businesses and the federal government and has successfully advanced numerous resource projects, including through environmental and land use compliance, defending permits through litigation, NEPA permitting and government relations. He is a significant asset to Copper World as Hudbay continues to advance towards a sanctioning decision in 2026.
After receiving all key permits and with feasibility study activities underway, in February 2025, we added to our U.S. team's project development expertise with the appointment of Kim Hackney as Project Director of Copper World. Mr. Hackney is a project professional with over 40 years of extensive experience in the mining industry having held several roles in project and construction management, including managing owners teams, EPCM projects and self-perform projects. He is recognized in the industry for bringing projects online within budget and on schedule, and his in-depth expertise includes global base and precious metals projects located in North, Central and South America, Canada, Africa, Australia, Indonesia, and Uzbekistan.
Hudbay also appointed John O'Shaughnessy as Vice President, Business Development in February 2025 to provide expert oversight and strategic leadership of the global mine planning process. Mr. O'Shaughnessy has 25 years of mining expertise, including numerous progressive engineering, operational and leadership roles at Vale's mining operations in Ontario and Newfoundland and Labrador. He was most recently the North Atlantic Lead for Vale's Base Metals division where he led and deployed strategic initiatives for the North Atlantic region. His broad technical expertise further augments Hudbay's technical bench strength.
New Britannia Demonstrates Successful Capital Allocation to Maximize Risk-adjusted Returns
Hudbay has a proven track record of prudently allocating capital to generate the highest risk-adjusted returns as we execute our growth strategy and advance our world-class asset portfolio. As an example of this success, we have completed a post-project review of the brownfield investment in the New Britannia mill refurbishment project in 2020 and 2021.
Hudbay acquired the New Britannia mill in 2015 for $12 million as a potential gold processing solution for the high-grade Lalor gold and copper-gold ores by providing additional processing capacity at the Snow Lake operations and allowing us to achieve higher gold recoveries of approximately 90%, compared to 55% at the existing mill. After completing several economic studies, the refurbishment project construction commenced in early 2020 with an initial capital cost of $115 million and an estimated unlevered IRR of 19%. The initial capital investment was funded by a $115 million low-cost gold prepay facility entered into in May 2020. Project construction was completed on time with mill ramp-up and commissioning achieved in the fourth quarter of 2021. The mill was refurbished with a nameplate design capacity of 1,500 tonnes per day, and has been consistently exceeding performance expectations, achieving throughput levels of 1,650 tonnes per day in 2023 and reaching record throughput levels of over 2,000 tonnes per day in 2024. The project payback was achieved after 2.5 years, and in August 2024, the gold prepay facility was fully repaid, which has increased exposure to the current high gold price environment and further improved cash flows. After three years of operations, the unlevered IRR for the New Britannia gold mill refurbishment project has now increased to 36% after adjusting for the higher production rates, stronger gold prices and current capital and operating costs.
Hudbay Celebrates Major Milestone with Millionth Ounce of Gold Recovered from Lalor Mine
At the end of 2024, we surpassed a total of one million ounces of gold produced at our Lalor mine in Snow Lake, Manitoba. This milestone reinforces the significant value Hudbay has unlocked by combining its exploration expertise, processing infrastructure and operating efficiency to maximize gold production at our Snow Lake operations. In 2024, the Snow Lake operations achieved record annual gold production exceeding the top end of the gold production guidance range with 214,225 ounces produced.
With approximately two million ounces of contained gold in current mineral reserve estimates and another 1.4 million ounces of contained gold in inferred mineral resources, Hudbay expects to continue to unlock significant value in Snow Lake and looks forward to further growing the mineral resource base through regional exploration as we continue to execute one of the largest exploration programs in Snow Lake operating history.
Exploration Update
Large Exploration Drill Program Continues in Snow Lake
In 2024, Hudbay completed the largest exploration program in the Company's history with the goal of extending known mineralization near the Lalor deposit to further extend mine life as well as to find a new anchor deposit within trucking distance of the Snow Lake processing infrastructure. The 2024 program included the largest geophysical program in Hudbay's history in Snow Lake, with surface electromagnetic surveys detecting targets at more than 1,000 metres below surface and covering a 25 square-kilometre area including the Cook Lake claims that had been previously untested by modern deep geophysics.
At Lalor Northwest, follow-up drilling in the second half of 2024 confirmed the potential for a new gold-copper discovery located approximately 400 metres from the existing Lalor underground infrastructure. Several new intersections have helped establish the geometry of this new discovery, and we plan to continue to drill Lalor Northwest in 2025.
At the regional Rail property, which was acquired through the Rockcliff acquisition in 2023, the 2024 drill program yielded new intersections of high-grade copper-gold mineralization. These results will be combined with historical drilling results on the property to update the geological model and assess its economic potential.
2024 drilling at the 1901 deposit from the exploration drift targeted down plunge extensions of the ore body. Five step-out holes were drilled beyond the known extent of the mineralization and all five holes have intersected visible copper-gold mineralization. Additional planned drilling at 1901 in 2025 is expected to confirm and potentially extend the orebody geometry and to convert inferred mineral resources in the gold lenses to mineral reserves.
We continue to test a very strong deep geophysical anomaly located at Cook Lake North, approximately six kilometres from Lalor with drilling activities continuing throughout the winter season.
Signed Exploration Agreement with First Nations in Manitoba
In February 2025, Hudbay signed its first-ever exploration agreement with the Kiciwapa Cree Nation, reflecting the Company's commitment to meaningful collaboration as we explore for new mineral resources in the Snow Lake and Flin Flon regions.
Advancing Engineering Work for Flin Flon Tailings Reprocessing
Zinc Plant Tailings - Metallurgical test work continues following positive results from the initial confirmatory drill program completed in 2024 in the section of the tailings facility that was utilized by the zinc plant for 25 years. The results confirmed the grades of precious metals and critical minerals previously estimated from historical zinc plant records. An early economic study to evaluate the opportunity to reprocess the zinc plant tailings has confirmed the potential for a technically viable reprocessing alternative, and further engineering work is underway.
Mill Tailings - We continue to advance metallurgical test work on the opportunity to reprocess Flin Flon mill tailings where 100 million tonnes of tailings were deposited over 90 years. An early economic study on the mill tailings is planned.
Maria Reyna and Caballito Drill Permits Expected in 2025
Hudbay controls a large, contiguous block of mineral rights with the potential to host mineral deposits in close proximity to the Constancia processing facility, including the past producing Caballito property and the highly prospective Maria Reyna property. The Company commenced early exploration activities at Maria Reyna and Caballito after completing a surface rights exploration agreement with the community of Uchucarcco in August 2022. As part of the drill permitting process, environmental impact assessment applications were submitted for the Maria Reyna property in November 2023 and for the Caballito property in April 2024. The environmental impact assessment (EIA) for Maria Reyna was approved by the government in June 2024 and the Caballito EIA was approved in September 2024. This represents one of several steps in the drill permitting process, which is expected to be completed in 2025.
Board Chair Transition
Effective January 1, 2025, Stephen A. Lang stepped down as Chair of Hudbay's Board of Directors due to health reasons. David S. Smith, current independent director, has been appointed Chair of the Board. Mr. Lang, who was appointed Chair in October 2019, will remain on the Board as an independent director. Mr. Smith joined the Board as an independent director in May 2019, bringing nearly 40 years of financial and executive leadership experience in the mining sector. Mr. Smith is a corporate director who has had a career on both the finance and the supply sides of the mining business, with extensive international experience in the acquisition, sale, development, financing and operations of base and precious metal operations.
Dividend Declared
A semi-annual dividend of C$0.01 per share was declared on February 18, 2025. The dividend will be paid out on March 21, 2025 to shareholders of record as of close of business on March 4, 2025.
PERU OPERATIONS REVIEW
|
|
Three months ended |
Year ended |
|||
|
Dec. 31, 2024 |
Dec. 31, 2023 |
Dec. 31, 2024 |
Dec. 31, 2023 |
||
|
Constancia ore mined1 |
tonnes |
4,186,058 |
973,176 |
15,046,190 |
9,265,954 |
|
Copper |
% |
0.40 |
0.30 |
0.34 |
0.32 |
|
Gold |
g/tonne |
0.04 |
0.04 |
0.04 |
0.04 |
|
Silver |
g/tonne |
3.88 |
2.26 |
3.08 |
2.53 |
|
Molybdenum |
% |
0.02 |
0.01 |
0.01 |
0.01 |
|
Pampacancha ore mined1 |
tonnes |
4,037,264 |
5,556,613 |
9,317,499 |
14,756,416 |
|
Copper |
% |
0.63 |
0.56 |
0.55 |
0.51 |
|
Gold |
g/tonne |
0.38 |
0.32 |
0.32 |
0.33 |
|
Silver |
g/tonne |
6.43 |
4.84 |
5.61 |
4.28 |
|
Molybdenum |
% |
0.00 |
0.01 |
0.01 |
0.01 |
|
Total ore mined |
tonnes |
8,223,322 |
6,529,789 |
24,363,689 |
24,022,370 |
|
Strip ratio2 |
|
1.22 |
1.26 |
1.78 |
1.51 |
|
Ore milled |
tonnes |
7,999,453 |
7,939,044 |
31,933,624 |
30,720,929 |
|
Copper |
% |
0.48 |
0.48 |
0.36 |
0.39 |
|
Gold |
g/tonne |
0.20 |
0.25 |
0.14 |
0.16 |
|
Silver |
g/tonne |
5.28 |
4.20 |
3.84 |
3.62 |
|
Molybdenum |
% |
0.01 |
0.01 |
0.01 |
0.01 |
|
Copper concentrate |
tonnes |
148,283 |
146,065 |
452,473 |
457,137 |
|
Concentrate grade |
% Cu |
22.92 |
22.73 |
21.88 |
21.98 |
|
Copper recovery |
% |
87.8 |
87.4 |
85.0 |
84.2 |
|
Gold recovery |
% |
73.3 |
77.6 |
70.7 |
71.8 |
|
Silver recovery |
% |
71.4 |
78.0 |
68.8 |
70.0 |
|
Molybdenum recovery |
% |
37.1 |
33.6 |
41.7 |
35.8 |
|
Combined unit operating costs3,4 |
$/tonne |
15.25 |
12.24 |
12.91 |
12.47 |
1 Reported tonnes and grade for ore mined are estimates based on mine plan assumptions and may not reconcile fully to ore milled.
2 Strip ratio is calculated as waste mined divided by ore mined.
3 Reflects combined mine, mill and general and administrative ("G&A") costs per tonne of ore milled. Reflects the deduction of expected capitalized stripping costs.
4 Combined unit costs is a non-GAAP financial performance measure with no standardized definition under IFRS. For further information and a detailed reconciliation, please see the discussion under the "Non-GAAP Financial Performance Measures" section of this MD&A.
|
|
|
Three months ended |
Year ended |
||
|
|
|
Dec. 31, 2024 |
Dec. 31, 2023 |
Dec. 31, 2024 |
Dec. 31, 2023 |
|
Contained metal in concentrate produced |
|
|
|
|
|
|
Copper |
tonnes |
33,988 |
33,207 |
99,001 |
100,487 |
|
Gold |
oz |
38,079 |
49,418 |
98,226 |
114,218 |
|
Silver |
oz |
969,502 |
836,208 |
2,708,262 |
2,505,229 |
|
Molybdenum |
tonnes |
195 |
397 |
1,323 |
1,566 |
|
Payable metal sold |
|
|
|
|
|
|
Copper |
tonnes |
28,775 |
31,200 |
88,138 |
96,213 |
|
Gold |
oz |
37,459 |
38,114 |
103,364 |
97,176 |
|
Silver |
oz |
824,613 |
703,679 |
2,343,820 |
2,227,419 |
|
Molybdenum |
tonnes |
182 |
468 |
1,287 |
1,462 |
|
Cost per pound of copper produced |
|
|
|
|
|
|
Cash cost1 |
$/lb |
1.00 |
0.54 |
1.18 |
1.07 |
|
Sustaining cash cost1 |
$/lb |
1.48 |
1.21 |
1.86 |
1.81 |
1 Cash cost and sustaining cash costs per pound of copper produced, net of by-product credits, are not recognized under IFRS. For more detail on these non-GAAP financial performance measures, please see the discussion under the "Non-GAAP Financial Performance Measures" section of this MD&A.
Overview
Peru operations delivered higher grades in fourth quarter, as planned, and continued to benefit from strong and consistent mill throughput in 2024, averaging approximately 87,000 tonnes processed per day in the fourth quarter and full year of 2024. Cost performance in 2024 was better than expected as the operations achieved steady operating unit cost performance while benefiting from higher gold by-product sales revenues. The fourth quarter also benefited from a larger portion of ore mill feed coming from Pampacancha.
Approximately 30,000 wet metric tonnes of copper concentrate in Peru were unsold as of December 31, 2024, which is approximately 15,000 wet metric tonnes above normal levels and resulted from the strong production ramp-up that occurred late in the quarter. The excess copper concentrate is expected to be sold in the first quarter of 2025.
The Company continues to evaluate opportunities to further increase mill throughput after the Peruvian Ministry of Energy and Mines approved a regulatory change in June 2024 to allow mining companies in Peru to increase throughput by up to 10% above permitted levels.
Mining Activities
Total ore mined in the fourth quarter of 2024 increased by 26% compared to the same period in 2023, in line with our mine plan as we completed the planned stripping program at Pampacancha in late September. The planned stripping phase at Pampacancha allowed us to mine higher copper and gold grade ore in the fourth quarter, as expected. Ore mined from Pampacancha during the fourth quarter decreased to 4.0 million tonnes compared with 5.6 million tonnes in the fourth quarter of 2023 when we were in an unusually high period of ore mined from Pampacancha as per the 2023 mine plan cadence. However, total ore mined in the fourth quarter of 2024 was higher than the same period in 2023 with the inclusion of ore mined in the Constancia pit.
Full year ore mined in 2024 was slightly higher than 2023 despite periods of intensive stripping in 2024, primarily as a result of the effective use of mobile equipment and higher fleet availability.
Milling Activities
Ore milled during the fourth quarter of 2024 was 1% higher than the comparative 2023 period mainly due to the treatment of softer ore from Constancia. Milled copper grades were consistent with the same period last year. Milled gold grades decreased by 20% in the fourth quarter of 2024 compared to the same period in 2023 but were better than expected as we mined additional gold benches in the Pampacancha pit during the fourth quarter of 2024. The Constancia mill achieved record copper recoveries of 88% in the fourth quarter of 2024, higher than the previous record of 87% achieved in the comparative period. Recoveries of gold and silver during the fourth quarter of 2024 were 73% and 71%, respectively, representing a decrease of 6% and 8% respectively, compared to the same period in 2023, but remained in line with our metallurgical models for the ore types that were being processed.
Ore milled during the year ended 2024 was 4% higher than the comparative 2023 period due to the same factors as the quarterly variance. For the full year, milled copper and gold grades decreased by 8% and 13%, respectively, compared to the same period in 2023, as a result of less ore being fed from Pampacancha, as per plan. Recoveries of copper during the year ended 2024 were 85%, representing an increase of 1%, compared with the 2023 period, despite being impacted by supplemental ore feed from stockpiles during pit stripping activities early in the year. Gold and silver recoveries during the year ended 2024 were 71% and 69%, representing a decrease of 2% and 2%, respectively. This is in line with our metallurgical models.
Production and Sales Performance
Production of copper and silver in the fourth quarter of 2024 was 33,988 tonnes and 969,502 ounces, respectively, representing an increase of 2% and 16%, respectively, compared to the same period in 2023 primarily due to higher throughput. Production of gold and molybdenum in the fourth quarter of 2024 was 38,079 ounces and 195 tonnes, respectively, representing a decrease of 23% and 51%, respectively, compared to the same period in 2023 as a larger portion of lower grade Constancia ore was processed in the current quarter compared to the same period last year.
Full year production of copper, gold and molybdenum in 2024 was 99,001 tonnes, 98,226 ounces, and 1,323 tonnes, respectively, representing a decrease of 1%, 14% and 16%, respectively, from the comparative 2023 period primarily due to lower grades since more material was mined from Constancia and reclaimed from the stockpile during 2024 compared with the prior year, partially offset by higher throughput. Production of silver was 2,708,262 ounces, representing an increase of 8% from the comparative 2023 period due to higher silver grades from Pampacancha.
Quantities of sold copper and gold during the fourth quarter of 2024 were lower by 8%, and 2%, respectively, than the corresponding period in 2023 primarily due to unsold copper concentrate inventory levels at quarter end. Approximately 30,000 wet metric tonnes of copper concentrate in Peru were unsold as of December 31, 2024, which is approximately 15,000 wet metric tonnes above normal levels and resulted from the strong production ramp-up that occurred late in the quarter. Copper concentrate inventory levels are expected to normalize in the first quarter of 2025. Quantity of molybdenum sold during the fourth quarter of 2024 was lower by 61% due to lower production during the quarter. Quantity of silver sold during the fourth quarter of 2024 was higher by 17% than the corresponding period in 2023 due to the aforementioned higher grades.
Full year copper metal sold was 8% lower than the comparable period due to higher ending inventory levels. Gold metal sold was 6% higher than the comparable period primarily due to timing of precious metal sales at the beginning of the year.
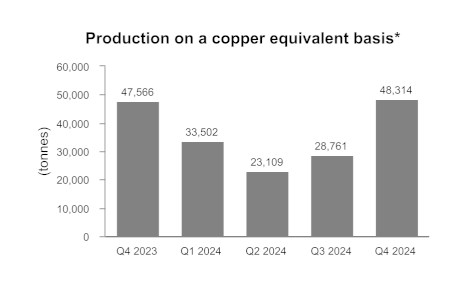
*Copper equivalent production is calculated using the quarter average LME prices for each metal excluding molybdenum.
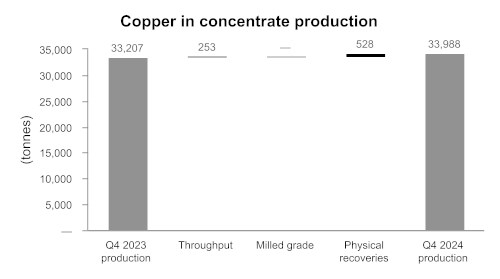
Cost Performance
Combined mine, mill and G&A unit operating cost in the fourth quarter of 2024 was $15.25 per tonne, 25% higher than the same period in 2023 primarily due to lower capitalized stripping, higher milling costs with a planned semi-annual mill maintenance shutdown in the quarter, and higher G&A costs including profit sharing. This increase was partially offset by higher ore milled. Combined mine, mill and G&A unit operating costs for the full year 2024 were $12.91 per tonne, a 4% increase compared to the same period in 2023 as higher mining and G&A costs were partially offset by higher throughput and slightly lower milling costs.
Cash cost per pound of copper produced, net of by-product credits, in the fourth quarter of 2024 was $1.00, an increase compared to $0.54 in the same period in 2023 due to lower capitalized stripping, higher mining, milling and G&A costs including profit sharing. In addition, lower by-product credits were realized from gold and molybdenum mostly as a result of lower grades compared to the same period last year.
Full year 2024 cash cost per pound of copper produced, net of by-product credits2 was $1.18, an increase compared to $1.07 in 2023 due to lower capitalized stripping, higher mining and G&A costs, including higher profit sharing and slightly lower copper production.
Sustaining cash cost per pound of copper produced, net of by-product credits2, was $1.48 in the fourth quarter, an increase compared with $1.21 in the same period of 2023. The increase was due to the same factors as described for the cash cost variance above, partially offset by lower sustaining capital due to lower capitalized stripping. On a full year basis, sustaining cash cost per pound of copper produced, net of by-products credits2, was $1.86, only marginally higher than the $1.81 for the comparable period in 2023, due to the same reasons described for the cash cost variance over the full year period.
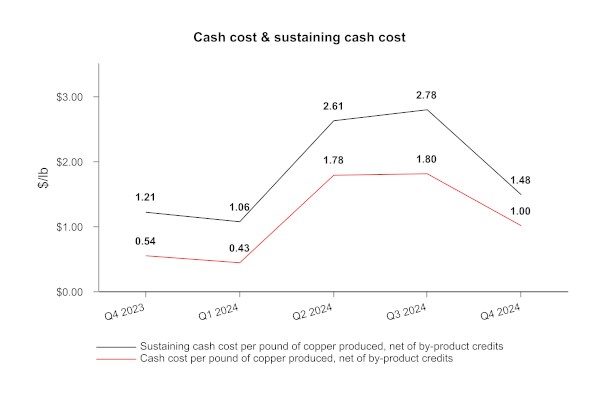
Peru Guidance Outlook
|
|
|
Three months ended |
Year ended |
Guidance |
|||
|
|
|
Dec. 31, |
Dec. 31, |
Dec. 31, |
Dec. 31, |
Annual 2024 |
Annual 2025 |
|
Contained metal in concentrate produced |
|
|
|
|
|
|
|
|
Copper |
tonnes |
33,988 |
33,207 |
99,001 |
100,487 |
98,000 - 120,000 |
80,000 - 97,000 |
|
Gold |
oz |
38,079 |
49,418 |
98,226 |
114,218 |
76,000 - 93,000 |
49,000 - 60,000 |
|
Silver |
oz |
969,502 |
836,208 |
2,708,262 |
2,505,229 |
2,500,000 - 3,000,000 |
2,475,000 - 3,025,000 |
|
Molybdenum |
tonnes |
195 |
397 |
1,323 |
1,566 |
1,250 - 1,500 |
1,300 - 1,500 |
|
Cost per pound of copper produced |
|
|
|
|
|
|
|
|
Cash cost1 |
$/lb |
1.00 |
0.54 |
1.18 |
1.07 |
1.25 - 1.60 |
1.35 - 1.65 |
1 Cash cost per pound of copper produced, net of by-product credits, are not recognized under IFRS. For more detail on these non-GAAP financial performance measures, please see the discussion under the "Non-GAAP Financial Performance Measures" section of this MD&A.
Full year 2024 copper, silver and molybdenum production achieved our annual guidance ranges, and gold production exceeded the upper end of our guidance range by 6%.
Cash cost per pound of copper produced2 of $1.18 was better than expected and outperformed the low end of the cost guidance range by 6%.
MANITOBA OPERATIONS REVIEW
|
|
Three months ended |
Year ended |
|||
|
Dec. 31, 2024 |
Dec. 31, 2023 |
Dec. 31, 2024 |
Dec. 31, 2023 |
||
|
Lalor ore mined |
tonnes |
422,454 |
372,384 |
1,626,935 |
1,526,729 |
|
Gold |
g/tonne |
4.61 |
5.92 |
4.68 |
4.74 |
|
Copper |
% |
0.95 |
1.04 |
0.85 |
0.86 |
|
Zinc |
% |
2.95 |
2.20 |
2.84 |
3.00 |
|
Silver |
g/tonne |
31.91 |
28.92 |
27.14 |
24.51 |
|
New Britannia ore milled |
tonnes |
185,592 |
165,038 |
715,198 |
596,912 |
|
Gold |
g/tonne |
5.99 |
8.03 |
6.29 |
6.76 |
|
Copper |
% |
1.17 |
1.46 |
1.04 |
1.03 |
|
Zinc |
% |
1.08 |
0.85 |
0.99 |
0.84 |
|
Silver |
g/tonne |
33.97 |
27.97 |
27.78 |
25.11 |
|
Copper concentrate |
tonnes |
12,345 |
15,179 |
44,198 |
37,176 |
|
Concentrate grade |
% Cu |
16.00 |
14.55 |
15.78 |
15.44 |
|
Gold recovery1 |
% |
90.2 |
89.0 |
89.7 |
88.6 |
|
Copper recovery |
% |
91.3 |
91.6 |
93.6 |
93.3 |
|
Silver recovery1 |
% |
79.6 |
83.2 |
80.9 |
81.5 |
|
Contained metal in concentrate produced |
|
|
|
|
|
|
Gold |
oz |
22,011 |
24,760 |
90,011 |
77,798 |
|
Copper |
tonnes |
1,975 |
2,208 |
6,976 |
5,739 |
|
Silver |
oz |
119,201 |
90,501 |
396,333 |
292,694 |
|
Metal in doré produced2 |
|
|
|
|
|
|
Gold |
oz |
12,747 |
14,144 |
56,853 |
40,239 |
|
Silver |
oz |
46,431 |
34,895 |
165,408 |
97,630 |
|
Stall ore milled |
tonnes |
222,004 |
228,799 |
893,510 |
965,567 |
|
Gold |
g/tonne |
3.36 |
4.22 |
3.42 |
3.45 |
|
Copper |
% |
0.73 |
0.73 |
0.71 |
0.74 |
|
Zinc |
% |
4.62 |
3.20 |
4.33 |
4.36 |
|
Silver |
g/tonne |
29.90 |
28.63 |
26.54 |
24.19 |
|
Copper concentrate |
tonnes |
7,222 |
7,938 |
29,029 |
31,900 |
|
Concentrate grade |
% Cu |
19.01 |
19.23 |
19.16 |
20.11 |
|
Zinc concentrate |
tonnes |
16,187 |
11,778 |
64,643 |
66,824 |
|
Concentrate grade |
% Zn |
51.80 |
48.79 |
51.58 |
51.84 |
|
Gold recovery |
% |
69.6 |
67.5 |
68.6 |
64.8 |
|
Copper recovery |
% |
84.4 |
92.0 |
87.4 |
90.4 |
|
Zinc recovery |
% |
81.7 |
78.5 |
86.2 |
82.2 |
|
Silver recovery |
% |
55.1 |
61.8 |
56.8 |
61.4 |
|
Contained metal in concentrate produced |
|
|
|
|
|
|
Gold |
oz |
16,680 |
20,959 |
67,361 |
69,326 |
|
Copper |
tonnes |
1,372 |
1,527 |
5,560 |
6,415 |
|
Zinc |
tonnes |
8,385 |
5,747 |
33,339 |
34,642 |
|
Silver |
oz |
117,591 |
130,183 |
433,349 |
461,399 |
1 Gold and silver recovery includes total recovery from concentrate and doré.
2 Doré includes sludge, slag and carbon fines.
|
|
Three months ended |
Year ended |
|||
|
Dec. 31, 2024 |
Dec. 31, 2023 |
Dec. 31, 2024 |
Dec. 31, 2023 |
||
|
Total contained metal in concentrate and doré produced1 |
|||||
|
Gold |
oz |
51,438 |
59,863 |
214,225 |
187,363 |
|
Copper |
tonnes |
3,347 |
3,735 |
12,536 |
12,154 |
|
Zinc |
tonnes |
8,385 |
5,747 |
33,339 |
34,642 |
|
Silver |
oz |
283,223 |
255,579 |
995,090 |
851,723 |
|
Payable metal sold in concentrate and doré |
|
|
|
|
|
|
Gold |
oz |
50,239 |
63,635 |
212,243 |
171,297 |
|
Copper |
tonnes |
3,321 |
3,687 |
11,602 |
10,708 |
|
Zinc |
tonnes |
5,261 |
7,385 |
25,120 |
28,779 |
|
Silver |
oz |
282,158 |
246,757 |
956,460 |
728,304 |
|
Unit Operating Costs2 |
|
|
|
|
|
|
Lalor |
C$/tonne |
141.13 |
147.10 |
142.59 |
142.35 |
|
New Britannia |
C$/tonne |
69.09 |
75.36 |
70.99 |
82.91 |
|
Stall |
C$/tonne |
46.34 |
36.97 |
43.02 |
35.82 |
|
Combined unit operating costs3,4 |
C$/tonne |
233 |
216 |
226 |
217 |
|
Cost per ounce of gold produced |
|
|
|
|
|
|
Cash cost4 |
$/oz |
607 |
434 |
606 |
727 |
|
Sustaining cash cost4 |
$/oz |
908 |
788 |
868 |
1,077 |
1 Metal reported in concentrate is prior to deductions associated with smelter terms.
2 Reflects costs per tonne of ore mined/milled.
3 Reflects combined mine, mill and G&A costs per tonne of milled ore.
4 Combined unit costs, cash cost and sustaining cash cost per ounce of gold produced, net of by-product credits, are non-GAAP financial performance measures with no standardized definition under IFRS. For further information and a detailed reconciliation, please see the discussion under the "Non-GAAP Financial Performance Measures" section of this MD&A.
Overview
The Snow Lake operations in Manitoba continued to deliver strong operational performance during the fourth quarter of 2024, exceeding expectations in both production and efficiency. A significant milestone was achieved in December 2024 with the recovery of one million ounces from the Lalor mine, reflecting the success of our strategy to maximize gold production from the Snow Lake operations. Record annual gold production of 214,225 ounces in 2024 was achieved through a combination of higher metallurgical recoveries at the New Britannia and Stall mills, despite processing lower gold grades year-over-year, and the strategic allocation of more gold ore feed to the New Britannia mill. This success reflects the positive impact of ongoing continuous improvement initiatives.
The Lalor mine achieved strong production results in the fourth quarter, achieving an average of 4,600 tonnes per day, marking the highest quarterly ore production in 2024. This strong performance was driven by positive muck fragmentation, stope availability and improved mobile equipment availability compared to the same period in 2023. Ongoing modifications to stope design, directing ore to the brow of the stope, continues to further enhanced mucking efficiency throughout the lifecycle of stopes.
The New Britannia mill had another quarter of exceptional performance with the mill operating consistently above nameplate capacity, achieving an average throughput of approximately 2,020 tonnes per day in the fourth quarter of 2024. Plant availability remained strong, supported by ongoing low-capital projects aimed at further increasing throughput while maintaining targeted gold recoveries of 90%. Construction of an enclosure for the copper slurry thickener tank was completed, enhancing year-round reliability and reducing costs associated with winter protection.
At the Stall mill, there was a slight reduction in throughput as more ore was diverted to New Britannia. Benefits from recent recovery improvement programs continue to be realized with gold recoveries exceeding prior year figures. Efforts to continue to optimize recovery were advanced with the installation of new elongated cyclones. These cyclones have demonstrated improved grind size distribution and enhanced gold recoveries, with an immediate payback on capital.
Progress on the 1901 deposit continued via the exploration drift and the recently started haulage drift, which achieved high advance rates in the fourth quarter of 2024, laying the groundwork to support full production from the 1901 deposit by 2027. With the drifts performing well, mining of first ore is scheduled for the second quarter of 2025. Exploration diamond drilling targeting down plunge mineralization intersected copper in the initial five holes, and further drilling is currently underway to follow up on the positive results. Additional drilling is planned in 2025 to evaluate the orebody and optimize the mining approach for future conversion of inferred mineral resources into mineral reserves.
At the Anderson Tailings Impoundment Area, tailings deposition efficiency continues to exceed expectations with new equipment and operational routines.
Environmental initiatives continued to advance in the fourth quarter, and the business achieved a year-over-year reduction in greenhouse gas emissions of approximately 8%, achieving our 2024 environmental targets, primarily driven by significant reductions in diesel and propane consumption across the operations. These reductions were achieved through the introduction and operation of battery electric vehicles underground at Lalor, and converting propane to electric heating in areas of the plant.
The Manitoba business unit continues to prioritize strong relationships with Indigenous communities. Several meetings with Indigenous Nations were held to discuss future exploration and geophysical programs within their Traditional Territories. To date, we have received letters of support for geophysical programs, and positive progress is being made in negotiating exploration agreements. In February 2025, Hudbay signed its first-ever exploration agreement with the Kiciwapa Cree Nation.
Mining Activities
Total ore mined in Manitoba in the fourth quarter of 2024 was 13% higher than the comparable quarter in 2023. Silver and zinc grades mined at Lalor during the fourth quarter were 10% and 34% higher, respectively, compared to the same period in 2023. Gold and copper grades mined at Lalor during the fourth quarter were 22% and 9% lower, respectively, compared to the same period in 2023. The year ended December 31, 2024 saw significant improvements in ore production and precious metal grade quality. These changes align with improvements in mining techniques, most notably in longhole muck fragmentation, and anticipated higher grade precious metal sequences.
Total ore mined at our Manitoba operations during the year ended December 31, 2024 was 7% higher than the same period in 2023. Silver grades mined at Lalor during the year ended December 31, 2024 were 11% higher compared with the same period in 2023, consistent with the mine plan. Gold, copper and zinc grades mined at Lalor during the year ended December 31, 2024 were 1%, 1% and 5%, respectively, lower than the same period in 2023, but gold grades were better than expected in 2024.
Milling Activities
Consistent with our strategy of allocating more Lalor ore feed to New Britannia, the New Britannia mill throughput averaged approximately 2,020 tonnes per day in the fourth quarter of 2024, approximately 12% above average daily throughput levels in the same period in 2023. Recoveries of gold and silver in the fourth quarter of 2024 were 90% and 80%, respectively, representing an increase of 1%, and a decrease of 4%, respectively, compared to the same period in 2023. Copper recovery in the fourth quarter of 2024 was 91%, remaining consistent when compared to the same period in 2023. Full year 2024 total ore milled at New Britannia was 20% higher than 2023, reflecting the consistently strong performance throughout 2024 as a result of continuous improvement efforts. Despite processing lower gold grade ore, gold recoveries also increased by 1% in 2024 compared to 2023.
During the three months and year ended December 31, 2024, the Stall mill processed 3% and 7% less ore, respectively, compared with the same period in 2023, which is aligned with our strategy of allocating more Lalor ore feed to New Britannia, as noted above. The Stall mill achieved gold recoveries of 70% in the fourth quarter, reflecting benefits from recent recovery improvement programs.
Production and Sales Performance
Manitoba operations produced 51,438 ounces of gold, 3,347 tonnes of copper, 8,385 tonnes of zinc and 283,223 ounces of silver during the fourth quarter of 2024. Compared to the fourth quarter of 2023, production of zinc and silver in the fourth quarter of 2024 increased by 46% and 11%, respectively, while production of gold and copper declined by 14% and 10%, respectively, as planned.
Full year production of gold, copper and silver in 2024 was higher by 14%, 3% and 17%, respectively, than the comparative 2023 period mainly due to the same reasons as noted above, as well as higher production from gold and copper-gold zones and better than expected gold grades. Zinc production in 2024 decreased by 4%, aligned with forecasted production and the strategy to mine more gold ore at Lalor.
Quantities of metal sold during the fourth quarter of 2024 were lower for all metals except silver, as compared to the comparable period in 2023, primarily due to the same factors impacting contained metal production, as noted above. During the year ended December 31, 2024, metal sold for gold, copper and silver were higher than the comparable period, while zinc metal sold was lower than the comparable period.

Cost Performance
Lalor mining costs during the fourth quarter of 2024 decreased by 4% compared to the same period in 2023, as a result of efficiency improvements and higher tonnage mined more than offsetting inflationary factors. Compared to the same period in 2023, milling costs at the Stall mill were 25% higher during the fourth quarter of 2024, primarily due to lower throughput as described earlier. New Britannia milling costs decreased by 8% during the fourth quarter of 2024 versus the same period in 2023, primarily as a result of higher throughput as described earlier. Combined mine, mill and G&A unit operating costs in the fourth quarter of 2024 were C$233 per tonne, representing an 8% increase compared to the same period in 2023. Combined mine, mill and G&A unit operating costs during for the year ended December 31, 2024 increased by 4% to C$226 per tonne. The marginal increase in operating costs year-over-year was largely the result of more tonnes being processed at New Britannia compared to Stall which operates at a lower cost per unit.
Cash cost per ounce of gold produced, net of by-product credits, in the fourth quarter of 2024 was $607, an increase compared to the same period in 2023, primarily due to lower gold production and higher profit sharing costs but remained better than expected as a result of continued operating efficiencies and focus on strong cost control.
Sustaining cash cost per ounce of gold produced, net of by-product credits, in the fourth quarter of 2024 was $908, an increase of 15% compared to the same period in 2023, primarily due to the same factors affecting cash cost, partially offset by lower sustaining capital costs during the quarter.
Cash cost per ounce of gold produced, net of by-product credits, during the year ended December 31, 2024 was $606 per ounce. These costs were 17% lower compared to the same period in 2023 primarily due to higher gold production and by-product credits, partially offset by higher mining, milling and G&A costs resulting from higher employee profit sharing costs. Sustaining cash cost per ounce of gold produced, net of by-product credits, for the year ended December 31, 2024 was $868 per ounce, a decrease of 19% from 2023 primarily due to the same factors affecting cash cost noted above, together with lower sustaining capital expenditures compared to the prior year.
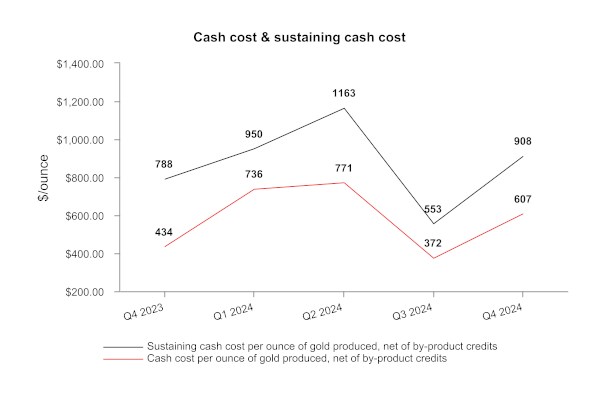
Manitoba Guidance Outlook
|
|
Three months ended |
Year ended |
Guidance |
||||
|
Dec. 31, 2024 |
Dec. 31, 2023 |
Dec. 31, 2024 |
Dec. 31, 2023 |
Annual 2024 |
Annual 2025 |
||
|
Total contained metal in concentrate and doré produced1 |
|
|
|||||
|
Gold2 |
oz |
51,438 |
59,863 |
214,225 |
187,363 |
170,000 - 200,000 |
180,000 - 220,000 |
|
Copper |
tonnes |
3,347 |
3,735 |
12,536 |
12,154 |
9,000 - 12,000 |
9,000 - 11,000 |
|
Zinc |
tonnes |
8,385 |
5,747 |
33,339 |
34,642 |
27,000 - 35,000 |
21,000 - 27,000 |
|
Silver3 |
oz |
283,223 |
255,579 |
995,090 |
851,723 |
750,000 - 1,000,000 |
800,000 - 1,000,000 |
|
Cost per ounce of gold produced |
|
|
|||||
|
Cash cost4 |
$/oz |
607 |
434 |
606 |
727 |
700 - 900 |
650 - 850 |
1 Metal reported in concentrate is prior to deductions associated with smelter terms.
2 Gold production guidance includes gold contained in concentrate produced and gold in doré.
3 Silver production guidance includes silver contained in concentrate produced and silver in doré.
4 Combined unit costs, cash cost per ounce of gold produced, net of by-product credits, are non-GAAP financial performance measures with no standardized definition under IFRS. For further information and a detailed reconciliation, please see the discussion under the "Non-GAAP Financial Performance Measures" section of this MD&A.
Full year 2024 gold and copper production both exceeded the upper end of our guidance range by 7% and 4%, respectively. Zinc production was in line with our annual guidance range, whereas silver production was at the top end of guidance range.
Full year 2024 cash cost per ounce of gold produced of $606 was better than expected and significantly outperformed the low end of the cost guidance range by 13%.
BRITISH COLUMBIA OPERATIONS REVIEW
|
|
|
Three months ended |
Year ended5 |
Since acquisition |
|
|
|
Dec. 31, 2024 |
Dec. 31, 2023 |
Dec. 31, 2024 |
Dec. 31, 2023 |
|
|
Ore mined1 |
tonnes |
2,374,044 |
2,627,398 |
11,360,125 |
6,975,389 |
|
Strip ratio2 |
|
7.36 |
5.34 |
5.98 |
3.82 |
|
Ore milled |
tonnes |
2,880,927 |
3,261,891 |
12,656,679 |
6,862,152 |
|
Copper |
% |
0.26 |
0.33 |
0.25 |
0.35 |
|
Gold |
g/tonne |
0.09 |
0.06 |
0.08 |
0.07 |
|
Silver |
g/tonne |
0.92 |
1.36 |
0.96 |
1.36 |
|
Copper concentrate |
tonnes |
25,554 |
38,056 |
113,528 |
82,685 |
|
Concentrate grade |
% Cu |
23.2 |
22.4 |
23.3 |
23.1 |
|
Copper recovery |
% |
79.5 |
78.8 |
82.4 |
79.7 |
|
Gold recovery |
% |
55.8 |
54.1 |
60.5 |
55.9 |
|
Silver recovery |
% |
69.0 |
73.8 |
71.8 |
73.0 |
|
Combined unit operating costs3,4 |
C$/tonne |
23.22 |
20.90 |
20.39 |
21.38 |
1 Reported tonnes and grade for ore mined are estimates based on mine plan assumptions and may not reconcile fully to ore milled.
2 Strip ratio is calculated as waste mined divided by ore mined.
3 Reflects combined mine, mill and general and administrative ("G&A") costs per tonne of ore milled. Reflects the deduction of expected capitalized stripping costs.
4 Combined unit costs is a non-GAAP financial performance measure with no standardized definition under IFRS. For further information and a detailed reconciliation, please see the discussion under the "Non-GAAP Financial Performance Measures" section of this MD&A.
5 Copper Mountain mine results are stated at 100%. Hudbay owns 75% of Copper Mountain mine. As Copper Mountain was acquired on June 20, 2023, the results for the year ended December 31, 2023 represents the period from the acquisition date, June 20, 2023, through to the end of the fourth quarter of 2023.
|
|
|
Three months ended |
Year ended2 |
Since acquisition |
|
|
|
|
Dec. 31, 2024 |
Dec. 31, 2023 |
Dec. 31, 2024 |
Dec. 31, 2023 |
|
Contained metal in concentrate produced |
|
|
|
|
|
|
Copper |
tonnes |
5,927 |
8,508 |
26,406 |
19,050 |
|
Gold |
oz |
4,644 |
3,495 |
19,789 |
8,848 |
|
Silver |
oz |
58,933 |
105,295 |
280,499 |
218,282 |
|
Payable metal sold |
|
|
|
|
|
|
Copper |
tonnes |
5,831 |
9,119 |
25,354 |
18,075 |
|
Gold |
oz |
5,036 |
3,091 |
19,735 |
8,420 |
|
Silver |
oz |
43,747 |
98,441 |
249,536 |
189,443 |
|
Cost per pound of copper produced |
|
|
|
|
|
|
Cash cost1 |
$/lb |
3.00 |
2.67 |
2.74 |
2.49 |
|
Sustaining cash cost1 |
$/lb |
5.76 |
3.93 |
5.29 |
3.41 |
1 Cash cost and sustaining cash cost, net of by-product credits, are non-GAAP financial performance measures with no standardized definition under IFRS. For further information and a detailed reconciliation, please see the discussion under the "Non-GAAP Financial Performance Measures" section of this MD&A.
2 Copper Mountain mine results are stated at 100%. Hudbay owns 75% of Copper Mountain mine. As Copper Mountain was acquired on June 20, 2023, the results for the year ended December 31, 2023 represents the period from the acquisition date, June 20, 2023, through to the end of the fourth quarter of 2023.
Overview
Since acquiring Copper Mountain in June 2023, Hudbay has been focused on advancing operational stabilization plans, including opening up the mine by re-activating the full mining fleet, adding additional haul trucks, adding additional mining faces, optimizing the ore feed to the plant and implementing plant improvement initiatives that mirror Hudbay's successful processes at Constancia. These stabilization plans have successfully increased the total tonnes moved and resulted in stronger mill performance as demonstrated by high mill availability of 92% and copper recoveries of 82% in 2024, compared to 85% and 80% respectively, in 2023.
Efforts are now focused on optimizing the operations in 2025. Mining activities will continue to execute the three-year accelerated stripping program intended to bring higher grade ore into the mine plan. In January, we completed feasibility engineering to debottleneck and increase the nominal plant capacity to its permitted capacity of 50,000 tonnes per day earlier than contemplated in the most recent technical report.
Mining Activities
Total ore mined at Copper Mountain in the fourth quarter of 2024 was 2.4 million tonnes, a decrease of 10% compared to the fourth quarter of 2023. As planned, ore stockpiles were utilized as ore feed to the mill while the mine operation team increased waste stripping activities. Total material moved continued to ramp up in the quarter to 21.4 million tonnes, compared to 18.3 million tonnes in the same period last year, as a result of effective usage of the mining fleet to execute the accelerated stripping program to access higher head grades. The focus in the fourth quarter of 2024 was on mining efficiencies and operator recruitment to effectively utilize the available haul truck fleet. As a result, total material moved is expected to increase quarter-over-quarter in 2025 as per the mine plan.
Milling Activities
The mill processed 2.9 million and 12.7 million tonnes of ore during the fourth quarter and the year ended December 31, 2024, respectively. Ore processed in the fourth quarter of 2024 was 12% lower than the fourth quarter of 2023, limited by both planned and unplanned maintenance and elevated clay material which impacted the secondary crushing circuit. In the fourth quarter of 2024, a number of initiatives were advanced to address these issues and other identified constraints to improve throughput to targeted levels. Several mill initiatives have been implemented in 2024, including, recovery improvements, reprogramming the mill expert system, installation of advanced semi-autogenous grinding control instrumentation, redesigned SAG liner package and updated operational procedures intended to remove magnetite from the pebble stream. Progressive improvements are expected to continue through 2025.
Milled copper grades during the fourth quarter of 2024 were 21% lower than the fourth quarter of 2023 as we continued to draw on lower grade stockpiled ore. Copper recoveries of 79.5% were higher than the fourth quarter of 2023 but were impacted by the ramp-up periods following the planned and unplanned maintenance shutdowns during the quarter. Milled gold grades were higher in the fourth quarter of 2024 than the same period in 2023, resulting in higher gold recoveries of 55.8% in the fourth quarter of 2024.
Full year 2024 copper recoveries of 82.4% were higher than 2023 and exceeded the mine plan expectations, despite processing lower grades, as the operations improved the regrind circuit constraint and implemented the flotation operational strategy improvements, including reagent selection and dose modification. Full year gold recoveries of 60.5% were higher than 2023 due to higher milled gold grades.
Production and Sales Performance
During the fourth quarter of 2024, production of copper, gold and silver was 5,927 tonnes, 4,644 ounces and 58,933 ounces, respectively. Production of copper and silver decreased by 30% and 44%, respectively, compared to the fourth quarter of 2023 primarily as a result of lower head grades from the use of stockpiled ore to feed the mill and lower mill throughput as a result of planned and unplanned maintenance shutdowns. Gold production increased by 33% compared to the fourth quarter of 2023 due to higher gold grades and recoveries.
During the year ended December 31, 2024, production of copper, gold and silver was 26,406 tonnes, 19,789 ounces and 280,499 ounces, respectively.
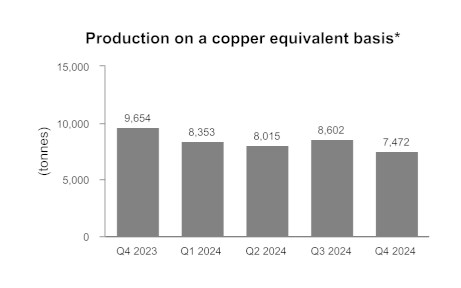
*Copper equivalent production is calculated using the quarter average LME prices for each metal excluding molybdenum. Copper Mountain mine production are stated at 100%. Hudbay owns 75% of Copper Mountain mine.
Cost Performance
Combined mine, mill and G&A unit operating costs in the fourth quarter of 2024 were C$23.22 per tonne milled, 11% higher than the fourth quarter of 2023. This was primarily due to lower ore milled during the fourth quarter, as a result of the previously mentioned planned and unplanned maintenance activities.
Combined mine, mill and G&A unit operating costs during the year ended December 31, 2024 were C$20.39 per tonne milled versus C$21.38 per tonne milled in second half of 2023 (or first six months since acquisition).
Cash cost and sustaining cash cost per pound of copper produced, net of by-product credits, in the fourth quarter of 2024 were $3.00 and $5.76, respectively. Cash cost was 12% higher than in the fourth quarter of 2023 largely due to lower copper production as described above, partially offset by higher by-product credits. Sustaining cash costs were 47% higher than the fourth quarter of 2023 mainly as a result of planned higher capitalized stripping costs in accordance with our accelerated stripping program to access higher grade ore.
Cash cost and sustaining cash cost per pound of copper produced, net of by-product credits, during the year ended December 31, 2024 were $2.74 and $5.29, respectively.
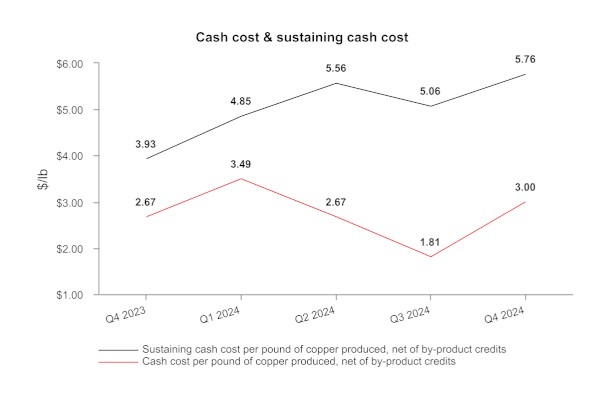
British Columbia Guidance Outlook
|
|
|
Three months ended |
Year ended2 |
Since |
Guidance |
||
|
|
|
Dec. 31, |
Dec. 31, |
Dec. 31, |
Dec. 31, |
Annual 2024 |
Annual 2025 |
|
Contained metal in concentrate produced |
|
|
|
|
|
|
|
|
Copper |
tonnes |
5,927 |
8,508 |
26,406 |
19,050 |
30,000 - 44,000 |
28,000 - 41,000 |
|
Gold |
oz |
4,644 |
3,495 |
19,789 |
8,848 |
17,000 - 26,000 |
18,500 - 28,000 |
|
Silver |
oz |
58,933 |
105,295 |
280,499 |
218,282 |
300,000 - 455,000 |
245,000 - 365,000 |
|
Cost per pound of copper produced |
|
|
|
|
|
|
|
|
Cash cost1 |
$/lb |
3.00 |
2.67 |
2.74 |
2.49 |
2.00 - 2.50 |
2.45 - 3.45 |
1 Cash cost, net of by-product credits, are non-GAAP financial performance measures with no standardized definition under IFRS. For further information and a detailed reconciliation, please see the discussion under the "Non-GAAP Financial Performance Measures" section of this MD&A.
2 Copper Mountain mine results are stated at 100%. Hudbay owns 75% of Copper Mountain mine. As Copper Mountain was acquired on June 20, 2023, the results for the year ended December 31, 2023 represents the period from the acquisition date, June 20, 2023, through to the end of the fourth quarter of 2023.
Full year 2024 gold production was in line with our annual guidance range, whereas copper and silver production were below the guidance ranges for each metal primarily as a result of lower grades in stockpiled ore and lower throughput during the ramp-up of stabilization and optimization efforts throughout the year.
Cash cost per pound of copper produced was $2.74 which was above the higher end of the cost guidance range driven by lower copper production as mentioned above.
OUTLOOK
This outlook includes forward-looking information about our operations and financial expectations based on our expectations and outlook as of February 18, 2025.
This outlook, including expected results and targets, is subject to various risks, uncertainties and assumptions, which may impact future performance and our achievement of the results and targets discussed in this section. For additional information on forward-looking information, refer to the "Forward-Looking Information" section of this MD&A. We may update our outlook depending on changes in metals prices and other factors, as per our "Commodity Markets" and "Sensitivity Analysis" discussions below. In addition to this section, refer to the "Operations Review", "Financial Review" and "Liquidity and Capital Resources" sections for additional details on our outlook for 2025.
Material Assumptions
Our annual production and operating cost guidance, along with our annual capital and exploration expenditure forecasts are discussed in detail below.
Production Guidance
|
Contained Metal in Concentrate and Doré1 |
2025 Guidance |
Year ended Dec. 31, 2024 |
2024 Guidance |
|
|
Peru |
|
|
|
|
|
Copper |
tonnes |
80,000 - 97,000 |
99,001 |
98,000 - 120,000 |
|
Gold |
oz |
49,000 - 60,000 |
98,226 |
76,000 - 93,000 |
|
Silver |
oz |
2,475,000 - 3,025,000 |
2,708,262 |
2,500,000 - 3,000,000 |
|
Molybdenum |
tonnes |
1,300 - 1,500 |
1,323 |
1,250 - 1,500 |
|
|
|
|
|
|
|
Manitoba |
|
|
|
|
|
Gold |
oz |
180,000 - 220,000 |
214,225 |
170,000 - 200,000 |
|
Zinc |
tonnes |
21,000 - 27,000 |
33,339 |
27,000 - 35,000 |
|
Copper |
tonnes |
9,000 - 11,000 |
12,536 |
9,000 - 12,000 |
|
Silver |
oz |
800,000 - 1,000,000 |
995,090 |
750,000 - 1,000,000 |
|
|
|
|
|
|
|
British Columbia |
|
|
|
|
|
Copper |
tonnes |
28,000 - 41,000 |
26,406 |
30,000 - 44,000 |
|
Gold |
oz |
18,500 - 28,000 |
19,789 |
17,000 - 26,000 |
|
Silver |
oz |
245,000 - 365,000 |
280,499 |
300,000 - 455,000 |
|
|
|
|
|
|
|
Total |
|
|
|
|
|
Copper |
tonnes |
117,000 - 149,000 |
137,943 |
137,000 - 176,000 |
|
Gold |
oz |
247,500 - 308,000 |
332,240 |
263,000 - 319,000 |
|
Zinc |
tonnes |
21,000 - 27,000 |
33,339 |
27,000 - 35,000 |
|
Silver |
oz |
3,520,000 - 4,390,000 |
3,983,851 |
3,550,000 - 4,455,000 |
|
Molybdenum |
tonnes |
1,300 - 1,500 |
1,323 |
1,250 - 1,500 |
1 Metal reported in concentrate and doré is prior to refining losses or deductions associated with smelter terms.
2 Represents 100% of the production from the Copper Mountain mine. Hudbay holds a 75% interest in the Copper Mountain mine.
On a consolidated basis, we successfully achieved 2024 production guidance for all metals. On a business unit stand-alone basis, Peru exceeded the top end of the gold production guidance range and achieved the guidance ranges for all other metals. Manitoba exceeded the top end of the gold and copper production guidance ranges and achieved the guidance ranges for all other metals. In British Columbia, copper production was below the low end of the guidance range as a result of lower grades in stockpiled ore and reduced throughput during the mill stabilization period, while gold production was within the guidance range.
In 2025, consolidated copper production is forecasted to remain stable with 2024 levels at 133,000 tonnes1. This is a result of slightly lower grades in Peru with a lower portion of ore feed from Pampacancha as it depletes at the end of 2025, offset by higher expected production in British Columbia as a result of mill throughput ramp-up throughout the year and higher expected grades from the accelerated stripping schedule. Consolidated gold production in 2025 is expected to decrease by 16% to 277,750 ounces1 due to the accelerated mining of high grade gold benches at Pampacancha in 2024 and a focus on high grade gold zones at Lalor in 2024 which resulted in both Peru and Manitoba exceeding the top end of the 2024 gold production guidance ranges.
In Peru, 2025 copper production is expected to be 88,500 tonnes1, a decrease of 11% from 2024 with less mill ore feed coming from Pampacancha in 2025. Gold production is expected to be 54,500 ounces1, lower than 2024 levels as additional high grade gold benches were mined in late 2024, ahead of schedule, resulting in gold production exceeding 2024 guidance levels. The Pampacancha deposit is now expected to be depleted in early December 2025 as opposed to October 2025, as the mine plan has smoothed Pampacancha production throughout the year. Total mill ore feed from Pampacancha is expected to be approximately 25% in 2025, lower than the typical one-third in prior years as Pampacancha approaches depletion. Peru's 2025 production guidance reflects a period of higher stripping activities at Pampacancha from January until April, as well as regularly scheduled semi-annual mill maintenance shutdowns at Constancia during the second and fourth quarters of 2025.
In Manitoba, 2025 gold production is anticipated to be 200,000 ounces1, a decrease of 7% from the record levels achieved in 2024. The impressive operating performance is expected to continue into 2025, resulting in new 2025 gold production guidance to be 8% higher than the previous 2025 guidance of 185,000 ounces1. The production guidance anticipates Lalor operating at 4,500 tonnes per day supplemented by 45,000 tonnes of ore feed from the 1901 deposit in 2025 as we confirm the optimal mining method. New Britannia mill throughput is expected to continue to exceed expectations and operate at 2,000 tonnes per day in 2025, far exceeding its original design capacity of 1,500 tonnes per day. Zinc production for 2025 is expected to be 24,000 tonnes1, a 28% decline from 2024 due to a lower grade base metal mining sequence at Lalor.
In British Columbia, 2025 copper production is expected to be 34,500 tonnes1, a 31% increase from 2024 as a result of mill throughput ramp-up in the second half of the year from several mill initiatives, including the planned conversion of the third ball mill to a second SAG mill, and higher grades from the accelerated stripping schedule. The mill throughput ramp-up reflects the first half of 2025 at similar throughput levels seen in 2024 with a significant increase in throughput in the second half of 2025 concurrent with the completion of second SAG mill project, ramping up towards 50,000 tonnes per day in 2026.
We will release updated three-year production outlook together with our annual mineral reserve and resource update in March 2025.
Cash Cost Guidance
Copper remains the primary revenue contributor on a consolidated basis, and therefore, consolidated cost guidance has been presented as cash cost per pound of copper produced, net of by-product credits. We have also provided cash cost guidance for each of our operations based on their respective primary metal contributors.
|
Cash cost 1 |
2025 Guidance |
Year ended Dec. 31, 2024 |
2024 Guidance5 |
|
|
Peru cash cost per pound of copper2 |
$/lb |
1.35 - 1.65 |
1.18 |
1.25 - 1.60 |
|
Manitoba cash cost per ounce of gold3 |
$/oz |
650 - 850 |
606 |
700 - 900 |
|
British Columbia cash cost per pound of copper4 |
$/lb |
2.45 - 3.45 |
2.74 |
2.00 - 2.50 |
|
|
|
|
|
|
|
Consolidated cash cost per pound of copper2 |
$/lb |
0.80 - 1.00 |
0.46 |
0.65 - 0.85 |
|
Consolidated sustaining cash cost per pound of copper2 |
$/lb |
2.25 - 2.65 |
1.62 |
1.75 - 2.20 |
1 Cash cost and sustaining cash cost, net of by-product credits, per pound of copper produced and cash costs, net of by-product credits, per ounce of gold produced are non-GAAP financial performance measure with no standardized definition under IFRS. For further information and a detailed reconciliation, please see the discussion under the "Non-GAAP Financial Performance Measures" section of this MD&A.
2 Peru cash cost, net of by-product credits, per pound of produced assumes by-product credits are calculated using the gold and silver deferred revenue drawdown rates for the streamed ounces in Peru in effect on December 31, 2024 and the following commodity price for 2025: $2,500 per ounce gold, $26.00 per ounce silver and $18.00 per pound molybdenum.
3 Manitoba cash cost, net of by-product credits, per ounce of gold assumes by-product credits are calculated using the following commodity prices for 2025: $4.10 per pound copper, $26.00 per ounce silver, $1.20 per pound zinc and an exchange rate of 1.35 C$/US$.
4 British Columbia cash cost, net of by-product credits, per pound of copper assumes by-product credits are calculated using the following commodity price assumptions for 2025: $2,500 per ounce gold, $26.00 per ounce silver and an exchange rate of 1.35 C$/US$.
5 We had improved our 2024 annual consolidated cash cost guidance range to $0.65 to $0.85 per pound from the original guidance range of $1.05 to $1.25 per pound. We have also improved our 2024 annual sustaining cash cost guidance range to $1.75 to $2.20 per pound from the original guidance range of $2.00 to $2.45 per pound.
Consolidated cash cost in 2025 is expected to be within $0.80 to $1.00 per pound of copper, net of by-product credits, as we continue to focus on maintaining strong cost control across the business, driving industry-leading margins. Sustaining cash cost in 2025 is expected to be within $2.25 to $2.65 per pound of copper, net of by-product credits, reflecting slightly lower copper production, lower by-product credits and higher sustaining capital expenditures compared to 2024.
Copper cash cost in Peru is expected to be between $1.35 to $1.65 per pound in 2025, reflecting steady unit operating cost performance, offset by lower copper production and by-product credits compared to 2024.
Gold cash cost in Manitoba is expected to be between $650 to $850 per ounce in 2025, an increase compared to 2024 as a result of lower by-product credits and slightly lower gold production but remains at industry-low levels driving strong margins compared to current gold prices.
Copper cash cost in British Columbia is expected to be between $2.45 to $3.45 per pound in 2025, an increase from 2024 due to higher mining costs related to more material moved as we execute the planned accelerated stripping program and higher milling costs as we implement the mill improvement projects this year, partially offset by higher copper production.
Capital Expenditure Guidance
|
Capital Expenditures1 |
2025 Guidance5 |
Year ended Dec. 31, 2024 |
2024 Guidance6 |
|
Sustaining capital 2 |
|
|
|
|
Peru 3 |
170.0 |
124.4 |
130.0 |
|
Manitoba |
60.0 |
45.6 |
55.0 |
|
British Columbia - sustaining capital |
50.0 |
51.5 |
35.0 |
|
British Columbia - capitalized stripping 3 |
85.0 |
71.6 |
70.0 |
|
Total sustaining capital |
365.0 |
293.1 |
290.0 |
|
Growth capital |
|
|
|
|
Peru |
25.0 |
0.8 |
2.0 |
|
Manitoba 4 |
15.0 |
7.0 |
10.0 |
|
British Columbia |
75.0 |
8.1 |
5.0 |
|
Arizona 6 |
90.0 |
28.9 |
45.0 |
|
Total growth capital |
205.0 |
44.8 |
62.0 |
|
Capitalized exploration5 |
10.0 |
12.2 |
8.0 |
|
Total |
580.0 |
350.1 |
360.0 |
1 Excludes capitalized costs not considered to be sustaining or growth capital expenditures.
2 Sustaining capital guidance excludes right-of-use lease additions, additions as a result of equipment financing arrangements, and non-cash deferred stripping.
3 Includes capitalized stripping and development costs.
4 2025 Manitoba growth capital partially funded by approximately $5 million in Canadian Development Expense flow-through financing proceeds (2024 - $3 million).
5 2025 Canadian capital expenditures guidance is converted into U.S. dollars using an exchange rate of 1.35 C$/US$.
6 2024 Arizona growth capital guidance was increased by an additional $25 million, compared to the original 2024 guidance of $20 million, related to early feasibility study work after receipt of the Aquifer Protection Permit in August 2024.
2024 total capital expenditures were $10 million lower than our full year guidance of $360 million as lower growth capital and certain sustaining capital deferrals were partially offset by higher sustaining capital in British Columbia.
2025 total capital expenditures are expected to be $580 million, reflecting an increase in growth capital spend as we reinvest in several high-return growth projects as well as higher sustaining capital at the operations, including some deferrals from 2024, as discussed below.
Peru 2025 sustaining capital expenditures are expected to increase to $170 million as a result of higher capitalized stripping, mine equipment purchases and capital deferrals from 2024. Peru 2025 growth capital expenditures of $25 million in 2025 relates primarily to the installation of a pebble crusher to increase mill throughput starting in 2026 and other mill optimization initiatives.
Manitoba 2025 sustaining capital expenditures are expected to increase to $60 million primarily as a result of additional underground capitalized development costs. Manitoba 2025 growth capital spending of $15 million relates to the development of the exploration and haulage drifts at the 1901 deposit. The 1901 growth expenditures will be partially funded by $5 million in proceeds from a Canadian Development Expense premium flow-through financing in December 2024. Manitoba spending guidance excludes approximately $15 million of annual care and maintenance costs related to the Flin Flon facilities in 2025, which are expected to be recorded as other operating expenses.
British Columbia 2025 sustaining capital expenditures are expected to remain consistent with 2024 at $50 million for mine and mill equipment capital. In addition, we expect to spend approximately $85 million for capitalized stripping costs in 2025 related to continued accelerated stripping as part of the three-year stabilization and optimization plan at Copper Mountain. British Columbia 2025 growth capital spending of $75 million includes approximately $55 million for the conversion of the third ball mill to a second SAG mill to increase throughput rates starting in the second half of 2025 and ramping up to 50,000 tonnes per day in 2026.
Arizona 2025 growth capital spending of $90 million includes approximately $65 million in costs related to de-risking activities and definitive feasibility studies for Copper World and $25 million of typical annual holding costs.
Exploration Guidance
|
(in $ millions) |
|
Year ended |
|
|
2025 Guidance |
Dec. 31, 2024 |
2024 Guidance |
|
|
Peru1 |
19.0 |
19.8 |
17.0 |
|
Manitoba2 |
30.0 |
26.4 |
23.0 |
|
British Columbia |
1.0 |
1.6 |
2.0 |
|
Arizona and other |
- |
1.8 |
1.0 |
|
Total exploration expenditures |
50.0 |
49.6 |
43.0 |
|
Capitalized spending |
(10.0) |
(12.2) |
(8.0) |
|
Total exploration expense |
40.0 |
37.4 |
35.0 |
1 Peru exploration expenditures exclude $5 million of non-cash amortization of community agreements for exploration properties.
2 Manitoba exploration partially funded by approximately $7 million in Canadian Exploration Expense flow-through financing proceeds for 2025 (2024 - $11 million).
2025 exploration expenditures are expected to total $40 million, in line with 2024 exploration spending as we continue to execute a multi-year extensive geophysics and drilling program in Snow Lake to extend mine life and explore for new discoveries, as described below.
In Manitoba, 2025 exploration activities will focus on completing the largest geophysics program in our history, including 800 kilometres of ground electromagnetic surveys and an extensive airborne geophysics survey. We plan to complete underground and surface drilling at Lalor to increase mineral resource and reserve estimates, including follow-up drilling at the new Lalor Northwest discovery. Underground drilling is planned for 1901 from the new exploration drift to upgrade and expand the mineral reserve and resource estimates. In addition, we plan to continue drilling activities at several regional targets in 2025, including the Cook Lake properties, following up on encouraging results in 2024. A portion of the 2025 Manitoba exploration program will be funded by $7 million in proceeds from a critical minerals premium flow-through financing completed in December 2024. We issued 476,200 Canadian Exploration Expense flow-through common shares of the Company, at a price of C$22.05 per share, representing a premium of approximately 65%.
In Peru, 2025 exploration activities will continue to focus on final permitting and drill preparation for the Maria Reyna and Caballito properties near Constancia.
|
|
1 Calculated using the midpoint of the guidance range Our 2025 operational and financial performance will be influenced by a variety of factors including our production volumes, metal prices and input costs.
Commodity Markets
The general performance of the Chinese, North American and global economies will influence the demand for copper and zinc and the prices we receive, while interest rates, inflation, the performance of financial markets, the amount of central bank gold purchases and the level of geopolitical uncertainty will drive the price we receive for our gold.
Whilst the pace of potential central banks interest rate reductions was a high profile driver of economic uncertainty in 2024, 2025 will be dominated by tariffs and trade wars stemming from the Trump White House. The magnitude of these tariffs, which countries are ultimately targeted, the duration of the tariffs, the breadth of products and services targeted, which countries these tariffs are directed against and the retaliatory tariffs imposed by other nations will determine how profound the effect is on world economic growth, trade flows, inflation, foreign exchange rates and the prices that Hudbay receives for its products. Hudbay does not currently sell any concentrate or precious metal doré into the USA from Canada so the tariffs currently contemplated by the US administration will not have any significant direct effect on our sales revenues.
The realized prices we achieve in the commodity markets significantly affect our financial performance. Our general expectations regarding metals prices and foreign exchange rates are included below and in the "Sensitivity Analysis" section of this MD&A.
We have developed the following market analysis from various information sources including analyst and industry experts and our own market intelligence.
Copper
In 2024, the London Metal Exchange ("LME") Cash copper price began the year by declining by $0.20 per pound until mid-February before surging to a an annual high of $5.03 per pound on May 21 on the strength of unprecedented investment interest, the anticipation of strong manufacturing demand in China, the LME's ban on Russian copper and a technical squeeze that developed on the Commodities Exchange ("Comex") in New York. After this initial run to over $5 per pound, LME Cash copper prices spent the balance of the year trading between $4.00 and $4.60 per pound with 2024 prices averaging $4.15 for the full year.
The LME contango between cash and 3-month was at its highest level in 10 years during 2024, owing to a well-supplied market, high prices and high interest rates, all of which figure into the contango equation. This large contango combined with the quotational period options that are a common component of sales contracts in the copper industry, has allowed traders to subsidize the purchase of concentrates, allowing spot TC/RCs to remain close to zero and sometimes negative for most of the past year. Low and negative TC/RCs have occurred briefly historically but for very short periods of time, making the current situation unprecedented.
2025 is likely to be a bumpy year for copper prices owing to the tremendous economic uncertainly introduced by potential tariffs which could have a negative effect on copper demand if they tip the world economy into recession or lead to temporary spikes in prices due to dislocations in the world's supply chain for copper concentrates and copper metal. Copper prices may also be impacted by western world smelter curtailments or closures due to low TC/RCs which could reduce supply although governments would most likely intervene to prevent these outcomes.
Growing future demand for copper, driven by the energy transition and AI data centres, will necessitate the development of intrinsically higher capital cost greenfield mines from the world's remaining inventory of lower-grade undeveloped copper deposits, which, in combination with higher operating costs and taxes, is expected to result in significantly higher copper prices in 2027 and beyond.
Zinc
The LME zinc price spent the first quarter of 2024 rangebound between $1.05 and $1.15 per pound, where it had traded for most of 2023. However, during the balance of the year, the price was more robust, trading between $1.20 and $1.40 per pound which brought the average price for 2024 to $1.26 per pound. In January 2025, the zinc price softened, declining to $1.23 per pound.
In 2025, two large new zinc mines are scheduled to ramp up in China and Russia which is expected to increase global mine production by 1.9% according to CRU. With demand forecast to be almost flat there does not appear to be a great incentive for prices to increase from current levels as they did in 2024 although it is possible that low treatment charges for zinc concentrate may cause smelters in China to curtail production and produce less metal which would be positive for the zinc price.
Gold
The physical supply and demand for gold is not an arbitrator of future prices as it is with base metals because most of the gold ever mined is stored in bank vaults. Gold is an investment that has traditionally provided a safe haven for investors during uncertain economic times, as well as a hedge against inflation, future currency devaluation and declining values of other riskier asset classes. The decline in interest rates in 2024, coupled with the election of a new president in the USA who has promised to enact policies which are considered to be inflationary, drove gold prices on the London Bullion Market to their best year since 2020 with prices up almost 26% to $2,609 per ounce on December 31. In the first month of 2025, the gold price maintained its momentum, hitting an all-time high of over $2,800 per ounce at the end of January as Donald Trump prepared to introduce tariffs on Canada, Mexico and China.
While continued interest rate reductions by the US Federal Reserve are temporarily on hold there is more than enough concern about the inflationary nature of the Trump policy agenda to be supportive of higher gold prices in the near term and most industry observers and participants have raised their long-term price projections for gold to over $1,900 per ounce.
Treatment Charges, Refining Charges, and Freight Costs
Hudbay's operating margins are affected by a variety of third-party processing charges and logistics costs that must be incurred to convert our concentrates into refined metal. For the copper, zinc and molybdenum concentrates that we produce, we pay freight costs to deliver these products from our facilities to our customers which include, depending on the destination, various combinations of truck, rail or ocean freight costs along with warehousing and loading fees. We also pay treatment and refining charges ("TC/RCs") to our customers who process our copper concentrates. For precious metal doré we produce, we incur transportation costs to ship to a third-party refinery.
A portion of our copper concentrate sales are made under multi-year contracts, with a link to annual benchmark treatment and refining charges. The large decline in annual treatment/refining charges from 2024 to 2025 reflects how exceptionally undersupplied the copper concentrate market is this year. The 2025 benchmark treatment and refining charges have been agreed with Chinese smelters at $21.25/2.125 cents, representing a dramatic fall from last year's benchmark of $80/8 cents. This represents a decline of approximately $0.17 per pound of copper compared to 2024 levels. Spot TC/RCs for copper concentrates have been in low single digits to negative $15/1.5 cents since early in 2024 and remain in this range due to the undersupplied smelter market that has driven the 2025 benchmark to record lows. With terms at current levels many non-integrated smelters in the western world and many smaller custom smelters in China will be under economic pressure to reduce output or temporarily shutter their facilities.
Hudbay is also exposed to zinc concentrate treatment charges, as a seller of zinc concentrate. The 2025 zinc concentrate benchmark has not been established yet, however industry expectations are that the 2025 benchmark will decrease substantially from the $160 per tonne benchmark in 2024 given that spot processing terms for zinc concentrates in 2024 have been around zero dollars per tonne for most of the year for many of the same reasons that the copper concentrate terms have been depressed.
Bulk ocean freight rates for our concentrates remained depressed in early 2025, continuing the market weakness experienced during Q4 of 2024. There is considerable uncertainty regarding rates for the balance of 2025, in part due to potential changing trade flows resulting from the imposition of tariffs by the Trump administration which will disrupt traditional trade flows and geopolitical related oil price uncertainty both of which could lead to increased global freight rates. Alternatively, if the world economy tips into recession global freight rates could further decline. Hudbay locked in ocean freight rates for approximately 45% of our Peruvian requirements for 2025 and 2026 and may seek to lock in additional fixed rates for the balance of our production over the same period.
Sensitivity Analysis
The following table displays the estimated impact of changes in metals prices and foreign exchange rates on our 2025 net profit, earnings per share and operating cash flow, assuming that our operational performance is consistent with the mid-point of our guidance for 2025. The effects of a given change in an assumption are calculated in isolation.
|
|
2025 Base |
Change of +/-10% |
Impact on |
Impact on |
Impact on Operating CF |
|
Metals Prices |
|
|
|
|
|
|
Copper price2 |
$4.10/lb |
$0.41/lb |
$75M |
$0.19 |
$100M |
|
Gold price3 |
$2,500/oz |
$250/oz |
$31M |
$0.08 |
$56M |
|
Zinc price |
$1.20/lb |
$0.12/lb |
$3M |
$0.01 |
$6M |
|
Exchange Rates 4 |
|
|
|
|
|
|
C$/US$ |
1.35 |
0.14 |
$63M |
$0.16 |
$62M |
1 Based on 394.9 million common shares outstanding as at December 31, 2024.
2 Quotational period hedging program neutralizes provisional pricing adjustments.
3 Gold price sensitivity also includes an impact of a +/- 10% change in the silver price (2025 assumption: $26.00/oz of silver).
4 Change in profit from operational performance only, does not include change in profit arising from translation of balance sheet accounts.
FINANCIAL REVIEW
Financial Results
In the fourth quarter of 2024, we recorded net earnings attributable to owners of $21.2 million compared to net earnings on the same basis of $30.7 million in the fourth quarter of 2023, representing a decrease in net earnings attributable to owners of $9.5 million. For the full year of 2024, we recorded net earnings attributable to owners of $76.7 million compared to net earnings on the same basis of $66.4 million for the same period in 2023, representing an increase in earnings attributable to owners of $10.3 million.
The following table provides further details on the makeup of this variance:
| (in $ millions) | Three months ended December 31, 2024 |
Year ended December 31, 20241 |
||||
| (Decrease) increase in components of earnings: | ||||||
| Revenues | (17.3 | ) | 331.2 | |||
| Cost of sales | ||||||
| Mine operating costs | 5.3 | (135.0 | ) | |||
| Depreciation and amortization | (0.4 | ) | (34.9 | ) | ||
| Selling and administrative expenses | 1.4 | (17.8 | ) | |||
| Exploration expenses | (0.8 | ) | (13.3 | ) | ||
| Re-evaluation adjustment - environmental obligation | 31.5 | (7.9 | ) | |||
| Other expenses | (11.5 | ) | (19.1 | ) | ||
| Net finance expense | 14.5 | (3.4 | ) | |||
| Tax expense | (36.9 | ) | (101.5 | ) | ||
| Increase in net earnings for the period | (14.2 | ) | (1.7 | ) | ||
| Change in non-controlling interest | 4.7 | 12.0 | ||||
| (Decrease) increase in net earnings attributable to owners for the period | (9.5 | ) | 10.3 |
1Copper Mountain mine results are stated at 100%. Hudbay owns 75% of Copper Mountain mine. As Copper Mountain was acquired on June 20, 2023, the results for the year ended December 31, 2023 represents the period from the acquisition date, June 20, 2023, through to the end of the fourth quarter of 2023.
Revenue
Revenue for the fourth quarter of 2024 was $584.9 million, $17.3 million lower than the same period in 2023, primarily due to lower sales volume of copper and gold in Peru from lower production levels and lower gold grade ore processed in Manitoba in line with the mine plan for the fourth quarter of 2024 partially offset by higher metal prices and lower treatment and refining charges.
Revenue during the year ended December 31, 2024 was $2,021.2 million, $331.2 million higher than in 2023, primarily as a result of higher metal prices, higher gold and silver sales volumes and incremental revenue as a result of the Copper Mountain mine acquisition.
While a majority of revenues continue to be from copper, gold is representing an increasing portion of total revenues at 35% in 2024 compared to 29% in 2023. This is as a result of higher gold production and strong leverage to higher gold prices in 2024, increasing commodity diversification and improving overall revenues.
The following table provides further details on these variances:
| (in $ millions) | Three months ended December 31, 2024 |
Year ended December 31, 2024 |
||||
| Metals prices1 | ||||||
| Higher copper prices | 26.9 | 76.1 | ||||
| Higher gold prices | 24.6 | 119.6 | ||||
| Higher zinc prices | 2.9 | 4.4 | ||||
| Higher silver prices | 1.7 | 7.6 | ||||
| Sales volumes | ||||||
| Lower copper sales volumes | (50.6 | ) | (112.1 | ) | ||
| (Lower) higher gold sales volumes | (25.0 | ) | 86.5 | |||
| Lower zinc sales volumes | (5.4 | ) | (9.3 | ) | ||
| Higher silver sales volumes | 2.2 | 5.4 | ||||
| British Columbia Business Unit2 | ||||||
| Copper | - | 129.6 | ||||
| Gold | - | 19.8 | ||||
| Silver | - | 4.3 | ||||
| Treatment & Refining | - | (7.7 | ) | |||
| Other | ||||||
| Molybdenum and other volume and pricing differences | (4.4 | ) | (8.4 | ) | ||
| Variable consideration adjustments | - | (8.7 | ) | |||
| Effect of lower treatment and refining charges | 9.8 | 24.1 | ||||
| (Decrease) increase in revenue in 2024 compared to 2023 | (17.3 | ) | 331.2 |
1 See discussion below for further information regarding metals prices.
2 Represents revenue for the period of January 1, 2024 through to June 30, 2024, where there was no comparable revenue in the comparative period due to the fact Copper Mountain mine was acquired on June 20, 2023.
Our revenue by significant product type is summarized below:
| Three months ended | Year ended | |||||||||||
| (in $ millions) | Dec. 31, 2024 | Dec. 31, 2023 | Dec. 31, 2024 | Dec. 31, 2023 | ||||||||
| Copper | 349.0 | 361.7 | 1,154.8 | 1,065.8 | ||||||||
| Gold | 199.6 | 183.8 | 673.6 | 463.0 | ||||||||
| Zinc | 16.4 | 18.7 | 71.1 | 76.6 | ||||||||
| Silver | 15.7 | 11.8 | 51.5 | 35.6 | ||||||||
| Molybdenum | 9.1 | 21.2 | 60.1 | 79.4 | ||||||||
| Other metals | 1.2 | - | 1.7 | 0.2 | ||||||||
| Revenue from contracts | 591.0 | 597.2 | 2,012.8 | 1,720.6 | ||||||||
| Amortization of deferred revenue - gold | 14.6 | 16.3 | 40.7 | 39.7 | ||||||||
| Amortization of deferred revenue - silver | 11.6 | 10.2 | 33.6 | 32.7 | ||||||||
| Amortization of deferred revenue - variable consideration adjustments - prior periods | - | - | (3.8 | ) | 4.9 | |||||||
| Pricing and volume adjustments1 | (6.4 | ) | 14.2 | 35.2 | 5.8 | |||||||
| Treatment and refining charges | (25.9 | ) | (35.7 | ) | (97.3 | ) | (113.7 | ) | ||||
| Revenue | 584.9 | 602.2 | 2,021.2 | 1,690.0 | ||||||||
1 Pricing and volume adjustments represents mark-to-market adjustments on provisionally prices sales, realized and unrealized changes to fair value for non-hedge derivative contracts (QP hedges) and adjustments to originally invoiced weights and assays.
For further detail on variable consideration adjustments, refer to note 22 of our consolidated financial statements.
Realized sales prices
This measure is intended to enable management and investors to understand the average realized price of metals sold to third parties in each reporting period. The average realized price per unit sold does not have any standardized meaning prescribed by IFRS, is unlikely to be comparable to similar measures presented by other issuers and should not be considered in isolation or a substitute for measures of performance prepared in accordance with IFRS.
For sales of copper, zinc, gold and silver we may enter into non-hedge derivatives ("QP hedges") which are intended to manage the provisional pricing risk arising from quotational period terms in concentrate sales agreements. The gains and losses on QP hedges are included in the calculation of realized prices. We expect that gains and losses on QP hedges will offset provisional pricing adjustments on concentrate sales contracts.
Our realized prices for the three months and year ended December 31, 2024 and 2023, respectively, are summarized below:
|
|
Realized prices1 for the |
|
Realized prices1 for the |
||||
|
Three months ended |
|
Year ended |
|||||
|
Prices |
LME QTD |
Dec. 31, 2024 |
Dec. 31, 2023 |
LME YTD 20242 |
Dec. 31, 2024 |
Dec. 31, 2023 |
|
|
Copper |
$/lb |
4.17 |
4.09 |
3.77 |
4.15 |
4.18 |
3.84 |
|
Zinc |
$/lb |
1.38 |
1.39 |
1.14 |
1.26 |
1.26 |
1.18 |
|
Gold3 |
$/oz |
|
2,327 |
2,062 |
|
2,241 |
1,898 |
|
Silver3 |
$/oz |
|
23.12 |
21.67 |
|
24.23 |
21.85 |
1 Realized prices exclude refining and treatment charges and are on the sale of finished metal or metal in concentrate. Realized prices include the effect of provisional pricing adjustments on prior period sales.
2 London Metal Exchange average for Cash copper and zinc prices.
3 Sales of gold and silver from Constancia mine are subject to our precious metals stream agreement with Wheaton, pursuant to which we recognize deferred revenue for precious metals deliveries and also receive cash payments. Stream sales are included within realized prices and their respective deferred revenue and cash payment rates can be found on page 45 of this MD&A.
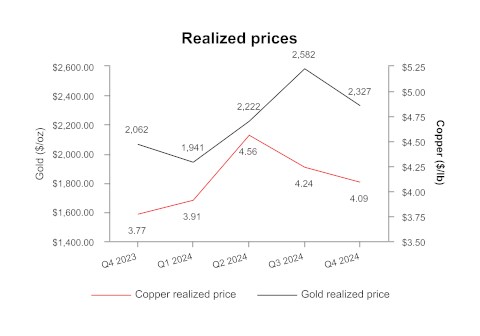
In addition to QP hedges, we may periodically undertake metal price hedging in accordance with Board approved policies to achieve strategic objectives, including locking in favourable metal prices to ensure minimum cash flows during or after the construction of a mine or during a period of reduced liquidity, to manage cash flows at shorter life or higher cost operations or as part of a financing arrangement. The realized prices, denoted in the table above, excludes the impact of derivative mark-to-market gains and losses on these non-QP hedges, which are included in change in fair value of financial instruments in our consolidated statement of earnings. The forward copper sales and zero cost collar hedges that were entered into in the first quarter of 2024, which represented a total of approximately 61% of Copper Mountain's 2024 production.
As of December 31, 2024, Hudbay had the following non-QP hedges outstanding:
- Forward sales contracts at the Copper Mountain mine for a total of 5.3 million pounds of copper over the period of January 2025 to April 2025 at an average price of $3.95 per pound; and
- Zero-cost collar program at the Copper Mountain mine for 6.6 million pounds of copper over a twelve month period of January 2025 to April 2025 at an average floor price of $3.88 per pound and an average cap price of $4.14 per pound.
The following tables provide a reconciliation of average realized price per unit sold, by metal, to revenues as shown in the consolidated financial statements.
| Three months ended December 31, 2024 | |||||||||||||||||||||
| (in $ millions except for realized price and payable metal sold) 1 | Copper | Gold | Zinc | Silver | Molybdenum | Other | Total | ||||||||||||||
| Revenue from contracts | 349.0 | 199.6 | 16.4 | 15.7 | 9.1 | 1.2 | 591.0 | ||||||||||||||
| Amortization of deferred revenue | - | 14.6 | - | 11.6 | - | - | 26.2 | ||||||||||||||
| Pricing and volume adjustments 3 | (6.6 | ) | 1.6 | (0.3 | ) | (0.7 | ) | (0.4 | ) | - | (6.4 | ) | |||||||||
| Revenue, including mark-to-market on QP hedges 4 | 342.4 | 215.8 | 16.1 | 26.6 | 8.7 | 1.2 | 610.8 | ||||||||||||||
| Realized non-QP derivative mark-to-market | (1.3 | ) | (2.9 | ) | - | - | - | - | (4.2 | ) | |||||||||||
| By-product credits 5 | 341.1 | 212.9 | 16.1 | 26.6 | 8.7 | 1.2 | 606.6 | ||||||||||||||
| Payable metal in concentrate and doré sold 6 | 37,927 | 92,734 | 5,261 | 1,150,518 | 182 | - | - | ||||||||||||||
| Realized price 7 | 9,028 | 2,327 | 3,060 | 23.12 | - | - | - | ||||||||||||||
| Realized price 8 | 4.09 | - | 1.39 | - | - | - | - | ||||||||||||||
| Year ended December 31, 2024 | |||||||||||||||||||||
| (in $ millions except for realized price and payable metal sold) 1 | Copper | Gold | Zinc | Silver | Molybdenum | Other | Total | ||||||||||||||
| Revenue from contracts 2 | 1,154.8 | 673.6 | 71.1 | 51.5 | 60.1 | 1.7 | 2,012.8 | ||||||||||||||
| Amortization of deferred revenue | - | 40.7 | - | 33.6 | - | - | 74.3 | ||||||||||||||
| Pricing and volume adjustments 3 | (3.6 | ) | 37.2 | (1.2 | ) | 0.9 | 1.9 | - | 35.2 | ||||||||||||
| Revenue, including mark-to-market on QP hedges 4 | 1,151.2 | 751.5 | 69.9 | 86.0 | 62.0 | 1.7 | 2,122.3 | ||||||||||||||
| Realized non-QP derivative mark-to-market | (5.2 | ) | (3.7 | ) | - | - | - | - | (8.9 | ) | |||||||||||
| By-product credits 5 | 1,146.0 | 747.8 | 69.9 | 86.0 | 62.0 | 1.7 | 2,113.4 | ||||||||||||||
| Payable metal in concentrate and doré sold 6 | 125,094 | 335,342 | 25,120 | 3,549,816 | 1,287 | - | - | ||||||||||||||
| Realized price 7 | 9,203 | 2,241 | 2,783 | 24.23 | - | - | - | ||||||||||||||
| Realized price 8 | 4.18 | - | 1.26 | - | - | - | - | ||||||||||||||
1 Average realized price per unit sold may not calculate based on amounts presented in this table due to rounding.
2 As per financial statements.
3 Pricing and volume adjustments represents mark-to-market adjustments on provisionally priced sales, realized and unrealized changes to fair value for QP hedge derivative contracts and adjustments to originally invoiced weights and assays.
4 Revenue, including mark-to-market on QP hedges is used in the calculation of realized price.
5 By-product credits subtotal is used in the calculated of cash cost per pound of copper and ounce of gold produced, net of by-product credits. Cash cost per pound of copper and per ounce of gold produced, net of by-product credits, are non-GAAP financial performance measures with no standardized definition under IFRS. For further information and a detailed reconciliation, please see the discussion under the "Non-GAAP Financial Performance Measures" section of this MD&A.
6 Copper, zinc and molybdenum shown in metric tonnes and gold and silver shown in ounces.
7 Realized price for copper and zinc in $/metric tonne and realized price for gold and silver in $/oz.
8 Realized price for copper and zinc in $/lb.
The price, quantity and mix of metals sold affect our revenue, operating cash flow and gross profit. Revenue from metals sales can vary from quarter to quarter due to production levels, shipping volumes and transfer of risk and title to customers.
| Three months ended December 31, 2023 | |||||||||||||||||||||
| (in $ millions except for realized price and payable metal sold) 1 | Copper | Gold | Zinc | Silver | Molybdenum | Other | Total | ||||||||||||||
| Revenue from contracts 2 | 361.7 | 183.8 | 18.7 | 11.8 | 21.2 | - | 597.2 | ||||||||||||||
| Amortization of deferred revenue | - | 16.3 | - | 10.2 | - | - | 26.5 | ||||||||||||||
| Pricing and volume adjustments 3 | 4.4 | 16.1 | (0.1 | ) | 0.7 | (6.9 | ) | - | 14.2 | ||||||||||||
| Revenue, including mark-to-market on QP hedges 4 | 366.1 | 216.2 | 18.6 | 22.7 | 14.3 | - | 637.9 | ||||||||||||||
| Realized non-QP derivative mark-to-market 5 | - | - | - | - | - | - | - | ||||||||||||||
| By-product credits 4 | 366.1 | 216.2 | 18.6 | 22.7 | 14.3 | - | 637.9 | ||||||||||||||
| Payable metal in concentrate and doré sold 6 | 44,006 | 104,841 | 7,385 | 1,048,879 | 468 | - | - | ||||||||||||||
| Realized price 7 | 8,319 | 2,062 | 2,519 | 21.67 | - | - | - | ||||||||||||||
| Realized price 8 | 3.77 | - | 1.14 | - | - | - | - | ||||||||||||||
| Year ended December 31, 2023 | |||||||||||||||||||||
| (in $ millions except for realized price and payable metal sold) 1 | Copper | Gold | Zinc | Silver | Molybdenum | Other | Total | ||||||||||||||
| Revenue from contracts 2 | 1,065.8 | 463.0 | 76.6 | 35.6 | 79.4 | 0.2 | 1,720.6 | ||||||||||||||
| Amortization of deferred revenue | - | 39.7 | - | 32.7 | - | - | 72.4 | ||||||||||||||
| Pricing and volume adjustments 3 | (8.3 | ) | 22.9 | (1.7 | ) | 0.4 | (7.5 | ) | - | 5.8 | |||||||||||
| Revenue, including mark-to-market on QP hedges 4 | 1,057.5 | 525.6 | 74.9 | 68.7 | 71.9 | 0.2 | 1,798.8 | ||||||||||||||
| Realized non-QP derivative mark-to-market 5 | - | - | - | - | - | - | - | ||||||||||||||
| By-product credits 4 | 1,057.5 | 525.6 | 74.9 | 68.7 | 71.9 | 0.2 | 1,798.8 | ||||||||||||||
| Payable metal in concentrate and dore sold 6 | 124,996 | 276,893 | 28,779 | 3,145,166 | 1,462 | - | - | ||||||||||||||
| Realized price 7 | 8,460 | 1,898 | 2,603 | 21.85 | - | - | - | ||||||||||||||
| Realized price 8 | 3.84 | - | 1.18 | - | - | - | - | ||||||||||||||
1 Average realized price per unit sold may not calculate based on amounts presented in this table due to rounding.
2 As per financial statements.
3 Pricing and volume adjustments represents mark-to-market adjustments on provisionally priced sales, realized and unrealized changes to fair value for non-hedge derivative contracts and adjustments to originally invoiced weights and assays.
4 By-product credits subtotal is used in the calculated of cash cost per pound of copper and ounce of gold produced, net of by-product credits. Cash cost per pound of copper and per ounce of gold produced, net of by-product credits, are non-GAAP financial performance measures with no standardized definition under IFRS. For further information and a detailed reconciliation, please see the discussion under the "Non-GAAP Financial Performance Measures" section of this MD&A.
5 Derivative mark-to-market excludes mark-to-market on QP hedges.
6 Copper, zinc and molybdenum shown in metric tonnes and gold and silver shown in ounces.
7 Realized price for copper and zinc in $/metric tonne and realized price for gold and silver in $/oz.
8 Realized price for copper and zinc in $/lb.
Precious metals - stream sales and realized price breakdown
The following table shows a breakdown of realized prices for precious metals inclusive of stream and offtaker revenue. It further identifies the components of the realized price for stream revenues between the amortized drawdown rate and cash payment rate.
| (in $ millions except for realized price and payable metal sold) | Gold | Silver | |||||||||||||||||||||||
| Three months ended | Year ended | Three months ended | Year ended | ||||||||||||||||||||||
| Revenue | Dec. 31, 2024 | Dec. 31, 2023 | Dec. 31, 2024 | Dec. 31, 2023 | Dec. 31, 2024 | Dec. 31, 2023 | Dec. 31, 2024 | Dec. 31, 2023 | |||||||||||||||||
| Stream | 22.2 | 24.7 | 61.8 | 60.1 | 16.6 | 14.3 | 48.0 | 45.9 | |||||||||||||||||
| Offtaker | 193.6 | 191.5 | 689.7 | 465.4 | 10.0 | 8.4 | 38.0 | 22.8 | |||||||||||||||||
| Revenue, including mark-to-market on QP hedges 3 | 215.8 | 216.2 | 751.5 | 525.5 | 26.6 | 22.7 | 86.0 | 68.7 | |||||||||||||||||
| Payable metal sold | |||||||||||||||||||||||||
| Stream | oz | 17,873 | 19,925 | 49,822 | 48,522 | 796,849 | 665,191 | 2,310,394 | 2,140,243 | ||||||||||||||||
| Offtaker | oz | 74,861 | 84,917 | 285,520 | 228,371 | 353,669 | 383,688 | 1,239,422 | 1,004,923 | ||||||||||||||||
| Total payable metal sold | oz | 92,734 | 104,842 | 335,342 | 276,893 | 1,150,518 | 1,048,879 | 3,549,816 | 3,145,166 | ||||||||||||||||
| Deferred revenue drawdown rate1 | $/oz | 817 | 820 | 817 | 820 | 14.56 | 15.26 | 14.56 | 15.26 | ||||||||||||||||
| Cash rate2 | $/oz | 425 | 420 | 423 | 418 | 6.26 | 6.20 | 6.23 | 6.17 | ||||||||||||||||
| Stream realized price | $/oz | 1,242 | 1,240 | 1,240 | 1,238 | 20.82 | 21.46 | 20.79 | 21.43 | ||||||||||||||||
| Offtaker realized price | $/oz | 2,586 | 2,255 | 2,416 | 2,038 | 28.28 | 21.89 | 30.66 | 22.69 | ||||||||||||||||
| Realized price | $/oz | 2,327 | 2,062 | 2,241 | 1,898 | 23.12 | 21.67 | 24.23 | 21.85 | ||||||||||||||||
1 Deferred revenue drawdown rates for gold and silver do not include variable consideration adjustments.
2 The gold and silver cash rate for Peru increased by 1% from $400/oz and $5.90/oz effective August 4, 2019. Subsequently every year, on August 4, the cash rate will increase by 1% compounded. The gold and silver cash rate for Manitoba increased by 1% from $400/oz and $5.90/oz effective August 1, 2015. Subsequently every year, on August 1, the cash rate will increase by 1% compounded. The weighted average cash rate is disclosed.
3 Revenue, including mark-to-market on QP hedges is used in the calculation of realized price.
Subsequent to the variable consideration adjustment recorded on January 1, 2024, the deferred revenue amortization is recorded in Peru at $817 per ounce gold and $14.56 per ounce silver (December 31, 2023 - $820 per ounce gold and $15.26 per ounce silver).
Cost of Sales
Our detailed cost of sales is summarized as follows:
| (in $ millions) | Three months ended | Year ended | ||||||||||
| Dec. 31, 2024 | Dec. 31, 2023 | Dec. 31, 2024 | Dec. 31, 2023 | |||||||||
| Peru | ||||||||||||
| Mining | 47.3 | 30.4 | 145.5 | 122.6 | ||||||||
| Milling | 53.6 | 50.2 | 197.1 | 198.1 | ||||||||
| Changes in product inventory | (6.7 | ) | 8.0 | 9.6 | 28.1 | |||||||
| Depreciation and amortization | 83.2 | 85.7 | 270.3 | 275.7 | ||||||||
| G&A | 33.3 | 24.9 | 96.0 | 77.3 | ||||||||
| Inventory adjustments | (0.2 | ) | - | - | - | |||||||
| Freight, royalties and other charges | 20.7 | 22.3 | 69.2 | 68.3 | ||||||||
| Total Peru cost of sales | 231.2 | 221.5 | 787.7 | 770.1 | ||||||||
| Manitoba | ||||||||||||
| Mining | 42.6 | 40.3 | 169.4 | 161.1 | ||||||||
| Milling | 16.6 | 15.3 | 65.2 | 62.3 | ||||||||
| Changes in product inventory | (0.3 | ) | 12.8 | (2.0 | ) | 1.8 | ||||||
| Depreciation and amortization | 27.2 | 30.6 | 106.2 | 104.3 | ||||||||
| Inventory adjustments | 0.3 | 1.4 | 1.7 | 2.3 | ||||||||
| G&A | 13.0 | 8.6 | 48.7 | 35.2 | ||||||||
| Past service costs | 1.5 | - | 4.3 | - | ||||||||
| Freight, royalties and other charges | 7.0 | 6.8 | 25.4 | 23.7 | ||||||||
| Total Manitoba cost of sales | 107.9 | 115.8 | 418.9 | 390.7 | ||||||||
| British Columbia1 | ||||||||||||
| Mining | 18.2 | 19.0 | 79.1 | 48.3 | ||||||||
| Milling | 25.2 | 25.2 | 89.8 | 49.3 | ||||||||
| Changes in product inventory | (3.0 | ) | 8.5 | 3.8 | 8.5 | |||||||
| Depreciation and amortization | 11.8 | 5.5 | 50.1 | 11.7 | ||||||||
| G&A | 5.0 | 5.6 | 20.0 | 10.7 | ||||||||
| Inventory adjustments | 1.2 | - | 1.2 | - | ||||||||
| Freight, royalties and other charges | 3.0 | 4.3 | 16.8 | 8.2 | ||||||||
| Total British Columbia cost of sales | 61.4 | 68.1 | 260.8 | 136.7 | ||||||||
| Cost of sales | 400.5 | 405.4 | 1,467.4 | 1,297.5 | ||||||||
1 Copper Mountain mine results are stated at 100%. Hudbay owns 75% of Copper Mountain mine. As Copper Mountain was acquired on June 20, 2023, the results for the year ended December 31, 2023 represents the period from the acquisition date, June 20, 2023, through to the end of the fourth quarter of 2023.
Total cost of sales for the fourth quarter of 2024 was $400.5 million, reflecting a decrease of $4.9 million compared to the fourth quarter of 2023. British Columbia cost of sales decreased by $6.7 million primarily driven by the effect of an increase in finished concentrate inventory, lower mining and G&A costs partially offset by higher depreciation during the quarter. Peru cost of sales increased by $9.7 million in the fourth quarter of 2024, compared to the same period of 2023 mainly due higher mining and milling costs in line with higher production during the quarter partially offset by the effect of the increase in inventory versus the comparative 2023 period. Manitoba cost of sales decreased by $7.9 million in the fourth quarter of 2024, primarily as a result decrease in the relative change in finished goods inventory and lower depreciation and amortization during the quarter, compared to the same period of 2023.
Total cost of sales for the year ended December 31, 2024 was $1,467.4 million, reflecting an increase of $169.9 million from the same period in 2023 in part due to $124.1 million of incremental operating costs from British Columbia. In addition, Peru cost of sales increased by $17.6 million as a result of an increase of $11.0 million in profit sharing and higher mining, G&A and freight costs. Manitoba cost of sales increased by $28.2 million as a result of a $10.3 million increase in profit sharing and $13.1 million of higher mining, milling and depreciation as a result of higher production.
For details on unit operating costs, refer to the respective tables in the "Operations Review" section of this MD&A.
For the fourth quarter of 2024, other significant variances in expenses, compared to the same period in 2023, include the following:
- Net finance expenses decreased by $14.5 million primarily due to a $9.0 million decrease in the relative revaluation loss of the gold prepayment liability, a decrease of $7.6 million on mark-to-market losses from non-QP hedges, a decrease of $4.4 million from interest expense on long-term debt benefiting from the retirement of some senior notes, an increase of $3.3 million from interest income, a decrease of $1.4 million from withholding taxes, partially offset by an increase in foreign exchange loss of $13.1 million.
- Other expenses increased by $11.5 million primarily due to an increase of $7.6 million in the write-off of previously capitalized PP&E costs and the prior year benefited from an $8.1 million recovery from insurance and value added tax partially offset by a $4.5 million decrease in the amortization of certain community costs.
- Re-evaluation adjustment - environmental provision contributed a decrease of $31.5 million in expenses compared to the same period of 2023 due to the relative revaluation of the environmental reclamation provision on our Manitoba non-producing sites from changes in long term risk-free discount rates and inflation rates.
Given the long term nature of the reclamation cash flows, the related environmental reclamation provision is highly sensitive to changes in inflation rates and long-term risk-free discount rates and, as such, we may continue to experience significant quarterly environmental reclamation provision revaluations.
For the year 2024, other significant variances in expenses, compared to the same period in 2023, included the following:
- Net finance expenses increased by $3.4 million due to an increase in market-to-market losses of $9.1 million from non-QP hedges, a $3.3 million increase in interest expense on equipment financing and leases, a $15.7 million increase in net foreign exchange loss, partially offset by a decrease in mark-to-market loss of $6.0 million from investments, an increase of $7.6 million in interest income, a $6.4 million decrease in interest expense on long-term debt, a decrease of $3.8 million in withholding taxes and a decrease in the accretion of revenue streaming arrangement of $2.4 million.
- Selling and administrative expenses increased by $17.8 million reflecting a higher share-based compensation expense as a result of a comparative increase in share price during the current period along with incremental selling and administrative expenses incurred by the Copper Mountain mine.
- Other expenses increased by $19.1 million primarily due to an increase of $20.0 million in write-off of previously capitalized PP&E costs, net of capitalized accrued interest, primarily related to an expired option agreement in Arizona of $8.1 million and Copper Mountain PP&E writedowns of $16.0 million, and the prior year benefited from an $8.1 million of recovery from insurance and value added tax, a decrease of $6.9 million in acquisition costs related to the acquisition of Copper Mountain incurred in 2023 and a $2.0 million gain related to the renouncement of the flow-through share liability, net of provisions.
- Exploration expenses increased by $13.3 million primarily due to our planned Snow Lake exploration program consisting of modern geophysical programs and multi-phased drilling campaigns, much of which is funded by flow-through financing.
- Re-evaluation adjustment - environmental provision gain decreased by $7.9 million due to the same reasons as outlined above in the quarterly variance analysis.
Tax Expense
For the three months ended December 31, 2024, tax expense increased by $36.9 million compared to the same period in 2023. For the year ended December 31, 2024 tax expense increased by $101.5 million compared to the same period in 2023. The following table provides further details:
| (in $ millions) | Three months ended | Year ended | ||||||||||
| Dec. 31, 2024 |
Dec. 31, 2023 |
Dec. 31, 2024 |
Dec. 31, 2023 |
|||||||||
| Current tax expense - income tax | 52.2 | 45.2 | 119.9 | 83.1 | ||||||||
| Deferred tax expense (recovery) - income tax1 | 15.1 | (3.2 | ) | 13.9 | (19.6 | ) | ||||||
| Total income tax expense | 67.3 | 42.0 | 133.8 | 63.5 | ||||||||
| Current tax expense - mining tax | 19.2 | 7.5 | 57.0 | 22.0 | ||||||||
| Deferred tax (recovery) expense - mining tax1 | (2.1 | ) | (2.0 | ) | (7.0 | ) | (3.2 | ) | ||||
| Total mining tax expense | 17.1 | 5.5 | 50.0 | 18.8 | ||||||||
| Tax expense | 84.4 | 47.5 | 183.8 | 82.3 | ||||||||
1 Deferred tax expense (recovery) represents our draw down/increase of non-cash deferred income and mining tax assets/liabilities.
Income Tax Expense/Recovery
Applying the estimated Canadian statutory income tax rate of 26.7% to our net earnings before taxes of $251.6 million for the full year of 2024 would have resulted in a tax expense of approximately $67.2 million; however, we recorded an income tax expense of $133.8 million. The primary items causing our effective income tax rate to be different than the 26.7% estimated Canadian statutory income tax rate include:
- Foreign exchange on the translation of deferred tax balances to group currency resulted in a deferred tax expense of $26.2 million.
- The tax expense with respect to our foreign operations is recorded using an income tax rate other than the Canadian statutory income tax rate of 26.7%, resulting in a tax expense of $36.7 million.
Mining Tax Expense
For full year of 2024, we recorded a mining tax expense of $50.0 million. Effective mining tax rates can vary significantly based on the composition of our earnings and the expected amount of mining taxable profits. Corporate costs and other costs not related to mining operations are not deductible in computing mining profits. A brief description of how mining taxes are calculated in our various business units is discussed below.
Manitoba
The Province of Manitoba imposes mining tax on earnings related to the sale of mineral products mined in the Province of Manitoba (mining taxable profit) at the following rates:
- 10% of total mining taxable earnings if mining profit is C$50 million or less;
- Between mining earnings of C$50 and $C55 million, mining tax is equal to a minimum of C$5 million plus mining earnings less C$50 million multiplied by 65%;
- 15% of total mining taxable earnings if mining profits are between C$55 million and C$100 million;
- Between mining earnings of C$100 million and C$105 million, mining tax is equal to a minimum of C$15 million plus mining earnings less C$100 million multiplied by 57%; and
- 17% of total mining taxable earnings if mining profits exceed C$105 million.
We estimate that the deferred tax rate that will be applicable when temporary differences reverse will be approximately 10.0%.
Peru
The Peruvian government imposes two parallel mining tax regimes, the Special Mining Tax and the Modified Royalty, on companies' operating mining income on a sliding scale, with progressive rates ranging from 2.0% to 8.4% and 1.0% to 12.0%, respectively. Based on financial forecasts, we have recorded a deferred tax liability as at December 31, 2024, at the tax rate we expect to apply when temporary differences reverse.
British Columbia
The Province of British Columbia imposes a 13% net revenue tax on the sale of mineral products mined in the province of British Columbia after the mine owner has recovered the capital invested in the mine and its "Cumulative Expenditure Account" ("CEA") no longer has a balance. The tax is paid on the profit in excess of the capital that has been invested in the mine. British Columbia mineral tax is deductible for federal and provincial income tax purposes.
While there is a balance in the CEA account, the mine owner must pay a "Net Current Proceeds" ("NCP") tax of 2%. Any amounts paid as NCP can then be claimed in the future against net revenue taxes payable.
We estimate that the effective tax rate that will be applicable when temporary differences reverse will be approximately 9.49%.
LIQUIDITY AND CAPITAL RESOURCES
Total liquidity substantially increased by 76% to $1,007.8 million at December 31, 2024 from $573.7 million at the end of 2023.
As at December 31, 2024, our liquidity includes $541.8 million in cash, $40.0 million in short-term investments as well as undrawn total availability of $426.0 million under our revolving credit facilities.
Senior Unsecured Notes
During 2024, we purchased a total of $25.0 million of our 2026 Notes and $57.6 million of our 2029 Notes in the open market at a discount to par value. As at December 31, 2024, we had $575.0 million aggregate principal amount of 2026 Notes and $542.4 million aggregate principal amount of 2029 Notes.
Senior Secured Revolving Credit Facilities
We have two senior secured revolving credit facilities with total commitments of $450 million ("the Credit Facilities") for our Canadian and Peruvian businesses on substantially similar terms and conditions.
During 2024, we fully repaid $100 million of debt outstanding under our revolving credit facilities. As at December 31, 2024, there were nil cash drawings under the Credit Facilities and $24.0 million in letters of credit secured under the Canadian Facility.
As at December 31, 2024, we were in compliance with our covenants under the Credit Facilities.
During the fourth quarter, we proactively extended the Credit Facilities by three years from October 2025 to November 2028 and negotiated the flexibility to leave our 4.50% 2026 senior unsecured notes outstanding to maturity as we advance Copper World towards a sanctioning decision in accordance with the 3-P plan. The newly extended $450 million revolving credit facility, with the existing banking syndicate, includes an improved pricing grid reflecting the enhanced financial position of Hudbay, and features an accordion provision that provides Hudbay with the option to increase the facility by an additional $150 million at our discretion during the four-year tenor, providing additional financial flexibility.
C$130 Million Bilateral Letter of Credit Facility
We have a C$130.0 million bilateral letter of credit facility ("LC Facility") with a major Canadian financial institution. The LC Facility has no financial covenants and enables us to issue up to C$130.0 million of letters of credit to beneficiaries on an unsecured basis at attractive rates, including C$30.0 million sub-limit for financial letters of credit. As at December 31, 2024, the Manitoba business unit had drawn $52.7 million in letters of credit under the LC Facility.
Surety Bonds and Letters of Credit
As at December 31, 2024, the Arizona business unit had $18.4 million in surety bonds issued to support future reclamation and closure obligations and the Peru business unit had $126.1 million in letters of credit issued with various Peruvian financial institutions to support future reclamation and other operating matters. In addition, the British Columbia business unit had $45.6 million in surety bonds issued to support future reclamation and $1.0 million in surety bonds issued to support the hydro used at Copper Mountain mine. The British Columbia business unit also had $0.6 million in cash collateralized letters of credit issued with various Canadian financial institutions related to other operating matters.
Gold Prepayment Liability
During the fourth quarter of 2020, we entered into a gold forward sale and prepay transaction which generated $115.0 million in cash proceeds to pre-fund the expected capital requirements for the New Britannia gold mill refurbishment project. The transaction valued the future gold ounce delivery obligation at 79,954 gold ounces to be delivered in fixed monthly deliveries of 3,331 gold ounces over a 24-month period from January 2022 to December 2023, which period was extended to August 2024.
During the third quarter of 2024, we completed our final fixed monthly delivery in August and have now fully completed all delivery obligations under the gold prepayment liability.
Working Capital
Working capital increased by $375.5 million to $511.3 million from December 31, 2023 to December 31, 2024, primarily due to an increase in cash and cash equivalents of $292.0 million, a decrease in gold prepayment liability of $55.9 million, an increase in short-term investment of $40.0 million, an increase in trade and other receivables of $32.1 million mainly related to the timing of receiving statutory receivables, a decrease in deferred revenue of $24.6 million, an increase in prepaid and other expenses of $11.1 million and an increase in other financial assets and taxes receivable of $10.0 million. Partially offsetting these items was an increase in taxes payable of $47.3 million mainly as a result of higher mining taxes from higher taxable income, an increase in trades and other payable of $30.9 million and a decrease in inventories of $9.9 million.
Cash Flows
The following table summarizes our cash flows for the three months and year ended December 31, 2024 and December 31, 2023:
| (in $ millions) | Three months ended | Year ended | ||||||||||
| Dec. 31, 2024 | Dec. 31, 2023 | Dec. 31, 2024 | Dec. 31, 2023 | |||||||||
| Operating cash flow before change in non-cash working capital | 231.5 | 246.5 | 691.1 | 570.0 | ||||||||
| Change in non-cash working capital | 6.6 | (17.5 | ) | (24.9 | ) | (93.1 | ) | |||||
| Cash generated from operating activities | 238.1 | 229.0 | 666.2 | 476.9 | ||||||||
| Cash used in investing activities | (99.6 | ) | (82.5 | ) | (382.9 | ) | (271.8 | ) | ||||
| Cash (used in) generated from financing activities | (36.9 | ) | (141.8 | ) | 10.2 | (182.4 | ) | |||||
| Effect of movement in exchange rates on cash | (3.1 | ) | (0.1 | ) | (1.5 | ) | 1.4 | |||||
| Net increase in cash | 98.5 | 4.6 | 292.0 | 24.1 | ||||||||
Cash Flow from Operating Activities
Cash generated from operating activities was $238.1 million during the fourth quarter of 2024, an increase of $9.1 million compared to the same period in 2023. Operating cash flow before change in non-cash working capital was $231.5 million during the fourth quarter of 2024, reflecting a decrease of $15.0 million compared to the fourth quarter of 2023. The decrease in operating cash flows before change in working capital was primarily the result of lower sales volume of copper and gold which overcame the strong realized prices for those respective metals.
Year-to-date cash generated from operating activities was $666.2 million in 2024, an increase of $189.3 million compared to 2023. Operating cash flow before changes in non-cash working capital for the year ended December 31, 2024 was $691.1 million, an increase of $121.1 million compared to 2023. The increase in operating cash flow before changes in working capital was primarily the result of higher metal prices and gold sales volumes, as well as the incremental contribution margin from the Copper Mountain mine. This was partially offset by a significant increase in cash taxes paid of $132.5 million mainly at our Peru operations, compared to the same period in 2023.
Cash Flow from Investing and Financing Activities
During the fourth quarter of 2024, we spent $136.5 million in investing and financing activities, primarily driven by $96.9 million in capital expenditures, $30.5 million in interest paid on long-term debt, $11.0 million in capitalized lease and equipment financing payments, $4.8 million in other financing costs mainly related to our Credit Facilities and foreign withholding taxes and $2.7 million in community agreement payments. These cash outflows were partially offset by $4.0 million of interest income received.
In the full year 2024, we spent $372.7 million in investing and financing activities, primarily driven by $347.1 million in capital expenditures, $100.0 million in repayments on our revolving credit facilities, $81.9 million of our senior unsecured notes repurchased, net of discount, $67.9 million in interest paid on our long-term debt, $62.3 million full repayment of our gold prepayment liability, $41.6 million in capitalized lease and equipment financing payments, $40.0 million in short-term investments, $15.1 million in other financing costs mainly related to our Credit Facilities and foreign withholding taxes, the final $10.0 million deferred payment for the acquisition of a prior minority interest in Copper World, $9.1 million in community agreement payments and $5.5 million of dividends paid. These cash outflows were partially offset by $398.0 million of proceeds from equity issuance, net of transaction and issuance costs, $17.5 million of interest income and grants received and $4.4 million net proceeds from exercise of stock options and warrants.
Capital Expenditures
The following summarizes accrued and cash additions to capital assets for the periods indicated:
| Three months ended | Year ended | Guidance | |||||||||||||
| (in $ millions) | Dec. 31, 2024 |
Dec. 31, 2023 |
Dec. 31, 2024 |
Dec. 31, 2023 |
Annual 20242 |
||||||||||
| Peru sustaining capital expenditures1 | 29.9 | 36.8 | 124.4 | 132.1 | 130.0 | ||||||||||
| Manitoba sustaining capital expenditures | 12.5 | 19.1 | 45.6 | 55.8 | 55.0 | ||||||||||
| British Columbia sustaining capital expenditures3 | 29.2 | 19.1 | 123.1 | 30.2 | 105.0 | ||||||||||
| Total sustaining capital expenditures | 71.6 | 75.0 | 293.1 | 218.1 | 290.0 | ||||||||||
| Arizona capitalized costs4 | 13.4 | 5.5 | 28.9 | 21.3 | 45.0 | ||||||||||
| Peru growth capitalized expenditures | 0.5 | 0.1 | 0.8 | 12.1 | 2.0 | ||||||||||
| Manitoba growth capitalized expenditures | 2.3 | - | 7.0 | 13.5 | 10.0 | ||||||||||
| British Columbia growth capitalized expenditures | 4.7 | 1.2 | 8.1 | 1.2 | 5.0 | ||||||||||
| Capitalized exploration | 6.7 | 6.2 | 12.2 | 7.8 | 8.0 | ||||||||||
| Right-of-use asset and equipment financing additions | 42.3 | 0.2 | 96.5 | 21.4 | |||||||||||
| Grants received | (0.7 | ) | - | (3.1 | ) | - | |||||||||
| Community agreement additions | 12.7 | (0.2 | ) | 14.5 | 1.8 | ||||||||||
| Non-cash capitalized stripping | 6.2 | 3.5 | 24.5 | 8.8 | |||||||||||
| Rockcliff acquisition | - | - | - | 14.2 | |||||||||||
| Other capitalized costs | 3.7 | 3.4 | 3.7 | 3.6 | |||||||||||
| Total other capitalized expenditures | 91.8 | 19.9 | 193.1 | 105.7 | |||||||||||
| Total accrued capital additions | 163.4 | 94.9 | 486.2 | 323.8 | |||||||||||
| Reconciliation to cash capital additions: | |||||||||||||||
| Other capitalized costs2 | (60.5 | ) | (6.9 | ) | (132.4 | ) | (45.7 | ) | |||||||
| Change in capital accruals | (5.9 | ) | (6.9 | ) | (6.7 | ) | 3.0 | ||||||||
| Acquisition of property, plant & equipment - cash | 97.0 | 81.1 | 347.1 | 281.1 | |||||||||||
1 Peru sustaining capital expenditures include capitalized stripping costs.
2 Other capitalized costs primarily include right-of-use lease and equipment financing additions, which are excluded from guidance in 2024, in addition to non-cash deferred stripping
3 Includes 100% of Copper Mountain mine production. Hudbay owns 75% of Copper mountain mine. As Copper Mountain was acquired on June 20, 2023, the production for the year ended December 31, 2023 represents the period from the acquisition date, June 20, 2023, through to the end of the fourth quarter of 2023.
4 With the receipt of the Aquifer Protection Permit on August 29, 2024, we expect to commence activities related to the preparation of feasibility studies for Copper World. As a result, 2024 growth capital spending in Arizona has increased by an additional $25 million, compared to the original 2024 guidance of $20 million.
For the quarter and year ended December 31, 2024, total capital additions increased by $68.5 million and $162.4 million, respectively, compared to the same period in 2023, primarily due to sustaining capital expenditures at the Copper Mountain mine representing a full year of ownership in 2024 and in moving forward our plan for production improvements. In addition, a number of new leases and equipment financing transactions were signed mostly for the Copper Mountain mine. This was partially offset by reduced sustaining and growth capital expenditures in Manitoba and Peru.
Sustaining capital expenditures in Manitoba for the three months and year ended December 31, 2024 were $12.5 million and $45.6 million, respectively, representing a decrease of $6.6 million and $10.2 million, respectively, compared to the same periods in 2023 mostly due to lower capital development at Lalor. Sustaining capital expenditures in Peru for the three months and year ended December 31, 2024 were $29.9 million and $124.4 million, respectively, representing a decrease of $6.9 million and $7.7 million, respectively, compared to the same periods in 2023 as a result of the timing of various stripping campaigns and civil work projects. Sustaining capital expenditures in British Columbia for the three months and year ended December 31, 2024 were $29.2 million and $123.1 million, respectively, which included $20.9 million and $69.7 million, respectively, of capitalized stripping related to our planned three-year accelerated stripping campaign to access higher grade ore.
Growth capital spending in Manitoba for the three months and year ended December 31, 2024 was $2.3 million and $7.0 million, respectively, representing an increase of $2.3 million and a decrease of $6.5 million, respectively, compared to the same periods in 2023. The decrease for the full year mainly relates to the completion of the Stall mill recovery improvement project in 2023, partially offset by the development of an exploration access drift at 1901 in 2024. Growth capital expenditures in Peru for the three months and year ended December 31, 2024 were $0.5 million and $0.8 million, respectively, representing an increase of $0.4 million and a decrease of $11.3 million, respectively. The annual decrease mainly relates to the completion of the copper recovery improvement project in 2023. Arizona's capital expenditures for the three months and year ended December 31, 2024 were $13.4 million and $28.9 million, respectively, mainly related to ongoing carrying costs and feasibility preparation.
Capitalized exploration for the three months and year ended December 31, 2024 was $6.7 million and $12.2 million, respectively.
Total consolidated sustaining and growth capital expenditures in 2024 were approximately $10 million lower than our full year guidance of $360 million. This reflects continued financial discipline and certain capital deferrals to 2025.
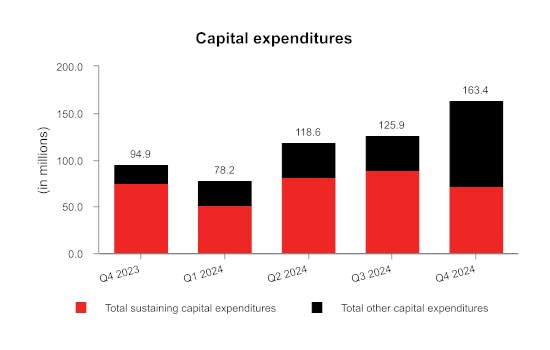
Capital Commitments
As at December 31, 2024, we had outstanding capital commitments in Canada of approximately $16.8 million, of which $1.6 million can be terminated, approximately $37.1 million in Peru primarily related to sustaining capital commitments and exploration option agreements, all of which can be terminated, and approximately $35.2 million in Arizona, primarily related to our Copper World project, none of which can be terminated.
Contractual Obligations
The following table summarizes our significant contractual obligations as at December 31, 2024:
|
|
Total |
Less than 12 months |
13 - 36 months |
37 - 60 months |
More than 60 months |
|
Payment Schedule (in $ millions) |
|||||
|
Long-term debt obligations1 |
1,318.6 |
62.5 |
661.1 |
595.0 |
- |
|
Equipment financing and lease obligations |
203.4 |
71.8 |
82.7 |
30.9 |
18.0 |
|
Purchase obligation - capital commitments |
89.2 |
41.6 |
28.1 |
19.5 |
- |
|
Purchase obligation - other commitments3 |
1,466.5 |
514.9 |
418.2 |
128.8 |
404.6 |
|
Pension and other employee future benefits obligations2 |
103.4 |
4.5 |
15.2 |
8.3 |
75.4 |
|
Community agreement obligations4, 5 |
99.0 |
26.1 |
17.0 |
8.3 |
47.6 |
|
Decommissioning and restoration obligations5 |
469.1 |
4.0 |
16.3 |
7.1 |
441.7 |
|
Total |
3,749.2 |
725.4 |
1,238.6 |
797.9 |
987.3 |
1 Long-term debt obligations include scheduled interest payments, as well as principal repayments
2 Discounted.
3 Primarily made up of trades payables, accrued liabilities, long-term agreements with operational suppliers, obligations for power purchases, concentrate handling and fleet and port services.
4 Represents community agreement obligations and various finalized land user agreements, including Pampacancha.
5 Undiscounted before inflation.
In addition to the contractual obligations included in the above payment schedule, we also have the following commitments which impact our financial position:
- A profit-sharing plan with most Manitoba employees;
- A profit-sharing plan with all Peru employees;
- Wheaton precious metals stream agreement for the Constancia mine;
- Government royalty payments related to the Constancia mines;
- Participation agreements related to the Copper Mountain mine, and
- Contracts related to future production and sales, such as royalties.
Outstanding Share Data
As of February 14, 2025, the final trading day prior to the date of this MD&A, there were 394,944,496 common shares of Hudbay issued and outstanding. In addition, there were 2,478,600 stock options and 60,544 common share purchase warrants outstanding.
FINANCIAL RISK MANAGEMENT
The Financial Risk Management risks in this MD&A are not exhaustive. Please also refer to the heading "Risk Factors" in our most recent Annual Information Form for a discussion of the additional risk factors that may affect Hudbay's business, operations and financial condition. In addition to those risks, we have identified the following other risks which may affect our consolidated financial statements in the future.
Metals Price Strategic Risk Management
Commodity prices are a key driver of our financial and operational results. Our strategic objective is to provide our investors with exposure to base metals prices, unless a reason exists to implement a hedging arrangement. From time to time, we maintain price protection programs and conduct commodity price risk management in line with Board-approved policies to reduce risk through the use of financial instruments.
In the normal course, we typically consider metal price hedging to manage the risk associated with provisional pricing terms in concentrate sales agreements and in connection with stream delivery obligations. We may also occasionally consider metal price hedging in accordance with Board approved policies to achieve strategic objectives, including: locking in favourable metal prices to ensure a minimum cash flow during or after the construction of a mine or during a period of reduced liquidity, to maintain profitable production of shorter life/higher cost operations or as part of a financing arrangement.
During the year, we entered into copper and zinc hedging transactions intended to manage the risk associated with provisional pricing terms in concentrate sales agreements.
As at December 31, 2024, we had 61.7 million pounds of net copper fixed for floating swaps outstanding at an average fixed receivable price of $4.19/lb associated with provisional pricing risk in concentrate sales agreements. These swaps settled beginning in January 2025 and will continue through May 2025.
As at December 31, 2024, we had 9.7 million pounds of net zinc fixed for floating swaps outstanding at an average fixed receivable price of $1.38/lb associated with provisional pricing risk in concentrate sales agreements. These swaps settled beginning in January 2025 and will continue through April 2025.
As at December 31, 2024, we had copper forward sales contracts at Copper Mountain for a total of 5.3 million pounds of copper production over the period from January 2025 to April 2025 at an average price of $3.95 per pound. Additionally, we had a zero-cost collar program for 6.6 million pounds copper production over the period from January 2025 to April 2025 at an average floor price of $3.88 per pound and an average cap price of $4.14 per pound.
From time to time, we enter into gold and silver forward sales contracts to hedge the commodity price risk associated with the future settlement of provisionally priced deliveries. We are generally obligated to deliver gold and silver to Wheaton Precious Metals Corp. ("Wheaton") prior to the determination of final settlement prices. These forward sales contracts are entered into at the time we deliver gold and silver to Wheaton, and are intended to mitigate the risk of subsequent adverse gold and silver price changes. Gains and losses resulting from the settlement of these derivatives are recorded directly to revenue, as the forward sales contracts do not achieve hedge accounting, and the associated cash flows are classified in operating activities. Our swap agreements are with counterparties we believe to be creditworthy and do not require us to provide collateral.
Carrying Values and Mine Plan Updates
At the end of each reporting period, Hudbay reviews its groups of non-financial assets to determine whether there are any indicators of impairment or impairment reversal. If any such indicator exists, the Company estimates the recoverable amount of the non-financial asset group in order to determine the extent of the impairment loss or reversal, if any. At December 31, 2024, the Company assessed whether there were impairment or impairment reversal indicators associated with the general business environment and known changes to business planning and found that there were no impairment or impairment reversal indicators.
There are a number of potential indicators that could trigger non-financial asset impairment or reversal of impairment in the future. One such potential indicator is a change to the life of mine ("LOM") plan for an asset, which we generally publish in the first quarter of every year. LOM plans incorporate management's best estimates of key assumptions which include future commodity prices, the value of mineral resources not included in the LOM plan, production based on current estimates of recoverable reserves, discount rates, future operating and capital costs and future foreign exchange rates.
There is a risk that certain assumptions in the updated LOM plans could give rise to an indicator of impairment or impairment reversal and cause an adjustment to the carrying value of the relevant assets and/or impact our financial statements.
Interest Rate and Foreign Exchange Risk Management
To the extent that we incur indebtedness at variable interest rates to fund our growth objectives, we may enter into interest rate hedging arrangements to manage our exposure to short-term interest rates. To the extent that we make commitments to capital expenditures denominated in foreign currencies, we may enter into foreign exchange forwards or acquire foreign currency outright, which may result in foreign exchange gains or losses in our consolidated statement of earnings.
At December 31, 2024, approximately $511.9 million of our cash was held in US dollars, approximately $26.2 million of our cash was held in Canadian dollars, and approximately $3.7 million of our cash was held in Peruvian soles.
Business Integration Risk with Copper Mountain
The ability to realize the benefits of the Copper Mountain transaction will depend in part on, building relationships with key stakeholders, stabilizing and optimizing the operation and successfully integrating functions, operations, procedures and personnel in a timely and efficient manner. It will also depend on Hudbay's ability to realize its updated mine plan (including the New Ingerbelle expansion) and the anticipated benefits from optimizing the operation.
There can be no assurance that management will be able to successfully complete the optimization of Copper Mountain's operations, achieve the updated mine plan and fully realize the anticipated operational and financial benefits the acquisition.
Political and Regulatory Changes - Trade
Since the Company operates across several jurisdictions, certain political and regulatory changes in Canada, the US, Peru, and other countries could negatively impact our operations and financial results. Recent and upcoming national elections, including those in Canada and the US, have brought, or may bring, new political leadership with substantially different political, social, and economic policy priorities on both domestic and foreign policy matters, including with respect to critical minerals, trade and tariffs. Political and regulatory risks such as these could have an impact on our operations and financial results. Although we do not currently sell any concentrate or precious metal doré into the United States from Canada, and the implementation or expansion of tariffs on exported and/or imported products could negatively affect supply chains, the price of consumables and the cost of mine development and construction.
TREND ANALYSIS AND QUARTERLY REVIEW
A detailed quarterly and annual summary of financial and operating performance can be found in the "Summary of Results" section at the end of this MD&A. The following table sets forth selected consolidated financial information for each of our eight most recently completed quarters:
| (in $ millions, except per share amounts, production on a copper equivalent basis and average realized copper price) |
2024 |
2023 | ||||||||||||||||||||||
| Q42 | Q3 | Q2 | Q1 | Q42 | Q33 | Q2 | Q1 | |||||||||||||||||
| Production on a copper equivalent basis (tonnes) | 77,769 | 60,895 | 47,164 | 62,120 | 77,951 | 71,335 | 37,530 | 38,614 | ||||||||||||||||
| Average realized copper price ($/lb) | 4.09 | 4.24 | 4.56 | 3.91 | 3.77 | 3.77 | 3.89 | 3.98 | ||||||||||||||||
| Average realized gold price ($/oz) | 2,327 | 2,582 | 2,222 | 1,941 | 2,062 | 1,738 | 1,810 | 1,881 | ||||||||||||||||
| Revenue | 584.9 | 485.8 | 425.5 | 525.0 | 602.2 | 480.5 | 312.2 | 295.2 | ||||||||||||||||
| Gross profit | 184.4 | 139.8 | 77.6 | 152.0 | 196.8 | 106.4 | 22.9 | 66.5 | ||||||||||||||||
| Income (loss) before tax | 103.7 | 79.7 | 0.4 | 67.8 | 81.0 | 84.1 | (30.7 | ) | 17.4 | |||||||||||||||
| Net income (loss) | 19.3 | 50.4 | (20.4 | ) | 18.5 | 33.5 | 45.5 | (14.9 | ) | 5.5 | ||||||||||||||
| Net income (loss) - attributable | 21.2 | 49.8 | (16.6 | ) | 22.4 | 30.7 | 45.1 | (14.9 | ) | 5.5 | ||||||||||||||
| Adjusted net earnings (loss)1 - attributable | 70.3 | 50.3 | 0.1 | 59.4 | 68.6 | 24.3 | (18.3 | ) | 0.1 | |||||||||||||||
| Earnings (loss) per share attributable: | ||||||||||||||||||||||||
| Basic and diluted | 0.05 | 0.13 | (0.05 | ) | 0.06 | 0.09 | 0.13 | (0.05 | ) | 0.02 | ||||||||||||||
| Adjusted net earnings (loss)1 per share - attributable | 0.18 | 0.13 | 0.00 | 0.17 | 0.20 | 0.07 | (0.07 | ) | 0.00 | |||||||||||||||
| Operating cash flow before change in non-cash working capital | 231.5 | 186.3 | 122.0 | 147.5 | 246.5 | 182.0 | 55.9 | 85.6 | ||||||||||||||||
| Adjusted EBITDA1 | 257.3 | 206.2 | 145.0 | 214.2 | 274.4 | 190.7 | 81.2 | 101.9 | ||||||||||||||||
| Adjusted EBITDA LTM1 | 822.5 | 839.8 | 824.3 | 760.5 | 647.8 | 498.5 | 407.1 | 467.3 | ||||||||||||||||
1 Adjusted net earnings (loss) - attributable to owners, adjusted net earnings (loss) per share - attributable to owners, adjusted EBITDA, and adjusted EBITDA last twelve months ("LTM") are non-GAAP financial performance measure with no standardized definition under IFRS. For further information and a detailed reconciliation, please see the discussion under the "Non-GAAP Financial Performance Measures" section of this MD&A.
2 Annual consolidated results may not calculate based on amounts presented in this table due to rounding.
3 The Company acquired Copper Mountain on June 20, 2023, and Q3 2023 represented the first full quarter of Copper Mountain production included in the Company's financial results.
On a quarterly basis, the Company's revenue is primarily impacted by metal prices, production mix and sales volumes of the key metals we produce. In addition to these factors, gross profit, net earnings (loss) attributable, earnings (loss) per share attributable, operating cash flow before change in non-cash working capital and adjusted EBITDA are also impacted by input costs. Net earnings (loss) and earnings (loss) per share are further impacted by net finance expense and re-evaluation adjustments of our closed site environmental provision.
During the fourth quarter of 2024, copper equivalent production increased to 77,769 tonnes. Our Manitoba and Peru operations delivered strong quarterly production as expected and unlocked higher grade helping the Company exceed 2024 annual gold guidance. Strong cost control and meaningful exposure to gold by-product credits resulted in consolidated cash cost1 and sustaining cash cost1 per pound of copper produced, net of by-product credits1, in the fourth quarter of 2024 of $0.45 and $1.37, respectively, contributing to our outperformance of our improved full year 2024 cost guidance. Furthermore, the settlement of the gold prepayment liability in the third quarter of 2024, allowed Hudbay to capitalize on surging gold prices. Since acquiring Copper Mountain in June 2023, we have moved to optimization efforts which have been focused on ramping up the mining fleet to execute a planned accelerated stripping campaign to gain access to higher grades, as well as plant improvement initiatives to improve mill reliability and recoveries. See "Financial Risk Management - Business Integration Risk with Copper Mountain" above for further details.
During the third quarter of 2024, profitability and cash flows grew compared to the second quarter of 2024. This strength was attributable in part to higher gold, copper and zinc production compared to the second quarter of 2024, along with returning strength in commodity prices including record gold prices. These impacts offset lower planned mined grades observed in Peru in the third quarter of 2024 and the higher cash mining taxes paid in Peru resulting from higher profitability over the past several quarters. Strong operating cost control continued into the third quarter of 2024 resulting from a number of operational initiatives and high levels of mill throughput being experienced throughout the business.
During the second quarter of 2024, realized copper and gold prices continued to climb which overcame the decline in sales volumes of concentrate compared to the first quarter of 2024. Expected lower mined grades observed for the same metals in Peru and Manitoba were the primary factor for the decline in production since the first quarter of the year. Cost control remained favourable as we continued to track within cost guidance given the expected cadence in the year's production profile. Higher mining taxes continued as we experienced higher profitability over the past several quarters. Lastly, volatile inter-period copper and gold prices led to relatively high mark-to-market adjustments for our strategic non-QP hedging program and high share prices for our common shares led to higher share-based compensation expenses. This led to a total of $19.5 million in mark-to-market adjustments to be added back in our adjusted net earnings - attributable to owners measure.
The first quarter of 2024 and the fourth quarter of 2023 reflected the continuation of strong copper, gold and silver production that commenced in the third quarter of 2023. The increase in copper, gold and silver prices in the first quarter of 2024 also contributed to strong revenue and profitability in the quarter.
Third quarter of 2023 results reflected significantly higher copper and gold production and sales volumes from the high grade zones of the Pampacancha deposit and higher gold and copper grade zones at Lalor resulting in a significant increase in our revenues, gross profits and earnings.
The second quarter of 2023 benefited from the drawdown of higher-than-normal unsold copper concentrate inventory levels in Peru that had built up due to supply chain disruptions during a short period of social and political unrest in the first quarter of 2023.
Gold prices during the first quarter of 2023 averaged levels not seen since 2020, which positively impacted gross profit during the quarter. Social and political unrest in Peru resulted in road blockades causing logistics and supply chain disruptions until mid-February 2023 and led to a buildup of copper concentrate inventory above normal operating levels, affecting overall revenues and net earnings attributable in the first quarter.
The following table sets forth selected consolidated financial information for each of the three most recently completed years:
|
(in $ millions, except for earnings (loss) per share, dividends declared per share, production on a copper equivalent basis and average realized copper price) |
2024 |
2023 |
2022 |
|
Production on a copper equivalent basis (tonnes) |
247,948 |
225,430 |
178,970 |
|
Average realized copper price ($/lb) |
4.18 |
3.84 |
3.94 |
|
Revenue |
2,021.2 |
1,690.0 |
1,461.4 |
|
Gross profit |
553.8 |
392.5 |
276.9 |
|
Income before tax |
251.6 |
151.8 |
95.8 |
|
Net income |
67.8 |
69.5 |
70.4 |
|
Adjusted net earnings - attributable 1 |
181.4 |
69.0 |
26.4 |
|
Earnings per share attributable: |
|
|
|
|
Basic and diluted |
0.20 |
0.22 |
0.27 |
|
Adjusted net earnings 1 per share - attributable |
0.48 |
0.23 |
0.10 |
|
Total assets |
5,487.6 |
5,312.6 |
4,325.9 |
|
Operating cash flow before precious metals stream deposit and changes in non-cash working capital |
691.1 |
570.0 |
391.7 |
|
Adjusted EBITDA1 |
822.5 |
647.8 |
475.9 |
|
Total non-current financial liabilities2 |
1,266.2 |
1,400.7 |
1,281.5 |
|
Dividends declared per share - C$3 |
0.02 |
0.02 |
0.02 |
1 Adjusted net earnings - attributable, adjusted net earnings per share - attributable, and adjusted EBITDA are non-GAAP financial performance measure with no standardized definition under IFRS. For further information and a detailed reconciliation, please see the discussion under the "Non-GAAP Financial Performance Measures" section of this MD&A.
2 Total non-current financial liabilities consists of non-current other financial liabilities, lease liabilities and long-term debt.
3 Dividend paid during March and September of each year.
We achieved copper equivalent production of 247,948 tonnes. Record copper equivalent production along with strong metal prices resulted in record annual revenue of $2,021.2 million and record annual adjusted EBITDA of $822.5 million. Our enhanced operating platform delivered a strong consolidated annual performance with record annual gold production exceeding 2024 consolidated guidance. The completion of planned stripping activities at Pampacancha in Peru unlocked higher copper and gold grades. In addition, record gold production was achieved in Manitoba in 2024 through a combination of higher metallurgical recoveries at New Britannia and Stall Mills, despite processing lower gold grades year-over-year. Since acquiring Copper Mountain in June 2023, we have shifted to optimization efforts which have been focused on ramping up the mining fleet to execute a planned accelerated stripping campaign to gain access to higher grades, as well as plant improvement initiatives to improve mill reliability and recoveries.
Despite the planned closure of the 777 mine in June 2022, we achieved record production on a copper equivalent basis during 2024 due to additional production from our recently acquired Copper Mountain mine as well a significantly higher copper and gold production from mining the high grade zones of the Pampacancha deposit and higher gold and copper grade zones at Lalor. Operating cash flow before change in non-cash working capital increased by $178.3 million to $570.0 million in 2023 mainly driven by record metal production during the year.
NON-GAAP FINANCIAL PERFORMANCE MEASURES
Adjusted net earnings (loss) attributable to owners, adjusted net earnings (loss) per share attributable to owners, adjusted EBITDA, realized prices, net debt, net debt to adjusted EBITDA, cash cost, sustaining and all-in sustaining cash cost per pound of copper produced, cash cost and sustaining cash cost per ounce of gold produced, combined unit cost and ratios based on these measures are non-GAAP performance measures. These measures do not have a meaning prescribed by IFRS and are therefore unlikely to be comparable to similar measures presented by other issuers. These measures should not be considered in isolation or as a substitute for measures prepared in accordance with IFRS and are not necessarily indicative of gross profit or cash flow from operations as determined under IFRS. Other companies may calculate these measures differently.
Management believes adjusted net earnings (loss) attributable to owners and adjusted net earnings (loss) per share attributable to owners provides an alternate measure of the Company's performance for the current period and gives insight into its expected performance in future periods. These measures are used internally by the Company to evaluate the performance of its underlying operations and to assist with its planning and forecasting of future operating results. As such, the Company believes these measures are useful to investors in assessing the Company's underlying performance. We provide adjusted EBITDA to help users analyze our results and to provide additional information about our ongoing cash generating potential in order to assess our capacity to service and repay debt, carry out investments and cover working capital needs. Net debt is shown because it is a performance measure used by the Company to assess our financial position. Net debt to adjusted EBITDA is shown because it is a performance measure used by the Company to assess our financial leverage and debt capacity. Realized price is shown to understand the average realized price of metals sold to third parties in each reporting period. Cash cost, sustaining and all-in sustaining cash cost per pound of copper produced are shown because we believe they help investors and management assess the performance of our operations, including the margin generated by the operations and the Company. Cash cost and sustaining cash cost per ounce of gold produced are shown because we believe they help investors and management assess the performance of our Manitoba operations. Combined unit cost is shown because we believe it helps investors and management assess our cost structure and margins that are not impacted by variability in by-product commodity prices.
Adjusted Net Earnings - Attributable to owners
Adjusted net earnings attributable to owners represents net earnings (loss) excluding certain impacts such as mark-to-market adjustments, foreign exchange (gains) loss, revaluation adjustment - environmental provisions for closed sites, variable consideration adjustment related to stream agreements, impairment charges and reversal of impairment charges on assets, (gain) loss on disposal of assets, other items that are not indicative of the underlying operating performance of our core business; and tax effect and non-controlling interest of the previously discussed items. These measures are not necessarily indicative of net earnings (loss) as determined under IFRS. The following table provides a reconciliation of net earnings and non-controlling interest per the consolidated statements of income, to adjusted net earnings attributable to owners of the Company for the year ended December 31, 2024 and 2023.
| Three months ended | Year ended | |||||||||||
| (in $ millions) | Dec. 31, 2024 |
Dec. 31, 2023 |
Dec. 31, 2024 |
Dec. 31, 2023 |
||||||||
| Net earnings for the period | 19.3 | 33.5 | 67.8 | 69.5 | ||||||||
| Tax expense | 84.4 | 47.5 | 183.8 | 82.3 | ||||||||
| Earnings before tax | 103.7 | 81.0 | 251.6 | 151.8 | ||||||||
| Adjusting items: | ||||||||||||
| Mark-to-market adjustments1 | (10.3 | ) | 12.7 | 27.1 | 22.1 | |||||||
| Foreign exchange loss | 17.4 | 4.2 | 21.0 | 5.3 | ||||||||
| Re-evaluation adjustment - environmental provision | 2.5 | 34.0 | (3.5 | ) | (11.4 | ) | ||||||
| Variable consideration adjustment - stream revenue and accretion | - | - | 4.0 | (5.0 | ) | |||||||
| Inventory adjustments | 1.3 | 1.4 | 2.9 | 2.3 | ||||||||
| Premium paid on redemption of notes | - | 2.2 | - | 2.2 | ||||||||
| Acquisition related costs | - | - | - | 6.9 | ||||||||
| Insurance recovery | - | (4.2 | ) | - | (4.2 | ) | ||||||
| Value-added-tax recovery | - | (3.9 | ) | - | (3.9 | ) | ||||||
| Write off fair value of the Copper Mountain Bonds | - | (1.0 | ) | - | (1.0 | ) | ||||||
| Restructuring charges | - | 0.6 | 1.2 | 2.9 | ||||||||
| Reduction of obligation to renounce flow-through share expenditures, net of provisions | 1.0 | - | (2.0 | ) | - | |||||||
| Write-down/loss on disposal of PP&E | 14.1 | 6.6 | 27.4 | 7.4 | ||||||||
| Adjusted earnings before income taxes | 129.7 | 133.6 | 329.7 | 175.4 | ||||||||
| Tax expense | (84.4 | ) | (47.5 | ) | (183.8 | ) | (82.3 | ) | ||||
| Tax impact of adjusting items | 23.4 | (14.8 | ) | 30.8 | (20.6 | ) | ||||||
| Adjusted net earnings | 68.7 | 71.3 | 176.7 | 72.5 | ||||||||
| Adjusted net earnings attributable to non-controlling interest: | ||||||||||||
| Net loss (earnings) for the period | 1.9 | (2.8 | ) | 8.9 | (3.2 | ) | ||||||
| Adjusting items, including tax impact | (0.3 | ) | 0.4 | (4.2 | ) | (0.3 | ) | |||||
| Adjusted net earnings - attributable to owners | 70.3 | 68.9 | 181.4 | 69.0 | ||||||||
| Adjusted net earnings ($/share) - attributable to owners | 0.18 | 0.20 | 0.48 | 0.23 | ||||||||
| Basic weighted average number of common shares outstanding (millions) | 394.0 | 349.1 | 376.8 | 310.8 | ||||||||
1 Includes changes in fair value of the gold prepayment liability, Canadian junior mining investments, other financial assets and liabilities at fair value through net earnings and share-based compensation expenses (recoveries). Also includes gains and losses on disposition of investments.
After adjusting reported net earnings for those items not considered representative of the Company's core business or indicative of future operations, the Company had adjusted net earnings - attributable in the fourth quarter of 2024 of $70.3 million or 0.18 earnings per share.
Adjusted EBITDA
Adjusted EBITDA is net earnings before net finance expense/income, tax expense/recoveries, depreciation and amortization of property, plant and equipment and deferred revenue, as well as certain other adjustments. We calculate adjusted EBITDA by excluding certain adjustments included within our adjusted net earnings attributable measure which we believe reflects the underlying performance of our core operating activities. The measure also removes the impact of non-cash items and financing costs that are not associated with measuring the underlying performance of our operations. However, our adjusted EBITDA is not the measure defined as EBITDA under our senior notes or revolving credit facilities and may not be comparable with performance measures with the same name reported by other companies. Adjusted EBITDA should not be considered as a substitute for earnings, which is calculated in accordance with IFRS. We provide adjusted EBITDA to help users analyze our results and to provide additional information about our ongoing cash generating potential in order to assess our capacity to service and repay debt, carry out investments and cover working capital needs.
The following table presents the reconciliation of earnings per the consolidated statements of income, to adjusted EBITDA for the three months ended and year ended December 31, 2024 and 2023:
| Three months ended | Year ended | |||||||||||
| (in $ millions) | Dec. 31, 2024 |
Dec. 31, 2023 |
Dec. 31, 2024 |
Dec. 31, 2023 |
||||||||
| Net earnings for the period | 19.3 | 33.5 | 67.8 | 69.5 | ||||||||
| Add back: | ||||||||||||
| Tax expense | 84.4 | 47.5 | 183.8 | 82.3 | ||||||||
| Net finance expense | 34.4 | 48.9 | 148.7 | 145.3 | ||||||||
| Other expense | 22.1 | 10.6 | 57.4 | 38.3 | ||||||||
| Depreciation and amortization | 122.2 | 121.9 | 426.6 | 391.7 | ||||||||
| Amortization of deferred revenue and variable consideration adjustment | (26.2 | ) | (26.5 | ) | (70.5 | ) | (77.3 | ) | ||||
| Adjusting items (pre-tax): | ||||||||||||
| Re-evaluation adjustment - environmental provision | 2.5 | 34.0 | (3.5 | ) | (11.4 | ) | ||||||
| Inventory adjustments | 1.3 | 1.4 | 2.9 | 2.3 | ||||||||
| Option agreement proceeds (Marubeni) | - | - | (0.4 | ) | - | |||||||
| Realized loss on non-QP hedges | (4.2 | ) | - | (8.9 | ) | - | ||||||
| Share-based compensation expense 1 | 1.5 | 3.1 | 18.6 | 7.1 | ||||||||
| Adjusted EBITDA | 257.3 | 274.4 | 822.5 | 647.8 | ||||||||
1 Share-based compensation expense reflected in cost of sales and selling and administrative expenses.
Net Debt
The following table presents our calculation of net debt as at December 31, 2024 and December 31, 2023:
| (in $ millions) | Dec. 31, 2024 |
Dec. 31, 2023 |
||||
| Total long-term debt | 1,107.5 | 1,287.5 | ||||
| Cash and cash equivalents | (541.8 | ) | (249.8 | ) | ||
| Short-term investments | (40.0 | ) | - | |||
| Net debt | 525.7 | 1,037.7 |
Net Debt to Adjusted EBITDA Ratio
The following table presents our calculation of net debt to adjusted EBITDA, both metrics have been reconciled above to the most comparable IFRS measure, as at December 31, 2024 and December 31, 2023:
| (in $ millions, except net debt to adjusted EBITDA ratio) | Dec. 31, 2024 |
Dec. 31, 2023 |
||||
| Net debt | 525.7 | 1,037.7 | ||||
| Adjusted EBITDA for the last twelve months | 822.5 | 647.8 | ||||
| Net debt to adjusted EBITDA | 0.6 | 1.6 |
Cash Cost, Sustaining and All-in Sustaining Cash Cost (Copper Basis)
Cash cost per pound of copper produced ("cash cost") is a non-GAAP measure that management uses as a key performance indicator to assess the performance of our operations. Our calculation designates copper as our primary metal of production as it has been the largest component of revenues. The calculation is presented in four manners:
- Cash cost, before by-product credits - This measure is gross of by-product revenues and is a function of the efforts and costs incurred to mine and process all ore mined. However, the measure divides this aggregate cost over only pounds of copper produced, our primary metal of production. This measure is generally less volatile from period to period, as it is not affected by changes in the price received for by-product metals. It is, however, affected by the relative mix of copper concentrate and zinc concentrate production, where an increase in production of zinc concentrate will tend to result in an increase in cash cost under this measure.
- Cash cost, net of by-product credits - In order to calculate the net cost to produce and sell copper, the net of by-product credits measure subtracts the revenues realized from the sale of the metals other than copper. The by-product revenues from zinc, gold, and silver are significant and are integral to the economics of our operations. The economics that support our decision to produce and sell copper would be different if we did not receive revenues from the other significant metals being extracted and processed. This measure provides management and investors with an indication of the minimum copper price consistent with positive operating margins, assuming realized by-product metal prices are consistent with those prevailing during the reporting period. It also serves as an important operating statistic that management and investors utilize to measure our operating performance versus that of our competitors. However, it is important to understand that if by-product metal prices decline alongside copper prices, the cash cost net of by-product credits would increase, requiring a higher copper price than that reported to maintain positive cash flows and operating margins.
- Sustaining cash cost, net of by-product credits - This measure is an extension of cash cost that includes cash sustaining capital expenditures, including payments on capitalized leases, capitalized sustaining exploration, net smelter returns royalties, payments on certain long-term community agreements, as well as accretion and amortization for expected decommissioning activities for producing assets. It does not include corporate selling and administrative expenses. It provides a more fulsome measurement of the cost of sustaining production than cash cost, which is focused on operating costs only.
- All-in sustaining cash cost, net of by-product credits - This measure is an extension of sustaining cash cost that includes corporate G&A, regional costs, accretion and amortization for community agreements relating to current operations, and accretion for expected decommissioning activities for non-producing sites. Due to the inclusion of corporate selling and administrative expenses, all-in sustaining cash cost is presented on a consolidated basis only.
The tables below present a detailed build-up of cash cost and sustaining cash cost, net of by-product credits, by business unit in addition to consolidated all-in sustaining cash cost, net of by-product credits, and reconciliations between cash cost, net of by-product credits, to the most comparable IFRS measures of cost of sales for the three months and year ended December 31, 2024 and 2023. Cash cost, net of by-product credits may not calculate exactly based on amounts presented in the tables below due to rounding.
| Consolidated | Three months ended | Year ended | ||||||||||
| (in thousands) | Dec. 31, 2024 | Dec. 31, 2023 | Dec. 31, 2024 | Dec. 31, 2023 | ||||||||
| Peru | 74,931 | 73,209 | 218,260 | 221,536 | ||||||||
| Manitoba | 7,379 | 8,234 | 27,637 | 26,795 | ||||||||
| British Columbia | 13,067 | 18,755 | 58,215 | 41,995 | ||||||||
| Net pounds of copper produced1 | 95,377 | 100,198 | 304,112 | 290,326 | ||||||||
1 Contained copper in concentrate.
| Consolidated | Three months ended | Year ended | ||||||||||||||||||||||
| Dec. 31, 2024 | Dec. 31, 2023 | Dec. 31, 2024 | Dec. 31, 2023 | |||||||||||||||||||||
| Cash cost per pound of copper produced | $ millions | $/lb | $ millions | $/lb | $ millions | $/lb | $ millions | $/lb | ||||||||||||||||
| Cash cost, before by-product credits | 308.6 | 3.23 | 287.2 | 2.87 | 1,107.3 | 3.64 | 972.7 | 3.35 | ||||||||||||||||
| By-product credits | (265.5 | ) | (2.78 | ) | (271.8 | ) | (2.71 | ) | (967.4 | ) | (3.18 | ) | (741.3 | ) | (2.55 | ) | ||||||||
| Cash cost, net of by-product credits | 43.1 | 0.45 | 15.4 | 0.16 | 139.9 | 0.46 | 231.4 | 0.80 | ||||||||||||||||
| Consolidated | Three months ended | Year ended | ||||||||||||||||||||||
| Dec. 31, 2024 | Dec. 31, 2023 | Dec. 31, 2024 | Dec. 31, 2023 | |||||||||||||||||||||
| Cash cost per pound of copper produced | $ millions | $/lb | $ millions | $/lb | $ millions | $/lb | $ millions | $/lb | ||||||||||||||||
| Mining | 108.1 | 1.13 | 89.7 | 0.89 | 394.0 | 1.30 | 332.0 | 1.14 | ||||||||||||||||
| Milling | 95.4 | 1.00 | 90.7 | 0.91 | 352.1 | 1.16 | 309.7 | 1.07 | ||||||||||||||||
| G&A | 50.6 | 0.53 | 38.8 | 0.39 | 162.8 | 0.54 | 122.6 | 0.42 | ||||||||||||||||
| Onsite costs | 254.1 | 2.66 | 219.2 | 2.19 | 908.9 | 3.00 | 764.3 | 2.63 | ||||||||||||||||
| Treatment & refining | 25.9 | 0.27 | 35.7 | 0.36 | 97.3 | 0.31 | 113.7 | 0.39 | ||||||||||||||||
| Freight & other | 28.6 | 0.30 | 32.3 | 0.32 | 101.1 | 0.33 | 94.7 | 0.33 | ||||||||||||||||
| Cash cost, before by-product credits | 308.6 | 3.23 | 287.2 | 2.87 | 1,107.3 | 3.64 | 972.7 | 3.35 | ||||||||||||||||
| Consolidated | Three months ended | Year ended | ||||||||||||||||||||||
| Dec. 31, 2024 | Dec. 31, 2023 | Dec. 31, 2024 | Dec. 31, 2023 | |||||||||||||||||||||
| Supplementary cash cost information | $ millions | $/lb 1 | $ millions | $/lb 1 | $ millions | $/lb1 | $ millions | $/lb1 | ||||||||||||||||
| By-product credits2: | ||||||||||||||||||||||||
| Zinc | 16.1 | 0.17 | 18.6 | 0.18 | 69.9 | 0.23 | 74.9 | 0.26 | ||||||||||||||||
| Gold3 | 212.9 | 2.23 | 216.2 | 2.16 | 747.8 | 2.46 | 525.6 | 1.80 | ||||||||||||||||
| Silver3 | 26.6 | 0.28 | 22.7 | 0.23 | 86.0 | 0.28 | 68.7 | 0.24 | ||||||||||||||||
| Molybdenum & other | 9.9 | 0.10 | 14.3 | 0.14 | 63.7 | 0.21 | 72.1 | 0.25 | ||||||||||||||||
| Total by-product credits | 265.5 | 2.78 | 271.8 | 2.71 | 967.4 | 3.18 | 741.3 | 2.55 | ||||||||||||||||
| Reconciliation to IFRS: | ||||||||||||||||||||||||
| Cash cost, net of by-product credits | 43.1 | 15.4 | 139.9 | 231.4 | ||||||||||||||||||||
| By-product credits | 265.5 | 271.8 | 967.4 | 741.3 | ||||||||||||||||||||
| Treatment and refining charges | (25.9 | ) | (35.7 | ) | (97.3 | ) | (113.7 | ) | ||||||||||||||||
| Inventory adjustments | 1.3 | 1.4 | 2.9 | 2.3 | ||||||||||||||||||||
| Share-based compensation expense | 0.7 | 0.3 | 1.9 | 0.6 | ||||||||||||||||||||
| Past service costs | 1.5 | - | 4.3 | - | ||||||||||||||||||||
| Change in product inventory | (10.0 | ) | 29.3 | 11.4 | 38.4 | |||||||||||||||||||
| Royalties | 2.1 | 1.1 | 10.3 | 5.5 | ||||||||||||||||||||
| Depreciation and amortization4 | 122.2 | 121.8 | 426.6 | 391.7 | ||||||||||||||||||||
| Cost of sales5 | 400.5 | 405.4 | 1,467.4 | 1,297.5 | ||||||||||||||||||||
1 Per pound of copper produced.
2 By-product credits are computed as revenue per financial statements, including amortization of deferred revenue and pricing and volume adjustments. For more information, please see the realized price reconciliation table on page 43 of this MD&A for these figures.
3 Gold and silver by-product credits do not include variable consideration adjustments with respect to stream arrangements. Variable consideration adjustments are cumulative adjustments to gold and silver stream deferred revenue primarily associated with the net change in mineral reserves and resources or amendments to the mine plan that would change the total expected deliverable ounces under the precious metal streaming arrangement. For the year ended December 31, 2024 the variable consideration adjustments amounted loss of $3.8 million (year ended December 31, 2023 - income of $4.9 million).
4 Depreciation is based on concentrate sold.
5 As per consolidated financial statements.
| Peru | Three months ended | Year ended | ||||||||||
| (in thousands) | Dec. 31, 2024 | Dec. 31, 2023 | Dec. 31, 2024 | Dec. 31, 2023 | ||||||||
| Net pounds of copper produced1 | 74,931 | 73,209 | 218,260 | 221,536 | ||||||||
1 Contained copper in concentrate.
| Peru | Three months ended | Year ended | ||||||||||||||||||||||
| Dec. 31, 2024 | Dec. 31, 2023 | Dec. 31, 2024 | Dec. 31, 2023 | |||||||||||||||||||||
| Cash cost per pound of copper produced | $ millions | $/lb | $ millions | $/lb | $ millions | $/lb | $ millions | $/lb | ||||||||||||||||
| Mining | 47.3 | 0.63 | 30.4 | 0.41 | 145.5 | 0.67 | 122.6 | 0.55 | ||||||||||||||||
| Milling | 53.6 | 0.72 | 50.2 | 0.69 | 197.1 | 0.90 | 198.1 | 0.90 | ||||||||||||||||
| G&A | 33.2 | 0.44 | 24.8 | 0.34 | 95.5 | 0.44 | 77.2 | 0.35 | ||||||||||||||||
| Onsite costs | 134.1 | 1.79 | 105.4 | 1.44 | 438.1 | 2.01 | 397.9 | 1.80 | ||||||||||||||||
| Treatment & refining | 16.0 | 0.21 | 19.6 | 0.27 | 53.4 | 0.24 | 66.4 | 0.30 | ||||||||||||||||
| Freight & other | 19.2 | 0.25 | 20.8 | 0.28 | 62.5 | 0.29 | 62.7 | 0.28 | ||||||||||||||||
| Cash cost, before by-product credits | 169.3 | 2.25 | 145.8 | 1.99 | 554.0 | 2.54 | 527.0 | 2.38 | ||||||||||||||||
| By-product credits | (94.0 | ) | (1.25 | ) | (106.1 | ) | (1.45 | ) | (295.8 | ) | (1.36 | ) | (289.1 | ) | (1.31 | ) | ||||||||
| Cash cost, net of by-product credits | 75.3 | 1.00 | 39.7 | 0.54 | 258.2 | 1.18 | 237.9 | 1.07 | ||||||||||||||||
| Peru | Three months ended | Year ended | ||||||||||||||||||||||
| Dec. 31, 2024 | Dec. 31, 2023 | Dec. 31, 2024 | Dec. 31, 2023 | |||||||||||||||||||||
| Supplementary cash cost information | $ millions | $/lb 1 | $ millions | $/lb 1 | $ millions | $/lb 1 | $ millions | $/lb 1 | ||||||||||||||||
| By-product credits2: | ||||||||||||||||||||||||
| Gold3 | 68.5 | 0.91 | 77.5 | 1.05 | 182.5 | 0.84 | 169.9 | 0.77 | ||||||||||||||||
| Silver3 | 16.8 | 0.22 | 14.3 | 0.20 | 51.3 | 0.24 | 47.3 | 0.21 | ||||||||||||||||
| Molybdenum | 8.7 | 0.12 | 14.3 | 0.20 | 62.0 | 0.28 | 71.9 | 0.33 | ||||||||||||||||
| Total by-product credits | 94.0 | 1.25 | 106.1 | 1.45 | 295.8 | 1.36 | 289.1 | 1.31 | ||||||||||||||||
| Reconciliation to IFRS: | ||||||||||||||||||||||||
| Cash cost, net of by-product credits | 75.3 | 39.7 | 258.2 | 237.9 | ||||||||||||||||||||
| By-product credits | 94.0 | 106.1 | 295.8 | 289.1 | ||||||||||||||||||||
| Treatment and refining charges | (16.0 | ) | (19.6 | ) | (53.4 | ) | (66.4 | ) | ||||||||||||||||
| Inventory adjustments | (0.2 | ) | - | - | - | |||||||||||||||||||
| Share-based compensation expenses | 0.1 | 0.1 | 0.5 | 0.1 | ||||||||||||||||||||
| Change in product inventory | (6.7 | ) | 8.0 | 9.6 | 28.1 | |||||||||||||||||||
| Royalties | 1.5 | 1.5 | 6.7 | 5.6 | ||||||||||||||||||||
| Depreciation and amortization4 | 83.2 | 85.7 | 270.3 | 275.7 | ||||||||||||||||||||
| Cost of sales5 | 231.2 | 221.5 | 787.7 | 770.1 | ||||||||||||||||||||
1 Per pound of copper produced.
2 By-product credits are computed as revenue per financial statements, including amortization of deferred revenue and pricing and volume adjustments. For more information, please see the realized price reconciliation table on page 43 of this MD&A.
3 Gold and silver by-product credits do not include variable consideration adjustments with respect to stream arrangements.
4 Depreciation is based on concentrate sold.
5 As per the consolidated financial statements.
| British Columbia | Three months ended | Year ended | ||||||||||
| (in thousands) | Dec. 31, 2024 | Dec. 31, 2023 | Dec. 31, 2024 | Dec. 31, 2023 | ||||||||
| Net pounds of copper produced1 | 13,067 | 18,755 | 58,215 | 41,995 | ||||||||
1 Contained copper in concentrate.
| British Columbia | Three months ended | Year ended | ||||||||||||||||||||||
| Dec. 31, 2024 | Dec. 31, 2023 | Dec. 31, 2024 | Dec. 31, 2023 | |||||||||||||||||||||
| Cash cost per pound of copper produced | $ millions | $/lb | $ millions | $/lb | $ millions | $/lb | $ millions | $/lb | ||||||||||||||||
| Mining | 18.2 | 1.39 | 19.0 | 1.01 | 79.1 | 1.36 | 48.3 | 1.15 | ||||||||||||||||
| Milling | 25.2 | 1.93 | 25.2 | 1.35 | 89.8 | 1.54 | 49.3 | 1.17 | ||||||||||||||||
| G&A | 4.6 | 0.35 | 5.6 | 0.30 | 19.6 | 0.34 | 10.7 | 0.25 | ||||||||||||||||
| Onsite costs | 48.0 | 3.67 | 49.8 | 2.66 | 188.5 | 3.24 | 108.3 | 2.57 | ||||||||||||||||
| Treatment & refining | 3.4 | 0.26 | 4.9 | 0.26 | 14.4 | 0.25 | 9.8 | 0.23 | ||||||||||||||||
| Freight & other | 2.4 | 0.19 | 4.7 | 0.25 | 13.2 | 0.22 | 8.4 | 0.20 | ||||||||||||||||
| Cash cost, before by-product credits | 53.8 | 4.12 | 59.4 | 3.17 | 216.1 | 3.71 | 126.5 | 3.00 | ||||||||||||||||
| By-product credits | (14.6 | ) | (1.12 | ) | (9.3 | ) | (0.50 | ) | (56.5 | ) | (0.97 | ) | (21.5 | ) | (0.51 | ) | ||||||||
| Cash cost, net of by-product credits | 39.2 | 3.00 | 50.1 | 2.67 | 159.6 | 2.74 | 105.0 | 2.49 | ||||||||||||||||
| British Columbia | Three months ended | Year ended | ||||||||||||||||||||||
| Dec. 31, 2024 | Dec. 31, 2023 | Dec. 31, 2024 | Dec. 31, 2023 | |||||||||||||||||||||
| Supplementary cash cost information | $ millions | $/lb 1 | $ millions | $/lb 1 | $ millions | $/lb 1 | $ millions | $/lb 1 | ||||||||||||||||
| By-product credits2: | ||||||||||||||||||||||||
| Gold | 13.3 | 1.02 | 6.9 | 0.37 | 49.3 | 0.85 | 17.0 | 0.40 | ||||||||||||||||
| Silver | 1.3 | 0.10 | 2.4 | 0.13 | 7.2 | 0.12 | 4.5 | 0.11 | ||||||||||||||||
| Total by-product credits | 14.6 | 1.12 | 9.3 | 0.50 | 56.5 | 0.97 | 21.5 | 0.51 | ||||||||||||||||
| Reconciliation to IFRS: | ||||||||||||||||||||||||
| Cash cost, net of by-product credits | 39.2 | 50.1 | 159.6 | 105.0 | ||||||||||||||||||||
| By-product credits | 14.6 | 9.3 | 56.5 | 21.5 | ||||||||||||||||||||
| Treatment and refining charges | (3.4 | ) | (4.9 | ) | (14.4 | ) | (9.8 | ) | ||||||||||||||||
| Inventory adjustments | 1.2 | - | 1.2 | - | ||||||||||||||||||||
| Change in product inventory | (3.0 | ) | 8.5 | 3.8 | 8.5 | |||||||||||||||||||
| Share based payment | 0.4 | - | 0.4 | - | ||||||||||||||||||||
| Royalties | 0.6 | (0.4 | ) | 3.6 | (0.2 | ) | ||||||||||||||||||
| Depreciation and amortization3 | 11.8 | 5.5 | 50.1 | 11.7 | ||||||||||||||||||||
| Cost of sales4 | 61.4 | 68.1 | 260.8 | 136.7 | ||||||||||||||||||||
1 Per pound of copper produced.
2 By-product credits are computed as revenue per financial statements, including amortization of deferred revenue and pricing and volume adjustments. For more information, please see the realized price reconciliation table on page 43 of this MD&A.
3 Depreciation is based on concentrate sold.
4 As per consolidated financial statements.
| Consolidated | Three months ended | Year ended | ||||||||||||||||||||||
| Dec. 31, 2024 | Dec. 31, 2023 | Dec. 31, 2024 | Dec. 31, 2023 | |||||||||||||||||||||
| All-in sustaining cash cost per pound of copper produced | $ millions | $/lb | $ millions | $/lb | $ millions | $/lb | $ millions | $/lb | ||||||||||||||||
| Cash cost, net of by-product credits | 43.1 | 0.45 | 15.4 | 0.16 | 139.9 | 0.46 | 231.4 | 0.80 | ||||||||||||||||
| Cash sustaining capital expenditures | 85.3 | 0.89 | 87.6 | 0.87 | 342.2 | 1.13 | 255.9 | 0.88 | ||||||||||||||||
| Capitalized exploration | - | - | 5.2 | 0.05 | - | - | 5.2 | 0.02 | ||||||||||||||||
| Royalties | 2.1 | 0.03 | 1.1 | 0.01 | 10.3 | 0.03 | 5.5 | 0.02 | ||||||||||||||||
| Sustaining cash cost, net of by-product credits | 130.5 | 1.37 | 109.3 | 1.09 | 492.4 | 1.62 | 498.0 | 1.72 | ||||||||||||||||
| Corporate selling and administrative expenses & regional costs | 11.6 | 0.12 | 12.7 | 0.13 | 62.4 | 0.20 | 43.5 | 0.14 | ||||||||||||||||
| Accretion and amortization of decommissioning and community agreements1 | 3.7 | 0.04 | 9.0 | 0.09 | 17.3 | 0.06 | 16.0 | 0.06 | ||||||||||||||||
| All-in sustaining cash cost, net of by-product credits | 145.8 | 1.53 | 131.0 | 1.31 | 572.1 | 1.88 | 557.5 | 1.92 | ||||||||||||||||
| Reconciliation to property, plant and equipment additions: | ||||||||||||||||||||||||
| Property, plant and equipment additions | 127.6 | 54.0 | 325.7 | 212.6 | ||||||||||||||||||||
| Capitalized stripping net additions | 35.8 | 40.9 | 160.5 | 111.2 | ||||||||||||||||||||
| Total accrued capital additions | 163.4 | 94.9 | 486.2 | 323.8 | ||||||||||||||||||||
| Less other non-sustaining capital costs2 | 91.8 | 19.9 | 193.1 | 105.7 | ||||||||||||||||||||
| Total sustaining capital costs | 71.6 | 75.0 | 293.1 | 218.1 | ||||||||||||||||||||
| Capitalized lease & equipment financing cash payments - operating sites | 10.3 | 8.7 | 38.4 | 25.0 | ||||||||||||||||||||
| Community agreement cash payments 3 | 0.7 | 2.3 | 2.5 | 6.7 | ||||||||||||||||||||
| Accretion and amortization of decommissioning and restoration obligations 4 | 2.7 | 1.6 | 8.2 | 6.1 | ||||||||||||||||||||
| Cash sustaining capital expenditures | 85.3 | 87.6 | 342.2 | 255.9 | ||||||||||||||||||||
1 Includes accretion of decommissioning liability relating to non-producing sites, and accretion and amortization of community agreements capitalized to Other assets.
2 Other non-sustaining capital costs include Arizona capitalized costs, capitalized interest, capitalized exploration, right-of-use lease asset additions, equipment financing asset additions, growth capital expenditures and reclassification related to capital spares.
3 Amortization for community agreements relating to current operations.
4 Includes amortization of decommissioning and restoration PP&E assets and accretion of decommissioning and restoration liabilities related to producing sites.
| Peru | Three months ended | Year ended | ||||||||||||||||||||||
| Dec. 31, 2024 | Dec. 31, 2023 | Dec. 31, 2024 | Dec. 31, 2023 | |||||||||||||||||||||
| Sustaining cash cost per pound of copper produced | $ millions | $/lb | $ millions | $/lb | $ millions | $/lb | $ millions | $/lb | ||||||||||||||||
| Cash cost, net of by-product credits | 75.3 | 1.00 | 39.7 | 0.54 | 258.2 | 1.18 | 237.9 | 1.07 | ||||||||||||||||
| Cash sustaining capital expenditures | 34.3 | 0.46 | 42.3 | 0.58 | 141.6 | 0.65 | 152.0 | 0.69 | ||||||||||||||||
| Capitalized exploration | - | - | 5.2 | 0.07 | - | - | 5.2 | 0.02 | ||||||||||||||||
| Royalties | 1.5 | 0.02 | 1.5 | 0.02 | 6.7 | 0.03 | 5.6 | 0.03 | ||||||||||||||||
| Sustaining cash cost per pound of copper produced | 111.1 | 1.48 | 88.7 | 1.21 | 406.5 | 1.86 | 400.7 | 1.81 | ||||||||||||||||
| British Columbia | Three months ended | Year ended | ||||||||||||||||||||||
| Dec. 31, 2024 | Dec. 31, 2023 | Dec. 31, 2024 | Dec. 31, 2023 | |||||||||||||||||||||
| Sustaining cash cost per pound of copper produced | $ millions | $/lb | $ millions | $/lb | $ millions | $/lb | $ millions | $/lb | ||||||||||||||||
| Cash cost, net of by-product credits | 39.2 | 3.00 | 50.1 | 2.67 | 159.6 | 2.74 | 105.0 | 2.49 | ||||||||||||||||
| Cash sustaining capital expenditures | 35.4 | 2.71 | 24.1 | 1.28 | 144.5 | 2.48 | 38.5 | 0.92 | ||||||||||||||||
| Royalties | 0.6 | 0.05 | (0.4 | ) | (0.02 | ) | 3.6 | 0.07 | (0.2 | ) | - | |||||||||||||
| Sustaining cash cost per pound of copper produced | 75.2 | 5.76 | 73.8 | 3.93 | 307.7 | 5.29 | 143.3 | 3.41 | ||||||||||||||||
Gold Cash Cost and Gold Sustaining Cash Cost
Cash cost per ounce of gold produced ("gold cash cost") is a non-GAAP measure that management uses as a key performance indicator to assess the performance of our Manitoba operations. This alternative cash cost calculation designates gold as the primary metal of production as it represents a substantial component of revenues for our Manitoba business unit and should therefore be less volatile over time than Manitoba cash cost per pound of copper. The calculation is presented in three manners:
- Gold cash cost, before by-product credits - This measure is gross of by-product revenues and is a function of the efforts and costs incurred to mine and process all ore mined. However, the measure divides this aggregate cost over only ounces of gold produced, the assumed primary metal of production. This measure is generally less volatile from period to period, as it is not affected by changes in the price received for by-product metals.
- Gold cash cost, net of by-product credits - In order to calculate the net cost to produce and sell gold, the net of by-product credits measure subtracts the revenues realized from the sale of the metals other than gold. The by-product revenues from copper, zinc, and silver are significant and are integral to the economics of our Manitoba operation. The economics that support our decision to produce and sell gold would be different if we did not receive revenues from the other significant metals being extracted and processed. This measure provides management and investors with an indication of the minimum gold price consistent with positive operating margins, assuming realized by-product metal prices are consistent with those prevailing during the reporting period. It also serves as an important operating statistic that management and investors utilize to measure our operating performance at our Manitoba operation versus that of our competitors. However, it is important to understand that if by-product metal prices decline alongside gold prices, the gold cash cost net of by-product credits would increase, requiring a higher gold price than that reported to maintain positive cash flows and operating margins.
- Gold sustaining cash cost, net of by-product credits - This measure is an extension of gold cash cost that includes cash sustaining capital expenditures, capitalized exploration, net smelter returns royalties, as well as accretion and amortization for expected decommissioning activities for producing assets. It does not include corporate selling and administrative expenses. It provides a more fulsome measurement of the cost of sustaining production than gold cash cost, which is focused on operating costs only.
The tables below present a detailed build-up of gold cash cost and gold sustaining cash cost, net of by-product credits, for the Manitoba business unit, and reconciliations between gold cash cost, net of by-product credits, to the most comparable IFRS measures of cost of sales for the year ended December 31, 2024 and 2023. Gold cash cost, net of by-product credits, may not calculate exactly based on amounts presented in the tables below due to rounding.
| Manitoba | Three months ended | Year ended | ||||||||||
| (in thousands) | Dec. 31, 2024 | Dec. 31, 2023 | Dec. 31, 2024 | Dec. 31, 2023 | ||||||||
| Net ounces of gold produced1 | 51,438 | 59,863 | 214,225 | 187,363 | ||||||||
1 Contained gold in concentrate and doré.
| Manitoba | Three months ended | Year ended | ||||||||||||||||||||||
| Dec. 31, 2024 | Dec. 31, 2023 | Dec. 31, 2024 | Dec. 31, 2023 | |||||||||||||||||||||
| Cash cost per ounce of gold produced | $ millions | $/oz1 | $ millions | $/oz1 | $ millions | $/oz1 | $ millions | $/oz1 | ||||||||||||||||
| Mining | 42.6 | 828 | 40.3 | 673 | 169.4 | 791 | 161.1 | 860 | ||||||||||||||||
| Milling | 16.6 | 323 | 15.3 | 256 | 65.2 | 304 | 62.3 | 333 | ||||||||||||||||
| G&A | 12.8 | 249 | 8.4 | 140 | 47.7 | 223 | 34.7 | 185 | ||||||||||||||||
| Onsite costs | 72.0 | 1,400 | 64.0 | 1,069 | 282.3 | 1,318 | 258.1 | 1,378 | ||||||||||||||||
| Treatment & refining | 6.5 | 126 | 11.1 | 186 | 29.5 | 137 | 37.5 | 200 | ||||||||||||||||
| Freight & other | 7.0 | 136 | 6.8 | 113 | 25.4 | 119 | 23.6 | 126 | ||||||||||||||||
| Cash cost, before by-product credits | 85.5 | 1,662 | 81.9 | 1,368 | 337.2 | 1,574 | 319.2 | 1,704 | ||||||||||||||||
| By-product credits | (54.3 | ) | (1,055 | ) | (56.0 | ) | (934 | ) | (207.3 | ) | (968 | ) | (183.1 | ) | (977 | ) | ||||||||
| Gold cash cost, net of by-product credits | 31.2 | 607 | 25.9 | 434 | 129.9 | 606 | 136.1 | 727 | ||||||||||||||||
| Manitoba | Three months ended | Year ended | ||||||||||||||||||||||
| Supplementary cash cost information | Dec. 31, 2024 | Dec. 31, 2023 | Dec. 31, 2024 | Dec. 31, 2023 | ||||||||||||||||||||
| $ millions | $/oz 1 | $ millions | $/oz 1 | $ millions | $/oz 1 | $ millions | $/oz 1 | |||||||||||||||||
| By-product credits2: | ||||||||||||||||||||||||
| Copper | 28.5 | 554 | 31.4 | 526 | 108.2 | 505 | 91.1 | 487 | ||||||||||||||||
| Zinc | 16.1 | 313 | 18.6 | 308 | 69.9 | 326 | 74.9 | 399 | ||||||||||||||||
| Silver | 8.5 | 165 | 6.0 | 100 | 27.5 | 128 | 16.9 | 90 | ||||||||||||||||
| Other | 1.2 | 23 | - | - | 1.7 | 9 | 0.2 | 1 | ||||||||||||||||
| Total by-product credits | 54.3 | 1,055 | 56.0 | 934 | 207.3 | 968 | 183.1 | 977 | ||||||||||||||||
| Reconciliation to IFRS: | ||||||||||||||||||||||||
| Cash cost, net of by-product credits | 31.2 | 25.9 | 129.9 | 136.1 | ||||||||||||||||||||
| By-product credits | 54.3 | 56.0 | 207.3 | 183.1 | ||||||||||||||||||||
| Treatment and refining charges | (6.5 | ) | (11.1 | ) | (29.5 | ) | (37.5 | ) | ||||||||||||||||
| Past service costs | 1.5 | - | 4.3 | - | ||||||||||||||||||||
| Share-based compensation expenses | 0.2 | 0.2 | 1.0 | 0.5 | ||||||||||||||||||||
| Inventory adjustments | 0.3 | 1.4 | 1.7 | 2.3 | ||||||||||||||||||||
| Change in product inventory | (0.3 | ) | 12.8 | (2.0 | ) | 1.8 | ||||||||||||||||||
| Royalties | - | - | - | 0.1 | ||||||||||||||||||||
| Depreciation and amortization3 | 27.2 | 30.6 | 106.2 | 104.3 | ||||||||||||||||||||
| Cost of sales4 | 107.9 | 115.8 | 418.9 | 390.7 | ||||||||||||||||||||
1 Per ounce of gold produced.
2 By-product credits are computed as revenue per financial statements, amortization of deferred revenue and pricing and volume adjustments. For more information, please see the realized price reconciliation table on page 43 of this MD&A.
3 Depreciation is based on concentrate sold.
4 As per consolidated financial statements.
| Manitoba | Three months ended | Year ended | ||||||||||||||||||||||
| Dec. 31, 2024 | Dec. 31, 2023 | Dec. 31, 2024 | Dec. 31, 2023 | |||||||||||||||||||||
| Sustaining cash cost per ounce of gold produced | $ millions | $/oz | $ millions | $/oz | $ millions | $/oz | $ millions | $/oz | ||||||||||||||||
| Gold cash cost, net of by-product credits | 31.2 | 607 | 25.9 | 434 | 129.9 | 606 | 136.1 | 727 | ||||||||||||||||
| Cash sustaining capital expenditures | 15.5 | 301 | 21.2 | 354 | 56.1 | 262 | 65.4 | 349 | ||||||||||||||||
| Royalties | - | - | - | - | - | - | 0.1 | 1 | ||||||||||||||||
| Sustaining cash cost per ounce of gold produced | 46.7 | 908 | 47.1 | 788 | 186.0 | 868 | 201.6 | 1,077 | ||||||||||||||||
Combined Unit Cost
Combined unit cost ("unit cost") and zinc plant unit cost is a non-GAAP measure that management uses as a key performance indicator to assess the performance of our mining and milling operations. Combined unit cost is calculated by dividing the cost of sales by mill throughput. This measure is utilized by management and investors to assess our cost structure and margins and compare it to similar information provided by other companies in our industry. Unlike cash cost, this measure is not impacted by variability in by-product commodity prices since there are no by-product deductions; costs associated with profit-sharing and similar costs are excluded because of their correlation to external metal prices. In addition, the unit costs are reported in the functional currency of the operation which minimizes the impact of foreign currency fluctuations. In all, the unit cost measures provide an alternative perspective on operating cost performance with minimal impact from external market prices.
The tables below present a detailed combined unit cost for the Peru and Manitoba business units, and reconciliations between these measures to the most comparable IFRS measures of cost of sales for the year ended December 31, 2024 and 2023.
| Peru | Three months ended | Year ended | ||||||||||
| (in millions except ore tonnes milled and unit cost per tonne) | Dec. 31, 2024 | Dec. 31, 2023 | Dec. 31, 2024 | Dec. 31, 2023 | ||||||||
| Combined unit cost per tonne processed | ||||||||||||
| Mining | 47.3 | 30.4 | 145.5 | 122.6 | ||||||||
| Milling | 53.6 | 50.2 | 197.1 | 198.1 | ||||||||
| G&A1 | 33.2 | 24.8 | 95.5 | 77.2 | ||||||||
| Less: Other G&A2 | (12.1 | ) | (8.2 | ) | (25.9 | ) | (14.9 | ) | ||||
| Unit cost | 122.0 | 97.2 | 412.2 | 383.0 | ||||||||
| Tonnes ore milled | 7,999 | 7,939 | 31,934 | 30,721 | ||||||||
| Combined unit cost per tonne | 15.25 | 12.24 | 12.91 | 12.47 | ||||||||
| Reconciliation to IFRS: | ||||||||||||
| Unit cost | 122.0 | 97.2 | 412.2 | 383.0 | ||||||||
| Freight & other | 19.2 | 20.8 | 62.5 | 62.7 | ||||||||
| Other G&A | 12.1 | 8.2 | 25.9 | 14.9 | ||||||||
| Share-based compensation expenses | 0.1 | 0.1 | 0.5 | 0.1 | ||||||||
| Inventory adjustments | (0.2 | ) | - | - | - | |||||||
| Change in product inventory | (6.7 | ) | 8.0 | 9.6 | 28.1 | |||||||
| Royalties | 1.5 | 1.5 | 6.7 | 5.6 | ||||||||
| Depreciation and amortization | 83.2 | 85.7 | 270.3 | 275.7 | ||||||||
| Cost of sales3 | 231.2 | 221.5 | 787.7 | 770.1 | ||||||||
1 G&A as per cash cost reconciliation above.
2 Other G&A primarily includes profit sharing costs.
3 As per consolidated financial statements.
| Manitoba | Three months ended | Year ended | ||||||||||
| (in millions except tonnes ore milled and unit cost per tonne) | Dec. 31, 2024 | Dec. 31, 2023 | Dec. 31, 2024 | Dec. 31, 2023 | ||||||||
| Combined unit cost per tonne processed | ||||||||||||
| Mining | 42.6 | 40.3 | 169.4 | 161.1 | ||||||||
| Milling | 16.6 | 15.3 | 65.2 | 62.3 | ||||||||
| G&A1 | 12.8 | 8.4 | 47.7 | 34.7 | ||||||||
| Less: Other G&A related to profit sharing costs | (4.0 | ) | (1.5 | ) | (17.0 | ) | (6.7 | ) | ||||
| Unit cost | 68.0 | 62.5 | 265.3 | 251.4 | ||||||||
| USD/CAD implicit exchange rate | 1.39 | 1.36 | 1.37 | 1.35 | ||||||||
| Unit cost - C$ | 95.0 | 85.0 | 363.5 | 339.2 | ||||||||
| Tonnes ore milled | 407,596 | 393,837 | 1,608,708 | 1,562,479 | ||||||||
| Combined unit cost per tonne - C$ | 233 | 216 | 226 | 217 | ||||||||
| Reconciliation to IFRS: | ||||||||||||
| Unit cost | 68.0 | 62.5 | 265.3 | 251.4 | ||||||||
| Freight & other | 7.0 | 6.8 | 25.4 | 23.6 | ||||||||
| Other G&A related to profit sharing | 4.0 | 1.5 | 17.0 | 6.7 | ||||||||
| Share-based compensation expenses | 0.2 | 0.2 | 1.0 | 0.5 | ||||||||
| Inventory adjustments | 0.3 | 1.4 | 1.7 | 2.3 | ||||||||
| Past service costs | 1.5 | - | 4.3 | - | ||||||||
| Change in product inventory | (0.3 | ) | 12.8 | (2.0 | ) | 1.8 | ||||||
| Royalties | - | - | - | 0.1 | ||||||||
| Depreciation and amortization | 27.2 | 30.6 | 106.2 | 104.3 | ||||||||
| Cost of sales2 | 107.9 | 115.8 | 418.9 | 390.7 | ||||||||
1 G&A as per cash cost reconciliation above.
2 As per consolidated financial statements.
| British Columbia | Three months ended | Year ended | ||||||||||
| (in millions except tonnes ore milled and unit cost per tonne) | Dec. 31, 2024 | Dec. 31, 2023 | Dec. 31, 2024 | Dec. 31, 2023 | ||||||||
| Combined unit cost per tonne processed | ||||||||||||
| Mining | 18.2 | 19.0 | 79.1 | 48.3 | ||||||||
| Milling | 25.2 | 25.2 | 89.8 | 49.3 | ||||||||
| G&A1 | 4.6 | 5.6 | 19.6 | 10.7 | ||||||||
| Unit cost | 48.0 | 49.8 | 188.5 | 108.3 | ||||||||
| USD/CAD implicit exchange rate | 1.38 | 1.37 | 1.37 | 1.36 | ||||||||
| Unit cost - C$ | 66.9 | 68.2 | 258.1 | 146.7 | ||||||||
| Tonnes ore milled | 2,881 | 3,262 | 12,657 | 6,862 | ||||||||
| Combined unit cost per tonne - C$ | 23.22 | 20.90 | 20.39 | 21.38 | ||||||||
| Reconciliation to IFRS: | ||||||||||||
| Unit cost | 48.0 | 49.8 | 188.5 | 108.3 | ||||||||
| Freight & other | 2.4 | 4.7 | 13.2 | 8.4 | ||||||||
| Change in product inventory | (3.0 | ) | 8.5 | 3.8 | 8.5 | |||||||
| Shared based compensation | 0.4 | - | 0.4 | - | ||||||||
| Inventory adjustments | 1.2 | - | 1.2 | - | ||||||||
| Royalties | 0.6 | (0.4 | ) | 3.6 | (0.2 | ) | ||||||
| Depreciation and amortization | 11.8 | 5.5 | 50.1 | 11.7 | ||||||||
| Cost of sales2 | 61.4 | 68.1 | 260.8 | 136.7 | ||||||||
1 G&A as per cash cost reconciliation above.
2 As per consolidated financial statements.
ACCOUNTING CHANGES
New standards and interpretations adopted and not yet adopted
For information on new standards and interpretations adopted and not yet adopted, refer to note 4 of our December 31, 2024 consolidated financial statements.
CRITICAL ACCOUNTING JUDGEMENTS AND ESTIMATES
The preparation of the consolidated financial statements in conformity with IFRS requires us to make judgements, estimates and assumptions that affect the application of accounting policies, reported amounts of assets and liabilities, disclosure of contingent assets and liabilities at the date of the consolidated financial statements, and reported amounts of revenue and expenses during the reporting period. Actual results may differ from these estimates.
We review these estimates and underlying assumptions on an ongoing basis based on our experience and other factors, including expectations of future events that we believe to be reasonable under the circumstances. Revisions to accounting estimates are recognized in the period in which the estimates are revised and in any future periods affected. Certain accounting estimates and judgements have been identified as being "critical" to the presentation of our financial condition and results of operations because they require us to make subjective and/or complex judgements about matters that are inherently uncertain; or there is a reasonable likelihood that materially different amounts could be reported under different conditions or using different assumptions and estimates.
The following are significant judgements and estimates impacting the consolidated financial statements:
- Judgements and estimates that affect multiple areas of the consolidated financial statements:
- Mineral reserves and resources which form the basis of life of mine plans which are utilized in impairment testing, timing of payments related to decommissioning obligations and depreciation of capital assets. We estimate our mineral reserves and resources based on information compiled by qualified persons as defined in accordance with NI 43-101;
- Income and mining taxes, including estimates of future taxable profit which impacts the ability to realize deferred tax assets on our balance sheet; and - In respect of the outcome of uncertain future events as it concerns recognizing contingent liabilities.
- Judgements and estimates that relate mainly to assets (these judgements may also affect other areas of the consolidated financial statements):
- Property, plant and equipment:
- Cost allocations for mine development;
- Mining properties expenditures capitalized;
- Classification of supply costs as related to capital development or inventory acquisition;
- Determining when exploration and evaluation assets should be transferred to capital works in progress within property, plant and equipment;
- Determination of when an asset or group of assets is in the condition and location to be ready for use as intended by management for the purposes of commencing depreciation;
- Componentization;
- Assessment of impairment, including determination of cash generating units and assessing for indicators of impairment;
- Recoverability of exploration and evaluation assets, including determination of cash generating units and assessing for indications of impairment;
- Units of production depreciation;
- Plant and equipment estimated useful lives and residual values;
- Capitalized stripping costs; and
- Finite life intangible assets.
- Impairment (and reversal of impairment) of non-financial assets:
- Future production levels and timing;
- Operating and capital costs;
- Future commodity prices;
- Foreign exchange rates; and
- Risk adjusted discount rates; and
- In process inventory quantities, inventory cost allocations and inventory valuation.
- Judgements and estimates that relate mainly to liabilities (these judgements may also affect other areas of the consolidated financial statements):
- Determination of deferred revenue per unit related to the precious metals stream transactions and determination of current portion of deferred revenue, which is based on timing of future sales, and adjustments of the expected conversion of resource to reserves;
- Pensions and other employee benefits; and
- Decommissioning, restoration and similar liabilities including estimated future costs and timing of spending.
- Estimates that relate mainly to the consolidated statements of income:
- Assaying used to determine revenues and recoverability of inventories.
For more information on judgements and estimates, refer to note 2 of our consolidated financial statements for the year ended December 31, 2024.
DISCLOSURE CONTROLS AND PROCEDURES AND INTERNAL CONTROL OVER FINANCIAL REPORTING
Disclosure controls and procedures ("DC&P")
Management is responsible for establishing and maintaining adequate DC&P. As of December 31, 2024, we have evaluated the effectiveness of the design and operation of our DC&P in accordance with requirements of National Instrument 52-109 of the Canadian Securities Commission ("NI 52-109") and the Sarbanes Oxley Act of 2002 (as adopted by the US Securities and Exchange Commission). Our Chief Executive Officer ("CEO") and Chief Financial Officer ("CFO") supervised and participated in this evaluation.
As of December 31, 2024, based on management's evaluation, our CEO and CFO concluded that our DC&P were effective to ensure that information required to be disclosed by us in reports we file or submit is recorded, processed, summarized and reported within the time periods specified in securities legislation and is accumulated and communicated to our management, including our CEO and CFO, to allow timely decisions regarding required disclosure.
Internal control over financial reporting ("ICFR")
Management of Hudbay is responsible for establishing and maintaining adequate ICFR. Under the supervision and with the participation of our Chief Executive Officer and Chief Financial Officer, we evaluated the effectiveness of our ICFR as of December 31, 2024 based upon the Internal Control - Integrated Framework (2013) issued by the Committee of Sponsoring Organizations of the Treadway Commission. Based on management's evaluation, our CEO and CFO concluded that our ICFR was effective as of December 31, 2024.
The effectiveness of the Company's ICFR as of December 31, 2024 has been audited by Deloitte LLP, Independent Registered Public Accounting Firm as stated in their report immediately preceding the Company's consolidated financial statements for the year ended December 31, 2024.
Changes in ICFR
We did not make any changes to ICFR during the year ended December 31, 2024 that materially affected, or are reasonably likely to materially affect, our ICFR.
Inherent limitations of controls and procedures
All internal control systems, no matter how well designed, have inherent limitations. As a result, even systems determined to be effective may not prevent or detect misstatements on a timely basis, as systems can provide only reasonable assurance that the objectives of the control system are met. In addition, projections of any evaluation of the effectiveness of ICFR to future periods are subject to the risk that controls may become inadequate because of changes in conditions, or that the degree of compliance with the policies or procedures may change.
NOTES TO READER
Forward-Looking Information
This MD&A contains forward-looking information within the meaning of applicable Canadian and United States securities legislation. All information contained in this MD&A, other than statements of current and historical fact, is forward-looking information. Often, but not always, forward-looking information can be identified by the use of words such as "plans", "expects", "budget", "guidance", "scheduled", "estimates", "forecasts", "strategy", "target", "intends", "objective", "goal", "understands", "anticipates" and "believes" (and variations of these or similar words) and statements that certain actions, events or results "may", "could", "would", "should", "might" "occur" or "be achieved" or "will be taken" (and variations of these or similar expressions). All of the forward-looking information in this MD&A is qualified by this cautionary note.
Forward-looking information includes, but is not limited to, statements with respect to our production, cost and capital and exploration expenditure guidance, expectations regarding reductions in discretionary spending and capital expenditures, our ability to stabilize and optimize the Copper Mountain mine operation, the implementation of stripping strategies and the expected benefits therefrom, the estimated timelines and pre-requisites for sanctioning the Copper World project and the pursuit of a potential minority joint venture partner, the possibility of and expectations regarding the results of any challenges to the permits for the Copper World project, the expected benefits of the sanctioning of Copper World project, the expected benefits of Manitoba growth initiatives, including the use of the exploration drift at the 1901 deposit, the potential utilization of excess capacity at the Stall mill, and the advancement of our exploration partnership with Marubeni, the anticipated use of proceeds from the flow-through financing completed during the fourth quarter of 2024, our future deleveraging strategies and our ability to deleverage and repay debt as needed, expectations regarding our cash balance and liquidity, expectations regarding the ability to conduct exploration work and execute on exploration programs on its properties and to advance related drill plans, including the advancement of the exploration program at Maria Reyna and Caballito and the status of the related drill permit application process, the ability to continue mining higher-grade ore in the Pampacancha pit and our expectations resulting therefrom, expectations regarding our ability to further reduce greenhouse gas emissions, our evaluation and assessment of opportunities to reprocess tailings using various metallurgical technologies, expectations regarding the prospective nature of the Maria Reyna and Caballito properties, the anticipated impact of brownfield and greenfield growth projects on our performance, anticipated expansion opportunities and extension of mine life in Snow Lake and our ability to find a new anchor deposit near our Snow Lake operations, anticipated future drill programs and exploration activities and any results expected therefrom, anticipated mine plans, anticipated metals prices and the anticipated sensitivity of our financial performance to metals prices, events that may affect our operations and development projects, anticipated cash flows from operations and related liquidity requirements, the anticipated effect of external factors on revenue, such as commodity prices, estimation of mineral reserves and resources, mine life projections, reclamation costs, economic outlook, government regulation of mining operations, and business and acquisition strategies. Forward-looking information is not, and cannot be, a guarantee of future results or events. Forward-looking information is based on, among other things, opinions, assumptions, estimates and analyses that, while considered reasonable by us at the date the forward-looking information is provided, inherently are subject to significant risks, uncertainties, contingencies and other factors that may cause actual results and events to be materially different from those expressed or implied by the forward-looking information.
The material factors or assumptions that we identified and were applied by us in drawing conclusions or making forecasts or projections set out in the forward-looking information include, but are not limited to:
- the ability to achieve production, cost and capital and exploration expenditure guidance;
- no significant interruptions to our operations due to social or political unrest in the regions we operate, including the navigation of the complex political and social environment in Peru; - no interruptions to our plans for advancing the Copper World project, including with respect to any successful challenges to the Copper World permits and/or the pursuit of a potential minority joint venture partner;
- our ability to successfully complete the stabilization and optimization of the Copper Mountain operations, obtain required permits and develop and maintain good relations with key stakeholders;
- the ability to execute on its exploration plans and to advance related drill plans;
- the ability to advance the exploration program at the Maria Reyna and Caballito properties;
- the success of mining, processing, exploration and development activities;
- the scheduled maintenance and availability of our processing facilities;
- the accuracy of geological, mining and metallurgical estimates;
- anticipated metals prices and the costs of production;
- the supply and demand for metals we produce;
- the supply and availability of all forms of energy and fuels at reasonable prices;
- no significant unanticipated operational or technical difficulties;
- the execution of our business and growth strategies, including the success of our strategic investments and initiatives;
- the availability of additional financing, if needed;
- the ability to deleverage and repay debt, as needed;
- the ability to complete project targets on time and on budget and other events that may affect our ability to develop our projects;
- the timing and receipt of various regulatory and governmental approvals;
- the availability of personnel for our exploration, development and operational projects and ongoing employee relations;
- maintaining good relations with the employees at our operations;
- maintaining good relations with the labour unions that represent certain of our employees in Manitoba and Peru;
- maintaining good relations with the communities in which we operate, including the neighbouring Indigenous communities and local governments;
- no significant unanticipated challenges with stakeholders at our various projects;
- no significant unanticipated events or changes relating to regulatory, environmental, health and safety matters;
- no contests over title to our properties, including as a result of rights or claimed rights of Indigenous peoples or challenges to the validity of our unpatented mining claims;
- the timing and possible outcome of pending litigation and no significant unanticipated litigation;
- certain tax matters, including, but not limited to current tax laws and regulations, changes in taxation policies and the refund of certain value added taxes from the Canadian and Peruvian governments; and
- no significant and continuing adverse changes in general economic conditions or conditions in the financial markets (including commodity prices and foreign exchange rates).
The risks, uncertainties, contingencies and other factors that may cause actual results to differ materially from those expressed or implied by the forward-looking information may include, but are not limited to, risks related to the failure to effectively complete the stabilization, optimization and expansion of the Copper Mountain mine operations, political and social risks in the regions we operate, including the navigation of the complex political and social environment in Peru, risks generally associated with the mining industry and the current geopolitical environment, including future commodity prices, the potential implementation or expansion of tariffs, currency and interest rate fluctuations, energy and consumable prices, supply chain constraints and general cost escalation in the current inflationary environment, uncertainties related to the development and operation of our projects, the risk of an indicator of impairment or impairment reversal relating to a material mineral property, risks related to the Copper World project, including in relation to project delivery and financing risks, risks related to the Lalor mine plan, including the ability to convert inferred mineral resource estimates to higher confidence categories, dependence on key personnel and employee and union relations, risks related to political or social instability, unrest or change, risks in respect of Indigenous and community relations, rights and title claims, operational risks and hazards, including the cost of maintaining and upgrading our tailings management facilities and any unanticipated environmental, industrial and geological events and developments and the inability to insure against all risks, failure of plant, equipment, processes, transportation and other infrastructure to operate as anticipated, compliance with government and environmental regulations, including permitting requirements and anti-bribery legislation, depletion of our reserves, volatile financial markets and interest rates that may affect our ability to obtain additional financing on acceptable terms, the failure to obtain required approvals or clearances from government authorities on a timely basis, uncertainties related to the geology, continuity, grade and estimates of mineral reserves and resources, and the potential for variations in grade and recovery rates, uncertain costs of reclamation activities, our ability to comply with our pension and other post-retirement obligations, our ability to abide by the covenants in our debt instruments and other material contracts, tax refunds, hedging transactions, as well as the risks discussed under the heading "Risk Factors" in our most recent Annual Information Form which is available on the Company's SEDAR+ profile at www.sedarplus.ca and the Company's EDGAR profile at www.sec.gov.
Should one or more risk, uncertainty, contingency or other factor materialize or should any factor or assumption prove incorrect, actual results could vary materially from those expressed or implied in the forward-looking information. Accordingly, you should not place undue reliance on forward-looking information. We do not assume any obligation to update or revise any forward-looking information after the date of this MD&A or to explain any material difference between subsequent actual events and any forward-looking information, except as required by applicable law.
Note to United States Investors
This MD&A has been prepared in accordance with the requirements of the securities laws in effect in Canada, which may differ materially from the requirements of United States securities laws applicable to U.S. issuers.
Qualified Person and NI 43-101
The technical and scientific information in this MD&A related to our material mineral projects has been approved by Olivier Tavchandjian, P. Geo, Senior Vice President, Exploration and Technical Services. Mr. Tavchandjian is a qualified person pursuant to National Instrument 43-101 - Standards of Disclosure for Mineral Projects ("NI 43-101").
For a description of the key assumptions, parameters and methods used to estimate mineral reserves and resources at Hudbay's material mineral properties, as well as data verification procedures and a general discussion of the extent to which the estimates of scientific and technical information may be affected by any known environmental, permitting, legal title, taxation, sociopolitical, marketing or other relevant factors, please see the technical reports for our material properties as filed by us on SEDAR+ at www.sedarplus.ca and EDGAR at www.sec.gov.
SUMMARY OF HISTORICAL RESULTS
The following unaudited tables set out a summary of quarterly and annual results for the Company.
| 2024 4 | Q4 2024 | Q3 2024 | Q2 2024 | Q1 2024 | 2023 4 | Q4 2023 | Q3 2023 | Q2 2023 | Q1 2023 | 2022 4 | Q4 2022 | |||||||||||||||||||||||||
| Consolidated Financial Condition ($ millions) | ||||||||||||||||||||||||||||||||||||
| Cash and cash equivalents and short-term investments | $ | 581.8 | $ | 581.8 | $ | 483.3 | $ | 523.8 | $ | 284.4 | $ | 249.8 | $ | 249.8 | $ | 245.2 | $ | 179.7 | $ | 255.6 | $ | 225.7 | $ | 225.7 | ||||||||||||
| Total long-term debt | 1,107.5 | 1,107.5 | 1,108.9 | 1,155.6 | 1,278.6 | 1,287.5 | 1,287.5 | 1,377.4 | 1,370.7 | 1,225.0 | 1,184.2 | 1,184.2 | ||||||||||||||||||||||||
| Net debt1 | 525.7 | 525.7 | 625.6 | 631.8 | 994.2 | 1,037.7 | 1,037.7 | 1,132.2 | 1,190.9 | 969.5 | 958.5 | 958.5 | ||||||||||||||||||||||||
| Consolidated Financial Performance ($ millions except per share amounts) | ||||||||||||||||||||||||||||||||||||
| Revenue | $ | 2,021.2 | $ | 584.9 | $ | 485.8 | $ | 425.5 | $ | 525.0 | $ | 1,690.0 | $ | 602.2 | $ | 480.5 | $ | 312.2 | $ | 295.2 | $ | 1,461.4 | $ | 321.2 | ||||||||||||
| Cost of sales | 1,467.4 | 400.5 | 346.0 | 347.9 | 373.0 | 1,297.5 | 405.4 | 374.1 | 289.3 | 228.7 | 1,184.6 | 251.5 | ||||||||||||||||||||||||
| Earnings (loss) before tax | 251.6 | 103.7 | 79.7 | 0.4 | 67.8 | 151.8 | 81.0 | 84.1 | (30.7 | ) | 17.4 | 95.8 | (14.3 | ) | ||||||||||||||||||||||
| Net (loss) earnings | 67.8 | 19.3 | 50.4 | (20.4 | ) | 18.5 | 69.5 | 33.5 | 45.5 | (14.9 | ) | 5.5 | 70.4 | (17.4 | ) | |||||||||||||||||||||
| Net (loss) earnings attributable to owners1 | 76.7 | 21.2 | 49.8 | (16.6 | ) | 22.4 | 66.4 | 30.7 | 45.1 | (14.9 | ) | 5.5 | 6.6 | (17.4 | ) | |||||||||||||||||||||
| Basic and diluted earnings (loss) per share | $ | 0.20 | $ | 0.05 | $ | 0.13 | $ | (0.05 | ) | $ | 0.06 | $ | 0.22 | $ | 0.09 | $ | 0.13 | $ | (0.05 | ) | $ | 0.02 | $ | 0.27 | $ | (0.07 | ) | |||||||||
| Adjusted earnings (loss) per share attributable to owners 1 | $ | 0.48 | $ | 0.18 | $ | 0.13 | $ | 0.00 | $ | 0.17 | $ | 0.23 | $ | 0.20 | $ | 0.07 | $ | (0.07 | ) | $ | 0.00 | $ | 0.10 | $ | 0.01 | |||||||||||
| Operating cash flow before change in non-cash working capital | 691.1 | 231.5 | 188.3 | 123.6 | 147.5 | 570.0 | 246.5 | 182.0 | 55.9 | 85.6 | 391.7 | 109.1 | ||||||||||||||||||||||||
| Adjusted EBITDA 1 | 822.5 | 257.3 | 206.2 | 145.0 | 214.2 | 647.8 | 274.4 | 190.7 | 81.2 | 101.9 | 475.9 | 124.7 | ||||||||||||||||||||||||
| Consolidated Operational Performance | ||||||||||||||||||||||||||||||||||||
| Contained metal in concentrate and doré produced 2 | ||||||||||||||||||||||||||||||||||||
| Copper | 137,943 | 43,262 | 31,354 | 28,578 | 34,749 | 131,691 | 45,450 | 41,964 | 21,715 | 22,562 | 104,173 | 29,305 | ||||||||||||||||||||||||
| Gold | 332,240 | 94,161 | 89,073 | 58,614 | 90,392 | 310,429 | 112,776 | 101,417 | 48,996 | 47,240 | 219,700 | 53,920 | ||||||||||||||||||||||||
| Silver | 3,983,851 | 1,311,658 | 985,569 | 738,707 | 947,917 | 3,575,234 | 1,197,082 | 1,063,032 | 612,310 | 702,809 | 3,161,294 | 795,015 | ||||||||||||||||||||||||
| Zinc | 33,339 | 8,385 | 8,069 | 8,087 | 8,798 | 34,642 | 5,747 | 10,291 | 8,758 | 9,846 | 55,381 | 6,326 | ||||||||||||||||||||||||
| Molybdenum | 1,323 | 195 | 362 | 369 | 397 | 1,566 | 397 | 466 | 414 | 289 | 1,377 | 344 | ||||||||||||||||||||||||
| Payable metal in concentrate and doré sold | ||||||||||||||||||||||||||||||||||||
| Copper | 125,094 | 37,927 | 27,760 | 25,799 | 33,608 | 124,996 | 44,006 | 39,371 | 23,078 | 18,541 | 94,473 | 25,415 | ||||||||||||||||||||||||
| Gold | 335,342 | 92,734 | 73,232 | 61,295 | 108,081 | 276,893 | 104,840 | 74,799 | 47,533 | 49,720 | 213,415 | 47,256 | ||||||||||||||||||||||||
| Silver | 3,549,816 | 1,150,518 | 663,413 | 667,036 | 1,068,848 | 3,145,166 | 1,048,877 | 748,955 | 805,448 | 541,884 | 2,978,485 | 559,306 | ||||||||||||||||||||||||
| Zinc 3 | 25,120 | 5,261 | 8,607 | 5,133 | 6,119 | 28,779 | 7,385 | 7,125 | 8,641 | 5,628 | 59,043 | 8,230 | ||||||||||||||||||||||||
| Molybdenum | 1,287 | 182 | 343 | 347 | 415 | 1,462 | 468 | 426 | 314 | 254 | 1,352 | 421 | ||||||||||||||||||||||||
| Cash cost 1 | $ | 0.46 | $ | 0.45 | $ | 0.18 | $ | 1.14 | $ | 0.16 | $ | 0.80 | $ | 0.16 | $ | 1.10 | $ | 1.60 | $ | 0.85 | $ | 0.86 | $ | 1.08 | ||||||||||||
| Sustaining cash cost 1 | $ | 1.62 | $ | 1.37 | $ | 1.71 | $ | 2.65 | $ | 1.03 | $ | 1.72 | $ | 1.09 | $ | 1.89 | $ | 2.73 | $ | 1.83 | $ | 2.07 | $ | 2.21 | ||||||||||||
| All-in sustaining cash cost 1 | $ | 1.88 | $ | 1.53 | $ | 1.95 | $ | 3.07 | $ | 1.32 | $ | 1.92 | $ | 1.31 | $ | 2.04 | $ | 2.98 | $ | 2.07 | $ | 2.26 | $ | 2.41 | ||||||||||||
1Net debt, adjusted earnings (loss) per share attributable to owners, adjusted EBITDA, cash cost, sustaining cash cost and all-in sustaining cash cost per pound of copper produced, net of by-product credits, are non-GAAP financial performance measures with no standardized definition under IFRS. For further information and a detailed reconciliation, please see discussion under the "Non-GAAP Financial Performance Measures" section of this MD&A. The above table sets forth selected non-GAAP financial performance measures for each of our nine most recently completed quarters and three most recently completed years; detailed reconciliations for non-comparable prior periods can be found in our MD&A for these prior periods in the "Non-GAAP Financial Performance Measures" section of these documents.
2 Metal reported in concentrate is prior to deductions associated with smelter contract terms.
3 Includes refined zinc metal sold.
4 Annual consolidated results may not calculate based on amounts presented in this table due to rounding.
| 2024 5 | Q4 2024 | Q3 2024 | Q2 2024 | Q1 2024 | 2023 5 | Q4 2023 | Q3 2023 | Q2 2023 | Q1 2023 | 2022 5 | Q4 2022 | ||||||||||||||||||||||||||
| Peru Operations | |||||||||||||||||||||||||||||||||||||
| Constancia ore mined1 | tonnes | 15,046,190 | 4,186,058 | 3,022,931 | 5,277,654 | 2,559,547 | 9,265,954 | 973,176 | 1,242,198 | 3,647,399 | 3,403,181 | 25,840,435 | 5,614,918 | ||||||||||||||||||||||||
| Copper | % | 0.34 | 0.40 | 0.36 | 0.29 | 0.31 | 0.32 | 0.30 | 0.30 | 0.31 | 0.34 | 0.35 | 0.40 | ||||||||||||||||||||||||
| Gold | g/tonne | 0.04 | 0.04 | 0.04 | 0.03 | 0.04 | 0.04 | 0.04 | 0.04 | 0.04 | 0.04 | 0.04 | 0.04 | ||||||||||||||||||||||||
| Silver | g/tonne | 3.08 | 3.88 | 3.20 | 2.50 | 2.79 | 2.53 | 2.26 | 2.91 | 2.49 | 2.52 | 3.40 | 3.48 | ||||||||||||||||||||||||
| Molybdenum | % | 0.01 | 0.02 | 0.02 | 0.01 | 0.01 | 0.01 | 0.01 | 0.01 | 0.01 | 0.01 | 0.01 | 0.01 | ||||||||||||||||||||||||
| Pampacancha ore mined1 | tonnes | 9,317,499 | 4,037,264 | 1,777,092 | 1,288,789 | 2,214,354 | 14,756,416 | 5,556,613 | 5,894,013 | 2,408,495 | 897,295 | 8,319,250 | 3,771,629 | ||||||||||||||||||||||||
| Copper | % | 0.55 | 0.63 | 0.48 | 0.41 | 0.56 | 0.51 | 0.56 | 0.53 | 0.36 | 0.49 | 0.33 | 0.37 | ||||||||||||||||||||||||
| Gold | g/tonne | 0.32 | 0.38 | 0.27 | 0.20 | 0.32 | 0.33 | 0.32 | 0.30 | 0.34 | 0.52 | 0.29 | 0.29 | ||||||||||||||||||||||||
| Silver | g/tonne | 5.61 | 6.43 | 6.23 | 3.83 | 4.64 | 4.28 | 4.84 | 4.22 | 2.81 | 5.12 | 4.06 | 3.84 | ||||||||||||||||||||||||
| Molybdenum | % | 0.01 | 0.00 | 0.01 | 0.02 | 0.02 | 0.01 | 0.01 | 0.02 | 0.02 | 0.01 | 0.01 | 0.01 | ||||||||||||||||||||||||
| Strip Ratio | 1.78 | 1.22 | 2.62 | 1.74 | 1.95 | 1.51 | 1.26 | 1.36 | 1.74 | 1.84 | 1.13 | 0.97 | |||||||||||||||||||||||||
| Ore milled | tonnes | 31,933,624 | 7,999,453 | 8,137,248 | 7,718,962 | 8,077,962 | 30,720,929 | 7,939,044 | 7,895,109 | 7,223,048 | 7,663,728 | 30,522,294 | 7,795,735 | ||||||||||||||||||||||||
| Copper | % | 0.36 | 0.48 | 0.32 | 0.30 | 0.36 | 0.39 | 0.48 | 0.43 | 0.31 | 0.33 | 0.34 | 0.41 | ||||||||||||||||||||||||
| Gold | g/tonne | 0.14 | 0.20 | 0.11 | 0.07 | 0.15 | 0.16 | 0.25 | 0.21 | 0.09 | 0.08 | 0.09 | 0.12 | ||||||||||||||||||||||||
| Silver | g/tonne | 3.84 | 5.28 | 3.70 | 2.85 | 3.48 | 3.62 | 4.20 | 3.75 | 2.78 | 3.69 | 3.58 | 3.93 | ||||||||||||||||||||||||
| Molybdenum | % | 0.01 | 0.01 | 0.01 | 0.01 | 0.01 | 0.01 | 0.01 | 0.02 | 0.01 | 0.01 | 0.01 | 0.01 | ||||||||||||||||||||||||
| Copper recovery | % | 85.0 | 87.8 | 82.6 | 83.1 | 84.9 | 84.2 | 87.4 | 85.2 | 80.0 | 81.7 | 85.0 | 85.1 | ||||||||||||||||||||||||
| Gold recovery | % | 70.7 | 73.3 | 68.1 | 61.4 | 73.4 | 71.8 | 77.6 | 74.8 | 61.1 | 56.8 | 63.6 | 69.6 | ||||||||||||||||||||||||
| Silver recovery | % | 68.8 | 71.4 | 67.0 | 63.9 | 70.7 | 70.0 | 78.0 | 73.2 | 65.1 | 60.7 | 65.7 | 66.5 | ||||||||||||||||||||||||
| Molybdenum recovery | % | 41.7 | 37.1 | 39.0 | 46.3 | 43.2 | 35.8 | 33.6 | 37.2 | 40.5 | 34.8 | 34.8 | 37.7 | ||||||||||||||||||||||||
| Contained metal in concentrate | |||||||||||||||||||||||||||||||||||||
| Copper | tonnes | 99,001 | 33,988 | 21,220 | 19,217 | 24,576 | 100,487 | 33,207 | 29,081 | 17,682 | 20,517 | 89,395 | 27,047 | ||||||||||||||||||||||||
| Gold | ounces | 98,226 | 38,079 | 20,331 | 10,672 | 29,144 | 114,218 | 49,418 | 40,596 | 12,998 | 11,206 | 58,229 | 20,860 | ||||||||||||||||||||||||
| Silver | ounces | 2,708,262 | 969,502 | 648,209 | 450,833 | 639,718 | 2,505,229 | 836,208 | 697,211 | 419,642 | 552,167 | 2,309,352 | 655,257 | ||||||||||||||||||||||||
| Molybdenum | tonnes | 1,323 | 195 | 362 | 369 | 397 | 1,566 | 397 | 466 | 414 | 289 | 1,377 | 344 | ||||||||||||||||||||||||
| Payable metal sold | |||||||||||||||||||||||||||||||||||||
| Copper | tonnes | 88,138 | 28,775 | 18,803 | 16,806 | 23,754 | 96,213 | 31,200 | 27,490 | 21,207 | 16,316 | 79,805 | 23,789 | ||||||||||||||||||||||||
| Gold | ounces | 103,364 | 37,459 | 9,795 | 13,433 | 42,677 | 97,176 | 38,114 | 32,757 | 14,524 | 11,781 | 49,968 | 15,116 | ||||||||||||||||||||||||
| Silver | ounces | 2,343,820 | 824,613 | 365,198 | 400,302 | 753,707 | 2,227,419 | 703,679 | 460,001 | 671,532 | 392,207 | 2,045,678 | 411,129 | ||||||||||||||||||||||||
| Molybdenum | tonnes | 1,287 | 182 | 343 | 347 | 415 | 1,462 | 468 | 426 | 314 | 254 | 1,352 | 421 | ||||||||||||||||||||||||
| Unit cost 2,3,4 | $/tonne | $ | 12.91 | $ | 15.25 | $ | 12.78 | $ | 12.68 | $ | 10.92 | $ | 12.47 | $ | 12.24 | $ | 12.20 | $ | 14.07 | $ | 11.47 | $ | 12.78 | $ | 13.64 | ||||||||||||
| Peru cash cost3 | $/lb | $ | 1.18 | $ | 1.00 | $ | 1.80 | $ | 1.78 | $ | 0.43 | $ | 1.07 | $ | 0.54 | $ | 0.83 | $ | 2.14 | $ | 1.36 | $ | 1.58 | $ | 1.34 | ||||||||||||
| Peru sustaining cash cost3 | $/lb | $ | 1.86 | $ | 1.48 | $ | 2.78 | $ | 2.61 | $ | 1.06 | $ | 1.81 | $ | 1.21 | $ | 1.51 | $ | 3.06 | $ | 2.12 | $ | 2.35 | $ | 2.09 | ||||||||||||
1 Reported tonnes and grade for ore mined are estimates based on mine plan assumptions and may not fully reconcile to ore milled.
2 Reflects combined mine, mill and general and administrative ("G&A") costs per tonne of ore milled. Reflects the deduction of expected capitalized stripping costs.
3 Combined unit costs, cash cost, and sustaining cash cost per pound of copper produced, net of by-product credits, are non-GAAP financial performance measures with no standardized definition under IFRS. For further information and a detailed reconciliation, please see the discussion under the "Non-GAAP Financial Performance Measures" section of this MD&A. The above table sets forth selected non-GAAP financial performance measures for each of our nine most recently completed quarters and three most recently completed years; detailed reconciliations for non-comparable prior periods can be found in our MD&A for these prior periods in the "Non-GAAP Financial Performance Measures" section of these documents.
4 2022 combined unit costs exclude COVID-19 related costs.
5 Annual consolidated results may not calculate based on amounts presented in this table due to rounding.
| 2024 1 | Q4 2024 | Q3 2024 | Q2 2024 | Q1 2024 | 2023 1 | Q4 2023 | Q3 2023 | Q2 2023 | Q1 2023 | 2022 1 | Q4 2022 | |||||||||||||||||||||||||||
| Manitoba Operations | ||||||||||||||||||||||||||||||||||||||
| Lalor ore mined | tonnes | 1,626,935 | 422,454 | 411,295 | 385,478 | 407,708 | 1,526,729 | 372,384 | 367,491 | 413,255 | 373,599 | 1,516,203 | 369,453 | |||||||||||||||||||||||||
| Gold | g/tonne | 4.68 | 4.61 | 5.45 | 3.75 | 4.84 | 4.74 | 5.92 | 5.08 | 4.07 | 3.96 | 4.00 | 4.00 | |||||||||||||||||||||||||
| Copper | % | 0.85 | 0.95 | 0.91 | 0.69 | 0.84 | 0.86 | 1.04 | 1.02 | 0.81 | 0.57 | 0.73 | 0.73 | |||||||||||||||||||||||||
| Zinc | % | 2.84 | 2.95 | 2.73 | 2.76 | 2.92 | 3.00 | 2.20 | 3.31 | 3.14 | 3.32 | 3.14 | 2.17 | |||||||||||||||||||||||||
| Silver | g/tonne | 27.14 | 31.91 | 30.45 | 22.29 | 23.44 | 24.51 | 28.92 | 27.80 | 23.27 | 18.24 | 21.96 | 19.37 | |||||||||||||||||||||||||
| 777 ore mined | tonnes | - | - | - | - | - | - | - | - | - | - | 484,355 | - | |||||||||||||||||||||||||
| Gold | g/tonne | - | - | - | - | - | - | - | - | - | - | 1.66 | - | |||||||||||||||||||||||||
| Copper | % | - | - | - | - | - | - | - | - | - | - | 1.12 | - | |||||||||||||||||||||||||
| Zinc | % | - | - | - | - | - | - | - | - | - | - | 3.83 | - | |||||||||||||||||||||||||
| Silver | g/tonne | - | - | - | - | - | - | - | - | - | - | 20.85 | - | |||||||||||||||||||||||||
| Stall Concentrator: | ||||||||||||||||||||||||||||||||||||||
| Ore milled | tonnes | 893,510 | 222,004 | 222,621 | 229,527 | 219,358 | 965,567 | 228,799 | 255,516 | 238,633 | 242,619 | 968,638 | 204,350 | |||||||||||||||||||||||||
| Gold | g/tonne | 3.42 | 3.36 | 4.23 | 3.02 | 3.07 | 3.45 | 4.22 | 3.70 | 3.12 | 2.78 | 2.86 | 2.50 | |||||||||||||||||||||||||
| Copper | % | 0.71 | 0.73 | 0.89 | 0.59 | 0.64 | 0.74 | 0.73 | 0.77 | 0.85 | 0.59 | 0.71 | 0.61 | |||||||||||||||||||||||||
| Zinc | % | 4.33 | 4.62 | 4.12 | 4.05 | 4.54 | 4.36 | 3.20 | 4.88 | 4.47 | 4.81 | 4.70 | 3.43 | |||||||||||||||||||||||||
| Silver | g/tonne | 26.54 | 29.90 | 30.20 | 21.74 | 24.46 | 24.19 | 28.63 | 28.82 | 22.15 | 17.14 | 22.81 | 19.24 | |||||||||||||||||||||||||
| Gold recovery | % | 68.6 | 69.6 | 70.5 | 65.5 | 68.0 | 64.8 | 67.5 | 67.8 | 59.9 | 61.9 | 58.0 | 62.4 | |||||||||||||||||||||||||
| Copper recovery | % | 87.4 | 84.4 | 88.3 | 85.4 | 91.7 | 90.4 | 92.0 | 93.9 | 88.5 | 87.0 | 87.2 | 89.0 | |||||||||||||||||||||||||
| Zinc recovery | % | 86.2 | 81.7 | 88.1 | 87.1 | 88.4 | 82.2 | 78.5 | 82.6 | 82.2 | 84.4 | 86.6 | 90.1 | |||||||||||||||||||||||||
| Silver recovery | % | 56.8 | 55.1 | 57.8 | 54.2 | 59.8 | 61.4 | 61.8 | 64.9 | 60.3 | 56.3 | 56.8 | 56.6 | |||||||||||||||||||||||||
| New Britannia Concentrator: | ||||||||||||||||||||||||||||||||||||||
| Ore milled | tonnes | 715,198 | 185,592 | 191,298 | 167,899 | 170,409 | 596,912 | 165,038 | 146,927 | 141,905 | 143,042 | 542,269 | 141,142 | |||||||||||||||||||||||||
| Gold | g/tonne | 6.29 | 5.99 | 6.77 | 5.31 | 7.03 | 6.76 | 8.03 | 6.93 | 5.82 | 6.05 | 6.28 | 6.11 | |||||||||||||||||||||||||
| Copper | % | 1.04 | 1.17 | 0.93 | 0.94 | 1.13 | 1.03 | 1.46 | 1.22 | 0.77 | 0.61 | 0.81 | 0.91 | |||||||||||||||||||||||||
| Zinc | % | 0.99 | 1.08 | 1.12 | 0.92 | 0.82 | 0.84 | 0.85 | 0.90 | 0.85 | 0.76 | 0.80 | 0.67 | |||||||||||||||||||||||||
| Silver | g/tonne | 27.78 | 33.97 | 30.24 | 24.42 | 21.60 | 25.11 | 27.97 | 23.88 | 25.79 | 22.39 | 20.97 | 22.09 | |||||||||||||||||||||||||
| Gold recovery - concentrate and doré | % | 89.7 | 90.2 | 90.0 | 90.0 | 88.6 | 88.6 | 89.0 | 88.8 | 88.6 | 87.9 | - | - | |||||||||||||||||||||||||
| Copper recovery | % | 93.6 | 91.3 | 92.8 | 94.4 | 96.2 | 93.3 | 91.6 | 97.4 | 91.2 | 91.7 | 90.7 | 89.3 | |||||||||||||||||||||||||
| Silver recovery - concentrate and doré | % | 80.9 | 79.6 | 79.9 | 83.1 | 82.0 | 81.5 | 83.2 | 82.0 | 79.6 | 80.9 | - | - | |||||||||||||||||||||||||
| Flin Flon Concentrator: | ||||||||||||||||||||||||||||||||||||||
| Ore milled | tonnes | - | - | - | - | - | - | - | - | - | - | 497,344 | - | |||||||||||||||||||||||||
| Gold | g/tonne | - | - | - | - | - | - | - | - | - | - | 1.67 | - | |||||||||||||||||||||||||
| Copper | % | - | - | - | - | - | - | - | - | - | - | 1.11 | - | |||||||||||||||||||||||||
| Zinc | % | - | - | - | - | - | - | - | - | - | - | 3.87 | - | |||||||||||||||||||||||||
| Silver | g/tonne | - | - | - | - | - | - | - | - | - | - | 21.00 | - | |||||||||||||||||||||||||
| Gold recovery | % | - | - | - | - | - | - | - | - | - | - | 57.1 | - | |||||||||||||||||||||||||
| Copper recovery | % | - | - | - | - | - | - | - | - | - | - | 86.7 | - | |||||||||||||||||||||||||
| Zinc recovery | % | - | - | - | - | - | - | - | - | - | - | 83.0 | - | |||||||||||||||||||||||||
| Silver recovery | % | - | - | - | - | - | - | - | - | - | - | 51.8 | - | |||||||||||||||||||||||||
1 Annual consolidated results may not calculate based on amounts presented in this table due to rounding.
| 2024 4 | Q4 2024 | Q3 2024 | Q2 2024 | Q1 2024 | 2023 4 | Q4 2023 | Q3 2023 | Q2 2023 | Q1 2023 | 2022 4 | Q4 2022 | ||||||||||||||||||||||||||
| Manitoba Operations (continued) | |||||||||||||||||||||||||||||||||||||
| Total Manitoba contained metal in concentrate and doré produced5 | |||||||||||||||||||||||||||||||||||||
| Gold | ounces | 214,225 | 51,438 | 62,468 | 43,488 | 56,831 | 187,363 | 59,863 | 56,213 | 35,253 | 36,034 | 161,471 | 33,060 | ||||||||||||||||||||||||
| Copper | tonnes | 12,536 | 3,347 | 3,398 | 2,642 | 3,149 | 12,154 | 3,735 | 3,580 | 2,794 | 2,045 | 14,778 | 2,258 | ||||||||||||||||||||||||
| Zinc | tonnes | 33,339 | 8,385 | 8,069 | 8,087 | 8,798 | 34,642 | 5,747 | 10,291 | 8,758 | 9,846 | 55,381 | 6,326 | ||||||||||||||||||||||||
| Silver | ounces | 995,090 | 283,223 | 281,397 | 210,647 | 219,823 | 851,723 | 255,579 | 264,752 | 180,750 | 150,642 | 851,942 | 139,758 | ||||||||||||||||||||||||
| Total Manitoba payable metal sold in concentrate and doré | |||||||||||||||||||||||||||||||||||||
| Gold | ounces | 212,243 | 50,239 | 57,238 | 42,763 | 62,003 | 171,297 | 63,635 | 36,713 | 33,009 | 37,939 | 163,447 | 32,140 | ||||||||||||||||||||||||
| Copper | tonnes | 11,602 | 3,321 | 2,931 | 2,429 | 2,921 | 10,708 | 3,687 | 2,925 | 1,871 | 2,225 | 14,668 | 1,626 | ||||||||||||||||||||||||
| Zinc1 | tonnes | 25,120 | 5,261 | 8,607 | 5,133 | 6,119 | 28,779 | 7,385 | 7,125 | 8,641 | 5,628 | 59,043 | 8,230 | ||||||||||||||||||||||||
| Silver | ounces | 956,460 | 282,158 | 244,974 | 197,486 | 231,841 | 728,304 | 246,757 | 197,952 | 133,916 | 149,677 | 932,807 | 148,177 | ||||||||||||||||||||||||
| Combined unit cost 2,3 | C$/tonne | $ | 226 | $ | 233 | $ | 211 | $ | 225 | $ | 235 | $ | 217 | $ | 216 | $ | 217 | $ | 220 | $ | 216 | $ | 195 | $ | 241 | ||||||||||||
| Gold cash cost 3 | $/oz | $ | 606 | $ | 607 | $ | 372 | $ | 771 | $ | 736 | $ | 727 | $ | 434 | $ | 670 | $ | 1,097 | $ | 938 | $ | 297 | $ | 922 | ||||||||||||
| Sustaining gold cash cost 3 | $/oz | $ | 868 | $ | 908 | $ | 553 | $ | 1,163 | $ | 950 | $ | 1,077 | $ | 788 | $ | 939 | $ | 1,521 | $ | 1,336 | $ | 1,091 | $ | 1,795 | ||||||||||||
1 Includes refined zinc metal sold. 2 Reflects combined mine, mill and G&A costs per tonne of milled ore. 3 Combined unit costs, cash cost, and sustaining cash cost per pound of copper produced, cash cost, and sustaining cash cost per ounce of gold produced, net of by-product credits, are non-GAAP financial performance measures with no standardized definition under IFRS. For further information and a detailed reconciliation, please see the discussion under the "Non-GAAP Financial Performance Measures" section of this MD&A. The above table sets forth selected non-GAAP financial performance measures for each of our nine most recently completed quarters and three most recently completed years; detailed reconciliations for non-comparable prior periods can be found in our MD&A for these prior periods in the "Non-GAAP Financial Performance Measures" section of these documents. 4 Annual consolidated results may not calculate based on amounts presented in this table due to rounding. 5 Metal reported in concentrate is prior to deductions associated with smelter terms 1 Reported tonnes and grade for ore mined are estimates based on mine plan assumptions and may not fully reconcile to ore milled.
| 2024 6 | Q4 2024 | Q3 2024 | Q2 2024 | Q1 2024 | 2023 6 | Q4 2023 | Q3 2023 | Q2 2023 5 | Q1 2023 | 2022 | Q4 2022 | ||||||||||||||||||||||||||
| British Columbia Operations 4 | |||||||||||||||||||||||||||||||||||||
| Ore mined1 | tonnes | 11,360,125 | 2,374,044 | 3,098,863 | 2,164,722 | 3,722,496 | 6,975,389 | 2,627,398 | 3,792,568 | 555,423 | - | - | - | ||||||||||||||||||||||||
| Strip Ratio | 5.98 | 7.36 | 6.05 | 7.61 | 4.10 | 3.82 | 5.34 | 2.96 | - | - | - | - | |||||||||||||||||||||||||
| Ore milled | tonnes | 12,656,679 | 2,880,927 | 3,363,176 | 3,232,427 | 3,180,149 | 6,862,152 | 3,261,891 | 3,158,006 | 442,255 | - | - | - | ||||||||||||||||||||||||
| Copper | % | 0.25 | 0.26 | 0.24 | 0.25 | 0.27 | 0.35 | 0.33 | 0.36 | 0.36 | - | - | - | ||||||||||||||||||||||||
| Gold | g/tonne | 0.08 | 0.09 | 0.09 | 0.07 | 0.07 | 0.07 | 0.06 | 0.08 | 0.08 | - | - | - | ||||||||||||||||||||||||
| Silver | g/tonne | 0.96 | 0.92 | 0.73 | 1.01 | 1.19 | 1.36 | 1.36 | 1.40 | 1.07 | - | - | - | ||||||||||||||||||||||||
| Copper recovery | % | 82.4 | 79.5 | 84.1 | 82.3 | 83.4 | 79.7 | 78.8 | 80.90 | 77.69 | - | - | - | ||||||||||||||||||||||||
| Gold recovery | % | 60.5 | 55.8 | 67.3 | 57.2 | 61.8 | 55.9 | 54.1 | 56.10 | 67.90 | - | - | - | ||||||||||||||||||||||||
| Silver recovery | % | 71.8 | 69.0 | 71.2 | 73.9 | 72.4 | 73.0 | 73.8 | 71.30 | 78.60 | - | - | - | ||||||||||||||||||||||||
| Contained metal in concentrate produced | |||||||||||||||||||||||||||||||||||||
| Copper | tonnes | 26,406 | 5,927 | 6,736 | 6,719 | 7,024 | 19,050 | 8,508 | 9,303 | 1,239 | - | - | - | ||||||||||||||||||||||||
| Gold | ounces | 19,789 | 4,644 | 6,274 | 4,454 | 4,417 | 8,848 | 3,495 | 4,608 | 745 | - | - | - | ||||||||||||||||||||||||
| Silver | ounces | 280,499 | 58,933 | 55,963 | 77,227 | 88,376 | 218,282 | 105,295 | 101,069 | 11,918 | - | - | - | ||||||||||||||||||||||||
| Payable metal | |||||||||||||||||||||||||||||||||||||
| Copper | tonnes | 25,354 | 5,831 | 6,026 | 6,564 | 6,933 | 18,075 | 9,119 | 8,956 | - | - | - | - | ||||||||||||||||||||||||
| Gold | ounces | 19,735 | 5,036 | 6,199 | 5,099 | 3,401 | 8,420 | 3,091 | 5,329 | - | - | - | - | ||||||||||||||||||||||||
| Silver | ounces | 249,536 | 43,747 | 53,241 | 69,248 | 83,300 | 189,443 | 98,441 | 91,002 | - | - | - | - | ||||||||||||||||||||||||
| Combined unit cost 2,3 | C$/tonne | $ | 20.39 | $ | 23.22 | $ | 15.58 | $ | 19.65 | $ | 23.67 | $ | 21.38 | $ | 20.90 | $ | 24.88 | - | - | - | - | ||||||||||||||||
| Cash cost3 | $/lb | $ | 2.74 | $ | 3.00 | $ | 1.81 | $ | 2.67 | $ | 3.49 | $ | 2.49 | $ | 2.67 | $ | 2.67 | - | - | - | - | ||||||||||||||||
| Sustaining cash cost 3 | $/lb | $ | 5.29 | $ | 5.76 | $ | 5.06 | $ | 5.56 | $ | 4.85 | $ | 3.41 | $ | 3.93 | $ | 3.39 | - | - | - | - | ||||||||||||||||
2 Reflects combined mine, mill and general and administrative ("G&A") costs per tonne of ore milled. Reflects the deduction of expected capitalized stripping costs. 3 Combined unit costs, cash cost, and sustaining cash cost per pound of copper produced, net of by-product credits, are non-GAAP financial performance measures with no standardized definition under IFRS. For further information and a detailed reconciliation, please see the discussion under the "Non-GAAP Financial Performance Measures" section of this MD&A. The above table sets forth selected non-GAAP financial performance measures for each of our nine most recently completed quarters and three most recently completed years; detailed reconciliations for non-comparable prior periods can be found in our MD&A for these prior periods in the "Non-GAAP Financial Performance Measures" section of these documents. 4 Includes 100% of Copper Mountain mine production. Hudbay owns 75% of Copper Mountain mine. 5 Production results from Copper Mountain operations represents the period from the June 20, 2023 acquisition date through to the end of the second quarter of 2023. 6 Annual consolidated results may not calculate based on amounts presented in this table due to rounding.
 |
TSX, NYSE - HBM 2025 No. 5 |
|
25 York Street, Suite 800 |
News Release |
Hudbay Delivers Strong Fourth Quarter and Record Full Year 2024 Results; Achieves 2024 Consolidated Production and Cost Guidance and Provides 2025 Annual Guidance
Toronto, Ontario, February 19, 2025 - Hudbay Minerals Inc. ("Hudbay" or the "company") (TSX, NYSE: HBM) today released its fourth quarter and full year 2024 financial results, and announced 2025 annual production and cost guidance. All amounts are in U.S. dollars, unless otherwise noted. All production and cost amounts reflect the Copper Mountain mine on a 100% basis, with Hudbay owning a 75% interest in the mine.
"Hudbay delivered record financial performance and a transformed balance sheet in 2024, driven by the achievement of consolidated production guidance for all metals with gold production significantly exceeding the top end of the guidance range and the outperformance of our twice-improved consolidated cash cost guidance," said Peter Kukielski, President and Chief Executive Officer. "Our enhanced operating platform achieved steady copper production, record high gold production and industry-leading cost performance, generating record annual free cash flows in 2024. The free cash flow generation and the successful equity offering in May have contributed to the significant $512 million reduction in net debt in 2024 and the transformation of our balance sheet to be in the lowest leverage position of our peers. This has put us in an excellent position to reinvest in our portfolio of high-return growth projects to unlock significant near-term and long-term value for our stakeholders. Our near-term brownfield growth projects include attractive mill improvement projects in British Columbia and Peru, which are expected to increase mill throughput levels starting in 2026. Our Copper World project in Arizona is now fully permitted and we look forward to prudently advancing this high-quality copper development project towards a construction sanctioning decision in 2026, and once in production, Copper World is expected to increase our consolidated copper production by more than 50% from current levels."
Delivered Record Annual Results, Led by Record Gold Production from Manitoba Operations and Record Revenues; 2024 Consolidated Production and Cost Guidance Achieved
|
TSX, NYSE - HBM 2025 No. 5 |
Delivered Strong Fourth Quarter Operating and Financial Results
|
TSX, NYSE - HBM 2025 No. 5 |
Achieved Significant Debt Reduction and Transformed Balance Sheet
Advancing Growth Initiatives to Further Enhance Copper and Gold Exposure
|
TSX, NYSE - HBM 2025 No. 5 |
2025 Guidance Reflects Stable Copper and Gold Production at Industry-leading Margins
|
TSX, NYSE - HBM 2025 No. 5 |
Summary of Fourth Quarter Results
Consolidated copper production of 43,262 tonnes in the fourth quarter of 2024 was in line with quarterly production cadence and represented a significant increase of 38% from the third quarter of 2024. Consolidated gold production of 94,161 ounces significantly exceeded expectations and represented an increase of 6% from the third quarter of 2024. Consolidated silver production was 1,311,658 ounces in the quarter, a 33% increase from the third quarter of 2024, while consolidated zinc production was 8,385 tonnes, in line with the prior quarter. The increase in production was primarily due to higher grades in Peru and continued strong gold production in Manitoba.
Cash generated from operating activities of $238.1 million increased by $91.9 million in the fourth quarter of 2024 compared to the third quarter of 2024. Operating cash flow before change in non-cash working capital was $231.5 million during the fourth quarter of 2024, reflecting an increase of $45.2 million from the third quarter of 2024. This increase reflects higher copper and gold sales volumes driven by higher grades in Peru and continued strong gold production in Manitoba.
Net earnings attributable to owners in the fourth quarter of 2024 was $21.2 million, or $0.05 per share, compared to $49.8 million, or $0.13 per share in the third quarter of 2024. The fourth quarter of 2024 was impacted by various non-cash charges for foreign exchange losses, write-offs of previously capitalized PP&E and revaluation of share-based compensation due to a higher share price.
Adjusted net earnings attributable to ownersi and adjusted net earnings per share attributable to ownersi were $70.3 million and $0.18 per share, respectively, in the fourth quarter of 2024, after adjusting for items on a pre-tax basis such as a non-cash $17.4 million foreign exchange loss, a $14.1 million write-down of PP&E, a $10.3 million mark-to-market revaluation gain on various instruments such as unrealized strategic copper hedges, investments and stock based compensation, and a non-cash loss of $2.5 million related to a quarterly revaluation of a closed site environmental reclamation provision, among other items. This compares to adjusted net earnings attributable to ownersi of $50.3 million, or $0.13 per share, in the third quarter of 2024.
In the fourth quarter, adjusted EBITDAi was $257.3 million, a 25% increase compared to $206.2 million in the third quarter of 2024 as higher copper and gold grades led to increased sales volumes. Sales volumes would have been even higher in the fourth quarter of 2024 if excess copper concentrate in Peru was sold. Copper concentrate inventory levels totaled approximately 30,000 wet metric tonnes in Peru at the end of the quarter, higher than normal levels of 15,000 wet metric tonnes because of the strong production ramp-up late in the year. The excess copper concentrate in Peru is expected to be sold in the first quarter of 2025.
In the fourth quarter of 2024, consolidated cash costi per pound of copper produced, net of by-product credits, was $0.45 compared to $0.18 in the third quarter of 2024, as higher copper production more than offset higher mining, milling and general and administrative ("G&A") costs in the fourth quarter, but by-product credits were lower on a per pound basis. Consolidated sustaining cash costi per pound of copper produced, net of by-product credits, was $1.37 in the fourth quarter of 2024 compared to $1.71 in the third quarter of 2024, with the decrease driven by strong cost control and lower sustaining capital expenditures in the fourth quarter.
Consolidated all-in sustaining cash costi per pound of copper produced, net of by-product credits, was $1.53 in the fourth quarter of 2024, lower than $1.95 in the third quarter of 2024 mainly due to the same reason outlined above as well as lower corporate G&A and regional cost in the fourth quarter.
As at December 31, 2024, total liquidity was $1,007.8 million, including $541.8 million in cash and cash equivalents, $40.0 million in short-term investments as well as undrawn availability of $426.0 million under the company's revolving credit facilities. Net debti declined to $525.7 million at the end of 2024 compared to $1,037.7 million at the end of 2023.
|
TSX, NYSE - HBM 2025 No. 5 |
Summary of Full Year Results
Hudbay achieved its 2024 consolidated production guidance for all metals and significantly exceeded the 2024 production guidance for gold. On a business unit stand-alone basis, Peru exceeded the top end of the gold production guidance and achieved the guidance ranges for all other metals. Manitoba exceeded the top end of the gold and copper guidance ranges and achieved the guidance ranges for all other metals. In British Columbia, production of gold was within the guidance range, whereas copper production was below the low end of guidance range as a result of lower grades in stockpiled ore and reduced throughput during the mill stabilization period.
Consolidated copper, gold and silver production for the full year 2024 increased by 5%, 7% and 11%, respectively, compared to the same period in 2023 primarily due to the incremental production from Copper Mountain and higher throughput and operating performance in Manitoba.
Cash generated from operating activities increased to $666.2 million in 2024 from $476.9 million in 2023. Operating cash flow before change in non-cash working capital increased to a record $691.1 million in 2024 from $570.0 million in 2023. The increase in operating cash flow before changes in working capital was primarily the result of higher metal prices and gold sales volumes, as well as the incremental contribution margin from the Copper Mountain mine. This was partially offset by a significant increase in cash taxes paid of $132.5 million in 2024, compared to $54.8 million in 2023, mainly at the Peru operations.
Net earnings attributable to owners for 2024 was $76.7 million, or $0.20 per share, compared to $66.4 million, or $0.22 per share, in 2023. Full year 2024 net earnings were positively impacted by increases in sales volumes and higher realized prices for all metals partially offset by various non-cash charges related to foreign exchange losses, write-offs of previously capitalized PP&E, mark-to-market revaluation losses on various instruments such as unrealized strategic copper hedges, investments and share-based compensation and higher mining and income tax expenses.
Adjusted net earnings attributable to ownersi and adjusted net earnings per share attributable to ownersi for 2024 were $181.4 million and $0.48 per share, respectively, after adjusting for items on a pre-tax basis such as a $27.4 million write-down of PP&E, a $27.1 million mark-to-market revaluation loss on various instruments such as the gold prepayment liability, unrealized strategic copper and gold hedges, investments and stock based compensation, a non-cash $21.0 million foreign exchange loss and a non-cash gain of $3.5 million related to the revaluation of a closed site environmental reclamation provision, among other items. This compares to adjusted net earnings attributable to ownersi and net earnings per share attributable to ownersi of $69.0 million and $0.23 per share in 2023.
Adjusted EBITDAi was $822.5 million in 2024, a 27% increase compared to $647.8 million in 2023. The increase is the result of higher realized metal prices and higher sales volumes during the year.
Consolidated cash costi per pound of copper produced, net of by-product credits, was $0.46, compared to $0.80 in 2023, which outperformed the twice-improved 2024 annual cost guidance. The improvement was mainly the result of higher copper production and higher gold by-product credits, partially offset by higher mining, milling and G&A costs. Consolidated sustaining cash costi per pound of copper produced, net of by-product credits, of $1.62 in 2024 decreased from $1.72 in 2023 due to the same reasons outlined above partially offset by higher cash sustaining capital expenditures.
Consolidated all-in sustaining cash costi per pound of copper produced, net of by-product credits, was $1.88 in 2024, slightly lower than $1.92 in 2023 as a result of the same reasons outlined above, partially offset by higher corporate selling and administrative costs primarily due to a revaluation of share-based compensation associated with a higher share price.
|
TSX, NYSE - HBM 2025 No. 5 |
|
Consolidated Financial Condition (in $ millions, except net debt to adjusted EBITDA ratio) |
Dec. 31, 2024 |
Sep. 30, 2024 |
Dec. 31, 2023 |
|
Cash and cash equivalents and short-term investments |
581.8 |
483.3 |
249.8 |
|
Total long-term debt |
1,107.5 |
1,108.9 |
1,287.5 |
|
Net debt1 |
525.7 |
625.6 |
1,037.7 |
|
Working capital2 |
511.3 |
434.3 |
135.8 |
|
Total assets |
5,487.6 |
5,508.1 |
5,312.6 |
|
Equity3 |
2,553.2 |
2,537.8 |
2,096.8 |
|
Net debt to adjusted EBITDA1,4 |
0.6 |
0.7 |
1.6 |
1 Net debt and net debit to adjusted EBITDA are non-GAAP financial performance measures with no standardized definition under IFRS. For further information, please see the "Non-GAAP Financial Performance Measures" section of this news release.
2 Working capital is determined as total current assets less total current liabilities as defined under IFRS and disclosed on the consolidated financial statements.
3 Equity attributable to owners of the company.
4 Net debt to adjusted EBITDA for the 12 month period.
|
Consolidated Financial Performance |
Three Months Ended |
Year Ended |
|||
|
(in $ millions) |
Dec. 31, |
Sep. 30, |
Dec. 31, |
Dec. 31, |
Dec. 31, |
|
Revenue |
584.9 |
485.8 |
602.2 |
2,021.2 |
1,690.0 |
|
Cost of sales |
400.5 |
346.0 |
405.4 |
1,467.4 |
1,297.5 |
|
Earnings before tax |
103.7 |
79.7 |
81.0 |
251.6 |
151.8 |
|
Net earnings |
19.3 |
50.4 |
33.5 |
67.8 |
69.5 |
|
Net earnings attributable to owners |
21.2 |
49.8 |
30.7 |
76.7 |
66.4 |
|
Basic and diluted attributable earnings per share |
0.05 |
0.13 |
0.10 |
0.20 |
0.22 |
|
Adjusted earnings attributable per share1 |
0.18 |
0.13 |
0.20 |
0.48 |
0.23 |
|
Operating cash flow before change in non-cash working capital |
231.5 |
186.3 |
246.5 |
691.1 |
570.0 |
|
Adjusted EBITDA1 |
257.3 |
206.2 |
274.4 |
822.5 |
647.8 |
|
1 Adjusted earnings attributable per share and adjusted EBITDA are non-GAAP financial performance measures with no standardized definition under IFRS. For further information, please see the "Non-GAAP Financial Performance Measures" section. |
|||||
|
TSX, NYSE - HBM 2025 No. 5 |
| Consolidated Production and Cost Performance5 | Three Months Ended | Year Ended | ||||
| Dec. 31, | Sep. 30, | Dec. 31, | Dec. 31, | Dec. 31, | ||
| 2024 | 2024 | 2023 | 2024 | 20234 | ||
| Contained metal in concentrate and doré produced1 | ||||||
| Copper | tonnes | 43,262 | 31,354 | 45,450 | 137,943 | 131,691 |
| Gold | ounces | 94,161 | 89,073 | 112,776 | 332,240 | 310,429 |
| Silver | ounces | 1,311,658 | 985,569 | 1,197,082 | 3,983,851 | 3,575,234 |
| Zinc | tonnes | 8,385 | 8,069 | 5,747 | 33,339 | 34,642 |
| Molybdenum | tonnes | 195 | 362 | 397 | 1,323 | 1,566 |
| Payable metal sold | ||||||
| Copper | tonnes | 37,927 | 27,760 | 44,006 | 125,094 | 124,996 |
| Gold2 | ounces | 92,734 | 73,232 | 104,840 | 335,342 | 276,893 |
| Silver2 | ounces | 1,150,518 | 663,413 | 1,048,877 | 3,549,816 | 3,145,166 |
| Zinc | tonnes | 5,261 | 8,607 | 7,385 | 25,120 | 28,799 |
| Molybdenum | tonnes | 182 | 343 | 468 | 1,287 | 1,462 |
| Consolidated cash cost per pound of copper produced3 | ||||||
| Cash cost | $/lb | 0.45 | 0.18 | 0.16 | 0.46 | 0.80 |
| Sustaining cash cost | $/lb | 1.37 | 1.71 | 1.09 | 1.62 | 1.72 |
| All-in sustaining cash | $/lb | 1.53 | 1.95 | 1.31 | 1.88 | 1.92 |
1 Metal reported in concentrate is prior to deductions associated with smelter contract terms.
2 Includes total payable gold and silver in concentrate and in doré sold.
3 Cash cost, sustaining cash cost and all-in sustaining cash cost per pound of copper produced, net of by-product credits, gold cash cost, sustaining cash cost per ounce of gold produced, net of by-product credits, are non-GAAP financial performance measures with no standardized definition under IFRS. For further information, please see the "Non-GAAP Financial Performance Measures" section of this news release.
4 As Copper Mountain was acquired on June 20, 2023, the production from the Copper Mountain mine included in these consolidated figures for the year ended December 31, 2023, represents the period from acquisition date, June 20, 2023, through to year end December 31, 2023.
5 Includes 100% of Copper Mountain mine production. Hudbay owns 75% of Copper Mountain mine.
|
TSX, NYSE - HBM 2025 No. 5 |
Peru Operations Review
| Peru Operations | Three Months Ended | Year Ended | ||||
| Dec. 31, 2024 |
Sep. 30, 2024 |
Dec. 31, 2023 |
Dec. 31, 2024 |
Dec. 31, 2023 |
||
| Constancia ore mined1 | tonnes | 4,186,058 | 3,022,931 | 973,176 | 15,046,190 | 9,265,954 |
| Copper | % | 0.40 | 0.36 | 0.30 | 0.34 | 0.32 |
| Gold | g/tonne | 0.04 | 0.04 | 0.04 | 0.04 | 0.04 |
| Silver | g/tonne | 3.88 | 3.20 | 2.26 | 3.08 | 2.53 |
| Molybdenum | % | 0.02 | 0.02 | 0.01 | 0.01 | 0.01 |
| Pampacancha ore mined1 | tonnes | 4,037,264 | 1,777,092 | 5,556,613 | 9,317,499 | 14,756,416 |
| Copper | % | 0.63 | 0.48 | 0.56 | 0.55 | 0.51 |
| Gold | g/tonne | 0.38 | 0.27 | 0.32 | 0.32 | 0.33 |
| Silver | g/tonne | 6.43 | 6.23 | 4.84 | 5.61 | 4.28 |
| Molybdenum | % | 0.00 | 0.01 | 0.01 | 0.01 | 0.01 |
| Total ore mined | tonnes | 8,223,322 | 4,800,023 | 6,529,789 | 24,363,689 | 24,022,370 |
| Strip ratio2 | 1.22 | 2.62 | 1.26 | 1.78 | 1.51 | |
| Ore milled | tonnes | 7,999,453 | 8,137,248 | 7,939,044 | 31,933,624 | 30,720,929 |
| Copper | % | 0.48 | 0.32 | 0.48 | 0.36 | 0.39 |
| Gold | g/tonne | 0.20 | 0.11 | 0.25 | 0.14 | 0.16 |
| Silver | g/tonne | 5.28 | 3.70 | 4.20 | 3.84 | 3.62 |
| Molybdenum | % | 0.01 | 0.01 | 0.01 | 0.01 | 0.01 |
| Copper recovery | % | 87.8 | 82.6 | 87.4 | 85.0 | 84.2 |
| Gold recovery | % | 73.3 | 68.1 | 77.6 | 70.7 | 71.8 |
| Silver recovery | % | 71.4 | 67.0 | 78.0 | 68.8 | 70.0 |
| Molybdenum recovery | % | 37.1 | 39.0 | 33.6 | 41.7 | 35.8 |
| Contained metal in concentrate | ||||||
| Copper | tonnes | 33,988 | 21,220 | 33,207 | 99,001 | 100,487 |
| Gold | ounces | 38,079 | 20,331 | 49,418 | 98,226 | 114,218 |
| Silver | ounces | 969,502 | 648,209 | 836,208 | 2,708,262 | 2,505,229 |
| Molybdenum | tonnes | 195 | 362 | 397 | 1,323 | 1,566 |
| Payable metal sold | ||||||
| Copper | tonnes | 28,775 | 18,803 | 31,200 | 88,138 | 96,213 |
| Gold | ounces | 37,459 | 9,795 | 38,114 | 103,364 | 97,176 |
| Silver | ounces | 824,613 | 365,198 | 703,679 | 2,343,820 | 2,227,419 |
| Molybdenum | tonnes | 182 | 343 | 468 | 1,287 | 1,462 |
| Combined unit operating cost3,4 | $/tonne | 15.25 | 12.78 | 12.24 | 12.91 | 12.47 |
| Cash cost4 | $/lb | 1.00 | 1.80 | 0.54 | 1.18 | 1.07 |
| Sustaining cash cost4 | $/lb | 1.48 | 2.78 | 1.21 | 1.86 | 1.81 |
1 Reported tonnes and grade for ore mined are estimates based on mine plan assumptions and may not reconcile fully to ore milled.
2 Strip ratio is calculated as waste mined divided by ore mined.
3 Reflects combined mine, mill and G&A costs per tonne of ore milled. Reflects the deduction of expected capitalized stripping costs.
4 Combined unit operating cost, cash cost and sustaining cash cost per pound of copper produced, net of by-product credits, are non-GAAP financial performance measures with no standardized definition under IFRS. For further information, please see the "Non-GAAP Financial Performance Measures" section of this news release.
|
TSX, NYSE - HBM 2025 No. 5 |
During the fourth quarter of 2024, the Peru operations produced 33,988 tonnes of copper, 38,079 ounces of gold, 969,502 ounces of silver and 195 tonnes of molybdenum. Production of copper, gold and silver significantly increased by 60%, 87% and 50%, respectively, compared to the third quarter of 2024. This significant increase was a result of higher grades from Pampacancha as the planned stripping program was successfully completed in the third quarter, as well as a larger portion of ore mill feed coming from Pampacancha.
Full year copper, silver and molybdenum production in 2024 achieved the annual guidance ranges, and gold production exceeded the upper end of the guidance range by 6%. Full year production of copper, gold and molybdenum in 2024 was 99,001 tonnes, 98,226 ounces, and 1,323 tonnes, respectively, representing a decrease of 1%, 14% and 16%, respectively, from 2023 primarily due to lower grades since more material was mined from Constancia and reclaimed from the stockpile compared with the prior year, partially offset by higher throughput. Production of silver was 2,708,262 ounces, representing an increase of 8% from the comparative 2023 period due to higher silver grades from Pampacancha.
Total ore mined in the fourth quarter of 2024 increased 71% compared to the third quarter of 2024, in line with the mine plan as the team completed the planned stripping program at Pampacancha in late September. Ore mined from Pampacancha increased to 4.0 million tonnes in the fourth quarter of 2024 following the stripping program to enable access to higher copper and gold grade ore of 0.63% and 0.38 grams per tonne, respectively. Full year ore mined in 2024 was slightly higher than 2023 despite periods of intensive stripping in 2024, primarily as a result of the effective use of mobile equipment and higher fleet availability.
Peru operations continued to benefit from strong and consistent mill throughput in 2024, averaging approximately 87,000 tonnes processed per day in the fourth quarter and full year of 2024. Ore milled during the fourth quarter of 2024 was 2% lower than the third quarter, mainly due to a planned semi-annual mill maintenance shutdown in the fourth quarter. Milled copper, gold and silver grades increased by 50%, 82% and 43%, respectively, in the fourth quarter compared to the third quarter of 2024, as a result of the higher-grade ore feed from Pampacancha. Milled gold grades were better than expected as additional gold benches in the Pampacancha pit were mined during the fourth quarter of 2024, ahead of schedule.
The Constancia mill achieved record copper recoveries of 88% in the fourth quarter of 2024, higher than the previous record of 87% achieved in the fourth quarter of 2023. Recoveries of gold and silver during the fourth quarter of 2024 were 73% and 71%, respectively, representing an increase of 8% and 7%, respectively, compared to the third quarter of 2024 and remained in line with the metallurgical models for the ore types that were being processed.
Combined mine, mill and G&A unit operating costi in the fourth quarter of 2024 was $15.25 per tonne, 19% higher than the third quarter primarily due to higher mining and milling costs and higher G&A costs including profit sharing, in addition to lower tonnes processed with the planned semi-annual mill maintenance shutdown in the fourth quarter. Combined mine, mill and G&A unit operating costs for the full year were $12.91 per tonne, compared to $12.47 per tonne in 2023, as higher mining and G&A costs were partially offset by higher throughput and slightly lower milling costs.
Cash costi per pound of copper produced, net of by-product credits, in the fourth quarter of 2024 was $1.00, a 44% decrease compared to $1.80 in the third quarter of 2024 as a result of higher copper production and higher by-product credits, partially offset by higher mining, milling and G&A costs. Full year 2024 cash costi per pound of copper produced, net of by-product credits, of $1.18 better than expected and outperformed the low end of the cost guidance range by 6%.
|
TSX, NYSE - HBM 2025 No. 5 |
Sustaining cash costi per pound of copper produced, net of by-product credits, was $1.48 in the fourth quarter of 2024, a 47% decrease compared to $2.78 in the third quarter as a result of similar factors affecting cash cost and lower sustaining capital expenditures. On a full year basis, sustaining cash costi per pound of copper produced, net of by-products credits, was $1.86, marginally above $1.81 in 2023, due to the same reasons described for the cash cost variance over the full year period.
Approximately 30,000 wet metric tonnes of copper concentrate in Peru were unsold as of December 31, 2024, which is approximately 15,000 wet metric tonnes above normal levels and resulted from the strong production ramp-up that occurred late in the quarter. The excess copper concentrate is expected to be sold in the first quarter of 2025.
The company continues to evaluate opportunities to further increase mill throughput after the Peruvian Ministry of Energy and Mines approved a regulatory change in June 2024 to allow mining companies in Peru to increase throughput by up to 10% above permitted levels.
|
TSX, NYSE - HBM 2025 No. 5 |
Manitoba Operations Review
| Manitoba Operations | Three Months Ended | Year Ended | |||||
| Dec. 31, 2024 |
Sep. 30, 2024 |
Dec. 31, 2023 |
Dec. 31, 2024 |
Dec. 31, 2023 |
|||
| Lalor | |||||||
| Ore mined | tonnes | 422,454 | 411,295 | 372,384 | 1,626,935 | 1,526,729 | |
| Gold | g/tonne | 4.61 | 5.45 | 5.92 | 4.68 | 4.74 | |
| Copper | % | 0.95 | 0.91 | 1.04 | 0.85 | 0.86 | |
| Zinc | % | 2.95 | 2.73 | 2.20 | 2.84 | 3.00 | |
| Silver | g/tonne | 31.91 | 30.45 | 28.92 | 27.14 | 24.51 | |
| New Britannia | |||||||
| Ore milled | tonnes | 185,592 | 191,298 | 165,038 | 715,198 | 596,912 | |
| Gold | g/tonne | 5.99 | 6.77 | 8.03 | 6.29 | 6.76 | |
| Copper | % | 1.17 | 0.93 | 1.46 | 1.04 | 1.03 | |
| Zinc | % | 1.08 | 1.12 | 0.85 | 0.99 | 0.84 | |
| Silver | g/tonne | 33.97 | 30.24 | 27.97 | 27.78 | 25.11 | |
| Gold recovery1 | % | 90.2 | 90.0 | 89.0 | 89.7 | 88.6 | |
| Copper recovery | % | 91.3 | 92.8 | 91.6 | 93.6 | 93.3 | |
| Silver recovery1 | % | 79.6 | 79.9 | 83.2 | 80.9 | 81.5 | |
| Stall Concentrator | |||||||
| Ore milled | tonnes | 222,004 | 222,621 | 228,799 | 893,510 | 965,567 | |
| Gold | g/tonne | 3.36 | 4.23 | 4.22 | 3.42 | 3.45 | |
| Copper | % | 0.73 | 0.89 | 0.73 | 0.71 | 0.74 | |
| Zinc | % | 4.62 | 4.12 | 3.20 | 4.33 | 4.36 | |
| Silver | g/tonne | 29.90 | 30.20 | 28.63 | 26.54 | 24.19 | |
| Gold recovery | % | 69.6 | 70.5 | 67.5 | 68.6 | 64.8 | |
| Copper recovery | % | 84.4 | 88.3 | 92.0 | 87.4 | 90.4 | |
| Zinc recovery | % | 81.7 | 88.1 | 78.5 | 86.2 | 82.2 | |
| Silver recovery | % | 55.1 | 57.8 | 61.8 | 56.8 | 61.4 | |
| Total contained metal in concentrate and doré2 | |||||||
| Gold | ounces | 51,438 | 62,468 | 59,863 | 214,225 | 187,363 | |
| Copper | tonnes | 3,347 | 3,398 | 3,735 | 12,536 | 12,154 | |
| Zinc | tonnes | 8,385 | 8,069 | 5,747 | 33,339 | 34,642 | |
| Silver | ounces | 283,223 | 281,397 | 255,579 | 995,090 | 851,723 | |
| Total payable metal sold | |||||||
| Gold | ounces | 50,239 | 57,238 | 63,635 | 212,243 | 171,297 | |
| Copper | tonnes | 3,321 | 2,931 | 3,687 | 11,602 | 10,708 | |
| Zinc | tonnes | 5,261 | 8,607 | 7,385 | 25,120 | 28,779 | |
| Silver | ounces | 282,158 | 244,974 | 246,757 | 956,460 | 728,304 | |
| Combined unit operating cost3,4 | C$/tonne | 233 | 211 | 216 | 226 | 217 | |
| Gold cash cost4 | $/oz | 607 | 372 | 434 | 606 | 727 | |
| Gold sustaining cash cost4 | $/oz | 908 | 553 | 788 | 868 | 1,077 | |
1 Gold and silver recovery includes total recovery from concentrate and doré.
2 Metal reported in concentrate is prior to deductions associated with smelter terms.
3 Reflects combined mine, mill and G&A costs per tonne of ore milled.
4 Combined unit operating cost, cash cost and sustaining cash cost per ounce of gold produced, net of by-product credits, are non-GAAP financial performance measures with no standardized definition under IFRS. For further information, please see the "Non-GAAP Financial Performance Measures" section of this news release.
|
TSX, NYSE - HBM 2025 No. 5 |
The Snow Lake operations continued to deliver strong operational performance during the fourth quarter of 2024, exceeding expectations in both production and efficiency. Record annual gold production of 214,225 ounces in 2024 was achieved through a combination of higher metallurgical recoveries at the New Britannia and Stall mills, despite processing lower gold grades year-over-year, and the strategic allocation of more gold ore feed to the New Britannia mill. This success reflects the positive impact of ongoing continuous improvement initiatives.
The Manitoba operations produced 51,438 ounces of gold, 3,347 tonnes of copper, 8,385 tonnes of zinc and 283,223 ounces of silver during the fourth quarter of 2024. Compared to the third quarter of 2024, zinc and silver increased by 4% and 1%, respectively, while production of gold and copper declined by 18% and 2%, respectively, from the record levels achieved in the third quarter. For the full year 2024, production of gold, copper and silver increased by 14%, 3% and 17%, respectively, compared to 2023 mainly due to higher production from gold and copper-gold zones and better than expected gold grades. Zinc production in 2024 decreased by 4%, aligned with forecasted production and the strategy to mine more gold ore at Lalor. Full year 2024 gold and copper production both exceeded the upper end of the guidance range by 7% and 4%, respectively. Zinc production was in line with the annual guidance range, whereas silver production was at the top end of guidance range.
The Lalor mine achieved strong production results in the fourth quarter, achieving an average of 4,600 tonnes per day, marking the highest quarterly ore production in 2024. Total ore mined in the fourth quarter of 2024 was 3% higher than the third quarter of 2024, and total ore mined in the full year 2024 was 7% higher than the prior year. The operations saw significant improvements in ore production and precious metal grade quality throughout 2024. These changes align with improvements in mining techniques, most notably in longhole muck fragmentation, and anticipated higher grade precious metal sequences. Gold grades of 4.61 grams per tonne in the fourth quarter of 2024 and 4.68 grams per tonne in the full year 2024 were better than expected.
The New Britannia mill had another quarter of exceptional performance with the mill operating consistently above nameplate capacity, achieving an average throughput of approximately 2,020 tonnes per day in the fourth quarter of 2024. Plant availability remained strong, supported by ongoing low-capital projects aimed at further increasing throughput while maintaining targeted gold recoveries of 90%. New Britannia recoveries of gold and silver in the fourth quarter of 2024 were 90% and 80%, respectively, consistent with the prior quarter. Copper recovery in the fourth quarter of 2024 was 91%, slightly lower than the copper recoveries in the third quarter of 2024 with lower copper grade feed directed to New Britannia. Full year 2024 total ore milled at New Britannia was 20% higher than 2023, reflecting the consistently strong performance throughout 2024 as a result of continuous improvement efforts.
At the Stall mill, there was a slight reduction in throughput as more ore was diverted to New Britannia. Benefits from recent recovery improvement programs continue to be realized with gold recoveries exceeding prior year figures. The lower throughput at Stall is aligned with the company's strategy to allocate more Lalor ore feed to New Britannia, as noted above. The Stall mill achieved gold recoveries of 70% in the fourth quarter, reflecting benefits from recent recovery improvement programs, and consistent with the third quarter of 2024.
Combined mine, mill and G&A unit operating costi was C$233 per tonne in the fourth quarter of 2024 and C$226 per tonne in the full year 2024, which increased by 4% compared to 2023. The marginal increase in operating costs year-over-year was largely the result of more tonnes being processed at New Britannia compared to Stall which operates at a lower cost per unit.
|
TSX, NYSE - HBM 2025 No. 5 |
Manitoba's cash costi per ounce of gold produced, net of by-product credits, in the fourth quarter of 2024 was $607, an increase compared to the third quarter of 2024, primarily due to lower gold production and higher profit sharing costs but remained better than expected as a result of continued operating efficiencies and focus on strong cost control. Cash costi per ounce of gold produced, net of by-product credits, for the full year 2024 was $606 per ounce, a 17% decrease from 2023 primarily due to higher gold production and by-product credits, partially offset by higher mining, milling and G&A costs resulting from higher employee profit sharing costs.
Sustaining cash costi per ounce of gold produced, net of by-product credits, in the fourth quarter of 2024 was $908, an increase from the third quarter of 2024, primarily due to the same factors affecting cash cost and higher sustaining capital costs during the quarter. Annual sustaining cash costi per ounce of gold produced, net of by-product credits, was $868 per ounce in 2024, a decrease of 19% from 2023 primarily due to the same factors affecting cash cost, together with lower sustaining capital expenditures compared to the prior year.
Progress on the 1901 deposit continued via the exploration drift and the recently started haulage drift, which achieved high advance rates in the fourth quarter of 2024, laying the groundwork to support full production from the 1901 deposit by 2027. With the drifts performing well, mining of first ore is scheduled for the second quarter of 2025.
The Manitoba business unit continues to prioritize strong relationships with Indigenous communities. Several meetings with Indigenous Nations were held to discuss future exploration and geophysical programs within their Traditional Territories. To date, Hudbay has received letters of support for geophysical programs, and positive progress is being made in negotiating exploration agreements. In February 2025, Hudbay signed its first-ever exploration agreement with the Kiciwapa Cree Nation.
|
TSX, NYSE - HBM 2025 No. 5 |
British Columbia Operations Review
| British Columbia Operations5 |
Three Months Ended | Year Ended5 | ||||||
| Dec. 31, 2024 |
Sep. 30, 2024 |
Dec. 31, 2023 |
Dec. 31, 2024 |
Dec. 31, 2023 |
||||
| Ore mined1 | tonnes | 2,374,044 | 3,098,863 | 2,627,398 | 11,360,125 | 6,975,389 | ||
| Strip ratio2 | 7.36 | 6.05 | 5.34 | 5.98 | 3.82 | |||
| Ore milled | tonnes | 2,880,927 | 3,363,176 | 3,261,891 | 12,656,679 | 6,862,152 | ||
| Copper | % | 0.26 | 0.24 | 0.33 | 0.25 | 0.35 | ||
| Gold | g/tonne | 0.09 | 0.09 | 0.06 | 0.08 | 0.07 | ||
| Silver | g/tonne | 0.92 | 0.73 | 1.36 | 0.96 | 1.36 | ||
| Copper recovery | % | 79.5 | 84.1 | 78.8 | 82.4 | 79.7 | ||
| Gold recovery | % | 55.8 | 67.3 | 54.1 | 60.5 | 55.9 | ||
| Silver recovery | % | 69.0 | 71.2 | 73.8 | 71.8 | 73.0 | ||
| Total contained metal in concentrate | ||||||||
| Copper | tonnes | 5,927 | 6,736 | 8,508 | 26,406 | 19,050 | ||
| Gold | ounces | 4,644 | 6,274 | 3,495 | 19,789 | 8,848 | ||
| Silver | ounces | 58,933 | 55,963 | 105,295 | 280,499 | 218,282 | ||
| Total payable metal sold | ||||||||
| Copper | tonnes | 5,831 | 6,026 | 9,119 | 25,354 | 18,075 | ||
| Gold | ounces | 5,036 | 6,199 | 3,091 | 19,735 | 8,420 | ||
| Silver | ounces | 43,747 | 53,241 | 98,441 | 249,536 | 189,443 | ||
| Combined unit operating cost3,4 | C$/tonne | 23.22 | 15.58 | 20.90 | 20.39 | 21.38 | ||
| Cash cost4 | $/lb | 3.00 | 1.81 | 2.67 | 2.74 | 2.49 | ||
| Sustaining cash cost4 | $/lb | 5.76 | 5.06 | 3.93 | 5.29 | 3.41 | ||
1 Reported tonnes and grade for ore mined are estimates based on mine plan assumptions and may not reconcile fully to ore milled.
2 Strip ratio is calculated as waste mined divided by ore mined.
3 Reflects combined mine, mill and G&A costs per tonne of ore milled. Reflects the deduction of expected capitalized stripping costs.
4 Combined unit operating cost, cash cost and sustaining cash cost per pound of copper produced, net of by-product credits, are non-GAAP financial performance measures with no standardized definition under IFRS. For further information, please see the "Non-GAAP Financial Performance Measures" section of this news release.
5 Includes 100% of Copper Mountain mine production, Hudbay owns 75% of Copper Mountain mine. As Copper Mountain was acquired on June 20, 2023, the December 31, 2023 annual figures in the table above represents the period from the acquisition date, through to the end of the fourth quarter of 2023.
Since acquiring Copper Mountain in June 2023, Hudbay has been focused on advancing operational stabilization plans, including opening up the mine by re-activating the full mining fleet, adding additional haul trucks, adding additional mining faces, optimizing the ore feed to the plant and implementing plant improvement initiatives that mirror Hudbay's successful processes at Constancia. These stabilization plans have successfully increased the total tonnes moved and resulted in stronger mill performance as demonstrated by high mill availability of 92% and copper recoveries of 82% in 2024, compared to 85% and 80%, respectively, in 2023.
During the fourth quarter of 2024, the British Columbia operations produced 5,927 tonnes of copper, 4,644 ounces of gold and 58,933 ounces of silver. Copper and gold production declined by 12% and 26% respectively, while silver production increased 5% compared to the third quarter of 2024, impacted by lower mill throughput as a result of planned and unplanned maintenance shutdowns. For the full year 2024, production of copper, gold and silver was 26,406 tonnes, 19,789 ounces and 280,499 ounces, respectively. Full year 2024 gold production was in line with the annual guidance range, whereas copper and silver production were below the guidance ranges for each metal primarily as a result of lower grades in stockpiled ore and lower throughput during the ramp-up of stabilization and optimization efforts throughout the year.
|
TSX, NYSE - HBM 2025 No. 5 |
Total ore mined at Copper Mountain in the fourth quarter of 2024 was 2.4 million tonnes, a decrease of 23% compared to the third quarter of 2024 as ore stockpiles were utilized as ore feed to the mill while the mine operation team increased waste stripping activities. Total material moved of 21.4 million tonnes in the quarter, continues to be at elevated levels with the execution of the three-year accelerated stripping program to access higher head grades. The focus in the fourth quarter of 2024 was on mining efficiencies and operator recruitment to effectively utilize the available haul truck fleet. As a result, total material moved is expected to increase in 2025 as per the mine plan.
The mill processed 2.9 million and 12.7 million tonnes of ore during the fourth quarter and the year ended December 31, 2024, respectively. Ore processed in the fourth quarter of 2024 was 14% lower than the third quarter of 2024, limited by both planned and unplanned maintenance in the fourth quarter as well as elevated clay material impacting the secondary crushing circuit. In the fourth quarter of 2024, a number of initiatives were advanced to address these issues and other identified constraints to improve throughput to targeted levels. Several mill initiatives have been implemented in 2024, including, recovery improvements, reprogramming the mill expert system, installation of advanced semi-autogenous grinding control instrumentation, redesigned SAG liner package and updated operational procedures intended to remove magnetite from the pebble stream. Progressive improvements are expected to continue through 2025.
Milled copper grades during the fourth quarter of 2024 were higher than the third quarter of 2024 but were impacted by the operation continuing to draw on lower grade stockpiled ore. Copper recoveries of 79.5% were slightly lower than the prior quarter, impacted by the ramp-up periods following the planned and unplanned maintenance shutdowns. Full year 2024 copper recoveries of 82.4% were higher than 2023 and exceeded the mine plan expectations, despite processing lower grades, as the operations improved the regrind circuit constraint and implemented the flotation operational strategy improvements, including reagent selection and dose modification.
Combined mine, mill and G&A unit operating costi in the fourth quarter of 2024 was C$23.22 per tonne milled, higher than in the third quarter of 2024 primarily due to lower ore milled as a result of the previously mentioned planned and unplanned maintenance activities. For the full year 2024, combined mine, mill and G&A unit operating costi was C$20.39 per tonne milled, an improvement from C$21.38 per tonne milled in the second half of 2023.
Cash costi and sustaining cash costi per pound of copper produced, net of by-product credits, in the fourth quarter of 2024 were $3.00 and $5.76, respectively, higher than the third quarter of 2024 largely due to lower copper production and higher mining and milling costs. Full year cash costi and sustaining cash costi per pound of copper produced, net of by-product credits, was $2.74 and $5.29, respectively in 2024. Full year cash cost was above the higher end of the cost guidance range driven by lower copper production as mentioned above.
At Copper Mountain in 2025, efforts will be focused on optimizing the operation. Mining activities will continue to execute the three-year accelerated stripping program intended to bring higher grade ore into the mine plan. In January, the company completed feasibility engineering to debottleneck and increase the nominal plant capacity to its permitted capacity of 50,000 tonnes per day earlier than contemplated in the most recent technical report. Further details on 2025 plans are outlined in the annual guidance section below.
|
TSX, NYSE - HBM 2025 No. 5 |
Significant Debt Reduction and Transformed Balance Sheet
The company took several prudent measures in 2024 to significantly improve the strength of the balance sheet and improve financial flexibility, including a total of $245 million of combined debt repayments and gold prepayment liability reductions:
Hudbay has successfully delivered six consecutive quarters of meaningful free cash flow generation as a result of recent brownfield investments, continuous operational improvement efforts and steady cost control across the business. As a result of the continued cash flow generation and the deleveraging efforts, the company has substantially reduced net debt to $525.7 million as of December 31, 2024, as compared to $1,037.7 million at the end of 2023. The net debt reduction, together with higher levels of adjusted EBITDAi over the last twelve months, has significantly improved the company's net debt to adjusted EBITDA ratioi to 0.6x compared to 1.6x at the end of 2023.
Copper World Permitting Completed
On January 2, 2025, Hudbay received the Air Quality Permit for the Copper World project from the Arizona Department of Environmental Quality ("ADEQ"). The issuance of this permit is a significant milestone in the advancement of the project as it is the final major permit required for the development and operation of Copper World. Copper World is expected to produce 85,000 tonnes of copper per year over an initial 20-year mine life.
Hudbay has now received all three key state permits required for Copper World development and operation:
Hudbay received the Aquifer Protection Permit and Air Quality Permit on schedule after a thorough public consultation process, and it is pleased with the level of local support it has received. The company looks forward to providing significant benefits for the community and local economy in Arizona. Once in production, Copper World is expected to be a meaningful copper producer in the U.S. domestic copper supply chain, which will be required to help secure growing U.S. metal demand related to increased manufacturing capacity, infrastructure development, increased energy independence, domestic battery supply chain and strengthening the nation's security.
|
TSX, NYSE - HBM 2025 No. 5 |
Now that the major permits for Copper World have been received, Hudbay commenced a minority joint venture partner process early in 2025. It is anticipated that any minority joint venture partner would participate in the funding of definitive feasibility study activities in 2025 as well as in the final project design and construction for Copper World.
The sanctioning of Copper World is not expected until 2026 based on current estimated timelines.
Bolstering Technical Capabilities
As Hudbay advances its numerous brownfield and greenfield growth opportunities within its portfolio, the company has enhanced the senior management team with additional technical expertise and expanded the U.S. team to build bench strength and establish key leadership positions.
Hudbay's Senior Vice President of the U.S. Business Unit, Javier Del Rio, has been focusing his time solely on leading the Copper World project, leveraging his project development and operational expertise as the former head of Hudbay's South America Business Unit where he oversaw the development and operation of the company's flagship Constancia mine in Peru. In addition, Warren Flannery, Hudbay's Vice President of Business Planning and Reclamation, relocated to Arizona in September 2024 to take on the role of Vice President of Copper World. In his new role, Mr. Flannery is leading the operational readiness of Copper World as the company advances through definitive feasibility study activities in 2025.
Adding to the U.S. expertise, in August 2024, Hudbay hired Robert Comer as Executive Director, External Affairs & Legal in Arizona. As an experienced attorney, Mr. Comer brings more than 30 years of U.S. permitting and mining law expertise. During his career, Mr. Comer has held senior leadership positions with businesses and the federal government and has successfully advanced numerous resource projects, including through environmental and land use compliance, defending permits through litigation, NEPA permitting and government relations. He is a significant asset to Copper World as Hudbay continues to advance towards a sanctioning decision in 2026.
After receiving all key permits and with feasibility study activities underway, in February 2025, Hudbay added to its U.S. team's project development expertise with the appointment of Kim Hackney as Project Director of Copper World. Mr. Hackney is a project professional with over 40 years of extensive experience in the mining industry having held several roles in project and construction management, including managing owners teams, EPCM projects and self-perform projects. He is recognized in the industry for bringing projects online within budget and on schedule, and his in-depth expertise includes global base and precious metals projects located in North, Central and South America, Canada, Africa, Australia, Indonesia, and Uzbekistan.
Hudbay also appointed John O'Shaughnessy as Vice President, Business Development in February 2025 to provide expert oversight and strategic leadership of the global mine planning process. Mr. O'Shaughnessy has 25 years of mining expertise, including numerous progressive engineering, operational and leadership roles at Vale's mining operations in Ontario and Newfoundland and Labrador. He was most recently the North Atlantic Lead for Vale's Base Metals division where he led and deployed strategic initiatives for the North Atlantic region. His broad technical expertise further augments Hudbay's technical bench strength.
Hudbay Celebrates Major Milestone with Millionth Ounce of Gold Recovered from Lalor Mine
At the end of 2024, Hudbay surpassed a total of one million ounces of gold produced at the Lalor mine in Snow Lake, Manitoba. This milestone reinforces the significant value the company has unlocked by combining its exploration expertise, processing infrastructure and operating efficiency to maximize gold production at the Snow Lake operations. In 2024, the Snow Lake operations achieved record annual gold production, exceeding the top end of the gold production guidance range with 214,225 ounces produced.
|
TSX, NYSE - HBM 2025 No. 5 |
With approximately two million ounces of contained gold in current mineral reserve estimates and another 1.4 million ounces of contained gold in inferred mineral resources, Hudbay expects to continue to unlock significant value in Snow Lake and looks forward to further growing the mineral resource base through regional exploration as it continues to execute one of the largest exploration programs in Snow Lake operating history.
Exploration Update
Large Exploration Drill Program Continues in Snow Lake
In 2024, Hudbay completed the largest exploration program in its history with the goal of extending known mineralization near the Lalor deposit to further extend mine life as well as to find a new anchor deposit within trucking distance of the Snow Lake processing infrastructure. The 2024 program included the largest geophysical program in Hudbay's history in Snow Lake, with surface electromagnetic surveys detecting targets at more than 1,000 metres below surface and covering a 25 square-kilometre area including the Cook Lake claims that had been previously untested by modern deep geophysics.
At Lalor Northwest, follow-up drilling in the second half of 2024 confirmed the potential for a new gold-copper discovery located approximately 400 metres from the existing Lalor underground infrastructure. Several new intersections have helped establish the geometry of this new discovery, and we plan to continue to drill Lalor Northwest in 2025.
At the regional Rail property, which was acquired through the Rockcliff acquisition in 2023, the 2024 drill program yielded new intersections of high-grade copper-gold mineralization. These results will be combined with historical drilling results on the property to update the geological model and assess its economic potential.
2024 drilling at the 1901 deposit from the exploration drift targeted down plunge extensions of the ore body. Five step-out holes were drilled beyond the known extent of the mineralization and all five holes have intersected visible copper-gold mineralization. Additional planned drilling at 1901 in 2025 is expected to confirm and potentially extend the orebody geometry and to convert inferred mineral resources in the gold lenses to mineral reserves.
Hudbay continues to test a very strong deep geophysical anomaly located at Cook Lake North, approximately six kilometres from Lalor with drilling activities continuing throughout the winter season.
Signed Exploration Agreement with First Nations in Manitoba
In February 2025, Hudbay signed its first-ever exploration agreement with the Kiciwapa Cree Nation, reflecting the Company's commitment to meaningful collaboration as the company explores for new mineral resources in the Snow Lake and Flin Flon regions.
Advancing Engineering Work for Flin Flon Tailings Reprocessing
• Zinc Plant Tailings - Metallurgical test work continues following positive results from the initial confirmatory drill program completed in 2024 in the section of the tailings facility that was utilized by the zinc plant for 25 years. The results confirmed the grades of precious metals and critical minerals previously estimated from historical zinc plant records. An early economic study to evaluate the opportunity to reprocess the zinc plant tailings has confirmed the potential for a technically viable reprocessing alternative, and further engineering work is underway.
|
TSX, NYSE - HBM 2025 No. 5 |
• Mill Tailings - The company continues to advance metallurgical test work on the opportunity to reprocess Flin Flon mill tailings where 100 million tonnes of tailings were deposited over 90 years. An early economic study on the mill tailings is planned.
Maria Reyna and Caballito Drill Permits Expected in 2025
Hudbay controls a large, contiguous block of mineral rights with the potential to host mineral deposits in close proximity to the Constancia processing facility, including the past producing Caballito property and the highly prospective Maria Reyna property. The Company commenced early exploration activities at Maria Reyna and Caballito after completing a surface rights exploration agreement with the community of Uchucarcco in August 2022. As part of the drill permitting process, environmental impact assessment applications were submitted for the Maria Reyna property in November 2023 and for the Caballito property in April 2024. The environmental impact assessment (EIA) for Maria Reyna was approved by the government in June 2024 and the Caballito EIA was approved in September 2024. This represents one of several steps in the drill permitting process, which is expected to be completed in 2025.
New Britannia Demonstrates Successful Capital Allocation to Maximize Risk-adjusted Returns
Hudbay has a proven track record of prudently allocating capital to generate the highest risk-adjusted returns as the company executes its growth strategy and advances its world-class asset portfolio. As an example of this success, the company has completed a post-project review of the brownfield investment in the New Britannia mill refurbishment project in 2020 and 2021.
Hudbay acquired the New Britannia mill in 2015 for $12 million as a potential gold processing solution for the high-grade Lalor gold and copper-gold ores by providing additional processing capacity at the Snow Lake operations and allowing the company to achieve higher gold recoveries of approximately 90%, compared to 55% at the existing mill. After completing several economic studies, the refurbishment project construction commenced in early 2020 with an initial capital cost of $115 million and an estimated unlevered IRR of 19%. The initial capital investment was funded by a $115 million low-cost gold prepay facility entered into in May 2020. Project construction was completed on time with mill ramp-up and commissioning achieved in the fourth quarter of 2021. The mill was refurbished with a nameplate design capacity of 1,500 tonnes per day, and has been consistently exceeding performance expectations, achieving throughput levels of 1,650 tonnes per day in 2023 and reaching record throughput levels of over 2,000 tonnes per day in 2024. The project payback was achieved after 2.5 years, and in August 2024, the gold prepay facility was fully repaid, which has increased exposure to the current high gold price environment and further improved cash flows. After three years of operations, the unlevered IRR for the New Britannia gold mill refurbishment project has now increased to 36% after adjusting for the higher production rates, stronger gold prices and current capital and operating costs.
|
TSX, NYSE - HBM 2025 No. 5 |
2025 Guidance Reflects Stable Copper and Gold Production, Leading Margins and the Advancement of Many High-return Growth Opportunities
Hudbay's key objectives for 2025 are to:
|
TSX, NYSE - HBM 2025 No. 5 |
Hudbay's annual production and operating cost guidance, along with its annual capital and exploration expenditure forecasts are discussed in detail below.
Production Guidance
| Contained Metal in Concentrate and Doré1 | 2025 Guidance | Year Ended Dec. 31, 2024 |
2024 Guidance | |
| Peru | ||||
| Copper | tonnes | 80,000 - 97,000 | 99,001 | 98,000 - 120,000 |
| Gold | ounces | 49,000 - 60,000 | 98,226 | 76,000 - 93,000 |
| Silver | ounces | 2,475,000 - 3,025,000 | 2,708,262 | 2,500,000 - 3,000,000 |
| Molybdenum | tonnes | 1,300 - 1,500 | 1,323 | 1,250 - 1,500 |
| Manitoba | ||||
| Gold | ounces | 180,000 - 220,000 | 214,225 | 170,000 - 200,000 |
| Zinc | tonnes | 21,000 - 27,000 | 33,339 | 27,000 - 35,000 |
| Copper | tonnes | 9,000 - 11,000 | 12,536 | 9,000 - 12,000 |
| Silver | ounces | 800,000 - 1,000,000 | 995,090 | 750,000 - 1,000,000 |
| British Columbia2 | ||||
| Copper | tonnes | 28,000 - 41,000 | 26,406 | 30,000 - 44,000 |
| Gold | ounces | 18,500 - 28,000 | 19,789 | 17,000 - 26,000 |
| Silver | ounces | 245,000 - 365,000 | 280,499 | 300,000 - 455,000 |
| Total | ||||
| Copper | tonnes | 117,000 - 149,000 | 137,943 | 137,000 - 176,000 |
| Gold | ounces | 247,500 - 308,000 | 332,240 | 263,000 - 319,000 |
| Zinc | tonnes | 21,000 - 27,000 | 33,339 | 27,000 - 35,000 |
| Silver | ounces | 3,520,000 - 4,390,000 | 3,983,851 | 3,550,000 - 4,455,000 |
| Molybdenum | tonnes | 1,300 - 1,500 | 1,323 | 1,250 - 1,500 |
1 Metal reported in concentrate and doré is prior to refining losses or deductions associated with smelter terms.
2 Represents 100% of the production from the Copper Mountain mine. Hudbay holds a 75% interest in the Copper Mountain mine.
On a consolidated basis, Hudbay successfully achieved its 2024 production guidance for all metals. On a business unit stand-alone basis, Peru exceeded the top end of the gold production guidance range and achieved the guidance ranges for all other metals. Manitoba exceeded the top end of the gold and copper production guidance ranges and achieved the guidance ranges for all other metals. In British Columbia, copper production was below the low end of the guidance range as a result of lower grades in stockpiled ore and reduced throughput during the mill stabilization period, while gold production was within the guidance range.
In 2025, consolidated copper production is forecasted to remain stable with 2024 levels at 133,000 tonnesii. This is a result of slightly lower grades in Peru with a lower portion of ore feed from Pampacancha as it depletes at the end of 2025, offset by higher expected production in British Columbia as a result of mill throughput ramp-up throughout the year and higher expected grades from the accelerated stripping schedule. Consolidated gold production in 2025 is expected to decrease by 16% to 277,750 ouncesii due to the accelerated mining of high-grade gold benches at Pampacancha in 2024 and a focus on high grade gold zones at Lalor in 2024, which resulted in both Peru and Manitoba exceeding the top end of the 2024 gold production guidance ranges.
In Peru, 2025 copper production is expected to be 88,500 tonnesii, a decrease of 11% from 2024 with less mill ore feed coming from Pampacancha in 2025. Gold production is expected to be 54,500 ouncesii, lower than 2024 levels as additional high grade gold benches were mined in late 2024, ahead of schedule, resulting in gold production exceeding 2024 guidance levels. The Pampacancha deposit is now expected to be depleted in early December 2025 as opposed to October 2025, as the mine plan has smoothed Pampacancha production throughout the year. Total mill ore feed from Pampacancha is expected to be approximately 25% in 2025, lower than the typical one-third in prior years as Pampacancha approaches depletion. Peru's 2025 production guidance reflects a period of higher stripping activities at Pampacancha from January until April, as well as regularly scheduled semi-annual mill maintenance shutdowns at Constancia during the second and fourth quarters of 2025.
|
TSX, NYSE - HBM 2025 No. 5 |
In Manitoba, 2025 gold production is anticipated to be 200,000 ouncesii, a decrease of 7% from the record levels achieved in 2024. The impressive operating performance is expected to continue into 2025, resulting in new 2025 gold production guidance to be 8% higher than the previous 2025 guidance of 185,000 ouncesii. The production guidance anticipates Lalor operating at 4,500 tonnes per day supplemented by 45,000 tonnes of ore feed from the 1901 deposit in 2025 as the company confirms the optimal mining method. New Britannia mill throughput is expected to continue to exceed expectations and operate at 2,000 tonnes per day in 2025, far exceeding its original design capacity of 1,500 tonnes per day. Zinc production for 2025 is expected to be 24,000 tonnesii, a 28% decline from 2024 due to a lower grade base metal mining sequence at Lalor.
In British Columbia, 2025 copper production is expected to be 34,500 tonnesii, a 31% increase from 2024 as a result of mill throughput ramp-up in the second half of the year from several mill initiatives, including the planned conversion of the third ball mill to a second SAG mill, and higher grades from the accelerated stripping schedule. The mill throughput ramp-up reflects the first half of 2025 at similar throughput levels seen in 2024 with a significant increase in throughput in the second half of 2025 concurrent with the completion of second SAG mill project, ramping up towards 50,000 tonnes per day in 2026.
The company will release updated three-year production outlook together with its annual mineral reserve and resource update in March 2025.
Cash Cost Guidance
Copper remains the primary revenue contributor on a consolidated basis, and therefore, consolidated cost guidance has been presented as cash cost per pound of copper produced, net of by-product credits. The company has also provided cash cost guidance for each of its operations based on their respective primary metal contributors.
| Cash cost1 | 2025 Guidance |
Year Ended Dec. 31, 2024 |
2024 Guidance |
|
| Peru cash cost per pound of copper2 | $/lb | 1.35 - 1.65 | 1.18 | 1.25 - 1.60 |
| Manitoba cash cost per ounce of gold3 | $/oz | 650 - 850 | 606 | 700 - 900 |
| British Columbia cash cost per pound of copper4 | $/lb | 2.45 - 3.45 | 2.74 | 2.00 - 2.50 |
| Consolidated cash cost per pound of copper | $/lb | 0.80 - 1.00 | 0.46 | 0.65 - 0.85 Original (1.05-1.25) |
| Consolidated sustaining cash cost per pound of copper | $/lb | 2.25 - 2.65 | 1.62 | 1.75 - 2.20 Original (2.00-2.45) |
1 Cash cost and sustaining cash cost per pound of copper produced, net of by-product credits, and cash cost per ounce of gold produced, net of by-product credits, are non-GAAP financial performance measures with no standardized definition under IFRS. For further information, please see the "Non-GAAP Financial Performance Measures" section of this news release.
2 Peru cash cost per pound of copper produced, net of by-product credits, assumes by-product credits are calculated using the gold and silver deferred revenue drawdown rates for the streamed ounces in effect on December 31, 2024 and the following commodity prices for 2025: $2,500 per ounce gold, $26.00 per ounce silver and $18.00 per pound molybdenum.
3 Manitoba cash cost per ounce of gold produced, net of by-product credits, assumes by-product credits are calculated using the following commodity prices for 2025: $4.10 per pound copper, $1.20 per pound zinc, $26.00 per ounce silver and an exchange rate of 1.35 C$/US$.
4 British Columbia cash cost per pound of copper produced, net of by-product credits, assumes by-product credits are calculated using the following commodity prices for 2025: $2,500 per ounce gold, $26.00 per ounce silver and an exchange rate of 1.35 C$/US$.
|
TSX, NYSE - HBM 2025 No. 5 |
Consolidated cash cost in 2025 is expected to be within $0.80 to $1.00 per pound of copper, net of by-product credits, as the company continues to focus on maintaining strong cost control across the business, driving industry-leading margins. Sustaining cash cost in 2025 is expected to be within $2.25 to $2.65 per pound of copper, net of by-product credits, reflecting slightly lower copper production, lower by-product credits and higher sustaining capital expenditures compared to 2024.
Copper cash cost in Peru is expected to be between $1.35 to $1.65 per pound in 2025, reflecting steady unit operating cost performance, offset by lower copper production and by-product credits compared to 2024.
Gold cash cost in Manitoba is expected to be between $650 to $850 per ounce in 2025, an increase compared to 2024 as a result of lower by-product credits and slightly lower gold production but remains at industry-low levels driving strong margins compared to current gold prices.
Copper cash cost in British Columbia is expected to be between $2.45 to $3.45 per pound in 2025, an increase from 2024 due to higher mining costs related to more material moved as the company executes the planned accelerated stripping program and higher milling costs as it implements the mill improvement projects this year, partially offset by higher copper production.
Capital Expenditure Guidance
| Capital Expenditures1 (in $ millions) |
2025 Guidance5 | Year Ended Dec. 31, 2024 |
2024 Guidance |
| Sustaining capital2 | |||
| Peru3 | 170.0 | 124.4 | 130.0 |
| Manitoba | 60.0 | 45.6 | 55.0 |
| British Columbia - sustaining capital | 50.0 | 51.5 | 35.0 |
| British Columbia - capitalized stripping3 | 85.0 | 71.6 | 70.0 |
| Total sustaining capital | 365.0 | 293.1 | 290.0 |
| Growth capital | |||
| Peru | 25.0 | 0.8 | 2.0 |
| Manitoba4 | 15.0 | 7.0 | 10.0 |
| British Columbia | 75.0 | 8.1 | 5.0 |
| Arizona6 | 90.0 | 28.9 | 45.0 |
| Total growth capital | 205.0 | 44.8 | 62.0 |
| Capitalized exploration | 10.0 | 12.2 | 8.0 |
| Total | 580.0 | 350.1 | 360.0 |
1 Excludes capitalized costs not considered to be sustaining or growth capital expenditures.
2 Sustaining capital guidance excludes right-of-use lease additions, additions as a result of equipment financing arrangements and non-cash deferred stripping.
3 Includes capitalized stripping and development costs.
4 2025 Manitoba growth capital partially funded by approximately $5 million in Canadian Development Expense flow-through financing proceeds (2024 - $3 million).
5 2025 Canadian capital expenditures guidance is converted into U.S. dollars using an exchange rate of 1.35 C$/US$.
6 2024 Arizona growth capital guidance was increased by an additional $25 million, compared to the original 2024 guidance of $20 million, related to early feasibility study work after receipt of the Aquifer Protection Permit in August 2024.
2024 total capital expenditures were $10 million lower than the full year guidance of $360 million as lower growth capital and certain sustaining capital deferrals were partially offset by higher sustaining capital in British Columbia.
|
TSX, NYSE - HBM 2025 No. 5 |
2025 total capital expenditures are expected to be $580 million, reflecting an increase in growth capital spend as the company reinvests in several high-return growth projects as well as higher sustaining capital at the operations, including some deferrals from 2024, as discussed below.
Peru 2025 sustaining capital expenditures are expected to increase to $170 million as a result of higher capitalized stripping, mine equipment purchases and capital deferrals from 2024. Peru 2025 growth capital expenditures of $25 million in 2025 relates primarily to the installation of a pebble crusher to increase mill throughput starting in 2026 and other mill optimization initiatives.
Manitoba 2025 sustaining capital expenditures are expected to increase to $60 million primarily as a result of additional underground capitalized development costs. Manitoba 2025 growth capital spending of $15 million relates to the development of the exploration and haulage drifts at the 1901 deposit. The 1901 growth expenditures will be partially funded by $5 million in proceeds from a Canadian Development Expense premium flow-through financing in December 2024. Manitoba spending guidance excludes approximately $15 million of annual care and maintenance costs related to the Flin Flon facilities in 2025, which are expected to be recorded as other operating expenses.
British Columbia 2025 sustaining capital expenditures are expected to remain consistent with 2024 at $50 million for mine and mill equipment capital. In addition, Hudbay expects to spend approximately $85 million for capitalized stripping costs in 2025 related to continued accelerated stripping as part of the three-year stabilization and optimization plan at Copper Mountain. British Columbia 2025 growth capital spending of $75 million includes approximately $55 million for the conversion of the third ball mill to a second SAG mill to increase throughput rates starting in the second half of 2025 and ramping up to 50,000 tonnes per day in 2026.
Arizona 2025 growth capital spending of $90 million includes approximately $65 million in costs related to de-risking activities and definitive feasibility studies for Copper World and approximately $25 million of typical annual holding costs.
Exploration Guidance
| Exploration Expenditures (in $ millions) |
2025 Guidance | Year Ended Dec. 31, 2024 |
2024 Guidance |
| Peru1 | 19.0 | 19.8 | 17.0 |
| Manitoba2 | 30.0 | 26.4 | 23.0 |
| British Columbia | 1.0 | 1.6 | 2.0 |
| Arizona and other | - | 1.8 | 1.0 |
| Total exploration expenditures | 50.0 | 49.6 | 43.0 |
| Capitalized spending | (10.0) | (12.2) | (8.0) |
| Total exploration expense | 40.0 | 37.4 | 35.0 |
1 Peru exploration expenditures exclude approximately $5 million of non-cash amortization of community agreements for exploration properties.
2 Manitoba exploration partially funded by approximately $7 million in Canadian Exploration Expense flow-through financing proceeds for 2025 (2024 - $11 million).
2025 exploration expenditures are expected to total $40 million, in line with 2024 exploration spending as the company continues to execute a multi-year extensive geophysics and drilling program in Snow Lake to extend mine life and explore for new discoveries, as described below.
|
TSX, NYSE - HBM 2025 No. 5 |
In Manitoba, 2025 exploration activities will focus on completing the largest geophysics program in Hudbay's history, including 800 kilometres of ground electromagnetic surveys and an extensive airborne geophysics survey. The company plans to complete underground and surface drilling at Lalor to increase mineral resource and reserve estimates, including follow-up drilling at the new Lalor Northwest discovery. Underground drilling is planned for 1901 from the new exploration drift to upgrade and expand the mineral reserve and resource estimates. In addition, Hudbay plans to continue drilling activities at several regional targets in 2025, including the Cook Lake properties, following up on encouraging results in 2024. A portion of the 2025 Manitoba exploration program will be funded by $7 million in proceeds from a critical minerals premium flow-through financing completed in December 2024. Hudbay issued 476,200 Canadian Exploration Expense flow-through common shares at a price of C$22.05 per share, representing a premium of approximately 65%.
In Peru, 2025 exploration activities will continue to focus on final permitting and drill preparation for the Maria Reyna and Caballito properties near Constancia.
Board Chair Transition
Effective January 1, 2025, Stephen A. Lang stepped down as Chair of Hudbay's Board of Directors due to health reasons. David S. Smith, current independent director, has been appointed Chair of the Board. Mr. Lang, who was appointed Chair in October 2019, will remain on the Board as an independent director. Mr. Smith joined the Board as an independent director in May 2019, bringing nearly 40 years of financial and executive leadership experience in the mining sector. Mr. Smith is a corporate director who has had a career on both the finance and the supply sides of the mining business, with extensive international experience in the acquisition, sale, development, financing and operations of base and precious metal operations.
Dividend Declared
A semi-annual dividend of C$0.01 per share was declared on February 18, 2025. The dividend will be paid out on March 21, 2025 to shareholders of record as of close of business on March 4, 2025.
|
TSX, NYSE - HBM 2025 No. 5 |
Website Links
Hudbay: www.hudbay.com
Management's Discussion and Analysis:
https://www.hudbayminerals.com/MDA225
Financial Statements:
https://www.hudbayminerals.com/FS225
Conference Call and Webcast
|
Date: |
Wednesday, February 19, 2025 |
|
Time: |
11:00 a.m. ET |
|
Webcast: |
www.hudbay.com |
|
Dial in: |
647-484-8814 or 1-844-763-8274 |
|
TSX, NYSE - HBM 2025 No. 5 |
Qualified Person and NI 43-101
The technical and scientific information in this news release related to the company's material mineral projects has been approved by Olivier Tavchandjian, P. Geo, Senior Vice President, Exploration and Technical Services. Mr. Tavchandjian is a qualified person pursuant to National Instrument 43-101 - Standards of Disclosure for Mineral Projects ("NI 43-101").
For a description of the key assumptions, parameters and methods used to estimate mineral reserves and resources at Hudbay's material mineral properties, as well as data verification procedures and a general discussion of the extent to which the estimates of scientific and technical information may be affected by any known environmental, permitting, legal title, taxation, sociopolitical, marketing or other relevant factors, please see the technical reports for the company's material properties as filed by Hudbay on SEDAR+ at www.sedarplus.ca and EDGAR at www.sec.gov.
Non-GAAP Financial Performance Measures
Adjusted net earnings (loss) attributable to owners, adjusted net earnings (loss) per share attributable to owners, adjusted EBITDA, net debt, cash cost, sustaining and all-in sustaining cash cost per pound of copper produced, cash cost and sustaining cash cost per ounce of gold produced, combined unit cost and ratios based on these measures are non-GAAP performance measures. These measures do not have a meaning prescribed by IFRS and are therefore unlikely to be comparable to similar measures presented by other issuers. These measures should not be considered in isolation or as a substitute for measures prepared in accordance with IFRS and are not necessarily indicative of operating profit or cash flow from operations as determined under IFRS. Other companies may calculate these measures differently.
Management believes adjusted net earnings (loss) attributable to owners and adjusted net earnings (loss) per share attributable to owners provides an alternate measure of the company's performance for the current period and gives insight into its expected performance in future periods. These measures are used internally by the company to evaluate the performance of its underlying operations and to assist with its planning and forecasting of future operating results. As such, the company believes these measures are useful to investors in assessing the company's underlying performance. Hudbay provides adjusted EBITDA to help users analyze the company's results and to provide additional information about its ongoing cash generating potential in order to assess its capacity to service and repay debt, carry out investments and cover working capital needs. Net debt is shown because it is a performance measure used by the company to assess its financial position. Net debt to adjusted EBITDA is shown because it is a performance measure used by the company to assess its financial leverage and debt capacity. Cash cost, sustaining and all-in sustaining cash cost per pound of copper produced are shown because the company believes they help investors and management assess the performance of its operations, including the margin generated by the operations and the company. Cash cost and sustaining cash cost per ounce of gold produced are shown because the company believes they help investors and management assess the performance of its Manitoba operations. Combined unit cost is shown because Hudbay believes it helps investors and management assess the company's cost structure and margins that are not impacted by variability in by-product commodity prices.
The following tables provide detailed reconciliations to the most comparable IFRS measures.
|
TSX, NYSE - HBM 2025 No. 5 |
Adjusted Net Earnings (Loss) Reconciliation
| Three Months Ended | Year Ended | ||||||||||||||
| (in $ millions) | Dec. 31, 2024 |
Sep. 30, 2024 |
Dec. 31, 2023 |
Dec. 31, 2024 |
Dec. 31, 2023 |
||||||||||
| Net earnings for the period | 19.3 | 50.4 | 33.5 | 67.8 | 69.5 | ||||||||||
| Tax expense | 84.4 | 29.3 | 47.5 | 183.8 | 82.3 | ||||||||||
| Earnings before tax | 103.7 | 79.7 | 81.0 | 251.6 | 151.8 | ||||||||||
| Adjusting items: | |||||||||||||||
| Mark-to-market adjustments1 | (10.3 | ) | 5.2 | 12.7 | 27.1 | 22.1 | |||||||||
| Foreign exchange loss (gain) | 17.4 | (3.3 | ) | 4.2 | 21.0 | 5.3 | |||||||||
| Variable consideration adjustment - stream revenue and accretion | - | - | - | 4.0 | (5.0 | ) | |||||||||
| Acquisition related costs | - | - | - | - | 6.9 | ||||||||||
| Premium paid on redemption of notes | - | - | 2.2 | - | 2.2 | ||||||||||
| Re-evaluation adjustment - environmental provision | 2.5 | 2.0 | 34.0 | (3.5 | ) | (11.4 | ) | ||||||||
| Inventory adjustments | 1.3 | 1.6 | 1.4 | 2.9 | 2.3 | ||||||||||
| Insurance recovery | - | - | (4.2 | ) | - | (4.2 | ) | ||||||||
| Value-added-tax recovery | - | - | (3.9 | ) | - | (3.9 | ) | ||||||||
| Write off fair value of the Copper Mountain Bonds | - | - | (1.0 | ) | - | (1.0 | ) | ||||||||
| Reduction of obligation to renounce flow-through share expenditures, net of provisions | 1.0 | (2.0 | ) | - | (2.0 | ) | - | ||||||||
| Restructuring charges | - | - | 0.6 | 1.2 | 2.9 | ||||||||||
| Write-down/loss on disposal of PP&E | 14.1 | 2.2 | 6.6 | 27.4 | 7.4 | ||||||||||
| Adjusted earnings before income taxes | 129.7 | 85.4 | 133.6 | 329.7 | 175.4 | ||||||||||
| Tax expense | (84.4 | ) | (29.3 | ) | (47.5 | ) | (183.8 | ) | (82.3 | ) | |||||
| Tax impact on adjusting items | 23.4 | (5.2 | ) | (14.8 | ) | 30.8 | (20.6 | ) | |||||||
| Adjusted net earnings | 68.7 | 50.9 | 71.3 | 176.7 | 72.5 | ||||||||||
| Adjusted net earnings attributable to non-controlling interest: | |||||||||||||||
| Net loss (earnings) for the period | 1.9 | (0.6 | ) | (2.8 | ) | 8.9 | (3.2 | ) | |||||||
| Adjusting items, including tax impact | (0.3 | ) | - | 0.4 | (4.2 | ) | (0.3 | ) | |||||||
| Adjusted net earnings - attributable to owners | 70.3 | 50.3 | 68.9 | 181.4 | 69.0 | ||||||||||
| Adjusted net earnings ($/share) - attributable to owners | 0.18 | 0.13 | 0.20 | 0.48 | 0.23 | ||||||||||
| Basic weighted average number of common shares outstanding (millions) | 394.0 | 393.6 | 349.1 | 376.8 | 310.8 | ||||||||||
1 Includes changes in fair value of the gold prepayment liability, Canadian junior mining investments, other financial assets and liabilities at fair value through profit or loss and share-based compensation expenses (recoveries). Also includes gains and losses on disposition of investments.
|
TSX, NYSE - HBM 2025 No. 5 |
Adjusted EBITDA Reconciliation
| Three Months Ended | Year Ended | ||||||||||||||
| (in $ millions) | Dec. 31, 2024 |
Sep. 30, 2024 |
Dec. 31, 2023 |
Dec. 31, 2024 |
Dec. 31, 2023 |
||||||||||
| Net earnings for the period | 19.3 | 50.4 | 33.5 | 67.8 | 69.5 | ||||||||||
| Add back: | |||||||||||||||
| Tax expense | 84.4 | 29.3 | 47.5 | 183.8 | 82.3 | ||||||||||
| Net finance expense | 34.4 | 26.0 | 48.9 | 148.7 | 145.3 | ||||||||||
| Other expense | 22.1 | 7.9 | 10.6 | 57.4 | 38.3 | ||||||||||
| Depreciation and amortization | 122.2 | 97.5 | 121.9 | 426.6 | 391.7 | ||||||||||
| Amortization of deferred revenue and variable consideration adjustment | (26.2 | ) | (9.5 | ) | (26.5 | ) | (70.5 | ) | (77.3 | ) | |||||
| Adjusting items (pre-tax): | |||||||||||||||
| Re-evaluation adjustment - environmental provision | 2.5 | 2.0 | 34.0 | (3.5 | ) | (11.4 | ) | ||||||||
| Inventory adjustments | 1.3 | 1.6 | 1.4 | 2.9 | 2.3 | ||||||||||
| Option agreement proceeds (Marubeni) | - | - | - | (0.4 | ) | - | |||||||||
| Realized loss on non-QP hedges | (4.2 | ) | (2.1 | ) | - | (8.9 | ) | - | |||||||
| Share-based compensation expense 1 | 1.5 | 3.1 | 3.1 | 18.6 | 7.1 | ||||||||||
| Adjusted EBITDA | 257.3 | 206.2 | 274.4 | 822.5 | 647.8 | ||||||||||
1 Share-based compensation expenses reflected in cost of sales and selling and administrative expenses.
|
TSX, NYSE - HBM 2025 No. 5 |
Net Debt Reconciliation
| (in $ millions) | ||||||||||
| Dec. 31, 2024 | Sep. 30, 2024 | Dec. 31, 2023 | ||||||||
| Total long-term debt | 1,107.5 | 1,108.9 | 1,287.5 | |||||||
| Less: Cash and cash equivalents | (541.8 | ) | (443.3 | ) | (249.8 | ) | ||||
| Less: Short-term investments | (40.0 | ) | (40.0 | ) | - | |||||
| Net debt | 525.7 | 625.6 | 1,037.7 | |||||||
| (in $ millions, except net debt to adjusted EBITDA ratio) | ||||||||||
| Net debt | 525.7 | 625.6 | 1,037.7 | |||||||
| Adjusted EBITDA (12 month period) | 822.5 | 839.8 | 647.8 | |||||||
| Net debt to adjusted EBITDA | 0.6 | 0.7 | 1.6 | |||||||
| Trailing Adjusted EBITDA | Three Months Ended | ||||||||||||||
| (in $ millions) | Dec. 31, 2024 |
Sep. 30, 2024 |
Jun. 30, 2024 |
Mar. 31, 2024 |
Dec. 31, 2023 |
||||||||||
| Profit (loss) for the period | 19.3 | 50.4 | (20.4 | ) | 18.5 | 33.5 | |||||||||
| Add back: | |||||||||||||||
| Tax expense | 84.4 | 29.3 | 20.8 | 49.3 | 47.5 | ||||||||||
| Net finance expense | 34.4 | 26.0 | 44.3 | 44.0 | 48.9 | ||||||||||
| Other expenses | 22.1 | 7.9 | 11.2 | 16.3 | 10.6 | ||||||||||
| Depreciation and amortization | 122.2 | 97.5 | 97.6 | 109.3 | 121.9 | ||||||||||
| Amortization of deferred revenue and variable consideration adjustment | (26.2 | ) | (9.5 | ) | (11.5 | ) | (23.2 | ) | (26.5 | ) | |||||
| Adjusting items (pre-tax): | |||||||||||||||
| Re-evaluation adjustment - environmental provision | 2.5 | 2.0 | (2.7 | ) | (5.3 | ) | 34.0 | ||||||||
| Inventory adjustments | 1.3 | 1.6 | - | - | 1.4 | ||||||||||
| Realized loss on non-QP hedges | (4.2 | ) | (2.1 | ) | (2.6 | ) | - | - | |||||||
| Post-employment plan curtailment | - | - | - | (0.4 | ) | - | |||||||||
| Share-based compensation expenses1 | 1.5 | 3.1 | 8.3 | 5.7 | 3.1 | ||||||||||
| Adjusted EBITDA | 257.3 | 206.2 | 145.0 | 214.2 | 274.4 | ||||||||||
| LTM2 | 822.5 | 839.8 | |||||||||||||
1 Share-based compensation expense reflected in cost of sales and administrative expenses.
2 LTM (last twelve months) as of December 31, 2024 and September 30, 2024. Annual consolidated results may not be calculated based on the amounts presented in this table due to rounding.
|
TSX, NYSE - HBM 2025 No. 5 |
Copper Cash Cost Reconciliation
| Consolidated | Three Months Ended | Year Ended | |||||||||||||
| Net pounds of copper produced1 | |||||||||||||||
| (in thousands) | Dec. 31, 2024 |
Sep. 30, 2024 |
Dec. 31, 2023 |
Dec. 31, 2024 |
Dec. 31, 2023 |
||||||||||
| Peru | 74,931 | 46,782 | 73,209 | 218,260 | 221,536 | ||||||||||
| Manitoba | 7,379 | 7,491 | 8,234 | 27,637 | 26,795 | ||||||||||
| British Columbia2 | 13,067 | 14,850 | 18,755 | 58,215 | 41,995 | ||||||||||
| Net pounds of copper produced | 95,377 | 69,123 | 100,198 | 304,112 | 290,326 | ||||||||||
1 Contained copper in concentrate.
2 Includes 100% of Copper Mountain mine production, Hudbay owns 75% of Copper Mountain mine. As Copper Mountain was acquired on June 20, 2023, the year ended December 31, 2023 includes production from acquisition date.
| Consolidated | Three Months Ended | |||||||||||||||||
| Dec. 31, 2024 | Sep. 30, 2024 | Dec. 31, 2023 | ||||||||||||||||
| Cash cost per pound of copper produced | $ millions | $/lb | $ millions | $/lb | $ millions | $/lb | ||||||||||||
| Mining | 108.1 | 1.13 | 90.7 | 1.31 | 89.7 | 0.89 | ||||||||||||
| Milling | 95.4 | 1.00 | 85.2 | 1.23 | 90.7 | 0.91 | ||||||||||||
| G&A | 50.6 | 0.53 | 38.0 | 0.55 | 38.8 | 0.39 | ||||||||||||
| Onsite costs | 254.1 | 2.66 | 213.9 | 3.09 | 219.2 | 2.19 | ||||||||||||
| Treatment & refining | 25.9 | 0.27 | 21.2 | 0.31 | 35.7 | 0.36 | ||||||||||||
| Freight & other | 28.6 | 0.30 | 24.4 | 0.35 | 32.3 | 0.32 | ||||||||||||
| Cash cost, before by-product credits | 308.6 | 3.23 | 259.5 | 3.75 | 287.2 | 2.87 | ||||||||||||
| By-product credits | (265.5 | ) | (2.78 | ) | (246.7 | ) | (3.57 | ) | (271.8 | ) | (2.71 | ) | ||||||
| Cash cost, net of by-product credits | 43.1 | 0.45 | 12.8 | 0.18 | 15.4 | 0.16 | ||||||||||||
| Year Ended | ||||||||||||||||||
| Dec. 31, 2024 | Dec. 31, 2023 | |||||||||||||||||
| Cash cost per pound of copper produced | $ millions | $/lb | $ millions | $/lb | ||||||||||||||
| Mining | 394.0 | 1.30 | 332.0 | 1.14 | ||||||||||||||
| Milling | 352.1 | 1.16 | 309.7 | 1.07 | ||||||||||||||
| G&A | 162.8 | 0.53 | 122.6 | 0.42 | ||||||||||||||
| Onsite costs | 908.9 | 2.99 | 764.3 | 2.63 | ||||||||||||||
| Treatment & refining | 97.3 | 0.31 | 113.7 | 0.39 | ||||||||||||||
| Freight & other | 101.1 | 0.34 | 94.7 | 0.33 | ||||||||||||||
| Cash cost, before by-product credits | 1,107.3 | 3.64 | 972.7 | 3.35 | ||||||||||||||
| By-product credits | (967.4 | ) | (3.18 | ) | (741.3 | ) | (2.55 | ) | ||||||||||
| Cash cost, net of by-product credits | 139.9 | 0.46 | 231.4 | 0.80 | ||||||||||||||
|
TSX, NYSE - HBM 2025 No. 5 |
| Consolidated | Three Months Ended | |||||||||||||||||
| Dec. 31, 2024 | Sep. 30, 2024 | Dec. 31, 2023 | ||||||||||||||||
| Supplementary cash cost information | $ millions | $/lb1 | $ millions | $/lb1 | $ millions | $/lb1 | ||||||||||||
| By-product credits2: | ||||||||||||||||||
| Zinc | 16.1 | 0.17 | 24.3 | 0.35 | 18.6 | 0.18 | ||||||||||||
| Gold3 | 212.9 | 2.23 | 189.0 | 2.73 | 216.2 | 2.16 | ||||||||||||
| Silver3 | 26.6 | 0.28 | 18.3 | 0.27 | 22.7 | 0.23 | ||||||||||||
| Molybdenum & other | 9.9 | 0.10 | 15.1 | 0.22 | 14.3 | 0.14 | ||||||||||||
| Total by-product credits | 265.5 | 2.78 | 246.7 | 3.57 | 271.8 | 2.71 | ||||||||||||
| Reconciliation to IFRS: | ||||||||||||||||||
| Cash cost, net of by-product credits | 43.1 | 12.8 | 15.4 | |||||||||||||||
| By-product credits | 265.5 | 246.7 | 271.8 | |||||||||||||||
| Treatment and refining charges | (25.9 | ) | (21.2 | ) | (35.7 | ) | ||||||||||||
| Share-based compensation expense | 0.7 | 0.3 | 0.3 | |||||||||||||||
| Inventory adjustments | 1.3 | 1.6 | 1.4 | |||||||||||||||
| Past service costs | 1.5 | 2.8 | - | |||||||||||||||
| Change in product inventory | (10.0 | ) | 1.8 | 29.3 | ||||||||||||||
| Royalties | 2.1 | 3.7 | 1.1 | |||||||||||||||
| Depreciation and amortization4 | 122.2 | 97.5 | 121.8 | |||||||||||||||
| Cost of sales5 | 400.5 | 346.0 | 405.4 | |||||||||||||||
| Year Ended | ||||||||||||||||||
| Dec. 31, 2024 | Dec. 31, 2023 | |||||||||||||||||
| Supplementary cash cost information | $ millions | $/lb1 | $ millions | $/lb1 | ||||||||||||||
| By-product credits2: | ||||||||||||||||||
| Zinc | 69.9 | 0.23 | 74.9 | 0.26 | ||||||||||||||
| Gold3 | 747.8 | 2.46 | 525.6 | 1.80 | ||||||||||||||
| Silver3 | 86.0 | 0.28 | 68.7 | 0.24 | ||||||||||||||
| Molybdenum & other | 63.7 | 0.21 | 72.1 | 0.25 | ||||||||||||||
| Total by-product credits | 967.4 | 3.18 | 741.3 | 2.55 | ||||||||||||||
| Reconciliation to IFRS: | ||||||||||||||||||
| Cash cost, net of by-product credits | 139.9 | 231.4 | ||||||||||||||||
| By-product credits | 967.4 | 741.3 | ||||||||||||||||
| Treatment and refining charges | (97.3 | ) | (113.7 | ) | ||||||||||||||
| Share-based compensation expense | 1.9 | 0.6 | ||||||||||||||||
| Inventory adjustments | 2.9 | 2.3 | ||||||||||||||||
| Past service costs | 4.3 | - | ||||||||||||||||
| Change in product inventory | 11.4 | 38.4 | ||||||||||||||||
| Royalties | 10.3 | 5.5 | ||||||||||||||||
| Depreciation and amortization4 | 426.6 | 391.7 | ||||||||||||||||
| Cost of sales5 | 1,467.4 | 1,297.5 | ||||||||||||||||
1 Per pound of copper produced.
2 By-product credits are computed as revenue per consolidated financial statements, including amortization of deferred revenue and pricing and volume adjustments.
3 Gold and silver by-product credits do not include variable consideration adjustments with respect to stream arrangements. Variable consideration adjustments are cumulative adjustments to gold and silver stream deferred revenue primarily associated with the net change in mineral reserves and resources or amendments to the mine plan that would change the total expected deliverable ounces under the precious metal streaming arrangement. For the year ended December 31, 2024 the variable consideration adjustments amounted loss of $3.8 million (year ended December 31, 2023 - income of $4.9 million).
4 Depreciation is based on concentrate sold.
5 As per consolidated financial statements.
|
TSX, NYSE - HBM 2025 No. 5 |
| Peru | Three Months Ended | Year Ended | |||||||||||||
| (in thousands) | Dec. 31, 2024 |
Sep. 30, 2024 |
Dec. 31, 2023 |
Dec. 31, 2024 |
Dec. 31, 2023 |
||||||||||
| Net pounds of copper produced1 | 74,931 | 46,782 | 73,209 | 218,260 | 221,536 | ||||||||||
1 Contained copper in concentrate.
| Peru | Three Months Ended | |||||||||||||||||
| Dec. 31, 2024 | Sep. 30, 2024 | Dec. 31, 2023 | ||||||||||||||||
| Cash cost per pound of copper produced | $ millions | $/lb | $ millions | $/lb | $ millions | $/lb | ||||||||||||
| Mining | 47.3 | 0.63 | 37.6 | 0.81 | 30.4 | 0.41 | ||||||||||||
| Milling | 53.6 | 0.72 | 48.5 | 1.04 | 50.2 | 0.69 | ||||||||||||
| G&A | 33.2 | 0.44 | 19.9 | 0.42 | 24.8 | 0.34 | ||||||||||||
| Onsite costs | 134.1 | 1.79 | 106.0 | 2.27 | 105.4 | 1.44 | ||||||||||||
| Treatment & refining | 16.0 | 0.21 | 11.4 | 0.24 | 19.6 | 0.27 | ||||||||||||
| Freight & other | 19.2 | 0.25 | 14.1 | 0.30 | 20.8 | 0.28 | ||||||||||||
| Cash cost, before by-product credits | 169.3 | 2.25 | 131.5 | 2.81 | 145.8 | 1.99 | ||||||||||||
| By-product credits | (94.0 | ) | (1.25 | ) | (47.2 | ) | (1.01 | ) | (106.1 | ) | (1.45 | ) | ||||||
| Cash cost, net of by-product credits | 75.3 | 1.00 | 84.3 | 1.80 | 39.7 | 0.54 | ||||||||||||
| Year Ended | ||||||||||||||||||
| Dec. 31, 2024 | Dec. 31, 2023 | |||||||||||||||||
| Cash cost per pound of copper produced | $ millions | $/lb | $ millions | $/lb | ||||||||||||||
| Mining | 145.5 | 0.67 | 122.6 | 0.55 | ||||||||||||||
| Milling | 197.1 | 0.90 | 198.1 | 0.90 | ||||||||||||||
| G&A | 95.5 | 0.44 | 77.2 | 0.35 | ||||||||||||||
| Onsite costs | 438.1 | 2.01 | 397.9 | 1.80 | ||||||||||||||
| Treatment & refining | 53.4 | 0.24 | 66.4 | 0.30 | ||||||||||||||
| Freight & other | 62.5 | 0.29 | 62.7 | 0.28 | ||||||||||||||
| Cash cost, before by-product credits | 554.0 | 2.54 | 527.0 | 2.38 | ||||||||||||||
| By-product credits | (295.8 | ) | (1.36 | ) | (289.1 | ) | (1.31 | ) | ||||||||||
| Cash cost, net of by-product credits | 258.2 | 1.18 | 237.9 | 1.07 | ||||||||||||||
|
TSX, NYSE - HBM 2025 No. 5 |
| Peru | Three Months Ended | ||||||||||||||||
| Dec. 31, 2024 | Sep. 30, 2024 | Dec. 31, 2023 | |||||||||||||||
| Supplementary cash cost information | $ millions |
$/lb1 |
$ millions | $/lb1 | $ millions | $/lb1 | |||||||||||
| By-product credits2: | |||||||||||||||||
| Gold3 | 68.5 | 0.91 | 22.9 | 0.49 | 77.5 | 1.05 | |||||||||||
| Silver3 | 16.8 | 0.22 | 9.2 | 0.20 | 14.3 | 0.20 | |||||||||||
| Molybdenum | 8.7 | 0.12 | 15.1 | 0.32 | 14.3 | 0.20 | |||||||||||
| Total by-product credits | 94.0 | 1.25 | 47.2 | 1.01 | 106.1 | 1.45 | |||||||||||
| Reconciliation to IFRS: | |||||||||||||||||
| Cash cost, net of by-product credits | 75.3 | 84.3 | 39.7 | ||||||||||||||
| By-product credits | 94.0 | 47.3 | 106.1 | ||||||||||||||
| Treatment and refining charges | (16.0 | ) | (11.4 | ) | (19.6 | ) | |||||||||||
| Inventory adjustments | (0.2 | ) | 0.2 | - | |||||||||||||
| Share-based compensation expenses | 0.1 | 0.1 | 0.1 | ||||||||||||||
| Change in product inventory | (6.7 | ) | 1.1 | 8.0 | |||||||||||||
| Royalties | 1.5 | 2.1 | 1.5 | ||||||||||||||
| Depreciation and amortization4 | 83.2 | 57.2 | 85.7 | ||||||||||||||
| Cost of sales5 | 231.2 | 180.9 | 221.5 | ||||||||||||||
| Year Ended | |||||||||||||||||
| Dec. 31, 2024 | Dec. 31, 2023 | ||||||||||||||||
| Supplementary cash cost information | $ | millions | $ | /lb1 | $ millions | $/lb1 | |||||||||||
| By-product credits2: | |||||||||||||||||
| Gold3 | 182.5 | 0.84 | 169.9 | 0.77 | |||||||||||||
| Silver3 | 51.3 | 0.24 | 47.3 | 0.21 | |||||||||||||
| Molybdenum | 62.0 | 0.28 | 71.9 | 0.33 | |||||||||||||
| Total by-product credits | 295.8 | 1.36 | 289.1 | 1.31 | |||||||||||||
| Reconciliation to IFRS: | |||||||||||||||||
| Cash cost, net of by-product credits | 258.2 | 237.9 | |||||||||||||||
| By-product credits | 295.8 | 289.1 | |||||||||||||||
| Treatment and refining charges | (53.4 | ) | (66.4 | ) | |||||||||||||
| Share-based compensation expenses | 0.5 | 0.1 | |||||||||||||||
| Change in product inventory | 9.6 | 28.1 | |||||||||||||||
| Royalties | 6.7 | 5.6 | |||||||||||||||
| Depreciation and amortization4 | 270.3 | 275.7 | |||||||||||||||
| Cost of sales5 | 787.7 | 770.1 | |||||||||||||||
1 Per pound of copper produced.
2 By-product credits are computed as revenue per consolidated financial statements, including amortization of deferred revenue and pricing and volume adjustments.
3 Gold and silver by-product credits do not include variable consideration adjustments with respect to stream arrangements.
4 Depreciation is based on concentrate sold.
5 As per the consolidated financial statements.
|
TSX, NYSE - HBM 2025 No. 5 |
| British Columbia | Three Months Ended | Year Ended | |||||||||||||
| (in thousands) | Dec. 31, 2024 |
Sep. 30, 2024 |
Dec. 31, 2023 |
Dec. 31, 2024 |
Dec. 31, 2023 |
||||||||||
| Net pounds of copper produced1 | 13,067 | 14,850 | 18,755 | 58,215 | 41,995 | ||||||||||
1 Contained copper in concentrate.
| British Columbia | Three Months Ended | ||||||||||||||||||
| Dec. 31, 2024 | Sep. 30, 2024 | Dec. 31, 2023 | |||||||||||||||||
| Cash cost per pound of copper produced | $ millions | $/lb | $ millions | $/lb | $ millions | $/lb | |||||||||||||
| Mining | 18.2 | 1.39 | 12.9 | 0.87 | 19.0 | 1.01 | |||||||||||||
| Milling | 25.2 | 1.93 | 19.7 | 1.33 | 25.2 | 1.35 | |||||||||||||
| G&A | 4.6 | 0.35 | 5.8 | 0.39 | 5.6 | 0.30 | |||||||||||||
| Onsite costs | 48.0 | 3.67 | 38.4 | 2.59 | 49.8 | 2.66 | |||||||||||||
| Treatment & refining | 3.4 | 0.26 | 3.3 | 0.22 | 4.9 | 0.26 | |||||||||||||
| Freight & other | 2.4 | 0.19 | 3.0 | 0.20 | 4.7 | 0.25 | |||||||||||||
| Cash cost, before by-product credits | 53.8 | 4.12 | 44.7 | 3.01 | 59.4 | 3.17 | |||||||||||||
| By-product credits | (14.6 | ) | (1.12 | ) | (17.9 | ) | (1.20 | ) | (9.3 | ) | (0.50 | ) | |||||||
| Cash cost, net of by-product credits | 39.2 | 3.00 | 26.8 | 1.81 | 50.1 | 2.67 | |||||||||||||
| Year Ended | |||||||||||||||||||
| Dec. 31, 2024 | Dec. 31, 2023 | ||||||||||||||||||
| Cash cost per pound of copper produced | $ millions | $/lb | $ millions | $/lb | |||||||||||||||
| Mining | 79.1 | 1.36 | 48.3 | 1.15 | |||||||||||||||
| Milling | 89.8 | 1.54 | 49.3 | 1.17 | |||||||||||||||
| G&A | 19.6 | 0.34 | 10.7 | 0.25 | |||||||||||||||
| Onsite costs | 188.5 | 3.24 | 108.3 | 2.57 | |||||||||||||||
| Treatment & refining | 14.4 | 0.25 | 9.8 | 0.23 | |||||||||||||||
| Freight & other | 13.2 | 0.22 | 8.4 | 0.20 | |||||||||||||||
| Cash cost, before by-product credits | 216.1 | 3.71 | 126.5 | 3.00 | |||||||||||||||
| By-product credits | (56.5 | ) | (0.97 | ) | (21.5 | ) | (0.51 | ) | |||||||||||
| Cash cost, net of by-product credits | 159.6 | 2.74 | 105.0 | 2.49 | |||||||||||||||
|
TSX, NYSE - HBM 2025 No. 5 |
| British Columbia | Three Months Ended | Year Ended | |||||||||||||||||||||||||||||
| Dec. 31, 2024 | Sep. 30, 2024 | Dec. 31, 2023 | Dec. 31, 2024 | Dec. 31, 2023 | |||||||||||||||||||||||||||
| Supplementary cash cost information | $millions | $/lb1 | $millions | $/lb1 | $millions | $/lb1 | $millions | $/lb1 | $millions | $/lb1 | |||||||||||||||||||||
| By-product credits2: | |||||||||||||||||||||||||||||||
| Gold | 13.3 | 1.02 | 16.3 | 1.09 | 6.9 | 0.37 | 49.3 | 0.85 | 17.0 | 0.40 | |||||||||||||||||||||
| Silver | 1.3 | 0.10 | 1.6 | 0.11 | 2.4 | 0.13 | 7.2 | 0.12 | 4.5 | 0.11 | |||||||||||||||||||||
| Total by-product credits | 14.6 | 1.12 | 17.9 | 1.20 | 9.3 | 0.50 | 56.5 | 0.97 | 21.5 | 0.51 | |||||||||||||||||||||
| Reconciliation to IFRS: | |||||||||||||||||||||||||||||||
| Cash cost, net of by-product credits | 39.2 | 26.8 | 50.1 | 159.6 | 105.0 | ||||||||||||||||||||||||||
| By-product credits | 14.6 | 17.9 | 9.3 | 56.5 | 21.5 | ||||||||||||||||||||||||||
| Treatment and refining charges | (3.4 | ) | (3.3 | ) | (4.9 | ) | (14.4 | ) | (9.8 | ) | |||||||||||||||||||||
| Share based payment | 0.4 | - | - | 0.4 | - | ||||||||||||||||||||||||||
| Change in product inventory | (3.0 | ) | (0.5 | ) | 8.5 | 3.8 | 8.5 | ||||||||||||||||||||||||
| Inventory adjustments | 1.2 | - | - | 1.2 | - | ||||||||||||||||||||||||||
| Royalties | 0.6 | 1.6 | (0.4 | ) | 3.6 | (0.2 | ) | ||||||||||||||||||||||||
| Depreciation and amortization3 | 11.8 | 12.5 | 5.5 | 50.1 | 11.7 | ||||||||||||||||||||||||||
| Cost of sales4 | 61.4 | 55.0 | 68.1 | 260.8 | 136.7 | ||||||||||||||||||||||||||
1 Per pound of copper produced.
2 By-product credits are computed as revenue per consolidated financial statements, including amortization of deferred revenue and pricing and volume adjustments.
3 Depreciation is based on concentrate sold.
4 As per consolidated financial statements.Sustaining and All-in Sustaining Cash Cost Reconciliation
|
TSX, NYSE - HBM 2025 No. 5 |
| Consolidated | Three Months Ended | ||||||||||||||||||
| Dec. 31, 2024 | Sep. 30, 2024 | Dec. 31, 2023 | |||||||||||||||||
| All-in sustaining cash cost per pound of copper produced | $millions | $/lb | $millions | $/lb | $millions | $/lb | |||||||||||||
| Cash cost, net of by-product credits | 43.1 | 0.45 | 12.7 | 0.18 | 15.4 | 0.16 | |||||||||||||
| Cash sustaining capital expenditures | 85.3 | 0.89 | 101.6 | 1.47 | 87.6 | 0.87 | |||||||||||||
| Capitalized exploration | - | - | - | - | 5.2 | 0.05 | |||||||||||||
| Royalties | 2.1 | 0.03 | 3.8 | 0.06 | 1.1 | 0.01 | |||||||||||||
| Sustaining cash cost, net of by-product credits | 130.5 | 1.37 | 118.1 | 1.71 | 109.3 | 1.09 | |||||||||||||
| Corporate selling and administrative expenses & regional costs | 11.6 | 0.12 | 12.9 | 0.18 | 12.7 | 0.13 | |||||||||||||
| Accretion and amortization of decommissioning and community agreements1 | 3.7 | 0.04 | 3.9 | 0.06 | 9.0 | 0.09 | |||||||||||||
| All-in sustaining cash cost, net of by-product credits | 145.8 | 1.53 | 134.9 | 1.95 | 131.0 | 1.31 | |||||||||||||
| Reconciliation to property, plant and equipment additions | |||||||||||||||||||
| Property, plant and equipment additions | 127.6 | 76.7 | 54.0 | ||||||||||||||||
| Capitalized stripping net additions | 35.8 | 49.3 | 40.9 | ||||||||||||||||
| Total accrued capital additions | 163.4 | 126.0 | 94.9 | ||||||||||||||||
| Less other non-sustaining capital costs2 | 91.8 | 36.6 | 19.9 | ||||||||||||||||
| Total sustaining capital costs | 71.6 | 89.4 | 75.0 | ||||||||||||||||
| Capitalized lease & equipment financing cash payments - operating sites | 10.3 | 10.2 | 8.7 | ||||||||||||||||
| Community agreement cash payments3 | 0.7 | 0.3 | 2.3 | ||||||||||||||||
| Accretion and amortization of decommissioning and restoration obligations4 | 2.7 | 1.7 | 1.6 | ||||||||||||||||
| Cash sustaining capital expenditures | 85.3 | 101.6 | 87.6 | ||||||||||||||||
1 Includes accretion of decommissioning relating to non-productive sites, and accretion and amortization of current community agreements.
2 Other non-sustaining capital costs include Arizona capitalized costs, capitalized interest, capitalized exploration, right-of-use lease asset additions, equipment financing asset additions, growth capital expenditures and reclassification related to capital spares.
3 Amortization for community agreements relating to current operations.
4 Includes amortization of decommissioning and restoration PP&E assets and accretion of decommissioning and restoration liabilities related to producing sites.
|
TSX, NYSE - HBM 2025 No. 5 |
| Consolidated | Year Ended | |||||||||||||
| Dec. 31, 2024 | Dec. 31, 2023 | |||||||||||||
| All-in sustaining cash cost per pound of copper produced | $millions | $/lb | $millions | $/lb | ||||||||||
| Cash cost, net of by-product credits | 139.9 | 0.46 | 231.4 | 0.80 | ||||||||||
| Cash sustaining capital expenditures | 342.2 | 1.13 | 255.9 | 0.88 | ||||||||||
| Capitalized exploration | - | - | 5.2 | 0.02 | ||||||||||
| Royalties | 10.3 | 0.03 | 5.5 | 0.02 | ||||||||||
| Sustaining cash cost, net of by-product credits | 492.4 | 1.62 | 498.0 | 1.72 | ||||||||||
| Corporate selling and administrative expenses & regional costs | 62.4 | 0.20 | 43.5 | 0.14 | ||||||||||
| Accretion and amortization of decommissioning and community agreements1 | 17.3 | 0.06 | 16.0 | 0.06 | ||||||||||
| All-in sustaining cash cost, net of by-product credits | 572.1 | 1.88 | 557.5 | 1.92 | ||||||||||
| Reconciliation to property, plant and equipment additions: | ||||||||||||||
| Property, plant and equipment additions | 325.7 | 212.6 | ||||||||||||
| Capitalized stripping net additions | 160.5 | 111.2 | ||||||||||||
| Total accrued capital additions | 486.2 | 323.8 | ||||||||||||
| Less other non-sustaining capital costs2 | 193.1 | 105.7 | ||||||||||||
| Total sustaining capital costs | 293.1 | 218.1 | ||||||||||||
| Capitalized lease & equipment financing cash payments - operating sites | 38.4 | 25.0 | ||||||||||||
| Community agreement cash payments3 | 2.5 | 6.7 | ||||||||||||
| Accretion and amortization of decommissioning and restoration obligations4 | 8.2 | 6.1 | ||||||||||||
| Cash sustaining capital expenditures | 342.2 | 255.9 | ||||||||||||
1 Includes accretion of decommissioning relating to non-productive sites, and accretion and amortization of community agreements capitalized to Other assets.
2 Other non-sustaining capital costs include Arizona capitalized costs, capitalized interest, capitalized exploration, right-of-use lease asset additions, equipment financing asset additions, growth capital expenditures and reclassification related to capital spares.
3 Amortization for community agreements relating to current operations.
4 Includes amortization of decommissioning and restoration PP&E assets and accretion of decommissioning and restoration liabilities related to producing sites.
| Peru | Three Months Ended | Year Ended | |||||||||||||||||||||||||||||
| Dec. 31, 2024 | Sep. 30, 2024 | Dec. 31, 2023 | Dec. 31, 2024 | Dec. 31, 2023 | |||||||||||||||||||||||||||
| Sustaining cash cost per pound of copper produced | $millions | $/lb | $millions | $/lb | $millions | $/lb | $millions | $/lb | $millions | $/lb | |||||||||||||||||||||
| Cash cost, net of by-product credits | 75.3 | 1.00 | 84.3 | 1.80 | 39.7 | 0.54 | 258.2 | 1.18 | 237.9 | 1.07 | |||||||||||||||||||||
| Cash sustaining capital expenditures | 34.3 | 0.46 | 43.7 | 0.93 | 42.3 | 0.58 | 141.6 | 0.65 | 152.0 | 0.69 | |||||||||||||||||||||
| Capitalized exploration | - | - | - | - | 5.2 | 0.07 | - | - | 5.2 | 0.02 | |||||||||||||||||||||
| Royalties | 1.5 | 0.02 | 2.1 | 0.05 | 1.5 | 0.02 | 6.7 | 0.03 | 5.6 | 0.03 | |||||||||||||||||||||
| Sustaining cash cost per pound of copper produced | 111.1 | 1.48 | 130.1 | 2.78 | 88.7 | 1.21 | 406.5 | 1.86 | 400.7 | 1.81 | |||||||||||||||||||||
|
TSX, NYSE - HBM 2025 No. 5 |
| British Columbia | Three Months Ended | Year Ended | |||||||||||||||||||||||||||||
| Dec. 31, 2024 | Sep. 30, 2024 | Dec. 31, 2023 | Dec. 31, 2024 | Dec. 31, 2023 | |||||||||||||||||||||||||||
| Sustaining cash cost per pound of copper produced | $millions | $/lb | $millions | $/lb | $millions | $/lb | $millions | $/lb | $millions | $/lb | |||||||||||||||||||||
| Cash cost, net of by-product credits | 39.2 | 3.00 | 26.8 | 1.81 | 50.1 | 2.67 | 159.6 | 2.74 | 105.0 | 2.49 | |||||||||||||||||||||
| Cash sustaining capital expenditures | 35.4 | 2.71 | 46.6 | 3.14 | 24.1 | 1.28 | 144.5 | 2.48 | 38.5 | 0.92 | |||||||||||||||||||||
| Royalties | 0.6 | 0.05 | 1.7 | 0.11 | (0.4 | ) | (0.02 | ) | 3.6 | 0.07 | (0.2 | ) | - | ||||||||||||||||||
| Sustaining cash cost per pound of copper produced | 75.2 | 5.76 | 75.1 | 5.06 | 73.8 | 3.93 | 307.7 | 5.29 | 143.3 | 3.41 | |||||||||||||||||||||
Gold Cash Cost and Sustaining Cash Cost Reconciliation
| Manitoba | Three Months Ended | Year Ended | ||||||||||||||
| (in thousands) | Dec. 31, 2024 |
Sep. 30, 2024 |
Dec. 31, 2023 |
Dec. 31, 2024 |
Dec. 31 , 2023 |
|||||||||||
| Net ounces of gold produced1 | 51,438 | 62,468 | 59,863 | 214,225 | 187,363 | |||||||||||
1 Contained gold in concentrate and doré.
| Manitoba | Three Months Ended | |||||||||||||||||||||||
| Dec. 31, 2024 | Sep. 30, 2024 | Dec. 31, 2023 | ||||||||||||||||||||||
| Cash cost per ounce of gold produced | $millions | $/oz | $millions | $/oz | $millions | $/oz | ||||||||||||||||||
| Mining | 42.6 | 828 | 40.1 | 642 | 40.3 | 673 | ||||||||||||||||||
| Milling | 16.6 | 323 | 16.9 | 271 | 15.3 | 256 | ||||||||||||||||||
| G&A | 12.8 | 249 | 12.4 | 198 | 8.4 | 140 | ||||||||||||||||||
| Onsite costs | 72.0 | 1,400 | 69.4 | 1,111 | 64.0 | 1,069 | ||||||||||||||||||
| Treatment & refining | 6.5 | 126 | 6.5 | 104 | 11.1 | 186 | ||||||||||||||||||
| Freight & other | 7.0 | 136 | 7.3 | 117 | 6.8 | 113 | ||||||||||||||||||
| Cash cost, before by-product credits | 85.5 | 1,662 | 83.2 | 1,332 | 81.9 | 1,368 | ||||||||||||||||||
| By-product credits | (54.3 | ) | (1,055 | ) | (60.0 | ) | (960 | ) | (56.0 | ) | (934 | ) | ||||||||||||
| Gold cash cost, net of by-product credits | 31.2 | 607 | 23.2 | 372 | 25.9 | 434 | ||||||||||||||||||
| Year Ended | |||||||||||||||||||
| Dec. 31, 2024 | Dec. 31, 2023 | ||||||||||||||||||
| Cash cost per ounce of gold produced | $millions | $/oz | $millions | $/oz | |||||||||||||||
| Mining | 169.4 | 791 | 161.1 | 860 | |||||||||||||||
| Milling | 65.2 | 304 | 62.3 | 333 | |||||||||||||||
| G&A | 47.7 | 223 | 34.7 | 185 | |||||||||||||||
| Onsite costs | 282.3 | 1,318 | 258.1 | 1,378 | |||||||||||||||
| Treatment & refining | 29.5 | 137 | 37.5 | 200 | |||||||||||||||
| Freight & other | 25.4 | 119 | 23.6 | 126 | |||||||||||||||
| Cash cost, before by-product credits | 337.2 | 1,574 | 319.2 | 1,704 | |||||||||||||||
| By-product credits | (207.3 | ) | (968 | ) | (183.1 | ) | (977 | ) | |||||||||||
| Gold cash cost, net of by-product credits | 129.9 | 606 | 136.1 | 727 | |||||||||||||||
|
TSX, NYSE - HBM 2025 No. 5 |
| Manitoba | Three Months Ended | |||||||||||||||||
| Dec. 31, 2024 | Sep. 30, 2024 | Dec. 31, 2023 | ||||||||||||||||
| Supplementary cash cost information | $millions | $/oz1 | $millions | $/oz1 | $millions | $/oz1 | ||||||||||||
| By-product credits2: | ||||||||||||||||||
| Copper | 28.5 | 554 | 28.2 | 451 | 31.4 | 526 | ||||||||||||
| Zinc | 16.1 | 313 | 24.3 | 389 | 18.6 | 308 | ||||||||||||
| Silver | 8.5 | 165 | 7.5 | 120 | 6.0 | 100 | ||||||||||||
| Other | 1.2 | 23 | - | - | - | - | ||||||||||||
| Total by-product credits | 54.3 | 1,055 | 60.0 | 960 | 56.0 | 934 | ||||||||||||
| Reconciliation to IFRS: | ||||||||||||||||||
| Cash cost, net of by-product credits | 31.2 | 23.2 | 25.9 | |||||||||||||||
| By-product credits | 54.3 | 60.0 | 56.0 | |||||||||||||||
| Treatment and refining charges | (6.5 | ) | (6.5 | ) | (11.1 | ) | ||||||||||||
| Inventory adjustments | 0.3 | 2.8 | 1.4 | |||||||||||||||
| Share-based compensation expenses | 0.2 | 1.4 | 0.2 | |||||||||||||||
| Past service cost | 1.5 | 0.2 | - | |||||||||||||||
| Change in product inventory | (0.3 | ) | 1.2 | 12.8 | ||||||||||||||
| Royalties | - | - | - | |||||||||||||||
| Depreciation and amortization3 | 27.2 | 27.7 | 30.6 | |||||||||||||||
| Cost of sales4 | 107.9 | 110.0 | 115.8 | |||||||||||||||
| Year Ended | ||||||||||||
| Dec. 31, 2024 | Dec. 31, 2023 | |||||||||||
| Supplementary cash cost information | $millions | $/oz1 | $millions | $/oz1 | ||||||||
| By-product credits2: | ||||||||||||
| Copper | 108.2 | 505 | 91.1 | 487 | ||||||||
| Zinc | 69.9 | 326 | 74.9 | 399 | ||||||||
| Silver | 27.5 | 128 | 16.9 | 90 | ||||||||
| Other | 1.7 | 9 | 0.2 | 1 | ||||||||
| Total by-product credits | 207.3 | 968 | 183.1 | 977 | ||||||||
| Reconciliation to IFRS: | ||||||||||||
| Cash cost, net of by-product credits | 129.9 | 136.1 | ||||||||||
| By-product credits | 207.3 | 183.1 | ||||||||||
| Treatment and refining charges | (29.5 | ) | (37.5 | ) | ||||||||
| Inventory adjustments | 1.7 | 2.3 | ||||||||||
| Share-based compensation expenses | 1.0 | 0.5 | ||||||||||
| Past service cost | 4.3 | - | ||||||||||
| Change in product inventory | (2.0 | ) | 1.8 | |||||||||
| Royalties | - | 0.1 | ||||||||||
| Depreciation and amortization3 | 106.2 | 104.3 | ||||||||||
| Cost of sales4 | 418.9 | 390.7 | ||||||||||
1 Per ounce of gold produced.
2 By-product credits are computed as revenue per consolidated financial statements, amortization of deferred revenue, pricing and volume adjustments.
3 Depreciation is based on concentrate sold.
4 As per consolidated financial statements.
|
TSX, NYSE - HBM 2025 No. 5 |
| Manitoba | Three Months Ended | Year Ended | |||||||||||||||||||||||||||||
| Dec. 31, 2024 | Sep. 30, 2024 | Dec. 31, 2023 | Dec. 31, 2024 | Dec. 31, 2023 | |||||||||||||||||||||||||||
| Sustaining cash cost per ounce of gold produced | $millions | $/oz | $millions | $/oz | $millions | $/oz | $millions | $/oz | $millions | $/oz | |||||||||||||||||||||
| Gold cash cost, net of by-product credits | 31.2 | 607 | 23.2 | 372 | 25.9 | 434 | 129.9 | 606 | 136.1 | 727 | |||||||||||||||||||||
| Cash sustaining capital expenditures | 15.5 | 301 | 11.3 | 181 | 21.2 | 354 | 56.1 | 262 | 65.4 | 349 | |||||||||||||||||||||
| Royalties | - | - | - | - | - | - | - | - | 0.1 | 1 | |||||||||||||||||||||
| Sustaining cash cost per ounce of gold produced | 46.7 | 908 | 34.5 | 553 | 47.1 | 788 | 186.0 | 868 | 201.6 | 1,077 | |||||||||||||||||||||
Combined Unit Cost Reconciliation
| Peru | Three Months Ended | Year Ended | |||||||||||||
| (in millions except ore tonnes milled and unit cost per tonne) | |||||||||||||||
| Combined unit cost per tonne processed | Dec. 31, 2024 |
Sep. 30, 2024 |
Dec. 31, 2023 |
Dec. 31, 2024 |
Dec. 31, 2023 |
||||||||||
| Mining | 47.3 | 37.6 | 30.4 | 145.5 | 122.6 | ||||||||||
| Milling | 53.6 | 48.5 | 50.2 | 197.1 | 198.1 | ||||||||||
| G&A1 | 33.2 | 19.9 | 24.8 | 95.5 | 77.2 | ||||||||||
| Other G&A2 | (12.1 | ) | (2.0 | ) | (8.2 | ) | (25.9 | ) | (14.9 | ) | |||||
| Unit cost | 122.0 | 104.0 | 97.2 | 412.2 | 383.0 | ||||||||||
| Tonnes ore milled | 7,999 | 8,137 | 7,939 | 31,934 | 30,721 | ||||||||||
| Combined unit cost per tonne | 15.25 | 12.78 | 12.24 | 12.91 | 12.47 | ||||||||||
| Reconciliation to IFRS | |||||||||||||||
| Unit cost | 122.0 | 104.0 | 97.2 | 412.2 | 383.0 | ||||||||||
| Freight & other | 19.2 | 14.1 | 20.8 | 62.5 | 62.7 | ||||||||||
| Inventory adjustments | (0.2 | ) | 0.2 | - | - | - | |||||||||
| Other G&A | 12.1 | 2.1 | 8.2 | 25.9 | 14.9 | ||||||||||
| Share-based compensation expenses | 0.1 | 0.1 | 0.1 | 0.5 | 0.1 | ||||||||||
| Change in product inventory | (6.7 | ) | 1.1 | 8.0 | 9.6 | 28.1 | |||||||||
| Royalties | 1.5 | 2.1 | 1.5 | 6.7 | 5.6 | ||||||||||
| Depreciation and amortization | 83.2 | 57.2 | 85.7 | 270.3 | 275.7 | ||||||||||
| Cost of sales3 | 231.2 | 180.9 | 221.5 | 787.7 | 770.1 | ||||||||||
1 G&A as per cash cost reconciliation above.
2 Other G&A primarily includes profit sharing costs.
3 As per consolidated financial statements.
|
TSX, NYSE - HBM 2025 No. 5 |
| British Columbia | Three Months Ended | Year Ended | |||||||||||||
| (in millions except unit cost per tonne) | |||||||||||||||
| Combined unit cost per tonne processed | Dec. 31, 2024 |
Sep. 30, 2024 |
Dec. 31, 2023 |
Dec. 31, 2024 |
Dec. 31, 2023 |
||||||||||
| Mining | 18.2 | 12.9 | 19.0 | 79.1 | 48.3 | ||||||||||
| Milling | 25.2 | 19.7 | 25.2 | 89.8 | 49.3 | ||||||||||
| G&A1 | 4.6 | 5.8 | 5.6 | 19.6 | 10.7 | ||||||||||
| Unit cost | 48.0 | 38.4 | 49.8 | 188.5 | 108.3 | ||||||||||
| USD/CAD implicit exchange rate | 1.38 | 1.35 | 1.37 | 1.37 | 1.36 | ||||||||||
| Unit cost - C$ | 66.9 | 52.4 | 68.2 | 258.1 | 146.7 | ||||||||||
| Tonnes ore milled | 2,881 | 3,363 | 3,262 | 12,657 | 6,862 | ||||||||||
| Combined unit cost per tonne - C$ | 23.22 | 15.58 | 20.90 | 20.39 | 21.38 | ||||||||||
| Reconciliation to IFRS: | |||||||||||||||
| Unit cost | 48.0 | 38.4 | 49.8 | 188.5 | 108.3 | ||||||||||
| Freight & other | 2.4 | 3.0 | 4.7 | 13.2 | 8.4 | ||||||||||
| Share-based compensation expenses | 0.4 | - | - | 0.4 | - | ||||||||||
| Change in product inventory | (3.0 | ) | (0.5 | ) | 8.5 | 3.8 | 8.5 | ||||||||
| Inventory adjustments | 1.2 | - | - | 1.2 | - | ||||||||||
| Royalties | 0.6 | 1.6 | (0.4 | ) | 3.6 | (0.2 | ) | ||||||||
| Depreciation and amortization | 11.8 | 12.5 | 5.5 | 50.1 | 11.7 | ||||||||||
| Cost of sales2 | 61.4 | 55.0 | 68.1 | 260.8 | 136.7 | ||||||||||
1 G&A as per cash cost reconciliation above
2 As per consolidated financial statements.
| Manitoba | Three Months Ended | Year Ended | ||||||||||||||
| (in millions except tonnes ore milled and unit cost per tonne) | ||||||||||||||||
| Combined unit cost per tonne processed | Dec. 31, 2024 | Sep. 30, 2024 | Dec. 31, 2023 | Dec. 31, 2024 | Dec. 31, 2023 | |||||||||||
| Mining | 42.6 | 40.1 | 40.3 | 169.4 | 161.1 | |||||||||||
| Milling | 16.6 | 16.9 | 15.3 | 65.2 | 62.3 | |||||||||||
| G&A1 | 12.8 | 12.4 | 8.4 | 47.7 | 34.7 | |||||||||||
| Less: Other G&A related to profit sharing costs | (4.0 | ) | (5.4 | ) | (1.5 | ) | (17.0 | ) | (6.7 | ) | ||||||
| Unit cost | 68.0 | 64.0 | 62.5 | 265.3 | 251.4 | |||||||||||
| USD/CAD implicit exchange rate | 1.39 | 1.36 | 1.36 | 1.37 | 1.35 | |||||||||||
| Unit cost - C$ | 95.0 | 87.4 | 85.0 | 363.5 | 339.2 | |||||||||||
| Tonnes ore milled | 407,596 | 413,919 | 393,837 | 1,608,708 | 1,562,479 | |||||||||||
| Combined unit cost per tonne - C$ | 233 | 211 | 216 | 226 | 217 | |||||||||||
| Reconciliation to IFRS: | ||||||||||||||||
| Unit cost | 68.0 | 64.0 | 62.5 | 265.3 | 251.4 | |||||||||||
| Freight & other | 7.0 | 7.3 | 6.8 | 25.4 | 23.6 | |||||||||||
| Other G&A related to profit sharing | 4.0 | 5.4 | 1.5 | 17.0 | 6.7 | |||||||||||
| Share-based compensation expenses | 0.2 | 0.2 | 0.2 | 1.0 | 0.5 | |||||||||||
| Inventory adjustments | 0.3 | 1.4 | 1.4 | 1.7 | 2.3 | |||||||||||
| Past service cost | 1.5 | 2.8 | - | 4.3 | - | |||||||||||
| Change in product inventory | (0.3 | ) | 1.2 | 12.8 | (2.0 | ) | 1.8 | |||||||||
| Royalties | - | - | - | - | 0.1 | |||||||||||
| Depreciation and amortization | 27.2 | 27.7 | 30.6 | 106.2 | 104.3 | |||||||||||
| Cost of sales2 | 107.9 | 110.0 | 115.8 | 418.9 | 390.7 | |||||||||||
1 G&A as per cash cost reconciliation above.
2 As per consolidated financial statements.
|
TSX, NYSE - HBM 2025 No. 5 |
Forward-Looking Information
This news release contains forward-looking information within the meaning of applicable Canadian and United States securities legislation. All information contained in this news release, other than statements of current and historical fact, is forward-looking information. Often, but not always, forward-looking information can be identified by the use of words such as "plans", "expects", "budget", "guidance", "scheduled", "estimates", "forecasts", "strategy", "target", "intends", "objective", "goal", "understands", "anticipates" and "believes" (and variations of these or similar words) and statements that certain actions, events or results "may", "could", "would", "should", "might" "occur" or "be achieved" or "will be taken" (and variations of these or similar expressions). All of the forward-looking information in this news release is qualified by this cautionary note.
Forward-looking information includes, but is not limited to, statements with respect to the company's production, cost and capital and exploration expenditure guidance, expectations regarding reductions in discretionary spending and capital expenditures, the ability of the company to stabilize and optimize the Copper Mountain mine operation, the implementation of stripping strategies and the expected benefits therefrom, the estimated timelines and pre-requisites for sanctioning the Copper World project and the pursuit of a potential minority joint venture partner, the possibility of and expectations regarding the results of any challenges to the permits for the Copper World project, the expected benefits of the sanctioning of the Copper World project, the expected benefits of Manitoba growth initiatives, including the use of the exploration drift at the 1901 deposit, the potential utilization of excess capacity at the Stall mill, and the advancement of the company's exploration partnership with Marubeni, the anticipated use of proceeds from the flow-through financing completed during the fourth quarter of 2024, the company's future deleveraging strategies and the company's ability to deleverage and repay debt as needed, expectations regarding the company's cash balance and liquidity, expectations regarding the ability to conduct exploration work and execute on exploration programs on its properties and to advance related drill plans, including the advancement of the exploration program at Maria Reyna and Caballito and the status of the related drill permit application process, the ability to continue mining higher-grade ore in the Pampacancha pit and the company's expectations resulting therefrom, expectations regarding the ability for the company to further reduce greenhouse gas emissions, the company's evaluation and assessment of opportunities to reprocess tailings using various metallurgical technologies, expectations regarding the prospective nature of the Maria Reyna and Caballito properties, the anticipated impact of brownfield and greenfield growth projects on the company's performance, anticipated expansion opportunities and extension of mine life in Snow Lake and the ability for Hudbay to find a new anchor deposit near the company's Snow Lake operations, anticipated future drill programs and exploration activities and any results expected therefrom, anticipated mine plans, anticipated metals prices and the anticipated sensitivity of the company's financial performance to metals prices, events that may affect its operations and development projects, anticipated cash flows from operations and related liquidity requirements, the anticipated effect of external factors on revenue, such as commodity prices, estimation of mineral reserves and resources, mine life projections, reclamation costs, economic outlook, government regulation of mining operations, and business and acquisition strategies. Forward-looking information is not, and cannot be, a guarantee of future results or events. Forward-looking information is based on, among other things, opinions, assumptions, estimates and analyses that, while considered reasonable by the company at the date the forward-looking information is provided, inherently are subject to significant risks, uncertainties, contingencies and other factors that may cause actual results and events to be materially different from those expressed or implied by the forward-looking information.
The material factors or assumptions that Hudbay has identified and were applied in drawing conclusions or making forecasts or projections set out in the forward-looking information include, but are not limited to:
|
TSX, NYSE - HBM 2025 No. 5 |
The risks, uncertainties, contingencies and other factors that may cause actual results to differ materially from those expressed or implied by the forward-looking information may include, but are not limited to, risks related to the failure to effectively complete the stabilization, optimization and expansion of the Copper Mountain mine operations, political and social risks in the regions Hudbay operates, including the navigation of the complex political and social environment in Peru, risks generally associated with the mining industry and the current geopolitical environment, including future commodity prices, the potential implementation or expansion of tariffs, currency and interest rate fluctuations, energy and consumable prices, supply chain constraints and general cost escalation in the current inflationary environment, uncertainties related to the development and operation of the company's projects, the risk of an indicator of impairment or impairment reversal relating to a material mineral property, risks related to the Copper World project, including in relation to project delivery and financing risks, risks related to the Lalor mine plan, including the ability to convert inferred mineral resource estimates to higher confidence categories, dependence on key personnel and employee and union relations, risks related to political or social instability, unrest or change, risks in respect of Indigenous and community relations, rights and title claims, operational risks and hazards, including the cost of maintaining and upgrading the company's tailings management facilities and any unanticipated environmental, industrial and geological events and developments and the inability to insure against all risks, failure of plant, equipment, processes, transportation and other infrastructure to operate as anticipated, compliance with government and environmental regulations, including permitting requirements and anti-bribery legislation, depletion of the company's reserves, volatile financial markets and interest rates that may affect the company's ability to obtain additional financing on acceptable terms, the failure to obtain required approvals or clearances from government authorities on a timely basis, uncertainties related to the geology, continuity, grade and estimates of mineral reserves and resources, and the potential for variations in grade and recovery rates, uncertain costs of reclamation activities, the company's ability to comply with its pension and other post-retirement obligations, the company's ability to abide by the covenants in its debt instruments and other material contracts, tax refunds, hedging transactions, as well as the risks discussed under the heading "Risk Factors" in the company's most recent Annual Information Form and under the heading "Financial Risk Management" in the company's most recent management's discussion and analysis, each of which is available on the company's SEDAR+ profile at www.sedarplus.ca and the company's EDGAR profile at www.sec.gov.
|
TSX, NYSE - HBM 2025 No. 5 |
Should one or more risk, uncertainty, contingency or other factor materialize or should any factor or assumption prove incorrect, actual results could vary materially from those expressed or implied in the forward-looking information. Accordingly, you should not place undue reliance on forward-looking information. Hudbay does not assume any obligation to update or revise any forward-looking information after the date of this news release or to explain any material difference between subsequent actual events and any forward-looking information, except as required by applicable law.
Note to United States Investors
This news release has been prepared in accordance with the requirements of the securities laws in effect in Canada, which may differ materially from the requirements of United States securities laws applicable to U.S. issuers.
About Hudbay
Hudbay (TSX, NYSE: HBM) is a copper-focused critical minerals company with three long-life operations and a world-class pipeline of copper growth projects in tier-one mining jurisdictions of Canada, Peru and the United States.
Hudbay's operating portfolio includes the Constancia mine in Cusco (Peru), the Snow Lake operations in Manitoba (Canada) and the Copper Mountain mine in British Columbia (Canada). Copper is the primary metal produced by the company, which is complemented by meaningful gold production and by-product zinc, silver and molybdenum. Hudbay's growth pipeline includes the Copper World project in Arizona (United States), the Mason project in Nevada (United States), the Llaguen project in La Libertad (Peru) and several expansion and exploration opportunities near its existing operations.
The value Hudbay creates and the impact it has is embodied in its purpose statement: "We care about our people, our communities and our planet. Hudbay provides the metals the world needs. We work sustainably, transform lives and create better futures for communities." Hudbay's mission is to create sustainable value and strong returns by leveraging its core strengths in community relations, focused exploration, mine development and efficient operations.
|
TSX, NYSE - HBM 2025 No. 5 |
For further information, please contact:
Candace Brûlé
Vice President, Investor Relations, Financial Analysis and External Communications
(416) 814-4387
investor.relations@hudbay.com
____________________
i Adjusted net earnings (loss) - attributable to owners and adjusted net earnings (loss) per share - attributable to owners, adjusted EBITDA, cash cost, sustaining cash cost, all-in sustaining cash cost per pound of copper produced, net of by-product credits, cash cost, sustaining cash cost per ounce of gold produced, net of by-product credits, combined unit cost, net debt and net debt to adjusted EBITDA ratio are non-GAAP financial performance measures with no standardized definition under IFRS. For further information and a detailed reconciliation, please see the discussion under the "Non-GAAP Financial Performance Measures" section of this news release.
ii Calculated using the midpoint of the guidance range.