UNITED STATES
SECURITIES AND EXCHANGE COMMISSION
Washington, D.C. 20549
FORM 6-K
REPORT OF FOREIGN PRIVATE ISSUER PURSUANT TO RULE 13a-16 OR 15d-16
UNDER THE SECURITIES EXCHANGE ACT OF 1934
For the month of May 2023
Commission File Number: 001-33153
ENDEAVOUR SILVER CORP.
(Translation of registrant's name into English)
#1130-609 Granville Street
Vancouver, British Columbia, Canada V7Y 1G5
(Address of principal executive offices)
Indicate by check mark whether the registrant files or will file annual reports under cover Form 20-F or Form 40-F.
[ ] Form 20-F [ x ] Form 40-F
Indicate by check mark if the registrant is submitting the Form 6-K in paper as permitted by Regulation S-T Rule 101(b)(1): [ ]
Indicate by check mark if the registrant is submitting the Form 6-K in paper as permitted by Regulation S-T Rule 101(b)(7): [ ]
SUBMITTED HEREWITH
Exhibits
SIGNATURES
Pursuant to the requirements of the Securities Exchange Act of 1934, the registrant has duly caused this report to be signed on its behalf by the undersigned, thereunto duly authorized.
| Endeavour Silver Corp. | ||
| (Registrant) | ||
| Date: May 10, 2023 | By: | /s/ Daniel Dickson |
| Daniel Dickson | ||
| Title: | CEO | |
ENDEAVOUR SILVER CORP.
CONDENSED CONSOLIDATED INTERIM STATEMENTS OF FINANCIAL POSITION
(unaudited - prepared by management)
(expressed in thousands of US dollars)
| March 31, | December 31, | ||||||
| Notes | 2023 | 2022 | |||||
| ASSETS | |||||||
| Current assets | |||||||
| Cash and cash equivalents | $ | 61,650 | $ | 83,391 | |||
| Other investments | 4 | 13,132 | 8,647 | ||||
| Accounts and other receivables | 5 | 15,610 | 13,136 | ||||
| Income tax receivable | 1,861 | 4,024 | |||||
| Inventories | 6 | 23,305 | 19,184 | ||||
| Prepaid expenses | 22,304 | 16,951 | |||||
| Loans receivable | 8 (c) | 1,000 | 1,000 | ||||
| Total current assets | 138,862 | 146,333 | |||||
| Non-current deposits | 497 | 565 | |||||
| Non-current income tax receivable | 3,570 | 3,570 | |||||
| Non-current other investments | 4 | - | 1,388 | ||||
| Non-current IVA receivable | 5 | 12,055 | 10,154 | ||||
| Non-current loans receivable | 8 (c) | 2,722 | 2,729 | ||||
| Right-of-use leased assets | 809 | 806 | |||||
| Mineral properties, plant and equipment | 8, 9 | 243,430 | 233,892 | ||||
| Total assets | $ | 401,945 | $ | 399,437 | |||
| LIABILITIES AND SHAREHOLDERS' EQUITY | |||||||
| Current liabilities | |||||||
| Accounts payable and accrued liabilities | $ | 35,453 | $ | 39,831 | |||
| Income taxes payable | 4,677 | 6,616 | |||||
| Loans payable | 9 | 5,607 | 6,041 | ||||
| Lease liabilities | 312 | 261 | |||||
| Total current liabilities | 46,049 | 52,749 | |||||
| Loans payable | 9 | 7,329 | 8,469 | ||||
| Lease liabilities | 786 | 812 | |||||
| Provision for reclamation and rehabilitation | 8,766 | 7,601 | |||||
| Deferred income tax liability | 14,620 | 12,944 | |||||
| Other non-current liabilities | 1,020 | 968 | |||||
| Total liabilities | 78,570 | 83,543 | |||||
| Shareholders' equity | |||||||
| Common shares, unlimited shares authorized, no par value, issued, issuable | |||||||
| and outstanding 191,276,399 shares (Dec 31, 2022 - 189,995,563 shares) | Page 4 | 661,029 | 657,866 | ||||
| Contributed surplus | Page 4 | 3,973 | 6,115 | ||||
| Retained earnings (deficit) | Page 4 | (341,627 | ) | (348,087 | ) | ||
| Total shareholders' equity | 323,375 | 315,894 | |||||
| Total liabilities and shareholders' equity | $ | 401,945 | $ | 399,437 | |||
The accompanying notes are an integral part of these consolidated financial statements.
Approved on behalf of the Board:
| /s/ Margaret Beck | /s/ Daniel Dickson | |
| Director | Director |
ENDEAVOUR SILVER CORP.
CONDENSED CONSOLIDATED INTERIM STATEMENTS OF COMPREHENSIVE EARNINGS (LOSS)
(unaudited - prepared by management)
(expressed in thousands of US dollars, except for shares and per share amounts)
| Three months ended | |||||||
| March 31, | March 31, | ||||||
| Notes | 2023 | 2022 | |||||
| Revenue | 11 | $ | 55,461 | $ | 57,740 | ||
| Cost of sales: | |||||||
| Direct production costs | 26,516 | 26,721 | |||||
| Royalties | 6,535 | 4,317 | |||||
| Share-based payments | 10 (b)(c) | 132 | 127 | ||||
| Depreciation, depletion and amortization | 6,253 | 6,306 | |||||
| 39,436 | 37,471 | ||||||
| Mine operating earnings | 16,025 | 20,269 | |||||
| Expenses: | |||||||
| Exploration and evaluation | 12 | 4,164 | 3,216 | ||||
| General and administrative | 13 | 4,917 | 4,297 | ||||
| Care and maintenance costs | - | 190 | |||||
| 9,081 | 7,703 | ||||||
| Operating earnings | 6,944 | 12,566 | |||||
| Finance costs | 400 | 298 | |||||
| Other income (expense): | |||||||
| Foreign exchange gain (loss) | 1,889 | 811 | |||||
| Gain on asset disposal | 62 | - | |||||
| Investment and other | 4,082 | 5,820 | |||||
| 6,033 | 6,631 | ||||||
| Earnings before income taxes | 12,577 | 18,899 | |||||
| Income tax expense: | |||||||
| Current income tax expense | 4,445 | 1,015 | |||||
| Deferred income tax expense | 1,676 | 6,222 | |||||
| 6,121 | 7,237 | ||||||
| Net earnings and comprehensive earnings for the period | $ | 6,456 | $ | 11,662 | |||
| Basic earnings per share based on net earnings | $ | 0.03 | $ | 0.07 | |||
| Diluted earnings per share based on net earnings | 10(f) | $ | 0.03 | $ | 0.07 | ||
| Basic weighted average number of shares outstanding | 190,274,768 | 171,557,220 | |||||
| Diluted weighted average number of shares outstanding | 10(f) | 192,295,971 | 174,438,202 | ||||
The accompanying notes are an integral part of these consolidated financial statements.
ENDEAVOUR SILVER CORP.
CONDENSED CONSOLIDATED INTERIM STATEMENTS OF CHANGES IN SHAREHOLDERS' EQUITY
(unaudited - prepared by management)
(expressed in thousands of US dollars, except share amounts)
| Notes | Number of shares | Share Capital |
Contributed Surplus |
Retained Earnings (Deficit) |
Total Shareholders' Equity |
|||||||||||
| Balance at December 31, 2021 | 170,537,307 | $ | 585,406 | $ | 6,331 | $ | (354,330 | ) | $ | 237,407 | ||||||
| Public equity offerings, net of issuance costs | 10 (a) | 9,293,150 | 43,204 | - | - | 43,204 | ||||||||||
| Exercise of options | 10 (b) | 66,700 | 179 | (49 | ) | - | 130 | |||||||||
| Settlement of performance and deferred share units | 10 (c) | 664,170 | 806 | (2,703 | ) | - | (1,897 | ) | ||||||||
| Share-based compensation | 10 (b)(c) | - | - | 1,527 | - | 1,527 | ||||||||||
| Earnings for the period | - | - | - | 11,662 | 11,662 | |||||||||||
| Balance at March 31, 2022 | 180,561,327 | $ | 629,595 | $ | 5,106 | $ | (342,668 | ) | $ | 292,033 | ||||||
| Public equity offerings, net of issuance costs | 10 (a) | - | (88 | ) | - | - | (88 | ) | ||||||||
| Issued on acquisition of mineral properties | 8 (b) | 8,577,380 | 25,589 | - | - | 25,589 | ||||||||||
| Exercise of options | 10 (b) | 502,500 | 2,198 | (721 | ) | - | 1,477 | |||||||||
| Issued and issuable for performance share units | 10 (c) | 350,829 | 555 | (555 | ) | - | - | |||||||||
| Issued for deferred share units | 10 (d) | 3,527 | 17 | (17 | ) | - | - | |||||||||
| Share-based compensation | 10 (b)(c) | - | - | 2,350 | - | 2,350 | ||||||||||
| Canceled options | 10 (b) | - | - | (42 | ) | 42 | - | |||||||||
| Settlement of performance and deferred share units | 13 (c) | - | - | (6 | ) | - | (6 | ) | ||||||||
| Loss for the period | - | - | - | (5,461 | ) | (5,461 | ) | |||||||||
| Balance at December 31, 2022 | 189,995,563 | $ | 657,866 | $ | 6,115 | $ | (348,087 | ) | $ | 315,894 | ||||||
| Exercise of options | 10 (b) | 869,000 | 2,758 | (946 | ) | - | 1,812 | |||||||||
| Settlement of performance and deferred share units | 10 (c) | 411,836 | 405 | (2,817 | ) | - | (2,412 | ) | ||||||||
| Share-based compensation | 10 (b)(c) | - | - | 1,625 | - | 1,625 | ||||||||||
| Canceled options | 10 (b) | - | - | (4 | ) | 4 | - | |||||||||
| Earnings for the period | - | - | - | 6,456 | 6,456 | |||||||||||
| Balance at March 31, 2023 | 191,276,399 | $ | 661,029 | $ | 3,973 | $ | (341,627 | ) | $ | 323,375 |
The accompanying notes are an integral part of these consolidated financial statements.
ENDEAVOUR SILVER CORP.
CONDENSED CONSOLIDATED INTERIM STATEMENTS OF CASH FLOWS
(unaudited - prepared by management)
(expressed in thousands of US dollars)
| Three months ended | |||||||
| March 31, | March 31, | ||||||
| Notes | 2023 | 2022 | |||||
| Operating activities | |||||||
| Net earnings (loss) for the period | $ | 6,456 | $ | 11,662 | |||
| Items not affecting cash: | |||||||
| Share-based compensation | 10 (b)(c) | 1,625 | 1,527 | ||||
| Depreciation, depletion and amortization | 8 | 6,619 | 6,462 | ||||
| Deferred income tax expense (recovery) | 1,676 | 6,222 | |||||
| Unrealized foreign exchange loss (gain) | 1,095 | (136 | ) | ||||
| Finance costs | 400 | 298 | |||||
| Accretion of loans receivable | (93 | ) | - | ||||
| Loss (gain) on asset disposal | (62 | ) | (59 | ) | |||
| Loss (gain) on other investments | 4 | (3,097 | ) | (5,357 | ) | ||
| Performance and deferred share units settled in cash | (2,118 | ) | - | ||||
| Net changes in non-cash working capital | 14 | (12,902 | ) | 1,114 | |||
| Cash from (used in) operating activities | (401 | ) | 21,733 | ||||
| Investing activities | |||||||
| Proceeds on disposal of property, plant and equipment | - | 34 | |||||
| Mineral properties, plant and equipment | 8 | (20,717 | ) | (12,997 | ) | ||
| Purchase of other investments | - | (1,371 | ) | ||||
| Redemption of (investment in) non-current deposits | 68 | 2 | |||||
| Cash used in investing activities | (20,649 | ) | (14,332 | ) | |||
| Financing activities | |||||||
| Repayment of loans payable | 9 | (1,574 | ) | (1,083 | ) | ||
| Repayment of lease liabilities | (63 | ) | (52 | ) | |||
| Interest paid | 9 | (239 | ) | (177 | ) | ||
| Public equity offerings | 10 (a) | - | 46,001 | ||||
| Exercise of options | 10 (b) | 1,812 | 130 | ||||
| Proceeds from loans receivable | 100 | - | |||||
| Share issuance costs | 10 (a) | - | (2,797 | ) | |||
| Performance and deferred share units witholding tax settlement | (294 | ) | (1,897 | ) | |||
| Cash from (used in) financing activities | (258 | ) | 40,125 | ||||
| Effect of exchange rate change on cash and cash equivalents | (433 | ) | 185 | ||||
| Increase (decrease) in cash and cash equivalents | (21,308 | ) | 47,526 | ||||
| Cash and cash equivalents, beginning of the period | 83,391 | 103,303 | |||||
| Cash and cash equivalents, end of the period | $ | 61,650 | $ | 151,014 | |||
Supplemental cash flow information (Note 14)
The accompanying notes are an integral part of these consolidated financial statements.
ENDEAVOUR SILVER CORP.
NOTES TO THE CONDENSED CONSOLIDATED INTERIM FINANCIAL STATEMENTS
Three months ended March 31, 2023 and 2022
(unaudited – prepared by management)
(expressed in thousands of US dollars, unless otherwise stated)
1. CORPORATE INFORMATION
Endeavour Silver Corp. (the "Company" or "Endeavour Silver") is a corporation governed by the Business Corporations Act (British Columbia, Canada). The Company is engaged in silver mining in Mexico and related activities including acquisition, exploration, development, extraction, processing, refining and reclamation. The Company is also engaged in exploration activities in Chile and United States. The address of the registered office is #1130 - 609 Granville Street, Vancouver, B.C., V7Y 1G5.
2. BASIS OF PRESENTATION
These condensed consolidated interim financial statements have been prepared in accordance with IAS 34 Interim Financial Reporting and do not include all of the information required for full annual financial statements and should be read in conjunction with the Company's consolidated financial statements as at and for the year ended December 31, 2022.
The Board of Directors approved the consolidated financial statements for issue on May 8, 2023.
The preparation of consolidated financial statements requires management to make judgments, estimates and assumptions that affect the application of accounting policies and the reported amounts of assets, liabilities, income and expenses. Actual results may differ from these estimates.
These consolidated financial statements are presented in the Company's functional currency of US dollars and include the accounts of the Company and its wholly owned subsidiaries: Endeavour Management Corp., Endeavour Gold Corporation S.A. de C.V., EDR Silver de Mexico S.A. de C.V. SOFOM , Minera Santa Cruz Y Garibaldi S.A de C.V., Metalurgica Guanaceví S.A. de C.V., Minera Plata Adelante S.A. de C.V., Refinadora Plata Guanaceví S.A. de C. V., Minas Bolañitos S. A. de C.V., Guanaceví Mining Services S.A. de C.V., Recursos Humanos Guanaceví S.A. de C.V., Recursos Villalpando S.A. de C.V., Servicios Administrativos Varal S.A. de C.V., Minera Plata Carina SPA, MXRT Holding Ltd., Compania Minera del Cubo S.A. de C.V., Minas Lupycal S.A. de C.V., Metales Interamericanos S.A. de C.V., Oro Silver Resources Ltd., Minera Oro Silver de Mexico S.A. de C.V. disposed of on September 9, 2022 (Note 8 (c)), Terronera Precious Metals S.A. de C.V, Minera Pitarrilla S.A. de C.V. (formerly SSR Durango S.A de C.V.), Endeavour USA Holdings and Endeavour USA Corp. All intercompany transactions and balances have been eliminated upon consolidation of these subsidiaries.
3. SIGNIFICANT ACCOUNTING POLICIES
The accounting policies applied in these condensed consolidated interim financial statements are the same as those applied in
the Company's annual audited consolidated financial statements as at and for the year ended December 31, 2022.
In preparing these condensed consolidated interim financial statements, the significant judgements made by management in applying the Company's accounting policies and the key sources of estimation uncertainty were the same as those that were applied to the annual audited consolidated financial statements for the year ended December 31, 2022 and should be read in conjunction with the Company's annual audited consolidated financial statements for the year ended December 31, 2022.
ENDEAVOUR SILVER CORP.
NOTES TO THE CONDENSED CONSOLIDATED INTERIM FINANCIAL STATEMENTS
Three months ended March 31, 2023 and 2022
(unaudited – prepared by management)
(expressed in thousands of US dollars, unless otherwise stated)
4. OTHER INVESTMENTS
| March 31, | December 31, | ||||||
| Note | 2023 | 2022 | |||||
| Balance at beginning of the period | $ | 10,035 | $ | 11,200 | |||
| Investment in marketable securities, at cost | - | 2,305 | |||||
| Gain (loss) on marketable securities | 3,097 | (3,470 | ) | ||||
| Balance at end of the period | 13,132 | 10,035 | |||||
| Less: Non-Current portion | - | 1,388 | |||||
| Current other investments | $ | 13,132 | $ | 8,647 |
The Company holds $12,971 in marketable securities that are classified as Level 1 and $161 in marketable securities that are classified as Level 3 in the fair value hierarchy (Note 17) and are classified as financial assets measured at FVTPL. Marketable securities classified as Level 3 in the fair value hierarchy are share purchase warrants and the fair value of the warrants at each period end has been estimated using the Black-Scholes Option Pricing Model.
During the year ended December 31, 2022, the Company acquired 6,600,000 units of Max Resource Corp ("Max") through a private placement with each unit consisting of one common share and ½ share purchase warrant. At the same time, the Company entered into a collaboration agreement with Max under which acquired shares and warrants of Max have certain transfer restrictions and cannot be liquidated before March 28, 2024. Accordingly, at inception these shares and warrants were classified as non-current and are classified as such in the comparative figures.
5. ACCOUNTS AND OTHER RECEIVABLES
| March 31, | December 31, | ||||||
| Note | 2023 | 2022 | |||||
| Trade receivables (1) | $ | 5,030 | $ | 4,385 | |||
| IVA receivable (2) | 16 | 9,121 | 8,062 | ||||
| Other receivables | 1,459 | 689 | |||||
| $ | 15,610 | $ | 13,136 |
(1) The trade receivables consist of receivables from provisional silver and gold sales from the Bolañitos mine. The fair value of receivables arising from concentrate sales contracts that contain provisional pricing mechanisms is determined using the appropriate period end closing prices on the measurement date from the exchange that is the principal active market for the particular metal. As such, these receivables, which meet the definition of an embedded derivative, are classified within Level 2 of the fair value hierarchy (Note 17).
ENDEAVOUR SILVER CORP.
NOTES TO THE CONDENSED CONSOLIDATED INTERIM FINANCIAL STATEMENTS
Three months ended March 31, 2023 and 2022
(unaudited – prepared by management)
(expressed in thousands of US dollars, unless otherwise stated)
(2) The Company's Mexican subsidiaries pay value added tax, Impuesto al Valor Agregado ("IVA"), on the purchase and sale of goods and services. The net amount paid is recoverable but is subject to review and assessment by the tax authorities. The Company regularly files the required IVA returns and all supporting documentation with the tax authorities, however, the Company has been advised that certain IVA amounts receivable from the tax authorities are being withheld pending completion of the authorities' audit of certain of the Company's third-party suppliers. Under Mexican law the Company has legal rights to those IVA refunds and the results of the third-party audits should have no impact on refunds. A smaller portion of IVA refund requests are from time to time improperly denied based on the alleged lack of compliance of certain formal requirements and information returns by the Company's third-party suppliers. The Company takes necessary legal action on the delayed refunds as well as any improperly denied refunds.
These delays and denials have occurred in Refinadora Plata Guanaceví S.A. de C.V. ("Guanaceví,"). At March 31, 2023, Guanaceví holds $7,448 in IVA receivables which the Company and its advisors have determined to be recoverable from tax authorities (December 31, 2022 $6,402 respectively).
As at March 31, 2023, the total IVA receivable of $21,176 (December 31, 2022 - $18,216) has been allocated between the current portion of $9,121, which is included in accounts receivable, and a non-current portion of $12,055 (December 31, 2022 - $8,062 and $10,154 respectively). The non-current portion is composed of Guanacevi of $1,625, which is currently under appeal and are unlikely to be received in the next 12 months. The remaining $10,430 is IVA receivable for Terronera, which may not become recoverable until Terronera recognizes revenue for tax purposes.
The Company is in regular contact with the tax authorities in respect of its IVA filings and believes the full amount of its IVA receivables will ultimately be received; however, the timing of recovery of these amounts and the nature and extent of any adjustments to the Company's IVA receivables remains uncertain.
6. INVENTORIES
| March 31, | December 31, | |||||
| 2023 | 2022 | |||||
| Warehouse inventory(1) | $ | 11,709 | $ | 9,682 | ||
| Stockpile inventory | 3,052 | 2,389 | ||||
| Finished goods inventory | 7,381 | 6,138 | ||||
| Work in process inventory | 1,163 | 975 | ||||
| $ | 23,305 | $ | 19,184 |
(1) The warehouse inventory balances at March 31, 2023 and December 31, 2022 are net of a write down to net realizable value of $1,179 at the Guanacevi mine and $1,038 at the Bolañitos mine.
ENDEAVOUR SILVER CORP.
NOTES TO THE CONDENSED CONSOLIDATED INTERIM FINANCIAL STATEMENTS
Three months ended March 31, 2023 and 2022
(unaudited – prepared by management)
(expressed in thousands of US dollars, unless otherwise stated)
7. RELATED PARTY TRANSACTIONS
The Company previously shared common administrative services and office space with a company related by virtue of a former common director and from time to time incurred third party costs on behalf of related parties on a full cost recovery basis. The agreement for sharing office space and administrative services ended in May 2022. The charges for these costs totaled $nil for the three months ended March 31, 2023 (March 31, 2022 - $6). The Company has a $nil net receivable related to these costs as of March 31, 2023 (December 31, 2022 - $ nil).
The Company was charged $67 for legal services for the three months ended March 31, 2023 by a legal firm in which the Company's corporate secretary is a partner (March 31, 2022 - $276). The Company has $40 payable to the legal firm as at March 31, 2023 (December 31, 2022 - $10).
8. MINERAL PROPERTIES, PLANT AND EQUIPMENT
(a) Mineral properties, plant and equipment comprise:
| Mineral | Machinery & | Transport & | ||||||||||||||||
| properties | Plant | equipment | Building | office equipment | Total | |||||||||||||
| Cost | ||||||||||||||||||
| Balance at December 31, 2021 | $ | 511,399 | $ | 98,185 | $ | 87,140 | $ | 13,445 | $ | 12,045 | $ | 722,214 | ||||||
| Additions | 103,635 | 5,217 | 19,877 | 7,573 | 1,978 | 138,280 | ||||||||||||
| Disposals | (14,966 | ) | (6,542 | ) | (757 | ) | (662 | ) | (746 | ) | (23,673 | ) | ||||||
| Balance at December 31, 2022 | $ | 600,068 | $ | 96,860 | $ | 106,260 | $ | 20,356 | $ | 13,277 | $ | 836,821 | ||||||
| Additions | 14,382 | 616 | 604 | 997 | 424 | 17,023 | ||||||||||||
| Disposals | - | - | (117 | ) | - | (38 | ) | (155 | ) | |||||||||
| Balance at March 31, 2023 | $ | 614,450 | $ | 97,476 | $ | 106,747 | $ | 21,353 | $ | 13,663 | $ | 853,689 | ||||||
| Accumulated amortization and impairment | ||||||||||||||||||
| Balance at December 31, 2021 | $ | 444,769 | $ | 88,208 | $ | 49,445 | $ | 9,194 | $ | 8,401 | $ | 600,017 | ||||||
| Amortization | 14,786 | 2,268 | 5,301 | 346 | 1,205 | 23,906 | ||||||||||||
| Disposals | (13,574 | ) | (6,442 | ) | (326 | ) | (159 | ) | (493 | ) | (20,994 | ) | ||||||
| Balance at December 31, 2022 | $ | 445,981 | $ | 84,034 | $ | 54,420 | $ | 9,381 | $ | 9,113 | $ | 602,929 | ||||||
| Amortization | 5,085 | 464 | 1,457 | 100 | 401 | 7,507 | ||||||||||||
| Disposals | - | - | (177 | ) | - | - | (177 | ) | ||||||||||
| Balance at March 31, 2023 | $ | 451,066 | $ | 84,498 | $ | 55,700 | $ | 9,481 | $ | 9,514 | $ | 610,259 | ||||||
| Net book value | ||||||||||||||||||
| At December 31, 2022 | $ | 154,087 | $ | 12,826 | $ | 51,840 | $ | 10,975 | $ | 4,164 | $ | 233,892 | ||||||
| At March 31, 2023 | $ | 163,384 | $ | 12,978 | $ | 51,047 | $ | 11,872 | $ | 4,149 | $ | 243,430 | ||||||
Included in mineral properties is $80,400 in acquisition costs for exploration properties and $34,149 for acquisition and development costs for development properties (December 31, 2022 - $80,155 and $26,669 respectively).
As of March 31, 2023, the Company has $15,385 committed for capital equipment purchases.
ENDEAVOUR SILVER CORP.
NOTES TO THE CONDENSED CONSOLIDATED INTERIM FINANCIAL STATEMENTS
Three months ended March 31, 2023 and 2022
(unaudited – prepared by management)
(expressed in thousands of US dollars, unless otherwise stated)
(b) Acquisition of the Pitarrilla Project
On January 17, 2022, the Company entered into a definitive agreement to purchase the Pitarrilla project in Durango State, Mexico, by acquiring all of the issued and outstanding shares of Minera Pitarrilla S.A. de C. V. (formerly SSR Durango, S.A. de C.V.) from SSR Mining Inc. ("SSR") for total consideration of $70 million (consisting of $35 million in Company's shares and a further $35 million in cash or in the Company's shares at the election of SSR and as agreed to by the Company) and a 1.25% net smelter returns royalty. SSR retains a 1.25% NSR Royalty in Pitarrilla. Endeavour will have matching rights to purchase the NSR Royalty in the event SSR proposes to sell it.
The acquisition was completed on July 6, 2022. Total consideration included 8,577,380 shares of the Company issued on July 6, 2022 and a $35.1 million cash payment. Fair value of the 8,577,380 common shares issued on July 6, 2022 was $25,589 at CAN$3.89 per share. The deemed value of the common shares issued, at the time of agreement, was $34.9 million. The shares are subject to a hold period of four months and one day following the date of closing.
The 4,950-hectares Pitarrilla exploration project is located in northern Mexico, consists of five concessions, has significant infrastructure in place and has access to utilities.
The acquisition is outside the scope of IFRS 3 Business Combinations, as the Pitarrilla project did not meet the definition of a business, and as such, the transaction was accounted for as an asset acquisition. The purchase price is allocated to the underlying assets acquired and liabilities assumed, based upon their estimated fair values at the date of acquisition.
| Pitarilla Project purchase consideration: | |||
| Common shares issued | $ | 25,589 | |
| Consideration paid in cash | 35,067 | ||
| Acquisition costs | 881 | ||
| Total consideration | $ | 61,537 |
| Fair value summary of assets acquired and liabilities assumed: | |||
| Assets: | |||
| Current assets | $ | 288 | |
| Buildings and equipment | 652 | ||
| Mineral properties | 60,811 | ||
| Total assets | $ | 61,751 | |
| Liabilities: | |||
| Accounts payable and accrued liabilities | 170 | ||
| Reclamation liability | 44 | ||
| Total liabilities | $ | 214 | |
| Net identifiable assets acquired | $ | 61,537 |
(c) El Compas, Mexico
On September 9, 2022, the Company entered into an agreement to sell its 100% interest in Minera Oro Silver de Mexico, S.A. de C.V. ("MOS") to Grupo ROSGO, S.A. de C.V., ("Grupo ROSGO"). Minera Oro Silver holds the El Compas property and the lease on the La Plata processing plant in Zacatecas, Mexico.
Pursuant to the agreement, Grupo ROSGO assumed the Minera Oro Silver loan payable to the Company, in the amount of $5,000 payable in cash payments over a five year period with an initial payment of $250 and subsequent Instalment payments of $500 every six months other than the third payment, which will be $750. The payments are secured by a pledge of the shares of MOS. As of March 31, 2023, the carrying value of the loan receivable is $3,822, consisting of the current portion of $1,000 and non-current portion of $2,722 (December 31, 2022 - $1,000 and $2,729 respectively).
ENDEAVOUR SILVER CORP.
NOTES TO THE CONDENSED CONSOLIDATED INTERIM FINANCIAL STATEMENTS
Three months ended March 31, 2023 and 2022
(unaudited – prepared by management)
(expressed in thousands of US dollars, unless otherwise stated)
The carrying value of the net Minera Oro Silver's net assets at the date of the sale was $1,149 resulting in the Company recording a $2,733.
9. LOANS PAYABLE
| March 31, | December 31, | |||||
| 2023 | 2022 | |||||
| Balance at the beginning of the period | $ | 14,510 | $ | 10,494 | ||
| Net proceeds from software and equipment financing | - | 9,070 | ||||
| Finance cost | 218 | 726 | ||||
| Repayments of principal | (1,574 | ) | (5,054 | ) | ||
| Repayments of finance costs | (218 | ) | (726 | ) | ||
| Balance at the end of the period | $ | 12,936 | $ | 14,510 | ||
| Statements of Financial Position presentation | ||||||
| Current loans payable | $ | 5,607 | $ | 6,041 | ||
| Non-current loans payable | 7,329 | 8,469 | ||||
| Total | $ | 12,936 | $ | 14,510 |
The Company currently has $25,203 in financing arrangements for equipment, with terms ranging from one to four years. The agreements require either monthly or quarterly payments of principal and interest with a weighted-average interest rate of 6.1%.
The equipment financing is secured by the underlying equipment purchased and is subject to various non-financial covenants and as at March 31, 2023 the Company was in compliance with these covenants. As at March 31, 2023, the net book value of equipment includes $23,268 (December 31, 2022 - $24,379) of equipment pledged as security for the equipment financing.
10. SHARE CAPITAL
(a) Public Offerings
On March 22, 2022, the Company completed a prospectus equity financing with the offering co-led by BMO Capital Markets and PI Financial Corp., together with a syndicate of underwriters consisting of CIBC World Markets Inc., B. Riley Securities Inc., and H.C. Wainwright & Co., LLC. The Company issued a total of 9,293,150 common shares at a price of $4.95 per share for aggregate gross proceeds of $46,001, less commission of $2,524 and recognized $361 of other transaction costs related to the financing as share issuance costs, which have been presented net within share capital.
(b) Stock Options
Options to purchase common shares have been granted to directors, officers, employees and consultants pursuant to the Company's current stock option plan, approved by the Company's shareholders in fiscal 2009 and amended and re-ratified in 2021, at exercise prices determined by reference to the market value on the date of grant. The stock option plan allows for, with approval by the Board, granting of options to its directors, officers, employees and consultants to acquire up to 5.0% of the issued and outstanding shares at any time. Prior to the 2021 amendment, the plan allowed for the granting of up to 7.0% of the issued
ENDEAVOUR SILVER CORP.
NOTES TO THE CONDENSED CONSOLIDATED INTERIM FINANCIAL STATEMENTS
Three months ended March 31, 2023 and 2022
(unaudited – prepared by management)
(expressed in thousands of US dollars, unless otherwise stated)
The following table summarizes the status of the Company's stock option plan and changes during the period:
| Expressed in Canadian dollars | Three months ended | Year ended | ||||||||||
| March 31, 2023 |
December 31, 2022 |
|||||||||||
| Number of options |
Weighted average exercise price |
Number of options |
Weighted average exercise price |
|||||||||
| Outstanding, beginning of the year | 3,899,630 | $ | 4.09 | 3,848,200 | $ | 3.68 | ||||||
| Granted | 991,000 | $ | 4.12 | 736,986 | $ | 6.24 | ||||||
| Exercised | (869,000 | ) | $ | 2.86 | (569,200 | ) | $ | 3.57 | ||||
| Expired and forfeited | (1,600 | ) | $ | 6.24 | (116,356 | ) | $ | 6.63 | ||||
| Outstanding, end of the period | 4,020,030 | $ | 4.36 | 3,899,630 | $ | 4.09 | ||||||
| Options exercisable at the end of the period | 2,955,316 | $ | 4.26 | 3,374,459 | $ | 3.74 | ||||||
During the three months ended March 31, 2023, the weighted-average share price at the date of exercise was CAN$4.25 (December 31, 2022 - CAN$6.77).
Subsequent to March 31, 2023, an additional 228,900 common shares were issued on the exercise of 228,900 stock options, with a weighted average exercise price of CAN$3.80 and a weighted average share price at the date of exercise of CAN$5.44.
The following table summarizes the information about stock options outstanding at March 31, 2023:
| Expressed in Canadian dollars | |||||||||||||||
| Options Outstanding | Options Exercisable | ||||||||||||||
| Number | Weighted Average | Weighted Average |
Number Exercisable |
Weighted Average |
|||||||||||
| Outstanding | Remaining | ||||||||||||||
| Price | as at | Contractual Life | Exercise | as at | Exercise | ||||||||||
| Intervals | March 31, 2023 | (Number of Years) | Price | March 31, 2023 | Price | ||||||||||
| $2.00 - $2.99 | 960,600 | 1.9 | $ | 2.14 | 960,600 | $ | 2.14 | ||||||||
| $3.00 - $3.99 | 668,900 | 0.7 | $ | 3.42 | 668,900 | $ | 3.42 | ||||||||
| $4.00 - $4.99 | 991,000 | 4.9 | $ | 4.12 | 198,200 | $ | 4.12 | ||||||||
| $5.00 - $5.99 | 60,000 | 2.5 | $ | 5.60 | 60,000 | $ | 5.60 | ||||||||
| $6.00 - $6.99 | 1,339,530 | 3.5 | $ | 6.56 | 1,067,616 | $ | 6.64 | ||||||||
| 4,020,030 | 3.0 | $ | 4.37 | 2,955,316 | $ | 4.26 | |||||||||
During the three months ended March 31, 2023, the Company recognized share-based compensation expense of $615 (March 31, 2022 - $611) based on the fair value of the vested portion of options granted in the current and prior years.
The weighted-average fair values of stock options granted and the assumptions used to calculate the related compensation expense have been estimated using the Black-Scholes Option Pricing Model with the following assumptions:
| Three months ended |
||||||
| March 31, 2023 |
March 31, 2022 |
|||||
| Weighted-average fair value of options in CAN$ | $ | 2.21 | $ | 3.17 | ||
| Risk-free interest rate | 3.83% | 2.19% | ||||
| Expected dividend yield | 0% | 0% | ||||
| Expected stock price volatility | 70% | 67% | ||||
| Expected options life in years | 3.77 | 3.80 | ||||
ENDEAVOUR SILVER CORP.
NOTES TO THE CONDENSED CONSOLIDATED INTERIM FINANCIAL STATEMENTS
Three months ended March 31, 2023 and 2022
(unaudited – prepared by management)
(expressed in thousands of US dollars, unless otherwise stated)
(c) Share Units Plan
On March 23, 2021 the Company adopted an equity-based Share Unit Plan ("SUP"), which was approved by the Company's shareholders on May 12, 2021. The SUP allows for, with approval by the Board, granting of Performance Share Units ("PSU"s) and Deferred Share Units ("DSU"s), to its directors, officers, employees to acquire up to 1.5% of the issued and outstanding shares. The SUP incorporates any new PSUs and DSUs granted and are to be subject to cash, share settlement or a combination of cash and share procedures at the discretion of the Board of Directors.
Performance Share Units
The PSUs granted are subject to a performance payout multiplier between 0% and 200% based on the Company's total shareholder return at the end of a three-year period, relative to the total shareholder return of the Company's peer group.
| Three months ended | Year ended | |||||
| March 31, 2023 |
December 31, 2022 |
|||||
| Number of units | Number of units | |||||
| Outstanding, beginning of period | 1,158,000 | 1,639,000 | ||||
| Granted | 423,000 | 316,000 | ||||
| Cancelled | - | - | ||||
| Settled for shares | (611,000 | ) | (797,000 | ) | ||
| Outstanding, end of period | 970,000 | 1,158,000 |
There were 423,000 PSUs granted during the three months ended March 31, 2023 (March 31, 2022 - 256,000) under the SUP. The PSUs vest at the end of a three-year period if certain pre-determined performance and vesting criteria are achieved. Performance criteria are based on the Company's share price performance relative to a representative group of other mining companies. 231,000 PSUs vest on March 4, 2024, 256,000 PSUs vest on March 24, 2025, 60,000 PSUs vest on or before June 30, 2024, and 423,000 PSUs vest on March 7, 2026.
On March 2, 2023, PSUs granted in 2020 vested with a payout multiplier of 200% based on the Company's shareholder return, relative to the total shareholder return of the Company's peer group over the three-year period and 205,918 PSUs were settled, through the issuance of 411,836 common shares and 405,082 PSUs were settled for $3,297 cash.
On August 16, 2022, vesting was accelerated on a pro-rata basis for 195,000 PSUs granted in 2020 and 67,000 PSUs granted in 2021. During the three months ended March 31, 2023, 350,829 shares were issued for the settlement of these PSUs.
During the three months ended March 31, 2023, the Company recognized share-based compensation expense of $394 related to the PSUs (March 31, 2022 - $428).
Deferred Share Units
The DSUs granted are vested immediately and are redeemable for shares at the time of a director's retirement.
| Three months ended | Year ended | |||||
| March 31, 2023 | December 31, 2022 | |||||
| Number of units | Number of units | |||||
| Outstanding, beginning of period | 104,596 | - | ||||
| Granted | 203,421 | 109,634 | ||||
| Settled for shares | - | (5,038 | ) | |||
| Outstanding, end of period | 308,017 | 104,596 |
There were 203,421 DSUs granted during the three months ended March 31, 2023 (March 31, 2022 - 98,313) under the SUP. During the three months ended March 31, 2023, the Company recognized share-based compensation expense of $616 related to the DSUs (March 31, 2022 - $488).
ENDEAVOUR SILVER CORP.
NOTES TO THE CONDENSED CONSOLIDATED INTERIM FINANCIAL STATEMENTS
Three months ended March 31, 2023 and 2022
(unaudited – prepared by management)
(expressed in thousands of US dollars, unless otherwise stated)
(d) Deferred Share Units - Cash Settled
The Company previously had a Deferred Share Unit ("DSU") plan whereby deferred share units were granted to independent directors of the Company in lieu of compensation in cash or share purchase options. These DSUs vested immediately and are redeemable for cash, based on the market value of the units at the time of a director's retirement. Upon adoption of the SUP plan in March 2021, no new DSUs will be granted under this cash settled plan.
| Expressed in Canadian dollars | Three months ended | Year ended | ||||||||||
| March 31, 2023 |
December 31, 2022 |
|||||||||||
| Number of Units |
Weighted Average Grant Price |
Number of Units |
Weighted Average Grant Price |
|||||||||
| Outstanding, beginning of period | 1,044,204 | $ | 3.19 | 1,348,765 | $ | 3.24 | ||||||
| Redeemed | - | $ | 0.00 | (304,561 | ) | $ | 3.41 | |||||
| Outstanding, end of period | 1,044,204 | $ | 3.19 | 1,044,204 | $ | 3.19 | ||||||
| Fair value at period end | 1,044,204 | $ | 5.22 | 1,044,204 | $ | 4.38 | ||||||
During the three months ended March 31, 2023, the Company recognized a mark to market expense on director's compensation related to these DSUs, which is included in general and administrative salaries, wages and benefits, of $653 (March 31, 2022 - a mark to market expense of $625) based on the fair value of new grants and the change in the fair value of the DSUs granted in the current and prior years. As of March 31, 2023, there are 1,044,204 deferred share units outstanding (December 31, 2022 - 1,044,204) with a fair market value of $4,028 (December 31, 2022 - $3,375) recognized in accounts payable and accrued liabilities.
(e) Share Appreciation Rights
As part of the Company's bonus program, the Company may grant share appreciation rights ("SARs") to its employees in Mexico and Chile. The SARs are subject to vesting conditions and, when exercised, constitute a cash bonus based on the value of the appreciation of the Company's common shares between the SARs grant date and the exercise date.
| Three months ended | Year ended | |||||||||||
| March 31, 2023 |
December 31, 2022 |
|||||||||||
|
Number |
Weighted Average Grant Price |
Number of Units |
Weighted Average Grant Price |
|||||||||
| Outstanding, beginning of period | 181,739 | $ | 5.12 | 113,670 | $ | 5.40 | ||||||
| Granted | - | $ | 0.00 | 148,030 | $ | 4.62 | ||||||
| Exercised | - | $ | 0.00 | (5,726 | ) | $ | 3.17 | |||||
| Cancelled | (20,643 | ) | $ | 5.06 | (74,235 | ) | $ | 4.72 | ||||
| Outstanding, end of period | 161,096 | $ | 5.12 | 181,739 | $ | 5.12 | ||||||
| Exercisable at the end of the period | 101,066 | $ | 5.18 | 101,066 | $ | 5.18 | ||||||
During the three months ended March 31, 2023, the Company recognized an expense related to SARs, which is included in operation and exploration salaries, wages and benefits, of $4 (March 31, 2022 - an expense of $25) based on the change in the fair value of the SARs granted in prior years. As of March 31, 2023, there are 161,096 SARs outstanding (December 31, 2022 - 181,739) with a fair market value of $112 (December 31, 2022 - $111) recognized in accounts payable and accrued liabilities.
ENDEAVOUR SILVER CORP.
NOTES TO THE CONDENSED CONSOLIDATED INTERIM FINANCIAL STATEMENTS
Three months ended March 31, 2023 and 2022
(unaudited – prepared by management)
(expressed in thousands of US dollars, unless otherwise stated)
(f) Diluted Earnings per Share
| Three months ended | ||||||
| March 31, 2023 |
March 31, 2022 |
|||||
| Net earnings | $ | 6,456 | $ | 11,662 | ||
| Basic weighted average number of shares outstanding | 190,274,768 | 171,557,220 | ||||
| Effect of dilutive securities: | ||||||
| Stock options | 743,186 | 1,422,669 | ||||
| Equity settled deferred share units | 308,017 | 98,313 | ||||
| Performance share units | 970,000 | 1,360,000 | ||||
| Diluted weighted average number of share outstanding | 192,295,971 | 174,438,202 | ||||
| Diluted earnings per share | $ | 0.03 | $ | 0.07 | ||
As of March 31, 2023, there are 3,276,844 anti-dilutive stock options (March 31, 2022 - 3,095,818).
11. REVENUE
| Three months ended | ||||||
| March 31, | March 31, | |||||
| 2023 | 2022 | |||||
| Silver sales (1) | $ | 38,620 | $ | 41,884 | ||
| Gold sales (1) | 17,497 | 16,510 | ||||
| Less: smelting and refining costs | (656 | ) | (654 | ) | ||
| Revenue | $ | 55,461 | $ | 57,740 | ||
(1) Changes in fair value from provisional pricing in the period are included in silver and gold sales.
ENDEAVOUR SILVER CORP.
NOTES TO THE CONDENSED CONSOLIDATED INTERIM FINANCIAL STATEMENTS
Three months ended March 31, 2023 and 2022
(unaudited – prepared by management)
(expressed in thousands of US dollars, unless otherwise stated)
| Three months ended | |||||||
| March 31, | March 31, | ||||||
| 2023 | 2022 | ||||||
| Revenue by product | |||||||
| Concentrate sales | $ | 11,785 | $ | 14,461 | |||
| Provisional pricing adjustments | (247 | ) | 630 | ||||
| Total revenue from concentrate sales | 11,538 | 15,091 | |||||
| Refined metal sales | 43,923 | 42,649 | |||||
| Total revenue | $ | 55,461 | $ | 57,740 | |||
Provisional pricing adjustments on sales of concentrate consist of provisional and final pricing adjustments made prior to the finalization of the sales contract. The Company's sales contracts are provisionally priced with provisional pricing periods lasting typically one to three months with provisional pricing adjustments recorded to revenue as market prices vary.
ENDEAVOUR SILVER CORP.
NOTES TO THE CONDENSED CONSOLIDATED INTERIM FINANCIAL STATEMENTS
Three months ended March 31, 2023 and 2022
(unaudited – prepared by management)
(expressed in thousands of US dollars, unless otherwise stated)
12. EXPLORATION AND EVALUATION
| Three months ended | ||||||
| March 31, 2023 |
March 31, 2022 |
|||||
| Depreciation and depletion | $ | 278 | $ | 107 | ||
| Share-based compensation | 131 | 94 | ||||
| Exploration salaries, wages and benefits | 429 | 692 | ||||
| Direct exploration expenditures | 1,546 | 791 | ||||
| Evaluation salaries, wages and benefits | 445 | 621 | ||||
| Direct evaluation expenditures | 1,335 | 911 | ||||
| $ | 4,164 | $ | 3,216 | |||
13. GENERAL AND ADMINISTRATIVE
| Three months ended | ||||||
| March 31, | March 31, | |||||
| 2023 | 2022 | |||||
| Depreciation and depletion | $ | 62 | $ | 48 | ||
| Share-based compensation | 1,361 | 1,306 | ||||
| Salaries, wages and benefits | 1,167 | 1,232 | ||||
| Directors' DSU expense (recovery) | 653 | 625 | ||||
| Direct general and administrative | 1,674 | 1,086 | ||||
| $ | 4,917 | $ | 4,297 | |||
14. SUPPLEMENTAL DISCLOSURE WITH RESPECT TO CASH FLOWS
| Three months ended | ||||||
| March 31, | March 31, | |||||
| 2023 | 2022 | |||||
| Net changes in non-cash working capital: | ||||||
| Accounts and other receivables | $ | (4,375 | ) | $ | (209 | ) |
| Income tax receivable | 2,163 | 6 | ||||
| Inventories | (3,093 | ) | 2,294 | |||
| Prepaid expenses | (1,382 | ) | (407 | ) | ||
| Accounts payable and accrued liabilities | (4,276 | ) | 763 | |||
| Income taxes payable | (1,939 | ) | (1,327 | ) | ||
| $ | (12,902 | ) | $ | 1,120 | ||
| Non-cash financing and investing activities: | ||||||
| Reclamation included in mineral properties, plant and equipment | $ | (436 | ) | $ | - | |
| Fair value of exercised options allocated to share capital | $ | (946 | ) | $ | (49 | ) |
| Fair value of performance share units allocated to share capital | $ | (405 | ) | $ | (806 | ) |
| Fair value of capital assets acquired under finance leases | $ | - | $ | 2,878 | ||
| Other cash disbursements: | ||||||
| Income taxes paid | $ | 1,859 | $ | 353 | ||
| Special mining duty paid | $ | 2,515 | $ | 2,272 | ||
ENDEAVOUR SILVER CORP.
NOTES TO THE CONDENSED CONSOLIDATED INTERIM FINANCIAL STATEMENTS
Three months ended March 31, 2023 and 2022
(unaudited – prepared by management)
(expressed in thousands of US dollars, unless otherwise stated)
15. SEGMENT DISCLOSURES
The Company's operating segments are based on internal management reports that are reviewed by the Company's executives (the chief operating decision makers) in assessing performance. The Company has two operating mining segments which are located in Mexico, Guanaceví and Bolañitos, and the El Compas mine which was on care and maintenance until the sale of the mine on September 9, 2022. The Company has one development project in Mexico, Terronera, as well as Exploration and Corporate segments. The Exploration segment consists of projects in the exploration and evaluation phases in Mexico, Chile and the USA. Exploration projects that are in the local district surrounding a mine are included in the mine's segments. Comparative period figures related to Terronera, previously reported as part of the exploration segment have been reclassified to conform with current period's presentation.
| March 31, 2023 | ||||||||||||||||||
| Corporate | Exploration | Guanaceví | Bolanitos | Terronera | Total | |||||||||||||
| Cash and cash equivalents | $ | 32,195 | $ | 1,525 | $ | 23,846 | $ | 3,192 | $ | 892 | $ | 61,650 | ||||||
| Other investments | 13,132 | - | - | - | - | 13,132 | ||||||||||||
| Accounts and other receivables | 922 | 792 | 6,876 | 7,017 | 3 | 15,610 | ||||||||||||
| Loans receivable | 3,722 | - | - | - | - | 3,722 | ||||||||||||
| Income tax receivable | 19 | - | 1,774 | 68 | - | 1,861 | ||||||||||||
| Inventories | 130 | - | 16,958 | 6,190 | 27 | 23,305 | ||||||||||||
| Prepaid expenses | 2,247 | 216 | 1,786 | 654 | 17,401 | 22,304 | ||||||||||||
| Non-current deposits | 76 | 2 | 324 | 95 | - | 497 | ||||||||||||
| Non-current income tax receivable | 3,570 | - | - | - | - | 3,570 | ||||||||||||
| Non-current IVA receivable | - | 1,625 | - | 10,430 | 12,055 | |||||||||||||
| Right-of-use leased assets | 487 | - | - | 256 | 66 | 809 | ||||||||||||
| Mineral properties, plant and equipment | 549 | 81,857 | 68,807 | 27,406 | 64,811 | 243,430 | ||||||||||||
| Total assets | $ | 57,049 | $ | 84,392 | $ | 121,996 | $ | 44,878 | $ | 93,630 | $ | 401,945 | ||||||
| Accounts payable and accrued liabilities | $ | 6,907 | $ | 603 | 16,808 | $ | 4,208 | $ | 6,927 | $ | 35,453 | |||||||
| Income taxes payable | - | 82 | 3,862 | 733 | - | 4,677 | ||||||||||||
| Loans payable | - | - | 781 | 1,604 | 10,551 | 12,936 | ||||||||||||
| Lease obligations | 752 | - | - | 280 | 66 | 1,098 | ||||||||||||
| Provision for reclamation and rehabilitation | - | 44 | 4,511 | 3,524 | 687 | 8,766 | ||||||||||||
| Deferred income tax liability | - | - | 14,322 | 298 | - | 14,620 | ||||||||||||
| Other non-current liabilities | - | 11 | 505 | 492 | 12 | 1,020 | ||||||||||||
| Total liabilities | $ | 7,659 | $ | 740 | $ | 40,789 | $ | 11,139 | $ | 18,243 | $ | 78,570 | ||||||
ENDEAVOUR SILVER CORP.
NOTES TO THE CONDENSED CONSOLIDATED INTERIM FINANCIAL STATEMENTS
Three months ended March 31, 2023 and 2022
(unaudited – prepared by management)
(expressed in thousands of US dollars, unless otherwise stated)
| December 31, 2022 | ||||||||||||||||||
| Corporate | Exploration | Guanaceví | Bolanitos | Terronera | Total | |||||||||||||
| Cash and cash equivalents | $ | 38,466 | $ | 1,935 | $ | 32,997 | $ | 7,371 | $ | 2,622 | $ | 83,391 | ||||||
| Other investments | 10,035 | - | - | - | - | 10,035 | ||||||||||||
| Accounts and other receivables | 383 | 669 | 5,824 | 6,246 | 14 | 13,136 | ||||||||||||
| Loans receivable | 3,729 | - | - | - | - | 3,729 | ||||||||||||
| Income tax receivable | 17 | - | 3,934 | 73 | - | 4,024 | ||||||||||||
| Inventories | 120 | - | 14,094 | 4,942 | 28 | 19,184 | ||||||||||||
| Prepaid expenses | 1,685 | 144 | 1,155 | 536 | 13,431 | 16,951 | ||||||||||||
| Non-current deposits | 150 | 2 | 321 | 92 | - | 565 | ||||||||||||
| Non-current IVA receivable | - | - | 1,505 | - | 8,649 | 10,154 | ||||||||||||
| Non-current income tax receivable | 3,570 | - | - | - | - | 3,570 | ||||||||||||
| Right-of-use leased assets | 512 | - | - | 294 | - | 806 | ||||||||||||
| Mineral properties, plant and equipment | 616 | 81,660 | 67,261 | 28,106 | 56,249 | 233,892 | ||||||||||||
| Total assets | $ | 59,283 | $ | 84,410 | $ | 127,091 | $ | 47,660 | $ | 80,993 | $ | 399,437 | ||||||
| Accounts payable and accrued liabilities | $ | 6,837 | $ | 743 | 19,875 | $ | 5,327 | $ | 7,049 | $ | 39,831 | |||||||
| Income taxes payable | 65 | 282 | 5,539 | 730 | - | 6,616 | ||||||||||||
| Loans payable | - | - | 1,025 | 2,092 | 11,393 | 14,510 | ||||||||||||
| Lease obligations | 780 | - | 293 | - | - | 1,073 | ||||||||||||
| Provision for reclamation and rehabilitation | - | 44 | 4,103 | 3,203 | 251 | 7,601 | ||||||||||||
| Deferred income tax liability | - | - | 12,647 | 297 | - | 12,944 | ||||||||||||
| Other non-current liabilities | - | 69 | 443 | 437 | 19 | 968 | ||||||||||||
| Total liabilities | $ | 7,682 | $ | 1,138 | $ | 43,925 | $ | 12,086 | $ | 18,712 | $ | 83,543 | ||||||
ENDEAVOUR SILVER CORP.
NOTES TO THE CONDENSED CONSOLIDATED INTERIM FINANCIAL STATEMENTS
Three months ended March 31, 2023 and 2022
(unaudited – prepared by management)
(expressed in thousands of US dollars, unless otherwise stated)
| Three months ended March 31, 2023 | ||||||||||||||||||
| Corporate | Exploration | Guanaceví | Bolanitos | Terronera | Total | |||||||||||||
| Silver revenue | $ | - | $ | - | $ | 35,491 | $ | 3,129 | $ | - | $ | 38,620 | ||||||
| Gold revenue | - | - | 8,433 | 9,064 | - | 17,497 | ||||||||||||
| Less: smelting and refining costs | - | - | - | (656 | ) | - | (656 | ) | ||||||||||
| Total revenue | $ | - | $ | - | $ | 43,924 | $ | 11,537 | $ | - | $ | 55,461 | ||||||
| Salaries, wages and benefits: | ||||||||||||||||||
| mining | $ | - | $ | - | $ | 1,930 | $ | 2,069 | $ | - | $ | 3,999 | ||||||
| processing | - | - | 1,069 | 577 | - | 1,646 | ||||||||||||
| administrative | - | - | 1,656 | 716 | - | 2,372 | ||||||||||||
| share-based compensation | - | - | 66 | 66 | - | 132 | ||||||||||||
| change in inventory | - | - | (113 | ) | (294 | ) | - | (407 | ) | |||||||||
| Total salaries, wages and benefits | - | - | 4,608 | 3,134 | - | 7,742 | ||||||||||||
| Direct costs: | ||||||||||||||||||
| mining | - | - | 7,153 | 3,407 | - | 10,560 | ||||||||||||
| processing | - | - | 4,851 | 1,450 | - | 6,301 | ||||||||||||
| administrative | - | - | 1,726 | 980 | - | 2,706 | ||||||||||||
| change in inventory | - | - | (127 | ) | (534 | ) | - | (661 | ) | |||||||||
| Total direct production costs | - | - | 13,603 | 5,303 | - | 18,906 | ||||||||||||
| Depreciation and depletion: | ||||||||||||||||||
| depreciation and depletion | - | - | 2,728 | 2,497 | - | 5,225 | ||||||||||||
| change in inventory | - | - | 745 | 283 | - | 1,028 | ||||||||||||
| Total depreciation and depletion | - | - | 3,473 | 2,780 | - | 6,253 | ||||||||||||
| Royalties | - | - | 6,471 | 64 | - | 6,535 | ||||||||||||
| Total cost of sales | $ | - | $ | - | $ | 28,155 | $ | 11,281 | $ | - | $ | 39,436 | ||||||
| Earnings (loss) before taxes | $ | 716 | $ | (2,384 | ) | $ | 15,769 | $ | 256 | $ | (1,780 | ) | $ | 12,577 | ||||
| Current income tax expense (recovery) | - | 4,339 | 106 | - | 4,445 | |||||||||||||
| Deferred income tax expense (recovery) | - | - | 1,676 | - | 1,676 | |||||||||||||
| Total income tax expense (recovery) | - | - | 6,015 | 106 | - | 6,121 | ||||||||||||
| Net earnings (loss) | $ | 716 | $ | (2,384 | ) | $ | 9,754 | $ | 150 | $ | (1,780 | ) | $ | 6,456 | ||||
The Exploration segment included $305 of costs incurred in Chile for the year ended March 31, 2023 (March 31, 2022 - $368).
ENDEAVOUR SILVER CORP.
NOTES TO THE CONDENSED CONSOLIDATED INTERIM FINANCIAL STATEMENTS
Three months ended March 31, 2023 and 2022
(unaudited – prepared by management)
(expressed in thousands of US dollars, unless otherwise stated)
| Three months ended March 31, 2022 | |||||||||||||||||||||
| Corporate | Exploration | Guanaceví | Bolanitos | El Compas | Terronera | Total | |||||||||||||||
| Silver revenue | $ | - | $ | - | $ | 37,627 | $ | 4,257 | $ | - | $ | - | $ | 41,884 | |||||||
| Gold revenue | - | - | 5,022 | 11,488 | - | - | 16,510 | ||||||||||||||
| Less: smelting and refining costs | - | - | - | (654 | ) | - | - | (654 | ) | ||||||||||||
| Total revenue | $ | - | $ | - | $ | 42,649 | $ | 15,091 | $ | - | $ | - | $ | 57,740 | |||||||
| Salaries, wages and benefits: | |||||||||||||||||||||
| mining | $ | - | $ | - | $ | 2,018 | $ | 1,952 | $ | - | $ | - | $ | 3,970 | |||||||
| processing | - | - | 908 | 554 | - | - | 1,462 | ||||||||||||||
| administrative | - | - | 1,406 | 900 | - | - | 2,306 | ||||||||||||||
| stock based compensation | - | - | 63 | 64 | - | - | 127 | ||||||||||||||
| change in inventory | - | - | 1,348 | (37 | ) | - | - | 1,311 | |||||||||||||
| Total salaries, wages and benefits | - | - | 5,743 | 3,433 | - | - | 9,176 | ||||||||||||||
| Direct costs: | |||||||||||||||||||||
| mining | - | - | 6,049 | 3,129 | - | - | 9,178 | ||||||||||||||
| processing | - | - | 3,177 | 1,497 | - | - | 4,674 | ||||||||||||||
| administrative | - | - | 1,445 | 1,019 | - | - | 2,464 | ||||||||||||||
| change in inventory | - | - | 1,533 | (177 | ) | - | - | 1,356 | |||||||||||||
| Total direct production costs | - | - | 12,204 | 5,468 | - | - | 17,672 | ||||||||||||||
| Depreciation and depletion: | |||||||||||||||||||||
| depreciation and depletion | - | - | 4,390 | 2,096 | - | - | 6,486 | ||||||||||||||
| change in inventory | - | - | (480 | ) | 300 | - | - | (180 | ) | ||||||||||||
| Total depreciation and depletion | - | - | 3,910 | 2,396 | - | - | 6,306 | ||||||||||||||
| Royalties | - | - | 4,234 | 83 | - | - | 4,317 | ||||||||||||||
| Total cost of sales | $ | - | $ | - | $ | 26,091 | $ | 11,380 | $ | - | $ | - | $ | 37,471 | |||||||
| Care and maintenance costs | - | - | - | - | 190 | - | 190 | ||||||||||||||
| Earnings (loss) before taxes | $ | 2,036 | $ | (1,684 | ) | $ | 16,558 | $ | 3,711 | $ | (190 | ) | $ | (1,532 | ) | $ | 18,899 | ||||
| Current income tax expense (recovery) | - | - | 750 | 265 | - | - | 1,015 | ||||||||||||||
| Deferred income tax expense (recovery) | - | - | 5,286 | 936 | - | - | 6,222 | ||||||||||||||
| Total income tax expense (recovery) | - | - | 6,036 | 1,201 | - | - | 7,237 | ||||||||||||||
| Net earnings (loss) | $ | 2,036 | $ | (1,684 | ) | $ | 10,522 | $ | 2,510 | $ | (190 | ) | $ | (1,532 | ) | $ | 11,662 | ||||
The Exploration segment included $368 of costs incurred in Chile for the three months ended March 31, 2022 (March 31, 2021 - $498).
ENDEAVOUR SILVER CORP.
NOTES TO THE CONDENSED CONSOLIDATED INTERIM FINANCIAL STATEMENTS
Three months ended March 31, 2023 and 2022
(unaudited – prepared by management)
(expressed in thousands of US dollars, unless otherwise stated)
16. INCOME TAXES
Minera Santa Cruz y Garibaldi S.A. de C.V. ("MSCG"), a subsidiary of the Company, received a MXN 238 million assessment on October 12, 2010 by Mexican fiscal authorities for failure to provide the appropriate support for certain expense deductions taken in MSCG's 2006 tax return, failure to provide appropriate support for loans made to MSCG from affiliated companies, and deemed an unrecorded distribution of dividends to shareholders, among other individually immaterial items. MSCG immediately initiated a Nullity action and filed an administrative attachment to dispute the assessment.
In June 2015, the Superior Court ruled in favour of MSCG on a number of the matters under appeal; however, the Superior Court ruled against MSCG for failure to provide appropriate support for certain deductions taken in MSCG's 2006 tax return. In June 2016, the Company received an MXN 122.9 million ($6,800) tax assessment based on the June 2015 ruling. The 2016 tax assessment comprised of MXN 41.8 million owed ($2,300) in taxes, MXN 17.7 million ($1,000) in inflationary charges, MXN 40.4 million ($2,200) in interest and MXN 23.0 million ($1,300) in penalties. The 2016 tax assessment was issued for failure to provide the appropriate support for certain expense deductions taken in MSCG's 2006 tax return and failure to provide appropriate support for loans made to MSCG from affiliated companies. The MXN 122.9 million assessment includes interest and penalties. If MSCG agrees to pay the tax assessment, or a lesser settled amount, it is eligible to apply for forgiveness of 100% of the penalties and 50% of the interest.
The Company filed an appeal against the June 2016 tax assessment on the basis certain items rejected by the courts were included in the new tax assessment, and a number of deficiencies exist within the assessment. Since issuance of the assessment interest charges of MXN 17.8 million ($1.0) and inflationary charges of MXN 26.6 million ($1,500) have accumulated.
Included in the Company's consolidated financial statements are net assets of $964 held by MSCG. Following the Tax Court's rulings, MSCG is in discussions with the tax authorities with regards to the shortfall of assets within MSCG to settle its estimated tax liability. An alternative settlement option would be to transfer the shares and assets of MSCG to the tax authorities. As of March 31, 2023, the Company's income tax payable includes an allowance for transferring the shares and assets of MSCG amounting to $964. The Company is currently assessing MSCG's settlement options based on ongoing court proceedings and discussion with the tax authorities. The Company has been advised that the appeal filed with the Federal Tax Court, against the June 2016 tax assessment has been rejected. The Company continues to assess MSCG's settlement options.
Compania Minera Del Cubo S.A. de C.V. ("Cubo"), a subsidiary of the Company, received a MXN 58.5 million ($2,900) assessment in 2019 by Mexican fiscal authorities for alleged failure to provide the appropriate support for depreciation deductions taken in the Cubo 2016 tax return and denied eligibility of deductions of certain suppliers. The tax assessment consisted of MXN 24.1 million ($1,200) for taxes, MXN 21.0 million ($1,100) for penalties, MXN 10.4 million ($500) for interest and MXN 3.0 million ($100) for inflation. At the time of the tax assessment the Cubo entity had and continues to have sufficient loss carry forwards which would be applied against the assessed difference of taxable income. The Mexican tax authorities did not consider these losses in the assessment.
Due to the denial of certain suppliers for income tax purposes in the Cubo assessment, the invoices from these suppliers have been assessed as ineligible for refunds of IVA paid on the invoices. The assessment includes MXN 14.7 million ($600) for re-payment of IVA (value added taxes) refunded on these supplier payments. In the Company's judgement the suppliers and invoices meet the necessary requirements to be deductible for income tax purposes and the recovery of IVA.
ENDEAVOUR SILVER CORP.
NOTES TO THE CONDENSED CONSOLIDATED INTERIM FINANCIAL STATEMENTS
Three months ended March 31, 2023 and 2022
(unaudited – prepared by management)
(expressed in thousands of US dollars, unless otherwise stated)
The Company has filed an administrative appeal related to the 2016 Cubo Tax assessment. The Company had previously provided a lien on certain El Cubo mining concessions during the appeal process. To facilitate the sale of the El Cubo mine and related assets, the Company elected to pay the assessed amount of $3,500 during Q1, 2021. During the appeal process the amount paid has been classified as a non-current income tax receivable. Since issuance of the assessment interest charges of MXN 9.9 million ($500) and inflationary charges of MXN 1.6 million ($100) had accumulated. The Company continues to assess that it is probable that its appeal will prevail, and no provision is recognized in respect of the Cubo tax assessment.
17. FINANCIAL INSTRUMENTS AND FAIR VALUE MEASUREMENTS
(a) Financial assets and liabilities
As at March 31, 2023, the carrying and fair values of the Company's financial instruments by category are as follows:
| Fair value through profit or loss |
Amortized cost |
Carrying value |
Fair value | |||||||||
| $ | $ | $ | $ | |||||||||
| Financial assets: | ||||||||||||
| Cash and cash equivalents | - | 61,650 | 61,650 | 61,650 | ||||||||
| Other investments | 13,132 | - | 13,132 | 13,132 | ||||||||
| Trade and other receivables | 5,030 | 909 | 5,939 | 5,939 | ||||||||
| Loans receivable | - | 3,722 | 3,722 | |||||||||
| Total financial assets | 18,162 | 66,281 | 84,443 | 84,443 | ||||||||
| Financial liabilities: | ||||||||||||
| Accounts payable and accrued liabilites | 4,140 | 31,313 | 35,453 | 35,453 | ||||||||
| Loans payable | - | 12,936 | 12,936 | 12,936 | ||||||||
| Total financial liabilities | 4,140 | 44,249 | 48,389 | 48,389 |
(b) Fair value hierarchy
Fair value is the price that would be received to sell an asset or paid to transfer a liability in an orderly transaction between market participants at the measurement date. The fair value hierarchy establishes three levels to classify the inputs to valuation techniques used to measure fair value. Level 1 inputs are quoted prices (unadjusted) in active markets for identical assets or liabilities. Level 2 inputs are quoted prices in markets that are not active, quoted prices for similar assets or liabilities in active markets, inputs other than quoted prices that are observable for the asset or liability (for example, interest rate and yield curves observable at commonly quoted intervals, forward pricing curves used to value currency and commodity contracts and volatility measurements used to value option contracts), or inputs that are derived principally from or corroborated by observable market data or other means. Level 3 inputs are unobservable (supported by little or no market activity). The fair value hierarchy gives the highest priority to Level 1 inputs and the lowest priority to Level 3 inputs.
Level 1:
Other investments are comprised of marketable securities. When there is an active market are determined based on a market approach reflecting the closing price of each particular security at the reporting date. The closing price is a quoted market price obtained from the exchange that is the principal active market for the particular security. As a result, $12,971 of these financial assets have been included in Level 1 of the fair value hierarchy.
Cash settled deferred share units are determined based on a market approach reflecting the Company's closing share price or share price at redemption date for any pending settlements.
ENDEAVOUR SILVER CORP.
NOTES TO THE CONDENSED CONSOLIDATED INTERIM FINANCIAL STATEMENTS
Three months ended March 31, 2023 and 2022
(unaudited – prepared by management)
(expressed in thousands of US dollars, unless otherwise stated)
Level 2:
The Company determines the fair value of the embedded derivatives related to its accounts and other receivables based on the quoted closing price obtained from the silver and gold metal exchanges and the fair value of the SARs liability is determined by using an option pricing model.
Level 3:
Included in other investments are share purchase warrants. Fair value of the warrants at each period end has been estimated using the Black-Scholes Option Pricing Model. As a result, $161 of these financial assets have been included in Level 3 of the fair value hierarchy.
Assets and liabilities as at March 31, 2023 measured at fair value on a recurring basis include:
| Level 1 | Level 2 | Level 3 | Total | ||||||||||
| $ | $ | $ | $ | ||||||||||
| Financial assets: | |||||||||||||
| Accounts and other receivables | - | 5,030 | - | 5,030 | |||||||||
| Other investments | 12,971 | - | 161 | 13,132 | |||||||||
| Total financial assets | 12,971 | 5,030 | 161 | 18,162 | |||||||||
| Financial liabilities: | |||||||||||||
| Deferred share units | 4,028 | - | - | 4,028 | |||||||||
| Share appreciation rights | - | 112 | - | 112 | |||||||||
| Total financial liabilities | 4,028 | 112 | - | 4,140 |
ENDEAVOUR SILVER CORP.
NOTES TO THE CONDENSED CONSOLIDATED INTERIM FINANCIAL STATEMENTS
Three months ended March 31, 2023 and 2022
(unaudited – prepared by management)
(expressed in thousands of US dollars, unless otherwise stated)
| HEAD OFFICE | Suite #1130, 609 Granville Street Vancouver, BC, Canada V7Y 1G5 Telephone: (604) 685-9775 1-877-685-9775 Facsimile: (604) 685-9744 Facsimile: (604) 685-9744 Website: www.edrsilver.com |
| DIRECTORS | Margaret Beck Ricardo Campoy Daniel Dickson Amy Jacobsen Rex McLennan Kenneth Pickering Mario Szotlender |
| OFFICERS | Daniel Dickson - Chief Executive Officer Donald Gray - Chief Operating Officer Christine West - Chief Financial Officer Nicholas Shakesby - Vice President, Operations Luis Castro - Vice-President, Exploration Dale Mah - Vice-President, Corporate Development Galina Meleger - Vice-President, Investor Relations Bernard Poznanski - Corporate Secretary |
| REGISTRAR AND TRANSFER AGENT |
Computershare Trust Company of Canada 3rd Floor - 510 Burrard Street Vancouver, BC, V6C 3B9 |
| AUDITORS | KPMG LLP 777 Dunsmuir Street Vancouver, BC, V7Y 1K3 |
| SOLICITORS | Koffman Kalef LLP 19th Floor - 885 West Georgia Street Vancouver, BC, V6C 3H4 |
| SHARES LISTED | Toronto Stock Exchange Trading Symbol - EDR New York Stock Exchange Trading Symbol - EXK |
|
MANAGEMENT'S DISCUSSION AND ANALYSIS FOR THE PERIOD ENDED MARCH 31, 2023 |
This Management Discussion and Analysis ("MD&A") should be read in conjunction with the condensed consolidated interim financial statements of Endeavour Silver Corp. ("Endeavour" or "the Company") for the three months ended March 31, 2023 and the related notes contained therein, which were prepared in accordance with IAS34 - Interim financial reporting if the International Financial Reporting Standards ("IFRS") as issued by the International Accounting Standards Board ("IASB"). The Company uses certain non-IFRS financial measures in this MD&A as described under "Non-IFRS Measures". Additional information relating to the Company, including the most recent Annual Information Form (the "Annual Information Form"), is available on SEDAR at www.sedar.com, and the Company's most recent annual report on Form 40-F has been filed with the U.S. Securities and Exchange Commission (the "SEC") on EDGAR at www.sec.gov. This MD&A contains "forward-looking statements" that are subject to risk factors set out in a cautionary note contained herein. All dollar ($) amounts are expressed in United States ("$.") dollars and tabular amounts are expressed in thousands of U.S. dollars unless Canadian dollars (CAN$) or Mexican Pesos (MXN) are otherwise indicated. This MD&A is dated as of May 8, 2023 and all information contained is current as of May 8, 2023 unless otherwise stated.
Cautionary Note to U.S. Investors Regarding Mineral Reserves and Resources
This MD&A has been prepared in accordance with the requirements of Canadian provincial securities laws, which differ from the requirements of U.S. securities laws. As a result, the Company reports the mineral reserves and resources of the projects it has an interest in according to Canadian standards. Canadian reporting requirements for disclosure of mineral properties are governed by National Instrument 43-101 - Standards of Disclosure for Mineral Projects ("NI-43 101"). NI-43 101 is a rule developed by the Canadian Securities Administrators that establishes standards for all public disclosure an issuer makes of scientific and technical information concerning mineral projects. These standards differ from the requirements of the SEC that are applicable to domestic United States reporting companies under subpart 1300 of Regulation S-K ("S-K 1300") under the Exchange Act. As an issuer that prepares and files its reports with the SEC pursuant to the MJDS, the Company is not subject to the requirements of S-K 1300. Any mineral reserves and mineral resources reported by the Company in accordance with NI 43- 101 may not qualify as such under or differ from those prepared in accordance with S-K 1300. Accordingly, information included or incorporated by reference in this MD&A concerning descriptions of mineralization and estimates of mineral reserves and resources under Canadian standards may not be comparable to similar information made public by United States companies subject to the reporting and disclosure requirements of S-K 130.
Forward-Looking Statements
This MD&A contains "forward-looking statements" within the meaning of the U.S. Securities Litigation Reform Act of 1995, as amended and "forward-looking information" within the meaning of applicable Canadian securities legislation. Such forward-looking statements and information include, but are not limited to, statements regarding the development and financing of the Terronera project, including anticipated decisions on construction and financing estimation of mineral resources at Pitarrilla, prospects for Terronera, Pitarrilla and Parral, Endeavour's anticipated performance in 2023, including silver and gold production, financial results, timing and expenditures to develop new silver mines and mineralized zones, silver and gold grades and recoveries, cash costs per ounce (oz), capital expenditures and sustaining capital and the timing and results of various activities.. Forward-looking statements are frequently characterized by words such as "plan", "expect", "forecast", "project", "intend", "believe", "anticipate", "outlook" and other similar words, or statements that certain events or conditions "may" or "will" occur. Forward- looking statements are based on the opinions and estimates of management at the dates the statements are made, and are subject to a variety of risks and uncertainties and other factors that could cause actual events or results to differ materially from those projected in the forward-looking statements.
The Company does not intend to, and does not assume any obligation to, update such forward-looking statements or information, other than as required by applicable law. Forward-looking statements or information involve known and unknown risks, uncertainties and other factors and are based on assumptions that may cause the actual results, level of activity, performance or achievements of the Company and its operations to be materially different from those expressed or implied by such statements. Such factors and assumptions include, among others: availability of debt financing for the Terronera project, fluctuations in the prices of silver and gold, fluctuations in the currency markets (particularly the Mexican peso, Chilean peso, Canadian dollar and U.S. dollar); changes in national and local governments, legislation, taxation, controls, regulations and political or economic developments in Canada and Mexico; operating or technical difficulties in mineral exploration, development and mining activities; risks and hazards of mineral exploration, development and mining (including, but not limited to environmental hazards, industrial accidents, unusual or unexpected geological conditions, pressures, cave-ins and flooding); inadequate insurance, or inability to obtain insurance; availability of and costs associated with mining inputs and labour; the speculative nature of mineral exploration and development, diminishing quantities or grades of mineral reserves as properties are mined; the ability to successfully integrate acquisitions; risks in obtaining necessary licenses and permits, and challenges to the Company's title to properties; as well as those factors described under "Risk Factors" in the Company's Annual Information Form. Although the Company has attempted to identify important factors that could cause actual results to differ materially from those contained in forward-looking statements or information, there may be other factors that cause results to be materially different from those anticipated, described, estimated, assessed or intended. There can be no assurance that any forward-looking statements or information will prove to be accurate as actual results and future events could differ materially from those anticipated in such statements or information. Accordingly, readers should not place undue reliance on forward-looking statements or information.
Qualified Person
The scientific and technical information contained in this MD&A relating to the Company's mines and mineral projects has been reviewed and approved by Dale Mah, B.Sc., P.Geo., Vice President Corporate Development of Endeavour, a Qualified Person within the meaning of NI 43-101.
| ENDEAVOUR SILVER CORP. | MANAGEMENT'S DISCUSSION & ANALYSIS |
PAGE 2 |
|
|
|
Table of Contents
OPERATING HIGHLIGHTS
| Q1 2023 Highlights | Three Months Ended March 31 | ||||||||
| 2023 | 2022 | % Change | |||||||
| Production | |||||||||
| Silver ounces produced | 1,623,545 | 1,314,955 | 23% | ||||||
| Gold ounces produced | 9,342 | 8,695 | 7% | ||||||
| Payable silver ounces produced | 1,608,212 | 1,303,540 | 23% | ||||||
| Payable gold ounces produced | 9,184 | 8,549 | 7% | ||||||
| Silver equivalent ounces produced(1) | 2,370,905 | 2,010,555 | 18% | ||||||
| Cash costs per silver ounce(2)(3) | 11.12 | 10.21 | 9% | ||||||
| Total production costs per ounce(2)(4) | 15.43 | 15.13 | 2% | ||||||
| All-in sustaining costs per ounce (2)(5) | 20.16 | 20.90 | (4%) | ||||||
| Processed tonnes | 211,073 | 206,147 | 2% | ||||||
| Direct operating costs per tonne(2)(6) | 132.11 | 122.86 | 8% | ||||||
| Direct costs per tonne(2)(6) | 169.49 | 148.53 | 14% | ||||||
| Silver co-product cash costs(7) | 14.93 | 15.18 | (2%) | ||||||
| Gold co-product cash costs(7) | 1,236 | 1,226 | 1% | ||||||
| Financial | |||||||||
| Revenue ($ millions) | 55.5 | 57.7 | (4%) | ||||||
| Silver ounces sold | 1,667,408 | 1,717,768 | (3%) | ||||||
| Gold ounces sold | 9,126 | 8,381 | 9% | ||||||
| Realized silver price per ounce | 23.16 | 24.38 | (5%) | ||||||
| Realized gold price per ounce | 1,917 | 1,970 | (3%) | ||||||
| Net earnings (loss) ($ millions) | 6.5 | 11.7 | (45%) | ||||||
| Adjusted net earnings (loss) (11) ($ millions) | 9.6 | 17.0 | 44% | ||||||
| Mine operating earnings ($ millions) | 16.0 | 20.3 | (21%) | ||||||
| Mine operating cash flow before taxes ($ millions)(8) | 22.4 | 26.7 | (16%) | ||||||
| Operating cash flow before working capital changes(9) | 12.5 | 20.6 | (39%) | ||||||
| EBITDA(10) ($ millions) | 19.4 | 25.6 | (24%) | ||||||
| Working capital (12) ($ millions) | 92.8 | 168.4 | (45%) | ||||||
| Shareholders | |||||||||
| Earnings (loss) per share - basic ($) | 0.03 | 0.07 | (57%) | ||||||
| Adjusted earnings (loss) per share - basic ($)(11) | 0.05 | 0.10 | 49% | ||||||
| Operating cash flow before working capital changes per share(9) | 0.07 | 0.12 | (45%) | ||||||
| Weighted average shares outstanding | 190,274,768 | 171,557,220 | 11% | ||||||
(1) Silver equivalents are calculated using an 80:1 (Ag/Au) ratio.
(2) The Company reports non-IFRS measures and ratios which include cash costs net of by-product revenue on a payable silver basis, total production costs per oz, all-in sustaining costs ("AISC") per oz, direct operating cost per tonne, direct cost per tonne, silver co-product cash costs and gold co-product cash costs in order to manage and evaluate operating performance at each of the Company's mines. These measures, some established by the Silver Institute (Production Cost Standards, June 2011), are widely used in the silver mining industry as a benchmark for performance, but do not have a standardized meaning. These measures are reported on a production basis. See Reconciliations to IFRS beginning on page 16.
(3) Cash costs net of by-product revenue per payable silver oz include mining, processing (including smelting, refining, transportation and selling costs), and direct overhead, net of gold credits. See Reconciliation to IFRS on page 19.
(4) Total production costs per oz include mining, processing (including smelting, refining, transportation and selling costs), direct overhead, amortization, depletion and amortization at the operation sites net of by-product revenues. See Reconciliation to IFRS on page 19.
(5) AlSC per oz include mining, processing (including smelting, refining, transportation and selling costs), direct overhead, corporate general and administration expenses, on-site exploration, share-based compensation, reclamation and sustaining capital net of gold credits. See Reconciliation to IFRS on page 20.
(6) Direct operating costs per tonne include mining, processing (including smelting, refining, transportation and selling costs) and direct overhead at the operation sites. Direct cost per tonne include all direct operating costs, royalties and special mining duty. See Reconciliation to IFRS on page 19.
(7) Silver co-product cash cost and gold co-product cash cost include mining, processing (including smelting, refining, transportation and selling costs), and direct overhead allocated on pro-rated basis of realized metal value. See Reconciliation to IFRS on page 21.
8) Mine operating cash flow is calculated by adding back amortization, depletion, inventory write-downs and share-based compensation to mine operating earnings. Mine operating earnings and mine operating cash flow are before taxes. See Reconciliation to IFRS on page 17.
(9) See Reconciliation to IFRS on page 17 for the reconciliation of operating cash flow before working capital changes and for the operating cash flow before working capital changes per share.
(10) See Reconciliation of Earnings before interest, taxes, depreciation and amortization on page 18.
(11) Adjusted net earnings include adjustments to net earnings for certain non-cash and unusual items, that in the Company's judgement are subject to volatility as a result of factors that are unrelated to the Company's operation in the period and had a significant effect on reported net earnings. See Reconciliation to IFRS on page 17.
(12) Working capital is calculated by deducting current liabilities from current assets. See Reconciliation to IFRS on page 16.
The above highlights are key measures used by management, however they should not be the sole measures used in determining the performance of the Company's operations.
HISTORY AND STRATEGY
The Company is engaged in silver mining in Mexico and related activities including property acquisition, exploration, development, mineral extraction, processing, refining and reclamation. The Company is also engaged in exploration activities in Chile and Nevada, USA. Since 2002, the Company's business strategy has been to focus on acquiring advanced-stage silver mining properties in Mexico. Mexico, despite its long and prolific history of metal production, appears to be relatively under-explored using modern exploration techniques and offers promising geological potential for precious metals exploration and production.
The Company's Guanaceví and Bolañitos mines acquired in 2004 and 2007, respectively, demonstrate its initial business model of acquiring fully built and permitted silver mines that were about to close for lack of ore. Investing resources expertise needed to discover new silver ore-bodies, the Company successfully re-opened and expanded these mines to realize their full potential. The benefit of acquiring fully built and permitted mining and milling infrastructure is that, if new exploration efforts are successful, the mine development cycle from discovery to production only takes a matter of months instead of the several years normally required in the traditional mining business model.
In 2016, the Company acquired the El Compas silver-gold mine located in Zacatecas, Mexico, which was operated until August 2021. On September 9, 2022, the Company completed the sale of the El Compas mine to Grupo ROSGO, S.A. de C.V., ("Grupo ROSGO") for $5.0 million in cash payments over five years.
In February 2013, the Company completed the acquisition of a 100% interest in the Terronera properties located in Jalisco State, Mexico by paying a total of $2.75 million over three years (paid). On September 9, 2021 the Company released a positive feasibility study for the project and since that time has advanced development of the project with detailed engineering, assembly of initial project infrastructure earthworks pertaining to site clearing, road upgrades and underground mine access development towards making a formal construction decision, subject to completion of a financing package and receipt of amended permits. On April 18, 2023, the Company announced that it had made a formal decision to proceed with construction of an underground mine and mill at the Terronera project.
On January 17, 2022, the Company entered into a definitive agreement to purchase the Pitarrilla project, a large undeveloped silver, lead, and zinc project, located in Durango State, Mexico, by acquiring all of the issued and outstanding shares of SSR Durango, S.A. de C.V. from SSR Mining Inc. for a total consideration of US$70 million (consisting of $35 million in Company's shares and a further $35 million in cash or in the Company's shares at the election of SSR Mining and as agreed to by the Company) and a 1.25% net smelter returns royalty. SSR Mining retains a 1.25% NSR Royalty in Pitarrilla. Endeavour will have matching rights to purchase the NSR Royalty in the event SSR Mining proposes to sell it. The acquisition was completed on July 6, 2022. Total consideration paid included 8,577,380 shares of the Company issued on July 6, 2022 and a $35.1 million cash payment. Fair value of the 8,577,380 common shares issued on July 6, 2022 was $25.6 million at CAN$3.89 per share. The deemed value of the common shares issued, at the time of agreement was $34.9 million. The shares are subject to a hold period of four months and one day following the date of closing.
The Company is advancing several other exploration projects in order to achieve its goal to become a premier senior producer in the silver mining sector.
The Company has historically funded its acquisition, exploration and development activities through equity financings, debt facilities and convertible debentures. In recent years, the Company has financed most of its acquisition, exploration, development and operating activities from production cash flows, treasury and equity financings. The Company may choose to undertake equity, debt, convertible debt or other financings, on an as-needed basis, in order to facilitate its growth.
As of March 31, 2023, the Company held $61.6 million in cash and $92.8 million in working capital. Management believes there is sufficient working capital to meet the Company's current obligations.
REVIEW OF OPERATING RESULTS
The Company operates the Guanaceví and Bolañitos mines. The Company suspended mining operations at the El Compas mine in August 2021 due to exhaustion of reserves and it remained on care and maintenance until the mine was sold on September 9, 2022.
Consolidated Production Results for the Three Months Ended March 31, 2023 and 2022
| CONSOLIDATED | Three Months Ended March 31 | ||||||||
| 2023 | 2022 | % Change | |||||||
| Ore tonnes processed | 211,073 | 206,147 | 2% | ||||||
| Average silver grade (gpt) | 279 | 231 | 21% | ||||||
| Silver recovery (%) | 85.7 | 85.9 | (0%) | ||||||
| Total silver ounces produced | 1,623,545 | 1,314,955 | 23% | ||||||
| Payable silver ounces produced | 1,608,212 | 1,303,540 | 23% | ||||||
| Average gold grade (gpt) | 1.56 | 1.46 | 7% | ||||||
| Gold recovery (%) | 88.0 | 89.6 | (2%) | ||||||
| Total gold ounces produced | 9,342 | 8,695 | 7% | ||||||
| Payable gold ounces produced | 9,184 | 8,549 | 7% | ||||||
| Silver equivalent ounces produced(1) | 2,370,905 | 2,010,555 | 18% | ||||||
| Cash costs per silver ounce(2)(3) | 11.12 | 10.21 | 9% | ||||||
| Total production costs per ounce(2)(4) | 15.43 | 15.13 | 2% | ||||||
| All in sustaining costs per ounce (2)(5) | 20.16 | 20.90 | (4%) | ||||||
| Direct operating costs per tonne(2)(6) | 132.11 | 122.86 | 8% | ||||||
| Direct costs per tonne(2)(6) | 169.49 | 148.53 | 14% | ||||||
| Silver co-product cash costs(7) | 14.93 | 15.18 | (2%) | ||||||
| Gold co-product cash costs(7) | 1,236 | 1,226 | 1% | ||||||
(1) Silver equivalents are calculated using an 80:1 (Ag/Au) ratio.
(2) The Company reports non-IFRS measures which include cash costs net of by-product revenue on a payable silver basis, total production costs per oz, AISC per oz, direct operating cost per tonne, direct cost per tonne, silver co-product cash costs and gold co-product cash costs in order to manage and evaluate operating performance at each of the Company's mines. These measures, some established by the Silver Institute (Production Cost Standards, June 2011), are widely used in the silver mining industry as a benchmark for performance, but do not have a standardized meaning. These measures are reported on a production basis. See Reconciliations to IFRS on page 16.
(3) Cash costs net of by-product revenue per payable silver oz include mining, processing (including smelting, refining, transportation and selling costs), and direct overhead, net of gold credits. See Reconciliation to IFRS on page 19.
(4) Total production costs per oz include mining, processing (including smelting, refining, transportation and selling costs), direct overhead, amortization, depletion and amortization at the operation sites net of by product revenues. See Reconciliation to IFRS on page 19.
(5) AISC per oz include mining, processing (including smelting, refining, transportation and selling costs), direct overhead, corporate general and administration expenses, on-site exploration, share-based compensation, reclamation and sustaining capital net of gold credits. See Reconciliation to IFRS on page 20.
(6) Direct operating cost per tonne include mining, processing (including smelting, refining, transportation and selling costs) and direct overhead at the operation sites. Direct cost per tonne include all direct operating costs, royalties and special mining duty. See Reconciliation to IFRS on page 19.
(7) Silver co-product cash cost and gold co-product cash cost include mining, processing (including smelting, refining, transportation and selling costs), and direct overhead allocated on pro-rated basis of realized metal value. See Reconciliation to IFRS on page 21.
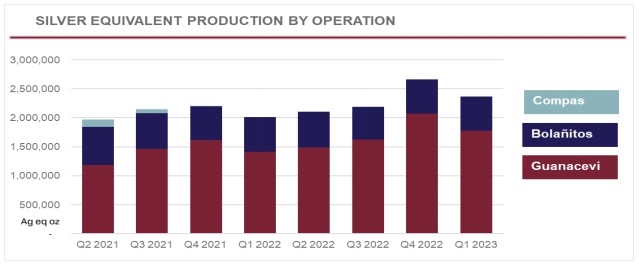
(1) Silver equivalents are calculated using an 80:1 (Ag/Au) ratio.
Consolidated Production
Three months ended March 31, 2023 (compared to the three months ended March 31, 2022)
Consolidated silver production during Q1, 2023 was 1,623,545 oz, an increase of 23% compared to 1,314,955 oz in Q1, 2022, and gold production was 9,342 oz, an increase of 7% compared to 8,695 oz in Q1, 2022. Plant throughput was 211,073 tonnes at average grades of 279 grams per tonne (gpt) silver and 1.56 gpt gold, compared to 206,147 tonnes grading 231 gpt silver and
1.46 gpt gold in Q1, 2022. The 23% increase in consolidated silver production, compared to Q1, 2022, is driven by a 27% increase in silver production at the Guanaceví mine and a 1% increase in silver production at the Bolañitos mine. Consolidated gold production increased by 7% compared to Q1, 2022, due to the 20% increase in gold production at the Guanaceví mine and a 1% decrease in gold production at the Bolañitos mine. The increase in silver and gold production at the Guanaceví mine was primarily due to a 26% increase in ore silver grade and a 19% increase in ore gold grade, with similar tonnes and silver and gold recoveries. At the Bolañitos mine the nominal increase in silver production was attributable to a 4% increase in throughput offset by a 2% decrease in silver recoveries. The 1% decrease in gold production at the Bolañitos mine was attributable to a 2% decrease in ore gold grade and a 3% decrease in recoveries offset by higher throughput.
Consolidated Operating Costs
Three months ended March 31, 2023 (compared to the three months ended March 31, 2022)
Direct operating costs per tonne in Q1, 2023 increased to $132.11, an 8% increase compared with Q1, 2022 due to both a strengthening of the Mexican peso and higher operating costs at both Guanaceví and Bolanitos from increased inflationary pressure during 2022 and Q1 2023. As the Mexican peso strengthens, the Company's Mexican peso denominated costs are increased in US dollar terms. Guanaceví and Bolañitos have seen increased labour, power and consumable costs. Including royalties and special mining duty, direct costs per tonne increased 14% to $169.49. Compared to Q1, 2022, royalties have increased 51% from $4.3 million to $6.5 million with the increase occurring in Guanaceví. At Guanaceví the increase in royalty expense recognized during Q1, 2023 is due to the increase in production coming from concessions subject to royalties. Consolidated cash costs per oz, net of by-product credits increased 9% to $11.12 driven by a 10% increase in direct operating costs, a 51% increase in royalties and a 39% increase in special mining duties, partially offset by an increase in by-product gold sales and increased silver production. All-In-Sustaining Costs ("AISC") decreased by 4% on a per oz basis compared to Q1, 2022 due to costs being allocated over increased ounces produced which offset the increased costs.
On a co-product cash costs basis, silver cost per oz decreased by 2% and gold cost per oz increased 1% compared to Q1, 2022. Increased silver production due to improved silver ore grade was offset by the higher operating costs and gold co-product cash costs increased due to the higher operating cost partially offset by a decrease in proportional costs resulting from decrease in proportional gold production.
GUANACEVÍ OPERATIONS
The Guanaceví operation is currently producing from three underground silver-gold mines along a five kilometre ("km") length of the prolific Santa Cruz vein. Guanaceví provides steady employment to over 540 people and engages over 280 contractors.
In July 2019, the Company acquired a 10 year right to explore and exploit the El Porvenir and El Curso concessions from Ocampo Mining SA de CV ("Ocampo"), a subsidiary of Grupo Frisco. The Company agreed to meet certain minimum production targets from the properties, subject to various terms and conditions and pay Ocampo a $12 fixed per tonne production payment plus a floating net smelter return royalty based on the silver spot price. The Company pays a 4% royalty on sales below $15.00 per silver oz, 9% above $15.00 per silver oz, 13% above $20.00 per silver oz, and a maximum of 16% above $25 per silver oz, based on the current realized prices. On December 12, 2021, the Company executed an amendment to the agreement whereby two additional concessions, adjacent to the existing and historic mine workings, were included in the existing agreement.
Production Results for the Three Months Ended March 31, 2023 and 2022
| GUANACEVÍ | Three Months Ended March 31 | ||||||||
| 2023 | 2022 | % Change | |||||||
| Ore tonnes processed | 102,375 | 101,253 | 1% | ||||||
| Average silver grade (g/t) | 511 | 407 | 26% | ||||||
| Silver recovery (%) | 85.6 | 85.6 | 0% | ||||||
| Total silver ounces produced | 1,439,924 | 1,133,850 | 27% | ||||||
| Payable silver ounces produced | 1,435,604 | 1,130,448 | 27% | ||||||
| Average gold grade (g/t) | 1.42 | 1.19 | 19% | ||||||
| Gold recovery (%) | 89.6 | 89.8 | (0%) | ||||||
| Total gold ounces produced | 4,188 | 3,477 | 20% | ||||||
| Payable gold ounces produced | 4,175 | 3,467 | 20% | ||||||
| Silver equivalent ounces produced(1) | 1,774,964 | 1,412,010 | 26% | ||||||
| Cash costs per silver ounce(2)(3) | 12.25 | 12.22 | 0% | ||||||
| Total production costs per ounce(2)(4) | 14.89 | 15.49 | (4%) | ||||||
| All in sustaining costs per ounce (2)(5) | 19.28 | 20.52 | (6%) | ||||||
| Direct operating costs per tonne(2)(6) | 176.21 | 155.05 | 14% | ||||||
| Direct costs per tonne(2)(6) | 251.83 | 204.08 | 23% | ||||||
| Silver co-product cash costs(7) | 14.43 | 14.61 | (1%) | ||||||
| Gold co-product cash costs(7) | 1,194 | 1,180 | 1% | ||||||
(1) Silver equivalents are calculated using an 80:1 (silver/gold) ratio.
(2) The Company reports non-IFRS measures which include cash costs net of by-product revenue on a payable silver basis, total production costs per oz, AISC per oz, direct operating cost per tonne, direct cost per tonne, silver co-product cash costs and gold co-product cash costs in order to manage and evaluate operating performance at each of the Company's mines. These measures, some established by the Silver Institute (Production Cost Standards, June 2011), are widely used in the silver mining industry as a benchmark for performance, but do not have a standardized meaning. These measures are reported on a production basis. See Reconciliations to IFRS on page 16.
(3) Cash costs net of by-product revenue per payable silver oz include mining, processing (including smelting, refining, transportation and selling costs), and direct overhead, net of gold credits. See Reconciliation to IFRS on page 19.
(4) Total production costs per oz include mining, processing (including smelting, refining, transportation and selling costs), direct overhead, amortization, depletion and amortization at the operation sites net of by product revenues. See Reconciliation to IFRS on page 19.
(5) AISC per oz include mining, processing (including smelting, refining, transportation and selling costs), direct overhead, corporate general and administration expenses, on-site exploration, share-based compensation, reclamation and sustaining capital net of gold credits. See Reconciliation to IFRS on page 20.
(6) Direct operating costs per tonne include mining, processing (including smelting, refining, transportation and selling costs) and direct overhead at the operation sites. Direct cost per tonne include all direct operating costs, royalties and special mining duty. See Reconciliation to IFRS on page 19.
(7) Silver co-product cash cost and gold co-product cash cost include mining, processing (including smelting, refining, transportation and selling costs), and direct overhead allocated on pro-rated basis of realized metal value. See Reconciliation to IFRS on page 21.
Guanaceví Production Results
Three months ended March 31, 2023 (compared to the three months ended March 31, 2022)
Silver production at the Guanaceví mine during Q1, 2023 was 1,439,924 oz, an increase of 27% compared to 1,133,850 oz in Q1, 2022, and gold production was 4,188 oz, an increase of 20% compared to 3,477 oz in Q1, 2022. Plant throughput was 1% higher in Q1, 2023 with 102,375 tonnes at average grades of 511 gpt silver and 1.42 gpt gold, compared to 101,253 tonnes grading 407 gpt silver and 1.19 gpt gold in Q1, 2022. The 27% increase in silver production is due to a 26% increase in silver grades and 1% increase in throughput with consistent recoveries. The 20% increase in gold production is due to a 19% increase in gold grades and the increased throughput with consistent recoveries.
Guanaceví Operating Costs
Three months ended March 31, 2023 (compared to the three months ended March 31, 2022)
Direct operating costs per tonne for the three months ended March 31, 2023 increased 14% to $176.21 compared with the same period in 2022, resulting from a strengthening in the Mexican peso and increased labour, power and consumables costs. The local third-party ore contributed $24.32 per tonne during Q1, 2023 compared to $28.82 per tonne in Q1, 2022 due to lower precious metals price. Including royalty and special mining duty costs, direct cost per tonne increased 23% to $251.83 compared with $204.08 in the same period in 2021. There was a 53% increase in royalty expense recognized during Q1, 2023 due to an increase in production from concessions that are subject to royalties. Royalty expense increased from $4.2 million to $6.5 million, which are included in cost per tonne and oz metrics.
Cash costs per oz, net of by-product credits, was relatively flat and increased to $12.25 compared to $12.22 for the same period in 2022, driven by the higher direct costs per tonne partially offset by increased silver production. AISC per oz decreased 6% to $19.28 per oz for the three months ended March 31, 2023, due to increased silver production and slightly lower sustaining capital expenditures being allocated to increased silver ounces produced offset by increased direct costs.
BOLAÑITOS OPERATIONS
The Bolañitos operation encompasses three underground silver-gold mines and a flotation plant. Bolañitos provides steady employment for over 490 people and engages over 130 contractors.
Production Results for the Three Months Ended March 31, 2023 and 2022
| BOLAÑITOS | Three Months Ended March 31 | ||||||||
| 2023 | 2022 | % Change | |||||||
| Ore tonnes processed | 108,698 | 104,894 | 4% | ||||||
| Average silver grade (g/t) | 61 | 61 | 0% | ||||||
| Silver recovery (%) | 86.1 | 88.0 | (2%) | ||||||
| Total silver ounces produced | 183,621 | 181,105 | 1% | ||||||
| Payable silver ounces produced | 172,608 | 173,092 | (0%) | ||||||
| Average gold grade (g/t) | 1.70 | 1.73 | (2%) | ||||||
| Gold recovery (%) | 86.8 | 89.4 | (3%) | ||||||
| Total gold ounces produced | 5,154 | 5,218 | (1%) | ||||||
| Payable gold ounces produced | 5,009 | 5,082 | (1%) | ||||||
| Silver equivalent ounces produced(1) | 595,941 | 598,545 | (0%) | ||||||
| Cash costs per silver ounce(2)(3) | 1.67 | (2.95) | 157% | ||||||
| Total production costs per ounce(2)(4) | 19.87 | 12.77 | 56% | ||||||
| All in sustaining costs per ounce (2)(5) | 27.45 | 23.39 | 17% | ||||||
| Direct operating costs per tonne(2)(6) | 90.57 | 91.80 | (1%) | ||||||
| Direct costs per tonne(2)(6) | 91.94 | 94.91 | (3%) | ||||||
| Silver co-product cash costs(7) | 16.38 | 16.52 | (1%) | ||||||
| Gold co-product cash costs(7) | 1,356 | 1,335 | 2% | ||||||
(1) Silver equivalents are calculated using an 80:1 (silver/gold) ratio.
(2) The Company reports non-IFRS measures which include cash costs net of by-product revenue on a payable silver basis, total production costs per oz, AISC per oz, direct operating cost per tonne, direct cost per tonne, silver co-product cash costs and gold co-product cash costs in order to manage and evaluate operating performance at each of the Company's mines. These measures, some established by the Silver Institute (Production Cost Standards, June 2011), are widely used in the silver mining industry as a benchmark for performance, but do not have a standardized meaning. These measures are reported on a production basis. See Reconciliations to IFRS on page 16.
(3) Cash costs net of by-product revenue per payable silver oz include mining, processing (including smelting, refining, transportation and selling costs), and direct overhead, net of gold credits. See Reconciliation to IFRS on page 19.
(4) Total production costs per oz include mining, processing (including smelting, refining, transportation and selling costs), direct overhead, amortization, depletion and amortization at the operation sites net of by product revenues. See Reconciliation to IFRS on page 19.
(5) AISC per oz include mining, processing (including smelting, refining, transportation and selling costs), direct overhead, corporate general and administration expenses, on-site exploration, share-based compensation, reclamation and sustaining capital net of gold credits. See Reconciliation to IFRS on page 20.
(6) Direct operating costs per tonne include mining, processing (including smelting, refining, transportation and selling costs) and direct overhead at the operation sites. Direct cost per tonne include all direct operating costs, royalties and special mining duty. See Reconciliation to IFRS on page 19.
(7) Silver co-product cash cost and gold co-product cash cost include mining, processing (including smelting, refining, transportation and selling costs), and direct overhead allocated on pro-rated basis of realized metal value. See Reconciliation to IFRS on page 21.
Bolañitos Production Results
Three months ended March 31, 2023 (compared to the three months ended March 31, 2022)
Silver production at the Bolañitos mine was 183,621 oz in Q1, 2023, an increase of 1% compared to 181,105 oz in Q1, 2022, and gold production was 5,154 oz in Q1, 2023, a decrease of 1% compared to 5,218 oz in Q1, 2022. Plant throughput in Q1, 2023 was 108,698 tonnes at average grades of 61 gpt silver and 1.70 gpt gold, compared to 104,894 tonnes at average grades of 61 gpt silver and 1.73 gpt gold in Q1, 2022. The 1% increase in silver production and 1% decrease in gold production compared to Q1, 2022 is primarily due to the fluctuations of ore grades from accessing different areas of the mine.
Bolañitos Operating Costs
Three months ended March 31, 2023 (compared to the three months ended March 31, 2022)
Direct costs per tonne in Q1, 2023 decreased 3% to $91.94 per tonne, primarily due to a 4% increase in ore tonnes processed partially offset by increased direct costs. Cash costs, net of by-product credits, were $1.67 per oz of payable silver in Q1, 2023 compared to negative $2.95 per oz in Q1, 2022 due to the increased costs compared to the same period in the prior period and reduced gold production and realized gold prices. AISC increased 17% in Q1, 2023 to $27.45 per oz primarily due to the increase in cash costs net of by-product a slight increase in mine site expensed exploration partially offset by a slight decrease in sustaining capital expenditures.
On a co-product cash costs basis, silver cost per oz decreased 1% compared to Q1, 2022 and gold co-product costs increased 2% to $16.38 per silver oz and $1,356 per gold oz, respectively. The decreases in the silver cost on a co-product basis were primarily driven by the higher direct costs per tonne and the increase in the gold co-product cost was driven by the higher operating costs and the 2% decrease in gold grade.
DEVELOPMENT ACTIVITIES
Terronera Project
The Terronera project, located 40 km northeast of Puerto Vallarta in the state of Jalisco, Mexico, features a high-grade silver- gold mineral resource in the Terronera vein, which is now over 1,400 metres long, 400 metres deep, 3 to 16 metres thick, and remains open along strike to the southeast and down dip.
Wood PLC completed an independent feasibility study entitled "NI 43-101 Technical Report on the Feasibility Study of the Terronera Project, Jalisco State, Mexico" dated October 21, 2021 with an effective date of September 9, 2021 (the "Terronera Feasibility Study" or "FS"), and filed on SEDAR and EDGAR and posted to the Company's website on October 25, 2021. The FS base case assumed a silver price of $20 per oz and a gold price of $1,575 per oz with an implied 79:1 silver to gold ratio, and a Mexico peso to U.S. dollar exchange rate of 20:1. At base case prices, the improved economics estimated an after-tax net present value of $174.1 million at a 5% discount rate, internal rate of return of 21.3%, and payback period of 3.6 years. Initial capital expenditures were estimated to be $175 million with capital expenditures during production estimated to be $108.5 million. The 12-year life of mine was estimated to produce an average of 3.3 million silver oz and 32,874 gold oz per year generating $476 million pre-tax, $311 million after-tax, free cash flow.
Since the completion of the Terronera Feasibility Study, the Company commenced initial earthworks and the procurement of long lead items and prior to making a formal construction decision, which was subject to completion of a financing package and receipt of additional amended permits. While the Company advanced financial due diligence, the Board approved certain early expenditures to de-risk various aspects of the project in a deliberate and disciplined manner to minimize risk prior to the final construction decision. Proceeding with these early expenditures has reduced inflationary and timing pressures and has also advanced key work that will facilitate ramp-up to full construction.
On April 18, 2023, the Company announced that the Company had made a decision to proceed with the construction of an underground mine and mill at the Terronera project and had executed a Commitment Letter for a senior secured debt facility of $120 million that will be used to fund construction.
Project Loan Facility
The Company has entered into a Commitment Letter with Societe Generale and ING Bank N.V. with certain definitive terms agreed to for a senior secured debt facility for up to $120 million (the "Debt Facility"). Artemis Capital Advisors has acted as the financial advisor to the Company regarding this transaction, with ING Capital LLC (together with ING BANK N.V. " ING") and Societe Generale acting as Joint Lead Arrangers. A summary of the key terms of the Debt Facility are as follows:
The Debt Facility will include standard and customary project finance terms and conditions regarding fees and conditions precedent to closing (including satisfaction of remaining customary due diligence and other approvals) and remains subject to the completion and execution of definitive loan documentation. Closing of the transaction is expected to occur in the third quarter of 2023. Further details of the Debt Facility will be released upon signing of the final documentation. Technical, environmental, and social due diligence has been completed by Societe Generale and ING to issue their Commitment Letter.
Updated Development Plans and Initial Capital Costs
Since the Company filed the Terronera Feasibility Study the Company has further evaluated various operating scenarios, cost- benefit initiatives and technologies to optimize the Terronera Project's operating flexibility and economics. Since 2021, additional cost pressures have emerged from systemic inflation and constrained global supply chains, which have contributed to increased costs of inputs within the mining sector. The Company's move to assemble an experienced development team has worked to mitigate some of these impacts, and management believes the Company is well-equipped to navigate the current business environment.
The Company has approved the construction of an optimized Terronera Project scenario (the "Revised Scenario"), consisting of a process plant with 2,000 tonne per day (tpd) capacity and an initial capital expenditure cost of $230 million, partially offset by a decrease in sustaining capital to $88.3 million over the life of the mine. Endeavour expects a 21-month construction period, including 3 to 6 months ramp up to full production with initial production expected in the fourth quarter of 2024.
|
Area |
2021 Feasibility Study |
2023 Revised Scenario |
Life of |
% Change |
||||
|
Mine |
||||||||
|
(millions) |
Initial |
Sustaining |
LOM |
Initial Capex |
Sustaining |
LOM |
Variance |
|
|
Mining |
$61.6 |
$102.5 |
$164.1 |
$69.9 |
$88.3 |
$158.1 |
($6.0) |
(4%) |
|
Mineral Processing Plant |
37.8 |
3.1 |
40.9 |
48.0 |
|
48.0 |
5.0 |
17% |
|
Site Infrastructure |
24.5 |
|
47.6 |
47.6 |
|
47.6 |
21.7 |
94% |
|
Total Direct Costs |
123.9 |
105.6 |
229.5 |
165.5 |
88.3 |
253.7 |
24.1 |
11% |
|
Owner Costs |
21.7 |
|
21.7 |
27.6 |
|
27.6 |
5.9 |
27% |
|
Project Indirect Costs |
17.2 |
|
17.2 |
19.9 |
|
19.9 |
2.7 |
16% |
|
Contingency |
12.2 |
|
12.2 |
17.6 |
|
17.6 |
5.4 |
45% |
|
Total Indirect Costs |
51.1 |
|
51.1 |
65.1 |
|
65.1 |
14.0 |
27% |
|
Total (Direct & Indirect) |
$175.0 |
$105.6 |
$280.6 |
$230.5 |
$88.30 |
$318.8 |
$38.10 |
14% |
The increased operating scale and optimization should result in slightly lower operating costs on a per tonne basis compared to the Terronera Feasibility Study. Below is a summary of the optimization work that has been completed on the project cost structure and key components:
• The mine design has been redesigned and mine plan optimized to reduce initial underground mine access development including changing portal locations. These changes were aimed at increasing development efficiencies, improving early ventilation, and reducing surface haulage. Pre-production development quantities increased for scaling the mine to 2,000 tpd.
• The processing plant and tailing storage facility initial capital expenditures have increased primarily for equipment required to achieve 2,000 tpd. These include a SAG Mill, concentrate regrind, and an additional tailings filter. Additional increases have resulted from inflationary costs for steel and other required materials for construction. Further metallurgical testing completed during the basic engineering design phase for the process plant indicate increased estimated silver and gold recoveries by 1.6% and 2.5% respectively, compared to the recoveries in the Terronera Feasibility Study. Certain sustaining capital costs in the Terronera Feasibility Study are now included as operating costs.
• Site infrastructure now includes the Company's ownership of the liquified natural gas ("LNG") vaporization and power generation equipment rather than leasing, which was included as an operating lease in the Terronera Feasibility Study. The site infrastructure increase from the Terronera Feasibility Study is also due to additional access road improvements.
• The owner's costs, project indirect costs and contingency increased based on updated estimates of detailed engineering and overhead expenses. The contingency estimate was revised based on updated quotes and increased confidence in certain estimates and committed costs to date.
The Company is well-financed to satisfy the financing requirements of the Project, having already invested over $58 million in direct development expenditures to the end of Q1 2023. However, the Company may consider various additional alternatives to raise the required projected capital as required by the terms of the Debt Facility, including a potential cost overrun facility. The revised metrics for the 2,000 tpd plant as compared to the 1,700 tpd plant contained in the 2021 Terronera Feasibility Study are set out in the following table. The Company does not consider these changes to be material to the Company.
| 2023 Revised 2,000 TPD Plant Compared to 2021 FS | Internal - FS Change | |||||
| 2023 | 2021 | % Change | ||||
| Silver Price | $20.00 | $20.00 | 0% | |||
| Gold Price | $1,575 | $1,575 | 0% | |||
| Silver: Gold Ratio | 79 | 79 | 0% | |||
| Operating Statistics | ||||||
| LOM Tonnes Processed LOM (thousands) | 7,382 | 7,380 | 0% | |||
| Life of Mine (Years) | 10.0 | 12.0 | (17%) | |||
| Average silver grade (g/t) | 196 | 197 | (1%) | |||
| Average gold grade (g/t) | 2.13 | 2.25 | (5%) | |||
| Silver equivalent grade (g/t)(1) | 364 | 374 | (3%) | |||
| Average silver recovery | 89.5% | 87.7% | 2% | |||
| Average gold recovery | 78.7% | 76.3% | 2% | |||
| LOM payable Ag ounces produced (millions) | 39.9 | 39.3 | 0% | |||
| LOM payable Au ounces produced (thousands) | 384 | 393 | (2%) | |||
| LOM payable Ag Eq ounces produced (millions) | 69.7 | 70.3 | (1%) | |||
| Avg annual payable Ag ounces produced (millions) | 4.0 | 3.3 | 20% | |||
| Avg annual payable Au ounces produced (thousands) | 38 | 33 | 17% | |||
| Avg annual payable Ag Eq ounces produced (millions) | 7.0 | 5.9 | 18% | |||
| Capital Expenditure Statistics | ||||||
| Initial Capital Expenditure (millions) | 230.4 | 175.0 | 32% | |||
| Process Capacity (tonnes per day) | 1,990 | 1,700 | 17% | |||
| LOM Sustaining Capital | 88.3 | 105.6 | (16%) | |||
| Total LOM Project Capital | 318.7 | 280.6 | 14% | |||
| Operating Cost Metrics (2) | ||||||
| LOM Gross Revenue (millions) | 1,403.2 | 1,406.2 | 0% | |||
| LOM Gross COS (millions) | 596.4 | 642.5 | (7%) | |||
| LOM EBITDA (millions) | 806.9 | 756.6 | 7% | |||
| After Tax LOM Free Cash Flow (millions) | 316.9 | 311.4 | 2% | |||
| Cash costs by Product (per silver ounce) | (0.20) | 0.59 | (134%) | |||
| All in sustaining (per silver ounce) | 2.15 | 3.24 | (34%) | |||
| Cash costs by Silver Equivalent (per silver ounce) | 8.50 | 9.14 | (7%) | |||
| All in sustaining Silver equivalents (per silver ounce) | 9.84 | 10.62 | (7%) | |||
| Total Direct Production Costs (per Tonne) | 80.43 | 87.06 | (8%) | |||
| Mining Costs (per tonne) | 29.26 | 30.96 | (7%) | |||
| Processing Costs (per tonne) | 23.38 | 25.47 | (8%) | |||
| General and Administrative (per tonne) | 9.32 | 10.90 | (14%) | |||
| Treatment & Refining Charges (per tonne) | 14.36 | 15.26 | (6%) | |||
| Royalty Costs (per tonne) | 4.47 | 4.46 | 0% | |||
(1) Silver equivalents are calculated using an 79:1 (silver/gold) ratio.
(2) Non-GAAP measures - See Non-IFRS measures beginning on page 16 for an explanation of these measures
Construction and Development Highlights
Early works have been underway since the first quarter of 2022, with more than $58 million of the budget spent to date. As at March 31, 2023, site works and activities to date have been, but are not limited to:
• Personnel - Onsite personnel has increased to 160 employees and contractors. As site activities ramp up, the Company continues to further advance its Health and Safety practices and protocols by harmonizing the "Te Cuido" safety culture across the Company. The Company has expanded its technical and finance teams at the project while ramping up engineering and construction activities.
• Detail engineering - The contract has been awarded to M3 Engineering & Technology and is expected to be completed in Q3 2023.
• Mobile mining equipment - The Company has received 30 mobile mining units including development jumbos, bolters, scoops, dump trucks, scissor lifts and other support equipment such as pallets and cranes, which the Company plans to use to self-perform mine development.
• Plant equipment purchases - Major equipment has been ordered with the majority of the items scheduled to arrive in Q2 2023, including the full grinding circuit. The remaining items, including the flash floatation, rougher/ cleaner float cells and filter press, will arrive in Q4, 2023. The ball mill, purchased earlier in the project, is awaiting transport to site from the Company's warehouse facilities in Puerto Vallarta, Mexico.
• Access road construction - Significant road upgrade work totalling over 7 km, primarily involving slope stabilization and drainage, has been completed for access to the mill site and mine portals. Completion of this work is planned for Q3 2023 prior to the significant increase in equipment and materials deliveries as major construction begins on the mill.
• Permanent camp construction - Installation is underway for facilities that will accommodate 550 personnel. It is expected that the permanent camp will be operational in H1 2023. Installed to date: training room, clinic, dining room/ kitchen/ gym, laundry and 2 out of 5 living modules.
• Plant site preparation - Ongoing work includes excavation and site levelling prior to mobilizing for concrete work. Work is well advanced and on track to allow other major construction activities to start before the rainy season.
• Underground Development - Portal #2 Site preparation has been completed and underground development is advancing. In addition, mine support modules have been mobilized at site as the project moves forward with ramping up development. Portal #1 site preparation will commence in Q2, 2023 with underground advancement expected in Q3, 2023.
• Initial project infrastructure - The temporary mine maintenance shop is operational and field offices have been installed at the mill site for improved construction oversight.
Project Timeline and Next Steps
The Company is focused on advancing its Terronera Project for achieving initial production in Q4 2024. Upcoming major milestones include:
• Completing detail engineering and expediting mill and infrastructure procurement;
• Finalizing earthworks and beginning concrete work prior to starting mechanical, piping and electrical work;
• Completing permanent camp and initiating site infrastructure construction including warehouse, assay lab, and mill, mine and admin offices;
• Commencing construction of engineering tailing storage facility and liquefied natural gas (LNG) vaporization plant along with gas-fired gensets; and
• Advancing mine development and underground infrastructure installations.
EXPLORATION RESULTS
At Guanaceví, the Company drilled 2,607 metres in 9 holes at a total expense of $0.4 million to delineate extensions of the El Curso mineralized zone. Drilling confirmed expectations and intersected significant mineralization with similar grades and vein widths to historical results.
At Bolañitos, the Company drilled 2,642 metres in 15 holes at a total expense of $0.3 million to target the Candelaria and El Puertocito veins in the Golondrinas area located in Bolañitos South. The Company intersected significant mineralization with resource average grades over mineable widths.
At Terronera, geological mapping was conducted in the El Padre, Katia and Ermita areas.
At Parral, the Company drilled 7 holes totalling 1,845 metres, with a cost of $0.4 million to continue targeting various areas of the San Patricio vein and conducted geological mapping activities. Management will continue the exploration program in 2023 with the intention to expand the resource estimate published in December 2019 and initiate an economic study in 2023.
At Pitarrilla, the Company continued underground development to advance the kilometre long decline and lateral drifts that will be used to drill 5,000 metres to test the resource ("underground manto") at various angles and conducted geological mapping activities.
In Chile, the Company conducted mapping sampling and surface exploration and preparation for drilling at the Aida project.
CONSOLIDATED FINANCIAL RESULTS
Three months ended March 31, 2023 (compared to the three months ended March 31, 2022)
In Q1, 2023, the Company's mine operating earnings were $16.0 million (Q1, 2022 - $20.3 million) on revenue of $55.5 million (Q1, 2022 - $57.7 million) with cost of sales of $39.5 million (Q1, 2022 - $37.4 million).
In Q1, 2023, the Company had operating earnings of $6.9 million (Q1, 2022 -$12.6 million) after exploration and evaluations costs of $4.2 million (Q1, 2022 - $3.2 million), general and administrative expense of $4.9 million (Q1, 20221 -$4.3 million). In the three months ended March 31, 2022 operating earnings also included $0.2 million in care and maintenance costs related to the suspension of the operations at the El Compas mine.
The earnings before taxes for Q1, 2023 was $12.5 million (Q1, 2022 -$18.9 million) after finance costs of $0.4 million (Q1, 2022
- $0.3 million), a foreign exchange gain of $1.9 million (Q1, 2022 -$0.8 million) and investment and other income of $4.0 million (Q1, 2022 -investment and other income of $5.8 million). The Company realized net earnings for the period of $6.5 million (Q1, 2022 -$11.7 million) after an income tax expense of $6.1 million (Q1, 2022 - $7.2 million).
Revenue of $55.5 million in Q1, 2023, net of $0.6 million of smelting and refining costs, decreased by 4% compared to $57.7 million, net of $0.7 million of smelting and refining costs, in Q1, 2022. Gross sales of $56.1 million in Q1, 2023 represented a 4% decrease over the $58.4 million for the same period in 2021. Silver oz sold decreased 3% due to the sales in Q1 2022 of finished goods inventory at December 31, 2021 which included significantly more silver ounces compared to December 31, 2022 partially offset by a reduction in finished goods held as at March 31, 2023 compared to March 31, 2022. The 3% decrease in ounces sold during the period, combined with a 5% decrease in the realized silver price resulted in an 8% decrease to silver sales. Gold oz sold increased 9% with a 3% decrease in realized gold prices resulting in a 6% increase in gold sales. Gold oz sold increased 9% primarily due to the 7% increase in gold ounces produced with some impact also due to the timing of sales of finished goods inventory. During the period, the Company sold 1,667,408 oz silver and 9,126 oz gold, for realized prices of $23.16 and $1,917 per oz, respectively, compared to sales of 1,717,768 oz silver and 8,381 oz gold, for realized prices of $24.38 and $1,970 per oz, respectively, in the same period of 2022. For the three months ended March 31, 2023, the realized prices of silver and gold were within 3% of the London spot prices. Silver and gold London spot prices averaged $22.55 and $1,890, respectively, during the three months ended March 31, 2023.
The Company decreased its finished goods silver to 471,069 oz silver and slightly increased it finished goods gold inventory to 1,766 oz gold, at March 31, 2023 compared to 530,250 oz silver and 1,707 oz gold at December 31, 2022. The cost allocated to these finished goods was $7.4 million at March 31, 2023, compared to $6.1 million at December 31, 2022 and $13.5 million at March 31, 2022. At March 31, 2023, the finished goods inventory fair market value was $14.7 million, compared to $15.8 million at December 31, 2022.
Cost of sales for Q1, 2023 was $39.5 million, an increase of 6% over the cost of sales of $37.4 million for Q1, 2022. The cost of sales in Q1, 2023 was impacted by a strengthened Mexican peso, higher labour, power and consumables costs as the Company, as well as the industry, has experienced significant inflationary pressures. Additionally, the Company incurred increased royalty costs recognized during Q1, 2023 compared to the prior period as a higher percentage of the production at Guanacevi has come from the El Curso and El Porvenir concessions, which are subject to royalties.
Exploration and evaluation expenses were $4.2 million, increase of 31% compared to $3.2 million incurred in the same period of 2022 primarily due to the additional exploration expenditures on the newly acquired Pitarrilla project and timing of exploration activities. General and administrative expenses of $4.9 million in Q1 2023 were 14% higher compared to the $4.3 million incurred for the same period of 2022, primarily due to investment in a new ERP system.
The Company incurred a foreign exchange gain of $1.9 million in Q1, 2023 compared to a foreign exchange gain of $0.8 million in Q1, 2022 due to a strengthening of the Mexican peso during the quarter which increases the US dollar value of Mexican peso denominated working capital. The Company incurred $0.4 million in finance charges primarily from interest on loans related to mobile equipment and accretion of reclamation and rehabilitation liabilities compared to $0.3 million in the same period in 2022. The Company recognized $4.0 million in investment and other income compared to $5.8 million in investment and other income in Q1, 2022, primarily resulting from recognizing an unrealized gain on marketable securities and warrants of $3.1 million (Q1, 2022 - gain of $5.4 million), $0.5 million in interest income (Q1, 2022 - $0.1 million), $0.3 million in royalty income (Q1, 2022 - $0.1 million) and $0.1 million in other income (Q2, 2022 - other income of $0.2 million).
Income tax expense was $6.1 million in Q1, 2023 compared to $7.2 million in Q1, 2022. The $6.1 million tax expense is comprised of $4.4 million in current income tax expense (Q1, 2022 - $1.0 million) and $1.7 million in deferred income tax expense (Q1, 2022 - $6.2 million). The current income tax expense consists of $1.3 million in special mining duty taxes and $3.1 million of income taxes. The deferred income tax expense of $1.7 million is derived from changes in temporary timing differences between deductions for accounting versus deductions for tax. During 2022, the changes in deferred taxes were driven primarily by the utilization of loss carryforwards at Guanacevi and during 2023 there were no further loss carryforwards available to offset against current income tax.
NON-IFRS MEASURES
Non-IFRS and Other Financial Measures and Ratios
We have included certain non-IFRS financial measures and ratios in this MD&A, as discussed below. We believe that these measures, in addition to conventional measures prepared in accordance with IFRS, provide investors an improved ability to evaluate the underlying performance of the Company. The non-IFRS measures and ratios are intended to provide additional information and should not be considered in isolation or as a substitute for measures of performance prepared in accordance with IFRS. These financial measures and ratios do not have any standardized meaning prescribed under IFRS, and therefore may not be comparable to other issuers.
Non-IFRS financial measures are defined in National Instrument 52-112 - Non-GAAP and Other Financial Measures Disclosure ("NI 52-112") as a financial measure disclosed that (a) depicts the historical or expected future financial performance, financial position or cash flow of an entity, (b) with respect to its composition, excludes an amount that is included in, or includes an amount that is excluded from, the composition of the most directly comparable financial measure disclosed in the primary financial statements of the entity, (c) is not disclosed in the financial statements of the entity, and (d) is not a ratio, fraction, percentage or similar representation.
A non-IFRS ration is defined by 52-112 as a financial measure disclosed that (a) is in the form of a ratio, fraction, percentage or similar representation, (b) has a non-IFRS financial measure as one or more of its components, and (c) is not disclosed in the financial statements.
Working capital is a non-IFRS measure that is a common measure of liquidity but does not have any standardized meaning. The most directly comparable measure prepared in accordance with IFRS is current assets and current liabilities. Working capital is calculated by deducting current liabilities from current assets. Working capital should not be considered in isolation or as a substitute from measures prepared in accordance with IFRS. The measure is intended to assist readers in evaluating our liquidity.
| Expressed in thousands US dollars | As at March 31, 2023 | As at December 31, 2022 | ||||
| Current assets | $138,862 | $146,333 | ||||
| Current liabilities | 46,049 | 52,749 | ||||
| Working capital | $92,813 | $93,584 |
Adjusted earnings and adjusted earnings per share ("EPS") are non-IFRS measures that supplement information to the Company's consolidated financial statements. The Company believes that, in addition to the conventional measures prepared in accordance with IFRS, the Company and certain investors and analysts use this information to evaluate the Company's underlying core operating performance. The presentation of adjusted earnings and adjusted earnings per share is not meant to be a substitute of net income and net income per share presented in accordance with IFRS, but rather should be evaluated in conjunction with such IFRS measures.
The Company defines the adjusted earnings as net income adjusted to include certain non-cash and unusual item, and items that in the Company's judgement are subject to volatility as a result of factors which are unrelated to the Company's operation in the period. Certain items that become applicable in a period may be adjusted for, with the Company retroactively presenting comparable periods with an adjustment for such items and, conversely, items no longer applicable may be removed from the calculation. During the current period, the Company has included changes in the fair value of its investments in marketable securities and made retroactive adjustments to prior periods for the same. The following table provides a detailed reconciliation of net income as reported in the Company's financial statement to adjusted earnings and adjusted earnings per share.
| Expressed in thousands US dollars | Three Months Ended March 31 | |||||
| (except for share numbers and per share amounts) | 2023 | 2022 | ||||
| Net earnings (loss) for the period per financial statements | $6,456 | $11,662 | ||||
| Change in fair value of investments | 3,097 | 5,357 | ||||
| Adjusted net earnings (loss) | $9,553 | $17,019 | ||||
| Basic weighted average share outstanding | 190,274,768 | 171,557,220 | ||||
| Adjusted net earnings (loss) per share | $0.05 | $0.10 | ||||
Mine operating cash flow before taxes is a non-IFRS measure that does not have a standardized meaning prescribed by IFRS and therefore may not be comparable to similar measures presented by other issuers. Mine operating cash flow is calculated as revenue minus direct production costs and royalties. Mine operating cash flow is used by management to assess the performance of the mine operations, excluding corporate and exploration activities and is provided to investors as a measure of the Company's operating performance.
| Expressed in thousands US dollars | Three Months Ended March 31 | |||||
| 2023 | 2022 | |||||
| Mine operating earnings per financial statements | $16,025 | $20,269 | ||||
| Share-based compensation | 132 | 127 | ||||
| Amortization and depletion | 6,253 | 6,306 | ||||
| Mine operating cash flow before taxes | $22,410 | $26,702 | ||||
Operating cash flow before working capital changes per share is a non-IFRS measure that does not have a standardized meaning prescribed by IFRS and therefore may not be comparable to similar measures presented by other issuers. Operating cash flow per share is calculated by dividing cash from operating activities by the weighted average shares outstanding. Operating cash flow per share is used by management to assess operating performance on a per share basis, irrespective of working capital changes and is provided to investors as a measure of the Company's operating performance.
| Expressed in thousands US dollars | Three Months Ended March 31 | Three Months Ended March 31 | ||||||||
| (except for per share amounts) | 2023 | 2022 | 2023 | 2022 | ||||||
| Cash from (used in) operating activities per financial statements | ($401) | $21,733 | ($401) | $21,733 | ||||||
| Net changes in non-cash working capital per financial statements | (12,902) | 1,114 | (12,902) | 1,114 | ||||||
| Operating cash flow before working capital changes | $12,501 | $20,619 | $12,501 | $20,619 | ||||||
| Basic weighted average shares outstanding | 190,274,768 | 171,557,220 | 190,274,768 | 171,557,220 | ||||||
| Operating cash flow before working capital changes per share | $0.07 | $0.12 | $0.07 | $0.12 | ||||||
EBITDA is a non-IFRS financial measure, which excludes the following from net earnings:
• Income tax expense;
• Finance costs;
• Amortization and depletion.
Adjusted EBITDA excludes the following additional items from EBITDA:
• Share based compensation;
• Non-recurring impairments (reversals);
• Change in fair value of investments;
• Significant non-routine items.
Adjusted EBITDA per share is calculated by dividing Adjusted EBITDA by the basic weighted average number of shares outstanding for the period.
Management believes EBITDA is a valuable indicator of the Company's ability to generate liquidity by producing operating cash flow to fund working capital needs, service debt obligations, and fund capital expenditures. Management uses EBITDA for this purpose. EBITDA is also frequently used by investors and analysts for valuation purposes whereby EBITDA is multiplied by a factor or "EBITDA multiple" based on an observed or inferred relationship between EBITDA and market values to determine the approximate total enterprise value of a Company.
EBITDA is intended to provide additional information to investors and analysts. It does not have any standardized definition under IFRS and should not be considered in isolation or as a substitute for measures of operating performance prepared in accordance with IFRS. EBITDA excludes the impact of cash costs of financing activities and taxes, and the effects of changes in operating working capital balances, and therefore is not necessarily indicative of operating profit or cash flow from operations as determined by IFRS. Other companies may calculate EBITDA and Adjusted EBITDA differently.
Certain items that become applicable in a period may be adjusted for, with the Company retroactively presenting comparable periods with an adjustment for such items and, conversely, items no longer applicable may be removed from the calculation. During the current period, the Company has included changes in the fair value of its investments in marketable securities and made retroactive adjustments to prior periods for the same
| Expressed in thousands US dollars | Three Months Ended March 31 | |||||
| 2023 | 2022 | |||||
| Net earnings (loss) for the period per financial statements | $6,456 | $11,662 | ||||
| Depreciation and depletion - cost of sales | 6,253 | 6,306 | ||||
| Depreciation and depletion - exploration | 278 | 107 | ||||
| Depreciation and depletion - general & administration | 62 | 48 | ||||
| Depreciation and depletion - care & maintenance | - | 30 | ||||
| Finance costs | 259 | 177 | ||||
| Current income tax expense | 4,445 | 1,015 | ||||
| Deferred income tax expense | 1,676 | 6,222 | ||||
| EBITDA | $19,429 | $25,567 | ||||
| Share based compensation | 1,625 | 1,527 | ||||
| Change in fair value of investments | 3,097 | 5,357 | ||||
| Adjusted EBITDA | $24,151 | $32,451 | ||||
Cash costs per silver oz, total production costs per oz, direct operating costs per tonne and direct costs per tonne are measures developed by precious metals companies in an effort to provide a comparable standard; however, there can be no assurance that the Company's reporting of these non-IFRS measures and ratios are similar to those reported by other mining companies. Cash costs per oz, total production costs per oz and direct costs per tonne are measures used by the Company to manage and evaluate operating performance at each of the Company's operating mining units. They are widely reported in the silver mining industry as a benchmark for performance, but do not have a standardized meaning and are disclosed in addition to IFRS measures. Direct operating costs include mining, processing (including smelting, refining, transportation and selling costs) and direct overhead at the operation sites. Direct costs include all direct operating costs plus royalties and special mining duty. Cash costs include all direct costs less by-product gold sales and changes in finished gold inventories. Total production costs include all cash costs plus amortization and depletion, changes in amortization and depletion in finished goods inventory and site share- based compensation. Cash costs per silver ounce and total production costs per ounce are calculated by dividing cash costs and total production costs by the payable silver ounces produced. Direct operating cost per tonne and direct costs per tonne are calculated by dividing direct operating costs and direct costs by the number of processed tonnes. The following tables provide a detailed reconciliation of these measures to the Company's direct production costs, as reported in its consolidated financial statements.
| Expressed in thousands US dollars | Three Months Ended March 31, 2023 | Three Months Ended March 31, 2022 | |||||
| Guanaceví | Bolañitos | Total | Guanaceví | Bolañitos | Total | ||
| Direct production costs per financial statements | 18,145 | 8,371 | 26,516 | 17,884 | 8,837 | 26,721 | |
| Smelting and refining costs included in net revenue | - | 656 | 656 | - | 654 | 654 | |
| Opening finished goods | (4,953) | (245) | (5,198) | (10,093) | (2,857) | (12,950) | |
| Closing finished goods | 4,848 | 1,063 | 5,911 | 7,908 | 2,995 | 10,903 | |
| Direct operating costs | 18,040 | 9,845 | 27,885 | 15,699 | 9,629 | 25,328 | |
| Royalties | 6,471 | 64 | 6,535 | 4,234 | 83 | 4,317 | |
| Special mining duty (1) | 1,270 | 85 | 1,355 | 731 | 244 | 975 | |
| Direct costs | 25,781 | 9,994 | 35,775 | 20,664 | 9,956 | 30,620 | |
| By-product gold sales | (8,433) | (9,064) | (17,497) | (5,022) | (11,488) | (16,510) | |
| Opening gold inventory fair market value | 2,740 | 354 | 3,094 | 1,900 | 4,784 | 6,684 | |
| Closing gold inventory fair market value | (2,500) | (995) | (3,495) | (3,724) | (3,763) | (7,487) | |
| Cash costs net of by-product | 17,588 | 289 | 17,877 | 13,818 | (511) | 13,307 | |
| Amortization and depletion | 3,474 | 2,779 | 6,253 | 3,910 | 2,396 | 6,306 | |
| Share-based compensation | 66 | 66 | 132 | 63 | 64 | 127 | |
| Opening finished goods depreciation and depletion | (862) | (60) | (922) | (1,965) | (635) | (2,600) | |
| Closing finished goods depreciation and depletion | 1,115 | 355 | 1,470 | 1,689 | 897 | 2,586 | |
| Total production costs | $21,381 | $3,429 | $24,810 | $17,515 | $2,211 | $19,726 | |
| Three Months Ended March 31, 2023 | Three Months Ended March 31, 2022 | ||||||
| Guanaceví | Bolañitos | Total | Guanaceví | Bolañitos | Total | ||
| Throughput tonnes | 102,375 | 108,698 | 211,073 | 101,253 | 104,894 | 206,147 | |
| Payable silver ounces | 1,435,604 | 172,608 | 1,608,212 | 1,130,448 | 173,092 | 1,303,540 | |
| Cash costs per silver ounce | $12.25 | $1.67 | $11.12 | $12.22 | ($2.95) | $10.21 | |
| Total production costs per ounce | $14.89 | $19.87 | $15.43 | $15.49 | $12.77 | $15.13 | |
| Direct operating costs per tonne | $176.21 | $90.57 | $132.11 | $155.05 | $91.80 | $122.86 | |
| Direct costs per tonne | $251.83 | $91.94 | $169.49 | $204.08 | $94.91 | $148.53 | |
| (1) Special mining duty is an EBITDA royalty tax presented as a current income tax in accordance with IFRS. | |||||||
| Expressed in thousands US dollars | March 31, 2023 | March 31, 2022 | |||||
| Guanaceví | Bolañitos | Total | Guanaceví | Bolañitos | Total | ||
| Closing finished goods | 4,848 | 1,063 | 5,911 | 7,908 | 2,995 | 10,903 | |
| Closing finished goods depletion | 1,115 | 355 | 1,470 | 1,689 | 897 | 2,586 | |
| Finished goods inventory | $5,963 | $1,418 | $7,381 | $9,597 | $3,892 | $13,489 | |
AISC per oz and all-in costs per oz are measures developed by the World Gold Council (and used as a standard of the Silver Institute) in an effort to provide a comparable standard within the precious metal industry; however, there can be no assurance that the Company's reporting of these non-IFRS measures are similar to those reported by other mining companies. These measures are used by the Company to manage and evaluate operating performance at each of the Company's operating mining units and consolidated group, and are widely reported in the silver mining industry as a benchmark for performance, but do not have a standardized meaning and are disclosed in addition to IFRS measures. The following tables provide a detailed reconciliation of these measures to the Company's cost of sales, as reported in the Company's consolidated financial statements.
| Expressed in thousands US dollars | Three Months Ended March 31, 2023 | Three Months Ended March 31, 2022 | |||||
| Guanaceví | Bolañitos | Total | Guanaceví | Bolañitos | Total | ||
| Cash costs net of by-product | $17,588 | $289 | $17,877 | $13,818 | ($511) | $13,307 | |
| Operations share-based compensation | 66 | 66 | 132 | 63 | 64 | 127 | |
| Corporate general and administrative | 2,616 | 878 | 3,494 | 2,067 | 876 | 2,943 | |
| Corporate share-based compensation | 1,019 | 342 | 1,361 | 917 | 389 | 1,306 | |
| Reclamation - amortization/accretion | 79 | 62 | 141 | 65 | 53 | 118 | |
| Mine site expensed exploration | 379 | 313 | 692 | 352 | 250 | 602 | |
| Intangible payments | - | - | - | 29 | 12 | 41 | |
| Equipment loan payments | 245 | 487 | 732 | 245 | 489 | 734 | |
| Capital expenditures sustaining | 5,690 | 2,301 | 7,991 | 5,646 | 2,426 | 8,072 | |
| All-In-Sustaining Costs | $27,682 | $4,738 | $32,420 | $23,202 | $4,048 | $27,250 | |
| Growth exploration and evaluation | 3,063 | 2,413 | |||||
| Growth capital expenditures | 12,726 | 4,925 | |||||
| All-In-Costs | $48,209 | $34,588 | |||||
|
|
Three Months Ended March 31, 2023 |
Three Months Ended March 31, 2022 |
|||||
|
|
Guanaceví |
Bolañitos |
Total |
Guanaceví |
Bolañitos |
Total |
|
|
Throughput tonnes |
102,375 |
108,698 |
211,073 |
101,253 |
104,894 |
206,147 |
|
|
Payable silver ounces |
1,435,604 |
172,608 |
1,608,212 |
1,130,448 |
173,092 |
1,303,540 |
|
|
Silver equivalent production (ounces) |
1,774,964 |
595,941 |
2,370,905 |
1,412,010 |
598,545 |
2,010,555 |
|
|
Sustaining cost per ounce |
$19.28 |
$27.45 |
$20.16 |
$20.52 |
$23.39 |
$20.90 |
|
|
All-In-costs per ounce |
|
|
$29.98 |
|
|
$26.53 |
|
|
Expressed in thousands US dollars |
Three Months Ended March 31 |
|
|
|
2023 |
2022 |
|
Capital expenditures sustaining |
$7,991 |
$8,072 |
|
Growth capital expenditures |
12,726 |
4,925 |
|
Property, plant and equipment expenditures per Consolidated Statement of Cash Flows |
$20,717 |
$12,997 |
|
|
|
|
|
Expressed in thousands US dollars |
Three Months Ended March 31 |
|
|
|
2023 |
2022 |
|
Mine site expensed exploration |
$692 |
$602 |
|
Growth exploration and evaluation |
3,063 |
2,413 |
|
Total exploration and evaluation |
3,755 |
3,015 |
|
Exploration depreciation and depletion |
278 |
107 |
|
Exploration share-based compensation |
131 |
94 |
|
Exploration and evaluation expense |
$4,164 |
$3,216 |
Silver co-product cash costs and gold co-product cash costs are measures used by the Company to manage and evaluate operating performance at each of the Company's operating mining units and consolidated group, but do not have a standardized meaning and are disclosed in addition to IFRS measures. The following tables provide a detailed reconciliation of these measures to the Company's cost of sales, as reported in its consolidated financial statements.
| Expressed in thousands US dollars | Three Months Ended March 31, 2023 | Three Months Ended March 31, 2022 | |||||
| Guanaceví | Bolañitos | Total | Guanaceví | Bolañitos | Total | ||
| Direct production costs per financial statements | $18,145 | $8,371 | $26,516 | $17,884 | $8,837 | $26,721 | |
| Smelting and refining costs included in net revenue | - | 656 | 656 | - | 654 | 654 | |
| Royalties | 6,471 | 64 | 6,535 | 4,234 | 83 | 4,317 | |
| Special mining duty (1) | 1,270 | 85 | 1,355 | 731 | 244 | 975 | |
| Opening finished goods | (4,953) | (245) | (5,198) | (10,093) | (2,857) | (12,950) | |
| Closing finished goods | 4,848 | 1,063 | 5,911 | 7,908 | 2,995 | 10,903 | |
| Direct costs | $25,781 | $9,994 | $35,775 | $20,664 | $9,956 | $30,620 | |
| Three Months Ended March 31, 2023 | Three Months Ended March 31, 2022 | ||||||
| Guanaceví | Bolañitos | Total | Guanaceví | Bolañitos | Total | ||
| Silver production (ounces) | 1,439,924 | 183,621 | 1,623,545 | 1,133,850 | 181,105 | 1,314,955 | |
| Average realized silver price ($) | 23.16 | 23.16 | 23.16 | 24.38 | 24.38 | 24.38 | |
| Silver value ($) | 33,351,084 | 4,252,974 | 37,604,058 | 27,643,263 | 4,415,340 | 32,058,603 | |
| Gold production (ounces) | 4,188 | 5,154 | 9,342 | 3,477 | 5,218 | 8,695 | |
| Average realized gold price ($) | 1,917 | 1,917 | 1,917 | 1,970 | 1,970 | 1,970 | |
| Gold value ($) | 8,029,524 | 9,881,606 | 17,911,130 | 6,849,690 | 10,279,460 | 17,129,150 | |
| Total metal value ($) | 41,380,608 | 14,134,580 | 55,515,189 | 34,492,953 | 14,694,800 | 49,187,753 | |
| Pro-rated silver costs (%) | 81% | 30% | 68% | 80% | 30% | 65% | |
| Pro-rated gold costs (%) | 19% | 70% | 32% | 20% | 70% | 35% | |
| Pro-rated silver costs ($) | 20,778 | 3,007 | 24,233 | 16,560 | 2,991 | 19,957 | |
| Pro-rated gold costs ($) | 5,003 | 6,987 | 11,542 | 4,104 | 6,965 | 10,663 | |
| Silver co-product cash costs ($) | 14.43 | 16.38 | 14.93 | 14.61 | 16.52 | 15.18 | |
| Gold co-product cash costs ($) | 1,194 | 1,356 | 1,236 | 1,180 | 1,335 | 1,226 | |
(1) Special mining duty is an EBITDA royalty tax presented as a current income tax in accordance with IFRS.
QUARTERLY RESULTS AND TRENDS
The following table presents selected financial information for each of the most recent eight quarters:
|
Table in thousands of U.S. dollars except for share |
2023 |
|
2022 |
|
|
2021 |
|
|
|
numbers and per share amounts |
Q1 |
Q4 |
Q3 |
Q2 |
Q1 |
Q4 |
Q3 |
Q2 |
|
Gross Sales |
$56,117 |
$82,683 |
$40,393 |
$31,719 |
$58,394 |
$48,875 |
$34,954 |
$48,357 |
|
Smelting and refining costs included in net revenue |
656 |
694 |
744 |
937 |
654 |
358 |
392 |
582 |
|
Total Revenue |
55,461 |
81,989 |
39,649 |
30,782 |
57,740 |
48,517 |
34,562 |
47,775 |
|
Direct production costs |
26,516 |
42,821 |
24,510 |
19,828 |
26,721 |
26,013 |
18,639 |
26,223 |
|
Royalties |
6,535 |
8,479 |
2,821 |
2,194 |
4,317 |
4,285 |
2,698 |
4,340 |
|
Mine operating cash flow before taxes |
22,410 |
30,689 |
12,318 |
8,760 |
26,702 |
18,219 |
13,225 |
17,212 |
|
Share-based compensation |
132 |
89 |
113 |
113 |
127 |
87 |
105 |
111 |
|
Amortization and depletion |
6,253 |
8,945 |
5,753 |
4,175 |
6,306 |
5,014 |
4,843 |
6,624 |
|
Write down on inventory |
- |
- |
1,323 |
- |
- |
896 |
- |
272 |
|
Mine operating earnings (loss) |
$16,025 |
$21,655 |
$5,129 |
$4,472 |
$20,269 |
$12,222 |
$8,277 |
$10,205 |
|
Basic earnings (loss) per share |
$0.03 |
$0.04 |
($0.01) |
($0.07) |
$0.07 |
$0.00 |
($0.03) |
$0.04 |
|
Diluted earnings (loss) per share |
$0.03 |
$0.04 |
($0.01) |
($0.07) |
$0.07 |
$0.00 |
($0.03) |
$0.04 |
|
Weighted shares outstanding |
190,274,768 |
189,993,085 |
189,241,367 |
180,974,609 |
171,557,220 |
170,518,894 |
170,432,326 |
168,383,755 |
|
Net earnings (loss) |
$6,456 |
$7,961 |
($1,499) |
($11,923) |
$11,662 |
($471) |
($4,479) |
$6,656 |
|
Amortization and depletion |
6,593 |
9,279 |
5,963 |
4,354 |
6,491 |
5,194 |
4,986 |
6,723 |
|
Finance costs |
259 |
233 |
194 |
212 |
177 |
22 |
195 |
216 |
|
Current income tax |
4,445 |
2,850 |
1,186 |
1,325 |
1,015 |
1,005 |
659 |
1,146 |
|
Deferred income tax |
1,676 |
2,345 |
2,053 |
1,752 |
6,222 |
4,992 |
3,017 |
1,116 |
|
NRV cost adjustment |
- |
- |
- |
- |
- |
- |
|
6 |
|
EBITDA |
$19,429 |
$22,668 |
$7,897 |
($4,280) |
$25,567 |
$10,742 |
$4,378 |
$15,863 |
The following table presents selected production information for each of the most recent eight quarters:
|
Highlights |
2023 |
|
2022 |
|
2021 |
|
|
|
|
|
Q1 |
Q4 |
Q3 |
Q2 |
Q1 |
Q4 |
Q3 |
Q2 |
|
Processed tonnes |
211,073 |
224,289 |
202,745 |
201,361 |
206,147 |
213,492 |
222,461 |
242,018 |
|
Guanaceví |
102,375 |
119,305 |
97,728 |
94,017 |
101,253 |
108,334 |
105,496 |
111,893 |
|
Bolañitos |
108,698 |
104,984 |
105,017 |
107,344 |
104,894 |
105,158 |
107,752 |
107,912 |
|
El Compas |
- |
- |
- |
- |
- |
- |
9,213 |
22,213 |
|
Silver ounces |
1,623,545 |
1,830,835 |
1,458,448 |
1,359,207 |
1,314,955 |
1,443,199 |
1,305,399 |
1,073,724 |
|
Guanaceví |
1,439,924 |
1,680,363 |
1,332,190 |
1,194,150 |
1,133,850 |
1,301,941 |
1,174,168 |
939,241 |
|
Bolañitos |
183,621 |
150,472 |
126,258 |
165,057 |
181,105 |
141,258 |
123,883 |
120,044 |
|
El Compas |
- |
- |
- |
- |
- |
365 |
7,348 |
14,439 |
|
Silver grade |
279 |
296 |
248 |
246 |
231 |
235 |
204 |
163 |
|
Guanaceví |
511 |
512 |
468 |
465 |
407 |
417 |
387 |
308 |
|
Bolañitos |
61 |
50 |
43 |
54 |
61 |
48 |
41 |
39 |
|
El Compas |
- |
- |
- |
- |
- |
- |
24 |
30 |
|
Silver recovery |
85.7 |
85.8 |
90.3 |
85.4 |
85.9 |
89.4 |
89.3 |
84.9 |
|
Guanaceví |
85.6 |
85.6 |
90.6 |
85.0 |
85.6 |
89.6 |
89.5 |
84.8 |
|
Bolañitos |
86.1 |
89.2 |
87.0 |
88.6 |
88.0 |
87.0 |
87.2 |
88.7 |
|
El Compas |
- |
- |
- |
- |
- |
- |
103.4 |
67.4 |
|
Gold ounces |
9,342 |
10,370 |
9,194 |
9,289 |
8,695 |
9,446 |
10,541 |
11,166 |
|
Guanaceví |
4,188 |
4,936 |
3,642 |
3,680 |
3,477 |
3,885 |
3,605 |
3,084 |
|
Bolañitos |
5,154 |
5,434 |
5,552 |
5,609 |
5,218 |
5,502 |
6,215 |
6,753 |
|
El Compas |
- |
- |
N/A |
- |
- |
59 |
721 |
1,329 |
|
Gold grade |
1.56 |
1.57 |
1.60 |
1.58 |
1.46 |
1.52 |
1.57 |
1.63 |
|
Guanaceví |
1.42 |
1.44 |
1.29 |
1.37 |
1.19 |
1.21 |
1.13 |
0.98 |
|
Bolañitos |
1.70 |
1.72 |
1.88 |
1.77 |
1.73 |
1.83 |
1.98 |
2.14 |
|
El Compas |
- |
- |
- |
- |
- |
- |
1.81 |
2.45 |
|
Gold recovery |
88.0 |
91.5 |
88.4 |
90.6 |
89.6 |
90.8 |
93.9 |
87.9 |
|
Guanaceví |
89.6 |
89.4 |
89.9 |
88.9 |
89.8 |
92.2 |
94.1 |
87.5 |
|
Bolañitos |
86.8 |
93.6 |
87.5 |
91.8 |
89.4 |
88.9 |
90.6 |
91.0 |
|
El Compas |
- |
- |
- |
- |
- |
- |
134.5 |
76.0 |
|
Cash costs per oz (1) |
$11.12 |
$11.65 |
$10.32 |
$10.08 |
$10.21 |
$8.65 |
$8.16 |
$13.03 |
|
Guanaceví |
$12.25 |
$12.40 |
$10.64 |
$10.35 |
$12.22 |
$10.74 |
$10.40 |
$17.06 |
|
Bolañitos |
$1.67 |
$2.85 |
$6.73 |
$8.01 |
($2.95) |
($10.69) |
($16.82) |
($30.39) |
|
El Compas |
- |
- |
- |
- |
- |
- |
$49.17 |
$96.21 |
|
AISC per oz (1) |
$20.16 |
$19.38 |
$20.27 |
$19.56 |
$20.90 |
$19.48 |
$17.46 |
$25.39 |
|
Guanaceví |
$19.28 |
$18.05 |
$17.79 |
$17.66 |
$20.52 |
$18.74 |
$16.12 |
$24.68 |
|
Bolañitos |
$27.45 |
$35.06 |
$48.21 |
$34.10 |
$23.39 |
$27.46 |
$28.88 |
$19.56 |
|
El Compas |
- |
- |
- |
- |
- |
- |
$48.16 |
$123.73 |
|
Direct costs per tonne (1) |
$169.49 |
$177.35 |
$146.30 |
$148.11 |
$148.53 |
$136.62 |
$130.38 |
$141.61 |
|
Guanaceví |
$251.83 |
$249.23 |
$205.42 |
$201.84 |
$204.08 |
$193.87 |
$176.50 |
$193.09 |
|
Bolañitos |
$91.94 |
$95.67 |
$91.28 |
$101.05 |
$94.91 |
$77.68 |
$81.53 |
$81.69 |
|
El Compas |
- |
- |
- |
- |
- |
- |
$173.67 |
$173.37 |
(1) Cash cost per oz, AISC per oz and direct costs per tonne are not-IFRS measures.
(2) El Compas operations were suspended in August 2021.
Key Economic Trends
Precious Metal Price Trends
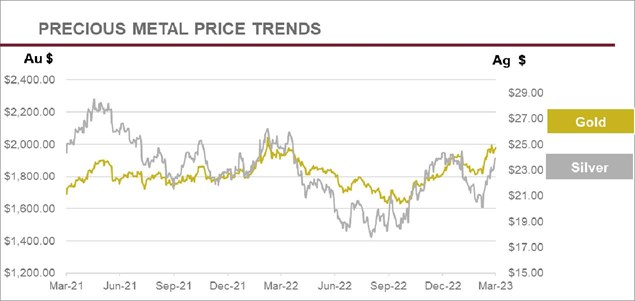
The prices of silver and gold are the largest single factor in determining profitability and cash flow from operations. The financial performance of the Company has been, and is expected to continue to be, closely linked to the prices of silver and gold.
During Q1 2023, the average price of silver was $22.55 per ounce, with silver trading between $20.09 and $24.44 per oz based on the London Fix silver price. This compares to an average of $24.01 per oz for the three months ended March 31, 2022, with a low of $22.24 and a high of $26.18 per oz. For the three months ended March 31, 2023, the Company realized an average price of $23.16 per silver oz compared with $24.38 for the three months ended March 31, 2022.
During Q1 2023, the average price of gold was $1,890 per oz, with gold trading between $1,811 and $1,994 per oz based on the London Fix PM gold price. This compares to an average of $1,799 per oz fore the three months ended March 31, 2022, with a low of $1,684 and a high of $1,943 per oz. For the three months ended March 31, 2023, the Company realized an average price of $1,917 per oz compared with $1,790 for the three months ended March 31, 2022.
The silver and gold markets have been impacted by changes in investment demand and the silver market is impacted due to the monetary aspects of silver, rising demand as a "green" metal and rising geopolitical tension. Central banks' increase of interest rates utilized as a tool in an attempt to offset inflation concerns, has impacted the price of silver and gold in 2022 and 2023.
Currency Fluctuations
The Company's operations are located in Mexico and therefore a significant portion of operating costs and capital expenditures are denominated in Mexican pesos. The Company's corporate activities are based in Vancouver, Canada with the significant portion of these expenditures being denominated in Canadian dollars.
During Q1 2023, the Mexican peso continued to strengthen against the U.S. dollar. The average foreign exchange rate was $18.66 Mexican pesos per U.S. dollar, with the peso trading within a range of $17.95 to $19.48. This compares to an average of $20.50, with a range of $19.88 to $21.35 Mexican pesos per U.S. dollar in Q1, 2022.
During the year ended December 31, 2022, the Mexican peso was relatively flat and has maintained its strength in comparison with the U.S. dollar. The average foreign exchange rate was $20.15 Mexican pesos per U.S. dollar, with the peso trading within a range of $19.22 to $21.35. This compares to an average of $20.27, with a range of $19.61 to $21.90 Mexican pesos per U.S. dollar in 2021.
During the year ended December 31, 2021, the Mexican peso was relatively flat. The average foreign exchange rate was $20.27 Mexican pesos per U.S. dollar, with the peso trading within a range of $19.61 to $21.90. This compares to an average of $21.48, with a range of $18.53 to $25.00 Mexican pesos per U.S. dollar in 2020.
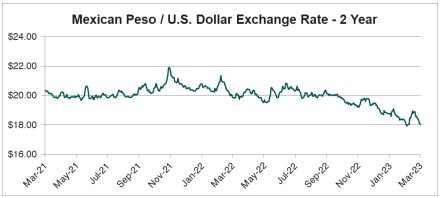
During Q1 2023, the Canadian dollar was relatively flat against the U.S. dollar. The average foreign exchange rate was $1.352 Canadian dollars per U.S. dollar, with the Canadian dollar trading within a range of $1.329 to $1.382. This compares to an average of $1.266, with a range of $1.247 to $1.284 Canadian dollars per U.S. dollar in Q1 2022.
During the year ended December 31, 2022, the Canadian dollar was relatively flat but weakened in Q3 and Q4 of 2022. The average foreign exchange rate was $1.296 Canadian dollars per U.S. dollar, with the Canadian dollar trading within a range of $1.25 to $1.388. This compares to an average of $1.253, with a range of $1.204 to $1.292 Canadian dollars per U.S. dollar in the 2021.
During the year ended December 31, 2021, the Canadian dollar was relatively flat although it initially appreciated compared to the U.S. dollar with the strengthening of oil prices and then weakened again towards the end of the year. During 2021, the average foreign exchange rate was $1.253 Canadian dollars per U.S. dollar, with the Canadian dollar trading within a range of $1.204 to $1.292. This compares to an average of $1.3409, with a range of $1.272 to $1.453 Canadian dollars per U.S. dollar during 2020.
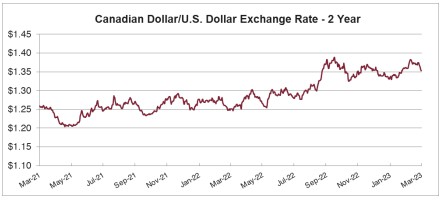
Cost Trends
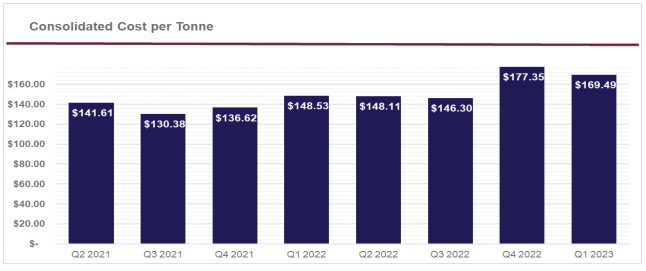
The Company's profitability is subject to industry wide cost pressures on development and operating costs with respect to labour, energy, consumables and capital expenditures. Underground mining is labour intensive and approximately 33% of the Company's production costs are directly tied to labour. In order to mitigate the impact of higher labour and consumable costs, the Company focuses on continuous improvement by promoting more efficient use of materials and supplies and by pursuing more advantageous pricing while increasing performance and without compromising operational integrity. During 2022, mining, processing and indirect costs all increased due to inflationary and industry cost pressures. During Q4, 2022 the cost per tonne was impacted by royalty costs recognized upon sale of higher than usual finished goods inventory that had been held during Q2 and Q3 of 2022.
ANNUAL OUTLOOK
2023 Production and Cost Guidance
|
|
|
Guanaceví |
Bolañitos |
Consolidated |
|
|
|
|
|
|
|
Tonnes per day |
TPD |
1,150 - 1,250 |
1,150 - 1,250 |
2,300 - 2,500 |
|
Silver Production |
M oz |
5.2 - 5.7 |
0.5 - 0.6 |
5.7 - 6.3 |
|
Gold Production |
K oz |
15.0 - 17.0 |
21.0 - 23.0 |
36.0 - 40.0 |
|
Silver Eq Production(1) |
US$/oz |
6.4 - 7.0 |
2.2 - 2.4 |
8.6 - 9.5 |
|
Cash Costs, net of gold by-product credits(2) |
US$/oz |
|
|
$10.00 - $11.00 |
|
AISC, net of gold by-product credits(2) |
US$/oz |
|
|
$19.00 - $20.00 |
|
Sustaining Capital Budget |
US$M |
|
|
$34.7 |
|
Exploration Budget |
US$M |
|
|
$9.3 |
(1) 2023 silver equivalent production is calculated using a 80:1 silver:gold ratio
(2) Non-GAAP measures - See Non-IFRS measures beginning on page 19
Operating mines
In 2023, silver production is expected to range from 5.7 to 6.3 million oz and gold production is expected to range from 36,000 to 40,000 oz. Silver equivalent production is forecasted to range from 8.6 to 9.5 million oz using an 80:1 silver:gold ratio.
|
Mine |
Ag (M oz) |
Au (K oz) |
Ag Eq (M oz) |
Tonnes/ Day (tpd) |
|
Guanaceví |
5.2 - 5.7 |
15.0 - 17.0 |
6 .4 - 7.0 |
1,150 - 1,250 |
|
Bolañitos |
0 .5 - 0 .6 |
21.0 - 23.0 |
2.2 - 2.4 |
1,150 - 1,250 |
|
Total |
5.7 - 6 .3 |
36 .0 - 40 .0 |
8 .6 - 9 .5 |
2,300 - 2,500 |
At Guanaceví, production will range between 1,150 tpd to 1,250 tpd and average 1,200 tpd from the Milache, SCS and El Curso orebodies. A significant portion of production will be mined from the Porvenir Cuatro extension on the El Curso concessions. The El Curso concessions are leased from a third party with no up-front costs but with significant royalty payments on production. Compared to 2022, mine grades are expected to remain elevated and recoveries are anticipated to be similar in 2023. Cash costs per ounce and direct costs on a per tonne basis are expected to be similar to 2022, with an increase in costs offset by both increased processed tonnes and increased production.
In 2023, plant throughput at Bolañitos is expected to range from 1,150 tpd to 1,250 tpd and average 1,200 tpd from the Plateros- La Luz, Lucero-Karina and Bolañitos-San Miguel vein systems. Mine grades and recoveries are expected to be similar to 2022. Direct costs on a per tonne basis are expected to decrease slightly due to both a reduction in indirect costs and an increase in processed tonnes. Cash costs per ounce are expected to be slightly lower than 2022 due to an increase in gold ounces produced.
Consolidated Operating Costs
In 2023, cash costs, net of gold by-product credits, are expected to be $10.00-$11.00 per oz of silver produced. Consolidated cash costs on a co-product basis are anticipated to be $13.00-$14.00 per oz silver and $1,100-$1,200 per oz gold.
AISC, net of gold by-product credits, in accordance with the World Gold Council standard, are estimated to be $19.00-$20.00 per oz of silver produced. When non-cash items such as stock-based compensation and accretion are excluded, AISC is forecasted to be in the $18.00-$19.00 range.
Direct operating costs per tonne were estimated to be $115-$120 with inflationary pressures expected to continue in 2023. Direct costs, which include royalties and special mining duties are estimated to be in the range of $140-$145 per tonne.
Management made the following assumptions in calculating its 2023 cost forecasts: $21 per oz silver price, $1,680 per oz gold price and 20:1 Mexican peso to U.S. dollar exchange rate.
2023 Capital Budget
| Sustaining Mine | Sustaining Other | Total Sustaining | Growth Capital | Total Capital | |
|
|
Development |
Capital |
Capital |
||
|
Guanaceví |
$14.0 million |
$8.9 million |
$22.9 million |
- |
$22.9 million |
|
Bolañitos |
$8.2 million |
$3.6 million |
$11.8 million |
- |
$11.8 million |
|
Corporate |
- |
- |
- |
$2.1 million |
$2.1 million |
|
Total |
$22.2 million |
$12.5 million |
$34.7 million |
$2.1 million |
$36.8 million |
Sustaining Capital Investments
In 2023, Endeavour plans to invest $34.7 million in sustaining capital at its two operating mines. At current metal prices, the sustaining capital investments are expected to be paid out of operating cash flow.
At Guanaceví, $22.9 million will be invested in capital projects, the largest of which is 4.5 kilometres of mine development at Milache, SCS and El Curso for an estimated $14.0 million. The additional $8.9 million will be used for improving plant infrastructure, upgrading the mine fleet, and supporting surface site infrastructure.
At Bolañitos, $11.8 million will be invested in capital projects, including $8.2 million for 3.8 kilometres of mine development to access resources in the Plateros-La Luz, Lucero-Karina, and Bolañitos -San Miguel areas. The additional $3.6 million will go to upgrade the mining fleet, plant improvements which include an elevation rise to the tailings dam, and to support site infrastructure.
The Company also plans to spend $2.1 million to maintain exploration concessions, acquire mobile equipment for exploration and cover corporate infrastructure.
Exploration Budget
|
Project |
2023 Activity |
Drill Metres |
Expenditures |
|
Guanaceví |
Drilling |
6,000 |
$1.1 million |
|
Bolañitos |
Drilling |
7,000 |
$0.9 million |
|
Terronera |
Drilling |
4,000 |
$0.7 million |
|
Parral |
Drilling/Economic Study |
6,000 |
$1.5 million |
|
Pitarrilla |
Drilling/Scope Studies |
5,000 |
$3.1 million |
|
Chile - Aida |
Drilling |
2,000 |
$0.8 million |
|
Chile - Other |
Evaluation |
- |
$1.0 million |
|
Bruner |
Evaluation |
- |
$ 0.2 million |
|
Total |
|
30,000 |
$9.3 million |
In 2023, the Company plans to spend $9.3 million drilling 30,000 metres across its properties.
At the Guanaceví and Bolañitos mines, 13,000 metres of drilling are planned at a cost of $2.0 million to replace reserves and expand resources.
At the Terronera development project, 4,000 metres of drilling are planned to test multiple regional targets identified in 2022 to expand resources within the district.
At the Pitarrilla project, management plans to invest $3.1 million on maintenance of the office and camp, underground drilling and evaluation programs, and 500 metres of underground development. The largest portion of the expenditures at Pitarrilla in 2023 relates to development costs to continue advancing the kilometre long decline and excavate lateral drifts that will be used to drill 5,000 metres to test the resource (“underground manto”) at various angles.
At the Parral in Chihuahua state, 6,000 metres of drilling are planned at a cost of $1.5 million to delineate existing resources, expand resources and test new targets. In the second half of 2023, the Company expects to initiate a preliminary economic analysis.
In Chile, management intends to invest $0.8 million to drill 2,000 metres to test a manto target with significant silver-manganese- lead-zinc anomalies at surface. Additionally, the Company plans to conduct mapping, sampling and surface exploration on several other exploration projects, estimated to cost $0.7 million including administration costs in the country.
At the Bruner project in Nevada, USA management plans to invest $0.2 million to map and sample new targets.
LIQUIDITY AND CAPITAL RESOURCES
Cash and cash equivalents decreased from $83.4 million at December 31, 2022 to $61.6 million at March 31, 2023. The Company had working capital of $92.8 million at March 31, 2023 (December 31, 2022 - $93.6 million). The $0.8 million decrease in working capital is primarily due to the $20.7 million invested in property, plant and equipment, $1.6 million in loan and lease payments, $0.3 million for the withholding taxes on the settlement of performance share units and a decrease in non-cash working capital of $12.9 million offset by $21.3 million decrease in cash, $12.5 cash generated from operating activities, and $1.8 million provided from exercise of options.
Operating activities used $0.4 million during the three months ended March 31,2023 compared to providing $21.7 million in same period of 2022. The significant non-cash adjustments to the net earnings of $6.5 million (Q1, 2022 -$11.7 million) were amortization and depletion of $6.6 million (Q1, 2022 - $6.5 million), share-based compensation of $1.6 million (Q1, 2022 - $1.5 million), a deferred income tax expense of $1.7 million (Q1, 2022 - $6.2 million), finance costs of $0.4 million (Q1, 2022 - $0.3 million), a gain on other investments of $3.1 million (Q1, 2022 - gain on other investments of $5.4 million), $2.1 million paid for cash settlement of performance share units and an increase in non-cash working capital of $12.9 million (Q1, 2022 - decrease of $1.1 million). The increase in non-cash working capital is primarily a result of an increase in prepaid expenses of $1.4 million, a decrease in accounts payable and income taxes payable of $6.2 million, an increase in the carrying value of inventories of $3.1 million and an increase in accounts receivable and income tax receivable of $2.2 million.
The Company's Mexican subsidiaries pay Impuesto al Valor Agregado ("IVA") on the purchase and sale of goods and services. The net amount paid is recoverable but is subject to review and assessment by the tax authorities. The Company regularly files the required IVA returns and all supporting documentation with the tax authorities, however, the Company has been advised that certain IVA amounts receivable from the tax authorities are being withheld pending completion of the authorities' audit of certain of the Company's third-party suppliers. Under Mexican law, the Company has legal rights to those IVA refunds and the results of the third-party audits should have no impact on refunds. A smaller portion of IVA refund requests are from time to time denied based on the alleged lack of compliance of certain formal requirements and information returns by the Company's third-party suppliers. The Company takes necessary legal action on the delayed refunds as well as any denied refunds. The Company is in regular contact with the tax authorities in respect of its IVA filings and believes that the full amount of its IVA receivables will ultimately be received; however, the timing of recovery of these amounts and the nature and extent of any adjustments to the Company's IVA receivables remains uncertain.
Investing activities used net cash $20.6 million during the three months ended March 31, 2023 compared to using net cash of $14.3 million in the same period in 2022. Capital investments totaled $20.7 million in property, plant and equipment during Q1, 2023, including $4.1 million in changes in working capital items used for purchases of equipment for Terronera, compared to capital investments totaling $13.0 million in the same period in 2022. The capital investments were primarily for sustaining capital at existing operations and for development capital at the Terronera Project. The Company used $nil million for investments in marketable securities during Q1, 2023 compared to using $1.4 million for investments in marketable securities in the same period in 2022.
At Guanaceví, the Company invested $5.7 million, with $4.6 million spent on 1.4 km of mine development, $0.4 million on mobile equipment. The Company continued to invest on upgrades for the plant and surrounding infrastructure, including $0.1 million on building and $0.5 million on plant upgrades, mine site improvements and the tailings facility and $0.1 million on office, building infrastructure and light vehicles.
At Bolañitos, the Company invested $2.3 million, with $2.0 million spent on 1.2 km of mine development and $0.2 million on mobile equipment. The Company continued to invest in upgrades for the plant and surrounding infrastructure, including $0.1 million on plant upgrades.
At Terronera, the Company invested $8.3 million, with $7.0 million spent on land payments and preliminary development, $0.9 million spent on buildings, $0.1 million was invested in mine equipment and $0.3 million on light vehicles, office and IT infrastructure. An additional $4.1 million was invested in changes in working capital items, primarily deposits for purchases of equipment not yet delivered.
Exploration and general and administrative investments were $0.3 million spent on holding costs, mobile equipment, office, building infrastructure and light vehicles.
Financing activities for Q1, 2023 used $0.3 million, compared to providing $40.1 million in the same period in 2022. During the three months ended March 31, 2023 the Company received $1.8 million on the exercise of employee stock options, paid $1.6 million in interest and principal repayments on loans and leases and paid $0.3 million in withholding taxes on equity settled performance share units. By comparison, during the same period in 2022, the Company raised gross proceeds of $46.0 million through a prospectus equity offering, paid $2.7 million in share issuance costs, received $0.1 million on the exercise of employee stock options, paid $1.3 million in interest and principal repayments on loans and leases and paid $1.9 million in withholding taxes on equity settled performance share units.
Management of the Company believes that operating cash flow and existing working capital will be sufficient to cover 2023 capital requirements and meet its short-term obligations. The Company continues to assess financing alternatives, including equity or debt or a combination of both to fund future growth, including the development of the Terronera project.
Contingencies
Minera Santa Cruz y Garibaldi SA de CV ("MSCG"), a subsidiary of the Company, received a Mexican peso ("MXN") 238 million assessment on October 12, 2010 by Mexican fiscal authorities for failure to provide the appropriate support for certain expense deductions taken in MSCG's 2006 tax return, failure to provide appropriate support for loans made to MSCG from affiliated companies, and deemed an unrecorded distribution of dividends to shareholders, among other individually immaterial items. MSCG immediately initiated a Nullity action and filed an administrative attachment to dispute the assessment.
In June 2015, the Superior Court ruled in favour of MSCG on a number of the matters under appeal; however, the Superior Court ruled against MSCG for failure to provide appropriate support for certain deductions taken in MSCG's 2006 tax return. In June 2016, the Company received a MXN 122.9 million ($6.8 million) tax assessment based on the June 2015 ruling. The 2016 tax assessment comprised of MXN 41.8 million in taxes owed ($2.3 million), MXN 17.7 million ($1.0 million) in inflationary charges, MXN 40.4 million ($2.2 million) in interest and MXN 23.0 million ($1.3 million) in penalties. The 2016 tax assessment was issued for failure to provide the appropriate support for certain expense deductions taken in MSCG's 2006 tax return and failure to provide appropriate support for loans made to MSCG from affiliated companies. If MSCG agrees to pay the tax assessment, or a lesser settled amount, it is eligible to apply for forgiveness of 100% of the penalties and 50% of the interest.
The Company filed an appeal against the June 2016 tax assessment on the basis that certain items rejected by the courts were included in the new tax assessment and a number of deficiencies exist within the assessment. Since issuance of the assessment interest charges of MXN 17.8 million ($1.0 million) and inflationary charges of MXN 26.6 million ($1.5 million) has accumulated.
Included in the Company's consolidated financial statements are net assets of $964,000 held by MSCG. Following the Tax Court's rulings, MSCG has been in discussions with the tax authorities with regards to the shortfall of assets within MSCG to settle its estimated tax liability. An alternative settlement option would be to transfer the shares and assets of MSCG to the tax authorities. The Company's income tax payable includes an allowance for transferring the shares and assets of MSCG amounting to $964,000. The Company is currently assessing MSCG's settlement options based on ongoing court proceedings and discussion with the tax authorities. The Company has been advised that the appeal filed with the Federal Tax Court and Supreme Court of Justice, against the June 2016 tax assessment has been rejected. The Company continues to assess MSCG's settlement options.
Compania Minera Del Cubo SA de CV ("Cubo"), a subsidiary of the Company, received a MXN 58.5 million ($2.9 million) assessment in 2019 by Mexican fiscal authorities for failure to provide the appropriate support for depreciation deductions taken in the Cubo 2016 tax return and denied deductions of certain suppliers. The tax assessment consists of MXN 24.1 million ($1.2 million) for taxes, MXN 21.0 million ($1.1 million) for penalties, MXN 10.4 million ($0.5 million) for interest and MXN 3.0 million ($0.1 million) for inflation. At the time of the tax assessment the Cubo entity had and continues to have sufficient loss carry forwards which would be applied against the assessed difference of taxable income. The Mexican tax authorities did not consider these losses in the assessment.
Due to the denial of certain suppliers for income tax purposes in the Cubo assessment, the invoices from these suppliers have been assessed as ineligible for refunds of IVA (value-added taxes) paid on the invoices. The assessment includes MXN 14.7 million ($0.7 million) for re-payment of IVA refunded on these supplier payments. In the Company's judgement, the suppliers and invoices meet the necessary requirements to be deductible for income tax purposes and the recovery of IVA.
The Company filed an administrative appeal related to the 2016 Cubo tax assessment. The Company had previously provided a lien on certain El Cubo mining concessions during the appeal process. To facilitate the sale of the El Cubo mine and related assets, the Company elected to pay the assessed amount of $3.5 million during Q1, 2021. During the appeal process the amount paid has been classified as a non-current income tax recoverable. Since issuance of the assessment interest charges of MXN 9.9 million ($0.5 million) and inflationary charges of MXN 1.6 million ($0.1 million) had accumulated. The Company continues to assess that it is probable that its appeal will prevail, and no provision is recognized in respect of the Cubo tax assessment.
The Company is required to use judgement to determine certain tax treatments in calculating income tax expense and IVA recoverable. A number of these judgements are subject to various uncertainties. From time to time, Mexican authorities may apply, re-interpret legislation or disregard precedents and it is possible that of these uncertainties may be resolved unfavorably for the Company.
Capital Requirements
As of March 31, 2023, the Company held $61.6 million in cash and $92.8 million in working capital.
The Company may be required to raise additional funds through future debt or equity financings in order to finance the development of the Terronera Project and may need to raise additional funds to carry out other business plans. The Company will continue to monitor capital markets, economic conditions, the COVID-19 global pandemic and assess its short term and long term capital needs.
See Annual Outlook on page 25 and Development Activities on page 10 for discussion on planned capital and exploration expenditures.
Contractual Obligations
The Company had the following undiscounted contractual obligations at March 31, 2023:
| Payments due by period (in thousands of dollars) | |||||||||||||||
| Contractual Obligations | |||||||||||||||
| Total | Less than 1 year |
1 - 3 years | 3 - 5 years | More than 5 | |||||||||||
| years | |||||||||||||||
| Capital asset purchases | $ | 15,385 | $ | 15,385 | $ | - | $ | - | $ | - | |||||
| Loans payable | 14,009 | 6,210 | 7,027 | 772 | - | ||||||||||
| Lease liabilities | 1,311 | 377 | 550 | 329 | 55 | ||||||||||
| Other contracts(1) | 617 | 145 | 206 | 206 | 60 | ||||||||||
| Other Long-Term Liabilities (2) | 13,143 | - | - | 6,991 | 6,152 | ||||||||||
| Total | $ | 44,465 | $ | 22,117 | $ | 7,783 | $ | 8,298 | $ | 6,267 |
(1) Other contracts consist of office premises operating costs and short-term leases.
(2) The $13,143 of other long-term liabilities is the undiscounted cost estimate to settle the Company's reclamation costs of the Guanaceví and Bolañitos mines, the Terronera development project and the Pitarrilla exploration project in Mexico. These costs include land rehabilitation, decommissioning of buildings and mine facilities, ongoing care and maintenance and other costs.
TRANSACTIONS WITH RELATED PARTIES
The Company previously shared common administrative services and office space with Aztec Metals Corp., which was considered a related party company by virtue of Bradford Cooke, the Company's former Executive Chairman, being a common director. From time to time, the Company incurred third-party costs on behalf of related parties, which are charged on a full cost recovery basis. The agreement for sharing office space and administrative services ended in May 2021. The charges for these costs totaled $Nil for the three months ended March 31, 2023 (March 31, 2022 - $6,000). The Company had no receivable related to administration costs outstanding as at March 31, 2023 (December 31, 2022 - $Nil).
The Company was charged $67,000 for legal services for the three months ended March 31, 2023 by a law firm in which the Company's corporate secretary is a partner (March 31, 2022 -$276,000). The Company has $40,000 payable to the legal firm as at March 31, 2023 (December 31, 2022 - $10,000).
FINANCIAL INSTRUMENTS AND FAIR VALUE MEASUREMENTS
As at March 31, 2023, the carrying and fair values of Endeavour's financial instruments by category were as follows:
| Expressed in thousands US dollars | Fair value through |
|||||||||||
| Amortized cost |
Carrying value |
Estimated Fair value |
||||||||||
| profit or loss | ||||||||||||
| Financial assets: | ||||||||||||
| Cash and cash equivalents | $ | - | $ | 61,650 | $ | 61,650 | $ | 61,650 | ||||
| Other investments | 13,132 | - | 13,132 | 13,132 | ||||||||
| Trade receivables | 5,030 | - | 5,030 | 5,030 | ||||||||
| Other receivables | - | 909 | 909 | 909 | ||||||||
| Loan receivable | - | 3,722 | 3,722 | 3,722 | ||||||||
| Total financial assets | $ | 18,162 | $ | 66,281 | $ | 84,443 | $ | 84,443 | ||||
| Financial liabilities: | ||||||||||||
| Accounts payable and accrued liabiities | $ | 4,140 | $ | 31,313 | $ | 35,453 | $ | 35,453 | ||||
| Loans payable | - | 12,936 | 12,936 | 12,936 | ||||||||
| Total financial liabilities | $ | 4,140 | $ | 44,249 | $ | 48,389 | $ | 48,389 | ||||
Fair value hierarchy
Fair value is the price that would be received to sell an asset or paid to transfer a liability in an orderly transaction between market participants at the measurement date. The fair value hierarchy establishes three levels to classify the inputs to valuation techniques used to measure fair value. Level 1 inputs are quoted prices (unadjusted) in active markets for identical assets or liabilities. Level 2 inputs are quoted prices in markets that are not active, quoted prices for similar assets or liabilities in active markets, inputs other than quoted prices that are observable for the asset or liability (for example, interest rate and yield curves observable at commonly quoted intervals, forward pricing curves used to value currency and commodity contracts and volatility measurements used to value option contracts), or inputs that are derived principally from or corroborated by observable market data or other means. Level 3 inputs are unobservable (supported by no or little market activity). The fair value hierarchy gives the highest priority to Level 1 inputs and the lowest priority to Level 3 inputs.
Assets and liabilities as at March 31, 2023 that measured at fair value on a recurring basis include:
| As at March 31, 2023 | ||||||||||||
| Expressed in thousands US dollars | Total | Level 1 | Level 2 | Level 3 | ||||||||
| Assets: | ||||||||||||
| Other investments | $ | 13,132 | $ | 12,971 | $ | - | $ | 161 | ||||
| Trade receivables | 5,030 | - | 5,030 | - | ||||||||
| Total financial assets | $ | 18,162 | $ | 12,971 | $ | 5,030 | $ | 161 | ||||
| Liabilities: | ||||||||||||
| Deferred share units | $ | 4,028 | $ | 4,028 | $ | - | $ | - | ||||
| Share appeciation rights | $ | 112 | $ | - | $ | 112 | $ | - | ||||
| Total financial liabilities | $ | 4,140 | $ | 4,028 | $ | 112 | $ | - |
Other investments
The Company holds marketable securities classified as Level 1 and Level 3 in the fair value hierarchy. The fair values of Level 1 investments are determined based on a market approach reflecting the closing price of each particular security at the reporting date. The closing price is a quoted market price obtained from the stock exchange that is the principal active market for the particular security, being the market with the greatest volume and level of activity for the assets. For Level 3 investments, which consist of share purchase warrants where inputs are not observable, they have an estimated value determined by using an option pricing model. Changes in fair value on available for sale marketable securities are recognized in earnings or loss.
Trade receivables
The trade receivables consist of receivables from provisional silver and gold sales from the Bolañitos mine. The fair value of receivables arising from concentrate sales contracts that contain provisional pricing mechanisms is determined using the appropriate quoted closing price on the measurement date from the exchange that is the principal active market for the particular metal. As such, these receivables, which meet the definition of an embedded derivative, are classified within Level 2 of the fair value hierarchy.
Deferred share units
The Company has a cash settled Deferred Share Unit ("DSU") plan whereby deferred share units may be granted to independent directors of the Company in lieu of compensation in cash or stock options. The DSUs vest immediately and are redeemable for cash based on the market value of the units at the time of a director's retirement. The DSUs are classified as Level 1 in the fair value hierarchy. The liability is determined based on a market approach reflecting the closing price of the Company's common shares at the reporting date. Changes in fair value are recognized in general and administrative expenses.
Share appreciation rights
As part of the Company's bonus program, the Company grants share appreciation rights ("SARs") to its employees in Mexico and Chile. The SARs are subject to vesting conditions and, when exercised, constitute a cash bonus based on the value of the appreciation of the Company's common shares between the SARs grant date and the exercise date.
The SARs are classified as Level 2 in the fair value hierarchy. The liability is valued using a Black-Scholes option pricing model. Changes in fair value are recognized in salaries, wages and benefits.
Financial Instrument Risk Exposure and Risk Management
The Company is exposed in varying degrees to a variety of financial instrument related risks. The Board approves and monitors the risk management process. The types of risk exposure and the way in which such exposure is managed is provided as follows:
Credit Risk
The Company is exposed to credit risk on its bank accounts, accounts receivable and loan receivable. Credit risk exposure on bank accounts is limited through maintaining the Company's balances with high-credit quality financial institutions, maintaining investment policies, assessing institutional exposure and continual discussion with external advisors. Value-added tax receivables are generated on the purchase of supplies and services to produce silver, which are refundable from the Mexican government. Trade receivables are generated on the sale of concentrate inventory to reputable metal traders. The loan receivable is related to the remaining proceeds for the sale of the El Compas mine to Grupo ROSGO. There has been no indication of a change in the creditworthiness of the counterparty to the loan receivable since the initial recognition.
Liquidity Risk
Liquidity risk is the risk that the Company will not be able to meet its financial obligations as they come due. The Company manages its liquidity risk by continually monitoring forecasted and actual cash flows. The Company has in place a planning and budgeting process to help determine the funds required to support its normal operating requirement and development plans. The Company aims to maintain sufficient liquidity to meet its short-term business requirements, taking into account its anticipated cash flows from operations, its holdings of cash and cash equivalents, and its committed and anticipated liabilities.
The Company's Mexican subsidiaries pay IVA on the purchase and sale of goods and services. The net amount paid is recoverable but is subject to review and assessment by the tax authorities. The Company regularly files the required IVA returns and all supporting documentation with the tax authorities, however, the Company has been advised that certain IVA amounts receivable from the tax authorities are being withheld pending completion of the authorities' audit of certain of the Company's third-party suppliers. Under Mexican law, the Company has legal rights to those IVA refunds and the results of the third-party audits should have no impact on refunds. A smaller portion of IVA refund requests are from time to time denied based on the alleged lack of compliance of certain formal requirements and information returns by the Company's third-party suppliers. The Company takes necessary legal action on the delayed refunds as well as any denied refunds. The Company is in regular contact with the tax authorities in respect of its IVA filings and believes that the full amount of its IVA receivables will ultimately be received; however, the timing of recovery of these amounts and the nature and extent of any adjustments to the Company's IVA receivables remains uncertain.
Market Risk
The significant market risk exposures to which the Company is exposed are foreign currency risk, interest rate risk, and commodity price risk.
Foreign Currency Risk - The Company's operations in Mexico and Canada make it subject to foreign currency fluctuations. Certain of the Company's operating expenses are incurred in Mexican pesos and Canadian dollars; therefore, the fluctuation of the U.S. dollar in relation to these currencies will consequently have an impact upon the profitability of the Company and may also affect the value of the Company's assets and the amount of shareholders' equity. The Company has not entered into any agreements or purchased any instruments to hedge possible currency risks.
Interest Rate Risk - In respect of financial assets, the Company's policy is to invest cash at floating rates of interest and cash reserves are to be maintained in cash equivalents in order to maintain liquidity. Fluctuations in interest rates impact the value of cash equivalents. As at March 31, 2023 the Company has $0.6 million in equipment loans with interest rates that are linked to SOFR and, with other variables unchanged, a 1% increase in the SOFR rate would result in an additional interest expense of $6,000.
Commodity Price Risk - Gold and silver prices have historically fluctuated significantly and are affected by numerous factors outside of the Company's control, including, but not limited to, industrial and retail demand, central bank lending, forward sales by producers and speculators, levels of worldwide production, short-term changes in supply and demand because of speculative hedging activities and certain other factors. As at March 31, 2023, the Company has not engaged in any hedging activities, other than short-term metal derivative transactions less than 90 days, to reduce its exposure to commodity price risk. At March 31, 2023, there are 96,989 oz of silver and 2,585 oz of gold, which do not have a final settlement price and the estimated revenues have been recognized at current market prices. As at March 31, 2023, with other variables unchanged, a 10% decrease in the market value of silver and gold would result in a reduction of revenue of $0.7 million.
OUTSTANDING SHARE DATA
As of May 8, 2023, the Company had the following securities issued, issuable and outstanding:
• 191,505,299 common shares;
• 3,702,8910 common shares issuable under stock options with a weighted average exercise price of CAD$4.34 per share expiring between March 3, 2024 and March 7, 2028;
• 970,000 performance share units with a weighted average grant price of CAD$5.48 vesting between March 4, 2024 and March 7, 2026; and
• 308,017 equity settled deferred share units with a weighted average grant prices of CAD$4.77 which are vested.
As at March 31, 2023, the Company's issued share capital was $661.0 million (December 31, 2022 - $657.9 million), representing 191,276,399 common shares (December 31, 2022 - 189,995,563), and the Company had options outstanding to purchase 4,020,030 common shares (December 31, 2022 - 3,899,630) with a weighted average exercise price of CAD$4.37 (December 31, 2022 - CAD$4.09).
The Company considers the items included in the consolidated statement of shareholders' equity as capital. The Company's objective when managing capital is to safeguard its ability to continue as a going concern so that it can continue to provide returns for shareholders and benefits for other stakeholders. The Company manages the capital structure and makes adjustments to it in light of changes in economic conditions and the risk characteristics of the underlying assets. In order to maintain or adjust the capital structure, the Company may issue new shares through private placements, prospectus offerings, convertible debentures, asset acquisitions or return capital to shareholders. The Company is not subject to externally imposed capital requirements.
CHANGES IN ACCOUNTING POLICIES AND CRITICAL ACCOUNTING ESTIMATES
Accounting standards adopted during the period:
The accounting policies applied in the Company's condensed consolidated interim financial statements for the three months ended March 31, 2023 are the same as those applied in the Company's annual audited consolidated financial statements as at and for the year ended December 31, 2022.
Critical Accounting Estimates
The preparation of financial statements requires the Company to make estimates that affect the reported amounts of assets and liabilities and disclosure of contingent assets and liabilities at the date of the financial statements and the reported amounts of revenues and expenses during the reporting period. Significant areas requiring the use of management's judgment relate to the determination of mineralized reserves and resources, plant and equipment lives, estimating the fair values of financial instruments and derivatives, impairment of non-current assets, reclamation and rehabilitation provisions, recognition of deferred tax assets, and assumptions used in determining the fair value of share-based compensation.
See "Critical Accounting Estimates" in the Company's annual MD&A for the year ended December 31, 2022 for a detailed discussion on the areas in which critical accounting estimates are made.
CONTROLS AND PROCEDURES
Disclosure Controls and Procedures
The Company's management, with the participation of its Chief Executive Officer ("CEO") and Chief Financial Officer ("CFO"), has evaluated the design of the Company's disclosure controls and procedures. Based on the results of that evaluation, the Company's CEO and CFO have concluded that, as of March 31, 2023, the Company's disclosure controls and procedures were effective to provide reasonable assurance that the information required to be disclosed by the Company in reports it files is recorded, processed, summarized and reported, within the appropriate time periods and is accumulated and communicated to management, including the CEO and CFO, as appropriate to allow timely decisions regarding required disclosure.
Changes in Internal Control over Financial Reporting
Management, including the CEO and CFO, has evaluated the Company's internal controls over financial reporting to determine whether any changes occurred during the period that have materially affected, or are reasonably likely to materially affect, the Company's internal controls over financial reporting.
During the three months ended March 31, 2023 there have been no significant changes in internal control over financial reporting that have materially affected, or are reasonably likely to materially affect, the Company's internal control over financial reporting.
Form 52-109F2
Certification of Interim Filings
Full Certificate
I, Daniel Dickson, Chief Executive Officer of Endeavour Silver Corp., certify the following:
1. Review: I have reviewed the interim financial report and interim MD&A (together, the "interim filings") of Endeavour Silver Corp. (the "issuer") for the interim period ended March 31, 2023.
2. No misrepresentations: Based on my knowledge, having exercised reasonable diligence, the interim filings do not contain any untrue statement of a material fact or omit to state a material fact required to be stated or that is necessary to make a statement not misleading in light of the circumstances under which it was made, with respect to the period covered by the interim filings.
3. Fair presentation: Based on my knowledge, having exercised reasonable diligence, the interim financial report together with the other financial information included in the interim filings fairly present in all material respects the financial condition, financial performance and cash flows of the issuer, as of the date of and for the periods presented in the interim filings.
4. Responsibility: The issuer's other certifying officer(s) and I are responsible for establishing and maintaining disclosure controls and procedures (DC&P) and internal control over financial reporting (ICFR), as those terms are defined in National Instrument 52-109 Certification of Disclosure in Issuers' Annual and Interim Filings, for the issuer.
5. Design: Subject to the limitations, if any, described in paragraphs 5.2 and 5.3, the issuer's other certifying officer(s) and I have, as at the end of the period covered by the interim filings
(a) designed DC&P, or caused it to be designed under our supervision, to provide reasonable assurance that
(i) material information relating to the issuer is made known to us by others, particularly during the period in which the interim filings are being prepared; and
(ii) information required to be disclosed by the issuer in its annual filings, interim filings or other reports filed or submitted by it under securities legislation is recorded, processed, summarized and reported within the time periods specified in securities legislation; and
(b) designed ICFR, or caused it to be designed under our supervision, to provide reasonable assurance regarding the reliability of financial reporting and the preparation of financial statements for external purposes in accordance with the issuer's GAAP.
5.1 Control framework: The control framework the issuer's other certifying officer(s) and I used to design the issuer's ICFR is the Internal Control - Integrated Framework (2013) (COSO Framework) published by The Committee of Sponsoring Organizations of the Treadway Commission (COSO).
5.2 ICFR - material weakness relating to design: N/A
5.3 Limitation on scope of design: N/A
6. Reporting changes in ICFR: The issuer has disclosed in its interim MD&A any change in the issuer's ICFR that occurred during the period beginning on January 1, 2023 and ended on March 31, 2023 that has materially affected, or is reasonably likely to materially affect, the issuer's ICFR.
Date: May 10, 2023
"Daniel Dickson"
_______________________
Daniel Dickson
Chief Executive Officer
Form 52-109F2
Certification of Interim Filings
Full Certificate
I, Christine West, Chief Financial Officer of Endeavour Silver Corp., certify the following:
1. Review: I have reviewed the interim financial report and interim MD&A (together, the "interim filings") of Endeavour Silver Corp. (the "issuer") for the interim period ended March 31, 2023.
2. No misrepresentations: Based on my knowledge, having exercised reasonable diligence, the interim filings do not contain any untrue statement of a material fact or omit to state a material fact required to be stated or that is necessary to make a statement not misleading in light of the circumstances under which it was made, with respect to the period covered by the interim filings.
3. Fair presentation: Based on my knowledge, having exercised reasonable diligence, the interim financial report together with the other financial information included in the interim filings fairly present in all material respects the financial condition, financial performance and cash flows of the issuer, as of the date of and for the periods presented in the interim filings.
4. Responsibility: The issuer's other certifying officer(s) and I are responsible for establishing and maintaining disclosure controls and procedures (DC&P) and internal control over financial reporting (ICFR), as those terms are defined in National Instrument 52-109 Certification of Disclosure in Issuers' Annual and Interim Filings, for the issuer.
5. Design: Subject to the limitations, if any, described in paragraphs 5.2 and 5.3, the issuer's other certifying officer(s) and I have, as at the end of the period covered by the interim filings
(a) designed DC&P, or caused it to be designed under our supervision, to provide reasonable assurance that
(i) material information relating to the issuer is made known to us by others, particularly during the period in which the interim filings are being prepared; and
(ii) information required to be disclosed by the issuer in its annual filings, interim filings or other reports filed or submitted by it under securities legislation is recorded, processed, summarized and reported within the time periods specified in securities legislation; and
(b) designed ICFR, or caused it to be designed under our supervision, to provide reasonable assurance regarding the reliability of financial reporting and the preparation of financial statements for external purposes in accordance with the issuer's GAAP.
5.1 Control framework: The control framework the issuer's other certifying officer(s) and I used to design the issuer's ICFR is the Internal Control - Integrated Framework (2013) (COSO Framework) published by The Committee of Sponsoring Organizations of the Treadway Commission (COSO).
5.2 ICFR - material weakness relating to design: N/A
5.3 Limitation on scope of design: N/A
6. Reporting changes in ICFR: The issuer has disclosed in its interim MD&A any change in the issuer's ICFR that occurred during the period beginning on January 1, 2023 and ended on March 31, 2023 that has materially affected, or is reasonably likely to materially affect, the issuer's ICFR.
Date: May 10, 2023
"Christine West"
_______________________
Christine West
Chief Financial Officer