| Delaware | 1-14037 | 13-3998945 | ||||||
| (State or Other Jurisdiction of Incorporation) | (Commission File Number) | (IRS Employer Identification No.) | ||||||
| ☐ | Written communications pursuant to Rule 425 under the Securities Act (17 CFR 230.425) | |||||||
| ☐ | Soliciting material pursuant to Rule 14a-12 under the Exchange Act (17 CFR 240.14a-12) |
|||||||
| ☐ | Pre-commencement communications pursuant to Rule 14d-2(b) under the Exchange Act (17 CFR 240.14d-2(b)) |
|||||||
| ☐ | Pre-commencement communications pursuant to Rule 13e-4(c) under the Exchange Act (17 CFR 240.13e-4(c)) | |||||||
| Title of each class | Trading Symbol(s) | Name of each exchange on which registered | ||||||||||||
| Common Stock, par value $0.01 per share | MCO | New York Stock Exchange | ||||||||||||
| 1.75% Senior Notes Due 2027 | MCO 27 | New York Stock Exchange | ||||||||||||
| 0.950% Senior Notes Due 2030 | MCO 30 | New York Stock Exchange | ||||||||||||
| Emerging growth company | ☐ | ||||
If an emerging growth company, indicate by check mark if the registrant has elected not to use the extended transition period for complying with any new or revised financial accounting standards provided pursuant to Section 13(a) of the Exchange Act. |
☐ | ||||
ITEM 2.02 |
RESULTS OF OPERATIONS AND FINANCIAL CONDITION |
3 | ||||||
| ITEM 7.01 | REGULATION FD DISCLOSURE | 3 | ||||||
| ITEM 9.01 | FINANCIAL STATEMENTS AND EXHIBITS | 3 | ||||||
| SIGNATURES | 4 | |||||||
| EXHIBIT 99.1 | ||||||||
| 104 | The cover page from this Current Report on Form 8-K, formatted in Inline XBRL. | ||||
| MOODY'S CORPORATION | |||||
| By: | /s/ Elizabeth M. McCarroll | ||||
| Elizabeth M. McCarroll | |||||
| Corporate Secretary and Associate General Counsel | |||||

SECOND QUARTER SUMMARY FINANCIALS | ||||||||||||||
| Moody’s Corporation (MCO) Revenue |
Moody’s Analytics (MA) Revenue |
Moody’s Investors Service (MIS) Revenue |
||||||||||||
2Q 2024 |
2Q 2024 |
2Q 2024 |
||||||||||||
$1.8 billion ⇑ 22% |
$802 million ⇑ 7% |
$1.0 billion ⇑ 36% |
||||||||||||
| YTD 2024 | YTD 2024 | YTD 2024 | ||||||||||||
$3.6 billion ⇑ 22% |
$1.6 billion ⇑ 8% |
$2.0 billion ⇑ 35% |
||||||||||||
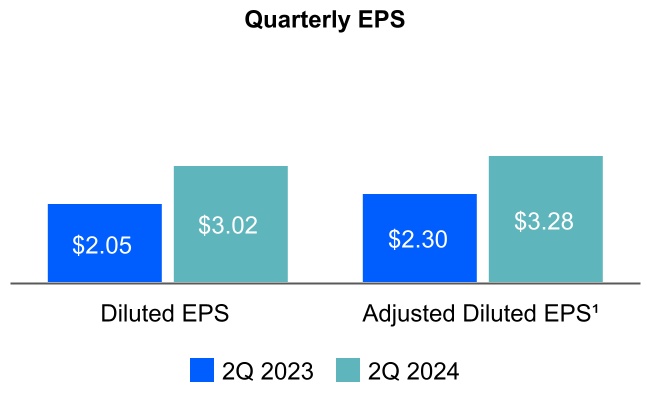
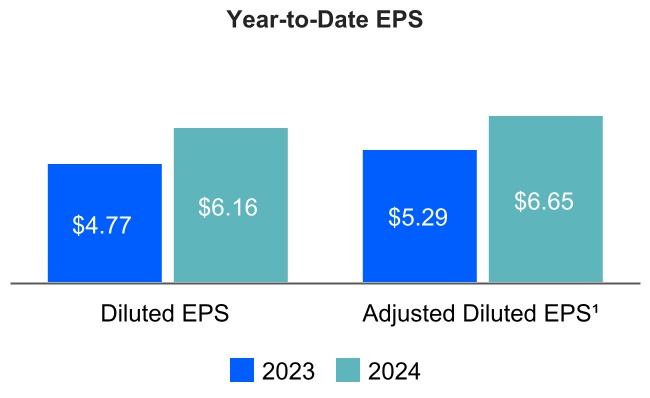
| MCO Diluted EPS | MCO Adjusted Diluted EPS1 |
MCO FY 2024 Projected2 |
||||||||||||
2Q 2024 |
2Q 2024 |
Diluted EPS |
||||||||||||
$3.02 ⇑ 47% |
$3.28 ⇑ 43% |
$9.95 to $10.35 | ||||||||||||
| YTD 2024 | YTD 2024 | Adjusted Diluted EPS1 |
||||||||||||
$6.16 ⇑ 29% |
$6.65 ⇑ 26% |
$11.00 to $11.40 | ||||||||||||
“This was another impressive quarter for Moody’s, led by the performance of our best-in-class ratings franchise. We delivered double-digit revenue growth, fueling product development and innovation. We also entered several exciting strategic partnerships with industry-leading companies to broaden the availability and reach of our data and insights.” | |||||
|
Rob Fauber
President and Chief Executive Officer
| |||||
"Moody’s outstanding performance in the second quarter demonstrates the incredible operating leverage inherent in the business. The 22% growth in revenue is driving a 21% increase in operating cash flow, enabling us to raise share repurchase guidance to $1.3 billion. For the full year, we are raising our adjusted diluted EPS1 guidance and narrowing the range to $11.00 to $11.402.” | |||||
|
Noémie Heuland
Chief Financial Officer
| |||||
|
1 Refer to the tables at the end of this press release for reconciliations of adjusted measures to U.S. GAAP.
2 Guidance as of July 23, 2024. Refer to Table 12 - “2024 Outlook” for a complete list of guidance, as well as assumptions used by the Company with respect to its guidance.
| |||||
| REVENUE | ||
| Moody’s Corporation (MCO) | ||

Second Quarter 2024 |
Year-to-Date 2024 | |||||||
|
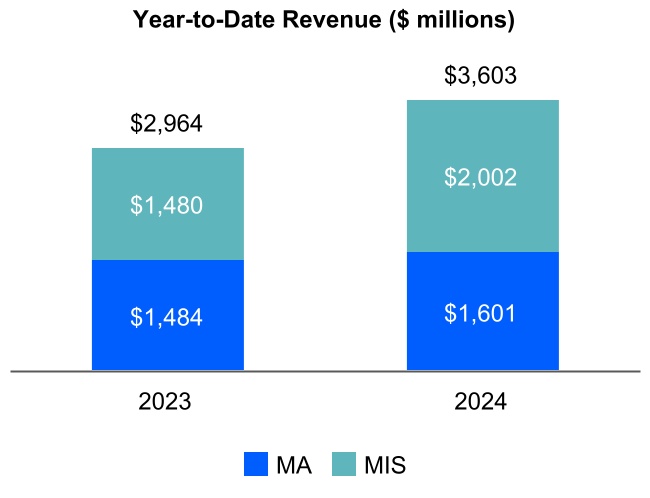
•Revenue increased 22% from the prior-year period. Foreign currency translation had an immaterial impact on MCO’s revenue.
•MA’s revenue grew 7% from the prior-year period reflecting strong demand for Moody’s proprietary data and unique analytical insights.
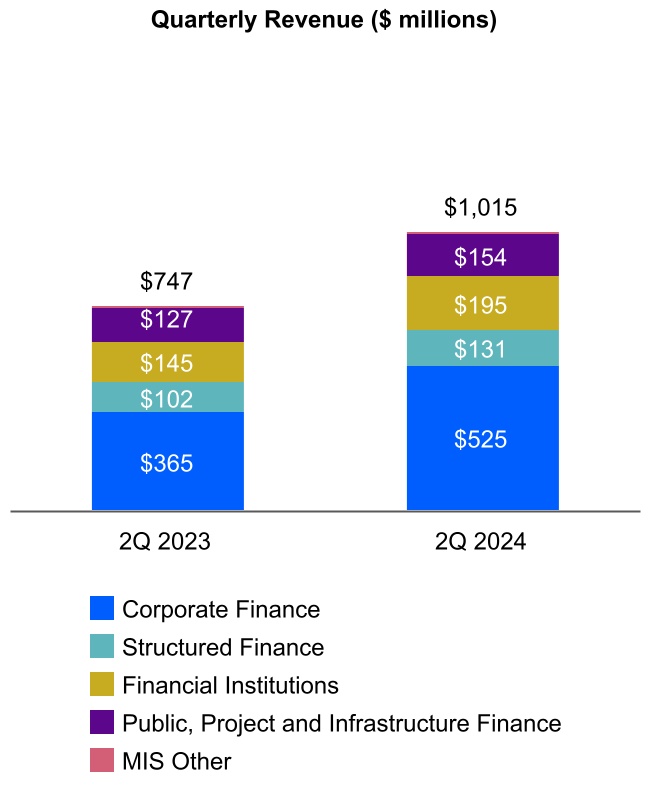
•MIS achieved 36% revenue growth from the prior-year period. Heightened issuance activity drove one of the strongest quarters on record, second only to 1Q 2021.
|
•Revenue increased 22% from the prior-year period. Foreign currency translation had an immaterial impact on MCO’s revenue.
•Customer demand for MA’s innovative products and solutions continued to drive revenue growth, which was up 8% from the prior-year period.
•MIS’s revenue grew 35% from the prior-year period fueled by favorable market conditions given high investor demand and tight spreads.
|
|||||||
| Moody’s Analytics (MA) | ||
Second Quarter 2024 |
Year-to-Date 2024 | |||||||
|
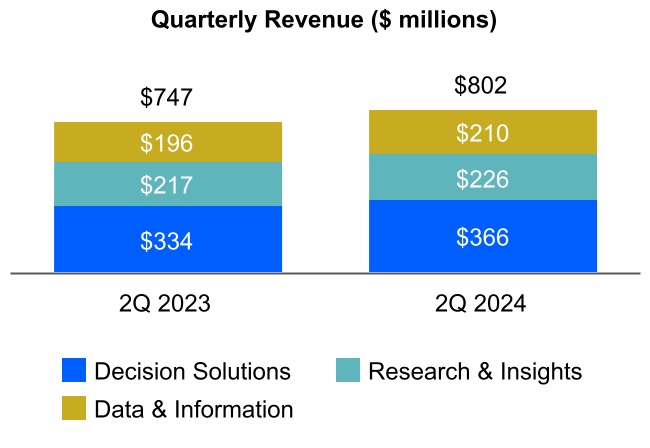
•Revenue grew 7% versus the prior-year period, led by 10% growth in Decision Solutions.
•Within Decision Solutions, Banking, Insurance and Know Your Customer (KYC) revenue increased 7%, 11% and 13%, respectively.
•Recurring revenue grew 9% and represented 95% of total MA revenue.
•Foreign currency translation unfavorably impacted MA’s revenue by 1%.
|
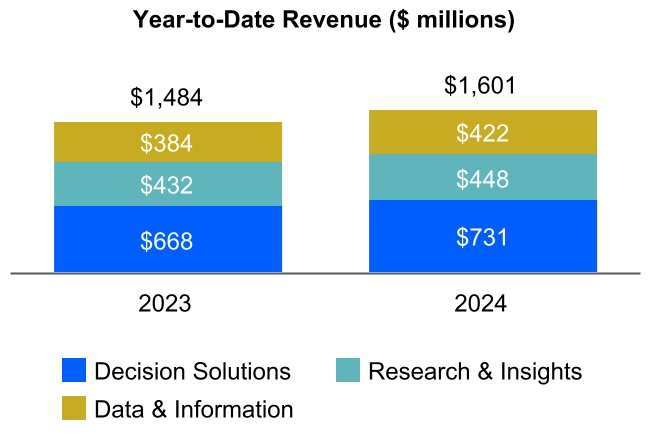
•Revenue grew 8% versus the prior-year period.
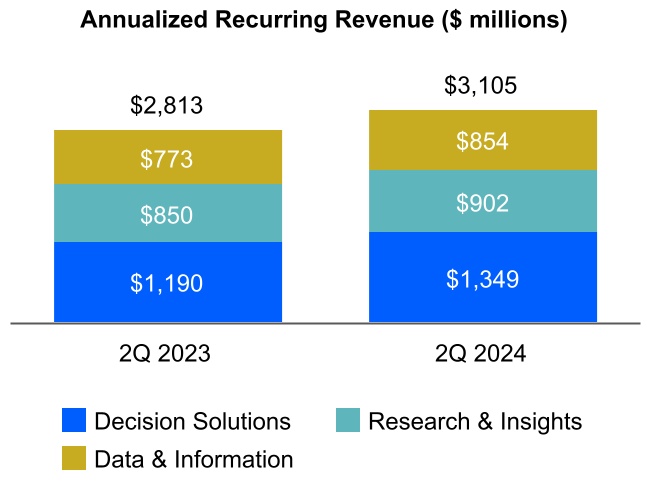
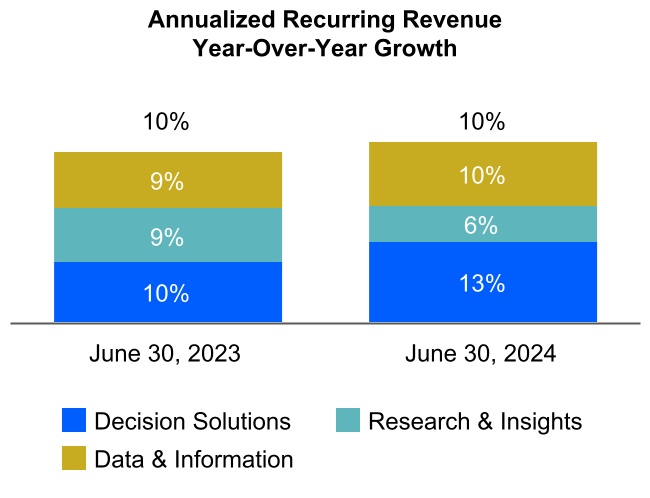
•ARR3 is now $3.1 billion, up from $2.8 billion as of June 30, 2023, driven by strong demand for data and SaaS-based solutions across financial, corporate and government sectors.
•ARR3 grew 10%, with Decision Solutions, Research & Insights and Data & Information growing 13%, 6% and 10%, respectively.
•Foreign currency translation had an immaterial impact on MA’s revenue.
|
|||||||
3 Refer to Table 10 at the end of this press release for the definition of and further information on the Annualized Recurring Revenue (ARR) metric. | |||||
| Moody’s Investors Service (MIS) | ||

Second Quarter 2024 |
Year-to-Date 2024 | |||||||
|
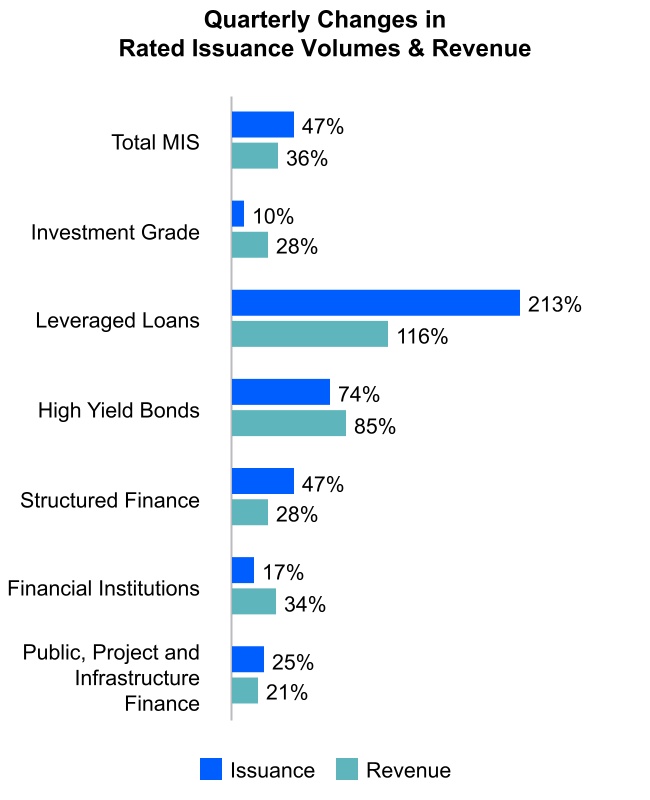
•Revenue grew 36% compared to the prior-year period.
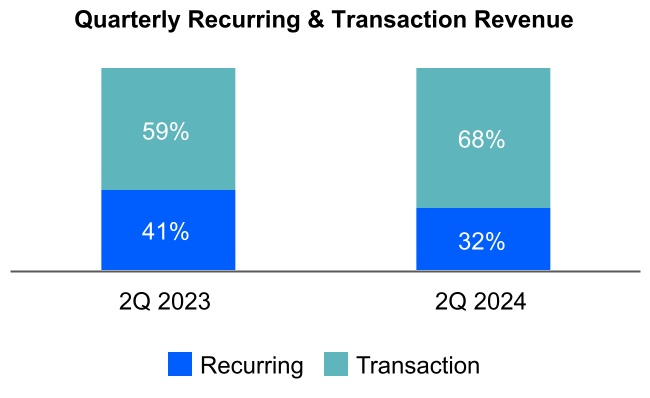
•Revenue growth was primarily driven by a 56% increase in transactional revenue, led by Corporate Finance.
•Leveraged Loans posted record quarterly issuance growth of 213%, due to elevated refinancing and repricing activity.
•CLO activity from both refinancing and new deals was the primary driver of Structured Finance revenue growth.
•Insurance infrequent issuer activity contributed to the favorable revenue mix within Financial Institutions.
•Foreign currency translation unfavorably impacted MIS’s revenue by 1%.
|
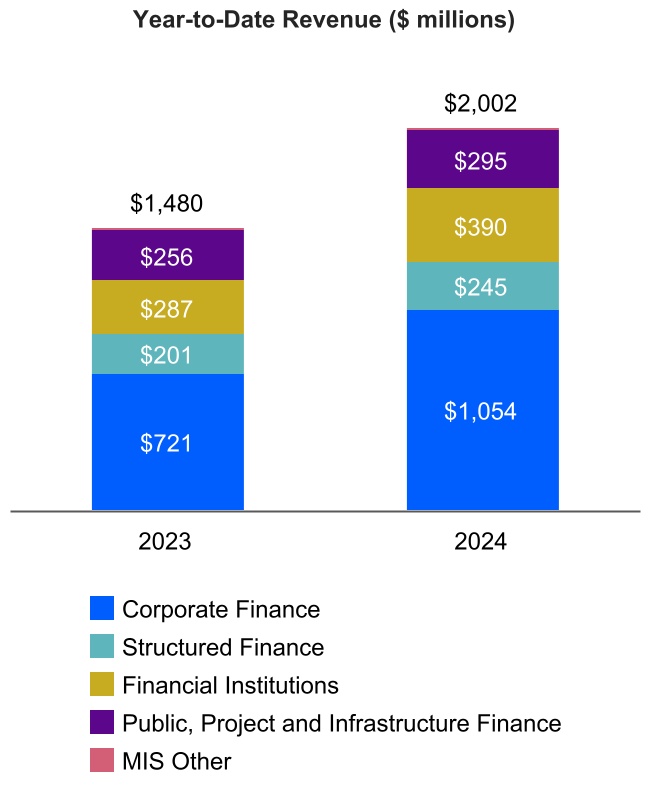
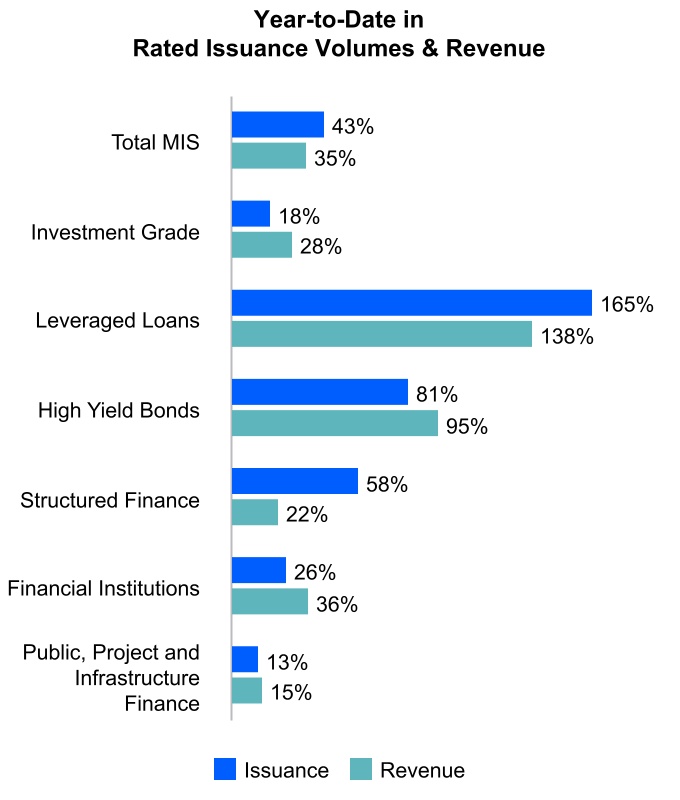
•Revenue grew 35% compared to the prior-year period.
•Improved macroeconomic sentiment and narrow spreads drove investor demand, mainly in Leveraged Loans.
•Market participants took advantage of the conducive issuance environment ahead of potential volatility later in the year.
•Within Financial Institutions, opportunistic activity from infrequent issuers drove transactional revenue growth of 66%.
•Foreign currency translation unfavorably impacted MIS’s revenue by 1%.
|
|||||||
| OPERATING EXPENSES AND MARGIN | ||
MCO Operating Expenses | ||
Second Quarter 2024 |
Year-to-Date 2024 |
|||||||
|
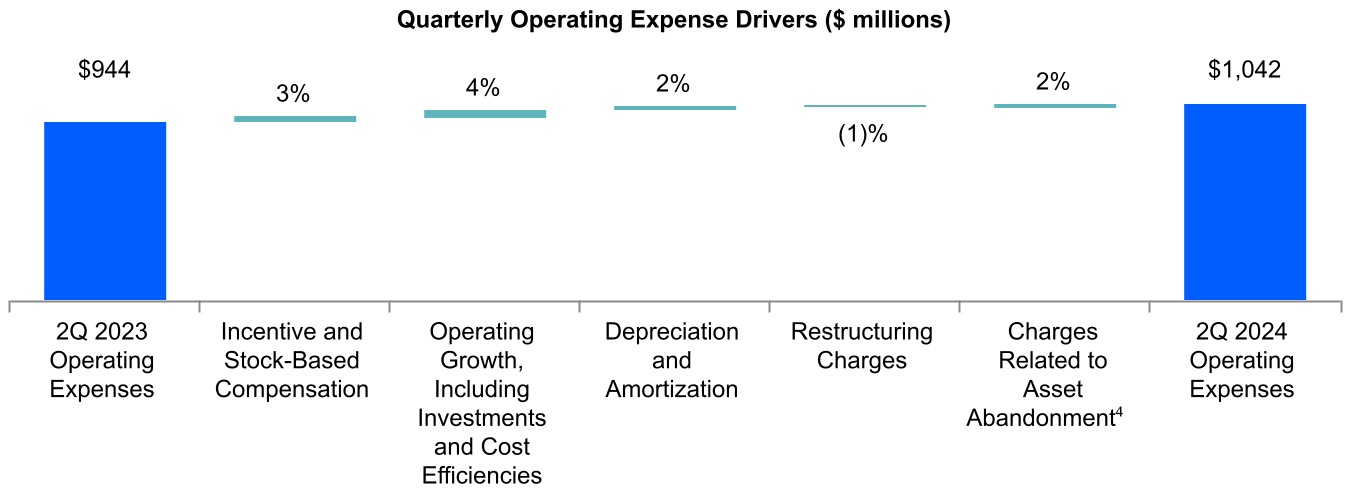
•Operating expenses increased 10% compared to the prior-year period, primarily attributed to higher operating growth (which included an increase in a legal reserve related to a previously disclosed regulatory matter) and incentive compensation accruals, partially offset by benefits from cost management initiatives.
•Foreign currency translation had an immaterial impact on operating expenses.
|
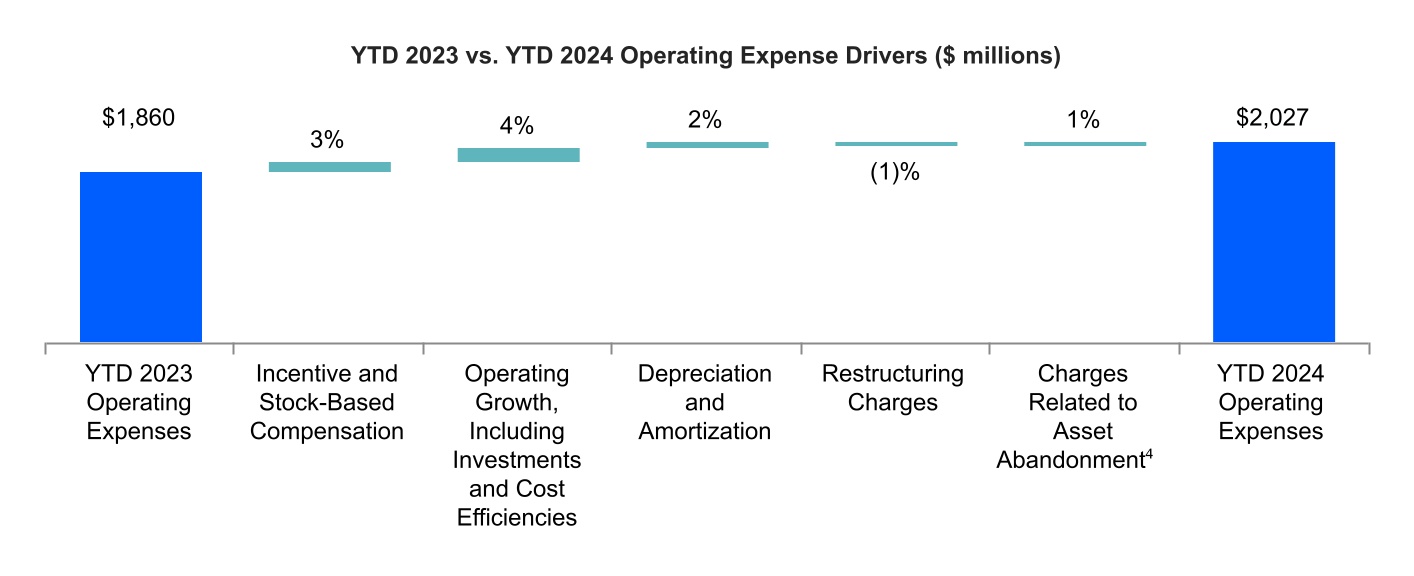
•Operating expenses grew 9% compared to the prior-year period, primarily driven by 4% from operating growth and ongoing investments to support future growth as well as 3% in incentive compensation accruals and stock-based compensation.
•Foreign currency translation had an immaterial impact on operating expenses.
|
|||||||
4 Refer to Table 5 - “Financial Information by Segment (Unaudited)” for more information regarding the “Charges Related to Asset Abandonment” category. | |||||
Operating Margin and Adjusted Operating Margin1 | ||
Second Quarter 2024 |
Year-to-Date 2024 | |||||||
|
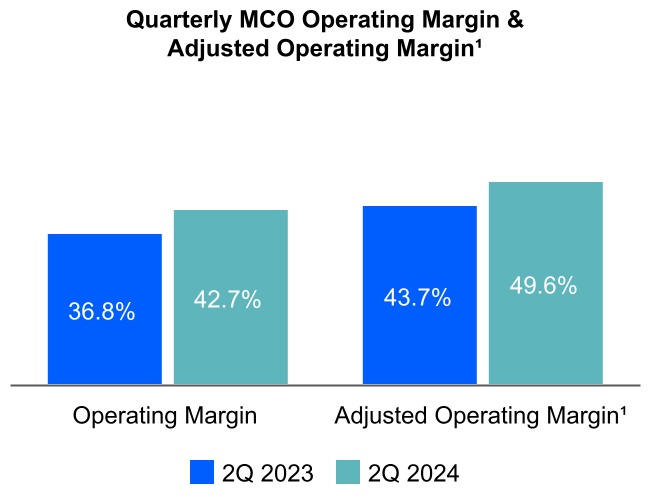
•MCO’s operating margin was 42.7%. MCO’s adjusted operating margin1 was 49.6%, up 590 basis points from the prior-year period.
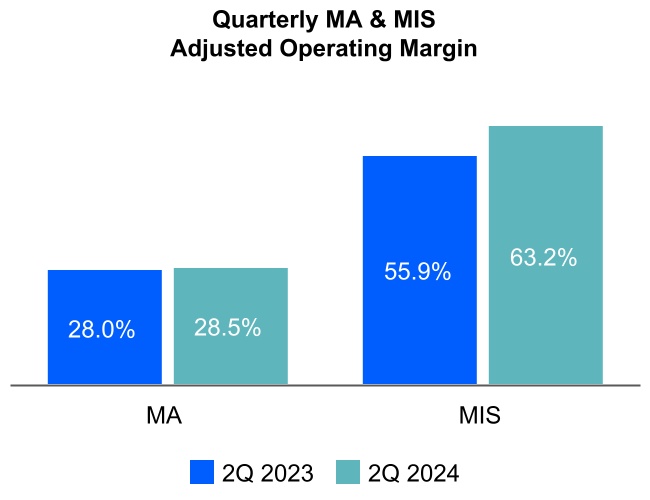
•MA’s adjusted operating margin of 28.5% incorporated the combination of cost management initiatives and ongoing strategic investments in product innovation and platforming.
•MIS’s adjusted operating margin grew 730 basis points to 63.2%, demonstrating its significant operating leverage in periods of elevated issuance.
•Foreign currency translation had an immaterial impact on both operating and adjusted operating margins1.
|
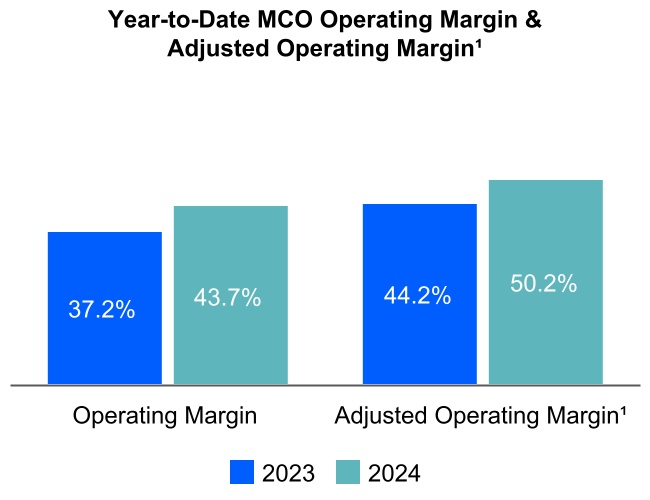
•MCO’s operating margin was 43.7%. MCO’s adjusted operating margin1 was 50.2%, up 600 basis points from the prior-year period.
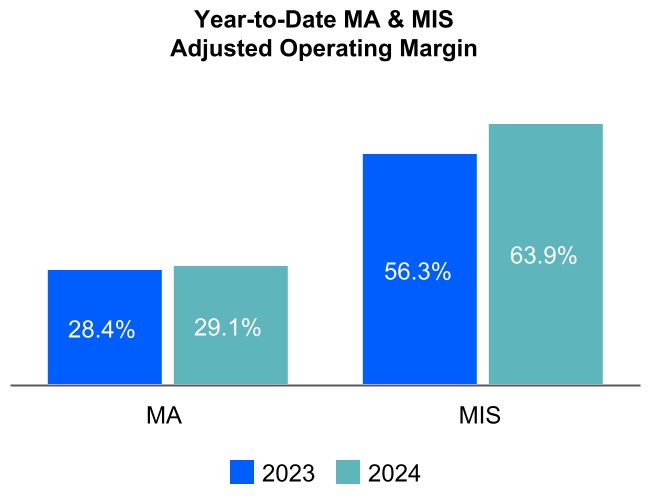
•Both MA and MIS’s adjusted operating margins increased from the prior-year period, reflecting strong revenue growth, operational leverage and a disciplined approach to expense management.
•Foreign currency translation had an immaterial impact on both operating and adjusted operating margins1.
|
|||||||
| EARNINGS PER SHARE (EPS) | ||
Diluted EPS and Adjusted Diluted EPS1 | ||
Second Quarter 2024 |
Year-to-Date 2024 | |||||||
|
•Both Diluted and Adjusted Diluted EPS1 increased from the prior-year period on higher operating income, primarily reflecting MIS’s second highest revenue on record.
•The Effective Tax Rate (ETR) of 23.1% was in line with the 23.4% reported in the prior-year period.
|
•The increase in both Diluted EPS and Adjusted Diluted EPS1 was primarily attributable to revenue growth in both segments given higher issuance volumes and growing demand for MA’s innovative solutions and analytical insights.
•The ETR was 23.2%, higher than the 12.0% reported in the prior-year period, primarily due to the favorable resolutions of uncertain tax positions within U.S. domestic and foreign tax jurisdictions in 2023.
|
|||||||
| CAPITAL ALLOCATION AND LIQUIDITY | ||
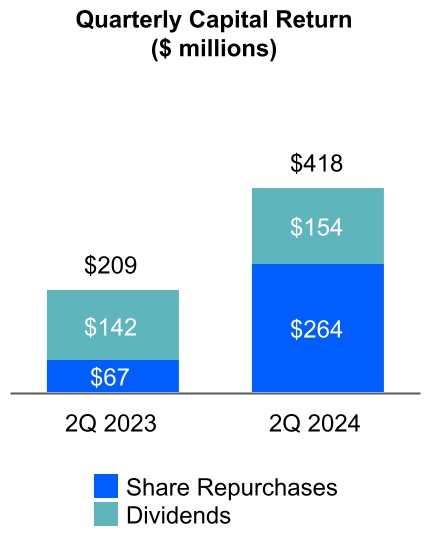
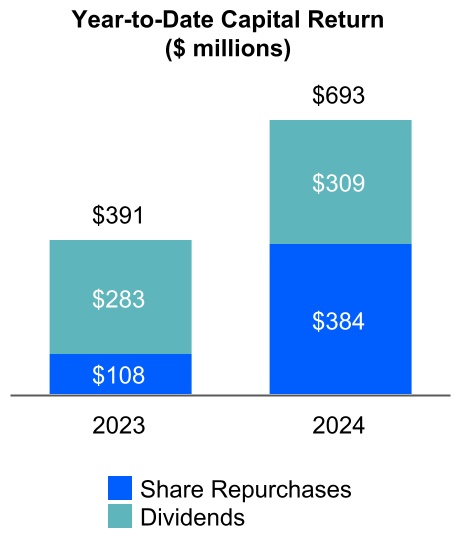
Capital Returned to Shareholders & Free Cash Flow1 | ||
|
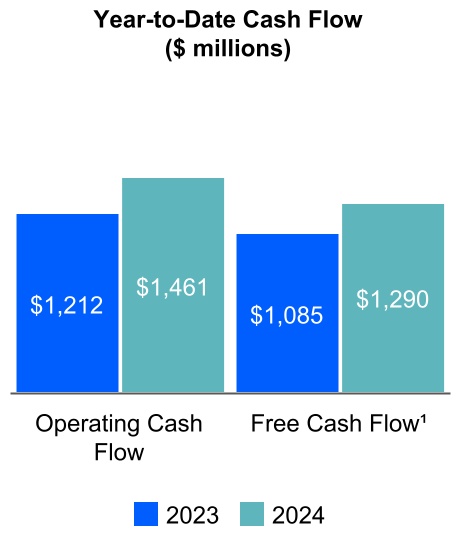
•Cash flow from operations for the first six months was $1,461 million and free cash flow1 was $1,290 million.
•The increase in free cash flow1 was primarily driven by net income growth partially offset by changes in working capital.
•On July 22, 2024, the Board of Directors declared a regular quarterly dividend of $0.85 per share of MCO Common Stock. The dividend will be payable on September 6, 2024, to stockholders of record at the close of business on August 16, 2024.
•During the second quarter of 2024, Moody’s repurchased 0.7 million shares at an average cost of $396.08 per share and issued net 0.1 million shares as part of its employee stock-based compensation programs. The net amount included shares withheld for employee payroll taxes.
•As of June 30, 2024, Moody’s had 182.1 million shares outstanding, with approximately $975 million of share repurchase authority remaining.
•As of June 30, 2024, Moody's had $6.9 billion of outstanding debt and an undrawn $1.25 billion revolving credit facility.
| ||
| ASSUMPTIONS AND OUTLOOK | ||
| Forecasted Item | Last Publicly Disclosed Assumption | Current Assumption | ||||||
U.S. GDP (1) growth |
1.5% - 2.5% | NC | ||||||
Euro area GDP (1) growth |
0.5% - 1.5% | NC | ||||||
Global GDP (1) growth |
2.0% - 3.0% |
NC |
||||||
| Global policy rates | To remain elevated, with some gradual rate reductions in the second half of 2024 | NC | ||||||
| U.S. high yield spreads | To fluctuate around 350 - 450 bps, with periodic volatility | NC | ||||||
| U.S. inflation rate | To decline towards 2.0% by year-end | To decline towards 2.0% by mid-2025 | ||||||
| Euro area inflation rate | Large economies to decline towards 2.0% by year-end | Large economies to decline towards 2.0% by mid-2025 | ||||||
| U.S. unemployment rate | To fluctuate around 4.0% during the year | NC | ||||||
| Global high yield default rate | To be in the range of 3.0% - 3.5% by year-end |
To be in the range of 3.5% - 4.0% by year-end |
||||||
Global MIS 2024 rated issuance |
Increase in the mid-to-high-single-digit percent range | Increase in the range of 20% to 25% |
||||||
| GBP/USD exchange rate | $1.26 for the remainder of the year | NC | ||||||
| EUR/USD exchange rate | $1.08 for the remainder of the year | $1.07 for the remainder of the year | ||||||
|
NC - There is no difference between the Company’s current assumption and the last publicly disclosed assumption for this item.
Note: All current assumptions are as of July 23, 2024. All last publicly disclosed assumptions are as of May 2, 2024.
(1) GDP growth represents real GDP.
| ||||||||
| TELECONFERENCE DETAILS | ||
| Date and Time | July 23, 2024, at 1:00 p.m. Eastern Time (ET). |
|||||||
| Webcast | The webcast and its replay can be accessed through Moody’s Investor Relations website, ir.moodys.com, within “Events & Presentations.” |
|||||||
| Dial In | U.S. and Canada |
‘+1-888-596-4144 |
||||||
Other callers |
‘+1-646-968-2525 |
|||||||
| Passcode | 515 6491 | |||||||
| Dial In Replay | A replay will be available immediately after the call on July 23, 2024 and until August 22, 2024. |
|||||||
U.S. and Canada |
‘+1-800-770-2030 |
|||||||
Other callers |
‘+1-647-362-9199 |
|||||||
| Passcode | 515 6491 | |||||||
| ABOUT MOODY’S CORPORATION | ||
| “SAFE HARBOR” STATEMENT UNDER THE PRIVATE SECURITIES LITIGATION REFORM ACT OF 1995 | ||
|
Three Months Ended
June 30,
|
Six Months Ended June 30, |
||||||||||||||||||||||
| Amounts in millions, except per share amounts | 2024 | 2023 | 2024 | 2023 | |||||||||||||||||||
| Revenue | $ | 1,817 | $ | 1,494 | $ | 3,603 | $ | 2,964 | |||||||||||||||
| Expenses: | |||||||||||||||||||||||
| Operating | 469 | 426 | 936 | 854 | |||||||||||||||||||
Selling, general and administrative |
446 | 415 | 859 | 801 | |||||||||||||||||||
| Depreciation and amortization | 110 | 93 | 210 | 181 | |||||||||||||||||||
| Restructuring | 2 | 10 | 7 | 24 | |||||||||||||||||||
| Charges related to asset abandonment | 15 | — | 15 | — | |||||||||||||||||||
| Total expenses | 1,042 | 944 | 2,027 | 1,860 | |||||||||||||||||||
| Operating income | 775 | 550 | 1,576 | 1,104 | |||||||||||||||||||
| Non-operating (expense) income, net | |||||||||||||||||||||||
| Interest expense, net | (63) | (71) | (125) | (119) | |||||||||||||||||||
Other non-operating income, net |
7 | 13 | 20 | 13 | |||||||||||||||||||
| Total non-operating (expense) income, net | (56) | (58) | (105) | (106) | |||||||||||||||||||
| Income before provision for income taxes | 719 | 492 | 1,471 | 998 | |||||||||||||||||||
| Provision for income taxes | 166 | 115 | 341 | 120 | |||||||||||||||||||
| Net income | 553 | 377 | 1,130 | 878 | |||||||||||||||||||
Less: net income attributable to noncontrolling interests |
1 | — | 1 | — | |||||||||||||||||||
| Net income attributable to Moody's Corporation | $ | 552 | $ | 377 | $ | 1,129 | $ | 878 | |||||||||||||||
| Earnings per share attributable to Moody's common shareholders | |||||||||||||||||||||||
| Basic | $ | 3.03 | $ | 2.05 | $ | 6.19 | $ | 4.79 | |||||||||||||||
| Diluted | $ | 3.02 | $ | 2.05 | $ | 6.16 | $ | 4.77 | |||||||||||||||
| Weighted average number of shares outstanding | |||||||||||||||||||||||
| Basic | 182.3 | 183.5 | 182.5 | 183.4 | |||||||||||||||||||
| Diluted | 183.0 | 184.1 | 183.2 | 184.1 | |||||||||||||||||||
| Amounts in millions | June 30, 2024 | December 31, 2023 | |||||||||
| ASSETS | |||||||||||
| Current assets: | |||||||||||
| Cash and cash equivalents | $ | 2,635 | $ | 2,130 | |||||||
| Short-term investments | 63 | 63 | |||||||||
Accounts receivable, net of allowance for credit losses of $35 in 2024 and $35 in 2023 |
1,694 | 1,659 | |||||||||
| Other current assets | 489 | 489 | |||||||||
| Total current assets | 4,881 | 4,341 | |||||||||
Property and equipment, net of accumulated depreciation of $1,378 in 2024 and $1,272 in 2023 |
652 | 603 | |||||||||
| Operating lease right-of-use assets | 242 | 277 | |||||||||
| Goodwill | 5,891 | 5,956 | |||||||||
| Intangible assets, net | 1,930 | 2,049 | |||||||||
| Deferred tax assets, net | 267 | 258 | |||||||||
| Other assets | 1,150 | 1,138 | |||||||||
| Total assets | $ | 15,013 | $ | 14,622 | |||||||
| LIABILITIES AND SHAREHOLDERS' EQUITY | |||||||||||
| Current liabilities: | |||||||||||
| Accounts payable and accrued liabilities | $ | 1,000 | $ | 1,076 | |||||||
| Current portion of operating lease liabilities | 108 | 108 | |||||||||
| Current portion of long-term debt | 688 | — | |||||||||
| Deferred revenue | 1,423 | 1,316 | |||||||||
| Total current liabilities | 3,219 | 2,500 | |||||||||
| Non-current portion of deferred revenue | 59 | 65 | |||||||||
| Long-term debt | 6,253 | 7,001 | |||||||||
| Deferred tax liabilities, net | 465 | 402 | |||||||||
| Uncertain tax positions | 207 | 196 | |||||||||
| Operating lease liabilities | 254 | 306 | |||||||||
| Other liabilities | 618 | 676 | |||||||||
| Total liabilities | 11,075 | 11,146 | |||||||||
| Total Moody's shareholders' equity | 3,778 | 3,318 | |||||||||
| Noncontrolling interests | 160 | 158 | |||||||||
| Total shareholders' equity | 3,938 | 3,476 | |||||||||
Total liabilities and shareholders' equity |
$ | 15,013 | $ | 14,622 | |||||||
| Six Months Ended June 30, |
|||||||||||
| Amounts in millions | 2024 | 2023 | |||||||||
Cash flows from operating activities |
|||||||||||
| Net income | $ | 1,130 | $ | 878 | |||||||
Reconciliation of net income to net cash provided by operating activities: |
|||||||||||
| Depreciation and amortization | 210 | 181 | |||||||||
| Stock-based compensation | 109 | 97 | |||||||||
| Deferred income taxes | 25 | 21 | |||||||||
Provision for credit losses on accounts receivable |
10 | 9 | |||||||||
Net changes in other operating assets and liabilities |
(23) | 26 | |||||||||
| Net cash provided by operating activities | 1,461 | 1,212 | |||||||||
Cash flows from investing activities |
|||||||||||
| Capital additions | (171) | (127) | |||||||||
| Purchases of investments | (87) | (53) | |||||||||
| Sales and maturities of investments | 81 | 81 | |||||||||
Purchases of investments in non-consolidated affiliates |
(2) | (2) | |||||||||
Sales of investments in non-consolidated affiliates |
— | 1 | |||||||||
| Cash paid for acquisitions, net of cash acquired | (12) | (3) | |||||||||
| Net cash used in investing activities | (191) | (103) | |||||||||
Cash flows from financing activities |
|||||||||||
| Repayment of notes | — | (200) | |||||||||
Proceeds from stock-based compensation plans |
45 | 31 | |||||||||
Treasury shares |
(384) | (108) | |||||||||
Repurchase of shares related to stock-based compensation |
(82) | (64) | |||||||||
Dividends |
(309) | (283) | |||||||||
| Dividends to noncontrolling interests | (1) | — | |||||||||
| Net cash used in financing activities | (731) | (624) | |||||||||
Effect of exchange rate changes on cash and cash equivalents |
(34) | 24 | |||||||||
| Increase in cash and cash equivalents | 505 | 509 | |||||||||
Cash and cash equivalents, beginning of period |
2,130 | 1,769 | |||||||||
Cash and cash equivalents, end of period |
$ | 2,635 | $ | 2,278 | |||||||
|
Three Months Ended
June 30,
|
Six Months Ended June 30, |
||||||||||||||||||||||
| Amounts in millions | 2024 | 2023 | 2024 | 2023 | |||||||||||||||||||
| Interest: | |||||||||||||||||||||||
| Income | $ | 23 | $ | 15 | $ | 45 | $ | 25 | |||||||||||||||
| Expense on borrowings | (74) | (75) | (148) | (145) | |||||||||||||||||||
(Expense) income on UTPs and other tax related liabilities(1) |
(5) | (4) | (9) | 14 | |||||||||||||||||||
| Net periodic pension costs - interest component | (7) | (7) | (13) | (13) | |||||||||||||||||||
| Total interest expense, net | $ | (63) | $ | (71) | $ | (125) | $ | (119) | |||||||||||||||
Other non-operating income, net: |
|||||||||||||||||||||||
| FX loss | $ | (4) | $ | (5) | $ | (7) | $ | (31) | |||||||||||||||
| Net periodic pension income - non-service and non-interest cost components | 8 | 9 | 16 | 18 | |||||||||||||||||||
| Income from investments in non-consolidated affiliates | 2 | 1 | 2 | 3 | |||||||||||||||||||
| Gain on investments | 5 | 5 | 8 | 11 | |||||||||||||||||||
Other(2) |
(4) | 3 | 1 | 12 | |||||||||||||||||||
Other non-operating income, net |
$ | 7 | $ | 13 | $ | 20 | $ | 13 | |||||||||||||||
| Total non-operating (expense) income, net | $ | (56) | $ | (58) | $ | (105) | $ | (106) | |||||||||||||||
(1) The amount for the six months ended June 30, 2023 reflects a $22 million reduction of tax-related interest expense primarily related to the resolutions of tax matters. | ||
(2) The amount for the six months ended June 30, 2023 reflects a benefit of $9 million related to the favorable resolutions of various tax matters. | ||
Three Months Ended June 30, |
|||||||||||||||||||||||||||||||||||||||||||||||
| 2024 | 2023 | ||||||||||||||||||||||||||||||||||||||||||||||
| Amounts in millions | MA | MIS | Eliminations | Consolidated | MA | MIS | Eliminations | Consolidated | |||||||||||||||||||||||||||||||||||||||
| Total external revenue | $ | 802 | $ | 1,015 | $ | — | $ | 1,817 | $ | 747 | $ | 747 | $ | — | $ | 1,494 | |||||||||||||||||||||||||||||||
| Intersegment revenue | 4 | 49 | (53) | — | 4 | 46 | (50) | — | |||||||||||||||||||||||||||||||||||||||
| Total revenue | 806 | 1,064 | (53) | 1,817 | 751 | 793 | (50) | 1,494 | |||||||||||||||||||||||||||||||||||||||
| Operating, SG&A | 576 | 392 | (53) | 915 | 541 | 350 | (50) | 841 | |||||||||||||||||||||||||||||||||||||||
| Adjusted Operating Income | $ | 230 | $ | 672 | $ | — | $ | 902 | $ | 210 | $ | 443 | $ | — | $ | 653 | |||||||||||||||||||||||||||||||
| Adjusted Operating Margin | 28.5 | % | 63.2 | % | 49.6 | % | 28.0 | % | 55.9 | % | 43.7 | % | |||||||||||||||||||||||||||||||||||
| Depreciation and amortization | 90 | 20 | — | 110 | 74 | 19 | — | 93 | |||||||||||||||||||||||||||||||||||||||
| Restructuring | 1 | 1 | — | 2 | 8 | 2 | — | 10 | |||||||||||||||||||||||||||||||||||||||
Charges related to asset abandonment (1) |
15 | — | — | 15 | — | — | — | — | |||||||||||||||||||||||||||||||||||||||
| Operating income | $ | 775 | $ | 550 | |||||||||||||||||||||||||||||||||||||||||||
| Operating margin | 42.7 | % | 36.8 | % | |||||||||||||||||||||||||||||||||||||||||||
| Six Months Ended June 30, | |||||||||||||||||||||||||||||||||||||||||||||||
| 2024 | 2023 | ||||||||||||||||||||||||||||||||||||||||||||||
| Amounts in millions | MA | MIS | Eliminations | Consolidated | MA | MIS | Eliminations | Consolidated | |||||||||||||||||||||||||||||||||||||||
| Total external revenue | $ | 1,601 | $ | 2,002 | $ | — | $ | 3,603 | $ | 1,484 | $ | 1,480 | $ | — | $ | 2,964 | |||||||||||||||||||||||||||||||
| Intersegment revenue | 7 | 96 | (103) | — | 7 | 91 | (98) | — | |||||||||||||||||||||||||||||||||||||||
| Total revenue | 1,608 | 2,098 | (103) | 3,603 | 1,491 | 1,571 | (98) | 2,964 | |||||||||||||||||||||||||||||||||||||||
| Operating, SG&A | 1,140 | 758 | (103) | 1,795 | 1,067 | 686 | (98) | 1,655 | |||||||||||||||||||||||||||||||||||||||
| Adjusted Operating Income | $ | 468 | $ | 1,340 | $ | — | $ | 1,808 | $ | 424 | $ | 885 | $ | — | $ | 1,309 | |||||||||||||||||||||||||||||||
| Adjusted Operating Margin | 29.1 | % | 63.9 | % | 50.2 | % | 28.4 | % | 56.3 | % | 44.2 | % | |||||||||||||||||||||||||||||||||||
| Depreciation and amortization | 172 | 38 | — | 210 | 144 | 37 | — | 181 | |||||||||||||||||||||||||||||||||||||||
| Restructuring | 3 | 4 | — | 7 | 16 | 8 | — | 24 | |||||||||||||||||||||||||||||||||||||||
Charges related to asset abandonment (1) |
15 | — | — | 15 | — | — | — | — | |||||||||||||||||||||||||||||||||||||||
| Operating income | $ | 1,576 | $ | 1,104 | |||||||||||||||||||||||||||||||||||||||||||
| Operating margin | 43.7 | % | 37.2 | % | |||||||||||||||||||||||||||||||||||||||||||
(1) Charges related to severance costs incurred pursuant to a reduction in staff due to the Company’s decision to outsource the production of certain sustainability content utilized in our product offerings. Additionally, the Company has reduced the estimated useful lives of certain internally developed software and amortizable intangible assets that are associated with the sustainability content offerings for which production is being outsourced. The Company expects to incur approximately $30 million in incremental amortization expense related to the change in estimated useful lives of these assets in the second half of 2024. | ||||||||||||||
Three Months Ended June 30, |
|||||||||||||||||||||||||||||||||||
| 2024 | 2023 | ||||||||||||||||||||||||||||||||||
| Amounts in millions | Transaction | Recurring | Total | Transaction | Recurring | Total | |||||||||||||||||||||||||||||
| Decision Solutions | $ | 35 | $ | 331 | $ | 366 | $ | 43 | $ | 291 | $ | 334 | |||||||||||||||||||||||
| 10 | % | 90 | % | 100 | % | 13 | % | 87 | % | 100 | % | ||||||||||||||||||||||||
| Research & Insights | $ | 3 | $ | 223 | $ | 226 | $ | 3 | $ | 214 | $ | 217 | |||||||||||||||||||||||
| 1 | % | 99 | % | 100 | % | 1 | % | 99 | % | 100 | % | ||||||||||||||||||||||||
| Data & Information | $ | 1 | $ | 209 | $ | 210 | $ | 1 | $ | 195 | $ | 196 | |||||||||||||||||||||||
| — | % | 100 | % | 100 | % | 1 | % | 99 | % | 100 | % | ||||||||||||||||||||||||
| Total MA | $ | 39 | $ | 763 | $ | 802 | $ | 47 | $ | 700 | $ | 747 | |||||||||||||||||||||||
| 5 | % | 95 | % | 100 | % | 6 | % | 94 | % | 100 | % | ||||||||||||||||||||||||
| Corporate Finance | $ | 388 | $ | 137 | $ | 525 | $ | 236 | $ | 129 | $ | 365 | |||||||||||||||||||||||
| 74 | % | 26 | % | 100 | % | 65 | % | 35 | % | 100 | % | ||||||||||||||||||||||||
| Structured Finance | $ | 76 | $ | 55 | $ | 131 | $ | 48 | $ | 54 | $ | 102 | |||||||||||||||||||||||
| 58 | % | 42 | % | 100 | % | 47 | % | 53 | % | 100 | % | ||||||||||||||||||||||||
| Financial Institutions | $ | 115 | $ | 80 | $ | 195 | $ | 73 | $ | 72 | $ | 145 | |||||||||||||||||||||||
| 59 | % | 41 | % | 100 | % | 50 | % | 50 | % | 100 | % | ||||||||||||||||||||||||
| Public, Project and Infrastructure Finance | $ | 110 | $ | 44 | $ | 154 | $ | 84 | $ | 43 | $ | 127 | |||||||||||||||||||||||
| 71 | % | 29 | % | 100 | % | 66 | % | 34 | % | 100 | % | ||||||||||||||||||||||||
| MIS Other | $ | 3 | $ | 7 | $ | 10 | $ | 2 | $ | 6 | $ | 8 | |||||||||||||||||||||||
| 30 | % | 70 | % | 100 | % | 25 | % | 75 | % | 100 | % | ||||||||||||||||||||||||
| Total MIS | $ | 692 | $ | 323 | $ | 1,015 | $ | 443 | $ | 304 | $ | 747 | |||||||||||||||||||||||
| 68 | % | 32 | % | 100 | % | 59 | % | 41 | % | 100 | % | ||||||||||||||||||||||||
| Total Moody's Corporation | $ | 731 | $ | 1,086 | $ | 1,817 | $ | 490 | $ | 1,004 | $ | 1,494 | |||||||||||||||||||||||
| 40 | % | 60 | % | 100 | % | 33 | % | 67 | % | 100 | % | ||||||||||||||||||||||||
| Six Months Ended June 30, | |||||||||||||||||||||||||||||||||||
| 2024 | 2023 | ||||||||||||||||||||||||||||||||||
| Amounts in millions | Transaction | Recurring |
Total | Transaction | Recurring |
Total | |||||||||||||||||||||||||||||
| Decision Solutions | $ | 72 | $ | 659 | $ | 731 | $ | 83 | $ | 585 | $ | 668 | |||||||||||||||||||||||
| 10 | % | 90 | % | 100 | % | 12 | % | 88 | % | 100 | % | ||||||||||||||||||||||||
| Research & Insights | $ | 7 | $ | 441 | $ | 448 | $ | 8 | $ | 424 | $ | 432 | |||||||||||||||||||||||
| 2 | % | 98 | % | 100 | % | 2 | % | 98 | % | 100 | % | ||||||||||||||||||||||||
| Data & Information | $ | 2 | $ | 420 | $ | 422 | $ | 1 | $ | 383 | $ | 384 | |||||||||||||||||||||||
| — | % | 100 | % | 100 | % | — | % | 100 | % | 100 | % | ||||||||||||||||||||||||
| Total MA | $ | 81 | $ | 1,520 | $ | 1,601 | $ | 92 | $ | 1,392 | $ | 1,484 | |||||||||||||||||||||||
| 5 | % | 95 | % | 100 | % | 6 | % | 94 | % | 100 | % | ||||||||||||||||||||||||
| Corporate Finance | $ | 787 | $ | 267 | $ | 1,054 | $ | 466 | $ | 255 | $ | 721 | |||||||||||||||||||||||
| 75 | % | 25 | % | 100 | % | 65 | % | 35 | % | 100 | % | ||||||||||||||||||||||||
| Structured Finance | $ | 135 | $ | 110 | $ | 245 | $ | 94 | $ | 107 | $ | 201 | |||||||||||||||||||||||
| 55 | % | 45 | % | 100 | % | 47 | % | 53 | % | 100 | % | ||||||||||||||||||||||||
| Financial Institutions | $ | 237 | $ | 153 | $ | 390 | $ | 143 | $ | 144 | $ | 287 | |||||||||||||||||||||||
| 61 | % | 39 | % | 100 | % | 50 | % | 50 | % | 100 | % | ||||||||||||||||||||||||
| Public, Project and Infrastructure Finance | $ | 206 | $ | 89 | $ | 295 | $ | 169 | $ | 87 | $ | 256 | |||||||||||||||||||||||
| 70 | % | 30 | % | 100 | % | 66 | % | 34 | % | 100 | % | ||||||||||||||||||||||||
| MIS Other | $ | 4 | $ | 14 | $ | 18 | $ | 3 | $ | 12 | $ | 15 | |||||||||||||||||||||||
| 22 | % | 78 | % | 100 | % | 20 | % | 80 | % | 100 | % | ||||||||||||||||||||||||
| Total MIS | $ | 1,369 | $ | 633 | $ | 2,002 | $ | 875 | $ | 605 | $ | 1,480 | |||||||||||||||||||||||
| 68 | % | 32 | % | 100 | % | 59 | % | 41 | % | 100 | % | ||||||||||||||||||||||||
| Total Moody's Corporation | $ | 1,450 | $ | 2,153 | $ | 3,603 | $ | 967 | $ | 1,997 | $ | 2,964 | |||||||||||||||||||||||
| 40 | % | 60 | % | 100 | % | 33 | % | 67 | % | 100 | % | ||||||||||||||||||||||||
Three Months Ended June 30, |
Six Months Ended June 30, | ||||||||||||||||||||||
| Amounts in millions | 2024 | 2023 | 2024 | 2023 | |||||||||||||||||||
| Operating income | $ | 775 | $ | 550 | $ | 1,576 | $ | 1,104 | |||||||||||||||
| Depreciation and amortization | 110 | 93 | 210 | 181 | |||||||||||||||||||
| Restructuring | 2 | 10 | 7 | 24 | |||||||||||||||||||
| Charges related to asset abandonment | 15 | — | 15 | — | |||||||||||||||||||
| Adjusted Operating Income | $ | 902 | $ | 653 | $ | 1,808 | $ | 1,309 | |||||||||||||||
| Operating margin | 42.7 | % | 36.8 | % | 43.7 | % | 37.2 | % | |||||||||||||||
| Adjusted Operating Margin | 49.6 | % | 43.7 | % | 50.2 | % | 44.2 | % | |||||||||||||||
| Six Months Ended June 30, | |||||||||||
| Amounts in millions | 2024 | 2023 | |||||||||
| Net cash provided by operating activities | $ | 1,461 | $ | 1,212 | |||||||
| Capital additions | (171) | (127) | |||||||||
| Free Cash Flow | $ | 1,290 | $ | 1,085 | |||||||
| Net cash used in investing activities | $ | (191) | $ | (103) | |||||||
| Net cash used in financing activities | $ | (731) | $ | (624) | |||||||
Three Months Ended June 30, |
Six Months Ended June 30, | |||||||||||||||||||||||||||||||||||||||||||||||||
| Amounts in millions | 2024 | 2023 | Change | Growth | 2024 | 2023 | Change | Growth | ||||||||||||||||||||||||||||||||||||||||||
| MCO revenue | $ | 1,817 | $ | 1,494 | $ | 323 | 22% | $ | 3,603 | $ | 2,964 | $ | 639 | 22% | ||||||||||||||||||||||||||||||||||||
| FX impact | 7 | — | 7 | 3 | — | 3 | ||||||||||||||||||||||||||||||||||||||||||||
Constant currency MCO revenue |
$ | 1,824 | $ | 1,494 | $ | 330 | 22% | $ | 3,606 | $ | 2,964 | $ | 642 | 22% | ||||||||||||||||||||||||||||||||||||
| MA revenue | $ | 802 | $ | 747 | $ | 55 | 7% | $ | 1,601 | $ | 1,484 | $ | 117 | 8% | ||||||||||||||||||||||||||||||||||||
| FX impact | 2 | — | 2 | (1) | — | (1) | ||||||||||||||||||||||||||||||||||||||||||||
Constant currency MA revenue |
$ | 804 | $ | 747 | $ | 57 | 8% | $ | 1,600 | $ | 1,484 | $ | 116 | 8% | ||||||||||||||||||||||||||||||||||||
| Decision Solutions revenue | $ | 366 | $ | 334 | $ | 32 | 10% | $ | 731 | $ | 668 | $ | 63 | 9% | ||||||||||||||||||||||||||||||||||||
| FX impact | 1 | — | 1 | (1) | — | (1) | ||||||||||||||||||||||||||||||||||||||||||||
Constant currency Decision Solutions revenue |
$ | 367 | $ | 334 | $ | 33 | 10% | $ | 730 | $ | 668 | $ | 62 | 9% | ||||||||||||||||||||||||||||||||||||
| Research and Insights revenue | $ | 226 | $ | 217 | $ | 9 | 4% | $ | 448 | $ | 432 | $ | 16 | 4% | ||||||||||||||||||||||||||||||||||||
| FX impact | — | — | — | — | — | — | ||||||||||||||||||||||||||||||||||||||||||||
Constant currency Research and Insights revenue |
$ | 226 | $ | 217 | $ | 9 | 4% | $ | 448 | $ | 432 | $ | 16 | 4% | ||||||||||||||||||||||||||||||||||||
| Data and Information revenue | $ | 210 | $ | 196 | $ | 14 | 7% | $ | 422 | $ | 384 | $ | 38 | 10% | ||||||||||||||||||||||||||||||||||||
| FX impact | 1 | — | 1 | — | — | — | ||||||||||||||||||||||||||||||||||||||||||||
Constant currency Data and Information revenue |
$ | 211 | $ | 196 | $ | 15 | 8% | $ | 422 | $ | 384 | $ | 38 | 10% | ||||||||||||||||||||||||||||||||||||
| MIS revenue | $ | 1,015 | $ | 747 | $ | 268 | 36% | $ | 2,002 | $ | 1,480 | $ | 522 | 35% | ||||||||||||||||||||||||||||||||||||
| FX impact | 5 | — | 5 | 4 | — | 4 | ||||||||||||||||||||||||||||||||||||||||||||
Constant currency MIS revenue |
$ | 1,020 | $ | 747 | $ | 273 | 37% | $ | 2,006 | $ | 1,480 | $ | 526 | 36% | ||||||||||||||||||||||||||||||||||||
CFG revenue |
$ | 525 | $ | 365 | $ | 160 | 44% | $ | 1,054 | $ | 721 | $ | 333 | 46% | ||||||||||||||||||||||||||||||||||||
| FX impact | 3 | — | 3 | 2 | — | 2 | ||||||||||||||||||||||||||||||||||||||||||||
Constant currency CFG revenue |
$ | 528 | $ | 365 | $ | 163 | 45% | $ | 1,056 | $ | 721 | $ | 335 | 46% | ||||||||||||||||||||||||||||||||||||
SFG revenue |
$ | 131 | $ | 102 | $ | 29 | 28% | $ | 245 | $ | 201 | $ | 44 | 22% | ||||||||||||||||||||||||||||||||||||
| FX impact | 1 | — | 1 | 1 | — | 1 | ||||||||||||||||||||||||||||||||||||||||||||
Constant currency SFG revenue |
$ | 132 | $ | 102 | $ | 30 | 29% | $ | 246 | $ | 201 | $ | 45 | 22% | ||||||||||||||||||||||||||||||||||||
| FIG revenue | $ | 195 | $ | 145 | $ | 50 | 34% | $ | 390 | $ | 287 | $ | 103 | 36% | ||||||||||||||||||||||||||||||||||||
| FX impact | 1 | — | 1 | 1 | — | 1 | ||||||||||||||||||||||||||||||||||||||||||||
| Constant currency FIG revenue | $ | 196 | $ | 145 | $ | 51 | 35% | $ | 391 | $ | 287 | $ | 104 | 36% | ||||||||||||||||||||||||||||||||||||
PPIF revenue |
$ | 154 | $ | 127 | $ | 27 | 21% | $ | 295 | $ | 256 | $ | 39 | 15% | ||||||||||||||||||||||||||||||||||||
| FX impact | — | — | — | — | — | — | ||||||||||||||||||||||||||||||||||||||||||||
Constant currency PPIF revenue |
$ | 154 | $ | 127 | $ | 27 | 21% | $ | 295 | $ | 256 | $ | 39 | 15% | ||||||||||||||||||||||||||||||||||||
| MA recurring revenue | $ | 763 | $ | 700 | $ | 63 | 9% | $ | 1,520 | $ | 1,392 | $ | 128 | 9% | ||||||||||||||||||||||||||||||||||||
| FX impact | 2 | — | 2 | (1) | — | (1) | ||||||||||||||||||||||||||||||||||||||||||||
Constant currency MA recurring revenue |
$ | 765 | $ | 700 | $ | 65 | 9% | $ | 1,519 | $ | 1,392 | $ | 127 | 9% | ||||||||||||||||||||||||||||||||||||
| Amounts in millions | June 30, 2024 | June 30, 2023 | Change | Growth | |||||||||||||||||||
| MA ARR | |||||||||||||||||||||||
| Decision Solutions | |||||||||||||||||||||||
| Banking | $ | 428 | $ | 392 | $ | 36 | 9% | ||||||||||||||||
| Insurance | 569 | 500 | 69 | 14% | |||||||||||||||||||
| KYC | 352 | 298 | 54 | 18% | |||||||||||||||||||
Total Decision Solutions |
$ | 1,349 | $ | 1,190 | $ | 159 | 13% | ||||||||||||||||
| Research and Insights | 902 | 850 | 52 | 6% | |||||||||||||||||||
| Data and Information | 854 | 773 | 81 | 10% | |||||||||||||||||||
| Total MA ARR | $ | 3,105 | $ | 2,813 | $ | 292 | 10% | ||||||||||||||||
Three Months Ended June 30, |
Six Months Ended June 30, | ||||||||||||||||||||||||||||||||||
| Amounts in millions | 2024 | 2023 | 2024 | 2023 | |||||||||||||||||||||||||||||||
| Net Income attributable to Moody's common shareholders | $ | 552 | $ | 377 | $ | 1,129 | $ | 878 | |||||||||||||||||||||||||||
| Pre-tax Acquisition-Related Intangible Amortization Expenses | $ | 48 | $ | 50 | $ | 97 | $ | 101 | |||||||||||||||||||||||||||
| Tax on Acquisition-Related Intangible Amortization Expenses | (12) | (12) | (24) | (24) | |||||||||||||||||||||||||||||||
| Net Acquisition-Related Intangible Amortization Expenses | 36 | 38 | 73 | 77 | |||||||||||||||||||||||||||||||
| Pre-tax restructuring | $ | 2 | $ | 10 | $ | 7 | $ | 24 | |||||||||||||||||||||||||||
| Tax on restructuring | (1) | (2) | (2) | (6) | |||||||||||||||||||||||||||||||
| Net restructuring | 1 | 8 | 5 | 18 | |||||||||||||||||||||||||||||||
| Pre-tax charges related to asset abandonment | $ | 15 | $ | — | $ | 15 | $ | — | |||||||||||||||||||||||||||
| Tax on charges related to asset abandonment | (4) | — | (4) | — | |||||||||||||||||||||||||||||||
| Net charges related to asset abandonment | 11 | — | 11 | — | |||||||||||||||||||||||||||||||
| Adjusted Net Income | $ | 600 | $ | 423 | $ | 1,218 | $ | 973 | |||||||||||||||||||||||||||
Three Months Ended June 30, |
Six Months Ended June 30, | ||||||||||||||||||||||||||||||||||
| 2024 | 2023 | 2024 | 2023 | ||||||||||||||||||||||||||||||||
| Diluted earnings per share attributable to Moody's common shareholders | $ | 3.02 | $ | 2.05 | $ | 6.16 | $ | 4.77 | |||||||||||||||||||||||||||
| Pre-tax Acquisition-Related Intangible Amortization Expenses | $ | 0.26 | $ | 0.27 | $ | 0.53 | $ | 0.55 | |||||||||||||||||||||||||||
| Tax on Acquisition-Related Intangible Amortization Expenses | (0.07) | (0.06) | (0.13) | (0.13) | |||||||||||||||||||||||||||||||
| Net Acquisition-Related Intangible Amortization Expenses | 0.19 | 0.21 | 0.40 | 0.42 | |||||||||||||||||||||||||||||||
| Pre-tax restructuring | $ | 0.01 | $ | 0.05 | $ | 0.04 | $ | 0.13 | |||||||||||||||||||||||||||
| Tax on restructuring | — | (0.01) | (0.01) | (0.03) | |||||||||||||||||||||||||||||||
| Net restructuring | 0.01 | 0.04 | 0.03 | 0.10 | |||||||||||||||||||||||||||||||
| Pre-tax charges related to asset abandonment | $ | 0.08 | $ | — | $ | 0.08 | $ | — | |||||||||||||||||||||||||||
| Tax on charges related to asset abandonment | (0.02) | — | (0.02) | — | |||||||||||||||||||||||||||||||
| Net charges related to asset abandonment | 0.06 | — | 0.06 | — | |||||||||||||||||||||||||||||||
| Adjusted Diluted EPS | $ | 3.28 | $ | 2.30 | $ | 6.65 | $ | 5.29 | |||||||||||||||||||||||||||
| Note: The tax impacts in the tables above were calculated using tax rates in effect in the jurisdiction for which the item relates. | ||
Full Year 2024 Moody's Corporation Guidance as of July 23, 2024 | ||||||||
| MOODY'S CORPORATION | Last Publicly Disclosed Guidance | Current Guidance | ||||||
| Revenue | Increase in the high-single-digit to low-double-digit percent range |
Increase in the low-teens percent range |
||||||
Operating Expenses |
Increase in the mid-to-high-single-digit percent range |
Increase in the high-single-digit percent range |
||||||
Operating Margin |
37% to 39% |
Approximately 39% |
||||||
Adjusted Operating Margin (1) |
44% to 46% |
46% to 47% |
||||||
Interest Expense, Net |
$240 - $260 million |
NC |
||||||
Effective Tax Rate |
22% to 24% |
NC |
||||||
Diluted EPS (2) |
$9.55 to $10.15 |
$9.95 to $10.35 |
||||||
Adjusted Diluted EPS (1) |
$10.40 to $11.00 |
$11.00 to $11.40 |
||||||
Operating Cash Flow |
$2.3 to $2.5 billion |
$2.4 to $2.6 billion |
||||||
Free Cash Flow (1) |
$1.9 to $2.1 billion |
$2.0 to $2.2 billion |
||||||
Share Repurchases |
Approximately $1.0 billion
(subject to available cash, market conditions, M&A opportunities, and other ongoing capital allocation decisions)
|
Approximately $1.3 billion
(subject to available cash, market conditions, M&A opportunities, and other ongoing capital allocation decisions)
|
||||||
| Moody's Analytics (MA) | Last Publicly Disclosed Guidance | Current Guidance | ||||||
MA Revenue |
Increase in the high-single-digit percent range |
NC |
||||||
ARR (3) |
Increase in the low-double-digit percent range |
Increase in the high-single-digit to low-double-digit percent range |
||||||
| MA Adjusted Operating Margin | 30% to 31% |
NC |
||||||
| Moody's Investors Service (MIS) | Last Publicly Disclosed Guidance | Current Guidance | ||||||
MIS Revenue |
Increase in the high-single-digit to low-double-digit percent range |
Increase in the high-teens percent range |
||||||
| MIS Adjusted Operating Margin | 56% to 58% |
58% to 59% |
||||||
|
NC - There is no difference between the Company’s current guidance and the last publicly disclosed guidance for this item.
Note: All current guidance as of July 23, 2024. All last publicly disclosed guidance is as of May 2, 2024.
(1) These metrics are adjusted measures. See below for reconciliation of these measures to their comparable U.S. GAAP measure. (2) The Company’s Diluted EPS guidance does not reflect the non-cash gain that will be recorded as a result of its acquisition of the remaining minority interests in Global Credit Rating Company Limited (GCR) in July 2024. Due to the close proximity of the date of the closing of the acquisition to the Company’s earnings release date, the valuations underlying the acquisition cannot be completed or effectively forecasted at this time without unreasonable effort. The revenues and expenses of GCR will not have a material impact on the Company’s 2024 financial results, including full year 2024 Diluted EPS.
(3) Refer to Table 10 within this earnings release for the definition of and further information on the ARR metric.
| ||||||||
|
Projected for the Year Ended
December 31, 2024
|
|||||
| Operating margin guidance | Approximately 39% |
||||
| Depreciation and amortization | Approximately 6.5% |
||||
| Restructuring | Negligible | ||||
Charges Related to Asset Abandonment |
Approximately 1% |
||||
| Adjusted Operating Margin guidance | 46% to 47% | ||||
| Projected for the Year Ended December 31, 2024 |
|||||
| Operating cash flow guidance | $2.4 to $2.6 billion | ||||
| Less: Capital expenditures | Approximately $350 million |
||||
| Free Cash Flow guidance | $2.0 to $2.2 billion | ||||
| Projected for the Year Ended December 31, 2024 |
|||||
| Diluted EPS guidance | $9.95 to $10.35 | ||||
| Acquisition-Related Intangible Amortization | Approximately $0.80 | ||||
| Restructuring | Approximately $0.05 |
||||
Charges Related to Asset Abandonment |
Approximately $0.20 |
||||
| Adjusted Diluted EPS guidance | $11.00 to $11.40 | ||||