| Delaware | 1-14037 | 13-3998945 | ||||||
| (State or Other Jurisdiction of Incorporation) | (Commission File Number) | (IRS Employer Identification No.) | ||||||
| ☐ | Written communications pursuant to Rule 425 under the Securities Act (17 CFR 230.425) | |||||||
| ☐ | Soliciting material pursuant to Rule 14a-12 under the Exchange Act (17 CFR 240.14a-12) |
|||||||
| ☐ | Pre-commencement communications pursuant to Rule 14d-2(b) under the Exchange Act (17 CFR 240.14d-2(b)) |
|||||||
| ☐ | Pre-commencement communications pursuant to Rule 13e-4(c) under the Exchange Act (17 CFR 240.13e-4(c)) | |||||||
| Title of each class | Trading Symbol(s) | Name of each exchange on which registered | ||||||||||||
| Common Stock, par value $0.01 per share | MCO | New York Stock Exchange | ||||||||||||
| 1.75% Senior Notes Due 2027 | MCO 27 | New York Stock Exchange | ||||||||||||
| 0.950% Senior Notes Due 2030 | MCO 30 | New York Stock Exchange | ||||||||||||
| Emerging growth company | ☐ | ||||
If an emerging growth company, indicate by check mark if the registrant has elected not to use the extended transition period for complying with any new or revised financial accounting standards provided pursuant to Section 13(a) of the Exchange Act. |
☐ | ||||
ITEM 2.02 |
RESULTS OF OPERATIONS AND FINANCIAL CONDITION |
3 | ||||||
| ITEM 5.02 | APPOINTMENT OF CERTAIN OFFICERS; COMPENSATORY ARRANGEMENTS OF CERTAIN OFFICERS | 3 | ||||||
| ITEM 7.01 | REGULATION FD DISCLOSURE | 3 | ||||||
| ITEM 9.01 | FINANCIAL STATEMENTS AND EXHIBITS | 3 | ||||||
| SIGNATURES | 4 | |||||||
| EXHIBIT 99.1 | ||||||||
| EXHIBIT 99.2 | ||||||||
| 104 | The cover page from this Current Report on Form 8-K, formatted in Inline XBRL. | ||||
| MOODY'S CORPORATION | |||||
| By: | /s/ Elizabeth M. McCarroll | ||||
| Elizabeth M. McCarroll | |||||
| Corporate Secretary and Associate General Counsel | |||||

FOURTH QUARTER AND FULL YEAR SUMMARY FINANCIALS | ||||||||||||||
| Moody’s Corporation (MCO) Revenue |
Moody’s Analytics (MA) Revenue |
Moody’s Investors Service (MIS) Revenue |
||||||||||||
4Q 2023 |
4Q 2023 |
4Q 2023 |
||||||||||||
$1.5 billion ⇑ 15% |
$796 million ⇑ 11% |
$684 million ⇑ 19% |
||||||||||||
| FY 2023 | FY 2023 | FY 2023 | ||||||||||||
$5.9 billion ⇑ 8% |
$3.1 billion ⇑ 10% |
$2.9 billion ⇑ 6% |
||||||||||||
| MCO Diluted EPS | MCO Adjusted Diluted EPS1 |
MCO FY 2024 Projected | ||||||||||||
4Q 2023 |
4Q 2023 |
Diluted EPS |
||||||||||||
$1.85 ⇑ 38% |
$2.19 ⇑ 37% |
$9.45 to $10.20 | ||||||||||||
| FY 2023 | FY 2023 | Adjusted Diluted EPS1 |
||||||||||||
$8.73 ⇑ 17% |
$9.90 ⇑ 16% |
$10.25 to $11.00 | ||||||||||||
“2023 was a year of tremendous progress for Moody's. We accelerated our pace of innovation, partnered with industry leaders, and produced best-in-class solutions for our customers, setting the foundation for future success. Moody’s continued to deliver strong financial performance, achieving revenue of $5.9 billion, up 8% from 2022. We are excited about the opportunities ahead of us as we harness the power of generative AI while investing for growth to create value for our stakeholders.” | |||||
|
Rob Fauber
President and Chief Executive Officer
| |||||
1 Refer to the tables at the end of this press release for reconciliations of adjusted and constant currency measures to U.S. GAAP. | |||||
| REVENUE | ||
| Moody’s Corporation (MCO) | ||


Fourth Quarter 2023 |
Full Year 2023 | |||||||
|
•Revenue increased 15%, or 13% on a constant currency basis1, from the prior-year period.
•MA’s revenue grew 11%, or 10% on a constant currency basis1, from the prior-year period, with all lines of business achieving double-digit revenue growth.
•MIS’s revenue grew 19%, or 17% on a constant currency basis1, from the prior-year period, as debt capital markets continued to recover and the outlook for macroeconomic conditions improved.
|
•Revenue increased to $5.9 billion, up 8% from the prior year.
•MA’s revenue grew 10% from the prior year, to over $3 billion, now representing 52% of MCO’s total revenue.
•MIS’s revenue grew 6% as markets stabilized and issuers acclimatized to the higher interest rate environment.
•Foreign currency exchange had an immaterial impact on MCO, MA and MIS’s revenues.
|
|||||||
| Moody’s Analytics (MA) | ||


Fourth Quarter 2023 |
Full Year 2023 | |||||||
|
•Revenue increased 11%, or 10% on a constant currency basis1, from the prior-year period.
•Decision Solutions revenue grew 10%, or 8% on a constant currency basis1. Banking, Insurance and Know Your Customer (KYC) reported revenue grew 4%, 9% and 22%, respectively.
•Research & Insights revenue increased 12%, or 11% on a constant currency basis1, reflecting continued demand and a more favorable sales mix in the quarter.
•Data & Information revenue increased 14%, or 11% on a constant currency basis1. Growth continues to be driven by rising demand for ratings data feeds.
|
•Revenue increased 10% from the prior year. Foreign currency translation had an immaterial impact on MA’s revenue.
•Annualized Recurring Revenue or ARR2 was up 10% with Decision Solutions, Research & Insights and Data & Information ARR growing 11%, 7% and 10%, respectively.
•Within Decision Solutions, ARR growth for Banking, Insurance and KYC was 9%, 11% and 17%.
|
|||||||
2 Refer to Table 10 at the end of this press release for the definition of and further information on the Annualized Recurring Revenue (ARR) metric. | |||||
| Moody’s Investors Service (MIS) | ||


Fourth Quarter 2023 |
Full Year 2023 | |||||||
|
•Revenue grew 19%, or 17% on a constant currency basis1, from the prior-year period.
•Benchmark treasury rates continued their downward trajectory from early in the quarter as markets started to price in potential rate cuts in 2024.
•Growth was driven by Corporate Finance, with bank loans having the strongest quarter since the beginning of 2022, predominantly driven by refinancing activity.
•A favorable issuance mix within Public, Project and Infrastructure Finance positively impacted revenue growth.
•Structured Finance revenue growth was driven by increased CLO issuance and favorable pricing constructs for CMBS.
|
•Revenue increased 6% compared to the prior year. Foreign currency translation had an immaterial impact on MIS’s revenue.
•Revenue increased in nearly all lines of business as market conditions became more favorable, with Investment Grade and High Yield Bond activity showing the strongest growth.
•Financial Institutions revenue benefitted from a favorable issuance mix due to opportunistic activity from infrequent bank issuers.
•Structured Finance revenue decreased as higher funding costs and ongoing uncertainty constrained issuance activity over the course of the year.
|
|||||||
| OPERATING EXPENSES AND MARGIN | ||
MCO Operating Expenses | ||


Full Year 2023 |
Full Year 2024 Forecast |
|||||||
|
•Operating expenses grew 5% from the prior-year period, including 3% from higher incentive compensation accruals and stock-based compensation.
•Recorded $87 million in charges related to the 2022 – 2023 Geolocation Restructuring Program. These actions supported operating leverage improvements in 2023 and created capacity for future organic investment.
•Foreign currency translation had an immaterial impact on operating expenses.
|
•Operating expenses projected to increase in the mid-to-high-single-digit percent range in 2024.
•Assumptions underpinning operating growth include salary and promotion increases as well as ongoing and incremental strategic investment across the firm, most of which is attributable to MA.
•Increase in depreciation and amortization expense is primarily driven by existing investments associated with the development of SaaS-based solutions in MA.
|
|||||||
Operating Margin and Adjusted Operating Margin1 | ||


Fourth Quarter 2023 |
Full Year 2023 | |||||||
|
•MCO’s operating margin was 33.6% and adjusted operating margin1 was 42.6%.
•Foreign currency translation had an immaterial impact on both operating and adjusted operating margins1.
•MA’s adjusted operating margin of 31.4% is a combination of the continuous investment in high growth markets combined with the execution of cost control initiatives.
•MIS’s adjusted operating margin was 51.9%, reflecting better revenue growth from an improvement in debt issuance, as well as internal efficiencies.
|
•MCO’s operating margin was 36.1% and adjusted operating margin1 was 43.9%.
•Foreign currency translation had an immaterial impact on both operating and adjusted operating margins1.
•MA and MIS’s adjusted operating margins continued to be supported by proactive cost management actions initiated in the prior year and prudent deployment of organic investment.
|
|||||||
| EARNINGS PER SHARE (EPS) | ||
Diluted EPS and Adjusted Diluted EPS1 | ||


Fourth Quarter 2023 |
Full Year 2023 | |||||||
|
•Diluted and adjusted diluted EPS1 increased from the prior-year period due to strong revenue growth derived from an increase in issuance activity and growing demand for data feeds and SaaS-based solutions.
•The Effective Tax Rate (ETR) was 24.4%, in line with 24.8% reported in the prior-year period.
|
•Diluted and adjusted diluted EPS1 increased from the prior-year period due to robust revenue growth, combined with favorable tax resolutions during the year.
•ETR was 16.9%, significantly lower than the 21.9% reported in the prior-year, primarily due to the favorable resolutions of uncertain tax positions within U.S. domestic and foreign tax jurisdictions in the first quarter of 2023 that are not expected to occur to a similar magnitude in future years.
|
|||||||
| CAPITAL ALLOCATION AND LIQUIDITY | ||
Capital Returned to Shareholders & Free Cash Flow1 | ||


|
•Cash flow from operations was $2,151 million and free cash flow1 was $1,880 million.
•The increase in free cash flow1 is due to improvements in working capital and higher net income, mainly driven by robust revenue growth from both segments.
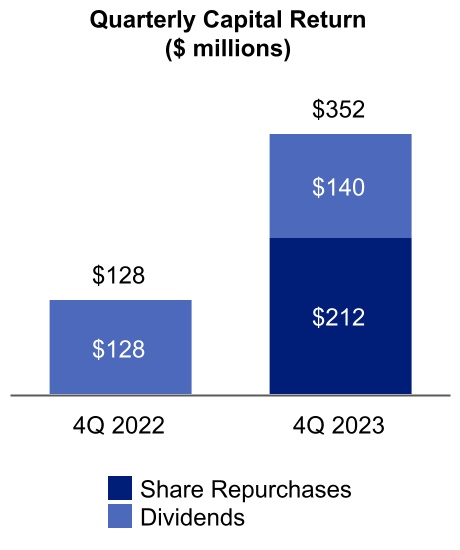
•On February 5, 2024, the Board of Directors declared a regular quarterly dividend of $0.85 per share of MCO Common Stock, a 10% increase from the prior quarterly dividend of $0.77 per share. The dividend will be payable on March 15, 2024, to stockholders of record at the close of business on February 23, 2024.
•During the fourth quarter of 2023, Moody’s repurchased 0.6 million shares at an average cost of $346.80 per share and issued net 0.1 million shares as part of its employee stock-based compensation programs. The net amount included shares withheld for employee payroll taxes.
•As of December 31, 2023, Moody’s had 182 million shares outstanding, with approximately $359 million of share repurchase authority remaining. On February 5, 2024, the Board of Directors authorized an additional $1 billion in share repurchase authority.
•As of December 31, 2023, Moody's had $7.0 billion of outstanding debt and an undrawn $1.25 billion revolving credit facility.
| ||
| ASSUMPTIONS AND OUTLOOK | ||
| Forecasted Item | Current assumption | ||||
U.S. GDP(1) growth |
1.0% - 2.0% |
||||
Euro area GDP(1) growth |
0.5% - 1.5% |
||||
| Global benchmark rates | Gradual rate reductions starting in 2Q 2024 |
||||
| U.S. high yield spreads | To fluctuate around 400 - 500 bps, with periodic volatility |
||||
| U.S. inflation rate | To decline to 2.0% by year-end |
||||
| Euro area inflation rate | Large economies to decline to around 2.0% by year-end |
||||
| U.S. unemployment rate | To average between 4.0% - 4.5% for the full year |
||||
| Global high yield default rate | Rise towards 5.0% in 1H 2024 and then ease to around 4.0% by year-end |
||||
| Global MIS rated issuance | Increase in the mid-to-high-single-digit percent range |
||||
| GBP/USD exchange rate | $1.27 for the full year |
||||
| EUR/USD exchange rate | $1.10 for the full year |
||||
|
Note: All current assumptions are as of February 13, 2024.
(1) GDP growth represents real GDP.
| |||||
| TELECONFERENCE DETAILS | ||
| Date and Time | February 13, 2024, at 11:30 a.m. Eastern Time (ET). |
|||||||
| Webcast | The webcast and its replay can be accessed through Moody’s Investor Relations website, ir.moodys.com, within “Events & Presentations.” |
|||||||
| Dial In | U.S. and Canada |
‘+1-888-330-2508 |
||||||
Other callers |
‘+1-240-789-2735 |
|||||||
| Passcode | 9302427 | |||||||
| Dial In Replay | A replay will be available immediately after the call on February 13, 2024, and until March 14, 2024. |
|||||||
U.S. and Canada |
‘+1-800-770-2030 |
|||||||
Other callers |
‘+1-647-362-9199 |
|||||||
| Passcode | 9302427 | |||||||
| ABOUT MOODY’S CORPORATION | ||
| “SAFE HARBOR” STATEMENT UNDER THE PRIVATE SECURITIES LITIGATION REFORM ACT OF 1995 | ||
|
Three Months Ended
December 31,
|
Year Ended December 31, |
||||||||||||||||||||||
| Amounts in millions, except per share amounts | 2023 | 2022 | 2023 | 2022 | |||||||||||||||||||
| Revenue | $ | 1,480 | $ | 1,290 | $ | 5,916 | $ | 5,468 | |||||||||||||||
| Expenses: | |||||||||||||||||||||||
| Operating | 421 | 410 | 1,687 | 1,613 | |||||||||||||||||||
Selling, general and administrative |
428 | 403 | 1,632 | 1,527 | |||||||||||||||||||
| Depreciation and amortization | 97 | 89 | 373 | 331 | |||||||||||||||||||
| Restructuring | 36 | 82 | 87 | 114 | |||||||||||||||||||
| Total expenses | 982 | 984 | 3,779 | 3,585 | |||||||||||||||||||
| Operating income | 498 | 306 | 2,137 | 1,883 | |||||||||||||||||||
| Non-operating (expense) income, net | |||||||||||||||||||||||
| Interest expense, net | (66) | (65) | (251) | (231) | |||||||||||||||||||
Other non-operating income, net |
18 | 16 | 49 | 38 | |||||||||||||||||||
| Gain on extinguishment of debt | — | 70 | — | 70 | |||||||||||||||||||
| Total non-operating (expense) income, net | (48) | 21 | (202) | (123) | |||||||||||||||||||
| Income before provision for income taxes | 450 | 327 | 1,935 | 1,760 | |||||||||||||||||||
| Provision for income taxes | 110 | 81 | 327 | 386 | |||||||||||||||||||
| Net income | 340 | 246 | 1,608 | 1,374 | |||||||||||||||||||
Less: net income attributable to noncontrolling interests |
— | — | 1 | — | |||||||||||||||||||
| Net income attributable to Moody's Corporation | $ | 340 | $ | 246 | $ | 1,607 | $ | 1,374 | |||||||||||||||
| Earnings per share attributable to Moody's common shareholders | |||||||||||||||||||||||
| Basic | $ | 1.86 | $ | 1.34 | $ | 8.77 | $ | 7.47 | |||||||||||||||
| Diluted | $ | 1.85 | $ | 1.34 | $ | 8.73 | $ | 7.44 | |||||||||||||||
| Weighted average number of shares outstanding | |||||||||||||||||||||||
| Basic | 182.7 | 183.2 | 183.2 | 183.9 | |||||||||||||||||||
| Diluted | 183.6 | 183.9 | 184.0 | 184.7 | |||||||||||||||||||
| Amounts in millions | December 31, 2023 | December 31, 2022 | |||||||||
| ASSETS | |||||||||||
| Current assets: | |||||||||||
| Cash and cash equivalents | $ | 2,130 | $ | 1,769 | |||||||
| Short-term investments | 63 | 90 | |||||||||
Accounts receivable, net of allowance for credit losses of $35 in 2023 and $40 in 2022 |
1,659 | 1,652 | |||||||||
| Other current assets | 489 | 583 | |||||||||
| Total current assets | 4,341 | 4,094 | |||||||||
Property and equipment, net of accumulated depreciation of $1,272 in 2023 and $1,123 in 2022 |
603 | 502 | |||||||||
| Operating lease right-of-use assets | 277 | 346 | |||||||||
| Goodwill | 5,956 | 5,839 | |||||||||
| Intangible assets, net | 2,049 | 2,210 | |||||||||
| Deferred tax assets, net | 258 | 266 | |||||||||
| Other assets | 1,138 | 1,092 | |||||||||
| Total assets | $ | 14,622 | $ | 14,349 | |||||||
| LIABILITIES AND SHAREHOLDERS' EQUITY | |||||||||||
| Current liabilities: | |||||||||||
| Accounts payable and accrued liabilities | $ | 1,076 | $ | 1,011 | |||||||
| Current portion of operating lease liabilities | 108 | 106 | |||||||||
| Deferred revenue | 1,316 | 1,258 | |||||||||
| Total current liabilities | 2,500 | 2,375 | |||||||||
| Non-current portion of deferred revenue | 65 | 75 | |||||||||
| Long-term debt | 7,001 | 7,389 | |||||||||
| Deferred tax liabilities, net | 402 | 457 | |||||||||
| Uncertain tax positions | 196 | 322 | |||||||||
| Operating lease liabilities | 306 | 368 | |||||||||
| Other liabilities | 676 | 674 | |||||||||
| Total liabilities | 11,146 | 11,660 | |||||||||
| Total Moody's shareholders' equity | 3,318 | 2,519 | |||||||||
| Noncontrolling interests | 158 | 170 | |||||||||
| Total shareholders' equity | 3,476 | 2,689 | |||||||||
Total liabilities and shareholders' equity |
$ | 14,622 | $ | 14,349 | |||||||
| Year Ended December 31, |
|||||||||||
| Amounts in millions | 2023 | 2022 | |||||||||
Cash flows from operating activities |
|||||||||||
| Net income | $ | 1,608 | $ | 1,374 | |||||||
Reconciliation of net income to net cash provided by operating activities: |
|||||||||||
| Depreciation and amortization | 373 | 331 | |||||||||
| Stock-based compensation | 193 | 169 | |||||||||
| Deferred income taxes | (38) | 48 | |||||||||
Provision for credit losses on accounts receivable |
22 | 25 | |||||||||
Right-of-use asset impairment & other non-cash restructuring/impairment charges |
35 | 29 | |||||||||
| FX translation losses reclassified to net income | — | 20 | |||||||||
| Gain on extinguishment of debt | — | (70) | |||||||||
Gain on sale of non-consolidated affiliates |
(4) | — | |||||||||
Net changes in other operating assets and liabilities |
(38) | (452) | |||||||||
| Net cash provided by operating activities | 2,151 | 1,474 | |||||||||
Cash flows from investing activities |
|||||||||||
| Capital additions | (271) | (283) | |||||||||
| Purchases of investments | (143) | (246) | |||||||||
| Sales and maturities of investments | 162 | 216 | |||||||||
Purchases of investments in non-consolidated affiliates |
(5) | (74) | |||||||||
Sales of investments in non-consolidated affiliates |
13 | 2 | |||||||||
| Cash paid for acquisitions, net of cash acquired | (3) | (97) | |||||||||
| Receipts from settlement of net investment hedges | — | 220 | |||||||||
| Net cash used in investing activities | (247) | (262) | |||||||||
Cash flows from financing activities |
|||||||||||
| Issuance of notes | — | 988 | |||||||||
| Repayment of notes | (500) | (626) | |||||||||
Proceeds from stock-based compensation plans |
50 | 26 | |||||||||
Repurchase of shares related to stock-based compensation |
(71) | (87) | |||||||||
Treasury shares |
(490) | (983) | |||||||||
Dividends |
(564) | (515) | |||||||||
| Dividends to noncontrolling interests | (9) | (1) | |||||||||
| Debt issuance costs, extinguishment costs and related fees | — | (10) | |||||||||
| Net cash used in financing activities | (1,584) | (1,208) | |||||||||
Effect of exchange rate changes on cash and cash equivalents |
41 | (46) | |||||||||
| Increase (decrease) in cash and cash equivalents | 361 | (42) | |||||||||
Cash and cash equivalents, beginning of period |
1,769 | 1,811 | |||||||||
Cash and cash equivalents, end of period |
$ | 2,130 | $ | 1,769 | |||||||
|
Three Months Ended
December 31,
|
Year Ended December 31, |
||||||||||||||||||||||
| Amounts in millions | 2023 | 2022 | 2023 | 2022 | |||||||||||||||||||
| Interest: | |||||||||||||||||||||||
Expense on borrowings(1) |
$ | (76) | $ | (64) | $ | (296) | $ | (216) | |||||||||||||||
UTPs and other tax related liabilities(2) |
(2) | (2) | 8 | (13) | |||||||||||||||||||
| Net periodic pension costs - interest component | (7) | (5) | (26) | (17) | |||||||||||||||||||
| Income | 19 | 6 | 63 | 15 | |||||||||||||||||||
| Total interest expense, net | $ | (66) | $ | (65) | $ | (251) | $ | (231) | |||||||||||||||
Other non-operating income, net: |
|||||||||||||||||||||||
FX loss(3) |
$ | (1) | $ | (1) | $ | (30) | $ | (10) | |||||||||||||||
| Net periodic pension costs - other components | 9 | 6 | 35 | 24 | |||||||||||||||||||
| Income from investments in non-consolidated affiliates | 7 | 3 | 19 | 17 | |||||||||||||||||||
Gain (loss) on investments |
3 | 4 | 14 | (14) | |||||||||||||||||||
Other |
— | 4 | 11 | 21 | |||||||||||||||||||
Other non-operating income, net |
$ | 18 | $ | 16 | $ | 49 | $ | 38 | |||||||||||||||
Gain on extinguishment of debt (4) |
— | 70 | — | 70 | |||||||||||||||||||
| Total non-operating (expense) income, net | $ | (48) | $ | 21 | $ | (202) | $ | (123) | |||||||||||||||
(1) Expense on borrowings includes interest on long-term debt and realized gains/losses related to interest rate swaps and cross currency swaps. | ||
(2) The amount for the year ended December 31, 2023 includes a $22 million reduction of tax-related interest expense primarily related to the resolutions of outstanding tax matters during the first quarter of 2023. | ||
(3) The amount for the year ended December 31, 2022 includes FX translation losses of $20 million reclassified to earnings resulting from the Company no longer conducting commercial operations in Russia. | ||
(4) The gain on extinguishment of debt for the quarter and year ended December 31, 2022 relates to the early redemption of a portion of the 2.55% 2020 Senior Notes, due 2060. | ||
Three Months Ended December 31, |
|||||||||||||||||||||||||||||||||||||||||||||||
| 2023 | 2022 | ||||||||||||||||||||||||||||||||||||||||||||||
| Amounts in millions | MA | MIS | Eliminations | Consolidated | MA | MIS | Eliminations | Consolidated | |||||||||||||||||||||||||||||||||||||||
| Total external revenue | $ | 796 | $ | 684 | $ | — | $ | 1,480 | $ | 714 | $ | 576 | $ | — | $ | 1,290 | |||||||||||||||||||||||||||||||
| Intersegment revenue | 3 | 48 | (51) | — | 3 | 45 | (48) | — | |||||||||||||||||||||||||||||||||||||||
| Total revenue | 799 | 732 | (51) | 1,480 | 717 | 621 | (48) | 1,290 | |||||||||||||||||||||||||||||||||||||||
| Operating, SG&A | 548 | 352 | (51) | 849 | 514 | 347 | (48) | 813 | |||||||||||||||||||||||||||||||||||||||
| Adjusted Operating Income | $ | 251 | $ | 380 | $ | — | $ | 631 | $ | 203 | $ | 274 | $ | — | $ | 477 | |||||||||||||||||||||||||||||||
| Adjusted Operating Margin | 31.4 | % | 51.9 | % | 42.6 | % | 28.3 | % | 44.1 | % | 37.0 | % | |||||||||||||||||||||||||||||||||||
| Depreciation and amortization | 78 | 19 | — | 97 | 68 | 21 | — | 89 | |||||||||||||||||||||||||||||||||||||||
| Restructuring | 21 | 15 | — | 36 | 32 | 50 | — | 82 | |||||||||||||||||||||||||||||||||||||||
| Operating income | $ | 498 | $ | 306 | |||||||||||||||||||||||||||||||||||||||||||
| Operating margin | 33.6 | % | 23.7 | % | |||||||||||||||||||||||||||||||||||||||||||
| Year Ended December 31, | |||||||||||||||||||||||||||||||||||||||||||||||
| 2023 | 2022 | ||||||||||||||||||||||||||||||||||||||||||||||
| Amounts in millions | MA | MIS | Eliminations | Consolidated | MA | MIS | Eliminations | Consolidated | |||||||||||||||||||||||||||||||||||||||
| Total external revenue | $ | 3,056 | $ | 2,860 | $ | — | $ | 5,916 | $ | 2,769 | $ | 2,699 | $ | — | $ | 5,468 | |||||||||||||||||||||||||||||||
| Intersegment revenue | 13 | 186 | (199) | — | 8 | 174 | (182) | — | |||||||||||||||||||||||||||||||||||||||
| Total revenue | 3,069 | 3,046 | (199) | 5,916 | 2,777 | 2,873 | (182) | 5,468 | |||||||||||||||||||||||||||||||||||||||
| Operating, SG&A | 2,132 | 1,386 | (199) | 3,319 | 1,937 | 1,385 | (182) | 3,140 | |||||||||||||||||||||||||||||||||||||||
| Adjusted Operating Income | $ | 937 | $ | 1,660 | $ | — | $ | 2,597 | $ | 840 | $ | 1,488 | $ | — | $ | 2,328 | |||||||||||||||||||||||||||||||
| Adjusted Operating Margin | 30.5 | % | 54.5 | % | 43.9 | % | 30.2 | % | 51.8 | % | 42.6 | % | |||||||||||||||||||||||||||||||||||
| Depreciation and amortization | 298 | 75 | — | 373 | 250 | 81 | — | 331 | |||||||||||||||||||||||||||||||||||||||
| Restructuring | 59 | 28 | — | 87 | 49 | 65 | — | 114 | |||||||||||||||||||||||||||||||||||||||
| Operating income | $ | 2,137 | $ | 1,883 | |||||||||||||||||||||||||||||||||||||||||||
| Operating margin | 36.1 | % | 34.4 | % | |||||||||||||||||||||||||||||||||||||||||||
Three Months Ended December 31, |
|||||||||||||||||||||||||||||||||||
| 2023 | 2022 | ||||||||||||||||||||||||||||||||||
| Amounts in millions | Transaction | Recurring | Total | Transaction | Recurring | Total | |||||||||||||||||||||||||||||
| Decision Solutions | $ | 43 | $ | 318 | $ | 361 | $ | 41 | $ | 288 | $ | 329 | |||||||||||||||||||||||
| 12 | % | 88 | % | 100 | % | 12 | % | 88 | % | 100 | % | ||||||||||||||||||||||||
| Research & Insights | $ | 4 | $ | 226 | $ | 230 | $ | 5 | $ | 200 | $ | 205 | |||||||||||||||||||||||
| 2 | % | 98 | % | 100 | % | 2 | % | 98 | % | 100 | % | ||||||||||||||||||||||||
| Data & Information | $ | 1 | $ | 204 | $ | 205 | $ | — | $ | 180 | $ | 180 | |||||||||||||||||||||||
| — | % | 100 | % | 100 | % | — | % | 100 | % | 100 | % | ||||||||||||||||||||||||
| Total MA | $ | 48 | $ | 748 | $ | 796 | $ | 46 | $ | 668 | $ | 714 | |||||||||||||||||||||||
| 6 | % | 94 | % | 100 | % | 6 | % | 94 | % | 100 | % | ||||||||||||||||||||||||
| Corporate Finance | $ | 205 | $ | 132 | $ | 337 | $ | 127 | $ | 126 | $ | 253 | |||||||||||||||||||||||
| 61 | % | 39 | % | 100 | % | 50 | % | 50 | % | 100 | % | ||||||||||||||||||||||||
| Structured Finance | $ | 48 | $ | 54 | $ | 102 | $ | 45 | $ | 49 | $ | 94 | |||||||||||||||||||||||
| 47 | % | 53 | % | 100 | % | 48 | % | 52 | % | 100 | % | ||||||||||||||||||||||||
| Financial Institutions | $ | 59 | $ | 73 | $ | 132 | $ | 52 | $ | 71 | $ | 123 | |||||||||||||||||||||||
| 45 | % | 55 | % | 100 | % | 42 | % | 58 | % | 100 | % | ||||||||||||||||||||||||
| Public, Project and Infrastructure Finance | $ | 61 | $ | 44 | $ | 105 | $ | 52 | $ | 42 | $ | 94 | |||||||||||||||||||||||
| 58 | % | 42 | % | 100 | % | 55 | % | 45 | % | 100 | % | ||||||||||||||||||||||||
| MIS Other | $ | 2 | $ | 6 | $ | 8 | $ | 1 | $ | 11 | $ | 12 | |||||||||||||||||||||||
| 25 | % | 75 | % | 100 | % | 8 | % | 92 | % | 100 | % | ||||||||||||||||||||||||
| Total MIS | $ | 375 | $ | 309 | $ | 684 | $ | 277 | $ | 299 | $ | 576 | |||||||||||||||||||||||
| 55 | % | 45 | % | 100 | % | 48 | % | 52 | % | 100 | % | ||||||||||||||||||||||||
| Total Moody's Corporation | $ | 423 | $ | 1,057 | $ | 1,480 | $ | 323 | $ | 967 | $ | 1,290 | |||||||||||||||||||||||
| 29 | % | 71 | % | 100 | % | 25 | % | 75 | % | 100 | % | ||||||||||||||||||||||||
| Year Ended December 31, | |||||||||||||||||||||||||||||||||||
| 2023 | 2022 | ||||||||||||||||||||||||||||||||||
| Amounts in millions | Transaction | Recurring |
Total | Transaction | Recurring |
Total | |||||||||||||||||||||||||||||
| Decision Solutions | $ | 169 | $ | 1,214 | $ | 1,383 | $ | 153 | $ | 1,092 | $ | 1,245 | |||||||||||||||||||||||
| 12 | % | 88 | % | 100 | % | 12 | % | 88 | % | 100 | % | ||||||||||||||||||||||||
| Research & Insights | $ | 16 | $ | 868 | $ | 884 | $ | 17 | $ | 795 | $ | 812 | |||||||||||||||||||||||
| 2 | % | 98 | % | 100 | % | 2 | % | 98 | % | 100 | % | ||||||||||||||||||||||||
| Data & Information | $ | 3 | $ | 786 | $ | 789 | $ | — | $ | 712 | $ | 712 | |||||||||||||||||||||||
| — | % | 100 | % | 100 | % | — | % | 100 | % | 100 | % | ||||||||||||||||||||||||
| Total MA | $ | 188 | $ | 2,868 | $ | 3,056 | $ | 170 | $ | 2,599 | $ | 2,769 | |||||||||||||||||||||||
| 6 | % | 94 | % | 100 | % | 6 | % | 94 | % | 100 | % | ||||||||||||||||||||||||
| Corporate Finance | $ | 887 | $ | 517 | $ | 1,404 | $ | 772 | $ | 497 | $ | 1,269 | |||||||||||||||||||||||
| 63 | % | 37 | % | 100 | % | 61 | % | 39 | % | 100 | % | ||||||||||||||||||||||||
| Structured Finance | $ | 190 | $ | 215 | $ | 405 | $ | 262 | $ | 200 | $ | 462 | |||||||||||||||||||||||
| 47 | % | 53 | % | 100 | % | 57 | % | 43 | % | 100 | % | ||||||||||||||||||||||||
| Financial Institutions | $ | 254 | $ | 291 | $ | 545 | $ | 211 | $ | 280 | $ | 491 | |||||||||||||||||||||||
| 47 | % | 53 | % | 100 | % | 43 | % | 57 | % | 100 | % | ||||||||||||||||||||||||
| Public, Project and Infrastructure Finance | $ | 301 | $ | 175 | $ | 476 | $ | 263 | $ | 168 | $ | 431 | |||||||||||||||||||||||
| 63 | % | 37 | % | 100 | % | 61 | % | 39 | % | 100 | % | ||||||||||||||||||||||||
| MIS Other | $ | 6 | $ | 24 | $ | 30 | $ | 4 | $ | 42 | $ | 46 | |||||||||||||||||||||||
| 20 | % | 80 | % | 100 | % | 9 | % | 91 | % | 100 | % | ||||||||||||||||||||||||
| Total MIS | $ | 1,638 | $ | 1,222 | $ | 2,860 | $ | 1,512 | $ | 1,187 | $ | 2,699 | |||||||||||||||||||||||
| 57 | % | 43 | % | 100 | % | 56 | % | 44 | % | 100 | % | ||||||||||||||||||||||||
| Total Moody's Corporation | $ | 1,826 | $ | 4,090 | $ | 5,916 | $ | 1,682 | $ | 3,786 | $ | 5,468 | |||||||||||||||||||||||
| 31 | % | 69 | % | 100 | % | 31 | % | 69 | % | 100 | % | ||||||||||||||||||||||||
Three Months Ended December 31, |
Year Ended December 31, | ||||||||||||||||||||||
| Amounts in millions | 2023 | 2022 | 2023 | 2022 | |||||||||||||||||||
| Operating income | $ | 498 | $ | 306 | $ | 2,137 | $ | 1,883 | |||||||||||||||
| Depreciation and amortization | 97 | 89 | 373 | 331 | |||||||||||||||||||
| Restructuring | 36 | 82 | 87 | 114 | |||||||||||||||||||
| Adjusted Operating Income | $ | 631 | $ | 477 | $ | 2,597 | $ | 2,328 | |||||||||||||||
| Operating margin | 33.6 | % | 23.7 | % | 36.1 | % | 34.4 | % | |||||||||||||||
| Adjusted Operating Margin | 42.6 | % | 37.0 | % | 43.9 | % | 42.6 | % | |||||||||||||||
| Year Ended December 31, | |||||||||||
| Amounts in millions | 2023 | 2022 | |||||||||
| Net cash provided by operating activities | $ | 2,151 | $ | 1,474 | |||||||
| Capital additions | (271) | (283) | |||||||||
| Free Cash Flow | $ | 1,880 | $ | 1,191 | |||||||
| Net cash used in investing activities | $ | (247) | $ | (262) | |||||||
| Net cash used in financing activities | $ | (1,584) | $ | (1,208) | |||||||
Three Months Ended December 31, |
||||||||||||||||||||||||||
| Amounts in millions | 2023 | 2022 | Change | Growth | ||||||||||||||||||||||
| MCO revenue | $ | 1,480 | $ | 1,290 | $ | 190 | 15% | |||||||||||||||||||
| FX impact | (21) | — | (21) | |||||||||||||||||||||||
Constant currency MCO revenue |
$ | 1,459 | $ | 1,290 | $ | 169 | 13% | |||||||||||||||||||
| MA revenue | $ | 796 | $ | 714 | $ | 82 | 11% | |||||||||||||||||||
| FX impact | (12) | — | (12) | |||||||||||||||||||||||
Constant currency MA revenue |
$ | 784 | $ | 714 | $ | 70 | 10% | |||||||||||||||||||
| Decision Solutions revenue | $ | 361 | $ | 329 | $ | 32 | 10% | |||||||||||||||||||
| FX impact | (5) | — | (5) | |||||||||||||||||||||||
Constant currency Decision Solutions revenue |
$ | 356 | $ | 329 | $ | 27 | 8% | |||||||||||||||||||
| Research and Insights revenue | $ | 230 | $ | 205 | $ | 25 | 12% | |||||||||||||||||||
| FX impact | (2) | — | (2) | |||||||||||||||||||||||
Constant currency Research and Insights revenue |
$ | 228 | $ | 205 | $ | 23 | 11% | |||||||||||||||||||
| Data and Information revenue | $ | 205 | $ | 180 | $ | 25 | 14% | |||||||||||||||||||
| FX impact | (5) | — | (5) | |||||||||||||||||||||||
Constant currency Data and Information revenue |
$ | 200 | $ | 180 | $ | 20 | 11% | |||||||||||||||||||
| MIS revenue | $ | 684 | $ | 576 | $ | 108 | 19% | |||||||||||||||||||
| FX impact | (9) | — | (9) | |||||||||||||||||||||||
Constant currency MIS revenue |
$ | 675 | $ | 576 | $ | 99 | 17% | |||||||||||||||||||
| Amounts in millions | December 31, 2023 | December 31, 2022 | Change | Growth | |||||||||||||||||||
| MA ARR | |||||||||||||||||||||||
| Decision Solutions | |||||||||||||||||||||||
| Banking | $ | 418 | $ | 385 | $ | 33 | 9% | ||||||||||||||||
| Insurance | 533 | 482 | 51 | 11% | |||||||||||||||||||
| KYC | 326 | 279 | 47 | 17% | |||||||||||||||||||
Total Decision Solutions |
$ | 1,277 | $ | 1,146 | $ | 131 | 11% | ||||||||||||||||
| Research and Insights | 879 | 819 | 60 | 7% | |||||||||||||||||||
| Data and Information | 806 | 733 | 73 | 10% | |||||||||||||||||||
| Total MA ARR | $ | 2,962 | $ | 2,698 | $ | 264 | 10% | ||||||||||||||||
Three Months Ended December 31, |
Year Ended December 31, | ||||||||||||||||||||||||||||||||||
| Amounts in millions | 2023 | 2022 | 2023 | 2022 | |||||||||||||||||||||||||||||||
| Net income attributable to Moody's common shareholders | $ | 340 | $ | 246 | $ | 1,607 | $ | 1,374 | |||||||||||||||||||||||||||
| Pre-tax Acquisition-Related Intangible Amortization Expenses | $ | 48 | $ | 50 | $ | 198 | $ | 200 | |||||||||||||||||||||||||||
| Tax on Acquisition-Related Intangible Amortization Expenses | (12) | (12) | (48) | (47) | |||||||||||||||||||||||||||||||
| Net Acquisition-Related Intangible Amortization Expenses | 36 | 38 | 150 | 153 | |||||||||||||||||||||||||||||||
| Pre-tax restructuring | $ | 36 | $ | 82 | $ | 87 | $ | 114 | |||||||||||||||||||||||||||
| Tax on restructuring | (10) | (18) | (22) | (26) | |||||||||||||||||||||||||||||||
| Net restructuring | 26 | 64 | 65 | 88 | |||||||||||||||||||||||||||||||
| Pre-tax gain on extinguishment of debt | $ | — | $ | (70) | $ | — | $ | (70) | |||||||||||||||||||||||||||
| Tax on gain on extinguishment of debt | — | 17 | — | 17 | |||||||||||||||||||||||||||||||
| Net gain on extinguishment of debt | — | (53) | — | (53) | |||||||||||||||||||||||||||||||
FX losses resulting from the Company no longer conducting commercial operations in Russia |
— | — | — | 20 | |||||||||||||||||||||||||||||||
| Adjusted Net Income | $ | 402 | $ | 295 | $ | 1,822 | $ | 1,582 | |||||||||||||||||||||||||||
Three Months Ended December 31, |
Year Ended December 31, | ||||||||||||||||||||||||||||||||||
| Amounts in millions | 2023 | 2022 | 2023 | 2022 | |||||||||||||||||||||||||||||||
| Diluted earnings per share attributable to Moody's common shareholders | $ | 1.85 | $ | 1.34 | $ | 8.73 | $ | 7.44 | |||||||||||||||||||||||||||
| Pre-tax Acquisition-Related Intangible Amortization Expenses | $ | 0.26 | $ | 0.27 | $ | 1.08 | $ | 1.08 | |||||||||||||||||||||||||||
| Tax on Acquisition-Related Intangible Amortization Expenses | (0.06) | (0.07) | (0.26) | (0.25) | |||||||||||||||||||||||||||||||
| Net Acquisition-Related Intangible Amortization Expenses | 0.20 | 0.20 | 0.82 | 0.83 | |||||||||||||||||||||||||||||||
| Pre-tax restructuring | $ | 0.20 | $ | 0.45 | $ | 0.47 | $ | 0.62 | |||||||||||||||||||||||||||
| Tax on restructuring | (0.06) | (0.10) | (0.12) | (0.14) | |||||||||||||||||||||||||||||||
| Net restructuring | 0.14 | 0.35 | 0.35 | 0.48 | |||||||||||||||||||||||||||||||
Pre-tax gain on extinguishment of debt |
$ | — | $ | (0.38) | $ | — | $ | (0.38) | |||||||||||||||||||||||||||
| Tax on gain on extinguishment of debt | — | 0.09 | — | 0.09 | |||||||||||||||||||||||||||||||
| Net gain on extinguishment of debt | — | (0.29) | — | (0.29) | |||||||||||||||||||||||||||||||
FX losses resulting from the Company no longer conducting commercial operations in Russia |
— | — | — | 0.11 | |||||||||||||||||||||||||||||||
| Adjusted Diluted EPS | $ | 2.19 | $ | 1.60 | $ | 9.90 | $ | 8.57 | |||||||||||||||||||||||||||
| Note: The tax impacts in the tables above were calculated using tax rates in effect in the jurisdiction for which the item relates. | ||
Full Year 2024 Moody's Corporation Guidance as of February 13, 2024 | |||||
| MOODY'S CORPORATION | Current guidance | ||||
| Revenue | Increase in the high-single-digit to low-double-digit percent range |
||||
Operating Expenses |
Increase in the mid-to-high-single-digit percent range |
||||
Operating Margin |
37% to 39% |
||||
Adjusted Operating Margin (1) |
44% to 46% |
||||
Interest Expense, Net |
$240 - $260 million |
||||
Effective Tax Rate |
22% to 24% |
||||
| Diluted EPS | $9.45 to $10.20 |
||||
Adjusted Diluted EPS (1) |
$10.25 to $11.00 |
||||
Operating Cash Flow |
$2.3 to $2.5 billion |
||||
Free Cash Flow (1) |
$1.9 to $2.1 billion |
||||
Share Repurchases |
Approximately $1.0 billion
(subject to available cash, market conditions, M&A opportunities, and other ongoing capital allocation decisions)
|
||||
| Moody's Analytics (MA) | Current guidance | ||||
MA Revenue |
Increase of approximately 10% | ||||
ARR (2) |
Increase in the low-double-digit percent range | ||||
| MA Adjusted Operating Margin | 30% to 31% | ||||
| Moody's Investors Service (MIS) | Current guidance | ||||
MIS Revenue |
Increase in the high-single-digit to low-double-digit percent range |
||||
| MIS Adjusted Operating Margin | 55.5% to 57.5% |
||||
|
(1) These metrics are adjusted measures. See below for reconciliation of these measures to their comparable U.S. GAAP measure.
(2) Refer to Table 10 within this earnings release for the definition of and further information on the ARR metric.
| |||||
|
Projected for the Year Ended
December 31, 2024
|
|||||
| Operating margin guidance | 37% to 39% |
||||
| Depreciation and amortization | Approximately 7% |
||||
| Adjusted Operating Margin guidance | 44% to 46% |
||||
| Projected for the Year Ended December 31, 2024 |
|||||
| Operating cash flow guidance | $2.3 to $2.5 billion |
||||
| Less: Capital expenditures | Approximately $0.4 billion |
||||
| Free Cash Flow guidance | $1.9 to $2.1 billion |
||||
| Projected for the Year Ended December 31, 2024 |
|||||
| Diluted EPS guidance | $9.45 to $10.20 |
||||
| Acquisition-Related Intangible Amortization | Approximately $0.80 |
||||
| Adjusted Diluted EPS guidance | $10.25 to $11.00 |
||||
