| Delaware | 1-14037 | 13-3998945 | ||||||
| (State or Other Jurisdiction of Incorporation) | (Commission File Number) | (IRS Employer Identification No.) | ||||||
| ☐ | Written communications pursuant to Rule 425 under the Securities Act (17 CFR 230.425) | |||||||
| ☐ | Soliciting material pursuant to Rule 14a-12 under the Exchange Act (17 CFR 240.14a-12) |
|||||||
| ☐ | Pre-commencement communications pursuant to Rule 14d-2(b) under the Exchange Act (17 CFR 240.14d-2(b)) |
|||||||
| ☐ | Pre-commencement communications pursuant to Rule 13e-4(c) under the Exchange Act (17 CFR 240.13e-4(c)) | |||||||
| Title of each class | Trading Symbol(s) | Name of each exchange on which registered | ||||||||||||
| Common Stock, par value $0.01 per share | MCO | New York Stock Exchange | ||||||||||||
| 1.75% Senior Notes Due 2027 | MCO 27 | New York Stock Exchange | ||||||||||||
| 0.950% Senior Notes Due 2030 | MCO 30 | New York Stock Exchange | ||||||||||||
| Emerging growth company | ☐ | ||||
If an emerging growth company, indicate by check mark if the registrant has elected not to use the extended transition period for complying with any new or revised financial accounting standards provided pursuant to Section 13(a) of the Exchange Act. |
☐ | ||||
ITEM 2.02 |
RESULTS OF OPERATIONS AND FINANCIAL CONDITION |
3 | ||||||
| ITEM 7.01 | REGULATION FD DISCLOSURE | 3 | ||||||
| ITEM 9.01 | FINANCIAL STATEMENTS AND EXHIBITS | 3 | ||||||
| SIGNATURES | 4 | |||||||
| EXHIBIT 99.1 | ||||||||
| 104 | The cover page from this Current Report on Form 8-K, formatted in Inline XBRL. | ||||
| MOODY'S CORPORATION | |||||
| By: | /s/ Elizabeth M. McCarroll | ||||
| Elizabeth M. McCarroll | |||||
| Corporate Secretary and Associate General Counsel | |||||

SECOND QUARTER SUMMARY FINANCIALS | ||||||||||||||
| Moody’s Corporation (MCO) Revenue |
Moody’s Analytics (MA) Revenue |
Moody’s Investors Service (MIS) Revenue |
||||||||||||
2Q 2023 |
2Q 2023 |
2Q 2023 |
||||||||||||
$1.5 billion ⇑ 8% |
$747 million ⇑ 11% |
$747 million ⇑ 6% |
||||||||||||
| YTD 2023 | YTD 2023 | YTD 2023 | ||||||||||||
$3.0 billion ⇑ 2% |
$1.5 billion ⇑ 8% |
$1.5 billion ⇓ 3% |
||||||||||||
| MCO Diluted EPS | MCO Adjusted Diluted EPS1 |
MCO FY 2023 Projected | ||||||||||||
2Q 2023 |
2Q 2023 |
Diluted EPS |
||||||||||||
$2.05 ⇑ 16% |
$2.30 ⇑ 4% |
$8.70 to $9.20 |
||||||||||||
| YTD 2023 | YTD 2023 | Adjusted Diluted EPS1 |
||||||||||||
$4.77 ⇑ 7% |
$5.29 ⇑ 4% |
$9.75 to $10.25 |
||||||||||||
“Moody’s is poised to capitalize on the momentous opportunity of generative AI to activate the power of our unique and verified data sets. Drawing on our team of over 14,000 innovators, we are accelerating our customers’ decision-making processes with enhanced analytics and insights that address the evolving world of exponential risk.” | |||||
|
Rob Fauber
President and Chief Executive Officer
| |||||
1 Refer to the tables at the end of this press release for reconciliations of adjusted measures to U.S. GAAP. | |||||
| REVENUE | ||
| Moody’s Corporation (MCO) | ||

Second Quarter 2023 |
Year-to-Date 2023 | |||||||
|
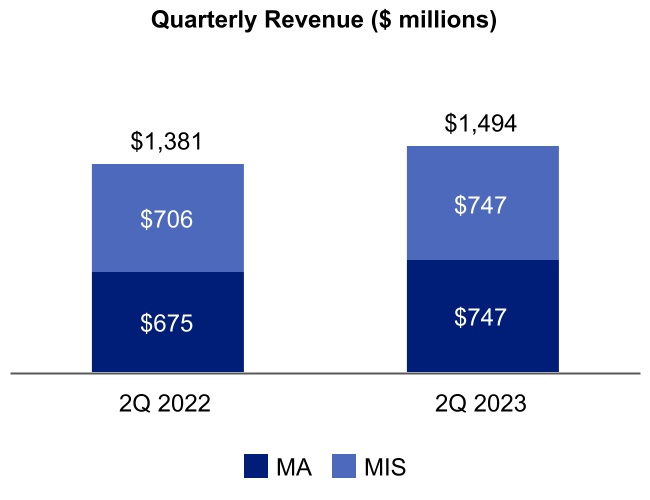
•Revenue increased 8% from the prior-year period. Foreign currency translation had an immaterial impact on MCO’s revenue.
•MA reported its 62nd consecutive quarter of growth, up 11% from the prior-year period, on continued strong demand for mission-critical data, analytics and software solutions.
•Increased investor demand for high-quality credits, combined with issuers seeking to refinance in advance of the U.S. debt ceiling deadline, led to higher-than-expected investment grade activity in the quarter.
|
•Revenue increased 2% from the prior-year period. Foreign currency translation unfavorably impacted MCO’s revenue by 1%.
•MA grew 8% from the prior-year period and represented just over 50% of MCO’s total revenue, up from 47% in the first half of 2022.
•MIS’s revenue declined 3% on a strong prior-year first quarter comparable.
|
|||||||
| Moody’s Analytics (MA) | ||


Second Quarter 2023 |
Year-to-Date 2023 | |||||||
|
•Reported revenue grew 11%, led by Decision Solutions growth of 14%. Foreign currency translation favorably impacted MA’s revenue by 1%.
•Within Decision Solutions: Banking, Insurance and Know Your Customer (KYC) revenue grew 12%, 12%, and 20%, respectively, from the prior-year period.
•Banking growth was driven by ongoing demand for SaaS-based customer solutions serving lending, risk management and finance workflows.
•Insurance growth was primarily due to continued demand for actuarial modelling and IFRS-17 solutions, as well as increased adoption of capabilities on RMS Intelligent Risk Platform™.
•KYC delivered strong growth across a diverse range of customer segments as our best-in-class solutions fulfill several onboarding, screening and monitoring use cases.
|
•Reported revenue grew 8% versus the prior-year period and included a 1% unfavorable impact from foreign currency translation.
•Customer retention at 93% reflects the mission-critical nature of MA’s innovative data, analytics and workflow solutions in the era of exponential risk.
•Expanded disclosure on Decision Solutions2 offers greater visibility into our SaaS businesses serving key customer workflows: Banking, Insurance and KYC.
•ARR increased 10% from the prior-year period to $2.8 billion, as strong customer demand and cross-selling execution continue to deliver double-digit growth.
|
|||||||
2 Moody’s reclassified certain immaterial revenue relating to structured finance solutions from the Decision Solutions LOB to the Research & Insights LOB. | |||||
| Moody’s Investors Service (MIS) | ||


Second Quarter 2023 |
Year-to-Date 2023 | |||||||
|
•Revenue increased 6% against the prior-year period. Foreign currency translation had an immaterial impact on MIS’s revenue.
•Similar to the first quarter, activity was skewed toward higher-rated, investment grade corporate and infrastructure finance issuers who took advantage of constructive market conditions.
•Within leveraged finance, the second quarter saw a significant increase in high yield bond issuance, which experienced the strongest quarter since the beginning of 2022, driven mainly by refinancing. Conversely, leveraged loan issuance declined due to subdued M&A activity.
•Structured Finance was negatively impacted by a combination of a strong prior-year comparable and a decline in loan supply for CMBS, RMBS and structured credit transactions.
|
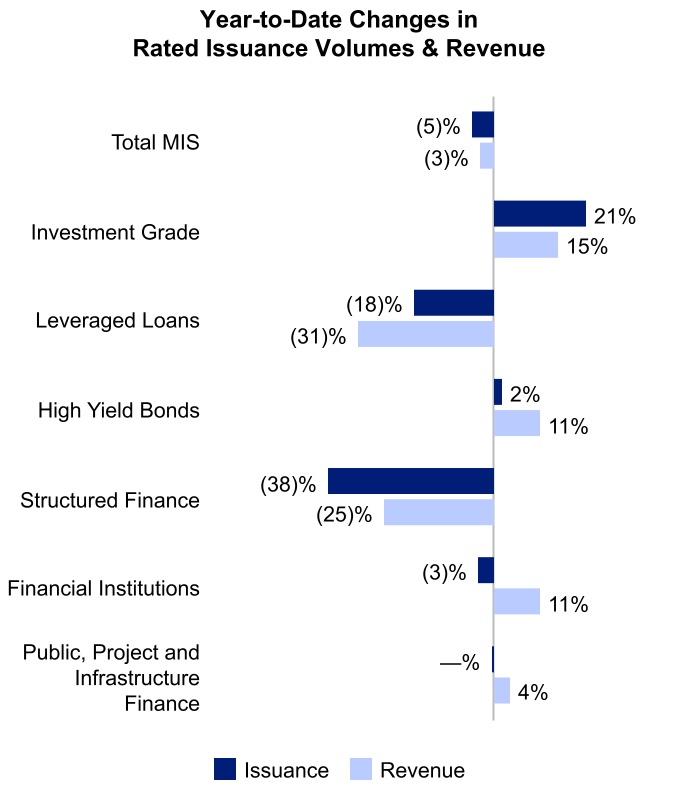
•Revenue declined 3% against the prior-year period. Foreign currency translation had an immaterial impact on MIS’s revenue.
•Market conditions were increasingly constructive during the first half of 2023, though ongoing uncertainty around inflation, interest rates and recessionary concerns continued to weigh on credit activity.
•Improved investment grade issuance, as well as a favorable mix from infrequent bank and insurance issuers positively impacted revenue growth; however, this was offset by lower leveraged loan and Structured Finance volumes.
|
|||||||
| OPERATING EXPENSES AND MARGIN | ||
| Operating Expenses | ||

Second Quarter 2023 |
Year-to-Date 2023 | |||||||
|
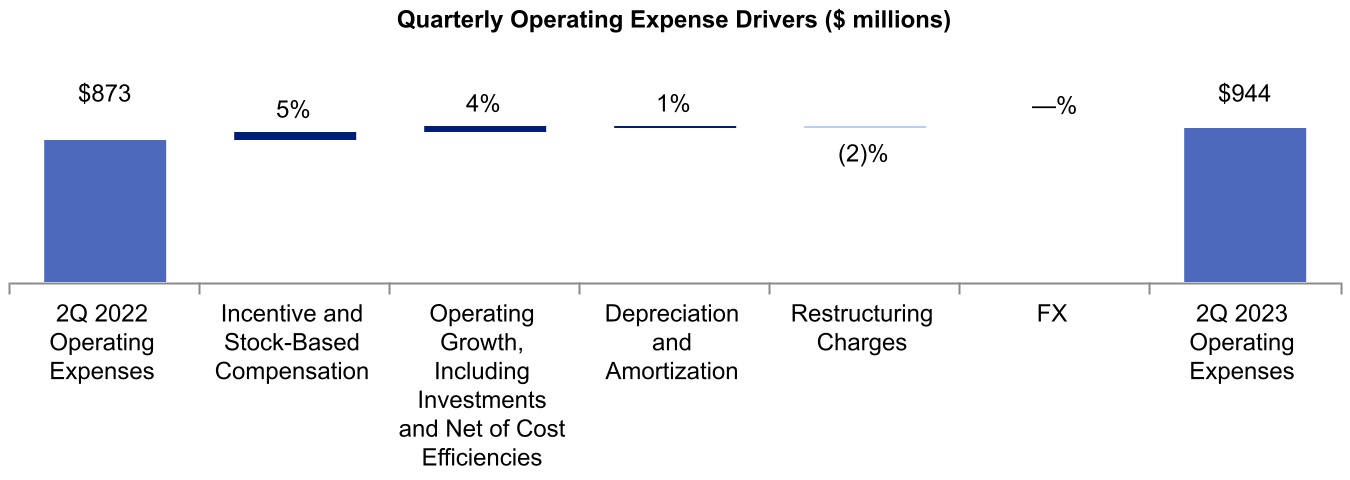
•Operating expenses grew 8% versus the prior-year period, including 5% from higher incentive compensation accruals and stock-based compensation. Foreign currency translation had an immaterial impact on operating expenses.
•Continued investment in innovation and product development to ensure Moody’s is well-positioned to capture demand from high-growth markets, offsetting expense growth with proactive cost management initiatives.
|
•Operating expenses grew 7% versus the prior-year period, including 3% from higher incentive compensation accruals and stock-based compensation. Foreign currency translation favorably impacted operating expenses by 1%.
•During the first half of 2023, we accelerated spending on product innovation and employee development related to AI technologies.
|
|||||||
Operating Margin and Adjusted Operating Margin1 | ||


Second Quarter 2023 |
Year-to-Date 2023 | |||||||
|
•MCO’s operating margin was 36.8% and adjusted operating margin1 was 43.7%. Foreign currency translation had an immaterial impact on both operating and adjusted operating margins1.
•MA’s adjusted operating margin reflected an increase in strategic sales deployment and product development investments.
•MIS’s adjusted operating margin captured operational leverage from both heightened issuance and disciplined expense management.
|
•MCO’s operating margin was 37.2% and adjusted operating margin1 was 44.2%. Foreign currency translation had an immaterial impact on both operating and adjusted operating margins1.
•The decisive expense management decisions taken as part of the 2022 – 2023 Geolocation Restructuring Program continue to positively impact both MA and MIS’s margins.
|
|||||||
| EARNINGS PER SHARE (EPS) | ||
Diluted EPS and Adjusted Diluted EPS1 | ||


Second Quarter 2023 |
Year-to-Date 2023 | |||||||
|
•Diluted and adjusted diluted EPS1 increased from the prior-year period on higher operating income, primarily reflecting MIS’s revenue growth.
•The Effective Tax Rate (ETR) was 23.4%, down from 26.2% reported in the prior-year period. The decrease was principally due to excess tax benefits realized from stock-based compensation, along with a non-deductible loss in 2022 associated with the Company no longer conducting commercial operations in Russia.
|
•The ETR was 12.0%, significantly lower than the 21.6% reported in the prior-year period, primarily due to the favorable resolutions of uncertain tax positions within U.S. domestic and foreign tax jurisdictions that are not expected to occur to a similar magnitude in future quarters.
|
|||||||
| CAPITAL ALLOCATION AND LIQUIDITY | ||
Capital Returned to Shareholders & Free Cash Flow1 | ||


|
•Cash flow from operations for the first half of 2023 was $1,212 million and free cash flow1 was $1,085 million.
•The increase in free cash flow1 year-to-date was due to an improvement in working capital.
•On July 24, 2023, the Board of Directors declared a regular quarterly dividend of $0.77 per share of MCO Common Stock. The dividend will be payable on September 8, 2023, to stockholders of record at the close of business on August 18, 2023.
•During the second quarter of 2023, Moody’s repurchased 0.2 million shares at an average cost of $314.25 per share and issued net 0.2 million shares as part of its employee stock-based compensation programs. The net amount included shares withheld for employee payroll taxes.
•As of June 30, 2023, Moody’s had 183.5 million shares outstanding, flat to June 30, 2022, with approximately $740 million of share repurchase authority remaining.
•As of June 30, 2023, Moody's had $7.2 billion of outstanding debt and an undrawn $1.25 billion revolving credit facility.
| ||
| ASSUMPTIONS AND OUTLOOK | ||
| Forecasted Item | Current assumption | Last publicly disclosed assumption | ||||||
U.S. GDP(1) growth |
0.5% - 1.5% | NC | ||||||
Euro area GDP(1) growth |
0.0% - 1.0% | NC | ||||||
| Global benchmark rates | Remain elevated, with U.S. Fed funds rate above 5%, followed by the potential for rate reductions in early 2024 | NC | ||||||
| U.S. high yield spreads | Average approximately 500 bps, with periodic volatility | NC | ||||||
| U.S. inflation rate | To decline below 3% by year-end | Averages approximately 5% | ||||||
| Euro area inflation rate | Large economies decline to between 3% and 5% by year-end, with considerable variation among countries | Large economies average approximately 6%, with considerable variation among countries |
||||||
| U.S. unemployment rate | Rise toward 4% by year-end | Rise toward 5% by year-end | ||||||
| Global high yield default rate | Rise to 4.5% - 5.0% by year-end | Rise to approximately 5% by year-end | ||||||
| Global MIS rated issuance | Increase in the mid-single-digit percent range | Increase in the low-single-digit percent range | ||||||
| GBP/USD exchange rate | $1.27 for the remainder of the year | $1.24 for the remainder of the year | ||||||
| EUR/USD exchange rate | $1.09 for the remainder of the year | NC | ||||||
|
NC - There is no difference between the Company’s current assumption and the last publicly disclosed assumption for this item.
Note: All current assumptions are as of July 25, 2023. All last publicly disclosed assumptions are as of April 25, 2023.
(1) GDP growth represents real GDP.
| ||||||||
| TELECONFERENCE DETAILS | ||
| Date and Time | July 25, 2023, at 12:30 p.m. Eastern Time (ET). |
|||||||
| Webcast | The webcast and its replay can be accessed through Moody’s Investor Relations website, ir.moodys.com, within “Events & Presentations.” |
|||||||
| Dial In | U.S. and Canada |
‘+1-888-330-2508 |
||||||
Other callers |
‘+1-240-789-2735 |
|||||||
| Passcode | 9302427 | |||||||
| Dial In Replay | A replay will be available immediately after the call on July 25, 2023, and until August 25, 2023. |
|||||||
U.S. and Canada |
‘+1-800-770-2030 |
|||||||
Other callers |
‘+1-647-362-9199 |
|||||||
| Passcode | 9302427 | |||||||
| ABOUT MOODY’S CORPORATION | ||
| “SAFE HARBOR” STATEMENT UNDER THE PRIVATE SECURITIES LITIGATION REFORM ACT OF 1995 | ||
|
Three Months Ended
June 30,
|
Six Months Ended June 30, |
||||||||||||||||||||||
| Amounts in millions, except per share amounts | 2023 | 2022 | 2023 | 2022 | |||||||||||||||||||
| Revenue | $ | 1,494 | $ | 1,381 | $ | 2,964 | $ | 2,903 | |||||||||||||||
| Expenses: | |||||||||||||||||||||||
| Operating | 426 | 393 | 854 | 810 | |||||||||||||||||||
| Selling, general, and administrative | 415 | 368 | 801 | 739 | |||||||||||||||||||
| Depreciation and amortization | 93 | 81 | 181 | 159 | |||||||||||||||||||
| Restructuring | 10 | 31 | 24 | 31 | |||||||||||||||||||
| Total expenses | 944 | 873 | 1,860 | 1,739 | |||||||||||||||||||
| Operating income | 550 | 508 | 1,104 | 1,164 | |||||||||||||||||||
| Non-operating (expense) income, net | |||||||||||||||||||||||
| Interest expense, net | (71) | (55) | (119) | (108) | |||||||||||||||||||
| Other non-operating income (expense), net | 13 | (10) | 13 | (4) | |||||||||||||||||||
| Total non-operating (expense) income, net | (58) | (65) | (106) | (112) | |||||||||||||||||||
| Income before provision for income taxes | 492 | 443 | 998 | 1,052 | |||||||||||||||||||
| Provision for income taxes | 115 | 116 | 120 | 227 | |||||||||||||||||||
| Net income attributable to Moody's Corporation | $ | 377 | $ | 327 | $ | 878 | $ | 825 | |||||||||||||||
| Earnings per share attributable to Moody's common shareholders | |||||||||||||||||||||||
| Basic | $ | 2.05 | $ | 1.78 | $ | 4.79 | $ | 4.47 | |||||||||||||||
| Diluted | $ | 2.05 | $ | 1.77 | $ | 4.77 | $ | 4.45 | |||||||||||||||
| Weighted average number of shares outstanding | |||||||||||||||||||||||
| Basic | 183.5 | 184.1 | 183.4 | 184.6 | |||||||||||||||||||
| Diluted | 184.1 | 184.9 | 184.1 | 185.4 | |||||||||||||||||||
| Amounts in millions | June 30, 2023 | December 31, 2022 | |||||||||
| ASSETS | |||||||||||
| Current assets: | |||||||||||
| Cash and cash equivalents | $ | 2,278 | $ | 1,769 | |||||||
| Short-term investments | 57 | 90 | |||||||||
Accounts receivable, net of allowance for credit losses of $33 in 2023 and $40 in 2022 |
1,542 | 1,652 | |||||||||
| Other current assets | 513 | 583 | |||||||||
| Total current assets | 4,390 | 4,094 | |||||||||
Property and equipment, net of accumulated depreciation of $1,195 in 2023 and $1,123 in 2022 |
541 | 502 | |||||||||
| Operating lease right-of-use assets | 330 | 346 | |||||||||
| Goodwill | 5,926 | 5,839 | |||||||||
| Intangible assets, net | 2,138 | 2,210 | |||||||||
| Deferred tax assets, net | 265 | 266 | |||||||||
| Other assets | 1,101 | 1,092 | |||||||||
| Total assets | $ | 14,691 | $ | 14,349 | |||||||
| LIABILITIES AND SHAREHOLDERS' EQUITY | |||||||||||
| Current liabilities: | |||||||||||
| Accounts payable and accrued liabilities | $ | 877 | $ | 1,011 | |||||||
| Current portion of operating lease liabilities | 105 | 106 | |||||||||
| Current portion of long-term debt | 300 | — | |||||||||
| Deferred revenue | 1,385 | 1,258 | |||||||||
| Total current liabilities | 2,667 | 2,375 | |||||||||
| Non-current portion of deferred revenue | 67 | 75 | |||||||||
| Long-term debt | 6,923 | 7,389 | |||||||||
| Deferred tax liabilities, net | 485 | 457 | |||||||||
| Uncertain tax positions | 204 | 322 | |||||||||
| Operating lease liabilities | 344 | 368 | |||||||||
| Other liabilities | 689 | 674 | |||||||||
| Total liabilities | 11,379 | 11,660 | |||||||||
| Total Moody's shareholders' equity | 3,144 | 2,519 | |||||||||
| Noncontrolling interests | 168 | 170 | |||||||||
| Total shareholders' equity | 3,312 | 2,689 | |||||||||
| Total liabilities, noncontrolling interests, and shareholders' equity | $ | 14,691 | $ | 14,349 | |||||||
|
Three Months Ended
June 30,
|
Six Months Ended June 30, |
||||||||||||||||||||||
| Amounts in millions | 2023 | 2022 | 2023 | 2022 | |||||||||||||||||||
| Interest: | |||||||||||||||||||||||
| Expense on borrowings | $ | (75) | $ | (50) | $ | (145) | $ | (98) | |||||||||||||||
UTPs and other tax related liabilities(1) |
(4) | (3) | 14 | (6) | |||||||||||||||||||
| Net periodic pension costs - interest component | (7) | (4) | (13) | (8) | |||||||||||||||||||
| Income | 15 | 2 | 25 | 4 | |||||||||||||||||||
| Total interest expense, net | $ | (71) | $ | (55) | $ | (119) | $ | (108) | |||||||||||||||
| Other non-operating (expense) income, net: | |||||||||||||||||||||||
FX loss(2) |
$ | (5) | $ | (22) | $ | (31) | $ | (22) | |||||||||||||||
| Net periodic pension costs - other components | 9 | 6 | 18 | 12 | |||||||||||||||||||
| Income from investments in non-consolidated affiliates | 1 | 2 | 3 | 4 | |||||||||||||||||||
| Gains / losses on investments | 5 | (9) | 11 | (14) | |||||||||||||||||||
Other(3) |
3 | 13 | 12 | 16 | |||||||||||||||||||
| Other non-operating income (expense), net | $ | 13 | $ | (10) | $ | 13 | $ | (4) | |||||||||||||||
| Total non-operating (expense) income, net | $ | (58) | $ | (65) | $ | (106) | $ | (112) | |||||||||||||||
(1) The amount for the six months ended June 30, 2023 includes a $22 million reduction of tax-related interest expense primarily related to the resolutions of outstanding tax matters. | ||
(2) The amounts for the three and six months ended June 30, 2022 include FX translation losses of $20 million reclassified to earnings resulting from the Company no longer conducting commercial operations in Russia. | ||
(3) The amount for the six months ended June 30, 2023 reflects a benefit of $9 million related to the favorable resolutions of various tax matters. The amounts for the three and six months ended June 30, 2022 reflect an $11 million benefit from a statute of limitations lapse relating to reserves established pursuant to the divestiture of MAKS. | ||
Three Months Ended June 30, |
|||||||||||||||||||||||||||||||||||||||||||||||
| 2023 | 2022 | ||||||||||||||||||||||||||||||||||||||||||||||
| Amounts in millions | MA | MIS | Eliminations | Consolidated | MA | MIS | Eliminations | Consolidated | |||||||||||||||||||||||||||||||||||||||
| Total external revenue | $ | 747 | $ | 747 | $ | — | $ | 1,494 | $ | 675 | $ | 706 | $ | — | $ | 1,381 | |||||||||||||||||||||||||||||||
| Intersegment revenue | 4 | 46 | (50) | — | 1 | 43 | (44) | — | |||||||||||||||||||||||||||||||||||||||
| Total revenue | 751 | 793 | (50) | 1,494 | 676 | 749 | (44) | 1,381 | |||||||||||||||||||||||||||||||||||||||
| Operating, SG&A | 541 | 350 | (50) | 841 | 471 | 334 | (44) | 761 | |||||||||||||||||||||||||||||||||||||||
| Adjusted Operating Income | $ | 210 | $ | 443 | $ | — | $ | 653 | $ | 205 | $ | 415 | $ | — | $ | 620 | |||||||||||||||||||||||||||||||
| Adjusted Operating Margin | 28.0 | % | 55.9 | % | 43.7 | % | 30.3 | % | 55.4 | % | 44.9 | % | |||||||||||||||||||||||||||||||||||
| Depreciation and amortization | 74 | 19 | — | 93 | 60 | 21 | — | 81 | |||||||||||||||||||||||||||||||||||||||
| Restructuring | 8 | 2 | — | 10 | 16 | 15 | — | 31 | |||||||||||||||||||||||||||||||||||||||
| Operating income | $ | 550 | $ | 508 | |||||||||||||||||||||||||||||||||||||||||||
| Operating margin | 36.8 | % | 36.8 | % | |||||||||||||||||||||||||||||||||||||||||||
| Six Months Ended June 30, | |||||||||||||||||||||||||||||||||||||||||||||||
| 2023 | 2022 | ||||||||||||||||||||||||||||||||||||||||||||||
| Amounts in millions | MA | MIS | Eliminations | Consolidated | MA | MIS | Eliminations | Consolidated | |||||||||||||||||||||||||||||||||||||||
| Total external revenue | $ | 1,484 | $ | 1,480 | $ | — | $ | 2,964 | $ | 1,370 | $ | 1,533 | $ | — | $ | 2,903 | |||||||||||||||||||||||||||||||
| Intersegment revenue | 7 | 91 | (98) | — | 3 | 86 | (89) | — | |||||||||||||||||||||||||||||||||||||||
| Total revenue | 1,491 | 1,571 | (98) | 2,964 | 1,373 | 1,619 | (89) | 2,903 | |||||||||||||||||||||||||||||||||||||||
| Operating, SG&A | 1,067 | 686 | (98) | 1,655 | 944 | 694 | (89) | 1,549 | |||||||||||||||||||||||||||||||||||||||
| Adjusted Operating Income | $ | 424 | $ | 885 | $ | — | $ | 1,309 | $ | 429 | $ | 925 | $ | — | $ | 1,354 | |||||||||||||||||||||||||||||||
| Adjusted Operating Margin | 28.4 | % | 56.3 | % | 44.2 | % | 31.2 | % | 57.1 | % | 46.6 | % | |||||||||||||||||||||||||||||||||||
| Depreciation and amortization | 144 | 37 | — | 181 | 120 | 39 | — | 159 | |||||||||||||||||||||||||||||||||||||||
| Restructuring | 16 | 8 | — | 24 | 16 | 15 | — | 31 | |||||||||||||||||||||||||||||||||||||||
| Operating income | $ | 1,104 | $ | 1,164 | |||||||||||||||||||||||||||||||||||||||||||
| Operating margin | 37.2 | % | 40.1 | % | |||||||||||||||||||||||||||||||||||||||||||
Three Months Ended June 30, |
|||||||||||||||||||||||||||||||||||
| 2023 | 2022 | ||||||||||||||||||||||||||||||||||
| Amounts in millions | Transaction | Recurring | Total | Transaction | Recurring | Total | |||||||||||||||||||||||||||||
| Decision Solutions | $ | 43 | $ | 291 | $ | 334 | $ | 38 | $ | 256 | $ | 294 | |||||||||||||||||||||||
| 13 | % | 87 | % | 100 | % | 13 | % | 87 | % | 100 | % | ||||||||||||||||||||||||
| Research & Insights | $ | 3 | $ | 214 | $ | 217 | $ | 4 | $ | 199 | $ | 203 | |||||||||||||||||||||||
| 1 | % | 99 | % | 100 | % | 2 | % | 98 | % | 100 | % | ||||||||||||||||||||||||
| Data & Information | $ | 1 | $ | 195 | $ | 196 | $ | — | $ | 178 | $ | 178 | |||||||||||||||||||||||
| 1 | % | 99 | % | 100 | % | — | % | 100 | % | 100 | % | ||||||||||||||||||||||||
| Total MA | $ | 47 | $ | 700 | $ | 747 | $ | 42 | $ | 633 | $ | 675 | |||||||||||||||||||||||
| 6 | % | 94 | % | 100 | % | 6 | % | 94 | % | 100 | % | ||||||||||||||||||||||||
| Corporate Finance | $ | 236 | $ | 129 | $ | 365 | $ | 199 | $ | 123 | $ | 322 | |||||||||||||||||||||||
| 65 | % | 35 | % | 100 | % | 62 | % | 38 | % | 100 | % | ||||||||||||||||||||||||
| Structured Finance | $ | 48 | $ | 54 | $ | 102 | $ | 73 | $ | 50 | $ | 123 | |||||||||||||||||||||||
| 47 | % | 53 | % | 100 | % | 59 | % | 41 | % | 100 | % | ||||||||||||||||||||||||
| Financial Institutions | $ | 73 | $ | 72 | $ | 145 | $ | 57 | $ | 71 | $ | 128 | |||||||||||||||||||||||
| 50 | % | 50 | % | 100 | % | 45 | % | 55 | % | 100 | % | ||||||||||||||||||||||||
| Public, Project and Infrastructure Finance | $ | 84 | $ | 43 | $ | 127 | $ | 82 | $ | 40 | $ | 122 | |||||||||||||||||||||||
| 66 | % | 34 | % | 100 | % | 67 | % | 33 | % | 100 | % | ||||||||||||||||||||||||
| MIS Other | $ | 2 | $ | 6 | $ | 8 | $ | 1 | $ | 10 | $ | 11 | |||||||||||||||||||||||
| 25 | % | 75 | % | 100 | % | 9 | % | 91 | % | 100 | % | ||||||||||||||||||||||||
| Total MIS | $ | 443 | $ | 304 | $ | 747 | $ | 412 | $ | 294 | $ | 706 | |||||||||||||||||||||||
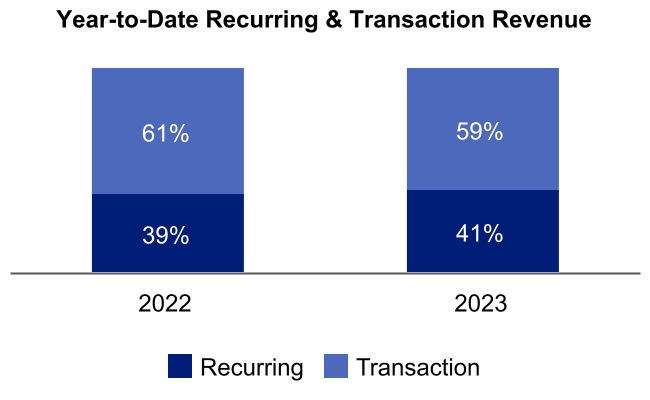
| 59 | % | 41 | % | 100 | % | 58 | % | 42 | % | 100 | % | ||||||||||||||||||||||||
| Total Moody's Corporation | $ | 490 | $ | 1,004 | $ | 1,494 | $ | 454 | $ | 927 | $ | 1,381 | |||||||||||||||||||||||
| 33 | % | 67 | % | 100 | % | 33 | % | 67 | % | 100 | % | ||||||||||||||||||||||||
| Six Months Ended June 30, | |||||||||||||||||||||||||||||||||||
| 2023 | 2022 | ||||||||||||||||||||||||||||||||||
| Amounts in millions | Transaction | Relationship | Total | Transaction | Relationship | Total | |||||||||||||||||||||||||||||
| Decision Solutions | $ | 83 | $ | 585 | $ | 668 | $ | 78 | $ | 530 | $ | 608 | |||||||||||||||||||||||
| 12 | % | 88 | % | 100 | % | 13 | % | 87 | % | 100 | % | ||||||||||||||||||||||||
| Research & Insights | $ | 8 | $ | 424 | $ | 432 | $ | 8 | $ | 398 | $ | 406 | |||||||||||||||||||||||
| 2 | % | 98 | % | 100 | % | 2 | % | 98 | % | 100 | % | ||||||||||||||||||||||||
| Data & Information | $ | 1 | $ | 383 | $ | 384 | $ | — | $ | 356 | $ | 356 | |||||||||||||||||||||||
| — | % | 100 | % | 100 | % | — | % | 100 | % | 100 | % | ||||||||||||||||||||||||
| Total MA | $ | 92 | $ | 1,392 | $ | 1,484 | $ | 86 | $ | 1,284 | $ | 1,370 | |||||||||||||||||||||||
| 6 | % | 94 | % | 100 | % | 6 | % | 94 | % | 100 | % | ||||||||||||||||||||||||
| Corporate Finance | $ | 466 | $ | 255 | $ | 721 | $ | 492 | $ | 247 | $ | 739 | |||||||||||||||||||||||
| 65 | % | 35 | % | 100 | % | 67 | % | 33 | % | 100 | % | ||||||||||||||||||||||||
| Structured Finance | $ | 94 | $ | 107 | $ | 201 | $ | 166 | $ | 101 | $ | 267 | |||||||||||||||||||||||
| 47 | % | 53 | % | 100 | % | 62 | % | 38 | % | 100 | % | ||||||||||||||||||||||||
| Financial Institutions | $ | 143 | $ | 144 | $ | 287 | $ | 118 | $ | 141 | $ | 259 | |||||||||||||||||||||||
| 50 | % | 50 | % | 100 | % | 46 | % | 54 | % | 100 | % | ||||||||||||||||||||||||
| Public, Project and Infrastructure Finance | $ | 169 | $ | 87 | $ | 256 | $ | 161 | $ | 84 | $ | 245 | |||||||||||||||||||||||
| 66 | % | 34 | % | 100 | % | 66 | % | 34 | % | 100 | % | ||||||||||||||||||||||||
| MIS Other | $ | 3 | $ | 12 | $ | 15 | $ | 2 | $ | 21 | $ | 23 | |||||||||||||||||||||||
| 20 | % | 80 | % | 100 | % | 9 | % | 91 | % | 100 | % | ||||||||||||||||||||||||
| Total MIS | $ | 875 | $ | 605 | $ | 1,480 | $ | 939 | $ | 594 | $ | 1,533 | |||||||||||||||||||||||
| 59 | % | 41 | % | 100 | % | 61 | % | 39 | % | 100 | % | ||||||||||||||||||||||||
| Total Moody's Corporation | $ | 967 | $ | 1,997 | $ | 2,964 | $ | 1,025 | $ | 1,878 | $ | 2,903 | |||||||||||||||||||||||
| 33 | % | 67 | % | 100 | % | 35 | % | 65 | % | 100 | % | ||||||||||||||||||||||||
Three Months Ended June 30, |
Six Months Ended June 30, | ||||||||||||||||||||||
| Amounts in millions | 2023 | 2022 | 2023 | 2022 | |||||||||||||||||||
| Operating income | $ | 550 | $ | 508 | $ | 1,104 | $ | 1,164 | |||||||||||||||
| Depreciation and amortization | 93 | 81 | 181 | 159 | |||||||||||||||||||
| Restructuring | 10 | 31 | 24 | 31 | |||||||||||||||||||
| Adjusted Operating Income | $ | 653 | $ | 620 | $ | 1,309 | $ | 1,354 | |||||||||||||||
| Operating margin | 36.8 | % | 36.8 | % | 37.2 | % | 40.1 | % | |||||||||||||||
| Adjusted Operating Margin | 43.7 | % | 44.9 | % | 44.2 | % | 46.6 | % | |||||||||||||||
| Six Months Ended June 30, | |||||||||||
| Amounts in millions | 2023 | 2022 | |||||||||
| Net cash provided by operating activities | $ | 1,212 | $ | 761 | |||||||
| Capital additions | (127) | (133) | |||||||||
| Free Cash Flow | $ | 1,085 | $ | 628 | |||||||
| Net cash used in investing activities | $ | (103) | $ | (172) | |||||||
| Net cash used in financing activities | $ | (624) | $ | (712) | |||||||
| Amounts in millions | June 30, 2023 | June 30, 2022 | Change | Growth | |||||||||||||||||||
| MA ARR | |||||||||||||||||||||||
| Decision Solutions | |||||||||||||||||||||||
| Banking | $ | 390 | $ | 355 | $ | 35 | 10% | ||||||||||||||||
| Insurance | 497 | 467 | 30 | 6% | |||||||||||||||||||
| KYC | 292 | 248 | 44 | 18% | |||||||||||||||||||
| Total DS | $ | 1,179 | $ | 1,070 | $ | 109 | 10% | ||||||||||||||||
| Research and Insights | 843 | 774 | 69 | 9% | |||||||||||||||||||
| Data and Information | 759 | 695 | 64 | 9% | |||||||||||||||||||
| Total MA ARR | $ | 2,781 | $ | 2,539 | $ | 242 | 10% | ||||||||||||||||
Three Months Ended June 30, |
Six Months Ended June 30, | ||||||||||||||||||||||||||||||||||
| Amounts in millions | 2023 | 2022 | 2023 | 2022 | |||||||||||||||||||||||||||||||
| Net income attributable to Moody's common shareholders | $ | 377 | $ | 327 | $ | 878 | $ | 825 | |||||||||||||||||||||||||||
| Pre-tax Acquisition-Related Intangible Amortization Expenses | $ | 50 | $ | 51 | $ | 101 | $ | 102 | |||||||||||||||||||||||||||
| Tax on Acquisition-Related Intangible Amortization Expenses | (12) | (12) | (24) | (24) | |||||||||||||||||||||||||||||||
| Net Acquisition-Related Intangible Amortization Expenses | 38 | 39 | 77 | 78 | |||||||||||||||||||||||||||||||
| Pre-tax restructuring | $ | 10 | $ | 31 | $ | 24 | $ | 31 | |||||||||||||||||||||||||||
| Tax on restructuring | (2) | (7) | (6) | (7) | |||||||||||||||||||||||||||||||
| Net restructuring | 8 | 24 | 18 | 24 | |||||||||||||||||||||||||||||||
FX losses resulting from the Company no longer conducting commercial operations in Russia |
— | 20 | — | 20 | |||||||||||||||||||||||||||||||
| Adjusted Net Income | $ | 423 | $ | 410 | $ | 973 | $ | 947 | |||||||||||||||||||||||||||
Three Months Ended June 30, |
Six Months Ended June 30, | ||||||||||||||||||||||||||||||||||
| Amounts in millions | 2023 | 2022 | 2023 | 2022 | |||||||||||||||||||||||||||||||
| Diluted earnings per share attributable to Moody's common shareholders | $ | 2.05 | $ | 1.77 | $ | 4.77 | $ | 4.45 | |||||||||||||||||||||||||||
| Pre-tax Acquisition-Related Intangible Amortization Expenses | $ | 0.27 | $ | 0.28 | $ | 0.55 | $ | 0.55 | |||||||||||||||||||||||||||
| Tax on Acquisition-Related Intangible Amortization Expenses | (0.06) | (0.07) | (0.13) | (0.13) | |||||||||||||||||||||||||||||||
| Net Acquisition-Related Intangible Amortization Expenses | 0.21 | 0.21 | 0.42 | 0.42 | |||||||||||||||||||||||||||||||
| Pre-tax restructuring | $ | 0.05 | $ | 0.17 | $ | 0.13 | $ | 0.17 | |||||||||||||||||||||||||||
| Tax on restructuring | (0.01) | (0.04) | (0.03) | (0.04) | |||||||||||||||||||||||||||||||
| Net restructuring | 0.04 | 0.13 | 0.10 | 0.13 | |||||||||||||||||||||||||||||||
FX losses resulting from the Company no longer conducting commercial operations in Russia |
— | 0.11 | — | 0.11 | |||||||||||||||||||||||||||||||
| Adjusted Diluted EPS | $ | 2.30 | $ | 2.22 | $ | 5.29 | $ | 5.11 | |||||||||||||||||||||||||||
| Note: The tax impacts in the tables above were calculated using tax rates in effect in the jurisdiction for which the item relates. | ||
Full Year 2023 Moody's Corporation Guidance as of July 25, 2023 | ||||||||
| MOODY'S CORPORATION | Current guidance | Last publicly disclosed guidance | ||||||
| Revenue | Increase in the high-single-digit percent range |
Increase in the mid-to-high-single-digit percent range |
||||||
| Operating expenses | Increase in the mid-single-digit percent range |
NC | ||||||
| Operating margin | Approximately 37% | NC | ||||||
Adjusted Operating Margin (1) |
44% to 45% | NC | ||||||
| Interest expense, net | $260 to $280 million | $275 to $295 million | ||||||
| Effective tax rate | 16% to 18% | 15% to 17% | ||||||
| Diluted EPS | $8.70 to $9.20 | $8.45 to $8.95 | ||||||
Adjusted Diluted EPS (1) |
$9.75 to $10.25 | $9.50 to $10.00 | ||||||
| Operating cash flow | $1.9 to $2.1 billion | $1.7 to $1.9 billion | ||||||
Free Cash Flow (1) |
$1.6 to $1.8 billion | $1.4 to $1.6 billion | ||||||
| Share repurchases | Approximately $500 million (subject to available cash, market conditions, M&A opportunities, and other ongoing capital allocation decisions) |
Approximately $250 million (subject to available cash, market conditions, M&A opportunities, and other ongoing capital allocation decisions) |
||||||
| Moody's Analytics (MA) | Current guidance | Last publicly disclosed guidance | ||||||
| MA global revenue | Increase of approximately 10% | NC | ||||||
ARR (2) |
Increase in the low-double-digit percent range | NC | ||||||
| MA Adjusted Operating Margin | 30% to 31% | Approximately 31% | ||||||
| Moody's Investors Service (MIS) | Current guidance | Last publicly disclosed guidance | ||||||
| MIS global revenue | Increase in the high-single-digit percent range | Increase in the low-to-mid-single-digit percent range | ||||||
| MIS Adjusted Operating Margin | 55% to 56% | Mid-50s percent range | ||||||
|
NC - There is no difference between the Company’s current guidance and the last publicly disclosed guidance for this item.
Note: All current guidance as of July 25, 2023. All last publicly disclosed guidance is as of April 25, 2023.
(1) These metrics are adjusted measures. See below for reconciliation of these measures to their comparable U.S. GAAP measure.
(2) Refer to Table 8 within this earnings release for the definition of and further information on the ARR metric.
| ||||||||
| Projected for the Year Ended December 31, 2023 |
|||||
| Operating margin guidance | Approximately 37% |
||||
| Depreciation and amortization | Approximately 6.5% | ||||
| Restructuring expense | Approximately 1.0% | ||||
| Adjusted Operating Margin guidance | 44% to 45% |
||||
| Projected for the Year Ended December 31, 2023 |
|||||
| Operating cash flow guidance | $1.9 to $2.1 billion |
||||
| Less: Capital expenditures | Approximately $0.3 billion | ||||
| Free Cash Flow guidance | $1.6 to $1.8 billion |
||||
| Projected for the Year Ended December 31, 2023 |
|||||
| Diluted EPS guidance | $8.70 to $9.20 |
||||
| Acquisition-Related Intangible Amortization | Approximately $0.85 | ||||
| Restructuring | Approximately $0.20 | ||||
| Adjusted Diluted EPS guidance | $9.75 to $10.25 |
||||