| Delaware | 1-14037 | 13-3998945 | ||||||
| (State or Other Jurisdiction of Incorporation) | (Commission File Number) | (IRS Employer Identification No.) | ||||||
| ☐ | Written communications pursuant to Rule 425 under the Securities Act (17 CFR 230.425) | |||||||
| ☐ | Soliciting material pursuant to Rule 14a-12 under the Exchange Act (17 CFR 240.14a-12) |
|||||||
| ☐ | Pre-commencement communications pursuant to Rule 14d-2(b) under the Exchange Act (17 CFR 240.14d-2(b)) |
|||||||
| ☐ | Pre-commencement communications pursuant to Rule 13e-4(c) under the Exchange Act (17 CFR 240.13e-4(c)) | |||||||
| Title of each class | Trading Symbol(s) | Name of each exchange on which registered | ||||||||||||
| Common Stock, par value $0.01 per share | MCO | New York Stock Exchange | ||||||||||||
| 1.75% Senior Notes Due 2027 | MCO 27 | New York Stock Exchange | ||||||||||||
| 0.950% Senior Notes Due 2030 | MCO 30 | New York Stock Exchange | ||||||||||||
| Emerging growth company | ☐ | ||||
If an emerging growth company, indicate by check mark if the registrant has elected not to use the extended transition period for complying with any new or revised financial accounting standards provided pursuant to Section 13(a) of the Exchange Act. |
☐ | ||||
ITEM 2.02 |
RESULTS OF OPERATIONS AND FINANCIAL CONDITION |
3 | ||||||
| ITEM 7.01 | REGULATION FD DISCLOSURE | 3 | ||||||
| ITEM 9.01 | FINANCIAL STATEMENTS AND EXHIBITS | 3 | ||||||
| SIGNATURES | 4 | |||||||
| EXHIBIT 99.1 | ||||||||
| 104 | The cover page from this Current Report on Form 8-K, formatted in Inline XBRL. | ||||
| MOODY'S CORPORATION | |||||
| By: | /s/ Elizabeth M. McCarroll | ||||
| Elizabeth M. McCarroll | |||||
| Corporate Secretary and Associate General Counsel | |||||

FIRST QUARTER SUMMARY FINANCIALS | ||||||||||||||
| Moody’s Corporation (MCO) Revenue |
Moody’s Analytics (MA) Revenue |
Moody’s Investors Service (MIS) Revenue |
||||||||||||
1Q 2023 |
1Q 2023 |
1Q 2023 |
||||||||||||
$1.5 billion ⇓ 3% |
$737 million ⇑ 6% |
$733 million ⇓ 11% |
||||||||||||
| MCO Diluted EPS | MCO Adjusted Diluted EPS1 |
MCO FY 2023 Projected | ||||||||||||
1Q 2023 |
1Q 2023 |
Diluted EPS |
||||||||||||
$2.72 ⇑ 1% |
$2.99 ⇑ 3% |
$8.45 to $8.95 |
||||||||||||
Adjusted Diluted EPS1 |
||||||||||||||
$9.50 to $10.00 |
||||||||||||||
|
“Today, risk no longer escalates sequentially; it multiplies exponentially, forcing leaders to confront risk in new ways.”
“Moody’s vast datasets combined with our analytical insights and workflow tools are critical in helping customers identify, measure, and manage risk. Despite near-term headwinds, we are energized about our long-term opportunities, underpinned by our unique capabilities that enable organizations to enhance their risk management and achieve operational resiliency.”
| |||||
|
Rob Fauber
President and Chief Executive Officer
| |||||
1 Refer to the tables at the end of this press release for reconciliations of adjusted and constant currency measures to U.S. GAAP. | |||||
| REVENUE | ||
| Moody’s Corporation (MCO) | ||

First Quarter 2023 |
||
|
•Revenue declined 3% and 2% on a reported and constant currency basis1, respectively, from the prior-year period.
•MA recorded its 61st consecutive quarter of growth amid heightened customer demand for integrated solutions, and contributed approximately 50% to overall MCO revenue, up from 46% in the prior-year period.
•Investment grade issuance had a strong start to the year, with geopolitical and macroeconomic uncertainties continuing to constrain structured finance, leveraged loan, and high yield bond activity.
|
||
| Moody’s Analytics (MA) | ||


First Quarter 2023 |
||
|
•Reported revenue grew 6% versus the prior-year period on strong demand for Know Your Customer and Insurance solutions, as well as ratings data feeds. Foreign exchange rates negatively impacted MA revenue by 3%.
•Recurring revenue grew 6%, or 9% on a constant currency basis1, and represented 94% of the total, as MA continues to prioritize renewable products through its ongoing strategic shift to subscription-based solutions.
•Consistent mid-90s customer retention rates demonstrate the value proposition of MA’s mission-critical solutions in an evolving and complex risk environment.
•ARR2 grew 10% to $2.8 billion, led by an 11% increase in Decision Solutions.
|
||
2 Refer to Table 9 at the end of this press release for the definition of and further information on the Annualized Recurring Revenue (ARR) metric. | |||||
| Moody’s Investors Service (MIS) | ||

First Quarter 2023 |
||
|
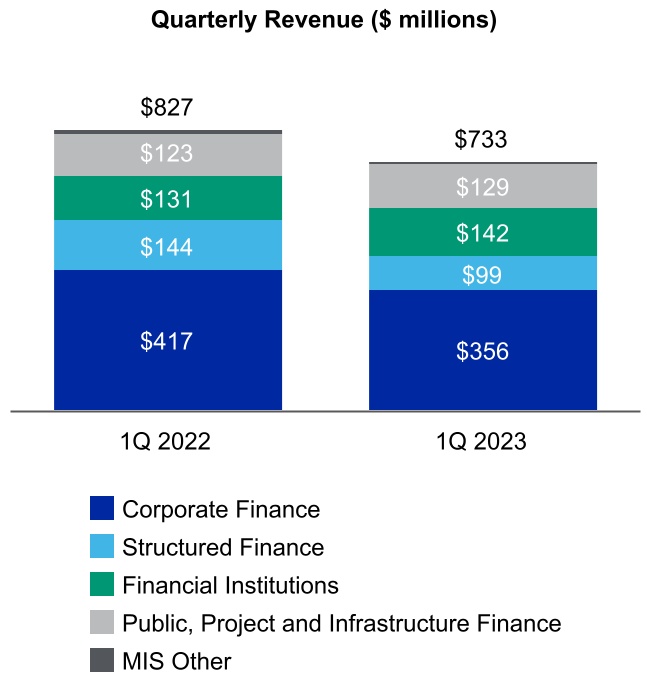
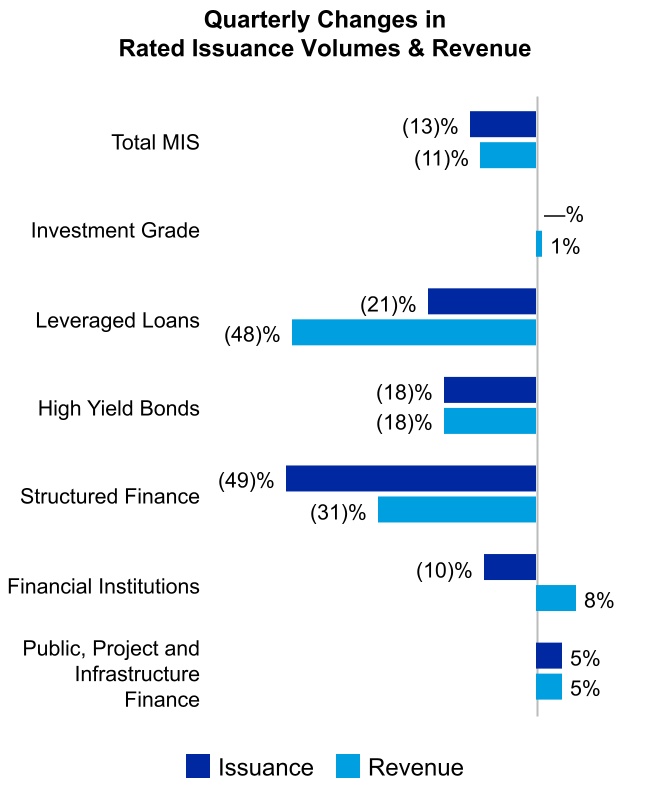
•Revenue declined 11% compared to the prior-year period. Foreign currency translation unfavorably impacted MIS revenue by 1%.
•Ongoing uncertainty around inflation, interest rates, and recessionary concerns broadly impacted credit markets, constraining issuance in most sectors.
•Activity was skewed toward higher-rated issuers, particularly in the investment grade corporate and infrastructure finance sectors. However, a strong prior-year comparable and the current macroeconomic environment resulted in issuance declines across several asset classes, specifically in structured and leveraged finance.
•A favorable mix from infrequent bank issuer activity positively impacted revenue growth within the Financial Institutions line of business.
|
||
| OPERATING EXPENSES AND MARGIN | ||
| Operating Expenses | ||


First Quarter 2023 |
Full Year 2023 Forecast | |||||||
|
•Operating expense growth of 6% was mainly due to higher incentive compensation accruals, annual merit increases, organic investments in sales deployment, as well as product and technology innovation initiatives, partially offset by benefits from cost management initiatives.
•Recorded $14 million in charges primarily related to personnel actions pursuant to the 2022 - 2023 Geolocation Restructuring Program.
•Increased depreciation and amortization expenses were mainly driven by investments associated with the development of SaaS-based solutions.
•Foreign currency translation favorably impacted operating expenses by 3%.
|
•Operating expenses are projected to increase in the mid-single-digit percent range.
•Assumptions underpinning operating growth largely unchanged, including the impact of ongoing strategic organic investments, salary and promotion increases, as well as the reset of incentive compensation accruals.
•2022 - 2023 Geolocation Restructuring Program creates additional investment capacity and financial flexibility; now expect to record approximately $50 million in restructuring charges during 2023.
|
|||||||
Operating Margin and Adjusted Operating Margin1 | ||


First Quarter 2023 |
||
|
•MCO’s operating margin was 37.7% and adjusted operating margin1 was 44.6%.
•MA’s year-over-year adjusted operating margin variability was influenced by a higher concentration of on-premise multi-year software renewals in the prior-year period, as well as the timing of investments.
•MIS’s adjusted operating margin remained resilient amid uncertain and volatile market conditions as decisive expense management actions partially offset the decline in revenue driven by issuance weakness, particularly in leveraged finance.
•Foreign currency had an immaterial impact on both operating and adjusted operating margins1.
|
||
| EARNINGS PER SHARE (EPS) | ||
Diluted EPS and Adjusted Diluted EPS1 | ||

First Quarter 2023 |
||
|
•The increase in both diluted and adjusted diluted EPS1 from the prior-year period was principally attributed to a decrease in the effective tax rate (ETR), continued and growing demand for MA’s mission-critical risk assessment offerings, and the benefit of expense reduction initiatives.
•The ETR was 1.0%, significantly lower than the 18.2% reported in the prior-year period, primarily due to the favorable resolutions of uncertain tax positions within U.S. domestic and foreign tax jurisdictions that are not expected to occur to a similar magnitude in future quarters.
|
||
| CAPITAL ALLOCATION AND LIQUIDITY | ||
Capital Returned to Shareholders & Free Cash Flow1 | ||


|
•Cash flow from operations for the first three months of 2023 was $608 million and free cash flow1 was $535 million.
•The increase in free cash flow1 was driven by lower incentive compensation payments versus the prior-year period.
•On April 24, 2023, the Board of Directors declared a regular quarterly dividend of $0.77 per share of MCO Common Stock. The dividend will be payable on June 9, 2023, to stockholders of record at the close of business on May 19, 2023.
•During the first quarter of 2023, Moody’s repurchased 0.1 million shares at an average cost of $297.90 per share and issued net 0.4 million shares as part of its employee stock-based compensation programs. The net amount included shares withheld for employee payroll taxes.
•As of March 31, 2023, Moody’s had 183.5 million shares outstanding, down 1% from March 31, 2022, and had approximately $807 million of share repurchase authority remaining.
•As of March 31, 2023, Moody's had $7.5 billion of outstanding debt and an undrawn $1.25 billion revolving credit facility.
| ||
| ASSUMPTIONS AND OUTLOOK | ||
| Forecasted Item | Current assumption | Last publicly disclosed assumption | ||||||
U.S. GDP(1) growth |
0.5% - 1.5% | 0.0% - 1.0% | ||||||
Euro area GDP(1) growth |
0.0% - 1.0% | (1.0%) - 0.0% | ||||||
| Global benchmark rates | Remain elevated, with U.S. Fed funds rate peaking above 5%, followed by the potential for rate reductions in early 2024 | Remain elevated, with U.S. Fed funds rate peaking above 5%, followed by rate cuts toward year-end | ||||||
| U.S. high yield spreads | Average approximately 500 bps, with periodic volatility | Widen toward 600 bps in 1Q 2023, then moderate toward 500 bps by year-end, with periodic volatility |
||||||
| U.S. inflation rate | Averages approximately 5% | NC | ||||||
| Euro area inflation rate | Large economies average approximately 6%, with considerable variation among countries |
Large economies average between 5% and 9%, with considerable variation among countries |
||||||
| U.S. unemployment rate | Rise toward 5% by year-end | NC | ||||||
| Global high yield default rate | Rise to approximately 5% by year-end | NC | ||||||
| Global MIS rated issuance | Increase in the low-single-digit percent range | NC | ||||||
| GBP/USD exchange rate | $1.24 for the remainder of the year | $1.20 for the full year | ||||||
| EUR/USD exchange rate | $1.09 for the remainder of the year | $1.07 for the full year | ||||||
|
NC - There is no difference between the Company’s current assumption and the last publicly disclosed assumption for this item.
Note: All current assumptions are as of April 25, 2023. All last publicly disclosed assumptions are as of January 31, 2023.
(1) GDP growth represents real GDP.
| ||||||||
| TELECONFERENCE DETAILS | ||
| Date and Time | April 25, 2023, at 12:30 p.m. Eastern Time (ET). |
|||||||
| Webcast | The webcast and its replay can be accessed through Moody’s Investor Relations website, ir.moodys.com, within “Events & Presentations.” |
|||||||
| Dial In | U.S. and Canada |
‘+1-888-330-2508 |
||||||
Other callers |
‘+1-240-789-2735 |
|||||||
| Passcode | 9302427 | |||||||
| Dial In Replay | A replay will be available immediately after the call on April 25, 2023, and until May 25, 2023. |
|||||||
U.S. and Canada |
‘+1-800-770-2030 |
|||||||
Other callers |
‘+1-647-362-9199 |
|||||||
| Passcode | 9302427 | |||||||
| ABOUT MOODY’S CORPORATION | ||
| “SAFE HARBOR” STATEMENT UNDER THE PRIVATE SECURITIES LITIGATION REFORM ACT OF 1995 | ||
|
Three Months Ended
March 31,
|
|||||||||||
| Amounts in millions, except per share amounts | 2023 | 2022 | |||||||||
| Revenue | $ | 1,470 | $ | 1,522 | |||||||
| Expenses: | |||||||||||
| Operating | 428 | 417 | |||||||||
| Selling, general, and administrative | 386 | 371 | |||||||||
| Depreciation and amortization | 88 | 78 | |||||||||
| Restructuring | 14 | — | |||||||||
| Total expenses | 916 | 866 | |||||||||
| Operating income | 554 | 656 | |||||||||
| Non-operating (expense) income, net | |||||||||||
| Interest expense, net | (48) | (53) | |||||||||
| Other non-operating income, net | — | 6 | |||||||||
| Total non-operating (expense) income, net | (48) | (47) | |||||||||
| Income before provision for income taxes | 506 | 609 | |||||||||
| Provision for income taxes | 5 | 111 | |||||||||
| Net income attributable to Moody's Corporation | $ | 501 | $ | 498 | |||||||
| Earnings per share attributable to Moody's common shareholders | |||||||||||
| Basic | $ | 2.73 | $ | 2.69 | |||||||
| Diluted | $ | 2.72 | $ | 2.68 | |||||||
| Weighted average number of shares outstanding | |||||||||||
| Basic | 183.3 | 185.1 | |||||||||
| Diluted | 184.1 | 186.1 | |||||||||
| Amounts in millions | March 31, 2023 | December 31, 2022 | |||||||||
| ASSETS | |||||||||||
| Current assets: | |||||||||||
| Cash and cash equivalents | $ | 2,119 | $ | 1,769 | |||||||
| Short-term investments | 78 | 90 | |||||||||
Accounts receivable, net of allowance for credit losses of $38 in 2023 and $40 in 2022 |
1,712 | 1,652 | |||||||||
| Other current assets | 517 | 583 | |||||||||
| Total current assets | 4,426 | 4,094 | |||||||||
Property and equipment, net of accumulated depreciation of $1,153 in 2023 and $1,123 in 2022 |
525 | 502 | |||||||||
| Operating lease right-of-use assets | 332 | 346 | |||||||||
| Goodwill | 5,892 | 5,839 | |||||||||
| Intangible assets, net | 2,177 | 2,210 | |||||||||
| Deferred tax assets, net | 268 | 266 | |||||||||
| Other assets | 1,099 | 1,092 | |||||||||
| Total assets | $ | 14,719 | $ | 14,349 | |||||||
| LIABILITIES AND SHAREHOLDERS' EQUITY | |||||||||||
| Current liabilities: | |||||||||||
| Accounts payable and accrued liabilities | $ | 805 | $ | 1,011 | |||||||
| Current portion of operating lease liabilities | 106 | 106 | |||||||||
| Current portion of long-term debt | 499 | — | |||||||||
| Deferred revenue | 1,578 | 1,258 | |||||||||
| Total current liabilities | 2,988 | 2,375 | |||||||||
| Non-current portion of deferred revenue | 70 | 75 | |||||||||
| Long-term debt | 6,963 | 7,389 | |||||||||
| Deferred tax liabilities, net | 476 | 457 | |||||||||
| Uncertain tax positions | 205 | 322 | |||||||||
| Operating lease liabilities | 349 | 368 | |||||||||
| Other liabilities | 610 | 674 | |||||||||
| Total liabilities | 11,661 | 11,660 | |||||||||
| Total Moody's shareholders' equity | 2,891 | 2,519 | |||||||||
| Noncontrolling interests | 167 | 170 | |||||||||
| Total shareholders' equity | 3,058 | 2,689 | |||||||||
| Total liabilities, noncontrolling interests, and shareholders' equity | $ | 14,719 | $ | 14,349 | |||||||
|
Three Months Ended
March 31,
|
|||||||||||
| Amounts in millions | 2023 | 2022 | |||||||||
| Interest: | |||||||||||
| Expense on borrowings | $ | (70) | $ | (48) | |||||||
UTPs and other tax related liabilities(1) |
18 | (3) | |||||||||
| Net periodic pension costs - interest component | (6) | (4) | |||||||||
| Income | 10 | 2 | |||||||||
| Total interest expense, net | $ | (48) | $ | (53) | |||||||
| Other non-operating (expense) income, net: | |||||||||||
| FX (loss)/gain | $ | (26) | $ | — | |||||||
| Net periodic pension costs - other components | 9 | 6 | |||||||||
| Income from investments in non-consolidated affiliates | 2 | 2 | |||||||||
Other(2) |
15 | (2) | |||||||||
| Other non-operating income (expense), net | $ | — | $ | 6 | |||||||
| Total non-operating (expense) income, net | $ | (48) | $ | (47) | |||||||
(1) The amount for the three months ended March 31, 2023 includes a $22 million reduction of tax-related interest expense primarily related to the resolutions of tax matters. | ||
(2) The amount for the three months ended March 31, 2023 includes a benefit of $9 million related to the favorable resolution of various tax matters and a $4 million gain on certain of the Company's investments. | ||
Three Months Ended March 31, |
|||||||||||||||||||||||||||||||||||||||||||||||
| 2023 | 2022 | ||||||||||||||||||||||||||||||||||||||||||||||
| Amounts in millions | MA | MIS | Eliminations | Consolidated | MA | MIS | Eliminations | Consolidated | |||||||||||||||||||||||||||||||||||||||
| Total external revenue | $ | 737 | $ | 733 | $ | — | $ | 1,470 | $ | 695 | $ | 827 | $ | — | $ | 1,522 | |||||||||||||||||||||||||||||||
| Intersegment revenue | 3 | 45 | (48) | — | 2 | 43 | (45) | — | |||||||||||||||||||||||||||||||||||||||
| Total revenue | 740 | 778 | (48) | 1,470 | 697 | 870 | (45) | 1,522 | |||||||||||||||||||||||||||||||||||||||
| Operating, SG&A | 526 | 336 | (48) | 814 | 473 | 360 | (45) | 788 | |||||||||||||||||||||||||||||||||||||||
| Adjusted Operating Income | $ | 214 | $ | 442 | $ | — | $ | 656 | $ | 224 | $ | 510 | $ | — | $ | 734 | |||||||||||||||||||||||||||||||
| Adjusted Operating Margin | 28.9 | % | 56.8 | % | 44.6 | % | 32.1 | % | 58.6 | % | 48.2 | % | |||||||||||||||||||||||||||||||||||
| Depreciation and amortization | 70 | 18 | — | 88 | 60 | 18 | — | 78 | |||||||||||||||||||||||||||||||||||||||
| Restructuring | 8 | 6 | — | 14 | — | — | — | — | |||||||||||||||||||||||||||||||||||||||
| Operating income | $ | 554 | $ | 656 | |||||||||||||||||||||||||||||||||||||||||||
| Operating margin | 37.7 | % | 43.1 | % | |||||||||||||||||||||||||||||||||||||||||||
Three Months Ended March 31, |
|||||||||||||||||||||||||||||||||||
| 2023 | 2022 | ||||||||||||||||||||||||||||||||||
| Amounts in millions | Transaction | Recurring | Total | Transaction | Recurring | Total | |||||||||||||||||||||||||||||
| Decision Solutions | $ | 43 | $ | 311 | $ | 354 | $ | 43 | $ | 291 | $ | 334 | |||||||||||||||||||||||
| 12 | % | 88 | % | 100 | % | 13 | % | 87 | % | 100 | % | ||||||||||||||||||||||||
| Research & Insights | $ | 2 | $ | 193 | $ | 195 | $ | 1 | $ | 182 | $ | 183 | |||||||||||||||||||||||
| 1 | % | 99 | % | 100 | % | 1 | % | 99 | % | 100 | % | ||||||||||||||||||||||||
| Data & Information | $ | — | $ | 188 | $ | 188 | $ | — | $ | 178 | $ | 178 | |||||||||||||||||||||||
| — | % | 100 | % | 100 | % | — | % | 100 | % | 100 | % | ||||||||||||||||||||||||
| Total MA | $ | 45 | $ | 692 | $ | 737 | $ | 44 | $ | 651 | $ | 695 | |||||||||||||||||||||||
| 6 | % | 94 | % | 100 | % | 6 | % | 94 | % | 100 | % | ||||||||||||||||||||||||
| Corporate Finance | $ | 230 | $ | 126 | $ | 356 | $ | 293 | $ | 124 | $ | 417 | |||||||||||||||||||||||
| 65 | % | 35 | % | 100 | % | 70 | % | 30 | % | 100 | % | ||||||||||||||||||||||||
| Structured Finance | $ | 45 | $ | 54 | $ | 99 | $ | 93 | $ | 51 | $ | 144 | |||||||||||||||||||||||
| 45 | % | 55 | % | 100 | % | 65 | % | 35 | % | 100 | % | ||||||||||||||||||||||||
| Financial Institutions | $ | 70 | $ | 72 | $ | 142 | $ | 61 | $ | 70 | $ | 131 | |||||||||||||||||||||||
| 49 | % | 51 | % | 100 | % | 47 | % | 53 | % | 100 | % | ||||||||||||||||||||||||
| Public, Project and Infrastructure Finance | $ | 86 | $ | 43 | $ | 129 | $ | 79 | $ | 44 | $ | 123 | |||||||||||||||||||||||
| 67 | % | 33 | % | 100 | % | 64 | % | 36 | % | 100 | % | ||||||||||||||||||||||||
| MIS Other | $ | — | $ | 7 | $ | 7 | $ | 3 | $ | 9 | $ | 12 | |||||||||||||||||||||||
| — | % | 100 | % | 100 | % | 25 | % | 75 | % | 100 | % | ||||||||||||||||||||||||
| Total MIS | $ | 431 | $ | 302 | $ | 733 | $ | 529 | $ | 298 | $ | 827 | |||||||||||||||||||||||
| 59 | % | 41 | % | 100 | % | 64 | % | 36 | % | 100 | % | ||||||||||||||||||||||||
| Total Moody's Corporation | $ | 476 | $ | 994 | $ | 1,470 | $ | 573 | $ | 949 | $ | 1,522 | |||||||||||||||||||||||
| 32 | % | 68 | % | 100 | % | 38 | % | 62 | % | 100 | % | ||||||||||||||||||||||||
Three Months Ended March 31, |
|||||||||||
| Amounts in millions | 2023 | 2022 | |||||||||
| Operating income | $ | 554 | $ | 656 | |||||||
| Depreciation and amortization | 88 | 78 | |||||||||
| Restructuring | 14 | — | |||||||||
| Adjusted Operating Income | $ | 656 | $ | 734 | |||||||
| Operating margin | 37.7 | % | 43.1 | % | |||||||
| Adjusted Operating Margin | 44.6 | % | 48.2 | % | |||||||
| Three Months Ended March 31, | |||||||||||
| Amounts in millions | 2023 | 2022 | |||||||||
| Net cash provided by operating activities | $ | 608 | $ | 470 | |||||||
| Capital additions | (73) | (59) | |||||||||
| Free Cash Flow | $ | 535 | $ | 411 | |||||||
| Net cash used in investing activities | $ | (63) | $ | (161) | |||||||
| Net cash used in financing activities | $ | (216) | $ | (352) | |||||||
Three Months Ended March 31, |
|||||||||||||||||||||||
| Amounts in millions | 2023 | 2022 | Change | Growth | |||||||||||||||||||
| MCO revenue | $ | 1,470 | $ | 1,522 | $ | (52) | (3)% | ||||||||||||||||
| FX impact | 28 | — | 28 | ||||||||||||||||||||
Constant currency MCO revenue |
$ | 1,498 | $ | 1,522 | $ | (24) | (2)% | ||||||||||||||||
| MA revenue | $ | 737 | $ | 695 | $ | 42 | 6% | ||||||||||||||||
| FX impact | 18 | — | 18 | ||||||||||||||||||||
Constant currency MA revenue |
$ | 755 | $ | 695 | $ | 60 | 9% | ||||||||||||||||
| Decision Solutions revenue | $ | 354 | $ | 334 | $ | 20 | 6% | ||||||||||||||||
| FX impact | 7 | — | 7 | ||||||||||||||||||||
Constant currency Decision Solutions revenue |
$ | 361 | $ | 334 | $ | 27 | 8% | ||||||||||||||||
| Research and Insights revenue | $ | 195 | $ | 183 | $ | 12 | 7% | ||||||||||||||||
| FX impact | 3 | — | 3 | ||||||||||||||||||||
Constant currency Research and Insights revenue |
$ | 198 | $ | 183 | $ | 15 | 8% | ||||||||||||||||
| Data and Information revenue | $ | 188 | $ | 178 | $ | 10 | 6% | ||||||||||||||||
| FX impact | 8 | — | 8 | ||||||||||||||||||||
Constant currency Data and Information revenue |
$ | 196 | $ | 178 | $ | 18 | 10% | ||||||||||||||||
| MA recurring revenue | $ | 692 | $ | 651 | $ | 41 | 6% | ||||||||||||||||
| FX impact | 17 | — | 17 | ||||||||||||||||||||
Constant currency MA recurring revenue |
$ | 709 | $ | 651 | $ | 58 | 9% | ||||||||||||||||
| Amounts in millions | March 31, 2023 | March 31, 2022 | Change | Growth | |||||||||||||||||||
| MA ARR | |||||||||||||||||||||||
| Decision Solutions | $ | 1,234 | $ | 1,108 | $ | 126 | 11% | ||||||||||||||||
| Research and Insights | 770 | 708 | 62 | 9% | |||||||||||||||||||
| Data and Information | 748 | 685 | 63 | 9% | |||||||||||||||||||
| Total MA ARR | $ | 2,752 | $ | 2,501 | $ | 251 | 10% | ||||||||||||||||
Three Months Ended March 31, |
|||||||||||||||||
| Amounts in millions | 2023 | 2022 | |||||||||||||||
| Net income attributable to Moody's common shareholders | $ | 501 | $ | 498 | |||||||||||||
| Pre-tax Acquisition-Related Intangible Amortization Expenses | $ | 51 | $ | 51 | |||||||||||||
| Tax on Acquisition-Related Intangible Amortization Expenses | (12) | (12) | |||||||||||||||
| Net Acquisition-Related Intangible Amortization Expenses | 39 | 39 | |||||||||||||||
| Pre-tax restructuring | $ | 14 | $ | — | |||||||||||||
| Tax on restructuring | (4) | — | |||||||||||||||
| Net restructuring | 10 | — | |||||||||||||||
| Adjusted Net Income | $ | 550 | $ | 537 | |||||||||||||
Three Months Ended March 31, |
|||||||||||||||||
| Amounts in millions | 2023 | 2022 | |||||||||||||||
| Diluted earnings per share attributable to Moody's common shareholders | $ | 2.72 | $ | 2.68 | |||||||||||||
| Pre-tax Acquisition-Related Intangible Amortization Expenses | $ | 0.28 | $ | 0.27 | |||||||||||||
| Tax on Acquisition-Related Intangible Amortization Expenses | (0.06) | (0.06) | |||||||||||||||
| Net Acquisition-Related Intangible Amortization Expenses | 0.22 | 0.21 | |||||||||||||||
| Pre-tax restructuring | $ | 0.08 | $ | — | |||||||||||||
| Tax on restructuring | (0.03) | — | |||||||||||||||
| Net restructuring | 0.05 | — | |||||||||||||||
| Adjusted Diluted EPS | $ | 2.99 | $ | 2.89 | |||||||||||||
| Note: The tax impacts in the tables above were calculated using tax rates in effect in the jurisdiction for which the item relates. | ||
Full Year 2023 Moody's Corporation Guidance as of April 25, 2023 | ||||||||
| MOODY'S CORPORATION | Current guidance | Last publicly disclosed guidance | ||||||
| Revenue | Increase in the mid-to-high-single-digit percent range |
NC | ||||||
| Operating expenses | Increase in the mid-single-digit percent range |
Increase in the low-single-digit percent range |
||||||
| Operating margin | Approximately 37% | NC | ||||||
Adjusted Operating Margin (1) |
44% to 45% | NC | ||||||
| Interest expense, net | $275 to $295 million | $290 to $310 million | ||||||
| Effective tax rate | 15% to 17% | 20% to 22% | ||||||
| Diluted EPS | $8.45 to $8.95 | $8.05 to $8.55 | ||||||
Adjusted Diluted EPS (1) |
$9.50 to $10.00 | $9.00 to $9.50 | ||||||
| Operating cash flow | $1.7 to $1.9 billion | NC | ||||||
Free Cash Flow (1) |
$1.4 to $1.6 billion | NC | ||||||
| Share repurchases | Approximately $250 million (subject to available cash, market conditions, M&A opportunities, and other ongoing capital allocation decisions) |
NC | ||||||
| Moody's Analytics (MA) | Current guidance | Last publicly disclosed guidance | ||||||
| MA global revenue | Increase of approximately 10% | NC | ||||||
ARR (2) |
Increase in the low-double-digit percent range | NC | ||||||
| MA Adjusted Operating Margin | Approximately 31% | NC | ||||||
| Moody's Investors Service (MIS) | Current guidance | Last publicly disclosed guidance | ||||||
| MIS global revenue | Increase in the low-to-mid-single-digit percent range | NC | ||||||
| MIS Adjusted Operating Margin | Mid-50s percent range | NC | ||||||
|
NC - There is no difference between the Company’s current guidance and the last publicly disclosed guidance for this item.
Note: All current guidance as of April 25, 2023. All last publicly disclosed guidance is as of January 31, 2023.
(1) These metrics are adjusted measures. See below for reconciliation of these measures to their comparable U.S. GAAP measure.
(2) Refer to Table 9 within this earnings release for the definition of and further information on the ARR metric.
| ||||||||
| Projected for the Year Ended December 31, 2023 |
|||||
| Operating margin guidance | Approximately 37% |
||||
| Depreciation and amortization | Approximately 6.5% | ||||
| Restructuring expense | Approximately 1% | ||||
| Adjusted Operating Margin guidance | 44% to 45% |
||||
| Projected for the Year Ended December 31, 2023 |
|||||
| Operating cash flow guidance | $1.7 to $1.9 billion |
||||
| Less: Capital expenditures | Approximately $0.3 billion | ||||
| Free Cash Flow guidance | $1.4 to $1.6 billion |
||||
| Projected for the Year Ended December 31, 2023 |
|||||
| Diluted EPS guidance | $8.45 to $8.95 |
||||
| Acquisition-Related Intangible Amortization | Approximately $0.85 | ||||
| Restructuring | Approximately $0.20 | ||||
| Adjusted Diluted EPS guidance | $9.50 to $10.00 |
||||