| Delaware | 1-14037 | 13-3998945 | ||||||
| (State or Other Jurisdiction of Incorporation) | (Commission File Number) | (IRS Employer Identification No.) | ||||||
| ☐ | Written communications pursuant to Rule 425 under the Securities Act (17 CFR 230.425) | |||||||
| ☐ | Soliciting material pursuant to Rule 14a-12 under the Exchange Act (17 CFR 240.14a-12) |
|||||||
| ☐ | Pre-commencement communications pursuant to Rule 14d-2(b) under the Exchange Act (17 CFR 240.14d-2(b)) |
|||||||
| ☐ | Pre-commencement communications pursuant to Rule 13e-4(c) under the Exchange Act (17 CFR 240.13e-4(c)) | |||||||
| Title of each class | Trading Symbol(s) | Name of each exchange on which registered | ||||||||||||
| Common Stock, par value $0.01 per share | MCO | New York Stock Exchange | ||||||||||||
| 1.75% Senior Notes Due 2027 | MCO 27 | New York Stock Exchange | ||||||||||||
| 0.950% Senior Notes Due 2030 | MCO 30 | New York Stock Exchange | ||||||||||||
| Emerging growth company | ☐ | ||||
If an emerging growth company, indicate by check mark if the registrant has elected not to use the extended transition period for complying with any new or revised financial accounting standards provided pursuant to Section 13(a) of the Exchange Act. |
☐ | ||||
ITEM 2.02 |
RESULTS OF OPERATIONS AND FINANCIAL CONDITION |
3 | ||||||
| ITEM 7.01 | REGULATION FD DISCLOSURE | 3 | ||||||
| ITEM 9.01 | FINANCIAL STATEMENTS AND EXHIBITS | 3 | ||||||
| SIGNATURES | 4 | |||||||
| EXHIBIT 99.1 | ||||||||
| 104 | The cover page from this Current Report on Form 8-K, formatted in Inline XBRL. | ||||
| MOODY'S CORPORATION | |||||
| By: | /s/ Elizabeth M. McCarroll | ||||
| Elizabeth M. McCarroll | |||||
| Corporate Secretary and Associate General Counsel | |||||

FOURTH QUARTER AND FULL YEAR SUMMARY FINANCIALS | ||||||||||||||
| Moody’s Corporation (MCO) Revenue |
Moody’s Investors Service (MIS) Revenue |
Moody’s Analytics (MA) Revenue |
||||||||||||
4Q 2022 |
4Q 2022 |
4Q 2022 |
||||||||||||
$1.3 billion ⇓ 16% |
$576 million ⇓ 34% |
$714 million ⇑ 7% |
||||||||||||
| FY 2022 | FY 2022 | FY 2022 | ||||||||||||
$5.5 billion ⇓ 12% |
$2.7 billion ⇓ 29% |
$2.8 billion ⇑ 15% |
||||||||||||
| MCO Diluted EPS | MCO Adjusted Diluted EPS1 |
MCO FY 2023 Projected | ||||||||||||
4Q 2022 |
4Q 2022 |
Diluted EPS |
||||||||||||
$1.34 ⇓ 41% |
$1.60 ⇓ 31% |
$8.05 - $8.55 | ||||||||||||
| FY 2022 | FY 2022 | Adjusted Diluted EPS1 |
||||||||||||
$7.44 ⇓ 37% |
$8.57 ⇓ 30% |
$9.00 - $9.50 | ||||||||||||
|
“Throughout 2022, our data, analytics and insights helped our customers navigate one of the more challenging years in recent memory.”
“Moody’s Analytics achieved its 60th consecutive quarter of revenue growth, expanded ARR by double-digits and improved its margin. While debt issuance was dampened amidst ongoing macroeconomic uncertainty, Moody’s Investors Service remains the agency of choice for both issuers and investors. For 2023, we project Moody’s revenue to grow in the mid-to-high-single-digit percent range and forecast adjusted diluted EPS in the range of $9.00 to $9.50.”
| |||||
|
Rob Fauber
President and Chief Executive Officer
| |||||
| REVENUE | ||
| Moody’s Corporation (MCO) | ||


Fourth Quarter 2022 |
Full Year 2022 | ||||
|
•Revenue declined 16% and 13% on a reported and organic constant currency basis1, respectively, from the prior-year period.
•Foreign currency translation unfavorably impacted Moody's revenue by 3%.
|
•Revenue declined 12% and 13% on a reported and organic constant currency basis1, respectively, from the prior year.
•Foreign currency translation unfavorably impacted Moody’s revenue by 3%.
|
||||
| Moody’s Investors Service (MIS) | ||


Fourth Quarter 2022 |
Full Year 2022 | ||||
|
•Revenue declined 34% against a record prior-year period.
•Credit market activity remained muted across all sectors due to ongoing market uncertainty, central bank actions, high levels of corporate cash, as well as persistent inflationary and recessionary concerns.
•Leveraged loan, high yield bond and structured finance issuance declined sharply from a strong prior-year comparable; revenue was also impacted by an unfavorable issuer mix given the decrease in opportunistic activity.
•Foreign currency translation unfavorably impacted MIS revenue by 2%.
|
•Revenue declined 29% against a record prior year.
•In contrast to the conducive issuance environment in 2021, inflationary concerns and geopolitical tensions significantly dampened issuance throughout 2022, particularly for leveraged finance.
•Revenue was also adversely affected by an unfavorable mix within both Corporate Finance and Financial Institutions as fewer infrequent issuers opportunistically came to market.
•Foreign currency translation unfavorably impacted MIS revenue by 2%.
|
||||
| Moody’s Analytics (MA) | ||


Fourth Quarter 2022 |
Full Year 2022 | ||||
|
•Revenue and organic constant currency revenue1 growth of 7% and 11%, respectively, driven by strong demand for MA’s award-winning Know Your Customer solutions, as well as credit research, ratings data feeds and insurance actuarial modeling tools.
•The impact of foreign currency translation reduced MA revenue growth by 5%.
•ARR2 was $2.8 billion, up 10% on mid-90s retention rates, value-based pricing realization, as well as new product launches and enhancements.
|
•Revenue and organic constant currency revenue1 grew 15% and 10%, respectively.
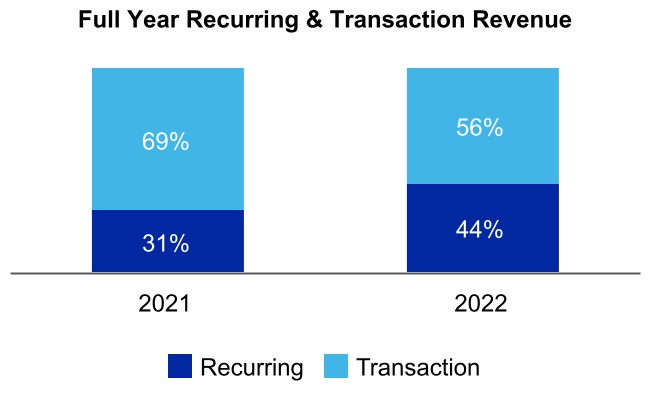
•MA’s recurring revenue now comprises 94% of total MA revenue, up from 93% in the prior year, as the business continues its strategic shift to subscription based solutions.
•Mid-90s customer retention rate demonstrates the value proposition of MA’s mission-critical solutions, particularly in an evolving and increasingly complex risk environment.
•Foreign currency translation unfavorably impacted MA revenue by 5%, with a notable impact in the Data & Information line of business of 7%.
|
||||
2 Refer to Table 9 at the end of this press release for the definition of and further information on the Annualized Recurring Revenue (ARR) metric. | |||||
| OPERATING EXPENSES | ||


| Full Year 2022 | Full Year 2023 Forecast | ||||
|
•Operating expenses grew 6% from the prior year, including 7% from recent acquisitions, primarily RMS.
•Recorded $114 million in charges related to personnel and real estate actions pursuant to the 2022 - 2023 Geolocation Restructuring Program.
•Lower incentive compensation accruals and ongoing cost control initiatives offset expense growth from ongoing organic investments.
•Foreign currency translation favorably impacted operating expenses by 4%.
|
•Operating expenses projected to increase in the low-single-digit percent range in 2023.
•Operating growth includes the impact of employee compensation increases, as well as the reset of incentive compensation funding and ongoing organic investments.
•Run-rate cost reductions achieved through the 2022 - 2023 Geolocation Restructuring Program and other expense efficiency initiatives provide incremental capacity for organic investments to capture customer demand in high-priority growth markets.
|
||||
Operating Margin and Adjusted Operating Margin1 | ||


Fourth Quarter 2022 |
Full Year 2022 | ||||
|
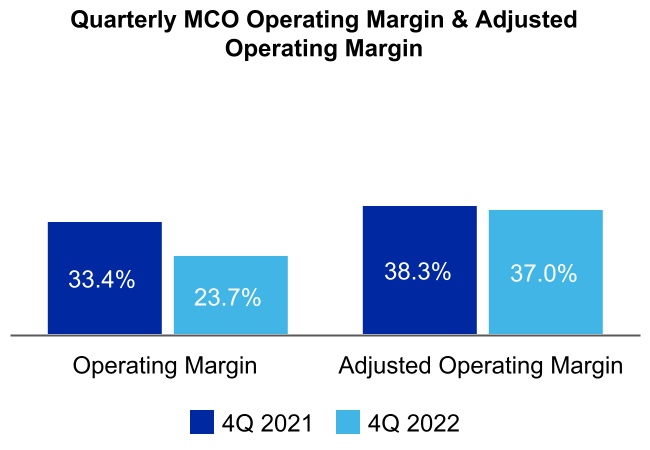
•MCO’s operating margin and adjusted operating margin1 both decreased from the prior-year period.
•Decisive expense management actions across the firm and growth in MA’s operating income partially offset the decline in MIS’s revenue given significant issuance weakness, particularly in the leveraged finance markets.
•Foreign currency translation had an immaterial impact on MCO’s and MIS’s adjusted operating margins, but unfavorably impacted MA’s adjusted operating margin1 by 70 basis points.
|
•MCO’s operating margin and adjusted operating margin1 declined from the prior year as the volatile macroeconomic environment and geopolitical uncertainty significantly impacted global debt issuance.
•Recent acquisitions3 and foreign currency translation lowered MA's adjusted operating margin1 by 190 and 80 basis points, respectively.
|
||||
3 Recent acquisitions refers to acquisitions completed during 2021 and 2022. | |||||
| EARNINGS PER SHARE (EPS) | ||
Diluted EPS and Adjusted Diluted EPS1 | ||


Fourth Quarter 2022 |
Full Year 2022 | ||||
|
•The EPS decline from the prior-year period was principally attributed to the decrease in MIS’s revenue, partially offset by continued and growing demand for MA’s global integrated risk assessment offerings and incremental MCO expense reduction initiatives.
•The effective tax rate was 24.8%, up from 17.2% in the prior year. The increase was primarily due to the recognition of higher U.S. discrete tax benefits in the fourth quarter of 2021 compared to the current year period.
|
•Lower EPS than prior year reflected the 34% decline in operating income primarily associated with the decrease in MIS’s revenue, partially offset by growing demand for MA’s global integrated risk assessment offerings.
•The effective tax rate was 21.9%, up from 19.6% in the prior year. The increase was primarily due to tax benefits realized upon resolution of uncertain tax positions during 2021 that did not recur to the same extent in 2022 and a non-deductible loss in 2022 associated with the Company no longer conducting commercial operations in Russia.
|
||||
| CAPITAL ALLOCATION AND LIQUIDITY | ||
Capital Returned to Shareholders & Free Cash Flow1 | ||


| ASSUMPTIONS AND OUTLOOK | ||
| Forecasted Item | Current assumption | ||||
U.S. GDP(1) |
0.0% - 1.0% | ||||
Euro area GDP(1) |
(1.0%) - 0.0% | ||||
| Global benchmark rates | Remain elevated, with U.S. Fed funds rate peaking above 5%, followed by rate cuts toward year-end | ||||
| U.S. high yield spreads | Widen toward 600 bps in 1Q 2023, then moderate toward 500 bps by year-end, with periodic volatility |
||||
| U.S. inflation rate | Averages approximately 5% | ||||
| Euro area inflation rate | Large economies average between 5% and 9%, with considerable variation among countries |
||||
| U.S. unemployment rate | Rise toward 5% by year-end | ||||
| Global high yield default rate | Rise to approximately 5% by year-end | ||||
| Global MIS rated issuance | Increase in the low-single-digit percent range | ||||
| GBP/USD exchange rate | $1.20 for the full year | ||||
| EUR/USD exchange rate | $1.07 for the full year | ||||
|
Note: All current assumptions are as of January 31, 2023.
(1) GDP represents rate of change in real GDP.
| |||||
| TELECONFERENCE DETAILS | ||
| Date and Time | January 31, 2023, at 12:30 p.m. Eastern Time (ET). |
|||||||
| Webcast | The webcast and its replay can be accessed through Moody’s Investor Relations website, ir.moodys.com, within “Events & Presentations”. |
|||||||
| Dial In | U.S. and Canada |
‘+1-888-330-2508 |
||||||
Other callers |
‘+1-240-789-2735 |
|||||||
| Passcode | 9302427 | |||||||
| Dial In Replay | A replay will be available immediately after the call on January 31, 2023, and until March 2, 2023. |
|||||||
U.S. and Canada |
‘+1-800-770-2030 |
|||||||
Other callers |
‘+1-647-362-9199 |
|||||||
| Passcode | 9302427 | |||||||
| ABOUT MOODY’S CORPORATION | ||
| “SAFE HARBOR” STATEMENT UNDER THE PRIVATE SECURITIES LITIGATION REFORM ACT OF 1995 | ||
|
Three Months Ended
December 31,
|
Year Ended December 31, |
||||||||||||||||||||||
| Amounts in millions, except per share amounts | 2022 | 2021 | 2022 | 2021 | |||||||||||||||||||
| Revenue | $ | 1,290 | $ | 1,539 | $ | 5,468 | $ | 6,218 | |||||||||||||||
| Expenses: | |||||||||||||||||||||||
| Operating | 410 | 485 | 1,613 | 1,637 | |||||||||||||||||||
| Selling, general and administrative | 403 | 465 | 1,527 | 1,480 | |||||||||||||||||||
| Depreciation and amortization | 89 | 77 | 331 | 257 | |||||||||||||||||||
| Restructuring | 82 | (2) | 114 | — | |||||||||||||||||||
| Total expenses | 984 | 1,025 | 3,585 | 3,374 | |||||||||||||||||||
| Operating income | 306 | 514 | 1,883 | 2,844 | |||||||||||||||||||
| Non-operating (expense) income, net | |||||||||||||||||||||||
| Interest expense, net | (65) | (62) | (231) | (171) | |||||||||||||||||||
| Other non-operating income, net | 16 | 64 | 38 | 82 | |||||||||||||||||||
| Gain on extinguishment of debt | 70 | — | 70 | — | |||||||||||||||||||
| Total non-operating (expense) income, net | 21 | 2 | (123) | (89) | |||||||||||||||||||
| Income before provision for income taxes | 327 | 516 | 1,760 | 2,755 | |||||||||||||||||||
| Provision for income taxes | 81 | 89 | 386 | 541 | |||||||||||||||||||
| Net income attributable to Moody's Corporation | $ | 246 | $ | 427 | $ | 1,374 | $ | 2,214 | |||||||||||||||
| Earnings per share attributable to Moody's common shareholders | |||||||||||||||||||||||
| Basic | $ | 1.34 | $ | 2.30 | $ | 7.47 | $ | 11.88 | |||||||||||||||
| Diluted | $ | 1.34 | $ | 2.28 | $ | 7.44 | $ | 11.78 | |||||||||||||||
| Weighted average number of shares outstanding | |||||||||||||||||||||||
| Basic | 183.2 | 185.8 | 183.9 | 186.4 | |||||||||||||||||||
| Diluted | 183.9 | 187.4 | 184.7 | 187.9 | |||||||||||||||||||
| Amounts in millions | December 31, 2022 | December 31, 2021 | |||||||||
| ASSETS | |||||||||||
| Current assets: | |||||||||||
| Cash and cash equivalents | $ | 1,769 | $ | 1,811 | |||||||
| Short-term investments | 90 | 91 | |||||||||
Accounts receivable, net of allowance for credit losses of $40 in 2022 and $32 in 2021 |
1,652 | 1,720 | |||||||||
| Other current assets | 583 | 389 | |||||||||
| Total current assets | 4,094 | 4,011 | |||||||||
Property and equipment, net of accumulated depreciation of $1,123 in 2022 and $1,010 in 2021 |
502 | 347 | |||||||||
| Operating lease right-of-use assets | 346 | 438 | |||||||||
| Goodwill | 5,839 | 5,999 | |||||||||
| Intangible assets, net | 2,210 | 2,467 | |||||||||
| Deferred tax assets, net | 266 | 384 | |||||||||
| Other assets | 1,092 | 1,034 | |||||||||
| Total assets | $ | 14,349 | $ | 14,680 | |||||||
| LIABILITIES AND SHAREHOLDERS' EQUITY | |||||||||||
| Current liabilities: | |||||||||||
| Accounts payable and accrued liabilities | $ | 1,011 | $ | 1,142 | |||||||
| Current portion of operating lease liabilities | 106 | 105 | |||||||||
| Deferred revenue | 1,258 | 1,249 | |||||||||
| Total current liabilities | 2,375 | 2,496 | |||||||||
| Non-current portion of deferred revenue | 75 | 86 | |||||||||
| Long-term debt | 7,389 | 7,413 | |||||||||
| Deferred tax liabilities, net | 457 | 488 | |||||||||
| Uncertain tax positions | 322 | 388 | |||||||||
| Operating lease liabilities | 368 | 455 | |||||||||
| Other liabilities | 674 | 438 | |||||||||
| Total liabilities | 11,660 | 11,764 | |||||||||
| Total Moody's shareholders' equity | 2,519 | 2,727 | |||||||||
| Noncontrolling interests | 170 | 189 | |||||||||
| Total shareholders' equity | 2,689 | 2,916 | |||||||||
| Total liabilities, noncontrolling interests and shareholders' equity | $ | 14,349 | $ | 14,680 | |||||||
|
Three Months Ended
December 31,
|
Year Ended December 31, |
||||||||||||||||||||||
| Amounts in millions | 2022 | 2021 | 2022 | 2021 | |||||||||||||||||||
| Interest: | |||||||||||||||||||||||
| Expense on borrowings | $ | (64) | $ | (56) | $ | (216) | $ | (185) | |||||||||||||||
UTPs and other tax related liabilities (1) |
(2) | (4) | (13) | 21 | |||||||||||||||||||
| Net periodic pension costs - interest component | (5) | (4) | (17) | (16) | |||||||||||||||||||
| Income | 6 | 2 | 15 | 9 | |||||||||||||||||||
| Total interest expense, net | $ | (65) | $ | (62) | $ | (231) | $ | (171) | |||||||||||||||
| Other non-operating (expense) income, net: | |||||||||||||||||||||||
FX gain/(loss) (2) |
$ | (1) | $ | 1 | $ | (10) | $ | (1) | |||||||||||||||
Purchase Price Hedge Loss (3) |
— | — | — | (13) | |||||||||||||||||||
| Net periodic pension costs - other components | 6 | 4 | 24 | 9 | |||||||||||||||||||
Income from investments in non-consolidated affiliates (4) |
3 | 45 | 17 | 60 | |||||||||||||||||||
| Other | 8 | 14 | 7 | 27 | |||||||||||||||||||
| Other non-operating income (expense), net | 16 | 64 | 38 | 82 | |||||||||||||||||||
Gain on extinguishment of debt (5) |
70 | — | 70 | — | |||||||||||||||||||
| Total non-operating (expense) income, net | $ | 21 | $ | 2 | $ | (123) | $ | (89) | |||||||||||||||
|
(1) The amount for the year ended December 31, 2021 includes a $45 million benefit related to the reversal of tax-related interest accruals pursuant to the resolution of outstanding tax matters.
(2) The amount for the year ended December 31, 2022 includes $20 million of foreign exchange translation losses reclassified to earnings resulting from the Company no longer conducting commercial operations in Russia.
(3) Reflects a loss on a forward contract to hedge a portion of the RMS British pound-denominated purchase price in 2021.
(4) The amount for the quarter and year ended December 31, 2021 reflects a $36 million non-cash gain relating to the exchange of Moody’s minority investment in VisibleRisk for shares of BitSight.
(5) The gain on extinguishment of debt for the quarter and year ended December 31, 2022 relates to the early redemption of a portion of the 2.55% 2020 Senior Notes, Due 2060.
| ||
Three Months Ended December 31, |
|||||||||||||||||||||||||||||||||||||||||||||||
| 2022 | 2021 | ||||||||||||||||||||||||||||||||||||||||||||||
| Amounts in millions | MIS | MA | Eliminations | Consolidated | MIS | MA | Eliminations | Consolidated | |||||||||||||||||||||||||||||||||||||||
| Total external revenue | $ | 576 | $ | 714 | $ | — | $ | 1,290 | $ | 871 | $ | 668 | $ | — | $ | 1,539 | |||||||||||||||||||||||||||||||
| Intersegment revenue | 45 | 3 | (48) | — | 41 | 1 | (42) | — | |||||||||||||||||||||||||||||||||||||||
| Total revenue | 621 | 717 | (48) | 1,290 | 912 | 669 | (42) | 1,539 | |||||||||||||||||||||||||||||||||||||||
| Operating, SG&A | 347 | 514 | (48) | 813 | 423 | 569 | (42) | 950 | |||||||||||||||||||||||||||||||||||||||
| Adjusted Operating Income | $ | 274 | $ | 203 | $ | — | $ | 477 | $ | 489 | $ | 100 | $ | — | $ | 589 | |||||||||||||||||||||||||||||||
| Adjusted Operating Margin | 44.1 | % | 28.3 | % | 37.0 | % | 53.6 | % | 14.9 | % | 38.3 | % | |||||||||||||||||||||||||||||||||||
| Depreciation and amortization | 21 | 68 | — | 89 | 19 | 58 | — | 77 | |||||||||||||||||||||||||||||||||||||||
| Restructuring | 50 | 32 | — | 82 | (1) | (1) | — | (2) | |||||||||||||||||||||||||||||||||||||||
| Operating income | $ | 306 | $ | 514 | |||||||||||||||||||||||||||||||||||||||||||
| Operating margin | 23.7 | % | 33.4 | % | |||||||||||||||||||||||||||||||||||||||||||
| Year Ended December 31, | |||||||||||||||||||||||||||||||||||||||||||||||
| 2022 | 2021 | ||||||||||||||||||||||||||||||||||||||||||||||
| Amounts in millions | MIS | MA | Eliminations | Consolidated | MIS | MA | Eliminations | Consolidated | |||||||||||||||||||||||||||||||||||||||
| Total external revenue | $ | 2,699 | $ | 2,769 | $ | — | $ | 5,468 | $ | 3,812 | $ | 2,406 | $ | — | $ | 6,218 | |||||||||||||||||||||||||||||||
| Intersegment revenue | 174 | 8 | (182) | — | 165 | 7 | (172) | — | |||||||||||||||||||||||||||||||||||||||
| Total revenue | 2,873 | 2,777 | (182) | 5,468 | 3,977 | 2,413 | (172) | 6,218 | |||||||||||||||||||||||||||||||||||||||
| Operating, SG&A | 1,385 | 1,937 | (182) | 3,140 | 1,503 | 1,786 | (172) | 3,117 | |||||||||||||||||||||||||||||||||||||||
| Adjusted Operating Income | $ | 1,488 | $ | 840 | $ | — | $ | 2,328 | $ | 2,474 | $ | 627 | $ | — | $ | 3,101 | |||||||||||||||||||||||||||||||
| Adjusted Operating Margin | 51.8 | % | 30.2 | % | 42.6 | % | 62.2 | % | 26.0 | % | 49.9 | % | |||||||||||||||||||||||||||||||||||
| Depreciation and amortization | 81 | 250 | — | 331 | 72 | 185 | — | 257 | |||||||||||||||||||||||||||||||||||||||
| Restructuring | 65 | 49 | — | 114 | (1) | 1 | — | — | |||||||||||||||||||||||||||||||||||||||
| Operating income | $ | 1,883 | $ | 2,844 | |||||||||||||||||||||||||||||||||||||||||||
| Operating margin | 34.4 | % | 45.7 | % | |||||||||||||||||||||||||||||||||||||||||||
Three Months Ended December 31, |
|||||||||||||||||||||||||||||||||||
| 2022 | 2021 | ||||||||||||||||||||||||||||||||||
| Amounts in millions | Transaction | Recurring | Total | Transaction | Recurring | Total | |||||||||||||||||||||||||||||
| Corporate Finance | $ | 127 | $ | 126 | $ | 253 | $ | 320 | $ | 124 | $ | 444 | |||||||||||||||||||||||
| 50 | % | 50 | % | 100 | % | 72 | % | 28 | % | 100 | % | ||||||||||||||||||||||||
| Structured Finance | $ | 45 | $ | 49 | $ | 94 | $ | 111 | $ | 50 | $ | 161 | |||||||||||||||||||||||
| 48 | % | 52 | % | 100 | % | 69 | % | 31 | % | 100 | % | ||||||||||||||||||||||||
| Financial Institutions | $ | 52 | $ | 71 | $ | 123 | $ | 68 | $ | 69 | $ | 137 | |||||||||||||||||||||||
| 42 | % | 58 | % | 100 | % | 50 | % | 50 | % | 100 | % | ||||||||||||||||||||||||
| Public, Project and Infrastructure Finance | $ | 52 | $ | 42 | $ | 94 | $ | 78 | $ | 40 | $ | 118 | |||||||||||||||||||||||
| 55 | % | 45 | % | 100 | % | 66 | % | 34 | % | 100 | % | ||||||||||||||||||||||||
| MIS Other | $ | 1 | $ | 11 | $ | 12 | $ | 1 | $ | 10 | $ | 11 | |||||||||||||||||||||||
| 8 | % | 92 | % | 100 | % | 9 | % | 91 | % | 100 | % | ||||||||||||||||||||||||
| Total MIS | $ | 277 | $ | 299 | $ | 576 | $ | 578 | $ | 293 | $ | 871 | |||||||||||||||||||||||
| 48 | % | 52 | % | 100 | % | 66 | % | 34 | % | 100 | % | ||||||||||||||||||||||||
| Decision Solutions | $ | 44 | $ | 309 | $ | 353 | $ | 47 | $ | 267 | $ | 314 | |||||||||||||||||||||||
| 12 | % | 88 | % | 100 | % | 15 | % | 85 | % | 100 | % | ||||||||||||||||||||||||
| Research & Insights | $ | 2 | $ | 179 | $ | 181 | $ | 2 | $ | 172 | $ | 174 | |||||||||||||||||||||||
| 1 | % | 99 | % | 100 | % | 1 | % | 99 | % | 100 | % | ||||||||||||||||||||||||
| Data & Information | $ | — | $ | 180 | $ | 180 | $ | 1 | $ | 179 | $ | 180 | |||||||||||||||||||||||
| — | % | 100 | % | 100 | % | 1 | % | 99 | % | 100 | % | ||||||||||||||||||||||||
| Total MA | $ | 46 | $ | 668 | $ | 714 | $ | 50 | $ | 618 | $ | 668 | |||||||||||||||||||||||
| 6 | % | 94 | % | 100 | % | 7 | % | 93 | % | 100 | % | ||||||||||||||||||||||||
| Total Moody's Corporation | $ | 323 | $ | 967 | $ | 1,290 | $ | 628 | $ | 911 | $ | 1,539 | |||||||||||||||||||||||
| 25 | % | 75 | % | 100 | % | 41 | % | 59 | % | 100 | % | ||||||||||||||||||||||||
| Year Ended December 31, | |||||||||||||||||||||||||||||||||||
| 2022 | 2021 | ||||||||||||||||||||||||||||||||||
| Amounts in millions | Transaction | Relationship | Total | Transaction | Relationship | Total | |||||||||||||||||||||||||||||
| Corporate Finance | $ | 772 | $ | 497 | $ | 1,269 | $ | 1,600 | $ | 487 | $ | 2,087 | |||||||||||||||||||||||
| 61 | % | 39 | % | 100 | % | 77 | % | 23 | % | 100 | % | ||||||||||||||||||||||||
| Structured Finance | $ | 262 | $ | 200 | $ | 462 | $ | 362 | $ | 198 | $ | 560 | |||||||||||||||||||||||
| 57 | % | 43 | % | 100 | % | 65 | % | 35 | % | 100 | % | ||||||||||||||||||||||||
| Financial Institutions | $ | 211 | $ | 280 | $ | 491 | $ | 320 | $ | 282 | $ | 602 | |||||||||||||||||||||||
| 43 | % | 57 | % | 100 | % | 53 | % | 47 | % | 100 | % | ||||||||||||||||||||||||
| Public, Project and Infrastructure Finance | $ | 263 | $ | 168 | $ | 431 | $ | 354 | $ | 167 | $ | 521 | |||||||||||||||||||||||
| 61 | % | 39 | % | 100 | % | 68 | % | 32 | % | 100 | % | ||||||||||||||||||||||||
| MIS Other | $ | 4 | $ | 42 | $ | 46 | $ | 4 | $ | 38 | $ | 42 | |||||||||||||||||||||||
| 9 | % | 91 | % | 100 | % | 10 | % | 90 | % | 100 | % | ||||||||||||||||||||||||
| Total MIS | $ | 1,512 | $ | 1,187 | $ | 2,699 | $ | 2,640 | $ | 1,172 | $ | 3,812 | |||||||||||||||||||||||
| 56 | % | 44 | % | 100 | % | 69 | % | 31 | % | 100 | % | ||||||||||||||||||||||||
| Decision Solutions | $ | 164 | $ | 1,160 | $ | 1,324 | $ | 158 | $ | 853 | $ | 1,011 | |||||||||||||||||||||||
| 12 | % | 88 | % | 100 | % | 16 | % | 84 | % | 100 | % | ||||||||||||||||||||||||
| Research & Insights | $ | 6 | $ | 727 | $ | 733 | $ | 8 | $ | 689 | $ | 697 | |||||||||||||||||||||||
| 1 | % | 99 | % | 100 | % | 1 | % | 99 | % | 100 | % | ||||||||||||||||||||||||
| Data & Information | $ | — | $ | 712 | $ | 712 | $ | 4 | $ | 694 | $ | 698 | |||||||||||||||||||||||
| — | % | 100 | % | 100 | % | 1 | % | 99 | % | 100 | % | ||||||||||||||||||||||||
| Total MA | $ | 170 | $ | 2,599 | $ | 2,769 | $ | 170 | $ | 2,236 | $ | 2,406 | |||||||||||||||||||||||
| 6 | % | 94 | % | 100 | % | 7 | % | 93 | % | 100 | % | ||||||||||||||||||||||||
| Total Moody's Corporation | $ | 1,682 | $ | 3,786 | $ | 5,468 | $ | 2,810 | $ | 3,408 | $ | 6,218 | |||||||||||||||||||||||
| 31 | % | 69 | % | 100 | % | 45 | % | 55 | % | 100 | % | ||||||||||||||||||||||||
Three Months Ended December 31, |
Year Ended December 31, | ||||||||||||||||||||||
| Amounts in millions | 2022 | 2021 | 2022 | 2021 | |||||||||||||||||||
| Operating income | $ | 306 | $ | 514 | $ | 1,883 | $ | 2,844 | |||||||||||||||
| Depreciation and amortization | 89 | 77 | 331 | 257 | |||||||||||||||||||
| Restructuring | 82 | (2) | 114 | — | |||||||||||||||||||
| Adjusted Operating Income | $ | 477 | $ | 589 | $ | 2,328 | $ | 3,101 | |||||||||||||||
| Operating margin | 23.7 | % | 33.4 | % | 34.4 | % | 45.7 | % | |||||||||||||||
| Adjusted Operating Margin | 37.0 | % | 38.3 | % | 42.6 | % | 49.9 | % | |||||||||||||||
| Year Ended December 31, | |||||||||||
| Amounts in millions | 2022 | 2021 | |||||||||
| Net cash provided by operating activities | $ | 1,474 | $ | 2,005 | |||||||
| Capital additions | (283) | (139) | |||||||||
| Free Cash Flow | $ | 1,191 | $ | 1,866 | |||||||
| Net cash used in investing activities | $ | (262) | $ | (2,619) | |||||||
| Net cash used in financing activities | $ | (1,208) | $ | (122) | |||||||
Three Months Ended December 31, |
Year Ended December 31, | ||||||||||||||||||||||||||||||||||||||||||||||
| Amounts in millions | 2022 | 2021 | Change | Growth | 2022 | 2021 | Change | Growth | |||||||||||||||||||||||||||||||||||||||
| MCO revenue | $ | 1,290 | $ | 1,539 | $ | (249) | (16)% | $ | 5,468 | $ | 6,218 | $ | (750) | (12)% | |||||||||||||||||||||||||||||||||
| FX impact | 51 | — | 51 | 193 | — | 193 | |||||||||||||||||||||||||||||||||||||||||
| Inorganic revenue from acquisitions | (4) | — | (4) | (236) | — | (236) | |||||||||||||||||||||||||||||||||||||||||
Organic constant currency MCO revenue |
$ | 1,337 | $ | 1,539 | $ | (202) | (13)% | $ | 5,425 | $ | 6,218 | $ | (793) | (13)% | |||||||||||||||||||||||||||||||||
| MA revenue | $ | 714 | $ | 668 | $ | 46 | 7% | $ | 2,769 | $ | 2,406 | $ | 363 | 15% | |||||||||||||||||||||||||||||||||
| FX impact | 32 | — | 32 | 113 | — | 113 | |||||||||||||||||||||||||||||||||||||||||
| Inorganic revenue from acquisitions | (4) | — | (4) | (236) | — | (236) | |||||||||||||||||||||||||||||||||||||||||
Organic constant currency MA revenue |
$ | 742 | $ | 668 | $ | 74 | 11% | $ | 2,646 | $ | 2,406 | $ | 240 | 10% | |||||||||||||||||||||||||||||||||
| Decision Solutions revenue | $ | 353 | $ | 314 | $ | 39 | 12% | $ | 1,324 | $ | 1,011 | $ | 313 | 31% | |||||||||||||||||||||||||||||||||
| FX impact | 12 | — | 12 | 40 | — | 40 | |||||||||||||||||||||||||||||||||||||||||
| Inorganic revenue from acquisitions | (4) | — | (4) | (234) | — | (234) | |||||||||||||||||||||||||||||||||||||||||
Organic constant currency Decision Solutions revenue |
$ | 361 | $ | 314 | $ | 47 | 15% | $ | 1,130 | $ | 1,011 | $ | 119 | 12% | |||||||||||||||||||||||||||||||||
| Research and Insights revenue | $ | 181 | $ | 174 | $ | 7 | 4% | $ | 733 | $ | 697 | $ | 36 | 5% | |||||||||||||||||||||||||||||||||
| FX impact | 6 | — | 6 | 21 | — | 21 | |||||||||||||||||||||||||||||||||||||||||
Constant currency Research and Insights revenue |
$ | 187 | $ | 174 | $ | 13 | 7% | $ | 754 | $ | 697 | $ | 57 | 8% | |||||||||||||||||||||||||||||||||
| Data and Information revenue | $ | 180 | $ | 180 | $ | — | —% | $ | 712 | $ | 698 | $ | 14 | 2% | |||||||||||||||||||||||||||||||||
| FX impact | 14 | — | 14 | 52 | — | 52 | |||||||||||||||||||||||||||||||||||||||||
| Inorganic revenue from acquisitions | — | — | — | (2) | — | (2) | |||||||||||||||||||||||||||||||||||||||||
Organic constant currency Data and Information revenue |
$ | 194 | $ | 180 | $ | 14 | 8% | $ | 762 | $ | 698 | $ | 64 | 9% | |||||||||||||||||||||||||||||||||
| MA recurring revenue | $ | 668 | $ | 618 | $ | 50 | 8% | $ | 2,599 | $ | 2,236 | $ | 363 | 16% | |||||||||||||||||||||||||||||||||
| FX impact | 31 | — | 31 | 108 | — | 108 | |||||||||||||||||||||||||||||||||||||||||
| Inorganic recurring revenue from acquisitions | (3) | — | (3) | (223) | — | (223) | |||||||||||||||||||||||||||||||||||||||||
Organic constant currency MA recurring revenue |
$ | 696 | $ | 618 | $ | 78 | 13% | $ | 2,484 | $ | 2,236 | $ | 248 | 11% | |||||||||||||||||||||||||||||||||
| Amounts in millions | December 31, 2022 | December 31, 2021 | Change | Growth | |||||||||||||||||||
| MA ARR | |||||||||||||||||||||||
| Decision Solutions | $ | 1,235 | $ | 1,110 | $ | 125 | 11% | ||||||||||||||||
| Research and Insights | 770 | 707 | 63 | 9% | |||||||||||||||||||
| Data and Information | 768 | 705 | 63 | 9% | |||||||||||||||||||
| Total MA ARR | $ | 2,773 | $ | 2,522 | $ | 251 | 10% | ||||||||||||||||
Three Months Ended December 31, |
Year Ended December 31, | ||||||||||||||||||||||||||||||||||
| Amounts in millions | 2022 | 2021 | 2022 | 2021 | |||||||||||||||||||||||||||||||
| Net income attributable to Moody's common shareholders | $ | 246 | $ | 427 | $ | 1,374 | $ | 2,214 | |||||||||||||||||||||||||||
| Pre-tax Acquisition-Related Intangible Amortization Expenses | $ | 50 | $ | 50 | $ | 200 | $ | 158 | |||||||||||||||||||||||||||
| Tax on Acquisition-Related Intangible Amortization Expenses | (12) | (12) | (47) | (36) | |||||||||||||||||||||||||||||||
| Net Acquisition-Related Intangible Amortization Expenses | 38 | 38 | 153 | 122 | |||||||||||||||||||||||||||||||
| Pre-tax restructuring | $ | 82 | $ | (2) | $ | 114 | $ | — | |||||||||||||||||||||||||||
| Tax on restructuring | (18) | — | (26) | — | |||||||||||||||||||||||||||||||
| Net restructuring | 64 | (2) | 88 | — | |||||||||||||||||||||||||||||||
| Pre-tax gain on extinguishment of debt | $ | (70) | $ | — | $ | (70) | $ | — | |||||||||||||||||||||||||||
| Tax on gain on extinguishment of debt | 17 | — | 17 | — | |||||||||||||||||||||||||||||||
| Net gain on extinguishment of debt | (53) | — | (53) | — | |||||||||||||||||||||||||||||||
FX losses resulting from the Company no longer conducting commercial operations in Russia |
— | — | 20 | — | |||||||||||||||||||||||||||||||
| Pre-tax non-cash gain relating to minority investment in BitSight | $ | — | $ | (36) | $ | — | $ | (36) | |||||||||||||||||||||||||||
| Tax on non-cash gain relating to minority investment in BitSight | — | 9 | — | 9 | |||||||||||||||||||||||||||||||
| Net non-cash gain relating to minority investment in BitSight | — | (27) | — | (27) | |||||||||||||||||||||||||||||||
| Adjusted Net Income | $ | 295 | $ | 436 | $ | 1,582 | $ | 2,309 | |||||||||||||||||||||||||||
| Note: The tax impacts in the table above were calculated using tax rates in effect in the jurisdiction for which the item relates. | ||||||||||||||
Three Months Ended December 31, |
Year Ended December 31, | ||||||||||||||||||||||||||||||||||
| Amounts in millions | 2022 | 2021 | 2022 | 2021 | |||||||||||||||||||||||||||||||
| Diluted earnings per share attributable to Moody's common shareholders | $ | 1.34 | $ | 2.28 | $ | 7.44 | $ | 11.78 | |||||||||||||||||||||||||||
| Pre-tax Acquisition-Related Intangible Amortization Expenses | $ | 0.27 | $ | 0.27 | $ | 1.08 | $ | 0.84 | |||||||||||||||||||||||||||
| Tax on Acquisition-Related Intangible Amortization Expenses | (0.07) | (0.07) | (0.25) | (0.19) | |||||||||||||||||||||||||||||||
| Net Acquisition-Related Intangible Amortization Expenses | 0.20 | 0.20 | 0.83 | 0.65 | |||||||||||||||||||||||||||||||
| Pre-tax restructuring | $ | 0.45 | $ | (0.01) | $ | 0.62 | $ | — | |||||||||||||||||||||||||||
| Tax on restructuring | (0.10) | — | (0.14) | — | |||||||||||||||||||||||||||||||
| Net restructuring | 0.35 | (0.01) | 0.48 | — | |||||||||||||||||||||||||||||||
| Pre-Tax gain on extinguishment of debt | $ | (0.38) | $ | — | $ | (0.38) | $ | — | |||||||||||||||||||||||||||
| Tax on gain on extinguishment of debt | 0.09 | — | 0.09 | — | |||||||||||||||||||||||||||||||
| Net gain on extinguishment of debt | (0.29) | — | (0.29) | — | |||||||||||||||||||||||||||||||
FX losses resulting from the Company no longer conducting commercial operations in Russia |
— | — | 0.11 | — | |||||||||||||||||||||||||||||||
| Pre-Tax non-cash gain relating to minority investment in BitSight | $ | — | $ | (0.19) | $ | — | $ | (0.19) | |||||||||||||||||||||||||||
| Tax on non-cash gain relating to minority investment in BitSight | — | 0.05 | — | 0.05 | |||||||||||||||||||||||||||||||
| Net non-cash gain relating to minority investment in BitSight | — | (0.14) | — | (0.14) | |||||||||||||||||||||||||||||||
| Adjusted Diluted EPS | $ | 1.60 | $ | 2.33 | $ | 8.57 | $ | 12.29 | |||||||||||||||||||||||||||
| Note: The tax impacts in the table above were calculated using tax rates in effect in the jurisdiction for which the item relates. | ||
Full Year 2023 Moody's Corporation Guidance as of January 31, 2023 | |||||
| MOODY'S CORPORATION | Current guidance | ||||
| Revenue | Increase in the mid-to-high-single-digit percent range | ||||
| Operating expenses | Increase in the low-single-digit percent range | ||||
| Operating margin | Approximately 37% | ||||
Adjusted Operating Margin (1) |
44% to 45% | ||||
| Interest expense, net | $290 to $310 million | ||||
| Effective tax rate | 20% to 22% | ||||
| Diluted EPS | $8.05 to $8.55 | ||||
Adjusted Diluted EPS (1) |
$9.00 to $9.50 | ||||
| Operating cash flow | $1.7 to $1.9 billion | ||||
Free Cash Flow (1) |
$1.4 to $1.6 billion | ||||
| Share repurchases | Approximately $250 million (subject to available cash, market conditions, M&A opportunities and other ongoing capital allocation decisions) |
||||
| Moody's Investors Service (MIS) | Current guidance | ||||
| MIS global revenue | Increase in the low-to-mid-single-digit percent range | ||||
| MIS Adjusted Operating Margin | Mid-50s percent range | ||||
| Moody's Analytics (MA) | Current guidance | ||||
| MA global revenue | Increase of approximately 10% | ||||
ARR (2) |
Increase in the low-double-digit percent range | ||||
| MA Adjusted Operating Margin | Approximately 31% | ||||
|
(1) These metrics are adjusted measures. See below for reconciliation of these measures to their comparable U.S. GAAP measure.
(2) Refer to Table 9 within this earnings release for the definition of and further information on the ARR metric.
| |||||
| Projected for the Year Ended December 31, 2023 |
|||||
| Operating margin guidance | Approximately 37% |
||||
| Depreciation and amortization | Approximately 7% | ||||
| Restructuring Expense | Approximately 0.5% | ||||
| Adjusted Operating Margin guidance | 44% to 45% |
||||
| Projected for the Year Ended December 31, 2023 |
|||||
| Operating cash flow guidance | $1.7 to $1.9 billion |
||||
| Less: Capital expenditures | Approximately $0.3 billion | ||||
| Free Cash Flow guidance | $1.4 to $1.6 billion |
||||
| Projected for the Year Ended December 31, 2023 |
|||||
| Diluted EPS guidance | $8.05 to $8.55 |
||||
| Acquisition-Related Intangible Amortization | Approximately $0.85 | ||||
| Restructuring | Approximately $0.10 | ||||
| Adjusted Diluted EPS guidance | $9.00 to $9.50 |
||||