| Delaware | 001-16441 | 76-0470458 | |||||||||||||||||||||
| (State or other jurisdiction of incorporation) |
(Commission File Number) | (IRS Employer Identification No.) | |||||||||||||||||||||
| (Former name or former address, if changed since last report.) | ||
| ☐ | Written communications pursuant to Rule 425 under the Securities Act (17 CFR 230.425) | |||||||
| ☐ | Soliciting material pursuant to Rule 14a-12 under the Exchange Act (17 CFR 240.14a-12) | |||||||
| ☐ | Pre-commencement communications pursuant to Rule 14d-2(b) under the Exchange Act (17 CFR 240.14d-2(b)) | |||||||
| ☐ | Pre-commencement communications pursuant to Rule 13e-4(c) under the Exchange Act (17 CFR 240.13e-4(c)) | |||||||
| Title of each class | Trading Symbol(s) | Name of each exchange on which registered | ||||||
| Common Stock, $0.01 par value | CCI | New York Stock Exchange | ||||||
| Exhibit No. | Description | |||||||
| 99.1 | ||||||||
| 99.2 | ||||||||
| 104 | Cover Page Interactive Data File - the cover page XBRL tags are embedded within the Inline XBRL document | |||||||
| CROWN CASTLE INC. | ||||||||||||||
| By: | /s/ Edward B. Adams, Jr. | |||||||||||||
| Name: | Edward B. Adams, Jr. | |||||||||||||
| Title: | Executive Vice President and General Counsel |
|||||||||||||
 |
NEWS RELEASE October 22, 2025 |
|||||||
Contacts: Sunit Patel, CFO |
|||||
| Kris Hinson, VP Corp Finance & Treasurer | |||||
FOR IMMEDIATE RELEASE |
Crown Castle Inc. | ||||
713-570-3050 |
|||||
| (dollars in millions, except per share amounts) | Current Full Year 2025 Outlook Midpoint(a) |
Full Year 2024 Actual | % Change |
Previous Full Year 2025 Outlook(b) |
Current Compared to Previous Outlook | ||||||||||||
Site rental revenues(c) |
$4,030 | $4,268 | (6)% | $4,020 | $10 | ||||||||||||
| Net income (loss) | $285 | $(3,903) | N/A | $240 | $45 | ||||||||||||
| Net income (loss) per share—diluted | $0.65 | $(8.98) | N/A | $0.55 | $0.10 | ||||||||||||
Adjusted EBITDA(c)(d) |
$2,835 | $3,035 | (7)% | $2,805 | $30 | ||||||||||||
AFFO(c)(d) |
$1,870 | $1,980 | (6)% | $1,830 | $40 | ||||||||||||
AFFO per share(c)(d) |
$4.29 | $4.55 | (6)% | $4.20 | $0.09 | ||||||||||||
| News Release continued: | Page 2 |
|||||||
| (dollars in millions, except per share amounts) | Q3 2025 | Q3 2024 | Change | % Change | |||||||||||||
Site rental revenues(a) |
$1,012 | $1,066 | $(54) | (5)% | |||||||||||||
| Net income (loss) | $323 | $303 | $20 | 7% | |||||||||||||
| Net income (loss) per share—diluted | $0.74 | $0.70 | $0.04 | 6% | |||||||||||||
Adjusted EBITDA(a)(b) |
$718 | $777 | $(59) | (8)% | |||||||||||||
AFFO(a)(b) |
$490 | $525 | $(35) | (7)% | |||||||||||||
AFFO per share(a)(b) |
$1.12 | $1.20 | $(0.08) | (7)% | |||||||||||||
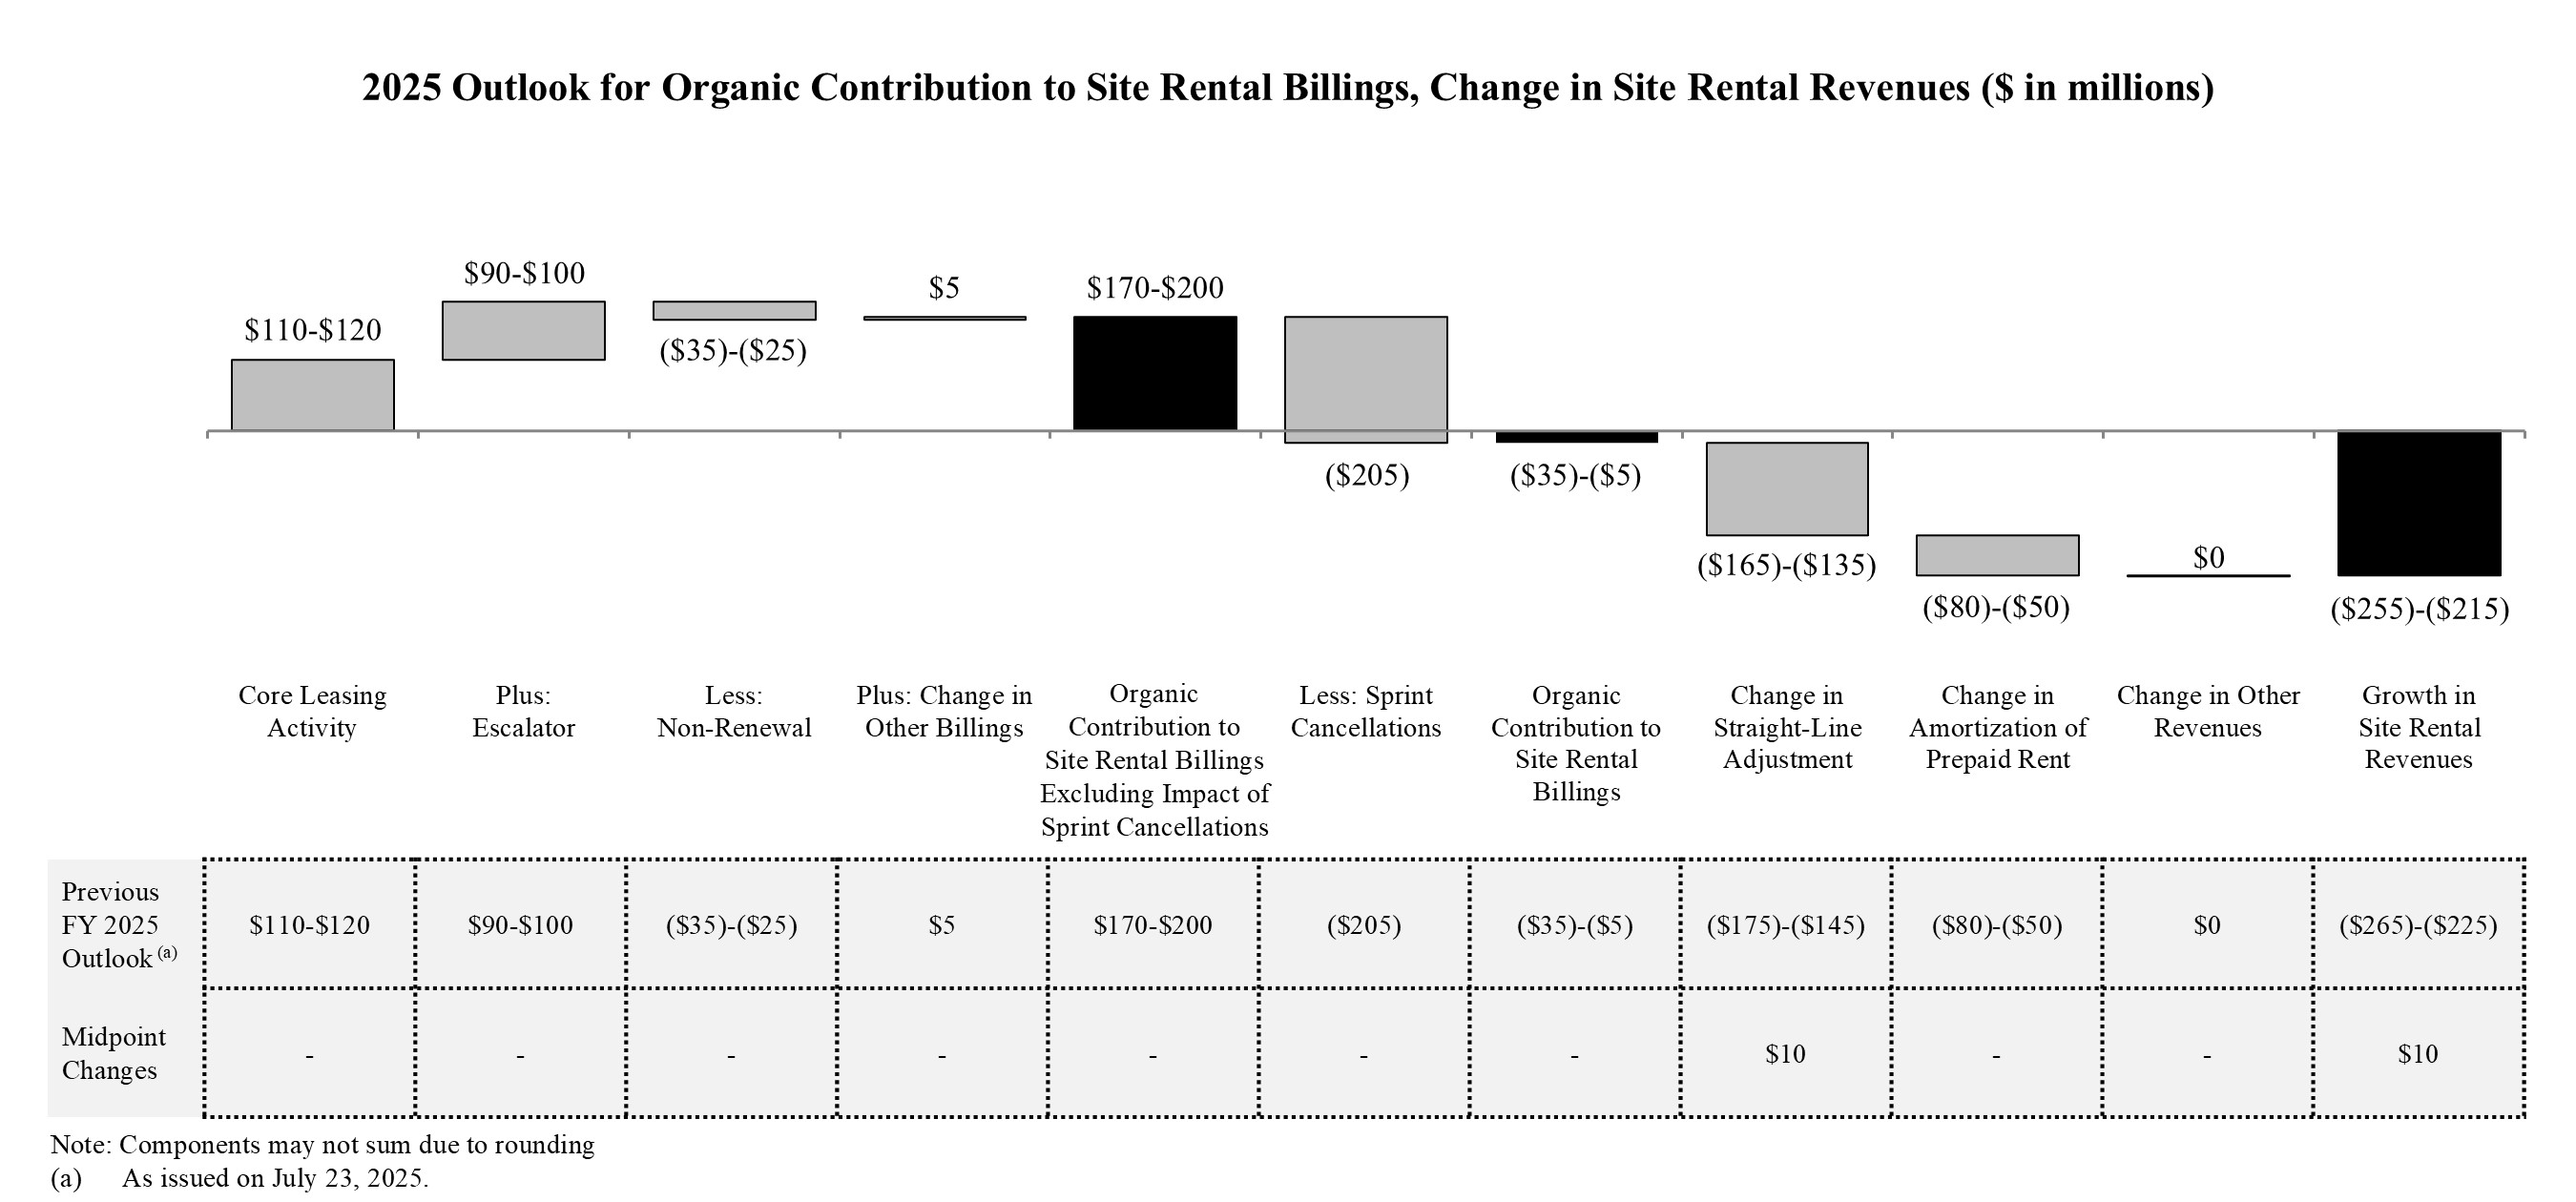
($ in millions; totals may not sum due to rounding) |
Current Full Year 2025 Outlook Midpoint(a) |
Q3 2025 | Q3 2024 | ||||||||||||||||||||||||||
Core leasing activity(b) |
$115 | 2.9% | $33 | 3.3% | $27 | 2.9% | |||||||||||||||||||||||
Escalators |
$95 |
2.4% | $24 | 2.5% | $23 | 2.5% | |||||||||||||||||||||||
Non-renewals(b) |
($30) |
(0.8)% | $(7) | (0.7)% | $(8) | (0.8)% | |||||||||||||||||||||||
Change in other billings(b) |
$5 | 0.1% | $2 | 0.2% | $— | —% | |||||||||||||||||||||||
Organic Contribution to Site Rental Billings as Adjusted for Impact of Sprint Cancellations(b) |
$185 | 4.7% | $52 | 5.2% | $43 | 4.5% | |||||||||||||||||||||||
| News Release continued: | Page 3 |
|||||||
| News Release continued: | Page 4 |
|||||||
| (in millions, except per share amounts) | Full Year 2025(a) |
Changes to Midpoint from Previous Outlook(b) |
||||||||||||||||||
Site rental billings(c) |
$3,895 | to | $3,925 | $— | ||||||||||||||||
| Amortization of prepaid rent | $80 | to | $110 | $— | ||||||||||||||||
| Straight-lined revenues | ($5) | to | $25 | $10 | ||||||||||||||||
Other revenues |
$15 | to | $15 | $— | ||||||||||||||||
| Site rental revenues | $4,007 | to | $4,052 | $10 | ||||||||||||||||
Site rental costs of operations(d) |
$967 | to | $1,012 | ($5) | ||||||||||||||||
| Services and other gross margin | $80 | to | $110 | $5 | ||||||||||||||||
Net income (loss)(e) |
$145 | to | $425 | $45 | ||||||||||||||||
Net income (loss) per share—diluted(e) |
$0.33 | to | $0.97 | $0.10 | ||||||||||||||||
Adjusted EBITDA(c) |
$2,810 | to | $2,860 | $30 | ||||||||||||||||
| Depreciation, amortization and accretion | $678 | to | $773 | $— | ||||||||||||||||
Interest expense and amortization of deferred financing costs, net(f) |
$957 | to | $1,002 | ($15) | ||||||||||||||||
Income (loss) from discontinued operations, net of tax(g) |
($830) | to | ($590) | $— | ||||||||||||||||
FFO(c) |
$1,690 | to | $1,720 | $45 | ||||||||||||||||
AFFO(c) |
$1,845 | to | $1,895 | $40 | ||||||||||||||||
AFFO per share(c) |
$4.23 | to | $4.35 | $0.09 | ||||||||||||||||
Discretionary capital expenditures(c) |
$155 | to | $155 | ($30) | ||||||||||||||||
Discretionary capital expenditures from discontinued operations(c)(h) |
$920 | to | $1,020 | $— | ||||||||||||||||
| News Release continued: | Page 5 |
|||||||
| News Release continued: | Page 6 |
|||||||
| News Release continued: | Page 7 |
|||||||
| News Release continued: | Page 8 |
|||||||
| News Release continued: | Page 9 |
|||||||
For the Three Months Ended |
For the Nine Months Ended |
For the Twelve Months Ended |
|||||||||||||||||||||||||||
(in millions; totals may not sum due to rounding) |
September 30, 2025 | September 30, 2024 | September 30, 2025 | September 30, 2024 | December 31, 2024 | ||||||||||||||||||||||||
Net income (loss)(a) |
$ | 323 | $ | 303 | $ | 150 | $ | 865 | $ | (3,903) | |||||||||||||||||||
| Adjustments to increase (decrease) net income (loss): | |||||||||||||||||||||||||||||
| Asset write-down charges | 3 | 2 | 7 | 10 | 11 | ||||||||||||||||||||||||
| Depreciation, amortization and accretion | 167 | 181 | 520 | 552 | 736 | ||||||||||||||||||||||||
Restructuring charges(b) |
— | 38 | — | 67 | 70 | ||||||||||||||||||||||||
| Amortization of prepaid lease purchase price adjustments | 4 | 4 | 11 | 12 | 16 | ||||||||||||||||||||||||
Interest expense and amortization of deferred financing costs, net(c) |
247 | 236 | 726 | 692 | 932 | ||||||||||||||||||||||||
| Interest income | (3) | (6) | (10) | (14) | (20) | ||||||||||||||||||||||||
| Other (income) expense | — | 5 | (3) | 3 | 26 | ||||||||||||||||||||||||
| (Benefit) provision for income taxes | 4 | 3 | 13 | 14 | 18 | ||||||||||||||||||||||||
| Stock-based compensation expense, net | 19 | 19 | 55 | 69 | 84 | ||||||||||||||||||||||||
(Income) loss from discontinued operations, net of tax(d) |
(46) | (9) | 676 | (12) | 5,065 | ||||||||||||||||||||||||
Adjusted EBITDA(e)(f) |
$ | 718 | $ | 777 | $ | 2,145 | $ | 2,258 | $ | 3,035 | |||||||||||||||||||
| Full Year 2025 | |||||||||||
(in millions; totals may not sum due to rounding) |
Outlook(g) |
||||||||||
Net income (loss)(a) |
$145 | to | $425 | ||||||||
| Adjustments to increase (decrease) net income (loss): | |||||||||||
Asset write-down charges |
5 | to | 15 | ||||||||
| Acquisition and integration costs | — | to | 6 | ||||||||
| Depreciation, amortization and accretion | 678 | to | 773 | ||||||||
| Amortization of prepaid lease purchase price adjustments | 14 | to | 16 | ||||||||
Interest expense and amortization of deferred financing costs, net(h) |
957 | to | 1,002 | ||||||||
| (Gains) losses on retirement of long-term obligations | — | to | — | ||||||||
| Interest income | (15) | to | (15) | ||||||||
| Other (income) expense | 6 | to | 15 | ||||||||
| (Benefit) provision for income taxes | 11 | to | 19 | ||||||||
| Stock-based compensation expense, net | 78 | to | 82 | ||||||||
(Income) loss from discontinued operations, net of tax(i) |
590 | to |
830 | ||||||||
Adjusted EBITDA(e)(f) |
$2,810 | to | $2,860 | ||||||||
| News Release continued: | Page 10 |
|||||||
For the Three Months Ended |
For the Nine Months Ended |
For the Twelve Months Ended | |||||||||||||||||||||||||||
(in millions; totals may not sum due to rounding) |
September 30, 2025 | September 30, 2024 | September 30, 2025 | September 30, 2024 | December 31, 2024 | ||||||||||||||||||||||||
Net income (loss)(a) |
$ | 323 | $ | 303 | $ | 150 | $ | 865 | $ | (3,903) | |||||||||||||||||||
| Real estate related depreciation, amortization and accretion | 163 | 170 | 489 | 517 | 690 | ||||||||||||||||||||||||
| Asset write-down charges | 3 | 2 | 7 | 10 | 11 | ||||||||||||||||||||||||
(Income) loss from discontinued operations, net of tax(b) |
(46) | (9) | 676 | (12) | 5,065 | ||||||||||||||||||||||||
FFO(c)(d) |
$ | 443 | $ | 466 | $ | 1,322 | $ | 1,380 | $ | 1,863 | |||||||||||||||||||
| Weighted-average common shares outstanding—diluted | 437 | 436 | 436 | 435 | 434 | ||||||||||||||||||||||||
| FFO (from above) | $ | 443 | $ | 466 | $ | 1,322 | $ | 1,380 | $ | 1,863 | |||||||||||||||||||
| Adjustments to increase (decrease) FFO: | |||||||||||||||||||||||||||||
| Straight-lined revenues | 11 | (28) | (27) | (140) | (160) | ||||||||||||||||||||||||
| Straight-lined expenses | 15 | 16 | 44 | 49 | 65 | ||||||||||||||||||||||||
| Stock-based compensation expense, net | 19 | 19 | 55 | 69 | 84 | ||||||||||||||||||||||||
| Non-cash portion of tax provision | 2 | — | 2 | 6 | 8 | ||||||||||||||||||||||||
| Non-real estate related depreciation, amortization and accretion | 4 | 11 | 31 | 35 | 46 | ||||||||||||||||||||||||
| Amortization of non-cash interest expense | 3 | 2 | 11 | 8 | 12 | ||||||||||||||||||||||||
| Other (income) expense | — | 5 | (3) | 3 | 26 | ||||||||||||||||||||||||
Restructuring charges(e) |
— | 38 | — | 67 | 70 | ||||||||||||||||||||||||
| Sustaining capital expenditures | (6) | (6) | (19) | (22) | (34) | ||||||||||||||||||||||||
AFFO(c)(d) |
$ | 490 | $ | 525 | $ | 1,414 | $ | 1,457 | $ | 1,980 | |||||||||||||||||||
| Weighted-average common shares outstanding—diluted | 437 | 436 | 436 | 435 | 434 | ||||||||||||||||||||||||
| News Release continued: | Page 11 |
|||||||
For the Three Months Ended |
For the Nine Months Ended |
For the Twelve Months Ended | |||||||||||||||||||||||||||
(in millions, except per share amounts; totals may not sum due to rounding) |
September 30, 2025 | September 30, 2024 | September 30, 2025 | September 30, 2024 | December 31, 2024 | ||||||||||||||||||||||||
Net income (loss)(a) |
$ | 0.74 | $ | 0.70 | $ | 0.34 | $ | 1.99 | $ | (8.98) | |||||||||||||||||||
| Real estate related depreciation, amortization and accretion | 0.37 | 0.39 | 1.12 | 1.19 | 1.59 | ||||||||||||||||||||||||
| Asset write-down charges | 0.01 | — | 0.02 | 0.02 | 0.03 | ||||||||||||||||||||||||
(Income) loss from discontinued operations, net of tax(b) |
(0.11) | (0.02) | 1.55 | (0.03) | 11.64 | ||||||||||||||||||||||||
FFO(c)(d) |
$ | 1.01 | $ | 1.07 | $ | 3.03 | $ | 3.17 | $ | 4.28 | |||||||||||||||||||
| Weighted-average common shares outstanding—diluted | 437 | 436 | 436 | 435 | 434 | ||||||||||||||||||||||||
| FFO (from above) | $ | 1.01 | $ | 1.07 | $ | 3.03 | $ | 3.17 | $ | 4.28 | |||||||||||||||||||
| Adjustments to increase (decrease) FFO: | |||||||||||||||||||||||||||||
| Straight-lined revenues | 0.03 | (0.06) | (0.06) | (0.32) | (0.37) | ||||||||||||||||||||||||
| Straight-lined expenses | 0.03 | 0.04 | 0.10 | 0.11 | 0.15 | ||||||||||||||||||||||||
| Stock-based compensation expense, net | 0.04 | 0.04 | 0.13 | 0.16 | 0.20 | ||||||||||||||||||||||||
| Non-cash portion of tax provision | — | — | — | 0.01 | 0.02 | ||||||||||||||||||||||||
| Non-real estate related depreciation, amortization and accretion | 0.01 | 0.03 | 0.07 | 0.08 | 0.11 | ||||||||||||||||||||||||
| Amortization of non-cash interest expense | 0.01 | — | 0.02 | 0.02 | 0.03 | ||||||||||||||||||||||||
| Other (income) expense | — | 0.01 | (0.01) | 0.01 | 0.06 | ||||||||||||||||||||||||
Restructuring charges(e) |
— | 0.09 | — | 0.16 | 0.16 | ||||||||||||||||||||||||
| Sustaining capital expenditures | (0.01) | (0.01) | (0.04) | (0.05) | (0.08) | ||||||||||||||||||||||||
AFFO(c)(d) |
$ | 1.12 | $ | 1.20 | $ | 3.24 | $ | 3.35 | $ | 4.55 | |||||||||||||||||||
| Weighted-average common shares outstanding—diluted | 437 | 436 | 436 | 435 | 434 | ||||||||||||||||||||||||
| News Release continued: | Page 12 |
|||||||
| Full Year 2025 | Full Year 2025 | ||||||||||||||||||||||
(in millions, except per share amounts; totals may not sum due to rounding) |
Outlook(a) |
Outlook per Share(a) |
|||||||||||||||||||||
Net income (loss)(b) |
$145 | to | $425 | $0.33 | to | $0.97 | |||||||||||||||||
| Real estate related depreciation, amortization and accretion | 660 | to | 740 | 1.51 | to | 1.70 | |||||||||||||||||
Asset write-down charges |
5 | to | 15 | 0.01 | to | 0.03 | |||||||||||||||||
(Income) loss from discontinued operations, net of tax(c) |
590 | to |
830 | 1.35 | to |
1.90 | |||||||||||||||||
FFO(d)(e) |
$1,690 | to | $1,720 | $3.88 | to | $3.94 | |||||||||||||||||
| Weighted-average common shares outstanding—diluted | 436 | 436 | |||||||||||||||||||||
| FFO (from above) | $1,690 | to | $1,720 | $3.88 | to | $3.94 | |||||||||||||||||
| Adjustments to increase (decrease) FFO: | |||||||||||||||||||||||
| Straight-lined revenues | (25) | to | 5 | (0.06) | to | 0.01 | |||||||||||||||||
| Straight-lined expenses | 55 | to | 75 | 0.13 | to | 0.17 | |||||||||||||||||
| Stock-based compensation expense, net | 78 | to | 82 | 0.18 | to | 0.19 | |||||||||||||||||
| Non-cash portion of tax provision | (8) | to | 8 | (0.02) | to | 0.02 | |||||||||||||||||
| Non-real estate related depreciation, amortization and accretion | 20 | to | 35 | 0.04 | to | 0.08 | |||||||||||||||||
| Amortization of non-cash interest expense | 7 | to | 17 | 0.02 | to | 0.04 | |||||||||||||||||
| Other (income) expense | 6 | to | 15 | 0.01 | to | 0.03 | |||||||||||||||||
| (Gains) losses on retirement of long-term obligations | — | to | — | — | to | — | |||||||||||||||||
| Acquisition and integration costs | — | to | 6 | — | to | 0.01 | |||||||||||||||||
| Sustaining capital expenditures | (50) | to | (30) | (0.11) | to | (0.07) | |||||||||||||||||
AFFO(d)(e) |
$1,845 | to | $1,895 | $4.23 | to | $4.35 | |||||||||||||||||
| Weighted-average common shares outstanding—diluted | 436 | 436 | |||||||||||||||||||||
| News Release continued: | Page 13 |
|||||||
| Previously Issued | |||||||||||
(in millions; totals may not sum due to rounding) |
Full Year 2025 Outlook(a) |
||||||||||
Net income (loss)(b) |
$100 | to | $380 | ||||||||
Adjustments to increase (decrease) net income (loss): |
|||||||||||
| Asset write-down charges | 5 | to | 15 | ||||||||
| Acquisition and integration costs | — | to | 6 | ||||||||
| Depreciation, amortization and accretion | 678 | to | 773 | ||||||||
| Amortization of prepaid lease purchase price adjustments | 14 | to | 16 | ||||||||
Interest expense and amortization of deferred financing costs, net(c) |
972 | to | 1,017 | ||||||||
| (Gains) losses on retirement of long-term obligations | — | to | — | ||||||||
| Interest income | (15) | to | (15) | ||||||||
| Other (income) expense | 6 | to | 15 | ||||||||
| (Benefit) provision for income taxes | 11 | to | 19 | ||||||||
| Stock-based compensation expense, net | 78 | to | 82 | ||||||||
(Income) loss from discontinued operations, net of tax(d) |
590 | to | 830 | ||||||||
Adjusted EBITDA(e)(f) |
$2,780 | to | $2,830 | ||||||||
| Previously Issued | Previously Issued | ||||||||||||||||||||||
(in millions, except per share amounts; totals may not sum due to rounding) |
Full Year 2025
Outlook(a)
|
Full Year 2025 Outlook
per share(a)
|
|||||||||||||||||||||
Net income (loss)(b) |
$100 | to | $380 | $0.23 | to | $0.87 | |||||||||||||||||
| Real estate related depreciation, amortization and accretion | 660 | to | 740 | 1.51 | to | 1.70 | |||||||||||||||||
| Asset write-down charges | 5 | to | 15 | 0.01 | to | 0.03 | |||||||||||||||||
(Income) loss from discontinued operations, net of tax(d) |
590 | to | 830 | 1.35 | to | 1.90 | |||||||||||||||||
FFO(e)(f) |
$1,645 | to | $1,675 | $3.77 | to | $3.84 | |||||||||||||||||
| Weighted-average common shares outstanding—diluted | 436 | 436 | |||||||||||||||||||||
| FFO (from above) | $1,645 | to | $1,675 | $3.77 | to | $3.84 | |||||||||||||||||
| Adjustments to increase (decrease) FFO: | |||||||||||||||||||||||
| Straight-lined revenues | (15) | to | 15 | (0.03) | to | 0.03 | |||||||||||||||||
| Straight-lined expenses | 55 | to | 75 | 0.13 | to | 0.17 | |||||||||||||||||
| Stock-based compensation expense, net | 78 | to | 82 | 0.18 | to | 0.19 | |||||||||||||||||
| Non-cash portion of tax provision | (8) | to | 8 | (0.02) | to | 0.02 | |||||||||||||||||
| Non-real estate related depreciation, amortization and accretion | 20 | to | 35 | 0.04 | to | 0.08 | |||||||||||||||||
| Amortization of non-cash interest expense | 7 | to | 17 | 0.02 | to | 0.04 | |||||||||||||||||
| Other (income) expense | 6 | to | 15 | 0.01 | to | 0.03 | |||||||||||||||||
| (Gains) losses on retirement of long-term obligations | — | to | — | — | to | — | |||||||||||||||||
| Acquisition and integration costs | — | to | 6 | — | to | 0.01 | |||||||||||||||||
| Sustaining capital expenditures | (55) | to | (35) | (0.13) | to | (0.08) | |||||||||||||||||
AFFO(e)(f) |
$1,805 | to | $1,855 | $4.14 | to | $4.25 | |||||||||||||||||
| Weighted-average common shares outstanding—diluted | 436 | 436 | |||||||||||||||||||||
| News Release continued: | Page 14 |
|||||||
| Three Months Ended September 30, | |||||||||||
(dollars in millions; totals may not sum due to rounding) |
2025 | 2024 | |||||||||
| Components of changes in site rental revenues: | |||||||||||
Prior year site rental billings(b) |
$ | 995 | $ | 952 | |||||||
Core leasing activity(b) |
33 | 27 | |||||||||
| Escalators | 24 | 23 | |||||||||
Non-renewals(b) |
(7) | (8) | |||||||||
Other billings(b) |
2 | — | |||||||||
Organic Contribution to Site Rental Billings as Adjusted for Impact of Sprint Cancellations(b) |
52 | 43 | |||||||||
Non-renewals associated with Sprint Cancellations(b) |
(51) | — | |||||||||
Organic Contribution to Site Rental Billings(b) |
1 | 43 | |||||||||
| Straight-lined revenues | (11) | 28 | |||||||||
| Amortization of prepaid rent | 23 | 39 | |||||||||
Other revenues |
4 | 4 | |||||||||
| Total site rental revenues | $ | 1,012 | $ | 1,066 | |||||||
| Year-over-year changes in revenues: | |||||||||||
| Site rental revenues as a percentage of prior year site rental revenues | (5.1) | % | (0.8) | % | |||||||
Organic Contribution to Site Rental Billings as Adjusted for Impact of Sprint Cancellations as a percentage of prior year site rental billings(b) |
5.2 | % | 4.5 | % | |||||||
Organic Contribution to Site Rental Billings as a percentage of prior year site rental billings(b) |
0.1 | % | 4.5 | % | |||||||
| News Release continued: | Page 15 |
|||||||
(dollars in millions; totals may not sum due to rounding) |
Full Year 2025 Outlook(a)(c) |
Previously Issued Full Year 2025 Outlook(b)(c) |
|||||||||||||||||||||
| Components of changes in site rental revenues: | |||||||||||||||||||||||
Prior year site rental billings(d)(e) |
$3,931 | $3,931 | |||||||||||||||||||||
Core leasing activity(e) |
110 | to | 120 | 110 | to | 120 | |||||||||||||||||
| Escalators | 90 | to | 100 | 90 | to | 100 | |||||||||||||||||
Non-renewals(e) |
(35) | to | (25) | (35) | to | (25) | |||||||||||||||||
Other billings(e) |
5 | to | 5 | 5 | to | 5 | |||||||||||||||||
Organic Contribution to Site Rental Billings as Adjusted for Impact of Sprint Cancellations(e) |
170 | to | 200 | 170 | to | 200 | |||||||||||||||||
Non-renewals associated with Sprint Cancellations(e) |
(205) | to | (205) | (205) | to | (205) | |||||||||||||||||
Organic Contribution to Site Rental Billings(e) |
(35) | to | (5) | (35) | to | (5) | |||||||||||||||||
| Straight-lined revenues | (5) | to | 25 | (15) | to | 15 | |||||||||||||||||
| Amortization of prepaid rent | 80 | to | 110 | 80 | to | 110 | |||||||||||||||||
Other revenues |
15 | to | 15 | 15 | to | 15 | |||||||||||||||||
Acquisitions(f) |
— | — | |||||||||||||||||||||
| Total site rental revenues | $4,007 | to | $4,052 | $3,997 | to | $4,042 | |||||||||||||||||
Year-over-year changes in revenues:(g) |
|||||||||||||||||||||||
Site rental revenues as a percentage of prior year site rental revenues |
(5.6)% | (5.8)% | |||||||||||||||||||||
Organic Contribution to Site Rental Billings as Adjusted for Impact of Sprint Cancellations as a percentage of prior year site rental billings(e) |
4.7% | 4.7% | |||||||||||||||||||||
Organic Contribution to Site Rental Billings as a percentage of prior year site rental billings(e) |
(0.5)% | (0.5)% | |||||||||||||||||||||
| News Release continued: | Page 16 |
|||||||
For the Three Months Ended |
For the Nine Months Ended |
||||||||||||||||||||||
| (in millions) | September 30, 2025 | September 30, 2024 | September 30, 2025 | September 30, 2024 | |||||||||||||||||||
| Discretionary capital expenditures: | |||||||||||||||||||||||
Tower improvements and other capital projects |
$ | 20 | $ | 21 | $ | 54 | $ | 64 | |||||||||||||||
| Purchases of land interests | 16 | 14 | 50 | 38 | |||||||||||||||||||
| Sustaining capital expenditures | 6 | 6 | 19 | 22 | |||||||||||||||||||
| Total capital expenditures | $ | 42 | $ | 41 | $ | 123 | $ | 124 | |||||||||||||||
| (in millions) | Full Year 2025 Outlook(d) |
Previously Issued Full Year 2025 Outlook(f) |
|||||||||||||||||||||
Discretionary capital expenditures |
$155 | to | $155 | $185 | to | $185 | |||||||||||||||||
Less: Prepaid rent additions(e) |
~40 | ~40 | |||||||||||||||||||||
Discretionary capital expenditures less prepaid rent additions |
$115 | to | $115 | $145 | to | $145 | |||||||||||||||||
For the Three Months Ended |
|||||||||||
| (in millions) | September 30, 2025 | September 30, 2024 | |||||||||
| Interest expense on debt obligations | $ | 244 | $ | 234 | |||||||
| Amortization of deferred financing costs and adjustments on long-term debt | 8 | 8 | |||||||||
| Capitalized interest | (5) | (6) | |||||||||
| Interest expense and amortization of deferred financing costs, net | $ | 247 | $ | 236 | |||||||
| (in millions) | Full Year 2025 Outlook(d) |
Previously Issued Full Year 2025 Outlook(f) |
|||||||||||||||||||||
| Interest expense on debt obligations | $945 | to | $985 | $960 | to | $1,000 | |||||||||||||||||
| Amortization of deferred financing costs and adjustments on long-term debt | 20 | to | 30 | 20 | to | 30 | |||||||||||||||||
| Capitalized interest | (15) | to | (5) | (15) | to | (5) | |||||||||||||||||
| Interest expense and amortization of deferred financing costs, net | $957 | to | $1,002 | $972 | to | $1,017 | |||||||||||||||||
| News Release continued: | Page 17 |
|||||||
| (in millions) | Face Value(a) |
Maturity |
|||||||||
Cash and cash equivalents and restricted cash and cash equivalents(b) |
$ | 238 | |||||||||
Senior Secured Notes, Series 2009-1, Class A-2(c) |
27 | Aug. 2029 | |||||||||
Senior Secured Tower Revenue Notes, Series 2018-2(d) |
750 | July 2048 | |||||||||
Installment purchase liabilities and finance leases(e) |
260 | Various | |||||||||
| Total secured debt | $ | 1,037 | |||||||||
2016 Revolver(f) |
900 | July 2027 | |||||||||
2016 Term Loan A(g) |
1,072 | July 2027 | |||||||||
Commercial Paper Notes(h) |
1,946 | Various |
|||||||||
4.450% Senior Notes |
900 | Feb. 2026 | |||||||||
3.700% Senior Notes |
750 | June 2026 | |||||||||
| 1.050% Senior Notes | 1,000 | July 2026 | |||||||||
| 2.900% Senior Notes | 750 | Mar. 2027 | |||||||||
4.000% Senior Notes |
500 | Mar. 2027 | |||||||||
3.650% Senior Notes |
1,000 | Sept. 2027 | |||||||||
| 5.000% Senior Notes | 1,000 | Jan. 2028 | |||||||||
3.800% Senior Notes |
1,000 | Feb. 2028 | |||||||||
| 4.800% Senior Notes | 600 | Sept. 2028 | |||||||||
4.300% Senior Notes |
600 | Feb. 2029 | |||||||||
5.600% Senior Notes |
750 | June 2029 | |||||||||
4.900% Senior Notes |
550 | Sept. 2029 | |||||||||
| 3.100% Senior Notes | 550 | Nov. 2029 | |||||||||
3.300% Senior Notes |
750 | July 2030 | |||||||||
2.250% Senior Notes |
1,100 | Jan. 2031 | |||||||||
| 2.100% Senior Notes | 1,000 | Apr. 2031 | |||||||||
| 2.500% Senior Notes | 750 | July 2031 | |||||||||
| 5.100% Senior Notes | 750 | May 2033 | |||||||||
5.800% Senior Notes |
750 | Mar. 2034 | |||||||||
5.200% Senior Notes |
700 | Sept. 2034 | |||||||||
| 2.900% Senior Notes | 1,250 | Apr. 2041 | |||||||||
4.750% Senior Notes |
350 | May 2047 | |||||||||
5.200% Senior Notes |
400 | Feb. 2049 | |||||||||
| 4.000% Senior Notes | 350 | Nov. 2049 | |||||||||
| 4.150% Senior Notes | 500 | July 2050 | |||||||||
| 3.250% Senior Notes | 900 | Jan. 2051 | |||||||||
| Total unsecured debt | $ | 23,418 | |||||||||
Net Debt(i) |
$ | 24,217 | |||||||||
| News Release continued: | Page 18 |
|||||||
| News Release continued: | Page 19 |
|||||||
| News Release continued: | Page 20 |
|||||||
|
CROWN CASTLE INC.
CONDENSED CONSOLIDATED BALANCE SHEET (UNAUDITED)
(Amounts in millions, except par values)
|
||||
| September 30, 2025 | December 31, 2024 | ||||||||||
| ASSETS | |||||||||||
| Current assets: | |||||||||||
| Cash and cash equivalents | $ | 57 | $ | 100 | |||||||
Restricted cash and cash equivalents |
176 | 170 | |||||||||
| Receivables, net | 125 | 129 | |||||||||
| Prepaid expenses | 89 | 74 | |||||||||
| Deferred site rental receivables | 226 | 164 | |||||||||
| Other current assets | 22 | 24 | |||||||||
Current assets of discontinued operations |
419 | 429 | |||||||||
| Total current assets | 1,114 | 1,090 | |||||||||
| Deferred site rental receivables | 2,244 | 2,279 | |||||||||
| Property and equipment, net | 6,330 | 6,577 | |||||||||
| Operating lease right-of-use assets | 5,513 | 5,600 | |||||||||
| Goodwill | 5,127 | 5,127 | |||||||||
| Other intangible assets, net | 905 | 1,037 | |||||||||
| Other assets, net | 63 | 58 | |||||||||
Non-current assets of discontinued operations |
10,205 | 10,968 | |||||||||
| Total assets | $ | 31,501 | $ | 32,736 | |||||||
LIABILITIES AND EQUITY (DEFICIT) |
|||||||||||
| Current liabilities: | |||||||||||
| Accounts payable | $ | 65 | $ | 48 | |||||||
| Accrued interest | 160 | 244 | |||||||||
| Deferred revenues | 147 | 141 | |||||||||
| Other accrued liabilities | 156 | 167 | |||||||||
| Current maturities of debt and other obligations | 2,769 | 603 | |||||||||
| Current portion of operating lease liabilities | 268 | 264 | |||||||||
| Current liabilities of discontinued operations | 732 | 710 | |||||||||
| Total current liabilities | 4,297 | 2,177 | |||||||||
| Debt and other long-term obligations | 21,550 | 23,451 | |||||||||
| Operating lease liabilities | 4,988 | 5,062 | |||||||||
| Other long-term liabilities | 623 | 645 | |||||||||
Non-current liabilities of discontinued operations |
1,536 | 1,534 | |||||||||
| Total liabilities | 32,994 | 32,869 | |||||||||
| Commitments and contingencies | |||||||||||
Stockholders' equity (deficit): |
|||||||||||
Common stock, 0.01 par value; 1,200 shares authorized; shares issued and outstanding: September 30, 2025—435 and December 31, 2024—435 |
4 | 4 | |||||||||
| Additional paid-in capital | 18,497 | 18,393 | |||||||||
| Accumulated other comprehensive income (loss) | (4) | (5) | |||||||||
| Dividends/distributions in excess of earnings | (19,990) | (18,525) | |||||||||
Total equity (deficit) |
(1,493) | (133) | |||||||||
Total liabilities and equity (deficit) |
$ | 31,501 | $ | 32,736 | |||||||
| News Release continued: | Page 21 |
|||||||
|
CROWN CASTLE INC.
CONDENSED CONSOLIDATED STATEMENT OF OPERATIONS (UNAUDITED)
(Amounts in millions, except per share amounts)
|
||||
| Three Months Ended September 30, | Nine Months Ended September 30, | ||||||||||||||||||||||
| 2025 | 2024 | 2025 | 2024 | ||||||||||||||||||||
| Net revenues: | |||||||||||||||||||||||
| Site rental | $ | 1,012 | $ | 1,066 | $ | 3,031 | $ | 3,198 | |||||||||||||||
| Services and other | 60 | 54 | 162 | 143 | |||||||||||||||||||
| Net revenues | 1,072 | 1,120 | 3,193 | 3,341 | |||||||||||||||||||
| Operating expenses: | |||||||||||||||||||||||
Costs of operations:(a) |
|||||||||||||||||||||||
| Site rental | 250 | 247 | 741 | 740 | |||||||||||||||||||
| Services and other | 30 | 27 | 84 | 81 | |||||||||||||||||||
| Selling, general and administrative | 97 | 93 | 289 | 343 | |||||||||||||||||||
| Asset write-down charges | 3 | 2 | 7 | 10 | |||||||||||||||||||
| Depreciation, amortization and accretion | 167 | 181 | 520 | 552 | |||||||||||||||||||
Restructuring charges |
— | 38 | — | 67 | |||||||||||||||||||
| Total operating expenses | 547 | 588 | 1,641 | 1,793 | |||||||||||||||||||
| Operating income (loss) | 525 | 532 | 1,552 | 1,548 | |||||||||||||||||||
| Interest expense and amortization of deferred financing costs, net | (247) | (236) | (726) | (692) | |||||||||||||||||||
| Interest income | 3 | 6 | 10 | 14 | |||||||||||||||||||
| Other income (expense) | — | (5) | 3 | (3) | |||||||||||||||||||
Income (loss) from continuing operations before income taxes |
281 | 297 | 839 | 867 | |||||||||||||||||||
| Benefit (provision) for income taxes | (4) | (3) | (13) | (14) | |||||||||||||||||||
Income (loss) from continuing operations |
$ | 277 | $ | 294 | $ | 826 | $ | 853 | |||||||||||||||
Discontinued Operations |
|||||||||||||||||||||||
| Income (loss) from discontinued operations before gain (loss) from disposal, net of tax | 277 | 9 | 637 | 12 | |||||||||||||||||||
Gain (loss) from disposal of discontinued operations |
(231) | — | (1,313) | — | |||||||||||||||||||
Income (loss) from discontinued operations, net of tax |
46 | 9 | (676) | 12 | |||||||||||||||||||
Net income (loss) |
$ | 323 | $ | 303 | $ | 150 | $ | 865 | |||||||||||||||
| Net income (loss), per common share: | |||||||||||||||||||||||
Income (loss) from continuing operations, basic |
$ | 0.64 | $ | 0.68 | $ | 1.89 | $ | 1.96 | |||||||||||||||
Income (loss) from discontinued operations, basic |
0.10 | 0.02 | (1.55) | 0.03 | |||||||||||||||||||
| Net income (loss)—basic | $ | 0.74 | $ | 0.70 | $ | 0.34 | $ | 1.99 | |||||||||||||||
Income (loss) from continuing operations, diluted |
$ | 0.64 | $ | 0.68 | $ | 1.89 | $ | 1.96 | |||||||||||||||
Income (loss) from discontinued operations, diluted |
0.10 | 0.02 | (1.55) | 0.03 | |||||||||||||||||||
| Net income (loss)—diluted | $ | 0.74 | $ | 0.70 | $ | 0.34 | $ | 1.99 | |||||||||||||||
| Weighted-average common shares outstanding: | |||||||||||||||||||||||
| Basic | 435 | 435 | 435 | 434 | |||||||||||||||||||
| Diluted | 437 | 436 | 436 | 435 | |||||||||||||||||||
| News Release continued: | Page 22 |
|||||||
|
CROWN CASTLE INC.
CONDENSED CONSOLIDATED STATEMENT OF CASH FLOWS (UNAUDITED)
(In millions of dollars)
|
||||
| Nine Months Ended September 30, | |||||||||||
| 2025 | 2024 | ||||||||||
| Cash flows from operating activities: | |||||||||||
| Net income (loss) | $ | 150 | $ | 865 | |||||||
(Income) loss from discontinued operations before (gain) loss from disposal, net of tax |
(637) | (12) | |||||||||
(Gain) loss from disposal of discontinued operations |
1,313 | — | |||||||||
Income (loss) from continuing operations |
826 | 853 | |||||||||
Adjustments to reconcile income (loss) from continuing operations to net cash provided by (used for) operating activities: |
|||||||||||
| Depreciation, amortization and accretion | 520 | 552 | |||||||||
| Amortization of deferred financing costs and other non-cash interest | 24 | 24 | |||||||||
| Stock-based compensation expense, net | 55 | 69 | |||||||||
| Asset write-down charges | 7 | 10 | |||||||||
| Deferred income tax (benefit) provision | 1 | 5 | |||||||||
| Other non-cash adjustments, net | (4) | 12 | |||||||||
Net cash provided by (used for) operating activities from discontinued operations |
897 | 830 | |||||||||
| Changes in assets and liabilities, excluding the effects of acquisitions: | |||||||||||
| Increase (decrease) in liabilities | (111) | (208) | |||||||||
| Decrease (increase) in assets | (28) | (81) | |||||||||
| Net cash provided by (used for) operating activities | 2,187 | 2,066 | |||||||||
| Cash flows from investing activities: | |||||||||||
| Capital expenditures | (123) | (124) | |||||||||
| Payments for acquisitions, net of cash acquired | — | (8) | |||||||||
| Other investing activities, net | 5 | 5 | |||||||||
| Net cash provided by (used for) investing activities from discontinued operations | (687) | (820) | |||||||||
| Net cash provided by (used for) investing activities | (805) | (947) | |||||||||
| Cash flows from financing activities: | |||||||||||
| Proceeds from issuance of long-term debt | — | 1,244 | |||||||||
| Principal payments on debt and other long-term obligations | (89) | (71) | |||||||||
| Purchases and redemptions of long-term debt | (1,200) | (750) | |||||||||
| Borrowings under revolving credit facility | 900 | — | |||||||||
| Payments under revolving credit facility | — | (670) | |||||||||
Net issuances (repayments) under commercial paper program |
605 | 1,312 | |||||||||
| Payments for financing costs | — | (12) | |||||||||
| Purchases of common stock | (23) | (32) | |||||||||
| Dividends/distributions paid on common stock | (1,615) | (2,049) | |||||||||
| Net cash provided by (used for) financing activities | (1,422) | (1,028) | |||||||||
Net increase (decrease) in cash and cash equivalents and restricted cash and cash equivalents |
(40) | 91 | |||||||||
| Effect of exchange rate changes on cash | — | (1) | |||||||||
Cash and cash equivalents and restricted cash and cash equivalents at beginning of period(a) |
295 | 281 | |||||||||
Cash and cash equivalents and restricted cash and cash equivalents at end of period(a) |
$ | 255 | $ | 371 | |||||||
| Supplemental disclosure of cash flow information: | |||||||||||
| Interest paid | $ | 799 | $ | 739 | |||||||
| Income taxes paid (refunded) | $ | 12 | $ | 8 | |||||||

| TABLE OF CONTENTS | |||||
| Page | |||||
| Company Overview | |||||
| Company Profile | |||||
| Strategy | |||||
| General Company Information | |||||
Tower Asset Portfolio Footprint |
|||||
| Historical Common Stock Data | |||||
| Executive Management Team | |||||
| Board of Directors | |||||
| Research Coverage | |||||
| Outlook | |||||
| Outlook | |||||
| Outlook for Components of Changes in Site Rental Revenues | |||||
| Outlook for Components of Interest Expense | |||||
Financial Highlights |
|||||
Summary Financial Highlights |
|||||
Components of Changes in Site Rental Revenues |
|||||
Summary of Capital Expenditures |
|||||
Portfolio Highlights |
|||||
Consolidated Return on Invested Capital |
|||||
Cash Yield on Invested Capital |
11 |
||||
Tenant Overview |
|||||
Annualized Rental Cash Payments at Time of Renewal |
|||||
Projected Revenues from Tenant Contracts Associated with Active Licenses |
|||||
Projected Expenses from Existing Ground Leases |
|||||
| Summary of Tower Portfolio by Vintage | |||||
| Ground Interest Overview | |||||
| Capitalization Overview | |||||
| Capitalization Overview | |||||
| Debt Maturity Overview | |||||
| Liquidity Overview | |||||
| Summary of Maintenance and Financial Covenants | |||||
| Interest Rate Exposure | |||||
| Components of Interest Expense | |||||
| Appendix of Condensed Consolidated Financial Statements and Non-GAAP Reconciliations | |||||
| COMPANY OVERVIEW |
OUTLOOK |
FINANCIAL
HIGHLIGHTS
|
CAPITALIZATION OVERVIEW | APPENDIX | ||||||||||
COMPANY PROFILE | ||||||||||||||
STRATEGY | ||||||||||||||
| COMPANY OVERVIEW |
OUTLOOK |
FINANCIAL
HIGHLIGHTS
|
CAPITALIZATION OVERVIEW | APPENDIX | ||||||||||
| GENERAL COMPANY INFORMATION | |||||
| Principal executive offices | 8020 Katy Freeway, Houston, TX 77024 | ||||
| Common shares trading symbol | CCI | ||||
| Stock exchange listing | New York Stock Exchange | ||||
| Fiscal year ending date | December 31 | ||||
| Fitch - Long-term Issuer Default Rating | BBB+ | ||||
| Moody’s - Long-term Corporate Family Rating | Baa3 | ||||
| Standard & Poor’s - Long-term Local Issuer Credit Rating | BBB | ||||
TOWER ASSET PORTFOLIO FOOTPRINT | ||
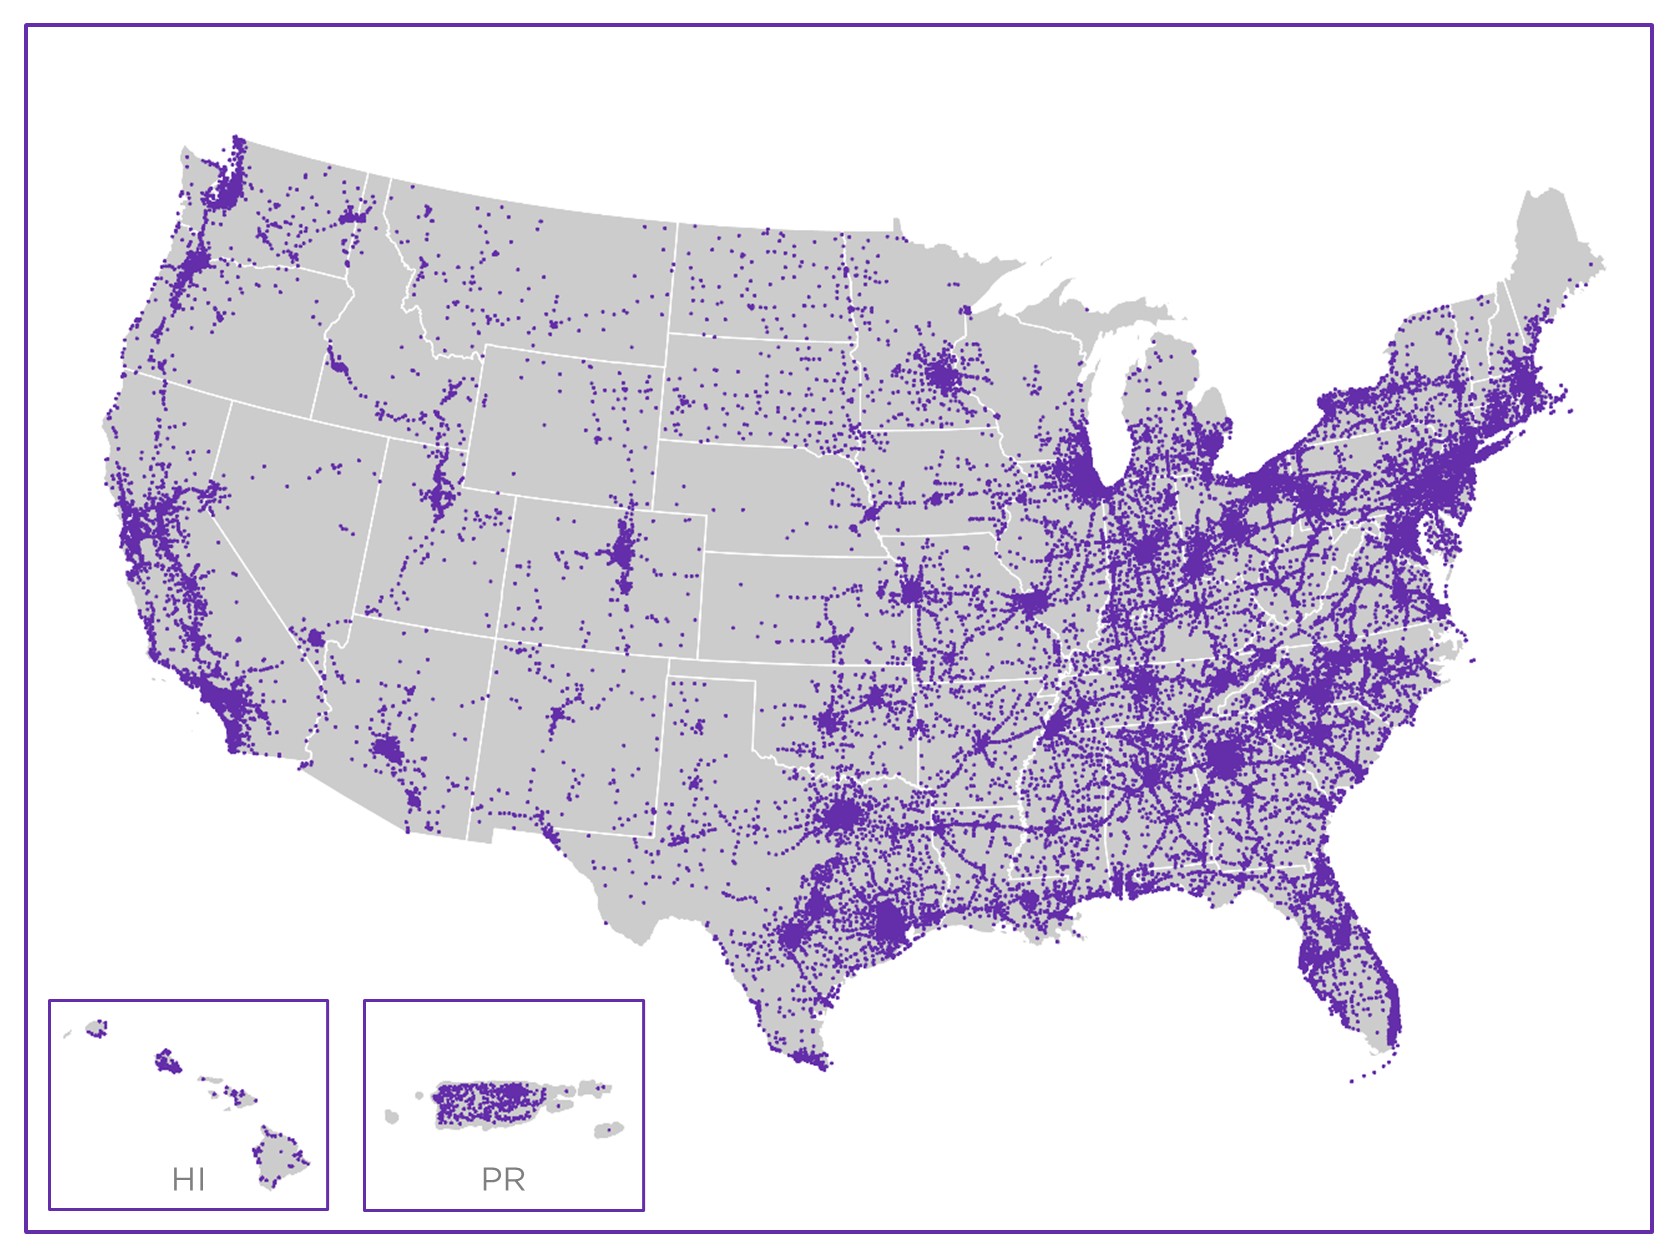 | ||
| HISTORICAL COMMON STOCK DATA | ||||||||||||||||||||||||||||||||
| Three Months Ended | ||||||||||||||||||||||||||||||||
| (in millions, except per share amounts) | 9/30/24 | 12/31/24 | 3/31/25 | 6/30/25 | 9/30/25 | |||||||||||||||||||||||||||
High price(a) |
$ | 114.55 | $ | 113.42 | $ | 105.07 | $ | 106.81 | $ | 114.49 | ||||||||||||||||||||||
Low price(a) |
$ | 88.78 | $ | 85.53 | $ | 81.01 | $ | 89.11 | $ | 90.25 | ||||||||||||||||||||||
Period end closing price(b) |
$ | 112.34 | $ | 87.33 | $ | 101.97 | $ | 101.59 | $ | 96.49 | ||||||||||||||||||||||
| Dividends paid per common share | $ | 1.57 | $ | 1.57 | $ | 1.57 | $ | 1.06 | $ | 1.06 | ||||||||||||||||||||||
Volume weighted average price for the period(a) |
$ | 103.48 | $ | 97.83 | $ | 91.66 | $ | 99.06 | $ | 99.98 | ||||||||||||||||||||||
| Common shares outstanding, at period end | 435 | 435 | 435 | 435 | 435 | |||||||||||||||||||||||||||
Market value of outstanding common shares, at period end(c) |
$ | 48,824 | $ | 37,957 | $ | 44,403 | $ | 44,237 | $ | 42,019 | ||||||||||||||||||||||
| COMPANY OVERVIEW |
OUTLOOK |
FINANCIAL
HIGHLIGHTS
|
CAPITALIZATION OVERVIEW | APPENDIX | ||||||||||
| EXECUTIVE MANAGEMENT TEAM | ||||||||||||||||||||
Name |
Position | Age | Years with Company | |||||||||||||||||
Christian H. Hillabrant |
President and Chief Executive Officer |
60 | <1 |
|||||||||||||||||
Sunit Patel |
Executive Vice President and Chief Financial Officer |
63 | <1 |
|||||||||||||||||
Catherine Piche |
Executive Vice President and Chief Operating Officer - Towers |
54 | 13(a) |
|||||||||||||||||
| Christopher D. Levendos | Executive Vice President and Chief Operating Officer - Fiber |
58 | 7 | |||||||||||||||||
| Edward B. Adams, Jr. | Executive Vice President and General Counsel | 56 | 9 | |||||||||||||||||
| Daniel K. Schlanger | Executive Vice President and Chief Transformation Officer |
51 | 9 | |||||||||||||||||
| BOARD OF DIRECTORS | ||||||||||||||||||||||||||
| Name | Position | Committees | Age | Years as Director | ||||||||||||||||||||||
| P. Robert Bartolo | Chair | Nominating and Governance, Finance, Fiber Review |
53 | 11 | ||||||||||||||||||||||
| Jason Genrich | Director | Finance, Fiber Review |
38 | 1 | ||||||||||||||||||||||
| Andrea J. Goldsmith | Director | Compensation and Human Capital |
61 | 7 | ||||||||||||||||||||||
Christian H. Hillabrant |
Director |
60 | <1 |
|||||||||||||||||||||||
| Tammy K. Jones | Director | Audit, Nominating and Governance, Finance |
60 | 4 | ||||||||||||||||||||||
| Kevin T. Kabat | Director | Compensation and Human Capital, Nominating and Governance |
68 | 2 | ||||||||||||||||||||||
| Anthony J. Melone | Director | Audit, Nominating and Governance, Fiber Review |
65 | 10 | ||||||||||||||||||||||
Katherine Motlagh |
Director |
Audit, Compensation and Human Capital, Finance |
51 | <1 |
||||||||||||||||||||||
| Kevin A. Stephens | Director |
Audit, Compensation and Human Capital, Fiber Review |
64 | 4 | ||||||||||||||||||||||
| Matthew Thornton III | Director |
Audit, Compensation and Human Capital, Nominating and Governance |
67 | 4 | ||||||||||||||||||||||
| RESEARCH COVERAGE | ||||||||
| Equity Research | ||||||||
|
Bank of America
Michael Funk
(646) 855-5664
|
Barclays Brendan Lynch (212) 526-9428 |
BMO Capital Markets Ari Klein (212) 885-4103 |
||||||
| Citigroup Michael Rollins (212) 816-1116 |
Goldman Sachs
Jim Schneider
(212) 357-2929
|
Green Street David Guarino (949) 640-8780 |
||||||
|
HSBC
Luigi Minerva
(207) 991-6928
|
Jefferies Jonathan Petersen (212) 284-1705 |
JMP Securities
Greg Miller
(212) 699-2917
|
||||||
|
JPMorgan
Richard Choe
(212) 622-6708
|
KeyBanc Brandon Nispel (503) 821-3871 |
MoffettNathanson Nick Del Deo (212) 519-0025 |
||||||
|
Morgan Stanley
Benjamin Swinburne
(212) 761-7527
|
New Street Research Jonathan Chaplin (212) 921-9876 |
Raymond James Ric Prentiss (727) 567-2567 |
||||||
| RBC Capital Markets Jonathan Atkin (415) 633-8589 |
Scotiabank
Maher Yaghi
(437) 995-5548
|
TD Cowen
Michael Elias
(646) 562-1358
|
||||||
| UBS Batya Levi (212) 713-8824 |
Wells Fargo Eric Luebchow (312) 630-2386 |
Wolfe Research Andrew Rosivach (646) 582-9350 |
||||||
| Rating Agencies | ||||||||
|
Fitch
Jeff Danforth
(312) 368-5447
|
Moody’s
Ranjini Venkatesan
(212) 553-3828
|
Standard & Poor’s
Allyn Arden
(212) 438-7832
|
||||||
| COMPANY OVERVIEW |
OUTLOOK |
FINANCIAL
HIGHLIGHTS
|
CAPITALIZATION OVERVIEW | APPENDIX | ||||||||||
| OUTLOOK | ||||||||||||||
| (in millions, except per share amounts) | Full Year 2025 Outlook(a) |
|||||||||||||
Site rental billings(b) |
$3,895 | to | $3,925 | |||||||||||
| Amortization of prepaid rent | 80 | to | 110 | |||||||||||
| Straight-lined revenues | (5) | to | 25 | |||||||||||
Other revenues |
15 | to | 15 | |||||||||||
| Site rental revenues | 4,007 | to | 4,052 | |||||||||||
Site rental costs of operations(c) |
967 | to | 1,012 | |||||||||||
| Services and other gross margin | 80 | to | 110 | |||||||||||
Net income (loss)(d) |
145 | to | 425 | |||||||||||
Net income (loss) per share—diluted(d) |
0.33 | to | 0.97 | |||||||||||
Adjusted EBITDA(b) |
2,810 | to | 2,860 | |||||||||||
| Depreciation, amortization and accretion | 678 | to | 773 | |||||||||||
Interest expense and amortization of deferred financing costs, net(e) |
957 | to | 1,002 | |||||||||||
Income (loss) from discontinued operations, net of tax(f) |
(830) | to | (590) | |||||||||||
FFO(b) |
1,690 | to | 1,720 | |||||||||||
AFFO(b) |
1,845 | to | 1,895 | |||||||||||
AFFO per share(b) |
$4.23 | to | $4.35 | |||||||||||
| COMPANY OVERVIEW |
OUTLOOK |
FINANCIAL
HIGHLIGHTS
|
CAPITALIZATION OVERVIEW | APPENDIX | ||||||||||
| OUTLOOK FOR COMPONENTS OF CHANGES IN SITE RENTAL REVENUES | ||||||||||||||
(dollars in millions; totals may not sum due to rounding) |
Full Year 2025 Outlook(a) |
|||||||||||||
| Components of changes in site rental revenues: | ||||||||||||||
Prior year site rental billings(b)(c) |
$3,931 | |||||||||||||
Core leasing activity(b) |
110 | to | 120 | |||||||||||
| Escalators | 90 | to | 100 | |||||||||||
Non-renewals(b) |
(35) | to | (25) | |||||||||||
Other billings(b) |
5 | to | 5 | |||||||||||
Organic Contribution to Site Rental Billings as Adjusted for Impact of Sprint Cancellations(b) |
170 | to | 200 | |||||||||||
Non-renewals associated with Sprint Cancellations(b) |
(205) | to | (205) | |||||||||||
Organic Contribution to Site Rental Billings(b) |
(35) | to | (5) | |||||||||||
| Straight-lined revenues | (5) | to | 25 | |||||||||||
| Amortization of prepaid rent | 80 | to | 110 | |||||||||||
Other revenues |
15 | to | 15 | |||||||||||
Acquisitions(d) |
— | to | — | |||||||||||
| Total site rental revenues | $4,007 | to | $4,052 | |||||||||||
Year-over-year changes in revenues:(e) |
||||||||||||||
Site rental revenues as a percentage of prior year site rental revenues |
(5.6)% | |||||||||||||
Organic Contribution to Site Rental Billings as Adjusted for Impact of Sprint Cancellations as a percentage of prior year site rental billings(b) |
4.7% | |||||||||||||
Organic Contribution to Site Rental Billings as a percentage of prior year site rental billings(b) |
(0.5)% | |||||||||||||
| OUTLOOK FOR COMPONENTS OF INTEREST EXPENSE | ||||||||||||||
| (in millions) | Full Year 2025 Outlook(a) |
|||||||||||||
| Interest expense on debt obligations | $945 | to | $985 | |||||||||||
| Amortization of deferred financing costs and adjustments on long-term debt | 20 | to | 30 | |||||||||||
| Capitalized interest | (15) | to | (5) | |||||||||||
| Interest expense and amortization of deferred financing costs, net | $957 | to | $1,002 | |||||||||||
| COMPANY OVERVIEW |
OUTLOOK |
FINANCIAL
HIGHLIGHTS
|
CAPITALIZATION OVERVIEW | APPENDIX | ||||||||||
SUMMARY FINANCIAL HIGHLIGHTS(a) | ||||||||||||||||||||||||||||||||||||||||||||
| 2024 | 2025 | |||||||||||||||||||||||||||||||||||||||||||
(in millions, except per share amounts; totals may not sum due to rounding) |
Q1 | Q2 | Q3 | Q4 | Q1 | Q2 | Q3 | |||||||||||||||||||||||||||||||||||||
| Net revenues: | ||||||||||||||||||||||||||||||||||||||||||||
| Site rental | ||||||||||||||||||||||||||||||||||||||||||||
Site rental billings(b) |
$ | 966 | $ | 967 | $ | 995 | $ | 1,006 | $ | 964 | $ | 961 | $ | 996 | ||||||||||||||||||||||||||||||
| Amortization of prepaid rent | 41 | 39 | 39 | 40 | 25 | 23 | 23 | |||||||||||||||||||||||||||||||||||||
| Straight-lined revenues | 57 | 54 | 28 | 20 | 19 | 20 | (11) | |||||||||||||||||||||||||||||||||||||
Other revenues |
4 | 4 | 4 | 4 | 4 | 4 | 4 | |||||||||||||||||||||||||||||||||||||
| Total site rental | 1,068 | 1,064 | 1,066 | 1,070 | 1,011 | 1,008 | 1,012 | |||||||||||||||||||||||||||||||||||||
| Services and other | 46 | 43 | 54 | 49 | 50 | 52 | 60 | |||||||||||||||||||||||||||||||||||||
| Net revenues | $ | 1,114 | $ | 1,107 | $ | 1,120 | (c) |
$ | 1,119 | $ | 1,061 | $ | 1,060 | $ | 1,072 | |||||||||||||||||||||||||||||
| Select operating expenses: | ||||||||||||||||||||||||||||||||||||||||||||
Costs of operations(d) |
||||||||||||||||||||||||||||||||||||||||||||
| Site rental exclusive of straight-lined expenses | $ | 227 | $ | 233 | $ | 232 | (c) |
$ | 227 | $ | 225 | $ | 236 | $ | 235 | |||||||||||||||||||||||||||||
| Straight-lined expenses | 16 | 16 | 15 | 15 | 15 | 15 | 15 | |||||||||||||||||||||||||||||||||||||
| Total site rental | 243 | 249 | 247 | (c) |
242 | 240 | 251 | 250 | ||||||||||||||||||||||||||||||||||||
| Services and other | 29 | 25 | 27 | 26 | 28 | 27 | 30 | |||||||||||||||||||||||||||||||||||||
| Total costs of operations | 272 | 274 | 274 | (c) |
268 | 268 | 278 | 280 | ||||||||||||||||||||||||||||||||||||
| Selling, general and administrative | $ | 114 | $ | 136 | $ | 93 | $ | 92 | $ | 93 | $ | 99 | $ | 97 | ||||||||||||||||||||||||||||||
Net income (loss) |
$ | 311 | $ | 251 | $ | 303 | $ | (4,768) | $ | (464) | $ | 291 | $ | 323 | ||||||||||||||||||||||||||||||
Adjusted EBITDA(e) |
754 | 727 | 777 | 777 | 722 | 705 | 718 | |||||||||||||||||||||||||||||||||||||
| Depreciation, amortization and accretion | 191 | 180 | 181 | 183 | 177 | 175 | 167 | |||||||||||||||||||||||||||||||||||||
| Interest expense and amortization of deferred financing costs, net | 226 | 230 | 236 | 240 | 236 | 243 | 247 | |||||||||||||||||||||||||||||||||||||
FFO(e) |
478 | 436 | 466 | 483 | 451 | 429 | 443 | |||||||||||||||||||||||||||||||||||||
AFFO(e) |
$ | 484 | $ | 449 | $ | 525 | $ | 523 | $ | 479 | $ | 444 | $ | 490 | ||||||||||||||||||||||||||||||
Weighted-average common shares outstanding— diluted |
435 | 435 | 436 | 435 | 436 | 437 | 437 | |||||||||||||||||||||||||||||||||||||
Net income (loss) per share—diluted |
$ | 0.71 | $ | 0.58 | $ | 0.70 | $ | (10.97) | $ | (1.07) | $ | 0.67 | $ | 0.74 | ||||||||||||||||||||||||||||||
AFFO per share(e) |
$ | 1.11 | $ | 1.03 | $ | 1.20 | $ | 1.20 | $ | 1.10 | $ | 1.02 | $ | 1.12 | ||||||||||||||||||||||||||||||
| COMPANY OVERVIEW |
OUTLOOK |
FINANCIAL
HIGHLIGHTS
|
CAPITALIZATION OVERVIEW | APPENDIX | ||||||||||
COMPONENTS OF CHANGES IN SITE RENTAL REVENUES(a) | ||||||||||||||||||||||||||||||||||||||||||||
| 2024 | 2025 | |||||||||||||||||||||||||||||||||||||||||||
(dollars in millions; totals may not sum due to rounding) |
Q1 | Q2 | Q3 | Q4 | Q1 | Q2 | Q3 | |||||||||||||||||||||||||||||||||||||
| Components of changes in site rental revenues: | ||||||||||||||||||||||||||||||||||||||||||||
Prior year site rental billings(b) |
$ | 923 | $ | 922 | $ | 952 | $ | 966 | $ | 966 | $ | 966 | $ | 995 | ||||||||||||||||||||||||||||||
Core leasing activity(b) |
28 | 28 | 27 | 28 | 28 | 28 | 33 | |||||||||||||||||||||||||||||||||||||
| Escalators | 23 | 23 | 23 | 24 | 24 | 24 | 24 | |||||||||||||||||||||||||||||||||||||
Non-renewals(b) |
(8) | (7) | (8) | (8) | (7) | (7) | (7) | |||||||||||||||||||||||||||||||||||||
Other billings(b) |
— | 2 | — | (4) | 3 | — | 2 | |||||||||||||||||||||||||||||||||||||
Organic Contribution to Site Rental Billings as Adjusted for Impact of Sprint Cancellations(b) |
43 | 45 | 43 | 40 | 49 | 45 | 52 | |||||||||||||||||||||||||||||||||||||
Non-renewals associated with Sprint Cancellations(b) |
— | — | — | — | (51) | (51) | (51) | |||||||||||||||||||||||||||||||||||||
Organic Contribution to Site Rental Billings(b) |
43 | 45 | 43 | 40 | (2) | (6) | 1 | |||||||||||||||||||||||||||||||||||||
| Straight-lined revenues | 57 | 54 | 28 | 20 | 19 | 20 | (11) | |||||||||||||||||||||||||||||||||||||
| Amortization of prepaid rent | 41 | 39 | 39 | 40 | 25 | 23 | 23 | |||||||||||||||||||||||||||||||||||||
Other revenues |
4 | 4 | 4 | 4 | 4 | 4 | 4 | |||||||||||||||||||||||||||||||||||||
| Total site rental revenues | $ | 1,068 | $ | 1,064 | $ | 1,066 | $ | 1,070 | $ | 1,011 | $ | 1,008 | $ | 1,012 | ||||||||||||||||||||||||||||||
| Year-over-year changes in revenues: | ||||||||||||||||||||||||||||||||||||||||||||
Site rental revenues as a percentage of prior year site rental revenues |
(1.2) | % | (1.5) | % | (0.8) | % | (0.8) | % | (5.3) | % | (5.3) | % | (5.1) | % | ||||||||||||||||||||||||||||||
Organic Contribution to Site Rental Billings as Adjusted for Impact of Sprint Cancellations as a percentage of prior year site rental billings(b) |
4.6 | % | 4.8 | % | 4.5 | % | 4.1 | % | 5.1 | % | 4.7 | % | 5.2 | % | ||||||||||||||||||||||||||||||
Organic Contribution to Site Rental Billings as a percentage of prior year site rental billings(b) |
4.6 | % | 4.8 | % | 4.5 | % | 4.1 | % | (0.2) | % | (0.6) | % | 0.1 | % | ||||||||||||||||||||||||||||||
| COMPANY OVERVIEW |
OUTLOOK |
FINANCIAL
HIGHLIGHTS
|
CAPITALIZATION OVERVIEW | APPENDIX | ||||||||||
SUMMARY OF CAPITAL EXPENDITURES(a) | ||||||||||||||||||||||||||||||||||||||||||||
| 2024 | 2025 | |||||||||||||||||||||||||||||||||||||||||||
(dollars in millions; totals may not sum due to rounding) |
Q1 | Q2 | Q3 | Q4 | Q1 | Q2 | Q3 | |||||||||||||||||||||||||||||||||||||
| Discretionary capital expenditures: | ||||||||||||||||||||||||||||||||||||||||||||
Tower improvements and other capital projects |
$ | 26 | $ | 20 | $ | 21 | $ | 18 | $ | 15 | $ | 17 | $ | 20 | ||||||||||||||||||||||||||||||
| Purchases of land interests | 13 | 11 | 14 | 20 | 18 | 16 | 16 | |||||||||||||||||||||||||||||||||||||
| Total discretionary capital expenditures | 39 | 31 | 35 | 38 | 33 | 33 | 36 | |||||||||||||||||||||||||||||||||||||
| Sustaining capital expenditures | 8 | 9 | 6 | 12 | 7 | 7 | 6 | |||||||||||||||||||||||||||||||||||||
| Total capital expenditures | 47 | 40 | 41 | 50 | 40 | 40 | 42 | |||||||||||||||||||||||||||||||||||||
Less: Prepaid rent additions(b) |
12 | 8 | 13 | 12 | 10 | 11 | 11 | |||||||||||||||||||||||||||||||||||||
| Capital expenditures less prepaid rent additions | $ | 35 | $ | 32 | $ | 28 | $ | 38 | $ | 30 | $ | 29 | $ | 31 | ||||||||||||||||||||||||||||||
PORTFOLIO HIGHLIGHTS | |||||
(as of September 30, 2025) |
|||||
Number of towers (in thousands)(c) |
40 | ||||
| Average number of tenants per tower | 2.4 | ||||
Remaining contracted tenant receivables (in billions)(d) |
$ | 28 | |||
Weighted average remaining tenant contract term (years)(d)(e) |
6 | ||||
| Percent of towers in the Top 50 / 100 Basic Trading Areas | 56% / 71% | ||||
Percent of ground leased / owned(f) |
57% / 43% |
||||
Weighted average maturity of ground leases (years)(f)(g) |
35 | ||||
| COMPANY OVERVIEW |
OUTLOOK |
FINANCIAL
HIGHLIGHTS
|
CAPITALIZATION OVERVIEW | APPENDIX | ||||||||||
CONSOLIDATED RETURN ON INVESTED CAPITAL(a)(b) | ||||||||||||||
(as of September 30, 2025; dollars in millions) |
Q3 2025 LQA |
Q3 2024 LQA | ||||||||||||
Adjusted EBITDA(c) |
$ | 2,872 | $ | 3,108 | ||||||||||
| Cash taxes (paid) refunded | (10) | (11) | ||||||||||||
Adjusted EBITDA less cash taxes paid |
$ | 2,862 | $ | 3,097 | ||||||||||
Historical gross investment in property and equipment(d) |
$ | 16,927 | $ | 16,895 | ||||||||||
| Historical gross investment in site rental contracts and tenant relationships | 4,589 | 4,590 | ||||||||||||
Historical gross investment in goodwill |
5,127 | 5,127 | ||||||||||||
Consolidated Invested Capital(a) |
$ | 26,643 | $ | 26,612 | ||||||||||
Consolidated Return on Invested Capital(a) |
10.7 | % | 11.6 | % | ||||||||||
CASH YIELD ON INVESTED CAPITAL(a)(b)(e) | ||||||||||||||
(as of September 30, 2025; dollars in millions) |
Q3 2025 LQA |
Q3 2024 LQA | ||||||||||||
Adjusted Site Rental Gross Margin(c) |
$ | 3,068 | $ | 3,292 | ||||||||||
| Less: Amortization of prepaid rent | (92) | (156) | ||||||||||||
Add (less): Straight-lined revenues |
45 | (112) | ||||||||||||
Add: Straight-lined expenses |
44 | 48 | ||||||||||||
Numerator |
$ | 3,065 | $ | 3,072 | ||||||||||
Net investment in property and equipment(f) |
$ | 13,611 | $ | 13,526 | ||||||||||
Investment in site rental contracts and tenant relationships |
4,589 | 4,590 | ||||||||||||
Investment in goodwill(g) |
5,351 | 5,351 | ||||||||||||
Net Invested Capital(a) |
$ | 23,551 | $ | 23,467 | ||||||||||
Cash Yield on Invested Capital(a) |
13.0 | % | 13.1 | % | ||||||||||
| COMPANY OVERVIEW |
OUTLOOK |
FINANCIAL
HIGHLIGHTS
|
CAPITALIZATION OVERVIEW | APPENDIX | ||||||||||
TENANT OVERVIEW(a) | ||||||||||||||
(as of September 30, 2025) |
Percentage of Q3 2025 LQA Site Rental Revenues |
Weighted Average Current Term Remaining(b) |
||||||||||||
| T-Mobile | 40% | 7 | ||||||||||||
| AT&T | 27% | 4 | ||||||||||||
| Verizon | 22% | 6 | ||||||||||||
| All Others Combined | 11% | 7 | ||||||||||||
| Total / Weighted Average | 100% | 6 | ||||||||||||
ANNUALIZED RENTAL CASH PAYMENTS AT TIME OF RENEWAL(a)(c) | ||||||||||||||||||||||||||||||||
Remaining Three Months |
Years Ending December 31, | |||||||||||||||||||||||||||||||
(as of September 30, 2025; in millions) |
2025 |
2026 |
2027 |
2028 |
2029 |
|||||||||||||||||||||||||||
| T-Mobile | $ | 1 | $ | 27 | $ | 32 | $ | 26 | $ | 24 | ||||||||||||||||||||||
| AT&T | 3 | 23 | 13 | 774 | 238 | |||||||||||||||||||||||||||
| Verizon | 1 | 6 | 7 | 31 | 48 | |||||||||||||||||||||||||||
| All Others Combined | 8 | 50 | 37 | 29 | 44 | |||||||||||||||||||||||||||
| Total | $ | 13 | $ | 106 | $ | 89 | $ | 860 | $ | 354 | ||||||||||||||||||||||
PROJECTED REVENUES FROM TENANT CONTRACTS ASSOCIATED WITH ACTIVE LICENSES(a)(d) | ||||||||||||||||||||||||||||||||
Remaining Three Months |
Years Ending December 31, | |||||||||||||||||||||||||||||||
(as of September 30, 2025; in millions) |
2025 |
2026 |
2027 |
2028 |
2029 |
|||||||||||||||||||||||||||
| Components of site rental revenues: | ||||||||||||||||||||||||||||||||
Site rental billings(e) |
$ | 991 | $ | 4,008 | $ | 4,117 | $ | 4,236 | $ | 4,361 | ||||||||||||||||||||||
| Amortization of prepaid rent | 22 | 79 | 66 | 45 | 29 | |||||||||||||||||||||||||||
| Straight-lined revenues | (1) | (57) | (170) | (234) | (206) | |||||||||||||||||||||||||||
| Site rental revenues | $ | 1,012 | $ | 4,030 | $ | 4,013 | $ | 4,047 | $ | 4,184 | ||||||||||||||||||||||
| COMPANY OVERVIEW |
OUTLOOK |
FINANCIAL
HIGHLIGHTS
|
CAPITALIZATION OVERVIEW | APPENDIX | ||||||||||
PROJECTED EXPENSES FROM EXISTING GROUND LEASES(a)(b) | ||||||||||||||||||||||||||||||||
Remaining Three Months |
Years Ending December 31, | |||||||||||||||||||||||||||||||
(as of September 30, 2025; in millions) |
2025 |
2026 |
2027 |
2028 |
2029 |
|||||||||||||||||||||||||||
Components of ground lease expenses: |
||||||||||||||||||||||||||||||||
Ground lease expenses exclusive of straight-lined expenses |
$ | 172 | $ | 701 | $ | 722 | $ | 741 | $ | 762 | ||||||||||||||||||||||
| Straight-lined expenses | 13 | 45 | 32 | 22 | 11 | |||||||||||||||||||||||||||
Ground lease expenses |
$ | 185 | $ | 746 | $ | 754 | $ | 763 | $ | 773 | ||||||||||||||||||||||
SUMMARY OF TOWER PORTFOLIO BY VINTAGE(c) | ||||||||||||||||||||
(as of September 30, 2025; dollars in thousands) |
Acquired and Built 2006 and Prior | Acquired and Built 2007 to Present | ||||||||||||||||||
Cash yield(d) |
21 | % | 10 | % | ||||||||||||||||
| Number of tenants per tower | 2.9 | 2.2 | ||||||||||||||||||
Last quarter annualized average cash site rental revenue per tower(e) |
$ | 137 | $ | 83 | ||||||||||||||||
Last quarter annualized average site rental gross cash margin per tower(f) |
$ | 118 | $ | 58 | ||||||||||||||||
Net invested capital per tower(g) |
$ | 567 | $ | 593 | ||||||||||||||||
| Number of towers | 11,165 | 28,693 | ||||||||||||||||||
| GROUND INTEREST OVERVIEW | ||||||||||||||||||||||||||||||||||||||||||||
(as of September 30, 2025; dollars in millions) |
LQA Cash Site Rental Revenues(e) |
Percentage of LQA Cash Site Rental Revenues(e) |
LQA Site Rental Gross Cash Margin(f) |
Percentage of LQA Site Rental Gross Cash Margin(f) |
Number of Towers(h) |
Percentage of Towers | Weighted Average Term Remaining (by years)(i) |
|||||||||||||||||||||||||||||||||||||
| Less than 10 years | $ | 432 | 11 | % | $ | 235 | 8 | % | 5,364 | 14 | % | |||||||||||||||||||||||||||||||||
| 10 to 20 years | $ | 566 | 14 | % | $ | 355 | 12 | % | 6,011 | 15 | % | |||||||||||||||||||||||||||||||||
| Greater than 20 years | $ | 1,556 | 40 | % | $ | 1,119 | 37 | % | 16,456 | 41 | % | |||||||||||||||||||||||||||||||||
| Total leased | $ | 2,554 | 65 | % | $ | 1,709 | 57 | % | 27,831 | 70 | % | 35 | ||||||||||||||||||||||||||||||||
| Owned | $ | 1,358 | 35 | % | $ | 1,271 | 43 | % | 12,027 | 30 | % | |||||||||||||||||||||||||||||||||
| Total / Average | $ | 3,912 | 100 | % | $ | 2,980 | 100 | % | 39,858 | 100 | % | |||||||||||||||||||||||||||||||||
| COMPANY OVERVIEW |
OUTLOOK |
FINANCIAL
HIGHLIGHTS
|
CAPITALIZATION OVERVIEW | APPENDIX | ||||||||||
CAPITALIZATION OVERVIEW | ||||||||||||||||||||||||||
(as of September 30, 2025; dollars in millions) |
Face Value(a) |
Fixed vs. Variable | Interest Rate(b) |
Maturity | ||||||||||||||||||||||
Cash and cash equivalents and restricted cash and cash equivalents(c) |
$ | 238 | ||||||||||||||||||||||||
Senior Secured Notes, Series 2009-1, Class A-2(d) |
27 | Fixed | 9.0% | Aug. 2029 | ||||||||||||||||||||||
Senior Secured Tower Revenue Notes, Series 2018-2(e) |
750 | Fixed | 4.2% | July 2048 | ||||||||||||||||||||||
Installment purchase liabilities and finance leases(f) |
260 | Fixed | Various | Various |
||||||||||||||||||||||
| Total secured debt | $ | 1,037 | 4.4% | |||||||||||||||||||||||
2016 Revolver(g) |
900 | Variable | 5.5% | July 2027 | ||||||||||||||||||||||
2016 Term Loan A(h) |
1,072 | Variable | 5.2% | July 2027 | ||||||||||||||||||||||
Commercial Paper Notes(i) |
1,946 | Variable | 4.8% | Various | ||||||||||||||||||||||
| 4.450% Senior Notes | 900 | Fixed | 4.5% | Feb. 2026 | ||||||||||||||||||||||
| 3.700% Senior Notes | 750 | Fixed | 3.7% | June 2026 | ||||||||||||||||||||||
| 1.050% Senior Notes | 1,000 | Fixed | 1.1% | July 2026 | ||||||||||||||||||||||
| 2.900% Senior Notes | 750 | Fixed | 2.9% | Mar. 2027 | ||||||||||||||||||||||
| 4.000% Senior Notes | 500 | Fixed | 4.0% | Mar. 2027 | ||||||||||||||||||||||
| 3.650% Senior Notes | 1,000 | Fixed | 3.7% | Sept. 2027 | ||||||||||||||||||||||
| 5.000% Senior Notes | 1,000 | Fixed | 5.0% | Jan. 2028 | ||||||||||||||||||||||
| 3.800% Senior Notes | 1,000 | Fixed | 3.8% | Feb. 2028 | ||||||||||||||||||||||
| 4.800% Senior Notes | 600 | Fixed | 4.8% | Sept. 2028 | ||||||||||||||||||||||
| 4.300% Senior Notes | 600 | Fixed | 4.3% | Feb. 2029 | ||||||||||||||||||||||
| 5.600% Senior Notes | 750 | Fixed | 5.6% | June 2029 | ||||||||||||||||||||||
| 4.900% Senior Notes | 550 | Fixed | 4.9% | Sept. 2029 | ||||||||||||||||||||||
| 3.100% Senior Notes | 550 | Fixed | 3.1% | Nov. 2029 | ||||||||||||||||||||||
| 3.300% Senior Notes | 750 | Fixed | 3.3% | July 2030 | ||||||||||||||||||||||
| 2.250% Senior Notes | 1,100 | Fixed | 2.3% | Jan. 2031 | ||||||||||||||||||||||
| 2.100% Senior Notes | 1,000 | Fixed | 2.1% | Apr. 2031 | ||||||||||||||||||||||
| 2.500% Senior Notes | 750 | Fixed | 2.5% | July 2031 | ||||||||||||||||||||||
| 5.100% Senior Notes | 750 | Fixed | 5.1% | May 2033 | ||||||||||||||||||||||
| 5.800% Senior Notes | 750 | Fixed | 5.8% | Mar. 2034 | ||||||||||||||||||||||
| 5.200% Senior Notes | 700 | Fixed | 5.2% | Sept. 2034 | ||||||||||||||||||||||
| 2.900% Senior Notes | 1,250 | Fixed | 2.9% | Apr. 2041 | ||||||||||||||||||||||
| 4.750% Senior Notes | 350 | Fixed | 4.8% | May 2047 | ||||||||||||||||||||||
| 5.200% Senior Notes | 400 | Fixed | 5.2% | Feb. 2049 | ||||||||||||||||||||||
| 4.000% Senior Notes | 350 | Fixed | 4.0% | Nov. 2049 | ||||||||||||||||||||||
| 4.150% Senior Notes | 500 | Fixed | 4.2% | July 2050 | ||||||||||||||||||||||
| 3.250% Senior Notes | 900 | Fixed | 3.3% | Jan. 2051 | ||||||||||||||||||||||
| Total unsecured debt | $ | 23,418 | 4.0% | |||||||||||||||||||||||
Net Debt(j) |
$ | 24,217 | 4.0% | |||||||||||||||||||||||
Market Capitalization(k) |
42,019 | |||||||||||||||||||||||||
Firm Value(l) |
$ | 66,236 | ||||||||||||||||||||||||
| COMPANY OVERVIEW |
OUTLOOK | FINANCIAL HIGHLIGHTS |
CAPITALIZATION OVERVIEW | APPENDIX | ||||||||||
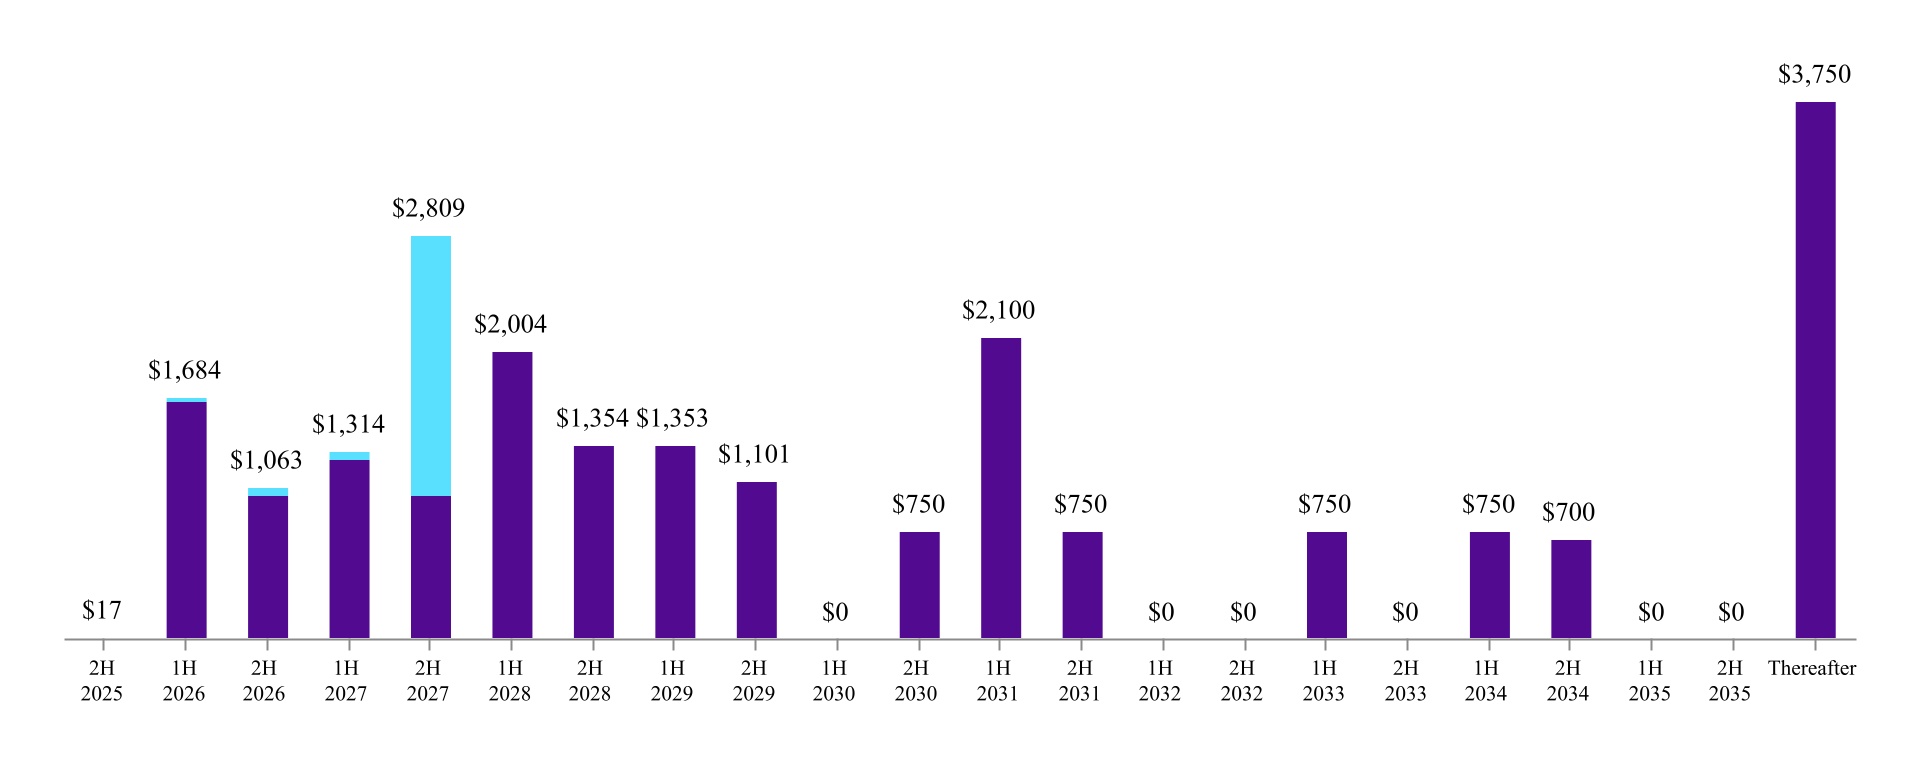
DEBT MATURITY OVERVIEW(a)(b) | ||

| COMPANY OVERVIEW |
OUTLOOK |
FINANCIAL
HIGHLIGHTS
|
CAPITALIZATION OVERVIEW | APPENDIX | ||||||||||
LIQUIDITY OVERVIEW(a) | ||||||||
| (in millions) | September 30, 2025 |
|||||||
Cash and cash equivalents, and restricted cash and cash equivalents(b)(c) |
$ | 238 | ||||||
Undrawn 2016 Revolver availability(d) |
6,061 | |||||||
Total debt and other obligations (current and non-current)(c)(e) |
24,319 | |||||||
Total equity (deficit) |
(1,493) | |||||||
| SUMMARY OF MAINTENANCE AND FINANCIAL COVENANTS | ||||||||||||||||||||||||||
| Debt | Borrower / Issuer | Covenant(f) |
Covenant Level Requirement | As of September 30, 2025 |
||||||||||||||||||||||
Maintenance Financial Covenants(g) | ||||||||||||||||||||||||||
| 2016 Credit Facility | CCI | Total Net Leverage Ratio | ≤ 6.50x | 5.9x | ||||||||||||||||||||||
| 2016 Credit Facility | CCI | Total Senior Secured Leverage Ratio | ≤ 3.50x | 0.2x | ||||||||||||||||||||||
| 2016 Credit Facility | CCI | Consolidated Interest Coverage Ratio(h) |
N/A | N/A | ||||||||||||||||||||||
| Financial covenants requiring excess cash flows to be deposited in a cash trap reserve account and not released | ||||||||||||||||||||||||||
Tower Revenue Notes, Series 2018-2 |
Crown Castle Towers LLC and its Subsidiaries | Debt Service Coverage Ratio | > 1.75x | (i) |
30.5x | |||||||||||||||||||||
| 2009 Securitized Notes | Pinnacle Towers Acquisition Holdings LLC and its Subsidiaries | Debt Service Coverage Ratio | > 1.30x | (i) |
39.9x | |||||||||||||||||||||
| Financial covenants restricting ability of relevant issuer to issue additional notes under the applicable indenture | ||||||||||||||||||||||||||
Tower Revenue Notes, Series 2018-2 |
Crown Castle Towers LLC and its Subsidiaries | Debt Service Coverage Ratio | ≥ 2.00x | (j) |
30.5x | |||||||||||||||||||||
| 2009 Securitized Notes | Pinnacle Towers Acquisition Holdings LLC and its Subsidiaries | Debt Service Coverage Ratio | ≥ 2.34x | (j) |
39.9x | |||||||||||||||||||||
| COMPANY OVERVIEW |
OUTLOOK |
FINANCIAL
HIGHLIGHTS
|
CAPITALIZATION OVERVIEW | APPENDIX | ||||||||||
INTEREST RATE EXPOSURE(a) | ||||||||||||||||||||||||||
(as of September 30, 2025; dollars in millions) | ||||||||||||||||||||||||||
| Fixed Rate Debt | Floating Rate Debt | |||||||||||||||||||||||||
Face value of principal outstanding(b) |
$20,277 | Face value of principal outstanding(b) |
$3,918 | |||||||||||||||||||||||
| % of total debt | 84% | % of total debt | 16% | |||||||||||||||||||||||
| Weighted average interest rate | 3.8% | Weighted average interest rate(c) |
5.1% | |||||||||||||||||||||||
| Upcoming maturities: | 2025 | 2026 | Interest rate sensitivity of 25 bps increase in interest rates: | |||||||||||||||||||||||
Face value of principal outstanding(b) |
$— | $2,650 | Full year effect(d) |
$9.8 | ||||||||||||||||||||||
| Weighted average interest rate | —% | 3.0% | ||||||||||||||||||||||||
| COMPONENTS OF INTEREST EXPENSE | ||||||||||||||||||||||||||||||||||||||||||||
| 2024 | 2025 | |||||||||||||||||||||||||||||||||||||||||||
| (in millions) | Q1 | Q2 | Q3 | Q4 | Q1 | Q2 | Q3 | |||||||||||||||||||||||||||||||||||||
| Interest expense on debt obligations | $ | 223 | $ | 227 | $ | 234 | $ | 236 | $ | 233 | $ | 239 | $ | 244 | ||||||||||||||||||||||||||||||
| Amortization of deferred financing costs and adjustments on long-term debt | 8 | 8 | 8 | 8 | 8 | 8 | 8 | |||||||||||||||||||||||||||||||||||||
| Capitalized interest | (5) | (5) | (6) | (4) | (5) | (4) | (5) | |||||||||||||||||||||||||||||||||||||
| Interest expense and amortization of deferred financing costs, net | $ | 226 | $ | 230 | $ | 236 | $ | 240 | $ | 236 | $ | 243 | $ | 247 | ||||||||||||||||||||||||||||||
| COMPANY OVERVIEW |
OUTLOOK |
FINANCIAL
HIGHLIGHTS
|
CAPITALIZATION OVERVIEW | APPENDIX | ||||||||||
| CONDENSED CONSOLIDATED BALANCE SHEET (Unaudited) | ||||||||||||||
| (in millions, except par values) | September 30, 2025 | December 31, 2024 | ||||||||||||
| ASSETS | ||||||||||||||
| Current assets: | ||||||||||||||
| Cash and cash equivalents | $ | 57 | $ | 100 | ||||||||||
Restricted cash and cash equivalents |
176 | 170 | ||||||||||||
| Receivables, net | 125 | 129 | ||||||||||||
| Prepaid expenses | 89 | 74 | ||||||||||||
Deferred site rental receivables |
226 | 164 | ||||||||||||
| Other current assets | 22 | 24 | ||||||||||||
Current assets of discontinued operations |
419 | 429 | ||||||||||||
| Total current assets | 1,114 | 1,090 | ||||||||||||
| Deferred site rental receivables | 2,244 | 2,279 | ||||||||||||
| Property and equipment, net | 6,330 | 6,577 | ||||||||||||
| Operating lease right-of-use assets | 5,513 | 5,600 | ||||||||||||
| Goodwill | 5,127 | 5,127 | ||||||||||||
| Other intangible assets, net | 905 | 1,037 | ||||||||||||
| Other assets, net | 63 | 58 | ||||||||||||
Non-current assets of discontinued operations |
10,205 | 10,968 | ||||||||||||
| Total assets | $ | 31,501 | $ | 32,736 | ||||||||||
LIABILITIES AND EQUITY (DEFICIT) | ||||||||||||||
| Current liabilities: | ||||||||||||||
| Accounts payable | $ | 65 | $ | 48 | ||||||||||
| Accrued interest | 160 | 244 | ||||||||||||
| Deferred revenues | 147 | 141 | ||||||||||||
| Other accrued liabilities | 156 | 167 | ||||||||||||
| Current maturities of debt and other obligations | 2,769 | 603 | ||||||||||||
| Current portion of operating lease liabilities | 268 | 264 | ||||||||||||
Current liabilities of discontinued operations |
732 | 710 | ||||||||||||
| Total current liabilities | 4,297 | 2,177 | ||||||||||||
| Debt and other long-term obligations | 21,550 | 23,451 | ||||||||||||
| Operating lease liabilities | 4,988 | 5,062 | ||||||||||||
| Other long-term liabilities | 623 | 645 | ||||||||||||
Non-current liabilities of discontinued operations |
1,536 | 1,534 | ||||||||||||
| Total liabilities | 32,994 | 32,869 | ||||||||||||
| Commitments and contingencies | ||||||||||||||
Stockholders' equity (deficit): |
||||||||||||||
Common stock, 0.01 par value; 1,200 shares authorized; shares issued and outstanding: September 30, 2025—435 and December 31, 2024—435 |
4 | 4 | ||||||||||||
| Additional paid-in capital | 18,497 | 18,393 | ||||||||||||
| Accumulated other comprehensive income (loss) | (4) | (5) | ||||||||||||
| Dividends/distributions in excess of earnings | (19,990) | (18,525) | ||||||||||||
Total equity (deficit) |
(1,493) | (133) | ||||||||||||
Total liabilities and equity (deficit) |
$ | 31,501 | $ | 32,736 | ||||||||||
| COMPANY OVERVIEW |
OUTLOOK |
FINANCIAL
HIGHLIGHTS
|
CAPITALIZATION OVERVIEW | APPENDIX | ||||||||||
| CONDENSED CONSOLIDATED STATEMENT OF OPERATIONS (Unaudited) | ||||||||||||||||||||||||||
| Three Months Ended September 30, | Nine Months Ended September 30, | |||||||||||||||||||||||||
| (in millions, except per share amounts) | 2025 | 2024 | 2025 | 2024 | ||||||||||||||||||||||
| Net revenues: | ||||||||||||||||||||||||||
| Site rental | $ | 1,012 | $ | 1,066 | $ | 3,031 | $ | 3,198 | ||||||||||||||||||
| Services and other | 60 | 54 | 162 | 143 | ||||||||||||||||||||||
| Net revenues | 1,072 | 1,120 | 3,193 | 3,341 | ||||||||||||||||||||||
| Operating expenses: | ||||||||||||||||||||||||||
Costs of operations:(a) |
||||||||||||||||||||||||||
| Site rental | 250 | 247 | 741 | 740 | ||||||||||||||||||||||
| Services and other | 30 | 27 | 84 | 81 | ||||||||||||||||||||||
| Selling, general and administrative | 97 | 93 | 289 | 343 | ||||||||||||||||||||||
| Asset write-down charges | 3 | 2 | 7 | 10 | ||||||||||||||||||||||
| Depreciation, amortization and accretion | 167 | 181 | 520 | 552 | ||||||||||||||||||||||
| Restructuring charges | — | 38 | — | 67 | ||||||||||||||||||||||
| Total operating expenses | 547 | 588 | 1,641 | 1,793 | ||||||||||||||||||||||
| Operating income (loss) | 525 | 532 | 1,552 | 1,548 | ||||||||||||||||||||||
| Interest expense and amortization of deferred financing costs, net | (247) | (236) | (726) | (692) | ||||||||||||||||||||||
| Interest income | 3 | 6 | 10 | 14 | ||||||||||||||||||||||
| Other income (expense) | — | (5) | 3 | (3) | ||||||||||||||||||||||
Income (loss) from continuing operations before income taxes |
281 | 297 | 839 | 867 | ||||||||||||||||||||||
| Benefit (provision) for income taxes | (4) | (3) | (13) | (14) | ||||||||||||||||||||||
Income (loss) from continuing operations |
$ | 277 | $ | 294 | $ | 826 | $ | 853 | ||||||||||||||||||
| Discontinued operations: | ||||||||||||||||||||||||||
Income (loss) from discontinued operations before gain (loss) from disposal, net of tax |
277 | 9 | 637 | 12 | ||||||||||||||||||||||
Gain (loss) from disposal of discontinued operations |
(231) | — | (1,313) | — | ||||||||||||||||||||||
Income (loss) from discontinued operations, net of tax |
46 | 9 | (676) | 12 | ||||||||||||||||||||||
| Net income (loss) | $ | 323 | $ | 303 | $ | 150 | $ | 865 | ||||||||||||||||||
| Net income (loss), per common share: | ||||||||||||||||||||||||||
| Income (loss) from continuing operations, basic | $ | 0.64 | $ | 0.68 | $ | 1.89 | $ | 1.96 | ||||||||||||||||||
| Income (loss) from discontinued operations, basic | $ | 0.10 | $ | 0.02 | $ | (1.55) | $ | 0.03 | ||||||||||||||||||
| Net income (loss)—basic | $ | 0.74 | $ | 0.70 | $ | 0.34 | $ | 1.99 | ||||||||||||||||||
Income (loss) from continuing operations, diluted |
$ | 0.64 | $ | 0.68 | $ | 1.89 | $ | 1.96 | ||||||||||||||||||
Income (loss) from discontinued operations, diluted |
$ | 0.10 | $ | 0.02 | $ | (1.55) | $ | 0.03 | ||||||||||||||||||
Net income (loss)—diluted |
$ | 0.74 | $ | 0.70 | $ | 0.34 | $ | 1.99 | ||||||||||||||||||
| Weighted-average common shares outstanding: | ||||||||||||||||||||||||||
| Basic | 435 | 435 | 435 | 434 | ||||||||||||||||||||||
| Diluted | 437 | 436 | 436 | 435 | ||||||||||||||||||||||
| COMPANY OVERVIEW |
OUTLOOK |
FINANCIAL
HIGHLIGHTS
|
CAPITALIZATION OVERVIEW | APPENDIX | ||||||||||
| CONDENSED CONSOLIDATED STATEMENT OF CASH FLOWS (Unaudited) | ||||||||||||||
| Nine Months Ended September 30, | ||||||||||||||
| (in millions) | 2025 | 2024 | ||||||||||||
| Cash flows from operating activities: | ||||||||||||||
| Net income (loss) | $ | 150 | $ | 865 | ||||||||||
(Income) loss from discontinued operations before (gain) loss from disposal, net of tax |
(637) | (12) | ||||||||||||
(Gain) loss from disposal of discontinued operations |
1,313 | — | ||||||||||||
Income (loss) from continuing operations |
826 | 853 | ||||||||||||
Adjustments to reconcile income (loss) from continuing operations to net cash provided by (used for) operating activities: |
||||||||||||||
| Depreciation, amortization and accretion | 520 | 552 | ||||||||||||
| Amortization of deferred financing costs and other non-cash interest | 24 | 24 | ||||||||||||
| Stock-based compensation expense, net | 55 | 69 | ||||||||||||
| Asset write-down charges | 7 | 10 | ||||||||||||
| Deferred income tax (benefit) provision | 1 | 5 | ||||||||||||
| Other non-cash adjustments, net | (4) | 12 | ||||||||||||
| Net cash provided by (used for) operating activities from discontinued operations | 897 | 830 | ||||||||||||
| Changes in assets and liabilities, excluding the effects of acquisitions: | ||||||||||||||
| Increase (decrease) in liabilities | (111) | (208) | ||||||||||||
| Decrease (increase) in assets | (28) | (81) | ||||||||||||
| Net cash provided by (used for) operating activities | 2,187 | 2,066 | ||||||||||||
| Cash flows from investing activities: | ||||||||||||||
| Capital expenditures | (123) | (124) | ||||||||||||
| Payments for acquisitions, net of cash acquired | — | (8) | ||||||||||||
| Other investing activities, net | 5 | 5 | ||||||||||||
| Net cash provided by (used for) investing activities from discontinued operations | (687) | (820) | ||||||||||||
| Net cash provided by (used for) investing activities | (805) | (947) | ||||||||||||
| Cash flows from financing activities: | ||||||||||||||
| Proceeds from issuance of long-term debt | — | 1,244 | ||||||||||||
| Principal payments on debt and other long-term obligations | (89) | (71) | ||||||||||||
| Purchases and redemptions of long-term debt | (1,200) | (750) | ||||||||||||
| Borrowings under revolving credit facility | 900 | — | ||||||||||||
| Payments under revolving credit facility | — | (670) | ||||||||||||
Net issuances (repayments) under commercial paper program |
605 | 1,312 | ||||||||||||
| Payments for financing costs | — | (12) | ||||||||||||
| Purchases of common stock | (23) | (32) | ||||||||||||
| Dividends/distributions paid on common stock | (1,615) | (2,049) | ||||||||||||
| Net cash provided by (used for) financing activities | (1,422) | (1,028) | ||||||||||||
| Net increase (decrease) in cash and cash equivalents and restricted cash and cash equivalents | (40) | 91 | ||||||||||||
| Effect of exchange rate changes on cash | — | (1) | ||||||||||||
Cash and cash equivalents and restricted cash and cash equivalents at beginning of period(a) |
295 | 281 | ||||||||||||
Cash and cash equivalents and restricted cash and cash equivalents at end of period(a) |
$ | 255 | $ | 371 | ||||||||||
| Supplemental disclosure of cash flow information: | ||||||||||||||
| Interest paid | $ | 799 | $ | 739 | ||||||||||
| Income taxes paid (refunded) | $ | 12 | $ | 8 | ||||||||||
| COMPANY OVERVIEW |
OUTLOOK |
FINANCIAL
HIGHLIGHTS
|
CAPITALIZATION OVERVIEW | APPENDIX | ||||||||||
| NON-GAAP MEASURES AND OTHER INFORMATION | ||
| COMPANY OVERVIEW |
OUTLOOK |
FINANCIAL
HIGHLIGHTS
|
CAPITALIZATION OVERVIEW | APPENDIX | ||||||||||
| COMPANY OVERVIEW |
OUTLOOK |
FINANCIAL
HIGHLIGHTS
|
CAPITALIZATION OVERVIEW | APPENDIX | ||||||||||
| COMPANY OVERVIEW |
OUTLOOK |
FINANCIAL
HIGHLIGHTS
|
CAPITALIZATION OVERVIEW | APPENDIX | ||||||||||
| 2024 | 2025 | |||||||||||||||||||||||||||||||||||||||||||
(in millions; totals may not sum due to rounding) |
Q1 | Q2 | Q3 | Q4 | Q1 | Q2 | Q3 | |||||||||||||||||||||||||||||||||||||
Net income (loss)(a) |
$ | 311 | $ | 251 | $ | 303 | $ | (4,768) | $ | (464) | $ | 291 | $ | 323 | ||||||||||||||||||||||||||||||
| Adjustments to increase (decrease) net income (loss) | ||||||||||||||||||||||||||||||||||||||||||||
| Asset write-down charges | 6 | 3 | 2 | 1 | 2 | 2 | 3 | |||||||||||||||||||||||||||||||||||||
| Depreciation, amortization and accretion | 191 | 180 | 181 | 183 | 177 | 175 | 167 | |||||||||||||||||||||||||||||||||||||
Restructuring charges(b) |
11 | 19 | 38 | 3 | — | — | — | |||||||||||||||||||||||||||||||||||||
| Amortization of prepaid lease purchase price adjustments | 4 | 4 | 4 | 4 | 4 | 4 | 4 | |||||||||||||||||||||||||||||||||||||
Interest expense and amortization of deferred financing costs, net(c) |
226 | 230 | 236 | 240 | 236 | 243 | 247 | |||||||||||||||||||||||||||||||||||||
| Interest income | (4) | (4) | (6) | (5) | (3) | (4) | (3) | |||||||||||||||||||||||||||||||||||||
| Other (income) expense | (2) | (1) | 5 | 23 | (1) | (2) | — | |||||||||||||||||||||||||||||||||||||
| (Benefit) provision for income taxes | 6 | 5 | 3 | 4 | 5 | 4 | 4 | |||||||||||||||||||||||||||||||||||||
| Stock-based compensation expense, net | 24 | 26 | 19 | 15 | 18 | 18 | 19 | |||||||||||||||||||||||||||||||||||||
(Income) loss from discontinued operations, net of tax(d) |
(17) | 14 | (9) | 5,077 | 748 | (26) | (46) | |||||||||||||||||||||||||||||||||||||
Adjusted EBITDA(e)(f) |
$ | 754 | $ | 727 | $ | 777 | $ | 777 | $ | 722 | $ | 705 | $ | 718 | ||||||||||||||||||||||||||||||
(in millions; totals may not sum due to rounding) |
Full Year 2025 Outlook(g) |
|||||||||||||
Net income (loss)(a) |
$145 | to | $425 | |||||||||||
| Adjustments to increase (decrease) net income (loss): | ||||||||||||||
| Asset write-down charges | 5 | to | 15 | |||||||||||
| Acquisition and integration costs | — | to | 6 | |||||||||||
| Depreciation, amortization and accretion | 678 | to | 773 | |||||||||||
| Amortization of prepaid lease purchase price adjustments | 14 | to | 16 | |||||||||||
Interest expense and amortization of deferred financing costs, net(h) |
957 | to | 1,002 | |||||||||||
| (Gains) losses on retirement of long-term obligations | — | to | — | |||||||||||
| Interest income | (15) | to | (15) | |||||||||||
| Other (income) expense | 6 | to | 15 | |||||||||||
| (Benefit) provision for income taxes | 11 | to | 19 | |||||||||||
| Stock-based compensation expense, net | 78 | to | 82 | |||||||||||
(Income) loss from discontinued operations, net of tax(i) |
590 | to | 830 | |||||||||||
Adjusted EBITDA(e)(f) |
$2,810 | to | $2,860 | |||||||||||
| COMPANY OVERVIEW |
OUTLOOK |
FINANCIAL
HIGHLIGHTS
|
CAPITALIZATION OVERVIEW | APPENDIX | ||||||||||
(in millions; totals may not sum due to rounding) |
2024 | 2025 | ||||||||||||||||||||||||||||||||||||||||||
| Q1 | Q2 | Q3 | Q4 | Q1 | Q2 | Q3 | ||||||||||||||||||||||||||||||||||||||
Net income (loss)(a) |
$ | 311 | $ | 251 | $ | 303 | $ | (4,768) | $ | (464) | $ | 291 | $ | 323 | ||||||||||||||||||||||||||||||
| Real estate related depreciation, amortization and accretion | 179 | 168 | 170 | 173 | 164 | 162 | 163 | |||||||||||||||||||||||||||||||||||||
| Asset write-down charges | 6 | 3 | 2 | 1 | 2 | 2 | 3 | |||||||||||||||||||||||||||||||||||||
(Income) loss from discontinued operations, net of tax(b) |
(17) | 14 | (9) | 5,077 | 748 | (26) | (46) | |||||||||||||||||||||||||||||||||||||
FFO(c)(d) |
$ | 478 | $ | 436 | $ | 466 | $ | 483 | $ | 451 | $ | 429 | $ | 443 | ||||||||||||||||||||||||||||||
| Weighted-average common shares outstanding—diluted | 435 | 435 | 436 | 435 | 436 | 437 | 437 | |||||||||||||||||||||||||||||||||||||
| FFO (from above) | $ | 478 | $ | 436 | $ | 466 | $ | 483 | $ | 451 | $ | 429 | $ | 443 | ||||||||||||||||||||||||||||||
| Adjustments to increase (decrease) FFO: | ||||||||||||||||||||||||||||||||||||||||||||
| Straight-lined revenues | (57) | (54) | (28) | (20) | (19) | (20) | 11 | |||||||||||||||||||||||||||||||||||||
| Straight-lined expenses | 17 | 17 | 16 | 15 | 15 | 14 | 15 | |||||||||||||||||||||||||||||||||||||
| Stock-based compensation expense, net | 24 | 26 | 19 | 15 | 18 | 18 | 19 | |||||||||||||||||||||||||||||||||||||
| Non-cash portion of tax provision | 6 | — | — | 2 | 5 | (5) | 2 | |||||||||||||||||||||||||||||||||||||
Non-real estate related depreciation, amortization and accretion |
12 | 12 | 11 | 11 | 13 | 13 | 4 | |||||||||||||||||||||||||||||||||||||
| Amortization of non-cash interest expense | 3 | 3 | 2 | 3 | 3 | 4 | 3 | |||||||||||||||||||||||||||||||||||||
| Other (income) expense | (2) | (1) | 5 | 23 | (1) | (2) | — | |||||||||||||||||||||||||||||||||||||
Restructuring charges(e) |
11 | 19 | 38 | 3 | — | — | — | |||||||||||||||||||||||||||||||||||||
| Sustaining capital expenditures | (8) | (9) | (6) | (12) | (7) | (7) | (6) | |||||||||||||||||||||||||||||||||||||
AFFO(c)(d) |
$ | 484 | $ | 449 | $ | 525 | $ | 523 | $ | 479 | $ | 444 | $ | 490 | ||||||||||||||||||||||||||||||
| Weighted-average common shares outstanding—diluted | 435 | 435 | 436 | 435 | 436 | 437 | 437 | |||||||||||||||||||||||||||||||||||||
| COMPANY OVERVIEW |
OUTLOOK |
FINANCIAL
HIGHLIGHTS
|
CAPITALIZATION OVERVIEW | APPENDIX | ||||||||||
(in millions, except per share amounts; totals may not sum due to rounding) |
2024 | 2025 | ||||||||||||||||||||||||||||||||||||||||||
| Q1 | Q2 | Q3 | Q4 | Q1 | Q2 | Q3 | ||||||||||||||||||||||||||||||||||||||
Net income (loss)(a) |
$ | 0.72 | $ | 0.58 | $ | 0.70 | $ | (10.97) | $ | (1.06) | $ | 0.67 | $ | 0.74 | ||||||||||||||||||||||||||||||
| Real estate related depreciation, amortization and accretion | 0.41 | 0.39 | 0.39 | 0.40 | 0.38 | 0.37 | 0.37 | |||||||||||||||||||||||||||||||||||||
| Asset write-down charges | 0.01 | 0.01 | — | — | — | — | 0.01 | |||||||||||||||||||||||||||||||||||||
(Income) loss from discontinued operations, net of tax(b) |
(0.04) | 0.04 | (0.02) | 11.67 | 1.72 | (0.06) | (0.11) | |||||||||||||||||||||||||||||||||||||
FFO(c)(d) |
$ | 1.10 | $ | 1.00 | $ | 1.07 | $ | 1.11 | $ | 1.03 | $ | 0.98 | $ | 1.01 | ||||||||||||||||||||||||||||||
| Weighted-average common shares outstanding—diluted | 435 | 435 | 436 | 435 | 436 | 437 | 437 | |||||||||||||||||||||||||||||||||||||
| FFO (from above) | $ | 1.10 | $ | 1.00 | $ | 1.07 | $ | 1.11 | $ | 1.03 | $ | 0.98 | $ | 1.01 | ||||||||||||||||||||||||||||||
| Adjustments to increase (decrease) FFO: | ||||||||||||||||||||||||||||||||||||||||||||
| Straight-lined revenues | (0.13) | (0.12) | (0.06) | (0.05) | (0.04) | (0.05) | 0.03 | |||||||||||||||||||||||||||||||||||||
| Straight-lined expenses | 0.04 | 0.04 | 0.04 | 0.03 | 0.03 | 0.03 | 0.03 | |||||||||||||||||||||||||||||||||||||
| Stock-based compensation expense, net | 0.06 | 0.06 | 0.04 | 0.03 | 0.04 | 0.04 | 0.04 | |||||||||||||||||||||||||||||||||||||
| Non-cash portion of tax provision | 0.01 | — | — | — | 0.01 | (0.01) | — | |||||||||||||||||||||||||||||||||||||
| Non-real estate related depreciation, amortization and accretion | 0.03 | 0.03 | 0.03 | 0.03 | 0.03 | 0.03 | 0.01 | |||||||||||||||||||||||||||||||||||||
| Amortization of non-cash interest expense | 0.01 | 0.01 | — | 0.01 | 0.01 | 0.01 | 0.01 | |||||||||||||||||||||||||||||||||||||
| Other (income) expense | — | — | 0.01 | 0.05 | — | — | — | |||||||||||||||||||||||||||||||||||||
Restructuring charges(e) |
0.03 | 0.04 | 0.09 | 0.01 | — | — | — | |||||||||||||||||||||||||||||||||||||
| Sustaining capital expenditures | (0.02) | (0.02) | (0.01) | (0.03) | (0.02) | (0.02) | (0.01) | |||||||||||||||||||||||||||||||||||||
AFFO(c)(d) |
$ | 1.11 | $ | 1.03 | $ | 1.20 | $ | 1.20 | $ | 1.10 | $ | 1.02 | $ | 1.12 | ||||||||||||||||||||||||||||||
| Weighted-average common shares outstanding—diluted | 435 | 435 | 436 | 435 | 436 | 437 | 437 | |||||||||||||||||||||||||||||||||||||
| COMPANY OVERVIEW |
OUTLOOK |
FINANCIAL
HIGHLIGHTS
|
CAPITALIZATION OVERVIEW | APPENDIX | ||||||||||
| (in millions, except per share amounts; totals may not sum due to rounding) | Full Year 2025 Outlook(a) |
Full Year 2025 Outlook Per Share(a) |
||||||||||||||||||||||||
Net income (loss)(b) |
$145 | to | $425 | $0.33 | to | $0.97 | ||||||||||||||||||||
| Real estate related depreciation, amortization and accretion | 660 | to | 740 | 1.51 | to | 1.70 | ||||||||||||||||||||
| Asset write-down charges | 5 | to | 15 | 0.01 | to | 0.03 | ||||||||||||||||||||
(Income) loss from discontinued operations, net of tax(c) |
590 | to | 830 | 1.35 | to | 1.90 | ||||||||||||||||||||
FFO(d)(e) |
$1,690 | to | $1,720 | $3.88 | to | $3.94 | ||||||||||||||||||||
| Weighted-average common shares outstanding—diluted | 436 | 436 | ||||||||||||||||||||||||
| FFO (from above) | $1,690 | to | $1,720 | $3.88 | to | $3.94 | ||||||||||||||||||||
| Adjustments to increase (decrease) FFO: | ||||||||||||||||||||||||||
| Straight-lined revenues | (25) | to | 5 | (0.06) | to | 0.01 | ||||||||||||||||||||
| Straight-lined expenses | 55 | to | 75 | 0.13 | to | 0.17 | ||||||||||||||||||||
| Stock-based compensation expense, net | 78 | to | 82 | 0.18 | to | 0.19 | ||||||||||||||||||||
| Non-cash portion of tax provision | (8) | to | 8 | (0.02) | to | 0.02 | ||||||||||||||||||||
| Non-real estate related depreciation, amortization and accretion | 20 | to | 35 | 0.04 | to | 0.08 | ||||||||||||||||||||
| Amortization of non-cash interest expense | 7 | to | 17 | 0.02 | to | 0.04 | ||||||||||||||||||||
| Other (income) expense | 6 | to | 15 | 0.01 | to | 0.03 | ||||||||||||||||||||
| (Gains) losses on retirement of long-term obligations | — | to | — | — | to | — | ||||||||||||||||||||
| Acquisition and integration costs | — | to | 6 | — | to | 0.01 | ||||||||||||||||||||
| Sustaining capital expenditures | (50) | to | (30) | (0.11) | to | (0.07) | ||||||||||||||||||||
AFFO(d)(e) |
$1,845 | to | $1,895 | $4.23 | to | $4.35 | ||||||||||||||||||||
| Weighted-average common shares outstanding—diluted | 436 | 436 | ||||||||||||||||||||||||
(as of September 30, 2025; dollars in millions) |
September 30, 2025 | |||||||
Total debt and other obligations (current and non-current)(f) |
$ | 24,319 | ||||||
| Unamortized adjustments, net | 136 | |||||||
| Total face value of debt | 24,455 | |||||||
Less: Ending cash and cash equivalents and restricted cash and cash equivalents(g) |
238 | |||||||
Net Debt(d) |
$ | 24,217 | ||||||
| COMPANY OVERVIEW |
OUTLOOK |
FINANCIAL
HIGHLIGHTS
|
CAPITALIZATION OVERVIEW | APPENDIX | ||||||||||
| Three Months Ended September 30, | Nine Months Ended September 30, | |||||||||||||||||||||||||
(In millions of dollars; totals may not sum due to rounding) |
2025 | 2024 | 2025 | 2024 | ||||||||||||||||||||||
Net income (loss)(a) |
$ | 323 | $ | 303 | $ | 150 | $ | 865 | ||||||||||||||||||
Adjustments to increase (decrease) income (loss): |
||||||||||||||||||||||||||
| Services and other revenues | (60) | (54) | (162) | (143) | ||||||||||||||||||||||
Services and other costs of operations |
30 | 27 | 84 | 81 | ||||||||||||||||||||||
Selling, general and administrative expenses |
97 | 93 | 289 | 343 | ||||||||||||||||||||||
Asset write-down charges |
3 | 2 | 7 | 10 | ||||||||||||||||||||||
| Depreciation, amortization and accretion | 167 | 181 | 520 | 552 | ||||||||||||||||||||||
| Restructuring charges | — | 38 | — | 67 | ||||||||||||||||||||||
| Amortization of prepaid lease purchase price adjustments | 4 | 4 | 11 | 12 | ||||||||||||||||||||||
| Interest expense and amortization of deferred financing costs, net | 247 | 236 | 726 | 692 | ||||||||||||||||||||||
Interest income |
(3) | (6) | (10) | (14) | ||||||||||||||||||||||
Other (income) expense |
— | 5 | (3) | 3 | ||||||||||||||||||||||
(Benefit) provision for income taxes |
4 | 3 | 13 | 14 | ||||||||||||||||||||||
Stock-based compensation expense, net recorded in site rental costs of operations |
1 | 1 | 3 | 3 | ||||||||||||||||||||||
(Income) loss from discontinued operations, net of tax |
(46) | (9) | 676 | (12) | ||||||||||||||||||||||
Adjusted Site Rental Gross Margin(b)(c) |
$ | 767 | $ | 823 | $ | 2,304 | $ | 2,473 | ||||||||||||||||||
| Three Months Ended September 30, | Nine Months Ended September 30, | |||||||||||||||||||||||||
(In millions of dollars; totals may not sum due to rounding) |
2025 | 2024 | 2025 | 2024 | ||||||||||||||||||||||
Net income (loss)(a) |
$ | 323 | $ | 303 | $ | 150 | $ | 865 | ||||||||||||||||||
Adjustments to increase (decrease) net income (loss): |
||||||||||||||||||||||||||
| Site rental revenues | (1,012) | (1,066) | (3,031) | (3,198) | ||||||||||||||||||||||
Site rental costs of operations(d) |
250 | 247 | 741 | 740 | ||||||||||||||||||||||
Selling, general and administrative expenses |
97 | 93 | 289 | 343 | ||||||||||||||||||||||
| Asset write-down charges | 3 | 2 | 7 | 10 | ||||||||||||||||||||||
| Depreciation, amortization and accretion | 167 | 181 | 520 | 552 | ||||||||||||||||||||||
| Restructuring charges | — | 38 | — | 67 | ||||||||||||||||||||||
| Interest expense and amortization of deferred financing costs, net | 247 | 236 | 726 | 692 | ||||||||||||||||||||||
| Interest income | (3) | (6) | (10) | (14) | ||||||||||||||||||||||
Other (income) expense |
— | 5 | (3) | 3 | ||||||||||||||||||||||
(Benefit) provision for income taxes |
4 | 3 | 13 | 14 | ||||||||||||||||||||||
Stock-based compensation expense, net recorded in services and other costs of operations |
1 | 2 | 4 | 5 | ||||||||||||||||||||||
(Income) loss from discontinued operations, net of tax |
(46) | (9) | 676 | (12) | ||||||||||||||||||||||
Adjusted Services and Other Gross Margin(b)(c) |
$ | 31 | $ | 29 | $ | 82 | $ | 67 | ||||||||||||||||||
| COMPANY OVERVIEW |
OUTLOOK |
FINANCIAL
HIGHLIGHTS
|
CAPITALIZATION OVERVIEW | APPENDIX | ||||||||||
| Nine Months Ended September 30, | ||||||||||||||
(in millions of dollars; totals may not sum due to rounding) |
2025 | 2024 | ||||||||||||
Net cash provided by (used for) operating activities from discontinued operations |
$ | 897 | $ | 830 | ||||||||||
Net cash provided by (used for) investing activities from discontinued operations |
(687) | (820) | ||||||||||||
Free Cash Flow from Discontinued Operations(a) |
$ | 210 | $ | 10 | ||||||||||
(in millions of dollars; totals may not sum due to rounding) |
Full Year 2025 Outlook |
|||||||||||||
Net cash provided by (used for) operating activities from discontinued operations |
$1,220 | to |
$1,320 | |||||||||||
Net cash provided by (used for) investing activities from discontinued operations |
(1,070) | to |
(970) | |||||||||||
Free Cash Flow from Discontinued Operations(a) |
$150 | to |
$350 | |||||||||||