| Delaware | 001-16441 | 76-0470458 | |||||||||||||||||||||
| (State or other jurisdiction of incorporation) |
(Commission File Number) | (IRS Employer Identification No.) | |||||||||||||||||||||
| (Former name or former address, if changed since last report.) | ||
| ☐ | Written communications pursuant to Rule 425 under the Securities Act (17 CFR 230.425) | |||||||
| ☐ | Soliciting material pursuant to Rule 14a-12 under the Exchange Act (17 CFR 240.14a-12) | |||||||
| ☐ | Pre-commencement communications pursuant to Rule 14d-2(b) under the Exchange Act (17 CFR 240.14d-2(b)) | |||||||
| ☐ | Pre-commencement communications pursuant to Rule 13e-4(c) under the Exchange Act (17 CFR 240.13e-4(c)) | |||||||
| Title of each class | Trading Symbol(s) | Name of each exchange on which registered | ||||||
| Common Stock, $0.01 par value | CCI | New York Stock Exchange | ||||||
| Exhibit No. | Description | |||||||
| 99.1 | ||||||||
| 99.2 | ||||||||
| 104 | Cover Page Interactive Data File - the cover page XBRL tags are embedded within the Inline XBRL document | |||||||
| CROWN CASTLE INC. | ||||||||||||||
| By: | /s/ Edward B. Adams, Jr. | |||||||||||||
| Name: | Edward B. Adams, Jr. | |||||||||||||
| Title: | Executive Vice President and General Counsel | |||||||||||||
 |
NEWS RELEASE July 17, 2024 |
|||||||
| Contacts: Dan Schlanger, CFO | |||||
| Kris Hinson, VP Corp Finance & Treasurer | |||||
FOR IMMEDIATE RELEASE |
Crown Castle Inc. | ||||
713-570-3050 |
|||||
| (dollars in millions, except per share amounts) | Current Full Year 2024 Outlook(a) |
Full Year 2023 Actual |
Change |
% Change |
|||||||||||||
| Site rental revenues | $6,340 | $6,532 | $(192) | (3)% | |||||||||||||
| Net income (loss) | $1,158 | $1,502 | $(344) | (23)% | |||||||||||||
| Net income (loss) per share—diluted | $2.67 | $3.46 | $(0.79) | (23)% | |||||||||||||
Adjusted EBITDA(b) |
$4,168 | $4,415 | $(247) | (6)% | |||||||||||||
AFFO(b) |
$3,030 | $3,277 | $(247) | (8)% | |||||||||||||
AFFO per share(b) |
$6.97 | $7.55 | $(0.58) | (8)% | |||||||||||||
| News Release continued: | Page 2 |
|||||||
| (dollars in millions, except per share amounts) | Q2 2024 |
Q2 2023 |
Change | % Change | |||||||||||||
| Site rental revenues | $1,580 | $1,728 | $(148) | (9)% | |||||||||||||
| Net income (loss) | $251 | $455 | $(204) | (45)% | |||||||||||||
| Net income (loss) per share—diluted | $0.58 | $1.05 | $(0.47) | (45)% | |||||||||||||
Adjusted EBITDA(a) |
$1,006 | $1,188 | $(182) | (15)% | |||||||||||||
AFFO(a) |
$704 | $891 | $(187) | (21)% | |||||||||||||
AFFO per share(a) |
$1.62 | $2.05 | $(0.43) | (21)% | |||||||||||||
| News Release continued: | Page 3 |
|||||||
| (in millions, except per share amounts) | Full Year 2024(a) |
||||||||||
Site rental billings(b) |
$5,740 | to | $5,780 | ||||||||
| Amortization of prepaid rent | $392 | to | $417 | ||||||||
| Straight-lined revenues | $162 | to | $187 | ||||||||
| Site rental revenues | $6,317 | to | $6,362 | ||||||||
Site rental costs of operations(c) |
$1,686 | to | $1,731 | ||||||||
| Services and other gross margin | $65 | to | $95 | ||||||||
| Net income (loss) | $1,125 | to | $1,190 | ||||||||
| Net income (loss) per share—diluted | $2.59 | to | $2.74 | ||||||||
Adjusted EBITDA(d) |
$4,143 | to | $4,193 | ||||||||
| Depreciation, amortization and accretion | $1,680 | to | $1,775 | ||||||||
Interest expense and amortization of deferred financing costs, net(e) |
$926 | to | $971 | ||||||||
FFO(d) |
$2,863 | to | $2,893 | ||||||||
AFFO(d) |
$3,005 | to | $3,055 | ||||||||
AFFO per share(d) |
$6.91 | to | $7.02 | ||||||||
Towers Segment discretionary capital expenditures(d) |
$180 | to | $180 | ||||||||
Fiber Segment discretionary capital expenditures(d) |
$1,050 | to | $1,150 | ||||||||
| News Release continued: | Page 4 |
|||||||
| News Release continued: | Page 5 |
|||||||
| News Release continued: | Page 6 |
|||||||
| News Release continued: | Page 7 |
|||||||
| News Release continued: | Page 8 |
|||||||
| News Release continued: | Page 9 |
|||||||
For the Three Months Ended |
For the Six Months Ended |
For the Twelve Months Ended | |||||||||||||||||||||||||||
(in millions; totals may not sum due to rounding) |
June 30, 2024 | June 30, 2023 | June 30, 2024 | June 30, 2023 | December 31, 2023 | ||||||||||||||||||||||||
| Net income (loss) | $ | 251 | $ | 455 | $ | 562 | $ | 874 | $ | 1,502 | |||||||||||||||||||
| Adjustments to increase (decrease) net income (loss): | |||||||||||||||||||||||||||||
| Asset write-down charges | 3 | 22 | 9 | 22 | 33 | ||||||||||||||||||||||||
| Acquisition and integration costs | — | 1 | — | 1 | 1 | ||||||||||||||||||||||||
| Depreciation, amortization and accretion | 430 | 445 | 869 | 876 | 1,754 | ||||||||||||||||||||||||
Restructuring charges(a) |
45 | — | 56 | — | 85 | ||||||||||||||||||||||||
| Amortization of prepaid lease purchase price adjustments | 4 | 4 | 8 | 8 | 16 | ||||||||||||||||||||||||
Interest expense and amortization of deferred financing costs, net(b) |
230 | 208 | 456 | 410 | 850 | ||||||||||||||||||||||||
| Interest income | (4) | (5) | (8) | (7) | (15) | ||||||||||||||||||||||||
| Other (income) expense | 1 | 2 | (1) | 4 | 6 | ||||||||||||||||||||||||
| (Benefit) provision for income taxes | 7 | 7 | 14 | 14 | 26 | ||||||||||||||||||||||||
| Stock-based compensation expense, net | 40 | 50 | 78 | 91 | 157 | ||||||||||||||||||||||||
Adjusted EBITDA(c)(d) |
$ | 1,006 | $ | 1,188 | $ | 2,043 | $ | 2,292 | $ | 4,415 | |||||||||||||||||||
| Full Year 2024 | |||||||||||
(in millions; totals may not sum due to rounding) |
Outlook(f) |
||||||||||
| Net income (loss) | $1,125 | to | $1,190 | ||||||||
| Adjustments to increase (decrease) net income (loss): | |||||||||||
| Asset write-down charges | $42 | to | $52 | ||||||||
| Acquisition and integration costs | $0 | to | $6 | ||||||||
| Depreciation, amortization and accretion | $1,680 | to | $1,775 | ||||||||
Restructuring charges(a) |
$100 | to | $130 | ||||||||
| Amortization of prepaid lease purchase price adjustments | $15 | to | $17 | ||||||||
Interest expense and amortization of deferred financing costs, net(e) |
$926 | to | $971 | ||||||||
| (Gains) losses on retirement of long-term obligations | — | to | — | ||||||||
| Interest income | $(12) | to | $(11) | ||||||||
| Other (income) expense | $0 | to | $9 | ||||||||
| (Benefit) provision for income taxes | $20 | to | $28 | ||||||||
| Stock-based compensation expense, net | $142 | to | $146 | ||||||||
Adjusted EBITDA(c)(d) |
$4,143 | to | $4,193 | ||||||||
| News Release continued: | Page 10 |
|||||||
For the Three Months Ended |
For the Six Months Ended |
For the Twelve Months Ended | |||||||||||||||||||||||||||
(in millions; totals may not sum due to rounding) |
June 30, 2024 | June 30, 2023 | June 30, 2024 | June 30, 2023 | December 31, 2023 | ||||||||||||||||||||||||
| Net income (loss) | $ | 251 | $ | 455 | $ | 562 | $ | 874 | $ | 1,502 | |||||||||||||||||||
| Real estate related depreciation, amortization and accretion | 415 | 424 | 841 | 841 | 1,692 | ||||||||||||||||||||||||
| Asset write-down charges | 3 | 22 | 9 | 22 | 33 | ||||||||||||||||||||||||
FFO(a)(b) |
$ | 669 | $ | 901 | $ | 1,412 | $ | 1,737 | $ | 3,227 | |||||||||||||||||||
| Weighted-average common shares outstanding—diluted | 435 | 434 | 435 | 434 | 434 | ||||||||||||||||||||||||
| FFO (from above) | $ | 669 | $ | 901 | $ | 1,412 | $ | 1,737 | $ | 3,227 | |||||||||||||||||||
| Adjustments to increase (decrease) FFO: | |||||||||||||||||||||||||||||
| Straight-lined revenues | (56) | (80) | (116) | (163) | (274) | ||||||||||||||||||||||||
| Straight-lined expenses | 17 | 18 | 33 | 39 | 73 | ||||||||||||||||||||||||
| Stock-based compensation expense, net | 40 | 50 | 78 | 91 | 157 | ||||||||||||||||||||||||
| Non-cash portion of tax provision | (2) | (6) | 5 | 4 | 8 | ||||||||||||||||||||||||
| Non-real estate related depreciation, amortization and accretion | 15 | 21 | 28 | 35 | 62 | ||||||||||||||||||||||||
| Amortization of non-cash interest expense | 3 | 4 | 6 | 7 | 14 | ||||||||||||||||||||||||
| Other (income) expense | 1 | 2 | (1) | 4 | 6 | ||||||||||||||||||||||||
| Acquisition and integration costs | — | 1 | — | 1 | 1 | ||||||||||||||||||||||||
Restructuring charges(c) |
45 | — | 56 | — | 85 | ||||||||||||||||||||||||
| Sustaining capital expenditures | (27) | (18) | (49) | (33) | (83) | ||||||||||||||||||||||||
AFFO(a)(b) |
$ | 704 | $ | 891 | $ | 1,453 | $ | 1,720 | $ | 3,277 | |||||||||||||||||||
| Weighted-average common shares outstanding—diluted | 435 | 434 | 435 | 434 | 434 | ||||||||||||||||||||||||
| News Release continued: | Page 11 |
|||||||
For the Three Months Ended |
For the Six Months Ended |
For the Twelve Months Ended | |||||||||||||||||||||||||||
(in millions, except per share amounts; totals may not sum due to rounding) |
June 30, 2024 | June 30, 2023 | June 30, 2024 | June 30, 2023 | December 31, 2023 | ||||||||||||||||||||||||
| Net income (loss) | $ | 0.58 | $ | 1.05 | $ | 1.29 | $ | 2.01 | $ | 3.46 | |||||||||||||||||||
| Real estate related depreciation, amortization and accretion | 0.95 | 0.98 | 1.93 | 1.94 | 3.90 | ||||||||||||||||||||||||
| Asset write-down charges | 0.01 | 0.05 | 0.02 | 0.05 | 0.08 | ||||||||||||||||||||||||
FFO(a)(b) |
$ | 1.54 | $ | 2.08 | $ | 3.25 | $ | 4.00 | $ | 7.43 | |||||||||||||||||||
| Weighted-average common shares outstanding—diluted | 435 | 434 | 435 | 434 | 434 | ||||||||||||||||||||||||
| FFO (from above) | $ | 1.54 | $ | 2.08 | $ | 3.25 | $ | 4.00 | $ | 7.43 | |||||||||||||||||||
| Adjustments to increase (decrease) FFO: | |||||||||||||||||||||||||||||
| Straight-lined revenues | (0.13) | (0.18) | (0.27) | (0.38) | (0.63) | ||||||||||||||||||||||||
| Straight-lined expenses | 0.04 | 0.04 | 0.08 | 0.09 | 0.17 | ||||||||||||||||||||||||
| Stock-based compensation expense, net | 0.09 | 0.12 | 0.18 | 0.21 | 0.36 | ||||||||||||||||||||||||
| Non-cash portion of tax provision | — | (0.01) | 0.01 | 0.01 | 0.02 | ||||||||||||||||||||||||
| Non-real estate related depreciation, amortization and accretion | 0.03 | 0.05 | 0.06 | 0.08 | 0.14 | ||||||||||||||||||||||||
| Amortization of non-cash interest expense | 0.01 | 0.01 | 0.01 | 0.02 | 0.03 | ||||||||||||||||||||||||
| Other (income) expense | — | — | — | 0.01 | 0.01 | ||||||||||||||||||||||||
| Acquisition and integration costs | — | — | — | — | — | ||||||||||||||||||||||||
Restructuring charges(c) |
0.10 | — | 0.13 | — | 0.20 | ||||||||||||||||||||||||
| Sustaining capital expenditures | (0.06) | (0.04) | (0.11) | (0.08) | (0.19) | ||||||||||||||||||||||||
AFFO(a)(b) |
$ | 1.62 | $ | 2.05 | $ | 3.34 | $ | 3.96 | $ | 7.55 | |||||||||||||||||||
| Weighted-average common shares outstanding—diluted | 435 | 434 | 434 | 434 | 434 | ||||||||||||||||||||||||
| News Release continued: | Page 12 |
|||||||
| Full Year 2024 | Full Year 2024 | ||||||||||||||||||||||
(in millions; totals may not sum due to rounding) |
Outlook(a) |
Outlook per share(a) |
|||||||||||||||||||||
| Net income (loss) | $1,125 | to | $1,190 | $2.59 | to | $2.74 | |||||||||||||||||
| Real estate related depreciation, amortization and accretion | $1,634 | to | $1,714 | $3.76 | to | $3.94 | |||||||||||||||||
| Asset write-down charges | $42 | to | $52 | $0.10 | to | $0.12 | |||||||||||||||||
FFO(b)(c) |
$2,863 | to | $2,893 | $6.58 | to | $6.65 | |||||||||||||||||
| Weighted-average common shares outstanding—diluted | 435 | 435 | |||||||||||||||||||||
| FFO (from above) | $2,863 | to | $2,893 | $6.58 | to | $6.65 | |||||||||||||||||
| Adjustments to increase (decrease) FFO: | |||||||||||||||||||||||
| Straight-lined revenues | $(187) | to | $(162) | $(0.43) | to | $(0.37) | |||||||||||||||||
| Straight-lined expenses | $55 | to | $75 | $0.13 | to | $0.17 | |||||||||||||||||
| Stock-based compensation expense, net | $142 | to | $146 | $0.33 | to | $0.34 | |||||||||||||||||
| Non-cash portion of tax provision | $2 | to | $17 | $0.00 | to | $0.04 | |||||||||||||||||
| Non-real estate related depreciation, amortization and accretion | $46 | to | $61 | $0.11 | to | $0.14 | |||||||||||||||||
| Amortization of non-cash interest expense | $9 | to | $19 | $0.02 | to | $0.04 | |||||||||||||||||
| Other (income) expense | $0 | to | $9 | $0.00 | to | $0.02 | |||||||||||||||||
| (Gains) losses on retirement of long-term obligations | — | to | — | — | to | — | |||||||||||||||||
| Acquisition and integration costs | $0 | to | $6 | $0.00 | to | $0.01 | |||||||||||||||||
Restructuring charges(d) |
$100 | to | $130 | $0.23 | to | $0.30 | |||||||||||||||||
| Sustaining capital expenditures | $(85) | to | $(65) | $(0.20) | to | $(0.15) | |||||||||||||||||
AFFO(b)(c) |
$3,005 | to | $3,055 | $6.91 | to | $7.02 | |||||||||||||||||
| Weighted-average common shares outstanding—diluted | 435 | 435 | |||||||||||||||||||||
| News Release continued: | Page 13 |
|||||||
| Three Months Ended June 30, | |||||||||||
(dollars in millions; totals may not sum due to rounding) |
2024 | 2023 | |||||||||
| Components of changes in site rental revenues: | |||||||||||
Prior year site rental billings excluding payments for Sprint Cancellations(a) |
$ | 1,354 | $ | 1,304 | |||||||
Prior year payments for Sprint Cancellations(a)(b) |
106 | — | |||||||||
Prior year site rental billings(a) |
1,460 | 1,304 | |||||||||
Core leasing activity(a) |
76 | 73 | |||||||||
| Escalators | 24 | 24 | |||||||||
Non-renewals(a) |
(37) | (42) | |||||||||
Organic Contribution to Site Rental Billings as Adjusted for Impact of Sprint Cancellations(a) |
63 | 54 | |||||||||
Payments for Sprint Cancellations(a)(b) |
(105) | 106 | |||||||||
Non-renewals associated with Sprint Cancellations(a)(b) |
(1) | (6) | |||||||||
Organic Contribution to Site Rental Billings(a) |
(44) | 155 | |||||||||
| Straight-lined revenues | 56 | 80 | |||||||||
| Amortization of prepaid rent | 107 | 188 | |||||||||
Acquisitions(c) |
— | 1 | |||||||||
| Total site rental revenues | $ | 1,580 | $ | 1,728 | |||||||
| Year-over-year changes in revenues: | |||||||||||
Site rental revenues as a percentage of prior year site rental revenues |
(8.6) | % | 10.3 | % | |||||||
Organic Contribution to Site Rental Billings as Adjusted for Impact of Sprint Cancellations as a percentage of prior year site rental billings excluding payments for Sprint Cancellations(a) |
4.7 | % | 4.2 | % | |||||||
Organic Contribution to Site Rental Billings as a percentage of prior year site rental billings(a) |
(3.0) | % | 11.9 | % | |||||||
| News Release continued: | Page 14 |
|||||||
| Three Months Ended June 30, | |||||||||||
(dollars in millions; totals may not sum due to rounding) |
2024 | 2023 | |||||||||
| Components of changes in site rental revenues: | |||||||||||
Prior year site rental billings(a) |
$ | 929 | $ | 877 | |||||||
Core leasing activity(a) |
26 | 38 | |||||||||
| Escalators | 23 | 22 | |||||||||
Non-renewals(a) |
(7) | (8) | |||||||||
Organic Contribution to Site Rental Billings(a) |
42 | 51 | |||||||||
| Straight-lined revenues | 54 | 84 | |||||||||
| Amortization of prepaid rent | 39 | 67 | |||||||||
Acquisitions(b) |
— | 1 | |||||||||
| Other | — | — | |||||||||
| Total site rental revenues | $ | 1,064 | $ | 1,080 | |||||||
| Year-over-year changes in revenues: | |||||||||||
Site rental revenues as a percentage of prior year site rental revenues |
(1.5) | % | 0.2 | % | |||||||
| Changes in revenues as a percentage of prior year site rental billings: | |||||||||||
Organic Contribution to Site Rental Billings(a) |
4.4 | % | 5.8 | % | |||||||
| News Release continued: | Page 15 |
|||||||
| Small Cells | Three Months Ended June 30, | ||||||||||
(dollars in millions; totals may not sum due to rounding) |
2024 | 2023 | |||||||||
| Components of changes in site rental revenues: | |||||||||||
Prior year site rental billings excluding payments for Sprint Cancellations(a) |
$ | 110 | $ | 109 | |||||||
Prior year payments for Sprint Cancellations(a)(b) |
101 | — | |||||||||
Prior year site rental billings(a) |
211 | 109 | |||||||||
Core leasing activity(a) |
11 | 6 | |||||||||
| Escalators | 2 | 2 | |||||||||
Non-renewals(a) |
(1) | (2) | |||||||||
Organic Contribution to Site Rental Billings as Adjusted for Impact of Sprint Cancellations(a) |
12 | 5 | |||||||||
Payments for Sprint Cancellations(a)(b) |
(101) | 101 | |||||||||
Non-renewals associated with Sprint Cancellations(a)(b) |
(1) | (4) | |||||||||
Organic Contribution to Site Rental Billings(a) |
(90) | 102 | |||||||||
| Straight-lined revenues | (1) | (6) | |||||||||
| Amortization of prepaid rent | 50 | 102 | |||||||||
Acquisitions(c) |
— | — | |||||||||
| Total site rental revenues | $ | 170 | $ | 308 | |||||||
| Year-over-year changes in revenues: | |||||||||||
Site rental revenues as a percentage of prior year site rental revenues |
(44.8) | % | 97.4 | % | |||||||
Organic Contribution to Site Rental Billings as Adjusted for Impact of Sprint Cancellations as a percentage of prior year site rental billings excluding payments for Sprint Cancellations(a) |
10.9 | % | 5.0 | % | |||||||
Organic Contribution to Site Rental Billings as a percentage of prior year site rental billings(a) |
(42.5) | % | 93.6 | % | |||||||
| News Release continued: | Page 16 |
|||||||
| Fiber Solutions | Three Months Ended June 30, | ||||||||||
(dollars in millions; totals may not sum due to rounding) |
2024 | 2023 | |||||||||
| Components of changes in site rental revenues: | |||||||||||
Prior year site rental billings excluding payments for Sprint Cancellations(a) |
$ | 314 | $ | 318 | |||||||
Prior year payments for Sprint Cancellations(a)(b) |
5 | — | |||||||||
Prior year site rental billings(a) |
319 | 318 | |||||||||
Core leasing activity(a) |
39 | 30 | |||||||||
| Escalators | — | — | |||||||||
Non-renewals(a) |
(29) | (32) | |||||||||
Organic Contribution to Site Rental Billings as Adjusted for Impact of Sprint Cancellations(a) |
10 | (2) | |||||||||
Payments for Sprint Cancellations(a)(b) |
(4) | 5 | |||||||||
Non-renewals associated with Sprint Cancellations(a)(b) |
(1) | (2) | |||||||||
Organic Contribution to Site Rental Billings(a) |
5 | 1 | |||||||||
| Straight-lined revenues | 3 | 2 | |||||||||
| Amortization of prepaid rent | 18 | 19 | |||||||||
Acquisitions(c) |
— | — | |||||||||
| Total site rental revenues | $ | 346 | $ | 340 | |||||||
| Year-over-year changes in revenues: | |||||||||||
Site rental revenues as a percentage of prior year site rental revenues |
1.8 | % | 2.1 | % | |||||||
Organic Contribution to Site Rental Billings as Adjusted for Impact of Sprint Cancellations as a percentage of prior year site rental billings excluding payments for Sprint Cancellations(a) |
3.2 | % | (0.7) | % | |||||||
Organic Contribution to Site Rental Billings as a percentage of prior year site rental billings(a) |
1.7 | % | 0.4 | % | |||||||
Full Year 2024 Outlook(d) |
|||||||||||||||||||||||||||||||||||
Towers |
Fiber Segment |
||||||||||||||||||||||||||||||||||
| (in millions) | Small Cells |
Fiber Solutions |
|||||||||||||||||||||||||||||||||
Core leasing activity (a) |
$105 | to | $115 | $65 | to | $75 | $135 | to | $145 | ||||||||||||||||||||||||||
Organic Contribution to Site Rental Billings as Adjusted for Impact of Sprint Cancellations as a percentage of prior year site rental billings excluding payments for Sprint Cancellations(a)(e)(f) |
4.5% | 15% | 2% | ||||||||||||||||||||||||||||||||
Organic Contribution to Site Rental Billings as a percentage of prior year site rental billings(a)(e) |
4.5% | (8) | (4) | ||||||||||||||||||||||||||||||||
| News Release continued: | Page 17 |
|||||||
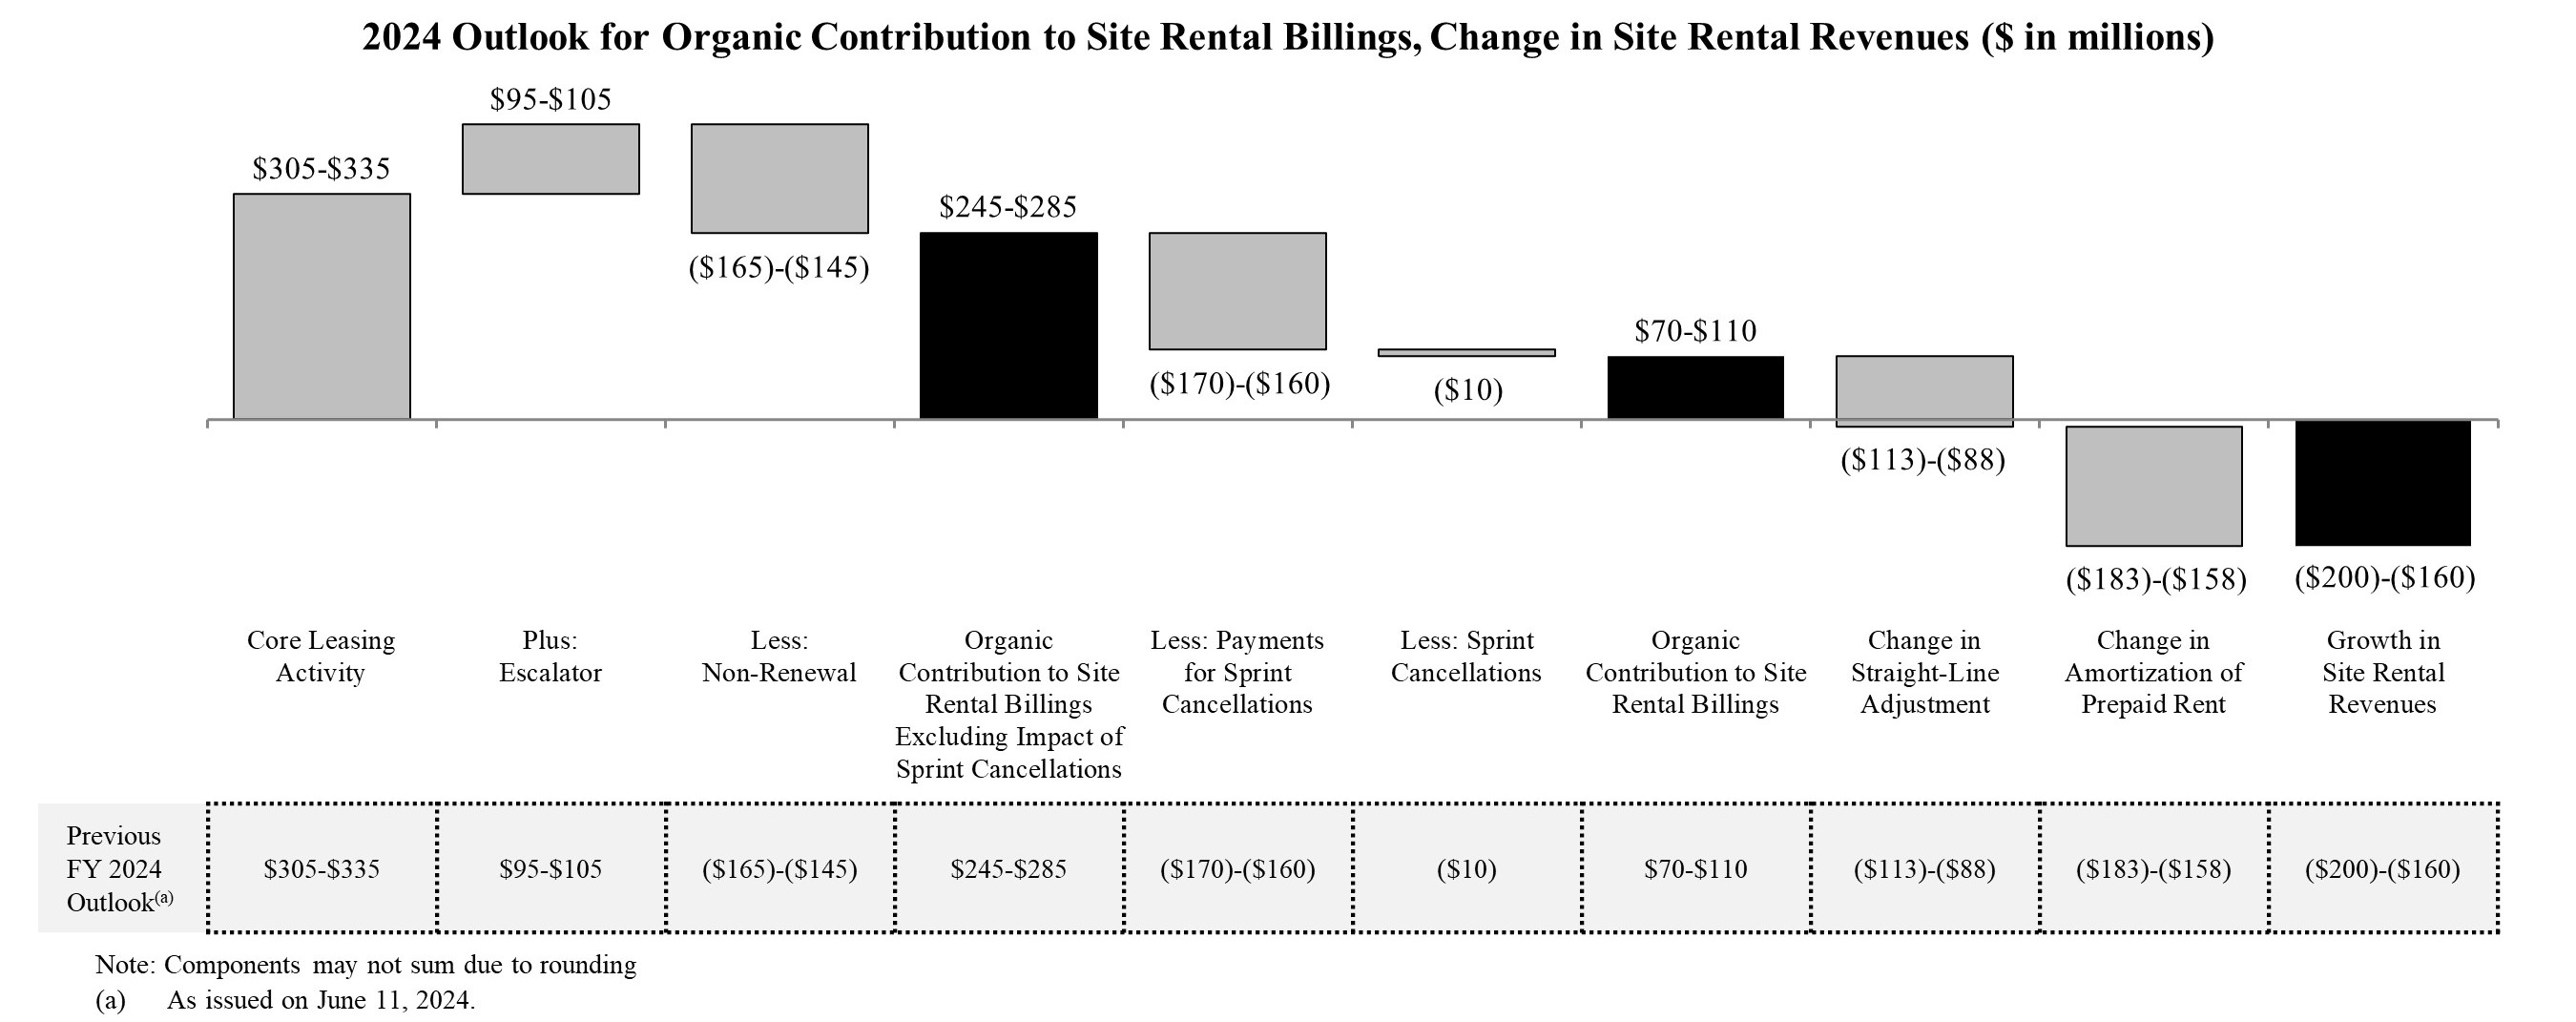
(dollars in millions; totals may not sum due to rounding) |
Full Year 2024 Outlook(a) |
||||||||||
| Components of changes in site rental revenues: | |||||||||||
Prior year site rental billings excluding payments for Sprint Cancellations(b) |
$5,505 | ||||||||||
Prior year payments for Sprint Cancellations(b)(c) |
$170 | ||||||||||
Prior year site rental billings(b) |
$5,675 | ||||||||||
Core leasing activity(b) |
$305 | to | $335 | ||||||||
| Escalators | $95 | to | $105 | ||||||||
Non-renewals(b) |
$(165) | to | $(145) | ||||||||
Organic Contribution to Site Rental Billings as Adjusted for Impact of Sprint Cancellations(b) |
$245 | to | $285 | ||||||||
Payments for Sprint Cancellations(b)(c) |
$(170) | to | $(160) | ||||||||
Non-renewals associated with Sprint Cancellations(b)(c) |
$(10) | to | $(10) | ||||||||
Organic Contribution to Site Rental Billings(b) |
$70 | to | $110 | ||||||||
| Straight-lined revenues | $162 | to | $187 | ||||||||
| Amortization of prepaid rent | $392 | to | $417 | ||||||||
Acquisitions(d) |
— | ||||||||||
| Total site rental revenues | $6,317 | to | $6,362 | ||||||||
Year-over-year changes in revenues:(e) |
|||||||||||
Site rental revenues as a percentage of prior year site rental revenues |
(3.0)% | ||||||||||
Organic Contribution to Site Rental Billings as Adjusted for Impact of Sprint Cancellations as a percentage of prior year site rental billings excluding payments for Sprint Cancellations(b) |
4.8% | ||||||||||
Organic Contribution to Site Rental Billings as a percentage of prior year site rental billings(b) |
1.6% | ||||||||||
| News Release continued: | Page 18 |
|||||||
For the Three Months Ended |
|||||||||||||||||||||||||||||
| June 30, 2024 | June 30, 2023 | ||||||||||||||||||||||||||||
| (in millions) | Towers | Fiber | Other | Total | Towers | Fiber | Other | Total | |||||||||||||||||||||
| Discretionary capital expenditures: | |||||||||||||||||||||||||||||
| Communications infrastructure improvements and other capital projects | $ | 15 | $ | 271 | $ | 5 | $ | 291 | $ | 34 | $ | 298 | $ | 6 | $ | 338 | |||||||||||||
| Purchases of land interests | 11 | — | — | 11 | 23 | — | — | 23 | |||||||||||||||||||||
| Sustaining capital expenditures | 3 | 18 | 6 | 27 | 4 | 8 | 6 | 18 | |||||||||||||||||||||
| Total capital expenditures | $ | 29 | $ | 289 | $ | 11 | $ | 329 | $ | 61 | $ | 306 | $ | 12 | $ | 379 | |||||||||||||
For the Six Months Ended |
|||||||||||||||||||||||||||||
| June 30, 2024 | June 30, 2023 | ||||||||||||||||||||||||||||
| (in millions) | Towers | Fiber | Other | Total | Towers | Fiber | Other | Total | |||||||||||||||||||||
| Discretionary capital expenditures: | |||||||||||||||||||||||||||||
| Communications infrastructure improvements and other capital projects | $ | 35 | $ | 530 | $ | 11 | $ | 576 | $ | 67 | $ | 570 | $ | 12 | $ | 649 | |||||||||||||
| Purchases of land interests | 24 | — | — | 24 | 38 | — | — | 38 | |||||||||||||||||||||
| Sustaining capital expenditures | 5 | 32 | 12 | 49 | 6 | 15 | 12 | 33 | |||||||||||||||||||||
| Total capital expenditures | $ | 64 | $ | 562 | $ | 23 | $ | 649 | $ | 111 | $ | 585 | $ | 24 | $ | 720 | |||||||||||||
| (in millions) | Full Year 2023 |
Full Year 2024 Outlook(b) |
|||||||||||||||||||||
Discretionary capital expenditures |
$1,341 | $1,230 | to | $1,330 | |||||||||||||||||||
Less: Prepaid rent additions(c) |
$348 | ~$355 | |||||||||||||||||||||
Discretionary capital expenditures less prepaid rent additions |
$993 | $875 | to | $975 | |||||||||||||||||||
For the Three Months Ended |
|||||||||||
| (in millions) | June 30, 2024 | June 30, 2023 | |||||||||
| Interest expense on debt obligations | $ | 227 | $ | 205 | |||||||
| Amortization of deferred financing costs and adjustments on long-term debt | 8 | 7 | |||||||||
| Capitalized interest | (5) | (4) | |||||||||
| Interest expense and amortization of deferred financing costs, net | $ | 230 | $ | 208 | |||||||
| (in millions) | Full Year 2024 Outlook(b) |
||||||||||
| Interest expense on debt obligations | $915 | to | $955 | ||||||||
| Amortization of deferred financing costs and adjustments on long-term debt | $20 | to | $30 | ||||||||
| Capitalized interest | $(17) | to | $(7) | ||||||||
| Interest expense and amortization of deferred financing costs, net | $926 | to | $971 | ||||||||
| News Release continued: | Page 19 |
|||||||
| (in millions) | Face Value(a) |
Final Maturity | |||||||||
Cash and cash equivalents and restricted cash and cash equivalents |
$ | 331 | |||||||||
Senior Secured Notes, Series 2009-1, Class A-2(b) |
36 | Aug. 2029 | |||||||||
Senior Secured Tower Revenue Notes, Series 2015-2(c) |
700 | May 2045 | |||||||||
Senior Secured Tower Revenue Notes, Series 2018-2(c) |
750 | July 2048 | |||||||||
Finance leases and other obligations(d) |
295 | Various | |||||||||
| Total secured debt | $ | 1,781 | |||||||||
2016 Revolver(e) |
— | July 2027 | |||||||||
2016 Term Loan A(f) |
1,155 | July 2027 | |||||||||
Commercial Paper Notes(g) |
1,438 | Various |
|||||||||
3.200% Senior Notes |
750 | Sept. 2024 | |||||||||
1.350% Senior Notes |
500 | July 2025 | |||||||||
4.450% Senior Notes |
900 | Feb. 2026 | |||||||||
3.700% Senior Notes |
750 | June 2026 | |||||||||
| 1.050% Senior Notes | 1,000 | July 2026 | |||||||||
| 2.900% Senior Notes | 750 | Mar. 2027 | |||||||||
4.000% Senior Notes |
500 | Mar. 2027 | |||||||||
3.650% Senior Notes |
1,000 | Sept. 2027 | |||||||||
| 5.000% Senior Notes | 1,000 | Jan. 2028 | |||||||||
3.800% Senior Notes |
1,000 | Feb. 2028 | |||||||||
| 4.800% Senior Notes | 600 | Sept. 2028 | |||||||||
4.300% Senior Notes |
600 | Feb. 2029 | |||||||||
5.600% Senior Notes |
750 | June 2029 | |||||||||
| 3.100% Senior Notes | 550 | Nov. 2029 | |||||||||
3.300% Senior Notes |
750 | July 2030 | |||||||||
2.250% Senior Notes |
1,100 | Jan. 2031 | |||||||||
| 2.100% Senior Notes | 1,000 | Apr. 2031 | |||||||||
| 2.500% Senior Notes | 750 | July 2031 | |||||||||
| 5.100% Senior Notes | 750 | May 2033 | |||||||||
5.800% Senior Notes |
750 | Mar. 2034 | |||||||||
| 2.900% Senior Notes | 1,250 | Apr. 2041 | |||||||||
4.750% Senior Notes |
350 | May 2047 | |||||||||
5.200% Senior Notes |
400 | Feb. 2049 | |||||||||
| 4.000% Senior Notes | 350 | Nov. 2049 | |||||||||
| 4.150% Senior Notes | 500 | July 2050 | |||||||||
| 3.250% Senior Notes | 900 | Jan. 2051 | |||||||||
| Total unsecured debt | $ | 22,093 | |||||||||
Net Debt(h) |
$ | 23,543 | |||||||||
| News Release continued: | Page 20 |
|||||||
| News Release continued: | Page 21 |
|||||||
| News Release continued: | Page 22 |
|||||||
|
CROWN CASTLE INC.
CONDENSED CONSOLIDATED BALANCE SHEET (UNAUDITED)
(Amounts in millions, except par values)
|
||||
| June 30, 2024 |
December 31, 2023 | ||||||||||
| ASSETS | |||||||||||
| Current assets: | |||||||||||
| Cash and cash equivalents | $ | 155 | $ | 105 | |||||||
Restricted cash and cash equivalents |
171 | 171 | |||||||||
| Receivables, net | 420 | 481 | |||||||||
| Prepaid expenses | 155 | 103 | |||||||||
| Deferred site rental receivables | 129 | 116 | |||||||||
| Other current assets | 51 | 56 | |||||||||
| Total current assets | 1,081 | 1,032 | |||||||||
| Deferred site rental receivables | 2,341 | 2,239 | |||||||||
| Property and equipment, net | 15,698 | 15,666 | |||||||||
| Operating lease right-of-use assets | 5,930 | 6,187 | |||||||||
| Goodwill | 10,085 | 10,085 | |||||||||
| Other intangible assets, net | 2,974 | 3,179 | |||||||||
| Other assets, net | 137 | 139 | |||||||||
| Total assets | $ | 38,246 | $ | 38,527 | |||||||
| LIABILITIES AND EQUITY | |||||||||||
| Current liabilities: | |||||||||||
| Accounts payable | $ | 225 | $ | 252 | |||||||
| Accrued interest | 228 | 219 | |||||||||
| Deferred revenues | 509 | 605 | |||||||||
| Other accrued liabilities | 359 | 342 | |||||||||
| Current maturities of debt and other obligations | 865 | 835 | |||||||||
| Current portion of operating lease liabilities | 308 | 332 | |||||||||
| Total current liabilities | 2,494 | 2,585 | |||||||||
| Debt and other long-term obligations | 22,854 | 22,086 | |||||||||
| Operating lease liabilities | 5,354 | 5,561 | |||||||||
| Other long-term liabilities | 1,892 | 1,914 | |||||||||
| Total liabilities | 32,594 | 32,146 | |||||||||
| Commitments and contingencies | |||||||||||
| Stockholders' equity: | |||||||||||
Common stock, 0.01 par value; 1,200 shares authorized; shares issued and outstanding: June 30, 2024—435 and December 31, 2023—434 |
4 | 4 | |||||||||
| Additional paid-in capital | 18,347 | 18,270 | |||||||||
| Accumulated other comprehensive income (loss) | (5) | (4) | |||||||||
| Dividends/distributions in excess of earnings | (12,694) | (11,889) | |||||||||
| Total equity | 5,652 | 6,381 | |||||||||
| Total liabilities and equity | $ | 38,246 | $ | 38,527 | |||||||
| News Release continued: | Page 23 |
|||||||
|
CROWN CASTLE INC.
CONDENSED CONSOLIDATED STATEMENT OF OPERATIONS (UNAUDITED)
(Amounts in millions, except per share amounts)
|
||||
| Three Months Ended June 30, | Six Months Ended June 30, | ||||||||||||||||||||||
| 2024 | 2023 | 2024 | 2023 | ||||||||||||||||||||
| Net revenues: | |||||||||||||||||||||||
| Site rental | $ | 1,580 | $ | 1,728 | $ | 3,168 | $ | 3,352 | |||||||||||||||
| Services and other | 46 | 139 | 99 | 288 | |||||||||||||||||||
| Net revenues | 1,626 | 1,867 | 3,267 | 3,640 | |||||||||||||||||||
| Operating expenses: | |||||||||||||||||||||||
Costs of operations:(a) |
|||||||||||||||||||||||
| Site rental | 432 | 424 | 862 | 839 | |||||||||||||||||||
| Services and other | 27 | 98 | 61 | 202 | |||||||||||||||||||
| Selling, general and administrative | 204 | 210 | 387 | 405 | |||||||||||||||||||
| Asset write-down charges | 3 | 22 | 9 | 22 | |||||||||||||||||||
| Acquisition and integration costs | — | 1 | — | 1 | |||||||||||||||||||
| Depreciation, amortization and accretion | 430 | 445 | 869 | 876 | |||||||||||||||||||
Restructuring charges |
45 | — | 56 | — | |||||||||||||||||||
| Total operating expenses | 1,141 | 1,200 | 2,244 | 2,345 | |||||||||||||||||||
| Operating income (loss) | 485 | 667 | 1,023 | 1,295 | |||||||||||||||||||
| Interest expense and amortization of deferred financing costs, net | (230) | (208) | (456) | (410) | |||||||||||||||||||
| Interest income | 4 | 5 | 8 | 7 | |||||||||||||||||||
| Other income (expense) | (1) | (2) | 1 | (4) | |||||||||||||||||||
| Income (loss) before income taxes | 258 | 462 | 576 | 888 | |||||||||||||||||||
| Benefit (provision) for income taxes | (7) | (7) | (14) | (14) | |||||||||||||||||||
| Net income (loss) | $ | 251 | $ | 455 | $ | 562 | $ | 874 | |||||||||||||||
| Net income (loss), per common share: | |||||||||||||||||||||||
| Basic | $ | 0.58 | $ | 1.05 | $ | 1.29 | $ | 2.02 | |||||||||||||||
| Diluted | $ | 0.58 | $ | 1.05 | $ | 1.29 | $ | 2.01 | |||||||||||||||
| Weighted-average common shares outstanding: | |||||||||||||||||||||||
| Basic | 435 | 434 | 434 | 433 | |||||||||||||||||||
| Diluted | 435 | 434 | 435 | 434 | |||||||||||||||||||
| News Release continued: | Page 24 |
|||||||
|
CROWN CASTLE INC.
CONDENSED CONSOLIDATED STATEMENT OF CASH FLOWS (UNAUDITED)
(In millions of dollars)
|
||||
| Six Months Ended June 30, | |||||||||||
| 2024 | 2023 | ||||||||||
| Cash flows from operating activities: | |||||||||||
| Net income (loss) | $ | 562 | $ | 874 | |||||||
| Adjustments to reconcile net income (loss) to net cash provided by (used for) operating activities: | |||||||||||
| Depreciation, amortization and accretion | 869 | 876 | |||||||||
| (Gains) losses on retirement of long-term obligations | — | — | |||||||||
| Amortization of deferred financing costs and other non-cash interest | 18 | 14 | |||||||||
| Stock-based compensation expense, net | 78 | 91 | |||||||||
| Asset write-down charges | 9 | 22 | |||||||||
| Deferred income tax (benefit) provision | 5 | 1 | |||||||||
| Other non-cash adjustments, net | 8 | 2 | |||||||||
| Changes in assets and liabilities, excluding the effects of acquisitions: | |||||||||||
| Increase (decrease) in liabilities | (99) | (35) | |||||||||
| Decrease (increase) in assets | (83) | (120) | |||||||||
| Net cash provided by (used for) operating activities | 1,367 | 1,725 | |||||||||
| Cash flows from investing activities: | |||||||||||
| Capital expenditures | (649) | (720) | |||||||||
| Payments for acquisitions, net of cash acquired | (1) | (89) | |||||||||
| Other investing activities, net | — | 3 | |||||||||
| Net cash provided by (used for) investing activities | (650) | (806) | |||||||||
| Cash flows from financing activities: | |||||||||||
| Proceeds from issuance of long-term debt | — | 2,347 | |||||||||
| Principal payments on debt and other long-term obligations | (36) | (39) | |||||||||
| Purchases and redemptions of long-term debt | — | — | |||||||||
| Borrowings under revolving credit facility | — | 2,113 | |||||||||
| Payments under revolving credit facility | (670) | (2,739) | |||||||||
| Net borrowings (repayments) under commercial paper program | 1,438 | (1,024) | |||||||||
| Payments for financing costs | — | (23) | |||||||||
| Purchases of common stock | (30) | (29) | |||||||||
| Dividends/distributions paid on common stock | (1,368) | (1,364) | |||||||||
| Net cash provided by (used for) financing activities | (666) | (758) | |||||||||
Net increase (decrease) in cash and cash equivalents and restricted cash |
51 | 161 | |||||||||
| Effect of exchange rate changes on cash | (1) | — | |||||||||
Cash and cash equivalents and restricted cash and cash equivalents at beginning of period |
281 | 327 | |||||||||
Cash and cash equivalents and restricted cash and cash equivalents at end of period |
$ | 331 | $ | 488 | |||||||
| Supplemental disclosure of cash flow information: | |||||||||||
| Interest paid | 441 | 367 | |||||||||
| Income taxes paid (refunded) | 9 | 10 | |||||||||
| News Release continued: | Page 25 |
|||||||
|
CROWN CASTLE INC.
SEGMENT OPERATING RESULTS (UNAUDITED)
(In millions of dollars)
|
||||
| SEGMENT OPERATING RESULTS | |||||||||||||||||||||||||||||||||||||||||||||||
Three Months Ended June 30, 2024 |
Three Months Ended June 30, 2023 |
||||||||||||||||||||||||||||||||||||||||||||||
| Towers | Fiber | Other | Total |
Towers | Fiber | Other | Total |
||||||||||||||||||||||||||||||||||||||||
| Segment site rental revenues | $ | 1,064 | $ | 516 | $ | 1,580 | $ | 1,080 | $ | 648 | $ | 1,728 | |||||||||||||||||||||||||||||||||||
| Segment services and other revenues | 43 | 3 | 46 | 124 | 15 | 139 | |||||||||||||||||||||||||||||||||||||||||
| Segment revenues | 1,107 | 519 | 1,626 | 1,204 | 663 | 1,867 | |||||||||||||||||||||||||||||||||||||||||
| Segment site rental costs of operations | 245 | 178 | 423 | 243 | 171 | 414 | |||||||||||||||||||||||||||||||||||||||||
| Segment services and other costs of operations | 23 | 2 | 25 | 92 | 3 | 95 | |||||||||||||||||||||||||||||||||||||||||
Segment costs of operations(a)(b) |
268 | 180 | 448 | 335 | 174 | 509 | |||||||||||||||||||||||||||||||||||||||||
Segment site rental gross margin(c) |
819 | 338 | 1,157 | 837 | 477 | 1,314 | |||||||||||||||||||||||||||||||||||||||||
Segment services and other gross margin(c) |
20 | 1 | 21 | 32 | 12 | 44 | |||||||||||||||||||||||||||||||||||||||||
Segment selling, general and administrative expenses(b) |
16 | 50 | 66 | 30 | 51 | 81 | |||||||||||||||||||||||||||||||||||||||||
Segment operating profit(c) |
823 | 289 | 1,112 | 839 | 438 | 1,277 | |||||||||||||||||||||||||||||||||||||||||
Other selling, general and administrative expenses(b) |
$ | 105 | 105 | $ | 88 | 88 | |||||||||||||||||||||||||||||||||||||||||
| Stock-based compensation expense, net | 40 | 40 | 50 | 50 | |||||||||||||||||||||||||||||||||||||||||||
Depreciation, amortization and accretion |
430 | 430 | 445 | 445 | |||||||||||||||||||||||||||||||||||||||||||
Restructuring charges(d) |
45 | 45 | — | — | |||||||||||||||||||||||||||||||||||||||||||
| Interest expense and amortization of deferred financing costs, net | 230 | 230 | 208 | 208 | |||||||||||||||||||||||||||||||||||||||||||
Other (income) expenses to reconcile to income (loss) before income taxes(e) |
4 | 4 | 24 | 24 | |||||||||||||||||||||||||||||||||||||||||||
Income (loss) before income taxes |
$ | 258 | $ | 462 | |||||||||||||||||||||||||||||||||||||||||||
| News Release continued: | Page 26 |
|||||||
| SEGMENT OPERATING RESULTS | |||||||||||||||||||||||||||||||||||||||||||||||
Six Months Ended June 30, 2024 |
Six Months Ended June 30, 2023 |
||||||||||||||||||||||||||||||||||||||||||||||
| Towers | Fiber | Other | Total |
Towers | Fiber | Other | Total |
||||||||||||||||||||||||||||||||||||||||
| Segment site rental revenues | $ | 2,132 | $ | 1,036 | $ | 3,168 | $ | 2,161 | $ | 1,191 | $ | 3,352 | |||||||||||||||||||||||||||||||||||
| Segment services and other revenues | 89 | 10 | 99 | 270 | 18 | 288 | |||||||||||||||||||||||||||||||||||||||||
| Segment revenues | 2,221 | 1,046 | 3,267 | 2,431 | 1,209 | 3,640 | |||||||||||||||||||||||||||||||||||||||||
| Segment site rental costs of operations | 483 | 360 | 843 | 477 | 343 | 820 | |||||||||||||||||||||||||||||||||||||||||
| Segment services and other costs of operations | 51 | 7 | 58 | 191 | 5 | 196 | |||||||||||||||||||||||||||||||||||||||||
Segment costs of operations(a)(b) |
534 | 367 | 901 | 668 | 348 | 1,016 | |||||||||||||||||||||||||||||||||||||||||
Segment site rental gross margin(c) |
1,649 | 676 | 2,325 | 1,684 | 848 | 2,532 | |||||||||||||||||||||||||||||||||||||||||
Segment services and other gross margin(c) |
38 | 3 | 41 | 79 | 13 | 92 | |||||||||||||||||||||||||||||||||||||||||
Segment selling, general and administrative expenses(b) |
37 | 97 | 134 | 61 | 100 | 161 | |||||||||||||||||||||||||||||||||||||||||
Segment operating profit(c) |
1,650 | 582 | 2,232 | 1,702 | 761 | 2,463 | |||||||||||||||||||||||||||||||||||||||||
Other selling, general and administrative expenses(b) |
$ | 189 | 189 | $ | 170 | 170 | |||||||||||||||||||||||||||||||||||||||||
| Stock-based compensation expense, net | 78 | 78 | 91 | 91 | |||||||||||||||||||||||||||||||||||||||||||
Depreciation, amortization and accretion |
869 | 869 | 876 | 876 | |||||||||||||||||||||||||||||||||||||||||||
Restructuring charges(d) |
56 | 56 | — | — | |||||||||||||||||||||||||||||||||||||||||||
| Interest expense and amortization of deferred financing costs, net | 456 | 456 | 410 | 410 | |||||||||||||||||||||||||||||||||||||||||||
Other (income) expenses to reconcile to income (loss) before income taxes(e) |
8 | 8 | 28 | 28 | |||||||||||||||||||||||||||||||||||||||||||
Income (loss) before income taxes |
$ | 576 | $ | 888 | |||||||||||||||||||||||||||||||||||||||||||

| TABLE OF CONTENTS | |||||
| Page | |||||
| Company Overview | |||||
| Company Profile | |||||
| Strategy | |||||
| General Company Information | |||||
| Asset Portfolio Footprint | |||||
| Historical Common Stock Data | |||||
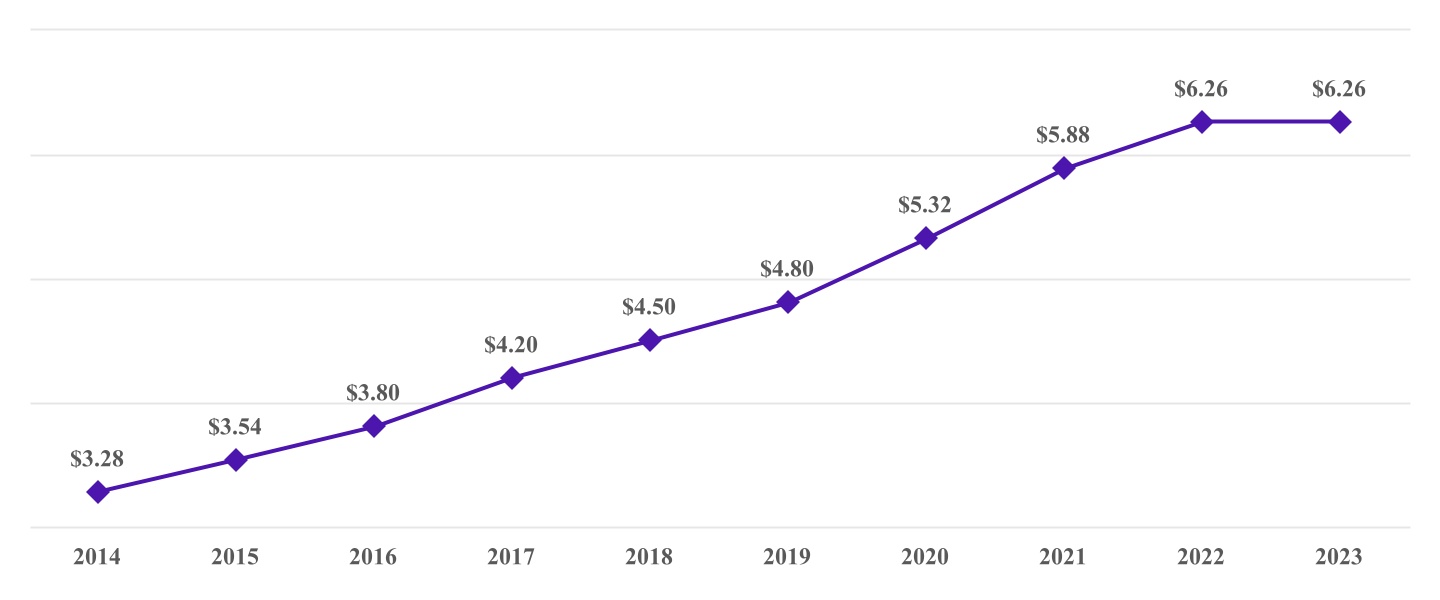
| Annualized Fourth Quarter Dividends Per Share | |||||
| Executive Management Team | |||||
| Board of Directors | |||||
| Research Coverage | |||||
| Outlook | |||||
| Outlook | |||||
| Outlook for Components of Changes in Site Rental Revenues | |||||
| Outlook for Components of Changes in Site Rental Revenues by Line of Business | |||||
| Outlook for Capital Expenditures | |||||
| Outlook for Components of Interest Expense | |||||
| Consolidated Financials | |||||
| Consolidated Summary Financial Highlights | |||||
| Consolidated Components of Changes in Site Rental Revenues | |||||
| Consolidated Summary of Capital Expenditures | |||||
| Consolidated Return on Invested Capital | |||||
| Consolidated Tenant Overview | |||||
| Consolidated Annualized Rental Cash Payments at Time of Renewal | |||||
| Consolidated Projected Revenues from Tenant Contracts | |||||
| Consolidated Projected Expenses from Existing Ground Leases and Fiber Access Agreements | |||||
| Capitalization Overview | |||||
| Capitalization Overview | |||||
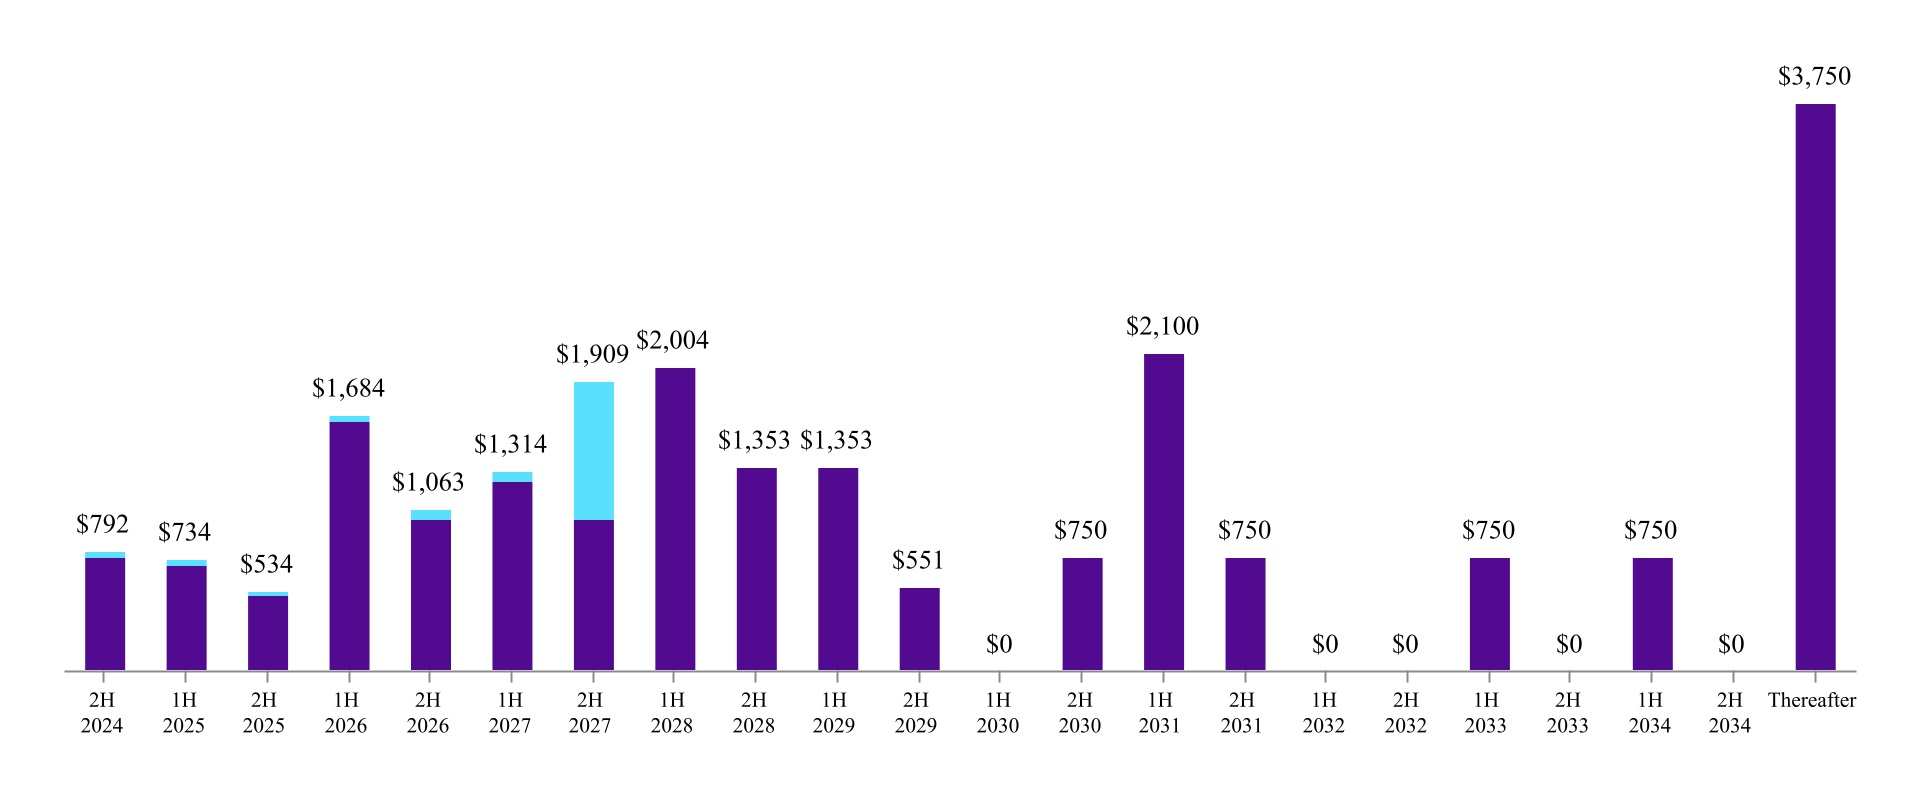
| Debt Maturity Overview | |||||
| Liquidity Overview | |||||
| Summary of Maintenance and Financial Covenants | |||||
| Interest Rate Exposure | |||||
| Components of Interest Expense | |||||
| Towers Segment | |||||
| Towers Segment Summary Financial Highlights | |||||
| Towers Segment Components of Changes in Site Rental Revenues | |||||
| Towers Segment Summary of Capital Expenditures | |||||
| Towers Segment Portfolio Highlights | |||||
| Towers Segment Cash Yield on Invested Capital | |||||
| Summary of Tower Portfolio by Vintage | |||||
| Ground Interest Overview | |||||
| Fiber Segment | |||||
| Fiber Segment Summary Financial Highlights | |||||
| Fiber Segment Components of Changes in Site Rental Revenues | |||||
| Fiber Segment Summary of Capital Expenditures | |||||
| Fiber Segment Revenue Detail by Line of Business | |||||
| Fiber Segment Portfolio Highlights | |||||
| Fiber Segment Cash Yield on Invested Capital | |||||
| Fiber Solutions Revenue Mix | |||||
| Appendix of Condensed Consolidated Financial Statements and Non-GAAP Reconciliations | |||||
| COMPANY OVERVIEW |
OUTLOOK | CONSOLIDATED FINANCIALS | CAPITALIZATION OVERVIEW | TOWERS SEGMENT | FIBER SEGMENT | APPENDIX | ||||||||||||||
COMPANY PROFILE | ||||||||||||||
STRATEGY | ||||||||||||||
| COMPANY OVERVIEW |
OUTLOOK | CONSOLIDATED FINANCIALS | CAPITALIZATION OVERVIEW | TOWERS SEGMENT | FIBER SEGMENT | APPENDIX | ||||||||||||||
| GENERAL COMPANY INFORMATION | |||||
| Principal executive offices | 8020 Katy Freeway, Houston, TX 77024 | ||||
| Common shares trading symbol | CCI | ||||
| Stock exchange listing | New York Stock Exchange | ||||
| Fiscal year ending date | December 31 | ||||
| Fitch - Long-term Issuer Default Rating | BBB+ | ||||
| Moody’s - Long-term Corporate Family Rating | Baa3 | ||||
| Standard & Poor’s - Long-term Local Issuer Credit Rating | BBB | ||||
| ASSET PORTFOLIO FOOTPRINT | ||
 | ||
| HISTORICAL COMMON STOCK DATA | |||||||||||||||||
| Three Months Ended | |||||||||||||||||
| (in millions, except per share amounts) | 6/30/23 | 9/30/23 | 12/31/23 | 3/31/24 | 6/30/24 | ||||||||||||
High price(b) |
$ | 126.82 | $ | 111.55 | $ | 114.47 | $ | 113.57 | $ | 104.06 | |||||||
Low price(b) |
$ | 101.25 | $ | 84.94 | $ | 81.02 | $ | 100.28 | $ | 91.00 | |||||||
Period end closing price(c) |
$ | 107.33 | $ | 88.10 | $ | 111.77 | $ | 104.17 | $ | 97.70 | |||||||
| Dividends paid per common share | $ | 1.57 | $ | 1.57 | $ | 1.57 | $ | 1.57 | $ | 1.57 | |||||||
Volume weighted average price for the period(b) |
$ | 109.38 | $ | 97.35 | $ | 98.94 | $ | 105.67 | $ | 96.82 | |||||||
| Common shares outstanding, at period end | 434 | 434 | 434 | 435 | 435 | ||||||||||||
Market value of outstanding common shares, at period end(d) |
$ | 46,545 | $ | 38,209 | $ | 48,477 | $ | 45,264 | $ | 42,457 | |||||||
| COMPANY OVERVIEW |
OUTLOOK | CONSOLIDATED FINANCIALS | CAPITALIZATION OVERVIEW | TOWERS SEGMENT | FIBER SEGMENT | APPENDIX | ||||||||||||||
ANNUALIZED FOURTH QUARTER DIVIDENDS PER SHARE(a) | ||
| EXECUTIVE MANAGEMENT TEAM | |||||||||||
| Age | Years with Company | Position | |||||||||
Steven J. Moskowitz |
61 | <1 | President and Chief Executive Officer |
||||||||
| Daniel K. Schlanger | 50 | 8 | Executive Vice President and Chief Financial Officer | ||||||||
| Michael J. Kavanagh | 56 | 13 | Executive Vice President and Chief Operating Officer - Towers |
||||||||
| Christopher D. Levendos | 56 | 6 | Executive Vice President and Chief Operating Officer - Fiber |
||||||||
| Edward B. Adams, Jr. | 55 | 7 | Executive Vice President and General Counsel | ||||||||
Edmond Chan |
54 | <1 | Executive Vice President and Chief Information Officer |
||||||||
| BOARD OF DIRECTORS | ||||||||||||||
| Name | Position | Committees | Age | Years as Director | ||||||||||
| P. Robert Bartolo | Chair | NESG(b), Fiber Review, Finance |
52 | 10 | ||||||||||
| Cindy Christy | Director | Compensation, NESG(b) |
58 | 16 | ||||||||||
| Ari Q. Fitzgerald | Director | Compensation, NESG(b) |
61 | 21 | ||||||||||
| Jason Genrich | Director | Fiber Review, Finance |
37 | <1 |
||||||||||
| Andrea J. Goldsmith | Director | Compensation |
59 | 6 | ||||||||||
| Tammy K. Jones | Director | Audit, NESG(b), Finance |
58 | 3 | ||||||||||
| Kevin T. Kabat | Director | Compensation, NESG(b) |
67 | <1 |
||||||||||
| Anthony J. Melone | Director | Audit, Fiber Review |
63 | 9 | ||||||||||
Steven J. Moskowitz |
Director |
61 | <1 |
|||||||||||
| Sunit S. Patel | Director | Audit, Fiber Review, Finance |
62 | <1 |
||||||||||
| Bradley E. Singer | Director |
Audit, Finance |
57 | <1 |
||||||||||
| Kevin A. Stephens | Director |
Audit, Compensation, Fiber Review |
62 | 3 | ||||||||||
| Matthew Thornton III | Director |
Compensation |
65 | 3 | ||||||||||
| COMPANY OVERVIEW |
OUTLOOK | CONSOLIDATED FINANCIALS | CAPITALIZATION OVERVIEW | TOWERS SEGMENT | FIBER SEGMENT | APPENDIX | ||||||||||||||
| RESEARCH COVERAGE | ||||||||
| Equity Research | ||||||||
| Bank of America David Barden (646) 855-1320 |
Barclays Brendan Lynch (212) 526-9428 |
BMO Capital Markets Ari Klein (212) 885-4103 |
||||||
| Citigroup Michael Rollins (212) 816-1116 |
Deutsche Bank Matthew Niknam (212) 250-4711 |
Goldman Sachs
Jim Schneider
(212) 357-2929
|
||||||
| Green Street David Guarino (949) 640-8780 |
HSBC
Luigi Minerva
(207) 991-6928
|
Jefferies Jonathan Petersen (212) 284-1705 |
||||||
|
JPMorgan
Richard Choe
(212) 622-6708
|
KeyBanc Brandon Nispel (503) 821-3871 |
LightShed Partners Walter Piecyk (646) 450-9258 |
||||||
| MoffettNathanson Nick Del Deo (212) 519-0025 |
Morgan Stanley Simon Flannery (212) 761-6432 |
New Street Research Jonathan Chaplin (212) 921-9876 |
||||||
| Raymond James Ric Prentiss (727) 567-2567 |
RBC Capital Markets Jonathan Atkin (415) 633-8589 |
Scotiabank
Maher Yaghi
(437) 995-5548
|
||||||
|
TD Cowen
Michael Elias
(646) 562-1358
|
UBS Batya Levi (212) 713-8824 |
Wells Fargo Securities, LLC Eric Luebchow (312) 630-2386 |
||||||
| Wolfe Research Andrew Rosivach (646) 582-9350 |
||||||||
| Rating Agencies | ||||||||
|
Fitch
Salonie Sehgal
(312) 368-3137
|
Moody’s
Ranjini Venkatesan
(212) 553-3828
|
Standard & Poor’s Ryan Gilmore (212) 438-0602 |
||||||
| COMPANY OVERVIEW |
OUTLOOK | CONSOLIDATED FINANCIALS | CAPITALIZATION OVERVIEW | TOWERS SEGMENT | FIBER SEGMENT | APPENDIX | ||||||||||||||
| OUTLOOK | |||||||||||
| (in millions, except per share amounts) | Full Year 2024 Outlook(a) |
||||||||||
Site rental billings(b) |
$5,740 | to | $5,780 | ||||||||
| Amortization of prepaid rent | $392 | to | $417 | ||||||||
| Straight-lined revenues | $162 | to | $187 | ||||||||
| Site rental revenues | $6,317 | to | $6,362 | ||||||||
Site rental costs of operations(c) |
$1,686 | to | $1,731 | ||||||||
| Services and other gross margin | $65 | to | $95 | ||||||||
| Net income (loss) | $1,125 | to | $1,190 | ||||||||
| Net income (loss) per share—diluted | $2.59 | to | $2.74 | ||||||||
Adjusted EBITDA(d) |
$4,143 | to | $4,193 | ||||||||
| Depreciation, amortization and accretion | $1,680 | to | $1,775 | ||||||||
Interest expense and amortization of deferred financing costs, net(e) |
$926 | to | $971 | ||||||||
FFO(d) |
$2,863 | to | $2,893 | ||||||||
AFFO(d) |
$3,005 | to | $3,055 | ||||||||
AFFO per share(d) |
$6.91 | to | $7.02 | ||||||||
| OUTLOOK FOR COMPONENTS OF CHANGES IN SITE RENTAL REVENUES | |||||||||||
(dollars in millions; totals may not sum due to rounding) |
Full Year 2024 Outlook(a) |
||||||||||
| Components of changes in site rental revenues: | |||||||||||
Prior year site rental billings excluding payments for Sprint Cancellations(b) |
$5,505 | ||||||||||
Prior year payments for Sprint Cancellations(b)(f) |
$170 | ||||||||||
Prior year site rental billings(b) |
$5,675 | ||||||||||
Core leasing activity(b) |
$305 | to | $335 | ||||||||
| Escalators | $95 | to | $105 | ||||||||
Non-renewals(b) |
$(165) | to | $(145) | ||||||||
Organic Contribution to Site Rental Billings as Adjusted for Impact of Sprint Cancellations(b) |
$245 | to | $285 | ||||||||
Payments for Sprint Cancellations(b)(f) |
$(170) | to | $(160) | ||||||||
Non-renewals associated with Sprint Cancellations(b)(f) |
$(10) | to | $(10) | ||||||||
Organic Contribution to Site Rental Billings(b) |
$70 | to | $110 | ||||||||
| Straight-lined revenues | $162 | to | $187 | ||||||||
| Amortization of prepaid rent | $392 | to | $417 | ||||||||
Acquisitions(g) |
— | to | — | ||||||||
| Total site rental revenues | $6,317 | to | $6,362 | ||||||||
Year-over-year changes in revenues:(h) |
|||||||||||
Site rental revenues as a percentage of prior year site rental revenues |
(3.0)% | ||||||||||
Organic Contribution to Site Rental Billings as Adjusted for Impact of Sprint Cancellations as a percentage of prior year site rental billings excluding payments for Sprint Cancellations(b) |
4.8% | ||||||||||
Organic Contribution to Site Rental Billings as a percentage of prior year site rental billings(b) |
1.6% | ||||||||||
| COMPANY OVERVIEW |
OUTLOOK | CONSOLIDATED FINANCIALS | CAPITALIZATION OVERVIEW | TOWERS SEGMENT | FIBER SEGMENT | APPENDIX | ||||||||||||||
| OUTLOOK FOR COMPONENTS OF CHANGES IN SITE RENTAL REVENUES BY LINE OF BUSINESS | |||||||||||||||||||||||||||||||||||
Full Year 2024 Outlook(a) |
|||||||||||||||||||||||||||||||||||
| Towers Segment | Fiber Segment | ||||||||||||||||||||||||||||||||||
| (dollars in millions) | Small Cells | Fiber Solutions | |||||||||||||||||||||||||||||||||
Core leasing activity(b) |
$105 | to | $115 | $65 | to | $75 | $135 | to | $145 | ||||||||||||||||||||||||||
Organic Contribution to Site Rental Billings as Adjusted for Impact of Sprint Cancellations as a percentage of prior year site rental billings excluding payments for Sprint Cancellations(b)(c)(d) |
4.5% | 15% | 2% | ||||||||||||||||||||||||||||||||
Organic Contribution to Site Rental Billings as a percentage of prior year site rental billings(b)(c) |
4.5% | (8) | (4) | ||||||||||||||||||||||||||||||||
| OUTLOOK FOR CAPITAL EXPENDITURES | |||||||||||||||||||||||||||||||||||
Full Year 2024 Outlook(a)(e) |
|||||||||||||||||||||||||||||||||||
| (in millions) | Towers Segment | Fiber Segment | Total | ||||||||||||||||||||||||||||||||
| Capital expenditures | ~$180 | $1,050 | to |
$1,150 | $1,230 | to | $1,330 | ||||||||||||||||||||||||||||
Less: Prepaid rent additions(f) |
~$80 | ~$275 | ~$355 | ||||||||||||||||||||||||||||||||
| Capital expenditures less prepaid rent additions | ~$100 | $775 | to |
$875 | $875 | to | $975 | ||||||||||||||||||||||||||||
| OUTLOOK FOR COMPONENTS OF INTEREST EXPENSE | |||||||||||
| (in millions) | Full Year 2024 Outlook(a) |
||||||||||
| Interest expense on debt obligations | $915 | to | $955 | ||||||||
| Amortization of deferred financing costs and adjustments on long-term debt | $20 | to | $30 | ||||||||
| Capitalized interest | $(17) | to | $(7) | ||||||||
| Interest expense and amortization of deferred financing costs, net | $926 | to | $971 | ||||||||
| COMPANY OVERVIEW |
OUTLOOK | CONSOLIDATED FINANCIALS | CAPITALIZATION OVERVIEW | TOWERS SEGMENT | FIBER SEGMENT | APPENDIX | ||||||||||||||
| CONSOLIDATED SUMMARY FINANCIAL HIGHLIGHTS | |||||||||||||||||||||||||||||||||||
| 2023 | 2024 | ||||||||||||||||||||||||||||||||||
(in millions, except per share amounts; totals may not sum due to rounding) |
Q1 | Q2 | Q3 | Q4 | Q1 | Q2 | |||||||||||||||||||||||||||||
| Net revenues: | |||||||||||||||||||||||||||||||||||
| Site rental | |||||||||||||||||||||||||||||||||||
Site rental billings(a) |
$ | 1,404 | $ | 1,460 | $ | 1,393 | $ | 1,418 | $ | 1,423 | $ | 1,417 | |||||||||||||||||||||||
| Amortization of prepaid rent | 137 | 188 | 126 | 134 | 106 | 107 | |||||||||||||||||||||||||||||
| Straight-lined revenues | 83 | 80 | 58 | 51 | 59 | 56 | |||||||||||||||||||||||||||||
| Total site rental | 1,624 | 1,728 | 1,577 | 1,603 | 1,588 | 1,580 | |||||||||||||||||||||||||||||
| Services and other | 149 | 139 | 90 | 71 | 53 | 46 | |||||||||||||||||||||||||||||
| Net revenues | $ | 1,773 | $ | 1,867 | $ | 1,667 | $ | 1,674 | $ | 1,641 | $ | 1,626 | |||||||||||||||||||||||
| Select operating expenses: | |||||||||||||||||||||||||||||||||||
Costs of operations(b) |
|||||||||||||||||||||||||||||||||||
| Site rental exclusive of straight-lined expenses | $ | 398 | $ | 406 | $ | 403 | $ | 390 | $ | 414 | $ | 416 | |||||||||||||||||||||||
| Straight-lined expenses | 17 | 18 | 17 | 17 | 16 | 16 | |||||||||||||||||||||||||||||
| Total site rental | 415 | 424 | 420 | 407 | 430 | 432 | |||||||||||||||||||||||||||||
| Services and other | 104 | 98 | 66 | 48 | 34 | 27 | |||||||||||||||||||||||||||||
| Total costs of operations | 519 | 522 | 486 | 455 | 464 | 459 | |||||||||||||||||||||||||||||
| Selling, general and administrative | $ | 195 | $ | 210 | $ | 176 | $ | 178 | $ | 183 | $ | 204 | |||||||||||||||||||||||
| Net income (loss) | $ | 418 | $ | 455 | $ | 265 | $ | 361 | $ | 311 | $ | 251 | |||||||||||||||||||||||
Adjusted EBITDA(c) |
1,104 | 1,188 | 1,047 | 1,076 | 1,036 | 1,006 | |||||||||||||||||||||||||||||
| Depreciation, amortization and accretion | 431 | 445 | 439 | 439 | 439 | 430 | |||||||||||||||||||||||||||||
| Interest expense and amortization of deferred financing costs, net | 202 | 208 | 217 | 223 | 226 | 230 | |||||||||||||||||||||||||||||
FFO(c) |
835 | 901 | 698 | 790 | 742 | 669 | |||||||||||||||||||||||||||||
AFFO(c) |
$ | 828 | $ | 891 | $ | 767 | $ | 790 | $ | 749 | $ | 704 | |||||||||||||||||||||||
Weighted-average common shares outstanding— diluted |
434 | 434 | 434 | 434 | 435 | 435 | |||||||||||||||||||||||||||||
| Net income (loss) per share—diluted | $ | 0.97 | $ | 1.05 | $ | 0.61 | $ | 0.83 | $ | 0.71 | $ | 0.58 | |||||||||||||||||||||||
AFFO per share(c) |
$ | 1.91 | $ | 2.05 | $ | 1.77 | $ | 1.82 | $ | 1.72 | $ | 1.62 | |||||||||||||||||||||||
| COMPANY OVERVIEW |
OUTLOOK | CONSOLIDATED FINANCIALS | CAPITALIZATION OVERVIEW | TOWERS SEGMENT | FIBER SEGMENT | APPENDIX | ||||||||||||||
| CONSOLIDATED COMPONENTS OF CHANGES IN SITE RENTAL REVENUES | |||||||||||||||||||||||||||||||||||
| 2023 | 2024 | ||||||||||||||||||||||||||||||||||
(dollars in millions; totals may not sum due to rounding) |
Q1 | Q2 | Q3 | Q4 | Q1 | Q2 | |||||||||||||||||||||||||||||
| Components of changes in site rental revenues: | |||||||||||||||||||||||||||||||||||
Prior year site rental billings excluding payments for Sprint Cancellations(a) |
$ | 1,318 | $ | 1,304 | $ | 1,339 | $ | 1,348 | $ | 1,357 | $ | 1,354 | |||||||||||||||||||||||
Prior year payments for Sprint Cancellations(a)(b) |
— | — | — | — | 48 | 106 | |||||||||||||||||||||||||||||
Prior year site rental billings(a) |
$ | 1,318 | $ | 1,304 | $ | 1,339 | $ | 1,348 | $ | 1,405 | $ | 1,460 | |||||||||||||||||||||||
Core leasing activity(a) |
57 | 73 | 66 | 79 | 81 | 76 | |||||||||||||||||||||||||||||
| Escalators | 24 | 24 | 24 | 24 | 24 | 24 | |||||||||||||||||||||||||||||
Non-renewals(a) |
(42) | (42) | (37) | (36) | (37) | (37) | |||||||||||||||||||||||||||||
Organic Contribution to Site Rental Billings as Adjusted for Impact of Sprint Cancellations(a) |
39 | 54 | 53 | 67 | 68 | 63 | |||||||||||||||||||||||||||||
Payments for Sprint Cancellations(a)(c) |
48 | 106 | 6 | 10 | (44) | (105) | |||||||||||||||||||||||||||||
Non-renewals associated with Sprint Cancellations(a)(c) |
(2) | (6) | (6) | (7) | (6) | (1) | |||||||||||||||||||||||||||||
Organic Contribution to Site Rental Billings(a) |
85 | 155 | 53 | 70 | 17 | (44) | |||||||||||||||||||||||||||||
| Straight-lined revenues | 83 | 80 | 58 | 51 | 59 | 56 | |||||||||||||||||||||||||||||
| Amortization of prepaid rent | 137 | 188 | 126 | 134 | 106 | 107 | |||||||||||||||||||||||||||||
Acquisitions(d) |
1 | 1 | 1 | 1 | — | — | |||||||||||||||||||||||||||||
| Total site rental revenues | $ | 1,624 | $ | 1,728 | $ | 1,577 | $ | 1,603 | $ | 1,588 | $ | 1,580 | |||||||||||||||||||||||
| Year-over-year changes in revenues: | |||||||||||||||||||||||||||||||||||
Site rental revenues as a percentage of prior year site rental revenues |
3.0 | % | 10.3 | % | 0.6 | % | 1.6 | % | (2.2) | % | (8.6) | % | |||||||||||||||||||||||
Organic Contribution to Site Rental Billings as Adjusted for Impact of Sprint Cancellations as a percentage of prior year site rental billings excluding payments for Sprint Cancellations(a) |
2.9 | % | 4.2 | % | 4.0 | % | 4.9 | % | 5.0 | % | 4.7 | % | |||||||||||||||||||||||
Organic Contribution to Site Rental Billings as a percentage of prior year site rental billings(a) |
6.4 | % | 11.9 | % | 3.9 | % | 5.2 | % | 1.2 | % | (3.0) | % | |||||||||||||||||||||||
CONSOLIDATED SUMMARY OF CAPITAL EXPENDITURES(a) | |||||||||||||||||||||||||||||||||||
| 2023 | 2024 | ||||||||||||||||||||||||||||||||||
(dollars in millions; totals may not sum due to rounding) |
Q1 | Q2 | Q3 | Q4 | Q1 | Q2 | |||||||||||||||||||||||||||||
| Discretionary capital expenditures: | |||||||||||||||||||||||||||||||||||
| Communications infrastructure improvements and other capital projects | $ | 311 | $ | 338 | $ | 312 | $ | 316 | $ | 285 | $ | 291 | |||||||||||||||||||||||
| Purchases of land interests | 15 | 23 | 13 | 13 | 13 | 11 | |||||||||||||||||||||||||||||
| Total discretionary capital expenditures | 326 | 361 | 325 | 329 | 298 | 302 | |||||||||||||||||||||||||||||
| Sustaining capital expenditures | 15 | 18 | 22 | 28 | 22 | 27 | |||||||||||||||||||||||||||||
| Total capital expenditures | 341 | 379 | 347 | 357 | 320 | 329 | |||||||||||||||||||||||||||||
Less: Prepaid rent additions(e) |
81 | 84 | 80 | 103 | 68 | 98 | |||||||||||||||||||||||||||||
| Capital expenditures less prepaid rent additions | $ | 260 | $ | 295 | $ | 267 | $ | 254 | $ | 252 | $ | 231 | |||||||||||||||||||||||
| COMPANY OVERVIEW |
OUTLOOK | CONSOLIDATED FINANCIALS | CAPITALIZATION OVERVIEW | TOWERS SEGMENT | FIBER SEGMENT | APPENDIX | ||||||||||||||
CONSOLIDATED RETURN ON INVESTED CAPITAL(a) | ||||||||
(as of June 30, 2024; dollars in millions) |
Q2 2024 LQA |
Q2 2023 LQA |
||||||
Adjusted EBITDA(b) |
$ | 4,024 | $ | 4,752 | ||||
| Cash taxes (paid) refunded | (36) | (49) | ||||||
Adjusted EBITDA less cash taxes paid |
$ | 3,988 | $ | 4,703 | ||||
Historical gross investment in property and equipment(c) |
$ | 29,465 | $ | 28,193 | ||||
| Historical gross investment in site rental contracts and tenant relationships | 7,879 | 7,866 | ||||||
| Historical gross investment in goodwill | 10,085 | 10,085 | ||||||
Consolidated Invested Capital(a) |
$ | 47,429 | $ | 46,144 | ||||
Consolidated Return on Invested Capital(a) |
8.4 | % | 10.2 | % | ||||
| CONSOLIDATED TENANT OVERVIEW | |||||||||||
(as of June 30, 2024) |
Percentage of Q2 2024 LQA Site Rental Revenues |
Weighted Average Current Term Remaining(d) |
Long-Term Credit Rating (S&P / Moody’s) |
||||||||
| T-Mobile | 35% | 7 | BBB / Baa2 |
||||||||
| AT&T | 19% | 5 | BBB / Baa2 | ||||||||
| Verizon | 20% | 7 | BBB+ / Baa1 | ||||||||
| All Others Combined | 26% | 4 | N/A | ||||||||
| Total / Weighted Average | 100% | 6 | |||||||||
CONSOLIDATED ANNUALIZED RENTAL CASH PAYMENTS AT TIME OF RENEWAL(e) | ||||||||||||||||||||
Remaining Six Months |
Years Ending December 31, | |||||||||||||||||||
(as of June 30, 2024; in millions) |
2024 |
2025 |
2026 |
2027 |
2028 |
|||||||||||||||
| T-Mobile | $ | 14 | $ | 240 | $ | 53 | $ | 58 | $ | 41 | ||||||||||
| AT&T | 8 | 20 | 29 | 31 | 755 | |||||||||||||||
| Verizon | 11 | 35 | 35 | 32 | 45 | |||||||||||||||
| All Others Combined | 108 | 213 | 223 | 133 | 84 | |||||||||||||||
| Total | $ | 141 | $ | 508 | $ | 340 | $ | 254 | $ | 925 | ||||||||||
| COMPANY OVERVIEW |
OUTLOOK | CONSOLIDATED FINANCIALS | CAPITALIZATION OVERVIEW | TOWERS SEGMENT | FIBER SEGMENT | APPENDIX | ||||||||||||||
CONSOLIDATED PROJECTED REVENUES FROM TENANT CONTRACTS(a) | ||||||||||||||||||||
Remaining Six Months |
Years Ending December 31, | |||||||||||||||||||
(as of June 30, 2024; in millions) |
2024 |
2025 |
2026 |
2027 |
2028 |
|||||||||||||||
| Components of site rental revenues: | ||||||||||||||||||||
Site rental billings(b) |
$ | 2,892 | $ | 5,678 | $ | 5,795 | $ | 5,921 | $ | 6,046 | ||||||||||
| Amortization of prepaid rent | 185 | 310 | 266 | 224 | 180 | |||||||||||||||
| Straight-lined revenues | 57 | 47 | (61) | (181) | (244) | |||||||||||||||
| Site rental revenues | $ | 3,134 | $ | 6,035 | $ | 6,000 | $ | 5,964 | $ | 5,982 | ||||||||||
CONSOLIDATED PROJECTED EXPENSES FROM EXISTING GROUND LEASES AND FIBER ACCESS AGREEMENTS(c) | ||||||||||||||||||||
Remaining Six Months |
Years Ending December 31, | |||||||||||||||||||
(as of June 30, 2024; in millions) |
2024 |
2025 |
2026 |
2027 |
2028 |
|||||||||||||||
| Components of ground lease and fiber access agreement expenses: | ||||||||||||||||||||
| Ground lease and fiber access agreement expenses exclusive of straight-lined expenses | $ | 525 | $ | 1,065 | $ | 1,087 | $ | 1,109 | $ | 1,130 | ||||||||||
| Straight-lined expenses | 29 | 48 | 35 | 23 | 13 | |||||||||||||||
| Ground lease and fiber access agreement expenses | $ | 554 | $ | 1,113 | $ | 1,122 | $ | 1,132 | $ | 1,143 | ||||||||||
| COMPANY OVERVIEW |
OUTLOOK | CONSOLIDATED FINANCIALS | CAPITALIZATION OVERVIEW | TOWERS SEGMENT | FIBER SEGMENT | APPENDIX | ||||||||||||||
CAPITALIZATION OVERVIEW | |||||||||||||||||
(as of June 30, 2024; dollars in millions) |
Face Value(a) |
Fixed vs. Variable | Interest Rate(b) |
Debt to LQA Adjusted EBITDA(c) |
Maturity | ||||||||||||
Cash and cash equivalents and restricted cash and cash equivalents |
$ | 331 | |||||||||||||||
Senior Secured Notes, Series 2009-1, Class A-2(d) |
36 | Fixed | 9.0% | 2029 | |||||||||||||
Senior Secured Tower Revenue Notes, Series 2015-2(e) |
700 | Fixed | 3.7% | 2045 |
|||||||||||||
Senior Secured Tower Revenue Notes, Series 2018-2(e) |
750 | Fixed | 4.2% | 2048 |
|||||||||||||
Finance leases and other obligations(f) |
295 | Fixed | Various | Various |
|||||||||||||
| Total secured debt | $ | 1,781 | 4.1% | 0.4x | |||||||||||||
2016 Revolver(g) |
— | Variable | 2027 | ||||||||||||||
2016 Term Loan A(h) |
1,155 | Variable | 6.4% | 2027 | |||||||||||||
Commercial Paper Notes(i) |
1,438 | Variable | 5.9% | Various |
|||||||||||||
| 3.200% Senior Notes | 750 | Fixed | 3.2% | 2024 | |||||||||||||
| 1.350% Senior Notes | 500 | Fixed | 1.4% | 2025 | |||||||||||||
| 4.450% Senior Notes | 900 | Fixed | 4.5% | 2026 | |||||||||||||
| 3.700% Senior Notes | 750 | Fixed | 3.7% | 2026 | |||||||||||||
| 1.050% Senior Notes | 1,000 | Fixed | 1.1% | 2026 | |||||||||||||
| 2.900% Senior Notes | 750 | Fixed | 2.9% | 2027 | |||||||||||||
| 4.000% Senior Notes | 500 | Fixed | 4.0% | 2027 | |||||||||||||
| 3.650% Senior Notes | 1,000 | Fixed | 3.7% | 2027 | |||||||||||||
| 5.000% Senior Notes | 1,000 | Fixed | 5.0% | 2028 | |||||||||||||
| 3.800% Senior Notes | 1,000 | Fixed | 3.8% | 2028 | |||||||||||||
| 4.800% Senior Notes | 600 | Fixed | 4.8% | 2028 | |||||||||||||
| 4.300% Senior Notes | 600 | Fixed | 4.3% | 2029 | |||||||||||||
5.600% Senior Notes |
750 | Fixed | 5.6% | 2029 |
|||||||||||||
| 3.100% Senior Notes | 550 | Fixed | 3.1% | 2029 | |||||||||||||
| 3.300% Senior Notes | 750 | Fixed | 3.3% | 2030 | |||||||||||||
| 2.250% Senior Notes | 1,100 | Fixed | 2.3% | 2031 | |||||||||||||
| 2.100% Senior Notes | 1,000 | Fixed | 2.1% | 2031 | |||||||||||||
| 2.500% Senior Notes | 750 | Fixed | 2.5% | 2031 | |||||||||||||
| 5.100% Senior Notes | 750 | Fixed | 5.1% | 2033 | |||||||||||||
5.800% Senior Notes |
750 | Fixed | 5.8% | 2034 |
|||||||||||||
| 2.900% Senior Notes | 1,250 | Fixed | 2.9% | 2041 | |||||||||||||
| 4.750% Senior Notes | 350 | Fixed | 4.8% | 2047 | |||||||||||||
| 5.200% Senior Notes | 400 | Fixed | 5.2% | 2049 | |||||||||||||
| 4.000% Senior Notes | 350 | Fixed | 4.0% | 2049 | |||||||||||||
| 4.150% Senior Notes | 500 | Fixed | 4.2% | 2050 | |||||||||||||
| 3.250% Senior Notes | 900 | Fixed | 3.3% | 2051 | |||||||||||||
| Total unsecured debt | $ | 22,093 | 3.9% | 5.5x | |||||||||||||
Net Debt(j) |
$ | 23,543 | 3.9% | 5.9x | |||||||||||||
Market Capitalization(k) |
42,457 | ||||||||||||||||
Firm Value(l) |
$ | 66,000 | |||||||||||||||
| COMPANY OVERVIEW |
OUTLOOK | CONSOLIDATED FINANCIALS | CAPITALIZATION OVERVIEW | TOWERS SEGMENT | FIBER SEGMENT | APPENDIX | ||||||||||||||
DEBT MATURITY OVERVIEW(a)(b) | ||

| COMPANY OVERVIEW |
OUTLOOK | CONSOLIDATED FINANCIALS | CAPITALIZATION OVERVIEW | TOWERS SEGMENT | FIBER SEGMENT | APPENDIX | ||||||||||||||
LIQUIDITY OVERVIEW(a) | |||||
| (in millions) | June 30, 2024 |
||||
Cash and cash equivalents, and restricted cash and cash equivalents(b) |
$ | 331 | |||
Undrawn 2016 Revolver availability(c) |
6,960 | ||||
Total debt and other obligations (current and non-current)(d) |
23,719 | ||||
| Total equity | 5,652 | ||||
| SUMMARY OF MAINTENANCE AND FINANCIAL COVENANTS | |||||||||||||||||
| Debt | Borrower / Issuer | Covenant(e) |
Covenant Level Requirement | As of June 30, 2024 |
|||||||||||||
Maintenance Financial Covenants(f) | |||||||||||||||||
| 2016 Credit Facility | CCI | Total Net Leverage Ratio | ≤ 6.50x | 5.6x | |||||||||||||
| 2016 Credit Facility | CCI | Total Senior Secured Leverage Ratio | ≤ 3.50x | 0.4x | |||||||||||||
| 2016 Credit Facility | CCI | Consolidated Interest Coverage Ratio(g) |
N/A | N/A | |||||||||||||
| Financial covenants requiring excess cash flows to be deposited in a cash trap reserve account and not released | |||||||||||||||||
| 2015 Tower Revenue Notes | Crown Castle Towers LLC and its Subsidiaries | Debt Service Coverage Ratio | > 1.75x | (h) |
17.8x | ||||||||||||
| 2018 Tower Revenue Notes | Crown Castle Towers LLC and its Subsidiaries | Debt Service Coverage Ratio | > 1.75x | (h) |
17.8x | ||||||||||||
| 2009 Securitized Notes | Pinnacle Towers Acquisition Holdings LLC and its Subsidiaries | Debt Service Coverage Ratio | > 1.30x | (h) |
29.3x | ||||||||||||
| Financial covenants restricting ability of relevant issuer to issue additional notes under the applicable indenture | |||||||||||||||||
| 2015 Tower Revenue Notes | Crown Castle Towers LLC and its Subsidiaries | Debt Service Coverage Ratio | ≥ 2.00x | (i) |
17.8x | ||||||||||||
| 2018 Tower Revenue Notes | Crown Castle Towers LLC and its Subsidiaries | Debt Service Coverage Ratio | ≥ 2.00x | (i) |
17.8x | ||||||||||||
| 2009 Securitized Notes | Pinnacle Towers Acquisition Holdings LLC and its Subsidiaries | Debt Service Coverage Ratio | ≥ 2.34x | (i) |
29.3x | ||||||||||||
| COMPANY OVERVIEW |
OUTLOOK | CONSOLIDATED FINANCIALS | CAPITALIZATION OVERVIEW | TOWERS SEGMENT | FIBER SEGMENT | APPENDIX | ||||||||||||||
INTEREST RATE EXPOSURE(a) | |||||||||||||||||
(as of June 30, 2024; dollars in millions) | |||||||||||||||||
| Fixed Rate Debt | Floating Rate Debt | ||||||||||||||||
Face value of principal outstanding(b) |
$20,986 | Face value of principal outstanding(b) |
$2,593 | ||||||||||||||
| % of total debt | 89% | % of total debt | 11% | ||||||||||||||
| Weighted average interest rate | 3.6% | Weighted average interest rate(c) |
6.1% | ||||||||||||||
| Upcoming maturities: | 2024(d) |
2025(e) |
Interest rate sensitivity of 25 bps increase in interest rates: | ||||||||||||||
Face value of principal outstanding(b) |
$750 | $1,200 | Full year effect(f) |
$6.5 | |||||||||||||
| Weighted average interest rate | 3.2% | 2.7% | |||||||||||||||
| COMPONENTS OF INTEREST EXPENSE | |||||||||||||||||||||||||||||||||||
| 2023 | 2024 | ||||||||||||||||||||||||||||||||||
| (in millions) | Q1 | Q2 | Q3 | Q4 | Q1 | Q2 |
|||||||||||||||||||||||||||||
| Interest expense on debt obligations | $ | 198 | $ | 205 | $ | 213 | $ | 220 | $ | 223 | $ | 227 | |||||||||||||||||||||||
| Amortization of deferred financing costs and adjustments on long-term debt | 7 | 7 | 8 | 7 | 8 | 8 | |||||||||||||||||||||||||||||
| Capitalized interest | (3) | (4) | (4) | (4) | (5) | (5) | |||||||||||||||||||||||||||||
| Interest expense and amortization of deferred financing costs, net | $ | 202 | $ | 208 | $ | 217 | $ | 223 | $ | 226 | $ | 230 | |||||||||||||||||||||||
| COMPANY OVERVIEW |
OUTLOOK | CONSOLIDATED FINANCIALS | CAPITALIZATION OVERVIEW | TOWERS SEGMENT | FIBER SEGMENT | APPENDIX | ||||||||||||||
| TOWERS SEGMENT SUMMARY FINANCIAL HIGHLIGHTS | |||||||||||||||||||||||||||||||||||
| 2023 | 2024 | ||||||||||||||||||||||||||||||||||
(in millions; totals may not sum due to rounding) |
Q1 | Q2 | Q3 | Q4 | Q1 | Q2 | |||||||||||||||||||||||||||||
| Segment net revenues: | |||||||||||||||||||||||||||||||||||
| Site rental | |||||||||||||||||||||||||||||||||||
Site rental billings(a) |
$ | 926 | $ | 929 | $ | 956 | $ | 970 | $ | 970 | $ | 970 | |||||||||||||||||||||||
| Amortization of prepaid rent | 72 | 67 | 61 | 59 | 41 | 39 | |||||||||||||||||||||||||||||
| Straight-lined revenues | 83 | 84 | 57 | 50 | 57 | 54 | |||||||||||||||||||||||||||||
| Total site rental | 1,081 | 1,080 | 1,074 | 1,079 | 1,068 | 1,064 | |||||||||||||||||||||||||||||
| Services and other | 146 | 124 | 86 | 65 | 46 | 43 | |||||||||||||||||||||||||||||
| Net revenues | $ | 1,227 | $ | 1,204 | $ | 1,160 | $ | 1,144 | $ | 1,114 | $ | 1,107 | |||||||||||||||||||||||
| Segment operating expenses: | |||||||||||||||||||||||||||||||||||
Costs of operations(b) |
|||||||||||||||||||||||||||||||||||
| Site rental exclusive of straight-lined expenses | $ | 217 | $ | 226 | $ | 219 | $ | 214 | $ | 223 | $ | 229 | |||||||||||||||||||||||
| Straight-lined expenses | 17 | 17 | 17 | 17 | 16 | 16 | |||||||||||||||||||||||||||||
| Total site rental | 234 | 243 | 236 | 231 | 239 | 245 | |||||||||||||||||||||||||||||
| Services and other | 99 | 92 | 61 | 42 | 28 | 23 | |||||||||||||||||||||||||||||
| Total costs of operations | 333 | 335 | 297 | 273 | 267 | 268 | |||||||||||||||||||||||||||||
Selling, general and administrative(c) |
31 | 30 | 24 | 19 | 21 | 16 | |||||||||||||||||||||||||||||
Segment operating profit(d) |
$ | 863 | $ | 839 | $ | 839 | $ | 852 | $ | 826 | $ | 823 | |||||||||||||||||||||||
| COMPANY OVERVIEW |
OUTLOOK | CONSOLIDATED FINANCIALS | CAPITALIZATION OVERVIEW | TOWERS SEGMENT | FIBER SEGMENT | APPENDIX | ||||||||||||||
| TOWERS SEGMENT COMPONENTS OF CHANGES IN SITE RENTAL REVENUES | |||||||||||||||||||||||||||||||||||
| 2023 | 2024 | ||||||||||||||||||||||||||||||||||
(dollars in millions; totals may not sum due to rounding) |
Q1 | Q2 | Q3 | Q4 | Q1 | Q2 | |||||||||||||||||||||||||||||
| Components of changes in site rental revenues: | |||||||||||||||||||||||||||||||||||
Prior year site rental billings(a) |
$ | 879 | $ | 877 | $ | 915 | $ | 921 | $ | 926 | $ | 929 | |||||||||||||||||||||||
Core leasing activity(a) |
32 | 38 | 25 | 32 | 28 | 26 | |||||||||||||||||||||||||||||
| Escalators | 22 | 22 | 22 | 23 | 23 | 23 | |||||||||||||||||||||||||||||
Non-renewals(a) |
(8) | (8) | (7) | (7) | (8) | (7) | |||||||||||||||||||||||||||||
Organic Contribution to Site Rental Billings(a) |
46 | 51 | 40 | 48 | 43 | 42 | |||||||||||||||||||||||||||||
| Straight-lined revenues | 83 | 84 | 57 | 50 | 57 | 54 | |||||||||||||||||||||||||||||
| Amortization of prepaid rent | 72 | 67 | 61 | 59 | 41 | 39 | |||||||||||||||||||||||||||||
Acquisitions(b) |
1 | 1 | 1 | 1 | — | — | |||||||||||||||||||||||||||||
| Total site rental revenues | $ | 1,081 | $ | 1,080 | $ | 1,074 | $ | 1,079 | $ | 1,068 | $ | 1,064 | |||||||||||||||||||||||
| Year-over-year changes in revenues: | |||||||||||||||||||||||||||||||||||
Site rental revenues as a percentage of prior year site rental revenues |
0.6 | % | 0.2 | % | (0.9) | % | (0.6) | % | (1.2) | % | (1.5) | % | |||||||||||||||||||||||
| Changes in revenues as a percentage of prior year site rental billings: | |||||||||||||||||||||||||||||||||||
Organic Contribution to Site Rental Billings(a) |
5.2 | % | 5.8 | % | 4.4 | % | 5.2 | % | 4.6 | % | 4.4 | % | |||||||||||||||||||||||
TOWERS SEGMENT SUMMARY OF CAPITAL EXPENDITURES(a) | |||||||||||||||||||||||||||||||||||
| 2023 | 2024 | ||||||||||||||||||||||||||||||||||
(in millions; totals may not sum due to rounding) |
Q1 | Q2 | Q3 | Q4 | Q1 | Q2 | |||||||||||||||||||||||||||||
| Discretionary capital expenditures: | |||||||||||||||||||||||||||||||||||
| Communications infrastructure improvements and other capital projects | $ | 33 | $ | 34 | $ | 34 | $ | 21 | $ | 20 | $ | 15 | |||||||||||||||||||||||
| Purchases of land interests | 15 | 23 | 13 | 13 | 13 | 11 | |||||||||||||||||||||||||||||
| Total discretionary capital expenditures | 48 | 57 | 47 | 34 | 33 | 26 | |||||||||||||||||||||||||||||
| Sustaining capital expenditures | 2 | 4 | 2 | — | 2 | 3 | |||||||||||||||||||||||||||||
| Total capital expenditures | 50 | 61 | 49 | 34 | 35 | 29 | |||||||||||||||||||||||||||||
Less: Prepaid rent additions(c) |
22 | 25 | 25 | 20 | 12 | 8 | |||||||||||||||||||||||||||||
| Capital expenditures less prepaid rent additions | $ | 28 | $ | 36 | $ | 24 | $ | 14 | $ | 23 | $ | 21 | |||||||||||||||||||||||
| COMPANY OVERVIEW |
OUTLOOK | CONSOLIDATED FINANCIALS | CAPITALIZATION OVERVIEW | TOWERS SEGMENT | FIBER SEGMENT | APPENDIX | ||||||||||||||
| TOWERS SEGMENT PORTFOLIO HIGHLIGHTS | |||||
(as of June 30, 2024) |
|||||
Number of towers (in thousands)(a) |
40 | ||||
| Average number of tenants per tower | 2.5 | ||||
Remaining contracted tenant receivables (in billions)(b) |
$ | 32 | |||
Weighted average remaining tenant contract term (years)(b)(c) |
7 | ||||
| Percent of towers in the Top 50 / 100 Basic Trading Areas | 56% / 71% | ||||
Percent of ground leased / owned(d) |
58% / 42% |
||||
Weighted average maturity of ground leases (years)(d)(e) |
36 | ||||
TOWERS SEGMENT CASH YIELD ON INVESTED CAPITAL(f) | |||||||||||
(as of June 30, 2024; dollars in millions) |
Q2 2024 LQA |
Q2 2023 LQA |
|||||||||
Segment site rental gross margin(g) |
$ | 3,276 | $ | 3,348 | |||||||
| Less: Amortization of prepaid rent | (156) | (268) | |||||||||
| Less: Straight-lined revenues | (216) | (336) | |||||||||
| Add: Straight-lined expenses | 64 | 68 | |||||||||
| Numerator | $ | 2,968 | $ | 2,812 | |||||||
Segment net investment in property and equipment(h) |
$ | 13,501 | $ | 13,398 | |||||||
| Segment investment in site rental contracts and tenant relationships | 4,589 | 4,576 | |||||||||
Segment investment in goodwill(i) |
5,351 | 5,351 | |||||||||
Segment Net Invested Capital(f) |
$ | 23,441 | $ | 23,325 | |||||||
Segment Cash Yield on Invested Capital(f) |
12.7 | % | 12.1 | % | |||||||
SUMMARY OF TOWER PORTFOLIO BY VINTAGE(j) | ||||||||||||||
(as of June 30, 2024; dollars in thousands) |
Acquired and Built 2006 and Prior | Acquired and Built 2007 to Present | ||||||||||||
Cash yield(k) |
21 | % | 10 | % | ||||||||||
| Number of tenants per tower | 3.0 | 2.3 | ||||||||||||
Last quarter annualized average cash site rental revenue per tower(l) |
$ | 135 | $ | 82 | ||||||||||
Last quarter annualized average site rental gross cash margin per tower(m) |
$ | 115 | $ | 58 | ||||||||||
Net invested capital per tower(n) |
$ | 561 | $ | 586 | ||||||||||
| Number of towers | 11,197 | 28,839 | ||||||||||||
| COMPANY OVERVIEW |
OUTLOOK | CONSOLIDATED FINANCIALS | CAPITALIZATION OVERVIEW | TOWERS SEGMENT | FIBER SEGMENT | APPENDIX | ||||||||||||||
| GROUND INTEREST OVERVIEW | |||||||||||||||||||||||
(as of June 30, 2024; dollars in millions) |
LQA Cash Site Rental Revenues(a) |
Percentage of LQA Cash Site Rental Revenues(a) |
LQA Towers Segment Site Rental Gross Cash Margin(b) |
Percentage of LQA Towers Segment Site Rental Gross Cash Margin(b) |
Number of Towers(c) |
Percentage of Towers | Weighted Average Term Remaining (by years)(d) |
||||||||||||||||
| Less than 10 years | $ | 425 | 11 | % | $ | 224 | 8 | % | 5,513 | 14 | % | ||||||||||||
| 10 to 20 years | 567 | 15 | % | 357 | 12 | % | 6,141 | 15 | % | ||||||||||||||
| Greater than 20 years | 1,567 | 40 | % | 1,136 | 38 | % | 16,644 | 42 | % | ||||||||||||||
| Total leased | $ | 2,559 | 66 | % | $ | 1,717 | 58 | % | 28,298 | 71 | % | 36 | |||||||||||
| Owned | $ | 1,317 | 34 | % | $ | 1,236 | 42 | % | 11,738 | 29 | % | ||||||||||||
| Total / Average | $ | 3,876 | 100 | % | $ | 2,953 | 100 | % | 40,036 | 100 | % | ||||||||||||
| COMPANY OVERVIEW |
OUTLOOK | CONSOLIDATED FINANCIALS | CAPITALIZATION OVERVIEW | TOWERS SEGMENT | FIBER SEGMENT | APPENDIX | ||||||||||||||
| FIBER SEGMENT SUMMARY FINANCIAL HIGHLIGHTS | |||||||||||||||||||||||||||||||||||
| 2023 | 2024 | ||||||||||||||||||||||||||||||||||
(in millions; totals may not sum due to rounding) |
Q1 | Q2 | Q3 | Q4 | Q1 | Q2 | |||||||||||||||||||||||||||||
| Segment net revenues: | |||||||||||||||||||||||||||||||||||
| Site rental | |||||||||||||||||||||||||||||||||||
Site rental billings(a) |
$ | 478 | $ | 531 | $ | 436 | $ | 447 | $ | 453 | $ | 446 | |||||||||||||||||||||||
| Amortization of prepaid rent | 65 | 121 | 66 | 75 | 65 | 67 | |||||||||||||||||||||||||||||
| Straight-lined revenues | — | (4) | 1 | 2 | 2 | 2 | |||||||||||||||||||||||||||||
| Total site rental | 543 | 648 | 503 | 524 | 520 | 516 | |||||||||||||||||||||||||||||
| Services and other | 3 | 15 | 4 | 6 | 7 | 3 | |||||||||||||||||||||||||||||
| Net revenues | $ | 546 | $ | 663 | $ | 507 | $ | 530 | $ | 527 | $ | 519 | |||||||||||||||||||||||
| Segment operating expenses | |||||||||||||||||||||||||||||||||||
Costs of operations(b) |
|||||||||||||||||||||||||||||||||||
| Site rental exclusive of straight-lined expenses | $ | 172 | $ | 170 | $ | 175 | $ | 168 | $ | 182 | $ | 178 | |||||||||||||||||||||||
| Straight-lined expenses | — | 1 | — | — | — | — | |||||||||||||||||||||||||||||
| Total site rental | 172 | 171 | 175 | 168 | 182 | 178 | |||||||||||||||||||||||||||||
| Services and other | 2 | 3 | 3 | 4 | 4 | 2 | |||||||||||||||||||||||||||||
| Total costs of operations | 174 | 174 | 178 | 172 | 186 | 180 | |||||||||||||||||||||||||||||
Selling, general and administrative(c) |
49 | 51 | 48 | 47 | 47 | 50 | |||||||||||||||||||||||||||||
Segment operating profit(d) |
$ | 323 | $ | 438 | $ | 281 | $ | 311 | $ | 294 | $ | 289 | |||||||||||||||||||||||
| COMPANY OVERVIEW |
OUTLOOK | CONSOLIDATED FINANCIALS | CAPITALIZATION OVERVIEW | TOWERS SEGMENT | FIBER SEGMENT | APPENDIX | ||||||||||||||
| FIBER SEGMENT COMPONENTS OF CHANGES IN SITE RENTAL REVENUES | |||||||||||||||||||||||||||||||||||
| 2023 | 2024 | ||||||||||||||||||||||||||||||||||
(dollars in millions; totals may not sum due to rounding) |
Q1 | Q2 | Q3 | Q4 | Q1 | Q2 | |||||||||||||||||||||||||||||
| Components of changes in site rental revenues: | |||||||||||||||||||||||||||||||||||
Prior year site rental billings excluding payments for Sprint Cancellations(a) |
$ | 439 | $ | 427 | $ | 424 | $ | 426 | $ | 431 | $ | 424 | |||||||||||||||||||||||
Prior year payments for Sprint Cancellations(a)(b) |
— | — | — | — | 48 | 106 | |||||||||||||||||||||||||||||
Prior year site rental billings(a) |
$ | 439 | $ | 427 | $ | 424 | $ | 426 | $ | 479 | $ | 530 | |||||||||||||||||||||||
Core leasing activity(a) |
25 | 36 | 41 | 47 | 53 | 50 | |||||||||||||||||||||||||||||
| Escalators | 2 | 2 | 2 | 2 | 2 | 2 | |||||||||||||||||||||||||||||
Non-renewals(a) |
(34) | (34) | (30) | (30) | (29) | (30) | |||||||||||||||||||||||||||||
Organic Contribution to Site Rental Billings as Adjusted for Impact of Sprint Cancellations(a) |
(7) | 3 | 13 | 19 | 25 | 22 | |||||||||||||||||||||||||||||
Payments for Sprint Cancellations(a)(c) |
48 | 106 | 6 | 10 | (44) | (105) | |||||||||||||||||||||||||||||
Non-renewals associated with Sprint Cancellations(a)(c) |
(2) | (6) | (6) | (7) | (6) | (1) | |||||||||||||||||||||||||||||
Organic Contribution to Site Rental Billings(a) |
39 | 104 | 12 | 22 | (25) | (84) | |||||||||||||||||||||||||||||
| Straight-lined revenues | — | (4) | 1 | 2 | 2 | 2 | |||||||||||||||||||||||||||||
| Amortization of prepaid rent | 65 | 121 | 66 | 75 | 65 | 67 | |||||||||||||||||||||||||||||
Acquisitions(d) |
— | — | — | — | — | — | |||||||||||||||||||||||||||||
| Total site rental revenues | $ | 543 | $ | 648 | $ | 503 | $ | 524 | $ | 520 | $ | 516 | |||||||||||||||||||||||
| Year-over-year changes in revenues: | |||||||||||||||||||||||||||||||||||
Site rental revenues as a percentage of prior year site rental revenues |
8.4 | % | 32.5 | % | 3.9 | % | 6.5 | % | (4.2) | % | (20.4) | % | |||||||||||||||||||||||
Organic Contribution to Site Rental Billings as Adjusted for Impact of Sprint Cancellations as a percentage of prior year site rental billings excluding payments for Sprint Cancellations(a) |
(1.6) | % | 0.8 | % | 3.0 | % | 4.4 | % | 5.8 | % | 5.2 | % | |||||||||||||||||||||||
Organic Contribution to Site Rental Billings as a percentage of prior year site rental billings(a) |
8.8 | % | 24.3 | % | 2.9 | % | 5.1 | % | (5.3) | % | (15.9) | % | |||||||||||||||||||||||
FIBER SEGMENT SUMMARY OF CAPITAL EXPENDITURES(a) | |||||||||||||||||||||||||||||||||||
| 2023 | 2024 | ||||||||||||||||||||||||||||||||||
(in millions; totals may not sum due to rounding) |
Q1 | Q2 | Q3 | Q4 | Q1 | Q2 | |||||||||||||||||||||||||||||
Discretionary capital expenditures |
272 | 298 | 273 | 288 | 259 | 271 | |||||||||||||||||||||||||||||
| Sustaining capital expenditures | 7 | 8 | 14 | 15 | 14 | 18 | |||||||||||||||||||||||||||||
| Total capital expenditures | 279 | 306 | 287 | 303 | 273 | 289 | |||||||||||||||||||||||||||||
Less: Prepaid rent additions(e) |
59 | 59 | 55 | 83 | 56 | 90 | |||||||||||||||||||||||||||||
| Capital expenditures less prepaid rent additions | $ | 220 | $ | 247 | $ | 232 | $ | 220 | $ | 217 | $ | 199 | |||||||||||||||||||||||
| COMPANY OVERVIEW |
OUTLOOK | CONSOLIDATED FINANCIALS | CAPITALIZATION OVERVIEW | TOWERS SEGMENT | FIBER SEGMENT | APPENDIX | ||||||||||||||
| FIBER SEGMENT REVENUE DETAIL BY LINE OF BUSINESS | |||||||||||||||||||||||||||||||||||
| 2023 | 2024 | ||||||||||||||||||||||||||||||||||
(dollars in millions; totals may not sum due to rounding) |
Q1 | Q2 | Q3 | Q4 | Q1 | Q2 | |||||||||||||||||||||||||||||
| Small Cells | |||||||||||||||||||||||||||||||||||
| Site rental revenues: | |||||||||||||||||||||||||||||||||||
Site rental billings(a) |
$ | 113 | $ | 211 | $ | 113 | $ | 118 | $ | 126 | $ | 122 | |||||||||||||||||||||||
| Amortization of prepaid rent | 48 | 102 | 45 | 53 | 45 | 50 | |||||||||||||||||||||||||||||
| Straight-lined revenues | (1) | (6) | (1) | (1) | (1) | (1) | |||||||||||||||||||||||||||||
| Total site rental revenues | 160 | 308 | 157 | 170 | 170 | 170 | |||||||||||||||||||||||||||||
| Services and other revenues | 3 | 15 | 3 | 6 | 7 | 3 | |||||||||||||||||||||||||||||
| Net revenues | $ | 163 | $ | 323 | $ | 160 | $ | 176 | $ | 177 | $ | 173 | |||||||||||||||||||||||
| Components of changes in site rental revenues: | |||||||||||||||||||||||||||||||||||
Prior year site rental billings excluding payments for Sprint Cancellations(a) |
$ | 108 | $ | 109 | $ | 109 | $ | 111 | $ | 108 | $ | 110 | |||||||||||||||||||||||
Prior year payments for Sprint Cancellations(a)(b) |
— | — | — | — | — | 101 | |||||||||||||||||||||||||||||
Prior year site rental billings(a) |
$ | 108 | $ | 109 | $ | 109 | $ | 111 | $ | 113 | $ | 211 | |||||||||||||||||||||||
Core leasing activity(a) |
6 | 6 | 8 | 9 | 17 | 11 | |||||||||||||||||||||||||||||
| Escalators | 2 | 2 | 2 | 2 | 2 | 2 | |||||||||||||||||||||||||||||
Non-renewals(a) |
(3) | (2) | (1) | (1) | (1) | (1) | |||||||||||||||||||||||||||||
Organic Contribution to Site Rental Billings as Adjusted for Impact of Sprint Cancellations(a) |
5 | 5 | 8 | 10 | 18 | 12 | |||||||||||||||||||||||||||||
Payments for Sprint Cancellations(a)(c) |
— | 101 | — | 2 | — | (101) | |||||||||||||||||||||||||||||
Non-renewals associated with Sprint Cancellations(a)(c) |
— | (4) | (5) | (5) | (5) | (1) | |||||||||||||||||||||||||||||
Organic Contribution to Site Rental Billings(a) |
5 | 102 | 3 | 7 | 13 | (90) | |||||||||||||||||||||||||||||
| Straight-lined revenues | (1) | (6) | (1) | (1) | (1) | (1) | |||||||||||||||||||||||||||||
| Amortization of prepaid rent | 48 | 102 | 45 | 53 | 45 | 50 | |||||||||||||||||||||||||||||
Acquisitions(d) |
— | — | — | — | — | — | |||||||||||||||||||||||||||||
| Total site rental revenues | $ | 160 | $ | 308 | $ | 157 | $ | 170 | $ | 170 | $ | 170 | |||||||||||||||||||||||
| Year-over-year changes in revenues: | |||||||||||||||||||||||||||||||||||
Site rental revenues as a percentage of prior year site rental revenues |
3.2 | % | 97.4 | % | 1.9 | % | 5.6 | % | 6.3 | % | (44.8) | % | |||||||||||||||||||||||
Organic Contribution to Site Rental Billings as Adjusted for Impact of Sprint Cancellations as a percentage of prior year site rental billings excluding payments for Sprint Cancellations(a) |
4.5 | % | 5.0 | % | 7.3 | % | 9.1 | % | 16.3 | % | 10.9 | % | |||||||||||||||||||||||
Organic Contribution to Site Rental Billings as a percentage of prior year site rental billings(a) |
4.5 | % | 93.6 | % | 3.1 | % | 6.7 | % | 11.8 | % | (42.5) | % | |||||||||||||||||||||||
| COMPANY OVERVIEW |
OUTLOOK | CONSOLIDATED FINANCIALS | CAPITALIZATION OVERVIEW | TOWERS SEGMENT | FIBER SEGMENT | APPENDIX | ||||||||||||||
| FIBER SEGMENT REVENUE DETAIL BY LINE OF BUSINESS CONTINUED | |||||||||||||||||||||||||||||||||||
| 2023 | 2024 | ||||||||||||||||||||||||||||||||||
(dollars in millions; totals may not sum due to rounding) |
Q1 | Q2 | Q3 | Q4 | Q1 | Q2 | |||||||||||||||||||||||||||||
| Fiber Solutions | |||||||||||||||||||||||||||||||||||
| Site rental revenues: | |||||||||||||||||||||||||||||||||||
Site rental billings(a) |
$ | 365 | $ | 320 | $ | 323 | $ | 330 | $ | 327 | $ | 325 | |||||||||||||||||||||||
| Amortization of prepaid rent | 17 | 19 | 20 | 22 | 20 | 18 | |||||||||||||||||||||||||||||
| Straight-lined revenues | 1 | 2 | 2 | 3 | 3 | 3 | |||||||||||||||||||||||||||||
| Total site rental revenues | 383 | 340 | 346 | 354 | 350 | 346 | |||||||||||||||||||||||||||||
| Services and other revenues | — | — | 1 | — | — | — | |||||||||||||||||||||||||||||
| Net revenues | $ | 383 | $ | 340 | $ | 347 | $ | 354 | $ | 350 | $ | 346 | |||||||||||||||||||||||
| Components of changes in site rental revenues: | |||||||||||||||||||||||||||||||||||
Prior year site rental billings excluding payments for Sprint Cancellations(a) |
$ | 331 | $ | 318 | $ | 315 | $ | 316 | $ | 318 | $ | 314 | |||||||||||||||||||||||
Prior year payments for Sprint Cancellations(a)(b) |
— | — | — | — | 48 | 5 | |||||||||||||||||||||||||||||
Prior year site rental billings(a) |
$ | 331 | $ | 318 | $ | 315 | $ | 316 | $ | 366 | $ | 319 | |||||||||||||||||||||||
Core leasing activity(a) |
19 | 30 | 34 | 37 | 35 | 39 | |||||||||||||||||||||||||||||
| Escalators | — | — | — | — | — | — | |||||||||||||||||||||||||||||
Non-renewals(a) |
(31) | (32) | (29) | (29) | (29) | (29) | |||||||||||||||||||||||||||||
Organic Contribution to Site Rental Billings as Adjusted for Impact of Sprint Cancellations(a) |
(12) | (2) | 5 | 8 | 6 | 10 | |||||||||||||||||||||||||||||
Payments for Sprint Cancellations(a)(c) |
48 | 5 | 6 | 8 | (44) | (4) | |||||||||||||||||||||||||||||
Non-renewals associated with Sprint Cancellations(a)(c) |
(2) | (2) | (2) | (2) | (1) | (1) | |||||||||||||||||||||||||||||
Organic Contribution to Site Rental Billings(a) |
34 | 1 | 9 | 14 | (39) | 5 | |||||||||||||||||||||||||||||
| Straight-lined revenues | 1 | 2 | 2 | 3 | 3 | 3 | |||||||||||||||||||||||||||||
| Amortization of prepaid rent | 17 | 19 | 20 | 22 | 20 | 18 | |||||||||||||||||||||||||||||
Acquisitions(d) |
— | — | — | — | — | — | |||||||||||||||||||||||||||||
| Total site rental revenues | $ | 383 | $ | 340 | $ | 346 | $ | 354 | $ | 350 | $ | 346 | |||||||||||||||||||||||
| Year-over-year changes in revenues: | |||||||||||||||||||||||||||||||||||
Site rental revenues as a percentage of prior year site rental revenues |
10.7 | % | 2.1 | % | 4.8 | % | 6.9 | % | (8.6) | % | 1.8 | % | |||||||||||||||||||||||
Organic Contribution to Site Rental Billings as Adjusted for Impact of Sprint Cancellations as a percentage of prior year site rental billings excluding payments for Sprint Cancellations(a) |
(3.6) | % | (0.7) | % | 1.5 | % | 2.7 | % | 2.1 | % | 3.2 | % | |||||||||||||||||||||||
Organic Contribution to Site Rental Billings as a percentage of prior year site rental billings(a) |
10.2 | % | 0.4 | % | 2.8 | % | 4.5 | % | (10.6) | % | 1.7 | % | |||||||||||||||||||||||
| COMPANY OVERVIEW |
OUTLOOK | CONSOLIDATED FINANCIALS | CAPITALIZATION OVERVIEW | TOWERS SEGMENT | FIBER SEGMENT | APPENDIX | ||||||||||||||
| FIBER SEGMENT PORTFOLIO HIGHLIGHTS | |||||
(as of June 30, 2024) |
|||||
| Number of route miles of fiber (in thousands) | 90 | ||||
Number of small cells on air or under contract (in thousands) |
115 | ||||
Remaining contracted tenant receivables (in billions)(a) |
$ | 5 | |||
Weighted average remaining tenant contract term (years)(a)(b) |
4 | ||||
FIBER SEGMENT CASH YIELD ON INVESTED CAPITAL(c) | |||||||||||
(as of June 30, 2024; dollars in millions) |
Q2 2024 LQA |
Q2 2023 LQA |
|||||||||
Segment site rental gross margin(d) |
$ | 1,352 | $ | 1,908 | |||||||
| Less: Amortization of prepaid rent | (268) | (484) | |||||||||
| Less: Straight-lined revenues | (8) | 16 | |||||||||
| Add: Straight-lined expenses | — | 4 | |||||||||
Add: Indirect labor costs(e) |
121 | 117 | |||||||||
| Numerator | $ | 1,197 | $ | 1,561 | |||||||
Segment net investment in property and equipment(f) |
$ | 9,902 | $ | 9,132 | |||||||
| Segment investment in site rental contracts and tenant relationships | 3,290 | 3,290 | |||||||||
Segment investment in goodwill(g) |
4,080 | 4,080 | |||||||||
Segment Net Invested Capital(c) |
$ | 17,272 | $ | 16,502 | |||||||
Segment Cash Yield on Invested Capital(c) |
6.9 | % | 9.5 | % | |||||||
| FIBER SOLUTIONS REVENUE MIX | |||||
(as of June 30, 2024) |
Percentage of Q2 2024 LQA Site Rental Revenues |
||||
Carrier(h) |
35% | ||||
| Education | 14% | ||||
| Healthcare | 11% | ||||
| Financial Services | 7% | ||||
| Other | 33% | ||||
| Total | 100% | ||||
| COMPANY OVERVIEW |
OUTLOOK | CONSOLIDATED FINANCIALS | CAPITALIZATION OVERVIEW | TOWERS SEGMENT | FIBER SEGMENT | APPENDIX | ||||||||||||||
| CONDENSED CONSOLIDATED BALANCE SHEET (Unaudited) | |||||||||||
| (in millions, except par values) | June 30, 2024 | December 31, 2023 | |||||||||
| ASSETS | |||||||||||
| Current assets: | |||||||||||
| Cash and cash equivalents | $ | 155 | $ | 105 | |||||||
Restricted cash and cash equivalents |
171 | 171 | |||||||||
| Receivables, net | 420 | 481 | |||||||||
| Prepaid expenses | 155 | 103 | |||||||||
| Deferred site rental receivables | 129 | 116 | |||||||||
| Other current assets | 51 | 56 | |||||||||
| Total current assets | 1,081 | 1,032 | |||||||||
| Deferred site rental receivables | 2,341 | 2,239 | |||||||||
| Property and equipment, net | 15,698 | 15,666 | |||||||||
| Operating lease right-of-use assets | 5,930 | 6,187 | |||||||||
| Goodwill | 10,085 | 10,085 | |||||||||
| Other intangible assets, net | 2,974 | 3,179 | |||||||||
| Other assets, net | 137 | 139 | |||||||||
| Total assets | $ | 38,246 | $ | 38,527 | |||||||
| LIABILITIES AND EQUITY | |||||||||||
| Current liabilities: | |||||||||||
| Accounts payable | $ | 225 | $ | 252 | |||||||
| Accrued interest | 228 | 219 | |||||||||
| Deferred revenues | 509 | 605 | |||||||||
| Other accrued liabilities | 359 | 342 | |||||||||
| Current maturities of debt and other obligations | 865 | 835 | |||||||||
| Current portion of operating lease liabilities | 308 | 332 | |||||||||
| Total current liabilities | 2,494 | 2,585 | |||||||||
| Debt and other long-term obligations | 22,854 | 22,086 | |||||||||
| Operating lease liabilities | 5,354 | 5,561 | |||||||||
| Other long-term liabilities | 1,892 | 1,914 | |||||||||
| Total liabilities | 32,594 | 32,146 | |||||||||
| Commitments and contingencies | |||||||||||
| Stockholders' equity: | |||||||||||
Common stock, 0.01 par value; 1,200 shares authorized; shares issued and outstanding: June 30, 2024—435 and December 31, 2023—434 |
4 | 4 | |||||||||
| Additional paid-in capital | 18,347 | 18,270 | |||||||||
| Accumulated other comprehensive income (loss) | (5) | (4) | |||||||||
| Dividends/distributions in excess of earnings | (12,694) | (11,889) | |||||||||
| Total equity | 5,652 | 6,381 | |||||||||
| Total liabilities and equity | $ | 38,246 | $ | 38,527 | |||||||
| COMPANY OVERVIEW |
OUTLOOK | CONSOLIDATED FINANCIALS | CAPITALIZATION OVERVIEW | TOWERS SEGMENT | FIBER SEGMENT | APPENDIX | ||||||||||||||
| CONDENSED CONSOLIDATED STATEMENT OF OPERATIONS (Unaudited) | |||||||||||||||||||||||
| Three Months Ended June 30, | Six Months Ended June 30, | ||||||||||||||||||||||
| (in millions, except per share amounts) | 2024 | 2023 | 2024 | 2023 | |||||||||||||||||||
| Net revenues: | |||||||||||||||||||||||
| Site rental | $ | 1,580 | $ | 1,728 | $ | 3,168 | $ | 3,352 | |||||||||||||||
| Services and other | 46 | 139 | 99 | 288 | |||||||||||||||||||
| Net revenues | 1,626 | 1,867 | 3,267 | 3,640 | |||||||||||||||||||
| Operating expenses: | |||||||||||||||||||||||
Costs of operations:(a) |
|||||||||||||||||||||||
| Site rental | 432 | 424 | 862 | 839 | |||||||||||||||||||
| Services and other | 27 | 98 | 61 | 202 | |||||||||||||||||||
| Selling, general and administrative | 204 | 210 | 387 | 405 | |||||||||||||||||||
| Asset write-down charges | 3 | 22 | 9 | 22 | |||||||||||||||||||
| Acquisition and integration costs | — | 1 | — | 1 | |||||||||||||||||||
| Depreciation, amortization and accretion | 430 | 445 | 869 | 876 | |||||||||||||||||||
| Restructuring charges | 45 | — | 56 | — | |||||||||||||||||||
| Total operating expenses | 1,141 | 1,200 | 2,244 | 2,345 | |||||||||||||||||||
| Operating income (loss) | 485 | 667 | 1,023 | 1,295 | |||||||||||||||||||
| Interest expense and amortization of deferred financing costs, net | (230) | (208) | (456) | (410) | |||||||||||||||||||
| Interest income | 4 | 5 | 8 | 7 | |||||||||||||||||||
| Other income (expense) | (1) | (2) | 1 | (4) | |||||||||||||||||||
| Income (loss) before income taxes | 258 | 462 | 576 | 888 | |||||||||||||||||||
| Benefit (provision) for income taxes | (7) | (7) | (14) | (14) | |||||||||||||||||||
| Net income (loss) | $ | 251 | $ | 455 | $ | 562 | $ | 874 | |||||||||||||||
| Net income (loss), per common share: | |||||||||||||||||||||||
| Basic | $ | 0.58 | $ | 1.05 | $ | 1.29 | $ | 2.02 | |||||||||||||||
| Diluted | $ | 0.58 | $ | 1.05 | $ | 1.29 | $ | 2.01 | |||||||||||||||
| Weighted-average common shares outstanding: | |||||||||||||||||||||||
| Basic | 435 | 434 | 434 | 433 | |||||||||||||||||||
| Diluted | 435 | 434 | 435 | 434 | |||||||||||||||||||
| COMPANY OVERVIEW |
OUTLOOK | CONSOLIDATED FINANCIALS | CAPITALIZATION OVERVIEW | TOWERS SEGMENT | FIBER SEGMENT | APPENDIX | ||||||||||||||
| CONDENSED CONSOLIDATED STATEMENT OF CASH FLOWS (Unaudited) | |||||||||||
| Six Months Ended June 30, | |||||||||||
| (in millions) | 2024 | 2023 | |||||||||
| Cash flows from operating activities: | |||||||||||
| Net income (loss) | $ | 562 | $ | 874 | |||||||
| Adjustments to reconcile net income (loss) to net cash provided by (used for) operating activities: | |||||||||||
| Depreciation, amortization and accretion | 869 | 876 | |||||||||
| (Gains) losses on retirement of long-term obligations | — | — | |||||||||
| Amortization of deferred financing costs and other non-cash interest | 18 | 14 | |||||||||
| Stock-based compensation expense, net | 78 | 91 | |||||||||
| Asset write-down charges | 9 | 22 | |||||||||
| Deferred income tax (benefit) provision | 5 | 1 | |||||||||
| Other non-cash adjustments, net | 8 | 2 | |||||||||
| Changes in assets and liabilities, excluding the effects of acquisitions: | |||||||||||
| Increase (decrease) in liabilities | (99) | (35) | |||||||||
| Decrease (increase) in assets | (83) | (120) | |||||||||
| Net cash provided by (used for) operating activities | 1,367 | 1,725 | |||||||||
| Cash flows from investing activities: | |||||||||||
| Capital expenditures | (649) | (720) | |||||||||
| Payments for acquisitions, net of cash acquired | (1) | (89) | |||||||||
| Other investing activities, net | — | 3 | |||||||||
| Net cash provided by (used for) investing activities | (650) | (806) | |||||||||
| Cash flows from financing activities: | |||||||||||
| Proceeds from issuance of long-term debt | — | 2,347 | |||||||||
| Principal payments on debt and other long-term obligations | (36) | (39) | |||||||||
| Purchases and redemptions of long-term debt | — | — | |||||||||
| Borrowings under revolving credit facility | — | 2,113 | |||||||||
| Payments under revolving credit facility | (670) | (2,739) | |||||||||
| Net borrowings (repayments) under commercial paper program | 1,438 | (1,024) | |||||||||
| Payments for financing costs | — | (23) | |||||||||
| Purchases of common stock | (30) | (29) | |||||||||
| Dividends/distributions paid on common stock | (1,368) | (1,364) | |||||||||
| Net cash provided by (used for) financing activities | (666) | (758) | |||||||||
Net increase (decrease) in cash and cash equivalents and restricted cash and cash equivalents |
51 | 161 | |||||||||
| Effect of exchange rate changes on cash | (1) | — | |||||||||
Cash and cash equivalents and restricted cash and cash equivalents at beginning of period |
281 | 327 | |||||||||
Cash and cash equivalents and restricted cash and cash equivalents at end of period |
$ | 331 | $ | 488 | |||||||
| Supplemental disclosure of cash flow information: | |||||||||||
| Interest paid | 441 | 367 | |||||||||
| Income taxes paid (refunded) | 9 | 10 | |||||||||
| COMPANY OVERVIEW |
OUTLOOK | CONSOLIDATED FINANCIALS | CAPITALIZATION OVERVIEW | TOWERS SEGMENT | FIBER SEGMENT | APPENDIX | ||||||||||||||
| SEGMENT OPERATING RESULTS | |||||||||||||||||||||||||||||||||||||||||||||||
Three Months Ended June 30, 2024 |
Three Months Ended June 30, 2023 |
||||||||||||||||||||||||||||||||||||||||||||||
| (in millions) | Towers | Fiber | Other | Total |
Towers | Fiber | Other | Total |
|||||||||||||||||||||||||||||||||||||||
| Segment site rental revenues | $ | 1,064 | $ | 516 | $ | 1,580 | $ | 1,080 | $ | 648 | $ | 1,728 | |||||||||||||||||||||||||||||||||||
| Segment services and other revenues | 43 | 3 | 46 | 124 | 15 | 139 | |||||||||||||||||||||||||||||||||||||||||
| Segment revenues | 1,107 | 519 | 1,626 | 1,204 | 663 | 1,867 | |||||||||||||||||||||||||||||||||||||||||
| Segment site rental costs of operations | 245 | 178 | 423 | 243 | 171 | 414 | |||||||||||||||||||||||||||||||||||||||||
| Segment services and other costs of operations | 23 | 2 | 25 | 92 | 3 | 95 | |||||||||||||||||||||||||||||||||||||||||
Segment costs of operations(a)(b) |
268 | 180 | 448 | 335 | 174 | 509 | |||||||||||||||||||||||||||||||||||||||||
Segment site rental gross margin(c) |
819 | 338 | 1,157 | 837 | 477 | 1,314 | |||||||||||||||||||||||||||||||||||||||||
Segment services and other gross margin(c) |
20 | 1 | 21 | 32 | 12 | 44 | |||||||||||||||||||||||||||||||||||||||||
Segment selling, general and administrative expenses(b) |
16 | 50 | 66 | 30 | 51 | 81 | |||||||||||||||||||||||||||||||||||||||||
Segment operating profit(c) |
823 | 289 | 1,112 | 839 | 438 | 1,277 | |||||||||||||||||||||||||||||||||||||||||
Other selling, general and administrative expenses(b) |
$ | 105 | 105 | $ | 88 | 88 | |||||||||||||||||||||||||||||||||||||||||
| Stock-based compensation expense, net | 40 | 40 | 50 | 50 | |||||||||||||||||||||||||||||||||||||||||||
| Depreciation, amortization and accretion | 430 | 430 | 445 | 445 | |||||||||||||||||||||||||||||||||||||||||||
Restructuring charges(d) |
45 | 45 | — | — | |||||||||||||||||||||||||||||||||||||||||||
| Interest expense and amortization of deferred financing costs, net | 230 | 230 | 208 | 208 | |||||||||||||||||||||||||||||||||||||||||||
Other (income) expenses to reconcile to income (loss) before income taxes(e) |
4 | 4 | 24 | 24 | |||||||||||||||||||||||||||||||||||||||||||
| Income (loss) before income taxes | $ | 258 | $ | 462 | |||||||||||||||||||||||||||||||||||||||||||
| COMPANY OVERVIEW |
OUTLOOK | CONSOLIDATED FINANCIALS | CAPITALIZATION OVERVIEW | TOWERS SEGMENT | FIBER SEGMENT | APPENDIX | ||||||||||||||
| SEGMENT OPERATING RESULTS | |||||||||||||||||||||||||||||||||||||||||||||||
Six Months Ended June 30, 2024 |
Six Months Ended June 30, 2023 |
||||||||||||||||||||||||||||||||||||||||||||||
| (in millions) | Towers | Fiber | Other | Total |
Towers | Fiber | Other | Total |
|||||||||||||||||||||||||||||||||||||||
| Segment site rental revenues | $ | 2,132 | $ | 1,036 | $ | 3,168 | $ | 2,161 | $ | 1,191 | $ | 3,352 | |||||||||||||||||||||||||||||||||||
| Segment services and other revenues | 89 | 10 | 99 | 270 | 18 | 288 | |||||||||||||||||||||||||||||||||||||||||
| Segment revenues | 2,221 | 1,046 | 3,267 | 2,431 | 1,209 | 3,640 | |||||||||||||||||||||||||||||||||||||||||
| Segment site rental costs of operations | 483 | 360 | 843 | 477 | 343 | 820 | |||||||||||||||||||||||||||||||||||||||||
| Segment services and other costs of operations | 51 | 7 | 58 | 191 | 5 | 196 | |||||||||||||||||||||||||||||||||||||||||
Segment costs of operations(a)(b) |
534 | 367 | 901 | 668 | 348 | 1,016 | |||||||||||||||||||||||||||||||||||||||||
Segment site rental gross margin(c) |
1,649 | 676 | 2,325 | 1,684 | 848 | 2,532 | |||||||||||||||||||||||||||||||||||||||||
Segment services and other gross margin(c) |
38 | 3 | 41 | 79 | 13 | 92 | |||||||||||||||||||||||||||||||||||||||||
Segment selling, general and administrative expenses(b) |
37 | 97 | 134 | 61 | 100 | 161 | |||||||||||||||||||||||||||||||||||||||||
Segment operating profit(c) |
1,650 | 582 | 2,232 | 1,702 | 761 | 2,463 | |||||||||||||||||||||||||||||||||||||||||
Other selling, general and administrative expenses(b) |
$ | 189 | 189 | $ | 170 | 170 | |||||||||||||||||||||||||||||||||||||||||
| Stock-based compensation expense, net | 78 | 78 | 91 | 91 | |||||||||||||||||||||||||||||||||||||||||||
| Depreciation, amortization and accretion | 869 | 869 | 876 | 876 | |||||||||||||||||||||||||||||||||||||||||||
Restructuring charges(d) |
56 | 56 | — | — | |||||||||||||||||||||||||||||||||||||||||||
| Interest expense and amortization of deferred financing costs, net | 456 | 456 | 410 | 410 | |||||||||||||||||||||||||||||||||||||||||||
Other (income) expenses to reconcile to income (loss) before income taxes(e) |
8 | 8 | 28 | 28 | |||||||||||||||||||||||||||||||||||||||||||
| Income (loss) before income taxes | $ | 576 | $ | 888 | |||||||||||||||||||||||||||||||||||||||||||
| COMPANY OVERVIEW |
OUTLOOK | CONSOLIDATED FINANCIALS | CAPITALIZATION OVERVIEW | TOWERS SEGMENT | FIBER SEGMENT | APPENDIX | ||||||||||||||
| NON-GAAP MEASURES AND OTHER INFORMATION | ||
| COMPANY OVERVIEW |
OUTLOOK | CONSOLIDATED FINANCIALS | CAPITALIZATION OVERVIEW | TOWERS SEGMENT | FIBER SEGMENT | APPENDIX | ||||||||||||||
| COMPANY OVERVIEW |
OUTLOOK | CONSOLIDATED FINANCIALS | CAPITALIZATION OVERVIEW | TOWERS SEGMENT | FIBER SEGMENT | APPENDIX | ||||||||||||||
| COMPANY OVERVIEW |
OUTLOOK | CONSOLIDATED FINANCIALS | CAPITALIZATION OVERVIEW | TOWERS SEGMENT | FIBER SEGMENT | APPENDIX | ||||||||||||||
| 2023 | 2024 | ||||||||||||||||||||||||||||||||||
(in millions; totals may not sum due to rounding) |
Q1 | Q2 | Q3 | Q4 | Q1 | Q2 | |||||||||||||||||||||||||||||
| Net income (loss) | $ | 418 | $ | 445 | $ | 265 | $ | 361 | $ | 311 | $ | 251 | |||||||||||||||||||||||
| Adjustments to increase (decrease) net income (loss) | |||||||||||||||||||||||||||||||||||
| Asset write-down charges | — | 22 | 8 | 3 | 6 | 3 | |||||||||||||||||||||||||||||
| Acquisition and integration costs | — | 1 | — | — | — | — | |||||||||||||||||||||||||||||
| Depreciation, amortization and accretion | 431 | 445 | 439 | 439 | 439 | 430 | |||||||||||||||||||||||||||||
Restructuring charges(a) |
— | — | 72 | 13 | 11 | 45 | |||||||||||||||||||||||||||||
| Amortization of prepaid lease purchase price adjustments | 4 | 4 | 4 | 4 | 4 | 4 | |||||||||||||||||||||||||||||
Interest expense and amortization of deferred financing costs, net(b) |
202 | 208 | 217 | 223 | 226 | 230 | |||||||||||||||||||||||||||||
| (Gains) losses on retirement of long-term obligations | — | — | — | — | — | — | |||||||||||||||||||||||||||||
| Interest income | (2) | (5) | (3) | (5) | (4) | (4) | |||||||||||||||||||||||||||||
| Other (income) expense | 3 | 2 | — | 2 | (2) | 1 | |||||||||||||||||||||||||||||
| (Benefit) provision for income taxes | 7 | 7 | 7 | 5 | 7 | 7 | |||||||||||||||||||||||||||||
| Stock-based compensation expense, net | 41 | 50 | 36 | 31 | 38 | 40 | |||||||||||||||||||||||||||||
Adjusted EBITDA(c)(d) |
$ | 1,104 | $ | 1,188 | $ | 1,047 | $ | 1,076 | $ | 1,036 | $ | 1,006 | |||||||||||||||||||||||
(in millions; totals may not sum due to rounding) |
Full Year 2024 Outlook(f) |
||||||||||
| Net income (loss) | $1,125 | to | $1,190 | ||||||||
| Adjustments to increase (decrease) net income (loss): | |||||||||||
| Asset write-down charges | $42 | to | $52 | ||||||||
| Acquisition and integration costs | $0 | to | $6 | ||||||||
| Depreciation, amortization and accretion | $1,680 | to | $1,775 | ||||||||
Restructuring charges(a) |
$100 | to | $130 | ||||||||
| Amortization of prepaid lease purchase price adjustments | $15 | to | $17 | ||||||||
Interest expense and amortization of deferred financing costs, net(e) |
$926 | to | $971 | ||||||||
| (Gains) losses on retirement of long-term obligations | — | to | — | ||||||||
| Interest income | $(12) | to | $(11) | ||||||||
| Other (income) expense | $0 | to | $9 | ||||||||
| (Benefit) provision for income taxes | $20 | to | $28 | ||||||||
| Stock-based compensation expense, net | $142 | to | $146 | ||||||||
Adjusted EBITDA(c)(d) |
$4,143 | to | $4,193 | ||||||||
| COMPANY OVERVIEW |
OUTLOOK | CONSOLIDATED FINANCIALS | CAPITALIZATION OVERVIEW | TOWERS SEGMENT | FIBER SEGMENT | APPENDIX | ||||||||||||||
(in millions; totals may not sum due to rounding) |
2023 | 2024 | |||||||||||||||||||||||||||||||||
| Q1 | Q2 | Q3 | Q4 | Q1 | Q2 | ||||||||||||||||||||||||||||||
| Net income (loss) | $ | 418 | $ | 455 | $ | 265 | $ | 361 | $ | 311 | $ | 251 | |||||||||||||||||||||||
| Real estate related depreciation, amortization and accretion | 417 | 424 | 425 | 426 | 425 | 415 | |||||||||||||||||||||||||||||
| Asset write-down charges | — | 22 | 8 | 3 | 6 | 3 | |||||||||||||||||||||||||||||
FFO(a)(b) |
$ | 835 | $ | 901 | $ | 698 | $ | 790 | $ | 742 | $ | 669 | |||||||||||||||||||||||
| Weighted-average common shares outstanding—diluted | 434 | 434 | 434 | 434 | 434 | 435 | |||||||||||||||||||||||||||||
| FFO (from above) | $ | 835 | $ | 901 | $ | 698 | $ | 790 | $ | 742 | $ | 669 | |||||||||||||||||||||||
| Adjustments to increase (decrease) FFO: | |||||||||||||||||||||||||||||||||||
| Straight-lined revenues | (83) | (80) | (59) | (51) | (59) | (56) | |||||||||||||||||||||||||||||
| Straight-lined expenses | 20 | 18 | 18 | 17 | 17 | 17 | |||||||||||||||||||||||||||||
| Stock-based compensation expense, net | 41 | 50 | 36 | 31 | 38 | 40 | |||||||||||||||||||||||||||||
| Non-cash portion of tax provision | 9 | (6) | 4 | — | 7 | (2) | |||||||||||||||||||||||||||||
Non-real estate related depreciation, amortization and accretion |
14 | 21 | 14 | 13 | 14 | 15 | |||||||||||||||||||||||||||||
| Amortization of non-cash interest expense | 4 | 4 | 3 | 3 | 3 | 3 | |||||||||||||||||||||||||||||
| Other (income) expense | 3 | 2 | — | 2 | (2) | 1 | |||||||||||||||||||||||||||||
| (Gains) losses on retirement of long-term obligations | — | — | — | — | — | — | |||||||||||||||||||||||||||||
| Acquisition and integration costs | — | 1 | — | — | — | — | |||||||||||||||||||||||||||||
Restructuring charges(c) |
— | — | 72 | 13 | 11 | 45 | |||||||||||||||||||||||||||||
| Sustaining capital expenditures | (15) | (18) | (21) | (28) | (22) | (27) | |||||||||||||||||||||||||||||
AFFO(a)(b) |
$ | 828 | $ | 891 | $ | 767 | $ | 790 | $ | 749 | $ | 704 | |||||||||||||||||||||||
| Weighted-average common shares outstanding—diluted | 434 | 434 | 434 | 434 | 434 | 435 | |||||||||||||||||||||||||||||
| COMPANY OVERVIEW |
OUTLOOK | CONSOLIDATED FINANCIALS | CAPITALIZATION OVERVIEW | TOWERS SEGMENT | FIBER SEGMENT | APPENDIX | ||||||||||||||
(in millions, except per share amounts; totals may not sum due to rounding) |
2023 | 2024 | |||||||||||||||||||||||||||||||||
| Q1 | Q2 | Q3 | Q4 | Q1 | Q2 | ||||||||||||||||||||||||||||||
| Net income (loss) | $ | 0.96 | $ | 1.05 | $ | 0.61 | $ | 0.83 | $ | 0.72 | $ | 0.58 | |||||||||||||||||||||||
| Real estate related depreciation, amortization and accretion | 0.96 | 0.98 | 0.98 | 0.98 | 0.98 | 0.95 | |||||||||||||||||||||||||||||
| Asset write-down charges | — | 0.05 | 0.02 | 0.01 | 0.01 | 0.01 | |||||||||||||||||||||||||||||
FFO(a)(b) |
$ | 1.92 | $ | 2.08 | $ | 1.61 | $ | 1.82 | $ | 1.71 | $ | 1.54 | |||||||||||||||||||||||
| Weighted-average common shares outstanding—diluted | 434 | 434 | 434 | 434 | 435 | 435 | |||||||||||||||||||||||||||||
| FFO (from above) | $ | 1.92 | $ | 2.08 | $ | 1.61 | $ | 1.82 | $ | 1.71 | $ | 1.54 | |||||||||||||||||||||||
| Adjustments to increase (decrease) FFO: | |||||||||||||||||||||||||||||||||||
| Straight-lined revenues | (0.19) | (0.18) | (0.14) | (0.12) | (0.14) | (0.13) | |||||||||||||||||||||||||||||
| Straight-lined expenses | 0.05 | 0.04 | 0.04 | 0.04 | 0.04 | 0.04 | |||||||||||||||||||||||||||||
| Stock-based compensation expense, net | 0.09 | 0.12 | 0.08 | 0.07 | 0.09 | 0.09 | |||||||||||||||||||||||||||||
| Non-cash portion of tax provision | 0.02 | (0.01) | 0.01 | — | 0.02 | — | |||||||||||||||||||||||||||||
| Non-real estate related depreciation, amortization and accretion | 0.03 | 0.05 | 0.03 | 0.03 | 0.03 | 0.03 | |||||||||||||||||||||||||||||
| Amortization of non-cash interest expense | 0.01 | 0.01 | 0.01 | 0.01 | 0.01 | 0.01 | |||||||||||||||||||||||||||||
| Other (income) expense | 0.01 | — | — | — | — | — | |||||||||||||||||||||||||||||
| (Gains) losses on retirement of long-term obligations | — | — | — | — | — | — | |||||||||||||||||||||||||||||
| Acquisition and integration costs | — | — | — | — | — | — | |||||||||||||||||||||||||||||
Restructuring charges(c) |
— | — | 0.17 | 0.03 | 0.03 | 0.10 | |||||||||||||||||||||||||||||
| Sustaining capital expenditures | (0.03) | (0.04) | (0.05) | (0.06) | (0.05) | (0.06) | |||||||||||||||||||||||||||||
AFFO(a)(b) |
$ | 1.91 | $ | 2.05 | $ | 1.77 | $ | 1.82 | $ | 1.72 | $ | 1.62 | |||||||||||||||||||||||
| Weighted-average common shares outstanding—diluted | 434 | 434 | 434 | 434 | 435 | 435 | |||||||||||||||||||||||||||||
| COMPANY OVERVIEW |
OUTLOOK | CONSOLIDATED FINANCIALS | CAPITALIZATION OVERVIEW | TOWERS SEGMENT | FIBER SEGMENT | APPENDIX | ||||||||||||||
(in millions; totals may not sum due to rounding) |
Full Year 2024 Outlook(a) |
Full Year 2024 Outlook Per Share(a) |
|||||||||||||||||||||
| Net income (loss) | $1,125 | to | $1,190 | $2.59 | to | $2.74 | |||||||||||||||||
| Real estate related depreciation, amortization and accretion | $1,634 | to | $1,714 | $3.76 | to | $3.94 | |||||||||||||||||
| Asset write-down charges | $42 | to | $52 | $0.10 | to | $0.12 | |||||||||||||||||
FFO(b)(c) |
$2,863 | to | $2,893 | $6.58 | to | $6.65 | |||||||||||||||||
| Weighted-average common shares outstanding—diluted | 435 | 435 | |||||||||||||||||||||
| FFO (from above) | $2,863 | to | $2,893 | $6.58 | to | $6.65 | |||||||||||||||||
| Adjustments to increase (decrease) FFO: | |||||||||||||||||||||||
| Straight-lined revenues | $(187) | to | $(162) | $(0.43) | to | $(0.37) | |||||||||||||||||
| Straight-lined expenses | $55 | to | $75 | $0.13 | to | $0.17 | |||||||||||||||||
| Stock-based compensation expense, net | $142 | to | $146 | $0.33 | to | $0.34 | |||||||||||||||||
| Non-cash portion of tax provision | $2 | to | $17 | $0.00 | to | $0.04 | |||||||||||||||||
| Non-real estate related depreciation, amortization and accretion | $46 | to | $61 | $0.11 | to | $0.14 | |||||||||||||||||
| Amortization of non-cash interest expense | $9 | to | $19 | $0.02 | to | $0.04 | |||||||||||||||||
| Other (income) expense | $0 | to | $9 | $0.00 | to | $0.02 | |||||||||||||||||
| (Gains) losses on retirement of long-term obligations | — | to | — | — | to | — | |||||||||||||||||
| Acquisition and integration costs | $0 | to | $6 | $0.00 | to | $0.01 | |||||||||||||||||
Restructuring charges(d) |
$100 | to | $130 | $0.23 | to | $0.30 | |||||||||||||||||
| Sustaining capital expenditures | $(85) | to | $(65) | $(0.20) | to | $(0.15) | |||||||||||||||||
AFFO(b)(c) |
$3,005 | to | $3,055 | $6.91 | to | $7.02 | |||||||||||||||||
| Weighted-average common shares outstanding—diluted | 435 | 435 | |||||||||||||||||||||
(as of June 30, 2024; dollars in millions) |
|||||
| Total debt and other obligations (current and non-current) | $ | 23,719 | |||
| Unamortized adjustments, net | 155 | ||||
| Total face value of debt | 23,874 | ||||
Less: Ending cash and cash equivalents and restricted cash and cash equivalents |
331 | ||||
Net Debt(e) |
$ | 23,543 | |||
Adjusted EBITDA for the three months ended June 30, 2024(e) |
$ | 1,006 | |||
Last quarter annualized Adjusted EBITDA(e) |
4,024 | ||||
Net debt to Last Quarter Annualized Adjusted EBITDA(e) |
5.9 | x | |||