Investor Presentation EagleBankCorp.com November 2023 Scan here for digital version:

Forward Looking Statements 2 This presentation contains forward looking statements within the meaning of the Securities and Exchange Act of 1934, as amended, including statements of goals, intentions, and expectations as to future trends, plans, events or results of Company operations and policies and regarding general economic conditions. In some cases, forward-looking statements can be identified by use of words such as “may,” “will,” “anticipates,” “believes,” “expects,” “plans,” “estimates,” “potential,” “continue,” “should,” and similar words or phrases. These statements are based upon current and anticipated economic conditions, nationally and in the Company’s market, interest rates and interest rate policy, competitive factors and other conditions which by their nature, are not susceptible to accurate forecast and are subject to significant uncertainty. For details on factors that could affect these expectations, see the risk factors and other cautionary language included in the Company’s Quarterly Report on Form 10-Q for the quarter ended September 30, 2023, the Company’s Annual Report on Form 10-K for the year ended December 31, 2022, and other periodic and current reports filed with the SEC. Because of these uncertainties and the assumptions on which this discussion and the forward-looking statements are based, actual future operations and results in the future may differ materially from those indicated herein. Readers are cautioned against placing undue reliance on any such forward-looking statements. The Company’s past results are not necessarily indicative of future performance. The Company does not undertake to publicly revise or update forward-looking statements in this presentation to reflect events or circumstances that arise after the date of this presentation, except as may be required under applicable law. This presentation was delivered digitally. The Company makes no representation that subsequent to delivery of the presentation it was not altered. For the most current, accurate information, please refer to www.eaglebankcorp.com and go to the Investor Relations tab. For further information on the Company please contact: David G. Danielson P 240-552-9534 E ddanielson@eaglebankcorp.com
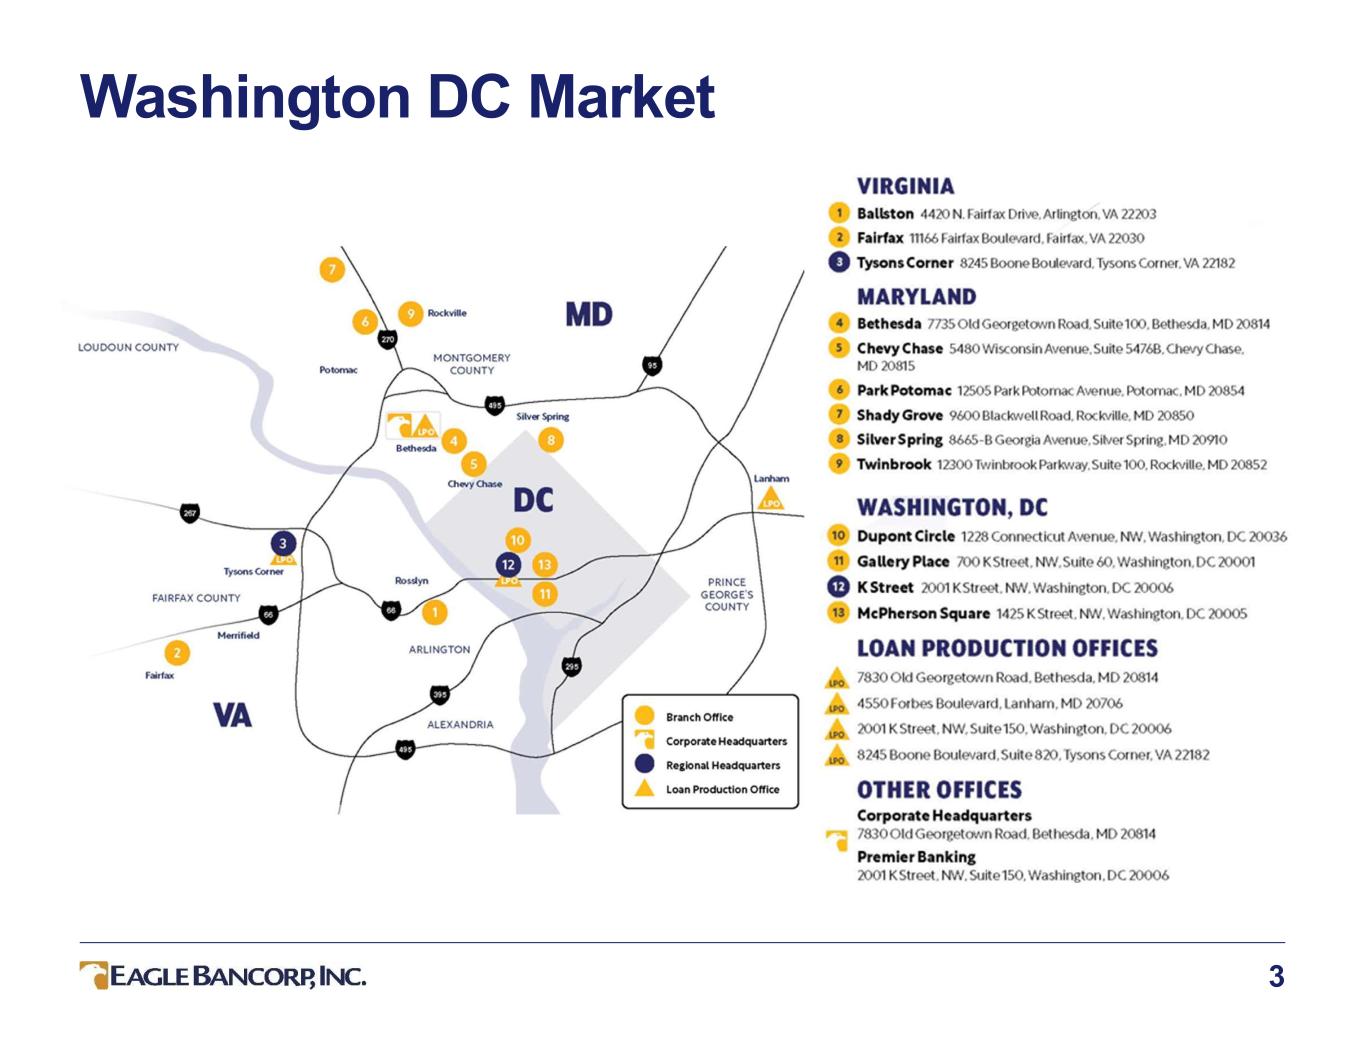
Washington DC Market 3

Investment Rationale 4 Strategically positioned in one of the most attractive markets in the U.S. Solid capitalization and prudent capital management Well-managed asset quality Superior efficiency with optimized branch network Recognized expertise in CRE, C&I and construction lending Dedicated, diverse and experienced Board focused on vision and governance 8.5% CAGR on Tangible Book Value Per Share excluding AOCI* For the period 12/31/2020 through 9/30/2023 *Please refer to Non-GAAP reconciliation and footnotes in the appendices. The CAGR for Book Value Per Share with AOCI included was 1.5% and excluded was 8.1% for the period from December 31, 2020, through September 30, 2023.

Key Strategic Objectives 5 • Core Deposit Growth o Focus on deposit growth from existing and new CRE/C&I customers using our lending capacity to entice core deposit growth and stability of deposits. o Enhance our treasury management program and product suite to build and maintain C&I relationships. o Enhance our digital banking platform to improve the ease of opening accounts on-line and leverage our in-footprint brand to increase market share of deposits in the Washington DC area as well as the DMV region and beyond. o Leverage our existing branch network to drive customer acquisition and exploring how to increase EagleBank’s physical presence in lower cost geographies contiguous to the Washington DC metro market. • C&I Loan Growth o Enhance our C&I lending capabilities to obtain greater growth and diversity within the loan portfolio. This will include enhancement of the treasury management system and more focus on cash management service. • Proactive Management of Office and Multi-family Portfolios o Continue to have expert teams regularly assess exposures and relationship managers proactively reach out to clients well in advance of maturities to achieve results beneficial to both the Bank and the borrower.

Biographies 6 Susan Riel CEO & President, Eagle Bancorp & EagleBank 47 years in banking 25 years with EGBN Eric Newell EVP & Chief Financial Officer, Eagle Bancorp 21 years in banking <1 year with EGBN Norman R. Pozez Executive Chair - Board of Directors 15 years with EGBN Charles Levingston EVP & Chief Financial Officer, EagleBank 23 years in banking 11 years with EGBN Janice Williams EVP, Eagle Bancorp; Senior EVP & Chief Credit Officer, EagleBank 29 years in banking 20 years with EGBN Karen Buck EVP & Chief Administrative Officer, EagleBank 34 years in financial services <1 years with EGBN • Served as CFO at Equity Bancshares in Wichita, KS ($5.1B assets) • Served as CFO at United Bank in Hartford, CT ($7.3B assets) • Served as CFO and head of Treasury at Rockville Bank, Glastonbury, CT. • Became CEO in 2019 • Member of the Company Board of Directors since 2017 • Started with the Company in 1998 • Served as EVP, Director of Operations/Contact Center at Flagstar in Michigan • Served as EVP Commercial, Retail/Payment operations at TD Bank. • Previously served as CFO of Eagle Bancorp and EVP of Finance at the Bank. • Served as the Federal Reserve Bank as a Bank Examiner • Served as a Manager at PriceWaterhouseCoopers • Served as EVP of the Bank in various capacities as Credit Officer, Senior Credit Officer • Previously served with several banks in the Washington DC area • Chairman and Chief Executive Officer of The Uniwest Companies • Previously served as COO of The Hair Cuttery of Falls Church Virginia

Summary Statistics 7 Total Assets $ billion Total Loans $ billion Total Deposits $ billion Tangible Common Equity $ billion Shares Outstanding (at close September 30, 2023) 29,917,982 Market Capitalization (at close November 8, 2023) $649 million Tangible Book Value per Common Share $37.12 Institutional Ownership 82% Member of Russell 2000 yes Member of S&P SmallCap 600 yes Note: Financial data as of September 30, 2023 unless otherwise noted. (1) Equity was $1.2 billion and book value was $40.64 per share. Please refer to the Non-GAAP reconciliation in the appendix. (2) Based on November 8, 2023 closing price of $21.70 per share and September 30, 2023 shares outstanding. (1) (1) (2)
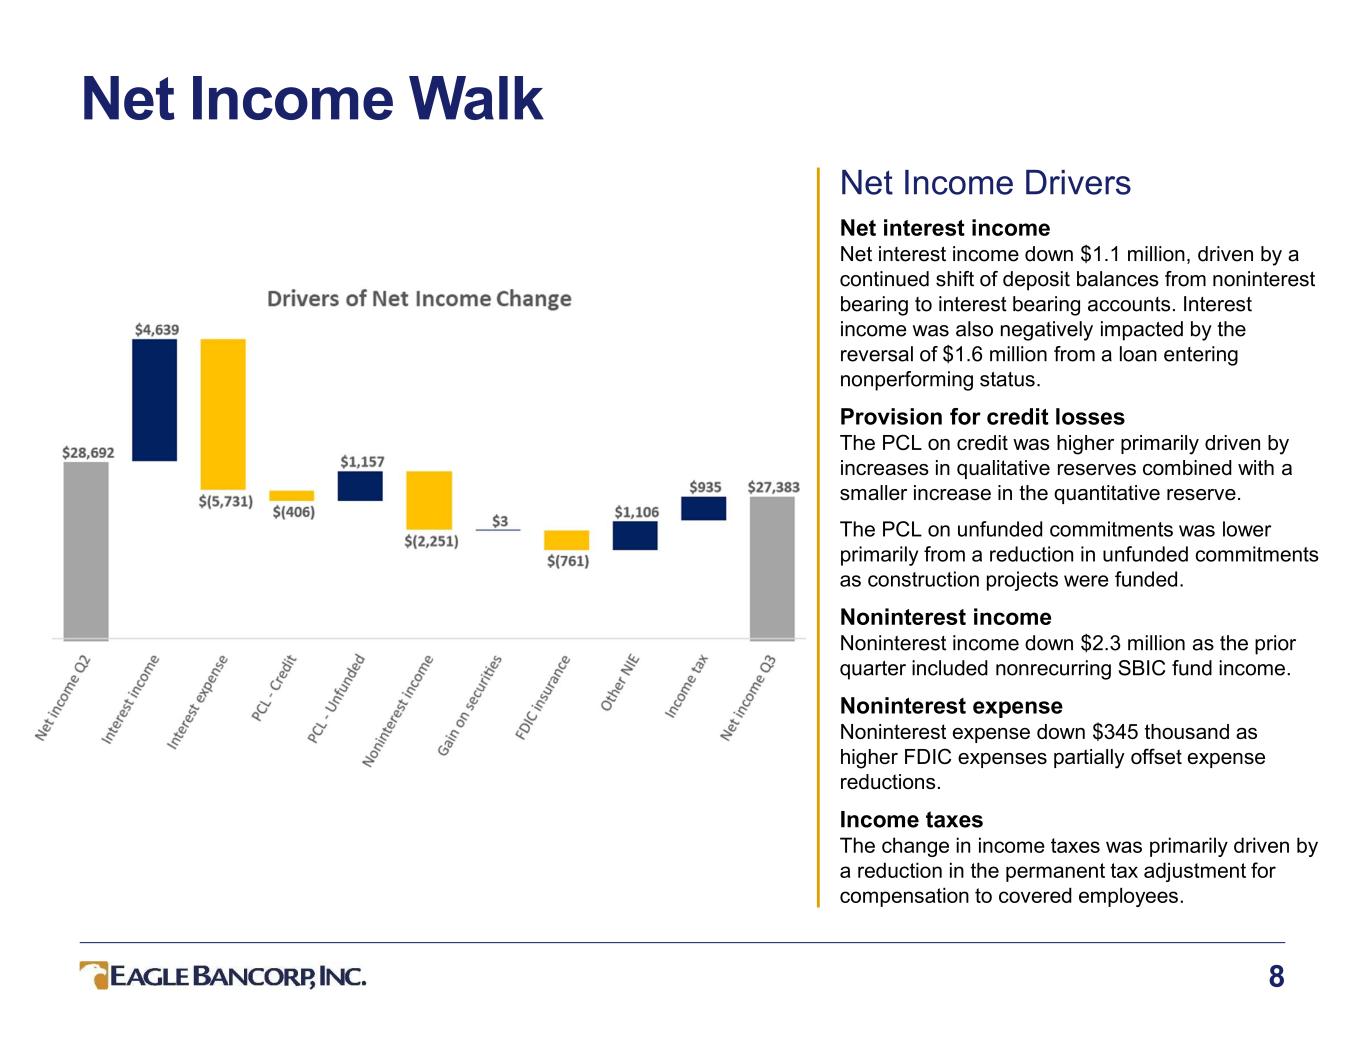
Net Income Walk 8 Net Income Drivers Net interest income Net interest income down $1.1 million, driven by a continued shift of deposit balances from noninterest bearing to interest bearing accounts. Interest income was also negatively impacted by the reversal of $1.6 million from a loan entering nonperforming status. Provision for credit losses The PCL on credit was higher primarily driven by increases in qualitative reserves combined with a smaller increase in the quantitative reserve. The PCL on unfunded commitments was lower primarily from a reduction in unfunded commitments as construction projects were funded. Noninterest income Noninterest income down $2.3 million as the prior quarter included nonrecurring SBIC fund income. Noninterest expense Noninterest expense down $345 thousand as higher FDIC expenses partially offset expense reductions. Income taxes The change in income taxes was primarily driven by a reduction in the permanent tax adjustment for compensation to covered employees.
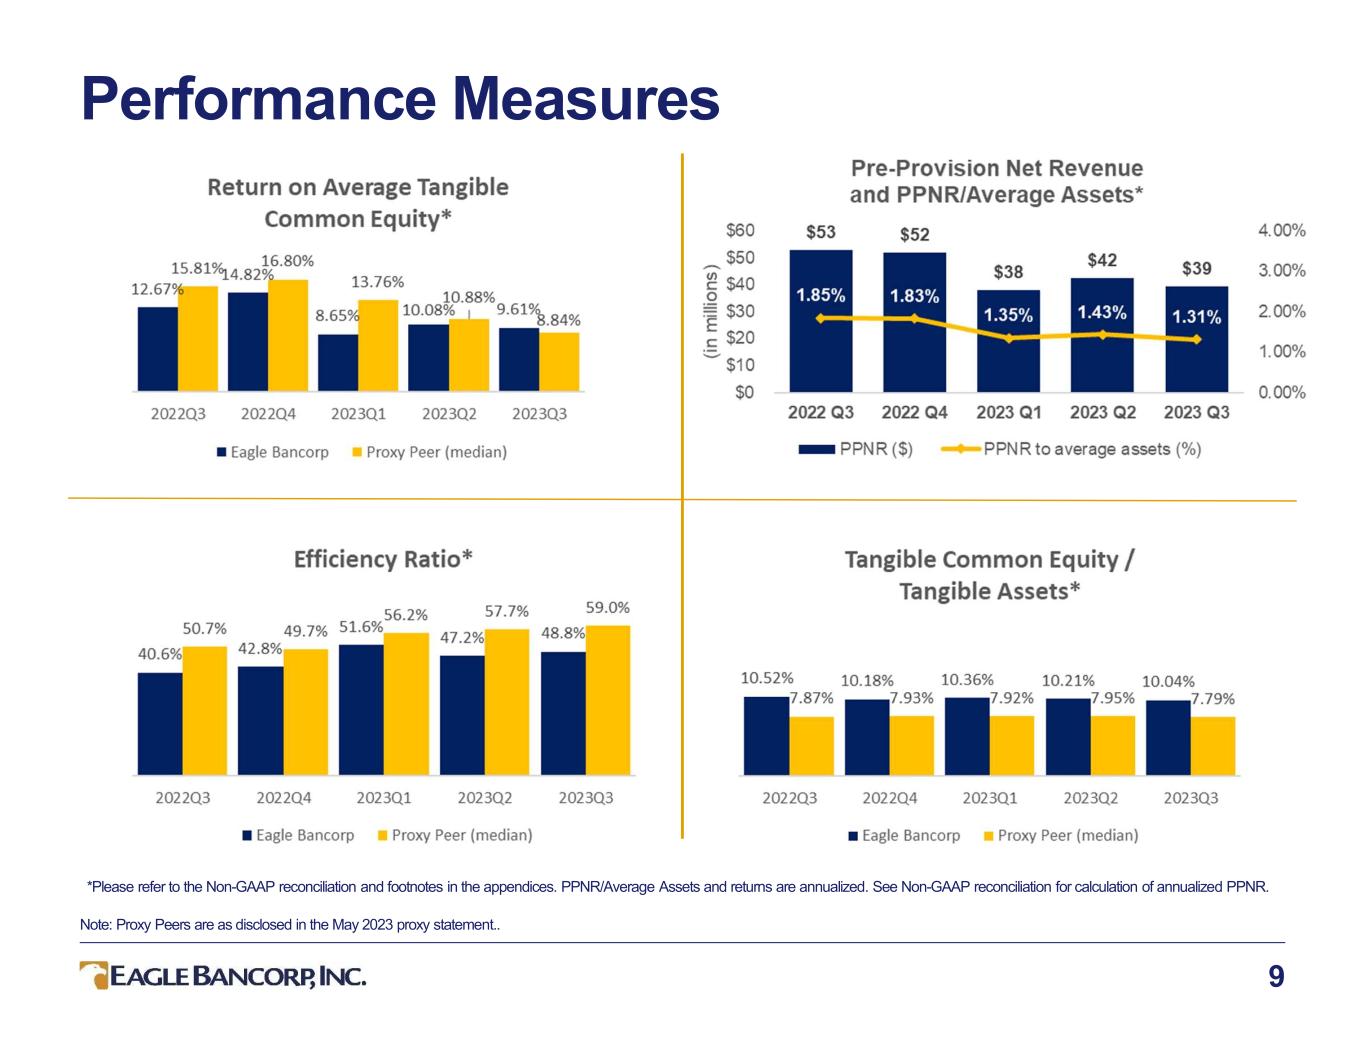
Performance Measures 9 *Please refer to the Non-GAAP reconciliation and footnotes in the appendices. PPNR/Average Assets and returns are annualized. See Non-GAAP reconciliation for calculation of annualized PPNR. Note: Proxy Peers are as disclosed in the May 2023 proxy statement..

Net Interest Income 10

11 Yield/Cost Components *For betas, the denominator is the change in the Average Effective Fed Funds rate for the quarter, starting with 2022 Q1. **Beginning in the second quarter of 2023, the Company revised its cost of funds methodology to use a daily average calculation where interest expense on interest bearing liabilities is divided by average interest-bearing liabilities and average noninterest bearing deposits. Previously, the Company calculated the cost of funds as the difference between yield on earning assets and net interest margin. Prior periods have been conformed to the current presentation.
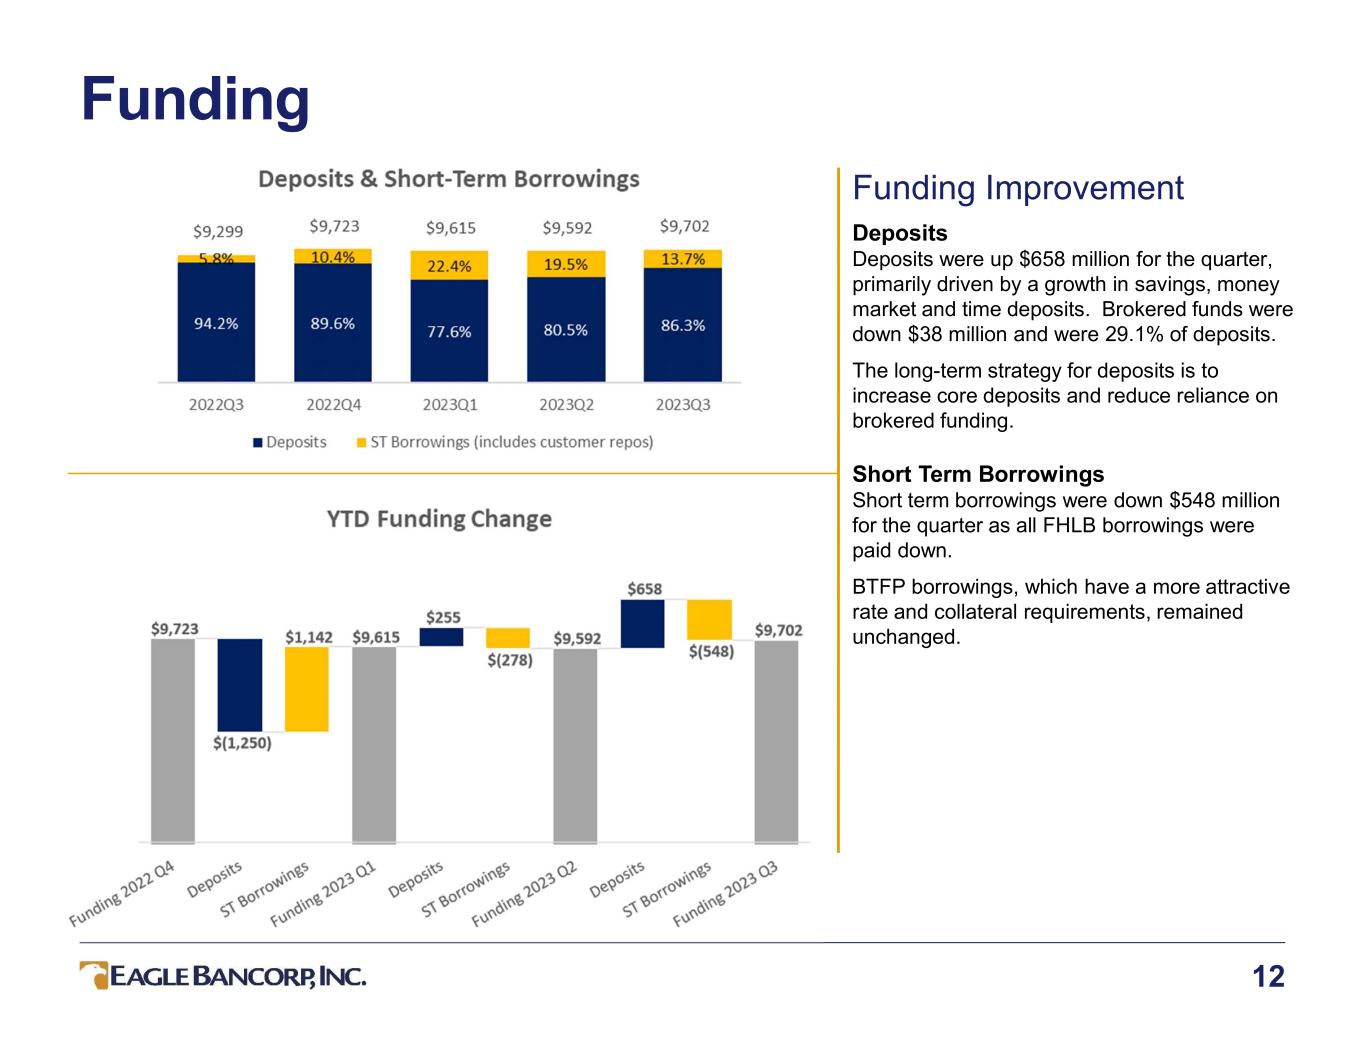
Funding 12 Funding Improvement Deposits Deposits were up $658 million for the quarter, primarily driven by a growth in savings, money market and time deposits. Brokered funds were down $38 million and were 29.1% of deposits. The long-term strategy for deposits is to increase core deposits and reduce reliance on brokered funding. Short Term Borrowings Short term borrowings were down $548 million for the quarter as all FHLB borrowings were paid down. BTFP borrowings, which have a more attractive rate and collateral requirements, remained unchanged.
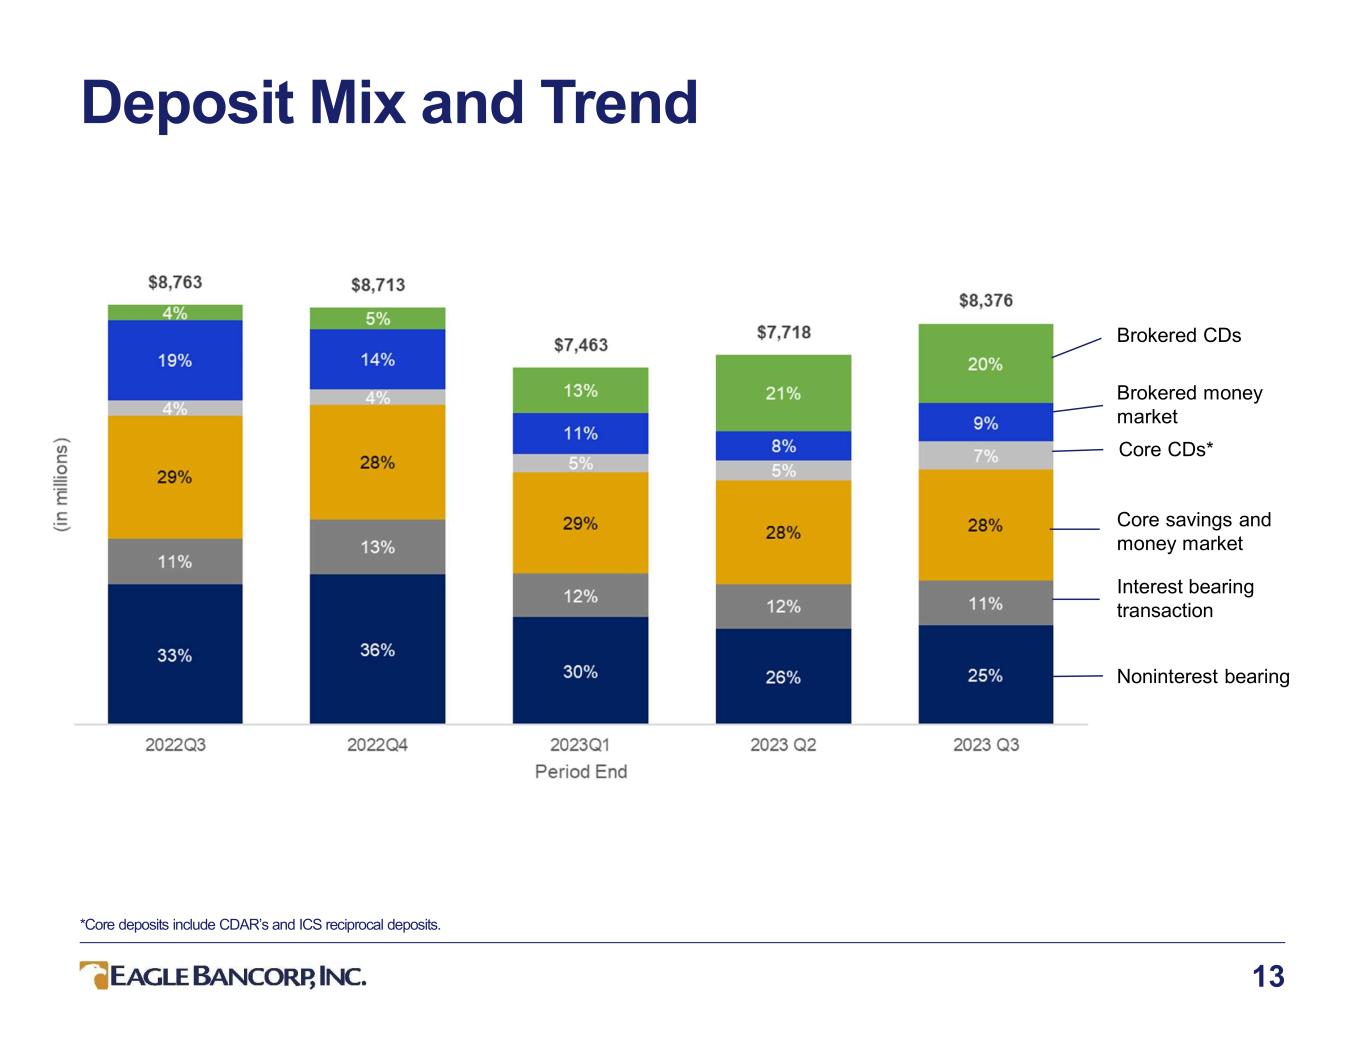
Deposit Mix and Trend 13 *Core deposits include CDAR’s and ICS reciprocal deposits. Brokered CDs Brokered money market Core CDs* Core savings and money market Interest bearing transaction Noninterest bearing
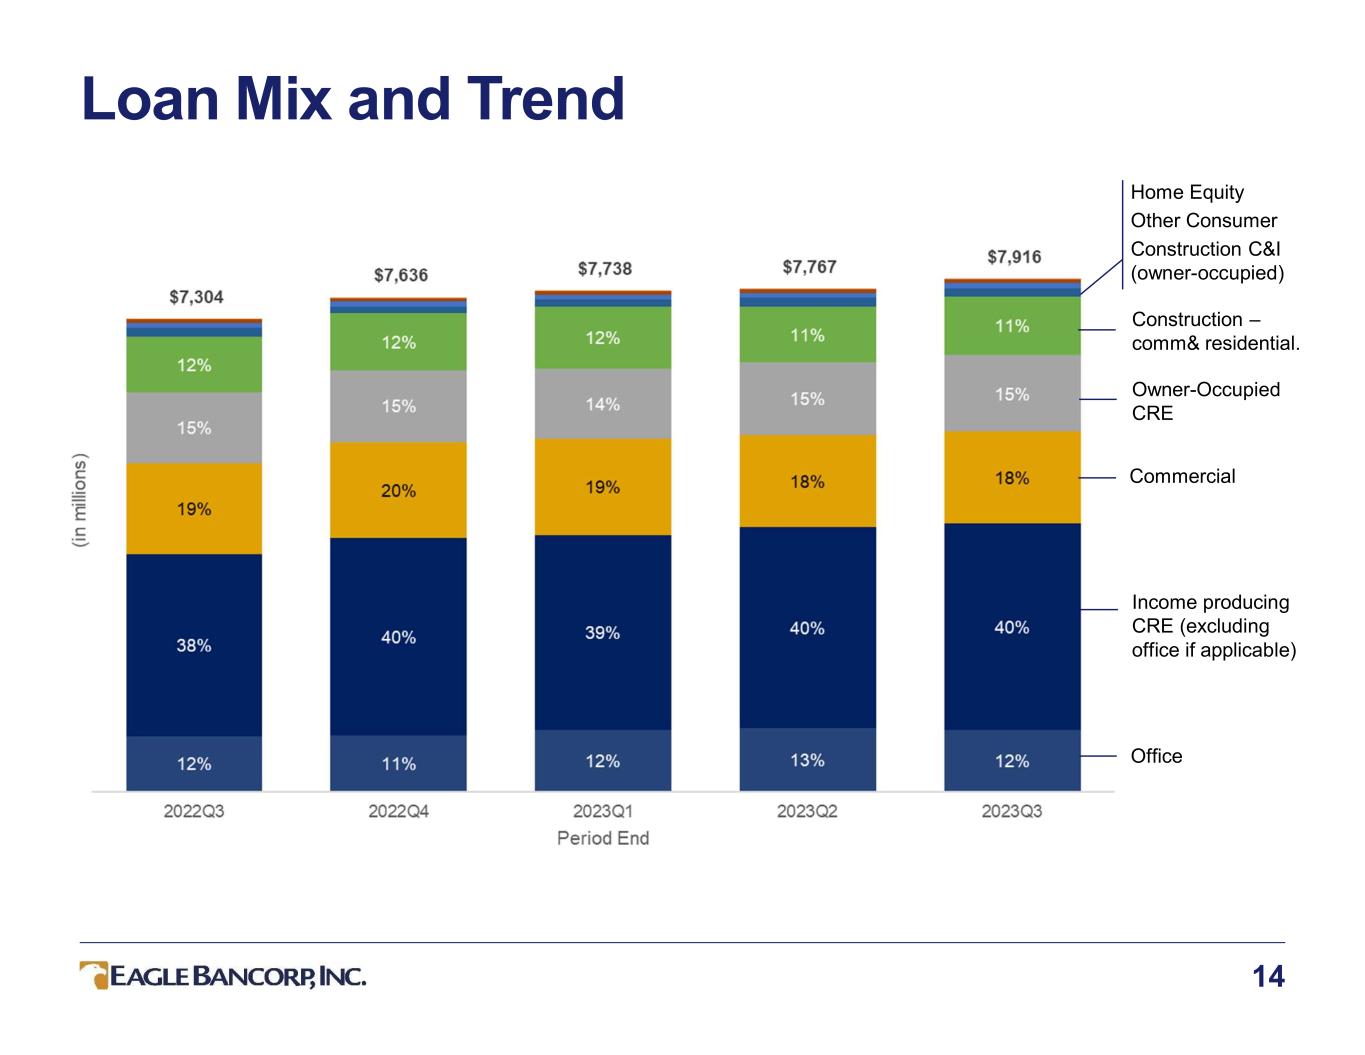
Loan Mix and Trend 14 Office Income producing CRE (excluding office if applicable) Commercial Owner-Occupied CRE Construction – comm& residential. Home Equity Other Consumer Construction C&I (owner-occupied)

15 Loan Type and Classification $ in millions Balance % of Hotel/Motel $400 9.6% Industrial 139 3.4% Mixed Use 378 9.1% Multifamily 820 19.8% Office & Office Condo 950 22.9% Retail 430 10.4% Single/1-4 Family & Res. Condo 113 2.7% Other 917 22.1% Total $4,147 100.0% Income Producing CRE by Type - 9/30/2023 *Includes land. $ in millions Balance % of Commercial $1,419 17.9% Income-producing - CRE 3,197 40.4% Income-producing - CRE (Office) 950 12.0% Owner-occupied - commercial real estate 1,183 15.0% Real estate mortgage - residential 77 1.0% Construction - commercial and residential* 904 11.4% Construction - C&I (owner-occupied) 130 1.6% Home equity 54 0.7% Other consumer 2 0.0% Total $7,916 100.0% Loans by Type - 9/30/2023

Asset Quality Metrics 16 *Excludes loans held for sale. **Non-performing assets (“NPAs”) include loans 90 days past due and still accruing. Charts for Allowance for Credit Losses and NPAs are as of period end. Net Charge Offs (“NCO”) are annualized for periods of less than a year.

Investment Portfolio 17 Investment portfolio strategy • Portfolio positioned to manage liquidity and pledging needs • Cash flow (principal and interest) from portfolio averaged $69 million per quarter YTD • Cash flow projected principal only: o 2024 - $326 million o 2025 - $375 million • Total securities down $185 million YTD from principal paydowns, maturities received, and lower carrying values on securities. • Selling investment securities remains an option for increasing liquidity. • Unencumbered securities of $270 million available for pledging. Note: Chart is as of period end on an amortized cost basis. AFS / HTM as of September 30, 2023 Percent Securities by of Portfolio Book Reprice Classification at Book Yield Term (years) Securities AFS 61% 1.71% 4.4 Securities HTM 39% 2.07% 7.2 Total Securities 100% 1.85% 5.5 Projected
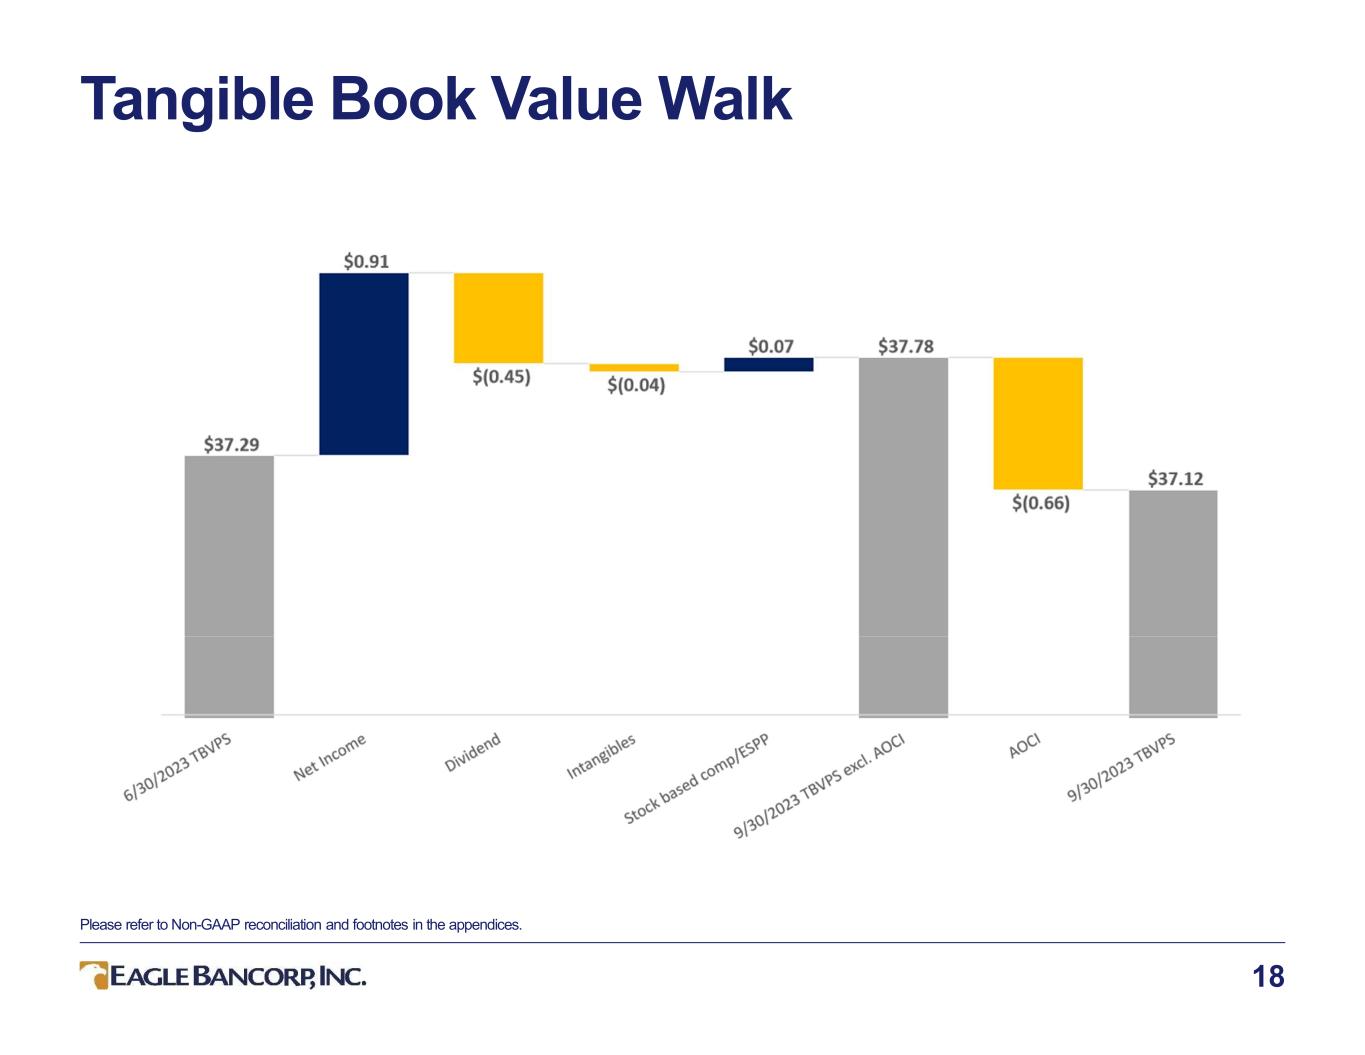
Tangible Book Value Walk 18 Please refer to Non-GAAP reconciliation and footnotes in the appendices.

Tangible Book Value Per Share 19 Per share data is as of period end. Please refer to Non-GAAP reconciliation and footnotes in the appendices. The CAGR for Book Value Per Share with AOCI included was 1.5% and excluded was 8.1% for the period from December 31, 2020, through September 30, 2023. Book values per share, including and excluding AOCI were, respectively, $39.05 and $38.56 (2020Y), $42.28 and $42.72 (2021Y), $39.18 and $45.55 (2022Y), $39.92 and $45.73 (2023Q1), $40.78 and $47.18 (2023Q2), and $40.64 and $47.71 (2023Q3).
Appendices 20

Loan Portfolio – Details 21 Note: Data as of September 30, 2023. $ in millions Location C&I Owner Occupied CRE Income Producing CRE Owner Occupied Const. CRE Construction Land Residential Mortgage Consumer TOTAL % of Total Washington DC $346.0 $294.4 $1,332.4 $67.1 $315.2 $30.5 $35.8 $14.3 $2,435.7 30.8% Suburban Washington Montgomery 219.0 181.8 697.3 9.1 99.9 0.6 7.1 22.8 1,237.6 15.6% Fairfax 216.3 51.8 410.0 - 100.9 27.2 8.2 9.6 824.0 10.4% Prince George's 128.7 272.8 339.9 8.0 53.6 14.0 - 0.6 817.6 10.3% Loudoun 57.3 37.3 195.5 3.9 42.5 4.2 1.1 1.7 343.5 4.4% Alexandria 28.8 16.2 201.2 5.7 54.4 1.0 1.3 0.4 309.0 3.9% Prince William 6.4 23.9 192.5 23.8 46.2 - - 0.5 293.3 3.7% Arlington 76.3 0.3 94.1 - 5.4 - 1.4 1.7 179.2 2.3% Frederick 8.5 - 52.1 1.8 - - 0.5 0.4 63.3 0.8% Suburban Washington 741.3 584.1 2,182.6 52.3 402.9 47.0 19.6 37.7 4,067.5 51.4% Other Maryland Anne Arundel 8.2 22.8 98.5 0.6 17.2 12.7 1.4 0.5 161.9 2.1% Baltimore 50.7 25.2 42.5 0.6 26.3 - - - 145.3 1.8% Eastern Shore 7.1 8.0 46.2 - 10.7 0.1 1.1 0.9 74.1 0.9% Howard 9.0 2.7 26.3 - - 1.6 1.4 0.7 41.7 0.5% Charles 0.5 20.6 3.9 - - - - 0.2 25.2 0.3% Other MD 1.2 4.9 19.8 - - - 0.1 0.5 26.5 0.3% Other Maryland 76.7 84.2 237.2 1.2 54.2 14.4 4.0 2.8 474.7 5.9% Other Virginia Fauquier - - 9.0 - - - - - 9.0 0.1% Other VA 55.8 44.8 262.0 2.5 10.4 - 0.3 0.3 376.1 4.8% Other Virginia 55.8 44.8 271.0 2.5 10.4 - 0.3 0.3 385.1 4.9% Other USA 199.5 175.4 124.8 6.6 20.1 8.9 16.8 1.3 553.4 7.0% Total $1,419.3 $1,182.9 $4,148.0 $129.7 $802.8 $100.8 $76.5 $56.4 $7,916.4 100.0%

Loan Portfolio – Income Producing CRE 22 Note: Data as of September 30, 2023. $ in millions Location Hotel/Motel Industrial Mixed Use Multifamily Office Retail Other TOTAL % of Total Washington DC $139.6 $5.0 $276.0 $354.0 $232.5 $82.5 $79.5 $163.3 $1,332.4 32.1% Suburban Washington Montgomery - 24.5 39.8 203.9 272.8 12.8 1.8 141.7 697.3 16.8% Fairfax - 2.6 1.0 1.0 199.0 52.9 10.8 142.7 410.0 9.9% Prince George's 85.8 52.1 7.3 68.4 44.0 43.3 0.8 38.2 339.9 8.2% Loudoun - 14.0 3.6 - 16.6 3.4 1.5 156.4 195.5 4.7% Alexandria 20.6 - 6.9 71.3 53.8 14.9 2.8 30.9 201.2 4.9% Prince William - 3.0 - 4.4 7.6 8.7 0.5 168.3 192.5 4.6% Arlington 46.4 - - 0.2 45.9 - 1.6 - 94.1 2.3% Frederick - 2.0 0.5 - 5.5 39.2 0.5 4.4 52.1 1.3% Suburban Washington 152.8 98.2 59.1 349.2 645.2 175.2 20.3 682.6 2,182.6 52.6% Other Maryland Anne Arundel 33.2 - 7.0 - 1.7 51.6 - 5.0 98.5 2.4% Baltimore 14.4 - 1.0 2.4 2.8 10.0 0.5 11.4 42.5 1.0% Eastern Shore 36.3 6.7 - - - 0.7 - 2.5 46.2 1.1% Howard - 6.1 - - 2.0 6.0 2.1 10.1 26.3 0.6% Charles - 3.9 - - - - - - 3.9 0.1% Other MD - 15.9 3.5 - - 0.4 - - 19.8 0.5% Other Maryland 83.9 32.6 11.5 2.4 6.5 68.7 2.6 29.0 237.2 5.7% Other Virginia Fauquier - - - - 6.2 - - 2.8 9.0 0.2% Other VA - 3.3 25.9 56.0 59.6 101.2 6.6 9.4 262.0 6.3% Other Virginia - 3.3 25.9 56.0 65.8 101.2 6.6 12.2 271.0 6.5% Other USA 23.8 - 5.4 59.0 0.1 2.0 4.1 30.4 124.8 3.0% Total $400.1 $139.1 $377.9 $820.6 $950.1 $429.6 $113.1 $917.5 $4,148.0 100.0% % of Total 9.6% 3.4% 9.1% 19.8% 22.9% 10.4% 2.7% 22.1% 100.0% Single/1-4 Family & Res. Condo
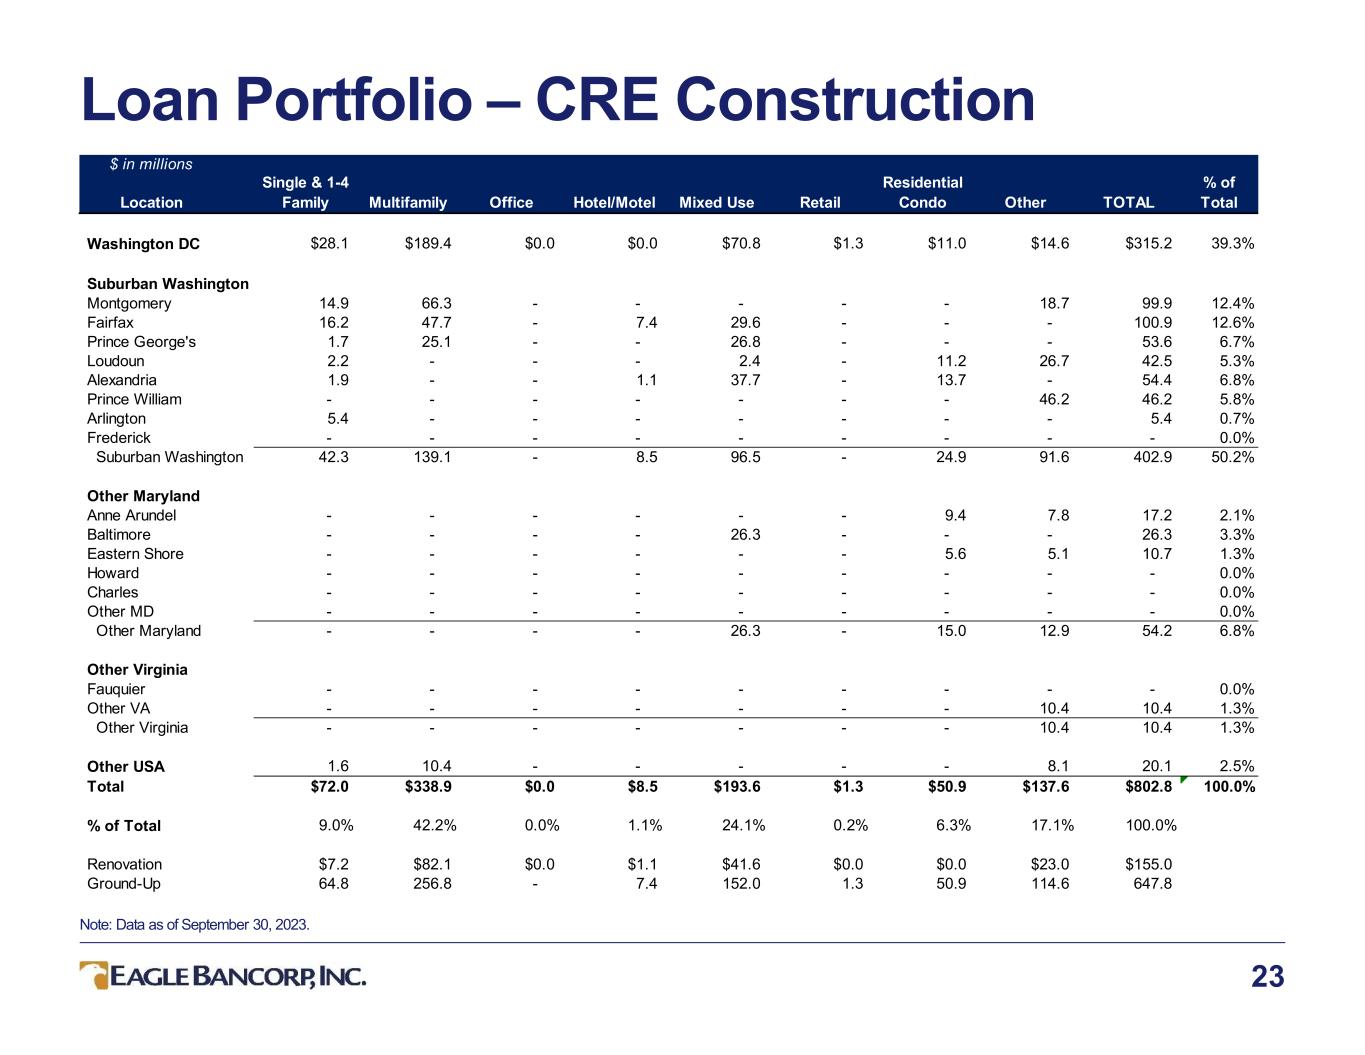
Loan Portfolio – CRE Construction 23 Note: Data as of September 30, 2023. $ in millions Location Single & 1-4 Family Multifamily Office Hotel/Motel Mixed Use Retail Residential Condo Other TOTAL % of Total Washington DC $28.1 $189.4 $0.0 $0.0 $70.8 $1.3 $11.0 $14.6 $315.2 39.3% Suburban Washington Montgomery 14.9 66.3 - - - - - 18.7 99.9 12.4% Fairfax 16.2 47.7 - 7.4 29.6 - - - 100.9 12.6% Prince George's 1.7 25.1 - - 26.8 - - - 53.6 6.7% Loudoun 2.2 - - - 2.4 - 11.2 26.7 42.5 5.3% Alexandria 1.9 - - 1.1 37.7 - 13.7 - 54.4 6.8% Prince William - - - - - - - 46.2 46.2 5.8% Arlington 5.4 - - - - - - - 5.4 0.7% Frederick - - - - - - - - - 0.0% Suburban Washington 42.3 139.1 - 8.5 96.5 - 24.9 91.6 402.9 50.2% Other Maryland Anne Arundel - - - - - - 9.4 7.8 17.2 2.1% Baltimore - - - - 26.3 - - - 26.3 3.3% Eastern Shore - - - - - - 5.6 5.1 10.7 1.3% Howard - - - - - - - - - 0.0% Charles - - - - - - - - - 0.0% Other MD - - - - - - - - - 0.0% Other Maryland - - - - 26.3 - 15.0 12.9 54.2 6.8% Other Virginia Fauquier - - - - - - - - - 0.0% Other VA - - - - - - - 10.4 10.4 1.3% Other Virginia - - - - - - - 10.4 10.4 1.3% Other USA 1.6 10.4 - - - - - 8.1 20.1 2.5% Total $72.0 $338.9 $0.0 $8.5 $193.6 $1.3 $50.9 $137.6 $802.8 100.0% % of Total 9.0% 42.2% 0.0% 1.1% 24.1% 0.2% 6.3% 17.1% 100.0% Renovation $7.2 $82.1 $0.0 $1.1 $41.6 $0.0 $0.0 $23.0 $155.0 Ground-Up 64.8 256.8 - 7.4 152.0 1.3 50.9 114.6 647.8
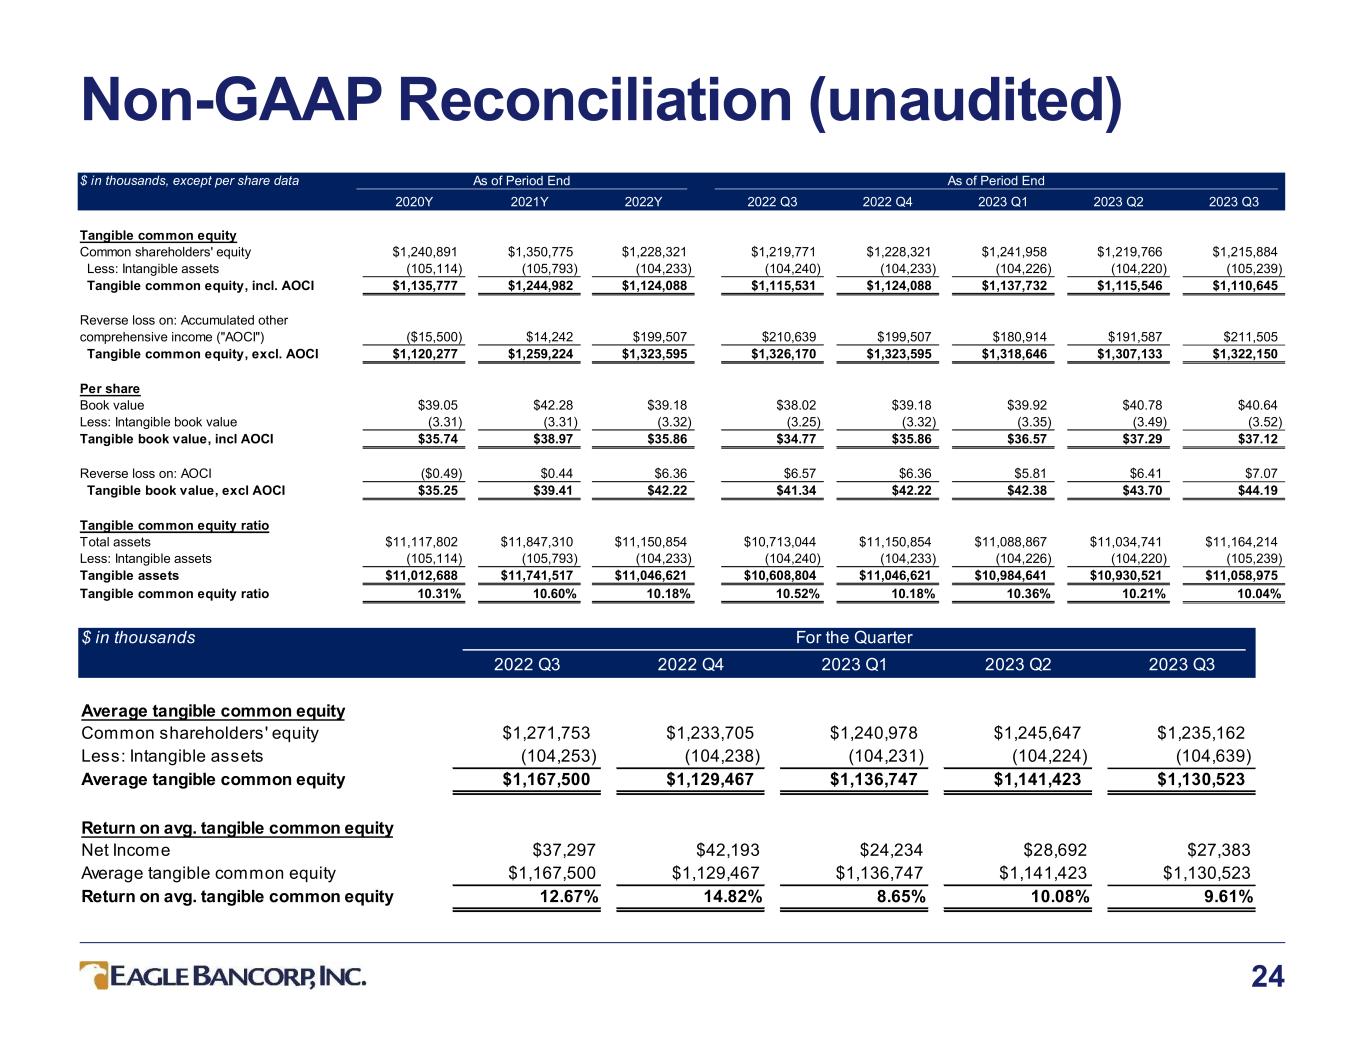
24 Non-GAAP Reconciliation (unaudited) $ in thousands 2022 Q3 2022 Q4 2023 Q1 2023 Q2 2023 Q3 Average tangible common equity Common shareholders' equity $1,271,753 $1,233,705 $1,240,978 $1,245,647 $1,235,162 Less: Intangible assets (104,253) (104,238) (104,231) (104,224) (104,639) Average tangible common equity $1,167,500 $1,129,467 $1,136,747 $1,141,423 $1,130,523 Return on avg. tangible common equity Net Income $37,297 $42,193 $24,234 $28,692 $27,383 Average tangible common equity $1,167,500 $1,129,467 $1,136,747 $1,141,423 $1,130,523 Return on avg. tangible common equity 12.67% 14.82% 8.65% 10.08% 9.61% For the Quarter $ in thousands, except per share data 2020Y 2021Y 2022Y 2022 Q3 2022 Q4 2023 Q1 2023 Q2 2023 Q3 Tangible common equity Common shareholders' equity $1,240,891 $1,350,775 $1,228,321 $1,219,771 $1,228,321 $1,241,958 $1,219,766 $1,215,884 Less: Intangible assets (105,114) (105,793) (104,233) (104,240) (104,233) (104,226) (104,220) (105,239) Tangible common equity, incl. AOCI $1,135,777 $1,244,982 $1,124,088 $1,115,531 $1,124,088 $1,137,732 $1,115,546 $1,110,645 Reverse loss on: Accumulated other comprehensive income ("AOCI") ($15,500) $14,242 $199,507 $210,639 $199,507 $180,914 $191,587 $211,505 Tangible common equity, excl. AOCI $1,120,277 $1,259,224 $1,323,595 $1,326,170 $1,323,595 $1,318,646 $1,307,133 $1,322,150 Per share Book value $39.05 $42.28 $39.18 $38.02 $39.18 $39.92 $40.78 $40.64 Less: Intangible book value (3.31) (3.31) (3.32) (3.25) (3.32) (3.35) (3.49) (3.52) Tangible book value, incl AOCI $35.74 $38.97 $35.86 $34.77 $35.86 $36.57 $37.29 $37.12 Reverse loss on: AOCI ($0.49) $0.44 $6.36 $6.57 $6.36 $5.81 $6.41 $7.07 Tangible book value, excl AOCI $35.25 $39.41 $42.22 $41.34 $42.22 $42.38 $43.70 $44.19 Tangible common equity ratio Total assets $11,117,802 $11,847,310 $11,150,854 $10,713,044 $11,150,854 $11,088,867 $11,034,741 $11,164,214 Less: Intangible assets (105,114) (105,793) (104,233) (104,240) (104,233) (104,226) (104,220) (105,239) Tangible assets $11,012,688 $11,741,517 $11,046,621 $10,608,804 $11,046,621 $10,984,641 $10,930,521 $11,058,975 Tangible common equity ratio 10.31% 10.60% 10.18% 10.52% 10.18% 10.36% 10.21% 10.04% As of Period EndAs of Period End

25 Non-GAAP Reconciliation (unaudited) $ in thousands 2022 Q3 2022 Q4 2023 Q1 2023 Q2 2023 Q3 Efficiency Ratio Net interest income $83,897 $85,600 $75,024 $71,811 $70,719 Noninterest income 5,308 5,329 3,700 8,595 6,347 Revenue $89,205 $90,929 $78,724 $80,406 $77,066 Noninterest expense $36,206 $38,918 $40,584 $37,978 $37,633 Efficiency ratio 40.6% 42.8% 51.6% 47.2% 48.8% For the Quarter $ in thousands 2022 Q3 2022 Q4 2023 Q1 2023 Q2 2023 Q3 Pre-Provision Net Revenue Net interest income $83,897 $85,600 $75,024 $71,811 $70,719 Non-interest income 5,308 5,329 3,700 8,595 6,347 Non-interest expense (36,206) (38,918) (40,584) (37,978) (37,633) Pre-Provision Net Revenue 52,999 52,011 38,140 42,428 39,433 Average assets $11,431,110 $11,255,956 $11,426,056 $11,960,111 $11,942,905 PPNR to average assets (%) 1.85% 1.83% 1.35% 1.43% 1.31% For the Quarter

26 Non-GAAP Reconciliation (unaudited) Tangible common equity to tangible assets (the "tangible common equity ratio"), tangible book value per common share, tangible book value per common share excluding accumulated other comprehensive income (“AOCI”), and the return on average tangible common equity are non-GAAP financial measures derived from GAAP based amounts. The Company calculates the tangible common equity ratio by excluding the balance of intangible assets from common shareholders' equity and dividing by tangible assets. The Company calculates tangible book value per common share by dividing tangible common equity by common shares outstanding, as compared to book value per common share, which the Company calculates by dividing common shareholders' equity by common shares outstanding; to calculate the tangible book value per common share excluding the AOCI, tangible common equity is reduced by the loss on the AOCI before dividing by common shares outstanding. The Company calculates the annualized return on average tangible common equity ratio by dividing net income available to common shareholders by average tangible common equity which is calculated by excluding the average balance of intangible assets from the average common shareholders’ equity. The Company considers this information important to shareholders as tangible equity is a measure that is consistent with the calculation of capital for bank regulatory purposes, which excludes intangible assets from the calculation of risk-based ratios and as such is useful for investors, regulators, management and others to evaluate capital adequacy and to compare against other financial institutions. The above table provides reconciliation of these financial measures defined by GAAP with non-GAAP financial measures. Efficiency ratio is a non-GAAP measure calculated by dividing GAAP non-interest expense by the sum of GAAP net interest income and GAAP non-interest (loss) income. Management believes that reporting the non-GAAP efficiency ratio more closely measures its effectiveness of controlling operational activities. The table above shows the calculation of the efficiency ratio from these GAAP measures. Pre-provision net revenue is a non-GAAP financial measure derived from GAAP based amounts. The Company calculates PPNR by subtracting noninterest expenses from the sum of net interest income and noninterest income. PPNR to Average Assets is calculated by dividing the PPNR amount by average assets to obtain a percentage. The Company considers this information important to shareholders because it illustrates revenue excluding the impact of provisions and reversals to the allowance for credit losses on loans. The table above provides a reconciliation of PPNR and PPNR to Average Assets to the nearest GAAP measure.


