0001042046false2024FYhttp://fasb.org/us-gaap/2024#DebtAndEquitySecuritiesRealizedGainLosshttp://fasb.org/us-gaap/2024#DebtAndEquitySecuritiesRealizedGainLosshttp://fasb.org/us-gaap/2024#OtherComprehensiveIncomeUnrealizedHoldingGainLossOnSecuritiesArisingDuringPeriodNetOfTaxhttp://fasb.org/us-gaap/2024#OtherLiabilitieshttp://fasb.org/us-gaap/2024#OtherAssetshttp://fasb.org/us-gaap/2024#OtherLiabilitieshttp://fasb.org/us-gaap/2024#OtherAssetshttp://fasb.org/us-gaap/2024#AvailableForSaleSecuritiesDebtSecuritieshttp://fasb.org/us-gaap/2024#AvailableForSaleSecuritiesDebtSecuritieshttp://fasb.org/us-gaap/2024#OtherAssetshttp://fasb.org/us-gaap/2024#OtherLiabilitieshttp://fasb.org/us-gaap/2024#OtherAssetshttp://fasb.org/us-gaap/2024#OtherLiabilitieshttp://fasb.org/us-gaap/2024#SecuredOvernightFinancingRateSofrMemberhttp://fasb.org/us-gaap/2024#OtherAssetshttp://fasb.org/us-gaap/2024#OtherAssetshttp://fasb.org/us-gaap/2024#OtherLiabilitieshttp://fasb.org/us-gaap/2024#OtherLiabilitieshttp://fasb.org/us-gaap/2024#OtherLiabilitiesiso4217:USDxbrli:sharesiso4217:USDxbrli:sharesafg:Businessesafg:segmentxbrli:pureafg:professionalafg:securityafg:swapafg:collateralized_loan_obligationiso4217:GBPafg:claim00010420462024-01-012024-12-310001042046us-gaap:CommonStockMember2024-01-012024-12-310001042046afg:SubordinatedDebenturesDueInMarch2059Member2024-01-012024-12-310001042046afg:SubordinatedDebenturesDueInJune2060Member2024-01-012024-12-310001042046afg:SubordinatedDebenturesdueinDecember2059Member2024-01-012024-12-310001042046afg:SubordinatedDebenturesDueInSeptember2060Member2024-01-012024-12-3100010420462024-06-3000010420462025-02-0100010420462024-10-012024-12-3100010420462024-12-3100010420462023-12-3100010420462023-01-012023-12-3100010420462022-01-012022-12-310001042046us-gaap:CommonStockMember2021-12-310001042046us-gaap:CommonStockIncludingAdditionalPaidInCapitalMember2021-12-310001042046us-gaap:RetainedEarningsMember2021-12-310001042046us-gaap:AccumulatedOtherComprehensiveIncomeMember2021-12-310001042046us-gaap:ParentMember2021-12-310001042046us-gaap:RetainedEarningsMember2022-01-012022-12-310001042046us-gaap:ParentMember2022-01-012022-12-310001042046us-gaap:AccumulatedOtherComprehensiveIncomeMember2022-01-012022-12-310001042046us-gaap:CommonStockMember2022-01-012022-12-310001042046us-gaap:CommonStockIncludingAdditionalPaidInCapitalMember2022-01-012022-12-310001042046us-gaap:CommonStockMember2022-12-310001042046us-gaap:CommonStockIncludingAdditionalPaidInCapitalMember2022-12-310001042046us-gaap:RetainedEarningsMember2022-12-310001042046us-gaap:AccumulatedOtherComprehensiveIncomeMember2022-12-310001042046us-gaap:ParentMember2022-12-310001042046us-gaap:RetainedEarningsMember2023-01-012023-12-310001042046us-gaap:ParentMember2023-01-012023-12-310001042046us-gaap:AccumulatedOtherComprehensiveIncomeMember2023-01-012023-12-310001042046us-gaap:CommonStockMember2023-01-012023-12-310001042046us-gaap:CommonStockIncludingAdditionalPaidInCapitalMember2023-01-012023-12-310001042046us-gaap:CommonStockMember2023-12-310001042046us-gaap:CommonStockIncludingAdditionalPaidInCapitalMember2023-12-310001042046us-gaap:RetainedEarningsMember2023-12-310001042046us-gaap:AccumulatedOtherComprehensiveIncomeMember2023-12-310001042046us-gaap:ParentMember2023-12-310001042046us-gaap:RetainedEarningsMember2024-01-012024-12-310001042046us-gaap:ParentMember2024-01-012024-12-310001042046us-gaap:AccumulatedOtherComprehensiveIncomeMember2024-01-012024-12-310001042046us-gaap:CommonStockMember2024-01-012024-12-310001042046us-gaap:CommonStockIncludingAdditionalPaidInCapitalMember2024-01-012024-12-310001042046us-gaap:CommonStockMember2024-12-310001042046us-gaap:CommonStockIncludingAdditionalPaidInCapitalMember2024-12-310001042046us-gaap:RetainedEarningsMember2024-12-310001042046us-gaap:AccumulatedOtherComprehensiveIncomeMember2024-12-310001042046us-gaap:ParentMember2024-12-3100010420462022-12-3100010420462021-12-310001042046afg:NewCollateralizedLoanObligationTemporaryWarehousingEntitiesMember2024-12-310001042046srt:MaximumMember2024-01-012024-12-310001042046afg:CropInsuranceContractCropYear2022Memberafg:CropRiskServicesMember2023-07-032023-07-030001042046afg:CropRiskServicesMember2023-07-032023-07-030001042046afg:CropRiskServicesMember2023-07-030001042046afg:CropRiskServicesMemberus-gaap:CustomerRelationshipsMember2023-07-030001042046afg:CropRiskServicesMemberus-gaap:CustomerRelationshipsMember2024-12-310001042046afg:InsuranceAgency2024Member2024-10-012024-12-310001042046afg:ConsultingCompanyMember2024-10-012024-12-310001042046afg:InsuranceAgency2022Member2022-10-012022-12-310001042046afg:PropertyAndCasualtyInsuranceMember2024-12-310001042046afg:PropertyAndCasualtyInsuranceMember2023-12-310001042046us-gaap:CorporateAndOtherMember2024-12-310001042046us-gaap:CorporateAndOtherMember2023-12-310001042046us-gaap:OperatingSegmentsMemberafg:PropertyAndCasualtyInsuranceMemberafg:SpecialtyPropertyAndTransportationInsuranceMember2024-01-012024-12-310001042046us-gaap:OperatingSegmentsMemberafg:PropertyAndCasualtyInsuranceMemberafg:SpecialtyPropertyAndTransportationInsuranceMember2023-01-012023-12-310001042046us-gaap:OperatingSegmentsMemberafg:PropertyAndCasualtyInsuranceMemberafg:SpecialtyPropertyAndTransportationInsuranceMember2022-01-012022-12-310001042046us-gaap:OperatingSegmentsMemberafg:PropertyAndCasualtyInsuranceMemberafg:SpecialtyCasualtyInsuranceMember2024-01-012024-12-310001042046us-gaap:OperatingSegmentsMemberafg:PropertyAndCasualtyInsuranceMemberafg:SpecialtyCasualtyInsuranceMember2023-01-012023-12-310001042046us-gaap:OperatingSegmentsMemberafg:PropertyAndCasualtyInsuranceMemberafg:SpecialtyCasualtyInsuranceMember2022-01-012022-12-310001042046us-gaap:OperatingSegmentsMemberafg:PropertyAndCasualtyInsuranceMemberafg:SpecialtyFinancialInsuranceMember2024-01-012024-12-310001042046us-gaap:OperatingSegmentsMemberafg:PropertyAndCasualtyInsuranceMemberafg:SpecialtyFinancialInsuranceMember2023-01-012023-12-310001042046us-gaap:OperatingSegmentsMemberafg:PropertyAndCasualtyInsuranceMemberafg:SpecialtyFinancialInsuranceMember2022-01-012022-12-310001042046us-gaap:OperatingSegmentsMemberafg:PropertyAndCasualtyInsuranceMemberafg:SpecialtyOtherInsuranceMember2024-01-012024-12-310001042046us-gaap:OperatingSegmentsMemberafg:PropertyAndCasualtyInsuranceMemberafg:SpecialtyOtherInsuranceMember2023-01-012023-12-310001042046us-gaap:OperatingSegmentsMemberafg:PropertyAndCasualtyInsuranceMemberafg:SpecialtyOtherInsuranceMember2022-01-012022-12-310001042046us-gaap:OperatingSegmentsMemberafg:PropertyAndCasualtyInsuranceMember2024-01-012024-12-310001042046us-gaap:OperatingSegmentsMemberafg:PropertyAndCasualtyInsuranceMember2023-01-012023-12-310001042046us-gaap:OperatingSegmentsMemberafg:PropertyAndCasualtyInsuranceMember2022-01-012022-12-310001042046us-gaap:OperatingSegmentsMemberus-gaap:CorporateAndOtherMember2024-01-012024-12-310001042046us-gaap:OperatingSegmentsMemberus-gaap:CorporateAndOtherMember2023-01-012023-12-310001042046us-gaap:OperatingSegmentsMemberus-gaap:CorporateAndOtherMember2022-01-012022-12-310001042046us-gaap:OperatingSegmentsMemberafg:PropertyAndCasualtyInsuranceMemberafg:OtherLinesMember2024-01-012024-12-310001042046us-gaap:OperatingSegmentsMemberafg:PropertyAndCasualtyInsuranceMemberafg:OtherLinesMember2023-01-012023-12-310001042046us-gaap:OperatingSegmentsMemberafg:PropertyAndCasualtyInsuranceMemberafg:OtherLinesMember2022-01-012022-12-310001042046us-gaap:CorporateAndOtherMember2023-01-012023-12-310001042046us-gaap:CorporateAndOtherMember2022-01-012022-12-310001042046us-gaap:CorporateAndOtherMember2024-01-012024-12-310001042046afg:VerikaiIncMember2021-12-310001042046afg:VerikaiIncMemberafg:ContingentConsiderationAcquisitionsMember2023-09-300001042046afg:VerikaiIncMemberafg:ContingentConsiderationAcquisitionsMember2023-07-012023-09-3000010420462023-07-012023-09-300001042046us-gaap:FairValueInputsLevel1Memberus-gaap:USTreasuryAndGovernmentMember2024-12-310001042046us-gaap:FairValueInputsLevel2Memberus-gaap:USTreasuryAndGovernmentMember2024-12-310001042046us-gaap:FairValueInputsLevel3Memberus-gaap:USTreasuryAndGovernmentMember2024-12-310001042046us-gaap:USTreasuryAndGovernmentMember2024-12-310001042046us-gaap:FairValueInputsLevel1Memberus-gaap:USStatesAndPoliticalSubdivisionsMember2024-12-310001042046us-gaap:FairValueInputsLevel2Memberus-gaap:USStatesAndPoliticalSubdivisionsMember2024-12-310001042046us-gaap:FairValueInputsLevel3Memberus-gaap:USStatesAndPoliticalSubdivisionsMember2024-12-310001042046us-gaap:USStatesAndPoliticalSubdivisionsMember2024-12-310001042046us-gaap:FairValueInputsLevel1Memberus-gaap:ForeignGovernmentDebtSecuritiesMember2024-12-310001042046us-gaap:FairValueInputsLevel2Memberus-gaap:ForeignGovernmentDebtSecuritiesMember2024-12-310001042046us-gaap:FairValueInputsLevel3Memberus-gaap:ForeignGovernmentDebtSecuritiesMember2024-12-310001042046us-gaap:ForeignGovernmentDebtSecuritiesMember2024-12-310001042046us-gaap:FairValueInputsLevel1Memberus-gaap:ResidentialMortgageBackedSecuritiesMember2024-12-310001042046us-gaap:FairValueInputsLevel2Memberus-gaap:ResidentialMortgageBackedSecuritiesMember2024-12-310001042046us-gaap:FairValueInputsLevel3Memberus-gaap:ResidentialMortgageBackedSecuritiesMember2024-12-310001042046us-gaap:ResidentialMortgageBackedSecuritiesMember2024-12-310001042046us-gaap:FairValueInputsLevel1Memberus-gaap:CommercialMortgageBackedSecuritiesMember2024-12-310001042046us-gaap:FairValueInputsLevel2Memberus-gaap:CommercialMortgageBackedSecuritiesMember2024-12-310001042046us-gaap:FairValueInputsLevel3Memberus-gaap:CommercialMortgageBackedSecuritiesMember2024-12-310001042046us-gaap:CommercialMortgageBackedSecuritiesMember2024-12-310001042046us-gaap:FairValueInputsLevel1Memberus-gaap:CollateralizedLoanObligationsMember2024-12-310001042046us-gaap:FairValueInputsLevel2Memberus-gaap:CollateralizedLoanObligationsMember2024-12-310001042046us-gaap:FairValueInputsLevel3Memberus-gaap:CollateralizedLoanObligationsMember2024-12-310001042046us-gaap:CollateralizedLoanObligationsMember2024-12-310001042046us-gaap:FairValueInputsLevel1Memberus-gaap:AssetBackedSecuritiesMember2024-12-310001042046us-gaap:FairValueInputsLevel2Memberus-gaap:AssetBackedSecuritiesMember2024-12-310001042046us-gaap:FairValueInputsLevel3Memberus-gaap:AssetBackedSecuritiesMember2024-12-310001042046us-gaap:AssetBackedSecuritiesMember2024-12-310001042046us-gaap:FairValueInputsLevel1Memberus-gaap:CorporateDebtSecuritiesMember2024-12-310001042046us-gaap:FairValueInputsLevel2Memberus-gaap:CorporateDebtSecuritiesMember2024-12-310001042046us-gaap:FairValueInputsLevel3Memberus-gaap:CorporateDebtSecuritiesMember2024-12-310001042046us-gaap:CorporateDebtSecuritiesMember2024-12-310001042046us-gaap:FairValueInputsLevel1Memberus-gaap:FixedMaturitiesMember2024-12-310001042046us-gaap:FairValueInputsLevel2Memberus-gaap:FixedMaturitiesMember2024-12-310001042046us-gaap:FairValueInputsLevel3Memberus-gaap:FixedMaturitiesMember2024-12-310001042046us-gaap:FixedMaturitiesMember2024-12-310001042046us-gaap:FairValueInputsLevel1Memberus-gaap:EquitySecuritiesMember2024-12-310001042046us-gaap:FairValueInputsLevel2Memberus-gaap:EquitySecuritiesMember2024-12-310001042046us-gaap:FairValueInputsLevel3Memberus-gaap:EquitySecuritiesMember2024-12-310001042046us-gaap:EquitySecuritiesMember2024-12-310001042046us-gaap:FairValueInputsLevel1Member2024-12-310001042046us-gaap:FairValueInputsLevel2Member2024-12-310001042046us-gaap:FairValueInputsLevel3Member2024-12-310001042046us-gaap:FairValueInputsLevel1Memberus-gaap:OtherAssetsMember2024-12-310001042046us-gaap:FairValueInputsLevel2Memberus-gaap:OtherAssetsMember2024-12-310001042046us-gaap:FairValueInputsLevel3Memberus-gaap:OtherAssetsMember2024-12-310001042046us-gaap:OtherAssetsMember2024-12-310001042046us-gaap:FairValueInputsLevel1Memberafg:ContingentConsiderationAcquisitionsMember2024-12-310001042046us-gaap:FairValueInputsLevel2Memberafg:ContingentConsiderationAcquisitionsMember2024-12-310001042046us-gaap:FairValueInputsLevel3Memberafg:ContingentConsiderationAcquisitionsMember2024-12-310001042046afg:ContingentConsiderationAcquisitionsMember2024-12-310001042046us-gaap:FairValueInputsLevel1Memberus-gaap:OtherLiabilitiesMember2024-12-310001042046us-gaap:FairValueInputsLevel2Memberus-gaap:OtherLiabilitiesMember2024-12-310001042046us-gaap:FairValueInputsLevel3Memberus-gaap:OtherLiabilitiesMember2024-12-310001042046us-gaap:OtherLiabilitiesMember2024-12-310001042046us-gaap:FairValueInputsLevel1Memberus-gaap:USTreasuryAndGovernmentMember2023-12-310001042046us-gaap:FairValueInputsLevel2Memberus-gaap:USTreasuryAndGovernmentMember2023-12-310001042046us-gaap:FairValueInputsLevel3Memberus-gaap:USTreasuryAndGovernmentMember2023-12-310001042046us-gaap:USTreasuryAndGovernmentMember2023-12-310001042046us-gaap:FairValueInputsLevel1Memberus-gaap:USStatesAndPoliticalSubdivisionsMember2023-12-310001042046us-gaap:FairValueInputsLevel2Memberus-gaap:USStatesAndPoliticalSubdivisionsMember2023-12-310001042046us-gaap:FairValueInputsLevel3Memberus-gaap:USStatesAndPoliticalSubdivisionsMember2023-12-310001042046us-gaap:USStatesAndPoliticalSubdivisionsMember2023-12-310001042046us-gaap:FairValueInputsLevel1Memberus-gaap:ForeignGovernmentDebtSecuritiesMember2023-12-310001042046us-gaap:FairValueInputsLevel2Memberus-gaap:ForeignGovernmentDebtSecuritiesMember2023-12-310001042046us-gaap:FairValueInputsLevel3Memberus-gaap:ForeignGovernmentDebtSecuritiesMember2023-12-310001042046us-gaap:ForeignGovernmentDebtSecuritiesMember2023-12-310001042046us-gaap:FairValueInputsLevel1Memberus-gaap:ResidentialMortgageBackedSecuritiesMember2023-12-310001042046us-gaap:FairValueInputsLevel2Memberus-gaap:ResidentialMortgageBackedSecuritiesMember2023-12-310001042046us-gaap:FairValueInputsLevel3Memberus-gaap:ResidentialMortgageBackedSecuritiesMember2023-12-310001042046us-gaap:ResidentialMortgageBackedSecuritiesMember2023-12-310001042046us-gaap:FairValueInputsLevel1Memberus-gaap:CommercialMortgageBackedSecuritiesMember2023-12-310001042046us-gaap:FairValueInputsLevel2Memberus-gaap:CommercialMortgageBackedSecuritiesMember2023-12-310001042046us-gaap:FairValueInputsLevel3Memberus-gaap:CommercialMortgageBackedSecuritiesMember2023-12-310001042046us-gaap:CommercialMortgageBackedSecuritiesMember2023-12-310001042046us-gaap:FairValueInputsLevel1Memberus-gaap:CollateralizedLoanObligationsMember2023-12-310001042046us-gaap:FairValueInputsLevel2Memberus-gaap:CollateralizedLoanObligationsMember2023-12-310001042046us-gaap:FairValueInputsLevel3Memberus-gaap:CollateralizedLoanObligationsMember2023-12-310001042046us-gaap:CollateralizedLoanObligationsMember2023-12-310001042046us-gaap:FairValueInputsLevel1Memberus-gaap:AssetBackedSecuritiesMember2023-12-310001042046us-gaap:FairValueInputsLevel2Memberus-gaap:AssetBackedSecuritiesMember2023-12-310001042046us-gaap:FairValueInputsLevel3Memberus-gaap:AssetBackedSecuritiesMember2023-12-310001042046us-gaap:AssetBackedSecuritiesMember2023-12-310001042046us-gaap:FairValueInputsLevel1Memberus-gaap:CorporateDebtSecuritiesMember2023-12-310001042046us-gaap:FairValueInputsLevel2Memberus-gaap:CorporateDebtSecuritiesMember2023-12-310001042046us-gaap:FairValueInputsLevel3Memberus-gaap:CorporateDebtSecuritiesMember2023-12-310001042046us-gaap:CorporateDebtSecuritiesMember2023-12-310001042046us-gaap:FairValueInputsLevel1Memberus-gaap:FixedMaturitiesMember2023-12-310001042046us-gaap:FairValueInputsLevel2Memberus-gaap:FixedMaturitiesMember2023-12-310001042046us-gaap:FairValueInputsLevel3Memberus-gaap:FixedMaturitiesMember2023-12-310001042046us-gaap:FixedMaturitiesMember2023-12-310001042046us-gaap:FairValueInputsLevel1Memberus-gaap:EquitySecuritiesMember2023-12-310001042046us-gaap:FairValueInputsLevel2Memberus-gaap:EquitySecuritiesMember2023-12-310001042046us-gaap:FairValueInputsLevel3Memberus-gaap:EquitySecuritiesMember2023-12-310001042046us-gaap:EquitySecuritiesMember2023-12-310001042046us-gaap:FairValueInputsLevel1Member2023-12-310001042046us-gaap:FairValueInputsLevel2Member2023-12-310001042046us-gaap:FairValueInputsLevel3Member2023-12-310001042046us-gaap:FairValueInputsLevel1Memberus-gaap:OtherAssetsMember2023-12-310001042046us-gaap:FairValueInputsLevel2Memberus-gaap:OtherAssetsMember2023-12-310001042046us-gaap:FairValueInputsLevel3Memberus-gaap:OtherAssetsMember2023-12-310001042046us-gaap:OtherAssetsMember2023-12-310001042046us-gaap:FairValueInputsLevel1Memberafg:ContingentConsiderationAcquisitionsMember2023-12-310001042046us-gaap:FairValueInputsLevel2Memberafg:ContingentConsiderationAcquisitionsMember2023-12-310001042046us-gaap:FairValueInputsLevel3Memberafg:ContingentConsiderationAcquisitionsMember2023-12-310001042046afg:ContingentConsiderationAcquisitionsMember2023-12-310001042046us-gaap:FairValueInputsLevel1Memberus-gaap:OtherLiabilitiesMember2023-12-310001042046us-gaap:FairValueInputsLevel2Memberus-gaap:OtherLiabilitiesMember2023-12-310001042046us-gaap:FairValueInputsLevel3Memberus-gaap:OtherLiabilitiesMember2023-12-310001042046us-gaap:OtherLiabilitiesMember2023-12-310001042046us-gaap:USTreasuryAndGovernmentMember2024-01-012024-12-310001042046us-gaap:USStatesAndPoliticalSubdivisionsMember2024-01-012024-12-310001042046us-gaap:ResidentialMortgageBackedSecuritiesMember2024-01-012024-12-310001042046us-gaap:CommercialMortgageBackedSecuritiesMember2024-01-012024-12-310001042046us-gaap:CollateralizedLoanObligationsMember2024-01-012024-12-310001042046us-gaap:AssetBackedSecuritiesMember2024-01-012024-12-310001042046us-gaap:CorporateDebtSecuritiesMember2024-01-012024-12-310001042046us-gaap:FixedMaturitiesMember2024-01-012024-12-310001042046afg:TradingFixedMaturitiesMember2023-12-310001042046afg:TradingFixedMaturitiesMember2024-01-012024-12-310001042046afg:TradingFixedMaturitiesMember2024-12-310001042046us-gaap:EquitySecuritiesMember2024-01-012024-12-310001042046afg:AssetsOfManagedInvestmentEntitiesMember2023-12-310001042046afg:AssetsOfManagedInvestmentEntitiesMember2024-01-012024-12-310001042046afg:AssetsOfManagedInvestmentEntitiesMember2024-12-310001042046afg:ContingentConsiderationAcquisitionsMember2024-01-012024-12-310001042046us-gaap:USTreasuryAndGovernmentMember2022-12-310001042046us-gaap:USTreasuryAndGovernmentMember2023-01-012023-12-310001042046us-gaap:USStatesAndPoliticalSubdivisionsMember2022-12-310001042046us-gaap:USStatesAndPoliticalSubdivisionsMember2023-01-012023-12-310001042046us-gaap:ResidentialMortgageBackedSecuritiesMember2022-12-310001042046us-gaap:ResidentialMortgageBackedSecuritiesMember2023-01-012023-12-310001042046us-gaap:CommercialMortgageBackedSecuritiesMember2022-12-310001042046us-gaap:CommercialMortgageBackedSecuritiesMember2023-01-012023-12-310001042046us-gaap:CollateralizedLoanObligationsMember2022-12-310001042046us-gaap:CollateralizedLoanObligationsMember2023-01-012023-12-310001042046us-gaap:AssetBackedSecuritiesMember2022-12-310001042046us-gaap:AssetBackedSecuritiesMember2023-01-012023-12-310001042046us-gaap:CorporateDebtSecuritiesMember2022-12-310001042046us-gaap:CorporateDebtSecuritiesMember2023-01-012023-12-310001042046us-gaap:FixedMaturitiesMember2022-12-310001042046us-gaap:FixedMaturitiesMember2023-01-012023-12-310001042046us-gaap:EquitySecuritiesMember2022-12-310001042046us-gaap:EquitySecuritiesMember2023-01-012023-12-310001042046afg:AssetsOfManagedInvestmentEntitiesMember2022-12-310001042046afg:AssetsOfManagedInvestmentEntitiesMember2023-01-012023-12-310001042046afg:ContingentConsiderationAcquisitionsMember2022-12-310001042046afg:ContingentConsiderationAcquisitionsMember2023-01-012023-12-310001042046us-gaap:USTreasuryAndGovernmentMember2021-12-310001042046us-gaap:USTreasuryAndGovernmentMember2022-01-012022-12-310001042046us-gaap:USStatesAndPoliticalSubdivisionsMember2021-12-310001042046us-gaap:USStatesAndPoliticalSubdivisionsMember2022-01-012022-12-310001042046us-gaap:ResidentialMortgageBackedSecuritiesMember2021-12-310001042046us-gaap:ResidentialMortgageBackedSecuritiesMember2022-01-012022-12-310001042046us-gaap:CommercialMortgageBackedSecuritiesMember2021-12-310001042046us-gaap:CommercialMortgageBackedSecuritiesMember2022-01-012022-12-310001042046us-gaap:CollateralizedLoanObligationsMember2021-12-310001042046us-gaap:CollateralizedLoanObligationsMember2022-01-012022-12-310001042046us-gaap:AssetBackedSecuritiesMember2021-12-310001042046us-gaap:AssetBackedSecuritiesMember2022-01-012022-12-310001042046us-gaap:CorporateDebtSecuritiesMember2021-12-310001042046us-gaap:CorporateDebtSecuritiesMember2022-01-012022-12-310001042046us-gaap:FixedMaturitiesMember2021-12-310001042046us-gaap:FixedMaturitiesMember2022-01-012022-12-310001042046us-gaap:EquitySecuritiesMember2021-12-310001042046us-gaap:EquitySecuritiesMember2022-01-012022-12-310001042046afg:AssetsOfManagedInvestmentEntitiesMember2021-12-310001042046afg:AssetsOfManagedInvestmentEntitiesMember2022-01-012022-12-310001042046afg:ContingentConsiderationAcquisitionsMember2021-12-310001042046afg:ContingentConsiderationAcquisitionsMember2022-01-012022-12-310001042046us-gaap:CarryingReportedAmountFairValueDisclosureMember2024-12-310001042046us-gaap:EstimateOfFairValueFairValueDisclosureMember2024-12-310001042046us-gaap:CarryingReportedAmountFairValueDisclosureMember2023-12-310001042046us-gaap:EstimateOfFairValueFairValueDisclosureMember2023-12-310001042046us-gaap:USTreasuryAndGovernmentMember2024-12-310001042046us-gaap:USStatesAndPoliticalSubdivisionsMember2024-12-310001042046us-gaap:ForeignGovernmentDebtSecuritiesMember2024-12-310001042046us-gaap:ResidentialMortgageBackedSecuritiesMember2024-12-310001042046us-gaap:CommercialMortgageBackedSecuritiesMember2024-12-310001042046us-gaap:CollateralizedLoanObligationsMember2024-12-310001042046us-gaap:AssetBackedSecuritiesMember2024-12-310001042046us-gaap:CorporateDebtSecuritiesMember2024-12-310001042046us-gaap:FixedMaturitiesMember2024-12-310001042046us-gaap:USTreasuryAndGovernmentMember2023-12-310001042046us-gaap:USStatesAndPoliticalSubdivisionsMember2023-12-310001042046us-gaap:ForeignGovernmentDebtSecuritiesMember2023-12-310001042046us-gaap:ResidentialMortgageBackedSecuritiesMember2023-12-310001042046us-gaap:CommercialMortgageBackedSecuritiesMember2023-12-310001042046us-gaap:CollateralizedLoanObligationsMember2023-12-310001042046us-gaap:AssetBackedSecuritiesMember2023-12-310001042046us-gaap:CorporateDebtSecuritiesMember2023-12-310001042046us-gaap:FixedMaturitiesMember2023-12-310001042046us-gaap:CommonStockMember2024-12-310001042046us-gaap:CommonStockMember2023-12-310001042046us-gaap:PreferredStockMember2024-12-310001042046us-gaap:PreferredStockMember2023-12-310001042046us-gaap:EquitySecuritiesMember2024-12-310001042046us-gaap:EquitySecuritiesMember2023-12-310001042046afg:EquityMethodInvestmentsRealEstateRelatedInvestmentsMember2024-12-310001042046afg:EquityMethodInvestmentsRealEstateRelatedInvestmentsMember2023-12-310001042046afg:EquityMethodInvestmentsRealEstateRelatedInvestmentsMember2024-01-012024-12-310001042046afg:EquityMethodInvestmentsRealEstateRelatedInvestmentsMember2023-01-012023-12-310001042046afg:EquityMethodInvestmentsRealEstateRelatedInvestmentsMember2022-01-012022-12-310001042046afg:EquityMethodInvestmentsPrivateEquityFundsMember2024-12-310001042046afg:EquityMethodInvestmentsPrivateEquityFundsMember2023-12-310001042046afg:EquityMethodInvestmentsPrivateEquityFundsMember2024-01-012024-12-310001042046afg:EquityMethodInvestmentsPrivateEquityFundsMember2023-01-012023-12-310001042046afg:EquityMethodInvestmentsPrivateEquityFundsMember2022-01-012022-12-310001042046afg:EquityMethodInvestmentsPrivateDebtFundsMember2024-12-310001042046afg:EquityMethodInvestmentsPrivateDebtFundsMember2023-12-310001042046afg:EquityMethodInvestmentsPrivateDebtFundsMember2024-01-012024-12-310001042046afg:EquityMethodInvestmentsPrivateDebtFundsMember2023-01-012023-12-310001042046afg:EquityMethodInvestmentsPrivateDebtFundsMember2022-01-012022-12-310001042046srt:MultifamilyMember2024-12-310001042046srt:MultifamilyMember2023-12-310001042046afg:StructuredSecuritiesMember2021-12-310001042046us-gaap:CorporateDebtSecuritiesMember2021-12-310001042046afg:StructuredSecuritiesMember2022-01-012022-12-310001042046us-gaap:CorporateDebtSecuritiesMember2022-01-012022-12-310001042046afg:StructuredSecuritiesMember2022-12-310001042046us-gaap:CorporateDebtSecuritiesMember2022-12-310001042046afg:StructuredSecuritiesMember2023-01-012023-12-310001042046us-gaap:CorporateDebtSecuritiesMember2023-01-012023-12-310001042046afg:StructuredSecuritiesMember2023-12-310001042046afg:StructuredSecuritiesMember2024-01-012024-12-310001042046us-gaap:CorporateDebtSecuritiesMember2024-01-012024-12-310001042046afg:StructuredSecuritiesMember2024-12-310001042046afg:CollateralizedLoanObligationsAndOtherAssetBackedSecuritiesMember2024-12-310001042046us-gaap:MortgageBackedSecuritiesMember2024-12-310001042046us-gaap:InvestmentIncomeMemberus-gaap:FixedMaturitiesMember2024-01-012024-12-310001042046us-gaap:InvestmentIncomeMemberus-gaap:FixedMaturitiesMember2023-01-012023-12-310001042046us-gaap:InvestmentIncomeMemberus-gaap:FixedMaturitiesMember2022-01-012022-12-310001042046us-gaap:InvestmentIncomeMemberus-gaap:FixedMaturitiesMember2024-01-012024-12-310001042046us-gaap:InvestmentIncomeMemberus-gaap:FixedMaturitiesMember2023-01-012023-12-310001042046us-gaap:InvestmentIncomeMemberus-gaap:FixedMaturitiesMember2022-01-012022-12-310001042046us-gaap:InvestmentIncomeMemberus-gaap:EquitySecuritiesMember2024-01-012024-12-310001042046us-gaap:InvestmentIncomeMemberus-gaap:EquitySecuritiesMember2023-01-012023-12-310001042046us-gaap:InvestmentIncomeMemberus-gaap:EquitySecuritiesMember2022-01-012022-12-310001042046us-gaap:InvestmentIncomeMember2024-01-012024-12-310001042046us-gaap:InvestmentIncomeMember2023-01-012023-12-310001042046us-gaap:InvestmentIncomeMember2022-01-012022-12-310001042046us-gaap:CashAndCashEquivalentsMember2024-01-012024-12-310001042046us-gaap:CashAndCashEquivalentsMember2023-01-012023-12-310001042046us-gaap:CashAndCashEquivalentsMember2022-01-012022-12-310001042046us-gaap:OtherLongTermInvestmentsMember2024-01-012024-12-310001042046us-gaap:OtherLongTermInvestmentsMember2023-01-012023-12-310001042046us-gaap:OtherLongTermInvestmentsMember2022-01-012022-12-310001042046us-gaap:FixedMaturitiesMember2024-01-012024-12-310001042046us-gaap:FixedMaturitiesMember2023-01-012023-12-310001042046us-gaap:EquitySecuritiesMember2024-01-012024-12-310001042046us-gaap:EquitySecuritiesMember2023-01-012023-12-310001042046afg:MortgageLoansAndOtherInvestmentsMember2024-01-012024-12-310001042046afg:MortgageLoansAndOtherInvestmentsMember2023-01-012023-12-310001042046afg:PretaxMember2024-01-012024-12-310001042046afg:PretaxMember2023-01-012023-12-310001042046afg:TaxEffectsMember2024-01-012024-12-310001042046afg:TaxEffectsMember2023-01-012023-12-310001042046afg:NetOfTaxMember2024-01-012024-12-310001042046afg:NetOfTaxMember2023-01-012023-12-310001042046us-gaap:FixedMaturitiesMember2022-01-012022-12-310001042046us-gaap:EquitySecuritiesMember2022-01-012022-12-310001042046afg:MortgageLoansAndOtherInvestmentsMember2022-01-012022-12-310001042046afg:PretaxMember2022-01-012022-12-310001042046afg:TaxEffectsMember2022-01-012022-12-310001042046afg:NetOfTaxMember2022-01-012022-12-310001042046afg:RealizedGainsLossesOnSecuritiesMember2024-01-012024-12-310001042046afg:RealizedGainsLossesOnSecuritiesMember2023-01-012023-12-310001042046afg:RealizedGainsLossesOnSecuritiesMember2022-01-012022-12-310001042046us-gaap:InterestRateSwapMemberus-gaap:DesignatedAsHedgingInstrumentMember2024-12-310001042046us-gaap:InterestRateSwapMemberus-gaap:DesignatedAsHedgingInstrumentMember2023-12-310001042046afg:FixedMaturitySecuritiesWithEmbeddedDerivativesMemberus-gaap:NondesignatedMember2024-12-310001042046afg:FixedMaturitySecuritiesWithEmbeddedDerivativesMemberus-gaap:NondesignatedMember2023-12-310001042046us-gaap:TotalReturnSwapMemberus-gaap:NondesignatedMember2023-12-310001042046us-gaap:TotalReturnSwapMemberus-gaap:NondesignatedMember2024-12-310001042046us-gaap:InterestRateSwapMemberus-gaap:CashFlowHedgingMemberus-gaap:DesignatedAsHedgingInstrumentMember2024-12-310001042046us-gaap:InterestRateSwapMemberus-gaap:CashFlowHedgingMemberus-gaap:DesignatedAsHedgingInstrumentMember2023-12-310001042046afg:NewInterestRateSwapsEnteredDuringPeriodMemberus-gaap:CashFlowHedgingMemberus-gaap:DesignatedAsHedgingInstrumentMember2024-12-310001042046us-gaap:InterestRateSwapMemberus-gaap:DesignatedAsHedgingInstrumentMemberus-gaap:InvestmentIncomeMember2024-01-012024-12-310001042046us-gaap:InterestRateSwapMemberus-gaap:DesignatedAsHedgingInstrumentMemberus-gaap:InvestmentIncomeMember2023-01-012023-12-310001042046us-gaap:InterestRateSwapMemberus-gaap:DesignatedAsHedgingInstrumentMemberus-gaap:InvestmentIncomeMembersrt:MaximumMember2022-01-012022-12-310001042046us-gaap:InterestRateSwapMemberus-gaap:DesignatedAsHedgingInstrumentMemberus-gaap:InvestmentIncomeMember2022-01-012022-12-310001042046afg:RealizedGainsLossesOnSecuritiesMemberafg:FixedMaturitySecuritiesWithEmbeddedDerivativesMember2024-01-012024-12-310001042046afg:RealizedGainsLossesOnSecuritiesMemberafg:FixedMaturitySecuritiesWithEmbeddedDerivativesMember2023-01-012023-12-310001042046afg:RealizedGainsLossesOnSecuritiesMemberafg:FixedMaturitySecuritiesWithEmbeddedDerivativesMember2022-01-012022-12-310001042046us-gaap:InvestmentIncomeMemberafg:FixedMaturitySecuritiesWithEmbeddedDerivativesMember2024-01-012024-12-310001042046us-gaap:InvestmentIncomeMemberafg:FixedMaturitySecuritiesWithEmbeddedDerivativesMember2023-01-012023-12-310001042046us-gaap:InvestmentIncomeMemberafg:FixedMaturitySecuritiesWithEmbeddedDerivativesMember2022-01-012022-12-310001042046us-gaap:OtherExpenseMemberus-gaap:TotalReturnSwapMember2024-01-012024-12-310001042046us-gaap:OtherExpenseMemberus-gaap:TotalReturnSwapMember2023-01-012023-12-310001042046us-gaap:OtherExpenseMemberus-gaap:TotalReturnSwapMember2022-01-012022-12-310001042046us-gaap:VariableInterestEntityPrimaryBeneficiaryMember2024-12-310001042046us-gaap:SubordinatedDebtObligationsMemberus-gaap:VariableInterestEntityPrimaryBeneficiaryMember2024-12-310001042046afg:NewCollateralizedLoanObligationEntitiesMember2024-01-012024-12-310001042046afg:NewCollateralizedLoanObligationEntitiesMember2023-01-012023-12-310001042046afg:NewCollateralizedLoanObligationEntitiesMember2022-01-012022-12-310001042046us-gaap:VariableInterestEntityPrimaryBeneficiaryMember2023-12-310001042046us-gaap:VariableInterestEntityPrimaryBeneficiaryMember2022-12-310001042046us-gaap:VariableInterestEntityPrimaryBeneficiaryMember2021-12-310001042046us-gaap:VariableInterestEntityPrimaryBeneficiaryMember2024-01-012024-12-310001042046us-gaap:VariableInterestEntityPrimaryBeneficiaryMember2023-01-012023-12-310001042046us-gaap:VariableInterestEntityPrimaryBeneficiaryMember2022-01-012022-12-310001042046afg:NewCollateralizedLoanObligationTemporaryWarehousingEntitiesMember2023-12-310001042046afg:NewCollateralizedLoanObligationTemporaryWarehousingEntitiesMember2022-12-310001042046afg:ManagedbyThirdPartiesMemberus-gaap:CollateralizedLoanObligationsMember2024-12-310001042046afg:ManagedbyThirdPartiesMemberus-gaap:CollateralizedLoanObligationsMember2023-12-310001042046afg:CropRiskServicesMember2023-01-012023-12-310001042046afg:VerikaiIncMember2023-01-012023-12-310001042046afg:SeniorNotesDueInJune2047Membersrt:ParentCompanyMemberus-gaap:SeniorNotesMember2024-12-310001042046afg:SeniorNotesDueInJune2047Membersrt:ParentCompanyMemberus-gaap:SeniorNotesMember2023-12-310001042046afg:SeniorNotesDueInApril2030Membersrt:ParentCompanyMemberus-gaap:SeniorNotesMember2024-12-310001042046afg:SeniorNotesDueInApril2030Membersrt:ParentCompanyMemberus-gaap:SeniorNotesMember2023-12-310001042046afg:OtherLongtermDebtMembersrt:ParentCompanyMemberus-gaap:SeniorNotesMember2024-12-310001042046afg:OtherLongtermDebtMembersrt:ParentCompanyMemberus-gaap:SeniorNotesMember2023-12-310001042046srt:ParentCompanyMemberus-gaap:SeniorNotesMember2024-12-310001042046srt:ParentCompanyMemberus-gaap:SeniorNotesMember2023-12-310001042046afg:SubordinatedDebenturesDueInSeptember2060Membersrt:ParentCompanyMemberus-gaap:SubordinatedDebtMember2024-12-310001042046afg:SubordinatedDebenturesDueInSeptember2060Membersrt:ParentCompanyMemberus-gaap:SubordinatedDebtMember2023-12-310001042046afg:SubordinatedDebenturesdueinDecember2059Membersrt:ParentCompanyMemberus-gaap:SubordinatedDebtMember2024-12-310001042046afg:SubordinatedDebenturesdueinDecember2059Membersrt:ParentCompanyMemberus-gaap:SubordinatedDebtMember2023-12-310001042046afg:SubordinatedDebenturesDueInJune2060Membersrt:ParentCompanyMemberus-gaap:SubordinatedDebtMember2024-12-310001042046afg:SubordinatedDebenturesDueInJune2060Membersrt:ParentCompanyMemberus-gaap:SubordinatedDebtMember2023-12-310001042046afg:SubordinatedDebenturesDueInMarch2059Membersrt:ParentCompanyMemberus-gaap:SubordinatedDebtMember2024-12-310001042046afg:SubordinatedDebenturesDueInMarch2059Membersrt:ParentCompanyMemberus-gaap:SubordinatedDebtMember2023-12-310001042046srt:ParentCompanyMemberus-gaap:SubordinatedDebtMember2024-12-310001042046srt:ParentCompanyMemberus-gaap:SubordinatedDebtMember2023-12-310001042046afg:SeniorNotesDueInAugust2026Membersrt:ParentCompanyMemberus-gaap:SeniorNotesMember2022-12-310001042046afg:SeniorNotesDueInJune2047Membersrt:ParentCompanyMemberus-gaap:SeniorNotesMember2022-12-310001042046afg:SeniorNotesDueInApril2030Membersrt:ParentCompanyMemberus-gaap:SeniorNotesMember2022-12-310001042046afg:SeniorNotesDueInAugust2026Membersrt:ParentCompanyMemberus-gaap:SeniorNotesMember2022-06-030001042046afg:SeniorNotesDueInAugust2026Membersrt:ParentCompanyMemberus-gaap:SeniorNotesMember2022-06-012022-06-300001042046afg:SeniorNotesDueInAugust2026Memberus-gaap:SeniorNotesMember2022-06-012022-06-300001042046srt:ParentCompanyMember2024-12-310001042046srt:ParentCompanyMembersrt:MinimumMember2024-01-012024-12-310001042046srt:ParentCompanyMembersrt:MaximumMember2024-01-012024-12-310001042046srt:ParentCompanyMember2024-01-012024-12-310001042046srt:ParentCompanyMember2023-12-310001042046afg:VotingPreferredStockMember2024-12-310001042046afg:NonvotingPreferredStockMember2024-12-310001042046us-gaap:StockCompensationPlanMember2024-12-310001042046us-gaap:RestrictedStockMember2024-01-012024-12-310001042046us-gaap:RestrictedStockMember2023-12-310001042046us-gaap:RestrictedStockMember2024-12-310001042046us-gaap:RestrictedStockMember2023-01-012023-12-310001042046us-gaap:RestrictedStockMember2022-01-012022-12-310001042046us-gaap:EmployeeStockOptionMember2024-12-310001042046us-gaap:AccumulatedNetUnrealizedInvestmentGainLossMember2023-12-310001042046us-gaap:AccumulatedNetUnrealizedInvestmentGainLossMember2024-12-310001042046us-gaap:AccumulatedGainLossNetCashFlowHedgeParentMember2023-12-310001042046us-gaap:AccumulatedGainLossNetCashFlowHedgeParentMember2024-12-310001042046us-gaap:AccumulatedTranslationAdjustmentMember2023-12-310001042046us-gaap:AccumulatedTranslationAdjustmentMember2024-12-310001042046us-gaap:AccumulatedDefinedBenefitPlansAdjustmentMember2023-12-310001042046us-gaap:AccumulatedDefinedBenefitPlansAdjustmentMember2024-12-310001042046us-gaap:AccumulatedNetUnrealizedInvestmentGainLossMember2022-12-310001042046us-gaap:AccumulatedGainLossNetCashFlowHedgeParentMember2022-12-310001042046us-gaap:AccumulatedTranslationAdjustmentMember2022-12-310001042046us-gaap:AccumulatedDefinedBenefitPlansAdjustmentMember2022-12-310001042046us-gaap:AccumulatedNetUnrealizedInvestmentGainLossMember2021-12-310001042046us-gaap:AccumulatedGainLossNetCashFlowHedgeParentMember2021-12-310001042046us-gaap:AccumulatedTranslationAdjustmentMember2021-12-310001042046us-gaap:AccumulatedDefinedBenefitPlansAdjustmentMember2021-12-310001042046afg:ExpirationDateOneMembercountry:US2024-12-310001042046country:GB2024-12-310001042046srt:ParentCompanyMembersrt:MaximumMember2023-12-310001042046srt:ParentCompanyMembersrt:MaximumMember2022-01-012022-12-310001042046srt:ParentCompanyMembersrt:MaximumMember2023-01-012023-12-310001042046afg:PropertyAndCasualtyGroupMember2024-12-310001042046afg:PropertyAndCasualtyGroupMemberafg:SpecialAsbestosAndEnvironmentalReservesMember2024-12-310001042046afg:APUConsolidatedAndItsSubsidiariesMember2024-12-310001042046afg:GafriMember2024-12-310001042046us-gaap:WorkersCompensationInsuranceMember2024-12-310001042046us-gaap:WorkersCompensationInsuranceMember2023-12-310001042046afg:OtherProvisionsForClaimsOfPriorYearsMember2024-01-012024-12-310001042046afg:OtherProvisionsForClaimsOfPriorYearsMember2023-01-012023-12-310001042046afg:OtherProvisionsForClaimsOfPriorYearsMember2022-01-012022-12-310001042046afg:PropertyAndCasualtyInsuranceMemberafg:SpecialtyPropertyAndTransportationInsuranceMember2024-12-310001042046afg:PropertyAndCasualtyInsuranceMemberafg:SpecialtyCasualtyInsuranceMember2024-12-310001042046afg:PropertyAndCasualtyInsuranceMemberafg:SpecialtyFinancialInsuranceMember2024-12-310001042046afg:PropertyAndCasualtyInsuranceMemberafg:SpecialtyOtherInsuranceMember2024-12-310001042046afg:ReservesForForeignOperationsMemberafg:PropertyAndCasualtyInsuranceMember2024-12-310001042046afg:SpecialAsbestosAndEnvironmentalReservesMemberafg:PropertyAndCasualtyInsuranceMember2024-12-310001042046afg:OtherReservesMemberafg:PropertyAndCasualtyInsuranceMember2024-12-310001042046us-gaap:ShortdurationInsuranceContractsAccidentYear2015Memberafg:PropertyAndCasualtyInsuranceMemberafg:SpecialtyPropertyAndTransportationInsuranceMember2015-12-310001042046us-gaap:ShortdurationInsuranceContractsAccidentYear2015Memberafg:PropertyAndCasualtyInsuranceMemberafg:SpecialtyPropertyAndTransportationInsuranceMember2016-12-310001042046us-gaap:ShortdurationInsuranceContractsAccidentYear2015Memberafg:PropertyAndCasualtyInsuranceMemberafg:SpecialtyPropertyAndTransportationInsuranceMember2017-12-310001042046us-gaap:ShortdurationInsuranceContractsAccidentYear2015Memberafg:PropertyAndCasualtyInsuranceMemberafg:SpecialtyPropertyAndTransportationInsuranceMember2018-12-310001042046us-gaap:ShortdurationInsuranceContractsAccidentYear2015Memberafg:PropertyAndCasualtyInsuranceMemberafg:SpecialtyPropertyAndTransportationInsuranceMember2019-12-310001042046us-gaap:ShortdurationInsuranceContractsAccidentYear2015Memberafg:PropertyAndCasualtyInsuranceMemberafg:SpecialtyPropertyAndTransportationInsuranceMember2020-12-310001042046us-gaap:ShortdurationInsuranceContractsAccidentYear2015Memberafg:PropertyAndCasualtyInsuranceMemberafg:SpecialtyPropertyAndTransportationInsuranceMember2021-12-310001042046us-gaap:ShortdurationInsuranceContractsAccidentYear2015Memberafg:PropertyAndCasualtyInsuranceMemberafg:SpecialtyPropertyAndTransportationInsuranceMember2022-12-310001042046us-gaap:ShortdurationInsuranceContractsAccidentYear2015Memberafg:PropertyAndCasualtyInsuranceMemberafg:SpecialtyPropertyAndTransportationInsuranceMember2023-12-310001042046us-gaap:ShortdurationInsuranceContractsAccidentYear2015Memberafg:PropertyAndCasualtyInsuranceMemberafg:SpecialtyPropertyAndTransportationInsuranceMember2024-12-310001042046us-gaap:ShortdurationInsuranceContractsAccidentYear2016Memberafg:PropertyAndCasualtyInsuranceMemberafg:SpecialtyPropertyAndTransportationInsuranceMember2016-12-310001042046us-gaap:ShortdurationInsuranceContractsAccidentYear2016Memberafg:PropertyAndCasualtyInsuranceMemberafg:SpecialtyPropertyAndTransportationInsuranceMember2017-12-310001042046us-gaap:ShortdurationInsuranceContractsAccidentYear2016Memberafg:PropertyAndCasualtyInsuranceMemberafg:SpecialtyPropertyAndTransportationInsuranceMember2018-12-310001042046us-gaap:ShortdurationInsuranceContractsAccidentYear2016Memberafg:PropertyAndCasualtyInsuranceMemberafg:SpecialtyPropertyAndTransportationInsuranceMember2019-12-310001042046us-gaap:ShortdurationInsuranceContractsAccidentYear2016Memberafg:PropertyAndCasualtyInsuranceMemberafg:SpecialtyPropertyAndTransportationInsuranceMember2020-12-310001042046us-gaap:ShortdurationInsuranceContractsAccidentYear2016Memberafg:PropertyAndCasualtyInsuranceMemberafg:SpecialtyPropertyAndTransportationInsuranceMember2021-12-310001042046us-gaap:ShortdurationInsuranceContractsAccidentYear2016Memberafg:PropertyAndCasualtyInsuranceMemberafg:SpecialtyPropertyAndTransportationInsuranceMember2022-12-310001042046us-gaap:ShortdurationInsuranceContractsAccidentYear2016Memberafg:PropertyAndCasualtyInsuranceMemberafg:SpecialtyPropertyAndTransportationInsuranceMember2023-12-310001042046us-gaap:ShortdurationInsuranceContractsAccidentYear2016Memberafg:PropertyAndCasualtyInsuranceMemberafg:SpecialtyPropertyAndTransportationInsuranceMember2024-12-310001042046us-gaap:ShortDurationInsuranceContractsAccidentYear2017Memberafg:PropertyAndCasualtyInsuranceMemberafg:SpecialtyPropertyAndTransportationInsuranceMember2017-12-310001042046us-gaap:ShortDurationInsuranceContractsAccidentYear2017Memberafg:PropertyAndCasualtyInsuranceMemberafg:SpecialtyPropertyAndTransportationInsuranceMember2018-12-310001042046us-gaap:ShortDurationInsuranceContractsAccidentYear2017Memberafg:PropertyAndCasualtyInsuranceMemberafg:SpecialtyPropertyAndTransportationInsuranceMember2019-12-310001042046us-gaap:ShortDurationInsuranceContractsAccidentYear2017Memberafg:PropertyAndCasualtyInsuranceMemberafg:SpecialtyPropertyAndTransportationInsuranceMember2020-12-310001042046us-gaap:ShortDurationInsuranceContractsAccidentYear2017Memberafg:PropertyAndCasualtyInsuranceMemberafg:SpecialtyPropertyAndTransportationInsuranceMember2021-12-310001042046us-gaap:ShortDurationInsuranceContractsAccidentYear2017Memberafg:PropertyAndCasualtyInsuranceMemberafg:SpecialtyPropertyAndTransportationInsuranceMember2022-12-310001042046us-gaap:ShortDurationInsuranceContractsAccidentYear2017Memberafg:PropertyAndCasualtyInsuranceMemberafg:SpecialtyPropertyAndTransportationInsuranceMember2023-12-310001042046us-gaap:ShortDurationInsuranceContractsAccidentYear2017Memberafg:PropertyAndCasualtyInsuranceMemberafg:SpecialtyPropertyAndTransportationInsuranceMember2024-12-310001042046us-gaap:ShortDurationInsuranceContractsAccidentYear2018Memberafg:PropertyAndCasualtyInsuranceMemberafg:SpecialtyPropertyAndTransportationInsuranceMember2018-12-310001042046us-gaap:ShortDurationInsuranceContractsAccidentYear2018Memberafg:PropertyAndCasualtyInsuranceMemberafg:SpecialtyPropertyAndTransportationInsuranceMember2019-12-310001042046us-gaap:ShortDurationInsuranceContractsAccidentYear2018Memberafg:PropertyAndCasualtyInsuranceMemberafg:SpecialtyPropertyAndTransportationInsuranceMember2020-12-310001042046us-gaap:ShortDurationInsuranceContractsAccidentYear2018Memberafg:PropertyAndCasualtyInsuranceMemberafg:SpecialtyPropertyAndTransportationInsuranceMember2021-12-310001042046us-gaap:ShortDurationInsuranceContractsAccidentYear2018Memberafg:PropertyAndCasualtyInsuranceMemberafg:SpecialtyPropertyAndTransportationInsuranceMember2022-12-310001042046us-gaap:ShortDurationInsuranceContractsAccidentYear2018Memberafg:PropertyAndCasualtyInsuranceMemberafg:SpecialtyPropertyAndTransportationInsuranceMember2023-12-310001042046us-gaap:ShortDurationInsuranceContractsAccidentYear2018Memberafg:PropertyAndCasualtyInsuranceMemberafg:SpecialtyPropertyAndTransportationInsuranceMember2024-12-310001042046us-gaap:ShortDurationInsuranceContractAccidentYear2019Memberafg:PropertyAndCasualtyInsuranceMemberafg:SpecialtyPropertyAndTransportationInsuranceMember2019-12-310001042046us-gaap:ShortDurationInsuranceContractAccidentYear2019Memberafg:PropertyAndCasualtyInsuranceMemberafg:SpecialtyPropertyAndTransportationInsuranceMember2020-12-310001042046us-gaap:ShortDurationInsuranceContractAccidentYear2019Memberafg:PropertyAndCasualtyInsuranceMemberafg:SpecialtyPropertyAndTransportationInsuranceMember2021-12-310001042046us-gaap:ShortDurationInsuranceContractAccidentYear2019Memberafg:PropertyAndCasualtyInsuranceMemberafg:SpecialtyPropertyAndTransportationInsuranceMember2022-12-310001042046us-gaap:ShortDurationInsuranceContractAccidentYear2019Memberafg:PropertyAndCasualtyInsuranceMemberafg:SpecialtyPropertyAndTransportationInsuranceMember2023-12-310001042046us-gaap:ShortDurationInsuranceContractAccidentYear2019Memberafg:PropertyAndCasualtyInsuranceMemberafg:SpecialtyPropertyAndTransportationInsuranceMember2024-12-310001042046us-gaap:ShortDurationInsuranceContractAccidentYear2020Memberafg:PropertyAndCasualtyInsuranceMemberafg:SpecialtyPropertyAndTransportationInsuranceMember2020-12-310001042046us-gaap:ShortDurationInsuranceContractAccidentYear2020Memberafg:PropertyAndCasualtyInsuranceMemberafg:SpecialtyPropertyAndTransportationInsuranceMember2021-12-310001042046us-gaap:ShortDurationInsuranceContractAccidentYear2020Memberafg:PropertyAndCasualtyInsuranceMemberafg:SpecialtyPropertyAndTransportationInsuranceMember2022-12-310001042046us-gaap:ShortDurationInsuranceContractAccidentYear2020Memberafg:PropertyAndCasualtyInsuranceMemberafg:SpecialtyPropertyAndTransportationInsuranceMember2023-12-310001042046us-gaap:ShortDurationInsuranceContractAccidentYear2020Memberafg:PropertyAndCasualtyInsuranceMemberafg:SpecialtyPropertyAndTransportationInsuranceMember2024-12-310001042046us-gaap:ShortDurationInsuranceContractAccidentYear2021Memberafg:PropertyAndCasualtyInsuranceMemberafg:SpecialtyPropertyAndTransportationInsuranceMember2021-12-310001042046us-gaap:ShortDurationInsuranceContractAccidentYear2021Memberafg:PropertyAndCasualtyInsuranceMemberafg:SpecialtyPropertyAndTransportationInsuranceMember2022-12-310001042046us-gaap:ShortDurationInsuranceContractAccidentYear2021Memberafg:PropertyAndCasualtyInsuranceMemberafg:SpecialtyPropertyAndTransportationInsuranceMember2023-12-310001042046us-gaap:ShortDurationInsuranceContractAccidentYear2021Memberafg:PropertyAndCasualtyInsuranceMemberafg:SpecialtyPropertyAndTransportationInsuranceMember2024-12-310001042046us-gaap:ShortDurationInsuranceContractAccidentYear2022Memberafg:PropertyAndCasualtyInsuranceMemberafg:SpecialtyPropertyAndTransportationInsuranceMember2022-12-310001042046us-gaap:ShortDurationInsuranceContractAccidentYear2022Memberafg:PropertyAndCasualtyInsuranceMemberafg:SpecialtyPropertyAndTransportationInsuranceMember2023-12-310001042046us-gaap:ShortDurationInsuranceContractAccidentYear2022Memberafg:PropertyAndCasualtyInsuranceMemberafg:SpecialtyPropertyAndTransportationInsuranceMember2024-12-310001042046us-gaap:ShortDurationInsuranceContractAccidentYear2023Memberafg:PropertyAndCasualtyInsuranceMemberafg:SpecialtyPropertyAndTransportationInsuranceMember2023-12-310001042046us-gaap:ShortDurationInsuranceContractAccidentYear2023Memberafg:PropertyAndCasualtyInsuranceMemberafg:SpecialtyPropertyAndTransportationInsuranceMember2024-12-310001042046us-gaap:ShortDurationInsuranceContractAccidentYear2024Memberafg:PropertyAndCasualtyInsuranceMemberafg:SpecialtyPropertyAndTransportationInsuranceMember2024-12-310001042046afg:ExcludesShortdurationInsuranceContractsLiabilityforUnpaidClaimsandAllocatedClaimAdjustmentExpenseNotSeparatelyPresentedMemberafg:PropertyAndCasualtyInsuranceMemberafg:SpecialtyPropertyAndTransportationInsuranceMember2024-12-310001042046us-gaap:ShortdurationInsuranceContractsAccidentYear2015Memberafg:PropertyAndCasualtyInsuranceMemberafg:SpecialtyCasualtyInsuranceMember2015-12-310001042046us-gaap:ShortdurationInsuranceContractsAccidentYear2015Memberafg:PropertyAndCasualtyInsuranceMemberafg:SpecialtyCasualtyInsuranceMember2016-12-310001042046us-gaap:ShortdurationInsuranceContractsAccidentYear2015Memberafg:PropertyAndCasualtyInsuranceMemberafg:SpecialtyCasualtyInsuranceMember2017-12-310001042046us-gaap:ShortdurationInsuranceContractsAccidentYear2015Memberafg:PropertyAndCasualtyInsuranceMemberafg:SpecialtyCasualtyInsuranceMember2018-12-310001042046us-gaap:ShortdurationInsuranceContractsAccidentYear2015Memberafg:PropertyAndCasualtyInsuranceMemberafg:SpecialtyCasualtyInsuranceMember2019-12-310001042046us-gaap:ShortdurationInsuranceContractsAccidentYear2015Memberafg:PropertyAndCasualtyInsuranceMemberafg:SpecialtyCasualtyInsuranceMember2020-12-310001042046us-gaap:ShortdurationInsuranceContractsAccidentYear2015Memberafg:PropertyAndCasualtyInsuranceMemberafg:SpecialtyCasualtyInsuranceMember2021-12-310001042046us-gaap:ShortdurationInsuranceContractsAccidentYear2015Memberafg:PropertyAndCasualtyInsuranceMemberafg:SpecialtyCasualtyInsuranceMember2022-12-310001042046us-gaap:ShortdurationInsuranceContractsAccidentYear2015Memberafg:PropertyAndCasualtyInsuranceMemberafg:SpecialtyCasualtyInsuranceMember2023-12-310001042046us-gaap:ShortdurationInsuranceContractsAccidentYear2015Memberafg:PropertyAndCasualtyInsuranceMemberafg:SpecialtyCasualtyInsuranceMember2024-12-310001042046us-gaap:ShortdurationInsuranceContractsAccidentYear2016Memberafg:PropertyAndCasualtyInsuranceMemberafg:SpecialtyCasualtyInsuranceMember2016-12-310001042046us-gaap:ShortdurationInsuranceContractsAccidentYear2016Memberafg:PropertyAndCasualtyInsuranceMemberafg:SpecialtyCasualtyInsuranceMember2017-12-310001042046us-gaap:ShortdurationInsuranceContractsAccidentYear2016Memberafg:PropertyAndCasualtyInsuranceMemberafg:SpecialtyCasualtyInsuranceMember2018-12-310001042046us-gaap:ShortdurationInsuranceContractsAccidentYear2016Memberafg:PropertyAndCasualtyInsuranceMemberafg:SpecialtyCasualtyInsuranceMember2019-12-310001042046us-gaap:ShortdurationInsuranceContractsAccidentYear2016Memberafg:PropertyAndCasualtyInsuranceMemberafg:SpecialtyCasualtyInsuranceMember2020-12-310001042046us-gaap:ShortdurationInsuranceContractsAccidentYear2016Memberafg:PropertyAndCasualtyInsuranceMemberafg:SpecialtyCasualtyInsuranceMember2021-12-310001042046us-gaap:ShortdurationInsuranceContractsAccidentYear2016Memberafg:PropertyAndCasualtyInsuranceMemberafg:SpecialtyCasualtyInsuranceMember2022-12-310001042046us-gaap:ShortdurationInsuranceContractsAccidentYear2016Memberafg:PropertyAndCasualtyInsuranceMemberafg:SpecialtyCasualtyInsuranceMember2023-12-310001042046us-gaap:ShortdurationInsuranceContractsAccidentYear2016Memberafg:PropertyAndCasualtyInsuranceMemberafg:SpecialtyCasualtyInsuranceMember2024-12-310001042046us-gaap:ShortDurationInsuranceContractsAccidentYear2017Memberafg:PropertyAndCasualtyInsuranceMemberafg:SpecialtyCasualtyInsuranceMember2017-12-310001042046us-gaap:ShortDurationInsuranceContractsAccidentYear2017Memberafg:PropertyAndCasualtyInsuranceMemberafg:SpecialtyCasualtyInsuranceMember2018-12-310001042046us-gaap:ShortDurationInsuranceContractsAccidentYear2017Memberafg:PropertyAndCasualtyInsuranceMemberafg:SpecialtyCasualtyInsuranceMember2019-12-310001042046us-gaap:ShortDurationInsuranceContractsAccidentYear2017Memberafg:PropertyAndCasualtyInsuranceMemberafg:SpecialtyCasualtyInsuranceMember2020-12-310001042046us-gaap:ShortDurationInsuranceContractsAccidentYear2017Memberafg:PropertyAndCasualtyInsuranceMemberafg:SpecialtyCasualtyInsuranceMember2021-12-310001042046us-gaap:ShortDurationInsuranceContractsAccidentYear2017Memberafg:PropertyAndCasualtyInsuranceMemberafg:SpecialtyCasualtyInsuranceMember2022-12-310001042046us-gaap:ShortDurationInsuranceContractsAccidentYear2017Memberafg:PropertyAndCasualtyInsuranceMemberafg:SpecialtyCasualtyInsuranceMember2023-12-310001042046us-gaap:ShortDurationInsuranceContractsAccidentYear2017Memberafg:PropertyAndCasualtyInsuranceMemberafg:SpecialtyCasualtyInsuranceMember2024-12-310001042046us-gaap:ShortDurationInsuranceContractsAccidentYear2018Memberafg:PropertyAndCasualtyInsuranceMemberafg:SpecialtyCasualtyInsuranceMember2018-12-310001042046us-gaap:ShortDurationInsuranceContractsAccidentYear2018Memberafg:PropertyAndCasualtyInsuranceMemberafg:SpecialtyCasualtyInsuranceMember2019-12-310001042046us-gaap:ShortDurationInsuranceContractsAccidentYear2018Memberafg:PropertyAndCasualtyInsuranceMemberafg:SpecialtyCasualtyInsuranceMember2020-12-310001042046us-gaap:ShortDurationInsuranceContractsAccidentYear2018Memberafg:PropertyAndCasualtyInsuranceMemberafg:SpecialtyCasualtyInsuranceMember2021-12-310001042046us-gaap:ShortDurationInsuranceContractsAccidentYear2018Memberafg:PropertyAndCasualtyInsuranceMemberafg:SpecialtyCasualtyInsuranceMember2022-12-310001042046us-gaap:ShortDurationInsuranceContractsAccidentYear2018Memberafg:PropertyAndCasualtyInsuranceMemberafg:SpecialtyCasualtyInsuranceMember2023-12-310001042046us-gaap:ShortDurationInsuranceContractsAccidentYear2018Memberafg:PropertyAndCasualtyInsuranceMemberafg:SpecialtyCasualtyInsuranceMember2024-12-310001042046us-gaap:ShortDurationInsuranceContractAccidentYear2019Memberafg:PropertyAndCasualtyInsuranceMemberafg:SpecialtyCasualtyInsuranceMember2019-12-310001042046us-gaap:ShortDurationInsuranceContractAccidentYear2019Memberafg:PropertyAndCasualtyInsuranceMemberafg:SpecialtyCasualtyInsuranceMember2020-12-310001042046us-gaap:ShortDurationInsuranceContractAccidentYear2019Memberafg:PropertyAndCasualtyInsuranceMemberafg:SpecialtyCasualtyInsuranceMember2021-12-310001042046us-gaap:ShortDurationInsuranceContractAccidentYear2019Memberafg:PropertyAndCasualtyInsuranceMemberafg:SpecialtyCasualtyInsuranceMember2022-12-310001042046us-gaap:ShortDurationInsuranceContractAccidentYear2019Memberafg:PropertyAndCasualtyInsuranceMemberafg:SpecialtyCasualtyInsuranceMember2023-12-310001042046us-gaap:ShortDurationInsuranceContractAccidentYear2019Memberafg:PropertyAndCasualtyInsuranceMemberafg:SpecialtyCasualtyInsuranceMember2024-12-310001042046us-gaap:ShortDurationInsuranceContractAccidentYear2020Memberafg:PropertyAndCasualtyInsuranceMemberafg:SpecialtyCasualtyInsuranceMember2020-12-310001042046us-gaap:ShortDurationInsuranceContractAccidentYear2020Memberafg:PropertyAndCasualtyInsuranceMemberafg:SpecialtyCasualtyInsuranceMember2021-12-310001042046us-gaap:ShortDurationInsuranceContractAccidentYear2020Memberafg:PropertyAndCasualtyInsuranceMemberafg:SpecialtyCasualtyInsuranceMember2022-12-310001042046us-gaap:ShortDurationInsuranceContractAccidentYear2020Memberafg:PropertyAndCasualtyInsuranceMemberafg:SpecialtyCasualtyInsuranceMember2023-12-310001042046us-gaap:ShortDurationInsuranceContractAccidentYear2020Memberafg:PropertyAndCasualtyInsuranceMemberafg:SpecialtyCasualtyInsuranceMember2024-12-310001042046us-gaap:ShortDurationInsuranceContractAccidentYear2021Memberafg:PropertyAndCasualtyInsuranceMemberafg:SpecialtyCasualtyInsuranceMember2021-12-310001042046us-gaap:ShortDurationInsuranceContractAccidentYear2021Memberafg:PropertyAndCasualtyInsuranceMemberafg:SpecialtyCasualtyInsuranceMember2022-12-310001042046us-gaap:ShortDurationInsuranceContractAccidentYear2021Memberafg:PropertyAndCasualtyInsuranceMemberafg:SpecialtyCasualtyInsuranceMember2023-12-310001042046us-gaap:ShortDurationInsuranceContractAccidentYear2021Memberafg:PropertyAndCasualtyInsuranceMemberafg:SpecialtyCasualtyInsuranceMember2024-12-310001042046us-gaap:ShortDurationInsuranceContractAccidentYear2022Memberafg:PropertyAndCasualtyInsuranceMemberafg:SpecialtyCasualtyInsuranceMember2022-12-310001042046us-gaap:ShortDurationInsuranceContractAccidentYear2022Memberafg:PropertyAndCasualtyInsuranceMemberafg:SpecialtyCasualtyInsuranceMember2023-12-310001042046us-gaap:ShortDurationInsuranceContractAccidentYear2022Memberafg:PropertyAndCasualtyInsuranceMemberafg:SpecialtyCasualtyInsuranceMember2024-12-310001042046us-gaap:ShortDurationInsuranceContractAccidentYear2023Memberafg:PropertyAndCasualtyInsuranceMemberafg:SpecialtyCasualtyInsuranceMember2023-12-310001042046us-gaap:ShortDurationInsuranceContractAccidentYear2023Memberafg:PropertyAndCasualtyInsuranceMemberafg:SpecialtyCasualtyInsuranceMember2024-12-310001042046us-gaap:ShortDurationInsuranceContractAccidentYear2024Memberafg:PropertyAndCasualtyInsuranceMemberafg:SpecialtyCasualtyInsuranceMember2024-12-310001042046afg:ExcludesShortdurationInsuranceContractsLiabilityforUnpaidClaimsandAllocatedClaimAdjustmentExpenseNotSeparatelyPresentedMemberafg:PropertyAndCasualtyInsuranceMemberafg:SpecialtyCasualtyInsuranceMember2024-12-310001042046us-gaap:ShortdurationInsuranceContractsAccidentYear2015Memberafg:PropertyAndCasualtyInsuranceMemberafg:SpecialtyFinancialInsuranceMember2015-12-310001042046us-gaap:ShortdurationInsuranceContractsAccidentYear2015Memberafg:PropertyAndCasualtyInsuranceMemberafg:SpecialtyFinancialInsuranceMember2016-12-310001042046us-gaap:ShortdurationInsuranceContractsAccidentYear2015Memberafg:PropertyAndCasualtyInsuranceMemberafg:SpecialtyFinancialInsuranceMember2017-12-310001042046us-gaap:ShortdurationInsuranceContractsAccidentYear2015Memberafg:PropertyAndCasualtyInsuranceMemberafg:SpecialtyFinancialInsuranceMember2018-12-310001042046us-gaap:ShortdurationInsuranceContractsAccidentYear2015Memberafg:PropertyAndCasualtyInsuranceMemberafg:SpecialtyFinancialInsuranceMember2019-12-310001042046us-gaap:ShortdurationInsuranceContractsAccidentYear2015Memberafg:PropertyAndCasualtyInsuranceMemberafg:SpecialtyFinancialInsuranceMember2020-12-310001042046us-gaap:ShortdurationInsuranceContractsAccidentYear2015Memberafg:PropertyAndCasualtyInsuranceMemberafg:SpecialtyFinancialInsuranceMember2021-12-310001042046us-gaap:ShortdurationInsuranceContractsAccidentYear2015Memberafg:PropertyAndCasualtyInsuranceMemberafg:SpecialtyFinancialInsuranceMember2022-12-310001042046us-gaap:ShortdurationInsuranceContractsAccidentYear2015Memberafg:PropertyAndCasualtyInsuranceMemberafg:SpecialtyFinancialInsuranceMember2023-12-310001042046us-gaap:ShortdurationInsuranceContractsAccidentYear2015Memberafg:PropertyAndCasualtyInsuranceMemberafg:SpecialtyFinancialInsuranceMember2024-12-310001042046us-gaap:ShortdurationInsuranceContractsAccidentYear2016Memberafg:PropertyAndCasualtyInsuranceMemberafg:SpecialtyFinancialInsuranceMember2016-12-310001042046us-gaap:ShortdurationInsuranceContractsAccidentYear2016Memberafg:PropertyAndCasualtyInsuranceMemberafg:SpecialtyFinancialInsuranceMember2017-12-310001042046us-gaap:ShortdurationInsuranceContractsAccidentYear2016Memberafg:PropertyAndCasualtyInsuranceMemberafg:SpecialtyFinancialInsuranceMember2018-12-310001042046us-gaap:ShortdurationInsuranceContractsAccidentYear2016Memberafg:PropertyAndCasualtyInsuranceMemberafg:SpecialtyFinancialInsuranceMember2019-12-310001042046us-gaap:ShortdurationInsuranceContractsAccidentYear2016Memberafg:PropertyAndCasualtyInsuranceMemberafg:SpecialtyFinancialInsuranceMember2020-12-310001042046us-gaap:ShortdurationInsuranceContractsAccidentYear2016Memberafg:PropertyAndCasualtyInsuranceMemberafg:SpecialtyFinancialInsuranceMember2021-12-310001042046us-gaap:ShortdurationInsuranceContractsAccidentYear2016Memberafg:PropertyAndCasualtyInsuranceMemberafg:SpecialtyFinancialInsuranceMember2022-12-310001042046us-gaap:ShortdurationInsuranceContractsAccidentYear2016Memberafg:PropertyAndCasualtyInsuranceMemberafg:SpecialtyFinancialInsuranceMember2023-12-310001042046us-gaap:ShortdurationInsuranceContractsAccidentYear2016Memberafg:PropertyAndCasualtyInsuranceMemberafg:SpecialtyFinancialInsuranceMember2024-12-310001042046us-gaap:ShortDurationInsuranceContractsAccidentYear2017Memberafg:PropertyAndCasualtyInsuranceMemberafg:SpecialtyFinancialInsuranceMember2017-12-310001042046us-gaap:ShortDurationInsuranceContractsAccidentYear2017Memberafg:PropertyAndCasualtyInsuranceMemberafg:SpecialtyFinancialInsuranceMember2018-12-310001042046us-gaap:ShortDurationInsuranceContractsAccidentYear2017Memberafg:PropertyAndCasualtyInsuranceMemberafg:SpecialtyFinancialInsuranceMember2019-12-310001042046us-gaap:ShortDurationInsuranceContractsAccidentYear2017Memberafg:PropertyAndCasualtyInsuranceMemberafg:SpecialtyFinancialInsuranceMember2020-12-310001042046us-gaap:ShortDurationInsuranceContractsAccidentYear2017Memberafg:PropertyAndCasualtyInsuranceMemberafg:SpecialtyFinancialInsuranceMember2021-12-310001042046us-gaap:ShortDurationInsuranceContractsAccidentYear2017Memberafg:PropertyAndCasualtyInsuranceMemberafg:SpecialtyFinancialInsuranceMember2022-12-310001042046us-gaap:ShortDurationInsuranceContractsAccidentYear2017Memberafg:PropertyAndCasualtyInsuranceMemberafg:SpecialtyFinancialInsuranceMember2023-12-310001042046us-gaap:ShortDurationInsuranceContractsAccidentYear2017Memberafg:PropertyAndCasualtyInsuranceMemberafg:SpecialtyFinancialInsuranceMember2024-12-310001042046us-gaap:ShortDurationInsuranceContractsAccidentYear2018Memberafg:PropertyAndCasualtyInsuranceMemberafg:SpecialtyFinancialInsuranceMember2018-12-310001042046us-gaap:ShortDurationInsuranceContractsAccidentYear2018Memberafg:PropertyAndCasualtyInsuranceMemberafg:SpecialtyFinancialInsuranceMember2019-12-310001042046us-gaap:ShortDurationInsuranceContractsAccidentYear2018Memberafg:PropertyAndCasualtyInsuranceMemberafg:SpecialtyFinancialInsuranceMember2020-12-310001042046us-gaap:ShortDurationInsuranceContractsAccidentYear2018Memberafg:PropertyAndCasualtyInsuranceMemberafg:SpecialtyFinancialInsuranceMember2021-12-310001042046us-gaap:ShortDurationInsuranceContractsAccidentYear2018Memberafg:PropertyAndCasualtyInsuranceMemberafg:SpecialtyFinancialInsuranceMember2022-12-310001042046us-gaap:ShortDurationInsuranceContractsAccidentYear2018Memberafg:PropertyAndCasualtyInsuranceMemberafg:SpecialtyFinancialInsuranceMember2023-12-310001042046us-gaap:ShortDurationInsuranceContractsAccidentYear2018Memberafg:PropertyAndCasualtyInsuranceMemberafg:SpecialtyFinancialInsuranceMember2024-12-310001042046us-gaap:ShortDurationInsuranceContractAccidentYear2019Memberafg:PropertyAndCasualtyInsuranceMemberafg:SpecialtyFinancialInsuranceMember2019-12-310001042046us-gaap:ShortDurationInsuranceContractAccidentYear2019Memberafg:PropertyAndCasualtyInsuranceMemberafg:SpecialtyFinancialInsuranceMember2020-12-310001042046us-gaap:ShortDurationInsuranceContractAccidentYear2019Memberafg:PropertyAndCasualtyInsuranceMemberafg:SpecialtyFinancialInsuranceMember2021-12-310001042046us-gaap:ShortDurationInsuranceContractAccidentYear2019Memberafg:PropertyAndCasualtyInsuranceMemberafg:SpecialtyFinancialInsuranceMember2022-12-310001042046us-gaap:ShortDurationInsuranceContractAccidentYear2019Memberafg:PropertyAndCasualtyInsuranceMemberafg:SpecialtyFinancialInsuranceMember2023-12-310001042046us-gaap:ShortDurationInsuranceContractAccidentYear2019Memberafg:PropertyAndCasualtyInsuranceMemberafg:SpecialtyFinancialInsuranceMember2024-12-310001042046us-gaap:ShortDurationInsuranceContractAccidentYear2020Memberafg:PropertyAndCasualtyInsuranceMemberafg:SpecialtyFinancialInsuranceMember2020-12-310001042046us-gaap:ShortDurationInsuranceContractAccidentYear2020Memberafg:PropertyAndCasualtyInsuranceMemberafg:SpecialtyFinancialInsuranceMember2021-12-310001042046us-gaap:ShortDurationInsuranceContractAccidentYear2020Memberafg:PropertyAndCasualtyInsuranceMemberafg:SpecialtyFinancialInsuranceMember2022-12-310001042046us-gaap:ShortDurationInsuranceContractAccidentYear2020Memberafg:PropertyAndCasualtyInsuranceMemberafg:SpecialtyFinancialInsuranceMember2023-12-310001042046us-gaap:ShortDurationInsuranceContractAccidentYear2020Memberafg:PropertyAndCasualtyInsuranceMemberafg:SpecialtyFinancialInsuranceMember2024-12-310001042046us-gaap:ShortDurationInsuranceContractAccidentYear2021Memberafg:PropertyAndCasualtyInsuranceMemberafg:SpecialtyFinancialInsuranceMember2021-12-310001042046us-gaap:ShortDurationInsuranceContractAccidentYear2021Memberafg:PropertyAndCasualtyInsuranceMemberafg:SpecialtyFinancialInsuranceMember2022-12-310001042046us-gaap:ShortDurationInsuranceContractAccidentYear2021Memberafg:PropertyAndCasualtyInsuranceMemberafg:SpecialtyFinancialInsuranceMember2023-12-310001042046us-gaap:ShortDurationInsuranceContractAccidentYear2021Memberafg:PropertyAndCasualtyInsuranceMemberafg:SpecialtyFinancialInsuranceMember2024-12-310001042046us-gaap:ShortDurationInsuranceContractAccidentYear2022Memberafg:PropertyAndCasualtyInsuranceMemberafg:SpecialtyFinancialInsuranceMember2022-12-310001042046us-gaap:ShortDurationInsuranceContractAccidentYear2022Memberafg:PropertyAndCasualtyInsuranceMemberafg:SpecialtyFinancialInsuranceMember2023-12-310001042046us-gaap:ShortDurationInsuranceContractAccidentYear2022Memberafg:PropertyAndCasualtyInsuranceMemberafg:SpecialtyFinancialInsuranceMember2024-12-310001042046us-gaap:ShortDurationInsuranceContractAccidentYear2023Memberafg:PropertyAndCasualtyInsuranceMemberafg:SpecialtyFinancialInsuranceMember2023-12-310001042046us-gaap:ShortDurationInsuranceContractAccidentYear2023Memberafg:PropertyAndCasualtyInsuranceMemberafg:SpecialtyFinancialInsuranceMember2024-12-310001042046us-gaap:ShortDurationInsuranceContractAccidentYear2024Memberafg:PropertyAndCasualtyInsuranceMemberafg:SpecialtyFinancialInsuranceMember2024-12-310001042046afg:ExcludesShortdurationInsuranceContractsLiabilityforUnpaidClaimsandAllocatedClaimAdjustmentExpenseNotSeparatelyPresentedMemberafg:PropertyAndCasualtyInsuranceMemberafg:SpecialtyFinancialInsuranceMember2024-12-310001042046us-gaap:ShortdurationInsuranceContractsAccidentYear2015Memberafg:PropertyAndCasualtyInsuranceMemberafg:SpecialtyOtherInsuranceMember2015-12-310001042046us-gaap:ShortdurationInsuranceContractsAccidentYear2015Memberafg:PropertyAndCasualtyInsuranceMemberafg:SpecialtyOtherInsuranceMember2016-12-310001042046us-gaap:ShortdurationInsuranceContractsAccidentYear2015Memberafg:PropertyAndCasualtyInsuranceMemberafg:SpecialtyOtherInsuranceMember2017-12-310001042046us-gaap:ShortdurationInsuranceContractsAccidentYear2015Memberafg:PropertyAndCasualtyInsuranceMemberafg:SpecialtyOtherInsuranceMember2018-12-310001042046us-gaap:ShortdurationInsuranceContractsAccidentYear2015Memberafg:PropertyAndCasualtyInsuranceMemberafg:SpecialtyOtherInsuranceMember2019-12-310001042046us-gaap:ShortdurationInsuranceContractsAccidentYear2015Memberafg:PropertyAndCasualtyInsuranceMemberafg:SpecialtyOtherInsuranceMember2020-12-310001042046us-gaap:ShortdurationInsuranceContractsAccidentYear2015Memberafg:PropertyAndCasualtyInsuranceMemberafg:SpecialtyOtherInsuranceMember2021-12-310001042046us-gaap:ShortdurationInsuranceContractsAccidentYear2015Memberafg:PropertyAndCasualtyInsuranceMemberafg:SpecialtyOtherInsuranceMember2022-12-310001042046us-gaap:ShortdurationInsuranceContractsAccidentYear2015Memberafg:PropertyAndCasualtyInsuranceMemberafg:SpecialtyOtherInsuranceMember2023-12-310001042046us-gaap:ShortdurationInsuranceContractsAccidentYear2015Memberafg:PropertyAndCasualtyInsuranceMemberafg:SpecialtyOtherInsuranceMember2024-12-310001042046us-gaap:ShortdurationInsuranceContractsAccidentYear2016Memberafg:PropertyAndCasualtyInsuranceMemberafg:SpecialtyOtherInsuranceMember2016-12-310001042046us-gaap:ShortdurationInsuranceContractsAccidentYear2016Memberafg:PropertyAndCasualtyInsuranceMemberafg:SpecialtyOtherInsuranceMember2017-12-310001042046us-gaap:ShortdurationInsuranceContractsAccidentYear2016Memberafg:PropertyAndCasualtyInsuranceMemberafg:SpecialtyOtherInsuranceMember2018-12-310001042046us-gaap:ShortdurationInsuranceContractsAccidentYear2016Memberafg:PropertyAndCasualtyInsuranceMemberafg:SpecialtyOtherInsuranceMember2019-12-310001042046us-gaap:ShortdurationInsuranceContractsAccidentYear2016Memberafg:PropertyAndCasualtyInsuranceMemberafg:SpecialtyOtherInsuranceMember2020-12-310001042046us-gaap:ShortdurationInsuranceContractsAccidentYear2016Memberafg:PropertyAndCasualtyInsuranceMemberafg:SpecialtyOtherInsuranceMember2021-12-310001042046us-gaap:ShortdurationInsuranceContractsAccidentYear2016Memberafg:PropertyAndCasualtyInsuranceMemberafg:SpecialtyOtherInsuranceMember2022-12-310001042046us-gaap:ShortdurationInsuranceContractsAccidentYear2016Memberafg:PropertyAndCasualtyInsuranceMemberafg:SpecialtyOtherInsuranceMember2023-12-310001042046us-gaap:ShortdurationInsuranceContractsAccidentYear2016Memberafg:PropertyAndCasualtyInsuranceMemberafg:SpecialtyOtherInsuranceMember2024-12-310001042046us-gaap:ShortDurationInsuranceContractsAccidentYear2017Memberafg:PropertyAndCasualtyInsuranceMemberafg:SpecialtyOtherInsuranceMember2017-12-310001042046us-gaap:ShortDurationInsuranceContractsAccidentYear2017Memberafg:PropertyAndCasualtyInsuranceMemberafg:SpecialtyOtherInsuranceMember2018-12-310001042046us-gaap:ShortDurationInsuranceContractsAccidentYear2017Memberafg:PropertyAndCasualtyInsuranceMemberafg:SpecialtyOtherInsuranceMember2019-12-310001042046us-gaap:ShortDurationInsuranceContractsAccidentYear2017Memberafg:PropertyAndCasualtyInsuranceMemberafg:SpecialtyOtherInsuranceMember2020-12-310001042046us-gaap:ShortDurationInsuranceContractsAccidentYear2017Memberafg:PropertyAndCasualtyInsuranceMemberafg:SpecialtyOtherInsuranceMember2021-12-310001042046us-gaap:ShortDurationInsuranceContractsAccidentYear2017Memberafg:PropertyAndCasualtyInsuranceMemberafg:SpecialtyOtherInsuranceMember2022-12-310001042046us-gaap:ShortDurationInsuranceContractsAccidentYear2017Memberafg:PropertyAndCasualtyInsuranceMemberafg:SpecialtyOtherInsuranceMember2023-12-310001042046us-gaap:ShortDurationInsuranceContractsAccidentYear2017Memberafg:PropertyAndCasualtyInsuranceMemberafg:SpecialtyOtherInsuranceMember2024-12-310001042046us-gaap:ShortDurationInsuranceContractsAccidentYear2018Memberafg:PropertyAndCasualtyInsuranceMemberafg:SpecialtyOtherInsuranceMember2018-12-310001042046us-gaap:ShortDurationInsuranceContractsAccidentYear2018Memberafg:PropertyAndCasualtyInsuranceMemberafg:SpecialtyOtherInsuranceMember2019-12-310001042046us-gaap:ShortDurationInsuranceContractsAccidentYear2018Memberafg:PropertyAndCasualtyInsuranceMemberafg:SpecialtyOtherInsuranceMember2020-12-310001042046us-gaap:ShortDurationInsuranceContractsAccidentYear2018Memberafg:PropertyAndCasualtyInsuranceMemberafg:SpecialtyOtherInsuranceMember2021-12-310001042046us-gaap:ShortDurationInsuranceContractsAccidentYear2018Memberafg:PropertyAndCasualtyInsuranceMemberafg:SpecialtyOtherInsuranceMember2022-12-310001042046us-gaap:ShortDurationInsuranceContractsAccidentYear2018Memberafg:PropertyAndCasualtyInsuranceMemberafg:SpecialtyOtherInsuranceMember2023-12-310001042046us-gaap:ShortDurationInsuranceContractsAccidentYear2018Memberafg:PropertyAndCasualtyInsuranceMemberafg:SpecialtyOtherInsuranceMember2024-12-310001042046us-gaap:ShortDurationInsuranceContractAccidentYear2019Memberafg:PropertyAndCasualtyInsuranceMemberafg:SpecialtyOtherInsuranceMember2019-12-310001042046us-gaap:ShortDurationInsuranceContractAccidentYear2019Memberafg:PropertyAndCasualtyInsuranceMemberafg:SpecialtyOtherInsuranceMember2020-12-310001042046us-gaap:ShortDurationInsuranceContractAccidentYear2019Memberafg:PropertyAndCasualtyInsuranceMemberafg:SpecialtyOtherInsuranceMember2021-12-310001042046us-gaap:ShortDurationInsuranceContractAccidentYear2019Memberafg:PropertyAndCasualtyInsuranceMemberafg:SpecialtyOtherInsuranceMember2022-12-310001042046us-gaap:ShortDurationInsuranceContractAccidentYear2019Memberafg:PropertyAndCasualtyInsuranceMemberafg:SpecialtyOtherInsuranceMember2023-12-310001042046us-gaap:ShortDurationInsuranceContractAccidentYear2019Memberafg:PropertyAndCasualtyInsuranceMemberafg:SpecialtyOtherInsuranceMember2024-12-310001042046us-gaap:ShortDurationInsuranceContractAccidentYear2020Memberafg:PropertyAndCasualtyInsuranceMemberafg:SpecialtyOtherInsuranceMember2020-12-310001042046us-gaap:ShortDurationInsuranceContractAccidentYear2020Memberafg:PropertyAndCasualtyInsuranceMemberafg:SpecialtyOtherInsuranceMember2021-12-310001042046us-gaap:ShortDurationInsuranceContractAccidentYear2020Memberafg:PropertyAndCasualtyInsuranceMemberafg:SpecialtyOtherInsuranceMember2022-12-310001042046us-gaap:ShortDurationInsuranceContractAccidentYear2020Memberafg:PropertyAndCasualtyInsuranceMemberafg:SpecialtyOtherInsuranceMember2023-12-310001042046us-gaap:ShortDurationInsuranceContractAccidentYear2020Memberafg:PropertyAndCasualtyInsuranceMemberafg:SpecialtyOtherInsuranceMember2024-12-310001042046us-gaap:ShortDurationInsuranceContractAccidentYear2021Memberafg:PropertyAndCasualtyInsuranceMemberafg:SpecialtyOtherInsuranceMember2021-12-310001042046us-gaap:ShortDurationInsuranceContractAccidentYear2021Memberafg:PropertyAndCasualtyInsuranceMemberafg:SpecialtyOtherInsuranceMember2022-12-310001042046us-gaap:ShortDurationInsuranceContractAccidentYear2021Memberafg:PropertyAndCasualtyInsuranceMemberafg:SpecialtyOtherInsuranceMember2023-12-310001042046us-gaap:ShortDurationInsuranceContractAccidentYear2021Memberafg:PropertyAndCasualtyInsuranceMemberafg:SpecialtyOtherInsuranceMember2024-12-310001042046us-gaap:ShortDurationInsuranceContractAccidentYear2022Memberafg:PropertyAndCasualtyInsuranceMemberafg:SpecialtyOtherInsuranceMember2022-12-310001042046us-gaap:ShortDurationInsuranceContractAccidentYear2022Memberafg:PropertyAndCasualtyInsuranceMemberafg:SpecialtyOtherInsuranceMember2023-12-310001042046us-gaap:ShortDurationInsuranceContractAccidentYear2022Memberafg:PropertyAndCasualtyInsuranceMemberafg:SpecialtyOtherInsuranceMember2024-12-310001042046us-gaap:ShortDurationInsuranceContractAccidentYear2023Memberafg:PropertyAndCasualtyInsuranceMemberafg:SpecialtyOtherInsuranceMember2023-12-310001042046us-gaap:ShortDurationInsuranceContractAccidentYear2023Memberafg:PropertyAndCasualtyInsuranceMemberafg:SpecialtyOtherInsuranceMember2024-12-310001042046us-gaap:ShortDurationInsuranceContractAccidentYear2024Memberafg:PropertyAndCasualtyInsuranceMemberafg:SpecialtyOtherInsuranceMember2024-12-310001042046afg:ExcludesShortdurationInsuranceContractsLiabilityforUnpaidClaimsandAllocatedClaimAdjustmentExpenseNotSeparatelyPresentedMemberafg:PropertyAndCasualtyInsuranceMemberafg:SpecialtyOtherInsuranceMember2024-12-310001042046us-gaap:ShortdurationInsuranceContractsAccidentYear2015Memberafg:PropertyAndCasualtyInsuranceMember2015-12-310001042046us-gaap:ShortdurationInsuranceContractsAccidentYear2015Memberafg:PropertyAndCasualtyInsuranceMember2016-12-310001042046us-gaap:ShortdurationInsuranceContractsAccidentYear2015Memberafg:PropertyAndCasualtyInsuranceMember2017-12-310001042046us-gaap:ShortdurationInsuranceContractsAccidentYear2015Memberafg:PropertyAndCasualtyInsuranceMember2018-12-310001042046us-gaap:ShortdurationInsuranceContractsAccidentYear2015Memberafg:PropertyAndCasualtyInsuranceMember2019-12-310001042046us-gaap:ShortdurationInsuranceContractsAccidentYear2015Memberafg:PropertyAndCasualtyInsuranceMember2020-12-310001042046us-gaap:ShortdurationInsuranceContractsAccidentYear2015Memberafg:PropertyAndCasualtyInsuranceMember2021-12-310001042046us-gaap:ShortdurationInsuranceContractsAccidentYear2015Memberafg:PropertyAndCasualtyInsuranceMember2022-12-310001042046us-gaap:ShortdurationInsuranceContractsAccidentYear2015Memberafg:PropertyAndCasualtyInsuranceMember2023-12-310001042046us-gaap:ShortdurationInsuranceContractsAccidentYear2015Memberafg:PropertyAndCasualtyInsuranceMember2024-12-310001042046us-gaap:ShortdurationInsuranceContractsAccidentYear2016Memberafg:PropertyAndCasualtyInsuranceMember2016-12-310001042046us-gaap:ShortdurationInsuranceContractsAccidentYear2016Memberafg:PropertyAndCasualtyInsuranceMember2017-12-310001042046us-gaap:ShortdurationInsuranceContractsAccidentYear2016Memberafg:PropertyAndCasualtyInsuranceMember2018-12-310001042046us-gaap:ShortdurationInsuranceContractsAccidentYear2016Memberafg:PropertyAndCasualtyInsuranceMember2019-12-310001042046us-gaap:ShortdurationInsuranceContractsAccidentYear2016Memberafg:PropertyAndCasualtyInsuranceMember2020-12-310001042046us-gaap:ShortdurationInsuranceContractsAccidentYear2016Memberafg:PropertyAndCasualtyInsuranceMember2021-12-310001042046us-gaap:ShortdurationInsuranceContractsAccidentYear2016Memberafg:PropertyAndCasualtyInsuranceMember2022-12-310001042046us-gaap:ShortdurationInsuranceContractsAccidentYear2016Memberafg:PropertyAndCasualtyInsuranceMember2023-12-310001042046us-gaap:ShortdurationInsuranceContractsAccidentYear2016Memberafg:PropertyAndCasualtyInsuranceMember2024-12-310001042046us-gaap:ShortDurationInsuranceContractsAccidentYear2017Memberafg:PropertyAndCasualtyInsuranceMember2017-12-310001042046us-gaap:ShortDurationInsuranceContractsAccidentYear2017Memberafg:PropertyAndCasualtyInsuranceMember2018-12-310001042046us-gaap:ShortDurationInsuranceContractsAccidentYear2017Memberafg:PropertyAndCasualtyInsuranceMember2019-12-310001042046us-gaap:ShortDurationInsuranceContractsAccidentYear2017Memberafg:PropertyAndCasualtyInsuranceMember2020-12-310001042046us-gaap:ShortDurationInsuranceContractsAccidentYear2017Memberafg:PropertyAndCasualtyInsuranceMember2021-12-310001042046us-gaap:ShortDurationInsuranceContractsAccidentYear2017Memberafg:PropertyAndCasualtyInsuranceMember2022-12-310001042046us-gaap:ShortDurationInsuranceContractsAccidentYear2017Memberafg:PropertyAndCasualtyInsuranceMember2023-12-310001042046us-gaap:ShortDurationInsuranceContractsAccidentYear2017Memberafg:PropertyAndCasualtyInsuranceMember2024-12-310001042046us-gaap:ShortDurationInsuranceContractsAccidentYear2018Memberafg:PropertyAndCasualtyInsuranceMember2018-12-310001042046us-gaap:ShortDurationInsuranceContractsAccidentYear2018Memberafg:PropertyAndCasualtyInsuranceMember2019-12-310001042046us-gaap:ShortDurationInsuranceContractsAccidentYear2018Memberafg:PropertyAndCasualtyInsuranceMember2020-12-310001042046us-gaap:ShortDurationInsuranceContractsAccidentYear2018Memberafg:PropertyAndCasualtyInsuranceMember2021-12-310001042046us-gaap:ShortDurationInsuranceContractsAccidentYear2018Memberafg:PropertyAndCasualtyInsuranceMember2022-12-310001042046us-gaap:ShortDurationInsuranceContractsAccidentYear2018Memberafg:PropertyAndCasualtyInsuranceMember2023-12-310001042046us-gaap:ShortDurationInsuranceContractsAccidentYear2018Memberafg:PropertyAndCasualtyInsuranceMember2024-12-310001042046us-gaap:ShortDurationInsuranceContractAccidentYear2019Memberafg:PropertyAndCasualtyInsuranceMember2019-12-310001042046us-gaap:ShortDurationInsuranceContractAccidentYear2019Memberafg:PropertyAndCasualtyInsuranceMember2020-12-310001042046us-gaap:ShortDurationInsuranceContractAccidentYear2019Memberafg:PropertyAndCasualtyInsuranceMember2021-12-310001042046us-gaap:ShortDurationInsuranceContractAccidentYear2019Memberafg:PropertyAndCasualtyInsuranceMember2022-12-310001042046us-gaap:ShortDurationInsuranceContractAccidentYear2019Memberafg:PropertyAndCasualtyInsuranceMember2023-12-310001042046us-gaap:ShortDurationInsuranceContractAccidentYear2019Memberafg:PropertyAndCasualtyInsuranceMember2024-12-310001042046us-gaap:ShortDurationInsuranceContractAccidentYear2020Memberafg:PropertyAndCasualtyInsuranceMember2020-12-310001042046us-gaap:ShortDurationInsuranceContractAccidentYear2020Memberafg:PropertyAndCasualtyInsuranceMember2021-12-310001042046us-gaap:ShortDurationInsuranceContractAccidentYear2020Memberafg:PropertyAndCasualtyInsuranceMember2022-12-310001042046us-gaap:ShortDurationInsuranceContractAccidentYear2020Memberafg:PropertyAndCasualtyInsuranceMember2023-12-310001042046us-gaap:ShortDurationInsuranceContractAccidentYear2020Memberafg:PropertyAndCasualtyInsuranceMember2024-12-310001042046us-gaap:ShortDurationInsuranceContractAccidentYear2021Memberafg:PropertyAndCasualtyInsuranceMember2021-12-310001042046us-gaap:ShortDurationInsuranceContractAccidentYear2021Memberafg:PropertyAndCasualtyInsuranceMember2022-12-310001042046us-gaap:ShortDurationInsuranceContractAccidentYear2021Memberafg:PropertyAndCasualtyInsuranceMember2023-12-310001042046us-gaap:ShortDurationInsuranceContractAccidentYear2021Memberafg:PropertyAndCasualtyInsuranceMember2024-12-310001042046us-gaap:ShortDurationInsuranceContractAccidentYear2022Memberafg:PropertyAndCasualtyInsuranceMember2022-12-310001042046us-gaap:ShortDurationInsuranceContractAccidentYear2022Memberafg:PropertyAndCasualtyInsuranceMember2023-12-310001042046us-gaap:ShortDurationInsuranceContractAccidentYear2022Memberafg:PropertyAndCasualtyInsuranceMember2024-12-310001042046us-gaap:ShortDurationInsuranceContractAccidentYear2023Memberafg:PropertyAndCasualtyInsuranceMember2023-12-310001042046us-gaap:ShortDurationInsuranceContractAccidentYear2023Memberafg:PropertyAndCasualtyInsuranceMember2024-12-310001042046us-gaap:ShortDurationInsuranceContractAccidentYear2024Memberafg:PropertyAndCasualtyInsuranceMember2024-12-310001042046afg:ExcludesShortdurationInsuranceContractsLiabilityforUnpaidClaimsandAllocatedClaimAdjustmentExpenseNotSeparatelyPresentedMemberafg:PropertyAndCasualtyInsuranceMember2024-12-310001042046us-gaap:PropertyLiabilityAndCasualtyInsuranceSegmentMember2024-01-012024-12-310001042046us-gaap:PropertyLiabilityAndCasualtyInsuranceSegmentMember2023-01-012023-12-310001042046us-gaap:PropertyLiabilityAndCasualtyInsuranceSegmentMember2022-01-012022-12-310001042046us-gaap:PropertyLiabilityAndCasualtyInsuranceSegmentMember2024-12-310001042046us-gaap:PropertyLiabilityAndCasualtyInsuranceSegmentMember2023-12-310001042046srt:MaximumMember2024-12-310001042046srt:ParentCompanyMember2023-01-012023-12-310001042046srt:ParentCompanyMember2022-01-012022-12-310001042046srt:ParentCompanyMember2022-12-310001042046srt:ParentCompanyMember2021-12-310001042046afg:PropertyAndCasualtyInsuranceMember2024-01-012024-12-310001042046afg:PropertyAndCasualtyInsuranceMember2023-01-012023-12-310001042046afg:PropertyAndCasualtyInsuranceMember2022-12-310001042046afg:PropertyAndCasualtyInsuranceMember2022-01-012022-12-31
|
|
|
| UNITED STATES SECURITIES AND EXCHANGE COMMISSION |
Washington, D.C. 20549
FORM 10-K
☑ Annual Report Pursuant to Section 13 or 15(d) of the Securities Exchange Act of 1934
For the Fiscal Year Ended December 31, 2024
or
☐ Transition Report Pursuant to Section 13 or 15(d) of the Securities Exchange Act of 1934
For the transition period from ____ to ____
Commission File No. 1-13653
AMERICAN FINANCIAL GROUP, INC.
Incorporated under the Laws of Ohio IRS Employer I.D. No. 31-1544320
301 East Fourth Street, Cincinnati, Ohio 45202
(513) 579-2121
|
|
|
|
|
|
|
|
|
|
|
|
|
|
|
|
|
|
Securities Registered Pursuant to Section 12(b) of the Act: |
|
Title of Each Class |
|
Trading Symbol(s) |
|
Name of Each Exchange on Which Registered |
|
Common Stock |
|
AFG |
|
New York Stock Exchange |
|
5.875% Subordinated Debentures due March 30, 2059 |
|
AFGB |
|
New York Stock Exchange |
|
5.625% Subordinated Debentures due June 1, 2060 |
|
AFGD |
|
New York Stock Exchange |
|
5.125% Subordinated Debentures due December 15, 2059 |
|
AFGC |
|
New York Stock Exchange |
|
4.50% Subordinated Debentures due September 15, 2060 |
|
AFGE |
|
New York Stock Exchange |
Securities Registered Pursuant to Section 12(g) of the Act: None
Indicate by check mark if the registrant is a well-known seasoned issuer, as defined in Rule 405 of the Securities Act. Yes ☑ No ☐
Indicate by check mark if the registrant is not required to file reports pursuant to Section 13 or Section 15(d) of the Act. Yes ☐ No ☑
Indicate by check mark whether the registrant (1) has filed all reports required to be filed by Section 13 or 15(d) of the Securities Exchange Act of 1934 during the preceding 12 months, and (2) has been subject to such filing requirements for the past 90 days. Yes ☑ No ☐
Indicate by check mark whether the registrant has submitted electronically, every Interactive Data File required to be submitted pursuant to Rule 405 of Regulation S-T during the preceding 12 months. Yes ☑ No ☐
Indicate by check mark whether the registrant is a large accelerated filer, an accelerated filer, a non-accelerated filer, a smaller reporting company or an emerging growth company. See definitions of “large accelerated filer,” “accelerated filer,” “smaller reporting company” and “emerging growth company” in Rule 12b-2 of the Exchange Act.
Large accelerated filer ☑ Accelerated filer ☐ Non-accelerated filer ☐
Smaller reporting company ☐ Emerging growth company ☐
If an emerging growth company, indicate by check mark if the registrant has elected not to use the extended transition period for complying with any new or revised financial accounting standards provided pursuant to Section 13(a) of the Exchange Act. ☐
Indicate by check mark whether the registrant has filed a report on and attestation to its management’s assessment of the effectiveness of its internal control over financial reporting under Section 404(b) of the Sarbanes-Oxley Act (15 U.S.C. 7262(b)) by the registered public accounting firm that prepared or issued its audit report. ☑
If securities are registered pursuant to Section 12(b) of the Act, indicate by check mark whether the financial statements of the registrant included in the filing reflect the correction of an error to previously issued financial statements. ☐
Indicate by check mark whether any of those error corrections are restatements that required a recovery analysis of incentive-based compensation received by any of the registrant’s executive officers during the relevant recovery period pursuant to §240.10D-1(b). ☐
Indicate by check mark whether the registrant is a shell company (as defined in Rule 12b-2 of the Act). Yes ☐ No ☑
State the aggregate market value of the voting and non-voting common equity held by non-affiliates computed by reference to the price at which the common equity was last sold, or the average bid and asked price of such common equity, as of the last business day of the registrant’s most recently completed second fiscal quarter: $8.82 billion.
Indicate the number of shares outstanding of each of the registrant’s classes of common stock, as of the latest practicable date: 83,982,106 shares (excluding 14.9 million shares owned by subsidiaries) as of February 1, 2025.
_____________________________________________________________________________________________________
Documents Incorporated by Reference:
|
|
|
Proxy Statement for 2025 Annual Meeting of Stockholders (portions of which are incorporated by reference into Part III hereof). |
AMERICAN FINANCIAL GROUP, INC.
INDEX TO ANNUAL REPORT ON FORM 10-K
|
|
|
|
|
|
|
|
|
|
|
|
|
|
|
Page |
| FORWARD-LOOKING STATEMENTS |
|
| |
|
|
|
| Part I |
|
|
|
| Item 1 |
— |
Business |
|
| Item 1A |
— |
Risk Factors |
|
| Item 1B |
— |
Unresolved Staff Comments |
|
| Item 1C |
— |
Cybersecurity |
|
| Item 2 |
— |
Properties |
|
| Item 3 |
— |
Legal Proceedings |
|
| Item 4 |
— |
Mine Safety Disclosures |
|
| |
|
|
|
| Part II |
|
|
|
Item 5 |
— |
Market for Registrant’s Common Equity, Related Stockholder Matters and Issuer Purchases of Equity Securities |
|
| Item 6 |
— |
Reserved |
|
| Item 7 |
— |
Management’s Discussion and Analysis of Financial Condition and Results of Operations |
|
| Item 7A |
— |
Quantitative and Qualitative Disclosure About Market Risk |
|
| Item 8 |
— |
Financial Statements and Supplementary Data |
|
| Item 9 |
— |
Changes in and Disagreements With Accountants on Accounting and Financial Disclosure |
|
| Item 9A |
— |
Controls and Procedures |
|
| Item 9B |
— |
Other Information |
|
Item 9C |
— |
Disclosure Regarding Foreign Jurisdictions that Prevent Inspections |
|
| |
|
|
|
| Part III |
|
|
|
| Item 10 |
— |
Directors, Executive Officers and Corporate Governance |
|
| Item 11 |
— |
Executive Compensation |
|
Item 12 |
— |
Security Ownership of Certain Beneficial Owners and Management and Related Stockholder Matters |
|
| Item 13 |
— |
Certain Relationships and Related Transactions, and Director Independence |
|
| Item 14 |
— |
Principal Accounting Fees and Services |
|
| |
|
|
|
| Part IV |
|
|
| Item 15 |
— |
Exhibits, Financial Statement Schedules |
|
|
|
|
|
|
|
|
|
|
|
|
|
FORWARD-LOOKING STATEMENTS
The disclosures in this Form 10-K contain certain forward-looking statements that are subject to numerous assumptions, risks or uncertainties. The Private Securities Litigation Reform Act of 1995 provides a safe harbor for forward-looking statements. Some of the forward-looking statements can be identified by the use of words such as “anticipates”, “believes”, “expects”, “projects”, “estimates”, “intends”, “plans”, “seeks”, “could”, “may”, “should”, “will” or the negative version of those words or other comparable terminology. Such forward-looking statements include statements relating to: expectations concerning market and other conditions and their effect on future premiums, revenues, earnings, investment activities and the amount and timing of share repurchases and special dividends; recoverability of asset values; expected losses and the adequacy of reserves for asbestos, environmental pollution and mass tort claims; rate changes; and improved loss experience.
Actual results and/or financial condition could differ materially from those contained in or implied by such forward-looking statements for a variety of reasons including but not limited to the following and those discussed in Item 1A — Risk Factors and in its other reports filed with the Securities and Exchange Commission.
•changes in financial, political and economic conditions, including changes in interest and inflation rates, currency fluctuations and extended economic recessions or expansions in the U.S. and/or abroad;
•performance of securities markets;
•new legislation or declines in credit quality or credit ratings that could have a material impact on the valuation of securities in AFG’s investment portfolio;
•the availability of capital;
•changes in insurance law or regulation, including changes in statutory accounting rules, including modifications to capital requirements;
•changes in the legal environment affecting AFG or its customers;
•tax law and accounting changes;
•levels of natural catastrophes and severe weather, terrorist activities (including any nuclear, biological, chemical or radiological events), incidents of war or losses resulting from pandemics, civil unrest and other major losses;
•disruption caused by cyber-attacks or other technology breaches or failures by AFG or its business partners and service providers, which could negatively impact AFG’s business or reputation and/or expose AFG to litigation;
•development of insurance loss reserves and establishment of other reserves, particularly with respect to amounts associated with asbestos and environmental claims;
•availability of reinsurance and ability of reinsurers to pay their obligations;
•competitive pressures;
•the ability to obtain adequate rates and policy terms;
•changes in AFG’s credit ratings or the financial strength ratings assigned by major ratings agencies to AFG’s operating subsidiaries; and
•the impact of the conditions in the international financial markets and the global economy relating to AFG’s international operations.
The forward-looking statements herein are made only as of the date of this report. The Company assumes no obligation to publicly update any forward-looking statements.
PART I
Item 1. Business
Introduction
American Financial Group, Inc. (“AFG” or the “Company”) is an insurance holding company. Through the operations of Great American Insurance Group, AFG is engaged in property and casualty insurance, focusing on specialized commercial products for businesses. AFG’s in-house team of investment professionals oversees the Company’s investment portfolio. The members of the Great American Insurance Group have been in business for over 150 years. Management believes that over 55% of the 2024 gross written premiums in AFG’s Specialty property and casualty group are produced by businesses that rank in the “top 10” amongst competitors based on gross written premiums.
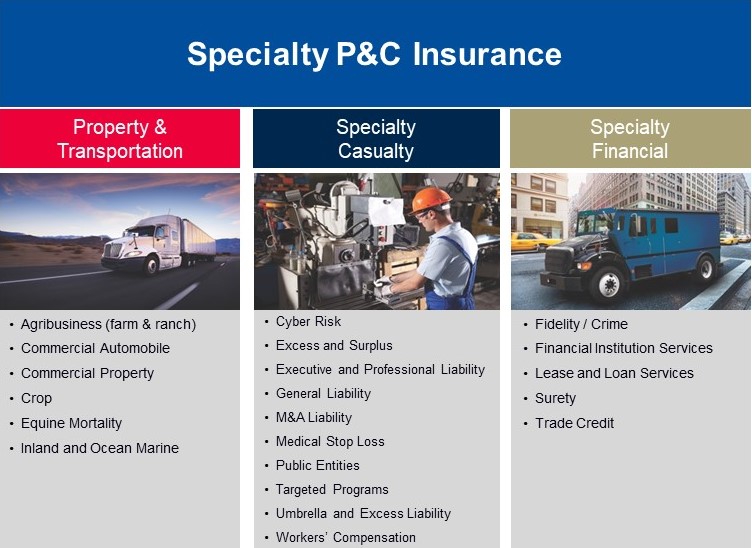
AFG’s address is 301 East Fourth Street, Cincinnati, Ohio 45202; its phone number is (513) 579-2121. SEC filings, news releases, AFG’s Code of Ethics applicable to directors, officers and employees, AFG’s Corporate Social Responsibility Report and other information may be accessed free of charge through AFG’s website at: www.AFGinc.com. (Information on or accessible through AFG’s website is not part of this Form 10-K.) See Note C — “Segments of Operations” to the financial statements for information on AFG’s assets, revenues and earnings before income taxes by segment.
Top Tier Specialty Property and Casualty Insurer
AFG allows each of its businesses the autonomy to make decisions related to underwriting, claims and policy servicing. This entrepreneurial business model promotes agility, innovative product design, unique applications of pricing segmentation, as well as developing distribution strategies and building relationships in the markets served. Management believes that AFG’s ability to grow book value per share at a double-digit annual rate over time is evidence that the Company’s culture, business model and employee incentive plans create a structure to build long-term value for AFG’s shareholders.
As highlighted in the illustration below, over the past 25 plus years, AFG has sharpened its focus on the businesses that management knows best. This has been accomplished through organic growth, carefully selected acquisitions, start-ups and dispositions. In July 2023, AFG completed the acquisition of Crop Risk Services (“CRS”) from American International Group. CRS is a primary crop insurance general agent based in Decatur, Illinois, and it was the seventh largest provider of multi-peril crop insurance in the United States based on 2022 premiums. As a result of the acquisition, AFG remained the fifth ranked writer of U.S. crop insurance and the largest U.S. owned participant in the United States multi-peril crop insurance program.
Timeline of Selected Start-ups, Acquisitions and Dispositions
Property and Casualty Insurance Segment
General
AFG’s property and casualty insurance operations provide a wide range of commercial coverages through 36 insurance businesses (at December 31, 2024) that make up the Great American Insurance Group. AFG’s property and casualty insurance operations ultimately report to a single senior executive and operate under a business model that allows local decision-making for underwriting, claims and policy servicing in each of the niche operations. Each business is managed by experienced professionals in particular lines or customer groups and operates autonomously but with certain central controls and accountability. The decentralized approach allows each unit the autonomy necessary to respond to local and specialty market conditions while capitalizing on the efficiencies of centralized investment and administrative support functions. AFG’s property and casualty insurance operations are conducted through the subsidiaries listed in the following table, which includes independent financial strength ratings and 2024 gross written premiums (in millions) for each subsidiary. These ratings are generally based on concerns for policyholders and agents and are not directed toward the protection of investors. AFG believes that maintaining a rating in the “A” category by A.M. Best is important to compete successfully in most lines of business.
|
|
|
|
|
|
|
|
|
|
|
|
|
|
|
|
|
|
|
Ratings |
|
Gross
Written
Premiums |
|
AM Best |
|
S&P |
|
| Insurance Group |
|
|
|
|
|
| Great American Insurance |
A+ |
|
A+ |
|
$ |
8,142 |
|
| National Interstate |
A+ |
|
not rated |
|
1,210 |
|
| Summit (Bridgefield Casualty and Bridgefield Employers) |
A+ |
|
A+ |
|
596 |
|
| Republic Indemnity |
A+ |
|
A+ |
|
198 |
|
| Mid-Continent Casualty |
A+ |
|
A+ |
|
193 |
|
| Other |
|
|
|
|
194 |
|
|
|
|
|
|
$ |
10,533 |
|
The primary objectives of AFG’s property and casualty insurance operations are to achieve solid underwriting profitability and provide excellent service to its policyholders and agents. Underwriting profitability is measured by the combined ratio, which is a sum of the ratios of losses, loss adjustment expenses (“LAE”), underwriting expenses and policyholder dividends to premiums. A combined ratio under 100% indicates an underwriting profit. The combined ratio does not reflect investment income, other income, other expenses or federal income taxes.
While many costs included in underwriting are readily determined (commissions, administrative expenses and many of the losses on claims reported), the process of determining overall underwriting results is highly dependent upon the use of estimates in the case of losses incurred or expected but not yet reported or developed. Management uses actuarial procedures and projections to determine “point estimates” of ultimate losses. While the process is imprecise and develops amounts which are subject to change over time, management believes that the liabilities for unpaid losses and loss adjustment expenses are adequate.
Financial information is reported in accordance with U.S. generally accepted accounting principles (“GAAP”) for shareholder and other investor-related purposes and reported on a statutory basis for U.S. insurance regulatory purposes. Unless indicated otherwise, the financial information presented in this Form 10-K for AFG’s property and casualty insurance operations is presented based on GAAP. Statutory information is only prepared for AFG’s U.S.-based subsidiaries, which represented approximately 98% of AFG’s direct written premiums in 2024, and is provided for industry comparisons or where comparable GAAP information is not readily available.
Major differences for statutory accounting include charging policy acquisition costs to expense as incurred rather than spreading the costs over the periods covered by the policies; reporting investment grade bonds and redeemable preferred stocks at amortized cost rather than fair value; netting of reinsurance recoverables and prepaid reinsurance premiums against the corresponding liabilities rather than reporting such items separately; and charging to surplus certain GAAP assets, such as furniture and fixtures and agents’ balances over 90 days old.
AFG’s statutory combined ratio averaged 90.6% for the period 2015 to 2024 as compared to 98.3% for the property and casualty commercial lines industry over the same period. AFG believes that its specialty niche focus, product line diversification and underwriting discipline have contributed to the Company’s ability to consistently outperform the industry’s underwriting results. Management’s philosophy is to refrain from writing business that is not expected to produce an underwriting profit even if it is necessary to limit premium growth to do so.
(*)The source of the commercial lines industry ratios is ©2025 A.M. Best Company’s Review & Preview Reports.
Property and Casualty Results
Performance measures such as underwriting profit or loss and related combined ratios are often used by property and casualty insurers to help users of their financial statements better understand the company’s performance. See Note C — “Segments of Operations” to the financial statements for the reconciliation of AFG’s earnings before income taxes by significant business segment to the statement of earnings.
The following table shows the performance of AFG’s property and casualty insurance operations (dollars in millions):
|
|
|
|
|
|
|
|
|
|
|
|
|
|
|
|
|
|
|
2024 |
|
2023 |
|
2022 |
| Gross written premiums |
$ |
10,533 |
|
|
$ |
9,656 |
|
|
$ |
9,057 |
|
| Ceded reinsurance |
(3,394) |
|
|
(2,964) |
|
|
(2,851) |
|
| Net written premiums |
$ |
7,139 |
|
|
$ |
6,692 |
|
|
$ |
6,206 |
|
|
|
|
|
|
|
| Net earned premiums |
$ |
7,036 |
|
|
$ |
6,531 |
|
|
$ |
6,085 |
|
| Loss and LAE |
4,455 |
|
|
4,017 |
|
|
3,629 |
|
|
|
|
|
|
|
|
|
|
|
|
|
| Underwriting expenses |
1,961 |
|
|
1,883 |
|
|
1,680 |
|
| Underwriting gain |
$ |
620 |
|
|
$ |
631 |
|
|
$ |
776 |
|
|
|
|
|
|
|
| GAAP ratios: |
|
|
|
|
|
| Loss and LAE ratio |
63.3 |
% |
|
61.6 |
% |
|
59.7 |
% |
| Underwriting expense ratio |
27.9 |
% |
|
28.8 |
% |
|
27.6 |
% |
| Combined ratio |
91.2 |
% |
|
90.4 |
% |
|
87.3 |
% |
|
|
|
|
|
|
| Statutory ratios: |
|
|
|
|
|
| Loss and LAE ratio |
61.3 |
% |
|
60.3 |
% |
|
57.3 |
% |
| Underwriting expense ratio |
29.6 |
% |
|
30.2 |
% |
|
29.7 |
% |
| Combined ratio |
90.9 |
% |
|
90.5 |
% |
|
87.0 |
% |
|
|
|
|
|
|
| Industry statutory combined ratio (*) |
|
|
|
|
|
| All lines |
98.9 |
% |
|
101.9 |
% |
|
103.1 |
% |
| Commercial lines |
97.0 |
% |
|
96.5 |
% |
|
95.4 |
% |
(*)The source of the industry ratios is ©2025 A.M. Best Company’s Review & Preview Reports.
As with other property and casualty insurers, AFG’s operating results can be adversely affected by unpredictable catastrophe losses. Certain natural disasters (hurricanes, severe storms, earthquakes, tornadoes, floods, etc.) and other incidents of major loss (explosions, civil disorder, terrorist events, fires, etc.) are classified as catastrophes by industry associations. Losses from these incidents are usually tracked separately from other business of insurers because of their sizable effects on overall operations. Total net losses to AFG’s insurance operations from current accident year catastrophes were $180 million in 2024, $162 million in 2023 and $88 million in 2022 and are included in the table above.
AFG generally seeks to reduce its exposure to catastrophes through individual risk selection, including minimizing coastal and known fault-line exposures, and through the purchase of reinsurance. In addition to traditional reinsurance, AFG has purchased coverage through a catastrophe bond structure. AFG’s most recent such coverage expired on January 7, 2025 and management expects to place a new catastrophe bond or purchase other reinsurance protection during the second quarter of 2025 that attaches at $275 million. AFG’s net exposure to a catastrophic earthquake or windstorm that industry models indicate should statistically occur once in every 500 years (a “500-year event”) is expected to be approximately 3% of AFG’s Shareholders’ Equity (less than 8% without the catastrophe bond).
Property and Casualty Insurance Products
AFG is focused on growth opportunities in what it believes to be more profitable specialty businesses where AFG personnel are experts in particular lines of business or customer groups. AFG believes it is an innovator in risk sharing and alternative risk transfer programs for policyholders and agents. For example, AFG provides: risk sharing alternatives in the passenger transportation, moving and storage and trucking industries, agency and group risk sharing programs, unique coverage options for workers’ compensation accounts that include higher retentions and specialty loss prevention and innovative commission structures for distribution partners who produce profitable business. These programs and offerings help align the interests of customers and distribution partners with AFG’s interests.
The following are examples of AFG’s specialty businesses grouped by sub-segment:
|
|
|
|
|
|
| Property and Transportation |
|
| Agricultural-related |
Federally reinsured multi-peril crop (allied lines) insurance covering most perils as well as crop-hail, equine mortality and other coverages for full-time operating farms/ranches and agribusiness operations on a nationwide basis. |
|
|
| Commercial Automobile |
Coverage for vehicles (such as buses and trucks) in a broad range of businesses, including the moving and storage and transportation industries, alternative risk transfer programs, a specialized physical damage product for the trucking industry and other specialty transportation niches. |
|
|
| Property, Inland Marine and Ocean Marine |
Coverage primarily for commercial properties, builders’ risk, contractors’ equipment, property, motor truck cargo, marine cargo, boat dealers, marina operators and dealers and excursion vessels. |
|
|
| Specialty Casualty |
|
| Excess and Surplus |
Liability, umbrella and excess coverage for unique, volatile or hard-to-place risks, using rates and forms that generally do not have to be approved by state insurance regulators. |
|
|
| Executive and Professional Liability |
Coverage for directors and officers of businesses and non-profit organizations, errors and omissions, cyber and mergers and acquisitions. |
|
|
| General Liability |
Coverage for contractor-related businesses, energy development and production risks and environmental liability risks. |
|
|
| Targeted Programs |
Coverage (primarily liability and property) for social service agencies, leisure, entertainment and non-profit organizations, customized solutions for other targeted markets and alternative risk programs using agency captives. |
|
|
| Umbrella and Excess Liability |
Coverage in excess of primary layers. |
|
|
| Workers’ Compensation |
Coverage for prescribed benefits payable to employees who are injured on the job. |
|
|
| Specialty Financial |
|
| Fidelity and Surety |
Fidelity and crime coverage for government, mercantile and financial institutions and surety coverage for various types of contractors and public and private corporations. |
|
|
| Lease and Loan Services |
Coverage for insurance risk management programs for lending and leasing institutions, including equipment leasing and collateral and lender-placed mortgage property insurance. |
|
|
| Trade Credit |
Export and domestic trade credit insurance products for global trade and related financing activities. |
Management believes specialization is the key element to the underwriting success of these business units. These specialty businesses are opportunistic and premium volume will vary based on prevailing market conditions. AFG continually evaluates expansion in existing markets and opportunities in new specialty markets that meet its profitability objectives. Likewise, AFG will withdraw from markets that do not meet its profit objectives or business strategy.
2024 SPECIALTY PROPERTY AND CASUALTY BY SUB-SEGMENT
(*)Excludes underwriting profits and losses recorded outside of AFG’s Specialty property and casualty group.
Premium Distribution
The following table shows the net written premiums by sub-segment for AFG’s property and casualty insurance operations for 2024, 2023 and 2022 (in millions):
|
|
|
|
|
|
|
|
|
|
|
|
|
|
|
|
|
|
|
2024 |
|
2023 |
|
2022 |
| Property and transportation |
$ |
2,811 |
|
|
$ |
2,551 |
|
|
$ |
2,515 |
|
| Specialty casualty |
3,043 |
|
|
2,944 |
|
|
2,728 |
|
| Specialty financial |
1,045 |
|
|
935 |
|
|
711 |
|
| Other specialty (*) |
240 |
|
|
262 |
|
|
252 |
|
|
$ |
7,139 |
|
|
$ |
6,692 |
|
|
$ |
6,206 |
|
(*)Premiums assumed by AFG’s internal reinsurance program from the operations that make up AFG’s Specialty property and casualty insurance sub-segments.
The geographic distribution of statutory direct written premiums by AFG’s U.S.-based insurers for 2024, 2023 and 2022 is shown below. Approximately 2% of AFG’s direct written premiums in 2024 were derived from non U.S.-based insurers.
|
|
|
|
|
|
|
|
|
|
|
|
|
|
|
|
|
|
|
|
|
|
|
|
|
|
|
|
|
|
|
|
|
|
|
|
|
|
|
|
2024 |
|
2023 |
|
2022 |
|
|
2024 |
|
2023 |
|
2022 |
| California |
12.3 |
% |
|
12.6 |
% |
|
12.7 |
% |
|
Kansas |
2.5 |
% |
|
2.5 |
% |
|
2.9 |
% |
| Florida |
8.2 |
% |
|
8.9 |
% |
|
8.2 |
% |
|
Iowa |
2.4 |
% |
|
2.5 |
% |
|
2.7 |
% |
| Texas |
7.9 |
% |
|
7.5 |
% |
|
7.0 |
% |
|
Ohio |
2.4 |
% |
|
2.1 |
% |
|
2.2 |
% |
| New York |
6.0 |
% |
|
5.8 |
% |
|
5.9 |
% |
|
Missouri |
2.3 |
% |
|
2.8 |
% |
|
2.9 |
% |
| Illinois |
5.5 |
% |
|
5.4 |
% |
|
6.2 |
% |
|
Michigan |
2.3 |
% |
|
2.3 |
% |
|
2.4 |
% |
| Georgia |
3.6 |
% |
|
3.4 |
% |
|
3.2 |
% |
|
North Carolina |
2.1 |
% |
|
2.2 |
% |
|
2.0 |
% |
| Indiana |
2.7 |
% |
|
2.6 |
% |
|
2.7 |
% |
|
Other |
34.8 |
% |
|
34.6 |
% |
|
34.5 |
% |
New Jersey |
2.5 |
% |
|
2.5 |
% |
|
2.3 |
% |
|
|
100.0 |
% |
|
100.0 |
% |
|
100.0 |
% |
| Pennsylvania |
2.5 |
% |
|
2.3 |
% |
|
2.2 |
% |
|
|
|
|
|
|
|
2024 STATUTORY DIRECT WRITTEN PREMIUMS
Reinsurance
Consistent with standard practice of most insurance companies, AFG reinsures a portion of its property and casualty business with other insurance companies and assumes a relatively small amount of business from other insurers. AFG uses reinsurance for two primary purposes: (i) to provide higher limits of coverage than it would otherwise be willing to provide (i.e. large line capacity) and (ii) to protect its business by reducing the impact of catastrophes. The availability and cost of reinsurance are subject to prevailing market conditions, which may affect the volume and profitability of business that is written. AFG is subject to credit risk with respect to its reinsurers, as the ceding of risk to reinsurers does not relieve AFG of its liability to its insureds until claims are fully settled.
Reinsurance is provided on either a facultative or treaty basis. Facultative reinsurance is generally provided on a risk-by-risk basis. Individual risks are ceded and assumed based on an offer and acceptance of risk by each party to the transaction. AFG purchases facultative reinsurance, both pro rata and excess of loss, depending on the risk and available reinsurance markets. Treaty reinsurance provides for risks meeting prescribed criteria to be automatically ceded and assumed according to contract provisions.
Catastrophe Reinsurance AFG has taken steps to limit its exposure to catastrophes (including those resulting from hurricanes, windstorms, tornadoes, floods, hailstorms, earthquakes, explosions, fires and acts of terrorism and civil unrest) through individual risk selection, including minimizing coastal and known fault-line exposures, and purchasing catastrophe reinsurance. In addition, AFG purchases catastrophe reinsurance for its workers’ compensation businesses. Although the cost of catastrophe reinsurance varies depending on exposure and the level of worldwide loss activity, AFG continues to obtain reinsurance coverage in adequate amounts at acceptable rates.
In January 2025, AFG’s property and casualty insurance subsidiaries renewed their catastrophe reinsurance coverages. For AFG’s U.S.-based operations, the Company placed $205 million of coverage in excess of a $70 million per event primary retention in the traditional reinsurance markets.
In addition to traditional reinsurance, AFG has historically purchased coverage through a catastrophe bond structure. AFG’s most recent such coverage expired on January 7, 2025 and management expects to place a new catastrophe bond or purchase other reinsurance protection during the second quarter of 2025 that attaches at $275 million.
The commercial marketplace requires large policy limits ($25 million or more) in several of AFG’s lines of business, including certain property, environmental, aviation, executive and professional liability, umbrella and excess liability, and fidelity and surety coverages. Since these limits exceed management’s desired exposure to an individual risk, AFG generally enters into reinsurance agreements to reduce its net exposure under such policies to an acceptable level. Reinsurance continues to be available for this large line capacity exposure with satisfactory pricing and terms.
In addition to the catastrophe and large line capacity reinsurance programs discussed above, AFG purchases reinsurance on a product-by-product basis. AFG regularly reviews the financial strength of its current and potential reinsurers. These reviews include consideration of credit ratings, available capital, claims paying history and expertise. This process periodically results in the transfer of risks to more financially secure reinsurers. Substantially all reinsurance is ceded to companies with investment grade S&P ratings or is secured by “funds withheld” or other collateral. Under “funds withheld” arrangements, AFG retains ceded premiums to fund ceded losses as they become due from the reinsurer. Recoverables from the following companies were individually between 5% and 12% of AFG’s total property and casualty reinsurance recoverable (including prepaid reinsurance premiums and net of payables to reinsurers) at December 31, 2024: Everest Reinsurance Company, Hannover Rueck SE, Munich Reinsurance America, Inc., Swiss Reinsurance America Corporation and Transatlantic Reinsurance Company. No other reinsurers exceeded 5% of AFG’s property and casualty reinsurance recoverable.
The following table presents (by type of coverage) the amount of each loss above the specified retention covered by treaty reinsurance programs in AFG’s U.S.-based property and casualty insurance operations (in millions) as of January 1, 2025:
|
|
|
|
|
|
|
|
|
|
|
|
|
|
|
|
|
|
|
|
|
|
|
|
|
|
|
|
|
|
|
|
|
Reinsurance Coverage |
|
AFG Maximum Loss (b) |
|
Primary Retention |
|
Coverage Amount |
|
AFG Participation (a) |
|
|
|
|
% |
|
$ |
|
| U.S.-based operations: |
|
|
|
|
|
|
|
|
|
| California Workers’ Compensation |
$ |
2 |
|
|
$ |
148 |
|
|
1 |
% |
|
$ |
1 |
|
|
$ |
3 |
|
| Summit Workers’ Compensation |
6 |
|
|
34 |
|
|
5 |
% |
|
2 |
|
|
8 |
|
| Other Workers’ Compensation |
2 |
|
|
48 |
|
|
3 |
% |
|
1 |
|
|
3 |
|
| Commercial Umbrella |
2 |
|
|
48 |
|
|
13 |
% |
|
6 |
|
|
8 |
|
| Property — General |
10 |
|
|
40 |
|
|
— |
% |
|
— |
|
|
10 |
|
Property — Catastrophe |
70 |
|
|
205 |
|
|
— |
% |
|
— |
|
|
70 |
|
(a)Includes the participation of AFG’s internal reinsurance program.
(b)Maximum loss per event for claims up to reinsurance coverage limit.
In addition to the coverage shown above, AFG reinsures its multi-peril crop insurance (“MPCI”) business through the Federal Crop Insurance Corporation (“FCIC”) based on the Standard Reinsurance Agreement (“SRA”). AFG can elect the desired retention of risk on a state-by-state, county, crop or plan basis according to the SRA. The SRA also includes an additional fixed percentage quota share cede. AFG typically reinsures 10% to 20% of MPCI gross written premiums with the FCIC. AFG also purchases quota share reinsurance on its crop business in the private market. This quota share provides for a ceding commission to AFG and a profit-sharing provision. During both 2024 and 2023, AFG reinsured 50% of its crop premiums not reinsured by the FCIC in the private market and purchased stop loss protection coverage for the remaining portion of the business. In 2025, AFG expects to continue to reinsure 50% of the premiums not reinsured by the FCIC in the private market.
The balance sheet caption “Recoverables from reinsurers” included approximately $220 million on paid losses and LAE and $4.96 billion on unpaid losses and LAE at December 31, 2024. These amounts are net of allowances of approximately $11 million for expected credit losses on reinsurance recoverables. The collectability of a reinsurance balance is based upon the financial condition of a reinsurer as well as individual claim considerations.
Reinsurance premiums ceded and assumed are presented in the following table (in millions):
|
|
|
|
|
|
|
|
|
|
|
|
|
|
|
|
|
|
|
2024 |
|
2023 |
|
2022 |
| Reinsurance ceded |
$ |
3,394 |
|
|
$ |
2,964 |
|
|
$ |
2,851 |
|
| Reinsurance ceded, excluding crop |
2,021 |
|
|
1,878 |
|
|
1,768 |
|
Reinsurance assumed — including involuntary pools and associations (*) |
600 |
|
|
347 |
|
|
283 |
|
(*)2024 includes $217 million related to the acquisition of CRS as a result of premium written by the previous owner and assumed by AFG during the transition.
Loss and Loss Adjustment Expense Reserves
The consolidated financial statements include the estimated liability for unpaid losses and LAE of AFG’s insurance subsidiaries. This liability represents estimates of the ultimate net cost of all unpaid losses and LAE and is determined by using case-basis evaluations, actuarial projections and management’s judgment. These estimates are subject to the effects of changes in claim amounts and frequency and are periodically reviewed and adjusted as additional information becomes known. In accordance with industry practices, such adjustments are reflected in current year operations. Generally, reserves for reinsurance assumed and involuntary pools and associations are reflected in AFG’s results at the amounts reported by those entities. See Note N — “Insurance — Insurance Reserves” to the financial statements for information on the development of AFG’s liability for unpaid losses and LAE by accident year as well as a progression of the liability on a GAAP basis over the past three years.
A reconciliation of the liability for losses and LAE reported in the annual statements filed with the state insurance departments in accordance with statutory accounting principles (“SAP”) to the liability reported in the accompanying consolidated financial statements in accordance with GAAP at December 31, 2024 follows (in millions):
|
|
|
|
|
|
Liability reported on a SAP basis, net of $83 million of retroactive reinsurance |
$ |
8,840 |
|
| Reinsurance recoverables, net of allowance |
4,957 |
|
| Other, including reserves of foreign insurers |
382 |
|
| Liability reported on a GAAP basis |
$ |
14,179 |
|
Asbestos and Environmental-related (“A&E”) Insurance Reserves AFG’s property and casualty group, like many others in the industry, has A&E claims arising in most cases from general liability policies written more than thirty-five years ago. The establishment of reserves for such A&E claims presents unique and difficult challenges and is subject to uncertainties significantly greater than those presented by other types of claims. For a discussion of these uncertainties, see Item 7 — Management’s Discussion and Analysis of Financial Condition and Results of Operations — “Uncertainties — Asbestos and Environmental-related (“A&E”) Insurance Reserves” and Note M — “Contingencies” to the financial statements.
The following table (in millions) is a progression of the property and casualty group’s A&E reserves.
|
|
|
|
|
|
|
|
|
|
|
|
|
|
|
|
|
|
|
2024 |
|
2023 |
|
2022 |
Reserves at beginning of year, net of reinsurance recoverable |
$ |
370 |
|
|
$ |
385 |
|
|
$ |
408 |
|
| Incurred losses and LAE |
— |
|
|
— |
|
|
— |
|
| Paid losses and LAE |
(11) |
|
|
(15) |
|
|
(23) |
|
| Reserves at end of year, net of reinsurance recoverable |
359 |
|
|
370 |
|
|
385 |
|
| Reinsurance recoverable, net of allowance |
135 |
|
|
128 |
|
|
140 |
|
| Gross reserves at end of year |
$ |
494 |
|
|
$ |
498 |
|
|
$ |
525 |
|
AFG annually conducts a comprehensive review of its asbestos and environmental reserves. In connection with these reviews, AFG engages with outside counsel and, as appropriate, engineering and consulting firms and specialty actuarial firms.
An in-depth internal review of AFG’s A&E reserves was completed in the third quarter of 2024 by AFG’s internal A&E claims specialists in consultation with specialty outside counsel. The 2024 internal review identified no new trends and recent claims activity was generally consistent with AFG’s expectations resulting from AFG’s in-depth internal reviews in 2023 and 2022 and most recent external study in 2020.
As a result, the 2024 review resulted in no net change to AFG’s property and casualty insurance segment’s asbestos and environmental reserves.
Marketing
The property and casualty insurance group directs its sales efforts primarily through independent insurance agents and brokers, although small portions are written through employee agents. Independent agents and brokers generally receive a commission on the sale of each policy. Some agents and brokers are eligible for a bonus commission based on the overall profitability of policies or volume of business placed with AFG by the broker or agent in a particular year. The property and casualty insurance group writes insurance through several thousand agents and brokers.
Competition
AFG’s property and casualty insurance businesses compete with other individual insurers, state funds and insurance groups of varying sizes, some of which are mutual insurance companies possessing competitive advantages in that all their profits inure to their policyholders. See Item 1A — Risk Factors. AFG also competes with self-insurance plans, captive programs and risk retention groups. Due to the specialty nature of these coverages, competition is based primarily on service to policyholders and agents, specific characteristics of products offered and reputation for claims handling. Financial strength ratings, price, commissions and profit-sharing terms are also important factors. Management believes that sophisticated data analysis for refinement of risk profiles, extensive specialized knowledge and loss prevention service have helped AFG compete successfully.
Human Capital Resources
Culture
AFG’s principal cultural goal is for all employees to feel included, respected, safe and empowered to perform at their best. The Company helps employees succeed by cultivating specialized knowledge and offering professional education and leadership development in a service-oriented culture. AFG respects human rights, appreciates diversity and inclusion and values the unique perspective each employee brings to the workplace.
AFG believes when employees are engaged and aligned with the Company’s mission and strategy, they deliver higher levels of service to its customers and create better results for its business. AFG strives to attract diverse and exceptional people who can grow within AFG by fostering a workplace culture that inspires and rewards people and by developing a workforce that can help the Company meet its current and future goals.
Attraction and Engagement
As of December 31, 2024, the Company had approximately 8,700 employees (none of which were covered by collective bargaining agreements), including approximately 7,800 employed at Great American Insurance Group.
AFG believes that its strong culture and values, along with the resources, competitive compensation and benefits, training and development and other opportunities afforded its employees, contribute meaningfully to what the Company views as positive retention and recruitment trends over the long-term. The Company’s voluntary turnover rate in 2024 was 7.1%. The Company believes that its overall average employee tenure, which is nearly 10.1 years, and average tenure of almost 20 years for the Company’s approximately 200 most senior leaders, evidences the Company’s relative success in growing careers.
To help inform management on employees’ views and perspectives on key matters, AFG generally conducts an employee engagement survey (“Employee Survey”) on a biennial basis. The Employee Survey enables each participant to provide anonymous feedback in response to questions on a broad scope of issues, including culture, engagement, development, benefits, resources and other issues that AFG believes are important measures of long-term employee satisfaction. With the benefit of this direct feedback, management can assess employees’ perspectives on salient issues, thereby informing management’s decisions on which practices should remain unchanged and which should be considered for potential enhancement or revision. AFG’s most recent Employee Survey was conducted in 2024. Employee participation was high, with 92% of the Company’s employees completing the survey. Management was encouraged by this strong engagement and by what management viewed as positive overall results, which on the whole reaffirmed management’s belief that employees appreciate the Company’s culture and the opportunities available to them and understand their link to AFG’s strategy and business. By way of example, some of the Employee Survey results included the following:
•94% of employees agreed that “the organization provides high quality products and services”;
•94% of employees agreed that “I understand how my job contributes to the organization’s strategy and goals”;
•95% of employees agreed that “I understand the results expected of me in my job”; and
•93% of employees agreed that “I am treated with respect as an individual”.
The results of the Employee Survey are reviewed and discussed by AFG management. Those results serve as an important source of information for management in shaping decisions that impact the Company’s employees.
Investing in Employees
Training and Development AFG offers training programs designed to encourage people to build careers in insurance and develop professional skills that positively impact employees’ careers as well as AFG’s customers and business. These include tuition reimbursement programs, monetary incentives and extensive personal and professional learning opportunities.
Compensation and Benefits AFG provides a competitive benefits package that includes an extensive wellness program and paid time away from work for employees to maintain a healthy work-life balance. AFG offers onsite fitness centers at many of its locations, financial incentives for taking care of one’s physical and emotional health and health management programs to increase employees’ engagement with their healthcare providers. AFG also provides six weeks of paid parental leave for employees to care for and bond with their newborn or newly adopted child.
Being a responsible employer and contributing to communities’ economic sustainability includes providing employees the opportunity to have the ability and access to achieve their financial goals. AFG maintains competitive and equitable pay by conducting regular market comparisons. AFG offers an employee stock purchase program, a retirement savings plan with employer matching contributions and company-wide profit sharing programs. In addition, employees have access to professional investment and retirement planning advisors to help prepare for their financial future.
Safety and Security AFG prioritizes workplace safety and is dedicated to minimizing employees’ risk of accident or injury. AFG’s obligations and procedures are outlined in its Workplace Safety and Security Policy along with its Safety and Accident Reporting Policy. AFG is firmly committed to and maintains a policy of providing a work environment free from harassment of any kind, including sexual harassment. This includes intentional and unintentional harassment based on any legally protected classification under applicable federal, state or local law.
Succession Planning As AFG’s success is driven principally by the efforts of its employees, many of whom are specialized experts in their field or area of practice, the Company views succession planning as critical to continuing its track record of strong financial performance. The Company maintains a consistent and methodical approach to succession planning, aimed at identifying successors to senior leaders and identifying and developing future leaders. Succession planning with regard to senior positions is also reviewed with AFG’s Board of Directors.
Board and Committee Oversight Our Board of Directors or its Committees discuss with our Co-CEOs and other senior management members, including directly with the Chief Administrative Officer and Chief Human Resources Officer, a range of human capital management issues, including succession planning and development, compensation, benefits, labor trends, including recruitment and retention, engagement and employee feedback.
Investment Portfolio
AFG’s in-house team of investment professionals have followed a consistent strategy over many years and changing economic conditions. Management believes that AFG’s investment expertise has been the driver of strong investment results and effective portfolio risk management over many years.
The following chart shows the allocation of AFG’s $15.85 billion investment portfolio at December 31, 2024:
Investment Portfolio
For additional information on AFG’s investments, see Note E — “Investments” to the financial statements and Item 7 — Management’s Discussion and Analysis of Financial Condition and Results of Operations — “Investments.” AFG’s earned yield (investment income divided by average invested assets) on fixed maturities was 5.0% for 2024, 4.7% for 2023 and 3.5% for 2022.
The table below compares the total return, which includes changes in fair value, on AFG’s fixed maturities to a comparable public index. While there is no directly comparable index to AFG’s portfolio, shown below is a widely used benchmark in the financial services industry.
|
|
|
|
|
|
|
|
|
|
|
|
|
|
|
|
|
|
|
2024 |
|
2023 |
|
2022 |
| Total return on AFG’s fixed maturities |
6.2 |
% |
|
7.2 |
% |
|
(4.4 |
%) |
| Barclays Capital U.S. Universal Bond Index |
2.0 |
% |
|
6.2 |
% |
|
(13.0 |
%) |
The following table shows AFG’s available for sale fixed maturity investments by Standard & Poor’s Corporation or comparable rating as of December 31, 2024 (dollars in millions).
|
|
|
|
|
|
|
|
|
|
|
|
|
|
|
|
|
|
|
Amortized Cost, net (*) |
|
Fair Value |
|
|
Amount |
|
% |
| S&P or comparable rating |
|
|
|
|
|
| AAA, AA, A |
$ |
7,528 |
|
|
$ |
7,294 |
|
|
70 |
% |
| BBB |
2,565 |
|
|
2,537 |
|
|
24 |
% |
| Total investment grade |
10,093 |
|
|
9,831 |
|
|
94 |
% |
| BB |
175 |
|
|
176 |
|
|
2 |
% |
| B |
38 |
|
|
37 |
|
|
— |
% |
| CCC, CC, C |
43 |
|
|
45 |
|
|
1 |
% |
| D |
12 |
|
|
12 |
|
|
— |
% |
| Total non-investment grade |
268 |
|
|
270 |
|
|
3 |
% |
| Not rated |
292 |
|
|
297 |
|
|
3 |
% |
| Total |
$ |
10,653 |
|
|
$ |
10,398 |
|
|
100 |
% |
(*)Amortized cost, net of allowance for expected credit losses.
At December 31, 2024, 96% (based on statutory carrying value of $10.46 billion) of AFG’s fixed maturity investments held by its insurance companies had a National Association of Insurance Commissioners (“NAIC”) designation of 1 or 2 (the highest of the six designations) based not only on the probability of loss but also on the severity of loss.
Regulation
AFG’s insurance company subsidiaries are subject to U.S. and international regulation in the jurisdictions where they do business. In general, the insurance laws of the various jurisdictions establish regulatory agencies with broad administrative powers governing, among other things, premium rates, solvency standards, licensing of insurers, agents and brokers, trade practices, forms of policies, maintenance of specified reserves and capital for the protection of policyholders, deposits of securities for the benefit of policyholders, investment activities and relationships between insurance subsidiaries and their parents and affiliates. Various transactions between insurance subsidiaries and their parents and affiliates must receive prior approval of the applicable insurance regulatory authorities and be disclosed.
U.S. Regulation
Holding Company Statutes AFG is subject to state statutes governing insurance holding company systems. Typically, those statutes require that AFG periodically file information with the appropriate state insurance commissioner, including information concerning capital structure, ownership, financial condition, dividend payments and other certain transactions with affiliates and general business operations.
Risk Based Capital Requirements The NAIC and state insurance departments use a risk-based capital (“RBC”) formula that is designed to measure the adequacy of an insurer’s statutory surplus in relation to the risks inherent in its business. The RBC formula develops risk adjusted target levels of adjusted statutory capital by applying certain factors to various asset, premium and reserve items. The insurance company’s state of domicile imposes RBC requirements.
Statutory Accounting Principles Each U.S. insurance subsidiary is required to file detailed quarterly and annual reports, including financial statements, in accordance with prescribed statutory accounting rules, with regulatory officials in the jurisdictions in which they conduct business. The quarterly and annual financial reports filed with the state insurance departments utilize statutory accounting principles (“SAP”) that are different from U.S. GAAP. In developing SAP, insurance regulators were primarily concerned with monitoring the solvency of insurance companies to assure an insurer’s ability to pay all its current and future obligations to policyholders.
Cybersecurity Regulations Numerous states have enacted new insurance laws that require certain regulated entities to implement and maintain comprehensive information security programs to safeguard the personal information of insureds. For example, the New York State Department of Financial Services (“NYDFS”) cybersecurity regulation requires banks, insurance companies and other financial services institutions regulated by the NYDFS to establish and maintain a cybersecurity program “designed to protect consumers and ensure the safety and soundness of New York State’s financial services industry.” The NAIC adopted an Insurance Data Security Model Law which, when adopted by the states, requires licensed insurance entities to comply with detailed information security requirements. To date, the Insurance Data Security Model Law has been adopted by a number of states, including Ohio, where several of AFG’s insurance subsidiaries are domiciled.
Certain states are developing or have developed regulations related to privacy and data security. For example, the California Consumer Privacy Act of 2018, as amended by the California Privacy Rights Act, broadly regulates the collection, processing and disclosure of California residents’ personal information, imposes limits on the “sale” and “sharing” of personal information and grants California residents certain rights to, among other things, access and delete data about them in certain circumstances.
Own Risk and Solvency Assessment AFG must submit an Own Risk and Solvency Assessment Summary Report (“ORSA”) at least annually to its lead state insurance regulator. The ORSA, which is a component of an insurer’s enterprise risk management framework, is a confidential internal assessment of the material and relevant risks associated with an insurer’s current business plan and the sufficiency of capital resources to support those risks.
Dividends The laws of the domiciliary states of AFG’s U.S. insurance subsidiaries govern the amount of dividends that may be paid to its shareholders in any twelve-month period, generally based on net earnings or statutory surplus. Under applicable restrictions, the maximum amount of dividends available to AFG in 2025 from its insurance subsidiaries without seeking prior regulatory approval is approximately $1.00 billion.
Investment Regulation Investments must comply with applicable laws and regulations that prescribe the kind, quality and concentration of investments. In general, these laws and regulations permit investments in federal, state and municipal obligations, corporate bonds, preferred and common equity securities, mortgage loans, real estate and certain other investments, subject to specified limits and certain other qualifications.
Federal Regulation
Although the federal government and its regulatory agencies generally do not directly regulate the business of insurance, federal legislation and administrative rules adopted apply to AFG’s business. For instance, privacy laws, such as the Gramm-Leach-Bliley Act and the Fair Credit Reporting Act, affect AFG’s day-to-day operations. AFG is also subject to other federal laws, such as the Terrorism Risk Insurance Act, the Nonadmitted and Reinsurance Reform Act, the U.S. Foreign Corrupt Practices Act and the rules and regulations of the Office of Foreign Assets Control.
The Dodd-Frank Wall Street Reform and Consumer Protection Act of 2010 (“Dodd-Frank”), contains insurance industry-specific provisions, including establishment of the Federal Insurance Office (“FIO”) and streamlining the regulation and taxation of surplus lines insurance and reinsurance among the states. The FIO, part of the U.S. Department of the Treasury, has limited authority and no direct regulatory authority over the business of insurance. The FIO’s principal mandates include monitoring the insurance industry, monitoring the extent to which traditionally underserved communities and consumers have access to affordable non-health insurance products, collecting insurance industry information and data and representing the U.S. with international insurance regulators.
International Regulation
AFG operates in limited foreign jurisdictions where its operations are subject to regulation and supervision of the various jurisdictions. These regulations, which vary depending on the jurisdiction, include, among others, solvency and market conduct regulations, including Solvency II; anti-corruption and anti-terrorist financing guidelines, laws and regulations; various privacy, insurance, tax, tariff, trade and sanctions laws and regulations, including the EU and UK General Data Protection Regulation (“GDPR”); and corporate, employment, intellectual property and investment laws and regulations. AFG has foreign insurance company subsidiaries domiciled in the United Kingdom, Ireland, Mexico, Bermuda, and the Cayman Islands and branch operations in Canada and Singapore, all of which are subject to regulation by the insurance regulator of such jurisdiction.
Item 1A. Risk Factors
In addition to the other information set forth in this report, particularly information under “Forward-Looking Statements” and “Management’s Discussion and Analysis of Financial Condition and Results of Operations,” the following are the material factors affecting AFG’s business. Any one of these factors, or multiple factors in combination, could cause AFG’s actual results to vary materially from recent results or from anticipated future results. Additional risks and uncertainties not currently known to AFG or that AFG currently deems to be immaterial also may materially adversely affect AFG’s business, financial condition or results of operations.
RISKS RELATING TO AFG’S INSURANCE OPERATIONS, DISTRIBUTION AND PRODUCTS
AFG’s results of operations could be adversely impacted by catastrophes, both natural and man-made, pandemics, severe weather conditions or climate change.
Catastrophes can be caused by unpredictable natural events such as hurricanes, windstorms, severe storms, tornadoes, floods, hailstorms, earthquakes, explosions and fire, and by other events, such as war, terrorist attacks and civil unrest, as well as pandemics and other similar outbreaks in many parts of the world. These events may have a material adverse effect on AFG’s workforce and business operations as well as the workforce and operations of AFG’s customers and independent agents.
The extent of gross losses for AFG’s insurance operations from a catastrophe event is a function of both the total amount of insured exposure in the area affected by the event and the severity of the event. In addition, certain catastrophes could result in both property and non-property claims from the same event. AFG purchases catastrophe reinsurance to mitigate the impact of catastrophe losses. Reinsurance is subject to the adequacy and counterparty reinsurance risks described below under “The inability to obtain reinsurance or to collect on ceded reinsurance could adversely affect AFG’s results of operations.” A severe catastrophe or a series of catastrophes could result in losses exceeding AFG’s reinsurance protection and may have a material adverse impact on its results of operations or financial condition.
Changing weather patterns, whether as a result of global climate change caused by human activities or otherwise, have added to the unpredictability, frequency and severity of weather-related catastrophes and other losses, such as wildfires or flooding, incurred by the industry in recent years. For example, in September 2024, Hurricane Helene caused significant damage in non-coastal areas, where such impacts may not have historically been expected. Changing weather patterns also make it more difficult for AFG to predict and model catastrophic events, reducing AFG’s ability to accurately price its exposure to such events and mitigate its risks.
In addition, claims for catastrophic events, or an unusual frequency of smaller losses in a particular period, such as from lower severity convective storms, could expose AFG to large losses, cause substantial volatility in its results of operations and could have a material adverse effect on its ability to write new business if AFG is not able to adequately assess and reserve for the increased frequency and severity of catastrophes resulting from these environmental factors. In addition, any increase in the frequency or severity of catastrophic events may result in losses exceeding AFG’s reinsurance protection or may result in substantial volatility in or materially impact AFG’s results of operations or financial condition.
Volatility in crop prices or yields, as a result of weather conditions or other events, could adversely impact AFG’s results of operations.
Weather conditions, including too much moisture (flooding or excessive rain), not enough moisture (droughts), and the level of crop yields and prices in the commodities market heavily impact AFG’s crop insurance business. These factors are inherently unpredictable and could result in significant volatility in the results of the crop insurance business from one year to the next. AFG’s crop results could also be negatively impacted by pests and plant disease. In addition, government policies, action, or regulation, whether by the United States or foreign governments, could directly or indirectly impact commodity prices. A large decline in the commodity prices of one or more of the major crops that AFG insures could have a material adverse effect on AFG’s results of operations or financial condition.
AFG’s results of operations and revenues may fluctuate as a result of many factors, including cyclical changes in the insurance industry.
The results of operations of companies in the property and casualty insurance industry historically have been subject to fluctuations and uncertainties from many factors, including competitive pressures, rising loss costs and changes in the level of reinsurance pricing and capacity, among others. Such factors often cause cyclical changes in the insurance industry with effects that are not uniform among product lines. The demand for property and casualty insurance, both admitted and excess and surplus lines, can vary significantly, rising as the overall level of economic activity increases and falling as that activity decreases, causing AFG’s revenues to fluctuate. As a result, AFG’s premium levels, renewal rates, expense ratio and other items could be materially adversely impacted. These factors could produce results that would have a negative impact on AFG’s results of operations and financial condition.
AFG’s success will depend on its ability to maintain and enhance effective operating procedures and manage risks on an enterprise-wide basis.
Operational risk and losses can result from, among other things, fraud, errors, failure to document transactions properly, failure to obtain proper internal authorization, failure to comply with regulatory requirements, information technology failures or other internal or external events. AFG continues to enhance its operating procedures and internal controls to effectively support its business and its regulatory and reporting requirements. The NAIC and state legislatures have increased their focus on risks within an insurer’s holding company system that may pose enterprise risk to insurers. AFG must submit an Own Risk and Solvency Assessment Summary Report (“ORSA”) at least annually to its lead state insurance regulator. The ORSA is a confidential internal assessment of the material and relevant risks associated with an insurer’s current business plan and the sufficiency of capital resources to support those risks.
AFG operates within an enterprise risk management (“ERM”) framework designed to assess and monitor risks. However, assurance that AFG can effectively identify, review and monitor all risks or that all its employees will operate within the ERM framework cannot be guaranteed. Assurances that AFG’s ERM framework will result in the Company accurately identifying all risks and accurately limiting its exposures based on its assessments also cannot be guaranteed. Any ineffectiveness in AFG’s control or procedures or failure to manage these risks may have an adverse effect on AFG’s results of operations and financial condition.
AFG could face unanticipated losses from war, terrorism, political unrest and geopolitical uncertainty which could have a material adverse effect on AFG’s financial condition and results of operations.
AFG has substantial exposure to unexpected losses resulting from war, acts of terrorism, political unrest and geopolitical instability in many regions of the world. Private sector catastrophe reinsurance is limited and generally unavailable for terrorism losses caused by attacks with nuclear, biological, chemical or radiological weapons. On December 20, 2019, the President of the United States signed the Terrorism Risk Insurance Program Reauthorization Act of 2019 (“TRIP"), extending the program through December 31, 2027. Although TRIP provides benefits in the event of certain acts of terrorism, those benefits are subject to a deductible and to other limitations, which could ultimately leave AFG subject to material adverse financial impacts. AFG cannot predict or eliminate its exposure to events of war, terrorism, political unrest or geopolitical uncertainty, and to the extent that losses from such events occur, AFG’s financial condition and results of operations could be materially adversely affected.
AFG’s international operations expose it to investment, political and economic risks, including foreign currency and credit risk.
AFG’s international operations expose AFG to additional risks including restrictions such as price controls, capital controls, currency exchange limits, ownership limits and other restrictive or anti-competitive governmental actions or requirements, which could have an adverse effect on AFG’s business and reputation. AFG’s business activities outside the United States may also be subject to political and economic risks, including foreign currency and credit risk.
AFG’s business activities outside the United States subject AFG to additional domestic and foreign laws and regulations, including the Foreign Corrupt Practices Act, the UK Bribery Act and similar laws in other countries that prohibit the making of improper payments to foreign officials. Although AFG has policies and controls in place that are designed to ensure compliance with these laws, if those controls are ineffective and an employee or intermediary fails to comply with applicable laws and regulations, AFG could suffer civil and criminal penalties and AFG’s business and reputation could be adversely affected. Some countries have laws and regulations that lack clarity and, even with local expertise and effective controls, it can be difficult to determine the exact requirements of, and potential liability for non-compliance under, the local laws. Failure to comply with local laws in a particular market may result in substantial liability and could have a significant and negative effect not only on AFG’s business in that market but also on AFG’s reputation generally.
RISKS RELATING TO THE INSURANCE INDUSTRY
Intense competition could adversely affect AFG’s results of operations.
The property and casualty insurance segment operates in a highly competitive industry that is affected by many factors that can cause significant fluctuations in its results of operations. The lines of business in this segment compete with other individual insurers, state funds and insurance groups of varying sizes, some of which are mutual insurance companies possessing competitive advantages in that all their profits inure to their policyholders. The property and casualty insurance segment also competes with self-insurance plans, captive programs and risk retention groups. In addition, certain foreign insurers may be taxed at lower rates, which may result in a competitive advantage over AFG.
In recent years, various types of investors have increasingly sought to participate in the property and casualty insurance industry. Well-capitalized new entrants to the property and casualty insurance industry, or existing competitors that receive substantial infusions of capital or access to third-party capital, provide increasing competition, which may adversely impact AFG’s business and profitability. Further, technology companies or other third parties have created, and may in the future create, technology-enabled business models, processes, platforms or alternate distribution channels that may adversely impact AFG’s competitive position in some parts of its business.
AFG may utilize artificial intelligence and machine learning (“AI”) in its business or incorporate AI into its products and services. The AI used by AFG may not operate properly or as expected, which could cause AFG to write policies it may not have otherwise written, misprice policies, assume greater risks, or overpay customer claims, among other potential negative impacts on its business and operations. AFG’s existing competitors, new entrants, technology companies or other third parties may leverage AI to the benefit of their business or operations or may incorporate AI into their products and services more quickly or successfully than AFG, which could make AFG less competitive and negatively impact its results of operations. In addition, if the content, analyses, output or recommendations produced by or with the assistance of AI are unintentionally, or are alleged to be, deficient, inaccurate or misleading, AFG’s business, financial condition and results of operation may be adversely impacted.
Competition is based on many factors, including service to policyholders and agents, product design, reputation for claims handling, price, commissions, ratings and financial strength. The property and casualty market has experienced periods characterized by increased competition, resulting in less restrictive underwriting standards and relatively low premium rates, followed by periods of relatively lower levels of competition, more selective underwriting standards and relatively high premium rates. During periods in which price competition is high or industry underwriting standards have loosened or degraded, AFG may lose business to competitors offering competitive insurance products at lower prices or more favorable terms. Some of AFG’s competitors have more capital and greater resources than AFG and may offer a broader range of products, lower prices or better terms than AFG offers. If competition limits AFG’s ability to write new or renewal business at adequate rates, its results of operations will be adversely affected.
AFG’s revenues could be adversely affected if it is not able to attract and retain independent agents.
AFG’s reliance on the independent agency market makes it vulnerable to a reduction in the amount of business written by agents. Many of AFG’s competitors also rely significantly on the independent agency market. Some of AFG’s competitors offer a wider variety of products or higher commissions. AFG also faces credit risk with respect to its independent agents, as they may not pay all the premiums owed to AFG and it may be difficult or impossible to recover such amounts. A reduction in the number of independent agencies marketing AFG’s products, the failure of agencies to successfully market AFG’s products, changes in the strategy or operations of agencies (including agency consolidation), the inability of AFG to collect amounts owed by agencies or the choice of agencies to reduce their writings of AFG products could adversely affect AFG’s revenues and profitability.
RISKS RELATING TO ESTIMATES, ASSUMPTIONS AND VALUATIONS
AFG’s property and casualty reserves may be inadequate, which could have a material adverse effect on AFG’s results of operations.
Liabilities for unpaid losses and loss adjustment expenses (“LAE”) do not represent an exact calculation of liability but instead represent management estimates of what the ultimate settlement and administration of claims will cost, supported by actuarial expertise and projection techniques, at a given accounting date. The process of estimating unpaid losses and LAE reserves involves a high degree of judgment and is subject to numerous internal and external factors. Variability is introduced by changes in claims handling procedures, the impact of general and wage inflation (including impacts on medical costs and property and transportation vehicle parts and values) on loss cost trends, increasing litigation and erosion of causation and coverage defenses for insurance claims, legislative actions, evolving mass tort issues and varying judgments and viewpoints of the individuals involved in the estimation process, among others. The impact of many of these items on ultimate costs for unpaid losses and LAE is difficult to estimate. Unpaid losses and LAE reserve estimation difficulties also differ significantly by product line due to differences in claim complexity, the volume of claims, the potential severity of individual claims, the determination of an occurrence date for a claim and lags in the time between damage, loss or injury and when a claim is actually reported to the insurer. In addition, the historic development of AFG’s liability for unpaid losses and LAE may not necessarily reflect future trends in the development of these amounts. To the extent that reserves are inadequate and are strengthened, AFG’s profitability would be adversely affected because the amount of any such increase would be treated as a charge to earnings in the period in which the deficiency is recognized.
AFG uses analytical models to assist in its underwriting, reserving and reinsurance purchasing decision-making, and actual results may differ materially from the model outputs and related analyses.
AFG uses various modeling techniques and data analytics to analyze and estimate exposures, loss trends and other risks associated with its assets and liabilities. AFG uses the modeled outputs and related analyses to assist in decision-making in areas such as underwriting, claims, reserving, reinsurance and catastrophe risk. The modeled outputs and related analyses are subject to various assumptions, uncertainties, model errors and the inherent limitations of any statistical analysis, including the use of historical internal and industry data. In addition, the modeled outputs and related analyses may from time to time contain inaccuracies, perhaps in material respects, including as a result of inaccurate inputs or applications thereof. Consequently, actual results may differ materially from AFG’s modeled results. AFG may also utilize AI to assist with modeled outputs and related analyses, the results of which may be unintentionally deficient, inaccurate or misleading. If, based upon these models or other factors, AFG underestimates the frequency and/or severity of loss events or overestimates the risks it is exposed to, new business growth and retention of AFG’s existing business may be adversely affected which could have an adverse effect on AFG’s results of operations and financial condition.
Exposure to mass tort claims could materially adversely affect AFG’s results of operations and financial condition.
AFG has current exposures and may in the future have additional exposures arising from its insurance operations and former railroad and manufacturing operations, including those relating to asbestos and environmental matters (“A&E”), as well as other potentially harmful products or substances, such as per- and polyfluoroalkyl substances (“PFAS”), talc and opioids, or cumulative trauma (e.g. concussion/abuse). Establishing A&E liabilities is subject to uncertainties that are significantly greater than those presented by other types of liabilities. Uncertainties include the long delays between exposure and manifestation of any bodily injury or property damage, difficulty in identifying the source of the asbestos or environmental contamination, long reporting delays, the risks inherent in complex litigation and difficulty in properly allocating liability for the asbestos or environmental damage. As a result, A&E liabilities are subject to revision as new information becomes available and as claims are made and develop. Claimants continue to assert new and novel theories of recovery and make efforts to expand the right to sue, judicial interpretations continue to evolve, and from time to time, there may be unfavorable changes to state and federal legislation regarding mass tort claim liability and claims administration.
In addition, third party funding of litigation has continued to grow, which may increase the number of claims and result in higher jury awards and settlements. If AFG has not established adequate reserves to cover future claims, AFG’s results of operations and financial condition could be materially adversely affected.
RISKS RELATING TO ECONOMIC, POLITICAL AND GLOBAL MARKET CONDITIONS
AFG’s investment portfolio is subject to market risk, including changes in interest rates, which could have a material adverse effect on AFG’s results of operations and financial condition.
Investment returns are an important part of AFG’s profitability. AFG’s investments are subject to market-wide risks and fluctuations, including in the fixed maturity and equity securities markets, which could impair its profitability, financial condition and cash flows.
AFG’s investment portfolio is highly concentrated in fixed maturity investments that are sensitive to changes in interest rates. Changes in interest rates may materially adversely affect the performance of some of AFG’s investments, including by materially reducing the fair value of and net investment income from fixed maturities and increasing unrealized losses in AFG’s investment portfolio. AFG’s fixed maturity portfolio is also subject to credit risk as certain investments may default or become impaired due to deterioration in the financial condition of issuers of those investments. In addition to the risks applicable to the entire fixed maturity investment portfolio, changes in interest rates can expose AFG to prepayment risks on its mortgage-backed securities. In periods of declining interest rates, mortgage prepayments generally increase and mortgage-backed securities are paid down more quickly, which may require AFG to reinvest the proceeds at lower interest rates.
General economic, financial market and political conditions and conditions in the markets in which AFG operates may materially adversely affect its investment portfolio, results of operations, financial condition and stock price.
General economic, financial market and political conditions and conditions in the markets in which AFG operates could have a material adverse effect on its results of operations and financial condition. Limited availability of credit, deteriorations of the domestic or global equity, debt, mortgage and real estate markets; declines in consumer confidence and consumer spending; increases in prices or in the rate of inflation; periods of high unemployment; persistently low or rapidly increasing interest rates; disruptive actions or policies by the U.S. or foreign governments; disruptive geopolitical events and other events outside of AFG’s control, such as a major epidemic or another pandemic, could contribute to increased volatility and diminished expectations for the economy and the financial markets, including the value of AFG’s investment portfolio and the market for its stock.
AFG’s alternative investments may be illiquid and volatile in terms of value and returns, which could negatively affect AFG’s investment income and liquidity.
AFG has invested, and intends to continue to invest in, alternative investments, such as limited partnerships and subordinate tranches of collateralized loan obligations for which changes in value are reported in net earnings. These and other similar investments may have different, more significant risk characteristics than investments in fixed maturity securities, may be more volatile and may be illiquid due to restrictions on sales, transfers and redemption terms, all of which could negatively affect AFG’s investment income and overall portfolio liquidity.
AFG has also invested, and intends to continue to invest in, limited partnerships and other entities that AFG does not control. AFG does not have management or operational control over the investees, which may limit AFG’s ability to take actions that could protect or increase the value of the investment. In addition, these investments may be illiquid due to contractual provisions, and AFG may be unable to obtain liquidity through distributions from these investments in a timely manner or on favorable terms.
Alternative or “other” investments may not meet regulatory admissibility requirements or may result in increased regulatory capital charges to the insurance subsidiaries that hold these investments, which could limit those subsidiaries’ ability to pay dividends and negatively impact AFG’s liquidity.
AFG’s access to capital may be limited or may not be available on favorable terms.
AFG’s future capital requirements depend on many factors, including rating agency and regulatory requirements, the performance of the investment portfolio, the ability to write new business successfully and the ability to establish premium rates and loss reserves at levels sufficient to cover losses. Financial markets in the U.S. and elsewhere can experience extreme volatility, which exerts downward pressure on stock prices and limits access to the equity and debt markets for certain issuers, including AFG. While AFG can borrow up to $450 million under its revolving credit facility, AFG’s access to funds through its credit facility is dependent on the ability of its banks to meet their funding commitments. There were no borrowings outstanding under the credit facility or any other parent company short-term borrowing arrangements during 2024.
If AFG cannot obtain adequate capital or sources of credit on favorable terms, or at all, its business, operating results and financial condition could be adversely affected.
RISKS RELATED TO TECHNOLOGY, DATA SECURITY AND PRIVACY
AFG or third parties may experience difficulties with technology or data security, which could have an adverse effect on AFG’s business or reputation.
AFG uses computer systems and services, which may include or utilize AI applications, to store, retrieve, evaluate and utilize company and customer data and information. Systems failures or outages could compromise AFG’s ability to perform business functions in a timely manner, which could harm its ability to conduct business and hurt its relationships with business partners and customers. In the event of a disaster such as a natural catastrophe, an industrial accident, a blackout, a malicious software attack, a terrorist attack or war, AFG’s systems may be inaccessible to employees, customers or business partners for an extended period of time. Even if AFG’s employees are able to report to work, they may be unable to perform their duties for an extended period of time if AFG’s data or systems are disabled or destroyed.
Businesses in the United States and in other countries have increasingly become the targets of “cyber-attacks,” “ransomware,” “phishing,” “hacking” or similar illegal or unauthorized intrusions into computer systems and networks. Such events are often highly publicized, can result in significant disruptions to information technology systems and the theft of significant amounts of information as well as funds from online financial accounts, and can cause negative publicity and extensive damage to the reputation of the targeted business, in addition to leading to significant expenses associated with investigation, remediation and customer protection measures. The sophistication of cybersecurity threats, including through the use of AI, continues to increase and proliferate. Like others in the insurance industry, AFG experiences cyber-attacks and other attempts to gain unauthorized access to its systems on a regular basis and anticipates continuing to be subject to such attempts. AFG’s administrative and technical controls as well as other preventative actions used to reduce the risk of cyber incidents and protect AFG’s information may be insufficient to detect or prevent future unauthorized access, other physical and electronic break-ins, cyber-attacks or other security breaches to AFG’s computer systems or those of third parties with whom AFG does business. Third parties with which AFG conducts business have also experienced, and may experience in the future, similar illegal or unauthorized intrusions into their computer systems and networks, which could adversely affect AFG’s ability to conduct business, its results of operations and reputation, in addition to exposing it to legal liability or regulatory action.
AFG has outsourced certain technology and business process functions to third parties over which it has no control and may continue to do so in the future. Outsourcing of certain technology and business process functions to third parties may expose AFG to increased risk related to data security or service disruptions. If AFG does not effectively develop, implement and monitor these relationships, third-party providers do not perform as anticipated, technological or other problems are incurred, or outsourcing relationships relevant to AFG’s business process functions are terminated or interrupted, AFG may not realize expected productivity improvements or cost efficiencies and may experience operational difficulties, increased costs and a loss of business.
The increased risks identified above could expose AFG to data loss, disruption of service, monetary and reputational damages, competitive disadvantage and significant increases in compliance costs and costs to improve the security and resiliency of AFG’s computer systems. The compromise of personal, confidential or proprietary information could also subject AFG to legal liability or regulatory action under evolving cyber-security, data protection and privacy laws and regulations enacted by the U.S. federal and state governments, Canada, the EU or other jurisdictions or by various regulatory organizations or exchanges. As a result, AFG’s ability to conduct business and its results of operations might be materially and adversely affected.
Any failure to appropriately collect, administer and protect consumer information could adversely affect AFG’s reputation, subject AFG to fines, claims and penalties, and have a material adverse effect on AFG’s business, financial condition and results of operations.
AFG and its business partners collect and store sensitive data in the ordinary course of AFG’s and their business, including personal identification information of our and their employees and customers, vendors, investors and other third parties and may include health information. Laws and regulations in this area are evolving at an international, national and state level and are generally becoming more rigorous, including through the adoption of more stringent subject matter-specific laws, such as the California Consumer Privacy Act of 2018 (as amended by the California Privacy Rights Act of 2020), the New York Department of Financial Services’ Cybersecurity Regulation and Ohio’s insurance data security law, which regulate the collection and use of data and security and data breach obligations. The use of AI by AFG or its business partners may also result in potential breaches of existing or future laws or regulations related to privacy or data security. If any disruption or security breach results in a loss or damage to AFG’s data, or inappropriate disclosure of AFG’s confidential information or that of others, it could damage AFG’s reputation, affect its relationships with customers, clients, business partners and regulators, lead to claims against AFG, result in regulatory action and harm AFG’s business.
In addition, AFG may be required to incur significant costs to mitigate the damage caused by any security breach or to protect against future damage.
RISKS RELATED TO FINANCIAL STRENGTH, CREDIT AND COUNTERPARTIES
A downgrade or potential downgrade in AFG’s financial strength and/or credit ratings by one or more rating agencies could adversely affect its business, financial condition, results of operations and/or cash flows.
Financial strength ratings are an important factor in establishing the competitive position of insurance companies and may have an effect on an insurance company’s sales. A downgrade out of the “A” category in AFG’s insurers’ claims-paying and financial strength ratings could significantly reduce AFG’s business volumes in certain lines of business, adversely impact AFG’s ability to access the capital markets and increase AFG’s borrowing costs.
In addition to the financial strength ratings of AFG’s principal insurance company subsidiaries, various rating agencies also publish credit ratings for AFG. Credit ratings are indicators of a debt issuer’s ability to meet the terms of debt obligations in a timely manner, are part of AFG’s overall financial profile and affect AFG’s ability to access and the associated cost of certain types of capital. A downgrade in AFG’s credit ratings could have a material adverse effect on AFG’s financial condition and results of operations and cash flows in a number of ways, including adversely limiting access to capital markets, potentially increasing the cost of debt or increasing borrowing costs under AFG’s current revolving credit facility.
The inability to obtain reinsurance or to collect on ceded reinsurance could adversely affect AFG’s results of operations.
AFG purchases reinsurance to limit the amount of risk it retains. Market conditions determine the availability and cost of the reinsurance protection AFG purchases, which affects the level of AFG’s business and profitability, as well as the level and types of risk AFG retains. If AFG is unable to obtain sufficient reinsurance at a cost AFG deems acceptable, AFG may opt to reduce the volume of its underwriting. AFG is also subject to credit risk with respect to its reinsurers, as AFG will remain liable to its insureds regardless of whether a reinsurer is able to meet its obligations under agreements covering the reinsurance ceded. As of December 31, 2024, AFG has $5.18 billion of recoverables from reinsurers on its balance sheet. The collectability of recoverables from reinsurers is subject to uncertainty arising from a number of factors, including a reinsurers’ financial capacity and willingness to make payments under the terms of a reinsurance treaty or contract and changes in market conditions.
REGULATORY AND LEGAL RISKS
AFG may suffer losses from litigation, including from effects of emerging claim and coverage issues which could materially and adversely affect AFG’s financial condition and business operations.
AFG is involved in routine legal proceedings incidental to its insurance operations and litigation related to asbestos and environmental claims from its historical operations. Litigation by nature is unpredictable, and the outcome of any case is uncertain and could result in liabilities that vary from the amounts AFG has currently recorded. Pervasive or significant changes in the judicial environment relating to matters such as trends in the size of jury awards, developments in the law relating to the liability of insurers or tort defendants, and rulings concerning the availability or amount of certain types of damages could cause AFG’s ultimate liabilities to change from current expectations. As industry practices and legal, judicial, social and other environmental conditions change, unexpected and unintended issues related to claims and coverage may emerge. These issues may adversely affect AFG’s business, including by extending coverage beyond contractual terms, underwriting intent or by increasing the number, size or types of claims as a result of, among other things, plaintiffs targeting property and casualty insurers in purported class action litigation relating to claims-handling and other practices; increased claims due to third party funding of litigation; and social inflation and legal system abuse influencing trends like more frequent claims, judgments that are unfavorable for insurers and an increase in “nuclear verdicts” leading to higher jury awards. Changes in federal or state tort litigation laws or other applicable law could have a similar effect. It is not possible to predict changes in the judicial and legislative environment, including in connection with asbestos and environmental claims. In addition, potential exposure to losses related to PFAS, whether through AFG’s insurance operations or its former railroad and manufacturing operations, are inherently difficult to forecast or estimate, as many factors could influence potential liability for any such losses. These factors may include developments in PFAS-related litigation, including the establishment or expansion of theories of causation and liability; new or enhanced rules, regulations and enforcement actions by the U.S. federal government and its agencies, including the Environmental Protection Agency, as well as state governments and agencies; and medical or research findings pertaining to actual or potential harm or illness to human health resulting from PFAS. New technology, including AI, could also create unforeseen exposures or coverage issues under policies written by AFG, as well as increase and aggravate claims fraud and cybercrime.
AFG’s business, financial condition, results of operations and liquidity could also be adversely affected if judicial, legislative or other anticipated developments cause AFG’s ultimate liabilities to increase from current expectations.
AFG is subject to comprehensive regulation, and its ability to earn profits may be restricted by these regulations.
AFG is subject to comprehensive regulation by government agencies in the states and countries where its insurance company subsidiaries are domiciled and where these subsidiaries issue policies and handle claims. Most insurance regulations are designed to protect the interests of AFG’s policyholders and third-party claimants as opposed to its investors.
While the federal government’s role in regulating insurance companies is currently limited, the Dodd-Frank Act established a Federal Insurance Office within the U.S. Department of Treasury to collect data on the insurance industry, recommend changes to the state system of insurance regulation and preempt certain state insurance laws. The potential impact on AFG remains unclear, but the implementation of any federal insurance regulations that constrain AFG’s business opportunities or reduce investment flexibility could change the competitive landscape of the financial services sector or the insurance industry, make it more expensive for AFG to conduct its business and otherwise have a material adverse effect on AFG’s financial condition and results of operations.
The Company may be subject to increasing regulation imposing mandatory disclosure of sustainability and climate-related data. For example, in October 2023, California adopted climate-related bills that require companies doing business in California that meet certain revenue thresholds to publicly disclose certain greenhouse gas emissions data and climate-related financial risk reports. Compliance with such requirements will require significant effort and resources. AFG is subject to complex and changing laws, regulation and public policy debates relating to climate change which are difficult to predict and quantify and may have an adverse impact on its business. Changes in regulations relating to climate change may result in an increase in the cost of doing business or a decrease in premiums in certain lines of business.
As a participant in the federal crop insurance program, AFG could also be impacted by regulatory and legislative changes affecting that program. For example, the reinsurance levels that the federal government provides to authorized carriers could be reduced by future legislation. AFG will continue to monitor new and changing federal regulations and the potential impact, if any, on its insurance company subsidiaries.
Both state and federal regulators in the U.S., as well as regulators in foreign jurisdictions, including the EU (whether under its regulatory framework proposed in April 2021 or otherwise), have enacted and will continue to evaluate and assess potential laws and regulations to limit and restrict companies’ use of AI, and enact new and expanding bases of liability for businesses utilizing AI. Such laws and regulations may limit or prevent AFG’s development and use of AI applications, or may eliminate or restrict the confidentiality of our proprietary technology, which could adversely affect AFG’s business, operations and financial results, including by reducing the utility of AFG’s products, increasing AFG’s costs and exposing AFG to litigation or other liabilities.
Existing insurance-related laws and regulations may become more restrictive in the future or new restrictive laws may be enacted; it is not possible to predict the potential effects of these laws and regulations. The costs of compliance or the failure to comply with existing or future regulations could impose significant burdens on AFG.
As a holding company, AFG is dependent on the operations of its insurance company subsidiaries to meet its obligations and pay future dividends.
AFG is a holding company and a legal entity separate and distinct from its insurance company subsidiaries. As a holding company without significant operations of its own, AFG’s principal sources of funds are dividends and other distributions from its insurance company subsidiaries. State insurance laws differ from state to state but may, absent advance regulatory approval, restrict the maximum amount of dividends that may be paid by an insurer to its shareholders in any twelve-month period. AFG’s rights to participate in any distribution of assets of its insurance company subsidiaries are subject to prior claims of policyholders and creditors (except to the extent that its rights, if any, as a creditor are recognized). Consequently, AFG’s ability to pay its debts, expenses and dividends to its shareholders may be limited.
Statutory capital requirements set by the NAIC and the various state insurance regulatory bodies establish regulations that provide minimum capitalization requirements based on risk-based capital (“RBC”) ratios for insurance companies. Statutory surplus and RBC ratios may change in a given year based on a number of factors, including statutory earnings/losses, reserve changes, excess capital held to support growth, equity market and interest rate changes, the value of investment securities and changes to the RBC formulas. Increases in the amount of capital or reserves that AFG’s larger insurance subsidiaries are required to hold could reduce the amount of future dividends such subsidiaries are able to distribute to the holding company or require capital contributions.
Any reduction in the RBC ratios of AFG’s insurance subsidiaries could also adversely affect their financial strength ratings as determined by rating agencies.
AFG could be adversely impacted by changes to the U.S. Federal income tax laws.
Changes in domestic or foreign tax laws or interpretations of such laws could increase AFG’s corporate taxes and reduce earnings. For example, on August 16, 2022, the U.S. government enacted the Inflation Reduction Act (“IRA”) which, among other changes, created a new corporate alternative minimum tax (“CAMT”) based on adjusted financial statement income and imposed a 1% excise tax on corporate stock repurchases. Many of the key individual tax provisions from the 2017 Tax Cuts and Jobs Act are set to expire on December 31, 2025. Legislation to extend or modify the provisions is expected to be addressed by the U.S. Congress in 2025 and such legislation could include provisions that impact the taxation of corporations on their domestic and foreign income. Any changes in federal income tax laws could adversely affect the federal income taxation of AFG’s ongoing operations and have a material adverse impact on its financial condition and results of operations.
New accounting rules or changes to existing accounting standards could adversely impact AFG’s reported results of operations.
As a U.S.-based SEC registrant, AFG prepares its financial statements in accordance with GAAP, as promulgated by the Financial Accounting Standards Board, subject to the accounting-related rules and interpretations of the SEC. New accounting rules or changes in accounting standards, particularly those that specifically apply to insurance company operations, may impact AFG’s reported financial results and could cause increased volatility in reported earnings, resulting in other adverse impacts on AFG’s ratings and cost of capital, and decrease the understandability of AFG’s financial results as well as the comparability of AFG’s reported results with other insurers.
GENERAL RISK FACTORS
Certain shareholders exercise substantial control over AFG’s affairs, which may impede a change of control transaction.
As of December 31, 2024, Carl H. Lindner III and S. Craig Lindner (each of whom are Co-Chief Executive Officers and Directors of AFG) and members of their respective families, directly or indirectly through trusts or other entities, together with employees of the Company, collectively owned approximately 24% of AFG’s outstanding Common Stock. As a result, the Lindner family and AFG’s employees have the ability to exercise significant influence over AFG and over matters requiring shareholder approval. Such influence could prevent an acquisition of AFG at a price and upon terms that other shareholders may find attractive.
AFG’s business and operations may be negatively impacted by its and its business partners’ failure to recruit and retain key employees.
The expertise and experience of AFG’s employees is a critical component of the Company’s success. The continuation of such success depends, in large part, on AFG’s ability to attract and retain key individuals. There can be intense competition for qualified candidates in the activities that AFG conducts and in the markets that it serves, both within the insurance industry and from businesses outside the industry. This is particularly acute in certain specialized positions and areas of expertise, such as underwriting, data and analytics and AI-related and technology fields. Competition for employees may increase AFG’s expenses and may result in the company not being able to hire key employees or retain them. If AFG is unable to hire qualified candidates or retain its key personnel, AFG may be unable to execute its business strategies and may suffer material adverse consequences to its business, operations and financial condition.
The price of AFG Common Stock may fluctuate significantly, which may make it difficult for holders to resell common stock when they want or at a price they find attractive.
The price of AFG Common Stock, which is listed on the NYSE, constantly changes. AFG’s Common Stock price could materially fluctuate or decrease in response to a number of events or factors discussed in this section in addition to other events or factors, including quarterly variations in AFG’s operating results; operating and stock price performance of comparable companies; and negative publicity relating to AFG or its competitors. In addition, broad market and industry fluctuations may materially and adversely affect the trading price or volume of AFG Common Stock, regardless of AFG’s actual operating performance.
Item 1B. Unresolved Staff Comments
None.
Item 1C. Cybersecurity
Risk Management and Strategy
AFG recognizes the importance of assessing, identifying and managing material risks associated with cybersecurity threats as defined by the Securities and Exchange Commission. Like all businesses, AFG is a target for “cyber-attacks,” “ransomware,” “phishing,” “hacking” and similar illegal or unauthorized intrusions into computer systems and networks. Such events can result in significant disruptions to information technology systems, the theft of information and financial assets and reputational harm. AFG could also incur significant expenses associated with investigating and remediating any such event.
As discussed below, AFG’s enterprise risk management (“ERM”) process considers cybersecurity threat risks alongside other company risks as part of the overall risk assessment process.
AFG has adopted the National Institute of Standards and Technology (“NIST”) Cybersecurity framework which provides a comprehensive method for developing a flexible, repeatable, performance-based and cost-effective approach to identifying and managing cybersecurity risks. The Company uses the framework to assess and improve its security posture.
AFG utilizes a variety of techniques to provide for the availability of critical data and systems, maintain regulatory compliance, manage its material risks from cybersecurity threats and to protect against, detect, and respond to cybersecurity incidents including, but not limited to, the following:
•Conducts regular phishing testing of all employees and all members of the Board of Directors;
•Utilizes full-desk encryption on all Company laptops and desktops;
•Maintains a defense in depth security control strategy that is tested against high risk threats such as ransomware and other trending attack vectors;
•Performs annual security awareness training and other routinely scheduled educational programming for employees;
•Validates compliance with internal data security controls through the use of security monitoring utilities and internal and external audits;
•Performs self-assessments measured against industry-leading cybersecurity frameworks for standards, guidelines and best practices, including the NIST cybersecurity framework;
•Regularly scans external websites and internal applications;
•Engages an external third-party to conduct an annual penetration test consisting of advanced adversarial attacks against company systems and from which findings are investigated, ranked by risk level and tracked through appropriate mediation levels;
•Utilizes user protections including stringent password requirements, two-factor authentication, and timed logoffs;
•Conducts regular network and endpoint monitoring;
•Performs regular tabletop exercises, utilizing a third-party data security firm as a facilitator, to simulate a response to a cybersecurity incident where the Company uses the findings to improve its processes and technologies; and
•Purchases information security risk insurance from a third-party insurer that provides protection against the potential losses arising from a cybersecurity incident.
AFG continues to integrate assessing cybersecurity threat risks associated with its use of third-party service providers, generally at the initial engagement or renewal of the relationship. When conducting these assessments, AFG’s Enterprise Information Security Group (“EISG”) considers the risk profile of the vendor or supplier, assesses security controls with the third parties and engages in contractual review to ensure appropriate security controls are in place.
AFG describes whether and how risks from identified cybersecurity threats are reasonably likely to materially affect the Company, including its business strategy, results of operations, or financial condition in its risk factor disclosures in Item 1A of this Annual Report on Form 10-K, which disclosures are incorporated by reference in this Item 1C.
Like others in the insurance industry, AFG experiences cyber-attacks and other attempts to gain unauthorized access to its systems on a regular basis and anticipates continuing to be subject to such attempts. Over the last three years, AFG has not experienced any material adverse events and has not paid any penalties or settlements related to an information security breach.
Governance
AFG’s Audit Committee is responsible for the oversight of risks from cybersecurity threats. At least annually, the full Board of Directors receives and at least quarterly, the Audit Committee receives an overview from the Chief Information Security Officer (“CISO”) or another senior member of the EISG of the Company’s cybersecurity threat risk management and strategy processes covering topics such as data security posture, results from third-party assessments, progress towards predetermined risk-mitigation-related goals, incident response planning and material cybersecurity threat risks or incidents and developments, as well as the steps management has taken to respond to such risks.
In such sessions, materials including a cybersecurity scorecard and other information indicating current and emerging material cybersecurity threat risks and describing the Company’s ability to mitigate those risks are provided. Members of the Board also regularly receive educational materials and engage in ad hoc conversations with management on cybersecurity-related news events and discuss any updates to AFG’s cybersecurity risk management and strategy programs.
AFG has designed its ERM program to reinforce the way the Company operates its business and reflects its culture, organizational structure and risks. The AFG Enterprise Risk Committee (“ERC”), consisting of AFG’s Chief Administrative Officer and Chief Human Resources Officer, AFG’s Chief Financial Officer, AFG’s General Counsel and Great American’s President, oversees the ERM process including risk identification, risk impact and mitigation strategies. Each member of the ERC directly reports to AFG’s Co-CEOs. On a day-to-day basis, the Company’s ERM process is overseen by an AFG Enterprise Risk Officer, who regularly meets with senior leaders, including the CISO, representing key areas throughout the organization. Cybersecurity risk has been identified as a significant risk monitored under the ERM program. In addition, Ms. Murray, one of AFG’s independent Directors, completed the National Association of Corporate Directors’ Cyber-Risk Oversight Program and received the CERT Certificate in Cybersecurity Oversight issued by the Software Engineering Institute at Carnegie Mellon University.
AFG has also adopted a Security Incident Response Plan (“SIRP”) that is designed to provide a management framework across Company functions for a coordinated assessment and response to potential security incidents. The AFG CISO leads and facilitates the SIRP team, which also includes AFG’s Chief Administrative Officer and Chief Human Resources Officer, AFG’s Chief Financial Officer, AFG’s Chief Information Officer, AFG’s General Counsel and Great American’s President and its General Counsel.
The SIRP provides for the interaction and coordination of executive, strategic and tactical teams, depending on the severity level of the incident, aimed at facilitating coordination across multiple units and departments of the Company. The incident response plan is reviewed, updated and tested at least annually. The SIRP covers the major phases of incident response process, including preparation; detection and analysis; containment and investigation; where required, notification to federal or state regulators; eradication and recovery; and incident closure and post-incident analysis.
AFG’s cybersecurity program is directed by its EISG leadership team that is headed by the AFG CISO and three divisional officers who report to the CISO. This leadership group has collectively over 70 years of cybersecurity work experience, over 90 years of Information Technology (“IT”) experience and over 20 years of IT audit experience. This experience involved various roles related to managing information security; developing cybersecurity strategy; implementing and monitoring effective cybersecurity controls and penetration testing. These individuals hold many industry-standard certifications including but not limited to Certified Information Systems Security Professional, Information Systems Security Management Professional, G2700 certification, GIAC Security Leadership Certification, Certified in Risk and Information Systems Control®, Certified Information Security Manager, ITL certification and others. The CISO also holds a master’s degree in information security. All members of this leadership team are active in their local cybersecurity communities and national conferences. They speak at local universities, local conferences, national conferences, and have conducted training sessions at international conferences like Black Hat, an internationally recognized cybersecurity event series providing the most technical and relevant information security research. Their work has also been used in various best practice case studies by industry leading consulting and research firms.
Item 2. Properties
AFG and its insurance subsidiaries lease the majority of their office and storage facilities in numerous cities throughout the United States and internationally, including the Company’s headquarters in Cincinnati, Ohio. Subsidiaries of AFG own several other buildings in downtown Cincinnati. AFG and its affiliates occupy approximately half of the aggregate 640,000 square feet of commercial and office space in these buildings.
Property and casualty subsidiaries own and occupy approximately 90% of the 281,000 square feet of rentable office space on 17.5 acres of land in Richfield, Ohio and 100% of the 135,000 square feet of rentable office space on 1.3 acres of land in Lakeland, Florida.
Item 3. Legal Proceedings
AFG and its subsidiaries are involved in litigation from time to time, generally arising in the ordinary course of business. This litigation may include, but is not limited to, general commercial disputes, lawsuits brought by policyholders, employment matters, reinsurance collection matters and actions challenging certain business practices of insurance subsidiaries. Except for the following, management believes that none of the litigation meets the threshold for disclosure under this Item.
AFG’s insurance company subsidiaries and its 100%-owned subsidiary, APU Consolidated, Inc. (including its subsidiaries, “APU”), are parties to litigation and receive claims alleging injuries and damages from asbestos, environmental and other substances and workplace hazards and have established loss accruals for such potential liabilities. None of such litigation or claims is individually material to AFG; however, the ultimate loss for these claims may vary materially from amounts currently recorded as the conditions surrounding resolution of these claims continue to change.
APU is a party or named as a potentially responsible party in a number of proceedings and claims by regulatory agencies and private parties under various environmental protection laws, including the Comprehensive Environmental Response, Compensation and Liability Act, seeking to impose responsibility on APU for hazardous waste or discharge remediation costs at certain railroad sites formerly owned by its predecessor, Penn Central Transportation Company (“PCTC”), and at certain other sites where hazardous waste or discharge allegedly generated by PCTC’s railroad operations and APU’s former manufacturing operations is present. It is difficult to estimate APU’s liability for remediation costs at these sites for a number of reasons, including the number and financial resources of other potentially responsible parties involved at a given site, the varying availability of evidence by which to allocate responsibility among such parties, the wide range of costs for possible remediation alternatives, changing technology and the period of time over which these matters develop. Nevertheless, APU believes that its accruals for potential environmental liabilities are adequate to cover the probable amount of such liabilities, based on APU’s estimates of remediation costs and related expenses and its estimates of the portions of such costs that will be borne by other parties. Such estimates are based on information currently available to APU and are subject to future change as additional information becomes available.
Item 4. Mine Safety Disclosures
Not applicable.
PART II
Item 5. Market for Registrant’s Common Equity, Related Stockholder Matters and Issuer Purchases of Equity Securities
AFG Common Stock is listed and traded on the New York Stock Exchange under the symbol AFG. There were approximately 4,300 shareholders of record of AFG Common Stock at February 1, 2025.
Issuer Purchases of Equity Securities
AFG did not repurchase any shares of its Common Stock during 2024. As of December 31, 2024, there are 5,729,010 remaining shares that may be repurchased until December 31, 2025 under the Plans authorized by AFG’s Board of Directors in October 2020 and May 2021.
AFG acquired 53,362 shares of its Common Stock (at an average of $126.33 per share) in the first nine months of 2024, 150 shares (at an average of $133.14 per share) in October 2024 and 61 shares (at $136.62 per share) in December 2024 in connection with its stock incentive plans.
Stock Performance Graph
The following graph compares the performance of AFG Common Stock during the five year period from December 31, 2019 through December 31, 2024 with the performance of (i) the S&P 500 Composite Stock Index (“S&P 500 Index”) and (ii) the S&P 500 Property & Casualty Insurance Index. The graph assumes that an initial investment of $100 was made on December 31, 2019 and all dividends were reinvested. The stock price performance presented below is not intended to be indicative of future price performance.
|
|
|
|
|
|
|
|
|
|
|
|
|
|
|
|
|
|
|
|
|
|
|
|
|
|
|
|
|
|
|
|
|
|
|
|
|
As of December 31, |
|
2019 |
|
2020 |
|
2021 |
|
2022 |
|
2023 |
|
2024 |
| AFG |
$ |
100 |
|
|
$ |
84 |
|
|
$ |
163 |
|
|
$ |
181 |
|
|
$ |
168 |
|
|
$ |
207 |
|
| S&P 500 Index |
100 |
|
|
118 |
|
|
152 |
|
|
125 |
|
|
157 |
|
|
197 |
|
| S&P 500 P&C Index (b) |
100 |
|
|
106 |
|
|
125 |
|
|
149 |
|
|
164 |
|
|
222 |
|
(a)Cumulative total shareholder return measures the performance of a company’s stock (or an index) over time and is calculated as the change in the stock price plus cumulative dividends (assuming dividends are reinvested) over a specific period of time divided by the stock price at the beginning of the time period.
(b)The S&P 500 Property & Casualty Insurance Index included the following companies at December 31, 2024 (weighted by market capitalization): The Allstate Corporation, Arch Capital Group Ltd., Assurant, Inc., Chubb Limited, Cincinnati Financial Corporation, Erie Indemnity Company, The Hartford Financial Services Group, Inc., Loews Corporation, The Progressive Corporation, The Travelers Companies, Inc. and W.R. Berkley Corporation.
Item 6. Reserved
Item 7. Management’s Discussion and Analysis of Financial Condition and Results of Operations
OBJECTIVE
The objective of Management’s Discussion and Analysis is to provide a discussion and analysis of the financial statements and other statistical data that management believes will enhance the understanding of AFG’s financial condition, changes in financial condition and results of operations. The tables and narrative that follow are presented in a manner that is consistent with the information that AFG’s management uses to make operational decisions and allocate capital resources. They are provided to demonstrate the nature of the transactions and events that could impact AFG’s financial results. This discussion should be read in conjunction with the financial statements beginning on page F-1.
OVERVIEW
Financial Condition
AFG is organized as a holding company with almost all of its operations being conducted by subsidiaries. AFG, however, has continuing cash needs for administrative expenses, the payment of principal and interest on borrowings, shareholder dividends, and taxes. Therefore, certain analyses are most meaningfully presented on a parent only basis while others are best done on a total enterprise basis. In addition, because its businesses are financial in nature, AFG does not prepare its consolidated financial statements using a current-noncurrent format. Consequently, certain traditional ratios and financial analysis tests are not meaningful.
Results of Operations
Through the operations of its subsidiaries, AFG is engaged primarily in property and casualty insurance, focusing on specialized commercial products for businesses.
AFG reported net earnings of $255 million ($3.03 per share, diluted) for the fourth quarter of 2024 compared to $263 million ($3.13 per share, diluted) in the fourth quarter of 2023. Higher net investment income was more than offset by net realized losses on securities in the fourth quarter of 2024 compared to net realized gains on securities in the fourth quarter of 2023 and lower underwriting profit.
Full year 2024 net earnings were $887 million ($10.57 per share, diluted) compared to $852 million ($10.05 per share, diluted) in 2023. The year-over-year increase was due primarily to the impact on net investment income of higher yields on fixed maturity investments coupled with the impact of net realized losses on securities in 2023. These items were partially offset by lower net investment income from AFG’s alternative investment portfolio and lower underwriting profit.
Outlook
Management expects continued premium growth and strong underwriting results in the ongoing generally favorable property and casualty insurance market. In addition, management anticipates the deployment of cash during the elevated interest rate environment (since early 2022) will continue to have a positive impact on investment income on fixed maturity investments in 2025.
AFG’s financial condition, results of operations and cash flows are impacted by the economic, legal and regulatory environment. Economic inflation, social inflation and other economic conditions may impact premium levels, loss cost trends and investment returns. For a more comprehensive list of risks, see “Item 1A — Risk Factors.”
Management believes that AFG’s strong financial position and current liquidity and capital at its subsidiaries will give AFG the flexibility to continue to effectively address and respond to anticipated and unanticipated challenges. AFG’s insurance subsidiaries continue to have capital at or in excess of the levels required by ratings agencies in order to maintain their current ratings, and the parent company does not have any near-term debt maturities.
CRITICAL ACCOUNTING POLICIES
Significant accounting policies are summarized in Note A — “Accounting Policies” to the financial statements. The preparation of financial statements in conformity with GAAP requires management to make estimates and assumptions that can have a significant effect on amounts reported in the financial statements. As more information becomes known, these estimates and assumptions change and, thus, impact amounts reported in the future. The areas where management believes the degree of judgment required to determine amounts recorded in the financial statements is most significant are as follows:
•the valuation of investments, including the determination of impairment allowances,
•the establishment of insurance reserves, especially asbestos and environmental-related reserves,
•the recoverability of reinsurance, and
•the establishment of asbestos and environmental liabilities of former railroad and manufacturing operations.
See “Liquidity and Capital Resources — Uncertainties” for a discussion of insurance reserves, recoverables from reinsurers and contingencies related to APU Consolidated’s former operations and “Liquidity and Capital Resources — Investments” for a discussion of the allowance for credit losses (impairments) on investments.
LIQUIDITY AND CAPITAL RESOURCES
Ratios
AFG’s debt to total capital ratio on a consolidated basis is shown below (dollars in millions). Management intends to maintain the ratio of debt to capital at or below 30% and intends to maintain the capital of its significant insurance subsidiaries at or above levels currently indicated by rating agencies as appropriate for the current ratings.
|
|
|
|
|
|
|
|
|
|
|
|
|
|
|
|
|
December 31, |
|
2024 |
|
2023 |
| Principal amount of long-term debt |
|
|
$ |
1,498 |
|
|
$ |
1,498 |
|
| Total capital |
|
|
6,204 |
|
|
6,075 |
|
| Ratio of debt to total capital: |
|
|
|
|
|
| Including subordinated debt |
|
|
24.1 |
% |
|
24.7 |
% |
| Excluding subordinated debt |
|
|
13.3 |
% |
|
13.5 |
% |
The ratio of debt to total capital is a non-GAAP measure that management believes is useful for investors, analysts and ratings agencies to evaluate AFG’s financial strength and liquidity and to provide insight into how AFG finances its operations. The ratio is calculated by dividing the principal amount of AFG’s long-term debt by its total capital, which includes long-term debt and shareholders’ equity (excluding accumulated other comprehensive income (loss), net of tax). In addition, maintaining a ratio of debt, excluding subordinated debt and debt secured by real estate (if any), to total capital of 35% or lower is a financial covenant in AFG’s bank credit facility.
The NAIC’s model law for risk-based capital (“RBC”) applies to property and casualty companies. RBC formulas determine the amount of capital that an insurance company needs so that it has an acceptable expectation of not becoming financially impaired. At December 31, 2024, the capital ratios of all AFG insurance companies exceeded the RBC requirements.
Condensed Consolidated Cash Flows
AFG’s principal sources of cash include insurance premiums, income from its investment portfolio and proceeds from the maturities, redemptions and sales of investments. Insurance premiums in excess of acquisition expenses and operating costs are invested until they are needed to meet policyholder obligations or made available to the parent company through dividends to cover debt obligations and corporate expenses, and to provide returns to shareholders through share repurchases and dividends. Cash flows from operating, investing and financing activities as detailed in AFG’s Consolidated Statement of Cash Flows are shown below (in millions):
|
|
|
|
|
|
|
|
|
|
|
|
|
|
|
|
|
|
|
Year ended December 31, |
|
2024 |
|
2023 |
|
2022 |
| Net cash provided by operating activities |
$ |
1,152 |
|
|
$ |
1,970 |
|
|
$ |
1,153 |
|
| Net cash provided by (used in) investing activities |
95 |
|
|
414 |
|
|
(1,051) |
|
| Net cash used in financing activities |
(1,066) |
|
|
(2,031) |
|
|
(1,361) |
|
| Net change in cash and cash equivalents |
$ |
181 |
|
|
$ |
353 |
|
|
$ |
(1,259) |
|
Net Cash Provided by Operating Activities AFG’s property and casualty insurance operations typically produce positive net operating cash flows as premiums collected and investment income exceed policy acquisition costs, claims payments and operating expenses. AFG’s net cash provided by operating activities is impacted by the level and timing of property and casualty premiums, claim and expense payments and recoveries from reinsurers. Cash flows provided by operating activities also include the activity of AFG’s managed investment entities (collateralized loan obligations (“CLO”)) other than those activities included in investing or financing activities. The changes in the assets and liabilities of the managed investment entities included in operating activities reduced cash flows from operating activities by $80 million in 2024, increased cash flows from operating activities by $305 million in 2023 and reduced cash flows from operating activities by $183 million in 2022, resulting in a $385 million decrease in cash flows from operating activities in 2024 compared to 2023 and a $488 million increase in cash flows from operating activities in 2023 compared to 2022. As discussed in Note A — “Accounting Policies — Managed Investment Entities” to the financial statements, AFG has no right to use the CLO assets and no obligation to pay the CLO liabilities and such assets and liabilities are shown separately in AFG’s Balance Sheet. Excluding the impact of the managed investment entities, net cash provided by operating activities was $1.23 billion, $1.67 billion and $1.34 billion in 2024, 2023 and 2022, respectively.
Net Cash Provided by (Used in) Investing Activities AFG’s investing activities consist primarily of the investment of funds provided by its property and casualty businesses. Investing activities also include the purchase and disposal of managed investment entity investments, which are presented separately in AFG’s Balance Sheet. Net investment activity in the managed investment entities was a $377 million source of cash in 2024 compared to $762 million in 2023, resulting in a $385 million decrease in net cash provided by investing activities in 2024 compared to 2023. See Note A — “Accounting Policies — Managed Investment Entities” and Note G — “Managed Investment Entities” to the financial statements. Investing activities for 2024 include the fourth quarter acquisitions of an insurance agency and a consulting business for $9 million in cash. Investing activities for 2023 include the July 2023 acquisition of Crop Risk Services (“CRS”) for $234 million in cash. Excluding these acquisitions and the activity of the managed investment entities, investing activities resulted in uses of cash of $273 million in 2024 and $114 million in 2023.
Net cash provided by investing activities was $414 million in 2023 compared to net cash used by investing activities of $1.05 billion in 2022, an increase in cash provided by investing activities of $1.47 billion. Net investment activity in the managed investment entities was a $762 million source of cash in 2023 compared to a $180 million use of cash in 2022, resulting in a $942 million increase in net cash provided by investing activities in 2023 compared to 2022. Excluding the acquisition of CRS in 2023 and the activity of the managed investment entities, investing activities resulted in uses of cash of $114 million in 2023 and $871 million in 2022, reflecting the opportunistic investment of cash on hand in the property and casualty operations during the rising interest rate environment in 2022.
Net Cash Used In Financing Activities AFG’s financing activities consist primarily of issuances and retirements of long-term debt, issuances and repurchases of common stock and dividend payments. Net cash used in financing activities was $1.07 billion in 2024 compared to $2.03 billion in 2023, a decrease of $965 million. AFG paid cash dividends totaling $788 million in 2024 compared to $684 million in 2023, resulting in a $104 million increase in net cash used in financing activities in 2024 compared to 2023. There were no debt retirements in 2024 compared to $21 million in debt retirements in 2023. In 2024, AFG did not repurchase any of its Common Stock compared to repurchases of $213 million in 2023. Financing activities also include issuances and retirements of managed investment entity liabilities, which are nonrecourse to AFG and presented separately in AFG’s Balance Sheet. Retirements of managed investment entity liabilities exceeded issuances by $295 million in 2024 compared to $1.13 billion in 2023, resulting in an $833 million decrease in net cash used in financing activities in 2024 compared to 2023.
See Note A — “Accounting Policies — Managed Investment Entities” and Note G — “Managed Investment Entities” to the financial statements.
Net cash used in financing activities was $2.03 billion in 2023 compared to $1.36 billion in 2022, an increase of $670 million. Debt retirements were a $21 million use of cash in 2023 compared to $477 million in 2022, a decrease of $456 million. In 2023, AFG repurchased $213 million of its Common Stock compared to $11 million in 2022, resulting in a $202 million increase in net cash used in financing activities in 2023 compared to 2022. AFG paid cash dividends totaling $684 million in 2023 compared to $1.21 billion in 2022, resulting in a $529 million decrease in net cash used in financing activities in 2023 compared to 2022. Retirements of managed investment entity liabilities exceeded issuances by $1.13 billion in 2023 compared to issuances exceeding retirements by $324 million in 2022, resulting in a $1.45 billion increase in net cash used in financing activities in 2023 compared to 2022.
Parent and Subsidiary Liquidity
Parent Holding Company Liquidity Management believes AFG has sufficient resources to meet its liquidity requirements. If funds generated from operations, including dividends, tax payments and borrowings from subsidiaries, are insufficient to meet fixed charges in any period, AFG would be required to utilize parent company cash and investments or to generate cash through borrowings, sales of other assets, or similar transactions.
AFG’s operations continue to generate significant excess capital for future returns of capital to shareholders in the form of regular and special cash dividends and through opportunistic share repurchases or to be deployed into its property and casualty businesses as management identifies the potential for profitable organic growth, and opportunities to expand through acquisitions of established businesses or start-ups that meet target return thresholds.
During 2024, AFG paid special cash dividends totaling $545 million ($2.50 per share in February and $4.00 per share in November).
During 2023, AFG repurchased 1,872,544 shares of its Common Stock for $213 million and paid special cash dividends totaling $466 million ($4.00 per share in February and $1.50 per share in November).
AFG may, at any time and from time to time, seek to retire or purchase its outstanding debt through cash purchases or exchanges for equity or debt, in open-market purchases, privately negotiated transactions or otherwise. Such repurchases or exchanges, if any, will be upon such terms and at such prices as management may determine, and will depend on prevailing market conditions, AFG’s liquidity requirements, contractual restrictions and other factors. During 2023, AFG repurchased $23 million principal amount of its senior notes for $21 million cash.
During 2022, AFG repurchased 89,368 shares of its Common Stock for $11 million and paid special cash dividends totaling $1.02 billion ($2.00 per share in March, $8.00 per share in May and $2.00 per share in November). In 2022, AFG repurchased $472 million principal amount of its senior notes for $477 million cash.
All debentures and notes issued by AFG are rated investment grade by two nationally recognized rating agencies. AFG maintains a shelf registration statement under which it can offer additional equity or debt securities. The shelf registration provides AFG with flexibility to access the capital markets from time to time as market and other conditions permit.
At December 31, 2024, AFG (parent) held approximately $389 million in cash and investments. Management believes that AFG’s cash balances are held at stable banking institutions, although the amounts of many of these deposits are in excess of federally insured balances. AFG can borrow up to $450 million under its revolving credit facility, which expires in June 2028. Amounts borrowed under this agreement bear interest at rates ranging from 1.00% to 1.75% (based on AFG’s credit rating, currently 1.25%) over a SOFR-based floating rate. There were no borrowings under AFG’s credit facility, or under any other parent company short-term borrowing arrangements, during 2024 or 2023.
Under a tax allocation agreement with AFG, all 80% (or more) owned U.S. subsidiaries generally pay taxes to (or recover taxes from) AFG based on each subsidiary’s contribution to amounts due under AFG’s consolidated tax return.
Subsidiary Liquidity The liquidity requirements of AFG’s insurance subsidiaries relate primarily to the policyholder claims and underwriting expenses and payments of dividends and taxes to AFG. Historically, cash flows from premiums and investment income have generally provided more than sufficient funds to meet these requirements. Funds received in excess of cash requirements are generally invested in marketable securities. In addition, the insurance subsidiaries generally hold a significant amount of highly liquid, short duration investments.
For statutory accounting purposes, equity securities of non-affiliates are generally carried at fair value. At December 31, 2024, AFG’s insurance companies owned equity securities with a fair value of $751 million. Decreases in market prices could adversely affect the insurance group’s capital, potentially impacting the amount of dividends available or necessitating a capital contribution. Conversely, increases in market prices could have a favorable impact on the group’s dividend-paying capability.
Property and casualty reserves for unpaid losses and loss adjustment expenses were $14.18 billion at December 31, 2024 and include case reserves and claims incurred but not reported (“IBNR”). The ultimate amount to be paid to settle reserves is an estimate, subject to significant uncertainty. Actual payments to settle claims cannot be determined until a settlement is reached with the claimant. Final claim settlements may vary significantly from estimated amounts. See “Uncertainties — Property and Casualty Insurance Reserves” below. The timing of future payments for the next twelve months and beyond could vary materially from historical payment patterns due to, among other things, changes in claim reporting and payment patterns and large unanticipated settlements.
AFG believes its insurance subsidiaries maintain sufficient liquidity to pay claims and underwriting expenses. In addition, these subsidiaries have sufficient capital to meet commitments in the event of unforeseen reserve deficiencies, inadequate premium rates or reinsurer insolvencies. Management believes that the capital levels in AFG’s insurance subsidiaries are adequate to maintain its business and rating agency ratings. Nonetheless, changes in statutory accounting rules, changes in rating agency measures, significant declines in the fair value of the insurance subsidiaries’ investment portfolios or significant ratings downgrades on these investments, could create a need for additional capital.
Condensed Parent Only Cash Flows
AFG’s parent holding company only condensed cash flows from operating, investing and financing activities are shown below (in millions):
|
|
|
|
|
|
|
|
|
|
|
|
|
|
|
|
|
|
|
Year ended December 31, |
|
2024 |
|
2023 |
|
2022 |
| Net cash provided by operating activities |
$ |
712 |
|
|
$ |
719 |
|
|
$ |
327 |
|
| Net cash provided by investing activities |
72 |
|
|
225 |
|
|
992 |
|
| Net cash used in financing activities |
(769) |
|
|
(901) |
|
|
(1,683) |
|
| Net change in cash and cash equivalents |
$ |
15 |
|
|
$ |
43 |
|
|
$ |
(364) |
|
Parent Net Cash Provided by Operating Activities Parent holding company cash flows from operating activities consist primarily of dividends and tax payments received from AFG’s insurance subsidiaries, reduced by tax payments to the IRS and holding company interest and other expenses. Parent holding company net cash provided by operating activities was $712 million in 2024 compared to $719 million in 2023 and $327 million in 2022. The $7 million decrease in net cash provided by operating activities in 2024 as compared to 2023 and the $392 million increase in net cash provided by operating activities in 2023 as compared to 2022 were due primarily to higher cash dividends received from subsidiaries in 2023 compared to the other periods.
Parent Net Cash Provided by Investing Activities Parent holding company investing activities consist of capital contributions to and returns of capital from subsidiaries and parent company investment activity. Parent holding company net cash provided by investing activities was $72 million in 2024, $225 million in 2023 and $992 million in 2022. The $153 million decrease in net cash provided by investing activities in 2024 as compared to 2023 was due primarily to lower balances of invested assets. The $767 million decrease in net cash provided by investing activities in 2023 as compared to 2022 was due to the increase in capital contributions to subsidiaries to fund the purchase of CRS in July 2023 and lower balances of invested assets.
Parent Net Cash Used in Financing Activities Parent company financing activities consist primarily of the issuance and retirement of long-term debt, repurchases of AFG Common Stock, dividends to shareholders, and, to a lesser extent, proceeds from employee stock option exercises. Significant long-term debt and common stock transactions are discussed above under “Parent Holding Company Liquidity.” Parent holding company net cash used in financing activities was $769 million in 2024 compared to $901 million in 2023 and $1.68 billion in 2022. The $132 million decrease in net cash used in financing activities in 2024 as compared to 2023 reflects no repurchases of common stock in 2024 compared to repurchases of common stock of $213 million in 2023, partially offset by higher dividends paid to shareholders (due primarily to special dividends of $6.50 per share in 2024 compared to special dividends of $5.50 per share in 2023). The $782 million decrease in net cash used in financing activities in 2023 as compared to 2022 reflects lower dividends paid to shareholders (due primarily to special dividends of $5.50 per share in 2023 compared to special dividends of $12.00 per share in 2022) and lower net retirements of long-term debt in 2023 compared to 2022.
Off-Balance Sheet Arrangements
See Note O — “Additional Information — Financial Instruments — Unfunded Commitments” to the financial statements.
Investments
AFG attempts to optimize investment income while building the value of its portfolio, placing emphasis upon total long-term performance.
AFG’s investment portfolio at December 31, 2024, contained $10.40 billion in fixed maturity securities classified as available for sale and carried at fair value with unrealized gains and losses included in accumulated other comprehensive income (loss) and $76 million in fixed maturities classified as trading with holding gains and losses included in net investment income. In addition, AFG’s investment portfolio includes $522 million in equity securities carried at fair value with holding gains and losses included in realized gains (losses) on securities and $229 million in equity securities carried at fair value with holding gains and losses included in net investment income. AFG’s investment portfolio also includes $2.28 billion in investments accounted for using the equity method (limited partnerships and similar investments). Under the equity method, AFG records its share of the earnings or losses of the investee based on when it is reported by the investee in its financial statements rather than in the period in which the investee declares a dividend. AFG’s share of the earnings or losses from equity method investments is included in net investment income and is generally recorded on a quarter lag due to the timing of the receipt of the investee’s financial statements.
Unrealized gains and losses on AFG’s fixed maturity securities are included in shareholders’ equity after adjustments for deferred income taxes.
Fixed income investment funds are generally invested in securities with intermediate-term maturities with an objective of optimizing total return while allowing flexibility to react to changes in market conditions. At December 31, 2024, the average life of AFG’s fixed maturities was about 4.2 years.
Fair values for AFG’s portfolio are determined by AFG’s internal investment professionals using data from nationally recognized pricing services, non-binding broker quotes and other market information. Fair values of equity securities are determined by published closing prices when available. For AFG’s fixed maturity portfolio, approximately 88% was priced using pricing services at December 31, 2024 and 4% was priced using non-binding broker quotes. When prices obtained for the same security vary, AFG’s internal investment professionals select the price they believe is most indicative of an exit price. For additional information on determination of fair value, see Note D — “Fair Value Measurements” to the financial statements.
The pricing services use a variety of observable inputs to estimate fair value of fixed maturities that do not trade on a daily basis. Based upon information provided by the pricing services, these inputs include, but are not limited to, recent reported trades, benchmark yields, issuer spreads, bids or offers, reference data, and measures of volatility. Included in the pricing of mortgage-backed securities (“MBS”) are estimates of the rate of future prepayments and defaults of principal over the remaining life of the underlying collateral. Due to the lack of transparency in the process that brokers use to develop prices, valuations that are based on brokers’ prices are classified as Level 3 in the GAAP hierarchy unless the price can be corroborated, for example, by comparison to similar securities priced using observable inputs.
Valuation techniques utilized by pricing services and prices obtained from external sources are reviewed by AFG’s internal investment professionals who are familiar with the securities being priced and the markets in which they trade to ensure the fair value determination is representative of an exit price. To validate the appropriateness of the prices obtained, these investment managers consider widely published indices (as benchmarks), recent trades, changes in interest rates, general economic conditions and the credit quality of the specific issuers. In addition, AFG communicates directly with pricing services regarding the methods and assumptions used in pricing, including verifying, on a test basis, the inputs used by the services to value specific securities.
In general, the fair value of AFG’s fixed maturity investments is inversely correlated to changes in interest rates. The following table demonstrates the sensitivity of such fair values to reasonably likely changes in interest rates by illustrating the estimated effect on AFG’s fixed maturity portfolio that an immediate increase of 100 basis points in the interest rate yield curve would have had at December 31, 2024 (dollars in millions). Effects of increases or decreases from the 100 basis points illustrated would be approximately proportional.
|
|
|
|
|
|
| Fair value of fixed maturity portfolio |
$ |
10,474 |
|
| Percentage impact on fair value of 100 bps increase in interest rates |
(3.0 |
%) |
| Pretax impact on fair value of fixed maturity portfolio |
$ |
(314) |
|
Approximately 94% of the fixed maturities held by AFG at December 31, 2024, were rated “investment grade” (credit rating of AAA to BBB) by nationally recognized rating agencies, 3% were rated “non-investment grade” and 3% were not rated. Investment grade securities generally bear lower yields and lower degrees of risk than those that are unrated and non-investment grade. Management believes that the high-quality investment portfolio should generate a stable and predictable investment return.
AFG has approximately $75 million of direct exposure to office commercial real estate through property ownership, mortgages or equity method investments. AFG’s fixed maturity portfolio includes securities (the majority of which are AAA-rated) with a carrying value of approximately $450 million that have minimal exposure to office commercial real estate.
Summarized information for the unrealized gains and losses recorded in AFG’s Balance Sheet at December 31, 2024, is shown in the following table (dollars in millions). Approximately $345 million of available for sale fixed maturity securities had no unrealized gains or losses at December 31, 2024.
|
|
|
|
|
|
|
|
|
|
|
|
|
Securities
With
Unrealized
Gains |
|
Securities
With
Unrealized
Losses |
| Available for Sale Fixed Maturities |
|
|
|
| Fair value of securities |
$ |
4,119 |
|
|
$ |
5,934 |
|
| Amortized cost of securities, net of allowance for expected credit losses |
$ |
4,021 |
|
|
$ |
6,287 |
|
| Gross unrealized gain (loss) |
$ |
98 |
|
|
$ |
(353) |
|
| Fair value as % of amortized cost |
102 |
% |
|
94 |
% |
| Number of security positions |
750 |
|
|
1,340 |
|
| Number individually exceeding $2 million gain or loss |
1 |
|
|
35 |
|
| Concentration of gains (losses) by type or industry (exceeding 5% of unrealized): |
|
|
|
| Mortgage-backed securities |
$ |
22 |
|
|
$ |
(154) |
|
| Other asset-backed securities |
19 |
|
|
(69) |
|
| Banking |
10 |
|
|
(13) |
|
| Collateralized loan obligations |
10 |
|
|
(12) |
|
| Asset managers |
8 |
|
|
(15) |
|
| States and municipalities |
3 |
|
|
(49) |
|
|
|
|
|
|
|
|
|
|
|
|
|
| Percentage rated investment grade |
94 |
% |
|
97 |
% |
The table below sets forth the scheduled maturities of AFG’s available for sale fixed maturity securities at December 31, 2024, based on their fair values. Securities with sinking funds are reported at average maturity. Actual maturities may differ from contractual maturities because certain securities may be called or prepaid by the issuers.
|
|
|
|
|
|
|
|
|
|
|
|
|
Securities
With
Unrealized
Gains |
|
Securities
With
Unrealized
Losses |
| Maturity |
|
|
|
| One year or less |
1 |
% |
|
7 |
% |
| After one year through five years |
26 |
% |
|
25 |
% |
| After five years through ten years |
15 |
% |
|
11 |
% |
| After ten years |
1 |
% |
|
3 |
% |
|
43 |
% |
|
46 |
% |
Collateralized loan obligations and other asset-backed securities (average life of approximately 3 years) |
42 |
% |
|
30 |
% |
Mortgage-backed securities (average life of approximately 6 years) |
15 |
% |
|
24 |
% |
|
100 |
% |
|
100 |
% |
The table below (dollars in millions) summarizes the unrealized gains and losses on fixed maturity securities by dollar amount:
|
|
|
|
|
|
|
|
|
|
|
|
|
|
|
|
|
|
|
Aggregate
Fair
Value |
|
Aggregate
Unrealized
Gain (Loss) |
|
Fair
Value as
% of Cost |
| Fixed Maturities at December 31, 2024 |
|
|
|
|
|
| Securities with unrealized gains: |
|
|
|
|
|
Exceeding $500,000 (32 securities) |
$ |
520 |
|
|
$ |
29 |
|
|
106 |
% |
$500,000 or less (718 securities) |
3,599 |
|
|
69 |
|
|
102 |
% |
|
$ |
4,119 |
|
|
$ |
98 |
|
|
102 |
% |
| Securities with unrealized losses: |
|
|
|
|
|
Exceeding $500,000 (158 securities) |
$ |
1,857 |
|
|
$ |
(236) |
|
|
89 |
% |
$500,000 or less (1,182 securities) |
4,077 |
|
|
(117) |
|
|
97 |
% |
|
$ |
5,934 |
|
|
$ |
(353) |
|
|
94 |
% |
The following table (dollars in millions) summarizes the unrealized losses for all securities with unrealized losses by issuer quality and the length of time those securities have been in an unrealized loss position:
|
|
|
|
|
|
|
|
|
|
|
|
|
|
|
|
|
|
|
Aggregate
Fair
Value |
|
Aggregate
Unrealized
Loss |
|
Fair
Value as
% of Cost |
| Securities with Unrealized Losses at December 31, 2024 |
|
|
|
|
|
| Investment grade fixed maturities with losses for: |
|
|
|
|
|
Less than one year (311 securities) |
$ |
1,732 |
|
|
$ |
(22) |
|
|
99 |
% |
One year or longer (861 securities) |
4,014 |
|
|
(317) |
|
|
93 |
% |
|
$ |
5,746 |
|
|
$ |
(339) |
|
|
94 |
% |
| Non-investment grade fixed maturities with losses for: |
|
|
|
|
|
Less than one year (39 securities) |
$ |
46 |
|
|
$ |
(3) |
|
|
94 |
% |
One year or longer (129 securities) |
142 |
|
|
(11) |
|
|
93 |
% |
|
$ |
188 |
|
|
$ |
(14) |
|
|
93 |
% |
To evaluate fixed maturities for expected credit losses (impairment), management considers the following:
(a)whether the unrealized loss is credit-driven or a result of changes in market interest rates,
(b)the extent to which fair value is less than cost basis,
(c)cash flow projections received from independent sources,
(d)historical operating, balance sheet and cash flow data contained in issuer SEC filings and news releases,
(e)near-term prospects for improvement in the issuer and/or its industry,
(f)third-party research and communications with industry specialists,
(g)financial models and forecasts,
(h)the continuity of interest payments, maintenance of investment grade ratings and hybrid nature of certain investments,
(i)discussions with issuer management, and
(j)ability and intent to hold the investment for a period of time sufficient to allow for anticipated recovery in fair value.
Based on its analysis of the factors listed above, management believes AFG will recover its cost basis (net of any allowance) in the fixed maturity securities with unrealized losses and that AFG has the ability to hold the securities until they recover in value and had no intent to sell them at December 31, 2024. Although AFG has the ability to continue holding its fixed maturity investments with unrealized losses, its intent to hold them may change due to deterioration in the issuers’ creditworthiness, decisions to lessen exposure to a particular issuer or industry, asset/liability management decisions, market movements, changes in views about appropriate asset allocation or the desire to offset taxable realized gains. Should AFG’s ability or intent change regarding a particular security, a charge for impairment would likely be required. While it is not possible to accurately predict if or when a specific security will become impaired, increases in the allowance for credit losses could be material to results of operations in future periods. Significant declines in the fair value of AFG’s investment portfolio could have a significant adverse effect on AFG’s liquidity. For information on AFG’s realized gains (losses) on securities, see “Results of Operations — Realized Gains (Losses) on Securities.”
Uncertainties
As more fully explained in the following paragraphs, management believes that the areas posing the greatest risk of material loss are the adequacy of its insurance reserves and contingencies arising out of its former railroad and manufacturing operations.
Property and Casualty Insurance Reserves Estimating the liability for unpaid losses and loss adjustment expenses (“LAE”) is inherently judgmental and is influenced by factors that are subject to significant variation. Determining the liability is a complex process incorporating input from many areas of the Company including actuarial, underwriting, pricing, claims and operations management.
The estimates of liabilities for unpaid claims and for expenses of investigation and adjustment of unpaid claims are based upon: (i) the accumulation of case estimates for losses reported prior to the close of the accounting periods on direct business written (“case reserves”); (ii) estimates received from ceding reinsurers and insurance pools and associations; (iii) estimates of claims incurred but not reported (including possible development on known claims); (iv) estimates (based on experience) of expense for investigating and adjusting claims; and (v) the current state of law and coverage litigation.
The process used to determine the total reserve for liabilities involves estimating the ultimate incurred losses and LAE, adjusted for amounts already paid on the claims. The IBNR reserve is derived by estimating the ultimate unpaid reserve liability and subtracting case reserves for loss and LAE. See Note N — “Insurance — Insurance Reserves” to the financial statements for a discussion of the factors considered and actuarial methods used in determining management’s best estimate of the ultimate liability for unpaid losses and LAE.
The following table shows (in millions) the breakdown of AFG’s property and casualty insurance reserves between case reserves, IBNR reserves and LAE reserves (estimated amounts required to adjust, record and settle claims, other than the claim payments themselves) at December 31, 2024 and gross written premiums for the year ended December 31, 2024.
|
|
|
|
|
|
|
|
|
|
|
|
|
|
|
|
|
|
|
|
|
|
|
|
|
|
|
|
|
|
| |
Gross Loss Reserves |
|
|
| |
Case |
|
IBNR |
|
LAE |
|
Total
Reserves |
|
Gross Written Premiums |
| Statutory Line of Business |
|
|
|
|
|
|
|
|
|
| Other liability — occurrence |
$ |
986 |
|
|
$ |
3,839 |
|
|
$ |
795 |
|
|
$ |
5,620 |
|
|
$ |
1,828 |
|
| Workers’ compensation |
986 |
|
|
1,117 |
|
|
347 |
|
|
2,450 |
|
|
1,359 |
|
| Other liability — claims made |
315 |
|
|
721 |
|
|
444 |
|
|
1,480 |
|
|
806 |
|
| Commercial auto/truck liability/medical |
445 |
|
|
628 |
|
|
154 |
|
|
1,227 |
|
|
777 |
|
| Special property (fire, allied lines, inland marine, earthquake) |
714 |
|
|
235 |
|
|
35 |
|
|
984 |
|
|
2,990 |
|
| Products liability — occurrence |
107 |
|
|
283 |
|
|
180 |
|
|
570 |
|
|
239 |
|
| Commercial multi-peril |
201 |
|
|
134 |
|
|
86 |
|
|
421 |
|
|
470 |
|
| Other lines |
340 |
|
|
511 |
|
|
169 |
|
|
1,020 |
|
|
1,703 |
|
| Total Statutory |
4,094 |
|
|
7,468 |
|
|
2,210 |
|
|
13,772 |
|
|
10,172 |
|
| Adjustments for GAAP: |
|
|
|
|
|
|
|
|
|
| Foreign operations |
184 |
|
|
173 |
|
|
46 |
|
|
403 |
|
|
370 |
|
| Deferred gains on retroactive reinsurance |
— |
|
|
9 |
|
|
— |
|
|
9 |
|
|
— |
|
| Loss reserve discounting |
(5) |
|
|
— |
|
|
— |
|
|
(5) |
|
|
— |
|
| Other |
— |
|
|
— |
|
|
— |
|
|
— |
|
|
(9) |
|
| Total Adjustments for GAAP |
179 |
|
|
182 |
|
|
46 |
|
|
407 |
|
|
361 |
|
| Total GAAP Reserves and Premiums |
$ |
4,273 |
|
|
$ |
7,650 |
|
|
$ |
2,256 |
|
|
$ |
14,179 |
|
|
$ |
10,533 |
|
While current factors and reasonably likely changes in variable factors are considered in estimating the liability for unpaid losses and LAE, there is no method or system that can eliminate the risk of actual ultimate results differing from such estimates.
Following is a discussion of certain critical variables affecting the estimation of loss reserves of the more significant long-tail lines of business (asbestos and environmental liabilities are separately discussed below). Many other variables may also impact ultimate claim costs.
An important assumption underlying reserve estimates is that the cost trends implicitly built into development patterns will continue into the future. However, future results could vary due to an unexpected change in the underlying cost trends. This unexpected change could arise from a variety of sources including a general increase in economic inflation, social inflation, new medical technologies, or other factors such as those listed below in connection with AFG’s largest lines of business.
It is not possible to isolate and measure the potential impact of just one of these variables, and future cost trends could be partially impacted by several such variables. However, it is reasonable to address the sensitivity of the reserves to potential impact from changes in these variables by measuring the effect of a possible overall 1% change in future cost trends that may be caused by one or more variables. Utilizing the effect of a 1% change in overall cost trends enables changes greater than 1% to be estimated by extrapolation. Each additional 1% change in the cost trend would increase the effect on net earnings by an amount slightly (about 5%) greater than the effect of the previous 1%. For example, if a 1% change in cost trends in a line of business would change net earnings by $20 million, a 2% change would change net earnings by approximately $41 million.
The estimated cumulative adverse impact that a 1% change in cost trends in AFG’s more significant long-tail lines of property and casualty business (exceeding 5% of total reserves) would have on net earnings is shown below (in millions).
|
|
|
|
|
|
|
Effect of 1%
Change in
Cost Trends |
Line of business |
|
| Other liability — occurrence |
$ |
78 |
|
| Workers’ compensation |
69 |
|
| Other liability — claims made |
30 |
|
| Commercial auto/truck liability/medical |
18 |
|
The judgments and uncertainties surrounding management’s reserve estimation process and the potential for reasonably possible variability in management’s most recent reserve estimates may also be viewed by looking at how recent historical estimates of reserves have developed. The following table shows (dollars in millions) what the impact on AFG’s net earnings would be on the more significant lines of business if the December 31, 2024, reserves (net of reinsurance) were to develop at the same rate as the average development of the most recent five years.
|
|
|
|
|
|
|
|
|
|
|
|
|
|
|
|
|
|
|
5-yr. Average
Development (a)(b) |
|
Net Reserves (b) December 31, 2024 |
|
Effect on Net
Earnings (a)(b) |
| Other liability — occurrence |
4.8 |
% |
|
$ |
2,382 |
|
|
$ |
115 |
|
| Workers’ compensation |
(5.7 |
%) |
|
2,080 |
|
|
(118) |
|
| Other liability — claims made |
(2.2 |
%) |
|
1,024 |
|
|
(23) |
|
| Commercial auto/truck liability/medical |
2.2 |
% |
|
892 |
|
|
20 |
|
(a)Adverse (favorable), net of tax effect.
(b)Excludes asbestos and environmental liabilities.
The following discussion describes key assumptions and important variables that affect the estimate of the reserve for loss and LAE of the more significant lines of business and explains what caused them to change from assumptions used in the preceding period.
Other Liability — Occurrence
This long-tail line of business consists of coverages protecting the insured against legal liability resulting from negligence, carelessness, or a failure to act causing property damage or personal injury to others. Some of the important variables affecting estimation of loss reserves for other liability — occurrence include:
•Litigious climate
•Unpredictability of judicial decisions regarding coverage issues
•Magnitude of jury awards
•Outside counsel costs
•Timing of claims reporting
AFG recorded adverse prior year reserve development of $210 million in 2024, $96 million in 2023 and $109 million in 2022 related to its other liability — occurrence coverage due primarily to continued claim severity increases in excess and umbrella liability coverages.
While management applies the actuarial methods discussed in Note N — “Insurance — Insurance Reserves” to the financial statements, more judgment is involved in arriving at the final reserve to be held. For recent accident years, more weight is given to the Bornhuetter-Ferguson method.
Workers’ Compensation
This long-tail line of business provides coverage to employees who may be injured in the course of employment. Some of the important variables affecting estimation of loss reserves for workers’ compensation include:
•Legislative actions and regulatory and legal interpretations
•Future medical cost inflation
•Economic conditions
•Frequency of reopening claims previously closed
•Advances in medical equipment and processes
•Pace and intensity of employee rehabilitation
•Changes in the use of pharmaceutical drugs
•Changes in mortality trends for permanently injured workers
Approximately 23% and 24% of AFG’s workers’ compensation reserves at December 31, 2024 relate to policies written in Florida and California, respectively.
AFG recorded favorable prior year reserve development of $128 million in 2024, $116 million in 2023 and $189 million in 2022, related to its workers’ compensation coverage due to lower than anticipated medical severity.
Other Liability — Claims Made
This long-tail line of business consists mostly of directors’ and officers’ liability (“D&O”). Some of the important variables affecting estimation of loss reserves for other liability — claims made include:
•Litigious climate
•Economic conditions
•Variability of stock prices
•Magnitude of jury awards
The general state of the economy and the variability of the stock price of the insured can affect the frequency and severity of shareholder class action suits and other situations that trigger coverage under D&O policies. For example, from 2008 to 2010, economic conditions led to higher frequency of claims, particularly in the D&O policies for small account and not-for-profit organizations. After peaking in 2010, claim frequency decreased and stabilized to near pre-2008 levels until dropping sharply during the pandemic-related shutdowns. Post-pandemic, frequency has increased slightly but has not rebounded to pre-pandemic levels.
AFG recorded favorable prior year reserve development of $15 million in 2024, $33 million in 2023 and $24 million in 2022 on its D&O business as claim frequency and severity were less than expected across several prior accident years.
Commercial Auto/Truck Liability/Medical
This line of business is a mix of coverage protecting the insured against legal liability for property damage or personal injury to others arising from the operation of commercial motor vehicles. The property damage liability exposure is usually short-tail with relatively prompt reporting and settlement of claims. The bodily injury and medical payments exposures are longer-tailed; although the claim reporting is relatively prompt, the final settlement can take longer to achieve. Some of the important variables affecting estimation of loss reserves for commercial auto/truck liability/medical are similar to other liability — occurrence and include:
•Magnitude of jury awards
•Unpredictability of judicial decisions regarding coverage issues
•Litigious climate and trends
•Change in frequency of severe accidents
•Health care costs and utilization of medical services by injured parties
AFG recorded adverse prior year reserve development of $36 million in 2024, $29 million in 2023 and $32 million in 2022 for this line of business due to higher than anticipated claim severity.
Recoverables from Reinsurers and Availability of Reinsurance AFG is subject to credit risk with respect to its reinsurers, as reinsurance contracts do not relieve AFG of its liability to policyholders. To mitigate this risk, substantially all reinsurance is ceded to companies rated “A” or better by S&P or is secured by “funds withheld” or other collateral.
The availability and cost of reinsurance are subject to prevailing market conditions, which are beyond AFG’s control and which may affect AFG’s level of business and profitability. Although the cost of certain reinsurance programs may increase, management believes that AFG will be able to maintain adequate reinsurance coverage at acceptable rates without a material adverse effect on AFG’s results of operations.
AFG’s gross and net combined ratios are shown in the table below.
See Item 1 — Business — “Property and Casualty Insurance Segment — Reinsurance” for more information on AFG’s reinsurance programs. For additional information on the effect of reinsurance on AFG’s historical results of operations see Note N — “Insurance — Reinsurance” to the financial statements.
The following table illustrates the effect that purchasing property and casualty reinsurance has had on AFG’s combined ratio over the last three years.
|
|
|
|
|
|
|
|
|
|
|
|
|
|
|
|
|
|
|
2024 |
|
2023 |
|
2022 |
| Before reinsurance (gross) |
98.2 |
% |
|
92.8 |
% |
|
90.9 |
% |
| Effect of reinsurance |
(7.0 |
%) |
|
(2.4 |
%) |
|
(3.6 |
%) |
| Actual (net of reinsurance) |
91.2 |
% |
|
90.4 |
% |
|
87.3 |
% |
Asbestos and Environmental-related (“A&E”) Insurance Reserves Asbestos and environmental reserves of the property and casualty group consisted of the following (in millions):
|
|
|
|
|
|
|
|
|
|
|
|
| |
December 31, |
| |
2024 |
|
2023 |
| Asbestos |
$ |
197 |
|
|
$ |
202 |
|
| Environmental |
162 |
|
|
168 |
|
| A&E reserves, net of reinsurance recoverable |
359 |
|
|
370 |
|
| Reinsurance recoverable, net of allowance |
135 |
|
|
128 |
|
| Gross A&E reserves |
$ |
494 |
|
|
$ |
498 |
|
Asbestos reserves include claims asserting alleged injuries and damages from exposure to asbestos. Environmental reserves include claims relating to polluted sites.
Asbestos claims against manufacturers, distributors or installers of asbestos products were presented under the products liability section of their policies, which typically had aggregate limits that capped an insurer’s liability. In addition, asbestos claims are being presented as “non-products” claims, such as those by installers of asbestos products and by property owners or operators who allegedly had asbestos on their property, under the premises or operations section of their policies. Unlike products exposures, these non-products exposures typically had no aggregate limits, creating greater exposure for insurers. Further, in an effort to seek additional insurance coverage, some insureds with installation activities who have substantially eroded their products coverage are presenting new asbestos claims as non-products operations claims or attempting to reclassify previously settled products claims as non-products claims to restore a portion of previously exhausted products aggregate limits.
Approximately 48% of AFG’s net asbestos reserves relate to policies written directly by AFG subsidiaries. Claims from these policies generally are product-oriented claims with only a limited amount of non-products exposures and are dominated by small to mid-sized commercial entities that are mostly regional policyholders with few national target defendants. The remainder is assumed reinsurance business that includes exposures from 1954 to 1983. The asbestos and environmental assumed claims are ceded by various insurance companies under reinsurance treaties. A majority of the individual assumed claims have exposures of less than $100,000 to AFG. Asbestos losses assumed include some of the industry known manufacturers, distributors and installers. Pollution losses include industry known insured names and sites.
Establishing reserves for A&E claims relating to policies and participations in reinsurance treaties and former operations is subject to uncertainties that are significantly greater than those presented by other types of claims. For this group of claims, traditional actuarial techniques that rely on historical loss development trends cannot be used and a range of reasonably possible losses cannot be estimated. Case reserves and expense reserves are established by the claims department as specific policies are identified. In addition to the case reserves established for known claims, management establishes additional reserves for claims not yet known or reported and for possible development on known claims. These additional reserves are management’s best estimate based on periodic comprehensive studies and internal reviews adjusted for payments and identifiable changes, supplemented by management’s review of industry information about such claims, with due consideration to individual claim situations.
Management believes that estimating the ultimate liability for asbestos claims presents a unique and difficult challenge to the insurance industry due to, among other things, difficulty in predicting the number of future claims, inconsistent court decisions, an increase in bankruptcy filings as a result of asbestos-related liabilities, unresolved issues such as whether coverage exists, novel theories of coverage, how claims are to be allocated among triggered policies and implicated years, whether claimants who exhibit no signs of illness will be successful in pursuing their claims and judicial interpretations that often expand theories of recovery and broaden the scope of coverage. Environmental claims likewise present challenges in prediction, due to uncertainty regarding the interpretation of insurance policies, complexities regarding multi-party involvements at sites, evolving cleanup standards and protracted time periods required to assess the level of cleanup required at contaminated sites.
While management believes that AFG’s reserves for A&E claims are a reasonable estimate of ultimate liability for such claims, actual results may vary materially from the amounts currently recorded due to the factors listed above. A 1% variation in loss cost trends, caused by any of the factors previously described, would change net earnings by approximately $28 million.
The following factors could impact AFG’s A&E reserves and payments:
•There is interest at the state level to attempt to legislatively address asbestos liabilities and the manner in which asbestos claims are resolved. These developments are fluid and could result in piecemeal state-by-state solutions.
•The manner by which bankruptcy courts are addressing asbestos liabilities is in flux.
•AFG’s insureds may make claims alleging significant non-products exposures.
AFG tracks its A&E claims by policyholder. The following table shows, by type of claim, the number of policyholders that did not receive any payments in the calendar year separate from policyholders that did receive a payment. Policyholder counts represent policies written by AFG subsidiaries and do not include assumed reinsurance.
|
|
|
|
|
|
|
|
|
|
|
|
|
|
|
|
|
|
|
2024 |
|
2023 |
|
2022 |
| Number of policyholders with no indemnity payments: |
|
|
|
|
|
| Asbestos |
85 |
|
|
107 |
|
|
103 |
|
| Environmental |
159 |
|
|
137 |
|
|
129 |
|
|
244 |
|
|
244 |
|
|
232 |
|
| Number of policyholders with indemnity payments: |
|
|
|
|
|
| Asbestos |
51 |
|
|
47 |
|
|
45 |
|
| Environmental |
18 |
|
|
23 |
|
|
25 |
|
|
69 |
|
|
70 |
|
|
70 |
|
| Total |
313 |
|
|
314 |
|
|
302 |
|
Amounts paid (net of reinsurance recoveries) for asbestos and environmental claims, including LAE, were as follows (in millions):
|
|
|
|
|
|
|
|
|
|
|
|
|
|
|
|
|
|
|
2024 |
|
2023 |
|
2022 |
| Asbestos |
$ |
6 |
|
|
$ |
13 |
|
|
$ |
12 |
|
| Environmental |
5 |
|
|
2 |
|
|
11 |
|
| Total |
$ |
11 |
|
|
$ |
15 |
|
|
$ |
23 |
|
The survival ratio is a measure often used by industry analysts to compare A&E reserves’ strength among companies. This ratio is typically calculated by dividing reserves for A&E exposures by the three-year average of paid losses, and therefore measures the number of years that it would take to pay off current reserves based on recent average payments. Because this ratio can be significantly impacted by a number of factors such as loss payout variability, caution should be exercised in attempting to determine reserve adequacy based simply on the survival ratio. At December 31, 2024, the property and casualty insurance segment’s three-year survival ratios compare favorably with industry survival ratios published by A.M. Best (as of December 31, 2023, and adjusted for several large portfolio transfers) as detailed in the following table:
|
|
|
|
|
|
|
|
|
|
|
|
|
|
|
|
|
|
|
Property and Casualty Insurance Reserves
Three-Year Survival Ratio (Times Paid Losses)
|
|
Asbestos |
|
Environmental |
|
Total A&E |
| AFG (12/31/2024) |
19.4 |
|
|
26.2 |
|
|
22.0 |
|
Industry (12/31/2023) |
8.7 |
|
|
7.5 |
|
|
8.4 |
|
During the third quarter of 2024, AFG completed an in-depth internal review of its asbestos and environmental exposures relating to the run-off operations of its property and casualty insurance segment. AFG annually conducts a comprehensive review of its asbestos and environmental reserves. In connection with these reviews, AFG engages with outside counsel and, as appropriate, engineering and consulting firms and specialty actuarial firms.
During the 2024 internal review, no new trends were identified and recent claims activity was generally consistent with AFG’s expectations resulting from its in-depth internal reviews in the prior three years, and the most recent external study in 2020. As a result, and consistent with the internal review in the third quarter of 2023, the 2024 review resulted in no net change to AFG’s property and casualty insurance segment’s asbestos and environmental reserves.
Contingencies related to Subsidiaries’ Former Operations The A&E reviews and external study discussed above also encompassed reserves for various environmental and occupational injury and disease claims and other contingencies arising out of the railroad operations disposed of by APU Consolidated’s predecessor and certain manufacturing operations disposed of by APU Consolidated and its subsidiaries and by Great American Financial Resources, Inc. AFG recorded pretax special non-core A&E charges of $14 million in 2024 and $15 million in 2023 to increase liabilities for those operations as a result of the internal reviews. Liabilities for claims and contingencies arising from these former railroad and manufacturing operations totaled $91 million at December 31, 2024. For a discussion of the uncertainties in determining the ultimate liability, see Note M — “Contingencies” to the financial statements.
MANAGED INVESTMENT ENTITIES
Accounting standards require AFG to consolidate its investments in collateralized loan obligation (“CLO”) entities that it manages and owns an interest in (in the form of debt). See Note A — “Accounting Policies — Managed Investment Entities” and Note G — “Managed Investment Entities” to the financial statements. The effect of consolidating these entities is shown in the tables below (in millions). The “Before CLO Consolidation” columns include AFG’s investment and earnings in the CLOs on an unconsolidated basis.
CONDENSED CONSOLIDATING BALANCE SHEET
|
|
|
|
|
|
|
|
|
|
|
|
|
|
|
|
|
|
|
|
|
|
|
|
|
|
|
|
|
|
|
Before CLO
Consolidation |
|
Managed
Investment
Entities |
|
Consol.
Entries |
|
|
|
Consolidated
As Reported |
| December 31, 2024 |
|
|
|
|
|
|
|
|
|
| Assets: |
|
|
|
|
|
|
|
|
|
| Cash and investments |
$ |
16,026 |
|
|
$ |
— |
|
|
$ |
(174) |
|
|
(*) |
|
$ |
15,852 |
|
| Assets of managed investment entities |
— |
|
|
4,140 |
|
|
— |
|
|
|
|
4,140 |
|
| Other assets |
10,845 |
|
|
— |
|
|
(1) |
|
|
(*) |
|
10,844 |
|
| Total assets |
$ |
26,871 |
|
|
$ |
4,140 |
|
|
$ |
(175) |
|
|
|
|
$ |
30,836 |
|
| Liabilities: |
|
|
|
|
|
|
|
|
|
Unpaid losses and loss adjustment expenses and unearned premiums |
$ |
17,763 |
|
|
$ |
— |
|
|
$ |
— |
|
|
|
|
$ |
17,763 |
|
| Liabilities of managed investment entities |
— |
|
|
4,091 |
|
|
(126) |
|
|
(*) |
|
3,965 |
|
| Long-term debt and other liabilities |
4,642 |
|
|
— |
|
|
— |
|
|
|
|
4,642 |
|
| Total liabilities |
22,405 |
|
|
4,091 |
|
|
(126) |
|
|
|
|
26,370 |
|
|
|
|
|
|
|
|
|
|
|
| Shareholders’ equity: |
|
|
|
|
|
|
|
|
|
| Common Stock and Capital surplus |
1,495 |
|
|
49 |
|
|
(49) |
|
|
|
|
1,495 |
|
| Retained earnings |
3,211 |
|
|
— |
|
|
— |
|
|
|
|
3,211 |
|
| Accumulated other comprehensive income (loss), net of tax |
(240) |
|
|
— |
|
|
— |
|
|
|
|
(240) |
|
| Total shareholders’ equity |
4,466 |
|
|
49 |
|
|
(49) |
|
|
|
|
4,466 |
|
| Total liabilities and shareholders’ equity |
$ |
26,871 |
|
|
$ |
4,140 |
|
|
$ |
(175) |
|
|
|
|
$ |
30,836 |
|
|
|
|
|
|
|
|
|
|
|
| December 31, 2023 |
|
|
|
|
|
|
|
|
|
| Assets: |
|
|
|
|
|
|
|
|
|
| Cash and investments |
$ |
15,438 |
|
|
$ |
— |
|
|
$ |
(175) |
|
|
(*) |
|
$ |
15,263 |
|
| Assets of managed investment entities |
— |
|
|
4,484 |
|
|
— |
|
|
|
|
4,484 |
|
| Other assets |
10,042 |
|
|
— |
|
|
(2) |
|
|
(*) |
|
10,040 |
|
| Total assets |
$ |
25,480 |
|
|
$ |
4,484 |
|
|
$ |
(177) |
|
|
|
|
$ |
29,787 |
|
| Liabilities: |
|
|
|
|
|
|
|
|
|
Unpaid losses and loss adjustment expenses and unearned premiums |
$ |
16,538 |
|
|
$ |
— |
|
|
$ |
— |
|
|
|
|
$ |
16,538 |
|
| Liabilities of managed investment entities |
— |
|
|
4,446 |
|
|
(139) |
|
|
(*) |
|
4,307 |
|
| Long-term debt and other liabilities |
4,684 |
|
|
— |
|
|
— |
|
|
|
|
4,684 |
|
| Total liabilities |
21,222 |
|
|
4,446 |
|
|
(139) |
|
|
|
|
25,529 |
|
|
|
|
|
|
|
|
|
|
|
| Shareholders’ equity: |
|
|
|
|
|
|
|
|
|
| Common Stock and Capital surplus |
1,456 |
|
|
38 |
|
|
(38) |
|
|
|
|
1,456 |
|
| Retained earnings |
3,121 |
|
|
— |
|
|
— |
|
|
|
|
3,121 |
|
| Accumulated other comprehensive income (loss), net of tax |
(319) |
|
|
— |
|
|
— |
|
|
|
|
(319) |
|
| Total shareholders’ equity |
4,258 |
|
|
38 |
|
|
(38) |
|
|
|
|
4,258 |
|
| Total liabilities and shareholders’ equity |
$ |
25,480 |
|
|
$ |
4,484 |
|
|
$ |
(177) |
|
|
|
|
$ |
29,787 |
|
(*)Elimination of the fair value of AFG’s investment in CLOs and related accrued interest.
CONDENSED CONSOLIDATING STATEMENT OF EARNINGS
|
|
|
|
|
|
|
|
|
|
|
|
|
|
|
|
|
|
|
|
|
|
|
|
|
|
|
|
|
|
|
Before CLO
Consolidation (a) |
|
Managed
Investment
Entities |
|
Consol.
Entries |
|
|
|
Consolidated
As Reported |
| Three months ended December 31, 2024 |
|
|
|
|
|
|
|
|
|
| Revenues: |
|
|
|
|
|
|
|
|
|
Net earned premiums |
$ |
1,850 |
|
|
$ |
— |
|
|
$ |
— |
|
|
|
|
$ |
1,850 |
|
| Net investment income |
202 |
|
|
— |
|
|
(8) |
|
|
(b) |
|
194 |
|
| Realized gains (losses) on securities |
(10) |
|
|
— |
|
|
— |
|
|
|
|
(10) |
|
| Income of managed investment entities: |
|
|
|
|
|
|
|
|
|
| Investment income |
— |
|
|
84 |
|
|
— |
|
|
|
|
84 |
|
| Gain (loss) on change in fair value of assets/liabilities |
— |
|
|
3 |
|
|
(4) |
|
|
(b) |
|
(1) |
|
| Other income |
36 |
|
|
— |
|
|
(4) |
|
|
(c) |
|
32 |
|
| Total revenues |
2,078 |
|
|
87 |
|
|
(16) |
|
|
|
|
2,149 |
|
| Costs and Expenses: |
|
|
|
|
|
|
|
|
|
| Insurance benefits and expenses |
1,661 |
|
|
— |
|
|
— |
|
|
|
|
1,661 |
|
| Expenses of managed investment entities |
— |
|
|
87 |
|
|
(16) |
|
|
(b)(c) |
|
71 |
|
| Interest charges on borrowed money and other expenses |
97 |
|
|
— |
|
|
— |
|
|
|
|
97 |
|
| Total costs and expenses |
1,758 |
|
|
87 |
|
|
(16) |
|
|
|
|
1,829 |
|
| Earnings before income taxes |
320 |
|
|
— |
|
|
— |
|
|
|
|
320 |
|
| Provision for income taxes |
65 |
|
|
— |
|
|
— |
|
|
|
|
65 |
|
| Net earnings |
$ |
255 |
|
|
$ |
— |
|
|
$ |
— |
|
|
|
|
$ |
255 |
|
|
|
|
|
|
|
|
|
|
|
| Three months ended December 31, 2023 |
|
|
|
|
|
|
|
|
|
| Revenues: |
|
|
|
|
|
|
|
|
|
Net earned premiums |
$ |
1,732 |
|
|
$ |
— |
|
|
$ |
— |
|
|
|
|
$ |
1,732 |
|
| Net investment income |
168 |
|
|
— |
|
|
(9) |
|
|
(b) |
|
159 |
|
| Realized gains (losses) on securities |
31 |
|
|
— |
|
|
— |
|
|
|
|
31 |
|
| Income of managed investment entities: |
|
|
|
|
|
|
|
|
|
| Investment income |
— |
|
|
100 |
|
|
— |
|
|
|
|
100 |
|
| Gain (loss) on change in fair value of assets/liabilities |
— |
|
|
17 |
|
|
(2) |
|
|
(b) |
|
15 |
|
| Other income |
50 |
|
|
— |
|
|
(4) |
|
|
(c) |
|
46 |
|
| Total revenues |
1,981 |
|
|
117 |
|
|
(15) |
|
|
|
|
2,083 |
|
| Costs and Expenses: |
|
|
|
|
|
|
|
|
|
| Insurance benefits and expenses |
1,549 |
|
|
— |
|
|
— |
|
|
|
|
1,549 |
|
| Expenses of managed investment entities |
— |
|
|
117 |
|
|
(15) |
|
|
(b)(c) |
|
102 |
|
| Interest charges on borrowed money and other expenses |
97 |
|
|
— |
|
|
— |
|
|
|
|
97 |
|
| Total costs and expenses |
1,646 |
|
|
117 |
|
|
(15) |
|
|
|
|
1,748 |
|
| Earnings before income taxes |
335 |
|
|
— |
|
|
— |
|
|
|
|
335 |
|
| Provision for income taxes |
72 |
|
|
— |
|
|
— |
|
|
|
|
72 |
|
| Net earnings |
$ |
263 |
|
|
$ |
— |
|
|
$ |
— |
|
|
|
|
$ |
263 |
|
(a)Includes income of $8 million in the fourth quarter of 2024 and $9 million in the fourth quarter of 2023, representing the change in fair value of AFG’s CLO investments and $4 million of income in both the fourth quarter of 2024 and 2023, in CLO management fees earned.
(b)Elimination of the change in fair value of AFG’s investments in the CLOs, including $12 million and $11 million in the fourth quarter of 2024 and 2023, respectively, in distributions recorded as interest expense by the CLOs.
(c)Elimination of management fees earned by AFG.
CONDENSED CONSOLIDATING STATEMENT OF EARNINGS - CONTINUED
|
|
|
|
|
|
|
|
|
|
|
|
|
|
|
|
|
|
|
|
|
|
|
|
|
|
|
|
|
|
|
Before
CLO
Consol. (a) |
|
Managed
Investment
Entities |
|
Consol.
Entries |
|
|
|
Consolidated
As Reported |
| Year ended December 31, 2024 |
|
|
|
|
|
|
|
|
|
| Revenues: |
|
|
|
|
|
|
|
|
|
Net earned premiums |
$ |
7,036 |
|
|
$ |
— |
|
|
$ |
— |
|
|
|
|
$ |
7,036 |
|
| Net investment income |
813 |
|
|
— |
|
|
(33) |
|
|
(b) |
|
780 |
|
Realized gains (losses) on securities |
— |
|
|
— |
|
|
— |
|
|
|
|
— |
|
| Income of managed investment entities: |
|
|
|
|
|
|
|
|
|
| Investment income |
— |
|
|
380 |
|
|
— |
|
|
|
|
380 |
|
| Gain (loss) on change in fair value of assets/liabilities |
— |
|
|
12 |
|
|
(8) |
|
|
(b) |
|
4 |
|
| Other income |
137 |
|
|
— |
|
|
(13) |
|
|
(c) |
|
124 |
|
| Total revenues |
7,986 |
|
|
392 |
|
|
(54) |
|
|
|
|
8,324 |
|
| Costs and Expenses: |
|
|
|
|
|
|
|
|
|
| Insurance benefits and expenses |
6,467 |
|
|
— |
|
|
— |
|
|
|
|
6,467 |
|
| Expenses of managed investment entities |
— |
|
|
388 |
|
|
(50) |
|
|
(b)(c) |
|
338 |
|
| Interest charges on borrowed money and other expenses |
395 |
|
|
— |
|
|
— |
|
|
|
|
395 |
|
| Total costs and expenses |
6,862 |
|
|
388 |
|
|
(50) |
|
|
|
|
7,200 |
|
Earnings before income taxes |
1,124 |
|
|
4 |
|
|
(4) |
|
|
|
|
1,124 |
|
| Provision for income taxes |
237 |
|
|
— |
|
|
— |
|
|
|
|
237 |
|
Net earnings |
$ |
887 |
|
|
$ |
4 |
|
|
$ |
(4) |
|
|
|
|
$ |
887 |
|
|
|
|
|
|
|
|
|
|
|
| Year ended December 31, 2023 |
|
|
|
|
|
|
|
|
|
| Revenues: |
|
|
|
|
|
|
|
|
|
Net earned premiums |
$ |
6,531 |
|
|
$ |
— |
|
|
$ |
— |
|
|
|
|
$ |
6,531 |
|
| Net investment income |
769 |
|
|
— |
|
|
(27) |
|
|
(b) |
|
742 |
|
Realized gains (losses) on: |
|
|
|
|
|
|
|
|
|
Securities |
(36) |
|
|
— |
|
|
— |
|
|
|
|
(36) |
|
Subsidiaries |
(4) |
|
|
— |
|
|
— |
|
|
|
|
(4) |
|
| Income of managed investment entities: |
|
|
|
|
|
|
|
|
|
| Investment income |
— |
|
|
421 |
|
|
— |
|
|
|
|
421 |
|
| Gain (loss) on change in fair value of assets/liabilities |
— |
|
|
29 |
|
|
(2) |
|
|
(b) |
|
27 |
|
| Other income |
162 |
|
|
— |
|
|
(16) |
|
|
(c) |
|
146 |
|
| Total revenues |
7,422 |
|
|
450 |
|
|
(45) |
|
|
|
|
7,827 |
|
| Costs and Expenses: |
|
|
|
|
|
|
|
|
|
| Insurance benefits and expenses |
5,968 |
|
|
— |
|
|
— |
|
|
|
|
5,968 |
|
| Expenses of managed investment entities |
— |
|
|
450 |
|
|
(45) |
|
|
(b)(c) |
|
405 |
|
| Interest charges on borrowed money and other expenses |
381 |
|
|
— |
|
|
— |
|
|
|
|
381 |
|
| Total costs and expenses |
6,349 |
|
|
450 |
|
|
(45) |
|
|
|
|
6,754 |
|
Earnings before income taxes |
1,073 |
|
|
— |
|
|
— |
|
|
|
|
1,073 |
|
| Provision for income taxes |
221 |
|
|
— |
|
|
— |
|
|
|
|
221 |
|
Net earnings |
$ |
852 |
|
|
$ |
— |
|
|
$ |
— |
|
|
|
|
$ |
852 |
|
(a)Includes income of $33 million in 2024 and $27 million in 2023, representing the change in fair value of AFG’s CLO investments and $13 million and $16 million of income in 2024 and 2023, respectively, in CLO management fees earned.
(b)Elimination of the change in fair value of AFG’s investments in the CLOs, including $37 million and $29 million in 2024 and 2023, respectively, in distributions recorded as interest expense by the CLOs.
(c)Elimination of management fees earned by AFG.
CONDENSED CONSOLIDATING STATEMENT OF EARNINGS - CONTINUED
|
|
|
|
|
|
|
|
|
|
|
|
|
|
|
|
|
|
|
|
|
|
|
|
|
|
|
|
|
|
|
Before
CLO
Consol. (a) |
|
Managed
Investment
Entities |
|
Consol.
Entries |
|
|
|
Consolidated
As Reported |
| Year ended December 31, 2022 |
|
|
|
|
|
|
|
|
|
| Revenues: |
|
|
|
|
|
|
|
|
|
Net earned premiums |
$ |
6,085 |
|
|
$ |
— |
|
|
$ |
— |
|
|
|
|
$ |
6,085 |
|
| Net investment income |
707 |
|
|
— |
|
|
10 |
|
|
(b) |
|
717 |
|
Realized gains (losses) on securities |
(116) |
|
|
— |
|
|
— |
|
|
|
|
(116) |
|
| Income of managed investment entities: |
|
|
|
|
|
|
|
|
|
| Investment income |
— |
|
|
268 |
|
|
— |
|
|
|
|
268 |
|
| Gain (loss) on change in fair value of assets/liabilities |
— |
|
|
(2) |
|
|
(29) |
|
|
(b) |
|
(31) |
|
| Other income |
134 |
|
|
— |
|
|
(17) |
|
|
(c) |
|
117 |
|
| Total revenues |
6,810 |
|
|
266 |
|
|
(36) |
|
|
|
|
7,040 |
|
| Costs and Expenses: |
|
|
|
|
|
|
|
|
|
| Insurance benefits and expenses |
5,347 |
|
|
— |
|
|
— |
|
|
|
|
5,347 |
|
| Expenses of managed investment entities |
— |
|
|
265 |
|
|
(35) |
|
|
(b)(c) |
|
230 |
|
| Interest charges on borrowed money and other expenses |
340 |
|
|
— |
|
|
— |
|
|
|
|
340 |
|
| Total costs and expenses |
5,687 |
|
|
265 |
|
|
(35) |
|
|
|
|
5,917 |
|
Earnings before income taxes |
1,123 |
|
|
1 |
|
|
(1) |
|
|
|
|
1,123 |
|
| Provision for income taxes |
225 |
|
|
— |
|
|
— |
|
|
|
|
225 |
|
Net earnings |
$ |
898 |
|
|
$ |
1 |
|
|
$ |
(1) |
|
|
|
|
$ |
898 |
|
(a)Includes a loss of $10 million representing the change in fair value of AFG’s CLO investments and $17 million of income in CLO management fees earned.
(b)Elimination of the change in fair value of AFG’s investments in the CLOs, including $18 million in distributions recorded as interest expense by the CLOs.
(c)Elimination of management fees earned by AFG.
RESULTS OF OPERATIONS
General
AFG’s net earnings, determined in accordance with GAAP, include certain items that may not be indicative of its ongoing core operations. Core net operating earnings excludes realized gains (losses) on securities because such gains and losses are influenced significantly by financial markets, interest rates and the timing of sales. In addition, special charges related to coverage that AFG no longer writes, such as asbestos and environmental exposures, are excluded from core earnings.
The following table (in millions, except per share amounts) identifies non-core items and reconciles net earnings to core net operating earnings, a non-GAAP financial measure. AFG believes core net operating earnings is a useful tool for investors and analysts in analyzing ongoing operating trends and for management to evaluate financial performance against historical results because it believes this provides a more comparable measure of its continuing business.
|
|
|
|
|
|
|
|
|
|
|
|
|
|
|
|
|
|
|
|
|
|
|
|
|
|
|
|
|
|
|
Three months ended December 31, |
|
Year ended December 31, |
| 2024 |
|
2023 |
|
2024 |
|
2023 |
|
2022 |
Components of net earnings: |
|
|
|
|
|
|
|
|
|
| Core operating earnings before income taxes |
$ |
330 |
|
|
$ |
304 |
|
|
$ |
1,138 |
|
|
$ |
1,127 |
|
|
$ |
1,248 |
|
| Pretax non-core items: |
|
|
|
|
|
|
|
|
|
| Realized gains (losses) on securities |
(10) |
|
|
31 |
|
|
— |
|
|
(36) |
|
|
(116) |
|
Realized loss on subsidiary |
— |
|
|
— |
|
|
— |
|
|
(4) |
|
|
— |
|
| Special A&E charges |
— |
|
|
— |
|
|
(14) |
|
|
(15) |
|
|
— |
|
| Gain (loss) on retirement of debt |
— |
|
|
— |
|
|
— |
|
|
1 |
|
|
(9) |
|
| Other |
— |
|
|
— |
|
|
— |
|
|
— |
|
|
— |
|
Earnings before income taxes |
320 |
|
|
335 |
|
|
1,124 |
|
|
1,073 |
|
|
1,123 |
|
| Provision for income taxes: |
|
|
|
|
|
|
|
|
|
| Core operating earnings |
68 |
|
|
66 |
|
|
236 |
|
|
232 |
|
|
255 |
|
| Non-core items: |
|
|
|
|
|
|
|
|
|
| Realized gains (losses) on securities |
(3) |
|
|
6 |
|
|
— |
|
|
(8) |
|
|
(24) |
|
Realized loss on subsidiary |
— |
|
|
— |
|
|
4 |
|
|
— |
|
|
— |
|
| Special A&E charges |
— |
|
|
— |
|
|
(3) |
|
|
(3) |
|
|
— |
|
| Gain (loss) on retirement of debt |
— |
|
|
— |
|
|
— |
|
|
— |
|
|
(2) |
|
| Other |
— |
|
|
— |
|
|
— |
|
|
— |
|
|
(4) |
|
| Total provision for income taxes |
65 |
|
|
72 |
|
|
237 |
|
|
221 |
|
|
225 |
|
Net earnings |
$ |
255 |
|
|
$ |
263 |
|
|
$ |
887 |
|
|
$ |
852 |
|
|
$ |
898 |
|
|
|
|
|
|
|
|
|
|
|
| Net earnings: |
|
|
|
|
|
|
|
|
|
| Core net operating earnings |
$ |
262 |
|
|
$ |
238 |
|
|
$ |
902 |
|
|
$ |
895 |
|
|
$ |
993 |
|
| Realized gains (losses) on securities |
(7) |
|
|
25 |
|
|
— |
|
|
(28) |
|
|
(92) |
|
Realized loss on subsidiary |
— |
|
|
— |
|
|
(4) |
|
|
(4) |
|
|
— |
|
| Special A&E charges |
— |
|
|
— |
|
|
(11) |
|
|
(12) |
|
|
— |
|
| Gain (loss) on retirement of debt |
— |
|
|
— |
|
|
— |
|
|
1 |
|
|
(7) |
|
| Other |
— |
|
|
— |
|
|
— |
|
|
— |
|
|
4 |
|
Net earnings |
$ |
255 |
|
|
$ |
263 |
|
|
$ |
887 |
|
|
$ |
852 |
|
|
$ |
898 |
|
|
|
|
|
|
|
|
|
|
|
| Diluted per share amounts: |
|
|
|
|
|
|
|
|
|
| Core net operating earnings |
$ |
3.12 |
|
|
$ |
2.84 |
|
|
$ |
10.75 |
|
|
$ |
10.56 |
|
|
$ |
11.63 |
|
| Realized gains (losses) on securities |
(0.09) |
|
|
0.29 |
|
|
— |
|
|
(0.33) |
|
|
(1.06) |
|
Realized loss on subsidiary |
— |
|
|
— |
|
|
(0.05) |
|
|
(0.04) |
|
|
— |
|
| Special A&E charges |
— |
|
|
— |
|
|
(0.13) |
|
|
(0.15) |
|
|
— |
|
| Gain (loss) on retirement of debt |
— |
|
|
— |
|
|
— |
|
|
0.01 |
|
|
(0.09) |
|
| Other |
— |
|
|
— |
|
|
— |
|
|
— |
|
|
0.05 |
|
Net earnings |
$ |
3.03 |
|
|
$ |
3.13 |
|
|
$ |
10.57 |
|
|
$ |
10.05 |
|
|
$ |
10.53 |
|
Net earnings were $255 million in the fourth quarter of 2024 compared to $263 million in the fourth quarter of 2023 reflecting net realized losses on securities in the fourth quarter of 2024 compared to net realized gains on securities in the fourth quarter of 2023, partially offset by higher core net operating earnings. Core net operating earnings for the fourth quarter of 2024 increased $24 million compared to the fourth quarter of 2023 reflecting higher net investment income, including improved returns on alternative investments, partially offset by lower underwriting profit. Net realized losses on securities of $7 million in the fourth quarter of 2024 and net realized gains on securities of $25 million in the fourth quarter of 2023 include $1 million of after-tax losses and $22 million of after-tax gains, respectively, from the change in fair value of equity securities that were still held at the balance sheet date.
Net earnings were $887 million for the full-year of 2024 compared to $852 million in 2023 reflecting the impact of net realized losses on securities in 2023 and higher core net operating earnings. Core net operating earnings for 2024 increased $7 million compared to 2023. Higher investment income outside of alternative investments was partially offset by lower returns on AFG’s alternative investment portfolio and lower underwriting profit. Net realized gains on securities of less than $1 million in 2024 and net realized losses on securities of $28 million in 2023 include $19 million of after-tax gains and $2 million of after-tax losses, respectively, from the change in fair value of equity securities that were still held at the balance sheet date.
Net earnings were $852 million for the full-year of 2023 compared to $898 million in 2022 reflecting lower core net operating earnings and a special A&E charge recorded in the third quarter of 2023, partially offset by lower net realized losses on securities in 2023 compared to 2022. Core net operating earnings for 2023 decreased $98 million compared to 2022 reflecting lower returns on AFG’s alternative investment portfolio when compared to the strong performance of this portfolio in 2022 and lower underwriting profit, partially offset by higher investment income outside of alternative investments. Net realized losses on securities of $28 million in 2023 and $92 million in 2022 include $2 million and $75 million, respectively, of after-tax losses from the change in fair value of equity securities that were still held at the balance sheet date.
RESULTS OF OPERATIONS — THREE MONTHS ENDED DECEMBER 31, 2024 AND 2023
Segmented Statement of Earnings
AFG reports its operations as two segments: (i) Property and casualty insurance (“P&C”) and (ii) Other, which includes holding company costs and income and expenses related to the managed investment entities (“MIEs”).
AFG’s net earnings, determined in accordance with GAAP, include certain items that may not be indicative of its ongoing core operations. The following tables for the three months ended December 31, 2024 and 2023 identify such items by segment and reconcile net earnings to core net operating earnings, a non-GAAP financial measure that AFG believes is a useful tool for investors and analysts in analyzing ongoing operating trends (in millions):
|
|
|
|
|
|
|
|
|
|
|
|
|
|
|
|
|
|
|
|
|
|
|
|
|
|
|
|
|
|
|
|
|
|
|
|
|
|
|
Other |
|
|
|
|
|
|
|
P&C |
|
Consol. MIEs |
|
Holding Co., other and unallocated |
|
Total |
|
Non-core reclass |
|
GAAP Total |
| Three months ended December 31, 2024 |
|
|
|
|
|
|
|
|
|
|
|
| Revenues: |
|
|
|
|
|
|
|
|
|
|
|
Net earned premiums |
$ |
1,850 |
|
|
$ |
— |
|
|
$ |
— |
|
|
$ |
1,850 |
|
|
$ |
— |
|
|
$ |
1,850 |
|
| Net investment income |
195 |
|
|
(8) |
|
|
7 |
|
|
194 |
|
|
— |
|
|
194 |
|
| Realized gains (losses) on securities |
— |
|
|
— |
|
|
— |
|
|
— |
|
|
(10) |
|
|
(10) |
|
| Income of MIEs: |
|
|
|
|
|
|
|
|
|
|
|
| Investment income |
— |
|
|
84 |
|
|
— |
|
|
84 |
|
|
— |
|
|
84 |
|
Gain (loss) on change in fair value of assets/liabilities |
— |
|
|
(1) |
|
|
— |
|
|
(1) |
|
|
— |
|
|
(1) |
|
| Other income |
2 |
|
|
(4) |
|
|
34 |
|
|
32 |
|
|
— |
|
|
32 |
|
| Total revenues |
2,047 |
|
|
71 |
|
|
41 |
|
|
2,159 |
|
|
(10) |
|
|
2,149 |
|
|
|
|
|
|
|
|
|
|
|
|
|
| Costs and Expenses: |
|
|
|
|
|
|
|
|
|
|
|
| Losses and loss adjustment expenses |
1,181 |
|
|
— |
|
|
— |
|
|
1,181 |
|
|
— |
|
|
1,181 |
|
| Commissions and other underwriting expenses |
467 |
|
|
— |
|
|
13 |
|
|
480 |
|
|
— |
|
|
480 |
|
| Interest charges on borrowed money |
— |
|
|
— |
|
|
19 |
|
|
19 |
|
|
— |
|
|
19 |
|
| Expenses of MIEs |
— |
|
|
71 |
|
|
— |
|
|
71 |
|
|
— |
|
|
71 |
|
| Other expenses |
21 |
|
|
— |
|
|
57 |
|
|
78 |
|
|
— |
|
|
78 |
|
| Total costs and expenses |
1,669 |
|
|
71 |
|
|
89 |
|
|
1,829 |
|
|
— |
|
|
1,829 |
|
| Earnings before income taxes |
378 |
|
|
— |
|
|
(48) |
|
|
330 |
|
|
(10) |
|
|
320 |
|
| Provision for income taxes |
81 |
|
|
— |
|
|
(13) |
|
|
68 |
|
|
(3) |
|
|
65 |
|
Core Net Operating Earnings |
297 |
|
|
— |
|
|
(35) |
|
|
262 |
|
|
|
|
|
| Non-core earnings (loss) (*): |
|
|
|
|
|
|
|
|
|
|
|
| Realized gains (losses) on securities, net of tax |
— |
|
|
— |
|
|
(7) |
|
|
(7) |
|
|
7 |
|
|
— |
|
| Net Earnings |
$ |
297 |
|
|
$ |
— |
|
|
$ |
(42) |
|
|
$ |
255 |
|
|
$ |
— |
|
|
$ |
255 |
|
|
|
|
|
|
|
|
|
|
|
|
|
|
|
|
|
|
|
|
|
|
|
|
|
|
|
|
|
|
|
|
|
|
|
|
|
|
|
|
Other |
|
|
|
|
|
|
|
P&C |
|
Consol. MIEs |
|
Holding Co., other and unallocated |
|
Total |
|
Non-core reclass |
|
GAAP Total |
| Three months ended December 31, 2023 |
|
|
|
|
|
|
|
|
|
|
|
| Revenues: |
|
|
|
|
|
|
|
|
|
|
|
Net earned premiums |
$ |
1,732 |
|
|
$ |
— |
|
|
$ |
— |
|
|
$ |
1,732 |
|
|
$ |
— |
|
|
$ |
1,732 |
|
| Net investment income |
161 |
|
|
(9) |
|
|
7 |
|
|
159 |
|
|
— |
|
|
159 |
|
| Realized gains (losses) on securities |
— |
|
|
— |
|
|
— |
|
|
— |
|
|
31 |
|
|
31 |
|
| Income of MIEs: |
|
|
|
|
|
|
|
|
|
|
|
| Investment income |
— |
|
|
100 |
|
|
— |
|
|
100 |
|
|
— |
|
|
100 |
|
Gain (loss) on change in fair value of assets/liabilities |
— |
|
|
15 |
|
|
— |
|
|
15 |
|
|
— |
|
|
15 |
|
| Other income |
3 |
|
|
(4) |
|
|
47 |
|
|
46 |
|
|
— |
|
|
46 |
|
| Total revenues |
1,896 |
|
|
102 |
|
|
54 |
|
|
2,052 |
|
|
31 |
|
|
2,083 |
|
|
|
|
|
|
|
|
|
|
|
|
|
| Costs and Expenses: |
|
|
|
|
|
|
|
|
|
|
|
| Losses and loss adjustment expenses |
1,053 |
|
|
— |
|
|
16 |
|
|
1,069 |
|
|
— |
|
|
1,069 |
|
| Commissions and other underwriting expenses |
468 |
|
|
— |
|
|
12 |
|
|
480 |
|
|
— |
|
|
480 |
|
| Interest charges on borrowed money |
— |
|
|
— |
|
|
19 |
|
|
19 |
|
|
— |
|
|
19 |
|
| Expenses of MIEs |
— |
|
|
102 |
|
|
— |
|
|
102 |
|
|
— |
|
|
102 |
|
| Other expenses |
18 |
|
|
— |
|
|
60 |
|
|
78 |
|
|
— |
|
|
78 |
|
| Total costs and expenses |
1,539 |
|
|
102 |
|
|
107 |
|
|
1,748 |
|
|
— |
|
|
1,748 |
|
| Earnings before income taxes |
357 |
|
|
— |
|
|
(53) |
|
|
304 |
|
|
31 |
|
|
335 |
|
| Provision for income taxes |
74 |
|
|
— |
|
|
(8) |
|
|
66 |
|
|
6 |
|
|
72 |
|
Core Net Operating Earnings |
283 |
|
|
— |
|
|
(45) |
|
|
238 |
|
|
|
|
|
| Non-core earnings (loss) (*): |
|
|
|
|
|
|
|
|
|
|
|
| Realized gains (losses) on securities, net of tax |
— |
|
|
— |
|
|
25 |
|
|
25 |
|
|
(25) |
|
|
— |
|
| Net Earnings |
$ |
283 |
|
|
$ |
— |
|
|
$ |
(20) |
|
|
$ |
263 |
|
|
$ |
— |
|
|
$ |
263 |
|
(*)See the reconciliation of core earnings to GAAP net earnings under “Results of Operations — General” for details on the tax impacts of these reconciling items.
Property and Casualty Insurance Segment — Results of Operations
Performance measures such as underwriting profit or loss and related combined ratios are often used by property and casualty insurers to help users of their financial statements better understand the company’s performance. Underwriting profitability is measured by the combined ratio, which is a sum of the ratios of losses and loss adjustment expenses, and commissions and other underwriting expenses to premiums. A combined ratio under 100% indicates an underwriting profit. The combined ratio does not reflect net investment income, other income, other expenses or federal income taxes.
AFG’s property and casualty insurance operations contributed $378 million in pretax earnings in the fourth quarter of 2024 compared to $357 million in the fourth quarter of 2023, an increase of $21 million (6%) as a result of higher net investment income which was partially offset by lower underwriting profit.
The following table details AFG’s earnings before income taxes from its property and casualty insurance operations for the three months ended December 31, 2024 and 2023 (dollars in millions):
|
|
|
|
|
|
|
|
|
|
|
|
|
|
|
|
|
|
|
Three months ended December 31, |
|
|
|
2024 |
|
2023 |
|
% Change |
| Gross written premiums |
$ |
2,043 |
|
|
$ |
1,992 |
|
|
3 |
% |
| Reinsurance premiums ceded |
(583) |
|
|
(547) |
|
|
7 |
% |
| Net written premiums |
1,460 |
|
|
1,445 |
|
|
1 |
% |
| Change in unearned premiums |
390 |
|
|
287 |
|
|
36 |
% |
| Net earned premiums |
1,850 |
|
|
1,732 |
|
|
7 |
% |
| Loss and loss adjustment expenses |
1,181 |
|
|
1,053 |
|
|
12 |
% |
| Commissions and other underwriting expenses |
467 |
|
|
468 |
|
|
— |
% |
| Underwriting gain |
202 |
|
|
211 |
|
|
(4 |
%) |
|
|
|
|
|
|
| Net investment income |
195 |
|
|
161 |
|
|
21 |
% |
| Other income and expenses, net |
(19) |
|
|
(15) |
|
|
27 |
% |
| Earnings before income taxes |
$ |
378 |
|
|
$ |
357 |
|
|
6 |
% |
|
|
|
|
|
|
|
Three months ended December 31, |
|
|
| Combined Ratios: |
2024 |
|
2023 |
|
Change |
| Specialty lines |
|
|
|
|
|
| Loss and LAE ratio |
63.7 |
% |
|
60.7 |
% |
|
3.0 |
% |
| Underwriting expense ratio |
25.3 |
% |
|
27.0 |
% |
|
(1.7 |
%) |
| Combined ratio |
89.0 |
% |
|
87.7 |
% |
|
1.3 |
% |
|
|
|
|
|
|
| Aggregate — including exited lines |
|
|
|
|
|
| Loss and LAE ratio |
63.8 |
% |
|
60.8 |
% |
|
3.0 |
% |
| Underwriting expense ratio |
25.3 |
% |
|
27.0 |
% |
|
(1.7 |
%) |
| Combined ratio |
89.1 |
% |
|
87.8 |
% |
|
1.3 |
% |
AFG’s statutory combined ratio has been better than the U.S. industry average for 37 of the most recent 39 years. Management believes that AFG’s insurance operations have performed better than the industry as a result of its specialty niche focus, product line diversification, stringent underwriting discipline and alignment of compensation incentives.
AFG reports the underwriting performance of its Specialty property and casualty insurance business in the following sub-segments: (i) Property and transportation, (ii) Specialty casualty and (iii) Specialty financial.
To understand the overall profitability of particular lines, the timing of claims payments and the related impact of investment income must be considered. Certain “short-tail” lines of business (primarily property coverages) generally have quick loss payouts, which reduce the time funds are held, thereby limiting investment income earned thereon. In contrast, “long-tail” lines of business (primarily liability coverages and workers’ compensation) generally have payouts that are either structured over many years or take many years to settle, thereby significantly increasing investment income earned on related premiums received.
Gross Written Premiums
Gross written premiums (“GWP”) for AFG’s property and casualty insurance segment were $2.04 billion for the fourth quarter of 2024 compared to $1.99 billion for the fourth quarter of 2023, an increase of $51 million (3%). Detail of AFG’s property and casualty gross written premiums is shown below (dollars in millions):
|
|
|
|
|
|
|
|
|
|
|
|
|
|
|
|
|
|
|
|
|
|
|
|
|
|
|
|
|
|
|
Three months ended December 31, |
|
|
|
2024 |
|
2023 |
|
|
|
GWP |
|
% |
|
GWP |
|
% |
|
% Change |
| Property and transportation |
$ |
585 |
|
|
29 |
% |
|
$ |
623 |
|
|
31 |
% |
|
(6 |
%) |
| Specialty casualty |
1,126 |
|
|
55 |
% |
|
1,069 |
|
|
54 |
% |
|
5 |
% |
| Specialty financial |
332 |
|
|
16 |
% |
|
300 |
|
|
15 |
% |
|
11 |
% |
|
$ |
2,043 |
|
|
100 |
% |
|
$ |
1,992 |
|
|
100 |
% |
|
3 |
% |
Reinsurance Premiums Ceded
Reinsurance premiums ceded (“Ceded”) for AFG’s property and casualty insurance segment were 29% of gross written premiums for the fourth quarter of 2024 compared to 27% of gross written premiums for the fourth quarter of 2023, an increase of 2 percentage points. Detail of AFG’s property and casualty reinsurance premiums ceded is shown below (dollars in millions):
|
|
|
|
|
|
|
|
|
|
|
|
|
|
|
|
|
|
|
|
|
|
|
|
|
|
|
|
|
|
|
Three months ended December 31, |
|
|
|
2024 |
|
2023 |
|
Change in % of GWP |
|
Ceded |
|
% of GWP |
|
Ceded |
|
% of GWP |
|
| Property and transportation |
$ |
(186) |
|
|
32 |
% |
|
$ |
(197) |
|
|
32 |
% |
|
— |
% |
| Specialty casualty |
(401) |
|
|
36 |
% |
|
(369) |
|
|
35 |
% |
|
1 |
% |
| Specialty financial |
(53) |
|
|
16 |
% |
|
(50) |
|
|
17 |
% |
|
(1 |
%) |
| Other specialty |
57 |
|
|
|
|
69 |
|
|
|
|
|
|
$ |
(583) |
|
|
29 |
% |
|
$ |
(547) |
|
|
27 |
% |
|
2 |
% |
Net Written Premiums
Net written premiums (“NWP”) for AFG’s property and casualty insurance segment were $1.46 billion for the fourth quarter of 2024 compared to $1.45 billion for the fourth quarter of 2023, an increase of $15 million (1%). Detail of AFG’s property and casualty net written premiums is shown below (dollars in millions):
|
|
|
|
|
|
|
|
|
|
|
|
|
|
|
|
|
|
|
|
|
|
|
|
|
|
|
|
|
|
|
Three months ended December 31, |
|
|
|
2024 |
|
2023 |
|
|
|
NWP |
|
% |
|
NWP |
|
% |
|
% Change |
| Property and transportation |
$ |
399 |
|
|
27 |
% |
|
$ |
426 |
|
|
30 |
% |
|
(6 |
%) |
| Specialty casualty |
725 |
|
|
50 |
% |
|
700 |
|
|
48 |
% |
|
4 |
% |
| Specialty financial |
279 |
|
|
19 |
% |
|
250 |
|
|
17 |
% |
|
12 |
% |
| Other specialty |
57 |
|
|
4 |
% |
|
69 |
|
|
5 |
% |
|
(17 |
%) |
|
$ |
1,460 |
|
|
100 |
% |
|
$ |
1,445 |
|
|
100 |
% |
|
1 |
% |
Net Earned Premiums
Net earned premiums (“NEP”) for AFG’s property and casualty insurance segment were $1.85 billion for the fourth quarter of 2024 compared to $1.73 billion for the fourth quarter of 2023, an increase of $118 million (7%). Detail of AFG’s property and casualty net earned premiums is shown below (dollars in millions):
|
|
|
|
|
|
|
|
|
|
|
|
|
|
|
|
|
|
|
|
|
|
|
|
|
|
|
|
|
|
|
Three months ended December 31, |
|
|
|
2024 |
|
2023 |
|
|
|
NEP |
|
% |
|
NEP |
|
% |
|
% Change |
| Property and transportation |
$ |
756 |
|
|
41 |
% |
|
$ |
682 |
|
|
39 |
% |
|
11 |
% |
| Specialty casualty |
754 |
|
|
41 |
% |
|
737 |
|
|
43 |
% |
|
2 |
% |
| Specialty financial |
279 |
|
|
15 |
% |
|
244 |
|
|
14 |
% |
|
14 |
% |
| Other specialty |
61 |
|
|
3 |
% |
|
69 |
|
|
4 |
% |
|
(12 |
%) |
|
$ |
1,850 |
|
|
100 |
% |
|
$ |
1,732 |
|
|
100 |
% |
|
7 |
% |
Gross written premiums for the fourth quarter of 2024 increased $51 million (3%) compared to the fourth quarter of 2023 driven primarily by new business opportunities, a good renewal rate environment and increased exposures. Overall average renewal rates increased approximately 7% in the fourth quarter of 2024. Excluding overall rate decreases in the workers’ compensation businesses, renewal rates increased approximately 8%.
Property and transportation Gross written premiums decreased $38 million (6%) in the fourth quarter of 2024 compared to the fourth quarter of 2023. This decrease was due primarily to the impact of lower year-over-year commodity pricing on winter wheat premiums, coupled with elevated pricing competition and the non-renewal of certain under-performing accounts in the transportation businesses. Average renewal rates increased 7% for this group in the fourth quarter of 2024. Reinsurance premiums ceded as a percentage of gross written premiums were comparable in the fourth quarter of 2024 and the fourth quarter of 2023 reflecting higher cessions in the crop business offset by the impact of lower cessions in certain transportation businesses.
Specialty casualty Gross written premiums increased $57 million (5%) in the fourth quarter of 2024 compared to the fourth quarter of 2023. The primary drivers of growth were new business opportunities and favorable renewal pricing in several of the targeted markets businesses and in the excess and surplus business.
The mergers and acquisitions liability business also benefited from an increase in mergers and acquisition activity. This growth was tempered by lower year-over-year workers’ compensation premiums. Average renewal rates for this group increased approximately 8% in the fourth quarter of 2024. Excluding rate decreases in the workers’ compensation businesses, renewal rates for this group increased approximately 11%. Reinsurance premiums ceded as a percentage of gross written premiums increased 1 percentage point for the fourth quarter of 2024 compared to the fourth quarter of 2023 reflecting higher premiums in the excess and surplus and mergers and acquisitions liability businesses, which cede a larger percentage of premiums than some of the other businesses in the Specialty casualty sub-segment as well as higher cessions in the public sector business, partially offset by lower cessions in certain more heavily reinsured products in the social services business.
Specialty financial Gross written premiums increased $32 million (11%) in the fourth quarter of 2024 compared to the fourth quarter of 2023 due primarily to growth in the financial institutions business. Average renewal rates for this group increased approximately 3% in the fourth quarter of 2024. Reinsurance premiums ceded as a percentage of gross written premiums decreased 1 percentage point in the fourth quarter of 2024 compared to the fourth quarter of 2023 reflecting the impact of lower gross written premiums in the innovative markets business, which cedes a larger percentage of premiums than some of the other businesses in the Specialty financial sub-segment.
Other specialty The amounts shown as reinsurance premiums ceded represent business assumed by AFG’s internal reinsurance program from the operations that make up AFG’s other Specialty property and casualty insurance sub-segments. Reinsurance premiums assumed decreased $12 million (17%) in the fourth quarter of 2024 compared to the fourth quarter of 2023 reflecting a decrease in premiums retained, primarily from businesses in the Specialty casualty sub-segment.
Combined Ratio
Performance measures such as the combined ratio are often used by property and casualty insurers to help users of their financial statements better understand the company’s performance. The combined ratio is the sum of the loss and loss adjustment expenses (“LAE”) and underwriting expense ratios. These ratios are calculated by dividing each of the respective expenses by net earned premiums. The table below (dollars in millions) details the components of the combined ratio for AFG’s property and casualty insurance segment:
|
|
|
|
|
|
|
|
|
|
|
|
|
|
|
|
|
|
|
|
|
|
|
|
|
|
|
|
|
|
|
Three months ended December 31, |
|
|
|
Three months ended December 31, |
|
2024 |
|
2023 |
|
Change |
|
2024 |
|
2023 |
| Property and transportation |
|
|
|
|
|
|
|
|
|
| Loss and LAE ratio |
69.3 |
% |
|
69.0 |
% |
|
0.3 |
% |
|
|
|
|
| Underwriting expense ratio |
19.9 |
% |
|
21.3 |
% |
|
(1.4 |
%) |
|
|
|
|
| Combined ratio |
89.2 |
% |
|
90.3 |
% |
|
(1.1 |
%) |
|
|
|
|
| Underwriting profit |
|
|
|
|
|
|
$ |
82 |
|
|
$ |
67 |
|
|
|
|
|
|
|
|
|
|
|
| Specialty casualty |
|
|
|
|
|
|
|
|
|
| Loss and LAE ratio |
65.6 |
% |
|
59.6 |
% |
|
6.0 |
% |
|
|
|
|
| Underwriting expense ratio |
23.4 |
% |
|
25.0 |
% |
|
(1.6 |
%) |
|
|
|
|
| Combined ratio |
89.0 |
% |
|
84.6 |
% |
|
4.4 |
% |
|
|
|
|
| Underwriting profit |
|
|
|
|
|
|
$ |
82 |
|
|
$ |
114 |
|
|
|
|
|
|
|
|
|
|
|
| Specialty financial |
|
|
|
|
|
|
|
|
|
| Loss and LAE ratio |
38.1 |
% |
|
34.8 |
% |
|
3.3 |
% |
|
|
|
|
| Underwriting expense ratio |
42.6 |
% |
|
46.5 |
% |
|
(3.9 |
%) |
|
|
|
|
| Combined ratio |
80.7 |
% |
|
81.3 |
% |
|
(0.6 |
%) |
|
|
|
|
| Underwriting profit |
|
|
|
|
|
|
$ |
54 |
|
|
$ |
45 |
|
|
|
|
|
|
|
|
|
|
|
| Total Specialty |
|
|
|
|
|
|
|
|
|
| Loss and LAE ratio |
63.7 |
% |
|
60.7 |
% |
|
3.0 |
% |
|
|
|
|
| Underwriting expense ratio |
25.3 |
% |
|
27.0 |
% |
|
(1.7 |
%) |
|
|
|
|
| Combined ratio |
89.0 |
% |
|
87.7 |
% |
|
1.3 |
% |
|
|
|
|
| Underwriting profit |
|
|
|
|
|
|
$ |
204 |
|
|
$ |
212 |
|
|
|
|
|
|
|
|
|
|
|
| Aggregate — including exited lines |
|
|
|
|
|
|
|
|
|
| Loss and LAE ratio |
63.8 |
% |
|
60.8 |
% |
|
3.0 |
% |
|
|
|
|
| Underwriting expense ratio |
25.3 |
% |
|
27.0 |
% |
|
(1.7 |
%) |
|
|
|
|
| Combined ratio |
89.1 |
% |
|
87.8 |
% |
|
1.3 |
% |
|
|
|
|
| Underwriting profit |
|
|
|
|
|
|
$ |
202 |
|
|
$ |
211 |
|
The Specialty property and casualty insurance operations generated an underwriting profit of $204 million in the fourth quarter of 2024 compared to $212 million in the fourth quarter of 2023, a decrease of $8 million (4%). Higher underwriting profit in the Property and transportation and Specialty financial sub-segments was more than offset by lower year-over-year underwriting profit in the Specialty casualty sub-segment, which was impacted by net adverse prior year reserve development in certain social inflation exposed businesses. Overall catastrophe losses were $21 million (1.1 points on the combined ratio), including $1 million in net reinstatement premiums in the fourth quarter of 2024 compared to catastrophe losses of $25 million (1.4 points), including $1 million in net reinstatement premiums in the fourth quarter of 2023.
Property and transportation Underwriting profit for this group was $82 million for the fourth quarter of 2024 compared to $67 million in the fourth quarter of 2023, an increase of $15 million (22%), reflecting higher year-over-year underwriting profitability in the crop insurance operations. Catastrophe losses for this group were $10 million (1.3 points on the combined ratio), including $1 million in net reinstatement premiums in the fourth quarter of 2024 compared to catastrophe losses of $5 million (0.6 points), including $2 million in net reinstatement premiums in the fourth quarter of 2023.
Specialty casualty Underwriting profit for this group was $82 million for the fourth quarter of 2024 compared to $114 million in the fourth quarter of 2023, a decrease of $32 million (28%). Higher year-over-year underwriting profit in the targeted markets businesses was more than offset by lower underwriting profit in the excess liability, workers’ compensation and executive liability businesses. Catastrophe losses, including the impact of lower than previously estimated losses from Hurricane Helene, had a favorable impact of $5 million (0.8 points on the combined ratio) compared to catastrophe losses of $8 million (1.1 points), including a $1 million favorable impact from lower than previously estimated net reinstatement premiums in the fourth quarter of 2023.
Specialty financial Underwriting profit for this group was $54 million for the fourth quarter of 2024 compared to $45 million in the fourth quarter of 2023, an increase of $9 million (20%). This year-over-year increase reflects higher underwriting profit in the financial institutions business. Catastrophe losses were $17 million (6.2 points on the combined ratio) in the fourth quarter of 2024 compared to $4 million (2.0 points) in the fourth quarter of 2023.
Other specialty This group reported an underwriting loss of $14 million for the fourth quarter of 2024 and the fourth quarter of 2023, reflecting losses in the business assumed by AFG’s internal reinsurance program from the operations that make up AFG’s other Specialty sub-segments. Favorable changes in estimated losses from Hurricane Helene resulted in a favorable impact of $1 million from catastrophe losses in the fourth quarter of 2024 compared to catastrophe losses of $8 million in the fourth quarter of 2023.
Aggregate Aggregate underwriting results for AFG’s property and casualty insurance segment include adverse prior year reserve development of $2 million in the fourth quarter of 2024 and $1 million in the fourth quarter of 2023 related to business outside of the Specialty group that AFG no longer writes.
Losses and Loss Adjustment Expenses
AFG’s overall loss and LAE ratio was 63.8% for the fourth quarter of 2024 compared to 60.8% for the fourth quarter of 2023, an increase of 3.0 percentage points. The components of AFG’s property and casualty losses and LAE amounts and ratio are detailed below (dollars in millions):
|
|
|
|
|
|
|
|
|
|
|
|
|
|
|
|
|
|
|
|
|
|
|
|
|
|
|
|
|
|
|
Three months ended December 31, |
|
|
|
Amount |
|
Ratio |
|
Change in Ratio |
|
2024 |
|
2023 |
|
2024 |
|
2023 |
|
| Property and transportation |
|
|
|
|
|
|
|
|
|
Current year, excluding catastrophe losses |
$ |
517 |
|
|
$ |
479 |
|
|
68.5 |
% |
|
70.2 |
% |
|
(1.7 |
%) |
| Prior accident years development |
(3) |
|
|
(12) |
|
|
(0.5 |
%) |
|
(1.8 |
%) |
|
1.3 |
% |
| Current year catastrophe losses including the impact of net reinstatement premiums |
9 |
|
|
3 |
|
|
1.3 |
% |
|
0.6 |
% |
|
0.7 |
% |
| Property and transportation losses and LAE and ratio |
$ |
523 |
|
|
$ |
470 |
|
|
69.3 |
% |
|
69.0 |
% |
|
0.3 |
% |
|
|
|
|
|
|
|
|
|
|
| Specialty casualty |
|
|
|
|
|
|
|
|
|
Current year, excluding catastrophe losses |
$ |
464 |
|
|
$ |
466 |
|
|
61.6 |
% |
|
63.5 |
% |
|
(1.9 |
%) |
| Prior accident years development |
36 |
|
|
(37) |
|
|
4.8 |
% |
|
(5.0 |
%) |
|
9.8 |
% |
| Current year catastrophe losses including the impact of net reinstatement premiums |
(5) |
|
|
9 |
|
|
(0.8 |
%) |
|
1.1 |
% |
|
(1.9 |
%) |
| Specialty casualty losses and LAE and ratio |
$ |
495 |
|
|
$ |
438 |
|
|
65.6 |
% |
|
59.6 |
% |
|
6.0 |
% |
|
|
|
|
|
|
|
|
|
|
| Specialty financial |
|
|
|
|
|
|
|
|
|
Current year, excluding catastrophe losses |
$ |
97 |
|
|
$ |
89 |
|
|
34.8 |
% |
|
36.2 |
% |
|
(1.4 |
%) |
| Prior accident years development |
(8) |
|
|
(8) |
|
|
(2.9 |
%) |
|
(3.4 |
%) |
|
0.5 |
% |
| Current year catastrophe losses including the impact of net reinstatement premiums |
17 |
|
|
4 |
|
|
6.2 |
% |
|
2.0 |
% |
|
4.2 |
% |
| Specialty financial losses and LAE and ratio |
$ |
106 |
|
|
$ |
85 |
|
|
38.1 |
% |
|
34.8 |
% |
|
3.3 |
% |
|
|
|
|
|
|
|
|
|
|
| Total Specialty |
|
|
|
|
|
|
|
|
|
Current year, excluding catastrophe losses |
$ |
1,125 |
|
|
$ |
1,085 |
|
|
60.8 |
% |
|
62.6 |
% |
|
(1.8 |
%) |
| Prior accident years development |
34 |
|
|
(57) |
|
|
1.8 |
% |
|
(3.3 |
%) |
|
5.1 |
% |
| Current year catastrophe losses including the impact of net reinstatement premiums |
20 |
|
|
24 |
|
|
1.1 |
% |
|
1.4 |
% |
|
(0.3 |
%) |
| Total Specialty losses and LAE and ratio |
$ |
1,179 |
|
|
$ |
1,052 |
|
|
63.7 |
% |
|
60.7 |
% |
|
3.0 |
% |
|
|
|
|
|
|
|
|
|
|
| Aggregate — including exited lines |
|
|
|
|
|
|
|
|
|
Current year, excluding catastrophe losses |
$ |
1,125 |
|
|
$ |
1,085 |
|
|
60.8 |
% |
|
62.6 |
% |
|
(1.8 |
%) |
| Prior accident years development |
36 |
|
|
(56) |
|
|
1.9 |
% |
|
(3.2 |
%) |
|
5.1 |
% |
| Current year catastrophe losses including the impact of net reinstatement premiums |
20 |
|
|
24 |
|
|
1.1 |
% |
|
1.4 |
% |
|
(0.3 |
%) |
| Aggregate losses and LAE and ratio |
$ |
1,181 |
|
|
$ |
1,053 |
|
|
63.8 |
% |
|
60.8 |
% |
|
3.0 |
% |
Current accident year losses and LAE, excluding catastrophe losses
The current accident year loss and LAE ratio, excluding catastrophe losses for AFG’s Specialty property and casualty insurance operations was 60.8% for the fourth quarter of 2024 compared to 62.6% in the fourth quarter of 2023, a decrease of 1.8 percentage points.
Property and transportation The 1.7 percentage points decrease in the loss and LAE ratio for the current year, excluding catastrophe losses, reflects improved profitability in the crop, ocean marine and property and inland marine businesses, partially offset by higher claim severity in the commercial auto business.
Specialty casualty The 1.9 percentage points decrease in the loss and LAE ratio for the current year, excluding catastrophe losses, reflects growth in certain programs in the social services business that have a lower loss and LAE ratio than some of the other businesses in the Specialty casualty sub-segment and improved results in the workers’ compensation businesses, partially offset by higher claim severity in the excess and surplus business and the impact of pressure on rates in the executive liability business.
Specialty financial The 1.4 percentage points decrease in the loss and LAE ratio for the current year, excluding catastrophe losses, reflects growth in the financial institutions business, which has a lower loss and LAE ratio than some of the other businesses in the Specialty financial sub-segment.
Net prior year reserve development
AFG’s Specialty property and casualty insurance operations recorded net adverse reserve development related to prior accident years of $34 million in the fourth quarter of 2024 compared to net favorable reserve development related to prior accident years of $57 million in the fourth quarter of 2023, a change of $91 million (160%).
Property and transportation Net favorable reserve development of $3 million in the fourth quarter of 2024 reflects lower than anticipated losses in the crop business and lower than expected claim severity in the aviation business, partially offset by higher than anticipated claim severity in the commercial auto business. Net favorable reserve development of $12 million in the fourth quarter of 2023 reflects lower than anticipated losses in the crop business and lower than expected claim frequency in the ocean marine and property and inland marine businesses.
Specialty casualty Net adverse reserve development of $36 million in the fourth quarter of 2024 reflects higher than anticipated claim frequency and severity in the umbrella and excess liability businesses and higher than expected claim severity in the social services and general liability businesses, partially offset by lower than expected claim severity in the workers’ compensation businesses. Net favorable reserve development of $37 million in the fourth quarter of 2023 reflects lower than anticipated claim severity in the workers’ compensation businesses, partially offset by higher than anticipated claim severity in the excess and surplus business and higher than expected claim frequency and severity in the excess liability and general liability businesses.
Specialty financial Net favorable reserve development of $8 million in the fourth quarter of 2024 reflects lower than anticipated claim frequency and severity in the financial institutions business and lower than expected claim severity in the fidelity business. Net favorable reserve development of $8 million in the fourth quarter of 2023 reflects lower than anticipated claim frequency and severity in the fidelity business and lower than expected claim frequency in the financial institutions and trade credit businesses.
Other specialty In addition to the development discussed above, total Specialty prior year reserve development includes net adverse reserve development of $9 million in the fourth quarter of 2024 and less than $1 million in the fourth quarter of 2023 primarily associated with AFG’s internal reinsurance program. The net adverse reserve development in 2024 is primarily related to social inflation exposed business assumed from the Specialty casualty sub-segment.
Aggregate Aggregate net prior accident years reserve development for AFG’s property and casualty insurance segment includes net adverse reserve development of $2 million in the fourth quarter of 2024 and $1 million in the fourth quarter of 2023 related to business outside of the Specialty group that AFG no longer writes.
Catastrophe losses
AFG generally seeks to reduce its exposure to catastrophes (whether resulting from climate change or otherwise) through individual risk selection, including minimizing coastal and known fault-line exposures, and the purchase of reinsurance. Based on data available at December 31, 2024 (including the expected placement of a catastrophe bond structure or additional other reinsurance protection in the second quarter of 2025), AFG’s exposure to a catastrophic earthquake or windstorm that industry models indicate should statistically occur once in every 100, 250 or 500 years as a percentage of AFG’s Shareholders’ Equity is shown below:
|
|
|
|
|
|
|
|
|
|
|
|
|
|
|
|
|
|
|
|
|
|
|
|
Approximate impact of modeled loss on AFG’s Shareholders’ Equity |
|
|
Industry Model |
|
Excluding the expected placement of a catastrophe bond |
|
Including the expected placement of a catastrophe bond |
|
|
100-year event |
|
3% |
|
2% |
|
|
250-year event |
|
6% |
|
2% |
|
|
500-year event |
|
8% |
|
3% |
|
Catastrophe losses of $20 million (before $1 million in net reinstatement premiums) in the fourth quarter of 2024 resulted primarily from Hurricane Milton. Catastrophe losses of $24 million (before $1 million in net reinstatement premiums) in the fourth quarter of 2023 resulted primarily from storms in multiple regions of the United States.
Commissions and Other Underwriting Expenses
AFG’s property and casualty commissions and other underwriting expenses (“U/W Exp”) were $467 million in the fourth quarter of 2024 compared to $468 million for the fourth quarter of 2023, a decrease of $1 million. AFG’s underwriting expense ratio, calculated as commissions and other underwriting expenses divided by net premiums earned, was 25.3% for the fourth quarter of 2024 compared to 27.0% for the fourth quarter of 2023, a decrease of 1.7 percentage points. Detail of AFG’s property and casualty commissions and other underwriting expenses and underwriting expense ratios is shown below (dollars in millions):
|
|
|
|
|
|
|
|
|
|
|
|
|
|
|
|
|
|
|
|
|
|
|
|
|
|
|
|
|
|
|
Three months ended December 31, |
|
|
|
2024 |
|
2023 |
|
Change in % of NEP |
|
U/W Exp |
|
% of NEP |
|
U/W Exp |
|
% of NEP |
|
| Property and transportation |
$ |
151 |
|
|
19.9 |
% |
|
$ |
145 |
|
|
21.3 |
% |
|
(1.4 |
%) |
| Specialty casualty |
177 |
|
|
23.4 |
% |
|
185 |
|
|
25.0 |
% |
|
(1.6 |
%) |
| Specialty financial |
119 |
|
|
42.6 |
% |
|
114 |
|
|
46.5 |
% |
|
(3.9 |
%) |
| Other specialty |
20 |
|
|
35.2 |
% |
|
24 |
|
|
36.1 |
% |
|
(0.9 |
%) |
|
$ |
467 |
|
|
25.3 |
% |
|
$ |
468 |
|
|
27.0 |
% |
|
(1.7 |
%) |
Property and transportation Commissions and other underwriting expenses as a percentage of net earned premiums decreased 1.4 percentage points in the fourth quarter of 2024 compared to the fourth quarter of 2023. The decrease reflects the impact on the ratio of higher earned premiums, including in the crop business which has a lower commissions and other underwriting expense ratio than some of the other businesses in the Property and transportation sub-segment, and lower average commission rates in the transportation businesses due to a change in the mix of business.
Specialty casualty Commissions and other underwriting expenses as a percentage of net earned premiums decreased 1.6 percentage points in the fourth quarter of 2024 compared to the fourth quarter of 2023 reflecting a change in the mix of business towards products with lower commission rates.
Specialty financial Commissions and other underwriting expenses as a percentage of net earned premiums decreased 3.9 percentage points in the fourth quarter of 2024 compared to the fourth quarter of 2023 reflecting the impact on the ratio of higher earned premiums in the financial institutions business and a change in the mix of business towards products with lower commission rates.
Property and Casualty Net Investment Income
Net investment income in AFG’s property and casualty insurance operations was $195 million in the fourth quarter of 2024 compared to $161 million in the fourth quarter of 2023, an increase of $34 million (21%). The average invested assets and overall yield earned on investments held by AFG’s property and casualty insurance operations are provided below (dollars in millions):
|
|
|
|
|
|
|
|
|
|
|
|
|
|
|
|
|
|
|
|
|
|
|
|
|
Three months ended December 31, |
|
|
|
% |
|
2024 |
|
2023 |
|
Change |
|
Change |
| Net investment income: |
|
|
|
|
|
|
|
| Net investment income, excluding alternative investments |
$ |
162 |
|
|
$ |
156 |
|
|
$ |
6 |
|
|
4 |
% |
| Alternative investments |
33 |
|
|
5 |
|
|
28 |
|
|
560 |
% |
| Total net investment income |
$ |
195 |
|
|
$ |
161 |
|
|
$ |
34 |
|
|
21 |
% |
|
|
|
|
|
|
|
|
| Average invested assets (at amortized cost) |
$ |
15,718 |
|
|
$ |
15,227 |
|
|
$ |
491 |
|
|
3 |
% |
|
|
|
|
|
|
|
|
| Yield (net investment income as a % of average invested assets) |
4.96 |
% |
|
4.23 |
% |
|
0.73 |
% |
|
|
|
|
|
|
|
|
|
|
| Tax equivalent yield (*) |
5.03 |
% |
|
4.31 |
% |
|
0.72 |
% |
|
|
(*)Adjusts the yield on equity securities and tax-exempt bonds to the fully taxable equivalent yield.
The increase in the property and casualty insurance segment’s net investment income for the fourth quarter of 2024 compared to the fourth quarter of 2023 reflects the impact of higher balances of invested assets, higher returns on fixed maturity investments and higher returns on AFG’s alternative investment portfolio (partnerships and similar investments and AFG-managed CLOs). The property and casualty insurance segment’s overall yield on investments (net investment income as a percentage of average invested assets) was 4.96% for the fourth quarter of 2024 compared to 4.23% for the fourth quarter of 2023, an increase of 0.73 percentage points.
The annualized return earned on alternative investments was 4.9% in the fourth quarter of 2024 compared to 0.8% in the comparable prior year period.
Property and Casualty Other Income and Expenses, Net
Other income and expenses, net for AFG’s property and casualty insurance operations was a net expense of $19 million for the fourth quarter of 2024 compared to $15 million for the fourth quarter of 2023, an increase of $4 million (27%). The table below details the items included in other income and expenses, net for AFG’s property and casualty insurance operations (in millions):
|
|
|
|
|
|
|
|
|
|
|
|
|
Three months ended December 31, |
|
2024 |
|
2023 |
|
|
|
|
|
|
|
|
|
|
|
|
Other income |
$ |
2 |
|
|
$ |
3 |
|
| Other expenses: |
|
|
|
| Amortization of intangibles |
6 |
|
|
4 |
|
| Interest expense on funds withheld |
12 |
|
|
12 |
|
| Other |
3 |
|
|
2 |
|
| Total other expenses |
21 |
|
|
18 |
|
| Other income and expenses, net |
$ |
(19) |
|
|
$ |
(15) |
|
Holding Company, Other and Unallocated — Results of Operations
AFG’s net pretax loss outside of its property and casualty insurance segment (excluding realized gains and losses) totaled $48 million in the fourth quarter of 2024 compared to $53 million in the fourth quarter of 2023, a decrease of $5 million (9%).
The following table details AFG’s loss before income taxes from operations outside of its property and casualty insurance segment for the three months ended December 31, 2024 and 2023 (dollars in millions):
|
|
|
|
|
|
|
|
|
|
|
|
|
|
|
|
|
|
|
Three months ended December 31, |
|
|
|
2024 |
|
2023 |
|
% Change |
| Revenues: |
|
|
|
|
|
| Net investment income |
$ |
7 |
|
|
$ |
7 |
|
|
— |
% |
| Other income — P&C fees |
28 |
|
|
42 |
|
|
(33 |
%) |
| Other income |
6 |
|
|
5 |
|
|
20 |
% |
| Total revenues |
41 |
|
|
54 |
|
|
(24 |
%) |
|
|
|
|
|
|
| Costs and Expenses: |
|
|
|
|
|
| Property and casualty insurance — loss adjustment and underwriting expenses |
13 |
|
|
28 |
|
|
(54 |
%) |
| Other expense — expenses associated with P&C fees |
15 |
|
|
14 |
|
|
7 |
% |
Other expenses |
42 |
|
|
46 |
|
|
(9 |
%) |
| Costs and expenses, excluding interest charges on borrowed money |
70 |
|
|
88 |
|
|
(20 |
%) |
| Loss before income taxes, excluding realized gains and losses and interest charges on borrowed money |
(29) |
|
|
(34) |
|
|
(15 |
%) |
| Interest charges on borrowed money |
19 |
|
|
19 |
|
|
— |
% |
Loss before income taxes, excluding realized gains and losses |
$ |
(48) |
|
|
$ |
(53) |
|
|
(9 |
%) |
Holding Company and Other — Net Investment Income
AFG recorded net investment income on investments held outside of its property and casualty insurance segment of $7 million in both the fourth quarter of 2024 and the fourth quarter of 2023.
Holding Company and Other — P&C Fees and Related Expenses
Summit, a workers’ compensation insurance subsidiary, collects fees from a small group of unaffiliated insurers for providing underwriting, policy administration and claims services. In addition, certain of AFG’s property and casualty insurance businesses collect fees from customers for ancillary services such as workplace safety programs and premium financing. In the fourth quarter of 2024, AFG collected $28 million in fees for these services compared to $23 million in the fourth quarter of 2023. Management views this fee income, net of the $15 million in the fourth quarter of 2024 and $14 million in the fourth quarter of 2023 in expenses incurred to generate such fees, as a reduction in the cost of underwriting its property and casualty insurance policies.
In addition, AFG’s property and casualty insurance businesses earned $19 million in fees during the fourth quarter of 2023 as compensation for providing services related to the administration of crop insurance business generated by CRS for its former owner prior to AFG’s acquisition of CRS. The expenses related to providing such services are embedded in underwriting expenses. Consistent with internal management reporting, these fees and the related expenses are netted and recorded as a reduction of loss adjustment and other underwriting expenses in AFG’s segmented results.
Holding Company and Other — Other Income
Other income in the table above includes $4 million in both the fourth quarter of 2024 and the fourth quarter of 2023, in management fees paid to AFG by the AFG-managed CLOs (AFG’s consolidated managed investment entities). The management fees are eliminated in consolidation — see the other income line in the Consolidate MIEs column under “Results of Operations — Segmented Statement of Earnings.” Excluding amounts eliminated in consolidation, AFG recorded other income outside of its property and casualty insurance segment of $2 million and $1 million in the fourth quarter of 2024 and the fourth quarter of 2023, respectively.
Holding Company and Other — Other Expenses
AFG’s holding companies and other operations outside of its property and casualty insurance segment recorded other expenses of $42 million in the fourth quarter of 2024 compared to $46 million in the fourth quarter of 2023, a decrease of $4 million (9%). This decrease is due primarily to lower aircraft related expenses in the fourth quarter of 2024 compared to the fourth quarter of 2023.
Holding Company and Other — Interest Charges on Borrowed Money
AFG’s holding companies and other operations outside of its property and casualty insurance segment recorded interest expense of $19 million in both the fourth quarter of 2024 and the fourth quarter of 2023.
Realized Gains (Losses) on Securities
AFG’s realized gains (losses) on securities were net losses of $10 million in the fourth quarter of 2024 compared to net gains of $31 million in the fourth quarter of 2023, a change of $41 million (132%). Realized gains (losses) on securities consisted of the following (in millions):
|
|
|
|
|
|
|
|
|
|
|
|
|
Three months ended December 31, |
| 2024 |
|
2023 |
| Realized gains (losses) before impairment allowances: |
|
|
|
| Disposals |
$ |
— |
|
|
$ |
(2) |
|
| Change in the fair value of equity securities |
3 |
|
|
33 |
|
| Change in the fair value of derivatives |
(3) |
|
|
2 |
|
|
— |
|
|
33 |
|
|
|
|
|
| Change in allowance for impairments on securities |
(10) |
|
|
(2) |
|
| Realized gains (losses) on securities |
$ |
(10) |
|
|
$ |
31 |
|
The $3 million net realized gain from the change in the fair value of equity securities in the fourth quarter of 2024 includes gains of $4 million on investments in technology companies. The $33 million net realized gain from the change in the fair value of equity securities in the fourth quarter of 2023 includes gains of $15 million on investments in banks and financing companies, $6 million on investments in retail companies, $5 million on investments in healthcare companies and $5 million on investments in media companies.
The $10 million change in allowance for impairments on securities in the fourth quarter of 2024 relates primarily to an allowance taken on fixed maturities from a single issuer in the retail sector.
Consolidated Income Taxes
AFG’s consolidated provision for income taxes was $65 million for the fourth quarter of 2024 compared to $72 million in the fourth quarter of 2023, a decrease of $7 million (10%). The following is a reconciliation of income taxes at the statutory rate to the provision for income taxes as shown in the segmented statement of earnings (dollars in millions):
|
|
|
|
|
|
|
|
|
|
|
|
|
|
|
|
|
|
|
|
|
|
|
|
|
Three months ended December 31, |
|
2024 |
|
2023 |
|
Amount |
|
% of EBT |
|
Amount |
|
% of EBT |
| Earnings before income taxes (“EBT”) |
$ |
320 |
|
|
|
|
$ |
335 |
|
|
|
|
|
|
|
|
|
|
|
| Income taxes at statutory rate |
$ |
67 |
|
|
21 |
% |
|
$ |
70 |
|
|
21 |
% |
| Effect of: |
|
|
|
|
|
|
|
| Tax exempt interest |
(2) |
|
|
(1 |
%) |
|
(1) |
|
|
— |
% |
| Employee stock ownership plan dividend paid deduction |
(2) |
|
|
(1 |
%) |
|
(2) |
|
|
(1 |
%) |
| Stock-based compensation |
(1) |
|
|
— |
% |
|
— |
|
|
— |
% |
| Change in valuation allowance |
(1) |
|
|
— |
% |
|
— |
|
|
— |
% |
| Dividend received deduction |
— |
|
|
— |
% |
|
(1) |
|
|
— |
% |
| Nondeductible expenses |
1 |
|
|
— |
% |
|
3 |
|
|
1 |
% |
| Foreign operations |
1 |
|
|
— |
% |
|
— |
|
|
— |
% |
| Other |
2 |
|
|
1 |
% |
|
3 |
|
|
— |
% |
| Provision for income taxes |
$ |
65 |
|
|
20 |
% |
|
$ |
72 |
|
|
21 |
% |
See Note L — “Income Taxes” to the financial statements for an analysis of items affecting AFG’s effective tax rate.
RESULTS OF OPERATIONS — YEARS ENDED DECEMBER 31, 2024, 2023 AND 2022
Segmented Statement of Earnings
AFG reports its operations as two segments: (i) Property and casualty insurance (“P&C”) and (ii) Other, which includes holding company costs and income and expenses related to the managed investment entities (“MIEs”).
AFG’s net earnings, determined in accordance with GAAP, include certain items that may not be indicative of its ongoing core operations. The following tables for the years ended December 31, 2024, 2023 and 2022 identify such items by segment and reconcile net earnings to core net operating earnings, a non-GAAP financial measure that AFG believes is a useful tool for investors and analysts in analyzing ongoing operating trends (in millions):
|
|
|
|
|
|
|
|
|
|
|
|
|
|
|
|
|
|
|
|
|
|
|
|
|
|
|
|
|
|
|
|
|
|
|
|
|
|
|
Other |
|
|
|
|
|
|
|
P&C |
|
Consol. MIEs |
|
Holding Co., other and unallocated |
|
Total |
|
Non-core reclass |
|
GAAP Total |
| Year ended December 31, 2024 |
|
|
|
|
|
|
|
|
|
|
|
| Revenues: |
|
|
|
|
|
|
|
|
|
|
|
Net earned premiums |
$ |
7,036 |
|
|
$ |
— |
|
|
$ |
— |
|
|
$ |
7,036 |
|
|
$ |
— |
|
|
$ |
7,036 |
|
| Net investment income |
784 |
|
|
(33) |
|
|
29 |
|
|
780 |
|
|
— |
|
|
780 |
|
Realized gains (losses) on securities |
— |
|
|
— |
|
|
— |
|
|
— |
|
|
— |
|
|
— |
|
| Income of MIEs: |
|
|
|
|
|
|
|
|
|
|
|
| Investment income |
— |
|
|
380 |
|
|
— |
|
|
380 |
|
|
— |
|
|
380 |
|
Gain (loss) on change in fair value of assets/liabilities |
— |
|
|
4 |
|
|
— |
|
|
4 |
|
|
— |
|
|
4 |
|
| Other income |
8 |
|
|
(13) |
|
|
129 |
|
|
124 |
|
|
— |
|
|
124 |
|
| Total revenues |
7,828 |
|
|
338 |
|
|
158 |
|
|
8,324 |
|
|
— |
|
|
8,324 |
|
|
|
|
|
|
|
|
|
|
|
|
|
| Costs and Expenses: |
|
|
|
|
|
|
|
|
|
|
|
| Losses and loss adjustment expenses |
4,455 |
|
|
— |
|
|
5 |
|
|
4,460 |
|
|
— |
|
|
4,460 |
|
| Commissions and other underwriting expenses |
1,961 |
|
|
— |
|
|
46 |
|
|
2,007 |
|
|
— |
|
|
2,007 |
|
| Interest charges on borrowed money |
— |
|
|
— |
|
|
76 |
|
|
76 |
|
|
— |
|
|
76 |
|
| Expenses of MIEs |
— |
|
|
338 |
|
|
— |
|
|
338 |
|
|
— |
|
|
338 |
|
| Other expenses |
84 |
|
|
— |
|
|
221 |
|
|
305 |
|
|
14 |
|
|
319 |
|
| Total costs and expenses |
6,500 |
|
|
338 |
|
|
348 |
|
|
7,186 |
|
|
14 |
|
|
7,200 |
|
Earnings before income taxes |
1,328 |
|
|
— |
|
|
(190) |
|
|
1,138 |
|
|
(14) |
|
|
1,124 |
|
| Provision for income taxes |
279 |
|
|
— |
|
|
(43) |
|
|
236 |
|
|
1 |
|
|
237 |
|
| Core Net Operating Earnings |
1,049 |
|
|
— |
|
|
(147) |
|
|
902 |
|
|
|
|
|
Non-core earnings (loss) (*): |
|
|
|
|
|
|
|
|
|
|
|
Realized gains (losses) on securities, net of tax |
— |
|
|
— |
|
|
— |
|
|
— |
|
|
— |
|
|
— |
|
Realized loss on subsidiary |
(4) |
|
|
— |
|
|
— |
|
|
(4) |
|
|
4 |
|
|
— |
|
Special A&E charge, net of tax |
— |
|
|
— |
|
|
(11) |
|
|
(11) |
|
|
11 |
|
|
— |
|
Net Earnings |
$ |
1,045 |
|
|
$ |
— |
|
|
$ |
(158) |
|
|
$ |
887 |
|
|
$ |
— |
|
|
$ |
887 |
|
|
|
|
|
|
|
|
|
|
|
|
|
|
|
|
|
|
|
|
|
|
|
|
|
|
|
|
|
|
|
|
|
|
|
|
|
|
|
|
Other |
|
|
|
|
|
|
|
P&C |
|
Consol. MIEs |
|
Holding Co., other and unallocated |
|
Total |
|
Non-core reclass |
|
GAAP Total |
| Year ended December 31, 2023 |
|
|
|
|
|
|
|
|
|
|
|
| Revenues: |
|
|
|
|
|
|
|
|
|
|
|
Net earned premiums |
$ |
6,531 |
|
|
$ |
— |
|
|
$ |
— |
|
|
$ |
6,531 |
|
|
$ |
— |
|
|
$ |
6,531 |
|
| Net investment income |
729 |
|
|
(27) |
|
|
40 |
|
|
742 |
|
|
— |
|
|
742 |
|
Realized gains (losses) on: |
|
|
|
|
|
|
|
|
|
|
|
Securities |
— |
|
|
— |
|
|
— |
|
|
— |
|
|
(36) |
|
|
(36) |
|
Subsidiary |
— |
|
|
— |
|
|
— |
|
|
— |
|
|
(4) |
|
|
(4) |
|
| Income of MIEs: |
|
|
|
|
|
|
|
|
|
|
|
| Investment income |
— |
|
|
421 |
|
|
— |
|
|
421 |
|
|
— |
|
|
421 |
|
Gain (loss) on change in fair value of assets/liabilities |
— |
|
|
27 |
|
|
— |
|
|
27 |
|
|
— |
|
|
27 |
|
| Other income |
16 |
|
|
(16) |
|
|
146 |
|
|
146 |
|
|
— |
|
|
146 |
|
| Total revenues |
7,276 |
|
|
405 |
|
|
186 |
|
|
7,867 |
|
|
(40) |
|
|
7,827 |
|
|
|
|
|
|
|
|
|
|
|
|
|
| Costs and Expenses: |
|
|
|
|
|
|
|
|
|
|
|
| Losses and loss adjustment expenses |
4,017 |
|
|
— |
|
|
16 |
|
|
4,033 |
|
|
— |
|
|
4,033 |
|
| Commissions and other underwriting expenses |
1,883 |
|
|
— |
|
|
52 |
|
|
1,935 |
|
|
— |
|
|
1,935 |
|
| Interest charges on borrowed money |
— |
|
|
— |
|
|
76 |
|
|
76 |
|
|
— |
|
|
76 |
|
| Expenses of MIEs |
— |
|
|
405 |
|
|
— |
|
|
405 |
|
|
— |
|
|
405 |
|
| Other expenses |
72 |
|
|
— |
|
|
219 |
|
|
291 |
|
|
14 |
|
|
305 |
|
| Total costs and expenses |
5,972 |
|
|
405 |
|
|
363 |
|
|
6,740 |
|
|
14 |
|
|
6,754 |
|
Earnings before income taxes |
1,304 |
|
|
— |
|
|
(177) |
|
|
1,127 |
|
|
(54) |
|
|
1,073 |
|
| Provision for income taxes |
265 |
|
|
— |
|
|
(33) |
|
|
232 |
|
|
(11) |
|
|
221 |
|
Core Net Operating Earnings |
1,039 |
|
|
— |
|
|
(144) |
|
|
895 |
|
|
|
|
|
Non-core earnings (loss) (*): |
|
|
|
|
|
|
|
|
|
|
|
Realized gains (losses) on securities, net of tax |
— |
|
|
— |
|
|
(28) |
|
|
(28) |
|
|
28 |
|
|
— |
|
Realized loss on subsidiary |
(4) |
|
|
— |
|
|
— |
|
|
(4) |
|
|
4 |
|
|
— |
|
Special A&E charge, net of tax |
— |
|
|
— |
|
|
(12) |
|
|
(12) |
|
|
12 |
|
|
— |
|
Gain on retirement of debt, net of tax |
— |
|
|
— |
|
|
1 |
|
|
1 |
|
|
(1) |
|
|
— |
|
Net Earnings |
$ |
1,035 |
|
|
$ |
— |
|
|
$ |
(183) |
|
|
$ |
852 |
|
|
$ |
— |
|
|
$ |
852 |
|
|
|
|
|
|
|
|
|
|
|
|
|
|
|
|
|
|
|
|
|
|
|
|
|
|
|
|
|
|
|
|
|
|
|
|
|
|
|
|
Other |
|
|
|
|
|
|
|
P&C |
|
Consol. MIEs |
|
Holding Co., other and unallocated |
|
Total |
|
Non-core reclass |
|
GAAP Total |
| Year ended December 31, 2022 |
|
|
|
|
|
|
|
|
|
|
|
| Revenues: |
|
|
|
|
|
|
|
|
|
|
|
Net earned premiums |
$ |
6,085 |
|
|
$ |
— |
|
|
$ |
— |
|
|
$ |
6,085 |
|
|
$ |
— |
|
|
$ |
6,085 |
|
| Net investment income |
683 |
|
|
10 |
|
|
24 |
|
|
717 |
|
|
— |
|
|
717 |
|
Realized gains (losses) on securities |
— |
|
|
— |
|
|
— |
|
|
— |
|
|
(116) |
|
|
(116) |
|
| Income of MIEs: |
|
|
|
|
|
|
|
|
|
|
|
| Investment income |
— |
|
|
268 |
|
|
— |
|
|
268 |
|
|
— |
|
|
268 |
|
Gain (loss) on change in fair value of assets/liabilities |
— |
|
|
(31) |
|
|
— |
|
|
(31) |
|
|
— |
|
|
(31) |
|
| Other income |
12 |
|
|
(17) |
|
|
122 |
|
|
117 |
|
|
— |
|
|
117 |
|
| Total revenues |
6,780 |
|
|
230 |
|
|
146 |
|
|
7,156 |
|
|
(116) |
|
|
7,040 |
|
|
|
|
|
|
|
|
|
|
|
|
|
| Costs and Expenses: |
|
|
|
|
|
|
|
|
|
|
|
| Losses and loss adjustment expenses |
3,629 |
|
|
— |
|
|
— |
|
|
3,629 |
|
|
— |
|
|
3,629 |
|
| Commissions and other underwriting expenses |
1,680 |
|
|
— |
|
|
38 |
|
|
1,718 |
|
|
— |
|
|
1,718 |
|
| Interest charges on borrowed money |
— |
|
|
— |
|
|
85 |
|
|
85 |
|
|
— |
|
|
85 |
|
| Expenses of MIEs |
— |
|
|
230 |
|
|
— |
|
|
230 |
|
|
— |
|
|
230 |
|
| Other expenses |
52 |
|
|
— |
|
|
194 |
|
|
246 |
|
|
9 |
|
|
255 |
|
| Total costs and expenses |
5,361 |
|
|
230 |
|
|
317 |
|
|
5,908 |
|
|
9 |
|
|
5,917 |
|
Earnings before income taxes |
1,419 |
|
|
— |
|
|
(171) |
|
|
1,248 |
|
|
(125) |
|
|
1,123 |
|
| Provision for income taxes |
295 |
|
|
— |
|
|
(40) |
|
|
255 |
|
|
(30) |
|
|
225 |
|
Core Net Operating Earnings |
1,124 |
|
|
— |
|
|
(131) |
|
|
993 |
|
|
|
|
|
Non-core earnings (loss) (*): |
|
|
|
|
|
|
|
|
|
|
|
Realized gains (losses) on securities, net of tax |
— |
|
|
— |
|
|
(92) |
|
|
(92) |
|
|
92 |
|
|
— |
|
Loss on retirement of debt, net of tax |
— |
|
|
— |
|
|
(7) |
|
|
(7) |
|
|
7 |
|
|
— |
|
Other, net of tax |
— |
|
|
— |
|
|
4 |
|
|
4 |
|
|
(4) |
|
|
— |
|
Net Earnings |
$ |
1,124 |
|
|
$ |
— |
|
|
$ |
(226) |
|
|
$ |
898 |
|
|
$ |
— |
|
|
$ |
898 |
|
(*)See the reconciliation of core earnings to GAAP net earnings under “Results of Operations — General” for details on the tax and noncontrolling interest impacts of these reconciling items.
Property and Casualty Insurance Segment — Results of Operations
AFG’s property and casualty insurance operations contributed $1.33 billion in GAAP pretax earnings in 2024 compared to $1.30 billion in 2023, an increase of $28 million (2%). Property and casualty core pretax earnings were $1.33 billion in 2024 compared to $1.30 billion in 2023, an increase of $24 million (2%). The increase in GAAP and core pretax earnings in 2024 compared to 2023 reflects higher investment income outside of alternative investments, partially offset by lower investment income from AFG’s alternative investment portfolio (partnerships and similar investments and AFG-managed CLOs) and lower underwriting profit.
AFG’s property and casualty insurance operations contributed $1.30 billion in GAAP pretax earnings in 2023 compared to $1.42 billion in 2022, a decrease of $119 million (8%). Property and casualty core pretax earnings were $1.30 billion in 2023 compared to $1.42 billion in 2022, a decrease of $115 million (8%). The decrease in GAAP and core pretax earnings reflects lower underwriting profit and lower investment income from alternative investments, partially offset by higher investment income outside of alternative investments in 2023 compared to 2022.
The following table details AFG’s GAAP and core earnings before income taxes from its property and casualty insurance operations for the years ended December 31, 2024, 2023 and 2022 (dollars in millions):
|
|
|
|
|
|
|
|
|
|
|
|
|
|
|
|
|
|
|
|
|
|
|
|
|
|
|
|
|
|
|
Year ended December 31, |
|
% Change |
|
2024 |
|
2023 |
|
2022 |
|
2024 - 2023 |
|
2023 - 2022 |
| Gross written premiums |
$ |
10,533 |
|
|
$ |
9,656 |
|
|
$ |
9,057 |
|
|
9 |
% |
|
7 |
% |
| Reinsurance premiums ceded |
(3,394) |
|
|
(2,964) |
|
|
(2,851) |
|
|
15 |
% |
|
4 |
% |
| Net written premiums |
7,139 |
|
|
6,692 |
|
|
6,206 |
|
|
7 |
% |
|
8 |
% |
| Change in unearned premiums |
(103) |
|
|
(161) |
|
|
(121) |
|
|
(36 |
%) |
|
33 |
% |
| Net earned premiums |
7,036 |
|
|
6,531 |
|
|
6,085 |
|
|
8 |
% |
|
7 |
% |
Loss and loss adjustment expenses |
4,455 |
|
|
4,017 |
|
|
3,629 |
|
|
11 |
% |
|
11 |
% |
| Commissions and other underwriting expenses |
1,961 |
|
|
1,883 |
|
|
1,680 |
|
|
4 |
% |
|
12 |
% |
Underwriting gain |
620 |
|
|
631 |
|
|
776 |
|
|
(2 |
%) |
|
(19 |
%) |
|
|
|
|
|
|
|
|
|
|
| Net investment income |
784 |
|
|
729 |
|
|
683 |
|
|
8 |
% |
|
7 |
% |
| Other income and expenses, net |
(76) |
|
|
(56) |
|
|
(40) |
|
|
36 |
% |
|
40 |
% |
| Core earnings before income taxes |
1,328 |
|
|
1,304 |
|
|
1,419 |
|
|
2 |
% |
|
(8 |
%) |
Realized loss on subsidiary |
— |
|
|
(4) |
|
|
— |
|
|
(100 |
%) |
|
— |
% |
GAAP earnings before income taxes |
$ |
1,328 |
|
|
$ |
1,300 |
|
|
$ |
1,419 |
|
|
2 |
% |
|
(8 |
%) |
|
|
|
|
|
|
|
|
|
|
|
|
Year ended December 31, |
|
Change |
| Combined Ratios: |
2024 |
|
2023 |
|
2022 |
|
2024 - 2023 |
|
2023 - 2022 |
| Specialty lines |
|
|
|
|
|
|
|
|
|
| Loss and LAE ratio |
63.3 |
% |
|
61.5 |
% |
|
59.6 |
% |
|
1.8 |
% |
|
1.9 |
% |
| Underwriting expense ratio |
27.9 |
% |
|
28.8 |
% |
|
27.6 |
% |
|
(0.9 |
%) |
|
1.2 |
% |
| Combined ratio |
91.2 |
% |
|
90.3 |
% |
|
87.2 |
% |
|
0.9 |
% |
|
3.1 |
% |
|
|
|
|
|
|
|
|
|
|
| Aggregate — including exited lines |
|
|
|
|
|
|
|
|
|
| Loss and LAE ratio |
63.3 |
% |
|
61.6 |
% |
|
59.7 |
% |
|
1.7 |
% |
|
1.9 |
% |
| Underwriting expense ratio |
27.9 |
% |
|
28.8 |
% |
|
27.6 |
% |
|
(0.9 |
%) |
|
1.2 |
% |
| Combined ratio |
91.2 |
% |
|
90.4 |
% |
|
87.3 |
% |
|
0.8 |
% |
|
3.1 |
% |
AFG reports the underwriting performance of its Specialty property and casualty insurance business in the following sub-segments: (i) Property and transportation, (ii) Specialty casualty and (iii) Specialty financial.
Gross Written Premiums
Gross written premiums (“GWP”) for AFG’s property and casualty insurance segment were $10.53 billion in 2024 compared to $9.66 billion in 2023, an increase of $877 million (9%). GWP increased $599 million (7%) in 2023 compared to 2022. Detail of AFG’s property and casualty gross written premiums is shown below (dollars in millions):
|
|
|
|
|
|
|
|
|
|
|
|
|
|
|
|
|
|
|
|
|
|
|
|
|
|
|
|
|
|
|
|
|
|
|
|
|
|
|
|
|
|
|
|
|
|
|
|
|
Year ended December 31, |
|
% Change |
|
2024 |
|
2023 |
|
2022 |
|
2024 - 2023 |
|
2023 - 2022 |
|
GWP |
|
% |
|
GWP |
|
% |
|
GWP |
|
% |
|
|
|
|
| Property and transportation |
$ |
4,735 |
|
|
45 |
% |
|
$ |
4,146 |
|
|
43 |
% |
|
$ |
4,060 |
|
|
45 |
% |
|
14 |
% |
|
2 |
% |
| Specialty casualty |
4,543 |
|
|
43 |
% |
|
4,368 |
|
|
45 |
% |
|
4,115 |
|
|
45 |
% |
|
4 |
% |
|
6 |
% |
| Specialty financial |
1,255 |
|
|
12 |
% |
|
1,142 |
|
|
12 |
% |
|
882 |
|
|
10 |
% |
|
10 |
% |
|
29 |
% |
|
$ |
10,533 |
|
|
100 |
% |
|
$ |
9,656 |
|
|
100 |
% |
|
$ |
9,057 |
|
|
100 |
% |
|
9 |
% |
|
7 |
% |
Reinsurance Premiums Ceded
Reinsurance premiums ceded (“Ceded”) for AFG’s property and casualty insurance segment were 32% of gross written premiums for the year ended December 31, 2024 and 31% for both years ended December 31, 2023 and December 31, 2022, an increase of 1 percentage point for 2024 compared to 2023 and 2022. Detail of AFG’s property and casualty reinsurance premiums ceded is shown below (dollars in millions):
|
|
|
|
|
|
|
|
|
|
|
|
|
|
|
|
|
|
|
|
|
|
|
|
|
|
|
|
|
|
|
|
|
|
|
|
|
|
|
|
|
|
|
|
|
|
|
|
|
Year ended December 31, |
|
Change in % of GWP |
|
2024 |
|
2023 |
|
2022 |
|
2024 - 2023 |
|
2023 - 2022 |
|
Ceded |
|
% of GWP |
|
Ceded |
|
% of GWP |
|
Ceded |
|
% of GWP |
|
|
|
|
| Property and transportation |
$ |
(1,924) |
|
|
41 |
% |
|
$ |
(1,595) |
|
|
38 |
% |
|
$ |
(1,545) |
|
|
38 |
% |
|
3 |
% |
|
— |
% |
| Specialty casualty |
(1,500) |
|
|
33 |
% |
|
(1,424) |
|
|
33 |
% |
|
(1,387) |
|
|
34 |
% |
|
— |
% |
|
(1 |
%) |
| Specialty financial |
(210) |
|
|
17 |
% |
|
(207) |
|
|
18 |
% |
|
(171) |
|
|
19 |
% |
|
(1 |
%) |
|
(1 |
%) |
| Other specialty |
240 |
|
|
|
|
262 |
|
|
|
|
252 |
|
|
|
|
|
|
|
|
$ |
(3,394) |
|
|
32 |
% |
|
$ |
(2,964) |
|
|
31 |
% |
|
$ |
(2,851) |
|
|
31 |
% |
|
1 |
% |
|
— |
% |
Net Written Premiums
Net written premiums (“NWP”) for AFG’s property and casualty insurance segment were $7.14 billion in 2024 compared to $6.69 billion in 2023, an increase of $447 million (7%). NWP increased $486 million (8%) in 2023 compared to 2022. Detail of AFG’s property and casualty net written premiums is shown below (dollars in millions):
|
|
|
|
|
|
|
|
|
|
|
|
|
|
|
|
|
|
|
|
|
|
|
|
|
|
|
|
|
|
|
|
|
|
|
|
|
|
|
|
|
|
|
|
|
|
|
|
|
Year ended December 31, |
|
% Change |
|
2024 |
|
2023 |
|
2022 |
|
2024 - 2023 |
|
2023 - 2022 |
|
NWP |
|
% |
|
NWP |
|
% |
|
NWP |
|
% |
|
|
|
|
| Property and transportation |
$ |
2,811 |
|
|
39 |
% |
|
$ |
2,551 |
|
|
38 |
% |
|
$ |
2,515 |
|
|
41 |
% |
|
10 |
% |
|
1 |
% |
| Specialty casualty |
3,043 |
|
|
43 |
% |
|
2,944 |
|
|
44 |
% |
|
2,728 |
|
|
44 |
% |
|
3 |
% |
|
8 |
% |
| Specialty financial |
1,045 |
|
|
15 |
% |
|
935 |
|
|
14 |
% |
|
711 |
|
|
11 |
% |
|
12 |
% |
|
32 |
% |
| Other specialty |
240 |
|
|
3 |
% |
|
262 |
|
|
4 |
% |
|
252 |
|
|
4 |
% |
|
(8 |
%) |
|
4 |
% |
|
$ |
7,139 |
|
|
100 |
% |
|
$ |
6,692 |
|
|
100 |
% |
|
$ |
6,206 |
|
|
100 |
% |
|
7 |
% |
|
8 |
% |
Net Earned Premiums
Net earned premiums (“NEP”) for AFG’s property and casualty insurance segment were $7.04 billion in 2024 compared to $6.53 billion in 2023, an increase of $505 million (8%). NEP increased $446 million (7%) in 2023 compared to 2022. Detail of AFG’s property and casualty net earned premiums is shown below (dollars in millions):
|
|
|
|
|
|
|
|
|
|
|
|
|
|
|
|
|
|
|
|
|
|
|
|
|
|
|
|
|
|
|
|
|
|
|
|
|
|
|
|
|
|
|
|
|
|
|
|
|
Year ended December 31, |
|
% Change |
|
2024 |
|
2023 |
|
2022 |
|
2024 - 2023 |
|
2023 - 2022 |
|
NEP |
|
% |
|
NEP |
|
% |
|
NEP |
|
% |
|
|
|
|
| Property and transportation |
$ |
2,793 |
|
|
40 |
% |
|
$ |
2,519 |
|
|
39 |
% |
|
$ |
2,487 |
|
|
41 |
% |
|
11 |
% |
|
1 |
% |
| Specialty casualty |
2,967 |
|
|
42 |
% |
|
2,886 |
|
|
44 |
% |
|
2,659 |
|
|
44 |
% |
|
3 |
% |
|
9 |
% |
| Specialty financial |
1,032 |
|
|
15 |
% |
|
867 |
|
|
13 |
% |
|
698 |
|
|
11 |
% |
|
19 |
% |
|
24 |
% |
| Other specialty |
244 |
|
|
3 |
% |
|
259 |
|
|
4 |
% |
|
241 |
|
|
4 |
% |
|
(6 |
%) |
|
7 |
% |
|
$ |
7,036 |
|
|
100 |
% |
|
$ |
6,531 |
|
|
100 |
% |
|
$ |
6,085 |
|
|
100 |
% |
|
8 |
% |
|
7 |
% |
The $877 million (9%) increase in gross written premiums in 2024 compared to 2023 reflects growth in each of the Specialty property and casualty sub-segments as a result of additional crop premiums from the CRS acquisition in the Property and transportation sub-segment and new business opportunities, increased exposures and a good renewal rate environment. Overall average renewal rates increased approximately 7% in 2024. Excluding the workers’ compensation businesses, renewal pricing increased approximately 8%.
The $599 million (7%) increase in gross written premiums in 2023 compared to 2022 reflects growth in each of the Specialty property and casualty sub-segments as a result of a combination of new business opportunities, increased exposures and a good renewal rate environment. Overall average renewal rates increased approximately 5% in 2023. Excluding the workers’ compensation businesses, renewal pricing increased approximately 6%.
Property and transportation Gross written premiums increased $589 million (14%) in 2024 compared to 2023. Year-over-year premium growth resulted from additional crop premium associated with the CRS acquisition as well as new business opportunities, a favorable rate environment and increased exposures in the commercial auto businesses. This year-over-year premium growth was tempered by the impact of lower year-over-year commodity pricing on winter wheat premiums, coupled with elevated pricing competition and the non-renewal of certain under-performing accounts in the transportation businesses.
Excluding crop premium, gross and net written premiums in this group grew by 5% and 4%, respectively. Average renewal rates increased approximately 8% for this group in 2024. Reinsurance premiums ceded as a percentage of gross written premiums increased 3 percentage points in 2024 compared to 2023 reflecting the impact of higher cessions in the crop business and growth in certain programs in the transportation businesses that cede a larger percentage of premiums than some of the other businesses in the Property and transportation sub-segment.
Gross written premiums increased $86 million (2%) in 2023 compared to 2022 reflecting the impact of increased rates, retentions and exposures in the transportation and ocean marine businesses and slightly higher crop premium related to the CRS acquisition in the fourth quarter of 2023. These items were partially offset by the impact of 2023 spring commodity futures pricing and related volatility on premiums in the crop business. Average renewal rates increased approximately 6% for this group in 2023. Reinsurance premiums ceded as a percentage of gross written premiums were comparable in 2023 and 2022 reflecting growth in alternative risk transfer products in the transportation businesses, offset by the impact of lower cessions in the crop business. Both of these businesses cede a larger percentage of premiums than some of the other businesses in the Property and transportation sub-segment.
Specialty casualty Gross written premiums increased $175 million (4%) in 2024 compared to 2023. The higher-year-over-year premiums resulted primarily from growth in the excess and surplus, excess liability and certain targeted markets businesses as a result of rate increases, new business opportunities and strong policy retention. The mergers and acquisitions liability business also benefited from an increase in mergers and acquisition activity. This growth was tempered by lower year-over-year workers’ compensation premiums. Average renewal rates increased approximately 6% for this group in 2024. Excluding overall rate decreases in the workers’ compensation businesses, renewal rates for this group increased approximately 9% in 2024. Reinsurance premiums ceded as a percentage of gross written premiums were comparable in 2024 and 2023 reflecting lower cessions in certain more heavily reinsured products in the social services business, offset by the impact of higher premiums in the excess and surplus and mergers and acquisitions liability businesses, which cede a larger percentage of premiums than some of the other businesses in the Specialty casualty sub-segment and higher cessions in the public sector business.
Gross written premiums increased $253 million (6%) in 2023 compared to 2022 due primarily to increased exposures from payroll growth and new business in the workers’ compensation businesses, new business opportunities, strong policy retention and rate increases in several of the targeted markets businesses and increased exposures and higher renewal rates in the excess and surplus and excess liability businesses. This growth was partially offset by lower premiums in the mergers and acquisitions liability and executive liability businesses. Average renewal rates increased approximately 4% for this group in 2023. Excluding overall rate decreases in the workers’ compensation businesses, renewal rates for this group increased approximately 6% in 2023. Reinsurance premiums ceded as a percentage of gross written premiums decreased 1 percentage point in 2023 compared to 2022 reflecting higher premiums in the workers’ compensation businesses (which cede a lower percentage of premiums than some of the other businesses in the Specialty casualty sub-segment) and lower cessions in the environmental and mergers and acquisitions liability businesses and at ABA Insurance Services.
Specialty financial Gross written premiums increased $113 million (10%) in 2024 compared to 2023. Year-over-year growth in the financial institutions business was partially offset by a decision to pause writing of new intellectual property-related coverage. Average renewal rates increased approximately 6% for this group in 2024. Reinsurance premiums ceded as a percentage of gross written premiums decreased 1 percentage point in 2024 compared to 2023 reflecting lower gross written premiums in the innovative markets business, which cedes a larger percentage of premiums than some of the other businesses in the Specialty financial sub-segment, partially offset by the impact of higher reinstatement premiums paid to reinsurers in the fidelity and surety businesses.
Gross written premiums increased $260 million (29%) in 2023 compared to 2022 due primarily to growth in the financial institutions business. Average renewal rates for this group increased approximately 5% in 2023. Reinsurance premiums ceded as a percentage of gross written premiums decreased 1 percentage point in 2023 compared to 2022 reflecting the impact of reinstatement premiums paid to reinsurers in 2022 related to Hurricane Ian.
Other specialty The amounts shown as reinsurance premiums ceded represent business assumed by AFG’s internal reinsurance program from the operations that make up AFG’s other Specialty property and casualty insurance sub-segments. Reinsurance premiums assumed decreased $22 million (8%) in 2024 compared to 2023 and increased $10 million (4%) in 2023 compared to 2022, reflecting changes in premiums retained, primarily from businesses in the Specialty casualty sub-segment.
Combined Ratio
The table below (dollars in millions) details the components of the combined ratio for AFG’s property and casualty insurance segment for 2024, 2023 and 2022:
|
|
|
|
|
|
|
|
|
|
|
|
|
|
|
|
|
|
|
|
|
|
|
|
|
|
|
|
|
|
|
|
|
|
|
|
|
|
|
|
|
|
|
|
|
|
|
|
|
Year ended December 31, |
|
Change |
|
Year ended December 31, |
|
2024 |
|
2023 |
|
2022 |
|
2024 - 2023 |
|
2023 - 2022 |
|
2024 |
|
2023 |
|
2022 |
| Property and transportation |
|
|
|
|
|
|
|
|
|
|
|
|
|
|
|
| Loss and LAE ratio |
69.9 |
% |
|
69.2 |
% |
|
69.8 |
% |
|
0.7 |
% |
|
(0.6 |
%) |
|
|
|
|
|
|
| Underwriting expense ratio |
22.5 |
% |
|
23.6 |
% |
|
21.9 |
% |
|
(1.1 |
%) |
|
1.7 |
% |
|
|
|
|
|
|
| Combined ratio |
92.4 |
% |
|
92.8 |
% |
|
91.7 |
% |
|
(0.4 |
%) |
|
1.1 |
% |
|
|
|
|
|
|
| Underwriting profit |
|
|
|
|
|
|
|
|
|
|
$ |
211 |
|
|
$ |
184 |
|
|
$ |
208 |
|
|
|
|
|
|
|
|
|
|
|
|
|
|
|
|
|
| Specialty casualty |
|
|
|
|
|
|
|
|
|
|
|
|
|
|
|
| Loss and LAE ratio |
62.4 |
% |
|
60.3 |
% |
|
54.7 |
% |
|
2.1 |
% |
|
5.6 |
% |
|
|
|
|
|
|
| Underwriting expense ratio |
26.1 |
% |
|
26.7 |
% |
|
26.5 |
% |
|
(0.6 |
%) |
|
0.2 |
% |
|
|
|
|
|
|
| Combined ratio |
88.5 |
% |
|
87.0 |
% |
|
81.2 |
% |
|
1.5 |
% |
|
5.8 |
% |
|
|
|
|
|
|
| Underwriting profit |
|
|
|
|
|
|
|
|
|
|
$ |
340 |
|
|
$ |
375 |
|
|
$ |
500 |
|
|
|
|
|
|
|
|
|
|
|
|
|
|
|
|
|
| Specialty financial |
|
|
|
|
|
|
|
|
|
|
|
|
|
|
|
| Loss and LAE ratio |
41.6 |
% |
|
37.8 |
% |
|
34.1 |
% |
|
3.8 |
% |
|
3.7 |
% |
|
|
|
|
|
|
| Underwriting expense ratio |
45.5 |
% |
|
49.5 |
% |
|
49.6 |
% |
|
(4.0 |
%) |
|
(0.1 |
%) |
|
|
|
|
|
|
| Combined ratio |
87.1 |
% |
|
87.3 |
% |
|
83.7 |
% |
|
(0.2 |
%) |
|
3.6 |
% |
|
|
|
|
|
|
| Underwriting profit |
|
|
|
|
|
|
|
|
|
|
$ |
134 |
|
|
$ |
110 |
|
|
$ |
114 |
|
|
|
|
|
|
|
|
|
|
|
|
|
|
|
|
|
| Total Specialty |
|
|
|
|
|
|
|
|
|
|
|
|
|
|
|
| Loss and LAE ratio |
63.3 |
% |
|
61.5 |
% |
|
59.6 |
% |
|
1.8 |
% |
|
1.9 |
% |
|
|
|
|
|
|
| Underwriting expense ratio |
27.9 |
% |
|
28.8 |
% |
|
27.6 |
% |
|
(0.9 |
%) |
|
1.2 |
% |
|
|
|
|
|
|
| Combined ratio |
91.2 |
% |
|
90.3 |
% |
|
87.2 |
% |
|
0.9 |
% |
|
3.1 |
% |
|
|
|
|
|
|
| Underwriting profit |
|
|
|
|
|
|
|
|
|
|
$ |
626 |
|
|
$ |
633 |
|
|
$ |
780 |
|
|
|
|
|
|
|
|
|
|
|
|
|
|
|
|
|
| Aggregate — including exited lines |
|
|
|
|
|
|
|
|
|
|
|
|
|
|
| Loss and LAE ratio |
63.3 |
% |
|
61.6 |
% |
|
59.7 |
% |
|
1.7 |
% |
|
1.9 |
% |
|
|
|
|
|
|
| Underwriting expense ratio |
27.9 |
% |
|
28.8 |
% |
|
27.6 |
% |
|
(0.9 |
%) |
|
1.2 |
% |
|
|
|
|
|
|
| Combined ratio |
91.2 |
% |
|
90.4 |
% |
|
87.3 |
% |
|
0.8 |
% |
|
3.1 |
% |
|
|
|
|
|
|
| Underwriting profit |
|
|
|
|
|
|
|
|
|
|
$ |
620 |
|
|
$ |
631 |
|
|
$ |
776 |
|
The Specialty property and casualty insurance operations generated an underwriting profit of $626 million in 2024 compared to $633 million in 2023, a decrease of $7 million (1%). Higher underwriting profit in the Property and transportation and Specialty financial sub-segments was more than offset by lower underwriting profit in the Specialty casualty sub-segment and higher losses in the business assumed by AFG’s internal reinsurance program. Overall catastrophe losses were $182 million (2.6 points on the combined ratio), including $2 million in net reinstatement premiums, for 2024 compared to catastrophe losses of $165 million (2.5 points), including $3 million in net reinstatement premiums, for 2023.
The Specialty property and casualty insurance operations generated an underwriting profit of $633 million in 2023 compared to $780 million in 2022, a decrease of $147 million (19%). This decrease reflects lower underwriting profit in each of the Specialty property and casualty insurance sub-segments. Overall catastrophe losses were $165 million (2.5 points on the combined ratio), including $3 million in net reinstatement premiums, for 2023 compared to catastrophe losses of $93 million (1.5 points), including $5 million in net reinstatement premiums, for 2022.
Property and transportation Underwriting profit for this group was $211 million in 2024 compared to $184 million in 2023, an increase of $27 million (15%). Higher year-over-year underwriting profit in the property and inland marine and crop insurance operations was partially offset by lower underwriting profitability in the transportation businesses. Catastrophe losses were $65 million (2.3 points on the combined ratio), including $1 million in net reinstatement premiums, in 2024 compared to catastrophe losses of $53 million (2.0 points), including $2 million in net reinstatement premiums, in 2023.
Underwriting profit for this group was $184 million in 2023 compared to $208 million in 2022, a decrease of $24 million (12%). Below average underwriting profitability in the crop insurance operations was partially offset by higher year-over-year underwriting profit in the property and inland marine business. Catastrophe losses were $53 million (2.0 points on the combined ratio), including $2 million in net reinstatement premiums, in 2023 compared to catastrophe losses of $45 million (1.9 points), including $3 million in net reinstatement premiums, in 2022.
Specialty casualty Underwriting profit for this group was $340 million in 2024 compared to $375 million in 2023, a decrease of $35 million (9%). Higher year-over-year underwriting profit in the targeted markets businesses was more than offset by lower levels of favorable prior year reserve development in the executive liability business and social inflation driven adverse development in the umbrella and excess business. Catastrophe losses were $32 million (1.1 points on the combined ratio), including $1 million in net reinstatement premiums, in 2024 compared to catastrophe losses of $36 million (1.2 points), including $1 million in net reinstatement premiums, in 2023.
Underwriting profit for this group was $375 million in 2023 compared to $500 million in 2022, a decrease of $125 million (25%). The lower year-over-year underwriting profit was due primarily to lower favorable prior year reserve development in the workers’ compensation businesses and adverse reserve development in the public sector and excess and surplus businesses, partially offset by higher favorable prior year reserve development in the executive liability business. Catastrophe losses were $36 million (1.2 points on the combined ratio), including $1 million in net reinstatement premiums, in 2023 compared to catastrophe losses of $11 million (0.5 points) in 2022.
Specialty financial Underwriting profit for this group was $134 million in 2024 compared to $110 million in 2023, an increase of $24 million (22%). This year-over-year increase reflects higher underwriting profit in the financial institutions business, partially offset by lower profitability resulting from the pause in writing of intellectual property-related coverage. Catastrophe losses were $81 million (7.8 points on the combined ratio) in 2024 compared to catastrophe losses of $49 million (5.7 points) in 2023.
Underwriting profit for this group was $110 million in 2023 compared to $114 million in 2022, a decrease of $4 million (4%). This decrease reflects higher year-over-year catastrophe losses in the financial institutions business and lower underwriting profit in the surety business. Catastrophe losses were $49 million (5.7 points on the combined ratio) in 2023 compared to catastrophe losses of $36 million (4.9 points), including $3 million in net reinstatement premiums, in 2022.
Other specialty This group reported an underwriting loss of $59 million in 2024 compared to $36 million in 2023, an increase of $23 million (64%), reflecting higher losses in the business assumed by AFG’s internal reinsurance program from the operations that make up AFG’s other Specialty sub-segments. Catastrophe losses were $4 million in 2024 compared to $27 million in 2023.
This group reported an underwriting loss of $36 million in 2023 compared to $42 million in 2022, a decrease of $6 million (14%), reflecting lower losses in the business assumed by AFG’s internal reinsurance program from the operations that make up AFG’s other Specialty sub-segments. The underwriting loss in 2022 relates primarily to losses from social inflation exposed operations in the Specialty casualty sub-segment. Catastrophe losses were $27 million in 2023 compared to $1 million in 2022.
Aggregate Aggregate underwriting results for AFG’s property and casualty insurance segment include adverse prior year reserve development of $6 million in 2024, $2 million in 2023 and $4 million in 2022, related to business outside of the Specialty group that AFG no longer writes.
Losses and Loss Adjustment Expenses
AFG’s overall loss and LAE ratio was 63.3%, 61.6% and 59.7% in 2024, 2023 and 2022, respectively. The components of AFG’s property and casualty losses and LAE amounts and ratio are detailed below (dollars in millions):
|
|
|
|
|
|
|
|
|
|
|
|
|
|
|
|
|
|
|
|
|
|
|
|
|
|
|
|
|
|
|
|
|
|
|
|
|
|
|
|
|
|
|
|
|
|
|
|
|
Year ended December 31, |
|
|
|
|
|
Amount |
|
Ratio |
|
Change in Ratio |
|
2024 |
|
2023 |
|
2022 |
|
2024 |
|
2023 |
|
2022 |
|
2024 - 2023 |
|
2023 - 2022 |
| Property and transportation |
|
|
|
|
|
|
|
|
|
|
|
|
|
|
|
Current year, excluding catastrophe losses |
$ |
1,982 |
|
|
$ |
1,774 |
|
|
$ |
1,785 |
|
|
71.0 |
% |
|
70.5 |
% |
|
71.6 |
% |
|
0.5 |
% |
|
(1.1 |
%) |
| Prior accident years development |
(94) |
|
|
(84) |
|
|
(92) |
|
|
(3.4 |
%) |
|
(3.3 |
%) |
|
(3.7 |
%) |
|
(0.1 |
%) |
|
0.4 |
% |
| Current year catastrophe losses including the impact of net reinstatement premiums |
64 |
|
|
51 |
|
|
42 |
|
|
2.3 |
% |
|
2.0 |
% |
|
1.9 |
% |
|
0.3 |
% |
|
0.1 |
% |
Property and transportation losses and LAE and ratio |
$ |
1,952 |
|
|
$ |
1,741 |
|
|
$ |
1,735 |
|
|
69.9 |
% |
|
69.2 |
% |
|
69.8 |
% |
|
0.7 |
% |
|
(0.6 |
%) |
|
|
|
|
|
|
|
|
|
|
|
|
|
|
|
|
| Specialty casualty |
|
|
|
|
|
|
|
|
|
|
|
|
|
|
|
Current year, excluding catastrophe losses |
$ |
1,832 |
|
|
$ |
1,814 |
|
|
$ |
1,632 |
|
|
61.7 |
% |
|
62.9 |
% |
|
61.4 |
% |
|
(1.2 |
%) |
|
1.5 |
% |
| Prior accident years development |
(10) |
|
|
(110) |
|
|
(190) |
|
|
(0.4 |
%) |
|
(3.8 |
%) |
|
(7.2 |
%) |
|
3.4 |
% |
|
3.4 |
% |
| Current year catastrophe losses including the impact of net reinstatement premiums |
31 |
|
|
35 |
|
|
11 |
|
|
1.1 |
% |
|
1.2 |
% |
|
0.5 |
% |
|
(0.1 |
%) |
|
0.7 |
% |
Specialty casualty losses and LAE and ratio |
$ |
1,853 |
|
|
$ |
1,739 |
|
|
$ |
1,453 |
|
|
62.4 |
% |
|
60.3 |
% |
|
54.7 |
% |
|
2.1 |
% |
|
5.6 |
% |
|
|
|
|
|
|
|
|
|
|
|
|
|
|
|
|
| Specialty financial |
|
|
|
|
|
|
|
|
|
|
|
|
|
|
|
Current year, excluding catastrophe losses |
$ |
359 |
|
|
$ |
311 |
|
|
$ |
252 |
|
|
34.9 |
% |
|
35.8 |
% |
|
36.0 |
% |
|
(0.9 |
%) |
|
(0.2 |
%) |
| Prior accident years development |
(11) |
|
|
(32) |
|
|
(47) |
|
|
(1.1 |
%) |
|
(3.7 |
%) |
|
(6.8 |
%) |
|
2.6 |
% |
|
3.1 |
% |
| Current year catastrophe losses including the impact of net reinstatement premiums |
81 |
|
|
49 |
|
|
33 |
|
|
7.8 |
% |
|
5.7 |
% |
|
4.9 |
% |
|
2.1 |
% |
|
0.8 |
% |
Specialty financial losses and LAE and ratio |
$ |
429 |
|
|
$ |
328 |
|
|
$ |
238 |
|
|
41.6 |
% |
|
37.8 |
% |
|
34.1 |
% |
|
3.8 |
% |
|
3.7 |
% |
|
|
|
|
|
|
|
|
|
|
|
|
|
|
|
|
| Total Specialty |
|
|
|
|
|
|
|
|
|
|
|
|
|
|
|
Current year, excluding catastrophe losses |
$ |
4,339 |
|
|
$ |
4,079 |
|
|
$ |
3,826 |
|
|
61.7 |
% |
|
62.4 |
% |
|
62.8 |
% |
|
(0.7 |
%) |
|
(0.4 |
%) |
| Prior accident years development |
(70) |
|
|
(226) |
|
|
(289) |
|
|
(1.0 |
%) |
|
(3.4 |
%) |
|
(4.7 |
%) |
|
2.4 |
% |
|
1.3 |
% |
| Current year catastrophe losses including the impact of net reinstatement premiums |
180 |
|
|
162 |
|
|
88 |
|
|
2.6 |
% |
|
2.5 |
% |
|
1.5 |
% |
|
0.1 |
% |
|
1.0 |
% |
| Total Specialty losses and LAE and ratio |
$ |
4,449 |
|
|
$ |
4,015 |
|
|
$ |
3,625 |
|
|
63.3 |
% |
|
61.5 |
% |
|
59.6 |
% |
|
1.8 |
% |
|
1.9 |
% |
|
|
|
|
|
|
|
|
|
|
|
|
|
|
|
|
| Aggregate — including exited lines |
|
|
|
|
|
|
|
|
|
|
|
|
|
|
|
Current year, excluding catastrophe losses |
$ |
4,339 |
|
|
$ |
4,079 |
|
|
$ |
3,826 |
|
|
61.7 |
% |
|
62.4 |
% |
|
62.8 |
% |
|
(0.7 |
%) |
|
(0.4 |
%) |
| Prior accident years development |
(64) |
|
|
(224) |
|
|
(285) |
|
|
(0.9 |
%) |
|
(3.4 |
%) |
|
(4.7 |
%) |
|
2.5 |
% |
|
1.3 |
% |
| Current year catastrophe losses including the impact of net reinstatement premiums |
180 |
|
|
162 |
|
|
88 |
|
|
2.5 |
% |
|
2.6 |
% |
|
1.6 |
% |
|
(0.1 |
%) |
|
1.0 |
% |
| Aggregate losses and LAE and ratio |
$ |
4,455 |
|
|
$ |
4,017 |
|
|
$ |
3,629 |
|
|
63.3 |
% |
|
61.6 |
% |
|
59.7 |
% |
|
1.7 |
% |
|
1.9 |
% |
Current accident year losses and LAE, excluding catastrophe losses
The current accident year loss and LAE ratio, excluding catastrophe losses for AFG’s Specialty property and casualty insurance operations was 61.7% in 2024, 62.4% in 2023 and 62.8% in 2022.
Property and transportation The 0.5 percentage points increase in the loss and LAE ratio for the current year, excluding catastrophe losses in 2024 compared to 2023 reflects growth in the crop business, which has a higher loss and LAE ratio than some of the other businesses in the Property and transportation sub-segment and higher reported claim severity in the commercial auto business, partially offset by the impact of improved profitability in the property and inland marine business.
The 1.1 percentage points decrease in the loss and LAE ratio for the current year, excluding catastrophe losses in 2023 compared to 2022 is due primarily to the impact of elevated large loss activity in the property and inland marine business in 2022 and improved results in certain transportation businesses, partially offset by lower profit in the crop business.
Specialty casualty The 1.2 percentage points decrease in the loss and LAE ratio for the current year, excluding catastrophe losses in 2024 compared to 2023 reflects improved results in the workers’ compensation and targeted markets businesses, partially offset by higher claim severity in the excess and surplus business.
The 1.5 percentage points increase in the loss and LAE ratio for the current year, excluding catastrophe losses in 2023 compared to 2022 reflects anticipated medical cost inflation and the impact of pressure on rates in the workers’ compensation businesses and higher claim severity in certain liability coverages.
Specialty financial The 0.9 percentage points decrease in the loss and LAE ratio for the current year, excluding catastrophe losses in 2024 compared to 2023 reflects growth in the financial institutions business, which has a lower loss and LAE ratio than some of the other businesses in the Specialty financial sub-segment, partially offset by higher reported losses and lower premiums in the fidelity and surety businesses.
The 0.2 percentage points decrease in the loss and LAE ratio for the current year, excluding catastrophe losses in 2023 compared to 2022 reflects lower claim frequency and growth in the financial institutions business, which has a lower loss and LAE ratio than some of the other businesses in the Specialty financial sub-segment, partially offset by higher claim severity in the innovative markets business.
Net prior year reserve development
AFG’s Specialty property and casualty insurance operations recorded net favorable reserve development related to prior accident years of $70 million in 2024 compared to $226 million in 2023 and $289 million in 2022, a decrease of $156 million (69%) and $63 million (22%), respectively.
Property and transportation Net favorable reserve development of $94 million in 2024 reflects lower than anticipated losses in the crop business, lower than expected claim severity in the property and inland marine and aviation businesses and lower than anticipated claim frequency and severity in the ocean marine business.
Net favorable reserve development of $84 million in 2023 reflects lower than anticipated losses in the crop business, lower than expected claim frequency and severity across the transportation businesses and lower than anticipated claim frequency in the property and inland marine and ocean marine businesses and in the Singapore operations.
Net favorable reserve development of $92 million in 2022 reflects lower than anticipated losses in the crop business, lower than expected claim frequency in the trucking and ocean marine businesses and in the Singapore operations, lower than expected claim frequency and severity in the aviation business and lower than anticipated claim severity in the property and inland marine business.
Specialty casualty Net favorable reserve development of $10 million in 2024 reflects lower than anticipated claim severity in the workers’ compensation businesses and lower than expected claim frequency and severity in the executive liability business, partially offset by higher than anticipated claim frequency and severity in the umbrella and excess liability and social services businesses and higher than expected claim severity in the public sector and general liability businesses.
Net favorable reserve development of $110 million in 2023 reflects lower than anticipated claim severity in the workers’ compensation businesses, lower than expected claim frequency in the executive liability and environmental businesses and favorable reserve development related to COVID-19 losses across several businesses, partially offset by higher than anticipated claim severity in the public sector business and higher than expected claim frequency and severity in the excess liability and general liability businesses.
Net favorable reserve development of $190 million in 2022 reflects lower than anticipated claim severity in the workers’ compensation businesses and lower than expected claim frequency in the executive liability and excess and surplus businesses, partially offset by higher than anticipated claim severity in the general liability, umbrella and excess liability, and certain targeted markets businesses.
Specialty financial Net favorable reserve development of $11 million in 2024 reflects lower than anticipated claim frequency and severity in the financial institutions and fidelity businesses and lower than expected claim frequency in the trade credit business, partially offset by higher than anticipated claim severity in the innovative markets and surety businesses.
Net favorable reserve development of $32 million in 2023 reflects lower than anticipated claim frequency in the trade credit, financial institutions and surety businesses and lower than expected claim frequency and severity in the fidelity business.
Net favorable reserve development of $47 million in 2022 reflects lower than anticipated claim frequency in the surety, trade credit and financial institutions businesses.
Other specialty In addition to the development discussed above, total Specialty prior year reserve development includes net adverse reserve development of $45 million, less than $1 million and $40 million in 2024, 2023, and 2022, respectively, primarily associated with AFG’s internal reinsurance program. The net adverse reserve development reflects $50 million, $4 million and $44 million in 2024, 2023 and 2022, respectively, of net adverse development associated with AFG’s internal reinsurance program, primarily related to social inflation exposed business assumed from the Specialty casualty sub-segment.
Aggregate Aggregate net prior accident years reserve development for AFG’s property and casualty insurance segment includes net adverse reserve development of $6 million in 2024, $2 million in 2023 and $4 million in 2022 related to business outside the Specialty group that AFG no longer writes.
Catastrophe losses
AFG generally seeks to reduce its exposure to catastrophes (whether resulting from climate change or otherwise) through individual risk selection, including minimizing coastal and known fault-line exposures, and the purchase of reinsurance. AFG recorded net catastrophe losses of $180 million in 2024 (before $2 million in net reinstatement premiums) primarily from winter and convective storms in multiple regions of the United States in the first and second quarters, Hurricane Helene in the third quarter and Hurricane Milton in the fourth quarter.
Catastrophe losses of $162 million in 2023 (before $3 million in net reinstatement premiums) resulted primarily from February and March storms across much of the United States in the first quarter and storms in multiple regions of the United States in the second, third and fourth quarters.
Catastrophe losses of $88 million in 2022 (before $5 million in net reinstatement premiums) resulted primarily from winter storms in multiple regions of the United States in the first quarter, storms in multiple regions of the United States in the second quarter, Hurricane Ian in the third quarter and Winter Storm Elliott in the fourth quarter.
Commissions and Other Underwriting Expenses
AFG’s property and casualty commissions and other underwriting expenses (“U/W Exp”) were $1.96 billion in 2024 compared to $1.88 billion in 2023, an increase of $78 million (4%). AFG’s underwriting expense ratio was 27.9% in 2024 compared to 28.8% in 2023, a decrease of 0.9 percentage points.
AFG’s property and casualty U/W Exp were $1.88 billion in 2023 compared to $1.68 billion in 2022, an increase of $203 million (12%). AFG’s underwriting expense ratio was 28.8% in 2023 compared to 27.6% in 2022, an increase of 1.2 percentage points.
Detail of AFG’s property and casualty commissions and other underwriting expenses and underwriting expense ratios is shown below (dollars in millions):
|
|
|
|
|
|
|
|
|
|
|
|
|
|
|
|
|
|
|
|
|
|
|
|
|
|
|
|
|
|
|
|
|
|
|
|
|
|
|
|
|
|
|
|
|
|
|
|
|
Year ended December 31, |
|
Change in % of NEP |
|
2024 |
|
2023 |
|
2022 |
|
2024 - 2023 |
|
2023 - 2022 |
|
U/W Exp |
|
% of NEP |
|
U/W Exp |
|
% of NEP |
|
U/W Exp |
|
% of NEP |
|
|
|
|
| Property and transportation |
$ |
630 |
|
|
22.5 |
% |
|
$ |
594 |
|
|
23.6 |
% |
|
$ |
544 |
|
|
21.9 |
% |
|
(1.1 |
%) |
|
1.7 |
% |
| Specialty casualty |
774 |
|
|
26.1 |
% |
|
772 |
|
|
26.7 |
% |
|
706 |
|
|
26.5 |
% |
|
(0.6 |
%) |
|
0.2 |
% |
| Specialty financial |
469 |
|
|
45.5 |
% |
|
429 |
|
|
49.5 |
% |
|
346 |
|
|
49.6 |
% |
|
(4.0 |
%) |
|
(0.1 |
%) |
| Other specialty |
88 |
|
|
36.1 |
% |
|
88 |
|
|
33.9 |
% |
|
84 |
|
|
34.7 |
% |
|
2.2 |
% |
|
(0.8 |
%) |
|
$ |
1,961 |
|
|
27.9 |
% |
|
$ |
1,883 |
|
|
28.8 |
% |
|
$ |
1,680 |
|
|
27.6 |
% |
|
(0.9 |
%) |
|
1.2 |
% |
Property and transportation Commissions and other underwriting expenses as a percentage of net earned premiums decreased 1.1 percentage points in 2024 compared to 2023 reflecting the impact on the ratio of higher earned premiums, including in the crop business which has a lower commissions and other underwriting expense ratio compared to some of the other businesses in the Property and transportation sub-segment and lower average commission rates in the transportation businesses due to a change in the mix of business.
Commissions and other underwriting expenses as a percentage of net earned premiums increased 1.7 percentage points in 2023 compared to 2022 reflecting the impact of lower profit-based ceding commissions related to below average profitability in the crop operations, the impact on the ratio of lower earned premiums in the crop operations (which has a lower commissions and other underwriting expense ratio compared to some of the other businesses in the Property and transportation sub-segment) and higher expenses related to certain technology initiatives.
Specialty casualty Commissions and other underwriting expenses as a percentage of net earned premiums decreased 0.6 percentage points in 2024 compared to 2023 reflecting a change in the mix of business towards products with lower commission rates, partially offset by lower ceding commissions received in the workers’ compensation businesses.
Commissions and other underwriting expenses as a percentage of net earned premiums increased 0.2 percentage points in 2023 compared to 2022 reflecting higher expenses related to certain technology initiatives, partially offset by the impact on the ratio of growth in earned premiums in the workers’ compensation businesses.
Specialty financial Commissions and other underwriting expenses as a percentage of net earned premiums decreased 4.0 percentage points in 2024 compared to 2023 due primarily to the impact on the ratio of higher earned premiums in the financial institutions business and a change in the mix of business towards products with lower commission rates.
Commissions and other underwriting expenses as a percentage of net earned premiums decreased 0.1 percentage points in 2023 compared to 2022 reflecting the impact on the ratio of growth in earned premiums in the financial institutions and innovative markets businesses, partially offset by higher expenses related to certain technology initiatives and the impact of lower profit-based commissions to agents and lower reinstatement premiums recorded in 2022 as a result of losses from Hurricane Ian.
Property and Casualty Net Investment Income
Net investment income in AFG’s property and casualty insurance operations was $784 million in 2024 compared to $729 million in 2023, an increase of $55 million (8%). Net investment income in AFG’s property and casualty insurance operations was $729 million in 2023 compared to $683 million in 2022, an increase of $46 million (7%). The average invested assets and overall yield earned on investments held by AFG’s property and casualty insurance operations are provided below (dollars in millions):
|
|
|
|
|
|
|
|
|
|
|
|
|
|
|
|
|
|
|
|
|
|
|
|
|
|
|
|
|
|
|
|
|
|
|
|
|
|
|
|
|
|
|
Year ended December 31, |
|
2024 - 2023 |
|
2023 - 2022 |
|
2024 |
|
2023 |
|
2022 |
|
Change |
|
% Change |
|
Change |
|
% Change |
| Net investment income: |
|
|
|
|
|
|
|
|
|
|
|
|
|
| Net investment income, excluding alternative investments |
$ |
626 |
|
|
$ |
566 |
|
|
$ |
418 |
|
|
$ |
60 |
|
|
11 |
% |
|
$ |
148 |
|
|
35 |
% |
| Alternative investments |
158 |
|
|
163 |
|
|
265 |
|
|
(5) |
|
|
(3 |
%) |
|
(102) |
|
|
(38 |
%) |
| Total net investment income |
$ |
784 |
|
|
$ |
729 |
|
|
$ |
683 |
|
|
$ |
55 |
|
|
8 |
% |
|
$ |
46 |
|
|
7 |
% |
|
|
|
|
|
|
|
|
|
|
|
|
|
|
| Average invested assets (at amortized cost) |
$ |
15,479 |
|
|
$ |
14,753 |
|
|
$ |
14,048 |
|
|
$ |
726 |
|
|
5 |
% |
|
$ |
705 |
|
|
5 |
% |
|
|
|
|
|
|
|
|
|
|
|
|
|
|
| Yield (net investment income as a % of average invested assets) |
5.06 |
% |
|
4.94 |
% |
|
4.86 |
% |
|
0.12 |
% |
|
|
|
0.08 |
% |
|
|
|
|
|
|
|
|
|
|
|
|
|
|
|
|
| Tax equivalent yield (*) |
5.13 |
% |
|
5.01 |
% |
|
4.96 |
% |
|
0.12 |
% |
|
|
|
0.05 |
% |
|
|
(*)Adjusts the yield on equity securities and tax-exempt bonds to the fully taxable equivalent yield.
The increase in the property and casualty insurance segment’s net investment income in 2024 compared to 2023 reflects the impact of higher balances of invested assets and higher returns on fixed maturity investments, partially offset by lower returns on AFG’s alternative investments portfolio (partnerships and similar investments and AFG-managed CLOs). The property and casualty insurance segment’s overall yield on investments (net investment income as a percentage of average invested assets) was 5.06% in 2024 compared to 4.94% in 2023, an increase of 0.12 percentage points. The annualized return earned on alternative investments was 6.1% in 2024 compared to 7.0% in 2023.
The increase in net investment income in 2023 compared to 2022 reflects the impact of higher yields on fixed maturity investments and higher balances of invested assets, partially offset by lower returns on AFG’s alternative investments portfolio as compared to the very strong performance of this portfolio in the prior year period. The property and casualty insurance segment’s overall yield on investments was 4.94% in 2023 compared to 4.86% in 2022, an increase of 0.08 percentage points.
The annualized return earned on alternative investments was 7.0% in 2023 compared to 13.2% in 2022.
Property and Casualty Other Income and Expenses, Net
Other income and expenses, net for AFG’s property and casualty insurance operations was a net expense of $76 million in 2024, $56 million in 2023 and $40 million in 2022, an increase of $20 million (36%) in 2024 compared to 2023 and an increase of $16 million (40%) in 2023 compared to 2022. The table below details the items included in other income and expenses, net for AFG’s property and casualty insurance operations (in millions):
|
|
|
|
|
|
|
|
|
|
|
|
|
|
|
|
|
|
|
Year ended December 31, |
|
2024 |
|
2023 |
|
2022 |
| Other income: |
|
|
|
|
|
| Income related to the sale of real estate |
$ |
— |
|
|
$ |
— |
|
|
$ |
1 |
|
| Other |
8 |
|
|
16 |
|
|
11 |
|
| Total other income |
8 |
|
|
16 |
|
|
12 |
|
| Other expenses: |
|
|
|
|
|
| Amortization of intangibles |
20 |
|
|
15 |
|
|
11 |
|
| Interest expense on funds withheld |
50 |
|
|
41 |
|
|
29 |
|
| Acquisition expenses related to CRS |
— |
|
|
3 |
|
|
— |
|
| Other (*) |
14 |
|
|
13 |
|
|
12 |
|
| Total other expenses |
84 |
|
|
72 |
|
|
52 |
|
| Other income and expenses, net |
$ |
(76) |
|
|
$ |
(56) |
|
|
$ |
(40) |
|
(*)Includes $9 million of expenses in 2024, 2023 and 2022 related to certain technology initiatives.
The decrease in other income in 2024 compared to 2023 is due primarily to death benefits received in 2023 from company-owned life insurance policies. The higher amortization of intangibles in 2024 compared to 2023 and 2023 compared to 2022 reflects the acquisition of CRS in July 2023. The $9 million (22%) increase in interest expense on funds withheld in 2024 compared to 2023 and the $12 million (41%) increase in 2023 compared to 2022 reflects the impact of higher balances and higher interest rates paid on funds withheld.
Holding Company, Other and Unallocated — Results of Operations
AFG’s net GAAP pretax loss outside of its property and casualty insurance segment (excluding realized gains and losses) totaled $204 million in 2024 compared to $191 million in 2023, an increase of $13 million (7%). AFG’s net core pretax loss outside of its property and casualty insurance segment (excluding realized gains and losses) totaled $190 million in 2024 compared to $177 million in 2023, an increase of $13 million (7%).
AFG’s net GAAP pretax loss outside of its property and casualty insurance segment (excluding realized gains and losses) totaled $191 million in 2023 compared to $180 million in 2022, an increase of $11 million (6%). AFG’s net core pretax loss outside of its property and casualty insurance segment (excluding realized gains and losses) totaled $177 million in 2023 compared to $171 million in 2022, an increase of $6 million (4%).
The following table details AFG’s GAAP and core loss before income taxes from operations outside of its property and casualty insurance segment in 2024, 2023 and 2022 (dollars in millions):
|
|
|
|
|
|
|
|
|
|
|
|
|
|
|
|
|
|
|
|
|
|
|
|
|
|
|
|
|
|
|
Year ended December 31, |
|
% Change |
|
2024 |
|
2023 |
|
2022 |
|
2024 - 2023 |
|
2023 - 2022 |
| Revenues: |
|
|
|
|
|
|
|
|
|
| Net investment income |
$ |
29 |
|
|
$ |
40 |
|
|
$ |
24 |
|
|
(28 |
%) |
|
67 |
% |
| Other income — P&C fees |
111 |
|
|
125 |
|
|
89 |
|
|
(11 |
%) |
|
40 |
% |
| Other income |
18 |
|
|
21 |
|
|
33 |
|
|
(14 |
%) |
|
(36 |
%) |
| Total revenues |
158 |
|
|
186 |
|
|
146 |
|
|
(15 |
%) |
|
27 |
% |
|
|
|
|
|
|
|
|
|
|
| Costs and Expenses: |
|
|
|
|
|
|
|
|
|
| Property and casualty insurance — loss adjustment and underwriting expenses |
51 |
|
|
68 |
|
|
38 |
|
|
(25 |
%) |
|
79 |
% |
| Other expense — expenses associated with P&C fees |
60 |
|
|
57 |
|
|
51 |
|
|
5 |
% |
|
12 |
% |
| Other expenses (*) |
161 |
|
|
162 |
|
|
143 |
|
|
(1 |
%) |
|
13 |
% |
| Costs and expenses, excluding interest charges on borrowed money |
272 |
|
|
287 |
|
|
232 |
|
|
(5 |
%) |
|
24 |
% |
| Loss before income taxes, excluding realized gains and losses and interest charges on borrowed money |
(114) |
|
|
(101) |
|
|
(86) |
|
|
13 |
% |
|
17 |
% |
| Interest charges on borrowed money |
76 |
|
|
76 |
|
|
85 |
|
|
— |
% |
|
(11 |
%) |
Core loss before income taxes, excluding realized gains and losses |
(190) |
|
|
(177) |
|
|
(171) |
|
|
7 |
% |
|
4 |
% |
Pretax non-core special A&E charge |
(14) |
|
|
(15) |
|
|
— |
|
|
(7 |
%) |
|
— |
% |
Pretax non-core gain (loss) on retirement of debt |
— |
|
|
1 |
|
|
(9) |
|
|
(100 |
%) |
|
(111 |
%) |
GAAP loss before income taxes, excluding realized gains and losses |
$ |
(204) |
|
|
$ |
(191) |
|
|
$ |
(180) |
|
|
7 |
% |
|
6 |
% |
(*)Excludes pretax non-core special A&E charges of $14 million and $15 million in 2024 and 2023, respectively, a pretax non-core gain on retirement of debt of $1 million in 2023 and a pretax non-core loss on retirement of debt of $9 million in 2022.
Holding Company and Other — Net Investment Income
AFG recorded net investment income on investments held outside of its property and casualty insurance segment of $29 million, $40 million and $24 million in 2024, 2023 and 2022, respectively. The $11 million (28%) decrease in 2024 compared to 2023 reflects the impact of lower average investment balances. The $16 million (67%) increase in 2023 compared to 2022 reflects the impact of a small portfolio of securities held at the holding company that were carried at fair value through net investment income. These securities, all of which were sold in 2022, declined in value by $7 million in 2022. Excluding the change in fair value of these equity securities, net investment income outside of AFG’s property and casualty insurance segment increased $9 million in 2023 compared to 2022 reflecting the impact of higher interest rates on cash and fixed maturity investments, partially offset by lower average investment balances.
Holding Company and Other — P&C Fees and Related Expenses
Summit, a workers’ compensation insurance subsidiary, collects fees from a small group of unaffiliated insurers for providing underwriting, policy administration and claims services. In addition, certain of AFG’s property and casualty insurance businesses collect fees from customers for ancillary services such as workplace safety programs and premium financing. In 2024, AFG collected $100 million in fees for these services compared to $91 million in 2023 and $82 million in 2022. Management views this fee income, net of the $60 million in 2024, $57 million in 2023 and $51 million in 2022, in expenses incurred to generate such fees, as a reduction in the cost of underwriting its property and casualty insurance policies. In addition, AFG’s property and casualty insurance businesses earned $11 million in 2024 and $34 million in 2023 in fees as compensation for providing services related to the administration of crop insurance business generated by CRS for its former owner prior to AFG’s acquisition of CRS and $7 million in 2022 in fees from AFG’s disposed annuity operations as compensation for certain services provided under a transition services agreement. The expenses related to providing such services are embedded in underwriting expenses. Consistent with internal management reporting, these fees and the related expenses are netted and recorded as a reduction of loss adjustment and other underwriting expenses in AFG’s segmented results.
Holding Company and Other — Other Income
Other income in the table above includes $13 million in 2024, $16 million in 2023 and $17 million in 2022, in management fees paid to AFG by the AFG-managed CLOs (AFG’s consolidated managed investment entities). The management fees are eliminated in consolidation — see the other income line in the Consolidated MIEs column under “Results of Operations — Segmented Statement of Earnings.” Excluding amounts eliminated in consolidation, AFG recorded other income outside of its property and casualty insurance segment of $5 million in both 2024 and 2023 and $16 million in 2022.
The decrease in 2024 and 2023 compared to 2022 is due primarily to income from the sale of real estate in 2022.
Holding Company and Other — Other Expenses
Excluding the non-core special A&E charges and the non-core gain on retirement of debt discussed below, AFG’s holding companies and other operations outside of its property and casualty insurance segment recorded other expenses of $161 million in 2024 compared to $162 million in 2023, a decrease of $1 million (1%).
Excluding the non-core special A&E charge and the non-core gain (loss) on retirement of debt discussed below, AFG’s holding companies and other operations outside of its property and casualty insurance segment recorded other expenses of $162 million in 2023 compared to $143 million in 2022, an increase of $19 million (13%) reflecting the favorable impact of poor stock market performance in 2022 on expenses related to deferred compensation obligations to employees that are tied to stock market performance. To mitigate the impact of fair value changes related to the equity components of these obligations, AFG entered into a total return swap in the second half of 2022.
Holding Company and Other — Interest Charges on Borrowed Money
AFG’s holding companies and other operations outside of its property and casualty insurance segment recorded interest expense of $76 million in both 2024 and 2023 and $85 million in 2022. The $9 million (11%) decrease in interest expense in 2024 and 2023 compared to 2022 is due primarily to the retirement of AFG’s $425 million principal amount of 3.50% Senior Notes during the first six months of 2022.
Holding Company and Other — Special A&E Charges
As a result of the in-depth internal reviews of A&E exposures discussed under “Uncertainties — Asbestos and Environmental-related (“A&E”) Insurance Reserves,” AFG’s holding companies and other operations outside of its property and casualty insurance segment recorded pretax non-core special charges of $14 million in 2024, $15 million in 2023 and a minor charge in 2022 (included in AFG’s core operating earnings) to increase liabilities related to the A&E exposures of AFG’s former railroad and manufacturing operations. The 2024 and 2023 charges reflect changes in the scope and costs of investigation and an increase in estimated remediation costs at a limited number of sites. AFG has also increased its reserve for asbestos and toxic substance exposures arising out of these operations. Total charges recorded to increase liabilities for A&E exposures of AFG’s former railroad and manufacturing operations (included in other expenses) were $24 million in 2024, $22 million in 2023, and $17 million in 2022.
Holding Company and Other — Gain (Loss) on Retirement of Debt
During 2023, AFG repurchased $23 million principal amount of its senior notes, which resulted in a $2 million pretax non-core gain and recorded a $1 million pretax non-core loss related to the write-off of debt issue costs associated with its previous revolving credit facility, which was replaced in June 2023. During 2022, AFG retired $472 million principal amount of its senior notes, which resulted in a $9 million pretax non-core loss.
Realized Gains (Losses) on Securities
AFG’s realized gains (losses) on securities were net gains of less than $1 million in 2024 compared to net losses of $36 million in 2023, a change of $36 million (100%). AFG’s consolidated realized gains (losses) on securities were net losses of $36 million in 2023 compared to $116 million in 2022, a decrease of $80 million (69%). Realized gains (losses) on securities consisted of the following (in millions):
|
|
|
|
|
|
|
|
|
|
|
|
|
|
|
|
|
|
|
Year ended December 31, |
| 2024 |
|
2023 |
|
2022 |
| Realized gains (losses) before impairment allowances: |
|
|
|
|
|
| Disposals |
$ |
(4) |
|
|
$ |
(33) |
|
|
$ |
(15) |
|
| Change in the fair value of equity securities |
32 |
|
|
10 |
|
|
(96) |
|
| Change in the fair value of derivatives |
(1) |
|
|
(2) |
|
|
(12) |
|
| Other |
— |
|
|
— |
|
|
10 |
|
|
27 |
|
|
(25) |
|
|
(113) |
|
|
|
|
|
|
|
| Change in allowance for impairments on securities |
(27) |
|
|
(11) |
|
|
(3) |
|
| Realized gains (losses) on securities |
$ |
— |
|
|
$ |
(36) |
|
|
$ |
(116) |
|
The $33 million net realized loss from disposals in 2023 includes losses of $15 million from the sale of investments in banks and $5 million from the sale of municipal bonds.
The $32 million net realized gain from the change in the fair value of equity securities in 2024 includes gains of $21 million on investments in banks and financing companies, $8 million on investments in natural gas companies and $5 million on investments in technology companies, partially offset by losses of $6 million on investments in energy companies.
The $10 million net realized gain from the change in the fair value of equity securities in 2023 includes gains of $8 million on investments in retail companies, $7 million on investments in banks and financing companies, $5 million on investments in capital goods companies and $4 million on investments in natural gas companies, partially offset by losses of $8 million on investments in media companies and $6 million on investments in energy companies.
The $96 million net realized loss from the change in the fair value of equity securities in 2022 includes losses of $51 million on investments in banks and financing companies, $21 million on investments in media companies, $14 million on investments in healthcare companies, $7 million on investments in technology companies and $3 million on investments in retail companies, partially offset by gains of $17 million on investments in energy and natural gas companies.
The $27 million change in allowance for impairments on securities in 2024 relates primarily to allowances taken on corporate bonds from a single issuer in the financial sector and fixed maturities from a single issuer in the retail sector.
Realized Loss on Subsidiaries
In the second quarter of 2024, AFG recorded $4 million in net tax expense related to a pending IRS settlement regarding the sale of a subsidiary in a prior year.
In the third quarter of 2023, AFG recorded a realized loss on subsidiary of $4 million, consisting of a $26 million goodwill impairment charge, partially offset by a $22 million reduction in the fair value of a contingent consideration liability, both related to AFG’s investment in Verikai. See Note D — “Fair Value Measurements” and Note H — “Goodwill and Other Intangibles” to the financial statements.
Consolidated Income Taxes
AFG’s consolidated provision for income taxes was $237 million in 2024 compared to $221 million in 2023, an increase of $16 million (7%). AFG’s consolidated provision for income taxes was $221 million in 2023 compared to $225 million in 2022, a decrease of $4 million (2%). See Note L — “Income Taxes” to the financial statements for an analysis of items affecting AFG’s effective tax rate.
RECENTLY ADOPTED ACCOUNTING STANDARDS
See Note C — “Segments of Operations” to the financial statements for accounting guidance adopted in the fourth quarter of 2024, which requires enhanced disclosures about significant segment expenses and a description of the composition of other segment expenses by business segment. The title and position of the chief operating decision maker (“CODM”) and an explanation of how the CODM uses the reported measures of segment profit or loss in assessing segment performance and deciding how to allocate resources is also required to be disclosed.
ACCOUNTING STANDARDS TO BE ADOPTED
In December 2023, the FASB issued ASU No. 2023-09 (“ASU 2023-09”), Improvements to Income Tax Disclosures. ASU 2023-09 is intended to improve income tax disclosures by requiring (i) consistent categories and greater disaggregation of information in the rate reconciliation presented in both dollar and percentage terms; (ii) the disaggregation of income taxes paid (net of refunds received), income (loss) before income taxes and income taxes by jurisdiction (federal, state and foreign taxes); and (iii) further disaggregation of income taxes paid by any individual jurisdiction equal to or exceeding five percent of total income taxes paid. ASU 2023-09 is effective for fiscal years beginning after December 15, 2024, with early adoption permitted, and is required to be applied prospectively with the option of retrospective application. As of December 31, 2024, AFG has not adopted ASU 2023-09. Management is evaluating the impact of the standard to AFG’s income tax disclosures. Since ASU 2023-09 only requires additional disclosure, the adoption of this guidance will not have an impact on AFG’s results of operations or financial condition.
In November 2024, the FASB issued ASU No. 2024-03 (“ASU 2024-03”), Income Statement — Reporting Comprehensive Income — Expense Disaggregation Disclosures (Subtopic 220-40): Disaggregation of Income Statement Expenses. ASU 2024-03 requires additional information and disaggregation of specified expense categories in the notes to financial statements. ASU 2024-04 is effective for fiscal years beginning after December 15, 2026, and interim periods within fiscal years beginning after December 15, 2027, with early adoption permitted and applied either prospectively or retrospectively.
As of December 31, 2024, AFG has not adopted ASU 2024-03. Management is evaluating the impact of the standard to AFG’s income statement expense disclosures. Since ASU 2024-03 only requires additional disclosures, the adoption of this guidance will not have an impact on AFG’s results of operations or financial condition.
Item 7A. Quantitative and Qualitative Disclosures about Market Risk
Market risk represents the potential economic loss arising from adverse changes in the fair value of financial instruments. AFG’s exposures to market risk relate primarily to its investment portfolio, which is exposed to interest rate risk and, to a lesser extent, equity price risk. To a much lesser extent, AFG’s long-term debt is also exposed to interest rate risk.
Fixed Maturity Interest Rate Risk In general, the fair value of AFG’s fixed maturity investments is inversely correlated to changes in interest rates. AFG’s fixed maturity portfolio is comprised of primarily fixed-rate investments with intermediate-term maturities. This practice is designed to allow flexibility in reacting to fluctuations of interest rates. The portfolios of AFG’s insurance operations are managed with an attempt to achieve an adequate risk-adjusted return while maintaining sufficient liquidity to meet policyholder obligations.
Consistent with the discussion in Item 7 — Management’s Discussion and Analysis — “Investments,” the following table demonstrates the sensitivity of the fair value of AFG’s fixed maturity portfolio to reasonably likely changes in interest rates by illustrating the estimated effect on AFG’s fixed maturity portfolio that an immediate increase of 100 basis points in the interest rate yield curve would have at December 31 (based on the duration of the portfolio, dollars in millions). Effects of increases or decreases from the 100 basis points illustrated would be approximately proportional.
|
|
|
|
|
|
|
|
|
|
|
|
|
2024 |
|
2023 |
| Fair value of fixed maturity portfolio |
$ |
10,474 |
|
|
$ |
10,434 |
|
| Percentage impact on fair value of 100 bps increase in interest rates |
(3.0 |
%) |
|
(3.0 |
%) |
| Pretax impact on fair value of fixed maturity portfolio |
$ |
(314) |
|
|
$ |
(313) |
|
Equity Price Risk AFG’s equity securities are reported at fair value with holding gains and losses recognized in net earnings. At December 31, 2024 and 2023, the fair value of AFG’s equity securities totaled $751 million and $1.02 billion, respectively. These investments are exposed to price risk, which is the potential loss arising from decreases in fair value. Market prices of equity securities, in general, are subject to fluctuations, which could cause future values to differ significantly from the current reported values. General economic swings influence the performance of the underlying industries and companies within those industries. Industry and company-specific risks also have the potential to substantially affect the value of AFG’s portfolio.
AFG utilizes a total return swap to offset changes in liabilities related to the equity price risk of certain deferred compensation arrangements. Gains or losses from changes in fair value of the total return swap are generally offset by changes in the carrying value of the related liabilities, both of which are included in other expenses.
Long-Term Debt The following table shows scheduled principal payments on fixed-rate long-term debt of AFG and its subsidiaries and related weighted average interest rates for each of the subsequent five years and for all years thereafter (dollars in millions):
|
|
|
|
|
|
|
|
|
|
|
|
|
|
|
|
|
|
|
|
|
|
|
|
|
|
|
|
|
|
|
|
|
|
|
December 31, 2024 |
|
|
December 31, 2023 |
|
|
|
Scheduled Principal Payments |
|
Rate |
|
|
Scheduled Principal Payments |
|
Rate |
|
|
2025 |
$ |
— |
|
|
— |
% |
|
2024 |
$ |
— |
|
|
— |
% |
|
|
2026 |
— |
|
|
— |
% |
|
2025 |
— |
|
|
— |
% |
|
|
2027 |
— |
|
|
— |
% |
|
2026 |
— |
|
|
— |
% |
|
|
2028 |
— |
|
|
— |
% |
|
2027 |
— |
|
|
— |
% |
|
|
2029 |
— |
|
|
— |
% |
|
2028 |
— |
|
|
— |
% |
|
|
Thereafter |
1,498 |
|
|
4.9 |
% |
|
Thereafter |
1,498 |
|
|
4.9 |
% |
|
|
Total |
$ |
1,498 |
|
|
4.9 |
% |
|
Total |
$ |
1,498 |
|
|
4.9 |
% |
|
|
|
|
|
|
|
|
|
|
|
|
|
Fair Value |
$ |
1,276 |
|
|
|
|
Fair Value |
$ |
1,345 |
|
|
|
|
Item 8. Financial Statements and Supplementary Data
|
|
|
|
|
|
|
Page |
Report of Independent Registered Public Accounting Firm (PCAOB ID: 42) |
|
Consolidated Balance Sheet as of December 31, 2024 and 2023 |
|
Consolidated Statement of Earnings for the years ended December 31, 2024, 2023 and 2022 |
|
Consolidated Statement of Comprehensive Income for the years ended December 31, 2024, 2023 and 2022 |
|
Consolidated Statement of Changes in Equity for the years ended December 31, 2024, 2023 and 2022 |
|
Consolidated Statement of Cash Flows for the years ended December 31, 2024, 2023 and 2022 |
|
| Notes to Consolidated Financial Statements |
|
Item 9. Changes in and Disagreements with Accountants on Accounting and Financial Disclosure
None.
Item 9A. Controls and Procedures
AFG’s management, with participation of its Co-Chief Executive Officers and its Chief Financial Officer, has evaluated AFG’s disclosure controls and procedures (as defined in Exchange Act Rule 13a-15) as of the end of the period covered by this report. Based on that evaluation, AFG’s Co-CEOs and CFO concluded that the controls and procedures are effective. There have been no changes in AFG’s internal control over financial reporting during the fourth fiscal quarter of 2024 that materially affected, or are reasonably likely to materially affect, AFG’s internal control over financial reporting.
MANAGEMENT’S REPORT ON INTERNAL CONTROL OVER FINANCIAL REPORTING
AFG’s management is responsible for establishing and maintaining adequate internal control over financial reporting, as such term is defined in Securities Exchange Act Rules 13a-15(f). Under the supervision and with the participation of management, including AFG’s Co-Chief Executive Officers and Chief Financial Officer, AFG conducted an evaluation of the effectiveness of internal control over financial reporting as of December 31, 2024, based on the criteria set forth in “Internal Control — Integrated Framework” issued in 2013 by the Committee of Sponsoring Organizations of the Treadway Commission.
There are inherent limitations to the effectiveness of any system of internal controls and procedures, including the possibility of human error and the circumvention or overriding of the controls and procedures. Accordingly, even effective internal controls and procedures can only provide reasonable assurance of achieving their control objectives.
Based on AFG’s evaluation, management concluded that internal control over financial reporting was effective as of December 31, 2024. The attestation report of AFG’s independent registered public accounting firm on AFG’s internal control over financial reporting as of December 31, 2024, is set forth on page
80.
Item 9B. Other Information
During the three months ended December 31, 2024, none of the Company’s directors or officers adopted, terminated or modified a “Rule 10b5-1 trading arrangement” or “non-Rule 10b5-1 trading arrangement,” as those terms are defined in Regulation S-K, Item 408.
Item 9C. Disclosure Regarding Foreign Jurisdictions that Prevent Inspections
Not applicable.
REPORT OF INDEPENDENT REGISTERED PUBLIC ACCOUNTING FIRM
ON INTERNAL CONTROL OVER FINANCIAL REPORTING
To the Shareholders and the Board of Directors of American Financial Group, Inc.
Opinion on Internal Control Over Financial Reporting
We have audited American Financial Group, Inc. and subsidiaries’ internal control over financial reporting as of December 31, 2024, based on criteria established in Internal Control — Integrated Framework issued by the Committee of Sponsoring Organizations of the Treadway Commission (2013 framework) (the COSO criteria). In our opinion, American Financial Group, Inc. and subsidiaries (the Company) maintained, in all material respects, effective internal control over financial reporting as of December 31, 2024, based on the COSO criteria.
We also have audited, in accordance with the standards of the Public Company Accounting Oversight Board (United States) (PCAOB), the consolidated balance sheet of the Company as of December 31, 2024 and 2023, the related consolidated statements of earnings, comprehensive income, changes in equity and cash flows for each of the three years in the period ended December 31, 2024, and the related notes and financial statement schedules listed in the Index at Item 15(a)(2) and our report dated February 25, 2025 expressed an unqualified opinion thereon.
Basis for Opinion
The Company’s management is responsible for maintaining effective internal control over financial reporting and for its assessment of the effectiveness of internal control over financial reporting included in the accompanying Management’s Report on Internal Control Over Financial Reporting. Our responsibility is to express an opinion on the Company’s internal control over financial reporting based on our audit. We are a public accounting firm registered with the PCAOB and are required to be independent with respect to the Company in accordance with the U.S. federal securities laws and the applicable rules and regulations of the Securities and Exchange Commission and the PCAOB.
We conducted our audit in accordance with the standards of the PCAOB. Those standards require that we plan and perform the audit to obtain reasonable assurance about whether effective internal control over financial reporting was maintained in all material respects.
Our audit included obtaining an understanding of internal control over financial reporting, assessing the risk that a material weakness exists, testing and evaluating the design and operating effectiveness of internal control based on the assessed risk, and performing such other procedures as we considered necessary in the circumstances. We believe that our audit provides a reasonable basis for our opinion.
Definition and Limitations of Internal Control Over Financial Reporting
A company’s internal control over financial reporting is a process designed to provide reasonable assurance regarding the reliability of financial reporting and the preparation of financial statements for external purposes in accordance with generally accepted accounting principles. A company’s internal control over financial reporting includes those policies and procedures that (1) pertain to the maintenance of records that, in reasonable detail, accurately and fairly reflect the transactions and dispositions of the assets of the company; (2) provide reasonable assurance that transactions are recorded as necessary to permit preparation of financial statements in accordance with generally accepted accounting principles, and that receipts and expenditures of the company are being made only in accordance with authorizations of management and directors of the company; and (3) provide reasonable assurance regarding prevention or timely detection of unauthorized acquisition, use, or disposition of the company’s assets that could have a material effect on the financial statements.
Because of its inherent limitations, internal control over financial reporting may not prevent or detect misstatements. Also, projections of any evaluation of effectiveness to future periods are subject to the risk that controls may become inadequate because of changes in conditions, or that the degree of compliance with the policies or procedures may deteriorate.
|
|
|
|
|
|
|
|
|
| /s/ Ernst & Young LLP |
|
|
| Cincinnati, Ohio |
|
|
| February 25, 2025 |
|
|
REPORT OF INDEPENDENT REGISTERED PUBLIC ACCOUNTING FIRM
To the Shareholders and the Board of Directors of American Financial Group, Inc.
Opinion on the Financial Statements
We have audited the accompanying consolidated balance sheet of American Financial Group, Inc. and subsidiaries (the Company) as of December 31, 2024 and 2023, the related consolidated statements of earnings, comprehensive income, changes in equity and cash flows for each of the three years in the period ended December 31, 2024, and the related notes and financial statement schedules listed in the Index at Item 15(a)(2) (collectively referred to as the “consolidated financial statements”). In our opinion, the consolidated financial statements present fairly, in all material respects, the financial position of the Company at December 31, 2024 and 2023, and the results of its operations and its cash flows for each of the three years in the period ended December 31, 2024, in conformity with U.S. generally accepted accounting principles.
We also have audited, in accordance with the standards of the Public Company Accounting Oversight Board (United States) (PCAOB), the Company’s internal control over financial reporting as of December 31, 2024, based on criteria established in Internal Control-Integrated Framework issued by the Committee of Sponsoring Organizations of the Treadway Commission (2013 framework), and our report dated February 25, 2025 expressed an unqualified opinion thereon.
Basis for Opinion
These financial statements are the responsibility of the Company’s management. Our responsibility is to express an opinion on the Company’s financial statements based on our audits. We are a public accounting firm registered with the PCAOB and are required to be independent with respect to the Company in accordance with the U.S. federal securities laws and the applicable rules and regulations of the Securities and Exchange Commission and the PCAOB.
We conducted our audits in accordance with the standards of the PCAOB. Those standards require that we plan and perform the audit to obtain reasonable assurance about whether the financial statements are free of material misstatement, whether due to error or fraud. Our audits included performing procedures to assess the risks of material misstatement of the financial statements, whether due to error or fraud, and performing procedures that respond to those risks. Such procedures included examining, on a test basis, evidence regarding the amounts and disclosures in the financial statements. Our audits also included evaluating the accounting principles used and significant estimates made by management, as well as evaluating the overall presentation of the financial statements. We believe that our audits provide a reasonable basis for our opinion.
Critical Audit Matters
The critical audit matters communicated below are matters arising from the current period audit of the financial statements that were communicated or required to be communicated to the audit committee and that: (1) relate to accounts or disclosures that are material to the financial statements and (2) involved our especially challenging, subjective or complex judgments. The communication of critical audit matters does not alter in any way our opinion on the consolidated financial statements, taken as a whole, and we are not, by communicating the critical audit matters below, providing separate opinions on the critical audit matters or on the accounts or disclosures to which they relate.
|
|
|
|
|
|
|
|
|
|
|
Valuation of investments in fixed maturity securities |
| Description of the Matter |
|
As of December 31, 2024, the fair value of the Company’s fixed maturity securities totaled $10.47 billion, a portion of which are valued based on internally developed prices, using significant inputs not based on, or corroborated by, observable market information, or which are valued based on non-binding broker quotes. The fair values of these securities are determined by management applying the methodologies outlined in Note D to the consolidated financial statements. The credit spread applied by management for internally developed fixed maturity investment values and the lack of visibility into assumptions used in non-binding broker quotes are significant unobservable inputs, which create greater subjectivity when determining the fair values. Credit spread inputs are developed based on management’s review of trade activity for comparable securities and credit spreads over the treasury yield of securities with a similar duration.
Auditing the fair value of the fixed maturity securities that use unobservable inputs was complex and highly judgmental due to the judgment used by the Company in determining unobservable inputs and assumptions to estimate the securities’ fair value. Significant unobservable inputs and assumptions include credit spreads over the treasury yield and non-binding broker quotes.
|
|
|
|
|
|
|
|
|
|
| How We Addressed the Matter in Our Audit |
|
We obtained an understanding, evaluated the design, and tested the operating effectiveness of controls over management’s valuation process for the fixed maturity securities priced using unobservable inputs. This included, among others, testing controls over investment pricing and the development and review of significant inputs and assumptions used in determining the fair values.
To test the Company’s investment fair values, our audit procedures included, among others, comparing the fair values for a sample of securities to pricing service values or internally developed cash flow models. With the assistance of our valuation specialists, we evaluated the valuation methodologies used by the Company and compared the Company’s fair value estimate to an independently calculated range of fair value estimates for a sample of securities. We evaluated information that corroborated or contradicted the Company’s fair value estimates, including observable spreads and transaction data for similar securities. |
|
|
|
|
|
|
|
|
|
|
|
Unpaid losses and loss adjustment expenses |
| Description of the Matter |
|
As of December 31, 2024, the Company’s unpaid losses and loss adjustment expenses reserve liabilities net of reinsurance recoverables, net of allowance, (“reserves”) totaled $9.22 billion as disclosed in Note N to the consolidated financial statements. This liability represents management’s best estimate of the ultimate net cost of all unpaid losses and loss adjustment expenses and is determined by using case-basis evaluations, actuarial projections, and management’s judgment. Estimating the reserves is inherently judgmental and is influenced by factors that are subject to significant variation, particularly for lines of business that develop or are paid over a long period of time or that contain exposures with high potential severities, such as workers’ compensation, other liability, and asbestos and environmental.
Auditing management’s best estimate of reserves was complex because it required the involvement of our actuarial specialists due to the highly judgmental nature of the assumptions used in the evaluation process. The significant judgment was primarily due to the sensitivity of management’s best estimate to the selection and weighting of actuarial methods, loss development factors, and expected loss ratios. These assumptions have a significant effect on the valuation of reserves.
|
|
|
|
|
|
|
|
|
|
| How We Addressed the Matter in Our Audit |
|
We obtained an understanding, evaluated the design and tested the operating effectiveness of controls over the process for estimating reserves. This included, among others, the review and approval processes that management has in place for the methods and assumptions used in estimating the reserves.
With the assistance of actuarial specialists, our audit procedures included, among others, an evaluation of the Company’s selection and weighting of actuarial methods used, including consideration of methods used in prior periods and those used in the industry for the specific types of insurance. To evaluate the significant assumptions used by management, we compared the significant assumptions, including loss development factors, and expected loss ratios, to factors historically used and current industry benchmarks. We also performed a review of the development of prior years’ reserve estimates. With the assistance of actuarial specialists, we established an independent range of reasonable reserve estimates, which we compared to management’s best estimate.
|
|
|
|
|
|
|
|
|
|
|
|
|
|
|
|
/s/ Ernst & Young LLP |
|
|
| We have served as the Company’s auditor since 1961. |
|
|
Cincinnati, Ohio |
|
|
| February 25, 2025 |
|
|
AMERICAN FINANCIAL GROUP, INC. AND SUBSIDIARIES
CONSOLIDATED BALANCE SHEET
(Dollars in Millions)
|
|
|
|
|
|
|
|
|
|
|
|
|
December 31, |
|
2024 |
|
2023 |
| Assets: |
|
|
|
| Cash and cash equivalents |
$ |
1,406 |
|
|
$ |
1,225 |
|
| Investments: |
|
|
|
Fixed maturities, available for sale at fair value (amortized cost — $10,687 and $10,752; allowance for expected credit losses of $34 and $12) |
10,398 |
|
|
10,377 |
|
| Fixed maturities, trading at fair value |
76 |
|
|
57 |
|
| Equity securities, at fair value |
751 |
|
|
1,018 |
|
| Investments accounted for using the equity method |
2,277 |
|
|
1,814 |
|
| Mortgage loans |
791 |
|
|
643 |
|
| Real estate and other investments |
153 |
|
|
129 |
|
| Total cash and investments |
15,852 |
|
|
15,263 |
|
|
|
|
|
| Recoverables from reinsurers |
5,176 |
|
|
4,477 |
|
| Prepaid reinsurance premiums |
1,013 |
|
|
961 |
|
| Agents’ balances and premiums receivable |
1,532 |
|
|
1,471 |
|
| Deferred policy acquisition costs |
320 |
|
|
309 |
|
| Assets of managed investment entities |
4,140 |
|
|
4,484 |
|
| Other receivables |
1,123 |
|
|
1,171 |
|
| Other assets |
1,375 |
|
|
1,346 |
|
| Goodwill |
305 |
|
|
305 |
|
| Total assets |
$ |
30,836 |
|
|
$ |
29,787 |
|
|
|
|
|
| Liabilities and Equity: |
|
|
|
| Unpaid losses and loss adjustment expenses |
$ |
14,179 |
|
|
$ |
13,087 |
|
| Unearned premiums |
3,584 |
|
|
3,451 |
|
| Payable to reinsurers |
1,191 |
|
|
1,186 |
|
| Liabilities of managed investment entities |
3,965 |
|
|
4,307 |
|
| Long-term debt |
1,475 |
|
|
1,475 |
|
| Other liabilities |
1,976 |
|
|
2,023 |
|
| Total liabilities |
26,370 |
|
|
25,529 |
|
|
|
|
|
| Shareholders’ equity: |
|
|
|
|
Common Stock, no par value
— 200,000,000 shares authorized
— 83,978,258 and 83,635,807 shares outstanding
|
84 |
|
|
84 |
|
| Capital surplus |
1,411 |
|
|
1,372 |
|
| Retained earnings |
3,211 |
|
|
3,121 |
|
| Accumulated other comprehensive income (loss), net of tax |
(240) |
|
|
(319) |
|
| Total shareholders’ equity |
4,466 |
|
|
4,258 |
|
| Total liabilities and shareholders’ equity |
$ |
30,836 |
|
|
$ |
29,787 |
|
See notes to consolidated financial statements.
AMERICAN FINANCIAL GROUP, INC. AND SUBSIDIARIES
CONSOLIDATED STATEMENT OF EARNINGS
(In Millions, Except Per Share Data)
|
|
|
|
|
|
|
|
|
|
|
|
|
|
|
|
|
|
|
Year ended December 31, |
|
2024 |
|
2023 |
|
2022 |
| Revenues: |
|
|
|
|
|
Net earned premiums |
$ |
7,036 |
|
|
$ |
6,531 |
|
|
$ |
6,085 |
|
| Net investment income |
780 |
|
|
742 |
|
|
717 |
|
| Realized gains (losses) on: |
|
|
|
|
|
| Securities |
— |
|
|
(36) |
|
|
(116) |
|
| Subsidiaries |
— |
|
|
(4) |
|
|
— |
|
| Income of managed investment entities: |
|
|
|
|
|
| Investment income |
380 |
|
|
421 |
|
|
268 |
|
Gain (loss) on change in fair value of assets/liabilities |
4 |
|
|
27 |
|
|
(31) |
|
| Other income |
124 |
|
|
146 |
|
|
117 |
|
| Total revenues |
8,324 |
|
|
7,827 |
|
|
7,040 |
|
|
|
|
|
|
|
| Costs and Expenses: |
|
|
|
|
|
| Losses and loss adjustment expenses |
4,460 |
|
|
4,033 |
|
|
3,629 |
|
| Commissions and other underwriting expenses |
2,007 |
|
|
1,935 |
|
|
1,718 |
|
| Interest charges on borrowed money |
76 |
|
|
76 |
|
|
85 |
|
| Expenses of managed investment entities |
338 |
|
|
405 |
|
|
230 |
|
| Other expenses |
319 |
|
|
305 |
|
|
255 |
|
| Total costs and expenses |
7,200 |
|
|
6,754 |
|
|
5,917 |
|
Earnings before income taxes |
1,124 |
|
|
1,073 |
|
|
1,123 |
|
Provision for income taxes |
237 |
|
|
221 |
|
|
225 |
|
|
|
|
|
|
|
|
|
|
|
|
|
Net Earnings |
$ |
887 |
|
|
$ |
852 |
|
|
$ |
898 |
|
|
|
|
|
|
|
Earnings per Common Share: |
|
|
|
|
|
|
|
|
|
|
|
|
|
|
|
|
|
| Total basic earnings |
$ |
10.57 |
|
|
$ |
10.06 |
|
|
$ |
10.55 |
|
|
|
|
|
|
|
|
|
|
|
|
|
|
|
|
|
|
|
| Total diluted earnings |
$ |
10.57 |
|
|
$ |
10.05 |
|
|
$ |
10.53 |
|
| Average number of Common Shares: |
|
|
|
|
|
| Basic |
83.9 |
|
|
84.7 |
|
|
85.1 |
|
| Diluted |
83.9 |
|
|
84.8 |
|
|
85.3 |
|
See notes to consolidated financial statements.
AMERICAN FINANCIAL GROUP, INC. AND SUBSIDIARIES
CONSOLIDATED STATEMENT OF COMPREHENSIVE INCOME
(In Millions)
|
|
|
|
|
|
|
|
|
|
|
|
|
|
|
|
|
|
|
Year ended December 31, |
|
2024 |
|
2023 |
|
2022 |
Net earnings |
$ |
887 |
|
|
$ |
852 |
|
|
$ |
898 |
|
|
|
|
|
|
|
Other comprehensive income (loss), net of tax: |
|
|
|
|
|
| Net unrealized gains (losses) on securities: |
|
|
|
|
|
| Unrealized holding gains (losses) on securities arising during the period |
61 |
|
|
176 |
|
|
(647) |
|
| Reclassification adjustment for realized (gains) losses included in net earnings |
24 |
|
|
34 |
|
|
14 |
|
| Total net unrealized gains (losses) on securities |
85 |
|
|
210 |
|
|
(633) |
|
| Net unrealized gains (losses) on cash flow hedges: |
|
|
|
|
|
| Unrealized holding gains (losses) on cash flow hedges arising during the period |
(12) |
|
|
(9) |
|
|
(29) |
|
| Reclassification adjustment for investment income included in net earnings |
19 |
|
|
21 |
|
|
— |
|
| Total net unrealized gains (losses) on cash flow hedges |
7 |
|
|
12 |
|
|
(29) |
|
| Foreign currency translation adjustments |
(13) |
|
|
3 |
|
|
(2) |
|
Pension and other postretirement plan adjustments |
— |
|
|
(1) |
|
|
2 |
|
Other comprehensive income (loss), net of tax |
79 |
|
|
224 |
|
|
(662) |
|
|
|
|
|
|
|
Comprehensive income |
$ |
966 |
|
|
$ |
1,076 |
|
|
$ |
236 |
|
See notes to consolidated financial statements.
AMERICAN FINANCIAL GROUP, INC. AND SUBSIDIARIES
CONSOLIDATED STATEMENT OF CHANGES IN EQUITY
(Dollars in Millions)
|
|
|
|
|
|
|
|
|
|
|
|
|
|
|
|
|
|
|
|
|
|
|
|
|
|
|
|
|
|
|
|
|
|
|
|
|
|
|
|
|
Shareholders’ Equity |
|
|
|
|
Common Shares |
|
|
Common Stock and Capital Surplus |
|
Retained Earnings |
|
Accumulated Other Comp. Income (Loss) |
|
Total |
|
|
|
|
| Balance at December 31, 2021 |
84,920,965 |
|
|
|
$ |
1,415 |
|
|
$ |
3,478 |
|
|
$ |
119 |
|
|
$ |
5,012 |
|
|
|
|
|
Net earnings |
— |
|
|
|
— |
|
|
898 |
|
|
— |
|
|
898 |
|
|
|
|
|
Other comprehensive loss |
— |
|
|
|
— |
|
|
— |
|
|
(662) |
|
|
(662) |
|
|
|
|
|
Dividends ($14.31 per share) |
— |
|
|
|
— |
|
|
(1,217) |
|
|
— |
|
|
(1,217) |
|
|
|
|
|
| Shares issued: |
|
|
|
|
|
|
|
|
|
|
|
|
|
|
| Exercise of stock options |
182,054 |
|
|
|
7 |
|
|
— |
|
|
— |
|
|
7 |
|
|
|
|
|
| Restricted stock awards |
151,080 |
|
|
|
— |
|
|
— |
|
|
— |
|
|
— |
|
|
|
|
|
| Other benefit plans |
78,460 |
|
|
|
10 |
|
|
— |
|
|
— |
|
|
10 |
|
|
|
|
|
| Dividend reinvestment plan |
33,794 |
|
|
|
4 |
|
|
— |
|
|
— |
|
|
4 |
|
|
|
|
|
| Stock-based compensation expense |
— |
|
|
|
19 |
|
|
— |
|
|
— |
|
|
19 |
|
|
|
|
|
| Shares acquired and retired |
(89,368) |
|
|
|
(1) |
|
|
(10) |
|
|
— |
|
|
(11) |
|
|
|
|
|
| Shares exchanged — benefit plans |
(57,420) |
|
|
|
(1) |
|
|
(7) |
|
|
— |
|
|
(8) |
|
|
|
|
|
| Forfeitures of restricted stock |
(15,559) |
|
|
|
— |
|
|
— |
|
|
— |
|
|
— |
|
|
|
|
|
|
|
|
|
|
|
|
|
|
|
|
|
|
|
|
| Balance at December 31, 2022 |
85,204,006 |
|
|
|
$ |
1,453 |
|
|
$ |
3,142 |
|
|
$ |
(543) |
|
|
$ |
4,052 |
|
|
|
|
|
Net earnings |
— |
|
|
|
— |
|
|
852 |
|
|
— |
|
|
852 |
|
|
|
|
|
Other comprehensive income |
— |
|
|
|
— |
|
|
— |
|
|
224 |
|
|
224 |
|
|
|
|
|
Dividends ($8.10 per share) |
— |
|
|
|
— |
|
|
(687) |
|
|
— |
|
|
(687) |
|
|
|
|
|
| Shares issued: |
|
|
|
|
|
|
|
|
|
|
|
|
|
|
| Exercise of stock options |
96,953 |
|
|
|
4 |
|
|
— |
|
|
— |
|
|
4 |
|
|
|
|
|
| Restricted stock awards |
165,513 |
|
|
|
— |
|
|
— |
|
|
— |
|
|
— |
|
|
|
|
|
| Other benefit plans |
104,207 |
|
|
|
13 |
|
|
— |
|
|
— |
|
|
13 |
|
|
|
|
|
| Dividend reinvestment plan |
20,614 |
|
|
|
3 |
|
|
— |
|
|
— |
|
|
3 |
|
|
|
|
|
| Stock-based compensation expense |
— |
|
|
|
18 |
|
|
— |
|
|
— |
|
|
18 |
|
|
|
|
|
| Shares acquired and retired |
(1,872,544) |
|
|
|
(34) |
|
|
(179) |
|
|
— |
|
|
(213) |
|
|
|
|
|
| Shares exchanged — benefit plans |
(64,060) |
|
|
|
(1) |
|
|
(7) |
|
|
— |
|
|
(8) |
|
|
|
|
|
| Forfeitures of restricted stock |
(18,882) |
|
|
|
— |
|
|
— |
|
|
— |
|
|
— |
|
|
|
|
|
|
|
|
|
|
|
|
|
|
|
|
|
|
|
|
| Balance at December 31, 2023 |
83,635,807 |
|
|
|
$ |
1,456 |
|
|
$ |
3,121 |
|
|
$ |
(319) |
|
|
$ |
4,258 |
|
|
|
|
|
Net earnings |
— |
|
|
|
— |
|
|
887 |
|
|
— |
|
|
887 |
|
|
|
|
|
Other comprehensive income |
— |
|
|
|
— |
|
|
— |
|
|
79 |
|
|
79 |
|
|
|
|
|
Dividends ($9.43 per share) |
— |
|
|
|
— |
|
|
(791) |
|
|
— |
|
|
(791) |
|
|
|
|
|
| Shares issued: |
|
|
|
|
|
|
|
|
|
|
|
|
|
|
| Exercise of stock options |
127,719 |
|
|
|
6 |
|
|
— |
|
|
— |
|
|
6 |
|
|
|
|
|
| Restricted stock awards |
157,681 |
|
|
|
— |
|
|
— |
|
|
— |
|
|
— |
|
|
|
|
|
| Other benefit plans |
100,716 |
|
|
|
13 |
|
|
— |
|
|
— |
|
|
13 |
|
|
|
|
|
| Dividend reinvestment plan |
22,740 |
|
|
|
3 |
|
|
— |
|
|
— |
|
|
3 |
|
|
|
|
|
| Stock-based compensation expense |
— |
|
|
|
18 |
|
|
— |
|
|
— |
|
|
18 |
|
|
|
|
|
|
|
|
|
|
|
|
|
|
|
|
|
|
|
|
| Shares exchanged — benefit plans |
(53,573) |
|
|
|
(1) |
|
|
(6) |
|
|
— |
|
|
(7) |
|
|
|
|
|
| Forfeitures of restricted stock |
(12,832) |
|
|
|
— |
|
|
— |
|
|
— |
|
|
— |
|
|
|
|
|
|
|
|
|
|
|
|
|
|
|
|
|
|
|
|
| Balance at December 31, 2024 |
83,978,258 |
|
|
|
$ |
1,495 |
|
|
$ |
3,211 |
|
|
$ |
(240) |
|
|
$ |
4,466 |
|
|
|
|
|
See notes to consolidated financial statements.
AMERICAN FINANCIAL GROUP, INC. AND SUBSIDIARIES
CONSOLIDATED STATEMENT OF CASH FLOWS
(In Millions)
|
|
|
|
|
|
|
|
|
|
|
|
|
|
|
|
|
|
|
Year ended December 31, |
|
2024 |
|
2023 |
|
2022 |
| Operating Activities: |
|
|
|
|
|
| Net earnings |
$ |
887 |
|
|
$ |
852 |
|
|
$ |
898 |
|
| Adjustments: |
|
|
|
|
|
| Depreciation and amortization |
81 |
|
|
78 |
|
|
100 |
|
| Realized gains (losses) on investing activities |
— |
|
|
38 |
|
|
110 |
|
Net purchases of trading securities |
(26) |
|
|
(5) |
|
|
(2) |
|
| Change in: |
|
|
|
|
|
| Reinsurance and other receivables |
(769) |
|
|
(794) |
|
|
(644) |
|
| Other assets |
10 |
|
|
(19) |
|
|
(138) |
|
| Insurance claims and reserves |
1,225 |
|
|
1,318 |
|
|
1,105 |
|
| Payable to reinsurers |
5 |
|
|
151 |
|
|
115 |
|
| Other liabilities |
(153) |
|
|
72 |
|
|
(69) |
|
| Managed investment entities’ assets/liabilities |
(80) |
|
|
305 |
|
|
(183) |
|
| Other operating activities, net |
(28) |
|
|
(26) |
|
|
(139) |
|
Net cash provided by operating activities |
1,152 |
|
|
1,970 |
|
|
1,153 |
|
|
|
|
|
|
|
| Investing Activities: |
|
|
|
|
|
| Purchases of: |
|
|
|
|
|
| Fixed maturities |
(2,136) |
|
|
(2,005) |
|
|
(4,387) |
|
| Equity securities |
(187) |
|
|
(146) |
|
|
(239) |
|
| Mortgage loans |
(191) |
|
|
— |
|
|
(273) |
|
Other investments |
(247) |
|
|
(150) |
|
|
(141) |
|
| Real estate, property and equipment |
(133) |
|
|
(72) |
|
|
(86) |
|
| Businesses |
(9) |
|
|
(234) |
|
|
(10) |
|
| Proceeds from: |
|
|
|
|
|
| Maturities and redemptions of fixed maturities |
2,145 |
|
|
1,310 |
|
|
2,511 |
|
| Repayments of mortgage loans |
41 |
|
|
34 |
|
|
118 |
|
| Sales of fixed maturities |
124 |
|
|
650 |
|
|
1,294 |
|
| Sales of equity securities |
179 |
|
|
164 |
|
|
174 |
|
Sales of other investments |
107 |
|
|
78 |
|
|
141 |
|
| Sales of real estate, property and equipment |
30 |
|
|
3 |
|
|
31 |
|
|
|
|
|
|
|
Cash and cash equivalents of businesses acquired |
— |
|
|
26 |
|
|
— |
|
| Managed investment entities: |
|
|
|
|
|
| Purchases of investments |
(1,880) |
|
|
(1,466) |
|
|
(1,515) |
|
| Proceeds from sales and redemptions of investments |
2,257 |
|
|
2,228 |
|
|
1,335 |
|
| Other investing activities, net |
(5) |
|
|
(6) |
|
|
(4) |
|
Net cash provided by (used in) investing activities |
95 |
|
|
414 |
|
|
(1,051) |
|
|
|
|
|
|
|
| Financing Activities: |
|
|
|
|
|
|
|
|
|
|
|
| Reductions of long-term debt |
— |
|
|
(21) |
|
|
(477) |
|
| Issuances of Common Stock |
17 |
|
|
15 |
|
|
16 |
|
| Repurchases of Common Stock |
— |
|
|
(213) |
|
|
(11) |
|
| Cash dividends paid on Common Stock |
(788) |
|
|
(684) |
|
|
(1,213) |
|
| Issuances of managed investment entities’ liabilities |
2,336 |
|
|
670 |
|
|
1,206 |
|
| Retirements of managed investment entities’ liabilities |
(2,631) |
|
|
(1,798) |
|
|
(882) |
|
|
|
|
|
|
|
Net cash used in financing activities |
(1,066) |
|
|
(2,031) |
|
|
(1,361) |
|
| Net Change in Cash and Cash Equivalents |
181 |
|
|
353 |
|
|
(1,259) |
|
| Cash and cash equivalents at beginning of year |
1,225 |
|
|
872 |
|
|
2,131 |
|
| Cash and cash equivalents at end of year |
$ |
1,406 |
|
|
$ |
1,225 |
|
|
$ |
872 |
|
See notes to consolidated financial statements.
AMERICAN FINANCIAL GROUP, INC. AND SUBSIDIARIES
NOTES TO CONSOLIDATED FINANCIAL STATEMENTS
|
|
|
|
|
|
|
|
|
|
|
|
|
|
|
|
|
|
| INDEX TO NOTES |
|
|
|
|
|
|
| A. |
Accounting Policies |
|
I. |
Long-Term Debt |
|
| B. |
Acquisitions of Businesses |
|
J. |
Leases |
|
| C. |
Segments of Operations |
|
K. |
Shareholders’ Equity |
|
| D. |
Fair Value Measurements |
|
L. |
Income Taxes |
|
| E. |
Investments |
|
M. |
Contingencies |
|
| F. |
Derivatives |
|
N. |
Insurance |
|
| G. |
Managed Investment Entities |
|
O. |
Additional Information |
|
| H. |
Goodwill and Other Intangibles |
|
|
|
|
A. Accounting Policies
Basis of Presentation The consolidated financial statements include the accounts of American Financial Group, Inc. and its subsidiaries (“AFG”). Certain reclassifications have been made to prior years to conform to the current year’s presentation. All significant intercompany balances and transactions have been eliminated. The results of operations of companies since their formation or acquisition are included in the consolidated financial statements. Events or transactions occurring subsequent to December 31, 2024, and prior to the filing of this Form 10-K, have been evaluated for potential recognition or disclosure herein.
The preparation of the financial statements in conformity with U.S. generally accepted accounting principles (“GAAP”) requires management to make estimates and assumptions that affect the amounts reported in the financial statements and accompanying notes. Changes in circumstances could cause actual results to differ materially from those estimates.
Recently Adopted Accounting Standards In the fourth quarter of 2024, AFG adopted Accounting Standards Update (“ASU”) 2023-07, Segment Reporting (Topic 280): Improvements to Reportable Segment Disclosures. The updated accounting guidance requires expanded reportable segment disclosures, primarily related to significant segment expenses which are regularly provided to the Company’s Chief Operating Decision Maker (“CODM”). See Note C — “Segments of Operations” to the financial statements.
Fair Value Measurements Accounting standards define fair value as the price that would be received to sell an asset or paid to transfer a liability (an exit price) in an orderly transaction between market participants on the measurement date. The standards establish a hierarchy of valuation techniques based on whether the assumptions that market participants would use in pricing the asset or liability (“inputs”) are observable or unobservable. Observable inputs reflect market data obtained from independent sources, while unobservable inputs reflect AFG’s assumptions about the assumptions market participants would use in pricing the asset or liability.
AFG had nonrecurring fair value measurements for the purchase price allocations related to two small acquisitions in 2024 and its acquisition of Crop Risk Services in 2023 (see Note B — “Acquisitions of Businesses”) and the write-off of a portion of goodwill related to AFG’s investment in Verikai in 2023 (see Note H — “Goodwill and Other Intangibles”). These fair value measurements were based on significant inputs that are unobservable (Level 3). There were no other material nonrecurring fair value measurements in 2024, 2023 or 2022.
Investments Fixed maturity securities classified as “available for sale” are reported at fair value with unrealized gains and losses included in accumulated other comprehensive income (“AOCI”) in AFG’s Balance Sheet. Fixed maturity securities classified as “trading” are reported at fair value with changes in unrealized holding gains or losses during the period included in net investment income. Mortgage loans (net of any allowance) are carried primarily at the aggregate unpaid balance.
Realized gains or losses on the disposal of fixed maturity securities are determined on the specific identification basis. Premiums and discounts on fixed maturity securities are amortized using the effective interest method. Structured securities subject to prepayment risk are amortized over a period based on estimated future principal payments, including prepayments. Prepayment assumptions are reviewed periodically and adjusted to reflect actual prepayments and changes in expectations.
AMERICAN FINANCIAL GROUP, INC. AND SUBSIDIARIES
NOTES TO CONSOLIDATED FINANCIAL STATEMENTS — CONTINUED
Equity securities are reported at fair value with holding gains and losses generally recorded in realized gains (losses) on securities. However, AFG records holding gains and losses on certain securities classified at purchase as “fair value through net investment income” in net investment income.
Limited partnerships and similar investments are generally accounted for using the equity method of accounting. Under the equity method, AFG records its share of the earnings or losses of the investee based on when it is reported by the investee in its financial statements rather than in the period in which the investee declares a dividend. AFG’s share of the earnings or losses from equity method investments is generally recorded on a quarter lag due to the timing of the receipt of the investee’s financial statements. AFG’s equity in the earnings (losses) of limited partnerships and similar investments is included in net investment income.
Credit Losses on Fixed Maturity Investments When a decline in the value of an available for sale fixed maturity is considered to be other-than-temporary at the balance sheet date, an allowance for credit losses (impairment), including any write-off of accrued interest, is charged to earnings (included in realized gains (losses) on securities). If management can assert that it does not intend to sell the security and it is not more likely than not that it will have to sell it before recovery of its amortized cost basis, then the impairment is separated into two components: (i) the allowance related to credit losses (recorded in earnings) and (ii) the amount related to all other factors (recorded in other comprehensive income). The credit-related portion is measured by comparing a security’s amortized cost (net of any existing allowance) to the present value of its current expected cash flows discounted at its effective yield prior to the charge. The allowance is limited to the difference between a security’s amortized cost basis and its fair value. Subsequent increases or decreases in expected credit losses are recorded immediately in net earnings through realized gains (losses). If management intends to sell an impaired security, or it is more likely than not that it will be required to sell the security before recovery, an impairment is recorded in earnings to reduce the amortized cost of that security to fair value.
Credit Losses on Financial Instruments Measured at Amortized Cost Credit-related impairments for financial instruments measured at amortized cost (mortgage loans, premiums receivable and reinsurance recoverables) reflect estimated credit losses expected over the life of an exposure or pool of exposures. The estimate of expected credit losses considers historical information, current information, as well as reasonable and supportable forecasts, including estimates of prepayments. Expected credit losses, and subsequent increases or decreases in such expected losses, are recorded immediately through net earnings as an allowance that is deducted from the amortized cost basis of the financial asset, with the net carrying value of the financial asset presented on the balance sheet at the amount expected to be collected.
Derivatives Derivatives included in AFG’s Balance Sheet are recorded at fair value. Changes in fair value of derivatives are included in earnings unless the derivatives are designated and qualify as highly effective cash flow hedges. AFG’s derivatives that do not qualify for hedge accounting under GAAP consist primarily of components of certain fixed maturity securities (convertible fixed maturities and interest-only and principal-only mortgage-backed securities (“MBS”)) and a total return swap related to its deferred compensation obligations to employees.
To qualify for hedge accounting, at the inception of a derivative contract, AFG formally documents the relationship between the terms of the hedge and the hedged items and its risk management objective. This documentation includes defining how hedge effectiveness is evaluated at the inception date and over the life of the derivative.
Changes in the fair value of derivatives that are designated and qualify as highly effective cash flow hedges are recorded in AOCI and are reclassified into earnings when the variability of the cash flows from the hedged items impacts earnings. When the change in the fair value of a qualifying cash flow hedge is included in earnings, it is included in the same line item in the statement of earnings as the cash flows from the hedged item. AFG uses interest rate swaps that are designated and qualify as highly effective cash flow hedges to mitigate interest rate risk related to certain floating-rate securities.
Goodwill Goodwill represents the excess of cost of subsidiaries over AFG’s equity in their underlying net assets at the date of acquisition. Goodwill is not amortized, but is subject to an impairment test at least annually. An entity is not required to complete the quantitative annual goodwill impairment test on a reporting unit if the entity elects to perform a qualitative analysis and determines that it is more likely than not that the reporting unit’s fair value exceeds its carrying amount.
Reinsurance Amounts recoverable from reinsurers are estimated in a manner consistent with the claim liability associated with the reinsured policies. AFG reports as assets (i) the estimated reinsurance recoverable on paid and unpaid losses, including an estimate for losses incurred but not reported, and (ii) amounts paid or due to reinsurers applicable to the unexpired terms of policies in force.
AMERICAN FINANCIAL GROUP, INC. AND SUBSIDIARIES
NOTES TO CONSOLIDATED FINANCIAL STATEMENTS — CONTINUED
Payable to reinsurers includes ceded premiums due to reinsurers, as well as ceded premiums retained by AFG under contracts to fund ceded losses as they become due. AFG also assumes reinsurance from other companies. Earnings on reinsurance assumed is recognized based on information received from ceding companies.
Deferred Policy Acquisition Costs (“DPAC”) Policy acquisition costs (principally commissions, premium taxes and certain underwriting and policy issuance costs) directly related to the successful acquisition or renewal of an insurance contract are deferred. DPAC is limited based upon recoverability without any consideration for anticipated investment income and is charged against income ratably over the terms of the related policies. A premium deficiency is recognized if the sum of expected claims costs, claims adjustment expenses and unamortized acquisition costs exceed the related unearned premiums. A premium deficiency is first recognized by charging any unamortized acquisition costs to expense to the extent required to eliminate the deficiency. If the premium deficiency is greater than unamortized acquisition costs, a liability is accrued for the excess deficiency and reported with unpaid losses and loss adjustment expenses.
Managed Investment Entities A company is considered the primary beneficiary of, and therefore must consolidate, a variable interest entity (“VIE”) based primarily on its ability to direct the activities of the VIE that most significantly impact that entity’s economic performance and the obligation to absorb losses of, or receive benefits from, the entity that could potentially be significant to the VIE.
AFG manages, and has investments in, collateralized loan obligations (“CLOs”) that are VIEs (see Note G — “Managed Investment Entities”). AFG has determined that it is the primary beneficiary of these CLOs because (i) its role as asset manager gives it the power to direct the activities that most significantly impact the economic performance of the CLOs and (ii) through its investment in the CLO debt tranches, it has exposure to CLO losses (limited to the amount AFG invested) and the right to receive CLO benefits that could potentially be significant to the CLOs.
Because AFG has no right to use the CLO assets and no obligation to pay the CLO liabilities, the assets and liabilities of the CLOs are shown separately in AFG’s Balance Sheet. AFG has elected the fair value option for reporting on the CLO assets and liabilities to improve the transparency of financial reporting related to the CLOs. The net gain or loss from accounting for the CLO assets and liabilities at fair value is presented separately in AFG’s Statement of Earnings.
The fair values of a CLO’s assets may differ from the separately measured fair values of its liabilities even though the CLO liabilities only have recourse to the CLO assets. AFG has set the carrying value of the CLO liabilities equal to the fair value of the CLO assets (which have more observable fair values) as an alternative to reporting those liabilities at a separately measured fair value. CLO earnings attributable to AFG’s shareholders are measured by the change in the fair value of AFG’s investments in the CLOs and management fees earned.
At December 31, 2024, assets and liabilities of managed investment entities included $302 million in assets and $253 million in liabilities of a temporary warehousing entity that was established to provide AFG the ability to form a new CLO. At closing, all warehoused assets will be transferred to the new CLO and the liabilities will be repaid.
Unpaid Losses and Loss Adjustment Expenses The liabilities stated for unpaid claims and for expenses of investigation and adjustment of unpaid claims represent management’s best estimate and are based upon (i) the accumulation of case estimates for losses reported prior to the close of the accounting period on direct business written; (ii) estimates received from ceding reinsurers and insurance pools and associations; (iii) estimates of unreported losses (including possible development on known claims) based on past experience; (iv) estimates based on experience of expenses for investigating and adjusting claims; and (v) the current state of the law and coverage litigation. Establishing reserves for asbestos, environmental and other mass tort claims involves considerably more judgment than other types of claims due to, among other things, inconsistent court decisions, an increase in bankruptcy filings as a result of asbestos-related liabilities, novel theories of coverage, and judicial interpretations that often expand theories of recovery and broaden the scope of coverage.
Loss reserve liabilities are subject to the impact of changes in claim amounts and frequency and other factors. Changes in estimates of the liabilities for losses and loss adjustment expenses are reflected in the statement of earnings in the period in which determined. Despite the variability inherent in such estimates, management believes that the liabilities for unpaid losses and loss adjustment expenses are adequate and reasonable.
Debt Issuance Costs Debt issuance costs related to AFG’s outstanding debt are presented in its Balance Sheet as a direct reduction in the carrying value of long-term debt and are amortized over the life of the related debt using the effective interest method as a component of interest expense.
AMERICAN FINANCIAL GROUP, INC. AND SUBSIDIARIES
NOTES TO CONSOLIDATED FINANCIAL STATEMENTS — CONTINUED
Debt issuance costs related to AFG’s revolving credit facility are included in other assets in AFG’s Balance Sheet.
Leases Leases for terms of longer than one year are recognized as assets and liabilities for the rights and obligations created by those leases on the balance sheet based on the present value of contractual cash flows.
Premium Recognition Property and casualty premiums are earned generally over the terms of the policies on a pro rata basis. Unearned premiums represent that portion of premiums written, which is applicable to the unexpired terms of policies in force. On reinsurance assumed from other insurance companies or written through various underwriting organizations, unearned premiums are based on information received from such companies and organizations.
Income Taxes Deferred income taxes are calculated using the liability method. Under this method, deferred income tax assets and liabilities are determined based on differences between financial reporting and tax bases and are measured using enacted tax rates. A valuation allowance is established to reduce total deferred tax assets to an amount that will more likely than not be realized. The effect of a change in tax rates on deferred tax assets and liabilities is recorded in net earnings in the period that includes the enactment date.
AFG recognizes the tax benefits of uncertain tax positions only when the position is more likely than not to be sustained under examination by the appropriate taxing authority. Interest and penalties on AFG’s reserve for uncertain tax positions are recognized as a component of tax expense.
Stock-Based Compensation All share-based grants are recognized as compensation expense on a straight-line basis over their vesting periods based on their calculated fair value at the date of grant.
AFG records excess tax benefits or deficiencies for share-based payments through income tax expense in the statement of earnings. In addition, AFG accounts for forfeitures of awards when they occur.
Benefit Plans AFG provides retirement benefits to qualified employees of participating companies through the AFG 401(k) Retirement and Savings Plan, a defined contribution plan. AFG makes all contributions to the retirement fund portion of the plan and matches a percentage of employee contributions to the savings fund. Company contributions are expensed in the year for which they are declared. AFG and many of its subsidiaries provide health care and life insurance benefits to eligible retirees. AFG also provides postemployment benefits to former or inactive employees (primarily those on disability) who were not deemed retired under other company plans. The projected future cost of providing these benefits is expensed over the period employees earn such benefits.
Earnings Per Share Although basic earnings per share only considers shares of common stock outstanding during the period, the calculation of diluted earnings per share includes the following adjustments to weighted average common shares related to stock-based compensation plans: 2024 – less than 0.1 million, 2023 – 0.1 million and 2022 – 0.2 million.
There were no anti-dilutive potential common shares related to stock compensation plans or adjustments to net earnings in the calculation of diluted earnings per share for the years ended December 31, 2024, 2023 or 2022.
Statement of Cash Flows For cash flow purposes, “investing activities” are defined as making and collecting loans and acquiring and disposing of debt or equity instruments, property and equipment and businesses. “Financing activities” include obtaining resources from owners and providing them with a return on their investments, borrowing money and repaying amounts borrowed. All other activities are considered “operating.” Short-term investments having original maturities of three months or less when purchased are considered to be cash equivalents for purposes of the financial statements.
AMERICAN FINANCIAL GROUP, INC. AND SUBSIDIARIES
NOTES TO CONSOLIDATED FINANCIAL STATEMENTS — CONTINUED
B. Acquisitions of Businesses
Crop Risk Services On July 3, 2023, AFG completed the acquisition of Crop Risk Services (“CRS”) from American International Group (“AIG”). CRS is a primary crop insurance general agent based in Decatur, Illinois, that generated crop year 2022 gross written premiums of approximately $1.2 billion and was the seventh largest provider of multi-peril crop insurance in the United States based on 2022 premiums. At closing, AFG paid AIG $234 million (based on $24 million in net tangible assets) using cash on hand.
Expenses related to the acquisition were $3 million and were expensed as incurred. The purchase price was allocated to the acquired assets and liabilities of CRS based on management’s best estimate of fair value as of the acquisition date. The purchase price allocation is shown below (in millions).
|
|
|
|
|
|
|
July 3, 2023 |
Cash paid at purchase |
$ |
234 |
|
|
|
Tangible assets acquired: |
|
Cash and cash equivalents |
$ |
26 |
|
Agents’ balances and premiums receivable |
164 |
|
Other assets |
3 |
|
Total tangible assets acquired |
$ |
193 |
|
|
|
Liabilities acquired: |
|
Other liabilities |
$ |
169 |
|
Total liabilities acquired |
169 |
|
Net tangible assets acquired, at fair value |
24 |
|
Excess purchase price over net tangible assets acquired |
$ |
210 |
|
|
|
| Allocation of excess purchase price: |
|
Intangible assets acquired (*) |
$ |
124 |
|
Deferred tax asset (*) |
1 |
|
Goodwill |
85 |
|
|
$ |
210 |
|
(*)Included in Other assets in AFG’s Balance Sheet.
In the purchase price allocation, $124 million of the purchase price was recognized as finite lived intangible assets primarily related to existing agency relationships, which will be amortized over an average estimated life of approximately 14 years. The acquisition resulted in the recognition of $85 million in GAAP basis goodwill based on the excess of the purchase price over the fair value of the net assets acquired. The acquisition resulted in $79 million of tax basis goodwill, which is deductible for tax purposes.
In the fourth quarter of 2024, AFG acquired an insurance agency business for $6 million, including $5 million in cash, and a consulting company for $4 million in cash. Virtually all of the purchase price for each acquisition was recorded as an amortizing intangible asset representing the fair value of the customer bases at acquisition.
In the third quarter of 2022, AFG acquired an insurance agency business for $12 million, including $10 million in cash. Virtually all of the purchase price was recorded as an amortizing intangible asset representing the fair value of the agency’s customer base at acquisition.
C. Segments of Operations
AFG manages its business as two segments: Property and casualty insurance and Other, which includes holding company assets and costs.
AMERICAN FINANCIAL GROUP, INC. AND SUBSIDIARIES
NOTES TO CONSOLIDATED FINANCIAL STATEMENTS — CONTINUED
AFG reports its property and casualty insurance business in the following Specialty sub-segments: (i) Property and transportation, which includes physical damage and liability coverage for buses and trucks and other specialty transportation niches, inland and ocean marine, agricultural-related products and other commercial property coverages, (ii) Specialty casualty, which includes primarily excess and surplus, executive and professional liability, general liability, umbrella and excess liability, specialty coverages in targeted markets, customized programs for small to mid-sized businesses and workers’ compensation insurance, and (iii) Specialty financial, which includes risk management insurance programs for lending and leasing institutions (including equipment leasing and collateral and lender-placed mortgage property insurance), fidelity and surety products and trade credit insurance. Premiums and underwriting profit (loss) included under Other specialty represent business assumed by AFG’s internal reinsurance program from the operations that make up AFG’s other Specialty sub-segments and amortization of a deferred gain on a retroactive reinsurance transaction related to the sale of a business. AFG’s reportable segments and their components were determined based primarily upon similar economic characteristics, products and services. The impacts of all intercompany transactions between segments have been eliminated.
AFG’s CODMs are its Co-CEOs. The CODMs evaluate the performance of the Property and casualty insurance segment based on return on equity and underwriting profit. The CODMs use this measure to allocate resources and make capital decisions.
Sales of property and casualty insurance outside of the United States represented 4% of AFG’s revenues in 2024, 3% in 2023 and 4% in 2022.
The following tables (in millions) show AFG’s assets, revenues and earnings before income taxes by segment and sub-segment.
|
|
|
|
|
|
|
|
|
|
|
|
|
2024 |
|
2023 |
| Assets |
|
|
|
| Property and casualty insurance (*) |
$ |
25,913 |
|
|
$ |
24,475 |
|
| Other |
4,923 |
|
|
5,312 |
|
| Total assets |
$ |
30,836 |
|
|
$ |
29,787 |
|
(*)Not allocable to sub-segments.
|
|
|
|
|
|
|
|
|
|
|
|
|
|
|
|
|
|
|
2024 |
|
2023 |
|
2022 |
| Revenues |
|
|
|
|
|
| Property and casualty insurance: |
|
|
|
|
|
| Premiums earned: |
|
|
|
|
|
| Specialty |
|
|
|
|
|
| Property and transportation |
$ |
2,793 |
|
|
$ |
2,519 |
|
|
$ |
2,487 |
|
| Specialty casualty |
2,967 |
|
|
2,886 |
|
|
2,659 |
|
| Specialty financial |
1,032 |
|
|
867 |
|
|
698 |
|
| Other specialty |
244 |
|
|
259 |
|
|
241 |
|
|
|
|
|
|
|
| Total premiums earned |
7,036 |
|
|
6,531 |
|
|
6,085 |
|
| Net investment income |
784 |
|
|
729 |
|
|
683 |
|
| Other income |
8 |
|
|
16 |
|
|
12 |
|
| Total property and casualty insurance |
7,828 |
|
|
7,276 |
|
|
6,780 |
|
| Other |
496 |
|
|
591 |
|
|
376 |
|
| Total revenues before realized gains (losses) |
8,324 |
|
|
7,867 |
|
|
7,156 |
|
| Realized gains (losses) on securities |
— |
|
|
(36) |
|
|
(116) |
|
Realized loss on subsidiary |
— |
|
|
(4) |
|
|
— |
|
| Total revenues |
$ |
8,324 |
|
|
$ |
7,827 |
|
|
$ |
7,040 |
|
AMERICAN FINANCIAL GROUP, INC. AND SUBSIDIARIES
NOTES TO CONSOLIDATED FINANCIAL STATEMENTS — CONTINUED
|
|
|
|
|
|
|
|
|
|
|
|
|
|
|
|
|
|
|
2024 |
|
2023 |
|
2022 |
Earnings Before Income Taxes |
|
|
|
|
|
| Property and casualty insurance: |
|
|
|
|
|
| Underwriting: |
|
|
|
|
|
| Specialty |
|
|
|
|
|
| Property and transportation |
$ |
211 |
|
|
$ |
184 |
|
|
$ |
208 |
|
| Specialty casualty |
340 |
|
|
375 |
|
|
500 |
|
| Specialty financial |
134 |
|
|
110 |
|
|
114 |
|
| Other specialty |
(59) |
|
|
(36) |
|
|
(42) |
|
| Other lines |
(6) |
|
|
(2) |
|
|
(4) |
|
Total underwriting (a) |
620 |
|
|
631 |
|
|
776 |
|
Investment and other income, net (b) |
708 |
|
|
673 |
|
|
643 |
|
| Total property and casualty insurance |
1,328 |
|
|
1,304 |
|
|
1,419 |
|
Other (c) |
(204) |
|
|
(191) |
|
|
(180) |
|
Total earnings before realized gains (losses) and income taxes |
1,124 |
|
|
1,113 |
|
|
1,239 |
|
| Realized gains (losses) on securities |
— |
|
|
(36) |
|
|
(116) |
|
| Realized loss on subsidiary |
— |
|
|
(4) |
|
|
— |
|
Total earnings before income taxes |
$ |
1,124 |
|
|
$ |
1,073 |
|
|
$ |
1,123 |
|
(a)Significant segment expenses, which are losses and loss adjustment expenses and commissions and other underwriting expenses, are shown in the table below by sub-segment.
(b)Includes the amortization of intangibles and other miscellaneous expenses.
(c)Includes the expenses of the managed investment entities, interest charges on borrowed money and salaries, depreciation and other general expenses. Additionally, includes a gain on retirement of debt of $1 million in 2023 and a loss on retirement of debt of $9 million in 2022, and special charges of $14 million and $15 million in 2024 and 2023, respectively, to increase asbestos and environmental liabilities related to AFG’s former railroad and manufacturing operations.
AMERICAN FINANCIAL GROUP, INC. AND SUBSIDIARIES
NOTES TO CONSOLIDATED FINANCIAL STATEMENTS — CONTINUED
The following table shows the components of underwriting profit, including significant segment expenses, for the Property and casualty insurance segment (in millions) for the years ended:
|
|
|
|
|
|
|
|
|
|
|
|
|
|
|
|
|
|
|
2024 |
|
2023 |
|
2022 |
Property and casualty insurance: |
|
|
|
|
|
Specialty: |
|
|
|
|
|
Property and transportation: |
|
|
|
|
|
Premiums earned |
$ |
2,793 |
|
|
$ |
2,519 |
|
|
$ |
2,487 |
|
| Losses and loss adjustment expenses |
1,952 |
|
|
1,741 |
|
|
1,735 |
|
| Commissions and other underwriting expenses |
630 |
|
|
594 |
|
|
544 |
|
Underwriting profit |
$ |
211 |
|
|
$ |
184 |
|
|
$ |
208 |
|
|
|
|
|
|
|
| Specialty casualty: |
|
|
|
|
|
| Premiums earned |
$ |
2,967 |
|
|
$ |
2,886 |
|
|
$ |
2,659 |
|
| Losses and loss adjustment expenses |
1,853 |
|
|
1,739 |
|
|
1,453 |
|
| Commissions and other underwriting expenses |
774 |
|
|
772 |
|
|
706 |
|
Underwriting profit |
$ |
340 |
|
|
$ |
375 |
|
|
$ |
500 |
|
|
|
|
|
|
|
| Specialty financial: |
|
|
|
|
|
| Premiums earned |
$ |
1,032 |
|
|
$ |
867 |
|
|
$ |
698 |
|
| Losses and loss adjustment expenses |
429 |
|
|
328 |
|
|
238 |
|
| Commissions and other underwriting expenses |
469 |
|
|
429 |
|
|
346 |
|
Underwriting profit |
$ |
134 |
|
|
$ |
110 |
|
|
$ |
114 |
|
|
|
|
|
|
|
| Other Specialty: |
|
|
|
|
|
| Premiums earned |
$ |
244 |
|
|
$ |
259 |
|
|
$ |
241 |
|
| Losses and loss adjustment expenses |
215 |
|
|
207 |
|
|
199 |
|
| Commissions and other underwriting expenses |
88 |
|
|
88 |
|
|
84 |
|
Underwriting loss |
$ |
(59) |
|
|
$ |
(36) |
|
|
$ |
(42) |
|
|
|
|
|
|
|
Other lines: |
|
|
|
|
|
| Losses and loss adjustment expenses |
$ |
6 |
|
|
$ |
2 |
|
|
$ |
4 |
|
Underwriting loss |
$ |
(6) |
|
|
$ |
(2) |
|
|
$ |
(4) |
|
|
|
|
|
|
|
Total property and casualty insurance segment: |
|
|
|
|
|
| Premiums earned |
$ |
7,036 |
|
|
$ |
6,531 |
|
|
$ |
6,085 |
|
| Losses and loss adjustment expenses |
4,455 |
|
|
4,017 |
|
|
3,629 |
|
| Commissions and other underwriting expenses |
1,961 |
|
|
1,883 |
|
|
1,680 |
|
Underwriting profit |
$ |
620 |
|
|
$ |
631 |
|
|
$ |
776 |
|
AMERICAN FINANCIAL GROUP, INC. AND SUBSIDIARIES
NOTES TO CONSOLIDATED FINANCIAL STATEMENTS — CONTINUED
D. Fair Value Measurements
Accounting standards for measuring fair value are based on inputs used in estimating fair value. The three levels of the hierarchy are as follows:
Level 1 — Quoted prices for identical assets or liabilities in active markets (markets in which transactions occur with sufficient frequency and volume to provide pricing information on an ongoing basis). AFG’s Level 1 financial instruments consist primarily of publicly traded equity securities, highly liquid government bonds for which quoted market prices in active markets are available and short-term investments of managed investment entities.
Level 2 — Quoted prices for similar instruments in active markets; quoted prices for identical or similar assets or liabilities in inactive markets (markets in which there are few transactions, the prices are not current, price quotations vary substantially over time or among market makers, or in which little information is released publicly); and valuations based on other significant inputs that are observable in active markets. AFG’s Level 2 financial instruments consist primarily of fixed maturity securities and investments of managed investment entities priced using observable inputs. Level 2 inputs include benchmark yields, reported trades, corroborated broker/dealer quotes, issuer spreads and benchmark securities. When non-binding broker quotes can be corroborated by comparison to similar securities priced using observable inputs, they are classified as Level 2.
Level 3 — Valuations derived from market valuation techniques generally consistent with those used to estimate the fair values of Level 2 financial instruments in which one or more significant inputs are unobservable or when the market for a security exhibits significantly less liquidity relative to markets supporting Level 2 fair value measurements. The unobservable inputs may include management’s own assumptions about the assumptions market participants would use based on the best information available at the valuation date. Financial instruments whose fair value is estimated based on non-binding broker quotes or internally developed using significant inputs not based on, or corroborated by, observable market information are classified as Level 3.
The contingent consideration liability related to the 2021 acquisition of Verikai, was measured using a weighted probability-based income approach which includes significant unobservable inputs and is classified as Level 3 and represented the fair value of the up to $50 million in potential acquisition-related contingent consideration. Due to slower than anticipated growth in the business supported by the Verikai technology, the fair value of this liability was reduced to zero in the third quarter of 2023. The $22 million gain from this change in fair value and a goodwill impairment charge of $26 million related to Verikai (see Note H — “Goodwill and Other Intangibles”) is included in realized gain (loss) on subsidiaries in AFG’s Statement of Earnings.
As discussed in Note A — “Accounting Policies — Managed Investment Entities,” AFG has set the carrying value of its CLO liabilities equal to the fair value of the CLO assets (which have more observable fair values) as an alternative to reporting those liabilities at separately measured fair values. As a result, the CLO liabilities are categorized within the fair value hierarchy on the same basis (proportionally) as the related CLO assets. Since the portion of the CLO liabilities allocated to Level 3 is derived from the fair value of the CLO assets, these amounts are excluded from the progression of Level 3 financial instruments.
AFG’s management is responsible for the valuation process and uses data from outside sources (including nationally recognized pricing services and broker/dealers) in establishing fair value. AFG’s internal investment professionals are a group of approximately 20 investment professionals whose primary responsibility is to manage AFG’s investment portfolio. These professionals monitor individual investments as well as overall industries and are active in the financial markets on a daily basis. The group is led by AFG’s chief investment officer, who reports directly to one of AFG’s Co-CEOs. Valuation techniques utilized by pricing services and prices obtained from external sources are reviewed by AFG’s internal investment professionals who are familiar with the securities being priced and the markets in which they trade to ensure the fair value determination is representative of an exit price. To validate the appropriateness of the prices obtained, these investment managers consider widely published indices (as benchmarks), recent trades, changes in interest rates, general economic conditions and the credit quality of the specific issuers. In addition, AFG communicates directly with the pricing services regarding the methods and assumptions used in pricing, including verifying, on a test basis, the inputs used by the service to value specific securities.
AMERICAN FINANCIAL GROUP, INC. AND SUBSIDIARIES
NOTES TO CONSOLIDATED FINANCIAL STATEMENTS — CONTINUED
Assets and liabilities measured and carried at fair value in the financial statements are summarized below (in millions):
|
|
|
|
|
|
|
|
|
|
|
|
|
|
|
|
|
|
|
|
|
|
|
|
|
Level 1 |
|
Level 2 |
|
Level 3 |
|
Total |
| December 31, 2024 |
|
|
|
|
|
|
|
| Assets: |
|
|
|
|
|
|
|
| Available for sale (“AFS”) fixed maturities: |
|
|
|
|
|
|
|
| U.S. Government and government agencies |
$ |
173 |
|
|
$ |
— |
|
|
$ |
— |
|
|
$ |
173 |
|
| States, municipalities and political subdivisions |
— |
|
|
858 |
|
|
1 |
|
|
859 |
|
| Foreign government |
— |
|
|
237 |
|
|
— |
|
|
237 |
|
| Residential MBS |
— |
|
|
1,988 |
|
|
1 |
|
|
1,989 |
|
| Commercial MBS |
— |
|
|
51 |
|
|
— |
|
|
51 |
|
| Collateralized loan obligations |
— |
|
|
1,237 |
|
|
— |
|
|
1,237 |
|
| Other asset-backed securities |
— |
|
|
2,060 |
|
|
296 |
|
|
2,356 |
|
| Corporate and other |
12 |
|
|
3,014 |
|
|
470 |
|
|
3,496 |
|
| Total AFS fixed maturities |
185 |
|
|
9,445 |
|
|
768 |
|
|
10,398 |
|
| Trading fixed maturities |
— |
|
|
50 |
|
|
26 |
|
|
76 |
|
| Equity securities |
419 |
|
|
40 |
|
|
292 |
|
|
751 |
|
| Assets of managed investment entities (“MIE”) |
419 |
|
|
3,711 |
|
|
10 |
|
|
4,140 |
|
Other assets — derivatives |
— |
|
|
1 |
|
|
— |
|
|
1 |
|
| Total assets accounted for at fair value |
$ |
1,023 |
|
|
$ |
13,247 |
|
|
$ |
1,096 |
|
|
$ |
15,366 |
|
| Liabilities: |
|
|
|
|
|
|
|
| Contingent consideration — acquisitions |
$ |
— |
|
|
$ |
— |
|
|
$ |
2 |
|
|
$ |
2 |
|
| Liabilities of managed investment entities |
402 |
|
|
3,553 |
|
|
10 |
|
|
3,965 |
|
| Other liabilities — derivatives |
— |
|
|
18 |
|
|
— |
|
|
18 |
|
| Total liabilities accounted for at fair value |
$ |
402 |
|
|
$ |
3,571 |
|
|
$ |
12 |
|
|
$ |
3,985 |
|
|
|
|
|
|
|
|
|
| December 31, 2023 |
|
|
|
|
|
|
|
| Assets: |
|
|
|
|
|
|
|
| Available for sale fixed maturities: |
|
|
|
|
|
|
|
| U.S. Government and government agencies |
$ |
235 |
|
|
$ |
1 |
|
|
$ |
— |
|
|
$ |
236 |
|
| States, municipalities and political subdivisions |
— |
|
|
982 |
|
|
2 |
|
|
984 |
|
| Foreign government |
— |
|
|
230 |
|
|
— |
|
|
230 |
|
| Residential MBS |
— |
|
|
1,656 |
|
|
2 |
|
|
1,658 |
|
| Commercial MBS |
— |
|
|
74 |
|
|
— |
|
|
74 |
|
| Collateralized loan obligations |
— |
|
|
1,686 |
|
|
1 |
|
|
1,687 |
|
| Other asset-backed securities |
— |
|
|
2,011 |
|
|
351 |
|
|
2,362 |
|
| Corporate and other |
9 |
|
|
2,757 |
|
|
380 |
|
|
3,146 |
|
| Total AFS fixed maturities |
244 |
|
|
9,397 |
|
|
736 |
|
|
10,377 |
|
| Trading fixed maturities |
— |
|
|
57 |
|
|
— |
|
|
57 |
|
| Equity securities |
500 |
|
|
33 |
|
|
485 |
|
|
1,018 |
|
| Assets of managed investment entities |
335 |
|
|
4,140 |
|
|
9 |
|
|
4,484 |
|
Other assets — derivatives |
— |
|
|
6 |
|
|
— |
|
|
6 |
|
| Total assets accounted for at fair value |
$ |
1,079 |
|
|
$ |
13,633 |
|
|
$ |
1,230 |
|
|
$ |
15,942 |
|
| Liabilities: |
|
|
|
|
|
|
|
| Contingent consideration — acquisitions |
$ |
— |
|
|
$ |
— |
|
|
$ |
2 |
|
|
$ |
2 |
|
| Liabilities of managed investment entities |
322 |
|
|
3,976 |
|
|
9 |
|
|
4,307 |
|
| Other liabilities — derivatives |
— |
|
|
22 |
|
|
— |
|
|
22 |
|
| Total liabilities accounted for at fair value |
$ |
322 |
|
|
$ |
3,998 |
|
|
$ |
11 |
|
|
$ |
4,331 |
|
Approximately 7% of the total assets carried at fair value at December 31, 2024, were Level 3 assets. Internally developed prices for fixed maturities are estimated using a variety of inputs, including appropriate credit spreads over the treasury yield (of a similar duration), trade information and prices of comparable securities and other security specific features (such as optional early redemption). Internally developed Level 3 asset fair values represent approximately $932 million (85%) of the total fair value of Level 3 assets at December 31, 2024. Approximately 69% ($647 million) of these internally developed Level 3 assets are priced using a pricing model that uses a discounted cash flow approach to estimate the fair value of fixed maturity securities.
AMERICAN FINANCIAL GROUP, INC. AND SUBSIDIARIES
NOTES TO CONSOLIDATED FINANCIAL STATEMENTS — CONTINUED
The credit spread applied by management is the significant unobservable input of the pricing model. In instances where the security is currently callable at par value and the pricing model suggests a higher price, management caps the fair value at par value. The remainder of the internally developed Level 3 investments ($285 million) are priced using internal models or inputs from third parties that are not market observable. Management believes that any justifiable changes in unobservable inputs used to determine internally developed fair values would not have resulted in a material change in AFG’s financial position.
Approximately 11% ($118 million) of the Level 3 assets were investments whose prices were determined based on financial information provided by third party asset managers. Approximately 4% ($46 million) of Level 3 assets were priced using non-binding broker quotes or pricing services, for which there is a lack of transparency as to the inputs used to determine fair value.
Changes in balances of Level 3 financial assets and liabilities carried at fair value during 2024, 2023 and 2022 are presented below (in millions). The transfers into and out of Level 3 were generally due to changes in the availability of market observable inputs. All transfers are reflected in the table at fair value as of the end of the reporting period.
|
|
|
|
|
|
|
|
|
|
|
|
|
|
|
|
|
|
|
|
|
|
|
|
|
|
|
|
|
|
|
|
|
|
|
|
|
|
|
|
|
|
|
|
|
|
|
|
|
|
|
Total realized/unrealized
gains (losses) included in |
|
|
|
|
|
|
|
|
|
|
| Balance at December 31, 2023 |
|
Net
earnings (loss) |
|
Other comprehensive income (loss) |
|
Purchases
and
issuances |
|
Sales and
settlements |
|
Transfer
into
Level 3 |
|
Transfer
out of
Level 3 |
|
Balance at December 31, 2024 |
| AFS fixed maturities: |
|
|
|
|
|
|
|
|
|
|
|
|
|
|
|
U.S. government agency |
$ |
— |
|
|
$ |
— |
|
|
$ |
— |
|
|
$ |
— |
|
|
$ |
— |
|
|
$ |
— |
|
|
$ |
— |
|
|
$ |
— |
|
| State and municipal |
2 |
|
|
— |
|
|
— |
|
|
— |
|
|
(1) |
|
|
— |
|
|
— |
|
|
1 |
|
| Residential MBS |
2 |
|
|
— |
|
|
— |
|
|
— |
|
|
— |
|
|
— |
|
|
(1) |
|
|
1 |
|
| Commercial MBS |
— |
|
|
— |
|
|
— |
|
|
— |
|
|
— |
|
|
— |
|
|
— |
|
|
— |
|
Collateralized loan obligations |
1 |
|
|
(1) |
|
|
— |
|
|
— |
|
|
— |
|
|
— |
|
|
— |
|
|
— |
|
Other asset-backed securities |
351 |
|
|
(1) |
|
|
8 |
|
|
59 |
|
|
(100) |
|
|
5 |
|
|
(26) |
|
|
296 |
|
| Corporate and other |
380 |
|
|
16 |
|
|
6 |
|
|
105 |
|
|
(31) |
|
|
4 |
|
|
(10) |
|
|
470 |
|
Total AFS fixed maturities |
736 |
|
|
14 |
|
|
14 |
|
|
164 |
|
|
(132) |
|
|
9 |
|
|
(37) |
|
|
768 |
|
Trading fixed maturities |
— |
|
|
2 |
|
|
— |
|
|
24 |
|
|
— |
|
|
— |
|
|
— |
|
|
26 |
|
Equity securities (*) |
485 |
|
|
60 |
|
|
— |
|
|
174 |
|
|
(57) |
|
|
— |
|
|
(370) |
|
|
292 |
|
| Assets of MIE |
9 |
|
|
— |
|
|
(5) |
|
|
6 |
|
|
— |
|
|
— |
|
|
— |
|
|
10 |
|
Total Level 3 assets |
$ |
1,230 |
|
|
$ |
76 |
|
|
$ |
9 |
|
|
$ |
368 |
|
|
$ |
(189) |
|
|
$ |
9 |
|
|
$ |
(407) |
|
|
$ |
1,096 |
|
|
|
|
|
|
|
|
|
|
|
|
|
|
|
|
|
| Contingent consideration — acquisitions |
$ |
(2) |
|
|
$ |
(1) |
|
|
$ |
— |
|
|
$ |
(1) |
|
|
$ |
2 |
|
|
$ |
— |
|
|
$ |
— |
|
|
$ |
(2) |
|
| Total Level 3 liabilities |
$ |
(2) |
|
|
$ |
(1) |
|
|
$ |
— |
|
|
$ |
(1) |
|
|
$ |
2 |
|
|
$ |
— |
|
|
$ |
— |
|
|
$ |
(2) |
|
(*)Transfers out primarily relate to investments now accounted for using the equity method.
AMERICAN FINANCIAL GROUP, INC. AND SUBSIDIARIES
NOTES TO CONSOLIDATED FINANCIAL STATEMENTS — CONTINUED
|
|
|
|
|
|
|
|
|
|
|
|
|
|
|
|
|
|
|
|
|
|
|
|
|
|
|
|
|
|
|
|
|
|
|
|
|
|
|
|
|
|
|
|
|
|
|
|
|
|
|
Total realized/unrealized
gains (losses) included in |
|
|
|
|
|
|
|
|
|
|
| Balance at December 31, 2022 |
|
Net
earnings (loss) |
|
Other comprehensive income (loss) |
|
Purchases
and
issuances |
|
Sales and
settlements |
|
Transfer
into
Level 3 |
|
Transfer
out of
Level 3 |
|
Balance at December 31, 2023 |
| AFS fixed maturities: |
|
|
|
|
|
|
|
|
|
|
|
|
|
|
|
U.S. government agency |
$ |
— |
|
|
$ |
— |
|
|
$ |
— |
|
|
$ |
— |
|
|
$ |
— |
|
|
$ |
— |
|
|
$ |
— |
|
|
$ |
— |
|
| State and municipal |
5 |
|
|
— |
|
|
— |
|
|
— |
|
|
(1) |
|
|
1 |
|
|
(3) |
|
|
2 |
|
| Residential MBS |
9 |
|
|
1 |
|
|
(1) |
|
|
— |
|
|
(3) |
|
|
5 |
|
|
(9) |
|
|
2 |
|
| Commercial MBS |
— |
|
|
— |
|
|
— |
|
|
— |
|
|
— |
|
|
— |
|
|
— |
|
|
— |
|
Collateralized loan obligations |
2 |
|
|
(2) |
|
|
1 |
|
|
— |
|
|
— |
|
|
1 |
|
|
(1) |
|
|
1 |
|
Other asset-backed securities |
329 |
|
|
1 |
|
|
6 |
|
|
55 |
|
|
(39) |
|
|
31 |
|
|
(32) |
|
|
351 |
|
| Corporate and other |
319 |
|
|
(4) |
|
|
5 |
|
|
92 |
|
|
(27) |
|
|
8 |
|
|
(13) |
|
|
380 |
|
Total AFS fixed maturities |
664 |
|
|
(4) |
|
|
11 |
|
|
147 |
|
|
(70) |
|
|
46 |
|
|
(58) |
|
|
736 |
|
| Equity securities |
427 |
|
|
15 |
|
|
— |
|
|
121 |
|
|
(39) |
|
|
— |
|
|
(39) |
|
|
485 |
|
| Assets of MIE |
11 |
|
|
(4) |
|
|
— |
|
|
2 |
|
|
— |
|
|
— |
|
|
— |
|
|
9 |
|
Total Level 3 assets |
$ |
1,102 |
|
|
$ |
7 |
|
|
$ |
11 |
|
|
$ |
270 |
|
|
$ |
(109) |
|
|
$ |
46 |
|
|
$ |
(97) |
|
|
$ |
1,230 |
|
|
|
|
|
|
|
|
|
|
|
|
|
|
|
|
|
| Contingent consideration — acquisitions |
$ |
(25) |
|
|
$ |
23 |
|
|
$ |
— |
|
|
$ |
— |
|
|
$ |
— |
|
|
$ |
— |
|
|
$ |
— |
|
|
$ |
(2) |
|
| Total Level 3 liabilities |
$ |
(25) |
|
|
$ |
23 |
|
|
$ |
— |
|
|
$ |
— |
|
|
$ |
— |
|
|
$ |
— |
|
|
$ |
— |
|
|
$ |
(2) |
|
|
|
|
|
|
|
|
|
|
|
|
|
|
|
|
|
|
|
|
|
|
|
|
|
|
|
|
|
|
|
|
|
|
|
|
|
|
|
|
|
|
|
|
|
|
|
|
|
|
|
|
Total realized/unrealized
gains (losses) included in |
|
|
|
|
|
|
|
|
|
|
| Balance at December 31, 2021 |
|
Net
earnings (loss) |
|
Other comprehensive income (loss) |
|
Purchases
and
issuances |
|
Sales and
settlements |
|
Transfer
into
Level 3 |
|
Transfer
out of
Level 3 |
|
Balance at December 31, 2022 |
| AFS fixed maturities: |
|
|
|
|
|
|
|
|
|
|
|
|
|
|
|
U.S. government agency |
$ |
— |
|
|
$ |
— |
|
|
$ |
— |
|
|
$ |
— |
|
|
$ |
— |
|
|
$ |
— |
|
|
$ |
— |
|
|
$ |
— |
|
| State and municipal |
41 |
|
|
— |
|
|
(3) |
|
|
— |
|
|
(1) |
|
|
4 |
|
|
(36) |
|
|
5 |
|
| Residential MBS |
14 |
|
|
— |
|
|
(1) |
|
|
— |
|
|
(1) |
|
|
7 |
|
|
(10) |
|
|
9 |
|
| Commercial MBS |
— |
|
|
— |
|
|
— |
|
|
— |
|
|
— |
|
|
— |
|
|
— |
|
|
— |
|
Collateralized loan obligations |
— |
|
|
— |
|
|
— |
|
|
— |
|
|
— |
|
|
2 |
|
|
— |
|
|
2 |
|
Other asset-backed securities |
278 |
|
|
1 |
|
|
(27) |
|
|
94 |
|
|
(52) |
|
|
35 |
|
|
— |
|
|
329 |
|
| Corporate and other |
267 |
|
|
(1) |
|
|
(22) |
|
|
129 |
|
|
(39) |
|
|
20 |
|
|
(35) |
|
|
319 |
|
Total AFS fixed maturities |
600 |
|
|
— |
|
|
(53) |
|
|
223 |
|
|
(93) |
|
|
68 |
|
|
(81) |
|
|
664 |
|
| Equity securities |
313 |
|
|
29 |
|
|
— |
|
|
112 |
|
|
(24) |
|
|
4 |
|
|
(7) |
|
|
427 |
|
| Assets of MIE |
13 |
|
|
(5) |
|
|
— |
|
|
3 |
|
|
— |
|
|
— |
|
|
— |
|
|
11 |
|
Total Level 3 assets |
$ |
926 |
|
|
$ |
24 |
|
|
$ |
(53) |
|
|
$ |
338 |
|
|
$ |
(117) |
|
|
$ |
72 |
|
|
$ |
(88) |
|
|
$ |
1,102 |
|
|
|
|
|
|
|
|
|
|
|
|
|
|
|
|
|
| Contingent consideration — acquisitions |
$ |
(23) |
|
|
$ |
— |
|
|
$ |
— |
|
|
$ |
(2) |
|
|
$ |
— |
|
|
$ |
— |
|
|
$ |
— |
|
|
$ |
(25) |
|
| Total Level 3 liabilities |
$ |
(23) |
|
|
$ |
— |
|
|
$ |
— |
|
|
$ |
(2) |
|
|
$ |
— |
|
|
$ |
— |
|
|
$ |
— |
|
|
$ |
(25) |
|
AMERICAN FINANCIAL GROUP, INC. AND SUBSIDIARIES
NOTES TO CONSOLIDATED FINANCIAL STATEMENTS — CONTINUED
Fair Value of Financial Instruments The carrying value and fair value of financial instruments that are not carried at fair value in the financial statements at December 31 are summarized below (in millions):
|
|
|
|
|
|
|
|
|
|
|
|
|
|
|
|
|
|
|
|
|
|
|
|
|
|
|
|
|
|
|
Carrying |
|
Fair Value |
|
Value |
|
Total |
|
Level 1 |
|
Level 2 |
|
Level 3 |
| 2024 |
|
|
|
|
|
|
|
|
|
| Financial assets: |
|
|
|
|
|
|
|
|
|
| Cash and cash equivalents |
$ |
1,406 |
|
|
$ |
1,406 |
|
|
$ |
1,406 |
|
|
$ |
— |
|
|
$ |
— |
|
| Mortgage loans |
791 |
|
|
754 |
|
|
— |
|
|
— |
|
|
754 |
|
Total financial assets not accounted for at fair value |
$ |
2,197 |
|
|
$ |
2,160 |
|
|
$ |
1,406 |
|
|
$ |
— |
|
|
$ |
754 |
|
|
|
|
|
|
|
|
|
|
|
| Long-term debt |
$ |
1,475 |
|
|
$ |
1,276 |
|
|
$ |
— |
|
|
$ |
1,273 |
|
|
$ |
3 |
|
Total financial liabilities not accounted for at fair value |
$ |
1,475 |
|
|
$ |
1,276 |
|
|
$ |
— |
|
|
$ |
1,273 |
|
|
$ |
3 |
|
|
|
|
|
|
|
|
|
|
|
| 2023 |
|
|
|
|
|
|
|
|
|
| Financial assets: |
|
|
|
|
|
|
|
|
|
| Cash and cash equivalents |
$ |
1,225 |
|
|
$ |
1,225 |
|
|
$ |
1,225 |
|
|
$ |
— |
|
|
$ |
— |
|
| Mortgage loans |
643 |
|
|
596 |
|
|
— |
|
|
— |
|
|
596 |
|
Total financial assets not accounted for at fair value |
$ |
1,868 |
|
|
$ |
1,821 |
|
|
$ |
1,225 |
|
|
$ |
— |
|
|
$ |
596 |
|
|
|
|
|
|
|
|
|
|
|
| Long-term debt |
$ |
1,475 |
|
|
$ |
1,345 |
|
|
$ |
— |
|
|
$ |
1,342 |
|
|
$ |
3 |
|
Total financial liabilities not accounted for at fair value |
$ |
1,475 |
|
|
$ |
1,345 |
|
|
$ |
— |
|
|
$ |
1,342 |
|
|
$ |
3 |
|
E. Investments
Available for sale fixed maturities at December 31 consisted of the following (in millions):
|
|
|
|
|
|
|
|
|
|
|
|
|
|
|
|
|
|
|
|
|
|
|
|
|
|
|
|
|
|
|
|
|
|
|
|
|
Amortized
Cost |
|
Allowance for Expected Credit Losses |
|
Gross Unrealized |
|
Net
Unrealized |
|
Fair
Value |
|
Gains |
|
Losses |
|
|
| December 31, 2024 |
|
|
|
|
|
|
|
|
|
|
|
| Fixed maturities: |
|
|
|
|
|
|
|
|
|
|
|
| U.S. Government and government agencies |
$ |
176 |
|
|
$ |
— |
|
|
$ |
— |
|
|
$ |
(3) |
|
|
$ |
(3) |
|
|
$ |
173 |
|
| States, municipalities and political subdivisions |
905 |
|
|
— |
|
|
3 |
|
|
(49) |
|
|
(46) |
|
|
859 |
|
| Foreign government |
236 |
|
|
— |
|
|
2 |
|
|
(1) |
|
|
1 |
|
|
237 |
|
| Residential MBS |
2,122 |
|
|
1 |
|
|
22 |
|
|
(154) |
|
|
(132) |
|
|
1,989 |
|
| Commercial MBS |
51 |
|
|
— |
|
|
— |
|
|
— |
|
|
— |
|
|
51 |
|
| Collateralized loan obligations |
1,243 |
|
|
4 |
|
|
10 |
|
|
(12) |
|
|
(2) |
|
|
1,237 |
|
| Other asset-backed securities |
2,412 |
|
|
6 |
|
|
19 |
|
|
(69) |
|
|
(50) |
|
|
2,356 |
|
| Corporate and other |
3,542 |
|
|
23 |
|
|
42 |
|
|
(65) |
|
|
(23) |
|
|
3,496 |
|
| Total fixed maturities |
$ |
10,687 |
|
|
$ |
34 |
|
|
$ |
98 |
|
|
$ |
(353) |
|
|
$ |
(255) |
|
|
$ |
10,398 |
|
|
|
|
|
|
|
|
|
|
|
|
|
| December 31, 2023 |
|
|
|
|
|
|
|
|
|
|
|
| Fixed maturities: |
|
|
|
|
|
|
|
|
|
|
|
| U.S. Government and government agencies |
$ |
243 |
|
|
$ |
— |
|
|
$ |
1 |
|
|
$ |
(8) |
|
|
$ |
(7) |
|
|
$ |
236 |
|
| States, municipalities and political subdivisions |
1,014 |
|
|
— |
|
|
8 |
|
|
(38) |
|
|
(30) |
|
|
984 |
|
| Foreign government |
236 |
|
|
— |
|
|
1 |
|
|
(7) |
|
|
(6) |
|
|
230 |
|
| Residential MBS |
1,788 |
|
|
1 |
|
|
26 |
|
|
(155) |
|
|
(129) |
|
|
1,658 |
|
| Commercial MBS |
75 |
|
|
— |
|
|
— |
|
|
(1) |
|
|
(1) |
|
|
74 |
|
| Collateralized loan obligations |
1,709 |
|
|
3 |
|
|
9 |
|
|
(28) |
|
|
(19) |
|
|
1,687 |
|
| Other asset-backed securities |
2,477 |
|
|
5 |
|
|
10 |
|
|
(120) |
|
|
(110) |
|
|
2,362 |
|
| Corporate and other |
3,210 |
|
|
3 |
|
|
52 |
|
|
(113) |
|
|
(61) |
|
|
3,146 |
|
| Total fixed maturities |
$ |
10,752 |
|
|
$ |
12 |
|
|
$ |
107 |
|
|
$ |
(470) |
|
|
$ |
(363) |
|
|
$ |
10,377 |
|
AMERICAN FINANCIAL GROUP, INC. AND SUBSIDIARIES
NOTES TO CONSOLIDATED FINANCIAL STATEMENTS — CONTINUED
Equity securities which are reported at fair value with holding gains and losses recognized in net earnings, consisted of the following at December 31 (in millions):
|
|
|
|
|
|
|
|
|
|
|
|
|
|
|
|
|
|
|
|
|
|
|
|
|
|
|
|
|
|
|
|
|
|
|
|
|
2024 |
|
2023 |
|
Actual Cost |
|
Fair Value |
|
Fair Value Over Cost |
|
Actual Cost |
|
Fair Value |
|
Fair Value Over Cost |
| Common stocks |
$ |
304 |
|
|
$ |
336 |
|
|
$ |
32 |
|
|
$ |
512 |
|
|
$ |
586 |
|
|
$ |
74 |
|
| Perpetual preferred stocks |
380 |
|
|
415 |
|
|
35 |
|
|
422 |
|
|
432 |
|
|
10 |
|
Total equity securities carried at fair value |
$ |
684 |
|
|
$ |
751 |
|
|
$ |
67 |
|
|
$ |
934 |
|
|
$ |
1,018 |
|
|
$ |
84 |
|
The following table summarizes investments accounted for using the equity method, by strategy (in millions):
|
|
|
|
|
|
|
|
|
|
|
|
|
|
|
|
|
|
|
|
|
|
|
|
|
|
|
|
|
|
|
Carrying Value |
|
Net Investment Income |
|
December 31, 2024 |
|
December 31, 2023 |
|
2024 |
|
2023 |
|
2022 |
| Real estate-related investments (*) |
$ |
1,392 |
|
|
$ |
1,320 |
|
|
$ |
8 |
|
|
$ |
85 |
|
|
$ |
233 |
|
| Private equity |
804 |
|
|
457 |
|
|
32 |
|
|
9 |
|
|
32 |
|
| Private debt |
81 |
|
|
37 |
|
|
6 |
|
|
5 |
|
|
2 |
|
| Total investments accounted for using the equity method |
$ |
2,277 |
|
|
$ |
1,814 |
|
|
$ |
46 |
|
|
$ |
99 |
|
|
$ |
267 |
|
(*)88% and 92% of the carrying value relates to underlying investments in multi-family properties as of December 31, 2024 and December 31, 2023, respectively.
The earnings (losses) from these investments are generally reported on a quarter lag due to the timing required to obtain the necessary information from the funds. AFG regularly reviews and discusses fund performance with the fund managers to corroborate the reasonableness of the underlying reported asset values and to assess whether any events have occurred within the lag period that may materially affect the valuation of these investments.
With respect to partnerships and similar investments, AFG had unfunded commitments of $457 million and $418 million as of December 31, 2024 and December 31, 2023, respectively.
AMERICAN FINANCIAL GROUP, INC. AND SUBSIDIARIES
NOTES TO CONSOLIDATED FINANCIAL STATEMENTS — CONTINUED
The following table shows gross unrealized losses (dollars in millions) on available for sale fixed maturities by investment category and length of time that individual securities have been in a continuous unrealized loss position at the following balance sheet dates.
|
|
|
|
|
|
|
|
|
|
|
|
|
|
|
|
|
|
|
|
|
|
|
|
|
|
|
|
|
|
|
|
|
|
|
|
|
Less Than Twelve Months |
|
Twelve Months or More |
Unrealized
Loss |
|
Fair
Value |
|
Fair Value as
% of Cost |
|
Unrealized
Loss |
|
Fair
Value |
|
Fair Value as
% of Cost |
|
| December 31, 2024 |
|
|
|
|
|
|
|
|
|
|
|
| Fixed maturities: |
|
|
|
|
|
|
|
|
|
|
|
U.S. Government and government agencies |
$ |
— |
|
|
$ |
35 |
|
|
100 |
% |
|
$ |
(3) |
|
|
$ |
105 |
|
|
97 |
% |
States, municipalities and political subdivisions |
(5) |
|
|
256 |
|
|
98 |
% |
|
(44) |
|
|
470 |
|
|
91 |
% |
| Foreign government |
— |
|
|
98 |
|
|
100 |
% |
|
(1) |
|
|
50 |
|
|
98 |
% |
| Residential MBS |
(6) |
|
|
452 |
|
|
99 |
% |
|
(148) |
|
|
916 |
|
|
86 |
% |
| Commercial MBS |
— |
|
|
14 |
|
|
100 |
% |
|
— |
|
|
16 |
|
|
100 |
% |
| Collateralized loan obligations |
— |
|
|
— |
|
|
— |
% |
|
(12) |
|
|
247 |
|
|
95 |
% |
| Other asset-backed securities |
(4) |
|
|
318 |
|
|
99 |
% |
|
(65) |
|
|
1,201 |
|
|
95 |
% |
| Corporate and other |
(10) |
|
|
605 |
|
|
98 |
% |
|
(55) |
|
|
1,151 |
|
|
95 |
% |
| Total fixed maturities |
$ |
(25) |
|
|
$ |
1,778 |
|
|
99 |
% |
|
$ |
(328) |
|
|
$ |
4,156 |
|
|
93 |
% |
|
|
|
|
|
|
|
|
|
|
|
|
| December 31, 2023 |
|
|
|
|
|
|
|
|
|
|
|
| Fixed maturities: |
|
|
|
|
|
|
|
|
|
|
|
U.S. Government and government agencies |
$ |
— |
|
|
$ |
11 |
|
|
100 |
% |
|
$ |
(8) |
|
|
$ |
191 |
|
|
96 |
% |
States, municipalities and political subdivisions |
(1) |
|
|
76 |
|
|
99 |
% |
|
(37) |
|
|
526 |
|
|
93 |
% |
| Foreign government |
— |
|
|
— |
|
|
— |
% |
|
(7) |
|
|
207 |
|
|
97 |
% |
| Residential MBS |
(1) |
|
|
42 |
|
|
98 |
% |
|
(154) |
|
|
1,089 |
|
|
88 |
% |
| Commercial MBS |
— |
|
|
— |
|
|
— |
% |
|
(1) |
|
|
61 |
|
|
98 |
% |
| Collateralized loan obligations |
— |
|
|
25 |
|
|
100 |
% |
|
(28) |
|
|
807 |
|
|
97 |
% |
| Other asset-backed securities |
(1) |
|
|
151 |
|
|
99 |
% |
|
(119) |
|
|
1,663 |
|
|
93 |
% |
| Corporate and other |
(4) |
|
|
123 |
|
|
97 |
% |
|
(109) |
|
|
1,455 |
|
|
93 |
% |
| Total fixed maturities |
$ |
(7) |
|
|
$ |
428 |
|
|
98 |
% |
|
$ |
(463) |
|
|
$ |
5,999 |
|
|
93 |
% |
At December 31, 2024, the gross unrealized losses on fixed maturities of $353 million relate to approximately 1,350 securities. Investment grade securities (as determined by nationally recognized rating agencies) represented approximately 96% of the gross unrealized loss and 97% of the fair value of securities with unrealized losses.
To evaluate fixed maturities for expected credit losses (impairment), management considers whether the unrealized loss is credit-driven or a result of changes in market interest rates, the extent to which fair value is less than cost basis, historical operating, balance sheet and cash flow data from the issuer, third party research, communications with industry specialists and discussions with issuer management.
AFG analyzes its MBS for expected credit losses (impairment) each quarter based upon expected future cash flows. Management estimates expected future cash flows based upon its knowledge of the MBS market, cash flow projections (which reflect loan to collateral values, subordination, vintage and geographic concentration) received from independent sources, implied cash flows inherent in security ratings and analysis of historical payment data.
Management believes AFG will recover its cost basis (net of any allowance) in the securities with unrealized losses and that AFG has the ability to hold the securities until they recover in value and had no intent to sell them at December 31, 2024.
AMERICAN FINANCIAL GROUP, INC. AND SUBSIDIARIES
NOTES TO CONSOLIDATED FINANCIAL STATEMENTS — CONTINUED
A progression of the allowance for expected credit losses on available for sale fixed maturity securities is shown below (in millions):
|
|
|
|
|
|
|
|
|
|
|
|
|
|
|
|
|
|
|
Structured securities (*) |
|
Corporate and other |
|
Total |
| Balance at December 31, 2021 |
$ |
8 |
|
|
$ |
1 |
|
|
$ |
9 |
|
|
|
|
|
|
|
| Provision for expected credit losses on securities with no previous allowance |
4 |
|
|
1 |
|
|
5 |
|
| Reductions to previously recognized expected credit losses |
(2) |
|
|
— |
|
|
(2) |
|
| Reductions due to sales or redemptions |
— |
|
|
(1) |
|
|
(1) |
|
| Balance at December 31, 2022 |
10 |
|
|
1 |
|
|
11 |
|
|
|
|
|
|
|
| Provision for expected credit losses on securities with no previous allowance |
1 |
|
|
8 |
|
|
9 |
|
Additions (reductions) to previously recognized expected credit losses |
2 |
|
|
(1) |
|
|
1 |
|
| Reductions due to sales or redemptions |
(4) |
|
|
(5) |
|
|
(9) |
|
| Balance at December 31, 2023 |
9 |
|
|
3 |
|
|
12 |
|
|
|
|
|
|
|
| Provision for expected credit losses on securities with no previous allowance |
1 |
|
|
25 |
|
|
26 |
|
Additions to previously recognized expected credit losses |
1 |
|
|
— |
|
|
1 |
|
| Reductions due to sales or redemptions |
— |
|
|
(5) |
|
|
(5) |
|
| Balance at December 31, 2024 |
$ |
11 |
|
|
$ |
23 |
|
|
$ |
34 |
|
(*)Includes MBS, collateralized loan obligations and other asset-backed securities (“ABS”).
In 2024, 2023 and 2022, AFG did not purchase any securities with expected credit losses.
The table below sets forth the scheduled maturities of AFG’s available for sale fixed maturities as of December 31, 2024 (dollars in millions). Securities with sinking funds are reported at average maturity. Actual maturities may differ from contractual maturities because certain securities may be called or prepaid by the issuers.
|
|
|
|
|
|
|
|
|
|
|
|
|
|
|
|
|
|
|
Amortized Cost, net (*) |
|
Fair Value |
|
Amount |
|
% |
| Maturity |
|
|
|
|
|
| One year or less |
$ |
552 |
|
|
$ |
540 |
|
|
5 |
% |
| After one year through five years |
2,738 |
|
|
2,704 |
|
|
26 |
% |
| After five years through ten years |
1,296 |
|
|
1,286 |
|
|
12 |
% |
| After ten years |
250 |
|
|
235 |
|
|
2 |
% |
|
4,836 |
|
|
4,765 |
|
|
45 |
% |
Collateralized loan obligations and other ABS (average life of approximately 3 years) |
3,645 |
|
|
3,593 |
|
|
35 |
% |
MBS (average life of approximately 6 years) |
2,172 |
|
|
2,040 |
|
|
20 |
% |
| Total |
$ |
10,653 |
|
|
$ |
10,398 |
|
|
100 |
% |
(*)Amortized cost, net of allowance for expected credit losses.
Certain risks are inherent in fixed maturity securities, including loss upon default, price volatility in reaction to changes in interest rates, and general market factors and risks associated with reinvestment of proceeds due to prepayments or redemptions in a period of declining interest rates.
There were no investments in individual issuers that exceeded 10% of shareholders’ equity at December 31, 2024 or 2023.
AMERICAN FINANCIAL GROUP, INC. AND SUBSIDIARIES
NOTES TO CONSOLIDATED FINANCIAL STATEMENTS — CONTINUED
Net Investment Income The following table shows (in millions) investment income earned and investment expenses incurred.
|
|
|
|
|
|
|
|
|
|
|
|
|
|
|
|
|
|
|
2024 |
|
2023 |
|
2022 |
| Investment income: |
|
|
|
|
|
Fixed maturities: |
|
|
|
|
|
Interest and amortization |
$ |
544 |
|
|
$ |
502 |
|
|
$ |
376 |
|
Change in fair value (*) |
17 |
|
|
(3) |
|
|
— |
|
| Equity securities: |
|
|
|
|
|
Dividends |
29 |
|
|
34 |
|
|
39 |
|
Change in fair value |
57 |
|
|
36 |
|
|
(2) |
|
Equity in earnings of partnerships and similar investments |
46 |
|
|
99 |
|
|
267 |
|
Cash and cash equivalents |
56 |
|
|
43 |
|
|
11 |
|
| Other |
53 |
|
|
47 |
|
|
42 |
|
| Gross investment income |
802 |
|
|
758 |
|
|
733 |
|
| Investment expenses |
(22) |
|
|
(16) |
|
|
(16) |
|
Net investment income |
$ |
780 |
|
|
$ |
742 |
|
|
$ |
717 |
|
(*)The change in the fair value of fixed maturities classified as trading and derivatives embedded in convertible fixed maturities related to limited partnerships and similar investments.
Realized gains (losses) and changes in unrealized appreciation (depreciation) included in AOCI related to fixed maturity securities are summarized as follows (in millions):
|
|
|
|
|
|
|
|
|
|
|
|
|
|
|
|
|
|
|
|
|
|
|
|
|
|
|
|
|
|
|
|
|
|
|
|
|
|
|
|
|
|
|
|
|
|
|
|
|
2024 |
|
2023 |
|
Realized gains (losses) |
|
|
|
Realized gains (losses) |
|
|
|
Before Impairments |
|
Impairment Allowance |
|
Total |
|
Change in Unrealized |
|
Before Impairments |
|
Impairment Allowance |
|
Total |
|
Change in Unrealized |
| Fixed maturities |
$ |
(5) |
|
|
$ |
(27) |
|
|
$ |
(32) |
|
|
$ |
108 |
|
|
$ |
(35) |
|
|
$ |
(10) |
|
|
$ |
(45) |
|
|
$ |
267 |
|
| Equity securities |
32 |
|
|
— |
|
|
32 |
|
|
— |
|
|
10 |
|
|
— |
|
|
10 |
|
|
— |
|
| Mortgage loans and other investments |
— |
|
|
— |
|
|
— |
|
|
— |
|
|
— |
|
|
(1) |
|
|
(1) |
|
|
— |
|
| Total pretax |
27 |
|
|
(27) |
|
|
— |
|
|
108 |
|
|
(25) |
|
|
(11) |
|
|
(36) |
|
|
267 |
|
| Tax effects |
(6) |
|
|
6 |
|
|
— |
|
|
(23) |
|
|
5 |
|
|
3 |
|
|
8 |
|
|
(57) |
|
| Net of tax |
$ |
21 |
|
|
$ |
(21) |
|
|
$ |
— |
|
|
$ |
85 |
|
|
$ |
(20) |
|
|
$ |
(8) |
|
|
$ |
(28) |
|
|
$ |
210 |
|
|
|
|
|
|
|
|
|
|
|
|
|
|
|
|
|
|
|
|
|
|
|
|
|
|
|
|
|
|
|
|
|
|
|
|
|
|
|
|
|
|
|
|
|
|
|
|
|
|
|
|
2022 |
|
|
|
|
|
Realized gains (losses) |
|
|
|
|
|
|
|
|
|
|
|
Before Impairments |
|
Impairment Allowance |
|
Total |
|
Change in Unrealized |
| Fixed maturities |
|
|
|
|
|
|
|
|
$ |
(27) |
|
|
$ |
(3) |
|
|
$ |
(30) |
|
|
$ |
(803) |
|
| Equity securities |
|
|
|
|
|
|
|
|
(96) |
|
|
— |
|
|
(96) |
|
|
— |
|
| Mortgage loans and other investments |
|
|
|
|
|
|
|
|
10 |
|
|
— |
|
|
10 |
|
|
— |
|
| Total pretax |
|
|
|
|
|
|
|
|
(113) |
|
|
(3) |
|
|
(116) |
|
|
(803) |
|
| Tax effects |
|
|
|
|
|
|
|
|
23 |
|
|
1 |
|
|
24 |
|
|
170 |
|
| Net of tax |
|
|
|
|
|
|
|
|
$ |
(90) |
|
|
$ |
(2) |
|
|
$ |
(92) |
|
|
$ |
(633) |
|
All equity securities are carried at fair value through net earnings. AFG recorded net holding gains (losses) on equity securities during 2024, 2023 and 2022 on securities that were still owned at December 31 of each year presented as follows (in millions):
|
|
|
|
|
|
|
|
|
|
|
|
|
|
|
|
|
|
|
2024 |
|
2023 |
|
2022 |
| Included in realized gains (losses) |
$ |
24 |
|
|
$ |
(2) |
|
|
$ |
(95) |
|
| Included in net investment income |
56 |
|
|
36 |
|
|
5 |
|
|
$ |
80 |
|
|
$ |
34 |
|
|
$ |
(90) |
|
AMERICAN FINANCIAL GROUP, INC. AND SUBSIDIARIES
NOTES TO CONSOLIDATED FINANCIAL STATEMENTS — CONTINUED
Gross realized gains and losses (excluding changes in impairment allowance and mark-to-market of derivatives) on available for sale fixed maturity investment transactions consisted of the following (in millions):
|
|
|
|
|
|
|
|
|
|
|
|
|
|
|
|
|
|
|
2024 |
|
2023 |
|
2022 |
| Gross gains |
$ |
1 |
|
|
$ |
5 |
|
|
$ |
3 |
|
| Gross losses |
(5) |
|
|
(38) |
|
|
(18) |
|
F. Derivatives
As discussed under “Derivatives” in Note A — “Accounting Policies,” AFG uses derivatives to mitigate certain market risks related to its investment portfolio and deferred compensation obligations to employees.
The following table presents the classification of derivative assets and liabilities included in AFG’s Balance Sheet at fair value (in millions):
|
|
|
|
|
|
|
|
|
|
|
|
|
|
|
|
|
|
|
|
|
|
|
|
|
|
|
|
|
|
|
|
|
December 31, 2024 |
|
December 31, 2023 |
|
Balance Sheet Line |
|
Asset |
|
Liability |
|
Asset |
|
Liability |
| Derivatives designated and qualifying as cash flow hedges: |
|
|
|
|
|
|
|
|
| Interest rate swaps |
Other assets/Other liabilities |
|
$ |
1 |
|
|
$ |
14 |
|
|
$ |
1 |
|
|
$ |
22 |
|
|
|
|
|
|
|
|
|
|
|
| Derivatives not designated as hedging instruments: |
|
|
|
|
|
|
|
|
Fixed maturities with embedded derivatives |
Fixed maturities |
|
81 |
|
|
— |
|
|
81 |
|
|
— |
|
Total return swap |
Other assets/Other liabilities |
|
— |
|
|
4 |
|
|
5 |
|
|
— |
|
|
|
|
$ |
82 |
|
|
$ |
18 |
|
|
$ |
87 |
|
|
$ |
22 |
|
AFG’s interest rate swaps are designated and qualify as highly effective cash flow hedges to mitigate interest rate risk related to certain floating-rate securities included in AFG’s portfolio of fixed maturity securities. The purpose of each of these swaps is to effectively convert a portion of AFG’s floating-rate fixed maturity securities to fixed rates by offsetting the variability in cash flows attributable to changes in the applicable Secured Overnight Financing Rate (“SOFR”).
Under the terms of the swaps, AFG receives fixed-rate interest payments in exchange for variable interest payments based on SOFR. The notional amounts of the interest rate swaps generally decline over each swap’s respective life (the swaps expire between January 2025 and October 2029) in anticipation of the expected decline in AFG’s portfolio of fixed maturity securities with floating interest rates based on SOFR. The total outstanding notional amount of AFG’s interest rate swaps was $1.05 billion at December 31, 2024 compared to $1.30 billion at December 31, 2023, reflecting scheduled amortization, partially offset by one new swap in 2024 ($20 million notional amount at issuance). Amounts reclassified from AOCI to net earnings were losses of $24 million and $26 million in 2024 and 2023, respectively, and income of less than $1 million (net) in 2022. Based on forward interest rate curves at December 31, 2024, management estimates that it will reclassify approximately $8 million of pre-tax net losses on interest rate swaps in AOCI to net investment income over the next twelve months. The actual amount will vary based on changes in SOFR. A collateral receivable supporting these swaps of $27 million and $48 million at December 31, 2024 and December 31, 2023, respectively, is included in other assets in AFG’s Balance Sheet.
The fixed maturities with embedded derivatives consist of convertible fixed maturity securities and interest-only and principal-only MBS. AFG records the change in the fair value of these securities in net earnings. These investments are part of AFG’s overall investment strategy and represent a small component of AFG’s overall investment portfolio.
AFG is exposed to fair value changes from certain equity and fixed maturity market-based exposures related to its deferred compensation obligations to certain employees. To mitigate this risk, AFG entered into a total return swap in 2022. AFG’s Balance Sheet includes a $4 million receivable for collateral posted related to the swap (included in other assets) at December 31, 2024, and a $5 million liability to return collateral related to the swap (included in other liabilities) at December 31, 2023.
AMERICAN FINANCIAL GROUP, INC. AND SUBSIDIARIES
NOTES TO CONSOLIDATED FINANCIAL STATEMENTS — CONTINUED
The following table summarizes the gains (losses) included in AFG’s Statement of Earnings for changes in the fair value of derivatives for 2024, 2023 and 2022 (in millions):
|
|
|
|
|
|
|
|
|
|
|
|
|
|
|
|
|
|
|
|
|
|
|
|
|
|
|
|
|
Statement of Earnings Line |
|
2024 |
|
2023 |
|
2022 |
Qualifying cash flow hedges: |
|
|
|
|
|
|
|
|
| Interest rate swaps |
|
Net investment income |
|
$ |
(24) |
|
|
$ |
(26) |
|
|
$ |
— |
|
|
|
|
|
|
|
|
|
|
Non-designated hedges: |
|
|
|
|
|
|
|
|
| Fixed maturities with embedded derivatives |
|
Realized gains (losses) on securities |
|
(1) |
|
|
(2) |
|
|
(12) |
|
| Fixed maturities with embedded derivatives |
|
Net investment income |
|
17 |
|
|
(4) |
|
|
— |
|
| Total return swap |
|
Other expenses |
|
9 |
|
|
13 |
|
|
(5) |
|
| Earnings (losses) on non-designated hedges |
|
|
|
25 |
|
|
7 |
|
|
(17) |
|
| Total earnings (losses) on derivatives |
|
|
|
$ |
1 |
|
|
$ |
(19) |
|
|
$ |
(17) |
|
G. Managed Investment Entities
AFG is the investment manager and it has investments ranging from 13.3% to 100% of the most subordinate debt tranche of thirteen active collateralized loan obligation entities (“CLOs”), which are considered variable interest entities. AFG also owns portions of the senior debt tranches of certain of these CLOs. Upon formation between 2012 and 2024, these entities issued securities in various senior and subordinate classes and invested the proceeds primarily in secured bank loans, which serve as collateral for the debt securities issued by each CLO. None of the collateral was purchased from AFG. AFG’s investments in the subordinate debt tranches of these entities receive residual income from the CLOs only after the CLOs pay expenses (including management fees to AFG) and interest on and returns of capital to senior levels of debt securities. There are no contractual requirements for AFG to provide additional funding for these entities. AFG has not provided and does not intend to provide any financial support to these entities.
AFG’s maximum exposure to economic loss on the CLOs that it manages is limited to its investment in those CLOs, which had an aggregate fair value of $175 million (including $115 million invested in the most subordinate tranches and $49 million invested in a temporary warehousing entity) at December 31, 2024.
In 2024, AFG formed two new CLOs, which issued an aggregate $813 million face amount of liabilities (including $73 million face amount purchased by AFG). In 2023, AFG formed one new CLO, which issued $407 million face amount of liabilities (including $16 million face amount purchased by AFG). In 2022, AFG formed two new CLOs, which issued an aggregate $754 million face amount of liabilities (including $48 million face amount purchased by AFG). In 2024 and 2023, one and four CLOs were substantially liquidated in accordance with the CLO indentures, respectively.
The following table shows a progression of the fair value of AFG's investment in CLO tranches (in millions):
|
|
|
|
|
|
|
|
|
|
|
|
|
|
|
|
|
|
|
2024 |
|
2023 |
|
2022 |
| Balance at beginning of period |
$ |
137 |
|
|
$ |
112 |
|
|
$ |
76 |
|
| Purchases |
62 |
|
|
32 |
|
|
66 |
|
| Sales |
(63) |
|
|
— |
|
|
— |
|
| Distributions |
(41) |
|
|
(34) |
|
|
(18) |
|
| Change in fair value |
29 |
|
|
27 |
|
|
(11) |
|
| Change in accrued interest |
1 |
|
|
— |
|
|
(1) |
|
| Balance at end of period (*) |
$ |
125 |
|
|
$ |
137 |
|
|
$ |
112 |
|
(*)Excludes $49 million, $38 million and $3 million invested in temporary warehousing entities at December 31, 2024, 2023 and 2022, respectively, that were established to provide AFG the ability to form new CLOs.
AMERICAN FINANCIAL GROUP, INC. AND SUBSIDIARIES
NOTES TO CONSOLIDATED FINANCIAL STATEMENTS — CONTINUED
The revenues and expenses of the CLOs are separately identified in AFG’s Statement of Earnings, after the elimination of management fees and earnings attributable to AFG as measured by the change in the fair value of AFG’s investments in the CLOs. Selected financial information related to the CLOs is shown below (in millions):
|
|
|
|
|
|
|
|
|
|
|
|
|
|
|
|
|
|
|
Year ended December 31, |
| 2024 |
|
2023 |
|
2022 |
| Gains (losses) on change in fair value of assets/liabilities (*): |
|
|
|
|
|
| Assets |
$ |
(2) |
|
|
$ |
144 |
|
|
$ |
(267) |
|
| Liabilities |
6 |
|
|
(117) |
|
|
236 |
|
| Management fees paid to AFG |
13 |
|
|
16 |
|
|
17 |
|
CLO earnings (losses) attributable to AFG |
33 |
|
|
27 |
|
|
(10) |
|
(*)Included in revenues in AFG’s Statement of Earnings.
The aggregate unpaid principal balance of the CLOs’ fixed maturity investments exceeded the fair value of the investments by $66 million and $109 million at December 31, 2024 and 2023, respectively. The aggregate unpaid principal balance of the CLOs’ debt exceeded its carrying value by $172 million and $253 million at those dates, respectively. The CLO assets include loans with an aggregate fair value of $3 million at December 31, 2024 and $7 million at December 31, 2023, for which the CLOs are not accruing interest because the loans are in default (aggregate unpaid principal balance of $5 million at December 31, 2024 and $13 million at December 31, 2023).
In addition to the CLOs that it manages, AFG had investments in CLOs that are managed by third parties (therefore not consolidated), which are included in available for sale fixed maturity securities and had a fair value of $1.24 billion at December 31, 2024 and $1.69 billion at December 31, 2023.
H. Goodwill and Other Intangibles
Changes in the carrying value of goodwill during 2023 and 2024 are presented in the following table (in millions):
|
|
|
|
|
|
Balance at December 31, 2022 |
$ |
246 |
|
Purchase of CRS |
85 |
|
Goodwill impairment charge related to investment in Verikai |
(26) |
|
Balance at December 31, 2023 and 2024 |
$ |
305 |
|
AFG recorded a goodwill impairment charge of $26 million in 2023 related to its investment in Verikai (included in the property and casualty insurance segment). The impairment indicator was slower than anticipated growth in the business supported by the Verikai technology relative to what was projected at acquisition. Management utilized the discounted cash flow method of the income approach to calculate the impairment charge. This charge and the impact of reducing the fair value of the contingent consideration related to the Verikai acquisition (see Note D — “Fair Value Measurements”) are included in realized loss on subsidiaries in AFG’s Statement of Earnings.
Included in other assets in AFG’s Balance Sheet is $203 million at December 31, 2024 and $213 million at December 31, 2023 of amortizable intangible assets related to acquisitions. These amounts are net of accumulated amortization of $59 million and $39 million, respectively. Amortization of intangibles was $20 million in 2024, $15 million in 2023 and $11 million in 2022. The decrease in amortizable intangible assets during 2024 is a result of the amortization discussed previously, partially offset by an increase in amortizable intangible assets related to the fair value of the customer bases of AFG’s acquisitions in the fourth quarter of 2024 (see Note B — “Acquisitions of Businesses”).
Future amortization of intangibles (weighted average amortization period of 5 years is estimated to be $20 million per year in 2025 and 2026, $21 million in 2027, $18 million in 2028, $17 million in 2029 and $107 million thereafter.
AMERICAN FINANCIAL GROUP, INC. AND SUBSIDIARIES
NOTES TO CONSOLIDATED FINANCIAL STATEMENTS — CONTINUED
I. Long-Term Debt
Long-term debt consisted of the following at December 31 (in millions):
|
|
|
|
|
|
|
|
|
|
|
|
|
|
|
|
|
|
|
|
|
|
|
|
|
|
|
|
|
|
|
|
|
|
|
|
|
2024 |
|
2023 |
|
Principal |
|
Discount and Issue Costs |
|
Carrying Value |
|
Principal |
|
Discount and Issue Costs |
|
Carrying Value |
| Direct Senior Obligations of AFG: |
|
|
|
|
|
|
|
|
|
|
|
4.50% Senior Notes due June 2047 |
$ |
567 |
|
|
$ |
(1) |
|
|
$ |
566 |
|
|
$ |
567 |
|
|
$ |
(1) |
|
|
$ |
566 |
|
5.25% Senior Notes due April 2030 |
253 |
|
|
(4) |
|
|
249 |
|
|
253 |
|
|
(4) |
|
|
249 |
|
| Other |
3 |
|
|
— |
|
|
3 |
|
|
3 |
|
|
— |
|
|
3 |
|
|
823 |
|
|
(5) |
|
|
818 |
|
|
823 |
|
|
(5) |
|
|
818 |
|
|
|
|
|
|
|
|
|
|
|
|
|
| Direct Subordinated Obligations of AFG: |
|
|
|
|
|
|
|
|
|
|
|
4.50% Subordinated Debentures due September 2060 |
200 |
|
|
(5) |
|
|
195 |
|
|
200 |
|
|
(5) |
|
|
195 |
|
5.125% Subordinated Debentures due December 2059 |
200 |
|
|
(5) |
|
|
195 |
|
|
200 |
|
|
(5) |
|
|
195 |
|
5.625% Subordinated Debentures due June 2060 |
150 |
|
|
(4) |
|
|
146 |
|
|
150 |
|
|
(4) |
|
|
146 |
|
5.875% Subordinated Debentures due March 2059 |
125 |
|
|
(4) |
|
|
121 |
|
|
125 |
|
|
(4) |
|
|
121 |
|
|
675 |
|
|
(18) |
|
|
657 |
|
|
675 |
|
|
(18) |
|
|
657 |
|
|
$ |
1,498 |
|
|
$ |
(23) |
|
|
$ |
1,475 |
|
|
$ |
1,498 |
|
|
$ |
(23) |
|
|
$ |
1,475 |
|
At December 31, 2024, there are no scheduled principal payments on debt for the subsequent five years.
During 2023, AFG repurchased $15 million principal amount of its 4.50% Senior Notes due in June 2047 for $13 million and $8 million principal amount of its 5.25% Senior Notes due in April 2030 for $8 million in open market transactions.
During 2022, AFG repurchased $49 million principal amount of its 3.50% Senior Notes due in August 2026 for $51 million, $8 million principal amount of its 4.50% Senior Notes due in June 2047 for $6 million and $39 million principal amount of its 5.25% Senior Notes due in April 2030 for $38 million in open market transactions. In June 2022, AFG redeemed the remaining $376 million of outstanding 3.50% Senior Notes due August 2026 for $382 million (including a $6 million make-whole call premium).
AFG can borrow up to $450 million under its revolving credit facility, which expires in June 2028. Amounts borrowed under this agreement bear interest at rates ranging from 1.00% to 1.75% (currently 1.25%) over a SOFR-based floating rate. No amounts were borrowed under this facility at December 31, 2024 or December 31, 2023.
Cash interest payments on long-term debt were $74 million in both 2024 and 2023 and $89 million in 2022.
J. Leases
AFG and its subsidiaries lease real estate that is primarily used for office space and, to a lesser extent, equipment under operating lease arrangements. Most of AFG’s real estate leases include an option to extend or renew the lease term at AFG’s option. The operating lease liability includes lease payments related to options to extend or renew the lease term if AFG is reasonably certain of exercising those options. Lease payments are discounted using the implicit discount rate in the lease. If the implicit discount rate for the lease cannot be readily determined, AFG uses an estimate of its incremental secured borrowing rate. AFG did not have any material contracts accounted for as finance or short-term leases at December 31, 2024 or December 31, 2023.
AFG’s operating lease right-of-use asset and operating lease liability are included in other assets and other liabilities, respectively, in AFG’s Balance Sheet at December 31 and are presented in the following table (in millions):
|
|
|
|
|
|
|
|
|
|
|
|
|
2024 |
|
2023 |
| Right-of-use asset |
$ |
212 |
|
|
$ |
176 |
|
| Lease liability |
232 |
|
|
198 |
|
AMERICAN FINANCIAL GROUP, INC. AND SUBSIDIARIES
NOTES TO CONSOLIDATED FINANCIAL STATEMENTS — CONTINUED
The following table details AFG’s lease activity for the years ended December 31, 2024, 2023 and 2022 (in millions):
|
|
|
|
|
|
|
|
|
|
|
|
|
|
|
|
|
|
|
2024 |
|
2023 |
|
2022 |
|
|
|
|
|
|
| Operating lease expense included in other expenses |
$ |
41 |
|
|
$ |
36 |
|
|
$ |
36 |
|
|
|
|
|
|
|
|
|
|
|
|
|
| Sublease income (*) |
— |
|
|
— |
|
|
(2) |
|
| Total lease expense, net of sublease income |
$ |
41 |
|
|
$ |
36 |
|
|
$ |
34 |
|
(*)Sublease income consisted of rent from third parties of office space and is included in other income in AFG’s Statement of Earnings.
Other operating lease information for the years ended December 31, 2024, 2023 and 2022 (in millions):
|
|
|
|
|
|
|
|
|
|
|
|
|
|
|
|
|
|
|
2024 |
|
2023 |
|
2022 |
| Cash paid for lease liabilities reported in operating cash flows |
$ |
40 |
|
|
$ |
38 |
|
|
$ |
38 |
|
| Right-of-use assets obtained under new leases |
68 |
|
|
102 |
|
|
11 |
|
The following table presents the undiscounted contractual maturities of AFG’s operating lease liability at December 31, 2024 (in millions):
|
|
|
|
|
|
| Operating lease payments: |
|
| 2025 |
$ |
40 |
|
| 2026 |
37 |
|
| 2027 |
34 |
|
| 2028 |
29 |
|
| 2029 |
24 |
|
| Thereafter |
164 |
|
| Total lease payments |
328 |
|
| Impact of discounting |
(96) |
|
| Operating lease liability |
$ |
232 |
|
|
|
|
|
|
|
| Weighted-average remaining lease term |
12.6 years |
| Weighted-average discount rate |
5.3 |
% |
K. Shareholders’ Equity
AFG is authorized to issue 12.5 million shares of Voting Preferred Stock and 12.5 million shares of Nonvoting Preferred Stock, each without par value.
Stock Incentive Plans Under AFG’s stock incentive plans, employees of AFG and its subsidiaries are eligible to receive equity awards in the form of stock options, stock appreciation rights, restricted stock awards, restricted stock units and stock awards. At December 31, 2024, there were 2.4 million shares of AFG Common Stock reserved for issuance under AFG’s stock incentive plans.
The restricted Common Stock that AFG has granted generally vests over a four-year period. Data relating to grants of restricted stock is presented below:
|
|
|
|
|
|
|
|
|
|
|
|
|
Shares |
|
Average
Grant Date
Fair Value |
| Outstanding at January 1, 2024 |
572,892 |
|
|
$ |
120.28 |
|
| Granted |
157,681 |
|
|
$ |
126.24 |
|
| Vested |
(151,377) |
|
|
$ |
105.96 |
|
| Forfeited |
(12,832) |
|
|
$ |
127.26 |
|
| Outstanding at December 31, 2024 |
566,364 |
|
|
$ |
125.61 |
|
The total fair value of restricted stock that vested during 2024, 2023 and 2022 was $19 million, $25 million and $23 million, respectively.
AMERICAN FINANCIAL GROUP, INC. AND SUBSIDIARIES
NOTES TO CONSOLIDATED FINANCIAL STATEMENTS — CONTINUED
AFG has not granted any stock options since 2015. There are 18,932 options outstanding and exercisable as of December 31, 2024, all of which expired in February 2025.
The total intrinsic value of options exercised during 2024, 2023 and 2022 was $10 million, $8 million and $18 million, respectively. During 2024, 2023 and 2022, AFG received $6 million, $4 million and $7 million, respectively, in cash from the exercise of stock options. The total tax benefit related to the exercises was $2 million, $1 million and $3 million during those years, respectively.
Total compensation expense related to stock incentive plans of AFG and its subsidiaries was $18 million for 2024, $18 million for 2023 and $19 million for 2022. AFG’s provision for income tax includes tax benefits of $7 million in 2024, $6 million in 2023 and $8 million in 2022 related to AFG’s stock incentive plans. At December 31, 2024, there was $32 million of unrecognized compensation expense related to restricted stock awards, which is expected to be recognized over a weighted average of 2.5 years. At December 31, 2024, there was no unrecognized compensation expense related to unvested stock options.
Accumulated Other Comprehensive Income (Loss), Net of Tax (“AOCI”) Comprehensive income is defined as all changes in shareholders’ equity except those arising from transactions with shareholders. Comprehensive income includes net earnings and other comprehensive income (loss), which consists primarily of changes in net unrealized gains or losses on available for sale fixed maturity securities.
The progression of the components of accumulated other comprehensive income (loss) follows (in millions):
|
|
|
|
|
|
|
|
|
|
|
|
|
|
|
|
|
|
|
|
|
|
|
|
|
|
|
|
|
|
|
|
|
|
|
|
|
|
|
Other Comprehensive Income (Loss) |
|
|
|
|
|
|
|
|
|
AOCI Beginning Balance |
|
Pretax |
|
Tax |
|
Net of tax |
|
|
|
|
|
|
|
AOCI Ending Balance |
| Year ended December 31, 2024 |
|
|
|
|
|
|
|
|
|
|
|
|
|
|
|
| Net unrealized gains (losses) on securities: |
|
|
|
|
|
|
|
|
|
|
|
|
|
|
|
| Unrealized holding gains (losses) on securities arising during the period |
|
|
$ |
77 |
|
|
$ |
(16) |
|
|
$ |
61 |
|
|
|
|
|
|
|
|
|
| Reclassification adjustment for realized (gains) losses included in net earnings (*) |
|
|
31 |
|
|
(7) |
|
|
24 |
|
|
|
|
|
|
|
|
|
| Total net unrealized gains (losses) on securities |
$ |
(287) |
|
|
108 |
|
|
(23) |
|
|
85 |
|
|
|
|
|
|
|
|
$ |
(202) |
|
| Net unrealized gains (losses) on cash flow hedges: |
|
|
|
|
|
|
|
|
|
|
|
|
|
|
|
| Unrealized holding gains (losses) on cash flow hedges arising during the period |
|
|
(16) |
|
|
4 |
|
|
(12) |
|
|
|
|
|
|
|
|
|
| Reclassification adjustment for investment income included in net earnings (*) |
|
|
24 |
|
|
(5) |
|
|
19 |
|
|
|
|
|
|
|
|
|
| Total net unrealized gains (losses) on cash flow hedges |
(17) |
|
|
8 |
|
|
(1) |
|
|
7 |
|
|
|
|
|
|
|
|
(10) |
|
| Foreign currency translation adjustments |
(17) |
|
|
(12) |
|
|
(1) |
|
|
(13) |
|
|
|
|
|
|
|
|
(30) |
|
| Pension and other postretirement plan adjustments |
2 |
|
|
— |
|
|
— |
|
|
— |
|
|
|
|
|
|
|
|
2 |
|
| Total |
$ |
(319) |
|
|
$ |
104 |
|
|
$ |
(25) |
|
|
$ |
79 |
|
|
|
|
|
|
|
|
$ |
(240) |
|
|
|
|
|
|
|
|
|
|
|
|
|
|
|
|
|
|
|
|
|
|
|
|
|
|
|
|
|
|
|
|
|
AMERICAN FINANCIAL GROUP, INC. AND SUBSIDIARIES
NOTES TO CONSOLIDATED FINANCIAL STATEMENTS — CONTINUED
|
|
|
|
|
|
|
|
|
|
|
|
|
|
|
|
|
|
|
|
|
|
|
|
|
|
|
|
|
|
|
|
|
|
|
|
|
|
|
Other Comprehensive Income (Loss) |
|
|
|
|
|
|
|
|
|
AOCI Beginning Balance |
|
Pretax |
|
Tax |
|
Net of tax |
|
|
|
|
|
|
|
AOCI Ending Balance |
| Year ended December 31, 2023 |
|
|
|
|
|
|
|
|
|
|
|
|
|
|
|
| Net unrealized gains (losses) on securities: |
|
|
|
|
|
|
|
|
|
|
|
|
|
|
|
| Unrealized holding gains (losses) on securities arising during the period |
|
|
$ |
224 |
|
|
$ |
(48) |
|
|
$ |
176 |
|
|
|
|
|
|
|
|
|
| Reclassification adjustment for realized (gains) losses included in net earnings (*) |
|
|
43 |
|
|
(9) |
|
|
34 |
|
|
|
|
|
|
|
|
|
| Total net unrealized gains (losses) on securities |
$ |
(497) |
|
|
267 |
|
|
(57) |
|
|
210 |
|
|
|
|
|
|
|
|
$ |
(287) |
|
| Net unrealized gains (losses) on cash flow hedges: |
|
|
|
|
|
|
|
|
|
|
|
|
|
|
|
| Unrealized holding gains (losses) on cash flow hedges arising during the period |
|
|
(11) |
|
|
2 |
|
|
(9) |
|
|
|
|
|
|
|
|
|
| Reclassification adjustment for investment income included in net earnings (*) |
|
|
26 |
|
|
(5) |
|
|
21 |
|
|
|
|
|
|
|
|
|
| Total net unrealized gains (losses) on cash flow hedges |
(29) |
|
|
15 |
|
|
(3) |
|
|
12 |
|
|
|
|
|
|
|
|
(17) |
|
| Foreign currency translation adjustments |
(20) |
|
|
2 |
|
|
1 |
|
|
3 |
|
|
|
|
|
|
|
|
(17) |
|
| Pension and other postretirement plan adjustments |
3 |
|
|
(1) |
|
|
— |
|
|
(1) |
|
|
|
|
|
|
|
|
2 |
|
| Total |
$ |
(543) |
|
|
$ |
283 |
|
|
$ |
(59) |
|
|
$ |
224 |
|
|
|
|
|
|
|
|
$ |
(319) |
|
|
|
|
|
|
|
|
|
|
|
|
|
|
|
|
|
| Year ended December 31, 2022 |
|
|
|
|
|
|
|
|
|
|
|
|
|
|
|
| Net unrealized gains (losses) on securities: |
|
|
|
|
|
|
|
|
|
|
|
|
|
|
|
| Unrealized holding gains (losses) on securities arising during the period |
|
|
$ |
(821) |
|
|
$ |
174 |
|
|
$ |
(647) |
|
|
|
|
|
|
|
|
|
| Reclassification adjustment for realized (gains) losses included in net earnings (*) |
|
|
18 |
|
|
(4) |
|
|
14 |
|
|
|
|
|
|
|
|
|
| Total net unrealized gains (losses) on securities |
$ |
136 |
|
|
(803) |
|
|
170 |
|
|
(633) |
|
|
|
|
|
|
|
|
$ |
(497) |
|
| Net unrealized gains (losses) on cash flow hedges: |
|
|
|
|
|
|
|
|
|
|
|
|
|
|
|
| Unrealized holding gains (losses) on cash flow hedges arising during the period |
|
|
(37) |
|
|
8 |
|
|
(29) |
|
|
|
|
|
|
|
|
|
Reclassification adjustment for investment income included in net earnings (*) |
|
|
— |
|
|
— |
|
|
— |
|
|
|
|
|
|
|
|
|
Total net unrealized gains (losses) on cash flow hedges |
— |
|
|
(37) |
|
|
8 |
|
|
(29) |
|
|
|
|
|
|
|
|
(29) |
|
| Foreign currency translation adjustments |
(18) |
|
|
(1) |
|
|
(1) |
|
|
(2) |
|
|
|
|
|
|
|
|
(20) |
|
| Pension and other postretirement plan adjustments |
1 |
|
|
2 |
|
|
— |
|
|
2 |
|
|
|
|
|
|
|
|
3 |
|
| Total |
$ |
119 |
|
|
$ |
(839) |
|
|
$ |
177 |
|
|
$ |
(662) |
|
|
|
|
|
|
|
|
$ |
(543) |
|
(*)The reclassification adjustments affected the following lines in AFG’s Statement of Earnings:
|
|
|
|
|
|
|
|
|
|
|
|
|
|
|
|
OCI component |
|
Affected line in the statement of earnings |
|
|
Pretax - Net unrealized gains (losses) on securities |
|
Realized gains (losses) on securities |
|
|
Pretax - Net unrealized gains (losses) on cash flow hedges |
|
Net investment income |
|
|
Pretax - Net unrealized gains (losses) on pension and other postretirement plans |
|
Other expenses |
|
|
Tax |
|
Provision for income taxes |
|
AMERICAN FINANCIAL GROUP, INC. AND SUBSIDIARIES
NOTES TO CONSOLIDATED FINANCIAL STATEMENTS — CONTINUED
L. Income Taxes
The following is a reconciliation of income taxes at the statutory rate of 21% to the provision for income taxes as shown in AFG’s Statement of Earnings (dollars in millions):
|
|
|
|
|
|
|
|
|
|
|
|
|
|
|
|
|
|
|
|
|
|
|
|
|
|
|
|
|
|
|
|
|
|
|
|
|
2024 |
|
2023 |
|
2022 |
|
Amount |
|
% of EBT |
|
Amount |
|
% of EBT |
|
Amount |
|
% of EBT |
Earnings before income taxes (“EBT”) |
$ |
1,124 |
|
|
|
|
$ |
1,073 |
|
|
|
|
$ |
1,123 |
|
|
|
|
|
|
|
|
|
|
|
|
|
|
|
| Income taxes at statutory rate |
$ |
236 |
|
|
21 |
% |
|
$ |
225 |
|
|
21 |
% |
|
$ |
236 |
|
|
21 |
% |
| Effect of: |
|
|
|
|
|
|
|
|
|
|
|
| Employee stock ownership plan dividend paid deduction |
(5) |
|
|
(1 |
%) |
|
(5) |
|
|
(1 |
%) |
|
(8) |
|
|
(1 |
%) |
| Tax exempt interest |
(5) |
|
|
(1 |
%) |
|
(5) |
|
|
(1 |
%) |
|
(6) |
|
|
(1 |
%) |
| Stock-based compensation |
(3) |
|
|
— |
% |
|
(2) |
|
|
— |
% |
|
(5) |
|
|
— |
% |
| Change in valuation allowance |
(3) |
|
|
— |
% |
|
(2) |
|
|
— |
% |
|
(9) |
|
|
(1 |
%) |
| Dividend received deduction |
(1) |
|
|
— |
% |
|
(2) |
|
|
— |
% |
|
(2) |
|
|
— |
% |
| Nondeductible expenses |
7 |
|
|
1 |
% |
|
11 |
|
|
1 |
% |
|
8 |
|
|
1 |
% |
Adjustment related to sale of subsidiary (*) |
4 |
|
|
1 |
% |
|
— |
|
|
— |
% |
|
— |
|
|
— |
% |
Adjustment to prior year taxes |
1 |
|
|
— |
% |
|
(5) |
|
|
— |
% |
|
(3) |
|
|
— |
% |
| Foreign operations |
2 |
|
|
— |
% |
|
6 |
|
|
1 |
% |
|
7 |
|
|
1 |
% |
| Other |
4 |
|
|
— |
% |
|
— |
|
|
— |
% |
|
7 |
|
|
— |
% |
| Provision for income taxes as shown in the statement of earnings |
$ |
237 |
|
|
21 |
% |
|
$ |
221 |
|
|
21 |
% |
|
$ |
225 |
|
|
20 |
% |
(*)In 2024, AFG recorded $4 million in net tax expense related to a pending IRS settlement regarding the sale of a subsidiary in a prior year.
On January 1, 2023, the two major tax provisions in the Inflation Reduction Act ("IRA”) became effective. The IRA created a new corporate alternative minimum tax (“CAMT”) based on the earnings that a company reports in its financial statements and imposes a 1% excise tax on corporate stock repurchases. Any CAMT incurred would be available to offset taxes payable under the standard calculation in future periods. Accordingly, the CAMT is a timing difference and would result in the recording of an offsetting deferred tax asset with no impact on overall income tax expense. While AFG meets the financial statement income thresholds to be subject to CAMT, management does not believe AFG will incur a CAMT liability for 2024. The excise tax on stock repurchases in excess of any issuances is recorded as part of the cost of the repurchases directly in shareholders’ equity.
Since almost all of AFG’s earnings are taxable based on U.S. tax rates, the Global Intangible Low-taxed Income (“GILTI”) provision is not expected to be material to AFG’s results of operations and will be recorded in the period that any tax arises.
The Organisation for Economic Co-operation and Development, an intergovernmental organization with 38 member countries, has proposed a global minimum corporate tax rate of 15% (“Pillar Two”). Due to AFG’s limited international operations and the tax rate AFG is subject to in those jurisdictions, management does not believe Pillar Two will have a material impact on AFG’s results of operations.
AFG’s 2013 — 2018 and 2021 — 2024 tax years remain subject to examination by the IRS.
AMERICAN FINANCIAL GROUP, INC. AND SUBSIDIARIES
NOTES TO CONSOLIDATED FINANCIAL STATEMENTS — CONTINUED
Total earnings before income taxes include earnings subject to tax in foreign jurisdictions of $36 million in 2024, $32 million in 2023 and $64 million in 2022.
The total income tax provision consists of (in millions):
|
|
|
|
|
|
|
|
|
|
|
|
|
|
|
|
|
|
|
2024 |
|
2023 |
|
2022 |
| Current taxes: |
|
|
|
|
|
| Federal |
$ |
218 |
|
|
$ |
176 |
|
|
$ |
192 |
|
| State |
11 |
|
|
9 |
|
|
10 |
|
| Foreign |
— |
|
|
(1) |
|
|
1 |
|
| Deferred taxes: |
|
|
|
|
|
| Federal |
8 |
|
|
37 |
|
|
22 |
|
| Provision for income taxes |
$ |
237 |
|
|
$ |
221 |
|
|
$ |
225 |
|
For income tax purposes, AFG and its subsidiaries had the following carryforwards available at December 31, 2024 (in millions):
|
|
|
|
|
|
|
|
|
|
|
|
|
|
|
|
Expiring |
|
Amount |
|
| Operating Loss – U.S. |
2025 - 2041 |
|
$ |
8 |
|
|
| Operating Loss – United Kingdom |
indefinite |
|
35 |
|
(*) |
(*)£28 million
Deferred income tax assets and liabilities reflect temporary differences between the carrying amounts of assets and liabilities recognized for financial reporting purposes and the amounts recognized for tax purposes. The significant components of deferred tax assets and liabilities included in AFG’s Balance Sheet at December 31 were as follows (in millions):
|
|
|
|
|
|
|
|
|
|
|
|
|
2024 |
|
2023 |
| Deferred tax assets: |
|
|
|
| Federal net operating loss carryforwards |
$ |
2 |
|
|
$ |
2 |
|
| Foreign underwriting losses |
10 |
|
|
10 |
|
|
|
|
|
| Insurance claims and reserves |
283 |
|
|
269 |
|
| Employee benefits |
114 |
|
|
111 |
|
Lease liabilities |
45 |
|
|
38 |
|
| Other, net |
20 |
|
|
23 |
|
Total deferred tax assets before valuation allowance |
474 |
|
|
453 |
|
| Valuation allowance against deferred tax assets |
(11) |
|
|
(14) |
|
| Total deferred tax assets |
463 |
|
|
439 |
|
| Deferred tax liabilities: |
|
|
|
| Investment securities |
(233) |
|
|
(177) |
|
| Deferred policy acquisition costs |
(73) |
|
|
(70) |
|
| Insurance claims and reserves transition liability |
(4) |
|
|
(8) |
|
Lease right of use assets |
(42) |
|
|
(36) |
|
| Real estate, property and equipment |
(7) |
|
|
(12) |
|
| Total deferred tax liabilities |
(359) |
|
|
(303) |
|
| Net deferred tax asset |
$ |
104 |
|
|
$ |
136 |
|
AFG’s net deferred tax asset at December 31, 2024 and 2023 is included in other assets in AFG’s Balance Sheet. The decrease in AFG’s net deferred tax asset at December 31, 2024 compared to December 31, 2023 reflects lower net unrealized losses on fixed maturities and the increase in fair value of equity securities and carrying value of limited partnership investments still owned.
The likelihood of realizing deferred tax assets is reviewed periodically. Any adjustments required to the valuation allowance are made in the period during which developments requiring an adjustment become known.
At December 31, 2024, there were no unrecognized tax benefits or related interest and penalties. At December 31, 2023, there were unrecognized tax benefits and related interest and penalties of less than $1 million. AFG’s provision for income taxes in 2024, 2023 and 2022 included interest expense of less than $1 million related to unrecognized tax benefits.
AMERICAN FINANCIAL GROUP, INC. AND SUBSIDIARIES
NOTES TO CONSOLIDATED FINANCIAL STATEMENTS — CONTINUED
There were liabilities of less than $1 million for interest related to unrecognized tax benefits at December 31, 2023. There were no penalties related to unrecognized tax benefits included in AFG’s provision for income taxes in 2024, 2023 and 2022. There is no liability for penalties related to unrecognized tax benefits at December 31, 2023.
Cash payments for income taxes, net of refunds, were $201 million for both 2024 and 2023 and $242 million for 2022.
M. Contingencies
Establishing property and casualty insurance reserves for claims related to environmental exposures, asbestos and other mass tort claims is subject to uncertainties that are significantly greater than those presented by other types of claims. For this group of claims, traditional actuarial techniques that rely on historical loss development trends cannot be used and a range of reasonably possible losses cannot be estimated. Accruals (included in other liabilities) have been recorded for various environmental and occupational injury and disease claims and other contingencies arising out of the railroad operations disposed of by Penn Central Transportation Company (“PCTC”), the predecessor to APU Consolidated, Inc. (including its subsidiaries, “APU”) prior to PCTC’s bankruptcy reorganization in 1978, and certain manufacturing operations disposed of by APU and Great American Financial Resources, Inc. (“GAFRI”).
AFG completed in-depth internal reviews of its asbestos and environmental (“A&E”) reserves in the third quarters of 2024, 2023 and 2022. The 2024 and 2023 internal reviews resulted in pretax special A&E charges of $14 million and $15 million, respectively, for the former railroad and manufacturing operations. The 2022 review resulted in a small adjustment to AFG’s A&E reserves.
The property and casualty group’s liability for A&E reserves was $494 million at December 31, 2024; related recoverables from reinsurers (net of allowances for doubtful accounts) at that date were $135 million.
At December 31, 2024, APU and its subsidiaries had liabilities for environmental and personal injury claims and other contingencies aggregating $84 million. The environmental claims consist of a number of proceedings and claims seeking to impose responsibility for hazardous waste remediation costs related to certain sites formerly owned or operated by the railroad and manufacturing operations. Remediation costs are difficult to estimate for a number of reasons, including the number and financial resources of other potentially responsible parties, the range of costs for remediation alternatives, changing technology and the time period over which these matters develop. The personal injury claims and other contingencies include pending and expected claims, primarily by former employees of PCTC, for injury or disease allegedly caused by exposure to excessive noise, asbestos or other substances in the workplace and other labor disputes.
At December 31, 2024, GAFRI had a liability of $7 million for environmental costs and certain other matters associated with the sales of its former manufacturing operations.
While management believes AFG has recorded adequate reserves for the items discussed above, the outcome is uncertain and could result in liabilities that may vary from amounts AFG has currently recorded. Such amounts could have a material effect on AFG’s future results of operations and financial condition.
In addition, AFG and its subsidiaries are involved in litigation from time to time, generally arising in the ordinary course of business. This litigation may include, but is not limited to, general commercial disputes, lawsuits brought by policyholders, employment matters, reinsurance collection matters and actions challenging certain business practices of insurance subsidiaries. None of these matters are expected to have a material adverse impact on AFG’s results of operations or financial condition.
N. Insurance
Cash and securities owned by U.S.-based insurance subsidiaries, having a carrying value of approximately $1.15 billion at December 31, 2024, were on deposit as required by regulatory authorities.
Insurance Reserves Estimating the liability for unpaid losses and loss adjustment expenses (“LAE”) is inherently judgmental and is influenced by factors that are subject to significant variation. Determining the liability is a complex process incorporating input from many areas of the Company including actuarial, underwriting, pricing, claims and operations management.
AMERICAN FINANCIAL GROUP, INC. AND SUBSIDIARIES
NOTES TO CONSOLIDATED FINANCIAL STATEMENTS — CONTINUED
The process used to determine the total reserve for liabilities involves estimating the ultimate incurred losses and LAE, adjusted for amounts already paid on the claims. The incurred but not reported (“IBNR”) reserve is derived by first estimating the ultimate unpaid reserve liability and subtracting case reserves for loss and LAE.
In determining management’s best estimate of the ultimate liability, management (with the assistance of Company actuaries) considers items such as the effect of inflation on medical, hospitalization, material, repair and replacement costs, the nature and maturity of lines of insurance, general economic trends and the legal environment. In addition, historical trends adjusted for changes in underwriting standards, policy provisions, product mix and other factors are analyzed using actuarial reserve development techniques. Weighing all of the factors, the management team determines a single or “point” estimate that it records as its best estimate of the ultimate liability. Ranges of loss reserves are not developed by Company actuaries. This reserve analysis and review is completed each quarter and for almost every business within AFG’s property and casualty insurance sub-segments.
Each quarterly review includes in-depth analysis of several hundred subdivisions of the business, employing multiple actuarial techniques. For each subdivision, actuaries use informed, professional judgment to adjust these techniques as necessary to respond to specific conditions in the data or within the business.
Some of the standard actuarial methods employed for the quarterly reserve analysis may include (but may not be limited to):
•Case Incurred Development Method
•Paid Development Method
•Bornhuetter-Ferguson Method
•Incremental Paid LAE to Paid Loss Methods
Each method has particular strengths and weaknesses and no single estimation method is most accurate in all situations. When applied to a particular group of claims, the relative strengths and weaknesses of each method can change over time based on the facts and circumstances. Ultimately, the estimation methods chosen are those which the actuary believes produce the most reliable indication for the particular liabilities under review.
The period of time from the event triggering a claim through the settlement of the liability is referred to as the “tail”. Generally, the same actuarial methods are considered for both short-tail and long-tail lines of business because most of them work properly for both. The methods are designed to incorporate the effects of the differing length of time to settle particular claims. For nearly all lines of business, the actuaries rely heavily on the Bornhuetter-Ferguson method for more recent accident periods. As accident years mature and the underlying claim data becomes more credible, more weight is given to the Case Incurred and Paid Development methods. This transition occurs relatively quickly for short-tailed lines, and over a number of years for long-tail lines. Liability claims for long-tail lines are more susceptible to litigation and can be significantly affected by changing contract interpretation and the legal environment. Therefore, the estimation of loss reserves for these classes is more complex and subject to a higher degree of variability.
The level of detail in which data is analyzed varies among the different lines of business. Data is generally analyzed by major product or by coverage within product, using countrywide data; however, in some situations, data may be reviewed by state or region. Appropriate segmentation of the data is determined based on data credibility, homogeneity of development patterns, mix of business, and other actuarial considerations.
Supplementary statistical information is also reviewed to determine which methods are most appropriate to use or if adjustments are needed to particular methods. Such information includes:
•Open and closed claim counts
•Average case reserves and average incurred on open claims
•Closure rates and statistics related to closed and open claim percentages
•Average closed claim severity
•Ultimate claim severity
•Reported loss ratios
•Projected ultimate loss ratios
•Loss payment patterns
Within each business, results of individual methods are reviewed, supplementary statistical information is analyzed, and data from underwriting, operating and claim management are considered in deriving management’s best estimate of the ultimate liability. This estimate may be the result of one method, a weighted average of several methods, or a judgmental selection as the management team determines is appropriate.
AMERICAN FINANCIAL GROUP, INC. AND SUBSIDIARIES
NOTES TO CONSOLIDATED FINANCIAL STATEMENTS — CONTINUED
The liability for losses and LAE for a very limited number of claims with long-term scheduled payments under certain workers’ compensation policies has been discounted at 4.5% at both December 31, 2024 and December 31, 2023, which represents an approximation of long-term investment yields. Because of the limited amount of claims involved, the net impact of discounting did not materially impact AFG’s total liability for unpaid losses and loss adjustment expenses (net reductions from discounting of $8 million at December 31, 2024 and $9 million at December 31, 2023).
The following table provides an analysis of changes in the liability for losses and loss adjustment expenses over the past three years (in millions):
|
|
|
|
|
|
|
|
|
|
|
|
|
|
|
|
|
|
|
2024 |
|
2023 |
|
2022 |
| Balance at beginning of period |
$ |
13,087 |
|
|
$ |
11,974 |
|
|
$ |
11,074 |
|
| Less reinsurance recoverables, net of allowance |
4,288 |
|
|
3,767 |
|
|
3,419 |
|
| Net liability at beginning of period |
8,799 |
|
|
8,207 |
|
|
7,655 |
|
| Provision for losses and LAE occurring in the current year |
4,524 |
|
|
4,256 |
|
|
3,914 |
|
|
|
|
|
|
|
|
|
|
|
|
|
Net decrease in the provision for claims of prior years |
(64) |
|
|
(223) |
|
|
(285) |
|
| Total losses and LAE incurred |
4,460 |
|
|
4,033 |
|
|
3,629 |
|
| Payments for losses and LAE of: |
|
|
|
|
|
| Current year |
(1,497) |
|
|
(1,261) |
|
|
(1,212) |
|
| Prior years |
(2,537) |
|
|
(2,181) |
|
|
(1,870) |
|
| Total payments |
(4,034) |
|
|
(3,442) |
|
|
(3,082) |
|
| Foreign currency translation and other |
(3) |
|
|
1 |
|
|
5 |
|
| Net liability at end of period |
9,222 |
|
|
8,799 |
|
|
8,207 |
|
| Add back reinsurance recoverables, net of allowance |
4,957 |
|
|
4,288 |
|
|
3,767 |
|
| Gross unpaid losses and LAE included in the balance sheet |
$ |
14,179 |
|
|
$ |
13,087 |
|
|
$ |
11,974 |
|
The net decrease in the provision for claims of prior years in 2024 reflects (i) lower than anticipated losses in the crop business, lower than expected claim severity in the property and inland marine and aviation businesses and lower than anticipated claim frequency and severity in the ocean marine business (within the Property and transportation sub-segment), (ii) lower than anticipated claim severity in the workers’ compensation businesses and lower than expected claim frequency and severity in the executive liability business (within the Specialty casualty sub-segment) and (iii) lower than anticipated claim frequency and severity in the financial institutions and fidelity businesses and lower than expected claim frequency in the trade credit business (within the Specialty financial sub-segment). This favorable development was partially offset by (i) higher than anticipated claim frequency and severity in the umbrella and excess liability and social services businesses and higher than expected claim severity in the public sector and general liability businesses (within the Specialty casualty sub-segment), (ii) higher than anticipated claim severity in the innovative markets and surety businesses (within the Specialty financial sub-segment) and (iii) net adverse development associated with AFG’s internal reinsurance program (within Other specialty).
The net decrease in the provision for claims of prior years in 2023 reflects (i) lower than anticipated losses in the crop business, lower than expected claim frequency and severity across the transportation businesses and lower than anticipated claim frequency in the property and inland marine and ocean marine businesses and in the Singapore operations (within the Property and transportation sub-segment), (ii) lower than anticipated claim severity in the workers’ compensation businesses, lower than expected claim frequency in the executive liability and environmental businesses and favorable reserve development related to COVID-19 losses across several businesses (within the Specialty casualty sub-segment) and (iii) lower than anticipated claim frequency in the trade credit, financial institutions and surety businesses and lower than expected claim frequency and severity in the fidelity business (within the Specialty financial sub-segment). This favorable development was partially offset by higher than anticipated claim severity in the public sector business and higher than expected claim frequency and severity in the excess liability and general liability businesses (within the Specialty casualty sub-segment).
The net decrease in the provision for claims of prior years in 2022 reflects (i) lower than anticipated losses in the crop business, lower than expected claim frequency in the trucking and ocean marine businesses and in the Singapore operations, lower than expected claim frequency and severity in the aviation business and lower than anticipated claim severity in the property and inland marine business (within the Property and transportation sub-segment), (ii) lower than anticipated claim severity in the workers’ compensation businesses and lower than expected claim frequency in the executive liability and excess and surplus businesses (within the Specialty casualty sub-segment) and (iii) lower than anticipated claim frequency in the surety, trade credit and financial institutions businesses (within the Specialty financial sub-segment).
AMERICAN FINANCIAL GROUP, INC. AND SUBSIDIARIES
NOTES TO CONSOLIDATED FINANCIAL STATEMENTS — CONTINUED
This favorable development was partially offset by (i) higher than anticipated claim severity in the general liability, umbrella and excess liability, and certain targeted markets businesses (within the Specialty casualty sub-segment) and (ii) net adverse development associated with AFG’s internal reinsurance program, primarily related to social inflation exposed business assumed from the Specialty casualty sub-segment (within Other specialty).
A reconciliation of incurred and paid claims development information to the aggregate carrying amount of the liability for unpaid losses and LAE, with separate disclosure of reinsurance recoverables on unpaid claims is shown below (in millions):
|
|
|
|
|
|
|
2024 |
| Unpaid losses and allocated LAE, net of reinsurance: |
|
| Specialty |
|
| Property and transportation |
$ |
1,696 |
|
| Specialty casualty |
5,266 |
|
| Specialty financial |
405 |
|
| Other specialty |
597 |
|
| Total Specialty (excluding foreign reserves) |
7,964 |
|
|
|
| Other reserves |
|
| Foreign operations |
406 |
|
| A&E reserves |
359 |
|
| Unallocated LAE |
435 |
|
| Other |
58 |
|
| Total other reserves |
1,258 |
|
| Total reserves, net of reinsurance |
9,222 |
|
|
|
| Add back reinsurance recoverables, net of allowance |
4,957 |
|
| Gross unpaid losses and LAE included in the balance sheet |
$ |
14,179 |
|
AMERICAN FINANCIAL GROUP, INC. AND SUBSIDIARIES
NOTES TO CONSOLIDATED FINANCIAL STATEMENTS — CONTINUED
The following claims development tables and associated disclosures related to short-duration insurance contracts are prepared by sub-segment within the property and casualty insurance business for the most recent 10 accident years. AFG determines its claim counts at the claimant or policy feature level depending on the particular facts and circumstances of the underlying claim. While the methodology is generally consistent within each sub-segment, there are minor differences between and within the sub-segments. The methods used to summarize claim counts have not changed significantly over the time periods reported in the tables below.
|
|
|
|
|
|
|
|
|
|
|
|
|
|
|
|
|
|
|
|
|
|
|
|
|
|
|
|
|
|
|
|
|
|
|
|
|
|
|
|
|
|
|
|
|
|
|
|
|
|
|
|
|
|
|
|
|
|
|
|
|
|
|
|
|
|
|
|
|
|
|
|
|
|
|
| Property and transportation |
|
|
|
|
|
|
|
|
|
|
|
|
|
|
|
|
| (Dollars in Millions) |
|
|
|
|
|
|
|
|
|
|
|
|
|
|
|
|
|
|
|
|
|
|
|
|
|
|
|
|
|
|
|
|
|
|
|
|
|
|
|
|
|
|
|
|
|
Incurred Claims and Allocated LAE, Net of Reinsurance |
|
As of December 31, 2024 |
|
|
For the Years Ended (2015–2023 is Supplementary Information and Unaudited) |
|
Total IBNR Plus Expected Development on Reported Claims |
|
Cumulative Number of Reported Claims |
| Accident Year |
|
2015 |
|
2016 |
|
2017 |
|
2018 |
|
2019 |
|
2020 |
|
2021 |
|
2022 |
|
2023 |
|
2024 |
|
|
| 2015 |
|
$ |
818 |
|
|
$ |
784 |
|
|
$ |
779 |
|
|
$ |
777 |
|
|
$ |
777 |
|
|
$ |
772 |
|
|
$ |
768 |
|
|
$ |
769 |
|
|
$ |
769 |
|
|
$ |
769 |
|
|
$ |
3 |
|
|
135,094 |
|
| 2016 |
|
|
|
746 |
|
|
716 |
|
|
714 |
|
|
706 |
|
|
694 |
|
|
688 |
|
|
689 |
|
|
689 |
|
|
686 |
|
|
5 |
|
|
121,410 |
|
| 2017 |
|
|
|
|
|
889 |
|
|
847 |
|
|
843 |
|
|
823 |
|
|
816 |
|
|
820 |
|
|
820 |
|
|
817 |
|
|
7 |
|
|
141,023 |
|
| 2018 |
|
|
|
|
|
|
|
932 |
|
|
902 |
|
|
886 |
|
|
876 |
|
|
882 |
|
|
876 |
|
|
878 |
|
|
9 |
|
|
130,781 |
|
| 2019 |
|
|
|
|
|
|
|
|
|
1,111 |
|
|
1,058 |
|
|
1,051 |
|
|
1,055 |
|
|
1,057 |
|
|
1,059 |
|
|
18 |
|
|
154,370 |
|
| 2020 |
|
|
|
|
|
|
|
|
|
|
|
1,043 |
|
|
974 |
|
|
957 |
|
|
949 |
|
|
948 |
|
|
22 |
|
|
122,246 |
|
| 2021 |
|
|
|
|
|
|
|
|
|
|
|
|
|
1,119 |
|
|
1,023 |
|
|
1,022 |
|
|
1,028 |
|
|
50 |
|
|
123,746 |
|
| 2022 |
|
|
|
|
|
|
|
|
|
|
|
|
|
|
|
1,393 |
|
|
1,316 |
|
|
1,313 |
|
|
100 |
|
|
137,902 |
|
| 2023 |
|
|
|
|
|
|
|
|
|
|
|
|
|
|
|
|
|
1,472 |
|
|
1,392 |
|
|
178 |
|
|
143,664 |
|
| 2024 |
|
|
|
|
|
|
|
|
|
|
|
|
|
|
|
|
|
|
|
1,592 |
|
|
419 |
|
|
156,368 |
|
|
|
|
|
|
|
|
|
|
|
|
|
|
|
|
|
|
|
Total |
|
$ |
10,482 |
|
|
|
|
|
|
|
|
|
|
|
|
|
|
|
|
|
|
|
|
|
|
|
|
|
|
|
|
|
|
|
|
|
|
|
|
|
|
|
|
|
|
|
|
|
|
|
|
|
|
|
|
|
|
|
|
|
|
|
|
|
|
|
|
|
|
|
|
|
|
|
|
|
|
|
|
|
|
|
|
|
|
Cumulative Paid Claims and Allocated LAE, Net of Reinsurance |
|
|
|
|
| Accident Year |
|
For the Years Ended (2015–2023 is Supplementary Information and Unaudited) |
|
|
|
|
|
2015 |
|
2016 |
|
2017 |
|
2018 |
|
2019 |
|
2020 |
|
2021 |
|
2022 |
|
2023 |
|
2024 |
|
% (a) |
|
|
| 2015 |
|
$ |
359 |
|
|
$ |
582 |
|
|
$ |
667 |
|
|
$ |
707 |
|
|
$ |
736 |
|
|
$ |
744 |
|
|
$ |
750 |
|
|
$ |
755 |
|
|
$ |
761 |
|
|
$ |
762 |
|
|
99.1 |
% |
|
|
| 2016 |
|
|
|
294 |
|
|
521 |
|
|
577 |
|
|
618 |
|
|
640 |
|
|
656 |
|
|
665 |
|
|
672 |
|
|
674 |
|
|
98.3 |
% |
|
|
| 2017 |
|
|
|
|
|
379 |
|
|
640 |
|
|
696 |
|
|
735 |
|
|
755 |
|
|
783 |
|
|
794 |
|
|
804 |
|
|
98.4 |
% |
|
|
| 2018 |
|
|
|
|
|
|
|
396 |
|
|
676 |
|
|
738 |
|
|
781 |
|
|
824 |
|
|
838 |
|
|
852 |
|
|
97.0 |
% |
|
|
| 2019 |
|
|
|
|
|
|
|
|
|
527 |
|
|
823 |
|
|
904 |
|
|
959 |
|
|
998 |
|
|
1,023 |
|
|
96.6 |
% |
|
|
| 2020 |
|
|
|
|
|
|
|
|
|
|
|
461 |
|
|
726 |
|
|
804 |
|
|
857 |
|
|
896 |
|
|
94.5 |
% |
|
|
| 2021 |
|
|
|
|
|
|
|
|
|
|
|
|
|
449 |
|
|
767 |
|
|
867 |
|
|
935 |
|
|
91.0 |
% |
|
|
| 2022 |
|
|
|
|
|
|
|
|
|
|
|
|
|
|
|
587 |
|
|
1,018 |
|
|
1,119 |
|
|
85.2 |
% |
|
|
| 2023 |
|
|
|
|
|
|
|
|
|
|
|
|
|
|
|
|
|
562 |
|
|
1,065 |
|
|
76.5 |
% |
|
|
| 2024 |
|
|
|
|
|
|
|
|
|
|
|
|
|
|
|
|
|
|
|
678 |
|
|
42.6 |
% |
|
|
|
|
|
|
|
|
|
|
|
|
|
|
|
|
|
|
|
|
Total |
|
$ |
8,808 |
|
|
|
|
|
|
|
|
|
|
|
|
|
Unpaid losses and LAE — years 2015 through 2024 |
|
1,674 |
|
|
|
|
|
|
|
|
|
Unpaid losses and LAE — 11th year and prior (excluding unallocated LAE) |
|
22 |
|
|
|
|
|
|
|
|
|
Unpaid losses and LAE, net of reinsurance (excluding unallocated LAE) |
|
$ |
1,696 |
|
|
|
|
|
|
|
|
|
|
|
|
|
|
|
|
|
|
|
|
|
|
|
|
|
|
|
|
|
|
|
|
|
|
|
|
|
|
|
|
|
|
|
|
|
|
|
|
|
|
|
|
|
|
|
|
|
|
|
|
|
|
|
|
|
|
|
|
|
|
|
|
|
|
|
|
|
|
|
|
|
|
Average Annual Percentage Payout of Incurred Claims by Age, Net of Reinsurance
(Supplementary Information and Unaudited) |
|
|
|
|
|
|
Year 1 |
|
Year 2 |
|
Year 3 |
|
Year 4 |
|
Year 5 |
|
Year 6 |
|
Year 7 |
|
Year 8 |
|
Year 9 |
|
Year 10 |
|
|
|
|
| Annual |
|
45.1 |
% |
|
31.3 |
% |
|
8.3 |
% |
|
5.5 |
% |
|
3.7 |
% |
|
2.2 |
% |
|
1.3 |
% |
|
1.0 |
% |
|
0.5 |
% |
|
0.1 |
% |
|
|
|
|
| Cumulative |
|
45.1 |
% |
|
76.4 |
% |
|
84.7 |
% |
|
90.2 |
% |
|
93.9 |
% |
|
96.1 |
% |
|
97.4 |
% |
|
98.4 |
% |
|
98.9 |
% |
|
99.0 |
% |
|
|
|
|
(a)Represents the cumulative percentage paid of incurred claims and allocated LAE (net of reinsurance, as estimated at December 31, 2024).
AMERICAN FINANCIAL GROUP, INC. AND SUBSIDIARIES
NOTES TO CONSOLIDATED FINANCIAL STATEMENTS — CONTINUED
|
|
|
|
|
|
|
|
|
|
|
|
|
|
|
|
|
|
|
|
|
|
|
|
|
|
|
|
|
|
|
|
|
|
|
|
|
|
|
|
|
|
|
|
|
|
|
|
|
|
|
|
|
|
|
|
|
|
|
|
|
|
|
|
|
|
|
|
|
|
|
|
|
|
|
| Specialty casualty |
|
|
|
|
|
|
|
|
|
|
|
|
|
|
|
|
|
|
| (Dollars in Millions) |
|
|
|
|
|
|
|
|
|
|
|
|
|
|
|
|
|
|
|
|
|
|
|
|
|
|
|
|
|
|
|
|
|
|
|
|
|
|
|
|
|
|
|
|
|
Incurred Claims and Allocated LAE, Net of Reinsurance |
|
As of December 31, 2024 |
|
|
For the Years Ended (2015–2023 is Supplementary Information and Unaudited) |
|
Total IBNR Plus Expected Development on Reported Claims |
|
Cumulative Number of Reported Claims |
| Accident Year |
|
2015 |
|
2016 |
|
2017 |
|
2018 |
|
2019 |
|
2020 |
|
2021 |
|
2022 |
|
2023 |
|
2024 |
|
|
| 2015 |
|
$ |
1,081 |
|
|
$ |
1,043 |
|
|
$ |
1,041 |
|
|
$ |
1,042 |
|
|
$ |
1,024 |
|
|
$ |
1,021 |
|
|
$ |
1,015 |
|
|
$ |
1,007 |
|
|
$ |
1,002 |
|
|
$ |
1,019 |
|
|
$ |
45 |
|
|
58,641 |
|
| 2016 |
|
|
|
1,131 |
|
|
1,122 |
|
|
1,116 |
|
|
1,101 |
|
|
1,090 |
|
|
1,069 |
|
|
1,046 |
|
|
1,036 |
|
|
1,035 |
|
|
57 |
|
|
56,831 |
|
| 2017 |
|
|
|
|
|
1,211 |
|
|
1,221 |
|
|
1,204 |
|
|
1,189 |
|
|
1,162 |
|
|
1,139 |
|
|
1,139 |
|
|
1,149 |
|
|
88 |
|
|
57,492 |
|
| 2018 |
|
|
|
|
|
|
|
1,277 |
|
|
1,307 |
|
|
1,302 |
|
|
1,262 |
|
|
1,269 |
|
|
1,264 |
|
|
1,263 |
|
|
137 |
|
|
59,615 |
|
| 2019 |
|
|
|
|
|
|
|
|
|
1,308 |
|
|
1,311 |
|
|
1,322 |
|
|
1,280 |
|
|
1,284 |
|
|
1,286 |
|
|
178 |
|
|
60,028 |
|
| 2020 |
|
|
|
|
|
|
|
|
|
|
|
1,352 |
|
|
1,329 |
|
|
1,258 |
|
|
1,232 |
|
|
1,232 |
|
|
225 |
|
|
54,632 |
|
| 2021 |
|
|
|
|
|
|
|
|
|
|
|
|
|
1,384 |
|
|
1,389 |
|
|
1,342 |
|
|
1,319 |
|
|
349 |
|
|
56,929 |
|
| 2022 |
|
|
|
|
|
|
|
|
|
|
|
|
|
|
|
1,475 |
|
|
1,503 |
|
|
1,516 |
|
|
497 |
|
|
59,184 |
|
| 2023 |
|
|
|
|
|
|
|
|
|
|
|
|
|
|
|
|
|
1,648 |
|
|
1,670 |
|
|
764 |
|
|
62,764 |
|
| 2024 |
|
|
|
|
|
|
|
|
|
|
|
|
|
|
|
|
|
|
|
1,685 |
|
|
1,067 |
|
|
55,113 |
|
|
|
|
|
|
|
|
|
|
|
|
|
|
|
|
|
|
|
Total |
|
$ |
13,174 |
|
|
|
|
|
|
|
|
|
|
|
|
|
|
|
|
|
|
|
|
|
|
|
|
|
|
|
|
|
|
|
|
|
|
|
|
|
|
|
|
|
|
|
|
|
|
|
|
|
|
|
|
|
|
|
|
|
|
|
|
|
|
|
|
|
|
|
|
|
|
|
|
|
|
|
|
|
|
|
|
|
|
Cumulative Paid Claims and Allocated LAE, Net of Reinsurance |
|
|
|
|
| Accident Year |
|
For the Years Ended (2015–2023 is Supplementary Information and Unaudited) |
|
|
|
|
|
2015 |
|
2016 |
|
2017 |
|
2018 |
|
2019 |
|
2020 |
|
2021 |
|
2022 |
|
2023 |
|
2024 |
|
% (a) |
|
|
| 2015 |
|
$ |
178 |
|
|
$ |
411 |
|
|
$ |
577 |
|
|
$ |
702 |
|
|
$ |
792 |
|
|
$ |
844 |
|
|
$ |
888 |
|
|
$ |
913 |
|
|
$ |
934 |
|
|
$ |
946 |
|
|
92.8 |
% |
|
|
| 2016 |
|
|
|
186 |
|
|
418 |
|
|
584 |
|
|
713 |
|
|
806 |
|
|
870 |
|
|
906 |
|
|
938 |
|
|
951 |
|
|
91.9 |
% |
|
|
| 2017 |
|
|
|
|
|
200 |
|
|
422 |
|
|
612 |
|
|
755 |
|
|
833 |
|
|
902 |
|
|
959 |
|
|
1,007 |
|
|
87.6 |
% |
|
|
| 2018 |
|
|
|
|
|
|
|
210 |
|
|
475 |
|
|
649 |
|
|
794 |
|
|
901 |
|
|
991 |
|
|
1,046 |
|
|
82.8 |
% |
|
|
| 2019 |
|
|
|
|
|
|
|
|
|
212 |
|
|
455 |
|
|
651 |
|
|
795 |
|
|
913 |
|
|
994 |
|
|
77.3 |
% |
|
|
| 2020 |
|
|
|
|
|
|
|
|
|
|
|
188 |
|
|
446 |
|
|
613 |
|
|
757 |
|
|
887 |
|
|
72.0 |
% |
|
|
| 2021 |
|
|
|
|
|
|
|
|
|
|
|
|
|
191 |
|
|
438 |
|
|
625 |
|
|
794 |
|
|
60.2 |
% |
|
|
| 2022 |
|
|
|
|
|
|
|
|
|
|
|
|
|
|
|
198 |
|
|
507 |
|
|
771 |
|
|
50.9 |
% |
|
|
| 2023 |
|
|
|
|
|
|
|
|
|
|
|
|
|
|
|
|
|
248 |
|
|
596 |
|
|
35.7 |
% |
|
|
| 2024 |
|
|
|
|
|
|
|
|
|
|
|
|
|
|
|
|
|
|
|
267 |
|
|
15.8 |
% |
|
|
|
|
|
|
|
|
|
|
|
|
|
|
|
|
|
|
|
|
Total |
|
$ |
8,259 |
|
|
|
|
|
|
|
|
|
|
|
|
|
Unpaid losses and LAE — years 2015 through 2024 |
|
4,915 |
|
|
|
|
|
|
|
|
|
Unpaid losses and LAE — 11th year and prior (excluding unallocated LAE) |
|
351 |
|
|
|
|
|
|
|
|
|
Unpaid losses and LAE, net of reinsurance (excluding unallocated LAE) |
|
$ |
5,266 |
|
|
|
|
|
|
|
|
|
|
|
|
|
|
|
|
|
|
|
|
|
|
|
|
|
|
|
|
|
|
|
|
|
|
|
|
|
|
|
|
|
|
|
|
|
|
|
|
|
|
|
|
|
|
|
|
|
|
|
|
|
|
|
|
|
|
|
|
|
|
|
|
|
|
|
|
|
|
|
|
|
|
Average Annual Percentage Payout of Incurred Claims by Age, Net of Reinsurance
(Supplementary Information and Unaudited) |
|
|
|
|
|
|
Year 1 |
|
Year 2 |
|
Year 3 |
|
Year 4 |
|
Year 5 |
|
Year 6 |
|
Year 7 |
|
Year 8 |
|
Year 9 |
|
Year 10 |
|
|
|
|
| Annual |
|
15.9 |
% |
|
20.6 |
% |
|
15.4 |
% |
|
12.1 |
% |
|
8.8 |
% |
|
6.1 |
% |
|
4.3 |
% |
|
3.2 |
% |
|
1.7 |
% |
|
1.2 |
% |
|
|
|
|
| Cumulative |
|
15.9 |
% |
|
36.5 |
% |
|
51.9 |
% |
|
64.0 |
% |
|
72.8 |
% |
|
78.9 |
% |
|
83.2 |
% |
|
86.4 |
% |
|
88.1 |
% |
|
89.3 |
% |
|
|
|
|
(a)Represents the cumulative percentage paid of incurred claims and allocated LAE (net of reinsurance, as estimated at December 31, 2024).
AMERICAN FINANCIAL GROUP, INC. AND SUBSIDIARIES
NOTES TO CONSOLIDATED FINANCIAL STATEMENTS — CONTINUED
|
|
|
|
|
|
|
|
|
|
|
|
|
|
|
|
|
|
|
|
|
|
|
|
|
|
|
|
|
|
|
|
|
|
|
|
|
|
|
|
|
|
|
|
|
|
|
|
|
|
|
|
|
|
|
|
|
|
|
|
|
|
|
|
|
|
|
|
|
|
|
|
|
|
|
| Specialty financial |
|
|
|
|
|
|
|
|
|
|
|
|
|
|
|
|
|
|
| (Dollars in Millions) |
|
|
|
|
|
|
|
|
|
|
|
|
|
|
|
|
|
|
|
|
|
|
|
|
|
|
|
|
|
|
|
|
|
|
|
|
|
|
|
|
|
|
|
Incurred Claims and Allocated LAE, Net of Reinsurance |
|
As of December 31, 2024 |
|
|
For the Years Ended (2015–2023 is Supplementary Information and Unaudited) |
|
Total IBNR Plus Expected Development on Reported Claims |
|
Cumulative Number of Reported Claims |
| Accident Year |
|
2015 |
|
2016 |
|
2017 |
|
2018 |
|
2019 |
|
2020 |
|
2021 |
|
2022 |
|
2023 |
|
2024 |
|
|
| 2015 |
|
$ |
156 |
|
|
$ |
160 |
|
|
$ |
158 |
|
|
$ |
153 |
|
|
$ |
145 |
|
|
$ |
138 |
|
|
$ |
136 |
|
|
$ |
135 |
|
|
$ |
133 |
|
|
$ |
133 |
|
|
$ |
— |
|
|
37,631 |
|
| 2016 |
|
|
|
179 |
|
|
184 |
|
|
187 |
|
|
182 |
|
|
174 |
|
|
170 |
|
|
173 |
|
|
172 |
|
|
172 |
|
|
— |
|
|
45,186 |
|
| 2017 |
|
|
|
|
|
212 |
|
|
215 |
|
|
212 |
|
|
208 |
|
|
203 |
|
|
202 |
|
|
210 |
|
|
210 |
|
|
5 |
|
|
48,843 |
|
| 2018 |
|
|
|
|
|
|
|
212 |
|
|
217 |
|
|
219 |
|
|
207 |
|
|
201 |
|
|
198 |
|
|
197 |
|
|
5 |
|
|
46,813 |
|
| 2019 |
|
|
|
|
|
|
|
|
|
194 |
|
|
198 |
|
|
191 |
|
|
186 |
|
|
182 |
|
|
178 |
|
|
4 |
|
|
41,970 |
|
| 2020 |
|
|
|
|
|
|
|
|
|
|
|
231 |
|
|
215 |
|
|
202 |
|
|
193 |
|
|
191 |
|
|
12 |
|
|
29,772 |
|
| 2021 |
|
|
|
|
|
|
|
|
|
|
|
|
|
223 |
|
|
201 |
|
|
187 |
|
|
179 |
|
|
16 |
|
|
27,467 |
|
| 2022 |
|
|
|
|
|
|
|
|
|
|
|
|
|
|
|
243 |
|
|
234 |
|
|
222 |
|
|
29 |
|
|
24,054 |
|
| 2023 |
|
|
|
|
|
|
|
|
|
|
|
|
|
|
|
|
|
310 |
|
|
329 |
|
|
75 |
|
|
24,393 |
|
| 2024 |
|
|
|
|
|
|
|
|
|
|
|
|
|
|
|
|
|
|
|
383 |
|
|
157 |
|
|
20,590 |
|
|
|
|
|
|
|
|
|
|
|
|
|
|
|
|
|
|
|
Total |
|
$ |
2,194 |
|
|
|
|
|
|
|
|
|
|
|
|
|
|
|
|
|
|
|
|
|
|
|
|
|
|
|
|
|
|
|
|
|
|
|
|
|
|
|
|
|
|
|
|
|
|
|
|
|
|
|
|
|
|
|
|
|
|
|
|
|
|
|
|
|
|
|
|
|
|
|
|
|
|
|
|
|
|
|
|
|
|
Cumulative Paid Claims and Allocated LAE, Net of Reinsurance |
|
|
|
|
| Accident Year |
|
For the Years Ended (2015–2023 is Supplementary Information and Unaudited) |
|
|
|
|
|
2015 |
|
2016 |
|
2017 |
|
2018 |
|
2019 |
|
2020 |
|
2021 |
|
2022 |
|
2023 |
|
2024 |
|
% (a) |
|
|
| 2015 |
|
$ |
72 |
|
|
$ |
110 |
|
|
$ |
129 |
|
|
$ |
133 |
|
|
$ |
132 |
|
|
$ |
134 |
|
|
$ |
134 |
|
|
$ |
134 |
|
|
$ |
133 |
|
|
$ |
132 |
|
|
99.2 |
% |
|
|
| 2016 |
|
|
|
88 |
|
|
141 |
|
|
158 |
|
|
161 |
|
|
163 |
|
|
164 |
|
|
171 |
|
|
172 |
|
|
172 |
|
|
100.0 |
% |
|
|
| 2017 |
|
|
|
|
|
120 |
|
|
169 |
|
|
186 |
|
|
194 |
|
|
193 |
|
|
192 |
|
|
194 |
|
|
196 |
|
|
93.3 |
% |
|
|
| 2018 |
|
|
|
|
|
|
|
112 |
|
|
163 |
|
|
187 |
|
|
188 |
|
|
192 |
|
|
193 |
|
|
193 |
|
|
98.0 |
% |
|
|
| 2019 |
|
|
|
|
|
|
|
|
|
99 |
|
|
146 |
|
|
164 |
|
|
168 |
|
|
170 |
|
|
172 |
|
|
96.6 |
% |
|
|
| 2020 |
|
|
|
|
|
|
|
|
|
|
|
100 |
|
|
144 |
|
|
159 |
|
|
162 |
|
|
167 |
|
|
87.4 |
% |
|
|
| 2021 |
|
|
|
|
|
|
|
|
|
|
|
|
|
98 |
|
|
136 |
|
|
146 |
|
|
156 |
|
|
87.2 |
% |
|
|
| 2022 |
|
|
|
|
|
|
|
|
|
|
|
|
|
|
|
108 |
|
|
164 |
|
|
187 |
|
|
84.2 |
% |
|
|
| 2023 |
|
|
|
|
|
|
|
|
|
|
|
|
|
|
|
|
|
150 |
|
|
230 |
|
|
69.9 |
% |
|
|
| 2024 |
|
|
|
|
|
|
|
|
|
|
|
|
|
|
|
|
|
|
|
176 |
|
|
46.0 |
% |
|
|
|
|
|
|
|
|
|
|
|
|
|
|
|
|
|
|
|
|
Total |
|
$ |
1,781 |
|
|
|
|
|
|
|
|
|
|
|
|
|
Unpaid losses and LAE — years 2015 through 2024 |
|
413 |
|
|
|
|
|
|
|
|
|
Unpaid losses and LAE — 11th year and prior (excluding unallocated LAE) |
|
(8) |
|
|
|
|
|
|
|
|
|
Unpaid losses and LAE, net of reinsurance (excluding unallocated LAE) |
|
$ |
405 |
|
|
|
|
|
|
|
|
|
|
|
|
|
|
|
|
|
|
|
|
|
|
|
|
|
|
|
|
|
|
|
|
|
|
|
|
|
|
|
|
|
|
|
|
|
|
|
|
|
|
|
|
|
|
|
|
|
|
|
|
|
|
|
|
|
|
|
|
|
|
|
|
|
|
|
|
|
|
|
|
|
|
Average Annual Percentage Payout of Incurred Claims by Age, Net of Reinsurance
(Supplementary Information and Unaudited) |
|
|
|
|
|
|
Year 1 |
|
Year 2 |
|
Year 3 |
|
Year 4 |
|
Year 5 |
|
Year 6 |
|
Year 7 |
|
Year 8 |
|
Year 9 |
|
Year 10 |
|
|
|
|
| Annual |
|
52.2 |
% |
|
25.4 |
% |
|
9.8 |
% |
|
2.6 |
% |
|
1.0 |
% |
|
0.6 |
% |
|
1.3 |
% |
|
0.5 |
% |
|
(0.4 |
%) |
|
(0.8 |
%) |
|
|
|
|
| Cumulative |
|
52.2 |
% |
|
77.6 |
% |
|
87.4 |
% |
|
90.0 |
% |
|
91.0 |
% |
|
91.6 |
% |
|
92.9 |
% |
|
93.4 |
% |
|
93.0 |
% |
|
92.2 |
% |
|
|
|
|
(a)Represents the cumulative percentage paid of incurred claims and allocated LAE (net of reinsurance, as estimated at December 31, 2024).
AMERICAN FINANCIAL GROUP, INC. AND SUBSIDIARIES
NOTES TO CONSOLIDATED FINANCIAL STATEMENTS — CONTINUED
|
|
|
|
|
|
|
|
|
|
|
|
|
|
|
|
|
|
|
|
|
|
|
|
|
|
|
|
|
|
|
|
|
|
|
|
|
|
|
|
|
|
|
|
|
|
|
|
|
|
|
|
|
|
|
|
|
|
|
|
|
|
|
|
|
|
|
|
|
|
|
|
|
|
|
| Other specialty |
|
|
|
|
|
|
|
|
|
|
|
|
|
|
|
|
|
|
| (Dollars in Millions) |
|
|
|
|
|
|
|
|
|
|
|
|
|
|
|
|
|
|
|
|
|
|
|
|
|
|
|
|
|
|
|
|
|
|
|
|
|
|
|
|
|
|
|
Incurred Claims and Allocated LAE, Net of Reinsurance |
|
As of December 31, 2024 |
|
|
For the Years Ended (2015–2023 is Supplementary Information and Unaudited) |
|
Total IBNR Plus Expected Development on Reported Claims |
|
Cumulative Number of Reported Claims (a) |
| Accident Year |
|
2015 |
|
2016 |
|
2017 |
|
2018 |
|
2019 |
|
2020 |
|
2021 |
|
2022 |
|
2023 |
|
2024 |
|
|
| 2015 |
|
$ |
59 |
|
|
$ |
60 |
|
|
$ |
63 |
|
|
$ |
66 |
|
|
$ |
76 |
|
|
$ |
82 |
|
|
$ |
84 |
|
|
$ |
87 |
|
|
$ |
87 |
|
|
$ |
88 |
|
|
$ |
2 |
|
|
— |
|
| 2016 |
|
|
|
61 |
|
|
61 |
|
|
65 |
|
|
71 |
|
|
76 |
|
|
77 |
|
|
78 |
|
|
77 |
|
|
77 |
|
|
6 |
|
|
— |
|
| 2017 |
|
|
|
|
|
63 |
|
|
65 |
|
|
70 |
|
|
81 |
|
|
88 |
|
|
95 |
|
|
97 |
|
|
107 |
|
|
7 |
|
|
— |
|
| 2018 |
|
|
|
|
|
|
|
86 |
|
|
90 |
|
|
92 |
|
|
94 |
|
|
100 |
|
|
111 |
|
|
113 |
|
|
14 |
|
|
— |
|
| 2019 |
|
|
|
|
|
|
|
|
|
108 |
|
|
107 |
|
|
108 |
|
|
111 |
|
|
119 |
|
|
134 |
|
|
20 |
|
|
— |
|
| 2020 |
|
|
|
|
|
|
|
|
|
|
|
122 |
|
|
117 |
|
|
129 |
|
|
126 |
|
|
141 |
|
|
29 |
|
|
— |
|
| 2021 |
|
|
|
|
|
|
|
|
|
|
|
|
|
135 |
|
|
141 |
|
|
138 |
|
|
143 |
|
|
52 |
|
|
— |
|
| 2022 |
|
|
|
|
|
|
|
|
|
|
|
|
|
|
|
159 |
|
|
152 |
|
|
153 |
|
|
72 |
|
|
— |
|
| 2023 |
|
|
|
|
|
|
|
|
|
|
|
|
|
|
|
|
|
201 |
|
|
189 |
|
|
104 |
|
|
— |
|
| 2024 |
|
|
|
|
|
|
|
|
|
|
|
|
|
|
|
|
|
|
|
165 |
|
|
132 |
|
|
— |
|
|
|
|
|
|
|
|
|
|
|
|
|
|
|
|
|
|
|
Total |
|
$ |
1,310 |
|
|
|
|
|
|
|
|
|
|
|
|
|
|
|
|
|
|
|
|
|
|
|
|
|
|
|
|
|
|
|
|
|
|
|
|
|
|
|
|
|
|
|
|
|
|
|
|
|
|
|
|
|
|
|
|
|
|
|
|
|
|
|
|
|
|
|
|
|
|
|
|
|
|
|
|
|
|
|
|
|
|
Cumulative Paid Claims and Allocated LAE, Net of Reinsurance |
|
|
|
|
| Accident Year |
|
For the Years Ended (2015–2023 is Supplementary Information and Unaudited) |
|
|
|
|
|
2015 |
|
2016 |
|
2017 |
|
2018 |
|
2019 |
|
2020 |
|
2021 |
|
2022 |
|
2023 |
|
2024 |
|
% (b) |
|
|
| 2015 |
|
$ |
10 |
|
|
$ |
26 |
|
|
$ |
31 |
|
|
$ |
50 |
|
|
$ |
62 |
|
|
$ |
69 |
|
|
$ |
75 |
|
|
$ |
76 |
|
|
$ |
81 |
|
|
$ |
84 |
|
|
95.5 |
% |
|
|
| 2016 |
|
|
|
9 |
|
|
19 |
|
|
31 |
|
|
47 |
|
|
53 |
|
|
60 |
|
|
64 |
|
|
66 |
|
|
68 |
|
|
88.3 |
% |
|
|
| 2017 |
|
|
|
|
|
10 |
|
|
19 |
|
|
30 |
|
|
52 |
|
|
63 |
|
|
76 |
|
|
83 |
|
|
93 |
|
|
86.9 |
% |
|
|
| 2018 |
|
|
|
|
|
|
|
12 |
|
|
23 |
|
|
32 |
|
|
44 |
|
|
60 |
|
|
77 |
|
|
87 |
|
|
77.0 |
% |
|
|
| 2019 |
|
|
|
|
|
|
|
|
|
9 |
|
|
24 |
|
|
49 |
|
|
61 |
|
|
79 |
|
|
95 |
|
|
70.9 |
% |
|
|
| 2020 |
|
|
|
|
|
|
|
|
|
|
|
9 |
|
|
21 |
|
|
44 |
|
|
66 |
|
|
93 |
|
|
66.0 |
% |
|
|
| 2021 |
|
|
|
|
|
|
|
|
|
|
|
|
|
8 |
|
|
27 |
|
|
49 |
|
|
73 |
|
|
51.0 |
% |
|
|
| 2022 |
|
|
|
|
|
|
|
|
|
|
|
|
|
|
|
11 |
|
|
35 |
|
|
67 |
|
|
43.8 |
% |
|
|
| 2023 |
|
|
|
|
|
|
|
|
|
|
|
|
|
|
|
|
|
29 |
|
|
59 |
|
|
31.2 |
% |
|
|
| 2024 |
|
|
|
|
|
|
|
|
|
|
|
|
|
|
|
|
|
|
|
17 |
|
|
10.3 |
% |
|
|
|
|
|
|
|
|
|
|
|
|
|
|
|
|
|
|
|
|
Total |
|
$ |
736 |
|
|
|
|
|
|
|
|
|
|
|
|
|
Unpaid losses and LAE — years 2015 through 2024 |
|
574 |
|
|
|
|
|
|
|
|
|
Unpaid losses and LAE — 11th year and prior (excluding unallocated LAE) |
|
23 |
|
|
|
|
|
|
|
|
|
Unpaid losses and LAE, net of reinsurance (excluding unallocated LAE) |
|
$ |
597 |
|
|
|
|
|
|
|
|
|
|
|
|
|
|
|
|
|
|
|
|
|
|
|
|
|
|
|
|
|
|
|
|
|
|
|
|
|
|
|
|
|
|
|
|
|
|
|
|
|
|
|
|
|
|
|
|
|
|
|
|
|
|
|
|
|
|
|
|
|
|
|
|
|
|
|
|
|
|
|
|
|
|
Average Annual Percentage Payout of Incurred Claims by Age, Net of Reinsurance
(Supplementary Information and Unaudited) |
|
|
|
|
|
|
Year 1 |
|
Year 2 |
|
Year 3 |
|
Year 4 |
|
Year 5 |
|
Year 6 |
|
Year 7 |
|
Year 8 |
|
Year 9 |
|
Year 10 |
|
|
|
|
| Annual |
|
9.5 |
% |
|
12.7 |
% |
|
13.8 |
% |
|
16.4 |
% |
|
13.1 |
% |
|
11.2 |
% |
|
6.9 |
% |
|
4.4 |
% |
|
4.1 |
% |
|
3.4 |
% |
|
|
|
|
| Cumulative |
|
9.5 |
% |
|
22.2 |
% |
|
36.0 |
% |
|
52.4 |
% |
|
65.5 |
% |
|
76.7 |
% |
|
83.6 |
% |
|
88.0 |
% |
|
92.1 |
% |
|
95.5 |
% |
|
|
|
|
(a)The amounts shown in Other specialty represent business assumed by AFG’s internal reinsurance program from the operations that make up AFG’s other Specialty property and casualty insurance sub-segments. Accordingly, the liability for incurred claims and allocated LAE represents additional reserves held on claims counted in the tables provided for the other sub-segments (above).
(b)Represents the cumulative percentage paid of incurred claims and allocated LAE (net of reinsurance, as estimated at December 31, 2024).
AMERICAN FINANCIAL GROUP, INC. AND SUBSIDIARIES
NOTES TO CONSOLIDATED FINANCIAL STATEMENTS — CONTINUED
|
|
|
|
|
|
|
|
|
|
|
|
|
|
|
|
|
|
|
|
|
|
|
|
|
|
|
|
|
|
|
|
|
|
|
|
|
|
|
|
|
|
|
|
|
|
|
|
|
|
|
|
|
|
|
|
|
|
|
|
|
|
|
|
|
|
|
|
|
|
|
|
|
|
|
| Total Specialty Group |
|
|
|
|
|
|
|
|
|
|
|
|
|
|
|
|
|
|
| (Dollars in Millions) |
|
|
|
|
|
|
|
|
|
|
|
|
|
|
|
|
|
|
|
|
|
|
|
|
|
|
|
|
|
|
|
|
|
|
|
|
|
|
|
|
|
|
|
Incurred Claims and Allocated LAE, Net of Reinsurance |
|
As of December 31, 2024 |
|
|
For the Years Ended (2015–2023 is Supplementary Information and Unaudited) |
|
Total IBNR Plus Expected Development on Reported Claims |
|
Cumulative Number of Reported Claims |
| Accident Year |
|
2015 |
|
2016 |
|
2017 |
|
2018 |
|
2019 |
|
2020 |
|
2021 |
|
2022 |
|
2023 |
|
2024 |
|
|
| 2015 |
|
$ |
2,114 |
|
|
$ |
2,047 |
|
|
$ |
2,041 |
|
|
$ |
2,038 |
|
|
$ |
2,022 |
|
|
$ |
2,013 |
|
|
$ |
2,003 |
|
|
$ |
1,998 |
|
|
$ |
1,991 |
|
|
$ |
2,009 |
|
|
$ |
50 |
|
|
231,366 |
|
| 2016 |
|
|
|
2,117 |
|
|
2,083 |
|
|
2,082 |
|
|
2,060 |
|
|
2,034 |
|
|
2,004 |
|
|
1,986 |
|
|
1,974 |
|
|
1,970 |
|
|
68 |
|
|
223,427 |
|
| 2017 |
|
|
|
|
|
2,375 |
|
|
2,348 |
|
|
2,329 |
|
|
2,301 |
|
|
2,269 |
|
|
2,256 |
|
|
2,266 |
|
|
2,283 |
|
|
107 |
|
|
247,358 |
|
| 2018 |
|
|
|
|
|
|
|
2,507 |
|
|
2,516 |
|
|
2,499 |
|
|
2,439 |
|
|
2,452 |
|
|
2,449 |
|
|
2,451 |
|
|
165 |
|
|
237,209 |
|
| 2019 |
|
|
|
|
|
|
|
|
|
2,721 |
|
|
2,674 |
|
|
2,672 |
|
|
2,632 |
|
|
2,642 |
|
|
2,657 |
|
|
220 |
|
|
256,368 |
|
| 2020 |
|
|
|
|
|
|
|
|
|
|
|
2,748 |
|
|
2,635 |
|
|
2,546 |
|
|
2,500 |
|
|
2,512 |
|
|
288 |
|
|
206,650 |
|
| 2021 |
|
|
|
|
|
|
|
|
|
|
|
|
|
2,861 |
|
|
2,754 |
|
|
2,689 |
|
|
2,669 |
|
|
467 |
|
|
208,142 |
|
| 2022 |
|
|
|
|
|
|
|
|
|
|
|
|
|
|
|
3,270 |
|
|
3,205 |
|
|
3,204 |
|
|
698 |
|
|
221,140 |
|
| 2023 |
|
|
|
|
|
|
|
|
|
|
|
|
|
|
|
|
|
3,631 |
|
|
3,580 |
|
|
1,121 |
|
|
230,821 |
|
| 2024 |
|
|
|
|
|
|
|
|
|
|
|
|
|
|
|
|
|
|
|
3,825 |
|
|
1,775 |
|
|
232,071 |
|
|
|
|
|
|
|
|
|
|
|
|
|
|
|
|
|
|
|
Total |
|
$ |
27,160 |
|
|
|
|
|
|
|
|
|
|
|
|
|
|
|
|
|
|
|
|
|
|
|
|
|
|
|
|
|
|
|
|
|
|
|
|
|
|
|
|
|
|
|
|
|
|
|
|
|
|
|
|
|
|
|
|
|
|
|
|
|
|
|
|
|
|
|
|
|
|
|
|
|
|
|
|
|
|
|
|
|
|
Cumulative Paid Claims and Allocated LAE, Net of Reinsurance |
|
|
|
|
| Accident Year |
|
For the Years Ended (2015–2023 is Supplementary Information and Unaudited) |
|
|
|
|
|
2015 |
|
2016 |
|
2017 |
|
2018 |
|
2019 |
|
2020 |
|
2021 |
|
2022 |
|
2023 |
|
2024 |
|
% (a) |
|
|
| 2015 |
|
$ |
619 |
|
|
$ |
1,129 |
|
|
$ |
1,404 |
|
|
$ |
1,592 |
|
|
$ |
1,722 |
|
|
$ |
1,791 |
|
|
$ |
1,847 |
|
|
$ |
1,878 |
|
|
$ |
1,909 |
|
|
$ |
1,924 |
|
|
95.8 |
% |
|
|
| 2016 |
|
|
|
577 |
|
|
1,099 |
|
|
1,350 |
|
|
1,539 |
|
|
1,662 |
|
|
1,750 |
|
|
1,806 |
|
|
1,848 |
|
|
1,865 |
|
|
94.7 |
% |
|
|
| 2017 |
|
|
|
|
|
709 |
|
|
1,250 |
|
|
1,524 |
|
|
1,736 |
|
|
1,844 |
|
|
1,953 |
|
|
2,030 |
|
|
2,100 |
|
|
92.0 |
% |
|
|
| 2018 |
|
|
|
|
|
|
|
730 |
|
|
1,337 |
|
|
1,606 |
|
|
1,807 |
|
|
1,977 |
|
|
2,099 |
|
|
2,178 |
|
|
88.9 |
% |
|
|
| 2019 |
|
|
|
|
|
|
|
|
|
847 |
|
|
1,448 |
|
|
1,768 |
|
|
1,983 |
|
|
2,160 |
|
|
2,284 |
|
|
86.0 |
% |
|
|
| 2020 |
|
|
|
|
|
|
|
|
|
|
|
758 |
|
|
1,337 |
|
|
1,620 |
|
|
1,842 |
|
|
2,043 |
|
|
81.3 |
% |
|
|
| 2021 |
|
|
|
|
|
|
|
|
|
|
|
|
|
746 |
|
|
1,368 |
|
|
1,687 |
|
|
1,958 |
|
|
73.4 |
% |
|
|
| 2022 |
|
|
|
|
|
|
|
|
|
|
|
|
|
|
|
904 |
|
|
1,724 |
|
|
2,144 |
|
|
66.9 |
% |
|
|
| 2023 |
|
|
|
|
|
|
|
|
|
|
|
|
|
|
|
|
|
989 |
|
|
1,950 |
|
|
54.5 |
% |
|
|
| 2024 |
|
|
|
|
|
|
|
|
|
|
|
|
|
|
|
|
|
|
|
1,138 |
|
|
29.8 |
% |
|
|
|
|
|
|
|
|
|
|
|
|
|
|
|
|
|
|
|
|
Total |
|
$ |
19,584 |
|
|
|
|
|
|
|
|
|
|
|
|
|
Unpaid losses and LAE — years 2015 through 2024 |
|
7,576 |
|
|
|
|
|
|
|
|
|
Unpaid losses and LAE — 11th year and prior (excluding unallocated LAE) |
|
388 |
|
|
|
|
|
|
|
|
|
Unpaid losses and LAE, net of reinsurance (excluding unallocated LAE) |
|
$ |
7,964 |
|
|
|
|
|
|
|
|
|
|
|
|
|
|
|
|
|
|
|
|
|
|
|
|
|
|
|
|
|
|
|
|
|
|
|
|
|
|
|
|
|
|
|
|
|
|
|
|
|
|
|
|
|
|
|
|
|
|
|
|
|
|
|
|
|
|
|
|
|
|
|
|
|
|
|
|
|
|
|
|
|
|
Average Annual Percentage Payout of Incurred Claims by Age, Net of Reinsurance
(Supplementary Information and Unaudited) |
|
|
|
|
|
|
Year 1 |
|
Year 2 |
|
Year 3 |
|
Year 4 |
|
Year 5 |
|
Year 6 |
|
Year 7 |
|
Year 8 |
|
Year 9 |
|
Year 10 |
|
|
|
|
| Annual |
|
29.7 |
% |
|
24.6 |
% |
|
12.2 |
% |
|
9.1 |
% |
|
6.5 |
% |
|
4.5 |
% |
|
3.1 |
% |
|
2.2 |
% |
|
1.2 |
% |
|
0.7 |
% |
|
|
|
|
| Cumulative |
|
29.7 |
% |
|
54.3 |
% |
|
66.5 |
% |
|
75.6 |
% |
|
82.1 |
% |
|
86.6 |
% |
|
89.7 |
% |
|
91.9 |
% |
|
93.1 |
% |
|
93.8 |
% |
|
|
|
|
(a)Represents the cumulative percentage paid of incurred claims and allocated LAE (net of reinsurance, as estimated at December 31, 2024).
AMERICAN FINANCIAL GROUP, INC. AND SUBSIDIARIES
NOTES TO CONSOLIDATED FINANCIAL STATEMENTS — CONTINUED
Deferred Policy Acquisition Costs Included in commissions and other underwriting expenses in AFG’s Statement of Earnings is amortization of deferred policy acquisition costs of $766 million, $720 million, and $641 million in 2024, 2023 and 2022, respectively.
Statutory Information AFG’s U.S.-based insurance subsidiaries are required to file financial statements with state insurance regulatory authorities prepared on an accounting basis prescribed or permitted by such authorities (statutory basis). Net earnings and capital and surplus on a statutory basis for the insurance subsidiaries were as follows (in millions):
|
|
|
|
|
|
|
|
|
|
|
|
|
|
|
|
|
|
|
|
|
|
|
|
|
|
|
|
|
|
| |
Net Earnings |
|
Capital and Surplus |
| |
2024 |
|
2023 |
|
2022 |
|
2024 |
|
2023 |
| Property and casualty companies |
$ |
974 |
|
|
$ |
1,004 |
|
|
$ |
912 |
|
|
$ |
4,614 |
|
|
$ |
4,436 |
|
The National Association of Insurance Commissioners’ (“NAIC”) model law for risk-based capital (“RBC”) applies to property and casualty insurance companies. RBC formulas determine the amount of capital that an insurance company needs so that it has an acceptable expectation of not becoming financially impaired. Companies below specific trigger points or ratios are subject to regulatory action. At December 31, 2024 and 2023, the capital ratios of all AFG insurance companies substantially exceeded the RBC requirements. AFG’s insurance companies did not use any prescribed or permitted statutory accounting practices that differed from the NAIC statutory accounting practices at December 31, 2024 or 2023.
Payments of dividends by AFG’s insurance companies are subject to various state laws that limit the amount of dividends that can be paid. Under applicable restrictions, the maximum amount of dividends available to AFG in 2025 from its insurance subsidiaries without seeking regulatory approval is $1.00 billion. Additional amounts of dividends require regulatory approval.
Holding Company Dividends AFG declared and paid common stock dividends to shareholders totaling $791 million, $687 million and $1.22 billion in 2024, 2023 and 2022, respectively. Currently, there are no regulatory restrictions on AFG’s retained earnings or net earnings that materially impact its ability to pay dividends. Based on shareholders’ equity at December 31, 2024, AFG could pay dividends of approximately $1.62 billion without violating its most restrictive debt covenant. However, the payment of future dividends will be at the discretion of AFG’s Board of Directors and will be dependent on many factors including AFG’s financial condition and results of operations, the capital requirements of its insurance subsidiaries, and rating agency commitments.
Reinsurance In the normal course of business, AFG cedes reinsurance to other companies to diversify risk and limit maximum loss arising from large claims. However, AFG remains liable to its insureds regardless of whether a reinsurer is able to meet its obligations. The following table shows (in millions) (i) amounts deducted from written and earned premiums in connection with reinsurance ceded, (ii) written and earned premiums included in income for reinsurance assumed and (iii) reinsurance recoveries, which represent ceded losses and loss adjustment expenses.
|
|
|
|
|
|
|
|
|
|
|
|
|
|
|
|
|
|
|
2024 |
|
2023 |
|
2022 |
| Direct premiums written |
$ |
9,933 |
|
|
$ |
9,309 |
|
|
$ |
8,774 |
|
| Reinsurance assumed |
600 |
|
|
347 |
|
|
283 |
|
| Reinsurance ceded |
(3,394) |
|
|
(2,964) |
|
|
(2,851) |
|
| Net written premiums |
$ |
7,139 |
|
|
$ |
6,692 |
|
|
$ |
6,206 |
|
|
|
|
|
|
|
| Direct premiums earned |
$ |
9,763 |
|
|
$ |
9,133 |
|
|
$ |
8,582 |
|
| Reinsurance assumed |
611 |
|
|
321 |
|
|
274 |
|
| Reinsurance ceded |
(3,338) |
|
|
(2,923) |
|
|
(2,771) |
|
| Net earned premiums |
$ |
7,036 |
|
|
$ |
6,531 |
|
|
$ |
6,085 |
|
|
|
|
|
|
|
| Reinsurance recoveries |
$ |
3,040 |
|
|
$ |
2,336 |
|
|
$ |
2,065 |
|
AMERICAN FINANCIAL GROUP, INC. AND SUBSIDIARIES
NOTES TO CONSOLIDATED FINANCIAL STATEMENTS — CONTINUED
Recoverables from Reinsurers and Premiums Receivable Progressions of the allowance for expected credit losses on recoverables from reinsurers and premiums receivable are shown below (in millions):
|
|
|
|
|
|
|
|
|
|
|
|
|
|
|
|
|
|
|
|
|
|
|
|
|
|
|
|
|
|
|
|
|
|
|
|
|
Recoverables from Reinsurers |
|
Premiums Receivable |
|
2024 |
|
2023 |
|
2022 |
|
2024 |
|
2023 |
|
2022 |
| Balance at January 1 |
$ |
10 |
|
|
$ |
8 |
|
|
$ |
8 |
|
|
$ |
15 |
|
|
$ |
8 |
|
|
$ |
8 |
|
Increase in allowance from acquisition of CRS |
— |
|
|
— |
|
|
— |
|
|
— |
|
|
4 |
|
|
— |
|
| Provision for expected credit losses |
1 |
|
|
2 |
|
|
— |
|
|
5 |
|
|
3 |
|
|
— |
|
| Write-offs charged against the allowance |
— |
|
|
— |
|
|
— |
|
|
(1) |
|
|
— |
|
|
— |
|
| Balance at December 31 |
$ |
11 |
|
|
$ |
10 |
|
|
$ |
8 |
|
|
$ |
19 |
|
|
$ |
15 |
|
|
$ |
8 |
|
O. Additional Information
Financial Instruments — Unfunded Commitments On occasion, AFG and its subsidiaries have entered into financial instrument transactions that may present off-balance-sheet risks of both a credit and market risk nature. These transactions include commitments to fund loans, loan guarantees and commitments to purchase and sell securities or loans. At December 31, 2024, AFG and its subsidiaries had commitments to fund credit facilities and contribute capital to limited partnerships and limited liability corporations of approximately $578 million.
Benefit Plans AFG expensed approximately $68 million in 2024, $63 million in 2023 and $41 million in 2022 for its retirement and employee savings plans.
PART III
The information required by the following Items will be included in AFG’s definitive Proxy Statement for the 2025 Annual Meeting of Shareholders, which will be filed with the Securities and Exchange Commission within 120 days after the end of the Registrant’s fiscal year and is incorporated herein by reference.
ITEM 10 Directors, Executive Officers of the Registrant and Corporate Governance
ITEM 11 Executive Compensation
ITEM 12 Security Ownership of Certain Beneficial Owners and Management and Related Stockholder Matters
ITEM 13 Certain Relationships and Related Transactions, and Director Independence
ITEM 14 Principal Accountant Fees and Services
PART IV
Item 15. Exhibits and Financial Statement Schedules
|
|
|
|
|
|
|
|
|
|
|
|
|
|
|
|
|
|
|
|
|
| (a) |
Documents filed as part of this Report: |
|
1. |
Financial Statements are included in Part II, Item 8. |
|
|
|
|
2. |
Financial Statement Schedules: |
|
|
|
Schedules filed herewith for 2024, 2023, and 2022: |
|
|
|
|
|
Page |
|
|
|
II — Condensed Financial Information of Registrant |
|
|
|
|
III — Supplementary Insurance Information |
|
|
|
|
|
|
|
|
|
All other schedules for which provisions are made in the applicable regulation of the Securities and Exchange Commission have been omitted as they are not applicable, not required, or the information required thereby is set forth in the Financial Statements or the notes thereto. |
|
|
|
|
|
3. |
Exhibits — See Exhibit Index on the next page. |
|
|
|
INDEX TO EXHIBITS
AMERICAN FINANCIAL GROUP, INC.
|
|
|
|
|
|
|
|
|
|
|
|
|
|
|
|
|
|
|
|
|
| Number |
|
Exhibit Description |
|
|
|
|
Amended and Restated Articles of Incorporation, filed as Exhibit 3.A to AFG’s Form 10-K for 2019. |
|
(*) |
|
|
Amended and Restated Code of Regulations, filed as Exhibit 3.1 to the Form 8-K filed on April 1, 2020. |
|
(*) |
| 4 |
|
Instruments defining the rights of security holders. |
Registrant has no outstanding debt issues exceeding 10% of the assets of Registrant and consolidated subsidiaries. |
|
|
Material Contracts: |
|
|
|
|
|
|
Amended and Restated Non-Employee Directors Compensation Plan, filed as Exhibit 10 to the Form S-8 Registration Statement (File No. 333-184913) filed by AFG on November 13, 2012. |
|
(*) |
|
|
Deferred Compensation Plan Amended and Restated as of January 1, 2022 filed as Exhibit 10 to the Form S-8 Registration Statement (File No. 333-268292) filed by AFG on November 10, 2022. |
|
(*) |
|
|
Annual Senior Executive Bonus Plan |
|
|
|
|
Amended and Restated Nonqualified Auxiliary RASP, filed as Exhibit 10(f) to AFG’s Form 10-K for 2008. |
|
(*) |
|
|
Amended and Restated 2015 Stock Incentive Plan, filed as Exhibit 10.1 to the Form 8-K filed by AFG on May 24, 2024. |
|
(*) |
|
|
Senior Executive Long Term Incentive Compensation Plan, filed as Appendix A to AFG’s Proxy Statement filed on April 1, 2016. |
|
(*) |
|
|
Amended and Restated Credit Agreement entered into among American Financial Group, Inc., the Bank of America, N.A., as Administrative Agent, and several lenders, filed as Exhibit 10.1 to AFG’s Form 8-K filed on June 27, 2023. |
|
(*) |
|
|
AFG Insider Trading Policy |
|
|
|
|
Subsidiaries of the Registrant. |
|
|
|
|
Consent of independent registered public accounting firm. |
|
|
|
|
Certification of Co-Chief Executive Officer pursuant to Section 302(a) of the Sarbanes-Oxley Act of 2002. |
|
|
|
|
Certification of Co-Chief Executive Officer pursuant to Section 302(a) of the Sarbanes-Oxley Act of 2002. |
|
|
|
|
Certification of Chief Financial Officer pursuant to Section 302(a) of the Sarbanes-Oxley Act of 2002. |
|
|
|
|
Certification of Co-Chief Executive Officers and Chief Financial Officer pursuant to Section 906 of the Sarbanes-Oxley Act of 2002. |
|
|
|
|
American Financial Group, Inc. Executive Officer Clawback Policy, filed as Exhibit 97 to AFG’s Form 10-K for 2023. |
|
(*) |
| 101.INS |
|
XBRL Instance Document - the instance document does not appear in the Interactive Data File because its XBRL tags are embedded within the Inline XBRL document. |
|
|
| 101.SCH |
|
Inline XBRL Taxonomy Extension Schema Document. |
|
|
| 101.CAL |
|
Inline XBRL Taxonomy Extension Calculation Linkbase Document. |
|
|
| 101.DEF |
|
Inline XBRL Taxonomy Extension Definition Linkbase Document. |
|
|
| 101.LAB |
|
Inline XBRL Taxonomy Extension Label Linkbase Document. |
|
|
| 101.PRE |
|
Inline XBRL Taxonomy Extension Presentation Linkbase Document. |
|
|
| 104 |
|
Cover Page Interactive Data File (formatted as Inline XBRL and contained in Exhibit 101). |
|
|
|
|
|
|
|
|
|
|
|
|
|
|
|
|
| (*) Incorporated herein by reference. |
|
|
|
|
AMERICAN FINANCIAL GROUP, INC. — PARENT ONLY
SCHEDULE II — CONDENSED FINANCIAL INFORMATION OF REGISTRANT
(In Millions)
Condensed Balance Sheet
|
|
|
|
|
|
|
|
|
|
|
|
| |
December 31, |
| |
2024 |
|
2023 |
| Assets: |
|
|
|
| Cash and cash equivalents |
$ |
283 |
|
|
$ |
268 |
|
| Investment in securities |
42 |
|
|
154 |
|
| Investment in subsidiaries (*) |
5,681 |
|
|
5,396 |
|
| Real estate and other investments |
64 |
|
|
63 |
|
| Other assets |
219 |
|
|
189 |
|
| Total assets |
$ |
6,289 |
|
|
$ |
6,070 |
|
|
|
|
|
| Liabilities and Equity: |
|
|
|
| Long-term debt |
$ |
1,475 |
|
|
$ |
1,475 |
|
| Other liabilities |
348 |
|
|
337 |
|
| Shareholders’ equity |
4,466 |
|
|
4,258 |
|
| Total liabilities and equity |
$ |
6,289 |
|
|
$ |
6,070 |
|
Condensed Statement of Earnings
|
|
|
|
|
|
|
|
|
|
|
|
|
|
|
|
|
|
|
Year ended December 31, |
|
2024 |
|
2023 |
|
2022 |
| Revenues: |
|
|
|
|
|
| Dividends from subsidiaries |
$ |
841 |
|
|
$ |
903 |
|
|
$ |
879 |
|
| Equity in undistributed earnings of subsidiaries |
454 |
|
|
308 |
|
|
405 |
|
| Investment and other income |
28 |
|
|
60 |
|
|
28 |
|
| Total revenues |
1,323 |
|
|
1,271 |
|
|
1,312 |
|
|
|
|
|
|
|
| Costs and Expenses: |
|
|
|
|
|
| Interest charges on intercompany borrowings |
8 |
|
|
8 |
|
|
7 |
|
| Interest charges on other borrowings |
76 |
|
|
76 |
|
|
85 |
|
| Other expenses |
115 |
|
|
114 |
|
|
97 |
|
| Total costs and expenses |
199 |
|
|
198 |
|
|
189 |
|
|
|
|
|
|
|
| Earnings before income taxes |
1,124 |
|
|
1,073 |
|
|
1,123 |
|
| Provision for income taxes |
237 |
|
|
221 |
|
|
225 |
|
Net Earnings |
$ |
887 |
|
|
$ |
852 |
|
|
$ |
898 |
|
Condensed Statement of Comprehensive Income
|
|
|
|
|
|
|
|
|
|
|
|
|
|
|
|
|
|
|
Year ended December 31, |
|
2024 |
|
2023 |
|
2022 |
Net earnings |
$ |
887 |
|
|
$ |
852 |
|
|
$ |
898 |
|
| Other comprehensive income (loss), net of tax |
79 |
|
|
224 |
|
|
(662) |
|
Total comprehensive income, net of tax |
$ |
966 |
|
|
$ |
1,076 |
|
|
$ |
236 |
|
________________________
(*)Investment in subsidiaries includes intercompany receivables and payables.
AMERICAN FINANCIAL GROUP, INC. — PARENT ONLY
SCHEDULE II — CONDENSED FINANCIAL INFORMATION OF REGISTRANT — CONTINUED
(In Millions)
Condensed Statement of Cash Flows
|
|
|
|
|
|
|
|
|
|
|
|
|
|
|
|
|
|
|
Year ended December 31, |
|
2024 |
|
2023 |
|
2022 |
| Operating Activities: |
|
|
|
|
|
Net earnings |
$ |
887 |
|
|
$ |
852 |
|
|
$ |
898 |
|
| Adjustments: |
|
|
|
|
|
| Equity in net earnings of subsidiaries |
(1,030) |
|
|
(967) |
|
|
(1,030) |
|
| Dividends from subsidiaries |
812 |
|
|
896 |
|
|
539 |
|
| Other operating activities, net |
43 |
|
|
(62) |
|
|
(80) |
|
| Net cash provided by operating activities |
712 |
|
|
719 |
|
|
327 |
|
|
|
|
|
|
|
| Investing Activities: |
|
|
|
|
|
| Capital contributions to subsidiaries |
(36) |
|
|
(180) |
|
|
(26) |
|
| Returns of capital from subsidiaries |
30 |
|
|
7 |
|
|
29 |
|
|
|
|
|
|
|
Purchases of investments, property and equipment |
(55) |
|
|
(35) |
|
|
(223) |
|
|
|
|
|
|
|
| Proceeds from: |
|
|
|
|
|
| Maturities and redemptions of investments |
129 |
|
|
255 |
|
|
556 |
|
| Sales of investments, property and equipment |
4 |
|
|
178 |
|
|
656 |
|
|
|
|
|
|
|
|
|
|
|
|
|
Net cash provided by investing activities |
72 |
|
|
225 |
|
|
992 |
|
|
|
|
|
|
|
| Financing Activities: |
|
|
|
|
|
|
|
|
|
|
|
| Reductions of long-term debt |
— |
|
|
(21) |
|
|
(477) |
|
| Issuances of Common Stock |
19 |
|
|
17 |
|
|
18 |
|
| Repurchases of Common Stock |
— |
|
|
(213) |
|
|
(11) |
|
| Cash dividends paid on Common Stock |
(788) |
|
|
(684) |
|
|
(1,213) |
|
|
|
|
|
|
|
| Net cash used in financing activities |
(769) |
|
|
(901) |
|
|
(1,683) |
|
|
|
|
|
|
|
| Net Change in Cash and Cash Equivalents |
15 |
|
|
43 |
|
|
(364) |
|
| Cash and cash equivalents at beginning of year |
268 |
|
|
225 |
|
|
589 |
|
| Cash and cash equivalents at end of year |
$ |
283 |
|
|
$ |
268 |
|
|
$ |
225 |
|
AMERICAN FINANCIAL GROUP, INC. AND SUBSIDIARIES
SCHEDULE III — SUPPLEMENTARY INSURANCE INFORMATION
THREE YEARS ENDED DECEMBER 31, 2024
(In Millions)
|
|
|
|
|
|
|
|
|
|
|
|
|
|
|
|
|
|
|
|
|
|
|
|
|
|
|
|
|
|
|
|
|
|
|
|
|
|
|
|
|
|
|
|
|
|
|
|
|
|
|
|
|
|
|
|
|
| Segment |
|
Deferred policy acquisition costs |
|
Reserves for claims and unpaid losses and LAE |
|
Unearned premiums |
|
Net earned premiums |
|
Net investment income |
|
Claims, losses and settlement expenses |
|
Amortization of deferred policy acquisition costs |
|
Other operating expenses |
|
Net written premiums |
| 2024 |
|
|
|
|
|
|
|
|
|
|
|
|
|
|
|
|
|
|
Property and casualty insurance |
|
$ |
320 |
|
|
$ |
14,179 |
|
|
$ |
3,584 |
|
|
$ |
7,036 |
|
|
$ |
784 |
|
|
$ |
4,455 |
|
|
$ |
766 |
|
|
$ |
1,279 |
|
|
$ |
7,139 |
|
| Other |
|
— |
|
|
— |
|
|
— |
|
|
— |
|
|
(4) |
|
|
5 |
|
|
— |
|
|
695 |
|
|
— |
|
| Total |
|
$ |
320 |
|
|
$ |
14,179 |
|
|
$ |
3,584 |
|
|
$ |
7,036 |
|
|
$ |
780 |
|
|
$ |
4,460 |
|
|
$ |
766 |
|
|
$ |
1,974 |
|
|
$ |
7,139 |
|
|
|
|
|
|
|
|
|
|
|
|
|
|
|
|
|
|
|
|
| 2023 |
|
|
|
|
|
|
|
|
|
|
|
|
|
|
|
|
|
|
Property and casualty insurance |
|
$ |
309 |
|
|
$ |
13,087 |
|
|
$ |
3,451 |
|
|
$ |
6,531 |
|
|
$ |
729 |
|
|
$ |
4,017 |
|
|
$ |
720 |
|
|
$ |
1,235 |
|
|
$ |
6,692 |
|
| Other |
|
— |
|
|
— |
|
|
— |
|
|
— |
|
|
13 |
|
|
16 |
|
|
— |
|
|
766 |
|
|
— |
|
| Total |
|
$ |
309 |
|
|
$ |
13,087 |
|
|
$ |
3,451 |
|
|
$ |
6,531 |
|
|
$ |
742 |
|
|
$ |
4,033 |
|
|
$ |
720 |
|
|
$ |
2,001 |
|
|
$ |
6,692 |
|
|
|
|
|
|
|
|
|
|
|
|
|
|
|
|
|
|
|
|
| 2022 |
|
|
|
|
|
|
|
|
|
|
|
|
|
|
|
|
|
|
Property and casualty insurance |
|
$ |
288 |
|
|
$ |
11,974 |
|
|
$ |
3,246 |
|
|
$ |
6,085 |
|
|
$ |
683 |
|
|
$ |
3,629 |
|
|
$ |
641 |
|
|
$ |
1,091 |
|
|
$ |
6,206 |
|
| Other |
|
— |
|
|
— |
|
|
— |
|
|
— |
|
|
34 |
|
|
— |
|
|
— |
|
|
556 |
|
|
— |
|
| Total |
|
$ |
288 |
|
|
$ |
11,974 |
|
|
$ |
3,246 |
|
|
$ |
6,085 |
|
|
$ |
717 |
|
|
$ |
3,629 |
|
|
$ |
641 |
|
|
$ |
1,647 |
|
|
$ |
6,206 |
|
Signatures
Pursuant to the requirements of Section 13 or 15(d) of the Securities Exchange Act of 1934, the registrant has duly caused this report to be signed on its behalf by the undersigned, thereunto duly authorized.
|
|
|
|
|
|
|
|
|
|
|
|
|
|
|
|
|
American Financial Group, Inc. |
|
|
|
|
|
|
|
|
|
|
|
| February 25, 2025 |
By: |
|
/s/ Brian S. Hertzman |
|
|
|
Brian S. Hertzman |
|
|
|
Senior Vice President and Chief Financial Officer |
__________________________________________________________________________________________
Pursuant to the requirements of the Securities Exchange Act of 1934, this report has been signed below by the following persons on behalf of the registrant and in the capacities and on the dates indicated:
|
|
|
|
|
|
|
|
|
|
|
|
|
|
|
| Signature |
|
Capacity |
|
Date |
|
|
|
|
|
| /s/ Carl H. Lindner III |
|
Co-Chief Executive Officer and Director |
|
February 25, 2025 |
| Carl H. Lindner III |
|
(Principal Executive Officer) |
|
|
|
|
|
|
|
| /s/ S. Craig Lindner |
|
Co-Chief Executive Officer and Director |
|
February 25, 2025 |
| S. Craig Lindner |
|
(Principal Executive Officer) |
|
|
|
|
|
|
|
| /s/ Brian S. Hertzman |
|
Senior Vice President and Chief Financial Officer |
|
February 25, 2025 |
| Brian S. Hertzman |
|
(Principal Financial and Accounting Officer) |
|
|
|
|
|
|
|
| /s/ John B. Berding |
|
President and Director |
|
February 25, 2025 |
| John B. Berding |
|
|
|
|
|
|
|
|
|
| /s/ James E. Evans |
|
Director |
|
February 25, 2025 |
| James E. Evans |
|
|
|
|
|
|
|
|
|
| /s/ Gregory G. Joseph |
|
Lead Independent Director* |
|
February 25, 2025 |
| Gregory G. Joseph |
|
|
|
|
|
|
|
|
|
| /s/ Mary Beth Martin |
|
Director |
|
February 25, 2025 |
| Mary Beth Martin |
|
|
|
|
|
|
|
|
|
| /s/ Amy Y. Murray |
|
Director* |
|
February 25, 2025 |
| Amy Y. Murray |
|
|
|
|
|
|
|
|
|
/s/ Roger K. Newport |
|
Director* |
|
February 25, 2025 |
Roger K. Newport |
|
|
|
|
|
|
|
|
|
| /s/ Evans N. Nwankwo |
|
Director |
|
February 25, 2025 |
| Evans N. Nwankwo |
|
|
|
|
|
|
|
|
|
| /s/ William W. Verity |
|
Director |
|
February 25, 2025 |
| William W. Verity |
|
|
|
|
|
|
|
|
|
| /s/ John I. Von Lehman |
|
Director* |
|
February 25, 2025 |
| John I. Von Lehman |
|
|
|
|
|
|
|
|
|
|
|
|
|
|
| * Member of the Audit Committee |
|
|
|
EX-10.C
2
afgseniorexecutiveannual.htm
EX-10.C
afgseniorexecutiveannual

SENIOR EXECUTIVE ANNUAL BONUS PLAN

AMERICAN FINANCIAL GROUP, INC. SENIOR EXECUTIVE ANNUAL BONUS PLAN 1. PURPOSE The purpose of the Senior Executive Annual Bonus Plan (the “Plan”) is to further the profitability of American Financial Group, Inc. (the “Company”) to the benefit of the shareholders of the Company through promoting high levels of corporate performance by including performance-based compensation as a component of a Plan participant’s annual compensation. 2. DEFINITIONS When used in the Plan, the following terms have the following meanings. 2.1. “Board” means the Board of Directors of the Company. 2.2. “Bonus Target” means the total target bonus for a Participant under all applicable Performance Criteria for the Bonus Year. 2.3. “Bonus Year” means a calendar year. 2.4. “Change in Control” means: (a) The direct or indirect sale, transfer, conveyance or other disposition (other than by way of merger or consolidation), in one or a series of related transactions, of all or substantially all of the properties or assets of the Company and its Subsidiaries, taken as a whole; (b) The dissolution or liquidation of the Company or any merger, other than a merger for the purpose of the redomestication of the Company (not involving an event set forth in Section 2.4 (c) or (d) below) consolidation, exchange or other transaction in which the Company is not the surviving corporation or in which the outstanding common shares of the Company are converted into cash, other securities or other property; (c) The acquisition of beneficial ownership (as defined in Rule 13d-3 under the Securities Exchange Act of 1934 (the “Exchange Act”)) of 25% or more of the outstanding common shares of the Company by any “person” within the meaning of Section 14(d) of the Exchange Act, excluding for purposes of this Section 2.4(c), the Lindner Family; or (d) during any period of one year after January 1, 2024, individuals who at the beginning of such period constitute the Board and any new director whose election by the Board or nomination for election by the Company’s shareholders was approved by a vote of at least two-thirds (2/3) of the directors then still in office who either were directors at the beginning of the period or whose election or nomination for election was previously so approved, cease for any reason to constitute a majority of the Board. For purposes of this Section 2.4, “Lindner Family” means, collectively, the wife of the late Carl H. Lindner, Jr. and all of the lineal descendants of the late Carl H. Lindner, Jr. and his wife, and the spouses of such lineal descendants, as well as trusts, or family limited partnerships or other entities established by or for the benefit of such persons, and limited liability companies of which the majority of membership interests are held by the estate of the late Carl H. Lindner, Jr., his wife or any of the lineal descendants of the late Carl H. Lindner, Jr. and his wife or the spouses of

- 2- such lineal descendants, or any trusts or family limited partnerships established by or for the benefit of such persons. 2.5. “Code” means the Internal Revenue Code of 1986, as amended. 2.6. “Committee” means the committee appointed by the Board as described under Section 3. 2.7. “Participant” means as to any Bonus Year, the senior executive officers of the Company or a Subsidiary who are designated by the Committee to participate in the Plan for that Bonus Year. 2.8. “Performance Criteria” means the objective targets selected by the Committee to measure performance, the outcome of which is substantially uncertain at the time selected, for a Bonus Year which shall be based upon one or more of the following performance-based business criteria, either on a Company, Subsidiary, division, business unit or line of business basis or in comparison with peer group performance or to an index, as the Committee deems appropriate: net income or operating income; net income per share or operating income per share; aggregate or per-share book value or adjusted book value; written premiums (net or gross); return measures (including, but not limited to, return on assets, investment portfolio, capital, invested capital, equity, sales, or premiums); cash flow (including, but not limited to, operating cash flow, free cash flow, and cash flow return on capital); combined ratios; share price (including, but not limited to, growth measures and total shareholder return); and increase in or maintenance of the Company’s market share. Bonus amounts may also be determined based on the satisfaction of discretionary Performance Criteria of a Participant. In the discretion of the Committee at the time of the annual selection of Performance Criteria for the Bonus Year, any Performance Criteria may be calculated after accounting for specified adjustments. 2.9. “Subsidiary” means a subsidiary of the Company within the meaning of Code Section 424(f). 3. ADMINISTRATION 3.1. Except as otherwise expressly provided in this Plan, the Plan shall be administered by the Compensation Committee or a successor committee or subcommittee of the Board comprised of two or more directors, each of whom shall be (1) a “Non-Employee Director” as defined in Rule 16b-3 promulgated under the Exchange Act, and (2) an “independent director” under rules adopted by the New York Stock Exchange, in each case as such rules and sections may be amended, superseded or interpreted hereafter. 3.2. Subject to the provisions of the Plan (and to the approval of the Board where specified in the Plan), the Committee shall have exclusive power to determine the Performance Criteria applicable to bonuses and all other terms and conditions (including performance requirements) to which the payment of the bonuses may be subject and to certify that Performance Criteria are attained. Subject to the provisions of the Plan, the Committee shall have the authority to interpret the Plan and establish, adopt or revise such rules and regulations and to make all determinations relating to the Plan as it may deem necessary or advisable for the administration of the Plan. The Committee’s interpretation of the Plan and all of its actions and decisions with respect to the Plan shall be final, binding and conclusive on all parties. 3.3. The Committee, in its sole discretion, may delegate all or part of its authority and powers under the Plan to one or more directors and/or officers of the Company; provided, however, that the Committee may not delegate its responsibility to make awards to the Co-Chief Executive Officers. The Committee may appoint agents to assist in administering the Plan. The Committee and each member thereof shall be entitled to, in good faith, rely or act upon any report or other information furnished to it or him by any officer or employee of the Company, the Company's certified public accountants, consultants or any other agent assisting in the administration of the Plan. Members of the Committee and any officer or employee of the Company acting at the direction or on behalf of the Committee shall not be personally liable for any action or determination taken or made in good faith with respect to the Plan, and shall, to

- 3- the extent permitted by law, be fully indemnified and protected by the Company with respect to any such action or determination. The foregoing right of indemnification shall not be exclusive of any other rights of indemnification to which such person may be entitled under the Company’s Articles of Incorporation or Code of Regulations, as a matter of law or otherwise or of any power that the Company may have to indemnify him or hold him harmless. 4. PLAN TERM The Plan shall remain in effect from the date of approval by the Board until terminated or suspended by the Board as provided in Section 11. 5. ESTABLISHMENT OF INDIVIDUAL BONUS TARGETS AND PERFORMANCE CRITERIA The Committee shall approve annually, no later than the 90th day of a Bonus Year, the individual target amount of bonus (the “Bonus Target”) that may be awarded for a Bonus Year to each Participant; the specific Performance Criteria to be used to determine the amount of bonus, if any, to be paid to each Participant for the Bonus Year; and the formula for determining the percentage of a Bonus Target that is payable based upon the achievement of Performance Criteria. The Performance Criteria may differ from and carry a different weight from Participant to Participant. The Bonus Target and Performance Criteria for each Participant for each Bonus Year shall be established in writing by the Committee. 6. DETERMINATION OF BONUSES AND TIME OF PAYMENT As soon as practicable after the end of each Bonus Year, the Committee shall determine whether or not the Performance Criteria of each Participant have been met or exceeded and shall determine the amount of the bonus, if any, to be awarded to each Participant for such year according to the terms of this Plan. The Committee shall certify in writing that the Performance Criteria have been achieved prior to payment of any bonus under the Plan. The payment, if any, of a bonus amount shall take place between February 1 and March 15 following any Bonus Year. The Participant must continue to be employed through the last day of the Bonus Year to be eligible for the bonus. Once the bonus is so determined for each Participant, it shall be paid in cash. The maximum amount which may be awarded to any Participant for any Bonus Year shall be $5,000,000. 7. TERMINATION OF EMPLOYMENT Notwithstanding the requirement to be employed on the last day of the Bonus Year in order to be eligible for payment of the Bonus Amount described in Section 6, if a Participant’s employment with the Company is terminated during a Bonus Year for which Performance Criteria have been attained for any reason other than discharge for “cause,” the Committee, in its sole discretion, may determine that the Participant is entitled to a portion of the Bonus Amount that is determined at the end of the Bonus Year and payable at the time specified in Section 6. This provision only provides discretion in determining whether to waive the employment requirement. In the event the employment requirement is waived, the bonus amount payable shall be a pro rata amount based on the number of months of the Participant’s employment during the Bonus Year with the month of termination counting as a full month of employment. For purposes of the Plan, “cause” shall mean: (i) a Participant’s failure or refusal to materially perform his duties; (ii) a Participant’s failure or refusal to follow material directions of the Board or any other act of material insubordination on the part of Participant; (iii) the commission by a Participant of an act of fraud or embezzlement against the Company; or (iv) any conviction of, or plea of guilty or nolo contendere to, a felony by a Participant. In the event of a Participant’s discharge for cause from the employment of the Company or a Subsidiary, as the case may be, he shall not be entitled to any amount of bonus.

- 4- 8. RECOUPMENT All bonuses are subject to the American Financial Group, Inc. Executive Officer Clawback Policy as may be adopted or modified from time to time (including, without limitation, to comply with applicable law or stock exchange listing requirements) and may be subject to the requirement that the bonuses be repaid to the Company after they have been distributed to the Participant. This Section 8 is in addition to, and not in lieu of, any and all other rights of the Board and/or the Company under applicable law and shall apply notwithstanding anything to the contrary in the Plan. 9. CHANGE IN CONTROL If a Change in Control occurs during a Bonus Year, each Participant will receive their Bonus Target award, without regard to actual performance and without proration for less than the full Bonus Year. Awards paid in connection with a Change in Control will be paid within 30 days following the Change in Control. 10. MISCELLANEOUS 10.1. Government and Other Regulations. The obligation of the Company to make payment of bonuses shall be subject to all applicable laws, rules and regulations and to such approvals by governmental agencies as may be required. 10.2. Tax Withholding. The Company or a Subsidiary, as appropriate, shall have the right to deduct from all bonuses paid in cash any federal, state or local taxes required by law to be withheld with respect to such cash payments. 10.3. No Rights to Employment. Neither this Plan nor any action taken hereunder shall be construed as giving any Participant any right to be retained in the employ of the Company or a Subsidiary. 10.4. No Right to Award. Unless otherwise expressly set forth in an employment agreement signed by the Company and a Participant, a Participant shall not have any right to any bonus under the Plan until such bonus has been paid to such Participant and participation in the Plan in one Bonus Year does not connote any right to become a Participant in the Plan in any future Bonus Year. 10.5. Beneficiaries. Any bonuses awarded under this Plan to a Participant who dies prior to payment shall be paid as specified in Section 6 to the beneficiary designated by the Participant on a form filed with the Company. If no such beneficiary has been designated or survives the Participant, payment shall be made to the Participant’s legal representative. A beneficiary designation may be changed or revoked by a Participant at any time provided the change or revocation is filed with the Company. If the Participant dies during a Bonus Year and while employed, the payment shall be made at the end of the Bonus Year at the time specified in Section 6 and shall be a pro rata amount based on the Participant’s months of employment during the Bonus Year prior to death with the month of death counting as a full month of employment. 10.6. Non-transferability. A person’s rights and interests under the Plan may not be assigned, pledged or transferred except, in the event of a Participant’s death, to his designated beneficiary as provided in the Plan or, in the absence of such designation, by will or the laws of descent and distribution. 10.7. Unfunded Status. Nothing contained in the Plan, and no action taken pursuant to its provisions, shall create or be construed to create a trust of any kind or a fiduciary relationship between the Company and any Participant, beneficiary or legal representative or any other person. To the extent that a person acquires a right to receive payments under the Plan, such right shall be no greater than the right of an unsecured general creditor of the Company. All payments to be made hereunder shall be paid from the general funds of the Company and no special or separate fund shall be established and no

- 5- segregation of assets shall be made to assure payment of such amounts except as expressly set forth in the Plan. The Plan is not intended to be subject to the Employee Retirement Income Security Act of 1974, as amended (ERISA). 10.8. Section 409A of the Code. It is intended that payments under the Plan qualify as short- term deferrals exempt from the requirements of Section 409A of the Code. In the event that any Bonus does not qualify for treatment as an exempt short-term deferral, it is intended that such amount will be paid in a manner that satisfies the requirements of Section 409A of the Code. The Plan shall be interpreted and construed accordingly. 10.9. Reliance on Reports. Each member of the Committee and each member of the Board shall be fully justified in relying or acting in good faith upon any report made by the independent certified public accountants of the Company or of its Subsidiaries or upon any other information furnished in connection with the Plan by any officer, employee or director of the Company or any of its Subsidiaries. In no event shall any person who is or shall have been a member of the Committee or of the Board be liable for any determination made or other action taken or any omission to act in reliance upon any such report or information or for any action taken, including the furnishing of information, or failure to act, if in good faith. 10.10. Non-exclusive. Nothing in the Plan shall limit the authority of the Company, the Board or the Committee to adopt such other compensation arrangements, as it may deem desirable for any Participant. 10.11. Governing Law. The Plan shall be construed, administered and enforced in accordance with the laws of Ohio without regard to conflicts of law. 10.12. Expenses. The expenses of administering the Plan shall be borne by the Company and its subsidiaries in such proportions as shall be agreed upon by them from time to time. 10.13. Pronouns. Masculine pronouns and other words of masculine gender shall refer to both men and women. 10.14. Titles and Headings. The titles and headings of the sections in the Plan are for convenience of reference only, and, in the event of any conflict between any such title or heading and the text of the Plan, such text shall control. 10.15. Severability. If any provision of the Plan shall be considered illegal or invalid for any reason, such illegality or invalidity shall not affect the remaining provisions of the Plan, but shall be fully severable, and the Plan shall be construed and enforced as if such illegal or invalid provision had never been contained therein. 11. AMENDMENT AND TERMINATION The Board may at any time terminate the Plan. The Board may at any time, or from time to time, amend or suspend and, if suspended, reinstate the Plan in whole or in part. Notwithstanding the foregoing, the Plan shall continue in effect to the extent necessary to settle all matters relating to the payment of bonuses awarded prior to any such termination or suspension.
EX-19
3
afginsidertradingpolicy-.htm
EX-19
afginsidertradingpolicy-

} { Insider Trading Policy Effective Date: August 21, 2024 Printed copies are for reference only. Please refer to the electronic copy for the latest version. Introduction Federal and state securities laws make it illegal for anyone to trade in a company’s securities while in possession of material, non-public information relating to that company. This conduct is frequently referred to as “insider trading” and may result in civil or criminal penalties. As detailed in this Insider Trading Policy (this “Policy”), you are forbidden from trading, either personally or on behalf of others, on material non-public information or communicating material non-public information to others. It is important that you understand the breadth of activities that constitute illegal insider trading and the consequences, which can be severe. Cases have been successfully prosecuted against trading involving only a small number of shares, trading by family members and friends and trading by individuals through foreign accounts. Federal authorities are very effective at detecting inside trading and pursue violations vigorously. In addition, failure to comply with this Policy may result in disciplinary action, up to and including termination of employment. This Policy supersedes any previous policy of the Company concerning stock trading. In the event of any conflict or inconsistency between this Policy and any other materials previously distributed by the Company, this Policy shall govern. Questions regarding this Policy should be directed to the AFG General Counsel’s office, contact information for which is located at the end of this Policy. 1. Purpose The AFG Board of Directors has adopted this Policy to promote compliance with applicable securities laws and to provide you with procedures and guidelines for transactions in AFG securities and other public companies. 2. Applicability This Policy applies to all trading or other transactions in: (i) AFG securities, including common stock, options and any other securities that the Company may issue, such as preferred stock, notes, debentures, bonds and convertible securities, as well as to derivative securities relating to any of the Company’s securities, whether or not issued by the Company; (ii) in some instances, interests in the AFG Common Stock Fund in the AFG 401(k) Retirement and Savings Plan, as discussed in Section 7 (“Transactions Under Company-Sponsored Plans”) of this Policy below; and, (iii) the securities of certain other companies—such as our customers and suppliers— including common stock, options and other securities issued by those companies as well as puts, calls or other derivative instruments relating to any of those companies’ securities, where the person trading used information obtained while working for the Company. This Policy applies to all employees and officers of the Company and to all members of the AFG Board

} { 2 of Directors, as well as their respective Related Persons (as defined in Section 4C below). Section V below provides additional restrictions on trading AFG securities by directors, officers and other individuals designated as Covered Persons (as defined in Section 5A below). 3. Policy A. No trading in AFG securities while in possession of material non-public information. Neither you nor your Related Persons may purchase or sell, or offer to purchase or sell, any AFG security, whether or not issued by AFG, while in possession of material non-public information about the Company. The terms “material" and “non-public” are defined in Sections 4A and 4B below). B. No “tipping” information to others. Neither you nor your Related Persons, who know of any material non-public information about the Company, may communicate that information to (“tip”) any other person, including family members and friends, or otherwise disclose such information without the Company’s authorization. Tippees can obtain material non- public information by receiving explicit tips from others or from unintentional disclosure through, among other things, conversations at social, business or other gatherings. C. Trading in Business Partners’ securities. Neither you nor your Related Persons may purchase or sell any security of any of the Company’s vendors, suppliers, customers, partners or other companies with whom AFG has a business relationship (collectively, “Business Partners”) while in possession of material non-public information about such Business Partner that was obtained in the course of your involvement with the Company. Likewise, neither you nor your Related Persons, who know of any such material non-public information, may communicate that information to, or tip, any other person, including family members and friends, or otherwise disclose such information without the express authorization of the AFG General Counsel. D. Contact the AFG General Counsel’s office with questions. You should never trade, tip or recommend securities (or otherwise cause the purchase or sale of securities) while in possession of information that you have reason to believe is material and non-public unless you first consult with, and obtain the advance approval of, the AFG General Counsel’s office, contact information for which is located at the end of this Policy. 4. Definitions A. What is “material” information? The materiality of information depends upon the circumstances. Information is considered “material” if there is a substantial likelihood that a reasonable investor would consider it important in making a decision to buy, sell or hold a security or where the information is likely to affect the market price of the security. Material information can be positive or negative and can relate to virtually any aspect of a company’s business or to any type of security. Some examples of material information may include: Unpublished earnings information and other financial or operational results or projections; Significant unusual gains or losses, including write-downs in assets or changes in reserves; Pending or proposed mergers, acquisitions, dispositions or other transactions; Changes in dividend or share repurchase policies; Public or private debt or equity offerings; Significant changes in corporate objectives or business strategies;

} { 3 Major changes in accounting methods or policies; Developments in significant litigation or investigations; Changes in debt or financial strength ratings; Cybersecurity incidents, including risks, vulnerabilities, and breaches; or Major changes in executive management or the AFG Board of Directors. The above list is only illustrative and not exclusive; many other types of information may be considered material, depending on the circumstances. The materiality of particular information is subject to reassessment on a regular basis. If you are unsure whether particular non-public information is material, you should presume that it is material and consult with the AFG General Counsel’s office before disclosing such information or trading in AFG securities or any securities of any other company to which such information relates. B. What is “non-public” information? Information is “non-public” if it is not available to the general public. In order for information to be considered public, it must have been disclosed in AFG’s public filings with the Securities and Exchange Commission or widely disseminated through the media in a manner making it generally available to investors. Information may still be non-public even though it is widely known inside the Company. C. Who is a “Related Person”? For purposes of this Policy, a “Related Person” includes the spouse, minor children or anyone else living your household; partnerships in which you are or control the general partner; trusts of which you are a trustee; estates of which you are an executor; and any other legal entities controlled by you. Although your parent, adult child, sibling or other relative may not be considered a Related Person (unless living in the same household), a parent, adult child, sibling or other relative may be a “tippee” for securities laws purposes. (See Section 4B above.) You are responsible for your Related Persons’ compliance with this Policy. 5. Additional Requirements for Covered Persons: Trading Windows and Blackout Periods A. Who is a “Covered Person”? “Covered Persons” are individuals who are at an enhanced risk of possessing material non-public information and who therefore must exercise greater diligence to comply with insider trading prohibitions. This group includes all directors, officers and certain employees in a role that makes it likely they will have involvement with material non-public information. The list of Covered Persons is maintained by the General Counsel’s office. You will receive a quarterly memorandum from the General Counsel’s office if you are considered a Covered Person under this Policy. B. Trading Windows and Blackout Periods In addition to being subject to all of the other requirements in this Policy, Covered Persons and their Related Persons are subject to the following additional limitations: (i) Quarterly Blackout Periods. Trading in AFG securities is prohibited from (1) market closing on the date that is the last trading day of each quarter until (2) market open following one full day of trading after the release of AFG’s quarterly earnings. For example, if AFG publicly discloses its quarterly earnings after market close on a Tuesday, you may trade in AFG securities starting at market open on Thursday of that week, because a full trading day would have elapsed (all of Wednesday).

} { 4 (ii) Special Blackout Periods. From time to time, other types of material information regarding the Company (such as mergers, acquisitions or dispositions or other developments) may not be publicly disclosed. While such material information remains non-public, Covered Persons and other individuals with knowledge of such material, non-public information are prohibited from trading in AFG securities. You also must keep the existence of any special blackout period confidential. (iii) Trading windows are not “safe harbors” that ensure compliance with securities laws. You are responsible for your trades and should use good judgment at all times. Accordingly, even during open trading window periods, if you are in possession of material non-public information about the Company, you are prohibited from trading in AFG securities. C. Prohibition on Pledging and Hedging of AFG Securities Investing in AFG securities provides the holder with the opportunity to benefit from the Company’s long-term growth and stability. Certain forms of hedging or monetization transactions may offset a decrease, or limit your ability to profit from an increase, in the value of AFG securities you hold, enabling you to continue to own AFG securities without the full risks and rewards of ownership. AFG believes that such transactions separate the holder’s interests from those of other securityholders and may put the potential for personal gain in conflict with the Company and such other securityholders. As such, no Covered Persons or their Related Persons may engage in any hedging or monetization transactions, including without limitation by trading in put or call options, swaps, forwards and other derivatives or similar instruments on AFG securities, or by selling short AFG securities. The pledging of AFG common shares, including holding common shares in a margin account or pledged as collateral for a loan, is prohibited in the absence of obtaining pre-approval from the Chair of the Corporate Governance Committee. Such approval will be granted only if the individual can clearly demonstrate the financial capacity to repay the loan without resorting to the pledged securities and/or after a determination that the number of shares that the individual proposes to pledge is unlikely to affect the market for the common shares when viewed in relation to the market value or trading volume. 6. 10b5-1 Plan Approval Requirement and Exception The trading restrictions in this Policy do not apply to transactions under a written plan, contract, instruction or arrangement under Rule 10b5-1 under the Securities Exchange Act of 1934, as amended (a “10b5-1 Plan”), (i) that complies with the requirements of Rule 10b5-1, (ii) is entered into during an open trading window and at a time when the individual entering into the 10b5-1 Plan is not aware of material non-public information, and (iii) that such insider or their broker has sent to the AFG General Counsel (who will coordinate any additional departmental reviews) for review and approval of in advance of any trades being made. If you are considering entering into, modifying or terminating a 10b5-1 Plan or have any questions regarding approved Rule 10b5-1 Plans under this Policy, please contact the General Counsel’s office.

} { 5 7. Transactions Under Company-Sponsored Plans A. AFG Securities Underlying Awards This Policy’s trading restrictions do not apply to the extent the Company is required to withhold taxes in connection with the vesting or delivery of AFG securities underlying restricted stock units or other awards received under any of the Company’s incentive plans. This Policy’s trading restrictions do apply, however, to any market sale or other disposition of AFG securities received following the vesting of any restricted stock units or other awards under any of the Company’s incentive plans. B. Company-Sponsored Retirement Plans This Policy’s trading restrictions do not apply to purchases of AFG securities in the Company’s savings and deferral plans, including purchases in the AFG Common Stock Fund in the AFG 401(k) Retirement and Savings Plan and AFG securities purchased in the Employee Stock Purchase Plan, resulting from a participant’s periodic contribution of money to such plan(s) pursuant to payroll deduction elections. This Policy’s trading restrictions do apply, however, to elections participants may make under such plans that relate to AFG securities, including elections with respect to the investment of contributions, intra-plan transfers of an existing account balance between investment funds, loans, and distributions. 8. Questions and Contacts AFG General Counsel’s Office: Mark Weiss, General Counsel 513-579-2520 Joseph Alter, Deputy General Counsel 513-362-0158
EX-21
4
afg-20241231xex21.htm
EX-21
Document
Exhibit 21
AMERICAN FINANCIAL GROUP, INC.
SUBSIDIARIES OF THE REGISTRANT
The following is a list of subsidiaries of AFG at December 31, 2024. All corporations are subsidiaries of AFG and, if indented, subsidiaries of the company under which they are listed. The names of certain subsidiaries are omitted, as such subsidiaries in the aggregate would not constitute a significant subsidiary.
|
|
|
|
|
|
|
|
|
|
|
|
|
|
|
| Name of Company |
|
Incorporated |
|
Percentage of Ownership |
| AFG Real Estate Holding Company, LLC |
|
Ohio |
|
100 |
| American Money Management Corporation |
|
Ohio |
|
100 |
| American Real Estate Capital Company, LLC |
|
Ohio |
|
100 |
| APU Holding Company |
|
Ohio |
|
100 |
| American Premier Underwriters, Inc. (*) |
|
Pennsylvania |
|
100 |
| GAI Insurance Company, Ltd. |
|
Bermuda |
|
100 |
| Great American Financial Resources, Inc. |
|
Delaware |
|
100 |
| Great American Holding, Inc. |
|
Ohio |
|
100 |
| ABA Insurance Services, Inc. |
|
Ohio |
|
100 |
| Farmers Crop Insurance Alliance, Inc. |
|
Kansas |
|
100 |
| Crop Risk Services, Inc. |
|
Illinois |
|
100 |
| Great American Contemporary Insurance Company |
|
Ohio |
|
100 |
| Bridgefield Casualty Insurance Company |
|
Florida |
|
100 |
| Bridgefield Employers Insurance Company |
|
Florida |
|
100 |
| Bridgefield Indemnity Insurance Company |
|
Ohio |
|
100 |
| Republic Indemnity Company of America |
|
California |
|
100 |
| Republic Indemnity Company of California |
|
California |
|
100 |
| Great American Holding (Europe) Limited |
|
United Kingdom |
|
100 |
| Great American Europe Limited |
|
United Kingdom |
|
100 |
| Great American International Insurance (EU) Designated Activity Company |
|
Ireland |
|
100 |
| Great American International Insurance (UK) Limited |
|
United Kingdom |
|
100 |
| Mid-Continent Casualty Company |
|
Ohio |
|
100 |
| Mid-Continent Assurance Company |
|
Ohio |
|
100 |
| Mid-Continent Excess and Surplus Insurance Company |
|
Ohio |
|
100 |
| Oklahoma Surety Company |
|
Ohio |
|
100 |
| National Interstate Corporation |
|
Ohio |
|
100 |
| Hudson Indemnity, Ltd. |
|
Cayman Islands |
|
100 |
| National Interstate Insurance Company |
|
Ohio |
|
100 |
| National Interstate Insurance Company of Hawaii, Inc. |
|
Ohio |
|
100 |
| Triumphe Casualty Company |
|
Ohio |
|
100 |
| Vanliner Insurance Company |
|
Ohio |
|
100 |
| Summit Consulting, LLC |
|
Florida |
|
100 |
| Great American Insurance Company |
|
Ohio |
|
100 |
| American Empire Insurance Company |
|
Ohio |
|
100 |
| El Aguila, Compañia de Seguros, S.A. de C.V. |
|
Mexico |
|
100 |
| GAI Warranty Company |
|
Ohio |
|
100 |
| GAI Warranty Company of Florida |
|
Florida |
|
100 |
| Great American Alliance Insurance Company |
|
Ohio |
|
100 |
| Great American Assurance Company |
|
Ohio |
|
100 |
| Great American Casualty Insurance Company |
|
Ohio |
|
100 |
| Great American E&S Insurance Company |
|
Ohio |
|
100 |
| Great American Fidelity Insurance Company |
|
Ohio |
|
100 |
| Great American Insurance Company of New York |
|
New York |
|
100 |
| Great American Protection Insurance Company |
|
Ohio |
|
100 |
| Great American Risk Solutions Surplus Lines Insurance Company |
|
Ohio |
|
100 |
| Great American Security Insurance Company |
|
Ohio |
|
100 |
| Great American Spirit Insurance Company |
|
Ohio |
|
100 |
| Professional Risk Brokers, Inc. |
|
Illinois |
|
100 |
| Verikai Inc. |
|
Delaware |
|
100 |
(*)Effective January 1, 2025, American Premier Underwriters, Inc. was renamed APU Consolidated, Inc.
EX-23
5
afg-20241231xex23.htm
EX-23
Document
Exhibit 23
AMERICAN FINANCIAL GROUP, INC. AND SUBSIDIARIES
CONSENT OF INDEPENDENT REGISTERED PUBLIC ACCOUNTING FIRM
We consent to the incorporation by reference in the following Registration Statements and related Prospectuses of American Financial Group, Inc.:
|
|
|
|
|
|
|
|
|
|
|
|
|
|
|
|
|
|
|
|
|
|
|
|
Registration |
|
|
|
|
Form |
|
Number |
|
Description |
|
|
S-8 |
|
33-58827 |
|
Employee Stock Purchase Plan |
|
|
S-3 |
|
333-102567 |
|
Dividend Reinvestment Plan |
|
|
S-8 |
|
333-117062 |
|
Non-employee Directors Compensation Plan |
|
|
S-8 |
|
333-184913 |
|
Non-employee Directors Compensation Plan |
|
|
S-8 |
|
333-14935 |
|
Retirement and Savings Plan |
|
|
S-8 |
|
333-91945 |
|
Deferred Compensation Plan |
|
|
S-8 |
|
333-268292 |
|
Deferred Compensation Plan |
|
|
S-8 |
|
333-125304 |
|
2005 Stock Incentive Plan |
|
|
S-8 |
|
333-170343 |
|
2005 Stock Incentive Plan |
|
|
S-8 |
|
333-184914 |
|
2005 Stock Incentive Plan |
|
|
S-8 |
|
333-206291 |
|
2015 Stock Incentive Plan |
|
|
S-3 |
|
333-253582 |
|
Shelf Registration |
|
|
S-8 |
|
333-281389 |
|
Amended and Restated 2015 Stock Incentive Plan |
|
of our reports dated February 25, 2025, with respect to the consolidated financial statements and schedules of American Financial Group, Inc. and subsidiaries and the effectiveness of internal control over financial reporting of American Financial Group, Inc. and subsidiaries, included in this Annual Report (Form 10-K) of American Financial Group, Inc. and subsidiaries for the year ended December 31, 2024.
/s/ Ernst & Young LLP
Cincinnati, Ohio
February 25, 2025
EX-31.A
6
afg-20241231xex31a.htm
EX-31.A
Document
Exhibit 31(a)
AMERICAN FINANCIAL GROUP, INC.
SARBANES-OXLEY SECTION 302(a) CERTIFICATIONS
I, Carl H. Lindner III, certify that:
1.I have reviewed this annual report on Form 10-K of American Financial Group, Inc.;
2.Based on my knowledge, this report does not contain any untrue statement of a material fact or omit to state a material fact necessary to make the statements made, in light of the circumstances under which such statements were made, not misleading with respect to the period covered by this report;
3.Based on my knowledge, the financial statements, and other financial information included in this report, fairly present in all material respects the financial condition, results of operations and cash flows of the registrant as of, and for, the periods presented in this report;
4.The registrant’s other certifying officers and I are responsible for establishing and maintaining disclosure controls and procedures (as defined in Exchange Act Rules 13a-15(e) and 15d-15(e)) and internal control over financial reporting (as defined in Exchange Act Rules 13a-15(f) and 15d-15(f)) for the registrant and have:
a)Designed such disclosure controls and procedures, or caused such disclosure controls and procedures to be designed under our supervision, to ensure that material information relating to the registrant, including its consolidated subsidiaries, is made known to us by others within those entities, particularly during the period in which this report is being prepared;
b)Designed such internal control over financial reporting, or caused such internal control over financial reporting to be designed under our supervision, to provide reasonable assurance regarding the reliability of financial reporting and the preparation of financial statements for external purposes in accordance with generally accepted accounting principles;
c)Evaluated the effectiveness of the registrant’s disclosure controls and procedures and presented in this report our conclusions about the effectiveness of the disclosure controls and procedures, as of the end of the period covered by this report based on such evaluation; and
d)Disclosed in this report any change in the registrant’s internal control over financial reporting that occurred during the registrant’s most recent fiscal quarter that has materially affected, or is reasonably likely to materially affect, the registrant’s internal control over financial reporting; and
5.The registrant’s other certifying officers and I have disclosed, based on our most recent evaluation of internal control over financial reporting, to the registrant’s auditors and the audit committee of registrant’s board of directors (or persons performing the equivalent functions):
a)All significant deficiencies and material weaknesses in the design or operation of internal control over financial reporting which are reasonably likely to adversely affect the registrant’s ability to record, process, summarize and report financial information; and
b)Any fraud, whether or not material, that involves management or other employees who have a significant role in the registrant’s internal control over financial reporting.
|
|
|
|
|
|
|
|
|
|
|
|
|
|
|
| February 25, 2025 |
|
By: |
/s/ Carl H. Lindner III |
|
|
|
|
Carl H. Lindner III |
|
|
|
|
Co-Chief Executive Officer |
|
EX-31.B
7
afg-20231231xex31b.htm
EX-31.B
Document
Exhibit 31(b)
AMERICAN FINANCIAL GROUP, INC.
SARBANES-OXLEY SECTION 302(a) CERTIFICATIONS
I, S. Craig Lindner, certify that:
1.I have reviewed this annual report on Form 10-K of American Financial Group, Inc.;
2.Based on my knowledge, this report does not contain any untrue statement of a material fact or omit to state a material fact necessary to make the statements made, in light of the circumstances under which such statements were made, not misleading with respect to the period covered by this report;
3.Based on my knowledge, the financial statements, and other financial information included in this report, fairly present in all material respects the financial condition, results of operations and cash flows of the registrant as of, and for, the periods presented in this report;
4.The registrant’s other certifying officers and I are responsible for establishing and maintaining disclosure controls and procedures (as defined in Exchange Act Rules 13a-15(e) and 15d-15(e)) and internal control over financial reporting (as defined in Exchange Act Rules 13a-15(f) and 15d-15(f)) for the registrant and have:
a)Designed such disclosure controls and procedures, or caused such disclosure controls and procedures to be designed under our supervision, to ensure that material information relating to the registrant, including its consolidated subsidiaries, is made known to us by others within those entities, particularly during the period in which this report is being prepared;
b)Designed such internal control over financial reporting, or caused such internal control over financial reporting to be designed under our supervision, to provide reasonable assurance regarding the reliability of financial reporting and the preparation of financial statements for external purposes in accordance with generally accepted accounting principles;
c)Evaluated the effectiveness of the registrant’s disclosure controls and procedures and presented in this report our conclusions about the effectiveness of the disclosure controls and procedures, as of the end of the period covered by this report based on such evaluation; and
d)Disclosed in this report any change in the registrant’s internal control over financial reporting that occurred during the registrant’s most recent fiscal quarter that has materially affected, or is reasonably likely to materially affect, the registrant’s internal control over financial reporting; and
5.The registrant’s other certifying officers and I have disclosed, based on our most recent evaluation of internal control over financial reporting, to the registrant’s auditors and the audit committee of registrant’s board of directors (or persons performing the equivalent functions):
a)All significant deficiencies and material weaknesses in the design or operation of internal control over financial reporting which are reasonably likely to adversely affect the registrant’s ability to record, process, summarize and report financial information; and
b)Any fraud, whether or not material, that involves management or other employees who have a significant role in the registrant’s internal control over financial reporting.
|
|
|
|
|
|
|
|
|
|
|
|
|
|
|
| February 25, 2025 |
|
By: |
/s/ S. Craig Lindner |
|
|
|
|
S. Craig Lindner |
|
|
|
|
Co-Chief Executive Officer |
|
EX-31.C
8
afg-20241231xex31c.htm
EX-31.C
Document
Exhibit 31(c)
AMERICAN FINANCIAL GROUP, INC.
SARBANES-OXLEY SECTION 302(a) CERTIFICATIONS
I, Brian S. Hertzman, certify that:
1.I have reviewed this annual report on Form 10-K of American Financial Group, Inc.;
2.Based on my knowledge, this report does not contain any untrue statement of a material fact or omit to state a material fact necessary to make the statements made, in light of the circumstances under which such statements were made, not misleading with respect to the period covered by this report;
3.Based on my knowledge, the financial statements, and other financial information included in this report, fairly present in all material respects the financial condition, results of operations and cash flows of the registrant as of, and for, the periods presented in this report;
4.The registrant’s other certifying officers and I are responsible for establishing and maintaining disclosure controls and procedures (as defined in Exchange Act Rules 13a-15(e) and 15d-15(e)) and internal control over financial reporting (as defined in Exchange Act Rules 13a-15(f) and 15d-15(f)) for the registrant and have:
a)Designed such disclosure controls and procedures, or caused such disclosure controls and procedures to be designed under our supervision, to ensure that material information relating to the registrant, including its consolidated subsidiaries, is made known to us by others within those entities, particularly during the period in which this report is being prepared;
b)Designed such internal control over financial reporting, or caused such internal control over financial reporting to be designed under our supervision, to provide reasonable assurance regarding the reliability of financial reporting and the preparation of financial statements for external purposes in accordance with generally accepted accounting principles;
c)Evaluated the effectiveness of the registrant’s disclosure controls and procedures and presented in this report our conclusions about the effectiveness of the disclosure controls and procedures, as of the end of the period covered by this report based on such evaluation; and
d)Disclosed in this report any change in the registrant’s internal control over financial reporting that occurred during the registrant’s most recent fiscal quarter that has materially affected, or is reasonably likely to materially affect, the registrant’s internal control over financial reporting; and
5.The registrant’s other certifying officers and I have disclosed, based on our most recent evaluation of internal control over financial reporting, to the registrant’s auditors and the audit committee of registrant’s board of directors (or persons performing the equivalent functions):
a)All significant deficiencies and material weaknesses in the design or operation of internal control over financial reporting which are reasonably likely to adversely affect the registrant’s ability to record, process, summarize and report financial information; and
b)Any fraud, whether or not material, that involves management or other employees who have a significant role in the registrant’s internal control over financial reporting.
|
|
|
|
|
|
|
|
|
|
|
|
|
|
|
| February 25, 2025 |
|
By: |
/s/ Brian S. Hertzman |
|
|
|
|
Brian S. Hertzman |
|
|
|
|
Senior Vice President and Chief Financial Officer |
|
EX-32
9
afg-20241231xex32.htm
EX-32
Document
Exhibit 32
AMERICAN FINANCIAL GROUP, INC.
CERTIFICATION OF CHIEF EXECUTIVE OFFICER AND CHIEF FINANCIAL OFFICER
PURSUANT TO SECTION 906 OF THE SARBANES-OXLEY ACT OF 2002
In connection with the filing with the Securities and Exchange Commission of the Annual Report of American Financial Group, Inc. (the “Company”) on Form 10-K for the period ended December 31, 2024 (the “Report”), the undersigned officers of the Company, certify, pursuant to section 906 of the Sarbanes-Oxley Act of 2002, that to the best of their knowledge:
(1)The Report fully complies with the requirements of section 13(a) or 15(d) of the Securities Act of 1934; and
(2)The information contained in the Report fairly presents, in all material respects, the financial condition and results of operations of the Company.
|
|
|
|
|
|
|
|
|
|
|
|
| February 25, 2025 |
|
By: |
/s/ Carl H. Lindner III |
| Date |
|
|
Carl H. Lindner III |
|
|
|
Co-Chief Executive Officer |
|
|
|
|
| February 25, 2025 |
|
By: |
/s/ S. Craig Lindner |
| Date |
|
|
S. Craig Lindner |
|
|
|
Co-Chief Executive Officer |
|
|
|
|
| February 25, 2025 |
|
By: |
/s/ Brian S. Hertzman |
| Date |
|
|
Brian S. Hertzman |
|
|
|
Senior Vice President and Chief Financial Officer |
|
|
|
|
A signed original of this written statement will be retained by the Registrant and
furnished to the Securities and Exchange Commission or its staff upon request.