| 1-13199 | 13-3956775 | ||||
| (Commission File Number) | (I.R.S. Employer Identification No.) | ||||
| One Vanderbilt Avenue | 10017 | |||||||
| New York, | New York | (Zip Code) | ||||||
(Address of principal executive offices) |
||||||||
| Registrant | Trading Symbol | Title of Each Class | Name of Each Exchange on Which Registered | |||||||||||||||||
| SL Green Realty Corp. | SLG | Common Stock, $0.01 par value | New York Stock Exchange | |||||||||||||||||
| SL Green Realty Corp. | SLG.PRI | 6.500% Series I Cumulative Redeemable Preferred Stock, $0.01 par value | New York Stock Exchange | |||||||||||||||||
| SL GREEN REALTY CORP. | |||||
| /s/ Matthew J. DiLiberto | |||||
| Matthew J. DiLiberto | |||||
| Chief Financial Officer | |||||
| Date: January 23, 2025 | |||||
| Three Months Ended | Twelve Months Ended | ||||||||||||||||||||||
| December 31, | December 31, | ||||||||||||||||||||||
| Revenues: | 2024 | 2023 | 2024 | 2023 | |||||||||||||||||||
| Rental revenue, net | $ | 139,613 | $ | 131,927 | $ | 542,995 | $ | 603,694 | |||||||||||||||
| Escalation and reimbursement revenues | 17,317 | 19,430 | 63,004 | 79,641 | |||||||||||||||||||
| SUMMIT Operator revenue | 38,571 | 35,240 | 133,214 | 118,260 | |||||||||||||||||||
| Investment income | 5,415 | 6,856 | 24,353 | 34,705 | |||||||||||||||||||
| Interest income from real estate loans held by consolidated securitization vehicles | 14,209 | — | 18,980 | — | |||||||||||||||||||
| Other income | 30,754 | 18,271 | 103,726 | 77,410 | |||||||||||||||||||
| Total revenues | 245,879 | 211,724 | 886,272 | 913,710 | |||||||||||||||||||
| Expenses: | |||||||||||||||||||||||
Operating expenses, including related party expenses of $5 and $7 in 2024 and $2 and $5 in 2023 |
50,150 | 48,090 | 189,598 | 196,696 | |||||||||||||||||||
| Real estate taxes | 33,692 | 31,294 | 128,187 | 143,757 | |||||||||||||||||||
| Operating lease rent | 5,287 | 7,083 | 24,423 | 27,292 | |||||||||||||||||||
| SUMMIT Operator expenses | 28,792 | 24,887 | 111,739 | 101,211 | |||||||||||||||||||
| Interest expense, net of interest income | 38,153 | 27,400 | 147,220 | 137,114 | |||||||||||||||||||
| Amortization of deferred financing costs | 1,734 | 1,510 | 6,619 | 7,837 | |||||||||||||||||||
| SUMMIT Operator tax expense | 1,949 | 2,320 | 730 | 9,201 | |||||||||||||||||||
| Interest expense on senior obligations of consolidated securitization vehicles | 11,304 | — | 14,634 | — | |||||||||||||||||||
| Depreciation and amortization | 53,436 | 49,050 | 207,443 | 247,810 | |||||||||||||||||||
| Loan loss and other investment reserves, net of recoveries | — | — | — | 6,890 | |||||||||||||||||||
| Transaction related costs | 138 | 16 | 401 | 1,099 | |||||||||||||||||||
| Marketing, general and administrative | 22,827 | 42,257 | 85,187 | 111,389 | |||||||||||||||||||
| Total expenses | 247,462 | 233,907 | 916,181 | 990,296 | |||||||||||||||||||
| Equity in net loss from unconsolidated joint ventures | (279,752) | (32,039) | (179,695) | (76,509) | |||||||||||||||||||
| Equity in net gain (loss) on sale of interest in unconsolidated joint venture/real estate | 189,138 | (13,289) | 208,144 | (13,368) | |||||||||||||||||||
| Purchase price and other fair value adjustments | 125,287 | (10,273) | 88,966 | (17,260) | |||||||||||||||||||
| (Loss) Gain on sale of real estate, net | (1,705) | (4,557) | 3,025 | (32,370) | |||||||||||||||||||
| Depreciable real estate reserves | (38,232) | (76,847) | (104,071) | (382,374) | |||||||||||||||||||
| Gain (Loss) on early extinguishment of debt | 25,985 | (870) | 43,762 | (870) | |||||||||||||||||||
| Net income (loss) | 19,138 | (160,058) | 30,222 | (599,337) | |||||||||||||||||||
| Net income (loss) attributable to noncontrolling interests: | |||||||||||||||||||||||
| Noncontrolling interests in the Operating Partnership | (663) | 9,972 | (497) | 37,465 | |||||||||||||||||||
| Noncontrolling interests in other partnerships | (3,222) | 109 | 928 | 4,568 | |||||||||||||||||||
| Preferred units distributions | (2,158) | (1,903) | (8,643) | (7,255) | |||||||||||||||||||
| Net income (loss) attributable to SL Green | 13,095 | (151,880) | 22,010 | (564,559) | |||||||||||||||||||
| Perpetual preferred stock dividends | (3,737) | (3,737) | (14,950) | (14,950) | |||||||||||||||||||
| Net income (loss) attributable to SL Green common stockholders | $ | 9,358 | $ | (155,617) | $ | 7,060 | $ | (579,509) | |||||||||||||||
| Earnings Per Share (EPS) | |||||||||||||||||||||||
| Basic earnings (loss) per share | $ | 0.13 | $ | (2.45) | $ | 0.08 | $ | (9.12) | |||||||||||||||
| Diluted earnings (loss) per share | $ | 0.13 | $ | (2.45) | $ | 0.08 | $ | (9.12) | |||||||||||||||
| Funds From Operations (FFO) | |||||||||||||||||||||||
| Basic FFO per share | $ | 1.87 | $ | 0.72 | $ | 8.29 | $ | 4.98 | |||||||||||||||
| Diluted FFO per share | $ | 1.81 | $ | 0.72 | $ | 8.11 | $ | 4.94 | |||||||||||||||
| Basic ownership interest | |||||||||||||||||||||||
| Weighted average REIT common shares for net income per share | 67,167 | 63,885 | 65,062 | 63,809 | |||||||||||||||||||
| Weighted average partnership units held by noncontrolling interests | 3,487 | 4,129 | 3,674 | 4,163 | |||||||||||||||||||
| Basic weighted average shares and units outstanding | 70,654 | 68,014 | 68,736 | 67,972 | |||||||||||||||||||
| Diluted ownership interest | |||||||||||||||||||||||
| Weighted average REIT common share and common share equivalents | 69,428 | 65,171 | 66,594 | 64,869 | |||||||||||||||||||
| Weighted average partnership units held by noncontrolling interests | 3,487 | 4,129 | 3,674 | 4,163 | |||||||||||||||||||
| Diluted weighted average shares and units outstanding | 72,915 | 69,300 | 70,268 | 69,032 | |||||||||||||||||||
| December 31, | December 31, | ||||||||||
| 2024 | 2023 | ||||||||||
| Assets | |||||||||||
| Commercial real estate properties, at cost: | |||||||||||
| Land and land interests | $ | 1,357,041 | $ | 1,092,671 | |||||||
| Building and improvements | 3,862,224 | 3,655,624 | |||||||||
| Building leasehold and improvements | 1,388,476 | 1,354,569 | |||||||||
| 6,607,741 | 6,102,864 | ||||||||||
| Less: accumulated depreciation | (2,126,081) | (1,968,004) | |||||||||
| 4,481,660 | 4,134,860 | ||||||||||
| Cash and cash equivalents | 184,294 | 221,823 | |||||||||
| Restricted cash | 147,344 | 113,696 | |||||||||
| Investment in marketable securities | 22,812 | 9,591 | |||||||||
| Tenant and other receivables | 44,055 | 33,270 | |||||||||
| Related party receivables | 26,865 | 12,168 | |||||||||
| Deferred rents receivable | 266,428 | 264,653 | |||||||||
Debt and preferred equity investments, net of discounts and deferred origination fees of $1,618 and $1,630 in 2024 and 2023, respectively, and allowances of $13,520 and $13,520 in 2024 and 2023, respectively |
303,726 | 346,745 | |||||||||
| Investments in unconsolidated joint ventures | 2,690,138 | 2,983,313 | |||||||||
| Deferred costs, net | 117,132 | 111,463 | |||||||||
| Right-of-use assets - operating leases | 865,639 | 885,929 | |||||||||
Real estate loans held by consolidated securitization vehicles (includes $584,134 and $— at fair value as of December 31, 2024 and December 31, 2023, respectively) |
709,095 | — | |||||||||
| Other assets | 598,752 | 413,670 | |||||||||
| Total assets | $ | 10,457,940 | $ | 9,531,181 | |||||||
| Liabilities | |||||||||||
| Mortgages and other loans payable | $ | 1,951,024 | $ | 1,497,386 | |||||||
| Revolving credit facility | 320,000 | 560,000 | |||||||||
| Unsecured term loan | 1,150,000 | 1,250,000 | |||||||||
| Unsecured notes | 100,000 | 100,000 | |||||||||
| Deferred financing costs, net | (14,242) | (16,639) | |||||||||
| Total debt, net of deferred financing costs | 3,506,782 | 3,390,747 | |||||||||
| Accrued interest payable | 2,727 | 17,930 | |||||||||
| Accounts payable and accrued expenses | 122,674 | 153,164 | |||||||||
| Deferred revenue | 164,887 | 134,053 | |||||||||
| Lease liability - financing leases | 106,853 | 105,531 | |||||||||
| Lease liability - operating leases | 810,989 | 827,692 | |||||||||
| Dividend and distributions payable | 21,816 | 20,280 | |||||||||
| Security deposits | 60,331 | 49,906 | |||||||||
| Junior subordinate deferrable interest debentures held by trusts that issued trust preferred securities | 100,000 | 100,000 | |||||||||
Senior obligations of consolidated securitization vehicles (includes $567,487 and $— at fair value as of December 31, 2024 and December 31, 2023, respectively) |
590,131 | — | |||||||||
Other liabilities (includes $251,096 and $— at fair value as of December 31, 2024 and December 31, 2023, respectively) |
415,794 | 471,401 | |||||||||
| Total liabilities | 5,902,984 | 5,270,704 | |||||||||
| Commitments and contingencies | |||||||||||
| Noncontrolling interests in Operating Partnership | 288,941 | 238,051 | |||||||||
| Preferred units and redeemable equity | 196,064 | 166,501 | |||||||||
| Equity | |||||||||||
| SL Green stockholders' equity: | |||||||||||
Series I Preferred Stock, $0.01 par value, $25.00 liquidation preference, 9,200 and 9,200 issued and outstanding at both December 31, 2024 and December 31, 2023 |
221,932 | 221,932 | |||||||||
Common stock, $0.01 par value 160,000 shares authorized, 71,097 and 65,786 issued and outstanding (including — and 1,060 held in Treasury) at December 31, 2024 and December 31, 2023, respectively |
711 | 660 | |||||||||
| Additional paid-in capital | 4,159,562 | 3,826,452 | |||||||||
| Treasury stock at cost | — | (128,655) | |||||||||
| Accumulated other comprehensive income | 18,196 | 17,477 | |||||||||
| Retained deficit | (449,101) | (151,551) | |||||||||
| Total SL Green Realty Corp. stockholders’ equity | 3,951,300 | 3,786,315 | |||||||||
| Noncontrolling interests in other partnerships | 118,651 | 69,610 | |||||||||
| Total equity | 4,069,951 | 3,855,925 | |||||||||
| Total liabilities and equity | $ | 10,457,940 | $ | 9,531,181 | |||||||
| Three Months Ended | Twelve Months Ended | ||||||||||||||||||||||
| December 31, | December 31, | ||||||||||||||||||||||
| Funds From Operations (FFO) Reconciliation: | 2024 | 2023 | 2024 | 2023 | |||||||||||||||||||
| Net income (loss) attributable to SL Green common stockholders | $ | 9,358 | $ | (155,617) | $ | 7,060 | $ | (579,509) | |||||||||||||||
| Add: | |||||||||||||||||||||||
| Depreciation and amortization | 53,436 | 49,050 | 207,443 | 247,810 | |||||||||||||||||||
| Joint venture depreciation and noncontrolling interest adjustments | 69,636 | 73,062 | 287,671 | 284,284 | |||||||||||||||||||
| Net income (loss) attributable to noncontrolling interests | 3,885 | (10,081) | (431) | (42,033) | |||||||||||||||||||
| Less: | |||||||||||||||||||||||
| Equity in net gain (loss) on sale of interest in unconsolidated joint venture/real estate | 189,138 | (13,289) | 208,144 | (13,368) | |||||||||||||||||||
| Purchase price and other fair value adjustments | 117,195 | — | 83,430 | (6,813) | |||||||||||||||||||
| (Loss) Gain on sale of real estate, net | (1,705) | (4,557) | 3,025 | (32,370) | |||||||||||||||||||
| Depreciable real estate reserves | (38,232) | (76,847) | (104,071) | (382,374) | |||||||||||||||||||
| Depreciable real estate reserves in unconsolidated joint venture | (263,190) | — | (263,190) | — | |||||||||||||||||||
| Depreciation on non-rental real estate assets | 1,226 | 1,414 | 4,583 | 4,136 | |||||||||||||||||||
| FFO attributable to SL Green common stockholders and unit holders | $ | 131,883 | $ | 49,693 | $ | 569,822 | $ | 341,341 | |||||||||||||||
| Three Months Ended | Twelve Months Ended | ||||||||||||||||||||||
| December 31, | December 31, | ||||||||||||||||||||||
| Operating income and Same-store NOI Reconciliation: | 2024 | 2023 | 2024 | 2023 | |||||||||||||||||||
| Net income (loss) | $ | 19,138 | $ | (160,058) | $ | 30,222 | $ | (599,337) | |||||||||||||||
| Depreciable real estate reserves | 38,232 | 76,847 | 104,071 | 382,374 | |||||||||||||||||||
| Loss (Gain) on sale of real estate, net | 1,705 | 4,557 | (3,025) | 32,370 | |||||||||||||||||||
| Purchase price and other fair value adjustments | (125,287) | 10,273 | (88,966) | 17,260 | |||||||||||||||||||
| Equity in net (gain) loss on sale of interest in unconsolidated joint venture/real estate | (189,138) | 13,289 | (208,144) | 13,368 | |||||||||||||||||||
| Depreciation and amortization | 53,436 | 49,050 | 207,443 | 247,810 | |||||||||||||||||||
| SUMMIT Operator tax expense | 1,949 | 2,320 | 730 | 9,201 | |||||||||||||||||||
| Amortization of deferred financing costs | 1,734 | 1,510 | 6,619 | 7,837 | |||||||||||||||||||
| Interest expense, net of interest income | 38,153 | 27,400 | 147,220 | 137,114 | |||||||||||||||||||
| Interest expense on senior obligations of consolidated securitization vehicles | 11,304 | — | 14,634 | — | |||||||||||||||||||
| Operating (loss) income | (148,774) | 25,188 | 210,804 | 247,997 | |||||||||||||||||||
| Equity in net loss from unconsolidated joint ventures | 279,752 | 32,039 | 179,695 | 76,509 | |||||||||||||||||||
| Marketing, general and administrative expense | 22,827 | 42,257 | 85,187 | 111,389 | |||||||||||||||||||
| Transaction related costs | 138 | 16 | 401 | 1,099 | |||||||||||||||||||
| Loan loss and other investment reserves, net of recoveries | — | — | — | 6,890 | |||||||||||||||||||
| SUMMIT Operator expenses | 28,792 | 24,887 | 111,739 | 101,211 | |||||||||||||||||||
| (Gain) Loss on early extinguishment of debt | (25,985) | 870 | (43,762) | 870 | |||||||||||||||||||
| Investment income | (5,415) | (6,856) | (24,353) | (34,705) | |||||||||||||||||||
| Interest income from real estate loans held by consolidated securitization vehicles | (14,209) | — | (18,980) | — | |||||||||||||||||||
| SUMMIT Operator revenue | (38,571) | (35,240) | (133,214) | (118,260) | |||||||||||||||||||
| Non-building revenue | (20,704) | (10,935) | (68,881) | (44,568) | |||||||||||||||||||
| Net operating income (NOI) | 77,851 | 72,226 | 298,636 | 348,432 | |||||||||||||||||||
| Equity in net loss from unconsolidated joint ventures | (279,752) | (32,039) | (179,695) | (76,509) | |||||||||||||||||||
| SLG share of unconsolidated JV depreciable real estate reserves | 263,190 | — | 263,190 | — | |||||||||||||||||||
| SLG share of unconsolidated JV depreciation and amortization | 67,046 | 69,588 | 275,098 | 266,340 | |||||||||||||||||||
| SLG share of unconsolidated JV amortization of deferred financing costs | 3,459 | 2,876 | 11,334 | 12,005 | |||||||||||||||||||
| SLG share of unconsolidated JV interest expense, net of interest income | 67,099 | 73,012 | 276,852 | 272,217 | |||||||||||||||||||
| SLG share of unconsolidated JV gain on early extinguishment of debt | — | — | (172,369) | — | |||||||||||||||||||
| SLG share of unconsolidated JV investment income | (5,048) | (320) | (11,513) | (1,271) | |||||||||||||||||||
| SLG share of unconsolidated JV non-building revenue | 147 | 106 | (3,051) | (14,336) | |||||||||||||||||||
| NOI including SLG share of unconsolidated JVs | 193,992 | 185,449 | 758,482 | 806,878 | |||||||||||||||||||
| NOI from other properties/affiliates | (38,211) | (26,870) | (140,923) | (163,399) | |||||||||||||||||||
| Same-Store NOI | 155,781 | 158,579 | 617,559 | 643,479 | |||||||||||||||||||
| Straight-line and free rent | 810 | (1,185) | 323 | (11,989) | |||||||||||||||||||
| Amortization of acquired above and below-market leases, net | 830 | 88 | 2,578 | 560 | |||||||||||||||||||
| Operating lease straight-line adjustment | 204 | 204 | 815 | 815 | |||||||||||||||||||
| SLG share of unconsolidated JV straight-line and free rent | (5,024) | (2,265) | (9,687) | (17,481) | |||||||||||||||||||
| SLG share of unconsolidated JV amortization of acquired above and below-market leases, net | (4,409) | (4,407) | (17,635) | (17,161) | |||||||||||||||||||
| SLG share of unconsolidated JV operating lease straight-line adjustment | — | — | — | — | |||||||||||||||||||
| Same-store cash NOI | $ | 148,192 | $ | 151,014 | $ | 593,953 | $ | 598,223 | |||||||||||||||
| Lease termination income | (2,737) | (1,102) | (6,338) | (4,054) | |||||||||||||||||||
| SLG share of unconsolidated JV lease termination income | — | (369) | (3,055) | (2,251) | |||||||||||||||||||
| Same-store cash NOI excluding lease termination income | $ | 145,455 | $ | 149,543 | $ | 584,560 | $ | 591,918 | |||||||||||||||
 |
||||||||
| Supplemental Information | 2 |
Fourth Quarter 2024 |
||||||
| TABLE OF CONTENTS | |
|||||||
| Definitions | |||||||||||
| Highlights | - | ||||||||||
| Comparative Balance Sheets | |||||||||||
| Comparative Statements of Operations | |||||||||||
| Comparative Computation of FFO and FAD | |||||||||||
| Consolidated Statement of Equity | |||||||||||
| Joint Venture Statements | - | ||||||||||
| Selected Financial Data | - | ||||||||||
| Debt Summary Schedule | - | ||||||||||
| Derivative Summary Schedule | |||||||||||
| Lease Liability Schedule | |||||||||||
| Debt and Preferred Equity Investments | - | ||||||||||
| Selected Property Data | |||||||||||
| Property Portfolio | - | ||||||||||
| Largest Tenants | |||||||||||
| Tenant Diversification | |||||||||||
| Leasing Activity | - | ||||||||||
| Lease Expirations | - | ||||||||||
| Summary of Real Estate Acquisition/Disposition Activity | - | ||||||||||
| Non-GAAP Disclosures and Reconciliations | |||||||||||
| Analyst Coverage | |||||||||||
| Executive Management | |||||||||||
| Supplemental Information | 3 |
Fourth Quarter 2024 |
||||||
|
DEFINITIONS
|
|
|||||||
| Supplemental Information | 4 |
Fourth Quarter 2024 |
||||||
|
DEFINITIONS
|
|
|||||||
| Added to Same-Store in 2024: | Removed from Same-Store in 2024: | ||||
| 885 Third Avenue | 717 Fifth Avenue (disposed) | ||||
| 450 Park Avenue | 719 Seventh Avenue (ASP) | ||||
| Worldwide Plaza (ASP) | |||||
| 115 Spring Street (ASP) | |||||
| 11 West 34th Street (ASP) | |||||
| 650 Fifth Avenue (ASP) | |||||
| 1552-1560 Broadway (ASP) | |||||
| Supplemental Information | 5 |
Fourth Quarter 2024 |
||||||
|
FOURTH QUARTER 2024 HIGHLIGHTS
Unaudited
|
|
|||||||
| Supplemental Information | 6 |
Fourth Quarter 2024 |
||||||
|
FOURTH QUARTER 2024 HIGHLIGHTS
Unaudited
|
|
|||||||
| Supplemental Information | 7 |
Fourth Quarter 2024 |
||||||
|
FOURTH QUARTER 2024 HIGHLIGHTS
Unaudited
|
|
|||||||
| Supplemental Information | 8 |
Fourth Quarter 2024 |
||||||
|
KEY FINANCIAL DATA
Unaudited
(Dollars in Thousands Except Per Share)
|
|
|||||||
| As of or for the three months ended | |||||||||||||||||||||||||||||
| 12/31/2024 | 9/30/2024 | 6/30/2024 | 3/31/2024 | 12/31/2023 | |||||||||||||||||||||||||
| Earnings Per Share | |||||||||||||||||||||||||||||
| Net income (loss) available to common stockholders (EPS) - diluted | $ | 0.13 | $ | (0.21) | $ | (0.04) | $ | 0.20 | $ | (2.45) | |||||||||||||||||||
| Funds from operations (FFO) available to common stockholders - diluted | $ | 1.81 | $ | 1.13 | $ | 2.05 | $ | 3.07 | $ | 0.72 | |||||||||||||||||||
| Common Share Price & Dividends | |||||||||||||||||||||||||||||
| Closing price at the end of the period | $ | 67.92 | $ | 69.61 | $ | 56.64 | $ | 55.13 | $ | 45.17 | |||||||||||||||||||
| Closing high price during period | $ | 81.13 | $ | 72.21 | $ | 57.38 | $ | 55.13 | $ | 48.00 | |||||||||||||||||||
| Closing low price during period | $ | 66.24 | $ | 54.99 | $ | 48.32 | $ | 42.45 | $ | 29.25 | |||||||||||||||||||
| Annual dividend per common share | $ | 3.09 | $ | 3.00 | $ | 3.00 | $ | 3.00 | $ | 3.00 | |||||||||||||||||||
| FFO dividend payout ratio (trailing 12 months) | 37.3% | 43.6% | 43.7% | 48.8% | 65.2% | ||||||||||||||||||||||||
| Funds available for distribution (FAD) dividend payout ratio (trailing 12 months) | 52.3% | 53.1% | 54.2% | 63.8% | 97.3% | ||||||||||||||||||||||||
| Common Shares & Units | |||||||||||||||||||||||||||||
| Common shares outstanding | 71,097 | 65,235 | 64,814 | 64,806 | 64,726 | ||||||||||||||||||||||||
| Units outstanding | 4,510 | 4,474 | 4,299 | 4,417 | 3,949 | ||||||||||||||||||||||||
| Total common shares and units outstanding | 75,607 | 69,709 | 69,113 | 69,223 | 68,675 | ||||||||||||||||||||||||
| Weighted average common shares and units outstanding - basic | 70,654 | 67,999 | 68,740 | 68,767 | 68,014 | ||||||||||||||||||||||||
| Weighted average common shares and units outstanding - diluted | 72,915 | 69,733 | 70,180 | 70,095 | 69,300 | ||||||||||||||||||||||||
| Market Capitalization | |||||||||||||||||||||||||||||
| Market value of common equity | $ | 5,135,227 | $ | 4,852,443 | $ | 3,914,560 | $ | 3,816,264 | $ | 3,102,050 | |||||||||||||||||||
| Liquidation value of preferred equity/units and redeemable equity | 426,064 | 396,730 | 396,730 | 396,500 | 396,500 | ||||||||||||||||||||||||
| Consolidated debt | 3,621,024 | 3,833,798 | 3,639,892 | 3,801,378 | 3,507,386 | ||||||||||||||||||||||||
| Consolidated market capitalization | $ | 9,182,315 | $ | 9,082,971 | $ | 7,951,182 | $ | 8,014,142 | $ | 7,005,936 | |||||||||||||||||||
| SLG share of unconsolidated JV debt | 6,027,862 | 6,876,416 | 6,866,190 | 7,087,348 | 7,352,275 | ||||||||||||||||||||||||
| Market capitalization including SLG share of unconsolidated JVs | $ | 15,210,177 | $ | 15,959,387 | $ | 14,817,372 | $ | 15,101,490 | $ | 14,358,211 | |||||||||||||||||||
| Consolidated debt service coverage (trailing 12 months) | 3.80x | 3.36x | 3.26x | 2.82x | 2.27x | ||||||||||||||||||||||||
| Consolidated fixed charge coverage (trailing 12 months) | 3.08x | 2.72x | 2.63x | 2.32x | 1.88x | ||||||||||||||||||||||||
| Debt service coverage, including SLG share of unconsolidated JVs (trailing 12 months) | 1.91x | 1.73x | 1.69x | 1.59x | 1.41x | ||||||||||||||||||||||||
| Fixed charge coverage, including SLG share of unconsolidated JVs (trailing 12 months) | 1.74x | 1.58x | 1.54x | 1.44x | 1.28x | ||||||||||||||||||||||||
| Supplemental Information | 9 |
Fourth Quarter 2024 |
||||||
|
KEY FINANCIAL DATA
Unaudited
(Dollars in Thousands Except Per Share)
|
|
|||||||
| As of or for the three months ended | |||||||||||||||||||||||||||||
| 12/31/2024 | 9/30/2024 | 6/30/2024 | 3/31/2024 | 12/31/2023 | |||||||||||||||||||||||||
| Selected Balance Sheet Data | |||||||||||||||||||||||||||||
| Real estate assets before depreciation | $ | 6,607,741 | $ | 6,289,894 | $ | 6,264,757 | $ | 6,260,955 | $ | 6,102,864 | |||||||||||||||||||
| Investments in unconsolidated joint ventures | $ | 2,690,138 | $ | 2,871,683 | $ | 2,895,399 | $ | 2,984,786 | $ | 2,983,313 | |||||||||||||||||||
| Debt and preferred equity investments | $ | 303,726 | $ | 293,924 | $ | 290,487 | $ | 352,347 | $ | 346,745 | |||||||||||||||||||
| Cash and cash equivalents | $ | 184,294 | $ | 188,216 | $ | 199,501 | $ | 196,035 | $ | 221,823 | |||||||||||||||||||
| Investment in marketable securities | $ | 22,812 | $ | 16,522 | $ | 16,593 | $ | 10,673 | $ | 9,591 | |||||||||||||||||||
| Total assets | $ | 10,457,940 | $ | 10,216,072 | $ | 9,548,652 | $ | 9,764,292 | $ | 9,531,181 | |||||||||||||||||||
| Consolidated fixed rate & hedged debt | $ | 3,257,474 | $ | 3,287,898 | $ | 3,039,399 | $ | 3,040,885 | $ | 3,237,386 | |||||||||||||||||||
| Consolidated variable rate debt | 363,550 | 485,000 | 540,000 | 650,000 | 160,000 | ||||||||||||||||||||||||
| Consolidated ASP debt | — | 60,900 | 60,493 | 110,493 | 110,000 | ||||||||||||||||||||||||
| Total consolidated debt | $ | 3,621,024 | $ | 3,833,798 | $ | 3,639,892 | $ | 3,801,378 | $ | 3,507,386 | |||||||||||||||||||
| Deferred financing costs, net of amortization | (14,242) | (12,903) | (14,304) | (15,875) | (16,639) | ||||||||||||||||||||||||
| Total consolidated debt, net | $ | 3,606,782 | $ | 3,820,895 | $ | 3,625,588 | $ | 3,785,503 | $ | 3,490,747 | |||||||||||||||||||
| Total liabilities | $ | 5,902,984 | $ | 6,135,743 | $ | 5,358,337 | $ | 5,521,908 | $ | 5,270,704 | |||||||||||||||||||
| Fixed rate & hedged debt, including SLG share of unconsolidated JV debt | $ | 8,711,539 | $ | 8,975,687 | $ | 8,720,916 | $ | 8,418,284 | $ | 8,703,587 | |||||||||||||||||||
Variable rate debt, including SLG share of unconsolidated JV debt (1) |
363,550 | 732,761 | 785,013 | 1,429,640 | 964,467 | ||||||||||||||||||||||||
| ASP debt, including SLG share of unconsolidated ASP JV debt | 573,797 | 1,001,766 | 1,000,153 | 1,040,802 | 1,191,607 | ||||||||||||||||||||||||
| Total debt, including SLG share of unconsolidated JV debt | $ | 9,648,886 | $ | 10,710,214 | $ | 10,506,082 | $ | 10,888,726 | $ | 10,859,661 | |||||||||||||||||||
| Selected Operating Data | |||||||||||||||||||||||||||||
| Property operating revenues | $ | 156,930 | $ | 156,933 | $ | 150,632 | $ | 141,504 | $ | 151,357 | |||||||||||||||||||
| Property operating expenses | (89,129) | (86,701) | (84,759) | (81,619) | (86,467) | ||||||||||||||||||||||||
| Property NOI | $ | 67,801 | $ | 70,232 | $ | 65,873 | $ | 59,885 | $ | 64,890 | |||||||||||||||||||
| SLG share of unconsolidated JV Property NOI | 118,072 | 122,936 | 117,506 | 116,741 | 119,506 | ||||||||||||||||||||||||
| Property NOI, including SLG share of unconsolidated JV Property NOI | $ | 185,873 | $ | 193,168 | $ | 183,379 | $ | 176,626 | $ | 184,396 | |||||||||||||||||||
| SUMMIT Operator revenue | 38,571 | 36,437 | 32,602 | 25,604 | 35,240 | ||||||||||||||||||||||||
| Investment income, including SLG share of unconsolidated JV | 10,463 | 10,089 | 7,911 | 7,403 | 7,176 | ||||||||||||||||||||||||
| Interest income from real estate loans held by consolidated securitization vehicles, net | 2,905 | 1,441 | — | — | — | ||||||||||||||||||||||||
| Other income, including SLG share of unconsolidated JV | 31,805 | 26,894 | 35,077 | 17,162 | 17,983 | ||||||||||||||||||||||||
| Gain (loss) on early extinguishment of debt, including SLG share of unconsolidated JV | 25,985 | — | 48,482 | 141,664 | (870) | ||||||||||||||||||||||||
| SUMMIT Operator expenses | (28,792) | (37,901) | (23,188) | (21,858) | (24,887) | ||||||||||||||||||||||||
| Transaction costs, including SLG share of unconsolidated JVs | (138) | (171) | (76) | (16) | (16) | ||||||||||||||||||||||||
| Marketing general & administrative expenses | (22,827) | (21,015) | (20,032) | (21,313) | (42,257) | ||||||||||||||||||||||||
| Income taxes | 2,324 | 1,406 | 1,230 | 606 | 737 | ||||||||||||||||||||||||
| EBITDAre | $ | 246,169 | $ | 210,348 | $ | 265,385 | $ | 325,878 | $ | 177,502 | |||||||||||||||||||
| (1) Does not reflect floating rate debt and preferred equity investments that provide a hedge against floating rate debt. | |||||||||||||||||||||||||||||
| Supplemental Information | 10 |
Fourth Quarter 2024 |
||||||
|
KEY FINANCIAL DATA
Manhattan Properties (1)
Unaudited
(Dollars in Thousands Except Per Share)
|
|
|||||||
| As of or for the three months ended | |||||||||||||||||||||||||||||
| 12/31/2024 | 9/30/2024 | 6/30/2024 | 3/31/2024 | 12/31/2023 | |||||||||||||||||||||||||
| Selected Operating Data | |||||||||||||||||||||||||||||
| Property operating revenues | $ | 151,614 | $ | 151,886 | $ | 145,369 | $ | 136,869 | $ | 145,542 | |||||||||||||||||||
| Property operating expenses | 77,371 | 73,841 | 73,436 | 70,223 | 73,799 | ||||||||||||||||||||||||
| Property NOI | $ | 74,243 | $ | 78,045 | $ | 71,933 | $ | 66,646 | $ | 71,743 | |||||||||||||||||||
| Other income - consolidated | $ | 4,157 | $ | 2,967 | $ | 2,270 | $ | 2,136 | $ | 2,190 | |||||||||||||||||||
| SLG share of property NOI from unconsolidated JVs | $ | 117,958 | $ | 123,401 | $ | 117,384 | $ | 116,617 | $ | 120,572 | |||||||||||||||||||
| Office Portfolio Statistics (Manhattan Operating Properties) | |||||||||||||||||||||||||||||
| Consolidated office buildings in service | 15 | 14 | 14 | 14 | 13 | ||||||||||||||||||||||||
| Unconsolidated office buildings in service | 9 | 10 | 10 | 10 | 12 | ||||||||||||||||||||||||
| 24 | 24 | 24 | 24 | 25 | |||||||||||||||||||||||||
| Consolidated office buildings in service - square footage | 9,587,441 | 8,753,441 | 8,753,441 | 8,753,441 | 8,399,141 | ||||||||||||||||||||||||
| Unconsolidated office buildings in service - square footage | 12,175,149 | 13,009,149 | 13,009,149 | 13,009,149 | 15,412,174 | ||||||||||||||||||||||||
| 21,762,590 | 21,762,590 | 21,762,590 | 21,762,590 | 23,811,315 | |||||||||||||||||||||||||
| Same-Store office occupancy inclusive of leases signed not yet commenced | 92.5% | 90.1% | 89.6% | 89.2% | 89.8% | ||||||||||||||||||||||||
| Office Leasing Statistics (Manhattan Operating Properties) | |||||||||||||||||||||||||||||
| New leases commenced | 24 | 29 | 30 | 31 | 20 | ||||||||||||||||||||||||
| Renewal leases commenced | 10 | 17 | 12 | 19 | 6 | ||||||||||||||||||||||||
| Total office leases commenced | 34 | 46 | 42 | 50 | 26 | ||||||||||||||||||||||||
| Commenced office square footage filling vacancy | 133,978 | 179,200 | 195,953 | 109,576 | 37,718 | ||||||||||||||||||||||||
Commenced office square footage on previously occupied space (M-T-M leasing) (2) |
1,015,833 | 540,288 | 211,251 | 280,879 | 235,703 | ||||||||||||||||||||||||
| Total office square footage commenced | 1,149,811 | 719,488 | 407,204 | 390,455 | 273,421 | ||||||||||||||||||||||||
| Average starting cash rent psf - office leases commenced | $ | 80.72 | $ | 106.76 | $ | 96.79 | $ | 75.11 | $ | 107.62 | |||||||||||||||||||
Previous escalated cash rent psf - office leases commenced (3) |
$ | 71.18 | $ | 95.44 | $ | 100.86 | $ | 76.02 | $ | 102.55 | |||||||||||||||||||
Increase (decrease) in new cash rent over previously escalated cash rent (2) (3) |
13.4% | 11.9% | (4.0)% | (1.2)% | 4.9% | ||||||||||||||||||||||||
| Average lease term | 10.5 | 10.5 | 11.9 | 7.0 | 11.5 | ||||||||||||||||||||||||
| Tenant concession packages psf | $ | 102.30 | $ | 103.37 | $ | 105.17 | $ | 52.48 | $ | 102.43 | |||||||||||||||||||
| Free rent months | 11.8 | 11.5 | 10.0 | 7.3 | 10.3 | ||||||||||||||||||||||||
| (1) Property data for operating buildings only. | |||||||||||||||||||||||||||||
| (2) Calculated on space that was occupied within the previous 12 months. | |||||||||||||||||||||||||||||
| (3) Previously escalated cash rent includes base rent plus all additional amounts paid by the previous tenant in the form of real estate taxes, operating expenses, porters wage or a consumer price index (CPI) adjustment. | |||||||||||||||||||||||||||||
| Supplemental Information | 11 |
Fourth Quarter 2024 |
||||||
|
COMPARATIVE BALANCE SHEETS
Unaudited
(Dollars in Thousands)
|
|
|||||||
| As of | |||||||||||||||||||||||||||||
| 12/31/2024 | 9/30/2024 | 6/30/2024 | 3/31/2024 | 12/31/2023 | |||||||||||||||||||||||||
| Assets | |||||||||||||||||||||||||||||
| Commercial real estate properties, at cost: | |||||||||||||||||||||||||||||
| Land and land interests | $ | 1,357,041 | $ | 1,134,432 | $ | 1,134,432 | $ | 1,150,681 | $ | 1,092,671 | |||||||||||||||||||
| Building and improvements | 3,862,224 | 3,781,403 | 3,743,316 | 3,729,884 | 3,655,624 | ||||||||||||||||||||||||
| Building leasehold and improvements | 1,388,476 | 1,374,059 | 1,365,423 | 1,358,851 | 1,354,569 | ||||||||||||||||||||||||
| 6,607,741 | 6,289,894 | 6,243,171 | 6,239,416 | 6,102,864 | |||||||||||||||||||||||||
| Less: accumulated depreciation | (2,126,081) | (2,084,755) | (2,041,102) | (2,005,893) | (1,968,004) | ||||||||||||||||||||||||
| Net real estate | 4,481,660 | 4,205,139 | 4,202,069 | 4,233,523 | 4,134,860 | ||||||||||||||||||||||||
| Other real estate investments: | |||||||||||||||||||||||||||||
Debt and preferred equity investments, net (1) |
303,726 | 293,924 | 290,487 | 352,347 | 346,745 | ||||||||||||||||||||||||
| Investment in unconsolidated joint ventures | 2,690,138 | 2,871,683 | 2,895,399 | 2,984,786 | 2,983,313 | ||||||||||||||||||||||||
| Assets held for sale, net | — | — | 21,615 | 21,586 | — | ||||||||||||||||||||||||
| Cash and cash equivalents | 184,294 | 188,216 | 199,501 | 196,035 | 221,823 | ||||||||||||||||||||||||
| Restricted cash | 147,344 | 126,909 | 116,310 | 122,461 | 113,696 | ||||||||||||||||||||||||
| Investment in marketable securities | 22,812 | 16,522 | 16,593 | 10,673 | 9,591 | ||||||||||||||||||||||||
| Tenant and other receivables | 44,055 | 53,628 | 41,202 | 38,659 | 33,270 | ||||||||||||||||||||||||
| Related party receivables | 26,865 | 13,077 | 8,127 | 12,229 | 12,168 | ||||||||||||||||||||||||
| Deferred rents receivable | 266,428 | 266,606 | 266,596 | 267,969 | 264,653 | ||||||||||||||||||||||||
| Deferred costs, net | 117,132 | 105,646 | 107,163 | 109,296 | 111,463 | ||||||||||||||||||||||||
| Right-of-use assets - operating leases | 865,639 | 870,782 | 875,878 | 880,926 | 885,929 | ||||||||||||||||||||||||
| Real estate loans held by consolidated securitization vehicles | 709,095 | 713,218 | — | — | — | ||||||||||||||||||||||||
| Other assets | 598,752 | 490,722 | 507,712 | 533,802 | 413,670 | ||||||||||||||||||||||||
| Total Assets | $ | 10,457,940 | $ | 10,216,072 | $ | 9,548,652 | $ | 9,764,292 | $ | 9,531,181 | |||||||||||||||||||
| (1) This balance excludes a $214.7 million preferred equity investment included in the Investment in unconsolidated joint ventures line item. | |||||||||||||||||||||||||||||
| Supplemental Information | 12 |
Fourth Quarter 2024 |
||||||
|
COMPARATIVE BALANCE SHEETS
Unaudited
(Dollars in Thousands)
|
|
|||||||
| As of | |||||||||||||||||||||||||||||
| 12/31/2024 | 9/30/2024 | 6/30/2024 | 3/31/2024 | 12/31/2023 | |||||||||||||||||||||||||
| Liabilities | |||||||||||||||||||||||||||||
| Mortgages and other loans payable | $ | 1,951,024 | $ | 1,648,798 | $ | 1,649,892 | $ | 1,701,378 | $ | 1,497,386 | |||||||||||||||||||
| Unsecured term loans | 1,150,000 | 1,250,000 | 1,250,000 | 1,250,000 | 1,250,000 | ||||||||||||||||||||||||
| Unsecured notes | 100,000 | 100,000 | 100,000 | 100,000 | 100,000 | ||||||||||||||||||||||||
| Revolving credit facility | 320,000 | 735,000 | 540,000 | 650,000 | 560,000 | ||||||||||||||||||||||||
| Deferred financing costs | (14,242) | (12,903) | (14,304) | (15,875) | (16,639) | ||||||||||||||||||||||||
| Total debt, net of deferred financing costs | 3,506,782 | 3,720,895 | 3,525,588 | 3,685,503 | 3,390,747 | ||||||||||||||||||||||||
| Accrued interest payable | 2,727 | 22,825 | 20,083 | 23,217 | 17,930 | ||||||||||||||||||||||||
| Accounts payable and accrued expenses | 122,674 | 125,377 | 121,050 | 101,495 | 153,164 | ||||||||||||||||||||||||
| Deferred revenue | 164,887 | 154,700 | 153,660 | 157,756 | 134,053 | ||||||||||||||||||||||||
| Lease liability - financing leases | 106,853 | 106,518 | 106,187 | 105,859 | 105,531 | ||||||||||||||||||||||||
| Lease liability - operating leases | 810,989 | 815,238 | 819,439 | 823,594 | 827,692 | ||||||||||||||||||||||||
| Dividends and distributions payable | 21,816 | 20,147 | 20,088 | 20,135 | 20,280 | ||||||||||||||||||||||||
| Security deposits | 60,331 | 56,297 | 58,002 | 56,398 | 49,906 | ||||||||||||||||||||||||
| Liabilities related to assets held for sale | — | — | 10,424 | 10,649 | — | ||||||||||||||||||||||||
| Junior subordinated deferrable interest debentures | 100,000 | 100,000 | 100,000 | 100,000 | 100,000 | ||||||||||||||||||||||||
| Senior obligations of consolidated securitization vehicles | 590,131 | 603,902 | — | — | — | ||||||||||||||||||||||||
| Other liabilities | 415,794 | 409,844 | 423,816 | 437,302 | 471,401 | ||||||||||||||||||||||||
| Total Liabilities | 5,902,984 | 6,135,743 | 5,358,337 | 5,521,908 | 5,270,704 | ||||||||||||||||||||||||
| Noncontrolling interests in Operating Partnership | |||||||||||||||||||||||||||||
(4,510 units outstanding at 12/31/2024) |
288,941 | 293,593 | 265,823 | 272,235 | 238,051 | ||||||||||||||||||||||||
| Preferred units and redeemable equity | 196,064 | 166,731 | 166,731 | 166,501 | 166,501 | ||||||||||||||||||||||||
| Equity | |||||||||||||||||||||||||||||
| SL Green stockholders' equity: | |||||||||||||||||||||||||||||
| Series I Preferred Stock | 221,932 | 221,932 | 221,932 | 221,932 | 221,932 | ||||||||||||||||||||||||
Common stock, $0.01 par value, 160,000 shares authorized, 71,097 |
|||||||||||||||||||||||||||||
issued and outstanding at 12/31/2024 |
711 | 663 | 660 | 660 | 660 | ||||||||||||||||||||||||
| Additional paid–in capital | 4,159,562 | 3,866,088 | 3,836,751 | 3,831,130 | 3,826,452 | ||||||||||||||||||||||||
| Treasury stock at cost | — | (128,655) | (128,655) | (128,655) | (128,655) | ||||||||||||||||||||||||
| Accumulated other comprehensive earnings (loss) | 18,196 | (27,308) | 40,371 | 40,151 | 17,477 | ||||||||||||||||||||||||
| Retained deficit | (449,101) | (376,435) | (279,763) | (229,607) | (151,551) | ||||||||||||||||||||||||
| Total SL Green Realty Corp. stockholders' equity | 3,951,300 | 3,556,285 | 3,691,296 | 3,735,611 | 3,786,315 | ||||||||||||||||||||||||
| Noncontrolling interests in other partnerships | 118,651 | 63,720 | 66,465 | 68,037 | 69,610 | ||||||||||||||||||||||||
| Total Equity | 4,069,951 | 3,620,005 | 3,757,761 | 3,803,648 | 3,855,925 | ||||||||||||||||||||||||
| Total Liabilities and Equity | $ | 10,457,940 | $ | 10,216,072 | $ | 9,548,652 | $ | 9,764,292 | $ | 9,531,181 | |||||||||||||||||||
| Supplemental Information | 13 |
Fourth Quarter 2024 |
||||||
|
COMPARATIVE STATEMENT OF OPERATIONS
Unaudited
(Dollars in Thousands Except Per Share)
|
|
|||||||
| Three Months Ended | Twelve Months Ended | ||||||||||||||||||||||||||||
| December 31, | December 31, | September 30, | December 31, | December 31, | |||||||||||||||||||||||||
| 2024 | 2023 | 2024 | 2024 | 2023 | |||||||||||||||||||||||||
| Revenues | |||||||||||||||||||||||||||||
| Rental revenue, net | $ | 139,613 | $ | 131,927 | $ | 139,616 | $ | 542,995 | $ | 603,694 | |||||||||||||||||||
| Escalation and reimbursement revenues | 17,317 | 19,430 | 17,317 | 63,004 | 79,641 | ||||||||||||||||||||||||
| SUMMIT Operator revenue | 38,571 | 35,240 | 36,437 | 133,214 | 118,260 | ||||||||||||||||||||||||
| Investment income | 5,415 | 6,856 | 5,344 | 24,353 | 34,705 | ||||||||||||||||||||||||
| Interest income from real estate loans held by consolidated securitization vehicles | 14,209 | — | 4,771 | 18,980 | — | ||||||||||||||||||||||||
| Other income | 30,754 | 18,271 | 26,206 | 103,726 | 77,410 | ||||||||||||||||||||||||
| Total Revenues | 245,879 | 211,724 | 229,691 | 886,272 | 913,710 | ||||||||||||||||||||||||
| Gain (Loss) on early extinguishment of debt | 25,985 | (870) | — | 43,762 | (870) | ||||||||||||||||||||||||
| Expenses | |||||||||||||||||||||||||||||
| Operating expenses ⁽¹⁾ | 50,150 | 48,090 | 49,507 | 189,598 | 196,696 | ||||||||||||||||||||||||
| Real estate taxes | 33,692 | 31,294 | 30,831 | 128,187 | 143,757 | ||||||||||||||||||||||||
| Operating lease rent | 5,287 | 7,083 | 6,363 | 24,423 | 27,292 | ||||||||||||||||||||||||
| SUMMIT Operator expenses | 28,792 | 24,887 | 37,901 | 111,739 | 101,211 | ||||||||||||||||||||||||
| Loan loss and other investment reserves, net of recoveries | — | — | — | — | 6,890 | ||||||||||||||||||||||||
| Transaction related costs | 138 | 16 | 171 | 401 | 1,099 | ||||||||||||||||||||||||
| Marketing, general and administrative | 22,827 | 42,257 | 21,015 | 85,187 | 111,389 | ||||||||||||||||||||||||
| Total Operating Expenses | 140,886 | 153,627 | 145,788 | 539,535 | 588,334 | ||||||||||||||||||||||||
| Equity in net income (loss) from unconsolidated joint ventures ⁽²⁾ | (16,562) | (32,039) | (15,428) | 83,495 | (76,509) | ||||||||||||||||||||||||
| Operating Income | 114,416 | 25,188 | 68,475 | 473,994 | 247,997 | ||||||||||||||||||||||||
| Interest expense, net of interest income | 38,153 | 27,400 | 42,091 | 147,220 | 137,114 | ||||||||||||||||||||||||
| Amortization of deferred financing costs | 1,734 | 1,510 | 1,669 | 6,619 | 7,837 | ||||||||||||||||||||||||
| SUMMIT Operator tax expense | 1,949 | 2,320 | (1,779) | 730 | 9,201 | ||||||||||||||||||||||||
| Interest expense on senior obligations of consolidated securitization vehicles | 11,304 | — | 3,330 | 14,634 | — | ||||||||||||||||||||||||
| Depreciation and amortization | 53,436 | 49,050 | 53,176 | 207,443 | 247,810 | ||||||||||||||||||||||||
| Income (Loss) from Continuing Operations ⁽³⁾ | 7,840 | (55,092) | (30,012) | 97,348 | (153,965) | ||||||||||||||||||||||||
| Equity in net gain (loss) on sale of interest in unconsolidated joint venture/real estate | 189,138 | (13,289) | 371 | 208,144 | (13,368) | ||||||||||||||||||||||||
| Purchase price and other fair value adjustments | 125,287 | (10,273) | 12,906 | 88,966 | (17,260) | ||||||||||||||||||||||||
| (Loss) gain on sale of real estate, net | (1,705) | (4,557) | 7,471 | 3,025 | (32,370) | ||||||||||||||||||||||||
| Depreciable real estate reserves | (38,232) | (76,847) | — | (104,071) | (382,374) | ||||||||||||||||||||||||
| Depreciable real estate reserves in unconsolidated joint venture | (263,190) | — | — | (263,190) | — | ||||||||||||||||||||||||
| Net Income (Loss) | 19,138 | (160,058) | (9,264) | 30,222 | (599,337) | ||||||||||||||||||||||||
| Net (income) loss attributable to noncontrolling interests | (3,885) | 10,081 | 1,899 | 431 | 42,033 | ||||||||||||||||||||||||
| Preferred units distributions | (2,158) | (1,903) | (2,176) | (8,643) | (7,255) | ||||||||||||||||||||||||
| Net Income (Loss) attributable to SL Green | 13,095 | (151,880) | (9,541) | 22,010 | (564,559) | ||||||||||||||||||||||||
| Perpetual preferred stock dividends | (3,737) | (3,737) | (3,738) | (14,950) | (14,950) | ||||||||||||||||||||||||
| Net Income (Loss) attributable to SL Green common stockholders | $ | 9,358 | $ | (155,617) | $ | (13,279) | $ | 7,060 | $ | (579,509) | |||||||||||||||||||
| Basic earnings (loss) per share | $ | 0.13 | $ | (2.45) | $ | (0.21) | $ | 0.08 | $ | (9.12) | |||||||||||||||||||
| Diluted earnings (loss) per share | $ | 0.13 | $ | (2.45) | $ | (0.21) | $ | 0.08 | $ | (9.12) | |||||||||||||||||||
(1) Includes property operating expenses and expenses of SL Green Management Corp., Emerge 212, Belmont Insurance Company and Ticonderoga Insurance Company. |
|||||||||||||||||||||||||||||
| (2) Excludes Depreciable real estate reserves in unconsolidated joint venture. | |||||||||||||||||||||||||||||
| (3) Before equity in net gain (loss), purchase price and other fair value adjustments, (loss) gain on sale and depreciable real estate reserves shown below. | |||||||||||||||||||||||||||||
| Supplemental Information | 14 |
Fourth Quarter 2024 |
||||||
|
COMPARATIVE COMPUTATION OF FFO AND FAD
Unaudited
(Dollars in Thousands Except Per Share)
|
|
|||||||
| Three Months Ended | Twelve Months Ended | |||||||||||||||||||||||||||||||
| December 31, | December 31, | September 30, | December 31, | December 31, | ||||||||||||||||||||||||||||
| 2024 | 2023 | 2024 | 2024 | 2023 | ||||||||||||||||||||||||||||
| Funds from Operations | ||||||||||||||||||||||||||||||||
| Net Income (Loss) attributable to SL Green common stockholders | $ | 9,358 | $ | (155,617) | $ | (13,279) | $ | 7,060 | $ | (579,509) | ||||||||||||||||||||||
| Depreciation and amortization | 53,436 | 49,050 | 53,176 | 207,443 | 247,810 | |||||||||||||||||||||||||||
| Joint ventures depreciation and noncontrolling interests adjustments | 69,636 | 73,062 | 71,539 | 287,671 | 284,284 | |||||||||||||||||||||||||||
| Net income (loss) attributable to noncontrolling interests | 3,885 | (10,081) | (1,899) | (431) | (42,033) | |||||||||||||||||||||||||||
| Equity in net (gain) loss on sale of interest in unconsolidated joint venture/real estate | (189,138) | 13,289 | (371) | (208,144) | 13,368 | |||||||||||||||||||||||||||
| Purchase price and other fair value adjustments | (117,195) | — | (21,937) | (83,430) | 6,813 | |||||||||||||||||||||||||||
| Loss (Gain) on sale of real estate, net | 1,705 | 4,557 | (7,471) | (3,025) | 32,370 | |||||||||||||||||||||||||||
| Depreciable real estate reserves | 38,232 | 76,847 | — | 104,071 | 382,374 | |||||||||||||||||||||||||||
| Depreciable real estate reserves in unconsolidated joint venture | 263,190 | — | — | 263,190 | — | |||||||||||||||||||||||||||
| Depreciation on non-rental real estate assets | (1,226) | (1,414) | (1,204) | (4,583) | (4,136) | |||||||||||||||||||||||||||
| Funds From Operations | $ | 131,883 | $ | 49,693 | $ | 78,554 | $ | 569,822 | $ | 341,341 | ||||||||||||||||||||||
| Funds From Operations - Basic per Share | $ | 1.87 | $ | 0.72 | $ | 1.16 | $ | 8.29 | $ | 4.98 | ||||||||||||||||||||||
| Funds From Operations - Diluted per Share | $ | 1.81 | $ | 0.72 | $ | 1.13 | $ | 8.11 | $ | 4.94 | ||||||||||||||||||||||
| Funds Available for Distribution | ||||||||||||||||||||||||||||||||
| FFO | $ | 131,883 | $ | 49,693 | $ | 78,554 | $ | 569,822 | $ | 341,341 | ||||||||||||||||||||||
| Non real estate depreciation and amortization | 1,226 | 1,414 | 1,204 | 4,583 | 4,136 | |||||||||||||||||||||||||||
| Amortization of deferred financing costs | 1,734 | 1,510 | 1,669 | 6,619 | 7,837 | |||||||||||||||||||||||||||
| Non-cash deferred compensation | 15,936 | 23,398 | 9,392 | 45,562 | 62,352 | |||||||||||||||||||||||||||
| FAD adjustment for joint ventures | (60,733) | (20,641) | (13,960) | (101,240) | (81,112) | |||||||||||||||||||||||||||
| Straight-line rental income and other non-cash adjustments | 129 | (1,484) | 1,094 | 659 | (20,188) | |||||||||||||||||||||||||||
| Non-cash fair value adjustments on mark-to-market derivatives | (8,092) | 10,273 | 9,030 | (5,537) | — | |||||||||||||||||||||||||||
| Second cycle tenant improvements | (21,826) | (15,355) | (17,401) | (72,011) | (52,300) | |||||||||||||||||||||||||||
| Second cycle leasing commissions | (8,545) | (2,705) | (4,292) | (20,115) | (9,335) | |||||||||||||||||||||||||||
| Revenue enhancing recurring CAPEX | (204) | (841) | (19) | (275) | (1,458) | |||||||||||||||||||||||||||
| Non-revenue enhancing recurring CAPEX | (10,984) | (8,326) | (5,138) | (23,234) | (21,530) | |||||||||||||||||||||||||||
| Reported Funds Available for Distribution | $ | 40,524 | $ | 36,936 | $ | 60,133 | $ | 404,833 | $ | 229,743 | ||||||||||||||||||||||
| First cycle tenant improvements | $ | 285 | $ | 516 | $ | 439 | $ | 2,313 | $ | 1,960 | ||||||||||||||||||||||
| First cycle leasing commissions | $ | 2,686 | $ | 9 | $ | 11 | $ | 2,737 | $ | 388 | ||||||||||||||||||||||
| Development costs | $ | 9,904 | $ | 19,361 | $ | 10,742 | $ | 49,765 | $ | 56,529 | ||||||||||||||||||||||
| Redevelopment costs | $ | 2,800 | $ | 6,372 | $ | 1,165 | $ | 8,489 | $ | 16,320 | ||||||||||||||||||||||
| Capitalized interest | $ | 8,922 | $ | 18,064 | $ | 9,493 | $ | 50,148 | $ | 95,980 | ||||||||||||||||||||||
| Supplemental Information | 15 |
Fourth Quarter 2024 |
||||||
|
CONSOLIDATED STATEMENT OF EQUITY
Unaudited
(Dollars in Thousands)
|
|
|||||||
| Accumulated | ||||||||||||||||||||||||||||||||||||||||||||||||||||||||
| Series I | Other | |||||||||||||||||||||||||||||||||||||||||||||||||||||||
| Preferred | Common | Additional | Treasury | Retained | Noncontrolling | Comprehensive | ||||||||||||||||||||||||||||||||||||||||||||||||||
| Stock | Stock | Paid-In Capital | Stock | Deficit | Interests | Income | Total | |||||||||||||||||||||||||||||||||||||||||||||||||
| Balance at December 31, 2023 | $ | 221,932 | $ | 660 | $ | 3,826,452 | $ | (128,655) | $ | (151,551) | $ | 69,610 | $ | 17,477 | $ | 3,855,925 | ||||||||||||||||||||||||||||||||||||||||
| Net income | 22,010 | (928) | 21,082 | |||||||||||||||||||||||||||||||||||||||||||||||||||||
| Acquisition of subsidiary interest from noncontrolling interest | (4,130) | (1,926) | (6,056) | |||||||||||||||||||||||||||||||||||||||||||||||||||||
| Other comprehensive income - net unrealized gain on derivative instruments | 3,978 | 3,978 | ||||||||||||||||||||||||||||||||||||||||||||||||||||||
| Other comprehensive loss - SLG share of unconsolidated joint venture net unrealized loss on derivative instruments | (3,784) | (3,784) | ||||||||||||||||||||||||||||||||||||||||||||||||||||||
| Other comprehensive income - net unrealized gain on marketable securities | 525 | 525 | ||||||||||||||||||||||||||||||||||||||||||||||||||||||
| Perpetual preferred stock dividends | (14,950) | (14,950) | ||||||||||||||||||||||||||||||||||||||||||||||||||||||
| DRSPP proceeds | 7 | 52,301 | 52,308 | |||||||||||||||||||||||||||||||||||||||||||||||||||||
| Measurement adjustment for redeemable noncontrolling interest | (107,631) | (107,631) | ||||||||||||||||||||||||||||||||||||||||||||||||||||||
| Deferred compensation plan and stock awards, net of forfeitures and tax withholdings | 4 | 26,844 | 26,848 | |||||||||||||||||||||||||||||||||||||||||||||||||||||
| Proceeds from issuance of common stock | 51 | 386,739 | 386,790 | |||||||||||||||||||||||||||||||||||||||||||||||||||||
| Repurchases of common stock | (11) | (128,644) | 128,655 | — | ||||||||||||||||||||||||||||||||||||||||||||||||||||
| Contributions to consolidated joint venture interests | 6,656 | 6,656 | ||||||||||||||||||||||||||||||||||||||||||||||||||||||
| Consolidation of partially owned entity | 59,452 | 59,452 | ||||||||||||||||||||||||||||||||||||||||||||||||||||||
| Cash distributions to noncontrolling interests | (14,213) | (14,213) | ||||||||||||||||||||||||||||||||||||||||||||||||||||||
Cash distributions declared ($3.01 per common share, none of which represented a return of capital for federal income tax purposes) |
(196,979) | (196,979) | ||||||||||||||||||||||||||||||||||||||||||||||||||||||
| Balance at December 31, 2024 | $ | 221,932 | $ | 711 | $ | 4,159,562 | $ | — | $ | (449,101) | $ | 118,651 | $ | 18,196 | $ | 4,069,951 | ||||||||||||||||||||||||||||||||||||||||
| RECONCILIATION OF SHARES AND UNITS OUTSTANDING, AND DILUTION COMPUTATION | ||||||||||||||||||||||||||||||||||||||||||||||||||||||||
| Common Stock | OP Units | Stock-Based Compensation | Contingently Issuable Shares | Diluted Shares | ||||||||||||||||||||||||||||||||||||||||||||||||||||
| Share Count at December 31, 2023 | 64,726,253 | 3,949,448 | — | — | 68,675,701 | |||||||||||||||||||||||||||||||||||||||||||||||||||
| YTD share activity | 6,370,490 | 560,505 | — | — | 6,930,995 | |||||||||||||||||||||||||||||||||||||||||||||||||||
| Share Count at December 31, 2024 | 71,096,743 | 4,509,953 | — | — | 75,606,696 | |||||||||||||||||||||||||||||||||||||||||||||||||||
| Weighting factor | (6,034,833) | (835,643) | 1,419,634 | 111,655 | (5,339,187) | |||||||||||||||||||||||||||||||||||||||||||||||||||
| Weighted Average Share Count at December 31, 2024 - Diluted | 65,061,910 | 3,674,310 | 1,419,634 | 111,655 | 70,267,509 | |||||||||||||||||||||||||||||||||||||||||||||||||||
| Supplemental Information | 16 |
Fourth Quarter 2024 |
||||||
|
JOINT VENTURE STATEMENTS
Balance Sheet for Unconsolidated Joint Ventures
Unaudited
(Dollars in Thousands)
|
|
|||||||
| As of | |||||||||||||||||||||||||||||||||||
| December 31, 2024 | September 30, 2024 | June 30, 2024 | |||||||||||||||||||||||||||||||||
| Total | SLG Share | Total | SLG Share | Total | SLG Share | ||||||||||||||||||||||||||||||
| Assets | |||||||||||||||||||||||||||||||||||
| Commercial real estate properties, at cost: | |||||||||||||||||||||||||||||||||||
| Land and land interests | $ | 4,146,384 | $ | 2,009,704 | $ | 4,222,970 | $ | 2,110,135 | $ | 4,222,970 | $ | 2,110,135 | |||||||||||||||||||||||
| Building and improvements | 13,341,755 | 6,474,343 | 14,209,648 | 7,119,004 | 14,103,745 | 7,082,454 | |||||||||||||||||||||||||||||
| Building leasehold and improvements | 274,456 | 181,184 | 1,023,401 | 415,555 | 1,008,186 | 408,457 | |||||||||||||||||||||||||||||
| 17,762,595 | 8,665,231 | 19,456,019 | 9,644,694 | 19,334,901 | 9,601,046 | ||||||||||||||||||||||||||||||
| Less: accumulated depreciation | (2,435,053) | (1,274,525) | (2,921,620) | (1,483,770) | (2,820,658) | (1,430,518) | |||||||||||||||||||||||||||||
| Net real estate | 15,327,542 | 7,390,706 | 16,534,399 | 8,160,924 | 16,514,243 | 8,170,528 | |||||||||||||||||||||||||||||
| Other real estate investments: | |||||||||||||||||||||||||||||||||||
| Debt and preferred equity investments, net | 236,512 | 215,061 | 231,080 | 210,121 | 225,743 | 205,268 | |||||||||||||||||||||||||||||
| Cash and cash equivalents | 330,348 | 131,568 | 312,785 | 156,150 | 311,324 | 155,441 | |||||||||||||||||||||||||||||
| Restricted cash | 319,078 | 164,682 | 383,225 | 208,895 | 361,579 | 201,126 | |||||||||||||||||||||||||||||
| Tenant and other receivables | 17,509 | 9,620 | 36,225 | 22,928 | 22,346 | 15,333 | |||||||||||||||||||||||||||||
| Deferred rents receivable | 604,239 | 325,897 | 607,085 | 349,136 | 597,063 | 344,123 | |||||||||||||||||||||||||||||
| Deferred costs, net | 390,646 | 196,818 | 367,001 | 196,994 | 330,642 | 179,972 | |||||||||||||||||||||||||||||
| Right-of-use assets - financing leases | 728,149 | 513,345 | 730,386 | 515,245 | 732,548 | 516,603 | |||||||||||||||||||||||||||||
| Right-of-use assets - operating leases | 191,509 | 92,920 | 195,075 | 94,555 | 198,611 | 96,176 | |||||||||||||||||||||||||||||
| Other assets | 1,348,903 | 625,717 | 2,085,063 | 875,529 | 2,145,709 | 897,768 | |||||||||||||||||||||||||||||
| Total Assets | $ | 19,494,435 | $ | 9,666,334 | $ | 21,482,324 | $ | 10,790,477 | $ | 21,439,808 | $ | 10,782,338 | |||||||||||||||||||||||
| Liabilities and Equity | |||||||||||||||||||||||||||||||||||
|
Mortgage and other loans payable, net of deferred financing costs of
$97,729 at 12/31/2024, of which $49,058 is SLG share
|
$ | 12,234,261 | $ | 5,978,804 | $ | 13,653,311 | $ | 6,829,019 | $ | 13,593,682 | $ | 6,816,499 | |||||||||||||||||||||||
| Accrued interest payable | 56,299 | 25,445 | 99,785 | 40,179 | 64,401 | 28,380 | |||||||||||||||||||||||||||||
| Accounts payable and accrued expenses | 346,726 | 162,633 | 223,087 | 114,935 | 241,413 | 121,004 | |||||||||||||||||||||||||||||
| Deferred revenue | 956,217 | 431,127 | 1,011,333 | 459,505 | 1,022,793 | 462,077 | |||||||||||||||||||||||||||||
| Lease liability - financing leases | 790,252 | 547,115 | 790,341 | 548,358 | 790,442 | 549,067 | |||||||||||||||||||||||||||||
| Lease liability - operating leases | 217,833 | 107,460 | 220,920 | 108,935 | 223,978 | 110,396 | |||||||||||||||||||||||||||||
| Security deposits | 43,544 | 19,690 | 46,854 | 21,672 | 46,383 | 21,702 | |||||||||||||||||||||||||||||
| Other liabilities | 73,013 | 40,197 | 129,683 | 76,074 | 78,344 | 51,570 | |||||||||||||||||||||||||||||
| Equity | 4,776,290 | 2,353,863 | 5,307,010 | 2,591,800 | 5,378,372 | 2,621,643 | |||||||||||||||||||||||||||||
| Total Liabilities and Equity | $ | 19,494,435 | $ | 9,666,334 | $ | 21,482,324 | $ | 10,790,477 | $ | 21,439,808 | $ | 10,782,338 | |||||||||||||||||||||||
| Supplemental Information | 17 |
Fourth Quarter 2024 |
||||||
|
JOINT VENTURE STATEMENTS
Statement of Operations for Unconsolidated Joint Ventures
Unaudited
(Dollars in Thousands)
|
|
|||||||
| Three Months Ended | |||||||||||||||||||||||||||||||||||
| December 31, 2024 | December 31, 2023 | September 30, 2024 | |||||||||||||||||||||||||||||||||
| Total | SLG Share | Total | SLG Share | Total | SLG Share | ||||||||||||||||||||||||||||||
| Revenues | |||||||||||||||||||||||||||||||||||
| Rental revenue, net | $ | 304,267 | $ | 157,190 | $ | 321,457 | $ | 164,315 | $ | 308,567 | $ | 162,987 | |||||||||||||||||||||||
| Escalation and reimbursement revenues | 64,234 | 35,069 | 61,423 | 33,680 | 61,545 | 35,753 | |||||||||||||||||||||||||||||
| Investment income | 5,865 | 5,048 | 1,262 | 320 | 4,904 | 4,745 | |||||||||||||||||||||||||||||
| Other income | 2,798 | 1,051 | 13 | (288) | 1,933 | 688 | |||||||||||||||||||||||||||||
| Total Revenues | 377,164 | 198,358 | 384,155 | 198,027 | 376,949 | 204,173 | |||||||||||||||||||||||||||||
| Gain on early extinguishment of debt | — | — | — | — | — | — | |||||||||||||||||||||||||||||
| Expenses | |||||||||||||||||||||||||||||||||||
| Operating expenses | 66,971 | 34,568 | 69,805 | 36,463 | 67,104 | 35,732 | |||||||||||||||||||||||||||||
| Real estate taxes | 74,723 | 37,826 | 77,034 | 38,649 | 73,686 | 38,119 | |||||||||||||||||||||||||||||
| Operating lease rent | 7,217 | 1,793 | 7,302 | 3,377 | 8,487 | 1,953 | |||||||||||||||||||||||||||||
| Total Operating Expenses | 148,911 | 74,187 | 154,141 | 78,489 | 149,277 | 75,804 | |||||||||||||||||||||||||||||
| Operating Income | 228,253 | 124,171 | 230,014 | 119,538 | 227,672 | 128,369 | |||||||||||||||||||||||||||||
| Interest expense, net of interest income | 140,031 | 67,099 | 152,504 | 73,012 | 141,067 | 67,670 | |||||||||||||||||||||||||||||
| Amortization of deferred financing costs | 6,571 | 3,459 | 7,017 | 2,876 | 4,487 | 2,413 | |||||||||||||||||||||||||||||
| Depreciation and amortization | 130,961 | 67,046 | 135,599 | 69,588 | 137,640 | 67,954 | |||||||||||||||||||||||||||||
| Net Loss | (49,310) | (13,433) | (65,106) | (25,938) | (55,522) | (9,668) | |||||||||||||||||||||||||||||
| Real estate depreciation | 130,959 | 67,046 | 135,593 | 69,583 | 137,639 | 67,953 | |||||||||||||||||||||||||||||
| FFO Contribution | $ | 81,649 | $ | 53,613 | $ | 70,487 | $ | 43,645 | $ | 82,117 | $ | 58,285 | |||||||||||||||||||||||
| FAD Adjustments: | |||||||||||||||||||||||||||||||||||
| Non real estate depreciation and amortization | $ | 2 | $ | — | $ | 6 | $ | 5 | $ | 1 | $ | 1 | |||||||||||||||||||||||
| Amortization of deferred financing costs | 6,571 | 3,459 | 7,017 | 2,876 | 4,487 | 2,413 | |||||||||||||||||||||||||||||
| Straight-line rental income and other non-cash adjustments | (41,700) | (21,369) | (17,634) | (10,027) | (20,159) | (11,043) | |||||||||||||||||||||||||||||
| Second cycle tenant improvements | (27,204) | (13,939) | (8,914) | (4,662) | (4,891) | (2,695) | |||||||||||||||||||||||||||||
| Second cycle leasing commissions | (46,837) | (23,832) | (14,263) | (7,133) | (5,487) | (2,763) | |||||||||||||||||||||||||||||
| Revenue enhancing recurring CAPEX | (72) | (36) | (195) | (99) | (18) | (9) | |||||||||||||||||||||||||||||
| Non-revenue enhancing recurring CAPEX | (10,087) | (5,016) | (2,965) | (1,601) | (174) | 136 | |||||||||||||||||||||||||||||
| Total FAD Adjustments | $ | (119,327) | $ | (60,733) | $ | (36,948) | $ | (20,641) | $ | (26,241) | $ | (13,960) | |||||||||||||||||||||||
| First cycle tenant improvements | $ | 2,215 | $ | 911 | $ | 8,536 | $ | 2,691 | $ | 2,669 | $ | 1,104 | |||||||||||||||||||||||
| First cycle leasing commissions | $ | 6,881 | $ | 3,446 | $ | 11,756 | $ | 4,953 | $ | 37,231 | $ | 18,388 | |||||||||||||||||||||||
| Development costs | $ | 112,422 | $ | 30,121 | $ | 56,568 | $ | 16,851 | $ | 28,703 | $ | 8,767 | |||||||||||||||||||||||
| Redevelopment costs | $ | 29,541 | $ | 14,151 | $ | 22,560 | $ | 7,287 | $ | 14,297 | $ | 6,180 | |||||||||||||||||||||||
| Capitalized interest | $ | 36,726 | $ | 15,407 | $ | 43,947 | $ | 17,005 | $ | 44,290 | $ | 15,003 | |||||||||||||||||||||||
| Supplemental Information | 18 |
Fourth Quarter 2024 |
||||||
|
JOINT VENTURE STATEMENTS
Statement of Operations for Unconsolidated Joint Ventures
Unaudited
(Dollars in Thousands)
|
|
|||||||
| Twelve Months Ended | |||||||||||||||||||||||
| December 31, 2024 | December 31, 2023 | ||||||||||||||||||||||
| Total | SLG Share | Total | SLG Share | ||||||||||||||||||||
| Revenues | |||||||||||||||||||||||
| Rental revenue, net | $ | 1,215,934 | $ | 635,019 | $ | 1,258,033 | $ | 645,147 | |||||||||||||||
| Escalation and reimbursement revenues | 242,451 | 136,302 | 232,353 | 126,836 | |||||||||||||||||||
| Investment income | 12,693 | 11,513 | 5,010 | 1,271 | |||||||||||||||||||
| Other income | 13,381 | 7,212 | 29,648 | 18,965 | |||||||||||||||||||
| Total Revenues | 1,484,459 | 790,046 | 1,525,044 | 792,219 | |||||||||||||||||||
| Gain on early extinguishment of debt | 233,704 | 172,369 | — | — | |||||||||||||||||||
| Expenses | |||||||||||||||||||||||
| Operating expenses | 259,558 | 135,821 | 253,630 | 131,958 | |||||||||||||||||||
| Real estate taxes | 297,520 | 152,437 | 287,462 | 144,095 | |||||||||||||||||||
| Operating lease rent | 33,207 | 7,808 | 29,048 | 13,458 | |||||||||||||||||||
| Total Operating Expenses | 590,285 | 296,066 | 570,140 | 289,511 | |||||||||||||||||||
| Operating Income | 1,127,878 | 666,349 | 954,904 | 502,708 | |||||||||||||||||||
| Interest expense, net of interest income | 573,148 | 276,852 | 574,032 | 272,217 | |||||||||||||||||||
| Amortization of deferred financing costs | 21,289 | 11,334 | 28,157 | 12,005 | |||||||||||||||||||
| Depreciation and amortization | 538,390 | 275,098 | 516,466 | 266,340 | |||||||||||||||||||
| Net (Loss) Income | (4,949) | 103,065 | (163,751) | (47,854) | |||||||||||||||||||
| Real estate depreciation | 538,378 | 275,091 | 516,441 | 266,322 | |||||||||||||||||||
| FFO Contribution | $ | 533,429 | $ | 378,156 | $ | 352,690 | $ | 218,468 | |||||||||||||||
| FAD Adjustments: | |||||||||||||||||||||||
| Non real estate depreciation and amortization | $ | 12 | $ | 7 | $ | 25 | $ | 18 | |||||||||||||||
| Amortization of deferred financing costs | 21,289 | 11,334 | 28,157 | 12,005 | |||||||||||||||||||
| Straight-line rental income and other non-cash adjustments | (90,148) | (53,676) | (77,224) | (46,255) | |||||||||||||||||||
| Second cycle tenant improvements | (43,768) | (22,899) | (59,137) | (30,493) | |||||||||||||||||||
| Second cycle leasing commissions | (58,661) | (30,008) | (20,296) | (10,288) | |||||||||||||||||||
| Revenue enhancing recurring CAPEX | (186) | (95) | (1,077) | (554) | |||||||||||||||||||
| Non-revenue enhancing recurring CAPEX | (12,235) | (5,903) | (10,876) | (5,545) | |||||||||||||||||||
| Total FAD Adjustments | $ | (183,697) | $ | (101,240) | $ | (140,428) | $ | (81,112) | |||||||||||||||
| First cycle tenant improvements | $ | 12,388 | $ | 4,302 | $ | 20,390 | $ | 8,039 | |||||||||||||||
| First cycle leasing commissions | $ | 45,896 | $ | 22,347 | $ | 20,196 | $ | 8,588 | |||||||||||||||
| Development costs | $ | 229,299 | $ | 65,805 | $ | 270,102 | $ | 77,250 | |||||||||||||||
| Redevelopment costs | $ | 68,142 | $ | 28,449 | $ | 86,685 | $ | 29,621 | |||||||||||||||
| Capitalized interest | $ | 156,533 | $ | 58,675 | $ | 149,268 | $ | 51,979 | |||||||||||||||
| Supplemental Information | 19 |
Fourth Quarter 2024 |
||||||
|
SELECTED FINANCIAL DATA
Net Operating Income(1)
Unaudited
(Dollars in Thousands)
|
|
|||||||
| Three Months Ended | Twelve Months Ended | ||||||||||||||||||||||||||||
| December 31, | December 31, | September 30, | December 31, | December 31, | |||||||||||||||||||||||||
| 2024 | 2023 | 2024 | 2024 | 2023 | |||||||||||||||||||||||||
Net Operating Income (1) |
$ | 91,459 | $ | 74,124 | $ | 88,718 | $ | 325,927 | $ | 352,043 | |||||||||||||||||||
| SLG share of NOI from unconsolidated JVs | 117,761 | 119,999 | 122,317 | 471,403 | 485,034 | ||||||||||||||||||||||||
| NOI, including SLG share of unconsolidated JVs | 209,220 | 194,123 | 211,035 | 797,330 | 837,077 | ||||||||||||||||||||||||
| Partners' share of NOI - consolidated JVs | (2,112) | 96 | (1,970) | (6,279) | 390 | ||||||||||||||||||||||||
| NOI - SLG share | $ | 207,108 | $ | 194,219 | $ | 209,065 | $ | 791,051 | $ | 837,467 | |||||||||||||||||||
| NOI, including SLG share of unconsolidated JVs | $ | 209,220 | $ | 194,123 | $ | 211,035 | $ | 797,330 | $ | 837,077 | |||||||||||||||||||
| Free rent (net of amortization) | (4,687) | (4,549) | 932 | (7,653) | (27,581) | ||||||||||||||||||||||||
| Straight-line revenue adjustment | (8,677) | (1,622) | (7,008) | (25,883) | (17,805) | ||||||||||||||||||||||||
| Amortization of acquired above and below-market leases, net | (6,220) | (6,227) | (4,680) | (22,707) | (36,115) | ||||||||||||||||||||||||
| Operating lease straight-line adjustment | (374) | 732 | 823 | 2,328 | 2,867 | ||||||||||||||||||||||||
| Straight-line tenant credit loss | (1,004) | (320) | 157 | 5,628 | (1,265) | ||||||||||||||||||||||||
| Cash NOI, including SLG share of unconsolidated JVs | 188,258 | 182,137 | 201,259 | 749,043 | 757,178 | ||||||||||||||||||||||||
| Partners' share of cash NOI - consolidated JVs | (2,120) | 52 | (2,190) | (6,782) | 244 | ||||||||||||||||||||||||
| Cash NOI - SLG share | $ | 186,138 | $ | 182,189 | $ | 199,069 | $ | 742,261 | $ | 757,422 | |||||||||||||||||||
| (1) Includes SL Green Management Corp. and Emerge 212. Excludes lease termination income. | |||||||||||||||||||||||||||||
NOI Summary by Portfolio (1) - SLG Share |
|||||||||||||||||||||||||||||
| Three Months Ended | Twelve Months Ended | ||||||||||||||||||||||||||||
| December 31, 2024 | December 31, 2024 | ||||||||||||||||||||||||||||
| NOI | Cash NOI | NOI | Cash NOI | ||||||||||||||||||||||||||
| Manhattan Office | $ | 165,675 | $ | 154,648 | $ | 667,747 | $ | 632,032 | |||||||||||||||||||||
| Development / Redevelopment | 6,090 | 416 | 12,389 | 6,898 | |||||||||||||||||||||||||
| High Street Retail | 5,212 | 4,138 | 15,660 | 11,852 | |||||||||||||||||||||||||
| Suburban & Residential | 4,079 | 3,915 | 19,273 | 18,643 | |||||||||||||||||||||||||
| Total Operating and Development | 181,056 | 163,117 | 715,069 | 669,425 | |||||||||||||||||||||||||
| Alternative Strategy Portfolio | 9,816 | 7,405 | 44,066 | 42,006 | |||||||||||||||||||||||||
Property Dispositions (2) |
863 | 754 | 4,710 | 3,122 | |||||||||||||||||||||||||
Other (3) |
15,373 | 14,862 | 27,206 | 27,708 | |||||||||||||||||||||||||
| Total | $ | 207,108 | $ | 186,138 | $ | 791,051 | $ | 742,261 | |||||||||||||||||||||
(1) Portfolio composition consistent with the Selected Property Data tables. |
|||||||||||||||||||||||||||||
(2) Includes properties sold or otherwise disposed of during the respective period. |
|||||||||||||||||||||||||||||
(3) Includes SL Green Management Corp., Emerge 212, Belmont Insurance Company and Ticonderoga Insurance Company. |
|||||||||||||||||||||||||||||
| Supplemental Information | 20 |
Fourth Quarter 2024 |
||||||
|
SELECTED FINANCIAL DATA
Same Store Net Operating Income - Wholly Owned and Consolidated JVs
Unaudited
(Dollars in Thousands)
|
|
|||||||
| Three Months Ended | Three Months Ended | Twelve Months Ended | |||||||||||||||||||||||||||||||||||||||||||||
| December 31, | December 31, | September 30, | December 31, | December 31, | |||||||||||||||||||||||||||||||||||||||||||
| 2024 | 2023 | % | 2024 | 2024 | 2023 | % | |||||||||||||||||||||||||||||||||||||||||
| Revenues | |||||||||||||||||||||||||||||||||||||||||||||||
| Rental revenue, net | $ | 126,302 | $ | 128,758 | $ | 126,272 | $ | 503,877 | $ | 518,991 | |||||||||||||||||||||||||||||||||||||
| Escalation & reimbursement revenues | 16,767 | 18,885 | 17,056 | 62,343 | 71,965 | ||||||||||||||||||||||||||||||||||||||||||
| Other income | 3,264 | 1,177 | 2,069 | 7,950 | 4,510 | ||||||||||||||||||||||||||||||||||||||||||
| Total Revenues | $ | 146,333 | $ | 148,820 | $ | 145,397 | $ | 574,170 | $ | 595,466 | |||||||||||||||||||||||||||||||||||||
| Expenses | |||||||||||||||||||||||||||||||||||||||||||||||
| Operating expenses | $ | 39,759 | $ | 39,110 | $ | 39,332 | $ | 152,145 | $ | 151,569 | |||||||||||||||||||||||||||||||||||||
| Real estate taxes | 32,527 | 31,294 | 31,230 | 126,010 | 124,788 | ||||||||||||||||||||||||||||||||||||||||||
| Operating lease rent | 6,106 | 6,106 | 6,106 | 24,423 | 24,423 | ||||||||||||||||||||||||||||||||||||||||||
| Total Operating Expenses | $ | 78,392 | $ | 76,510 | $ | 76,668 | $ | 302,578 | $ | 300,780 | |||||||||||||||||||||||||||||||||||||
| Operating Income | $ | 67,941 | $ | 72,310 | $ | 68,729 | $ | 271,592 | $ | 294,686 | |||||||||||||||||||||||||||||||||||||
| Interest expense & amortization of financing costs | $ | 22,421 | $ | 18,931 | $ | 19,396 | $ | 80,692 | $ | 75,032 | |||||||||||||||||||||||||||||||||||||
| Depreciation & amortization | 46,166 | 44,718 | 45,966 | 181,435 | 177,696 | ||||||||||||||||||||||||||||||||||||||||||
| (Loss) income before noncontrolling interest | $ | (646) | $ | 8,661 | $ | 3,367 | $ | 9,465 | $ | 41,958 | |||||||||||||||||||||||||||||||||||||
| Real estate depreciation & amortization | 46,166 | 44,718 | 45,966 | 181,435 | 177,696 | ||||||||||||||||||||||||||||||||||||||||||
| FFO Contribution | $ | 45,520 | $ | 53,379 | $ | 49,333 | $ | 190,900 | $ | 219,654 | |||||||||||||||||||||||||||||||||||||
| Non–building revenue | (498) | (58) | (662) | (1,510) | (402) | ||||||||||||||||||||||||||||||||||||||||||
| Interest expense & amortization of financing costs | 22,421 | 18,931 | 19,396 | 80,692 | 75,032 | ||||||||||||||||||||||||||||||||||||||||||
| Non-real estate depreciation | — | — | — | — | — | ||||||||||||||||||||||||||||||||||||||||||
| NOI | $ | 67,443 | $ | 72,252 | (6.7) | % | $ | 68,067 | $ | 270,082 | $ | 294,284 | (8.2) | % | |||||||||||||||||||||||||||||||||
| Cash Adjustments | |||||||||||||||||||||||||||||||||||||||||||||||
| Free rent (net of amortization) | $ | (1,055) | $ | (1,023) | $ | (1,344) | $ | (8,815) | $ | (11,271) | |||||||||||||||||||||||||||||||||||||
| Straight-line revenue adjustment | 2,293 | (119) | 1,896 | 7,907 | (10) | ||||||||||||||||||||||||||||||||||||||||||
| Amortization of acquired above and below-market leases, net | 830 | 88 | 834 | 2,578 | 560 | ||||||||||||||||||||||||||||||||||||||||||
| Operating lease straight-line adjustment | 204 | 204 | 204 | 815 | 815 | ||||||||||||||||||||||||||||||||||||||||||
| Straight-line tenant credit loss | (428) | (43) | 122 | 1,231 | (708) | ||||||||||||||||||||||||||||||||||||||||||
| Cash NOI | $ | 69,287 | $ | 71,359 | (2.9) | % | $ | 69,779 | $ | 273,798 | $ | 283,670 | (3.5) | % | |||||||||||||||||||||||||||||||||
| Lease termination income | (2,737) | (1,102) | (1,369) | (6,338) | (4,054) | ||||||||||||||||||||||||||||||||||||||||||
| Cash NOI excluding lease termination income | $ | 66,550 | $ | 70,257 | (5.3) | % | $ | 68,410 | $ | 267,460 | $ | 279,616 | (4.3) | % | |||||||||||||||||||||||||||||||||
| Operating Margins | |||||||||||||||||||||||||||||||||||||||||||||||
| NOI to real estate revenue, net | 46.2 | % | 48.6 | % | 47.0 | % | 47.2 | % | 49.5 | % | |||||||||||||||||||||||||||||||||||||
| Cash NOI to real estate revenue, net | 47.5 | % | 48.0 | % | 48.2 | % | 47.8 | % | 47.7 | % | |||||||||||||||||||||||||||||||||||||
| NOI before operating lease rent/real estate revenue, net | 50.4 | % | 52.7 | % | 51.2 | % | 51.4 | % | 53.6 | % | |||||||||||||||||||||||||||||||||||||
| Cash NOI before operating lease rent/real estate revenue, net | 51.6 | % | 51.9 | % | 52.3 | % | 51.9 | % | 51.6 | % | |||||||||||||||||||||||||||||||||||||
| Supplemental Information | 21 |
Fourth Quarter 2024 |
||||||
|
SELECTED FINANCIAL DATA
Same Store Net Operating Income - Unconsolidated JVs
Unaudited
(Dollars in Thousands, SLG Share)
|
|
|||||||
| Three Months Ended | Three Months Ended | Twelve Months Ended | |||||||||||||||||||||||||||||||||||||||||||||
| December 31, | December 31, | September 30, | December 31, | December 31, | |||||||||||||||||||||||||||||||||||||||||||
| 2024 | 2023 | % | 2024 | 2024 | 2023 | % | |||||||||||||||||||||||||||||||||||||||||
| Revenues | |||||||||||||||||||||||||||||||||||||||||||||||
| Rental revenue, net | $ | 115,769 | $ | 115,237 | $ | 119,474 | $ | 456,242 | $ | 462,710 | |||||||||||||||||||||||||||||||||||||
| Escalation & reimbursement revenues | 31,096 | 27,497 | 30,726 | 115,140 | 105,334 | ||||||||||||||||||||||||||||||||||||||||||
| Other income | 123 | (301) | 264 | 3,426 | 2,892 | ||||||||||||||||||||||||||||||||||||||||||
| Total Revenues | $ | 146,988 | $ | 142,433 | $ | 150,464 | $ | 574,808 | $ | 570,936 | |||||||||||||||||||||||||||||||||||||
| Expenses | |||||||||||||||||||||||||||||||||||||||||||||||
| Operating expenses | $ | 28,582 | $ | 28,128 | $ | 29,177 | $ | 110,333 | $ | 109,058 | |||||||||||||||||||||||||||||||||||||
| Real estate taxes | 29,842 | 28,542 | 29,069 | 116,210 | 111,625 | ||||||||||||||||||||||||||||||||||||||||||
| Operating lease rent | 108 | 108 | 108 | 433 | 433 | ||||||||||||||||||||||||||||||||||||||||||
| Total Operating Expenses | $ | 58,532 | $ | 56,778 | $ | 58,354 | $ | 226,976 | $ | 221,116 | |||||||||||||||||||||||||||||||||||||
| Operating Income | $ | 88,456 | $ | 85,655 | $ | 92,110 | $ | 347,832 | $ | 349,820 | |||||||||||||||||||||||||||||||||||||
| Interest expense & amortization of financing costs | $ | 48,539 | $ | 51,568 | $ | 48,424 | $ | 198,117 | $ | 200,295 | |||||||||||||||||||||||||||||||||||||
| Depreciation & amortization | 48,690 | 47,899 | 47,765 | 195,632 | 192,700 | ||||||||||||||||||||||||||||||||||||||||||
| Loss before noncontrolling interest | $ | (8,773) | $ | (13,812) | $ | (4,079) | $ | (45,917) | $ | (43,175) | |||||||||||||||||||||||||||||||||||||
| Real estate depreciation & amortization | 48,689 | 47,895 | 47,764 | 195,625 | 192,685 | ||||||||||||||||||||||||||||||||||||||||||
| FFO Contribution | $ | 39,916 | $ | 34,083 | $ | 43,685 | $ | 149,708 | $ | 149,510 | |||||||||||||||||||||||||||||||||||||
| Non–building revenue | (118) | 672 | (38) | (355) | (625) | ||||||||||||||||||||||||||||||||||||||||||
| Interest expense & amortization of financing costs | 48,539 | 51,568 | 48,424 | 198,117 | 200,295 | ||||||||||||||||||||||||||||||||||||||||||
| Non-real estate depreciation | 1 | 4 | 1 | 7 | 15 | ||||||||||||||||||||||||||||||||||||||||||
| NOI | $ | 88,338 | $ | 86,327 | 2.3 | % | $ | 92,072 | $ | 347,477 | $ | 349,195 | (0.5) | % | |||||||||||||||||||||||||||||||||
| Cash Adjustments | |||||||||||||||||||||||||||||||||||||||||||||||
| Free rent (net of amortization) | $ | 842 | $ | (3,127) | $ | 1,441 | $ | 4,892 | $ | (8,200) | |||||||||||||||||||||||||||||||||||||
| Straight-line revenue adjustment | (5,275) | 1,139 | (3,413) | (14,251) | (8,827) | ||||||||||||||||||||||||||||||||||||||||||
| Amortization of acquired above and below-market leases, net | (4,409) | (4,407) | (4,409) | (17,635) | (17,161) | ||||||||||||||||||||||||||||||||||||||||||
| Operating lease straight-line adjustment | — | — | — | — | — | ||||||||||||||||||||||||||||||||||||||||||
| Straight-line tenant credit loss | (591) | (277) | 10 | (328) | (454) | ||||||||||||||||||||||||||||||||||||||||||
| Cash NOI | $ | 78,905 | $ | 79,655 | (0.9) | % | $ | 85,701 | $ | 320,155 | $ | 314,553 | 1.8 | % | |||||||||||||||||||||||||||||||||
| Lease termination income | — | (369) | (223) | (3,055) | (2,251) | ||||||||||||||||||||||||||||||||||||||||||
| Cash NOI excluding lease termination income | $ | 78,905 | $ | 79,286 | (0.5) | % | $ | 85,478 | $ | 317,100 | $ | 312,302 | 1.5 | % | |||||||||||||||||||||||||||||||||
| Operating Margins | |||||||||||||||||||||||||||||||||||||||||||||||
| NOI to real estate revenue, net | 60.1 | % | 60.3 | % | 61.2 | % | 60.5 | % | 61.2 | % | |||||||||||||||||||||||||||||||||||||
| Cash NOI to real estate revenue, net | 53.7 | % | 55.7 | % | 57.0 | % | 55.7 | % | 55.2 | % | |||||||||||||||||||||||||||||||||||||
| NOI before operating lease rent/real estate revenue, net | 60.2 | % | 60.4 | % | 61.3 | % | 60.6 | % | 61.3 | % | |||||||||||||||||||||||||||||||||||||
| Cash NOI before operating lease rent/real estate revenue, net | 53.8 | % | 55.7 | % | 57.0 | % | 55.8 | % | 55.2 | % | |||||||||||||||||||||||||||||||||||||
| Supplemental Information | 22 |
Fourth Quarter 2024 |
||||||
|
SELECTED FINANCIAL DATA
Same Store Net Operating Income
Unaudited
(Dollars in Thousands)
|
|
|||||||
| Three Months Ended | Three Months Ended | Twelve Months Ended | |||||||||||||||||||||||||||||||||||||||||||||
| December 31, | December 31, | September 30, | December 31, | December 31, | |||||||||||||||||||||||||||||||||||||||||||
| 2024 | 2023 | % | 2024 | 2024 | 2023 | % | |||||||||||||||||||||||||||||||||||||||||
| Revenues | |||||||||||||||||||||||||||||||||||||||||||||||
| Rental revenue, net | $ | 126,302 | $ | 128,758 | $ | 126,272 | $ | 503,877 | $ | 518,991 | |||||||||||||||||||||||||||||||||||||
| Escalation & reimbursement revenues | 16,767 | 18,885 | 17,056 | 62,343 | 71,965 | ||||||||||||||||||||||||||||||||||||||||||
| Other income | 3,264 | 1,177 | 2,069 | 7,950 | 4,510 | ||||||||||||||||||||||||||||||||||||||||||
| Total Revenues | $ | 146,333 | $ | 148,820 | $ | 145,397 | $ | 574,170 | $ | 595,466 | |||||||||||||||||||||||||||||||||||||
Equity in net income (loss) from unconsolidated joint ventures (1) |
$ | (8,773) | $ | (13,812) | $ | (4,079) | $ | (45,917) | $ | (43,175) | |||||||||||||||||||||||||||||||||||||
| Expenses | |||||||||||||||||||||||||||||||||||||||||||||||
| Operating expenses | $ | 39,759 | $ | 39,110 | $ | 39,332 | $ | 152,145 | $ | 151,569 | |||||||||||||||||||||||||||||||||||||
| Real estate taxes | 32,527 | 31,294 | 31,230 | 126,010 | 124,788 | ||||||||||||||||||||||||||||||||||||||||||
| Operating lease rent | 6,106 | 6,106 | 6,106 | 24,423 | 24,423 | ||||||||||||||||||||||||||||||||||||||||||
| Total Operating Expenses | $ | 78,392 | $ | 76,510 | $ | 76,668 | $ | 302,578 | $ | 300,780 | |||||||||||||||||||||||||||||||||||||
| Operating Income | $ | 59,168 | $ | 58,498 | $ | 64,650 | $ | 225,675 | $ | 251,511 | |||||||||||||||||||||||||||||||||||||
| Interest expense & amortization of financing costs | $ | 22,421 | $ | 18,931 | $ | 19,396 | $ | 80,692 | $ | 75,032 | |||||||||||||||||||||||||||||||||||||
| Depreciation & amortization | 46,166 | 44,718 | 45,966 | 181,435 | 177,696 | ||||||||||||||||||||||||||||||||||||||||||
| Loss before noncontrolling interest | $ | (9,419) | $ | (5,151) | $ | (712) | $ | (36,452) | $ | (1,217) | |||||||||||||||||||||||||||||||||||||
| Real estate depreciation & amortization | 46,166 | 44,718 | 45,966 | 181,435 | 177,696 | ||||||||||||||||||||||||||||||||||||||||||
Joint Ventures Real estate depreciation & amortization (1) |
48,689 | 47,895 | 47,764 | 195,625 | 192,685 | ||||||||||||||||||||||||||||||||||||||||||
| FFO Contribution | $ | 85,436 | $ | 87,462 | $ | 93,018 | $ | 340,608 | $ | 369,164 | |||||||||||||||||||||||||||||||||||||
| Non–building revenue | (498) | (58) | (662) | (1,510) | (402) | ||||||||||||||||||||||||||||||||||||||||||
Joint Ventures Non–building revenue (1) |
(118) | 672 | (38) | (355) | (625) | ||||||||||||||||||||||||||||||||||||||||||
| Interest expense & amortization of financing costs | 22,421 | 18,931 | 19,396 | 80,692 | 75,032 | ||||||||||||||||||||||||||||||||||||||||||
Joint Ventures Interest expense & amortization of financing costs (1) |
48,539 | 51,568 | 48,424 | 198,117 | 200,295 | ||||||||||||||||||||||||||||||||||||||||||
| Non-real estate depreciation | — | — | — | — | — | ||||||||||||||||||||||||||||||||||||||||||
Joint Ventures Non-real estate depreciation (1) |
1 | 4 | 1 | 7 | 15 | ||||||||||||||||||||||||||||||||||||||||||
| NOI | $ | 155,781 | $ | 158,579 | (1.8) | % | $ | 160,139 | $ | 617,559 | $ | 643,479 | (4.0) | % | |||||||||||||||||||||||||||||||||
| Cash Adjustments | |||||||||||||||||||||||||||||||||||||||||||||||
| Non-cash adjustments | $ | 1,844 | $ | (893) | $ | 1,712 | $ | 3,716 | $ | (10,614) | |||||||||||||||||||||||||||||||||||||
Joint Ventures non-cash adjustments (1) |
(9,433) | (6,672) | (6,371) | (27,322) | (34,642) | ||||||||||||||||||||||||||||||||||||||||||
| Cash NOI | $ | 148,192 | $ | 151,014 | (1.9) | % | $ | 155,480 | $ | 593,953 | $ | 598,223 | (0.7) | % | |||||||||||||||||||||||||||||||||
| Lease termination income | $ | (2,737) | $ | (1,102) | $ | (1,369) | $ | (6,338) | $ | (4,054) | |||||||||||||||||||||||||||||||||||||
Joint Ventures lease termination income (1) |
— | (369) | (223) | (3,055) | (2,251) | ||||||||||||||||||||||||||||||||||||||||||
| Cash NOI excluding lease termination income | $ | 145,455 | $ | 149,543 | (2.7) | % | $ | 153,888 | $ | 584,560 | $ | 591,918 | (1.2) | % | |||||||||||||||||||||||||||||||||
| Operating Margins | |||||||||||||||||||||||||||||||||||||||||||||||
| NOI to real estate revenue, net | 53.2 | % | 54.3 | % | 54.3 | % | 53.8 | % | 55.2 | % | |||||||||||||||||||||||||||||||||||||
| Cash NOI to real estate revenue, net | 50.6 | % | 51.7 | % | 52.7 | % | 51.8 | % | 51.3 | % | |||||||||||||||||||||||||||||||||||||
| NOI before operating lease rent/real estate revenue, net | 55.3 | % | 56.5 | % | 56.4 | % | 56.0 | % | 57.3 | % | |||||||||||||||||||||||||||||||||||||
| Cash NOI before operating lease rent/real estate revenue, net | 52.7 | % | 53.8 | % | 54.7 | % | 53.9 | % | 53.4 | % | |||||||||||||||||||||||||||||||||||||
(1) The amount represents the Company's share of same-store unconsolidated joint venture activity. The Company does not control investments in unconsolidated joint ventures. |
|||||||||||||||||||||||||||||||||||||||||||||||
| Supplemental Information | 23 |
Fourth Quarter 2024 |
||||||
|
DEBT SUMMARY SCHEDULE
Consolidated
Unaudited
(Dollars in Thousands)
|
|
|||||||
| Principal | 2025 | Current | Final | Principal | ||||||||||||||||||||||||||||||||||||||||||||||||||||
| Ownership | Outstanding | Principal | Maturity | Maturity | Due at | |||||||||||||||||||||||||||||||||||||||||||||||||||
| Fixed rate debt | Interest (%) | 12/31/2024 | Coupon (1) | Amortization | Date | Date (2) | Final Maturity | |||||||||||||||||||||||||||||||||||||||||||||||||
| Secured fixed rate debt | ||||||||||||||||||||||||||||||||||||||||||||||||||||||||
| 10 East 53rd Street (capped) | 100.0 | $ | 205,000 | 5.45% | $ | — | May-25 | May-28 | (3) | $ | 205,000 | |||||||||||||||||||||||||||||||||||||||||||||
| 100 Church Street (swapped) | 100.0 | 370,000 | 5.89% | — | Jun-25 | Jun-27 | 370,000 | |||||||||||||||||||||||||||||||||||||||||||||||||
| 185 Broadway / 7 Dey | 100.0 | 190,148 | 6.65% | — | Nov-25 | Nov-26 | (3) | 190,148 | ||||||||||||||||||||||||||||||||||||||||||||||||
| Landmark Square | 100.0 | 100,000 | 4.90% | — | Jan-27 | Jan-27 | 100,000 | |||||||||||||||||||||||||||||||||||||||||||||||||
| 485 Lexington Avenue | 100.0 | 450,000 | 4.25% | — | Feb-27 | Feb-27 | 450,000 | |||||||||||||||||||||||||||||||||||||||||||||||||
| 420 Lexington Avenue | 100.0 | 272,326 | 8.24% | — | Oct-40 | Oct-40 | 272,326 | |||||||||||||||||||||||||||||||||||||||||||||||||
| $ | 1,587,474 | 5.80% | $ | — | $ | 1,587,474 | ||||||||||||||||||||||||||||||||||||||||||||||||||
| Unsecured fixed rate debt | ||||||||||||||||||||||||||||||||||||||||||||||||||||||||
| Term Loan B (swapped) | $ | 100,000 | 4.56% | $ | — | Nov-25 | Nov-26 | (3) | $ | 100,000 | ||||||||||||||||||||||||||||||||||||||||||||||
| Unsecured notes | 100,000 | 4.27% | — | Dec-25 | Dec-25 | 100,000 | ||||||||||||||||||||||||||||||||||||||||||||||||||
| Revolving credit facility (swapped) | 320,000 | 4.93% | (4) | — | May-26 | May-27 | (3) | 320,000 | ||||||||||||||||||||||||||||||||||||||||||||||||
| Term Loan A (swapped) | 1,050,000 | 4.54% | — | May-27 | May-27 | 1,050,000 | ||||||||||||||||||||||||||||||||||||||||||||||||||
| Junior subordinated deferrable interest debentures (swapped) | 100,000 | 5.27% | — | Jul-35 | Jul-35 | 100,000 | ||||||||||||||||||||||||||||||||||||||||||||||||||
| $ | 1,670,000 | 4.65% | $ | — | $ | 1,670,000 | ||||||||||||||||||||||||||||||||||||||||||||||||||
| Total Fixed Rate Debt | $ | 3,257,474 | 5.21% | $ | — | $ | 3,257,474 | |||||||||||||||||||||||||||||||||||||||||||||||||
| Floating rate debt | ||||||||||||||||||||||||||||||||||||||||||||||||||||||||
| Secured floating rate debt | ||||||||||||||||||||||||||||||||||||||||||||||||||||||||
| CMBS Repurchase Facility (SOFR+ 175 bps) | 100.0 | $ | 3,550 | 6.00% | $ | — | Jun-25 | Jun-25 | $ | 3,550 | ||||||||||||||||||||||||||||||||||||||||||||||
| 100 Park Avenue (SOFR + 225 bps) | 49.9 | 360,000 | 6.58% | — | Jun-25 | Dec-27 | (3) | 360,000 | ||||||||||||||||||||||||||||||||||||||||||||||||
| $ | 363,550 | 6.58% | $ | — | $ | 363,550 | ||||||||||||||||||||||||||||||||||||||||||||||||||
| Total Floating Rate Debt | $ | 363,550 | 6.58% | $ | — | $ | 363,550 | |||||||||||||||||||||||||||||||||||||||||||||||||
| Consolidated Debt | $ | 3,621,024 | 5.35% | |||||||||||||||||||||||||||||||||||||||||||||||||||||
| Alternative Strategy Portfolio Debt | $ | — | —% | |||||||||||||||||||||||||||||||||||||||||||||||||||||
| Total Debt - Consolidated | $ | 3,621,024 | 5.35% | $ | — | $ | 3,621,024 | |||||||||||||||||||||||||||||||||||||||||||||||||
| Deferred financing costs | (14,242) | |||||||||||||||||||||||||||||||||||||||||||||||||||||||
| Total Debt - Consolidated, net | $ | 3,606,782 | 5.35% | |||||||||||||||||||||||||||||||||||||||||||||||||||||
| Total Debt - Unconsolidated JV, net | $ | 5,978,804 | 4.35% | |||||||||||||||||||||||||||||||||||||||||||||||||||||
| Debt including SLG share of JV Debt | $ | 9,075,089 | 4.70% | |||||||||||||||||||||||||||||||||||||||||||||||||||||
| Alternative Strategy Portfolio Debt including SLG share of JV Debt | $ | 573,797 | 5.18% | |||||||||||||||||||||||||||||||||||||||||||||||||||||
| Total Debt including SLG share of JV Debt | $ | 9,648,886 | 4.73% | |||||||||||||||||||||||||||||||||||||||||||||||||||||
| Weighted Average Balance & Interest Rate for the quarter, including SLG share of JV Debt | $ | 9,896,995 | 4.77% | |||||||||||||||||||||||||||||||||||||||||||||||||||||
| (1) Coupon for floating rate debt determined using the effective Term SOFR rate at the end of the quarter of 4.85%. Coupon for loans that are subject to SOFR floors, interest rate caps or interest rate swaps were determined using the SOFR floors, interest rate cap strike rate, or swapped interest rate plus the applicable loan spread. | ||||||||||||||||||||||||||||||||||||||||||||||||||||||||
| (2) Reflects exercise of all available extension options, which may be subject to conditions and/or result in adjusted terms. | ||||||||||||||||||||||||||||||||||||||||||||||||||||||||
| (3) As-of-right extension. | ||||||||||||||||||||||||||||||||||||||||||||||||||||||||
| (4) Represents a blended swapped rate inclusive of the effect of multiple swaps. | ||||||||||||||||||||||||||||||||||||||||||||||||||||||||
| Supplemental Information | 24 |
Fourth Quarter 2024 |
||||||
|
DEBT SUMMARY SCHEDULE
Unconsolidated JVs
Unaudited
(Dollars in Thousands)
|
|
|||||||
| Principal Outstanding | 2025 Principal |
Current | Final | Principal Due at | ||||||||||||||||||||||||||||||||||||||||||||||||||||
| Ownership | 12/31/2024 | Amortization | Maturity | Maturity | Final Maturity | |||||||||||||||||||||||||||||||||||||||||||||||||||
| Fixed rate debt | Interest (%) | Gross Principal | SLG Share | Coupon (1) | (SLG Share) | Date | Date (2) | (SLG Share) | ||||||||||||||||||||||||||||||||||||||||||||||||
| 450 Park Avenue (swapped) | 25.1 | $ | 284,835 | $ | 71,494 | 6.57% | (3) | $ | — | Jun-25 | Jun-27 | $ | 71,494 | |||||||||||||||||||||||||||||||||||||||||||
| 11 Madison Avenue | 60.0 | 1,400,000 | 840,000 | 3.84% | — | Sep-25 | Sep-25 | 840,000 | ||||||||||||||||||||||||||||||||||||||||||||||||
| 15 Beekman | 20.0 | 120,000 | 24,000 | 5.99% | — | Jan-26 | Jan-28 | 24,000 | ||||||||||||||||||||||||||||||||||||||||||||||||
| 800 Third Avenue (swapped) | 60.5 | 177,000 | 107,120 | 3.37% | — | Feb-26 | Feb-26 | 107,120 | ||||||||||||||||||||||||||||||||||||||||||||||||
| 1515 Broadway | 56.9 | 740,947 | 421,369 | 3.93% | 11,975 | Mar-26 | Mar-28 | 380,032 | ||||||||||||||||||||||||||||||||||||||||||||||||
| 919 Third Avenue (swapped) | 51.0 | 500,000 | 255,000 | 6.11% | — | Apr-26 | Apr-28 | 255,000 | ||||||||||||||||||||||||||||||||||||||||||||||||
| 280 Park Avenue (swapped) | 50.0 | 1,075,000 | 537,500 | 5.84% | — | Sep-26 | Sep-28 | 537,500 | ||||||||||||||||||||||||||||||||||||||||||||||||
| 245 Park Avenue | 50.1 | 1,768,000 | 885,768 | 4.30% | — | Jun-27 | Jun-27 | 885,768 | ||||||||||||||||||||||||||||||||||||||||||||||||
| One Madison Avenue (hedged) | 25.5 | 1,013,114 | (4) | 258,344 | 7.27% | (3) | — | Nov-27 | Nov-27 | 258,344 | ||||||||||||||||||||||||||||||||||||||||||||||
| 220 East 42nd | 51.0 | 496,412 | 253,170 | 6.77% | — | Dec-27 | Dec-27 | 253,170 | ||||||||||||||||||||||||||||||||||||||||||||||||
| One Vanderbilt Avenue | 60.0 | 3,000,000 | 1,800,300 | 2.95% | — | Jul-31 | Jul-31 | 1,800,300 | ||||||||||||||||||||||||||||||||||||||||||||||||
| $ | 10,575,308 | $ | 5,454,065 | 4.26% | (5) | $ | 11,975 | $ | 5,412,728 | |||||||||||||||||||||||||||||||||||||||||||||||
| Alternative strategy portfolio | ||||||||||||||||||||||||||||||||||||||||||||||||||||||||
| 650 Fifth Avenue | 50.0 | $ | 65,000 | $ | 32,500 | 5.45% | $ | — | Feb-25 | Jul-25 | $ | 32,500 | ||||||||||||||||||||||||||||||||||||||||||||
| 115 Spring Street | 51.0 | 65,550 | 33,431 | 5.50% | — | Mar-25 | Mar-25 | 33,431 | ||||||||||||||||||||||||||||||||||||||||||||||||
| Worldwide Plaza | 25.0 | 1,200,000 | 299,400 | 3.98% | — | Nov-27 | Nov-27 | 299,400 | ||||||||||||||||||||||||||||||||||||||||||||||||
| $ | 1,330,550 | $ | 365,331 | 4.25% | (5) | $ | — | $ | 365,331 | |||||||||||||||||||||||||||||||||||||||||||||||
| Total Fixed Rate Debt | $ | 11,905,858 | $ | 5,819,396 | 4.26% | (5) | $ | 11,975 | $ | 5,778,059 | ||||||||||||||||||||||||||||||||||||||||||||||
| Floating rate debt | ||||||||||||||||||||||||||||||||||||||||||||||||||||||||
| Alternative strategy portfolio | ||||||||||||||||||||||||||||||||||||||||||||||||||||||||
| 11 West 34th Street (LIBOR + 145 bps) | 30.0 | $ | 23,000 | $ | 6,900 | 6.67% | (7) | — | Feb-23 | (8) | Feb-23 | (8) | $ | 6,900 | ||||||||||||||||||||||||||||||||||||||||||
| 1552 Broadway (SOFR + 275 bps) (6) | 50.0 | 193,132 | 96,566 | 7.08% | — | Feb-24 | (9) | Feb-24 | (9) | 96,566 | ||||||||||||||||||||||||||||||||||||||||||||||
| 650 Fifth Avenue (SOFR + 225 bps) | 50.0 | 210,000 | 105,000 | 6.58% | — | Feb-25 | Jul-25 | 105,000 | ||||||||||||||||||||||||||||||||||||||||||||||||
| $ | 426,132 | $ | 208,466 | 6.82% | (5) | $ | — | $ | 208,466 | |||||||||||||||||||||||||||||||||||||||||||||||
| Total Floating Rate Debt | $ | 426,132 | $ | 208,466 | 6.82% | (5) | $ | — | $ | 208,466 | ||||||||||||||||||||||||||||||||||||||||||||||
| Unconsolidated JV Debt | $ | 10,575,308 | $ | 5,454,065 | 4.26% | (5) | ||||||||||||||||||||||||||||||||||||||||||||||||||
| Alternative Strategy Portfolio Debt | $ | 1,756,682 | $ | 573,797 | 5.18% | (5) | ||||||||||||||||||||||||||||||||||||||||||||||||||
| Total Debt - Unconsolidated JV | $ | 12,331,990 | $ | 6,027,862 | 4.35% | (5) | $ | 11,975 | $ | 5,986,525 | ||||||||||||||||||||||||||||||||||||||||||||||
| Deferred financing costs | (97,729) | (49,058) | ||||||||||||||||||||||||||||||||||||||||||||||||||||||
| Total Debt - Unconsolidated JV, net | $ | 12,234,261 | $ | 5,978,804 | 4.35% | (5) | ||||||||||||||||||||||||||||||||||||||||||||||||||
| (1) Coupon for floating rate debt determined using the effective Term SOFR rate at the end of the quarter of 4.85%. Coupon for loans that are subject to SOFR floors, interest rate caps or interest rate swaps were determined using the SOFR floors, interest rate cap strike rate, or swapped interest rate plus the applicable loan spread. | ||||||||||||||||||||||||||||||||||||||||||||||||||||||||
| (2) Reflects exercise of all available extension options, which may be subject to conditions and/or result in adjusted terms. | ||||||||||||||||||||||||||||||||||||||||||||||||||||||||
| (3) Coupon reflects interest rate swaps executed at the corporate level for SLG’s share of the outstanding debt. | ||||||||||||||||||||||||||||||||||||||||||||||||||||||||
| (4) Debt is hedged via a $354.8 million swap executed at the corporate level and a $658.4 million cap executed at the joint venture. | ||||||||||||||||||||||||||||||||||||||||||||||||||||||||
| (5) Calculated based on SL Green's share of the outstanding debt. | ||||||||||||||||||||||||||||||||||||||||||||||||||||||||
| (6) Spread includes applicable Term SOFR adjustment. | ||||||||||||||||||||||||||||||||||||||||||||||||||||||||
| (7) The coupon rate is based on the last available LIBOR on June 30, 2023. | ||||||||||||||||||||||||||||||||||||||||||||||||||||||||
| (8) The Company's joint venture partner is in discussions with the lender on resolution of the past maturity. | ||||||||||||||||||||||||||||||||||||||||||||||||||||||||
| (9) The Company is in discussions with the lender on resolution of the past maturity. | ||||||||||||||||||||||||||||||||||||||||||||||||||||||||
| Supplemental Information | 25 |
Fourth Quarter 2024 |
||||||
|
DEBT COMPOSITION AND CORPORATE DEBT COVENANTS
Unaudited
(Dollars in Thousands)
|
|
|||||||
| Composition of Debt | |||||||||||||||||||||||||||||||||||||||||||||||
| Core Portfolio | Alternative Strategy Portfolio | Total | |||||||||||||||||||||||||||||||||||||||||||||
| Fixed Rate Debt | |||||||||||||||||||||||||||||||||||||||||||||||
| Consolidated | $ | 3,257,474 | $ | — | $ | 3,257,474 | |||||||||||||||||||||||||||||||||||||||||
| SLG Share of JV | 5,454,065 | 365,331 | 5,819,396 | ||||||||||||||||||||||||||||||||||||||||||||
| Total Fixed Rate Debt | $ | 8,711,539 | 96.0% | $ | 365,331 | 63.7% | $ | 9,076,870 | 94.1% | ||||||||||||||||||||||||||||||||||||||
| Floating Rate Debt | |||||||||||||||||||||||||||||||||||||||||||||||
| Consolidated | $ | 363,550 | $ | — | $ | 363,550 | |||||||||||||||||||||||||||||||||||||||||
| SLG Share of JV | — | 208,466 | 208,466 | ||||||||||||||||||||||||||||||||||||||||||||
| 363,550 | 4.0% | 208,466 | 36.3% | 572,016 | 5.9% | ||||||||||||||||||||||||||||||||||||||||||
| Debt & Preferred Equity and CMBS Investments | (187,250) | (2.1)% | (53,533) | (9.3)% | (240,783) | (2.5)% | |||||||||||||||||||||||||||||||||||||||||
| Total Floating Rate Debt | $ | 176,300 | 1.9% | $ | 154,933 | 27.0% | $ | 331,233 | 3.4% | ||||||||||||||||||||||||||||||||||||||
| Total Debt | $ | 9,075,089 | $ | 573,797 | $ | 9,648,886 | |||||||||||||||||||||||||||||||||||||||||
Revolving Credit Facility Covenants (1) |
||||||||||||||
| Actual | Required | |||||||||||||
| Total Debt / Total Assets | 36.8% | Less than 60% | ||||||||||||
| Consolidated Fixed Charge Coverage | 1.70x | Greater than 1.40x | ||||||||||||
| Maximum Secured Indebtedness | 21.7% | Less than 50% | ||||||||||||
| Maximum Unencumbered Leverage Ratio | 28.8% | Less than 60% | ||||||||||||
Unsecured Notes Covenants (1) |
||||||||||||||
| Actual | Required | |||||||||||||
| Total Debt / Total Assets | 34.6% | Less than 60% | ||||||||||||
| Secured Debt / Total Assets | 23.0% | Less than 40% | ||||||||||||
| Debt Service Coverage | 2.65x | Greater than 1.50x | ||||||||||||
| Unencumbered Assets / Unsecured Debt | 464.0% | Greater than 150% | ||||||||||||
| (1) Covenants calculated pursuant to the terms of the underlying facility or notes. | ||||||||||||||
| Supplemental Information | 26 |
Fourth Quarter 2024 |
||||||
|
DERIVATIVE SUMMARY SCHEDULE
Unaudited
(Dollars in Thousands)
|
|
|||||||
| Consolidated Interest Rate Derivatives | |||||||||||||||||||||||||||||||||||||||||||||||||||||
| Ownership | Notional Value | Fair Value | |||||||||||||||||||||||||||||||||||||||||||||||||||
| Secured Debt | Interest (%) | 12/31/2024 | 12/31/2024 | Instrument (1) |
Strike Rate (1) |
Effective Date | Maturity Date | ||||||||||||||||||||||||||||||||||||||||||||||
| 10 East 53rd Street | 55.0 | $205,000 | $75 | Cap | 4.00 | % | February 2024 | February 2025 | |||||||||||||||||||||||||||||||||||||||||||||
| 100 Church Street | 100.0 | $370,000 | $970 | Swap | 3.89 | % | November 2022 | June 2027 | |||||||||||||||||||||||||||||||||||||||||||||
| SLGOP – 450 Park Avenue | 100.0 | $68,678 | $(765) | (2) | Swap | 4.47 | % | August 2024 | June 2027 | ||||||||||||||||||||||||||||||||||||||||||||
| SLGOP – One Madison Avenue | 100.0 | $300,000 | $(3,953) | (2) | Swap | 4.49 | % | November 2024 | November 2027 | ||||||||||||||||||||||||||||||||||||||||||||
| Unsecured Debt | |||||||||||||||||||||||||||||||||||||||||||||||||||||
| Term Loan A | 100.0 | $150,000 | $2,196 | Swap | 2.62 | % | December 2021 | January 2026 | |||||||||||||||||||||||||||||||||||||||||||||
| Term Loan A | 100.0 | 200,000 | 5,711 | Swap | 2.59 | % | February 2023 | February 2027 | |||||||||||||||||||||||||||||||||||||||||||||
| Term Loan A | 100.0 | 100,000 | 2,225 | Swap | 2.90 | % | February 2023 | February 2027 | |||||||||||||||||||||||||||||||||||||||||||||
| Term Loan A | 100.0 | 100,000 | 2,568 | Swap | 2.73 | % | February 2023 | February 2027 | |||||||||||||||||||||||||||||||||||||||||||||
| Term Loan A | 100.0 | 50,000 | 1,557 | Swap | 2.46 | % | February 2023 | February 2027 | |||||||||||||||||||||||||||||||||||||||||||||
| Term Loan A | 100.0 | 300,000 | 7,637 | Swap | 2.87 | % | July 2023 | May 2027 | |||||||||||||||||||||||||||||||||||||||||||||
| Term Loan A | 100.0 | 150,000 | 1,618 | Swap | 3.52 | % | January 2024 | May 2027 | |||||||||||||||||||||||||||||||||||||||||||||
| Term Loan B & Revolving Credit Facility | 100.0 | $200,000 | $2,849 | Swap | 2.66 | % | December 2021 | January 2026 | |||||||||||||||||||||||||||||||||||||||||||||
| Revolving Credit Facility | 100.0 | $125,000 | $828 | Swap | 3.67 | % | August 2024 | December 2026 | |||||||||||||||||||||||||||||||||||||||||||||
| Revolving Credit Facility | 100.0 | 125,000 | 820 | Swap | 3.67 | % | August 2024 | December 2026 | |||||||||||||||||||||||||||||||||||||||||||||
| Junior subordinated deferrable interest debentures | 100.0 | $100,000 | $722 | Swap | 3.76 | % | January 2023 | January 2028 | |||||||||||||||||||||||||||||||||||||||||||||
| Forward-starting Derivatives | |||||||||||||||||||||||||||||||||||||||||||||||||||||
| 10 East 53rd Street | 55.0 | $204,963 | $431 | Swap | 3.92 | % | February 2025 | May 2028 | |||||||||||||||||||||||||||||||||||||||||||||
| Unconsolidated JV Interest Rate Derivatives | |||||||||||||||||||||||||||||||||||||||||||||||||||||
| Notional Value | Fair Value | ||||||||||||||||||||||||||||||||||||||||||||||||||||
| Ownership | 12/31/2024 | 12/31/2024 | |||||||||||||||||||||||||||||||||||||||||||||||||||
| Secured Debt | Interest (%) | Gross | SLG Share | Gross | SLG Share | Instrument (1) |
Strike Rate (1) |
Effective Date | Maturity Date | ||||||||||||||||||||||||||||||||||||||||||||
| One Madison Avenue | 25.5 | $658,357 | $332,470 | $727 | $367 | Cap | 4.00 | % | November 2024 | May 2025 | |||||||||||||||||||||||||||||||||||||||||||
| 800 Third Avenue | 60.5 | $177,000 | $107,120 | $4,964 | $3,004 | Swap | 1.55 | % | December 2022 | February 2026 | |||||||||||||||||||||||||||||||||||||||||||
| 919 Third Avenue | 51.0 | $250,000 | $127,500 | $1,309 | $668 | Swap | 3.61 | % | April 2023 | February 2026 | |||||||||||||||||||||||||||||||||||||||||||
| 919 Third Avenue | 51.0 | 250,000 | 127,500 | $1,309 | $668 | Swap | 3.61 | % | April 2023 | February 2026 | |||||||||||||||||||||||||||||||||||||||||||
| 280 Park Avenue | 50.0 | $537,500 | $268,750 | $(1,628) | $(814) | Swap | 4.07 | % | July 2024 | September 2028 | |||||||||||||||||||||||||||||||||||||||||||
| 280 Park Avenue | 50.0 | 268,750 | 134,375 | (534) | (267) | Swap | 4.04 | % | July 2024 | September 2028 | |||||||||||||||||||||||||||||||||||||||||||
| 280 Park Avenue | 50.0 | 268,750 | 134,375 | (711) | (356) | Swap | 4.06 | % | July 2024 | September 2028 | |||||||||||||||||||||||||||||||||||||||||||
| (1) Certain financings require the purchase of a cap at a specified strike rate. | |||||||||||||||||||||||||||||||||||||||||||||||||||||
| (2) Quarterly changes in fair value recognized in the calculation of FFO. | |||||||||||||||||||||||||||||||||||||||||||||||||||||
| Supplemental Information | 27 |
Fourth Quarter 2024 |
||||||
|
SUMMARY OF LEASE LIABILITIES
Unaudited
(Dollars in Thousands)
|
|
|||||||
Scheduled Cash Payment (1) |
Lease | Year of Final | |||||||||||||||||||||||||||||||||||||||||||||
| Property | 2025 | 2026 | 2027 | 2028 | Liabilities (2) |
Expiration (3) |
|||||||||||||||||||||||||||||||||||||||||
| Consolidated Lease Liabilities (SLG Share) | |||||||||||||||||||||||||||||||||||||||||||||||
| Operating Leases | |||||||||||||||||||||||||||||||||||||||||||||||
| 1185 Avenue of the Americas | $ | 6,909 | $ | 6,909 | $ | 6,909 | $ | 6,909 | $ | 83,492 | 2043 | ||||||||||||||||||||||||||||||||||||
| SL Green Headquarters at One Vanderbilt | 2,394 | (4) | 2,450 | (4) | 2,455 | (4) | 2,641 | (4) | 89,083 | 2048 | |||||||||||||||||||||||||||||||||||||
| SUMMIT One Vanderbilt | 9,598 | (4) | 9,598 | (4) | 9,598 | (4) | 9,598 | (4) | 428,652 | 2070 | |||||||||||||||||||||||||||||||||||||
| 420 Lexington Avenue | 11,199 | 11,199 | 11,199 | 11,199 | 170,784 | 2080 | |||||||||||||||||||||||||||||||||||||||||
| 711 Third Avenue | 5,500 | (5) | 5,500 | (5) | 5,500 | (5) | 5,500 | (5) | 38,978 | (5) | 2083 | ||||||||||||||||||||||||||||||||||||
| Total | $ | 35,600 | $ | 35,656 | $ | 35,661 | $ | 35,847 | $ | 810,989 | |||||||||||||||||||||||||||||||||||||
| Financing Leases | |||||||||||||||||||||||||||||||||||||||||||||||
| 15 Beekman | $ | 3,228 | $ | 3,276 | $ | 3,325 | $ | 3,375 | $ | 106,853 | 2119 | (6) | |||||||||||||||||||||||||||||||||||
| Total | $ | 3,228 | $ | 3,276 | $ | 3,325 | $ | 3,375 | $ | 106,853 | |||||||||||||||||||||||||||||||||||||
| SLG | Scheduled Cash Payment (1) |
Lease | Year of Final | ||||||||||||||||||||||||||||||||||||||||||||
| Property | Interest (%) | 2025 | 2026 | 2027 | 2028 | Liabilities (2) |
Expiration (3) |
||||||||||||||||||||||||||||||||||||||||
| Unconsolidated Joint Venture Lease Liabilities (SLG Share) | |||||||||||||||||||||||||||||||||||||||||||||||
| Operating Leases | |||||||||||||||||||||||||||||||||||||||||||||||
Equinox Studio City (7) |
33.3 | $ | 614 | $ | 614 | $ | 693 | $ | 693 | $ | 2,914 | 2029 | |||||||||||||||||||||||||||||||||||
| Alternative strategy portfolio | |||||||||||||||||||||||||||||||||||||||||||||||
| 650 Fifth Avenue (Floors 4-6) | 50.0 | $ | 1,790 | $ | 1,802 | $ | 1,935 | $ | 1,935 | $ | 13,663 | 2053 | |||||||||||||||||||||||||||||||||||
| 650 Fifth Avenue (Floors b-3) | 50.0 | 1,569 | 1,571 | 1,585 | 1,605 | 31,900 | 2062 | ||||||||||||||||||||||||||||||||||||||||
| 1560 Broadway | 50.0 | 7,476 | 7,554 | 7,610 | 7,610 | 58,983 | 2114 | ||||||||||||||||||||||||||||||||||||||||
| Total | $ | 11,449 | $ | 11,541 | $ | 11,823 | $ | 11,843 | $ | 107,460 | |||||||||||||||||||||||||||||||||||||
| Financing Leases | |||||||||||||||||||||||||||||||||||||||||||||||
| One Vanderbilt Avenue Garage | 60.0 | $ | 178 | $ | 180 | $ | 182 | $ | 184 | $ | 2,916 | 2069 | |||||||||||||||||||||||||||||||||||
| 885 Third Avenue | 34.1 | 795 | 817 | 817 | 817 | 15,617 | 2119 | ||||||||||||||||||||||||||||||||||||||||
| Alternative strategy portfolio | |||||||||||||||||||||||||||||||||||||||||||||||
| 650 Fifth Avenue (Floors b-3) | 50.0 | $ | 7,364 | $ | 7,364 | $ | 7,364 | $ | 7,464 | $ | 104,185 | 2062 | |||||||||||||||||||||||||||||||||||
| 2 Herald Square | 95.0 | 14,613 | 14,978 | 15,353 | — | 403,006 | 2077 | (6) | |||||||||||||||||||||||||||||||||||||||
| Total | $ | 22,950 | $ | 23,339 | $ | 23,716 | $ | 8,465 | $ | 525,724 | |||||||||||||||||||||||||||||||||||||
| (1) Reflects SLG's share of remaining contractual base rent for each year presented. Leases may provide for additional rent payments based on exceeding specified thresholds. | |||||||||||||||||||||||||||||||||||||||||||||||
(2) Per the balance sheet as of December 31, 2024. | |||||||||||||||||||||||||||||||||||||||||||||||
| (3) Reflects all available extension options. | |||||||||||||||||||||||||||||||||||||||||||||||
| (4) Reflects scheduled cash payments net of the Company's 60.01% ownership interest in One Vanderbilt. | |||||||||||||||||||||||||||||||||||||||||||||||
| (5) Reflects scheduled cash payments net of the Company's 50.0% ownership of the fee interest in the property. | |||||||||||||||||||||||||||||||||||||||||||||||
| (6) The Company has an option to purchase the ground lease for a fixed price on a specific date. Scheduled cash payments do not reflect the exercise of the purchase option. | |||||||||||||||||||||||||||||||||||||||||||||||
| (7) The Company has a JV interest in the sublandlord for the premises. Amounts reflect the sublandlord's lease obligation to the fee owner and have not been reduced by rents owed to the sublandlord under a sublease covering 100% of the premises. | |||||||||||||||||||||||||||||||||||||||||||||||
| Supplemental Information | 28 |
Fourth Quarter 2024 |
||||||
|
DEBT AND PREFERRED EQUITY INVESTMENTS
Unaudited
(Dollars in Thousands)
|
|
|||||||
| Weighted Average Book | Weighted Average | Weighted Average Yield | ||||||||||||||||||||||||||||||||||||||||||||||||
Book Value (1) |
Value During Quarter | Yield During Quarter (2) |
At End Of Quarter (3) |
|||||||||||||||||||||||||||||||||||||||||||||||
| 12/31/2023 | $ | 346,745 | $ | 358,011 | 7.79% | 7.92% | ||||||||||||||||||||||||||||||||||||||||||||
| Debt investment originations/fundings/accretion | (4) |
3,487 | ||||||||||||||||||||||||||||||||||||||||||||||||
| Preferred Equity investment originations/accretion | (4) |
2,115 | ||||||||||||||||||||||||||||||||||||||||||||||||
| Joint venture investment originations/accretion/amortization | (4) |
— | ||||||||||||||||||||||||||||||||||||||||||||||||
| Redemptions/Sales/Syndications/Equity Ownership/Amortization | — | |||||||||||||||||||||||||||||||||||||||||||||||||
| Reserves/Realized Losses | — | |||||||||||||||||||||||||||||||||||||||||||||||||
| 3/31/2024 | $ | 352,347 | $ | 362,794 | 7.82% | 7.95% | ||||||||||||||||||||||||||||||||||||||||||||
| Debt investment originations/fundings/accretion | (4) |
619 | ||||||||||||||||||||||||||||||||||||||||||||||||
| Preferred Equity investment originations/accretion | (4) |
2,150 | ||||||||||||||||||||||||||||||||||||||||||||||||
| Joint venture investment originations/accretion/amortization | (4) |
205,208 | ||||||||||||||||||||||||||||||||||||||||||||||||
| Redemptions/Sales/Syndications/Equity Ownership/Amortization | (64,629) | |||||||||||||||||||||||||||||||||||||||||||||||||
| Reserves/Realized Losses | — | |||||||||||||||||||||||||||||||||||||||||||||||||
| 6/30/2024 | $ | 495,695 | $ | 405,571 | 7.41% | 7.46% | ||||||||||||||||||||||||||||||||||||||||||||
| Debt investment originations/fundings/accretion | (4) |
1,228 | ||||||||||||||||||||||||||||||||||||||||||||||||
| Preferred Equity investment originations/accretion | (4) |
2,209 | ||||||||||||||||||||||||||||||||||||||||||||||||
| Joint venture investment originations/accretion/amortization | (4) |
4,684 | ||||||||||||||||||||||||||||||||||||||||||||||||
| Redemptions/Sales/Syndications/Equity Ownership/Amortization | — | |||||||||||||||||||||||||||||||||||||||||||||||||
| Reserves/Realized Losses | — | |||||||||||||||||||||||||||||||||||||||||||||||||
| 9/30/2024 | $ | 503,816 | $ | 514,192 | 7.35% | 7.43% | ||||||||||||||||||||||||||||||||||||||||||||
| Debt investment originations/fundings/accretion | (4) |
7,556 | ||||||||||||||||||||||||||||||||||||||||||||||||
| Preferred Equity investment originations/accretion | (4) |
2,246 | ||||||||||||||||||||||||||||||||||||||||||||||||
| Joint venture investment originations/accretion/amortization | (4) |
4,765 | ||||||||||||||||||||||||||||||||||||||||||||||||
| Redemptions/Sales/Syndications/Equity Ownership/Amortization | — | |||||||||||||||||||||||||||||||||||||||||||||||||
| Reserves/Realized Losses | — | |||||||||||||||||||||||||||||||||||||||||||||||||
| 12/31/2024 | $ | 518,383 | $ | 524,757 | 7.26% | 7.30% | ||||||||||||||||||||||||||||||||||||||||||||
| (1) Net of unamortized fees, discounts, and premiums. | ||||||||||||||||||||||||||||||||||||||||||||||||||
| (2) Excludes loan loss reserves and accelerated fee income resulting from early repayment. | ||||||||||||||||||||||||||||||||||||||||||||||||||
| (3) Calculated based on GAAP income, which includes cash interest, paid-in-kind interest, fee accrual and amortization of discounts, recognized in the last month of the quarter. Excludes accelerated fee income resulting from early repayment and loan loss reserves. | ||||||||||||||||||||||||||||||||||||||||||||||||||
| (4) Includes funded future funding obligations, amortization of fees and discounts and paid-in-kind investment income. | ||||||||||||||||||||||||||||||||||||||||||||||||||
| Supplemental Information | 29 |
Fourth Quarter 2024 |
||||||
|
DEBT AND PREFERRED EQUITY INVESTMENTS
Unaudited
(Dollars in Thousands, Except Per Square Foot Amounts)
|
|
|||||||
| Book Value | Senior | Weighted Average | Weighted Average | Weighted Average Yield | ||||||||||||||||||||||||||||||||||||||||||||||||||||||||||
| Type of Investment | Floating rate | Fixed rate | Total | Financing | Exposure PSF (1) |
Yield During Quarter (2) |
At End Of Quarter (2) (3) |
|||||||||||||||||||||||||||||||||||||||||||||||||||||||
| Mezzanine Debt | $ | 117,006 | $ | 50,000 | $ | 167,006 | $ | 812,021 | $ | 592 | 6.05% | 6.02% | ||||||||||||||||||||||||||||||||||||||||||||||||||
| Preferred Equity | — | 136,720 | 136,720 | 250,000 | $ | 785 | 6.46% | 6.55% | ||||||||||||||||||||||||||||||||||||||||||||||||||||||
| Joint Venture Preferred Equity | — | 214,657 | 214,657 | 206,321 | $ | 764 | 8.76% | 8.86% | ||||||||||||||||||||||||||||||||||||||||||||||||||||||
Balance as of 12/31/2024 |
$ | 117,006 | $ | 401,377 | $ | 518,383 | $ | 713 | 7.26% | 7.30% | ||||||||||||||||||||||||||||||||||||||||||||||||||||
| Debt and Preferred Equity Maturity Profile | ||||||||||||||||||||
2025 |
2026 |
2027 |
2028 |
2029 & Thereafter |
||||||||||||||||
| Floating Rate | $ | 62,525 | $ | 54,481 | $ | — | $ | — | $ | — | ||||||||||
| Fixed Rate | 30,000 | 214,657 | 136,720 | — | 20,000 | |||||||||||||||
| Sub-total | $ | 92,525 | $ | 269,138 | $ | 136,720 | $ | — | $ | 20,000 | ||||||||||
| (1) Net of loan loss reserves. | ||||||||||||||||||||||||||||||||||||||||||||||||||||||||||||||
| (2) Excludes accelerated fee income resulting from early repayment and loan loss reserves. | ||||||||||||||||||||||||||||||||||||||||||||||||||||||||||||||
| (3) Calculated based on GAAP income, which includes cash interest, paid-in-kind interest, fee accrual and amortization of discounts, recognized in the last month of the quarter, excluding accelerated fee income resulting from early repayment and loan loss reserves. | ||||||||||||||||||||||||||||||||||||||||||||||||||||||||||||||
| Supplemental Information | 30 |
Fourth Quarter 2024 |
||||||
|
DEBT AND PREFERRED EQUITY INVESTMENTS
Unaudited
(Dollars in Thousands, Except Per Square Foot Amounts)
|
|
|||||||
Book Value (1) |
Property | Senior | Yield At End | ||||||||||||||||||||||||||||||||||||||||||||||||||
| Investment Type | 12/31/2024 | Type | Location | Financing | Last $ PSF (2) |
Fixed/Floating | Of Quarter (3) |
||||||||||||||||||||||||||||||||||||||||||||||
| Preferred Equity (4) | $ | 214,657 | (4) | Office | Manhattan | $ | 206,321 | $ | 764 | Fixed | 8.86% | ||||||||||||||||||||||||||||||||||||||||||
| Preferred Equity | 136,720 | Multi-Family Rental | Manhattan | 250,000 | $ | 785 | Fixed | 6.55% | |||||||||||||||||||||||||||||||||||||||||||||
| Mezzanine Loan | 54,482 | Office | Manhattan | 190,021 | $ | 749 | Floating | 9.59% | |||||||||||||||||||||||||||||||||||||||||||||
| Mezzanine Loan (5) | 53,533 | (5) | Office | Manhattan | 283,000 | $ | 428 | Floating | (6) | ||||||||||||||||||||||||||||||||||||||||||||
| Mezzanine Loan | 30,000 | Office | Manhattan | 95,000 | $ | 573 | Fixed | 8.52% | |||||||||||||||||||||||||||||||||||||||||||||
| Mezzanine Loan | 20,000 | Multi-Family Rental | Brooklyn | 85,000 | $ | 696 | Fixed | 8.11% | |||||||||||||||||||||||||||||||||||||||||||||
| Mezzanine Loan | 8,991 | Office | Manhattan | 54,000 | $ | 455 | Floating | 16.34% | |||||||||||||||||||||||||||||||||||||||||||||
| Total | $ | 518,383 | |||||||||||||||||||||||||||||||||||||||||||||||||||
| (1) Net of unamortized fees, discounts, premiums and loan loss reserves. | |||||||||||||||||||||||||||||||||||||||||||||||||||||
| (2) Reflects the last dollar of exposure to the Company's most junior position. | |||||||||||||||||||||||||||||||||||||||||||||||||||||
| (3) Calculated based on accounting income, which includes cash interest, paid-in-kind interest, fee accrual and amortization of discounts, recognized in the last month of the quarter excluding loan loss reserves. | |||||||||||||||||||||||||||||||||||||||||||||||||||||
| (4) Investment is included in the Investment in unconsolidated joint ventures line item in our consolidated balance sheet. | |||||||||||||||||||||||||||||||||||||||||||||||||||||
| (5) Alternative Strategy Portfolio asset. | |||||||||||||||||||||||||||||||||||||||||||||||||||||
(6) Loan was put on non-accrual in the first quarter of 2023 and continues to be on non-accrual as of December 31, 2024. | |||||||||||||||||||||||||||||||||||||||||||||||||||||
| Supplemental Information | 31 |
Fourth Quarter 2024 |
||||||
|
SELECTED PROPERTY DATA
Manhattan Operating Properties
Unaudited
(Dollars in Thousands)
|
|
|||||||
| Ownership | % of Total | December 31, 2024 | September 30, 2024 | Annualized Contractual Cash Rent |
Total Tenants | ||||||||||||||||||||||||||||||||||||||||||||||||||||||
| Properties | Interest (%) | SubMarket | Ownership | Square Feet (1) | Sq. Feet | % Occupied (2) |
% Leased (3) |
% Occupied (2) |
% Leased (3) |
($'s) | SLG Share ($'s) | ||||||||||||||||||||||||||||||||||||||||||||||||
| CONSOLIDATED PROPERTIES | |||||||||||||||||||||||||||||||||||||||||||||||||||||||||||
| "Same Store" | |||||||||||||||||||||||||||||||||||||||||||||||||||||||||||
| 10 East 53rd Street | 100.0 | Plaza District | Fee Interest | 354,300 | 1.6 | 97.6 | 98.1 | 98.1 | 98.1 | $33,872 | $33,872 | 39 | |||||||||||||||||||||||||||||||||||||||||||||||
| 100 Church Street | 100.0 | Downtown | Fee Interest | 1,047,500 | 4.8 | 86.9 | 86.9 | 93.1 | 93.1 | 46,125 | 46,125 | 19 | |||||||||||||||||||||||||||||||||||||||||||||||
| 100 Park Avenue | 50.0 | Grand Central South | Fee Interest | 834,000 | 3.8 | 60.8 | 95.8 | 57.5 | 66.2 | 40,294 | 20,147 | 33 | |||||||||||||||||||||||||||||||||||||||||||||||
| 110 Greene Street | 100.0 | Soho | Fee Interest | 223,600 | 1.0 | 89.3 | 92.2 | 91.3 | 91.4 | 18,145 | 18,145 | 55 | |||||||||||||||||||||||||||||||||||||||||||||||
| 125 Park Avenue | 100.0 | Grand Central | Fee Interest | 604,245 | 2.8 | 95.7 | 99.5 | 100.0 | 100.0 | 46,465 | 46,465 | 23 | |||||||||||||||||||||||||||||||||||||||||||||||
| 304 Park Avenue South | 100.0 | Midtown South | Fee Interest | 215,000 | 1.0 | 100.0 | 100.0 | 100.0 | 100.0 | 18,741 | 18,741 | 7 | |||||||||||||||||||||||||||||||||||||||||||||||
| 420 Lexington Ave (Graybar) | 100.0 | Grand Central North | Leasehold Interest | 1,188,000 | 5.6 | 86.9 | 90.1 | 87.0 | 90.3 | 82,350 | 82,350 | 170 | |||||||||||||||||||||||||||||||||||||||||||||||
| 461 Fifth Avenue | 100.0 | Midtown | Fee Interest | 200,000 | 0.9 | 98.2 | 98.2 | 92.9 | 98.2 | 17,673 | 17,673 | 18 | |||||||||||||||||||||||||||||||||||||||||||||||
| 485 Lexington Avenue | 100.0 | Grand Central North | Fee Interest | 921,000 | 4.2 | 78.9 | 83.2 | 77.0 | 82.4 | 48,211 | 48,211 | 33 | |||||||||||||||||||||||||||||||||||||||||||||||
| 555 West 57th Street | 100.0 | Midtown West | Fee Interest | 941,000 | 4.3 | 88.1 | 88.1 | 88.1 | 88.1 | 51,890 | 51,890 | 12 | |||||||||||||||||||||||||||||||||||||||||||||||
| 711 Third Avenue | 100.0 (4) | Grand Central North | Leasehold Interest (4) | 524,000 | 2.4 | 93.7 | 93.7 | 93.7 | 93.7 | 33,735 | 33,735 | 20 | |||||||||||||||||||||||||||||||||||||||||||||||
| 810 Seventh Avenue | 100.0 | Times Square | Fee Interest | 692,000 | 3.2 | 80.6 | 85.4 | 81.3 | 86.1 | 41,795 | 41,795 | 44 | |||||||||||||||||||||||||||||||||||||||||||||||
| 1185 Avenue of the Americas | 100.0 | Rockefeller Center | Leasehold Interest | 1,062,000 | 4.9 | 75.0 | 85.9 | 76.8 | 79.7 | 68,903 | 68,903 | 15 | |||||||||||||||||||||||||||||||||||||||||||||||
| 1350 Avenue of the Americas | 100.0 | Rockefeller Center | Fee Interest | 562,000 | 2.6 | 78.5 | 80.7 | 76.2 | 78.5 | 35,732 | 35,732 | 45 | |||||||||||||||||||||||||||||||||||||||||||||||
| Added to Same Store in 2024 | |||||||||||||||||||||||||||||||||||||||||||||||||||||||||||
| 885 Third Avenue | 100.0 | Midtown / Plaza District | Fee / Leasehold Interest | 218,796 | 1.0 | 74.5 | 74.5 | 73.1 | 73.1 | 10,081 | 10,081 | 11 | |||||||||||||||||||||||||||||||||||||||||||||||
| Subtotal / Weighted Average | 9,587,441 | 44.1 | % | 83.3 | % | 89.2 | % | 83.9 | % | 86.5 | % | $594,012 | $573,865 | 544 | |||||||||||||||||||||||||||||||||||||||||||||
| Total / Weighted Average Consolidated Properties | 9,587,441 | 44.1 | % | 83.3 | % | 89.2 | % | 83.9 | % | 86.5 | % | $594,012 | $573,865 | 544 | |||||||||||||||||||||||||||||||||||||||||||||
| UNCONSOLIDATED PROPERTIES | |||||||||||||||||||||||||||||||||||||||||||||||||||||||||||
| "Same Store" | |||||||||||||||||||||||||||||||||||||||||||||||||||||||||||
| One Vanderbilt Avenue | 60.0 | Grand Central | Fee Interest | 1,657,198 | 7.6 | 99.4 | 100.0 | 99.4 | 100.0 | $287,129 | $172,277 | 40 | |||||||||||||||||||||||||||||||||||||||||||||||
| 11 Madison Avenue | 60.0 | Park Avenue South | Fee Interest | 2,314,000 | 10.8 | 96.1 | 96.1 | 96.1 | 96.1 | 172,839 | 103,704 | 7 | |||||||||||||||||||||||||||||||||||||||||||||||
| 220 East 42nd Street | 51.0 | Grand Central | Fee Interest | 1,135,000 | 5.2 | 89.0 | 93.7 | 89.5 | 92.0 | 69,332 | 35,359 | 31 | |||||||||||||||||||||||||||||||||||||||||||||||
| 280 Park Avenue | 50.0 | Park Avenue | Fee Interest | 1,219,158 | 5.6 | 89.0 | 91.1 | 87.9 | 89.5 | 121,544 | 60,772 | 33 | |||||||||||||||||||||||||||||||||||||||||||||||
| 800 Third Avenue | 60.5 | Grand Central North | Fee Interest | 526,000 | 2.4 | 84.6 | 84.6 | 89.2 | 89.2 | 32,995 | 19,962 | 43 | |||||||||||||||||||||||||||||||||||||||||||||||
| 919 Third Avenue | 51.0 | Grand Central North | Fee Interest | 1,454,000 | 6.7 | 80.9 | 95.6 | 80.0 | 80.9 | 82,200 | 41,922 | 10 | |||||||||||||||||||||||||||||||||||||||||||||||
| 1515 Broadway | 56.9 | Times Square | Fee Interest | 1,750,000 | 8.0 | 99.7 | 99.7 | 99.7 | 99.7 | 139,119 | 79,159 | 7 | |||||||||||||||||||||||||||||||||||||||||||||||
| Added to Same Store in 2024 | |||||||||||||||||||||||||||||||||||||||||||||||||||||||||||
| 450 Park Avenue | 25.1 | Park Avenue | Fee Interest | 337,000 | 1.5 | 89.3 | 89.3 | 89.3 | 89.3 | 37,886 | 9,509 | 23 | |||||||||||||||||||||||||||||||||||||||||||||||
| Subtotal / Weighted Average | 10,392,356 | 47.8 | % | 92.7 | % | 95.6 | % | 92.7 | % | 93.4 | % | $943,044 | $522,664 | 194 | |||||||||||||||||||||||||||||||||||||||||||||
| "Non Same Store" | |||||||||||||||||||||||||||||||||||||||||||||||||||||||||||
| 245 Park Avenue | 50.1 | Park Avenue | Fee Interest | 1,782,793 | 8.2 | 85.4 | 91.7 | 79.0 | 87.7 | $157,384 | $78,849 | 14 | |||||||||||||||||||||||||||||||||||||||||||||||
| Subtotal / Weighted Average | 1,782,793 | 8.2 | % | 85.4 | % | 91.7 | % | 79.0 | % | 87.7 | % | $157,384 | $78,849 | 14 | |||||||||||||||||||||||||||||||||||||||||||||
| Total / Weighted Average Unconsolidated Properties | 12,175,149 | 55.9 | % | 91.6 | % | 95.0 | % | 90.7 | % | 92.6 | % | $1,100,428 | $601,513 | 208 | |||||||||||||||||||||||||||||||||||||||||||||
| Manhattan Operating Properties Grand Total / Weighted Average | 21,762,590 | 100.0 | % | 88.0 | % | 92.5 | % | 87.7 | % | 89.9 | % | $1,694,440 | $1,175,379 | 752 | |||||||||||||||||||||||||||||||||||||||||||||
| Manhattan Operating Properties Same Store Occupancy % | 19,979,797 | 91.8 | % | 88.2 | % | 92.5 | % | 88.5 | % | 90.1 | % | ||||||||||||||||||||||||||||||||||||||||||||||||
| (1) Represents the rentable square footage at the time the property was acquired. | |||||||||||||||||||||||||||||||||||||||||||||||||||||||||||
| (2) Based on commenced leases. | |||||||||||||||||||||||||||||||||||||||||||||||||||||||||||
| (3) Inclusive of leases signed but not yet commenced. | |||||||||||||||||||||||||||||||||||||||||||||||||||||||||||
| (4) The Company also owns 50% of the fee interest. | |||||||||||||||||||||||||||||||||||||||||||||||||||||||||||
| Supplemental Information | 32 |
Fourth Quarter 2024 |
||||||
|
SELECTED PROPERTY DATA
Retail, Residential and Suburban Operating Properties
Unaudited
(Dollars in Thousands)
|
|
|||||||
| Ownership | % of Total | December 31, 2024 | September 30, 2024 | Annualized Contractual Cash Rent |
Total Tenants | ||||||||||||||||||||||||||||||||||||||||||||||||||||||
| Properties | Interest (%) | SubMarket | Ownership | Square Feet (1) | Sq. Feet | % Occupied (2) |
% Leased (3) |
% Occupied (2) |
% Leased (3) |
($'s) | SLG Share ($'s) | ||||||||||||||||||||||||||||||||||||||||||||||||
| RETAIL PROPERTIES | |||||||||||||||||||||||||||||||||||||||||||||||||||||||||||
| "Same Store" Retail | |||||||||||||||||||||||||||||||||||||||||||||||||||||||||||
| 85 Fifth Avenue | 36.3 | Midtown South | Fee Interest | 12,946 | 29.8 | 100.0 | 100.0 | 100.0 | 100.0 | $2,800 | $1,016 | 1 | |||||||||||||||||||||||||||||||||||||||||||||||
| Subtotal/Weighted Average | 12,946 | 29.8 | % | 100.0 | % | 100.0 | % | 100.0 | % | 100.0 | % | $2,800 | $1,016 | 1 | |||||||||||||||||||||||||||||||||||||||||||||
| "Non Same Store" Retail | |||||||||||||||||||||||||||||||||||||||||||||||||||||||||||
| 690 Madison Avenue | 90.0 | Plaza District | Fee Interest | 7,848 | 18.1 | 100.0 | 100.0 | 100.0 | 100.0 | $1,505 | $1,355 | 1 | |||||||||||||||||||||||||||||||||||||||||||||||
| 760 Madison Avenue | 100.0 | Plaza District | Fee Interest | 22,648 | 52.1 | 100.0 | 100.0 | 100.0 | 100.0 | 18,046 | 18,046 | 1 | |||||||||||||||||||||||||||||||||||||||||||||||
| Subtotal/Weighted Average | 30,496 | 70.2 | % | 100.0 | % | 100.0 | % | 100.0 | % | 100.0 | % | $19,551 | $19,401 | 2 | |||||||||||||||||||||||||||||||||||||||||||||
| Total / Weighted Average Retail Properties | 43,442 | 100.0 | % | 100.0 | % | 100.0 | % | 100.0 | % | 100.0 | % | $22,351 | $20,416 | 3 | |||||||||||||||||||||||||||||||||||||||||||||
| Ownership | Total | December 31, 2024 | September 30, 2024 | Annualized Contractual Cash Rent |
Average Monthly Rent Per Unit (4) | ||||||||||||||||||||||||||||||||||||||||||||||||||||||
| Properties | Interest (%) | SubMarket | Ownership | Square Feet (1) | Units | % Occupied (2) |
% Leased (3) |
% Occupied (2) |
% Leased (3) |
($'s) | SLG Share ($'s) | ($'s) | |||||||||||||||||||||||||||||||||||||||||||||||
| RESIDENTIAL PROPERTIES | |||||||||||||||||||||||||||||||||||||||||||||||||||||||||||
| "Non Same Store" Residential | |||||||||||||||||||||||||||||||||||||||||||||||||||||||||||
| 7 Dey Street | 100.0 | Lower Manhattan | Fee Interest | 140,382 | 209 | 94.3 | 97.1 | 96.2 | 96.7 | $11,707 | $11,707 | $4,952 | |||||||||||||||||||||||||||||||||||||||||||||||
| 15 Beekman Street | 20.0 | Downtown | Leasehold Interest | 221,884 | 484 | (5) | 100.0 | 100.0 | 100.0 | 100.0 | 13,810 | 2,762 | N/A | ||||||||||||||||||||||||||||||||||||||||||||||
| Subtotal/Weighted Average | 362,266 | 693 | 98.3 | % | 99.1 | % | 98.8 | % | 99.0 | % | $25,517 | $14,469 | $4,952 | ||||||||||||||||||||||||||||||||||||||||||||||
| Total / Weighted Average Residential Properties | 362,266 | 693 | 98.3 | % | 99.1 | % | 98.8 | % | 99.0 | % | $25,517 | $14,469 | $4,952 | ||||||||||||||||||||||||||||||||||||||||||||||
| Ownership | % of Total | December 31, 2024 | September 30, 2024 | Annualized Contractual Cash Rent |
Total Tenants | ||||||||||||||||||||||||||||||||||||||||||||||||||||||
| Properties | Interest (%) | SubMarket | Ownership | Square Feet (1) | Sq. Feet | % Occupied (2) |
% Leased (3) |
% Occupied (2) |
% Leased (3) |
($'s) | SLG Share ($'s) | ||||||||||||||||||||||||||||||||||||||||||||||||
| SUBURBAN PROPERTIES | |||||||||||||||||||||||||||||||||||||||||||||||||||||||||||
| "Same Store" Suburban | |||||||||||||||||||||||||||||||||||||||||||||||||||||||||||
| Landmark Square | 100.0 | Stamford, Connecticut | Fee Interest | 862,800 | 100.0 | 72.6 | 73.5 | 72.3 | 73.6 | $18,080 | $18,080 | 92 | |||||||||||||||||||||||||||||||||||||||||||||||
| Subtotal/Weighted Average | 862,800 | 100.0 | % | 72.6 | % | 73.5 | % | 72.3 | % | 73.6 | % | $18,080 | $18,080 | 92 | |||||||||||||||||||||||||||||||||||||||||||||
| Total / Weighted Average Suburban Properties | 862,800 | 100.0 | % | 72.6 | % | 73.5 | % | 72.3 | % | 73.6 | % | $18,080 | $18,080 | 92 | |||||||||||||||||||||||||||||||||||||||||||||
| (1) Represents the rentable square footage at the time the property was acquired. | |||||||||||||||||||||||||||||||||||||||||||||||||||||||||||
| (2) Based on commenced leases. | |||||||||||||||||||||||||||||||||||||||||||||||||||||||||||
| (3) Inclusive of leases signed but not yet commenced. | |||||||||||||||||||||||||||||||||||||||||||||||||||||||||||
| (4) Calculated based on occupied units. Amount in dollars. | |||||||||||||||||||||||||||||||||||||||||||||||||||||||||||
| (5) Property occupied by Pace University and used as an academic center and dormitory space. 484 represents number of beds. | |||||||||||||||||||||||||||||||||||||||||||||||||||||||||||
| Supplemental Information | 33 |
Fourth Quarter 2024 |
||||||
|
SELECTED PROPERTY DATA
Development / Redevelopment & Alternative Strategy Portfolio Properties
Unaudited
(Dollars in Thousands)
|
|
|||||||
| Ownership | % of Total | December 31, 2024 | September 30, 2024 | Annualized Contractual Cash Rent |
Real Estate Book Value, Net | Total Tenants | |||||||||||||||||||||||||||||||||||||||||||||||||||||||||||
| Properties | Interest (%) | SubMarket | Ownership | Square Feet (1) | Sq. Feet | % Occupied (2) |
% Leased (3) |
% Occupied (2) |
% Leased (3) |
($'s) | SLG Share ($'s) | ||||||||||||||||||||||||||||||||||||||||||||||||||||||
| Development / Redevelopment | |||||||||||||||||||||||||||||||||||||||||||||||||||||||||||||||||
| One Madison Avenue | 25.5 | Park Avenue South | Fee Interest | 1,385,484 | 62.0 | 62.9 | 66.6 | 62.8 | 66.6 | $105,999 | $27,030 | $1,676,349 | 10 | ||||||||||||||||||||||||||||||||||||||||||||||||||||
| 19 East 65th Street | 100.0 | Plaza District | Fee Interest | 14,639 | 0.7 | 5.5 | 5.5 | 5.5 | 5.5 | 32 | 32 | 15,658 | 1 | ||||||||||||||||||||||||||||||||||||||||||||||||||||
| 185 Broadway | 100.0 | Lower Manhattan | Fee Interest | 50,206 | 2.3 | 34.5 | 34.5 | 34.5 | 34.5 | 3,454 | 3,454 | 48,572 | 4 | ||||||||||||||||||||||||||||||||||||||||||||||||||||
| 750 Third Avenue | 100.0 | Grand Central North | Fee Interest | 780,000 | 35.0 | 9.5 | 9.5 | 10.3 | 10.3 | 6,299 | 6,300 | 301,397 | 9 | ||||||||||||||||||||||||||||||||||||||||||||||||||||
| Total / Weighted Average Development / Redevelopment Properties | 2,230,329 | 100.0 | % | 43.2 | % | 45.5 | % | 43.4 | % | 45.8 | % | $115,784 | $36,816 | $2,041,976 | 24 | ||||||||||||||||||||||||||||||||||||||||||||||||||
| Ownership | % of Total | December 31, 2024 | September 30, 2024 | Annualized Contractual Cash Rent |
Investment Carrying Value, Net | Total Tenants | |||||||||||||||||||||||||||||||||||||||||||||||||||||||||||
| Properties | Interest (%) | SubMarket | Ownership | Square Feet (1) | Sq. Feet | % Occupied (2) |
% Leased (3) |
% Occupied (2) |
% Leased (3) |
($'s) | SLG Share ($'s) | ||||||||||||||||||||||||||||||||||||||||||||||||||||||
| Alternative Strategy Portfolio | |||||||||||||||||||||||||||||||||||||||||||||||||||||||||||||||||
| 2 Herald Square | 95.0 | Herald Square | Leasehold Interest | 369,000 | 14.4 | 60.3 | 60.3 | 43.9 | 43.9 | $20,291 | $19,276 | $107,888 | 5 | ||||||||||||||||||||||||||||||||||||||||||||||||||||
| 11 West 34th Street | 30.0 | Herald Square/Penn Station | Fee Interest | 17,150 | 0.7 | 100.0 | 100.0 | 100.0 | 100.0 | 3,561 | 1,068 | 0 | 1 | ||||||||||||||||||||||||||||||||||||||||||||||||||||
| 115 Spring Street | 51.0 | Soho | Fee Interest | 5,218 | 0.2 | 100.0 | 100.0 | 100.0 | 100.0 | 4,098 | 2,090 | (18,338) | 1 | ||||||||||||||||||||||||||||||||||||||||||||||||||||
| 650 Fifth Avenue | 50.0 | Plaza District | Leasehold Interest | 69,214 | 2.7 | 100.0 | 100.0 | 100.0 | 100.0 | 41,308 | 20,655 | (79,515) | 1 | ||||||||||||||||||||||||||||||||||||||||||||||||||||
| 1552-1560 Broadway | 50.0 | Times Square | Fee / Leasehold Interest | 57,718 | 2.2 | 12.6 | 12.6 | 12.6 | 12.6 | 2,000 | 1,000 | 0 | 1 | ||||||||||||||||||||||||||||||||||||||||||||||||||||
| Worldwide Plaza | 25.0 | Westside | Fee Interest | 2,048,725 | 79.8 | 63.3 | 63.3 | 63.3 | 63.3 | 77,129 | 19,244 | 19,338 | 22 | ||||||||||||||||||||||||||||||||||||||||||||||||||||
| Total / Weighted Average Alternative Strategy Portfolio Properties | 2,567,025 | 100.0 | % | 63.0 | % | 63.0 | % | 60.7 | % | 60.7 | % | $148,387 | $63,333 | $29,373 | 31 | ||||||||||||||||||||||||||||||||||||||||||||||||||
| (1) Represents the rentable square footage at the time the property was acquired. | |||||||||||||||||||||||||||||||||||||||||||||||||||||||||||||||||
| (2) Based on commenced leases. | |||||||||||||||||||||||||||||||||||||||||||||||||||||||||||||||||
| (3) Inclusive of leases signed but not yet commenced. | |||||||||||||||||||||||||||||||||||||||||||||||||||||||||||||||||
| Supplemental Information | 34 |
Fourth Quarter 2024 |
||||||
|
SELECTED PROPERTY DATA
Retail Within Operating, Development / Redevelopment and Alternative Strategy Portfolio Properties
Unaudited
(Dollars in Thousands)
|
|
|||||||
| Ownership | % of Total | December 31, 2024 | September 30, 2024 | Annualized Contractual Cash Rent |
Total Tenants | ||||||||||||||||||||||||||||||||||||||||||||||||||||||
| Properties | Interest (%) | SubMarket | Ownership | Square Feet (1) | Sq. Feet | % Occupied (2) |
% Leased (3) |
% Occupied (2) |
% Leased (3) |
($'s) | SLG Share ($'s) | ||||||||||||||||||||||||||||||||||||||||||||||||
| HIGH STREET RETAIL - Consolidated Properties | |||||||||||||||||||||||||||||||||||||||||||||||||||||||||||
| 690 Madison Avenue | 90.0 | Plaza District | Fee Interest | 7,944 | 0.6 | 100.0 | 100.0 | 100.0 | 100.0 | $1,505 | $1,354 | 1 | |||||||||||||||||||||||||||||||||||||||||||||||
| 760 Madison Avenue | 100.0 | Plaza District | Fee Interest | 22,648 | 1.8 | 100.0 | 100.0 | 100.0 | 100.0 | 18,046 | 18,047 | 1 | |||||||||||||||||||||||||||||||||||||||||||||||
| Subtotal / Weighted Average | 30,592 | 2.4 | % | 100.0 | % | 100.0 | % | 100.0 | % | 100.0 | % | $19,551 | $19,401 | 2 | |||||||||||||||||||||||||||||||||||||||||||||
| HIGH STREET RETAIL - Unconsolidated Properties | |||||||||||||||||||||||||||||||||||||||||||||||||||||||||||
| 85 Fifth Avenue | 36.3 | Midtown South | Fee Interest | 12,946 | 1.0 | 100.0 | 100.0 | 100.0 | 100.0 | $2,800 | $1,016 | 1 | |||||||||||||||||||||||||||||||||||||||||||||||
| Subtotal / Weighted Average | 12,946 | 1.0 | % | 100.0 | % | 100.0 | % | 100.0 | % | 100.0 | % | $2,800 | $1,016 | 1 | |||||||||||||||||||||||||||||||||||||||||||||
| Total / Weighted Average High Street Retail | 43,538 | 3.5 | % | 100.0 | % | 100.0 | % | 100.0 | % | 100.0 | % | $22,351 | $20,416 | 3 | |||||||||||||||||||||||||||||||||||||||||||||
| OTHER RETAIL - Consolidated Properties | |||||||||||||||||||||||||||||||||||||||||||||||||||||||||||
| 10 East 53rd Street | 100.0 | Plaza District | Fee Interest | 38,657 | 3.1 | 100.0 | 100.0 | 100.0 | 100.0 | $4,099 | $4,099 | 3 | |||||||||||||||||||||||||||||||||||||||||||||||
| 100 Church Street | 100.0 | Downtown | Fee Interest | 61,708 | 4.9 | 100.0 | 100.0 | 100.0 | 100.0 | 4,306 | 4,306 | 10 | |||||||||||||||||||||||||||||||||||||||||||||||
| 100 Park Avenue | 50.0 | Grand Central South | Fee Interest | 40,022 | 3.2 | 97.1 | 97.1 | 91.7 | 91.7 | 3,243 | 1,621 | 7 | |||||||||||||||||||||||||||||||||||||||||||||||
| 110 Greene Street | 100.0 | Soho | Fee Interest | 16,121 | 1.3 | 100.0 | 100.0 | 100.0 | 100.0 | 4,615 | 4,615 | 3 | |||||||||||||||||||||||||||||||||||||||||||||||
| 125 Park Avenue | 100.0 | Grand Central | Fee Interest | 32,124 | 2.6 | 100.0 | 100.0 | 100.0 | 100.0 | 4,184 | 4,185 | 7 | |||||||||||||||||||||||||||||||||||||||||||||||
| 185 Broadway | 100.0 | Lower Manhattan | Fee Interest | 16,413 | 1.3 | 100.0 | 100.0 | 100.0 | 100.0 | 3,454 | 3,454 | 4 | |||||||||||||||||||||||||||||||||||||||||||||||
| 304 Park Avenue South | 100.0 | Midtown South | Fee Interest | 25,330 | 2.0 | 100.0 | 100.0 | 100.0 | 100.0 | 3,666 | 3,666 | 5 | |||||||||||||||||||||||||||||||||||||||||||||||
| 420 Lexington Ave (Graybar) | 100.0 | Grand Central North | Leasehold Interest | 54,026 | 4.3 | 100.0 | 100.0 | 100.0 | 100.0 | 5,380 | 5,380 | 6 | |||||||||||||||||||||||||||||||||||||||||||||||
| 461 Fifth Avenue | 100.0 | Midtown | Fee Interest | 16,149 | 1.3 | 100.0 | 100.0 | 100.0 | 100.0 | 1,130 | 1,130 | 2 | |||||||||||||||||||||||||||||||||||||||||||||||
| 485 Lexington Avenue | 100.0 | Grand Central North | Fee Interest | 41,701 | 3.3 | 64.7 | 64.7 | 64.7 | 64.7 | 4,019 | 4,019 | 6 | |||||||||||||||||||||||||||||||||||||||||||||||
| 555 West 57th Street | 100.0 | Midtown West | Fee Interest | 53,186 | 4.3 | 100.0 | 100.0 | 100.0 | 100.0 | 3,089 | 3,089 | 2 | |||||||||||||||||||||||||||||||||||||||||||||||
| 711 Third Avenue | 100.0 | Grand Central North | Leasehold Interest | 25,639 | 2.1 | 83.5 | 83.5 | 83.5 | 83.5 | 2,321 | 2,321 | 2 | |||||||||||||||||||||||||||||||||||||||||||||||
| 750 Third Avenue (4) | 100.0 | Grand Central North | Fee Interest | 24,827 | 2.0 | 47.5 | 47.5 | 47.5 | 47.5 | 1,764 | 1,764 | 4 | |||||||||||||||||||||||||||||||||||||||||||||||
| 810 Seventh Avenue | 100.0 | Times Square | Fee Interest | 18,207 | 1.5 | 98.6 | 98.6 | 98.6 | 98.6 | 4,723 | 4,723 | 3 | |||||||||||||||||||||||||||||||||||||||||||||||
| 885 Third Avenue | 100.0 | Midtown / Plaza District | Fee / Leasehold Interest | 9,140 | 0.7 | 100.0 | 100.0 | 100.0 | 100.0 | 511 | 511 | 2 | |||||||||||||||||||||||||||||||||||||||||||||||
| 1185 Avenue of the Americas | 100.0 | Rockefeller Center | Leasehold Interest | 58,271 | 4.7 | 84.1 | 84.1 | 84.1 | 84.1 | 2,755 | 2,755 | 3 | |||||||||||||||||||||||||||||||||||||||||||||||
| 1350 Avenue of the Americas | 100.0 | Rockefeller Center | Fee Interest | 17,797 | 1.4 | 100.0 | 100.0 | 100.0 | 100.0 | 2,763 | 2,763 | 6 | |||||||||||||||||||||||||||||||||||||||||||||||
| Subtotal / Weighted Average | 549,318 | 44.0 | % | 92.2 | % | 92.2 | % | 91.8 | % | 91.8 | % | $56,022 | $54,401 | 75 | |||||||||||||||||||||||||||||||||||||||||||||
| OTHER RETAIL - Unconsolidated Properties | |||||||||||||||||||||||||||||||||||||||||||||||||||||||||||
| One Vanderbilt Avenue | 60.0 | Grand Central | Fee Interest | 34,885 | 2.8 | 100.0 | 100.0 | 100.0 | 100.0 | $5,850 | $3,510 | 7 | |||||||||||||||||||||||||||||||||||||||||||||||
| 11 Madison Avenue | 60.0 | Park Avenue South | Fee Interest | 38,800 | 3.1 | 95.7 | 95.7 | 95.7 | 95.7 | 3,779 | 2,267 | 3 | |||||||||||||||||||||||||||||||||||||||||||||||
| 220 East 42nd Street | 51.0 | Grand Central | Fee Interest | 33,866 | 2.7 | 67.1 | 67.1 | 67.1 | 67.1 | 1,597 | 815 | 3 | |||||||||||||||||||||||||||||||||||||||||||||||
| 245 Park Avenue | 50.1 | Park Avenue | Fee Interest | 37,220 | 3.0 | 50.7 | 50.7 | 50.7 | 50.7 | 1,166 | 584 | 3 | |||||||||||||||||||||||||||||||||||||||||||||||
| 280 Park Avenue | 50.0 | Park Avenue | Fee Interest | 28,219 | 2.3 | 93.9 | 93.9 | 93.9 | 93.9 | 1,437 | 719 | 2 | |||||||||||||||||||||||||||||||||||||||||||||||
| 450 Park Avenue | 25.1 | Park Avenue | Fee Interest | 6,317 | 0.5 | 100.0 | 100.0 | 100.0 | 100.0 | 1,697 | 426 | 1 | |||||||||||||||||||||||||||||||||||||||||||||||
| 800 Third Avenue | 60.5 | Grand Central North | Fee Interest | 9,900 | 0.8 | 100.0 | 100.0 | 100.0 | 100.0 | 949 | 574 | 2 | |||||||||||||||||||||||||||||||||||||||||||||||
| 919 Third Avenue | 51.0 | Grand Central North | Fee Interest | 31,004 | 2.5 | 98.9 | 98.9 | 98.9 | 98.9 | 3,895 | 1,987 | 4 | |||||||||||||||||||||||||||||||||||||||||||||||
| 1515 Broadway | 56.9 | Times Square | Fee Interest | 182,011 | 14.5 | 99.8 | 99.8 | 99.8 | 99.8 | 31,782 | 18,083 | 7 | |||||||||||||||||||||||||||||||||||||||||||||||
| Subtotal / Weighted Average | 402,222 | 32.2 | % | 91.7 | % | 91.7 | % | 91.7 | % | 91.7 | % | $52,152 | $28,965 | 32 | |||||||||||||||||||||||||||||||||||||||||||||
| Total / Weighted Average Other Retail | 951,540 | 76.2 | % | 92.0 | % | 92.0 | % | 91.8 | % | 91.8 | % | $108,174 | $83,366 | 107 | |||||||||||||||||||||||||||||||||||||||||||||
| (1) Represents the rentable square footage at the time the property was acquired. | |||||||||||||||||||||||||||||||||||||||||||||||||||||||||||
| (2) Based on commenced leases. | |||||||||||||||||||||||||||||||||||||||||||||||||||||||||||
| (3) Inclusive of leases signed but not yet commenced. | |||||||||||||||||||||||||||||||||||||||||||||||||||||||||||
| (4) Redevelopment properties. | |||||||||||||||||||||||||||||||||||||||||||||||||||||||||||
| Supplemental Information | 35 |
Fourth Quarter 2024 |
||||||
|
SELECTED PROPERTY DATA - CONTINUED
Retail Within Operating, Development / Redevelopment and Alternative Strategy Portfolio Properties
Unaudited
(Dollars in Thousands)
|
|
|||||||
| Ownership | % of Total | December 31, 2024 | September 30, 2024 | Annualized Contractual Cash Rent |
Total Tenants | ||||||||||||||||||||||||||||||||||||||||||||||||||||||
| Properties | Interest (%) | SubMarket | Ownership | Square Feet (1) | Sq. Feet | % Occupied (2) |
% Leased (3) |
% Occupied (2) |
% Leased (3) |
($'s) | SLG Share ($'s) | ||||||||||||||||||||||||||||||||||||||||||||||||
| ALTERNATIVE STRATEGY PORTFOLIO - Unconsolidated Properties | |||||||||||||||||||||||||||||||||||||||||||||||||||||||||||
| 2 Herald Square | 95.0 | Herald Square | Leasehold Interest | 94,531 | 7.6 | 40.6 | 40.6 | 40.6 | 40.6 | $9,858 | $9,365 | 3 | |||||||||||||||||||||||||||||||||||||||||||||||
| 11 West 34th Street | 30.00 | Herald Square/Penn Station | Fee Interest | 17,150 | 1.4 | 100.0 | 100.0 | 100.0 | 100.0 | 3,561 | 1,068 | 1 | |||||||||||||||||||||||||||||||||||||||||||||||
| 115 Spring Street | 51.0 | Soho | Fee Interest | 5,218 | 0.4 | 100.0 | 100.0 | 100.0 | 100.0 | 4,098 | 2,090 | 1 | |||||||||||||||||||||||||||||||||||||||||||||||
| 650 Fifth Avenue | 50.0 | Plaza District | Leasehold Interest | 69,214 | 5.6 | 100.0 | 100.0 | 100.0 | 100.0 | 41,308 | 20,654 | 1 | |||||||||||||||||||||||||||||||||||||||||||||||
| 1552-1560 Broadway | 50.0 | Times Square | Fee / Leasehold Interest | 57,718 | 4.6 | 12.6 | 12.6 | 12.6 | 12.6 | 2,000 | 1,000 | 1 | |||||||||||||||||||||||||||||||||||||||||||||||
| Worldwide Plaza | 25.0 | Westside | Fee Interest | 10,592 | (4) | 0.8 | 84.9 | 84.9 | 84.9 | 84.9 | 1,233 | 308 | 7 | ||||||||||||||||||||||||||||||||||||||||||||||
| Subtotal / Weighted Average | 254,423 | 20.4 | % | 57.5 | % | 57.5 | % | 57.5 | % | 57.5 | % | $62,058 | $34,485 | 14 | |||||||||||||||||||||||||||||||||||||||||||||
| Total / Weighted Average Alternative Strategy Portfolio | 254,423 | 20.4 | % | 57.5 | % | 57.5 | % | 57.5 | % | 57.5 | % | $62,058 | $34,485 | 14 | |||||||||||||||||||||||||||||||||||||||||||||
| Retail Grand Total / Weighted Average | 1,249,501 | 100.0 | % | 85.2 | % | 85.2 | % | 85.1 | % | 85.1 | % | $192,583 | $138,267 | 124 | |||||||||||||||||||||||||||||||||||||||||||||
| (1) Represents the rentable square footage at the time the property was acquired. | |||||||||||||||||||||||||||||||||||||||||||||||||||||||||||
| (2) Based on commenced leases. | |||||||||||||||||||||||||||||||||||||||||||||||||||||||||||
| (3) Inclusive of leases signed but not yet commenced. | |||||||||||||||||||||||||||||||||||||||||||||||||||||||||||
| (4) Excludes the theatre, parking garage, fitness gym and other amenity space totaling 241,371 square feet. | |||||||||||||||||||||||||||||||||||||||||||||||||||||||||||
| Supplemental Information | 36 |
Fourth Quarter 2024 |
||||||
|
LARGEST TENANTS BY SLG SHARE OF ANNUALIZED CASH RENT (1)
Unaudited
(Dollars in Thousands Except Per SF)
|
|
|||||||
| Ownership Interest % | Lease Expiration (2) | Total Rentable Square Feet | Annualized Contractual Cash Rent ($) | SLG Share of Annualized Contractual Cash Rent ($) | % of SLG Share of Annualized Contractual Cash Rent (3) |
Annualized Contractual Rent PSF | Investment Grade Credit Rating (4) |
|||||||||||||||||||||||||
| Tenant Name | Property | |||||||||||||||||||||||||||||||
| Paramount Global | 1515 Broadway | 56.9 | Jun 2031 | 1,603,121 | $107,314 | $61,062 | 4.6% | $66.94 | ||||||||||||||||||||||||
| 555 West 57th Street | 100.0 | Apr 2029 | 186,266 | 10,790 | 10,790 | 0.8 | 57.93 | |||||||||||||||||||||||||
| 1515 Broadway | 56.9 | Mar 2028 | 9,106 | 2,166 | 1,232 | 0.1 | 237.84 | |||||||||||||||||||||||||
| Worldwide Plaza | 25.0 | Jan 2027 | 32,598 | 2,488 | 621 | — | 76.34 | |||||||||||||||||||||||||
| 1,831,091 | $122,758 | $73,705 | 5.5% | $67.04 | BBB- | |||||||||||||||||||||||||||
| UBS Americas, Inc. | 11 Madison Avenue | 60.0 | May 2037 | 1,184,762 | $78,221 | $46,933 | 3.5% | $66.02 | A+ | |||||||||||||||||||||||
| Sony Corporation | 11 Madison Avenue | 60.0 | Jan 2031 | 578,791 | $52,130 | $31,278 | 2.3% | $90.07 | A | |||||||||||||||||||||||
| Bloomberg L.P. | 919 Third Avenue | 51.0 | Feb 2040 | 749,216 | $49,782 | $25,389 | 1.9% | $66.45 | ||||||||||||||||||||||||
| Societe Generale | 245 Park Avenue | 50.1 | Oct 2032 | 520,831 | $50,328 | $25,215 | 1.9% | $96.63 | A | |||||||||||||||||||||||
| TD Bank US Holding Company | One Vanderbilt Avenue | 60.0 | Jul 2041 | 193,159 | $26,065 | $15,639 | 1.2% | $134.94 | (5) | |||||||||||||||||||||||
| One Vanderbilt Avenue | 60.0 | Aug 2041 | 6,843 | 3,234 | 1,940 | 0.1 | 472.58 | |||||||||||||||||||||||||
| 125 Park Avenue | 100.0 | Oct 2025 | 6,234 | 2,129 | 2,129 | 0.2 | 341.56 | |||||||||||||||||||||||||
| 125 Park Avenue | 100.0 | Oct 2030 | 26,536 | 1,842 | 1,842 | 0.1 | 69.40 | |||||||||||||||||||||||||
| 125 Park Avenue | 100.0 | Mar 2034 | 25,171 | 1,612 | 1,612 | 0.1 | 64.06 | |||||||||||||||||||||||||
| 257,943 | $34,882 | $23,162 | 1.7% | $135.23 | A+ | |||||||||||||||||||||||||||
| The City of New York | 100 Church Street | 100.0 | Mar 2034 | 510,007 | $22,709 | $22,709 | 1.7% | $44.53 | Aa2 | |||||||||||||||||||||||
| King & Spalding | 1185 Avenue of the Americas | 100.0 | Oct 2025 | 218,275 | $21,010 | $21,010 | 1.6% | $96.25 | ||||||||||||||||||||||||
| Carlyle Investment Management LLC | One Vanderbilt Avenue | 60.0 | Sep 2036 | 194,702 | $34,586 | $20,752 | 1.6% | $177.64 | (5) | A- | ||||||||||||||||||||||
| Nike Retail Services, Inc. | 650 Fifth Avenue | 50.0 | Jan 2033 | 69,214 | $41,308 | $20,654 | 1.5% | $596.82 | AA- | |||||||||||||||||||||||
| Metro-North Commuter Railroad Company | 420 Lexington Avenue | 100.0 | Nov 2034 | 344,873 | $20,113 | $20,113 | 1.5% | $58.32 | ||||||||||||||||||||||||
| 420 Lexington Avenue | 100.0 | Jan 2027 | 7,537 | 448 | 448 | — | 59.48 | |||||||||||||||||||||||||
| 352,410 | $20,561 | $20,561 | 1.5% | $58.34 | (5) | A1 | ||||||||||||||||||||||||||
| WME IMG, LLC | 304 Park Avenue | 100.0 | Apr 2028 | 174,069 | $13,775 | $13,775 | 1.0% | $79.13 | ||||||||||||||||||||||||
| 11 Madison Avenue | 60.0 | Sep 2030 | 104,618 | 10,717 | 6,430 | 0.5% | 102.44 | |||||||||||||||||||||||||
| 278,687 | $24,492 | $20,205 | 1.5% | $87.88 | ||||||||||||||||||||||||||||
| McDermott Will & Emery LLP | One Vanderbilt Avenue | 60.0 | Dec 2042 | 169,586 | $31,475 | $18,885 | 1.4% | $185.60 | ||||||||||||||||||||||||
| 420 Lexington Avenue | 100.0 | Oct 2026 | 10,043 | 621 | 621 | — | 61.82 | |||||||||||||||||||||||||
| 179,629 | $32,096 | $19,506 | 1.4% | $178.68 | ||||||||||||||||||||||||||||
| Franklin Templeton Companies LLC | One Madison Avenue | 25.5 | May 2040 | 354,976 | $48,439 | $12,351 | 0.9% | $136.45 | ||||||||||||||||||||||||
| 280 Park Avenue | 50.0 | Nov 2031 | 128,993 | 13,565 | 6,783 | 0.5% | 105.16 | |||||||||||||||||||||||||
| 483,969 | $62,004 | $19,134 | 1.4% | $128.12 | A | |||||||||||||||||||||||||||
| Giorgio Armani Corporation | 760 Madison Avenue | 100.0 | Oct 2038 | 22,648 | $18,046 | $18,046 | 1.4% | $796.82 | ||||||||||||||||||||||||
| Ares Management LLC | 245 Park Avenue | 50.1 | May 2026 | 36,316 | $3,741 | $1,874 | 0.1% | $103.00 | ||||||||||||||||||||||||
| 245 Park Avenue | 50.1 | Jun 2043 | 251,175 | 29,869 | 14,964 | 1.1% | 118.92 | |||||||||||||||||||||||||
| 287,491 | $33,609 | $16,838 | 1.2% | $116.90 | A- | |||||||||||||||||||||||||||
| The Toronto Dominion Bank | One Vanderbilt Avenue | 60.0 | Apr 2042 | 142,892 | $21,302 | $12,781 | 1.0% | $149.08 | (5) | |||||||||||||||||||||||
| 125 Park Avenue | 100.0 | Apr 2042 | 52,450 | 3,603 | 3,603 | 0.3% | 68.69 | |||||||||||||||||||||||||
| 195,342 | $24,905 | $16,384 | 1.3% | $127.49 | A+ | |||||||||||||||||||||||||||
| Hess Corp | 1185 Avenue of the Americas | 100.0 | Dec 2027 | 167,169 | $15,439 | $15,439 | 1.2% | $92.36 | BBB- | |||||||||||||||||||||||
| Stone Ridge Holdings Group LP | One Vanderbilt Avenue | 60.0 | Dec 2037 | 97,652 | $23,013 | $13,808 | 1.0% | $235.67 | (5) | |||||||||||||||||||||||
| BMW of Manhattan, Inc. | 555 West 57th Street | 100.0 | Jul 2032 | 226,556 | $13,116 | $13,116 | 1.0% | $57.89 | A | |||||||||||||||||||||||
| Total | 8,406,385 | $774,997 | $483,845 | 36.2% | $92.19 | |||||||||||||||||||||||||||
| (1) Based on commenced leases. | ||||||||||||||||||||||||||||||||
| (2) Expiration of current lease term and does not reflect extension options. | ||||||||||||||||||||||||||||||||
| (3) SLG Share of Annualized Cash Rent includes Manhattan, Suburban, Retail, Residential, Development / Redevelopment and Alternative Strategy Portfolio properties. | ||||||||||||||||||||||||||||||||
| (4) Corporate or bond rating from S&P, Fitch or Moody's. | ||||||||||||||||||||||||||||||||
| (5) Tenant pays rent on a net basis. Rent PSF reflects gross equivalent. | ||||||||||||||||||||||||||||||||
| Supplemental Information | 37 |
Fourth Quarter 2024 |
||||||
|
MANHATTAN TENANT DIVERSIFICATION
Unaudited
|
|
|||||||
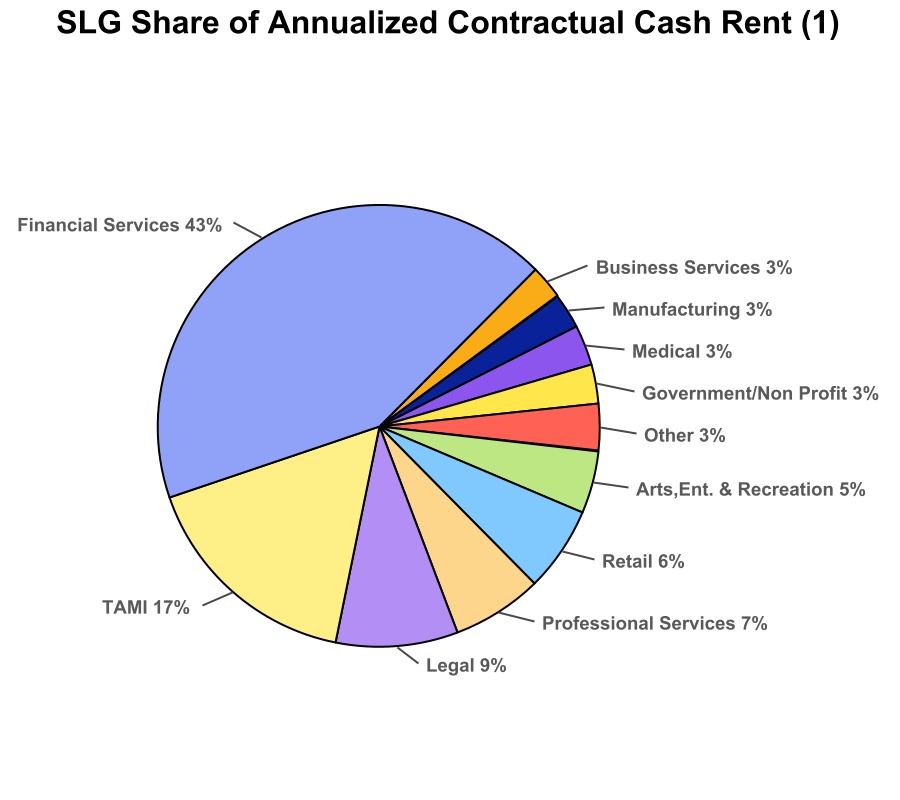
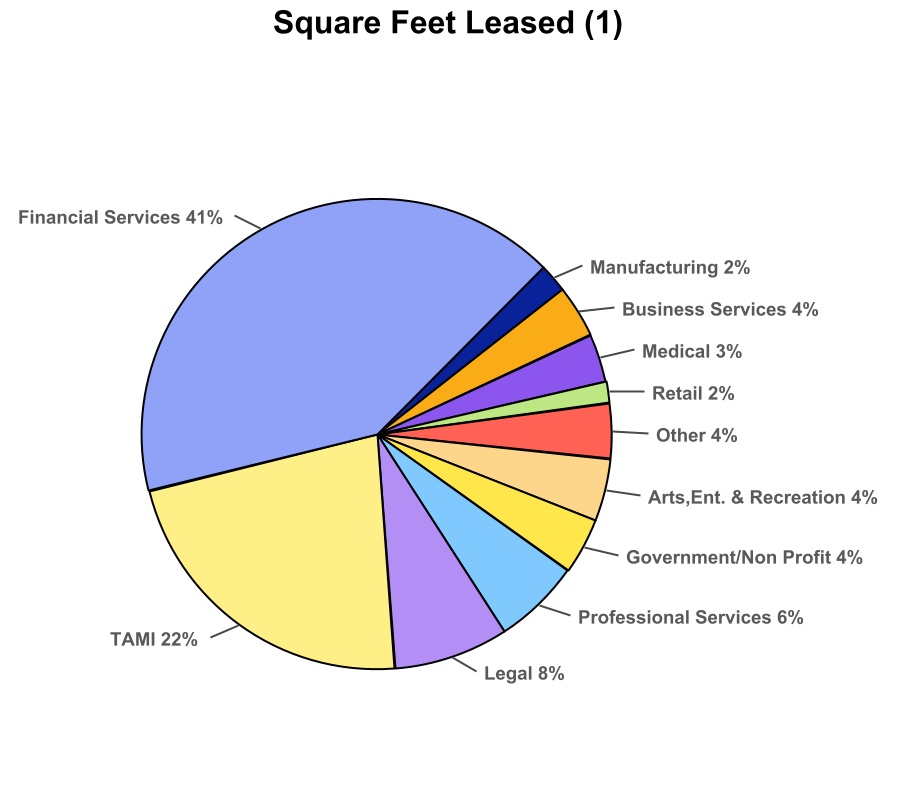
| Supplemental Information | 38 |
Fourth Quarter 2024 |
||||||
|
LEASING ACTIVITY - MANHATTAN OPERATING PROPERTIES
Available Space
Unaudited
|
|
|||||||
| Activity | Building Address | # of Leases | Square Feet (1) | Rentable SF | Escalated Rent/Rentable SF ($'s)(2) |
||||||||||||||||||||||||
| Available Space at 9/30/24 | 2,686,939 | ||||||||||||||||||||||||||||
| Space which became available during the Quarter (3): | |||||||||||||||||||||||||||||
| Office | |||||||||||||||||||||||||||||
| 10 East 53rd Street | 1 | 1,870 | 2,055 | $93.83 | |||||||||||||||||||||||||
| 100 Church Street | 1 | 64,529 | 64,529 | 56.88 | |||||||||||||||||||||||||
| 100 Park Avenue | 2 | 7,334 | 8,625 | 92.98 | |||||||||||||||||||||||||
| 110 Greene Street | 1 | 9,209 | 9,397 | 93.00 | |||||||||||||||||||||||||
| 125 Park Avenue | 1 | 23,640 | 26,225 | 72.83 | |||||||||||||||||||||||||
| 220 East 42nd Street | 1 | 5,311 | 6,015 | 66.94 | |||||||||||||||||||||||||
| 280 Park Avenue | 1 | 6,100 | 6,179 | 112.47 | |||||||||||||||||||||||||
| 420 Lexington Avenue | 7 | 20,748 | 27,404 | 63.54 | |||||||||||||||||||||||||
| 800 Third Avenue | 2 | 23,953 | 25,634 | 69.88 | |||||||||||||||||||||||||
| 810 Seventh Avenue | 1 | 20,500 | 20,500 | 61.37 | |||||||||||||||||||||||||
| 1185 Avenue of the Americas | 1 | 25,000 | 25,000 | 88.40 | |||||||||||||||||||||||||
| Total/Weighted Average | 19 | 208,194 | 221,563 | $70.17 | |||||||||||||||||||||||||
| Storage | |||||||||||||||||||||||||||||
| 125 Park Avenue | 1 | 2,172 | 2,302 | $22.27 | |||||||||||||||||||||||||
| 420 Lexington Avenue | 2 | 886 | 992 | 29.76 | |||||||||||||||||||||||||
| Total/Weighted Average | 3 | 3,058 | 3,294 | $24.53 | |||||||||||||||||||||||||
| Total Space which became available during the Quarter | |||||||||||||||||||||||||||||
| Office | 19 | 208,194 | 221,563 | $70.17 | |||||||||||||||||||||||||
| Storage | 3 | 3,058 | 3,294 | $24.53 | |||||||||||||||||||||||||
| 22 | 211,252 | 224,857 | $69.50 | ||||||||||||||||||||||||||
| Total Available Space | 2,898,191 | ||||||||||||||||||||||||||||
| (1) Represents the rentable square footage at the time the property was acquired. | |||||||||||||||||||||||||||||
| (2) Escalated cash rent includes base rent plus all additional amounts paid by the tenant in the form of real estate taxes, operating expenses, porters wage or a consumer price index (CPI) adjustment, excluding concessions. | |||||||||||||||||||||||||||||
| (3) Includes expiring space, relocating tenants and move-outs where tenants vacated. Excludes lease expirations where tenants heldover. | |||||||||||||||||||||||||||||
| Supplemental Information | 39 |
Fourth Quarter 2024 |
||||||
|
LEASING ACTIVITY - MANHATTAN OPERATING PROPERTIES
Commenced Leasing
Unaudited
|
|
|||||||
| Activity | Building Address | # of Leases | Term (Yrs) | Square Feet (1) | Rentable SF | New Cash Rent / Rentable SF(2) | Prev. Escalated Rent/ Rentable SF(3) | TI / Rentable SF | Free Rent # of Months |
||||||||||||||||||||||||||||||||||||||||||||
| Available Space | 2,898,191 | ||||||||||||||||||||||||||||||||||||||||||||||||||||
| Office | |||||||||||||||||||||||||||||||||||||||||||||||||||||
| 100 Park Avenue | 1 | 11.3 | 33,362 | 36,541 | $65.00 | $86.59 | $145.32 | 16.0 | |||||||||||||||||||||||||||||||||||||||||||||
| 110 Greene Street | 4 | 2.8 | 4,777 | 4,807 | 86.21 | 95.17 | — | 0.9 | |||||||||||||||||||||||||||||||||||||||||||||
| 245 Park Avenue | 3 | 12.6 | 112,580 | 110,420 | 128.09 | 141.52 | 134.42 | 13.8 | |||||||||||||||||||||||||||||||||||||||||||||
| 280 Park Avenue | 1 | 10.0 | 18,541 | 19,018 | 101.00 | 129.12 | 145.00 | 17.2 | |||||||||||||||||||||||||||||||||||||||||||||
| 420 Lexington Avenue | 10 | 6.2 | 20,106 | 24,840 | 59.89 | 64.70 | 71.09 | 6.5 | |||||||||||||||||||||||||||||||||||||||||||||
| 461 Fifth Avenue | 1 | 16.4 | 10,595 | 11,232 | 77.00 | 81.50 | 136.01 | 17.0 | |||||||||||||||||||||||||||||||||||||||||||||
| 485 Lexington Avenue | 2 | 6.9 | 17,309 | 17,389 | 59.91 | — | 52.92 | 8.4 | |||||||||||||||||||||||||||||||||||||||||||||
| 810 Seventh Avenue | 1 | 9.2 | 15,500 | 17,320 | 72.00 | 76.15 | 110.00 | 12.0 | |||||||||||||||||||||||||||||||||||||||||||||
| 885 Third Avenue | 1 | 2.8 | 3,065 | 2,716 | 75.00 | — | 21.76 | 2.0 | |||||||||||||||||||||||||||||||||||||||||||||
| 919 Third Avenue | 1 | 6.8 | 12,995 | 14,085 | 76.00 | — | 165.37 | 7.0 | |||||||||||||||||||||||||||||||||||||||||||||
| 1185 Avenue of the Americas | 1 | 3.3 | 6,484 | 6,668 | 65.26 | — | 48.30 | 2.0 | |||||||||||||||||||||||||||||||||||||||||||||
| 1350 Avenue of the Americas | 1 | 11.0 | 12,964 | 13,284 | 72.00 | 93.65 | 137.33 | 12.0 | |||||||||||||||||||||||||||||||||||||||||||||
| Total/Weighted Average | 27 | 10.4 | 268,278 | 278,320 | $94.00 | $105.04 | $120.60 | 12.3 | |||||||||||||||||||||||||||||||||||||||||||||
| Retail | |||||||||||||||||||||||||||||||||||||||||||||||||||||
| 100 Park Avenue | 1 | 10.4 | 1,611 | 2,097 | $100.14 | $80.85 | $40.53 | 6.0 | |||||||||||||||||||||||||||||||||||||||||||||
| Total/Weighted Average | 1 | 10.4 | 1,611 | 2,097 | $100.14 | $80.85 | $40.53 | 6.0 | |||||||||||||||||||||||||||||||||||||||||||||
| Leased Space | |||||||||||||||||||||||||||||||||||||||||||||||||||||
| Office (4) | 27 | 10.4 | 268,278 | 278,320 | $94.00 | $105.04 | $120.60 | 12.3 | |||||||||||||||||||||||||||||||||||||||||||||
| Retail | 1 | 10.4 | 1,611 | 2,097 | $100.14 | $80.85 | $40.53 | 6.0 | |||||||||||||||||||||||||||||||||||||||||||||
| Total | 28 | 10.4 | 269,889 | 280,417 | $94.04 | $104.69 | $120.00 | 12.2 | |||||||||||||||||||||||||||||||||||||||||||||
| Total Available Space as of 12/31/24 | 2,628,302 | ||||||||||||||||||||||||||||||||||||||||||||||||||||
| Early Renewals | |||||||||||||||||||||||||||||||||||||||||||||||||||||
| Office | |||||||||||||||||||||||||||||||||||||||||||||||||||||
| 220 East 42nd Street | 1 | 4.2 | 29,787 | 30,030 | $65.00 | $60.29 | $— | — | |||||||||||||||||||||||||||||||||||||||||||||
| 420 Lexington Avenue | 1 | 5.2 | 1,843 | 2,117 | 71.25 | 75.41 | — | 2.0 | |||||||||||||||||||||||||||||||||||||||||||||
| 485 Lexington Avenue | 1 | 10.0 | 76,207 | 78,295 | 61.00 | 58.00 | 116.94 | 14.0 | |||||||||||||||||||||||||||||||||||||||||||||
| 800 Third Avenue | 3 | 5.5 | 11,308 | 12,014 | 62.83 | 74.97 | 0.62 | 3.1 | |||||||||||||||||||||||||||||||||||||||||||||
| 919 Third Avenue | 1 | 11.0 | 749,216 | 749,035 | 81.00 | 66.40 | 100.00 | 12.0 | |||||||||||||||||||||||||||||||||||||||||||||
| Total/Weighted Average | 7 | 10.6 | 868,361 | 871,491 | $78.38 | $65.57 | $96.46 | 11.6 | |||||||||||||||||||||||||||||||||||||||||||||
| Retail | — | ||||||||||||||||||||||||||||||||||||||||||||||||||||
| 919 Third Avenue | 1 | 5.0 | 10,658 | 10,740 | $128.03 | $142.88 | $— | — | |||||||||||||||||||||||||||||||||||||||||||||
| Total/Weighted Average | 1 | 5.0 | 10,658 | 10,740 | $128.03 | $142.88 | $— | — | |||||||||||||||||||||||||||||||||||||||||||||
| Storage | |||||||||||||||||||||||||||||||||||||||||||||||||||||
| 220 East 42nd Street | 1 | 4.2 | 283 | 299 | $51.58 | $39.83 | $— | — | |||||||||||||||||||||||||||||||||||||||||||||
| Total/Weighted Average | 1 | 4.2 | 283 | 299 | $51.58 | $39.83 | $— | — | |||||||||||||||||||||||||||||||||||||||||||||
| Renewals | |||||||||||||||||||||||||||||||||||||||||||||||||||||
| Early Renewals Office | 7 | 10.6 | 868,361 | 871,491 | $78.38 | $65.57 | $96.46 | 11.6 | |||||||||||||||||||||||||||||||||||||||||||||
| Early Renewals Retail | 1 | 5.0 | 10,658 | 10,740 | $128.03 | $142.88 | — | — | |||||||||||||||||||||||||||||||||||||||||||||
| Early Renewals Storage | 1 | 4.2 | 283 | 299 | $51.58 | $39.83 | $— | — | |||||||||||||||||||||||||||||||||||||||||||||
| Total | 9 | 10.5 | 879,302 | 882,530 | $78.97 | $66.50 | $95.26 | 11.5 | |||||||||||||||||||||||||||||||||||||||||||||
| (1) Represents the rentable square footage at the time the property was acquired. | |||||||||||||||||||||||||||||||||||||||||||||||||||||
| (2) Annual initial base rent. | |||||||||||||||||||||||||||||||||||||||||||||||||||||
| (3) Escalated cash rent includes base rent plus all additional amounts paid by the tenant in the form of real estate taxes, operating expenses, porters wage or a consumer price index (CPI) adjustment, excluding concessions. | |||||||||||||||||||||||||||||||||||||||||||||||||||||
| (4) Average starting office rent excluding new tenants replacing vacancies is $94.87/rsf for 144,342 rentable SF. | |||||||||||||||||||||||||||||||||||||||||||||||||||||
| Average starting office rent for office space (leased and early renewals, excluding new tenants replacing vacancies) is $80.72/rsf for 1,015,833 rentable SF. | |||||||||||||||||||||||||||||||||||||||||||||||||||||
| Supplemental Information | 40 |
Fourth Quarter 2024 |
||||||
|
LEASE EXPIRATIONS - MANHATTAN OPERATING PROPERTIES
Office, Retail and Storage Leases
Unaudited
|
|
|||||||
| Year of Lease Expiration | Number of Expiring Leases (1) | Rentable Square Footage of Expiring Leases | SLG Share Rentable Square Footage of Expiring Leases |
Percentage of Total Sq. Ft. |
Annualized Contractual Cash Rent of Expiring Leases | SLG Share Annualized Contractual Cash Rent of Expiring Leases |
Annualized Contractual Cash Rent Per Square Foot of Expiring Leases $/psf (2) | ||||||||||||||||||||||
| Wholly-Owned and Consolidated JV Properties | |||||||||||||||||||||||||||||
| 2024 (3) | 9 | 126,384 | 126,384 | 1.5 | % | $7,390,300 | $7,390,300 | $58.47 | |||||||||||||||||||||
| 1st Quarter 2025 | 13 | 235,307 | 235,307 | 2.8 | % | $14,979,840 | $14,979,840 | $63.66 | |||||||||||||||||||||
| 2nd Quarter 2025 | 16 | 99,894 | 99,894 | 1.2 | % | 8,184,444 | 8,184,444 | 81.93 | |||||||||||||||||||||
| 3rd Quarter 2025 | 19 | 60,714 | 55,269.5 | 0.7 | % | 4,544,320 | 4,038,113 | 74.85 | |||||||||||||||||||||
| 4th Quarter 2025 | 34 | 359,429 | 358,418.5 | 4.2 | % | 33,001,617 | 32,913,812 | 91.82 | |||||||||||||||||||||
| Total 2025 | 82 | 755,344 | 748,889 | 8.9 | % | $60,710,221 | $60,116,209 | $80.37 | |||||||||||||||||||||
| 2026 | 78 | 847,874 | 813,988 | 10.0 | % | $58,604,929 | $55,864,520 | $69.12 | |||||||||||||||||||||
| 2027 | 80 | 808,055 | 758,080 | 9.5 | % | 65,504,055 | 61,335,962 | 81.06 | |||||||||||||||||||||
| 2028 | 64 | 675,774 | 668,891 | 8.0 | % | 49,898,756 | 49,287,540 | 73.84 | |||||||||||||||||||||
| 2029 | 57 | 705,732 | 705,732 | 8.3 | % | 48,572,940 | 48,572,940 | 68.83 | |||||||||||||||||||||
| 2030 | 45 | 848,373 | 825,026 | 10.0 | % | 59,570,712 | 57,505,412 | 70.22 | |||||||||||||||||||||
| 2031 | 26 | 423,086 | 380,691 | 5.0 | % | 31,467,856 | 28,222,800 | 74.38 | |||||||||||||||||||||
| 2032 | 20 | 731,991 | 731,991 | 8.6 | % | 45,177,103 | 45,177,103 | 61.72 | |||||||||||||||||||||
| 2033 | 20 | 348,403 | 324,878 | 4.1 | % | 27,643,595 | 26,137,339 | 79.34 | |||||||||||||||||||||
| Thereafter | 76 | 2,225,853 | 2,148,950 | 26.1 | % | 139,472,015 | 134,255,251 | 62.66 | |||||||||||||||||||||
| Grand Total | 557 | 8,496,869 | 8,233,500 | 100.0 | % | $594,012,482 | $573,865,376 | $69.91 | |||||||||||||||||||||
| Unconsolidated JV Properties | |||||||||||||||||||||||||||||
| 2024 (3) | 1 | 1,423 | 810 | — | % | $24,000 | $13,656 | $16.87 | |||||||||||||||||||||
| 1st Quarter 2025 | 6 | 33,399 | 19,115 | 0.3 | % | $2,762,921 | $1,571,872 | $82.72 | |||||||||||||||||||||
| 2nd Quarter 2025 | 3 | 196,196 | 117,740 | 1.8 | % | 20,404,766 | 12,244,468 | 104.00 | |||||||||||||||||||||
| 3rd Quarter 2025 | 1 | 4,576 | 2,768 | — | % | 302,623 | 183,087 | 66.13 | |||||||||||||||||||||
| 4th Quarter 2025 | 7 | 78,808 | 34,720 | 0.7 | % | 6,982,782 | 2,885,987 | 88.60 | |||||||||||||||||||||
| Total 2025 | 17 | 312,979 | 174,343 | 2.8 | % | $30,453,092 | $16,885,414 | $97.30 | |||||||||||||||||||||
| 2026 | 21 | 350,768 | 175,291 | 3.1 | % | $47,036,241 | $23,701,599 | $134.10 | |||||||||||||||||||||
| 2027 | 17 | 222,604 | 100,615 | 2.0 | % | 31,852,679 | 15,030,602 | 143.09 | |||||||||||||||||||||
| 2028 | 21 | 250,810 | 134,617 | 2.2 | % | 30,428,097 | 16,447,869 | 121.32 | |||||||||||||||||||||
| 2029 | 18 | 147,621 | 75,743 | 1.3 | % | 15,378,083 | 7,525,949 | 104.17 | |||||||||||||||||||||
| 2030 | 15 | 329,755 | 189,044 | 2.9 | % | 38,410,279 | 21,745,127 | 116.48 | |||||||||||||||||||||
| 2031 | 15 | 2,688,738 | 1,509,472 | 23.8 | % | 205,643,360 | 114,780,458 | 76.48 | |||||||||||||||||||||
| 2032 | 14 | 992,725 | 507,649 | 8.8 | % | 89,598,105 | 45,780,088 | 90.25 | |||||||||||||||||||||
| 2033 | 11 | 250,685 | 137,674 | 2.2 | % | 28,051,255 | 15,782,149 | 111.90 | |||||||||||||||||||||
| Thereafter | 65 | 5,740,480 | 3,144,862 | 50.9 | % | 583,552,330 | 323,820,416 | 101.66 | |||||||||||||||||||||
| Grand Total | 215 | 11,288,588 | 6,150,120 | 100.0 | % | $1,100,427,521 | $601,513,327 | $97.48 | |||||||||||||||||||||
| (1) Tenants may have multiple leases. | |||||||||||||||||||||||||||||
| (2) Represents in place annualized contractual cash rent allocated by year of expiration. | |||||||||||||||||||||||||||||
| (3) Includes month to month holdover tenants that expired prior to December 31, 2024. | |||||||||||||||||||||||||||||
| Supplemental Information | 41 |
Fourth Quarter 2024 |
||||||
|
LEASE EXPIRATIONS
Retail Leases Within Operating, Development / Redevelopment and Alternative Strategy Portfolio Properties
Wholly-Owned and Consolidated JV's
Unaudited
|
|
|||||||
| Year of Lease Expiration | Number of Expiring Leases (1) | Rentable Square Footage of Expiring Leases | SLG Share Rentable Square Footage of Expiring Leases |
Percentage of Total Sq. Ft. |
Annualized Contractual Cash Rent of Expiring Leases | SLG Share Annualized Contractual Cash Rent of Expiring Leases |
Annualized Contractual Cash Rent Per Square Foot of Expiring Leases $/psf (2) | ||||||||||||||||||||||
| High Street Retail | |||||||||||||||||||||||||||||
| 2024 (3) | — | — | — | — | % | $— | $— | $— | |||||||||||||||||||||
| 2025 | — | — | — | — | % | — | — | — | |||||||||||||||||||||
| 2026 | — | — | — | — | % | — | — | — | |||||||||||||||||||||
| 2027 | — | — | — | — | % | — | — | — | |||||||||||||||||||||
| 2028 | — | — | — | — | % | — | — | — | |||||||||||||||||||||
| 2029 | — | — | — | — | % | — | — | — | |||||||||||||||||||||
| 2030 | — | — | — | — | % | — | — | — | |||||||||||||||||||||
| 2031 | — | — | — | — | % | — | — | — | |||||||||||||||||||||
| 2032 | — | — | — | — | % | — | — | — | |||||||||||||||||||||
| 2033 | 1 | 7,944 | 7,150 | 26.0 | % | 1,504,752 | 1,354,277 | 189.42 | |||||||||||||||||||||
| Thereafter | 1 | 22,648 | 22,648 | 74.0 | % | 18,046,460 | 18,046,460 | 796.82 | |||||||||||||||||||||
| 2 | 30,592 | 29,798 | 100.0 | % | $19,551,212 | $19,400,737 | $639.10 | ||||||||||||||||||||||
| Vacancy (4) | — | ||||||||||||||||||||||||||||
| Grand Total | 30,592 | ||||||||||||||||||||||||||||
| Other Retail | |||||||||||||||||||||||||||||
| 2024 (3) | — | — | — | — | % | $— | $— | $— | |||||||||||||||||||||
| 2025 | 2 | 14,197 | 14,197 | 2.8 | % | 2,604,041 | 2,604,041 | 183.42 | |||||||||||||||||||||
| 2026 | 4 | 10,104 | 10,104 | 2.0 | % | 1,131,476 | 1,131,476 | 111.98 | |||||||||||||||||||||
| 2027 | 7 | 40,336 | 34,579 | 7.9 | % | 5,645,958 | 5,211,856 | 139.97 | |||||||||||||||||||||
| 2028 | 6 | 25,159 | 18,276 | 4.9 | % | 3,195,319 | 2,584,103 | 127.01 | |||||||||||||||||||||
| 2029 | 4 | 27,702 | 27,702 | 5.4 | % | 2,578,245 | 2,578,245 | 93.07 | |||||||||||||||||||||
| 2030 | 5 | 44,135 | 44,135 | 8.6 | % | 6,450,497 | 6,450,497 | 146.15 | |||||||||||||||||||||
| 2031 | 4 | 16,050 | 11,697 | 3.1 | % | 1,801,777 | 1,479,407 | 112.26 | |||||||||||||||||||||
| 2032 | 7 | 71,237 | 71,237 | 13.9 | % | 6,036,471 | 6,036,471 | 84.74 | |||||||||||||||||||||
| 2033 | 7 | 63,848 | 63,848 | 12.5 | % | 8,435,344 | 8,435,344 | 132.12 | |||||||||||||||||||||
| Thereafter | 29 | 198,868 | 196,583 | 38.9 | % | 18,142,975 | 17,889,282 | 91.23 | |||||||||||||||||||||
| 75 | 511,636 | 492,358 | 100.0 | % | $56,022,103 | $54,400,722 | $109.50 | ||||||||||||||||||||||
| Vacancy (4) | 43,865 | ||||||||||||||||||||||||||||
| Grand Total | 555,501 | ||||||||||||||||||||||||||||
| (1) Tenants may have multiple leases. | |||||||||||||||||||||||||||||
| (2) Represents in place annualized contractual cash rent allocated by year of expiration. | |||||||||||||||||||||||||||||
| (3) Includes month to month holdover tenants that expired prior to December 31, 2024. | |||||||||||||||||||||||||||||
| (4) Includes square footage of leases signed but not yet commenced. | |||||||||||||||||||||||||||||
| Supplemental Information | 42 |
Fourth Quarter 2024 |
||||||
|
LEASE EXPIRATIONS
Retail Leases Within Operating, Development / Redevelopment and Alternative Strategy Portfolio Properties
Unconsolidated JV's
Unaudited
|
|
|||||||
| Year of Lease Expiration | Number of Expiring Leases (1) | Rentable Square Footage of Expiring Leases | SLG Share Rentable Square Footage of Expiring Leases |
Percentage of Total Sq. Ft. |
Annualized Contractual Cash Rent of Expiring Leases | SLG Share Annualized Contractual Cash Rent of Expiring Leases |
Annualized Contractual Cash Rent Per Square Foot of Expiring Leases $/psf (2) | ||||||||||||||||||||||
| High Street Retail | |||||||||||||||||||||||||||||
| 2024 (3) | — | — | — | — | % | $— | $— | $— | |||||||||||||||||||||
| 2025 | — | — | — | — | % | — | — | — | |||||||||||||||||||||
| 2026 | — | — | — | — | % | — | — | — | |||||||||||||||||||||
| 2027 | — | — | — | — | % | — | — | — | |||||||||||||||||||||
| 2028 | — | — | — | — | % | — | — | — | |||||||||||||||||||||
| 2029 | — | — | — | — | % | — | — | — | |||||||||||||||||||||
| 2030 | — | — | — | — | % | — | — | — | |||||||||||||||||||||
| 2031 | — | — | — | — | % | — | — | — | |||||||||||||||||||||
| 2032 | — | — | — | — | % | — | — | — | |||||||||||||||||||||
| 2033 | — | — | — | — | % | — | — | — | |||||||||||||||||||||
| Thereafter | 1 | 13,092 | 4,748 | 100.0 | % | 2,799,996 | 1,015,559 | 213.87 | |||||||||||||||||||||
| 1 | 13,092 | 4,748 | 100.0 | % | $2,799,996 | $1,015,559 | $213.87 | ||||||||||||||||||||||
| Vacancy (4) | — | ||||||||||||||||||||||||||||
| Grand Total | 13,092 | ||||||||||||||||||||||||||||
| Other Retail | |||||||||||||||||||||||||||||
| 2024 (3) | — | — | — | — | % | $— | $— | $— | |||||||||||||||||||||
| 2025 | 1 | 1,190 | 596 | 0.3 | % | 50,923 | 25,513 | 42.79 | |||||||||||||||||||||
| 2026 | 2 | 9,820 | 5,688 | 2.7 | % | 9,072,540 | 5,176,645 | 923.88 | |||||||||||||||||||||
| 2027 | 1 | 7,711 | 4,388 | 2.1 | % | 10,638,409 | 6,053,255 | 1,379.64 | |||||||||||||||||||||
| 2028 | 1 | 9,106 | 5,181 | 2.5 | % | 2,165,733 | 1,232,302 | 237.84 | |||||||||||||||||||||
| 2029 | 3 | 52,886 | 27,070 | 14.5 | % | 5,302,067 | 2,457,384 | 100.25 | |||||||||||||||||||||
| 2030 | 2 | 11,970 | 6,811 | 3.3 | % | 6,927,611 | 3,941,811 | 578.75 | |||||||||||||||||||||
| 2031 | 3 | 14,058 | 7,433 | 3.9 | % | 2,370,973 | 1,279,993 | 168.66 | |||||||||||||||||||||
| 2032 | 2 | 18,864 | 9,499 | 5.2 | % | 1,303,659 | 657,900 | 69.11 | |||||||||||||||||||||
| 2033 | 2 | 4,721 | 2,417 | 1.3 | % | 571,900 | 292,337 | 121.14 | |||||||||||||||||||||
| Thereafter | 15 | 233,154 | 132,103 | 64.2 | % | 13,747,806 | 7,847,784 | 58.96 | |||||||||||||||||||||
| 32 | 363,480 | 201,186 | 100.0 | % | $52,151,621 | $28,964,924 | $143.48 | ||||||||||||||||||||||
| Vacancy (4) | 37,619 | ||||||||||||||||||||||||||||
| Grand Total | 401,099 | ||||||||||||||||||||||||||||
| Alternative Strategy Portfolio | |||||||||||||||||||||||||||||
| 2024 (3) | 1 | 1,277 | 319 | 0.9 | % | $119,574 | $29,834 | $93.64 | |||||||||||||||||||||
| 2025 | — | — | — | — | % | — | — | — | |||||||||||||||||||||
| 2026 | 3 | 17,869 | 6,381 | 12.6 | % | 7,730,567 | 3,176,104 | 432.62 | |||||||||||||||||||||
| 2027 | 1 | 1,685 | 420 | 1.2 | % | 445,771 | 111,220 | 264.55 | |||||||||||||||||||||
| 2028 | 1 | 1,819 | 454 | 1.3 | % | 213,982 | 53,388 | 117.64 | |||||||||||||||||||||
| 2029 | 2 | 1,425 | 937 | 1.0 | % | 613,621 | 508,937 | 430.61 | |||||||||||||||||||||
| 2030 | — | — | — | — | % | — | — | — | |||||||||||||||||||||
| 2031 | 2 | 23,536 | 21,077 | 16.6 | % | 7,538,007 | 7,026,603 | 320.28 | |||||||||||||||||||||
| 2032 | — | — | — | — | % | — | — | — | |||||||||||||||||||||
| 2033 | 1 | 16,343 | 15,526 | 11.5 | % | 2,003,864 | 1,903,671 | 122.61 | |||||||||||||||||||||
| Thereafter | 3 | 77,801 | 38,738 | 54.9 | % | 43,392,607 | 21,675,216 | 557.74 | |||||||||||||||||||||
| 14 | 141,755 | 83,852 | 100.0 | % | $62,057,993 | $34,484,973 | $437.78 | ||||||||||||||||||||||
| Vacancy (4) | 95,592 | ||||||||||||||||||||||||||||
| Grand Total | 237,347 | ||||||||||||||||||||||||||||
| (1) Tenants may have multiple leases. | |||||||||||||||||||||||||||||
| (2) Represents in place annualized contractual cash rent allocated by year of expiration. | |||||||||||||||||||||||||||||
| (3) Includes month to month holdover tenants that expired prior to December 31, 2024. | |||||||||||||||||||||||||||||
| (4) Includes square footage of leases signed but not yet commenced. | |||||||||||||||||||||||||||||
| Supplemental Information | 43 |
Fourth Quarter 2024 |
||||||
|
SUMMARY OF REAL ESTATE ACQUISITION ACTIVITY
Manhattan Office
Unaudited
(Dollars in Thousands)
|
|
|||||||
| Gross Asset | Occupancy (%) | |||||||||||||||||||||||||||||||||||||
| Property | Submarket | Interest Acquired | Type of Ownership | Net Rentable SF | Valuation ($'s) | at acquisition | 12/31/2024 | |||||||||||||||||||||||||||||||
| 2001 - 2023 Acquisitions | ||||||||||||||||||||||||||||||||||||||
| Jun-01 | 317 Madison Avenue | Grand Central | 100.0% | Fee Interest | 450,000 | $ | 105,600 | 95.0 | N/A | |||||||||||||||||||||||||||||
| Sep-01 | 1250 Broadway | Penn Station | 49.9 | Fee Interest | 670,000 | 126,500 | 97.7 | N/A | ||||||||||||||||||||||||||||||
| May-02 | 1515 Broadway | Times Square | 55.0 | Fee Interest | 1,750,000 | 483,500 | 98.0 | 99.7 | ||||||||||||||||||||||||||||||
| Feb-03 | 220 East 42nd Street | Grand Central | 100.0 | Fee Interest | 1,135,000 | 265,000 | 91.9 | 89.0 | ||||||||||||||||||||||||||||||
| Mar-03 | 125 Broad Street | Downtown | 100.0 | Fee Interest | 525,000 | 92,000 | 100.0 | N/A | ||||||||||||||||||||||||||||||
| Oct-03 | 461 Fifth Avenue | Midtown | 100.0 | Leasehold Interest | 200,000 | 60,900 | 93.9 | 98.2 | ||||||||||||||||||||||||||||||
| Dec-03 | 1221 Avenue of the Americas | Rockefeller Center | 45.0 | Fee Interest | 2,550,000 | 1,000,000 | 98.8 | N/A | ||||||||||||||||||||||||||||||
| Mar-04 | 19 West 44th Street | Midtown | 35.0 | Fee Interest | 292,000 | 67,000 | 86.0 | N/A | ||||||||||||||||||||||||||||||
| Jul-04 | 750 Third Avenue | Grand Central | 100.0 | Fee Interest | 779,000 | 255,000 | 100.0 | 9.5 | ||||||||||||||||||||||||||||||
| Jul-04 | 485 Lexington Avenue | Grand Central | 30.0 | Fee Interest | 921,000 | 225,000 | 100.0 | 78.9 | ||||||||||||||||||||||||||||||
| Oct-04 | 625 Madison Avenue | Plaza District | 100.0 | Leasehold Interest | 563,000 | 231,500 | 68.0 | N/A | ||||||||||||||||||||||||||||||
| Feb-05 | 28 West 44th Street | Midtown | 100.0 | Fee Interest | 359,000 | 105,000 | 87.0 | N/A | ||||||||||||||||||||||||||||||
| Apr-05 | 1 Madison Avenue | Park Avenue South | 55.0 | Fee Interest | 1,177,000 | 803,000 | 96.0 | N/A | ||||||||||||||||||||||||||||||
| Apr-05 | 5 Madison Avenue Clock Tower | Park Avenue South | 100.0 | Fee Interest | 267,000 | 115,000 | N/A | N/A | ||||||||||||||||||||||||||||||
| Jun-05 | 19 West 44th Street | Midtown | 65.0 | Fee Interest | — | 91,200 | 92.2 | N/A | ||||||||||||||||||||||||||||||
| Mar-06 | 521 Fifth Avenue | Midtown | 100.0 | Leasehold Interest | 460,000 | 210,000 | 97.0 | N/A | ||||||||||||||||||||||||||||||
| Jun-06 | 609 Fifth Avenue | Midtown | 100.0 | Fee Interest | 160,000 | 182,000 | 98.5 | N/A | ||||||||||||||||||||||||||||||
| Dec-06 | 485 Lexington Avenue | Grand Central | 70.0 | Fee Interest | — | 578,000 | 90.5 | 78.9 | ||||||||||||||||||||||||||||||
| Dec-06 | 800 Third Avenue | Grand Central North | 43.0 | Fee Interest | 526,000 | 285,000 | 96.9 | 84.6 | ||||||||||||||||||||||||||||||
| Jan-07 | Reckson - NYC Portfolio | Various | 100.0 | Fee Interests / Leasehold Interest | 5,612,000 | 3,679,530 | 98.3 | 78.8 | ||||||||||||||||||||||||||||||
| Apr-07 | 331 Madison Avenue | Grand Central | 100.0 | Fee Interest | 114,900 | 73,000 | 97.6 | N/A | ||||||||||||||||||||||||||||||
| Apr-07 | 1745 Broadway | Midtown | 32.3 | Leasehold Interest | 674,000 | 520,000 | 100.0 | N/A | ||||||||||||||||||||||||||||||
| Jun-07 | 333 West 34th Street | Penn Station | 100.0 | Fee Interest | 345,400 | 183,000 | 100.0 | N/A | ||||||||||||||||||||||||||||||
| Aug-07 | 1 Madison Avenue | Park Avenue South | 45.0 | Fee Interest | 1,177,000 | 1,000,000 | 99.8 | N/A | ||||||||||||||||||||||||||||||
| Dec-07 | 388 & 390 Greenwich Street | Downtown | 50.6 | Fee Interest | 2,635,000 | 1,575,000 | 100.0 | N/A | ||||||||||||||||||||||||||||||
| Jan-10 | 100 Church Street | Downtown | 100.0 | Fee Interest | 1,047,500 | 181,600 | 41.3 | 86.9 | ||||||||||||||||||||||||||||||
| May-10 | 600 Lexington Avenue | Grand Central North | 55.0 | Fee Interest | 303,515 | 193,000 | 93.6 | N/A | ||||||||||||||||||||||||||||||
| Aug-10 | 125 Park Avenue | Grand Central | 100.0 | Fee Interest | 604,245 | 330,000 | 99.1 | 95.7 | ||||||||||||||||||||||||||||||
| Jan-11 | 521 Fifth Avenue | Midtown | 49.9 | Leasehold Interest | 460,000 | 245,700 | 80.7 | N/A | ||||||||||||||||||||||||||||||
| Apr-11 | 1515 Broadway | Times Square | 45.0 | Fee Interest | 1,750,000 | 1,210,000 | 98.5 | 99.7 | ||||||||||||||||||||||||||||||
| May-11 | 110 East 42nd Street | Grand Central | 100.0 | Fee Interest | 205,000 | 85,570 | 72.6 | N/A | ||||||||||||||||||||||||||||||
| May-11 | 280 Park Avenue | Park Avenue | 49.5 | Fee Interest | 1,219,158 | 1,110,000 | 78.2 | 89.0 | ||||||||||||||||||||||||||||||
| Nov-11 | 180 Maiden Lane | Financial East | 49.9 | Fee Interest | 1,090,000 | 425,680 | 97.7 | N/A | ||||||||||||||||||||||||||||||
| Nov-11 | 51 East 42nd Street | Grand Central | 100.0 | Fee Interest | 142,000 | 80,000 | 95.5 | N/A | ||||||||||||||||||||||||||||||
| Feb-12 | 10 East 53rd Street | Plaza District | 55.0 | Fee Interest | 354,300 | 252,500 | 91.9 | 97.6 | ||||||||||||||||||||||||||||||
| Jun-12 | 304 Park Avenue South | Midtown South | 100.0 | Fee Interest | 215,000 | 135,000 | 95.8 | 100.0 | ||||||||||||||||||||||||||||||
| Sep-12 | 641 Sixth Avenue | Midtown South | 100.0 | Fee Interest | 163,000 | 90,000 | 92.1 | N/A | ||||||||||||||||||||||||||||||
| Dec-12 | 315 West 36th Street | Times Square South | 35.5 | Fee Interest | 147,619 | 46,000 | 99.2 | N/A | ||||||||||||||||||||||||||||||
| May-14 | 388 & 390 Greenwich Street | Downtown | 49.4 | Fee Interest | 2,635,000 | 1,585,000 | 100.0 | N/A | ||||||||||||||||||||||||||||||
| Jul-15 | 110 Greene Street | Soho | 90.0 | Fee Interest | 223,600 | 255,000 | 84.0 | 89.3 | ||||||||||||||||||||||||||||||
| Aug-15 | 30 East 40th Street | Grand Central South | 60.0 | Leasehold Interest | 69,446 | 4,650 | 100.0 | N/A | ||||||||||||||||||||||||||||||
| Aug-15 | 11 Madison Avenue | Park Avenue South | 100.0 | Fee Interest | 2,314,000 | 2,285,000 | 71.6 | 96.1 | ||||||||||||||||||||||||||||||
| Dec-15 | 600 Lexington Avenue | Grand Central North | 45.0 | Fee Interest | 303,515 | 284,000 | 95.5 | N/A | ||||||||||||||||||||||||||||||
| Oct-17 | Worldwide Plaza | Westside | 24.4 | Fee Interest | 2,048,725 | 1,725,000 | 100.0 | 63.3 | ||||||||||||||||||||||||||||||
| May-18 | 2 Herald Square | Herald Square | 100.0 | Leasehold Interest | 369,000 | 266,000 | 81.6 | 60.3 | ||||||||||||||||||||||||||||||
| May-19 | 110 Greene Street | Soho | 10.0 | Fee Interest | 223,600 | 256,500 | 93.3 | 89.3 | ||||||||||||||||||||||||||||||
| Jul-20 | 885 Third Avenue | Midtown / Plaza District | 100.0 | Fee / Leasehold Interest | 625,300 | 387,932 | 94.8 | 74.5 | ||||||||||||||||||||||||||||||
| Oct-20 | 590 Fifth Avenue | Midtown | 100.0 | Fee Interest | 103,300 | 107,200 | 90.0 | N/A | ||||||||||||||||||||||||||||||
| Jun-22 | 450 Park Avenue | Park Avenue | 25.1 | Fee Interest | 337,000 | 445,000 | 79.8 | 89.3 | ||||||||||||||||||||||||||||||
| Sep-22 | 245 Park Avenue | Park Avenue | 100.0 | Fee Interest | 1,782,793 | 1,960,000 | 91.8 | 85.4 | ||||||||||||||||||||||||||||||
| 42,078,916 | $ | 26,258,062 | ||||||||||||||||||||||||||||||||||||
| 2024 Acquisitions | ||||||||||||||||||||||||||||||||||||||
| Dec-24 | 10 East 53rd Street | Plaza District | 45.0 | Fee Interest | 354,300 | $ | 236,000 | 97.6 | 97.6 | |||||||||||||||||||||||||||||
| 354,300 | $ | 236,000 | ||||||||||||||||||||||||||||||||||||
| Supplemental Information | 44 |
Fourth Quarter 2024 |
||||||
|
SUMMARY OF REAL ESTATE DISPOSITION ACTIVITY
Manhattan Office
Unaudited
(Dollars in Thousands)
|
|
|||||||
| Gross Asset Valuation | |||||||||||||||||||||||||||||||||||||||||
| Property | Submarket | Interest Sold | Type of Ownership | Net Rentable SF | ($'s) | ($'s/SF) | |||||||||||||||||||||||||||||||||||
| 2001 - 2023 Dispositions | |||||||||||||||||||||||||||||||||||||||||
| Jan-01 | 633 Third Ave | Grand Central North | 100.0% | Fee Interest | 40,623 | $ | 13,250 | $ | 326 | ||||||||||||||||||||||||||||||||
| May-01 | 1 Park Ave | Grand Central South | 45.0 | Fee Interest | 913,000 | 233,900 | 256 | ||||||||||||||||||||||||||||||||||
| Jun-01 | 1412 Broadway | Times Square South | 100.0 | Fee Interest | 389,000 | 90,700 | 233 | ||||||||||||||||||||||||||||||||||
| Jul-01 | 110 East 42nd Street | Grand Central | 100.0 | Fee Interest | 69,700 | 14,500 | 208 | ||||||||||||||||||||||||||||||||||
| Sep-01 | 1250 Broadway | Penn Station | 45.0 | Fee Interest | 670,000 | 126,500 | 189 | ||||||||||||||||||||||||||||||||||
| Jun-02 | 469 Seventh Avenue | Penn Station | 100.0 | Fee Interest | 253,000 | 53,100 | 210 | ||||||||||||||||||||||||||||||||||
| Mar-03 | 50 West 23rd Street | Chelsea | 100.0 | Fee Interest | 333,000 | 66,000 | 198 | ||||||||||||||||||||||||||||||||||
| Jul-03 | 1370 Broadway | Times Square South | 100.0 | Fee Interest | 255,000 | 58,500 | 229 | ||||||||||||||||||||||||||||||||||
| Dec-03 | 321 West 44th Street | Times Square | 100.0 | Fee Interest | 203,000 | 35,000 | 172 | ||||||||||||||||||||||||||||||||||
| May-04 | 1 Park Avenue | Grand Central South | 75.0 | Fee Interest | 913,000 | 318,500 | 349 | ||||||||||||||||||||||||||||||||||
| Oct-04 | 17 Battery Place North | Financial | 100.0 | Fee Interest | 419,000 | 70,000 | 167 | ||||||||||||||||||||||||||||||||||
| Nov-04 | 1466 Broadway | Times Square | 100.0 | Fee Interest | 289,000 | 160,000 | 554 | ||||||||||||||||||||||||||||||||||
| Apr-05 | 1414 Avenue of the Americas | Plaza District | 100.0 | Fee Interest | 111,000 | 60,500 | 545 | ||||||||||||||||||||||||||||||||||
| Aug-05 | 180 Madison Avenue | Grand Central | 100.0 | Fee Interest | 265,000 | 92,700 | 350 | ||||||||||||||||||||||||||||||||||
| Jul-06 | 286 & 290 Madison Avenue | Grand Central | 100.0 | Fee Interest | 149,000 | 63,000 | 423 | ||||||||||||||||||||||||||||||||||
| Aug-06 | 1140 Avenue of the Americas | Rockefeller Center | 100.0 | Leasehold Interest | 191,000 | 97,500 | 510 | ||||||||||||||||||||||||||||||||||
| Dec-06 | 521 Fifth Avenue | Grand Central | 50.0 | Leasehold Interest | 460,000 | 240,000 | 522 | ||||||||||||||||||||||||||||||||||
| Mar-07 | 1 Park Avenue | Grand Central South | 100.0 | Fee Interest | 913,000 | 550,000 | 602 | ||||||||||||||||||||||||||||||||||
| Mar-07 | 70 West 36th Street | Garment | 100.0 | Fee Interest | 151,000 | 61,500 | 407 | ||||||||||||||||||||||||||||||||||
| Jun-07 | 110 East 42nd Street | Grand Central North | 100.0 | Fee Interest | 181,000 | 111,500 | 616 | ||||||||||||||||||||||||||||||||||
| Jun-07 | 125 Broad Street | Downtown | 100.0 | Fee Interest | 525,000 | 273,000 | 520 | ||||||||||||||||||||||||||||||||||
| Jun-07 | 5 Madison Clock Tower | Park Avenue South | 100.0 | Fee Interest | 267,000 | 200,000 | 749 | ||||||||||||||||||||||||||||||||||
| Jul-07 | 292 Madison Avenue | Grand Central South | 100.0 | Fee Interest | 187,000 | 140,000 | 749 | ||||||||||||||||||||||||||||||||||
| Jul-07 | 1372 Broadway | Penn Station/Garment | 85.0 | Fee Interest | 508,000 | 335,000 | 659 | ||||||||||||||||||||||||||||||||||
| Nov-07 | 470 Park Avenue South | Park Avenue South/Flatiron | 100.0 | Fee Interest | 260,000 | 157,000 | 604 | ||||||||||||||||||||||||||||||||||
| Jan-08 | 440 Ninth Avenue | Penn Station | 100.0 | Fee Interest | 339,000 | 160,000 | 472 | ||||||||||||||||||||||||||||||||||
| May-08 | 1250 Broadway | Penn Station | 100.0 | Fee Interest | 670,000 | 310,000 | 463 | ||||||||||||||||||||||||||||||||||
| Oct-08 | 1372 Broadway | Penn Station/Garment | 15.0 | Fee Interest | 508,000 | 274,000 | 539 | ||||||||||||||||||||||||||||||||||
| May-10 | 1221 Avenue of the Americas | Rockefeller Center | 45.0 | Fee Interest | 2,550,000 | 1,280,000 | 502 | ||||||||||||||||||||||||||||||||||
| Sep-10 | 19 West 44th Street | Midtown | 100.0 | Fee Interest | 292,000 | 123,150 | 422 | ||||||||||||||||||||||||||||||||||
| May-11 | 28 West 44th Street | Midtown | 100.0 | Fee Interest | 359,000 | 161,000 | 448 | ||||||||||||||||||||||||||||||||||
| Aug-13 | 333 West 34th Street | Penn Station | 100.0 | Fee Interest | 345,400 | 220,250 | 638 | ||||||||||||||||||||||||||||||||||
| May-14 | 673 First Avenue | Grand Central South | 100.0 | Leasehold Interest | 422,000 | 145,000 | 344 | ||||||||||||||||||||||||||||||||||
| Sep-15 | 120 West 45th Street | Midtown | 100.0 | Fee Interest | 440,000 | 365,000 | 830 | ||||||||||||||||||||||||||||||||||
| Sep-15 | 315 West 36th Street | Times Square South | 100.0 | Fee Interest | 148,000 | 115,000 | 777 | ||||||||||||||||||||||||||||||||||
| Jun-16 | 388 & 390 Greenwich Street | Downtown | 100.0 | Fee Interest | 2,635,000 | 2,000,000 | 759 | ||||||||||||||||||||||||||||||||||
| Aug-16 | 11 Madison Avenue | Park Avenue South | 40.0 | Fee Interest | 2,314,000 | 2,600,000 | 1,124 | ||||||||||||||||||||||||||||||||||
| Nov-17 | 1515 Broadway | Times Square | 30.0 | Fee Interest | 1,750,000 | 1,950,000 | 1,114 | ||||||||||||||||||||||||||||||||||
| Jan-18 | 600 Lexington Avenue | Grand Central North | 100.0 | Fee Interest | 303,515 | 305,000 | 1,005 | ||||||||||||||||||||||||||||||||||
| Feb-18 | 1515 Broadway | Times Square | 13.0 | Fee Interest | 1,750,000 | 1,950,000 | 1,114 | ||||||||||||||||||||||||||||||||||
| May-18 | 1745 Broadway | Midtown | 56.9 | Leasehold Interest | 674,000 | 633,000 | 939 | ||||||||||||||||||||||||||||||||||
| Nov-18 | 3 Columbus Circle | Columbus Circle | 48.9 | Fee Interest | 530,981 | 851,000 | 1,603 | ||||||||||||||||||||||||||||||||||
| Nov-18 | 2 Herald Square | Herald Square | 49.0 | Leasehold Interest | 369,000 | 265,000 | 718 | ||||||||||||||||||||||||||||||||||
| May-19 | 521 Fifth Avenue | Grand Central | 50.5 | Fee Interest | 460,000 | 381,000 | 828 | ||||||||||||||||||||||||||||||||||
| Dec-20 | 30 East 40th Street | Grand Central South | 60.0 | Leasehold Interest | 69,446 | 5,200 | 75 | ||||||||||||||||||||||||||||||||||
| Mar-21 | 55 West 46th Street - Tower 46 | Midtown | 25.0 | Fee Interest | 347,000 | 275,000 | 793 | ||||||||||||||||||||||||||||||||||
| Jun-21 | 635 - 641 Sixth Avenue | Midtown South | 100.0 | Fee Interest | 267,000 | 325,000 | 1,217 | ||||||||||||||||||||||||||||||||||
| Jul-21 | 220 East 42nd Street | Grand Central | 49.0 | Fee Interest | 1,135,000 | 783,500 | 690 | ||||||||||||||||||||||||||||||||||
| Oct-21 | 590 Fifth Avenue | Midtown | 100.0 | Fee Interest | 103,300 | 103,000 | 997 | ||||||||||||||||||||||||||||||||||
| Dec-21 | 110 East 42nd Street | Grand Central | 100.0 | Fee Interest | 215,400 | 117,075 | 544 | ||||||||||||||||||||||||||||||||||
| Jun-23 | 245 Park Avenue | Park Avenue | 49.9 | Fee Interest | 1,782,793 | 1,995,000 | 1,119 | ||||||||||||||||||||||||||||||||||
| 29,695,158 | $ | 21,313,825 | $ | 718 | |||||||||||||||||||||||||||||||||||||
| 2024 Dispositions | |||||||||||||||||||||||||||||||||||||||||
| Nov-24 | One Vanderbilt Avenue | Grand Central | 11.0 | Fee Interest | 1,657,198 | $ | 4,700,000 | $ | 2,836 | ||||||||||||||||||||||||||||||||
| 1,657,198 | $ | 4,700,000 | $ | 2,836 | |||||||||||||||||||||||||||||||||||||
| Supplemental Information | 45 |
Fourth Quarter 2024 |
||||||
|
SUMMARY OF REAL ESTATE ACQUISITION ACTIVITY
Retail, Residential, Development / Redevelopment and Land
Unaudited
(Dollars in Thousands)
|
|
|||||||
| Interest | Gross Asset | Occupancy (%) | |||||||||||||||||||||||||||||||||||||||
| Property | Type of Property | Submarket | Acquired | Type of Ownership | Net Rentable SF | Valuation ($'s) | at acquisition | 12/31/2024 | |||||||||||||||||||||||||||||||||
| 2005 - 2023 Acquisitions | |||||||||||||||||||||||||||||||||||||||||
| Jul-05 | 1551-1555 Broadway | Retail | Times Square | 10.0% | Fee Interest | 25,600 | $ | 85,000 | N/A | N/A | |||||||||||||||||||||||||||||||
| Jul-05 | 21 West 34th Street | Retail | Herald Square | 50.0 | Fee Interest | 30,100 | 17,500 | N/A | N/A | ||||||||||||||||||||||||||||||||
| Sep-05 | 141 Fifth Avenue | Retail | Flatiron | 50.0 | Fee Interest | 21,500 | 13,250 | N/A | N/A | ||||||||||||||||||||||||||||||||
| Nov-05 | 1604 Broadway | Retail | Times Square | 63.0 | Leasehold Interest | 29,876 | 4,400 | 17.2 | N/A | ||||||||||||||||||||||||||||||||
| Dec-05 | 379 West Broadway | Retail | Cast Iron/Soho | 45.0 | Leasehold Interest | 62,006 | 19,750 | 100.0 | N/A | ||||||||||||||||||||||||||||||||
| Jan-06 | 25-29 West 34th Street | Retail | Herald Square/Penn Station | 50.0 | Fee Interest | 41,000 | 30,000 | 55.8 | N/A | ||||||||||||||||||||||||||||||||
| Sep-06 | 717 Fifth Avenue | Retail | Midtown/Plaza District | 32.8 | Fee Interest | 119,550 | 251,900 | 63.1 | N/A | ||||||||||||||||||||||||||||||||
| Aug-07 | 180 Broadway | Development | Lower Manhattan | 50.0 | Fee Interest | 24,300 | 13,600 | 85.2 | N/A | ||||||||||||||||||||||||||||||||
| Apr-07 | Two Herald Square | Land | Herald Square | 55.0 | Fee Interest | N/A | 225,000 | N/A | N/A | ||||||||||||||||||||||||||||||||
| Jul-07 | 885 Third Avenue | Land | Midtown / Plaza District | 55.0 | Fee Interest | N/A | 317,000 | N/A | N/A | ||||||||||||||||||||||||||||||||
| Feb-08 | 182 Broadway | Development | Lower Manhattan | 50.0 | Fee Interest | 46,280 | 30,000 | 83.8 | N/A | ||||||||||||||||||||||||||||||||
| Nov-10 | Williamsburg Terrace | Retail | Brooklyn, New York | 100.0 | Fee Interest | 52,000 | 18,000 | 100.0 | N/A | ||||||||||||||||||||||||||||||||
| Dec-10 | 11 West 34th Street | Retail | Herald Square/Penn Station | 30.0 | Fee Interest | 17,150 | 10,800 | 100.0 | 100.0 | ||||||||||||||||||||||||||||||||
| Dec-10 | Two Herald Square | Land | Herald Square | 45.0 | Fee Interest | 354,400 | 247,500 | N/A | N/A | ||||||||||||||||||||||||||||||||
| Dec-10 | 885 Third Avenue | Land | Midtown / Plaza District | 45.0 | Fee Interest | 607,000 | 352,000 | N/A | N/A | ||||||||||||||||||||||||||||||||
| Dec-10 | 292 Madison Avenue | Land | Grand Central South | 100.0 | Fee Interest | 203,800 | 78,300 | N/A | N/A | ||||||||||||||||||||||||||||||||
| Jan-11 | 3 Columbus Circle | Redevelopment | Columbus Circle | 48.9 | Fee Interest | 741,500 | 500,000 | 20.1 | N/A | ||||||||||||||||||||||||||||||||
| Aug-11 | 1552-1560 Broadway | Retail | Times Square | 50.0 | Fee Interest | 35,897 | 136,550 | 59.7 | 12.6 | ||||||||||||||||||||||||||||||||
| Sep-11 | 747 Madison Avenue | Retail | Plaza District | 33.3 | Fee Interest | 10,000 | 66,250 | 100.0 | N/A | ||||||||||||||||||||||||||||||||
| Jan-12 | DFR Residential and Retail Portfolio | Residential | Plaza District, Upper East Side | 80.0 | Fee Interests / Leasehold Interest | 489,882 | 193,000 | 95.1 | N/A | ||||||||||||||||||||||||||||||||
| Jan-12 | 724 Fifth Avenue | Retail | Plaza District | 50.0 | Fee Interest | 65,010 | 223,000 | 92.9 | N/A | ||||||||||||||||||||||||||||||||
| Jul-12 | West Coast Office Portfolio | West Coast | 27.6 | Fee Interest | 4,473,603 | 880,104 | 76.3 | N/A | |||||||||||||||||||||||||||||||||
| Aug-12 | 33 Beekman Street | Development | Downtown | 45.9 | Fee Interest | 163,500 | 31,160 | — | N/A | ||||||||||||||||||||||||||||||||
| Sep-12 | 635 Sixth Avenue | Redevelopment | Midtown South | 100.0 | Fee Interest | 104,000 | 83,000 | — | N/A | ||||||||||||||||||||||||||||||||
| Oct-12 | 1080 Amsterdam | Redevelopment | Upper West Side | 87.5 | Leasehold Interest | 82,250 | — | 2.2 | N/A | ||||||||||||||||||||||||||||||||
| Dec-12 | 21 East 66th Street | Retail | Plaza District | 32.3 | Fee Interest | 16,736 | 75,000 | 100.0 | N/A | ||||||||||||||||||||||||||||||||
| Dec-12 | 985-987 Third Avenue | Redevelopment | Upper East Side | 100.0 | Fee Interest | 13,678 | 18,000 | — | N/A | ||||||||||||||||||||||||||||||||
| Dec-12 | 131-137 Spring Street | Retail | Soho | 100.0 | Fee Interest | 68,342 | 122,300 | 100.0 | N/A | ||||||||||||||||||||||||||||||||
| Mar-13 | 248-252 Bedford Avenue | Residential | Brooklyn, New York | 90.0 | Fee Interest | 66,611 | 54,900 | — | N/A | ||||||||||||||||||||||||||||||||
| Nov-13 | 650 Fifth Avenue | Retail | Plaza District | 50.0 | Leasehold Interest | 32,324 | — | 63.6 | 100.0 | ||||||||||||||||||||||||||||||||
| Nov-13 | 315 West 33rd Street - The Olivia | Retail / Residential | Penn Station | 100.0 | Fee Interest | 492,987 | 386,775 | 96.6 | N/A | ||||||||||||||||||||||||||||||||
| Nov-13 | 562, 570 & 574 Fifth Avenue | Redevelopment | Plaza District | 100.0 | Fee Interest | 66,962 | 146,222 | 74.6 | N/A | ||||||||||||||||||||||||||||||||
| Jul-14 | 719 Seventh Avenue | Retail | Times Square | 75.0 | Fee Interest | 6,000 | 41,149 | 100.0 | N/A | ||||||||||||||||||||||||||||||||
| Jul-14 | 115 Spring Street | Retail | Soho | 100.0 | Fee Interest | 5,218 | 52,000 | 100.0 | 100.0 | ||||||||||||||||||||||||||||||||
| Jul-14 | 752-760 Madison Avenue | Retail | Plaza District | 100.0 | Fee Interest | 21,124 | 282,415 | 100.0 | 100.0 | ||||||||||||||||||||||||||||||||
| Sep-14 | 121 Greene Street | Retail | Soho | 50.0 | Fee Interest | 7,131 | 27,400 | 100.0 | N/A | ||||||||||||||||||||||||||||||||
| Sep-14 | 635 Madison Avenue | Land | Plaza District | 100.0 | Fee Interest | 176,530 | 145,000 | N/A | N/A | ||||||||||||||||||||||||||||||||
| Oct-14 | 102 Greene Street | Retail | Soho | 100.0 | Fee Interest | 9,200 | 32,250 | 100.0 | N/A | ||||||||||||||||||||||||||||||||
| Oct-14 | 175-225 Third Street | Redevelopment | Brooklyn, New York | 95.0 | Fee Interest | — | 72,500 | — | N/A | ||||||||||||||||||||||||||||||||
| Nov-14 | 55 West 46th Street - Tower 46 | Redevelopment | Midtown | 100.0 | Fee Interest | 347,000 | 295,000 | — | N/A | ||||||||||||||||||||||||||||||||
| Feb-15 | Stonehenge Portfolio | Residential | Various | Various | Fee Interest | 2,589,184 | 40,000 | 96.5 | N/A | ||||||||||||||||||||||||||||||||
| Mar-15 | 1640 Flatbush Avenue | Redevelopment | Brooklyn, New York | 100.0 | Fee Interest | 1,000 | 6,799 | 100.0 | N/A | ||||||||||||||||||||||||||||||||
| Jun-15 | Upper East Side Residential | Residential | Upper East Side Residential | 90.0 | Fee Interest | 27,000 | 50,074 | 96.4 | N/A | ||||||||||||||||||||||||||||||||
| Aug-15 | 187 Broadway & 5-7 Dey Street | Retail | Lower Manhattan | 100.0 | Fee Interest | 73,600 | 63,690 | 90.5 | N/A | ||||||||||||||||||||||||||||||||
| Mar-16 | 183 Broadway | Retail | Lower Manhattan | 100.0 | Fee Interest | 9,100 | 28,500 | 58.3 | N/A | ||||||||||||||||||||||||||||||||
| Apr-16 | 605 West 42nd Street - Sky | Residential | Midtown West | 20.0 | Fee Interest | 927,358 | 759,046 | — | N/A | ||||||||||||||||||||||||||||||||
| Jul-18 | 1231 Third Avenue | Residential | Upper East Side | 100.0 | Fee Interest | 38,992 | 55,355 | 100.0 | N/A | ||||||||||||||||||||||||||||||||
| Oct-18 | 133 Greene Street | Retail | Soho | 100.0 | Fee Interest | 6,425 | 30,999 | 100.0 | N/A | ||||||||||||||||||||||||||||||||
| Dec-18 | 712 Madison Avenue | Retail | Plaza District | 100.0 | Fee Interest | 6,600 | 57,996 | 100.0 | N/A | ||||||||||||||||||||||||||||||||
| Apr-19 | 106 Spring Street | Redevelopment | Soho | 100.0 | Fee Interest | 5,928 | 80,150 | — | N/A | ||||||||||||||||||||||||||||||||
| May-19 | 410 Tenth Avenue | Redevelopment | Hudson Yards | 70.9 | Fee Interest | 638,000 | 440,000 | 76.3 | N/A | ||||||||||||||||||||||||||||||||
| Jan-20 | 762 Madison Avenue | Redevelopment | Plaza District | 10.0 | Fee Interest | 6,109 | 29,250 | 55.1 | N/A | ||||||||||||||||||||||||||||||||
| Jan-20 | 707 Eleventh Avenue | Redevelopment | Midtown West | 100.0 | Fee Interest | 159,720 | 90,000 | 54.3 | N/A | ||||||||||||||||||||||||||||||||
| Jan-20 | 126 Nassau Street | Development | Lower Manhattan | 100.0 | Leasehold Interest | 98,412 | — | 87.3 | 100.0 | ||||||||||||||||||||||||||||||||
| Oct-20 | 85 Fifth Avenue | Retail | Midtown South | 36.3 | Fee Interest | 12,946 | 59,000 | 100.0 | 100.0 | ||||||||||||||||||||||||||||||||
| Sep-21 | 1591-1597 Broadway | Land | Times Square | 100.0 | Fee Interest | 7,684 | 121,000 | N/A | N/A | ||||||||||||||||||||||||||||||||
| Sep-21 | 690 Madison Avenue | Retail | Plaza District | 100.0 | Fee Interest | 7,848 | 72,221 | 100.0 | 100.0 | ||||||||||||||||||||||||||||||||
| Sep-22 | 5 Times Square | Redevelopment | Times Square | 31.6 | Leasehold Interest | 1,127,931 | 1,096,714 | 22.5 | N/A | ||||||||||||||||||||||||||||||||
| Sep-23 | 625 Madison Avenue | Land | Plaza District | 90.4 | Fee Interest | 563,000 | 620,245 | N/A | N/A | ||||||||||||||||||||||||||||||||
| 15,436,884 | $ | 9,279,014 | |||||||||||||||||||||||||||||||||||||||
| 2024 Acquisitions | |||||||||||||||||||||||||||||||||||||||||
| Jan-24 | 2 Herald Square | Redevelopment | Herald Square | 44.0% | Leasehold Interest | 369,000 | $ | 120,000 | 43.9 | 60.3 | |||||||||||||||||||||||||||||||
| Mar-24 | 719 Seventh Avenue | Retail | Times Square | 25.0 | Fee Interest | 10,040 | 76,500 | — | N/A | ||||||||||||||||||||||||||||||||
| 379,040 | $ | 196,500 | |||||||||||||||||||||||||||||||||||||||
| Supplemental Information | 46 |
Fourth Quarter 2024 |
||||||
|
SUMMARY OF REAL ESTATE DISPOSITION ACTIVITY
Retail, Residential, Development / Redevelopment, Land and Alternative Strategy Portfolio
Unaudited
(Dollars in Thousands)
|
|
|||||||
| Interest | Gross Asset Valuation | |||||||||||||||||||||||||||||||||||||||||||
| Property | Type of Property | Submarket | Sold | Type of Ownership | Net Rentable SF | ($'s) | ($'s/SF) | |||||||||||||||||||||||||||||||||||||
| 2011 - 2023 Dispositions | ||||||||||||||||||||||||||||||||||||||||||||
| Sep-11 | 1551-1555 Broadway | Retail | Times Square | 10.0% | Fee Interest | 25,600 | $ | 276,757 | $ | 10,811 | ||||||||||||||||||||||||||||||||||
| Feb-12 | 141 Fifth Avenue | Retail | Flatiron | 100.0 | Fee Interest | 13,000 | 46,000 | 3,538 | ||||||||||||||||||||||||||||||||||||
| Feb-12 | 292 Madison Avenue | Land | Grand Central South | 100.0 | Fee Interest | 203,800 | 85,000 | 417 | ||||||||||||||||||||||||||||||||||||
| Apr-12 | 379 West Broadway | Retail | Cast Iron/Soho | 100.0 | Leasehold Interest | 62,006 | 48,500 | 782 | ||||||||||||||||||||||||||||||||||||
| Jun-12 | 717 Fifth Avenue | Retail | Midtown/Plaza District | 50.0 | Fee Interest | 119,550 | 617,584 | 5,166 | ||||||||||||||||||||||||||||||||||||
| Sep-12 | 3 Columbus Circle | Redevelopment | Columbus Circle | 29.0 | Fee Interest | 214,372 | 143,600 | 670 | ||||||||||||||||||||||||||||||||||||
| Feb-13 | 44 West 55th Street | Retail | Plaza District | 100.0 | Fee Interest | 8,557 | 6,250 | 730 | ||||||||||||||||||||||||||||||||||||
| Jun-13 | West Coast Office Portfolio | West Coast | Los Angeles, California | 100.0 | Fee Interest | 406,740 | 111,925 | 275 | ||||||||||||||||||||||||||||||||||||
| Aug-13 | West Coast Office Portfolio | West Coast | Fountain Valley, California | 100.0 | Fee Interest | 302,037 | 66,994 | 222 | ||||||||||||||||||||||||||||||||||||
| Sep-13 | West Coast Office Portfolio | West Coast | San Diego, California | 100.0 | Fee Interest | 110,511 | 45,400 | 411 | ||||||||||||||||||||||||||||||||||||
| Dec-13 | 27-29 West 34th Street | Retail | Herald Square/Penn Station | 100.0 | Fee Interest | 15,600 | 70,052 | 4,491 | ||||||||||||||||||||||||||||||||||||
| Jan-14 | 21-25 West 34th Street | Retail | Herald Square/Penn Station | 100.0 | Fee Interest | 30,100 | 114,948 | 3,819 | ||||||||||||||||||||||||||||||||||||
| Mar-14 | West Coast Office Portfolio | West Coast | 100.0 | Fee Interest | 3,654,315 | 756,000 | 207 | |||||||||||||||||||||||||||||||||||||
| May-14 | 747 Madison Avenue | Retail | Plaza District | 100.0 | Fee Interest | 10,000 | 160,000 | 16,000 | ||||||||||||||||||||||||||||||||||||
| Jul-14 | 985-987 Third Avenue | Redevelopment | Upper East Side | 100.0 | Fee Interest | 13,678 | 68,700 | 5,023 | ||||||||||||||||||||||||||||||||||||
| Sep-14 | 180-182 Broadway | Redevelopment | Lower Manhattan | 100.0 | Fee Interest | 156,086 | 222,500 | 1,425 | ||||||||||||||||||||||||||||||||||||
| Nov-14 | 2 Herald Square | Land | Herald Square/Penn Station | 100.0 | Fee Interest | 354,400 | 365,000 | 1,030 | ||||||||||||||||||||||||||||||||||||
| Nov-14 | 55 West 46th Street - Tower 46 | Redevelopment | Midtown | 75.0 | Fee Interest | 347,000 | 295,000 | 850 | ||||||||||||||||||||||||||||||||||||
| Jan-15 | 180 Maiden Lane | Redevelopment | Financial East | 100.0 | Fee Interest | 1,090,000 | 470,000 | 431 | ||||||||||||||||||||||||||||||||||||
| Aug-15 | 131-137 Spring Street | Retail | Soho | 80.0 | Fee Interest | 68,342 | 277,750 | 4,064 | ||||||||||||||||||||||||||||||||||||
| Dec-15 | 570 & 574 Fifth Avenue | Redevelopment | Plaza District | 100.0 | Fee Interest | 24,327 | 125,400 | 5,155 | ||||||||||||||||||||||||||||||||||||
| Feb-16 | 248-252 Bedford Avenue | Residential | Brooklyn, New York | 90.0 | Fee Interest | 66,611 | 55,000 | 826 | ||||||||||||||||||||||||||||||||||||
| Feb-16 | 885 Third Avenue | Land | Midtown / Plaza District | 100.0 | Fee Interest | 607,000 | 453,000 | 746 | ||||||||||||||||||||||||||||||||||||
| May-16 | 33 Beekman Street | Redevelopment | Downtown | 100.0 | Fee Interest | 163,500 | 196,000 | 1,199 | ||||||||||||||||||||||||||||||||||||
| Oct-16 | 400 East 57th Street | Residential | Upper East Side | 49.0 | Fee Interest | 290,482 | 170,000 | 585 | ||||||||||||||||||||||||||||||||||||
| Apr-17 | 102 Greene Street | Retail | Soho | 90.0 | Fee Interest | 9,200 | 43,500 | 4,728 | ||||||||||||||||||||||||||||||||||||
| Sep-17 | 102 Greene Street | Retail | Soho | 10.0 | Fee Interest | 9,200 | 43,500 | 4,728 | ||||||||||||||||||||||||||||||||||||
| Apr-18 | 175-225 Third Street | Redevelopment | Brooklyn, New York | 95.0 | Fee Interest | — | 115,000 | — | ||||||||||||||||||||||||||||||||||||
| Jun-18 | 635 Madison Avenue | Land | Plaza District | 100.0 | Fee Interest | 176,530 | 153,000 | 867 | ||||||||||||||||||||||||||||||||||||
| Jul-18 | 724 Fifth Avenue | Retail | Plaza District | 50.0 | Fee Interest | 65,010 | 365,000 | 5,615 | ||||||||||||||||||||||||||||||||||||
| Oct-18 | 72nd Street Assemblage & 1231 Third Avenue | Residential | Upper East Side | Various | Fee Interest | — | 143,800 | — | ||||||||||||||||||||||||||||||||||||
| Jan-19 | 131-137 Spring Street | Retail | Soho | 20.0 | Fee Interest | 68,342 | 216,000 | 3,161 | ||||||||||||||||||||||||||||||||||||
| Aug-19 | 115 Spring Street | Retail | Soho | 49.0 | Fee Interest | 5,218 | 66,050 | 12,658 | ||||||||||||||||||||||||||||||||||||
| Dec-19 | 562 Fifth Avenue | Redevelopment | Plaza District | 100.0 | Fee Interest | 42,635 | 52,393 | 1,229 | ||||||||||||||||||||||||||||||||||||
| Dec-19 | 1640 Flatbush Avenue | Redevelopment | Brooklyn, New York | 100.0 | Fee Interest | 1,000 | 16,150 | 16,150 | ||||||||||||||||||||||||||||||||||||
| Mar-20 | 315 West 33rd Street - The Olivia | Retail / Residential | Penn Station | 100.0 | Fee Interest | 492,987 | 446,500 | 906 | ||||||||||||||||||||||||||||||||||||
| May-20 | 609 Fifth Avenue - Retail Condominium | Retail | Rockefeller Center | 100.0 | Fee Interest | 21,437 | 168,000 | 7,837 | ||||||||||||||||||||||||||||||||||||
| Sep-20 | 400 East 58th Street | Residential | Upper East Side | 90.0 | Fee Interest | 140,000 | 62,000 | 443 | ||||||||||||||||||||||||||||||||||||
| Dec-20 | 410 Tenth Avenue | Redevelopment | Hudson Yards | 70.9 | Fee Interest | 638,000 | 952,500 | 1,493 | ||||||||||||||||||||||||||||||||||||
| Dec-20 | Williamsburg Terrace | Retail | Brooklyn, New York | 100.0 | Fee Interest | 52,000 | 32,000 | 615 | ||||||||||||||||||||||||||||||||||||
| Jan-21 | 712 Madison Avenue | Retail | Plaza District | 100.0 | Fee Interest | 6,600 | 43,000 | 6,515 | ||||||||||||||||||||||||||||||||||||
| Feb-21 | 133 Greene Street | Retail | Soho | 100.0 | Fee Interest | 6,425 | 15,796 | 2,459 | ||||||||||||||||||||||||||||||||||||
| Mar-21 | 106 Spring Street | Redevelopment | Soho | 100.0 | Fee Interest | 5,928 | 34,024 | 5,740 | ||||||||||||||||||||||||||||||||||||
| Jun-21 | 605 West 42nd Street - Sky | Residential | Westside | 20.0 | Fee Interest | 927,358 | 858,100 | 925 | ||||||||||||||||||||||||||||||||||||
| Sep-21 | 400 East 57th Street | Residential | Upper East Side | 41.0 | Fee Interest | 290,482 | 133,500 | 460 | ||||||||||||||||||||||||||||||||||||
| Feb-22 | 707 Eleventh Avenue | Redevelopment | Midtown West | 100.0 | Fee Interest | 159,720 | 95,000 | 595 | ||||||||||||||||||||||||||||||||||||
| Apr-22 | 1080 Amsterdam | Residential | Upper West Side | 92.5 | Leasehold Interest | 82,250 | 42,650 | 519 | ||||||||||||||||||||||||||||||||||||
| May-22 | 1591-1597 Broadway | Land | Times Square | 100.0 | Fee Interest | 7,684 | 121,000 | 15,747 | ||||||||||||||||||||||||||||||||||||
| Jun-22 | 609 Fifth Avenue | Redevelopment | Rockefeller Center | 100.0 | Fee Interest | 138,563 | 100,500 | 725 | ||||||||||||||||||||||||||||||||||||
| Dec-22 | 885 Third Avenue - Condominium | Redevelopment | Midtown / Plaza District | 100.0 | Fee / Leasehold Interest | 414,317 | 300,400 | 725 | ||||||||||||||||||||||||||||||||||||
| Feb-23 | 121 Greene Street | Retail | Soho | 50.0 | Fee Interest | 7,131 | 14,000 | 1,963 | ||||||||||||||||||||||||||||||||||||
| Dec-23 | 21 East 66th Street | Retail | Plaza District | 32.3 | Fee Interest | 13,069 | 40,574 | 3,105 | ||||||||||||||||||||||||||||||||||||
| 12,138,700 | $ | 9,921,297 | $ | 817 | ||||||||||||||||||||||||||||||||||||||||
| 2024 Dispositions | ||||||||||||||||||||||||||||||||||||||||||||
| Jan-24 | 717 Fifth Avenue | Retail | Midtown / Plaza District | 10.9% | Fee Interest | 119,550 | $ | 963,000 | $ | 8,055 | ||||||||||||||||||||||||||||||||||
| May-24 | 625 Madison Avenue | Redevelopment | Plaza District | 90.4 | Fee Interest | 563,000 | 634,600 | 1,127 | ||||||||||||||||||||||||||||||||||||
| Jun-24 | 719 Seventh Avenue | Retail | Times Square | 100.0 | Fee Interest | 10,040 | 30,500 | 3,038 | ||||||||||||||||||||||||||||||||||||
| Oct-24 | 5 Times Square | Redevelopment | Times Square | 31.6 | Leasehold Interest | 1,127,931 | 1,165,587 | 1,033 | ||||||||||||||||||||||||||||||||||||
| 1,820,521 | $ | 2,793,687 | $ | 1,535 | ||||||||||||||||||||||||||||||||||||||||
| Supplemental Information | 47 |
Fourth Quarter 2024 |
||||||
SUMMARY OF REAL ESTATE ACQUISITION/DISPOSITION ACTIVITY Suburban Unaudited (Dollars in Thousands) |
|
|||||||
| Gross Asset | Occupancy (%) | |||||||||||||||||||||||||||||||||||||
| Property | Submarket | Interest Acquired | Type of Ownership | Net Rentable SF | Valuation ($'s) | at acquisition | 12/31/2024 | |||||||||||||||||||||||||||||||
| 2007 - 2024 Acquisitions | ||||||||||||||||||||||||||||||||||||||
| Jan-07 | 300 Main Street | Stamford, Connecticut | 100.0% | Fee Interest | 130,000 | $ | 15,000 | 92.5 | N/A | |||||||||||||||||||||||||||||
| Jan-07 | 399 Knollwood Road | White Plains, New York | 100.0 | Fee Interest | 145,000 | 31,600 | 96.6 | N/A | ||||||||||||||||||||||||||||||
| Jan-07 | Reckson - Connecticut Portfolio | Stamford, Connecticut | 100.0 | Fee Interests / Leasehold Interest | 1,369,800 | 490,750 | 88.9 | 72.6 | ||||||||||||||||||||||||||||||
| Jan-07 | Reckson - Westchester Portfolio | Westchester | 100.0 | Fee Interests / Leasehold Interest | 2,346,100 | 570,190 | 90.6 | N/A | ||||||||||||||||||||||||||||||
| Apr-07 | Jericho Plaza | Jericho, New York | 20.3 | Fee Interest | 640,000 | 210,000 | 98.4 | N/A | ||||||||||||||||||||||||||||||
| Jun-07 | 1010 Washington Boulevard | Stamford, Connecticut | 100.0 | Fee Interest | 143,400 | 38,000 | 95.6 | N/A | ||||||||||||||||||||||||||||||
| Jun-07 | 500 West Putnam Avenue | Greenwich, Connecticut | 100.0 | Fee Interest | 121,500 | 56,000 | 94.4 | N/A | ||||||||||||||||||||||||||||||
| Jul-07 | 16 Court Street | Brooklyn, New York | 35.0 | Fee Interest | 317,600 | 107,500 | 80.6 | N/A | ||||||||||||||||||||||||||||||
| Aug-07 | 150 Grand Street | White Plains, New York | 100.0 | Fee Interest | 85,000 | 6,700 | 52.9 | N/A | ||||||||||||||||||||||||||||||
| Sep-07 | The Meadows | Rutherford, New Jersey | 25.0 | Fee Interest | 582,100 | 111,500 | 81.3 | N/A | ||||||||||||||||||||||||||||||
| Jan-08 | 125 Chubb Way | Lyndhurst, New Jersey | 100.0 | Fee Interest | 278,000 | 29,364 | — | N/A | ||||||||||||||||||||||||||||||
| Dec-10 | 7 Renaissance Square | White Plains, New York | 50.0 | Fee Interest | 65,641 | 4,000 | — | N/A | ||||||||||||||||||||||||||||||
| Apr-13 | 16 Court Street | Brooklyn, New York | 49.0 | Fee Interest | 317,600 | 96,200 | 84.9 | N/A | ||||||||||||||||||||||||||||||
| 6,541,741 | $ | 1,766,804 | ||||||||||||||||||||||||||||||||||||
| Gross Asset | ||||||||||||||||||||||||||||||||||||||
| Property | Submarket | Interest Sold | Type of Ownership | Net Rentable SF | Valuation ($'s) | Price ($'s/SF) | ||||||||||||||||||||||||||||||||
| 2008 - 2023 Dispositions | ||||||||||||||||||||||||||||||||||||||
| Oct-08 | 100 & 120 White Plains Road | Tarrytown, New York | 100.0% | Fee Interest | 211,000 | $ | 48,000 | $ | 227 | |||||||||||||||||||||||||||||
| Jan-09 | 55 Corporate Drive | Bridgewater, New Jersey | 100.0 | Fee Interest | 670,000 | 230,000 | 343 | |||||||||||||||||||||||||||||||
| Aug-09 | 399 Knollwood Road | White Plains, New York | 100.0 | Fee Interest | 145,000 | 20,767 | 143 | |||||||||||||||||||||||||||||||
| Jul-12 | One Court Square | Long Island City, New York | 100.0 | Fee Interest | 1,402,000 | 481,100 | 343 | |||||||||||||||||||||||||||||||
| Sep-13 | 300 Main Street | Stamford, Connecticut | 100.0 | Fee Interest | 130,000 | 13,500 | 104 | |||||||||||||||||||||||||||||||
| Aug-15 | The Meadows | Rutherford, New Jersey | 100.0 | Fee Interest | 582,100 | 121,100 | 208 | |||||||||||||||||||||||||||||||
| Dec-15 | 140 Grand Street | White Plains, New York | 100.0 | Fee Interest | 130,100 | 22,400 | 172 | |||||||||||||||||||||||||||||||
| Dec-15 | 150 Grand Street | White Plains, New York | 100.0 | Fee Interest | 85,000 | 9,600 | 113 | |||||||||||||||||||||||||||||||
| Mar-16 | 7 Renaissance Square | White Plains, New York | 100.0 | Fee Interest | 65,641 | 21,000 | 320 | |||||||||||||||||||||||||||||||
| Jul-16 | 500 West Putnam Avenue | Greenwich, Connecticut | 100.0 | Fee Interest | 121,500 | 41,000 | 337 | |||||||||||||||||||||||||||||||
| Apr-17 | 520 White Plains Road | Tarrytown, New York | 100.0 | Fee Interest | 180,000 | 21,000 | 117 | |||||||||||||||||||||||||||||||
| Jul-17 | 680 Washington Avenue | Stamford, Connecticut | 51.0 | Fee Interest | 133,000 | 42,011 | 316 | |||||||||||||||||||||||||||||||
| Jul-17 | 750 Washington Avenue | Stamford, Connecticut | 51.0 | Fee Interest | 192,000 | 53,745 | 280 | |||||||||||||||||||||||||||||||
| Oct-17 | 16 Court Street | Brooklyn, New York | 100.0 | Fee Interest | 317,600 | 171,000 | 538 | |||||||||||||||||||||||||||||||
| Oct-17 | 125 Chubb Way | Lyndhurst, New Jersey | 100.0 | Fee Interest | 278,000 | 29,500 | 106 | |||||||||||||||||||||||||||||||
| May-18 | 115-117 Stevens Avenue | Valhalla, New York | 100.0 | Fee Interest | 178,000 | 12,000 | 67 | |||||||||||||||||||||||||||||||
| Jun-18 | Jericho Plaza | Jericho, New York | 11.7 | Fee Interest | 640,000 | 117,400 | 183 | |||||||||||||||||||||||||||||||
| Jul-18 | 1-6 International Drive | Rye Brook, New York | 100.0 | Fee Interest | 540,000 | 55,000 | 102 | |||||||||||||||||||||||||||||||
| Nov-19 | 1010 Washington Boulevard | Stamford, Connecticut | 100.0 | Fee Interest | 143,400 | 23,100 | 161 | |||||||||||||||||||||||||||||||
| Dec-19 | 100 Summit Lake Drive | Valhalla, New York | 100.0 | Fee Interest | 250,000 | 41,580 | 166 | |||||||||||||||||||||||||||||||
| Dec-19 | 200 Summit Lake Drive | Valhalla, New York | 100.0 | Fee Interest | 245,000 | 37,943 | 155 | |||||||||||||||||||||||||||||||
| Dec-19 | 500 Summit Lake Drive | Valhalla, New York | 100.0 | Fee Interest | 228,000 | 34,185 | 150 | |||||||||||||||||||||||||||||||
| Dec-19 | 360 Hamilton Avenue | White Plains, New York | 100.0 | Fee Interest | 384,000 | 115,452 | 301 | |||||||||||||||||||||||||||||||
| Dec-20 | 1055 Washington Boulevard | Stamford, Connecticut | 100.0 | Leasehold Interest | 182,000 | 23,750 | 130 | |||||||||||||||||||||||||||||||
| 7,433,341 | $ | 1,786,133 | $ | 240 | ||||||||||||||||||||||||||||||||||
| 2024 Dispositions | ||||||||||||||||||||||||||||||||||||||
| Jul-24 | Palisades Premier Conference Center | Orangetown, New York | 100.0 | Fee Interest | 450,000 | $ | 26,250 | $ | 58 | |||||||||||||||||||||||||||||
| 450,000 | $ | 26,250 | $ | 58 | ||||||||||||||||||||||||||||||||||
| Supplemental Information | 48 |
Fourth Quarter 2024 |
||||||
|
Non-GAAP Disclosures and Reconciliations
Unaudited
(Dollars in Thousands, except per share data)
|
|
|||||||
| Supplemental Information | 49 |
Fourth Quarter 2024 |
||||||
|
Non-GAAP Disclosures and Reconciliations
Unaudited
(Dollars in Thousands, except per share data)
|
|
|||||||
| Three Months Ended | Twelve Months Ended | ||||||||||||||||||||||
| December 31, | December 31, | ||||||||||||||||||||||
| 2024 | 2023 | 2024 | 2023 | ||||||||||||||||||||
| Net income (loss) attributable to SL Green common stockholders | $ | 9,358 | $ | (155,617) | $ | 7,060 | $ | (579,509) | |||||||||||||||
| Add: | |||||||||||||||||||||||
| Depreciation and amortization | 53,436 | 49,050 | 207,443 | 247,810 | |||||||||||||||||||
| Joint venture depreciation and noncontrolling interest adjustments | 69,636 | 73,062 | 287,671 | 284,284 | |||||||||||||||||||
| Net income (loss) attributable to noncontrolling interests | 3,885 | (10,081) | (431) | (42,033) | |||||||||||||||||||
| Less: | |||||||||||||||||||||||
| Equity in net gain (loss) on sale of interest in unconsolidated joint venture/real estate | 189,138 | (13,289) | 208,144 | (13,368) | |||||||||||||||||||
| Purchase price and other fair value adjustments | 117,195 | — | 83,430 | (6,813) | |||||||||||||||||||
| (Loss) Gain on sale of real estate, net | (1,705) | (4,557) | 3,025 | (32,370) | |||||||||||||||||||
| Depreciable real estate reserves | (38,232) | (76,847) | (104,071) | (382,374) | |||||||||||||||||||
| Depreciable real estate reserves in unconsolidated joint venture | (263,190) | — | (263,190) | — | |||||||||||||||||||
| Depreciation on non-rental real estate assets | 1,226 | 1,414 | 4,583 | 4,136 | |||||||||||||||||||
| FFO attributable to SL Green common stockholders and unit holders | $ | 131,883 | $ | 49,693 | $ | 569,822 | $ | 341,341 | |||||||||||||||
| For the three months ended | |||||||||||||||||||||||||||||
| 12/31/2024 | 9/30/2024 | 6/30/2024 | 3/31/2024 | 12/31/2023 | |||||||||||||||||||||||||
| Net income (loss) | $ | 19,138 | $ | (9,264) | $ | 1,959 | $ | 18,389 | $ | (160,058) | |||||||||||||||||||
| Depreciable real estate reserves | 38,232 | — | 13,721 | 52,118 | 76,847 | ||||||||||||||||||||||||
| Depreciable real estate reserves in unconsolidated joint venture | 263,190 | — | — | — | — | ||||||||||||||||||||||||
| Loss (gain) on sale of real estate, net | 1,705 | (7,471) | 2,741 | — | 4,557 | ||||||||||||||||||||||||
| Purchase price and other fair value adjustments | (125,287) | (12,906) | (1,265) | 50,492 | 10,273 | ||||||||||||||||||||||||
| Equity in net (gain) loss on sale of interest in unconsolidated joint venture/real estate | (189,138) | (371) | 8,129 | (26,764) | 13,289 | ||||||||||||||||||||||||
| Depreciation and amortization | 53,436 | 53,176 | 52,247 | 48,584 | 49,050 | ||||||||||||||||||||||||
| Income taxes | 2,324 | 1,406 | 1,230 | 606 | 737 | ||||||||||||||||||||||||
| SUMMIT Operator tax expense | 1,949 | (1,779) | 1,855 | (1,295) | 2,320 | ||||||||||||||||||||||||
| Amortization of deferred financing costs | 1,734 | 1,669 | 1,677 | 1,539 | 1,510 | ||||||||||||||||||||||||
| Interest expense, net of interest income | 38,153 | 42,091 | 35,803 | 31,173 | 27,400 | ||||||||||||||||||||||||
| Adjustments to reflect the entity’s share of EBITDAre of unconsolidated affiliates | 140,733 | 143,797 | 147,288 | 151,036 | 151,577 | ||||||||||||||||||||||||
| EBITDAre | $ | 246,169 | $ | 210,348 | $ | 265,385 | $ | 325,878 | $ | 177,502 | |||||||||||||||||||
| Supplemental Information | 50 |
Fourth Quarter 2024 |
||||||
|
Non-GAAP Disclosures and Reconciliations
Unaudited
(Dollars in Thousands, except per share data)
|
|
|||||||
| RECONCILIATION OF NON-GAAP FINANCIAL MEASURES | Three Months Ended | Twelve Months Ended | |||||||||||||||||||||
Operating income and Same-store NOI Reconciliation |
December 31, | December 31, | |||||||||||||||||||||
| 2024 | 2023 | 2024 | 2023 | ||||||||||||||||||||
| Net income (loss) | $ | 19,138 | $ | (160,058) | $ | 30,222 | $ | (599,337) | |||||||||||||||
| Depreciable real estate reserves | 38,232 | 76,847 | 104,071 | 382,374 | |||||||||||||||||||
| Depreciable real estate reserves in unconsolidated joint venture | 263,190 | — | 263,190 | — | |||||||||||||||||||
| Loss (Gain) on sale of real estate, net | 1,705 | 4,557 | (3,025) | 32,370 | |||||||||||||||||||
| Purchase price and other fair value adjustments | (125,287) | 10,273 | (88,966) | 17,260 | |||||||||||||||||||
| Equity in net (gain) loss on sale of interest in unconsolidated joint venture/real estate | (189,138) | 13,289 | (208,144) | 13,368 | |||||||||||||||||||
| Depreciation and amortization | 53,436 | 49,050 | 207,443 | 247,810 | |||||||||||||||||||
| SUMMIT Operator tax expense | 1,949 | 2,320 | 730 | 9,201 | |||||||||||||||||||
| Amortization of deferred financing costs | 1,734 | 1,510 | 6,619 | 7,837 | |||||||||||||||||||
| Interest expense, net of interest income | 38,153 | 27,400 | 147,220 | 137,114 | |||||||||||||||||||
| Interest expense on senior obligations of consolidated securitization vehicles | 11,304 | — | 14,634 | — | |||||||||||||||||||
| Operating income | 114,416 | 25,188 | 473,994 | 247,997 | |||||||||||||||||||
| Equity in net loss (income) from unconsolidated joint ventures | 16,562 | 32,039 | (83,495) | 76,509 | |||||||||||||||||||
| Marketing, general and administrative expense | 22,827 | 42,257 | 85,187 | 111,389 | |||||||||||||||||||
| Transaction related costs | 138 | 16 | 401 | 1,099 | |||||||||||||||||||
| Loan loss and other investment reserves, net of recoveries | — | — | — | 6,890 | |||||||||||||||||||
| SUMMIT Operator expenses | 28,792 | 24,887 | 111,739 | 101,211 | |||||||||||||||||||
| (Gain) Loss on early extinguishment of debt | (25,985) | 870 | (43,762) | 870 | |||||||||||||||||||
| Investment income | (5,415) | (6,856) | (24,353) | (34,705) | |||||||||||||||||||
| Interest income from real estate loans held by consolidated securitization vehicles | (14,209) | — | (18,980) | — | |||||||||||||||||||
| SUMMIT Operator revenue | (38,571) | (35,240) | (133,214) | (118,260) | |||||||||||||||||||
| Non-building revenue | (20,704) | (10,935) | (68,881) | (44,568) | |||||||||||||||||||
| Net operating income (NOI) | 77,851 | 72,226 | 298,636 | 348,432 | |||||||||||||||||||
| Equity in net (loss) income from unconsolidated joint ventures | (16,562) | (32,039) | 83,495 | (76,509) | |||||||||||||||||||
| SLG share of unconsolidated JV depreciation and amortization | 67,046 | 69,588 | 275,098 | 266,340 | |||||||||||||||||||
| SLG share of unconsolidated JV amortization of deferred financing costs | 3,459 | 2,876 | 11,334 | 12,005 | |||||||||||||||||||
| SLG share of unconsolidated JV interest expense, net of interest income | 67,099 | 73,012 | 276,852 | 272,217 | |||||||||||||||||||
| SLG share of unconsolidated JV gain on early extinguishment of debt | — | — | (172,369) | — | |||||||||||||||||||
| SLG share of unconsolidated JV investment income | (5,048) | (320) | (11,513) | (1,271) | |||||||||||||||||||
| SLG share of unconsolidated JV non-building revenue | 147 | 106 | (3,051) | (14,336) | |||||||||||||||||||
| NOI including SLG share of unconsolidated JVs | 193,992 | 185,449 | 758,482 | 806,878 | |||||||||||||||||||
| NOI from other properties/affiliates | (38,211) | (26,870) | (140,923) | (163,399) | |||||||||||||||||||
| Same-Store NOI | 155,781 | 158,579 | 617,559 | 643,479 | |||||||||||||||||||
| Straight-line and free rent | 810 | (1,185) | 323 | (11,989) | |||||||||||||||||||
| Amortization of acquired above and below-market leases, net | 830 | 88 | 2,578 | 560 | |||||||||||||||||||
| Operating lease straight-line adjustment | 204 | 204 | 815 | 815 | |||||||||||||||||||
| SLG share of unconsolidated JV straight-line and free rent | (5,024) | (2,265) | (9,687) | (17,481) | |||||||||||||||||||
| SLG share of unconsolidated JV amortization of acquired above and below-market leases, net | (4,409) | (4,407) | (17,635) | (17,161) | |||||||||||||||||||
| SLG share of unconsolidated JV operating lease straight-line adjustment | — | — | — | — | |||||||||||||||||||
| Same-store cash NOI | $ | 148,192 | $ | 151,014 | $ | 593,953 | $ | 598,223 | |||||||||||||||
| Lease termination income | (2,737) | (1,102) | (6,338) | (4,054) | |||||||||||||||||||
| SLG share of unconsolidated JV lease termination income | — | (369) | (3,055) | (2,251) | |||||||||||||||||||
| Same-store cash NOI excluding lease termination income | $ | 145,455 | $ | 149,543 | $ | 584,560 | $ | 591,918 | |||||||||||||||
| Supplemental Information | 51 |
Fourth Quarter 2024 |
||||||
|
RESEARCH ANALYST COVERAGE
|
|
|||||||
| EQUITY COVERAGE | |||||||||||
| Firm | Analyst | Phone | |||||||||
| B of A Securities | Jeff Spector |
(646) 855-1363 |
jeff.spector@bofa.com | ||||||||
| Barclays | Brendan Lynch | (212) 526-9428 | brendan.lynch@barclays.com | ||||||||
| BMO Capital Markets Corp. | John P. Kim | (212) 885-4115 | JohnP.Kim@bmo.com | ||||||||
| BTIG | Thomas Catherwood | (212) 738-6140 | tcatherwood@btig.com | ||||||||
| Citi | Michael Griffin |
(212) 816-5871 |
michael.a.griffin@citi.com |
||||||||
| Deutsche Bank | Omotayo Okusanya | (212) 250-9284 | omotayo.okusanya@db.com | ||||||||
| Goldman Sachs & Co. | Caitlin Burrows | (212) 902-4736 | caitlin.burrows@gs.com | ||||||||
| Evercore ISI | Steve Sakwa | (212) 446-9462 | steve.sakwa@evercoreisi.com | ||||||||
| Jefferies | Peter Abramowitz | (212) 336-7241 | pabramowitz@jefferies.com | ||||||||
| JP Morgan Securities | Anthony Paolone | (212) 622-6682 | anthony.paolone@jpmorgan.com | ||||||||
Mizuho Securities USA |
Vikram Malhotra |
(212) 282-3827 |
vikram.malhotra@mizuhogroup.com |
||||||||
| Morgan Stanley & Co. | Ronald Kamdem | (212) 296-8319 | ronald.kamdem@morganstanley.com | ||||||||
| Piper Sandler | Alexander Goldfarb | (212) 466-7937 | alexander.goldfarb@psc.com | ||||||||
| Scotiabank | Nicholas Yulico | (212) 225-6904 | nicholas.yulico@scotiabank.com | ||||||||
| Truist Securities | Michael Lewis | (212) 319-5659 | michael.r.lewis@truist.com | ||||||||
| Wells Fargo | Blaine Heck | (443) 263-6529 | blaine.heck@wellsfargo.com | ||||||||
| Wolfe Research | Andrew Rosivach | (646) 582-9250 | arosivach@wolferesearch.com | ||||||||
| SL Green Realty Corp. is covered by the research analysts listed above. Please note that any opinions, estimates or forecasts regarding SL Green Realty Corp.'s performance made by these analysts are theirs alone and do not represent opinions, forecasts or predictions of SL Green Realty Corp. or its management. SL Green Realty Corp. does not, by its reference above or distribution, imply its endorsement of or concurrence with such information, conclusions or recommendations. | ||||||||||||||
| Supplemental Information | 52 |
Fourth Quarter 2024 |
||||||
|
EXECUTIVE MANAGEMENT
|
|
|||||||
| Marc Holliday | Neil H. Kessner | ||||
| Chairman, Chief Executive Officer and | Executive Vice President, General | ||||
| Interim President | Counsel - Real Property | ||||
| Matthew J. DiLiberto | Maggie Hui | ||||
Chief Financial Officer |
Chief Accounting Officer | ||||
| Andrew S. Levine | Harrison Sitomer | ||||
| Chief Legal Officer - General Counsel, EVP | Chief Investment Officer | ||||
| Steven M. Durels | Robert Schiffer | ||||
| Executive Vice President, Director of | Executive Vice President, Development | ||||
| Leasing and Real Property | |||||
| Brett Herschenfeld | |||||
| Edward V. Piccinich | Executive Vice President, Retail and Opportunistic | ||||
Chief Operating Officer |
Investment | ||||
| Supplemental Information | 53 |
Fourth Quarter 2024 |
||||||