| BXP, Inc. | Delaware | 1-13087 |
04-2473675 | ||||||||
| (State or Other Jurisdiction of Incorporation) |
(Commission File Number) | (IRS Employer Identification No.) |
|||||||||
| Boston Properties Limited Partnership | Delaware | 0-50209 |
04-3372948 | ||||||||
| (State or Other Jurisdiction of Incorporation) |
(Commission File Number) | (IRS Employer Identification No.) |
|||||||||
| Registrant | Title of each class | Trading Symbol(s) | Name of each exchange on which registered | |||||||||||||||||
| BXP, Inc. | Common Stock, par value $0.01 per share | BXP | New York Stock Exchange | |||||||||||||||||
| Exhibit No. | Description | |||||||
| *99.1 | ||||||||
| *99.2 | ||||||||
| *101.SCH | Inline XBRL Taxonomy Extension Schema Document. | |||||||
| *101.LAB | Inline XBRL Taxonomy Extension Label Linkbase Document. | |||||||
| *101.PRE | Inline XBRL Taxonomy Extension Presentation Linkbase Document. | |||||||
| *101.DEF | Inline XBRL Taxonomy Extension Definition Linkbase Document. | |||||||
| *104 | Cover Page Interactive Data File (formatted as Inline XBRL with applicable taxonomy extension information contained in Exhibits 101.*). | |||||||
| BXP, INC. | |||||||||||
| By: | /s/ MICHAEL E. LABELLE | ||||||||||
Michael E. LaBelle |
|||||||||||
Executive Vice President, Chief Financial Officer |
|||||||||||
and Treasurer |
|||||||||||
BOSTON PROPERTIES LIMITED PARTNERSHIP |
|||||||||||
| By: BXP, Inc., its General Partner | |||||||||||
| By: | /s/ MICHAEL E. LABELLE | ||||||||||
Michael E. LaBelle |
|||||||||||
Executive Vice President, Chief Financial Officer |
|||||||||||
and Treasurer |
|||||||||||

| Corporate Headquarters | Trading Symbol | Investor Relations | Inquiries | ||||||||
| 800 Boylston Street | BXP | BXP, Inc. | Inquiries should be directed to | ||||||||
| Suite 1900 | 800 Boylston Street, Suite 1900 | Helen Han | |||||||||
| Boston, MA 02199 | Stock Exchange Listing | Boston, MA 02199 | Vice President, Investor Relations | ||||||||
| www.bxp.com | New York Stock Exchange | investors.bxp.com | at 617.236.3429 or | ||||||||
| (t) 617.236.3300 | investorrelations@bxp.com | hhan@bxp.com | |||||||||
| (t) 617.236.3429 | |||||||||||
| Michael E. LaBelle | |||||||||||
| Executive Vice President, Chief Financial Officer | |||||||||||
| at 617.236.3352 or | |||||||||||
| mlabelle@bxp.com | |||||||||||
|
|
Q3 2025 | ||||
| Table of contents | |||||
| Page | |||||
| OVERVIEW | |||||
| Company Profile | |||||
| Guidance and assumptions | |||||
| FINANCIAL INFORMATION | |||||
| Financial Highlights | |||||
| Consolidated Balance Sheets | |||||
| Consolidated Income Statements | |||||
| Funds From Operations (FFO) | |||||
| Funds Available for Distribution (FAD) | |||||
| Net Operating Income (NOI) | |||||
| Same Property Net Operating Income (NOI) by Reportable Segment | |||||
| Capital Expenditures, Tenant Improvement Costs and Leasing Commissions | |||||
| Acquisitions and Dispositions | |||||
| DEVELOPMENT ACTIVITY | |||||
| Construction in Progress | |||||
| Land Parcels and Purchase Options | |||||
| LEASING ACTIVITY | |||||
| Leasing Activity | |||||
| PROPERTY STATISTICS | |||||
| Portfolio Overview | |||||
| Residential and Hotel Performance | |||||
| In-Service Property Listing | |||||
| Top 20 Clients Listing and Portfolio Client Diversification | |||||
| Occupancy by Location | |||||
| DEBT AND CAPITALIZATION | |||||
| Capital Structure | |||||
| Debt Analysis | |||||
| Senior Unsecured Debt Covenant Compliance Ratios | |||||
Net Debt to EBITDAre |
|||||
| Debt Ratios | |||||
| JOINT VENTURES | |||||
| Consolidated Joint Ventures | |||||
| Unconsolidated Joint Ventures | |||||
| LEASE EXPIRATION ROLL-OUT | |||||
| Total In-Service Properties | |||||
| Boston | |||||
| Los Angeles | |||||
| New York | |||||
| San Francisco | |||||
| Seattle | |||||
| Washington, DC | |||||
| CBD | |||||
| Suburban | |||||
| RESEARCH COVERAGE, DEFINITIONS AND RECONCILIATIONS | |||||
| Research Coverage | |||||
| Definitions | |||||
| Reconciliations | |||||
| Consolidated Income Statement - Prior Year | |||||
|
|
Q3 2025 | ||||
| Company profile | |||||
| Fiscal Year-End | December 31 | ||||
| Total Properties (includes unconsolidated joint ventures and properties under development/redevelopment) | 187 | ||||
| Total Square Feet (includes unconsolidated joint ventures and properties under development/redevelopment) | 54.6 million | ||||
Common shares outstanding, plus common units and LTIP units (other than unearned Multi-Year Long-Term Incentive Program (MYLTIP) Units) on an as-converted basis 1, 2 |
176.8 million | ||||
| Closing Price, at the end of the quarter | $74.34 per share | ||||
| Dividend - Quarter/Annualized | $0.70/$2.80 per share | ||||
| Dividend Yield | 3.8% | ||||
Consolidated Market Capitalization 2 |
$29.7 billion | ||||
BXP’s Share of Market Capitalization 2, 3 |
$29.8 billion | ||||
| Unsecured Senior Debt Ratings | BBB (S&P); Baa2 (Moody’s) | ||||
| Board of Directors | ||||||||||||||
| Owen D. Thomas | Chairman of the Board | Owen D. Thomas | Chief Executive Officer | |||||||||||
| Douglas T. Linde | Douglas T. Linde | President | ||||||||||||
| Joel I. Klein | Lead Independent Director | Raymond A. Ritchey | Senior Executive Vice President | |||||||||||
| Bruce W. Duncan | Chair of Audit Committee | Michael E. LaBelle | Executive Vice President, Chief Financial Officer and Treasurer | |||||||||||
| Diane J. Hoskins | Chair of Sustainability Committee | Rodney C. Diehl |
Executive Vice President, West Coast Regions | |||||||||||
| Mary E. Kipp | Donna D. Garesche | Executive Vice President, Chief Human Resources Officer | ||||||||||||
| Matthew J. Lustig | Chair of Nominating & Corporate | Bryan J. Koop | Executive Vice President, Boston Region | |||||||||||
| Governance Committee | Peter V. Otteni | Executive Vice President, Co-Head of the Washington, DC | ||||||||||||
Timothy J. Naughton |
Chair of Compensation Committee | Region | ||||||||||||
| Julie G. Richardson | Hilary J. Spann | Executive Vice President, New York Region | ||||||||||||
| William H. Walton, III | John J. Stroman | Executive Vice President, Co-Head of the Washington, DC | ||||||||||||
| Derek A. (Tony) West | Region | |||||||||||||
| Colin D. Joynt | Senior Vice President, Chief Information Officer |
|||||||||||||
| Eric G. Kevorkian | Senior Vice President, Chief Legal Officer and Secretary | |||||||||||||
| Michael R. Walsh | Senior Vice President, Chief Accounting Officer | |||||||||||||
| James J. Whalen | Senior Vice President, Chief Technology Officer |
|||||||||||||
|
|
Q3 2025 | ||||
| Guidance and assumptions | |||||
| Full Year 2025 | ||||||||||||||||||||
| Low | High | |||||||||||||||||||
| Projected EPS (diluted) | $ | 0.99 | $ | 1.02 | ||||||||||||||||
| Add: | ||||||||||||||||||||
| Projected Company share of real estate depreciation and amortization | 5.15 | 5.15 | ||||||||||||||||||
| Projected Company share of (gains)/losses on sales of real estate, gain on investment from unconsolidated joint venture and impairments | 0.75 | 0.75 | ||||||||||||||||||
| Projected FFO per share (diluted) | $ | 6.89 | $ | 6.92 | ||||||||||||||||
| Full Year 2025 | |||||||||||||||||
| Low | High | ||||||||||||||||
| Operating property activity: | |||||||||||||||||
Average In-service portfolio occupancy 1 |
86.50 | % | 87.50 | % | |||||||||||||
| Change in BXP’s Share of Same Property net operating income (excluding termination income) | — | % | 0.50 | % | |||||||||||||
| Change in BXP’s Share of Same Property net operating income - cash (excluding termination income) | 1.00 | % | 1.50 | % | |||||||||||||
BXP’s Share of Non Same Properties’ incremental contribution to net operating income over prior year (excluding asset sales) |
$ | 22,000 | $ | 24,000 | |||||||||||||
| Taking Buildings Out-of-Service | $ | (17,000) | $ | (16,000) | |||||||||||||
BXP’s Share of incremental net operating income related to asset sales over prior year |
$ | (4,000) | $ | (2,000) | |||||||||||||
BXP’s Share of straight-line rent and fair value lease revenue (non-cash revenue) |
$ | 105,000 | $ | 120,000 | |||||||||||||
| Termination income | $ | 6,000 | $ | 8,000 | |||||||||||||
| Other revenue (expense): | |||||||||||||||||
| Development, management services and other revenue | $ | 35,000 | $ | 37,000 | |||||||||||||
General and administrative expense 2 |
$ | (161,000) | $ | (158,000) | |||||||||||||
| Consolidated net interest expense | $ | (621,000) | $ | (617,000) | |||||||||||||
| Unconsolidated joint venture interest expense | $ | (75,000) | $ | (73,000) | |||||||||||||
| Noncontrolling interest: | |||||||||||||||||
| Noncontrolling interest in property partnerships’ share of FFO | $ | (166,000) | $ | (162,000) | |||||||||||||
|
|
Q3 2025 | ||||
| Financial highlights | |||||
| Three Months Ended | ||||||||||||||
| 30-Sep-25 | 30-Jun-25 | |||||||||||||
| Net income (loss) attributable to BXP, Inc. | $ | (121,712) | $ | 88,977 | ||||||||||
| Net income (loss) attributable to BXP, Inc. per share - diluted | $ | (0.77) | $ | 0.56 | ||||||||||
FFO attributable to BXP, Inc. 1 |
$ | 276,674 | $ | 271,652 | ||||||||||
Diluted FFO per share 1 |
$ | 1.74 | $ | 1.71 | ||||||||||
| Dividends per common share | $ | 0.70 | $ | 0.98 | ||||||||||
Funds available for distribution to common shareholders and common unitholders (FAD) 2 |
$ | 201,772 | $ | 203,592 | ||||||||||
| Selected items: | ||||||||||||||
| Revenue | $ | 871,510 | $ | 868,457 | ||||||||||
| Recoveries from clients | $ | 146,082 | $ | 141,725 | ||||||||||
| Service income from clients | $ | 2,786 | $ | 2,848 | ||||||||||
BXP’s Share of revenue 3 |
$ | 839,345 | $ | 835,667 | ||||||||||
BXP’s Share of straight-line rent 3 |
$ | 23,859 | $ | 20,535 | ||||||||||
BXP’s Share of fair value lease revenue 3, 4 |
$ | 3,019 | $ | 3,029 | ||||||||||
BXP’s Share of termination income 3 |
$ | 1,382 | $ | 763 | ||||||||||
| Ground rent expense | $ | 3,777 | $ | 3,612 | ||||||||||
| Capitalized interest | $ | 13,491 | $ | 12,148 | ||||||||||
| Capitalized wages | $ | 3,657 | $ | 4,733 | ||||||||||
Loss from unconsolidated joint ventures 5 |
$ | (148,329) | $ | (3,324) | ||||||||||
BXP’s share of FFO from unconsolidated joint ventures 6 |
$ | 11,840 | $ | 13,350 | ||||||||||
| Net income attributable to noncontrolling interests in property partnerships | $ | 17,853 | $ | 20,100 | ||||||||||
FFO attributable to noncontrolling interests in property partnerships 7 |
$ | 40,468 | $ | 41,045 | ||||||||||
| Balance Sheet items: | ||||||||||||||
| Above-market rents (included within Prepaid Expenses and Other Assets) | $ | 5,619 | $ | 6,214 | ||||||||||
| Below-market rents (included within Other Liabilities) | $ | 21,290 | $ | 23,792 | ||||||||||
| Accrued rental income liability (included within Other Liabilities) | $ | 101,001 | $ | 108,834 | ||||||||||
| Ratios: | ||||||||||||||
Interest Coverage Ratio (excluding capitalized interest) 8 |
2.78 | 2.85 | ||||||||||||
Interest Coverage Ratio (including capitalized interest) 8 |
2.56 | 2.62 | ||||||||||||
Fixed Charge Coverage Ratio 8 |
2.25 | 2.23 | ||||||||||||
BXP’s Share of Net Debt to BXP’s Share of EBITDAre (Annualized) 9 |
8.21 | 8.18 | ||||||||||||
Change in BXP’s Share of Same Property Net Operating Income (NOI) (excluding termination income) 10 |
1.7 | % | (0.2) | % | ||||||||||
Change in BXP’s Share of Same Property NOI (excluding termination income) - cash 10 |
2.6 | % | 1.7 | % | ||||||||||
FAD Payout Ratio 2 |
61.37 | % | 85.15 | % | ||||||||||
| Operating Margins [(rental revenue - rental expense)/rental revenue] | 60.8 | % | 60.5 | % | ||||||||||
Occupancy % of In-Service Properties 11 |
86.0 | % | 86.4 | % | ||||||||||
Leased % of In-Service Properties 12 |
88.8 | % | 89.1 | % | ||||||||||
| Capitalization: | ||||||||||||||
| Consolidated Debt | $ | 16,604,696 | $ | 15,811,005 | ||||||||||
BXP’s Share of Debt 13 |
$ | 16,613,274 | $ | 15,833,687 | ||||||||||
| Consolidated Market Capitalization | $ | 29,747,934 | $ | 27,739,296 | ||||||||||
| Consolidated Debt/Consolidated Market Capitalization | 55.82 | % | 57.00 | % | ||||||||||
BXP’s Share of Market Capitalization 13 |
$ | 29,756,512 | $ | 27,761,978 | ||||||||||
BXP’s Share of Debt/BXP’s Share of Market Capitalization 13 |
55.83 | % | 57.03 | % | ||||||||||
|
|
Q3 2025 | ||||
| Financial highlights (continued) | |||||
|
|
Q3 2025 | ||||
| Consolidated Balance Sheets | |||||
| 30-Sep-25 | 30-Jun-25 | |||||||||||||
| ASSETS | ||||||||||||||
| Real estate | $ | 26,718,660 | $ | 26,632,189 | ||||||||||
| Construction in progress | 1,322,608 | 1,047,687 | ||||||||||||
| Land held for future development | 568,516 | 748,198 | ||||||||||||
| Right of use assets - finance leases | 372,747 | 372,839 | ||||||||||||
| Right of use assets - operating leases | 321,063 | 325,670 | ||||||||||||
| Less accumulated depreciation | (8,008,908) | (7,863,743) | ||||||||||||
| Total real estate | 21,294,686 | 21,262,840 | ||||||||||||
| Cash and cash equivalents | 861,066 | 446,953 | ||||||||||||
| Cash held in escrows | 77,663 | 80,888 | ||||||||||||
| Investments in securities | 43,604 | 41,062 | ||||||||||||
| Tenant and other receivables, net | 136,743 | 109,683 | ||||||||||||
| Note receivable, net | 8,898 | 6,711 | ||||||||||||
| Related party note receivables, net | 88,879 | 88,825 | ||||||||||||
| Sales-type lease receivable, net | 15,430 | 15,188 | ||||||||||||
| Accrued rental income, net | 1,532,403 | 1,509,347 | ||||||||||||
| Deferred charges, net | 802,785 | 809,033 | ||||||||||||
| Prepaid expenses and other assets | 137,561 | 89,624 | ||||||||||||
| Investments in unconsolidated joint ventures | 999,764 | 1,161,036 | ||||||||||||
| Total assets | $ | 25,999,482 | $ | 25,621,190 | ||||||||||
| LIABILITIES AND EQUITY | ||||||||||||||
| Liabilities: | ||||||||||||||
| Mortgage notes payable, net | $ | 4,279,482 | $ | 4,278,788 | ||||||||||
| Unsecured senior notes, net | 9,803,336 | 9,800,577 | ||||||||||||
| Unsecured exchangeable senior notes, net | 975,080 | — | ||||||||||||
| Unsecured line of credit | — | 185,000 | ||||||||||||
| Unsecured term loans, net | 796,798 | 796,640 | ||||||||||||
| Unsecured commercial paper | 750,000 | 750,000 | ||||||||||||
| Lease liabilities - finance leases | 363,207 | 365,897 | ||||||||||||
| Lease liabilities - operating leases | 379,792 | 399,174 | ||||||||||||
| Accounts payable and accrued expenses | 484,798 | 480,158 | ||||||||||||
| Dividends and distributions payable | 123,259 | 172,732 | ||||||||||||
| Accrued interest payable | 120,128 | 120,975 | ||||||||||||
| Other liabilities | 406,820 | 416,838 | ||||||||||||
| Total liabilities | 18,482,700 | 17,766,779 | ||||||||||||
| Commitments and contingencies | — | — | ||||||||||||
| Redeemable deferred stock units | 8,006 | 6,981 | ||||||||||||
| Equity: | ||||||||||||||
| Stockholders’ equity attributable to BXP, Inc.: | ||||||||||||||
| Excess stock, $0.01 par value, 150,000,000 shares authorized, none issued or outstanding | — | — | ||||||||||||
Common stock, $0.01 par value, 250,000,000 shares authorized, 158,479,314 and 158,445,177 issued and 158,400,414 and 158,366,277 outstanding at September 30, 2025 and June 30, 2025, respectively |
1,584 | 1,584 | ||||||||||||
| Additional paid-in capital | 6,827,889 | 6,854,753 | ||||||||||||
| Dividends in excess of earnings | (1,812,361) | (1,579,770) | ||||||||||||
Treasury common stock at cost, 78,900 shares at September 30, 2025 and June 30, 2025 |
(2,722) | (2,722) | ||||||||||||
| Accumulated other comprehensive loss | (14,831) | (15,059) | ||||||||||||
| Total stockholders’ equity attributable to BXP, Inc. | 4,999,559 | 5,258,786 | ||||||||||||
| Noncontrolling interests: | ||||||||||||||
| Common units of the Operating Partnership | 554,440 | 584,651 | ||||||||||||
| Property partnerships | 1,954,777 | 2,003,993 | ||||||||||||
| Total equity | 7,508,776 | 7,847,430 | ||||||||||||
| Total liabilities and equity | $ | 25,999,482 | $ | 25,621,190 | ||||||||||
|
|
Q3 2025 | ||||
| Consolidated Income Statements | |||||
| Three Months Ended | ||||||||||||||
| 30-Sep-25 | 30-Jun-25 | |||||||||||||
| Revenue | ||||||||||||||
| Lease | $ | 809,820 | $ | 805,935 | ||||||||||
| Parking and other | 34,404 | 34,709 | ||||||||||||
| Insurance proceeds | 986 | 90 | ||||||||||||
| Hotel revenue | 13,162 | 14,773 | ||||||||||||
| Development and management services | 9,317 | 8,846 | ||||||||||||
| Direct reimbursements of payroll and related costs from management services contracts | 3,821 | 4,104 | ||||||||||||
| Total revenue | 871,510 | 868,457 | ||||||||||||
| Expenses | ||||||||||||||
| Operating | 187,820 | 184,942 | ||||||||||||
| Real estate taxes | 142,992 | 146,272 | ||||||||||||
| Restoration expenses related to insurance claims | 924 | 848 | ||||||||||||
| Hotel operating | 9,628 | 9,365 | ||||||||||||
General and administrative 1 |
36,188 | 42,516 | ||||||||||||
| Payroll and related costs from management services contracts | 3,821 | 4,104 | ||||||||||||
| Transaction costs | 1,431 | 357 | ||||||||||||
| Depreciation and amortization | 236,147 | 223,819 | ||||||||||||
| Total expenses | 618,951 | 612,223 | ||||||||||||
| Other income (expense) | ||||||||||||||
Loss from unconsolidated joint ventures 2 |
(148,329) | (3,324) | ||||||||||||
| Gains on sales of real estate | 1,932 | 18,390 | ||||||||||||
Gains from investments in securities 1 |
2,400 | 2,600 | ||||||||||||
| Unrealized gain (loss) on non-real estate investments | 178 | (39) | ||||||||||||
| Interest and other income (loss) | 7,620 | 8,063 | ||||||||||||
Impairment losses 3 |
(68,901) | — | ||||||||||||
| Interest expense | (164,299) | (162,783) | ||||||||||||
| Net income (loss) | (116,840) | 119,141 | ||||||||||||
| Net (income) loss attributable to noncontrolling interests | ||||||||||||||
| Noncontrolling interest in property partnerships | (17,853) | (20,100) | ||||||||||||
Noncontrolling interest - common units of the Operating Partnership 4 |
12,981 | (10,064) | ||||||||||||
| Net income (loss) attributable to BXP, Inc. | $ | (121,712) | $ | 88,977 | ||||||||||
| INCOME PER SHARE OF COMMON STOCK (EPS) | ||||||||||||||
| Net income (loss) attributable to BXP, Inc. per share - basic | $ | (0.77) | $ | 0.56 | ||||||||||
| Net income (loss) attributable to BXP, Inc. per share - diluted | $ | (0.77) | $ | 0.56 | ||||||||||
|
|
Q3 2025 | ||||
Funds from operations (FFO) 1 | |||||
| Three Months Ended | ||||||||||||||
| 30-Sep-25 | 30-Jun-25 | |||||||||||||
| Net income (loss) attributable to BXP, Inc. | $ | (121,712) | $ | 88,977 | ||||||||||
| Add: | ||||||||||||||
| Noncontrolling interest - common units of the Operating Partnership | (12,981) | 10,064 | ||||||||||||
| Noncontrolling interests in property partnerships | 17,853 | 20,100 | ||||||||||||
| Net income (loss) | (116,840) | 119,141 | ||||||||||||
| Add: | ||||||||||||||
| Depreciation and amortization expense | 236,147 | 223,819 | ||||||||||||
Noncontrolling interests in property partnerships' share of depreciation and amortization 2 |
(22,615) | (20,945) | ||||||||||||
BXP's share of depreciation and amortization from unconsolidated joint ventures 3 |
17,272 | 16,674 | ||||||||||||
| Corporate-related depreciation and amortization | (582) | (600) | ||||||||||||
| Non-real estate related amortization | 2,130 | 2,131 | ||||||||||||
| Impairment losses | 68,901 | — | ||||||||||||
Impairment loss included within loss from unconsolidated joint ventures 3 |
145,133 | — | ||||||||||||
| Less: | ||||||||||||||
| Gains on sales of real estate | 1,932 | 18,390 | ||||||||||||
Gain on sale / consolidation included within loss from unconsolidated joint ventures 3 |
2,236 | — | ||||||||||||
| Unrealized gain (loss) on non-real estate investments | 178 | (39) | ||||||||||||
| Noncontrolling interests in property partnerships | 17,853 | 20,100 | ||||||||||||
| FFO attributable to the Operating Partnership (including BXP, Inc.) (Basic FFO) | 307,347 | 301,769 | ||||||||||||
| Less: | ||||||||||||||
| Noncontrolling interest - common units of the Operating Partnership’s share of FFO | 30,673 | 30,117 | ||||||||||||
| FFO attributable to BXP, Inc. | $ | 276,674 | $ | 271,652 | ||||||||||
| BXP, Inc.’s percentage share of Basic FFO | 90.02 | % | 90.02 | % | ||||||||||
| Noncontrolling interest’s - common unitholders percentage share of Basic FFO | 9.98 | % | 9.98 | % | ||||||||||
| Basic FFO per share | $ | 1.75 | $ | 1.72 | ||||||||||
| Weighted average shares outstanding - basic | 158,345 | 158,312 | ||||||||||||
| Diluted FFO per share | $ | 1.74 | $ | 1.71 | ||||||||||
| Weighted average shares outstanding - diluted | 158,928 | 158,795 | ||||||||||||
| Three Months Ended | ||||||||||||||
| 30-Sep-25 | 30-Jun-25 | |||||||||||||
| Basic FFO | $ | 307,347 | $ | 301,769 | ||||||||||
| Add: | ||||||||||||||
| Effect of dilutive securities - stock-based compensation | — | — | ||||||||||||
| Diluted FFO | 307,347 | 301,769 | ||||||||||||
| Less: | ||||||||||||||
| Noncontrolling interest - common units of the Operating Partnership’s share of diluted FFO | 30,581 | 30,056 | ||||||||||||
| BXP, Inc.’s share of Diluted FFO | $ | 276,766 | $ | 271,713 | ||||||||||
| Three Months Ended | ||||||||||||||
| 30-Sep-25 | 30-Jun-25 | |||||||||||||
| Shares/units for Basic FFO | 175,901 | 175,871 | ||||||||||||
| Add: | ||||||||||||||
| Effect of dilutive securities - stock-based compensation (shares/units) | 583 | 483 | ||||||||||||
| Shares/units for Diluted FFO | 176,484 | 176,354 | ||||||||||||
| Less: | ||||||||||||||
| Noncontrolling interest - common units of the Operating Partnership’s share of Diluted FFO (shares/units) | 17,556 | 17,559 | ||||||||||||
| BXP, Inc.’s share of shares/units for Diluted FFO | 158,928 | 158,795 | ||||||||||||
| BXP, Inc.’s percentage share of Diluted FFO | 90.05 | % | 90.04 | % | ||||||||||
|
|
Q3 2025 | ||||
Funds available for distributions (FAD) 1 | |||||
| Three Months Ended | ||||||||||||||
| 30-Sep-25 | 30-Jun-25 | |||||||||||||
| Net income (loss) attributable to BXP, Inc. | $ | (121,712) | $ | 88,977 | ||||||||||
| Add: | ||||||||||||||
| Noncontrolling interest - common units of the Operating Partnership | (12,981) | 10,064 | ||||||||||||
| Noncontrolling interests in property partnerships | 17,853 | 20,100 | ||||||||||||
| Net income (loss) | (116,840) | 119,141 | ||||||||||||
| Add: | ||||||||||||||
| Depreciation and amortization expense | 236,147 | 223,819 | ||||||||||||
Noncontrolling interests in property partnerships’ share of depreciation and amortization 2 |
(22,615) | (20,945) | ||||||||||||
BXP’s share of depreciation and amortization from unconsolidated joint ventures 3 |
17,272 | 16,674 | ||||||||||||
| Corporate-related depreciation and amortization | (582) | (600) | ||||||||||||
| Non-real estate related amortization | 2,130 | 2,131 | ||||||||||||
Impairment loss included within loss from unconsolidated joint ventures 3 |
145,133 | — | ||||||||||||
| Impairment losses | 68,901 | — | ||||||||||||
| Less: | ||||||||||||||
| Gains on sales of real estate | 1,932 | 18,390 | ||||||||||||
Gain on sale / consolidation included within loss from unconsolidated joint ventures 3 |
2,236 | — | ||||||||||||
| Unrealized gain (loss) on non-real estate investments | 178 | (39) | ||||||||||||
| Noncontrolling interests in property partnerships | 17,853 | 20,100 | ||||||||||||
| Basic FFO | 307,347 | 301,769 | ||||||||||||
| Add: | ||||||||||||||
BXP’s Share of lease transaction costs that qualify as rent inducements 1, 4 |
4,999 | 3,482 | ||||||||||||
BXP’s Share of hedge amortization, net of costs 1 |
1,781 | 1,808 | ||||||||||||
BXP’s Share of fair value interest adjustment 1 |
638 | 1,217 | ||||||||||||
BXP’s Share of straight-line ground rent expense adjustment 1, 5 |
(407) | 584 | ||||||||||||
| Stock-based compensation | 4,404 | 11,612 | ||||||||||||
| Non-real estate depreciation and amortization | (1,548) | (1,531) | ||||||||||||
Unearned portion of capitalized fees from consolidated joint ventures 6 |
938 | 969 | ||||||||||||
| Non-cash loss from early extinguishments of debt | — | — | ||||||||||||
| Less: | ||||||||||||||
BXP’s Share of straight-line rent 1 |
23,859 | 20,535 | ||||||||||||
BXP’s Share of fair value lease revenue 1, 7 |
3,019 | 3,029 | ||||||||||||
BXP’s Share of non-cash termination income adjustment (fair value lease amounts) 1 |
— | — | ||||||||||||
BXP’s Share of 2nd generation tenant improvements and leasing commissions 1 |
64,715 | 61,423 | ||||||||||||
BXP’s Share of maintenance capital expenditures 1, 8 |
23,341 | 30,211 | ||||||||||||
BXP’s Share of amortization and accretion related to sales type lease 1 |
265 | 261 | ||||||||||||
| Hotel improvements, equipment upgrades and replacements | 1,181 | 859 | ||||||||||||
Funds available for distribution to common shareholders and common unitholders (FAD) (A) |
$ | 201,772 | $ | 203,592 | ||||||||||
Distributions to common shareholders and unitholders (excluding any special distributions) (B) 9 |
123,830 | 173,357 | ||||||||||||
FAD Payout Ratio1 (B÷A) |
61.37 | % | 85.15 | % | ||||||||||
|
|
Q3 2025 | ||||
| Reconciliation of net income attributable to BXP, Inc. to BXP’s Share of same property net operating income (NOI) | |||||
| Three Months Ended | ||||||||||||||
| 30-Sep-25 | 30-Sep-24 | |||||||||||||
| Net income (loss) attributable to BXP, Inc. | $ | (121,712) | $ | 83,628 | ||||||||||
| Net (income) loss attributable to noncontrolling interests | ||||||||||||||
| Noncontrolling interest - common units of the Operating Partnership | (12,981) | 9,587 | ||||||||||||
| Noncontrolling interest in property partnerships | 17,853 | 15,237 | ||||||||||||
| Net income (loss) | (116,840) | 108,452 | ||||||||||||
| Add: | ||||||||||||||
| Interest expense | 164,299 | 163,194 | ||||||||||||
| Impairment losses | 68,901 | — | ||||||||||||
| Loss from unconsolidated joint ventures | 148,329 | 7,011 | ||||||||||||
| Depreciation and amortization expense | 236,147 | 222,890 | ||||||||||||
| Transaction costs | 1,431 | 188 | ||||||||||||
| Payroll and related costs from management services contracts | 3,821 | 3,649 | ||||||||||||
| General and administrative expense | 36,188 | 33,352 | ||||||||||||
| Less: | ||||||||||||||
| Interest and other income (loss) | 7,620 | 14,430 | ||||||||||||
| Unrealized gain on non-real estate investments | 178 | 94 | ||||||||||||
| Gains from investments in securities | 2,400 | 2,198 | ||||||||||||
| Gains on sales of real estate | 1,932 | 517 | ||||||||||||
| Direct reimbursements of payroll and related costs from management services contracts | 3,821 | 3,649 | ||||||||||||
| Development and management services revenue | 9,317 | 6,770 | ||||||||||||
| Net Operating Income (NOI) | 517,008 | 511,078 | ||||||||||||
| Add: | ||||||||||||||
BXP’s share of NOI from unconsolidated joint ventures 1 |
30,675 | 31,919 | ||||||||||||
| Less: | ||||||||||||||
Partners’ share of NOI from consolidated joint ventures (after income allocation to private REIT shareholders) 2 |
51,504 | 44,487 | ||||||||||||
| BXP’s Share of NOI | 496,179 | 498,510 | ||||||||||||
| Less: | ||||||||||||||
| Termination income | 1,241 | 12,120 | ||||||||||||
BXP’s share of termination income from unconsolidated joint ventures 1 |
141 | 77 | ||||||||||||
| Add: | ||||||||||||||
Partners’ share of termination income from consolidated joint ventures 2 |
— | 18 | ||||||||||||
| BXP’s Share of NOI (excluding termination income) | $ | 494,797 | $ | 486,331 | ||||||||||
| Net Operating Income (NOI) | $ | 517,008 | $ | 511,078 | ||||||||||
| Less: | ||||||||||||||
| Termination income | 1,241 | 12,120 | ||||||||||||
NOI from non Same Properties (excluding termination income) 3 |
9,642 | 4,808 | ||||||||||||
| Same Property NOI (excluding termination income) | 506,125 | 494,150 | ||||||||||||
| Less: | ||||||||||||||
Partners’ share of NOI from consolidated joint ventures (excluding termination income and after income allocation to private REIT shareholders) 2 |
51,504 | 44,469 | ||||||||||||
| Add: | ||||||||||||||
Partners’ share of NOI from non Same Properties from consolidated joint ventures (excluding termination income and after income allocation to private REIT shareholders) 3 |
4,442 | — | ||||||||||||
BXP’s share of NOI from unconsolidated joint ventures (excluding termination income) 1 |
30,534 | 31,842 | ||||||||||||
| Less: | ||||||||||||||
BXP’s share of NOI from non Same Properties from unconsolidated joint ventures (excluding termination income) 3 |
11 | 274 | ||||||||||||
| BXP’s Share of Same Property NOI (excluding termination income) | $ | 489,586 | $ | 481,249 | ||||||||||
|
|
Q3 2025 | ||||
| Reconciliation of net income attributable to BXP, Inc. to BXP’s Share of same property net operating income (NOI) - cash | |||||
| Three Months Ended | ||||||||||||||
| 30-Sep-25 | 30-Sep-24 | |||||||||||||
| Net income (loss) attributable to BXP, Inc. | $ | (121,712) | $ | 83,628 | ||||||||||
| Net (income) loss attributable to noncontrolling interests | ||||||||||||||
| Noncontrolling interest - common units of the Operating Partnership | (12,981) | 9,587 | ||||||||||||
| Noncontrolling interest in property partnerships | 17,853 | 15,237 | ||||||||||||
| Net income (loss) | (116,840) | 108,452 | ||||||||||||
| Add: | ||||||||||||||
| Interest expense | 164,299 | 163,194 | ||||||||||||
| Impairment losses | 68,901 | — | ||||||||||||
| Loss from unconsolidated joint ventures | 148,329 | 7,011 | ||||||||||||
| Depreciation and amortization expense | 236,147 | 222,890 | ||||||||||||
| Transaction costs | 1,431 | 188 | ||||||||||||
| Payroll and related costs from management services contracts | 3,821 | 3,649 | ||||||||||||
| General and administrative expense | 36,188 | 33,352 | ||||||||||||
| Less: | ||||||||||||||
| Interest and other income (loss) | 7,620 | 14,430 | ||||||||||||
| Unrealized gain on non-real estate investments | 178 | 94 | ||||||||||||
| Gains from investments in securities | 2,400 | 2,198 | ||||||||||||
| Gains on sales of real estate | 1,932 | 517 | ||||||||||||
| Direct reimbursements of payroll and related costs from management services contracts | 3,821 | 3,649 | ||||||||||||
| Development and management services revenue | 9,317 | 6,770 | ||||||||||||
| Net Operating Income (NOI) | 517,008 | 511,078 | ||||||||||||
| Less: | ||||||||||||||
| Straight-line rent | 30,105 | 29,578 | ||||||||||||
| Fair value lease revenue | 1,906 | 1,298 | ||||||||||||
| Amortization and accretion related to sales type lease | 236 | 250 | ||||||||||||
| Termination income | 1,241 | 12,120 | ||||||||||||
| Add: | ||||||||||||||
Straight-line ground rent expense adjustment 1 |
531 | 585 | ||||||||||||
Lease transaction costs that qualify as rent inducements 2 |
5,894 | 4,983 | ||||||||||||
| NOI - cash (excluding termination income) | 489,945 | 473,400 | ||||||||||||
| Less: | ||||||||||||||
NOI - cash from non Same Properties (excluding termination income) 3 |
6,681 | 5,228 | ||||||||||||
| Same Property NOI - cash (excluding termination income) | 483,264 | 468,172 | ||||||||||||
| Less: | ||||||||||||||
Partners’ share of NOI - cash from consolidated joint ventures (excluding termination income and after income allocation to private REIT shareholders) 4 |
44,504 | 38,849 | ||||||||||||
| Add: | ||||||||||||||
Partners’ share of NOI - cash from non Same Properties from consolidated joint ventures (excluding termination income and after income allocation to private REIT shareholders) 3 |
3,143 | — | ||||||||||||
BXP’s share of NOI - cash from unconsolidated joint ventures (excluding termination income) 5 |
27,866 | 29,568 | ||||||||||||
| Less: | ||||||||||||||
BXP’s share of NOI - cash from non Same Properties from unconsolidated joint ventures (excluding termination income) 3 |
(1,154) | 57 | ||||||||||||
| BXP’s Share of Same Property NOI - cash (excluding termination income) | $ | 470,923 | $ | 458,834 | ||||||||||
|
|
Q3 2025 | ||||
| Same property net operating income (NOI) by reportable segment | |||||
Office 1 |
Hotel & Residential | ||||||||||||||||||||||||||||||||||||||||||||||
| Three Months Ended | $ | % | Three Months Ended | $ | % | ||||||||||||||||||||||||||||||||||||||||||
| 30-Sep-25 | 30-Sep-24 | Change | Change | 30-Sep-25 | 30-Sep-24 | Change | Change | ||||||||||||||||||||||||||||||||||||||||
Rental Revenue 2 |
$ | 815,032 | $ | 803,593 | $ | 26,007 | $ | 27,199 | |||||||||||||||||||||||||||||||||||||||
| Less: Termination income | 1,241 | 5,140 | — | — | |||||||||||||||||||||||||||||||||||||||||||
Rental revenue (excluding termination income) 2 |
813,791 | 798,453 | $ | 15,338 | 1.9 | % | 26,007 | 27,199 | $ | (1,192) | (4.4) | % | |||||||||||||||||||||||||||||||||||
| Less: Operating expenses and real estate taxes | 317,950 | 315,681 | 2,269 | 0.7 | % | 15,723 | 15,821 | (98) | (0.6) | % | |||||||||||||||||||||||||||||||||||||
NOI (excluding termination income) 2, 3 |
$ | 495,841 | $ | 482,772 | $ | 13,069 | 2.7 | % | $ | 10,284 | $ | 11,378 | $ | (1,094) | (9.6) | % | |||||||||||||||||||||||||||||||
Rental revenue (excluding termination income) 2 |
$ | 813,791 | $ | 798,453 | $ | 15,338 | 1.9 | % | $ | 26,007 | $ | 27,199 | $ | (1,192) | (4.4) | % | |||||||||||||||||||||||||||||||
| Less: Straight-line rent and fair value lease revenue and amortization and accretion from sales-type lease | 29,149 | 31,399 | (2,250) | (7.2) | % | 137 | 147 | (10) | (6.8) | % | |||||||||||||||||||||||||||||||||||||
Add: Lease transaction costs that qualify as rent inducements 4 |
5,745 | 4,834 | 911 | 18.8 | % | 149 | 149 | — | — | % | |||||||||||||||||||||||||||||||||||||
| Subtotal | 790,387 | 771,888 | 18,499 | 2.4 | % | 26,019 | 27,201 | (1,182) | (4.3) | % | |||||||||||||||||||||||||||||||||||||
| Less: Operating expenses and real estate taxes | 317,950 | 315,681 | 2,269 | 0.7 | % | 15,723 | 15,821 | (98) | (0.6) | % | |||||||||||||||||||||||||||||||||||||
Add: Straight-line ground rent expense 5 |
531 | 585 | (54) | (9.2) | % | — | — | — | — | % | |||||||||||||||||||||||||||||||||||||
NOI - cash (excluding termination income) 2, 3 |
$ | 472,968 | $ | 456,792 | $ | 16,176 | 3.5 | % | $ | 10,296 | $ | 11,380 | $ | (1,084) | (9.5) | % | |||||||||||||||||||||||||||||||
Consolidated Total 1 (A) |
BXP’s share of Unconsolidated Joint Ventures (B) | ||||||||||||||||||||||||||||||||||||||||||||||
| Three Months Ended | $ | % | Three Months Ended | $ | % | ||||||||||||||||||||||||||||||||||||||||||
| 30-Sep-25 | 30-Sep-24 | Change | Change | 30-Sep-25 | 30-Sep-24 | Change | Change | ||||||||||||||||||||||||||||||||||||||||
Rental Revenue 2 |
$ | 841,039 | $ | 830,792 | $ | 51,833 | $ | 53,878 | |||||||||||||||||||||||||||||||||||||||
| Less: Termination income | 1,241 | 5,140 | 141 | 77 | |||||||||||||||||||||||||||||||||||||||||||
Rental revenue (excluding termination income) 2 |
839,798 | 825,652 | $ | 14,146 | 1.7 | % | 51,692 | 53,801 | $ | (2,109) | (3.9) | % | |||||||||||||||||||||||||||||||||||
| Less: Operating expenses and real estate taxes | 333,673 | 331,502 | 2,171 | 0.7 | % | 21,169 | 22,233 | (1,064) | (4.8) | % | |||||||||||||||||||||||||||||||||||||
NOI (excluding termination income) 2, 3 |
$ | 506,125 | $ | 494,150 | $ | 11,975 | 2.4 | % | $ | 30,523 | $ | 31,568 | $ | (1,045) | (3.3) | % | |||||||||||||||||||||||||||||||
Rental revenue (excluding termination income) 2 |
$ | 839,798 | $ | 825,652 | $ | 14,146 | 1.7 | % | $ | 51,692 | $ | 53,801 | $ | (2,109) | (3.9) | % | |||||||||||||||||||||||||||||||
| Less: Straight-line rent and fair value lease revenue and amortization and accretion from sales-type lease | 29,286 | 31,546 | (2,260) | (7.2) | % | 1,626 | 2,195 | (569) | (25.9) | % | |||||||||||||||||||||||||||||||||||||
Add: Lease transaction costs that qualify as rent inducements 4 |
5,894 | 4,983 | 911 | 18.3 | % | — | — | — | — | % | |||||||||||||||||||||||||||||||||||||
| Subtotal | 816,406 | 799,089 | 17,317 | 2.2 | % | 50,066 | 51,606 | (1,540) | (3.0) | % | |||||||||||||||||||||||||||||||||||||
| Less: Operating expenses and real estate taxes | 333,673 | 331,502 | 2,171 | 0.7 | % | 21,169 | 22,233 | (1,064) | (4.8) | % | |||||||||||||||||||||||||||||||||||||
Add: Straight-line ground rent expense 5 |
531 | 585 | (54) | (9.2) | % | 123 | 138 | (15) | (10.9) | % | |||||||||||||||||||||||||||||||||||||
NOI - cash (excluding termination income) 2, 3 |
$ | 483,264 | $ | 468,172 | $ | 15,092 | 3.2 | % | $ | 29,020 | $ | 29,511 | $ | (491) | (1.7) | % | |||||||||||||||||||||||||||||||
Partners’ share of Consolidated Joint Ventures (C) |
BXP’s Share 2, 6 |
||||||||||||||||||||||||||||||||||||||||||||||
| Three Months Ended | $ | % | Three Months Ended | $ | % | ||||||||||||||||||||||||||||||||||||||||||
| 30-Sep-25 | 30-Sep-24 | Change | Change | 30-Sep-25 | 30-Sep-24 | Change | Change | ||||||||||||||||||||||||||||||||||||||||
Rental Revenue 2 |
$ | 82,803 | $ | 78,919 | $ | 810,069 | $ | 805,751 | |||||||||||||||||||||||||||||||||||||||
| Less: Termination income | — | 18 | 1,382 | 5,199 | |||||||||||||||||||||||||||||||||||||||||||
Rental revenue (excluding termination income) 2 |
82,803 | 78,901 | $ | 3,902 | 4.9 | % | 808,687 | 800,552 | $ | 8,135 | 1.0 | % | |||||||||||||||||||||||||||||||||||
| Less: Operating expenses and real estate taxes | 35,741 | 34,432 | 1,309 | 3.8 | % | 319,101 | 319,303 | (202) | (0.1) | % | |||||||||||||||||||||||||||||||||||||
NOI (excluding termination income) 2, 3 |
$ | 47,062 | $ | 44,469 | $ | 2,593 | 5.8 | % | $ | 489,586 | $ | 481,249 | $ | 8,337 | 1.7 | % | |||||||||||||||||||||||||||||||
Rental revenue (excluding termination income) 2 |
$ | 82,803 | $ | 78,901 | $ | 3,902 | 4.9 | % | $ | 808,687 | $ | 800,552 | $ | 8,135 | 1.0 | % | |||||||||||||||||||||||||||||||
| Less: Straight-line rent and fair value lease revenue and amortization and accretion from sales-type lease | 6,596 | 5,533 | 1,063 | 19.2 | % | 24,316 | 28,208 | (3,892) | (13.8) | % | |||||||||||||||||||||||||||||||||||||
Add: Lease transaction costs that qualify as rent inducements 4 |
895 | (87) | 982 | 1,128.7 | % | 4,999 | 5,070 | (71) | (1.4) | % | |||||||||||||||||||||||||||||||||||||
| Subtotal | 77,102 | 73,281 | 3,821 | 5.2 | % | 789,370 | 777,414 | 11,956 | 1.5 | % | |||||||||||||||||||||||||||||||||||||
| Less: Operating expenses and real estate taxes | 35,741 | 34,432 | 1,309 | 3.8 | % | 319,101 | 319,303 | (202) | (0.1) | % | |||||||||||||||||||||||||||||||||||||
Add: Straight-line ground rent expense 5 |
— | — | — | — | % | 654 | 723 | (69) | (9.5) | % | |||||||||||||||||||||||||||||||||||||
NOI - cash (excluding termination income) 2, 3 |
$ | 41,361 | $ | 38,849 | $ | 2,512 | 6.5 | % | $ | 470,923 | $ | 458,834 | $ | 12,089 | 2.6 | % | |||||||||||||||||||||||||||||||
|
|
Q3 2025 | ||||
| Same property net operating income (NOI) by reportable segment (continued) | |||||
|
|
Q3 2025 | ||||
| Capital expenditures, tenant improvement costs and leasing commissions | |||||
| Three Months Ended | ||||||||||||||
| 30-Sep-25 | 30-Jun-25 | |||||||||||||
| Maintenance capital expenditures | $ | 25,996 | $ | 32,934 | ||||||||||
| Planned capital expenditures associated with acquisition properties | 5,020 | 5,977 | ||||||||||||
| Repositioning capital expenditures | 10,084 | 13,150 | ||||||||||||
| Hotel improvements, equipment upgrades and replacements | 1,181 | 859 | ||||||||||||
| Subtotal | 42,281 | 52,920 | ||||||||||||
| Add: | ||||||||||||||
| BXP’s share of maintenance capital expenditures from unconsolidated joint ventures (JVs) | 349 | 703 | ||||||||||||
| BXP’s share of planned capital expenditures associated with acquisition properties from unconsolidated JVs | 116 | (85) | ||||||||||||
| BXP’s share of repositioning capital expenditures from unconsolidated JVs | — | — | ||||||||||||
| Less: | ||||||||||||||
| Partners’ share of maintenance capital expenditures from consolidated JVs | 3,004 | 3,426 | ||||||||||||
| Partners’ share of planned capital expenditures associated with acquisition properties from consolidated JVs | — | — | ||||||||||||
| Partners’ share of repositioning capital expenditures from consolidated JVs | 2 | 23 | ||||||||||||
BXP’s Share of Capital Expenditures 1 |
$ | 39,740 | $ | 50,089 | ||||||||||
| Three Months Ended | ||||||||||||||
| 30-Sep-25 | 30-Jun-25 | |||||||||||||
| Square feet | 957,858 | 852,284 | ||||||||||||
| Tenant improvements and lease commissions PSF | $ | 77.47 | $ | 85.84 | ||||||||||
|
|
Q3 2025 | ||||
| Acquisitions and dispositions | |||||
| BXP’s Share of Investment | |||||||||||||||||||||||||||||||||||||||||||||||
| Property | Location | Date Acquired | Square Feet | Initial | Anticipated Future | Total | In-service Leased (%) | ||||||||||||||||||||||||||||||||||||||||
290 Coles Street (670 Units) (19.46% ownership) 1 |
Jersey City, NJ | March 5, 2025 | 560,000 | $ | 20,000 | $ | 68,700 | $ | 88,700 | N/A | |||||||||||||||||||||||||||||||||||||
343 Madison Avenue 2 |
New York, NY | August 27, 2025 | 930,000 | 43,532 | 843,418 | 886,950 | N/A | ||||||||||||||||||||||||||||||||||||||||
| Total Acquisitions | 1,490,000 | $ | 63,532 | $ | 912,118 | $ | 975,650 | — | % | ||||||||||||||||||||||||||||||||||||||
| Property | Location | Date Disposed | Square Feet | BXP’s Share of Gross Sales Price | BXP’s Share of Net Cash Proceeds | BXP’s Share of Book Gain (Loss) 3 |
|||||||||||||||||||||||||||||||||||
17 Hartwell Avenue 4 |
Lexington, MA | June 27, 2025 | 30,000 | $ | 21,840 | $ | 21,840 | $ | 18,390 | ||||||||||||||||||||||||||||||||
| Beach Cities Media Campus (50% ownership) | El Segundo, CA | September 17, 2025 | N/A | 28,005 | 26,571 | 2,236 | |||||||||||||||||||||||||||||||||||
| Total Dispositions | 30,000 | $ | 49,845 | $ | 48,411 | $ | 20,626 | ||||||||||||||||||||||||||||||||||
|
|
Q3 2025 | ||||
| Construction in progress | |||||
| Actual/Estimated | BXP’s share | |||||||||||||||||||||||||||||||||||||||||||||||||||||||||||||||||||||||||
| Initial Occupancy | Stabilization Date | Square Feet | Investment to Date 2 |
Estimated Total Investment 2 |
Total Financing | Amount Drawn | Estimated Future Equity Requirement 2 |
Percentage | Percentage placed in-service 4 |
Net Operating Income (Loss) 5 (BXP’s share) |
||||||||||||||||||||||||||||||||||||||||||||||||||||||||||||||||
| Location | Leased 3 |
|||||||||||||||||||||||||||||||||||||||||||||||||||||||||||||||||||||||||
| Office | ||||||||||||||||||||||||||||||||||||||||||||||||||||||||||||||||||||||||||
| 725 12th Street | Q1 2029 | Q4 2030 | Washington, DC | 320,000 | $ | 76,838 | $ | 349,600 | $ | — | $ | — | $ | 272,762 | 87 | % | — | % | N/A | |||||||||||||||||||||||||||||||||||||||||||||||||||||||
| 343 Madison Avenue | Q3 2029 | Q2 2031 | New York, NY | 930,000 | 183,665 | 1,971,000 | — | — | 1,787,335 | — | % | — | % | N/A | ||||||||||||||||||||||||||||||||||||||||||||||||||||||||||||
| Total Office Properties under Construction | 1,250,000 | 260,503 | 2,320,600 | — | — | 2,060,097 | 22 | % | — | % | N/A | |||||||||||||||||||||||||||||||||||||||||||||||||||||||||||||||
| Lab/Life Sciences | ||||||||||||||||||||||||||||||||||||||||||||||||||||||||||||||||||||||||||
290 Binney Street (55% ownership) 6 |
Q2 2026 | Q2 2026 | Cambridge, MA | 573,000 | 335,288 | 508,000 | — | — | 172,712 | 100 | % | — | % | N/A | ||||||||||||||||||||||||||||||||||||||||||||||||||||||||||||
651 Gateway (50% ownership) 7 |
Q1 2024 | Q3 2027 | South San Francisco, CA | 327,000 | 134,783 | 167,100 | — | — | 32,317 | 21 | % | 27 | % | $ | 51 | |||||||||||||||||||||||||||||||||||||||||||||||||||||||||||
| Total Lab/Life Sciences Properties under Construction | 900,000 | 470,071 | 675,100 | — | — | 205,029 | 71 | % | 10 | % | 51 | |||||||||||||||||||||||||||||||||||||||||||||||||||||||||||||||
| Residential | ||||||||||||||||||||||||||||||||||||||||||||||||||||||||||||||||||||||||||
| 17 Hartwell Avenue (312 units) (20% ownership) | Q2 2027 | Q2 2028 | Lexington, MA | 288,000 | 8,460 | 35,900 | 19,747 | — | 7,693 | — | % | — | % | N/A | ||||||||||||||||||||||||||||||||||||||||||||||||||||||||||||
| 17 Hartwell Avenue - Retail | 2,100 | — | — | — | — | — | — | % | — | % | N/A | |||||||||||||||||||||||||||||||||||||||||||||||||||||||||||||||
| 121 Broadway Street (439 units) | Q3 2027 | Q2 2029 | Cambridge, MA | 492,000 | 221,830 | 597,800 | — | — | 375,970 | — | % | — | % | N/A | ||||||||||||||||||||||||||||||||||||||||||||||||||||||||||||
290 Coles Street (670 units) (19.46% ownership) 8 |
Q2 2028 | Q3 2029 | Jersey City, NJ | 547,000 | 20,503 | 88,700 | 56,400 | — | 11,797 | — | % | — | % | N/A | ||||||||||||||||||||||||||||||||||||||||||||||||||||||||||||
| 290 Coles Street - Retail | 13,000 | — | — | — | — | — | — | % | — | % | N/A | |||||||||||||||||||||||||||||||||||||||||||||||||||||||||||||||
| Total Residential Properties under Construction | 1,342,100 | 250,793 | 722,400 | 76,147 | — | 395,460 | — | % | — | % | N/A | |||||||||||||||||||||||||||||||||||||||||||||||||||||||||||||||
| Retail | ||||||||||||||||||||||||||||||||||||||||||||||||||||||||||||||||||||||||||
| Reston Next Retail | Q1 2026 | Q4 2026 | Reston, VA | 30,000 | 26,823 | 31,600 | — | — | 4,777 | 70 | % | — | % | (13) | ||||||||||||||||||||||||||||||||||||||||||||||||||||||||||||
| Total Retail Property under Construction | 30,000 | 26,823 | 31,600 | — | — | 4,777 | 70 | % | — | % | (13) | |||||||||||||||||||||||||||||||||||||||||||||||||||||||||||||||
| Total Properties Under Construction | 3,522,100 | $ | 1,008,190 | $ | 3,749,700 | $ | 76,147 | $ | — | $ | 2,665,363 | 43 | % | 9 |
3 | % | $ | 38 | ||||||||||||||||||||||||||||||||||||||||||||||||||||||||
| Actual/Estimated | BXP’s share | ||||||||||||||||||||||||||||||||||||||||||||||||||||||||||||||||
Estimated Total Investment 2 |
Amount Drawn at 9/30/2025 |
Estimated Future Equity Requirement 2 |
Net Operating Income (Loss) 5 (BXP’s share) |
||||||||||||||||||||||||||||||||||||||||||||||||||||||||||||||
| Initial Occupancy | Stabilization Date | Investment to Date 2 |
Total Financing | Percentage | |||||||||||||||||||||||||||||||||||||||||||||||||||||||||||||
| Location | Square Feet | Leased 3 |
|||||||||||||||||||||||||||||||||||||||||||||||||||||||||||||||
| 1050 Winter Street | Q2 2025 | Q3 2025 | Waltham, MA | 162,274 | $ | 8,273 | $ | 38,700 | $ | — | $ | — | $ | 30,427 | 100 | % | $ | 583 | |||||||||||||||||||||||||||||||||||||||||||||||
| Reston Next Office Phase II | Q1 2025 | Q1 2027 | Reston, VA | 86,629 | 51,193 | 61,000 | — | — | 9,807 | 92 | % | (166) | |||||||||||||||||||||||||||||||||||||||||||||||||||||
| 360 Park Avenue South (71% ownership) | Q4 2024 | Q4 2026 | New York, NY | 448,112 | 385,755 | 418,300 | 156,470 | 156,470 | 32,545 | 38 | % | (409) | |||||||||||||||||||||||||||||||||||||||||||||||||||||
| Total Projects Fully Placed In-Service | 697,015 | $ | 445,221 | $ | 518,000 | $ | 156,470 | $ | 156,470 | $ | 72,779 | 59 | % | $ | 8 | ||||||||||||||||||||||||||||||||||||||||||||||||||
|
|
Q3 2025 | ||||
| Construction in progress (continued) | |||||
|
|
Q3 2025 | ||||
| Land parcels and purchase options | |||||
| Location | Approximate Developable Square Feet 2 |
|||||||
| Office | ||||||||
| San Jose, CA | 2,830,000 | |||||||
| New York, NY (25% ownership) | 2,000,000 | |||||||
| Princeton, NJ | 1,723,000 | |||||||
| Reston, VA | 1,278,000 | |||||||
| San Jose, CA (55% ownership) | 1,088,000 | |||||||
| Waltham, MA | 899,000 | |||||||
| San Francisco, CA | 850,000 | |||||||
| Santa Clara, CA | 632,000 | |||||||
| Springfield, VA | 576,000 | |||||||
| South San Francisco, CA (50% ownership) | 451,000 | |||||||
| Lexington, MA | 420,000 | |||||||
| Dulles, VA | 150,000 | |||||||
| Rockville, MD | 150,000 | |||||||
| Boston, MA | 25,000 | |||||||
| Total Office | 13,072,000 | |||||||
| Residential | ||||||||
| Reston, VA | 1,193,000 | |||||||
| Rockville, MD | 894,000 | |||||||
| Herndon, VA (50% ownership) | 611,000 | |||||||
| Weston, MA | 600,000 | |||||||
| Washington, DC (50% ownership) | 520,000 | |||||||
| Total Residential | 3,818,000 | |||||||
| Total Owned Land Parcels | 16,890,000 | |||||||
| Location | Approximate Developable Square Feet 2 |
|||||||
| Office | ||||||||
Waltham, MA 3 |
1,200,000 | |||||||
| Boston, MA | 668,000 | |||||||
| Cambridge, MA | 573,000 | |||||||
| Total Office | 2,441,000 | |||||||
| Residential | ||||||||
| Boston, MA | 632,000 | |||||||
| Total Residential | 632,000 | |||||||
| Total Land Purchase Options | 3,073,000 | |||||||
|
|
Q3 2025 | ||||
| Leasing activity | |||||
| Net (increase)/decrease in available space (SF) | Total | ||||
| Vacant space available at the beginning of the period | 6,559,755 | ||||
| Less: | |||||
Property dispositions/properties taken out of service 1 |
23,633 | ||||
| Add: | |||||
Properties placed (and partially placed) in-service 2 |
535,011 | ||||
| Leases expiring or terminated during the period | 977,209 | ||||
| Total space available for lease | 8,048,342 | ||||
| 1st generation leases | 198,797 | ||||
| 2nd generation leases with new clients | 688,867 | ||||
| 2nd generation lease renewals | 268,991 | ||||
| Total leases commenced during the period | 1,156,655 | ||||
| Vacant space available for lease at the end of the period | 6,891,687 | ||||
| Net (increase)/decrease in available space | (331,932) | ||||
2nd generation leasing information: 3 |
|||||
| Leases commencing during the period (SF) | 957,858 | ||||
| Weighted average lease term (months) | 96 | ||||
| Weighted average free rent period (days) | 215 | ||||
Total transaction costs per square foot 4 |
$77.47 | ||||
Increase (decrease) in gross rents 5 |
(4.48) | % | |||
Increase (decrease) in net rents 6 |
(7.13) | % | |||
| All leases commencing occupancy (SF) | Incr (decr) in 2nd generation cash rents | Total square feet of leases executed in the quarter 8 |
|||||||||||||||||||||||||||||||||
| 1st generation | 2nd generation | total 7 |
gross 5, 7 |
net 6,7 |
|||||||||||||||||||||||||||||||
| Boston | 113,924 | 368,708 | 482,632 | 2.18 | % | 3.19 | % | 397,854 | |||||||||||||||||||||||||||
| Los Angeles | — | 10,709 | 10,709 | (29.10) | % | (41.02) | % | 4,705 | |||||||||||||||||||||||||||
| New York | 23,038 | 215,801 | 238,839 | 4.52 | % | 8.11 | % | 794,741 | |||||||||||||||||||||||||||
| San Francisco | — | 176,055 | 176,055 | (19.02) | % | (24.57) | % | 133,551 | |||||||||||||||||||||||||||
| Seattle | — | 36,329 | 36,329 | — | % | — | % | 54,100 | |||||||||||||||||||||||||||
| Washington, DC | 61,835 | 150,256 | 212,091 | (8.03) | % | (11.78) | % | 139,247 | |||||||||||||||||||||||||||
| Total / Weighted Average | 198,797 | 957,858 | 1,156,655 | (4.48) | % | (7.13) | % | 1,524,198 | |||||||||||||||||||||||||||
|
|
Q3 2025 | ||||
| Portfolio overview | |||||
| Office | Retail | Residential | Hotel | Total | ||||||||||||||||||||||||||||
| Boston | 14,661,416 | 1,120,176 | 550,114 | 330,000 | 16,661,706 | |||||||||||||||||||||||||||
| Los Angeles | 2,183,712 | 123,534 | — | — | 2,307,246 | |||||||||||||||||||||||||||
| New York | 12,540,900 | 488,017 | — | — | 13,028,917 | |||||||||||||||||||||||||||
| San Francisco | 7,239,141 | 349,648 | 318,171 | — | 7,906,960 | |||||||||||||||||||||||||||
| Seattle | 1,503,381 | 13,171 | — | — | 1,516,552 | |||||||||||||||||||||||||||
| Washington, DC | 8,123,872 | 635,566 | 910,277 | — | 9,669,715 | |||||||||||||||||||||||||||
| Total | 46,252,422 | 2,730,112 | 1,778,562 | 330,000 | 51,091,096 | |||||||||||||||||||||||||||
| % of Total | 90.53 | % | 5.34 | % | 3.48 | % | 0.65 | % | 100.00 | % | ||||||||||||||||||||||
| Total | |||||
Rentable square feet of in-service properties 2 |
51,091,096 | ||||
| Less: | |||||
Rentable square feet from residential and hotel properties 2 |
2,174,332 | ||||
Partners’ share of rentable square feet from unconsolidated joint venture properties, excluding residential properties 4 |
3,975,899 | ||||
Partners’ share of rentable square feet from consolidated joint venture properties 5 |
3,117,910 | ||||
BXP’s Share of rentable square feet, excluding residential and hotel properties 1 |
41,822,955 | ||||
| Office | Retail | Residential | Hotel 6 |
Total | ||||||||||||||||||||||||||||
| Consolidated | $ | 768,404 | $ | 64,737 | $ | 12,171 | $ | 13,060 | $ | 858,372 | ||||||||||||||||||||||
Less: |
||||||||||||||||||||||||||||||||
Partners’ share from consolidated joint ventures 7 |
78,126 | 10,055 | — | — | 88,181 | |||||||||||||||||||||||||||
Add: |
||||||||||||||||||||||||||||||||
BXP’s share from unconsolidated joint ventures 8 |
49,655 | 2,535 | 3,617 | — | 55,807 | |||||||||||||||||||||||||||
BXP’s Share of Rental revenue 1 |
$ | 739,933 | $ | 57,217 | $ | 15,788 | $ | 13,060 | $ | 825,998 | ||||||||||||||||||||||
| % of Total | 89.58 | % | 6.93 | % | 1.91 | % | 1.58 | % | 100.00 | % | ||||||||||||||||||||||
| CBD | Suburban | Total | |||||||||||||||
| Boston | 33.16 | % | 4.85 | % | 38.01 | % | |||||||||||
| Los Angeles | 4.65 | % | — | % | 4.65 | % | |||||||||||
| New York | 21.81 | % | 1.57 | % | 23.38 | % | |||||||||||
| San Francisco | 14.25 | % | 1.86 | % | 16.11 | % | |||||||||||
| Seattle | 2.52 | % | — | % | 2.52 | % | |||||||||||
| Washington, DC | 15.18 | % | 0.15 | % | 15.33 | % | |||||||||||
| Total | 91.57 | % | 8.43 | % | 100.00 | % | |||||||||||
|
|
Q3 2025 | ||||
| Residential and hotel performance | |||||
Residential 1 |
Hotel | ||||||||||||||||||||||
| Three Months Ended | Three Months Ended | ||||||||||||||||||||||
| 30-Sep-25 | 30-Jun-25 | 30-Sep-25 | 30-Jun-25 | ||||||||||||||||||||
Rental Revenue 2 |
$ | 12,845 | $ | 12,532 | $ | 13,162 | $ | 14,773 | |||||||||||||||
| Less: Operating expenses and real estate taxes | 6,095 | 6,578 | 9,628 | 9,365 | |||||||||||||||||||
Net Operating Income (NOI) 2 |
6,750 | 5,954 | 3,534 | 5,408 | |||||||||||||||||||
| Add: BXP’s share of NOI from unconsolidated joint ventures | 2,211 | 2,148 | N/A | N/A | |||||||||||||||||||
BXP’s Share of NOI 2 |
$ | 8,961 | $ | 8,102 | $ | 3,534 | $ | 5,408 | |||||||||||||||
Rental Revenue 2 |
$ | 12,845 | $ | 12,532 | $ | 13,162 | $ | 14,773 | |||||||||||||||
| Less: Straight line rent and fair value lease revenue | 139 | 142 | (2) | (2) | |||||||||||||||||||
| Add: Lease transaction costs that qualify as rent inducements | 149 | 149 | — | — | |||||||||||||||||||
| Subtotal | 12,855 | 12,539 | 13,164 | 14,775 | |||||||||||||||||||
| Less: Operating expenses and real estate taxes | 6,095 | 6,578 | 9,628 | 9,365 | |||||||||||||||||||
NOI - cash basis 2 |
6,760 | 5,961 | 3,536 | 5,410 | |||||||||||||||||||
| Add: BXP’s share of NOI-cash from unconsolidated joint ventures | 2,211 | 2,148 | N/A | N/A | |||||||||||||||||||
BXP’s Share of NOI - cash basis 2 |
$ | 8,971 | $ | 8,109 | $ | 3,536 | $ | 5,410 | |||||||||||||||
| Residential Units | Three Months Ended | Percent Change | |||||||||||||||||||||
| 30-Sep-25 | 30-Sep-24 | ||||||||||||||||||||||
| Boston | 806 | ||||||||||||||||||||||
| Average Monthly Rental Rate | $ | 4,091 | $ | 4,000 | 2.28 | % | |||||||||||||||||
| Average Rental Rate Per Occupied Square Foot | $ | 5.97 | $ | 5.85 | 2.05 | % | |||||||||||||||||
| Average Physical Occupancy | 94.62 | % | 95.37 | % | (0.79) | % | |||||||||||||||||
| Average Economic Occupancy | 94.57 | % | 95.39 | % | (0.86) | % | |||||||||||||||||
| San Francisco | 402 | ||||||||||||||||||||||
| Average Monthly Rental Rate | $ | 3,004 | $ | 2,968 | 1.21 | % | |||||||||||||||||
| Average Rental Rate Per Occupied Square Foot | $ | 3.80 | $ | 3.76 | 1.06 | % | |||||||||||||||||
| Average Physical Occupancy | 90.88 | % | 89.88 | % | 1.11 | % | |||||||||||||||||
| Average Economic Occupancy | 89.02 | % | 87.49 | % | 1.75 | % | |||||||||||||||||
Washington, DC 4 |
1,016 | ||||||||||||||||||||||
| Average Monthly Rental Rate | $ | 2,869 | $ | 2,869 | — | % | |||||||||||||||||
| Average Rental Rate Per Occupied Square Foot | $ | 3.23 | $ | 2.95 | 9.49 | % | |||||||||||||||||
| Average Physical Occupancy | 91.57 | % | 96.00 | % | (4.61) | % | |||||||||||||||||
| Average Economic Occupancy | 89.11 | % | 95.89 | % | (7.07) | % | |||||||||||||||||
| Total residential units | 2,224 | ||||||||||||||||||||||
| Hotel Rooms | Three Months Ended | Percent Change | |||||||||||||||||||||
| 30-Sep-25 | 30-Sep-24 | ||||||||||||||||||||||
| Boston Marriott Cambridge | 437 | ||||||||||||||||||||||
| Average Occupancy | 82.80 | % | 82.70 | % | 0.12 | % | |||||||||||||||||
| Average Daily Rate | $ | 328.68 | $ | 356.44 | (7.79) | % | |||||||||||||||||
| Revenue Per Available Room | $ | 272.00 | $ | 294.86 | (7.75) | % | |||||||||||||||||
|
|
Q3 2025 | ||||
| In-service property listing | |||||
| as of September 30, 2025 | |||||||||||||||||||||||||||||||||||||||||||||||
| Sub Market | Number of Buildings | Square Feet | Occupied % 1 |
Leased % 2 |
Annualized Rental Obligations Per Occupied SF 3 |
||||||||||||||||||||||||||||||||||||||||||
| CBD | |||||||||||||||||||||||||||||||||||||||||||||||
| BOSTON | |||||||||||||||||||||||||||||||||||||||||||||||
| Office | |||||||||||||||||||||||||||||||||||||||||||||||
| 200 Clarendon Street | CBD Boston MA | 1 | 1,700,914 | 99.6 | % | 99.6 | % | $ | 88.62 | ||||||||||||||||||||||||||||||||||||||
| 800 Boylston Street - The Prudential Center | CBD Boston MA | 1 | 1,274,213 | 94.8 | % | 97.8 | % | 73.56 | |||||||||||||||||||||||||||||||||||||||
| 100 Federal Street (55% ownership) | CBD Boston MA | 1 | 1,233,943 | 91.9 | % | 98.3 | % | 77.44 | |||||||||||||||||||||||||||||||||||||||
| 111 Huntington Avenue - The Prudential Center | CBD Boston MA | 1 | 860,446 | 100.0 | % | 100.0 | % | 81.19 | |||||||||||||||||||||||||||||||||||||||
| Atlantic Wharf Office (55% ownership) | CBD Boston MA | 1 | 793,024 | 100.0 | % | 100.0 | % | 88.25 | |||||||||||||||||||||||||||||||||||||||
100 Causeway Street (50% ownership) 4 |
CBD Boston MA | 1 | 633,818 | 100.0 | % | 100.0 | % | 75.65 | |||||||||||||||||||||||||||||||||||||||
Prudential Center (retail shops) 5 |
CBD Boston MA | 1 | 601,333 | 94.5 | % | 94.8 | % | 94.38 | |||||||||||||||||||||||||||||||||||||||
| 101 Huntington Avenue - The Prudential Center | CBD Boston MA | 1 | 506,476 | 100.0 | % | 100.0 | % | 62.33 | |||||||||||||||||||||||||||||||||||||||
The Hub on Causeway - Podium (50% ownership) 4 |
CBD Boston MA | 1 | 382,988 | 94.8 | % | 94.8 | % | 65.80 | |||||||||||||||||||||||||||||||||||||||
| 888 Boylston Street - The Prudential Center | CBD Boston MA | 1 | 363,320 | 100.0 | % | 100.0 | % | 83.84 | |||||||||||||||||||||||||||||||||||||||
Star Market at the Prudential Center 5 |
CBD Boston MA | 1 | 60,015 | 100.0 | % | 100.0 | % | 64.51 | |||||||||||||||||||||||||||||||||||||||
| Subtotal | 11 | 8,410,490 | 97.3 | % | 98.7 | % | $ | 80.49 | |||||||||||||||||||||||||||||||||||||||
| 145 Broadway | East Cambridge MA | 1 | 490,086 | 99.6 | % | 99.6 | % | $ | 93.42 | ||||||||||||||||||||||||||||||||||||||
| 325 Main Street | East Cambridge MA | 1 | 414,900 | 91.4 | % | 97.4 | % | 119.26 | |||||||||||||||||||||||||||||||||||||||
125 Broadway 6 |
East Cambridge MA | 1 | 271,000 | 100.0 | % | 100.0 | % | 148.82 | |||||||||||||||||||||||||||||||||||||||
| 355 Main Street | East Cambridge MA | 1 | 256,966 | 100.0 | % | 100.0 | % | 86.33 | |||||||||||||||||||||||||||||||||||||||
300 Binney Street (55% ownership) 6, 7 |
East Cambridge MA | 1 | 239,908 | 100.0 | % | 100.0 | % | 159.03 | |||||||||||||||||||||||||||||||||||||||
| 90 Broadway | East Cambridge MA | 1 | 223,771 | 100.0 | % | 100.0 | % | 81.08 | |||||||||||||||||||||||||||||||||||||||
| 255 Main Street | East Cambridge MA | 1 | 215,394 | 82.5 | % | 82.5 | % | 92.24 | |||||||||||||||||||||||||||||||||||||||
| 150 Broadway | East Cambridge MA | 1 | 177,226 | 100.0 | % | 100.0 | % | 101.94 | |||||||||||||||||||||||||||||||||||||||
| 105 Broadway | East Cambridge MA | 1 | 152,664 | 100.0 | % | 100.0 | % | 77.35 | |||||||||||||||||||||||||||||||||||||||
250 Binney Street 6 |
East Cambridge MA | 1 | 67,362 | 100.0 | % | 100.0 | % | 92.10 | |||||||||||||||||||||||||||||||||||||||
| University Place | Mid-Cambridge MA | 1 | 195,282 | 100.0 | % | 100.0 | % | 61.08 | |||||||||||||||||||||||||||||||||||||||
| Subtotal | 11 | 2,704,559 | 97.2 | % | 98.1 | % | $ | 104.27 | |||||||||||||||||||||||||||||||||||||||
| Subtotal Boston CBD | 22 | 11,115,049 | 97.3 | % | 98.6 | % | $ | 86.32 | |||||||||||||||||||||||||||||||||||||||
| Residential | |||||||||||||||||||||||||||||||||||||||||||||||
Hub50House (440 units) (50% ownership) 4 |
CBD Boston MA | 1 | 320,444 | ||||||||||||||||||||||||||||||||||||||||||||
| The Lofts at Atlantic Wharf (86 units) | CBD Boston MA | 1 | 87,096 | ||||||||||||||||||||||||||||||||||||||||||||
| Proto Kendall Square (280 units) | East Cambridge MA | 1 | 166,717 | ||||||||||||||||||||||||||||||||||||||||||||
| Subtotal | 3 | 574,257 | |||||||||||||||||||||||||||||||||||||||||||||
| Hotel | |||||||||||||||||||||||||||||||||||||||||||||||
| Boston Marriott Cambridge (437 rooms) | East Cambridge MA | 1 | 334,260 | ||||||||||||||||||||||||||||||||||||||||||||
| Subtotal | 1 | 334,260 | |||||||||||||||||||||||||||||||||||||||||||||
| LOS ANGELES | |||||||||||||||||||||||||||||||||||||||||||||||
| Office | |||||||||||||||||||||||||||||||||||||||||||||||
Colorado Center (50% ownership) 4 |
West Los Angeles CA | 6 | 1,130,066 | 89.6 | % | 90.3 | % | $ | 78.25 | ||||||||||||||||||||||||||||||||||||||
| Santa Monica Business Park | West Los Angeles CA | 14 | 1,104,174 | 83.8 | % | 83.8 | % | 73.18 | |||||||||||||||||||||||||||||||||||||||
Santa Monica Business Park Retail 5 |
West Los Angeles CA | 7 | 73,006 | 86.8 | % | 86.8 | % | 80.09 | |||||||||||||||||||||||||||||||||||||||
| Subtotal | 27 | 2,307,246 | 86.7 | % | 87.1 | % | $ | 75.97 | |||||||||||||||||||||||||||||||||||||||
| NEW YORK | |||||||||||||||||||||||||||||||||||||||||||||||
| Office | |||||||||||||||||||||||||||||||||||||||||||||||
| 767 Fifth Avenue (The GM Building) (60% ownership) | Plaza District NY | 1 | 1,970,335 | 93.7 | % | 98.5 | % | $ | 170.35 | ||||||||||||||||||||||||||||||||||||||
| 601 Lexington Avenue (55% ownership) | Park Avenue NY | 1 | 1,671,682 | 99.9 | % | 99.9 | % | 100.64 | |||||||||||||||||||||||||||||||||||||||
| 399 Park Avenue | Park Avenue NY | 1 | 1,567,470 | 100.0 | % | 100.0 | % | 109.69 | |||||||||||||||||||||||||||||||||||||||
|
|
Q3 2025 | ||||
| In-service property listing (continued) | |||||
| as of September 30, 2025 | |||||||||||||||||||||||||||||||||||||||||||||||
| Sub Market | Number of Buildings | Square Feet | Occupied % 1 |
Leased % 2 |
Annualized Rental Obligations Per Occupied SF 3 |
||||||||||||||||||||||||||||||||||||||||||
| 599 Lexington Avenue | Park Avenue NY | 1 | 1,106,336 | 87.8 | % | 97.0 | % | 87.43 | |||||||||||||||||||||||||||||||||||||||
| 7 Times Square (formerly Times Square Tower) (55% ownership) | Times Square NY | 1 | 1,238,724 | 80.2 | % | 84.7 | % | 76.83 | |||||||||||||||||||||||||||||||||||||||
| 250 West 55th Street | Times Square / West Side NY | 1 | 966,976 | 100.0 | % | 100.0 | % | 102.74 | |||||||||||||||||||||||||||||||||||||||
200 Fifth Avenue (26.69% ownership) 4 |
Midtown South NY | 1 | 846,506 | 59.0 | % | 91.0 | % | 98.80 | |||||||||||||||||||||||||||||||||||||||
360 Park Avenue South (71.11% ownership) 4, 7, 8 |
Midtown South NY | 1 | 448,112 | 28.0 | % | 38.3 | % | 100.48 | |||||||||||||||||||||||||||||||||||||||
Dock 72 (50% ownership) 4 |
Brooklyn NY | 1 | 668,521 | 42.7 | % | 42.7 | % | 37.60 | |||||||||||||||||||||||||||||||||||||||
| 510 Madison Avenue | Fifth/Madison Avenue NY | 1 | 352,589 | 77.0 | % | 93.4 | % | 123.57 | |||||||||||||||||||||||||||||||||||||||
| Subtotal | 10 | 10,837,251 | 84.9 | % | 90.7 | % | $ | 111.11 | |||||||||||||||||||||||||||||||||||||||
| SAN FRANCISCO | |||||||||||||||||||||||||||||||||||||||||||||||
| Office | |||||||||||||||||||||||||||||||||||||||||||||||
| Salesforce Tower | CBD San Francisco CA | 1 | 1,420,682 | 98.0 | % | 98.0 | % | $ | 114.47 | ||||||||||||||||||||||||||||||||||||||
| Embarcadero Center Four | CBD San Francisco CA | 1 | 945,405 | 88.3 | % | 94.5 | % | 105.29 | |||||||||||||||||||||||||||||||||||||||
| Embarcadero Center One | CBD San Francisco CA | 1 | 837,810 | 71.3 | % | 71.3 | % | 96.59 | |||||||||||||||||||||||||||||||||||||||
| Embarcadero Center Two | CBD San Francisco CA | 1 | 804,891 | 71.5 | % | 72.5 | % | 85.39 | |||||||||||||||||||||||||||||||||||||||
| Embarcadero Center Three | CBD San Francisco CA | 1 | 786,411 | 75.0 | % | 78.7 | % | 93.08 | |||||||||||||||||||||||||||||||||||||||
| 680 Folsom Street | CBD San Francisco CA | 2 | 522,406 | 59.2 | % | 59.2 | % | 84.61 | |||||||||||||||||||||||||||||||||||||||
| 535 Mission Street | CBD San Francisco CA | 1 | 303,322 | 77.2 | % | 86.2 | % | 77.36 | |||||||||||||||||||||||||||||||||||||||
| 690 Folsom Street | CBD San Francisco CA | 1 | 26,080 | 100.0 | % | 100.0 | % | 76.45 | |||||||||||||||||||||||||||||||||||||||
| Subtotal | 9 | 5,647,007 | 80.7 | % | 82.9 | % | $ | 99.95 | |||||||||||||||||||||||||||||||||||||||
| Residential | |||||||||||||||||||||||||||||||||||||||||||||||
| The Skylyne (402 units) | CBD Oakland CA | 1 | 330,996 | ||||||||||||||||||||||||||||||||||||||||||||
| Subtotal | 1 | 330,996 | |||||||||||||||||||||||||||||||||||||||||||||
| SEATTLE | |||||||||||||||||||||||||||||||||||||||||||||||
| Office | |||||||||||||||||||||||||||||||||||||||||||||||
Safeco Plaza (33.67% ownership) 4 |
CBD Seattle WA | 1 | 762,541 | 84.5 | % | 86.5 | % | $ | 49.34 | ||||||||||||||||||||||||||||||||||||||
| Madison Centre | CBD Seattle WA | 1 | 754,011 | 80.7 | % | 83.6 | % | 60.44 | |||||||||||||||||||||||||||||||||||||||
| Subtotal | 2 | 1,516,552 | 82.6 | % | 85.1 | % | $ | 54.72 | |||||||||||||||||||||||||||||||||||||||
| WASHINGTON, DC | |||||||||||||||||||||||||||||||||||||||||||||||
| Office | |||||||||||||||||||||||||||||||||||||||||||||||
| 901 New York Avenue | East End Washington DC | 1 | 508,130 | 80.5 | % | 80.5 | % | $ | 69.14 | ||||||||||||||||||||||||||||||||||||||
Market Square North (50% ownership) 4 |
East End Washington DC | 1 | 417,298 | 75.3 | % | 75.3 | % | 75.52 | |||||||||||||||||||||||||||||||||||||||
| 2100 Pennsylvania Avenue | CBD Washington DC | 1 | 475,849 | 95.0 | % | 95.0 | % | 82.25 | |||||||||||||||||||||||||||||||||||||||
| 2200 Pennsylvania Avenue | CBD Washington DC | 1 | 459,954 | 94.8 | % | 98.0 | % | 95.76 | |||||||||||||||||||||||||||||||||||||||
| 1330 Connecticut Avenue | CBD Washington DC | 1 | 252,413 | 95.5 | % | 95.5 | % | 71.07 | |||||||||||||||||||||||||||||||||||||||
| Sumner Square | CBD Washington DC | 1 | 208,797 | 94.0 | % | 94.0 | % | 50.61 | |||||||||||||||||||||||||||||||||||||||
500 North Capitol Street, N.W. (30% ownership) 4 |
Capitol Hill Washington DC | 1 | 230,900 | 96.8 | % | 96.8 | % | 86.29 | |||||||||||||||||||||||||||||||||||||||
| Capital Gallery | Southwest Washington DC | 1 | 176,824 | 80.8 | % | 92.7 | % | 58.30 | |||||||||||||||||||||||||||||||||||||||
| Subtotal | 8 | 2,730,165 | 88.5 | % | 89.8 | % | $ | 76.68 | |||||||||||||||||||||||||||||||||||||||
| Reston Next | Reston VA | 2 | 1,063,299 | 97.5 | % | 99.2 | % | $ | 62.90 | ||||||||||||||||||||||||||||||||||||||
| South of Market | Reston VA | 3 | 624,387 | 100.0 | % | 100.0 | % | 57.19 | |||||||||||||||||||||||||||||||||||||||
| Fountain Square | Reston VA | 2 | 524,329 | 94.2 | % | 99.1 | % | 53.64 | |||||||||||||||||||||||||||||||||||||||
| One Freedom Square | Reston VA | 1 | 427,646 | 87.8 | % | 87.8 | % | 55.08 | |||||||||||||||||||||||||||||||||||||||
| Two Freedom Square | Reston VA | 1 | 423,222 | 100.0 | % | 100.0 | % | 55.65 | |||||||||||||||||||||||||||||||||||||||
| One and Two Discovery Square | Reston VA | 2 | 366,989 | 89.7 | % | 89.7 | % | 54.13 | |||||||||||||||||||||||||||||||||||||||
| One Reston Overlook | Reston VA | 1 | 319,519 | 100.0 | % | 100.0 | % | 50.80 | |||||||||||||||||||||||||||||||||||||||
| 17Fifty Presidents Street | Reston VA | 1 | 275,809 | 100.0 | % | 100.0 | % | 74.81 | |||||||||||||||||||||||||||||||||||||||
| Democracy Tower | Reston VA | 1 | 259,441 | 99.3 | % | 99.3 | % | 69.25 | |||||||||||||||||||||||||||||||||||||||
Fountain Square Retail 5 |
Reston VA | 1 | 196,421 | 90.4 | % | 91.2 | % | 59.39 | |||||||||||||||||||||||||||||||||||||||
|
|
Q3 2025 | ||||
| In-service property listing (continued) | |||||
| as of September 30, 2025 | |||||||||||||||||||||||||||||||||||||||||||||||
| Sub Market | Number of Buildings | Square Feet | Occupied % 1 |
Leased % 2 |
Annualized Rental Obligations Per Occupied SF 3 |
||||||||||||||||||||||||||||||||||||||||||
| Two Reston Overlook | Reston VA | 1 | 134,615 | 100.0 | % | 100.0 | % | 56.54 | |||||||||||||||||||||||||||||||||||||||
Reston Next Office Phase II 7, 8 |
Reston VA | 1 | 86,629 | 4.5 | % | 92.2 | % | 57.20 | |||||||||||||||||||||||||||||||||||||||
Avant Retail 5 |
Reston VA | 1 | 26,179 | 100.0 | % | 100.0 | % | 67.23 | |||||||||||||||||||||||||||||||||||||||
| Subtotal | 18 | 4,728,485 | 94.7 | % | 97.3 | % | $ | 59.04 | |||||||||||||||||||||||||||||||||||||||
7750 Wisconsin Avenue (50% ownership) 4 |
Bethesda/Chevy Chase MD | 1 | 735,573 | 100.0 | % | 100.0 | % | $ | 38.99 | ||||||||||||||||||||||||||||||||||||||
| Wisconsin Place Office | Montgomery County MD | 1 | 295,845 | 59.9 | % | 59.9 | % | 53.06 | |||||||||||||||||||||||||||||||||||||||
| Subtotal | 2 | 1,031,418 | 88.5 | % | 88.5 | % | $ | 42.13 | |||||||||||||||||||||||||||||||||||||||
| Subtotal Washington, DC CBD | 28 | 8,490,068 | 91.9 | % | 93.8 | % | $ | 62.49 | |||||||||||||||||||||||||||||||||||||||
| Residential | |||||||||||||||||||||||||||||||||||||||||||||||
| Signature at Reston (508 units) | Reston VA | 1 | 517,783 | ||||||||||||||||||||||||||||||||||||||||||||
Skymark (508 units) (20% ownership) 4, 7 |
Reston VA | 1 | 417,036 | ||||||||||||||||||||||||||||||||||||||||||||
| Subtotal | 2 | 934,819 | |||||||||||||||||||||||||||||||||||||||||||||
| CBD Total | 105 | 42,087,505 | 89.3 | % | 9 |
92.0 | % | 9 |
$ | 87.55 | 9 |
||||||||||||||||||||||||||||||||||||
| BXP’s Share of CBD | 90.0 | % | 9 |
92.3 | % | 9 |
|||||||||||||||||||||||||||||||||||||||||
| SUBURBAN | |||||||||||||||||||||||||||||||||||||||||||||||
| BOSTON | |||||||||||||||||||||||||||||||||||||||||||||||
| Office | |||||||||||||||||||||||||||||||||||||||||||||||
Bay Colony Corporate Center 10 |
Route 128 Mass Turnpike MA | 3 | 710,064 | 56.2 | % | 57.7 | % | $ | 38.70 | ||||||||||||||||||||||||||||||||||||||
| 140 Kendrick Street | Route 128 Mass Turnpike MA | 3 | 409,197 | 77.2 | % | 81.7 | % | 60.59 | |||||||||||||||||||||||||||||||||||||||
| Weston Corporate Center | Route 128 Mass Turnpike MA | 1 | 357,579 | 12.5 | % | 12.5 | % | 48.08 | |||||||||||||||||||||||||||||||||||||||
180 CityPoint 6, 7 |
Route 128 Mass Turnpike MA | 1 | 329,195 | 43.2 | % | 78.3 | % | 102.94 | |||||||||||||||||||||||||||||||||||||||
| Waltham Weston Corporate Center | Route 128 Mass Turnpike MA | 1 | 301,611 | 73.0 | % | 73.0 | % | 45.22 | |||||||||||||||||||||||||||||||||||||||
| 230 CityPoint | Route 128 Mass Turnpike MA | 1 | 296,720 | 97.7 | % | 97.7 | % | 49.53 | |||||||||||||||||||||||||||||||||||||||
200 West Street 6 |
Route 128 Mass Turnpike MA | 1 | 273,361 | 86.1 | % | 86.1 | % | 91.72 | |||||||||||||||||||||||||||||||||||||||
880 Winter Street 6 |
Route 128 Mass Turnpike MA | 1 | 243,614 | 100.0 | % | 100.0 | % | 100.00 | |||||||||||||||||||||||||||||||||||||||
| 10 CityPoint | Route 128 Mass Turnpike MA | 1 | 236,570 | 97.1 | % | 98.6 | % | 60.69 | |||||||||||||||||||||||||||||||||||||||
| 20 CityPoint | Route 128 Mass Turnpike MA | 1 | 211,476 | 98.1 | % | 98.1 | % | 62.02 | |||||||||||||||||||||||||||||||||||||||
| 77 CityPoint | Route 128 Mass Turnpike MA | 1 | 209,382 | 90.2 | % | 90.2 | % | 56.43 | |||||||||||||||||||||||||||||||||||||||
| 890 Winter Street | Route 128 Mass Turnpike MA | 1 | 180,155 | 93.1 | % | 93.1 | % | 45.71 | |||||||||||||||||||||||||||||||||||||||
Reservoir Place 11 |
Route 128 Mass Turnpike MA | 1 | 164,993 | 35.0 | % | 35.0 | % | 46.23 | |||||||||||||||||||||||||||||||||||||||
153 & 211 Second Avenue 12 |
Route 128 Mass Turnpike MA | 2 | 154,093 | 84.2 | % | 84.2 | % | 52.45 | |||||||||||||||||||||||||||||||||||||||
1265 Main Street (50% ownership) 4 |
Route 128 Mass Turnpike MA | 1 | 120,681 | 100.0 | % | 100.0 | % | 58.99 | |||||||||||||||||||||||||||||||||||||||
103 CityPoint 6, 7 |
Route 128 Mass Turnpike MA | 1 | 112,841 | — | % | — | % | — | |||||||||||||||||||||||||||||||||||||||
| Reservoir Place North | Route 128 Mass Turnpike MA | 1 | 73,258 | 100.0 | % | 100.0 | % | 52.86 | |||||||||||||||||||||||||||||||||||||||
The Point 5 |
Route 128 Mass Turnpike MA | 1 | 16,300 | 100.0 | % | 100.0 | % | 63.48 | |||||||||||||||||||||||||||||||||||||||
33 Hayden Avenue 6 |
Route 128 Northwest MA | 1 | 80,872 | 100.0 | % | 100.0 | % | 80.03 | |||||||||||||||||||||||||||||||||||||||
| 32 Hartwell Avenue | Route 128 Northwest MA | 1 | 69,154 | 100.0 | % | 100.0 | % | 27.50 | |||||||||||||||||||||||||||||||||||||||
100 Hayden Avenue 6 |
Route 128 Northwest MA | 1 | 55,924 | 100.0 | % | 100.0 | % | 66.22 | |||||||||||||||||||||||||||||||||||||||
| 92 Hayden Avenue | Route 128 Northwest MA | 1 | 31,100 | 100.0 | % | 100.0 | % | 46.83 | |||||||||||||||||||||||||||||||||||||||
| Subtotal | 27 | 4,638,140 | 71.6 | % | 74.8 | % | $ | 60.82 | |||||||||||||||||||||||||||||||||||||||
| NEW YORK | |||||||||||||||||||||||||||||||||||||||||||||||
| Office | |||||||||||||||||||||||||||||||||||||||||||||||
| 510 Carnegie Center | Princeton NJ | 1 | 234,160 | 72.4 | % | 74.9 | % | $ | 40.13 | ||||||||||||||||||||||||||||||||||||||
| 206 Carnegie Center | Princeton NJ | 1 | 161,763 | — | % | — | % | — | |||||||||||||||||||||||||||||||||||||||
| 210 Carnegie Center | Princeton NJ | 1 | 159,468 | 27.5 | % | 66.3 | % | 44.06 | |||||||||||||||||||||||||||||||||||||||
| 212 Carnegie Center | Princeton NJ | 1 | 148,942 | 67.8 | % | 72.4 | % | 35.63 | |||||||||||||||||||||||||||||||||||||||
| 214 Carnegie Center | Princeton NJ | 1 | 146,799 | 62.8 | % | 62.8 | % | 38.57 | |||||||||||||||||||||||||||||||||||||||
| 506 Carnegie Center | Princeton NJ | 1 | 139,050 | 95.1 | % | 95.1 | % | 40.73 | |||||||||||||||||||||||||||||||||||||||
|
|
Q3 2025 | ||||
| In-service property listing (continued) | |||||
| as of September 30, 2025 | |||||||||||||||||||||||||||||||||||||||||||||||
| Sub Market | Number of Buildings | Square Feet | Occupied % 1 |
Leased % 2 |
Annualized Rental Obligations Per Occupied SF 3 |
||||||||||||||||||||||||||||||||||||||||||
| 508 Carnegie Center | Princeton NJ | 1 | 134,433 | 100.0 | % | 100.0 | % | 43.84 | |||||||||||||||||||||||||||||||||||||||
| 202 Carnegie Center | Princeton NJ | 1 | 134,068 | 73.7 | % | 73.7 | % | 40.89 | |||||||||||||||||||||||||||||||||||||||
| 804 Carnegie Center | Princeton NJ | 1 | 130,000 | 100.0 | % | 100.0 | % | 42.13 | |||||||||||||||||||||||||||||||||||||||
| 101 Carnegie Center | Princeton NJ | 1 | 122,791 | 99.5 | % | 100.0 | % | 40.25 | |||||||||||||||||||||||||||||||||||||||
| 504 Carnegie Center | Princeton NJ | 1 | 121,990 | 100.0 | % | 100.0 | % | 36.83 | |||||||||||||||||||||||||||||||||||||||
| 502 Carnegie Center | Princeton NJ | 1 | 121,460 | 94.8 | % | 94.8 | % | 39.47 | |||||||||||||||||||||||||||||||||||||||
| 701 Carnegie Center | Princeton NJ | 1 | 120,000 | 100.0 | % | 100.0 | % | 34.78 | |||||||||||||||||||||||||||||||||||||||
| 104 Carnegie Center | Princeton NJ | 1 | 101,969 | 69.6 | % | 73.4 | % | 38.38 | |||||||||||||||||||||||||||||||||||||||
| 103 Carnegie Center | Princeton NJ | 1 | 96,322 | 69.1 | % | 69.1 | % | 37.51 | |||||||||||||||||||||||||||||||||||||||
| 302 Carnegie Center | Princeton NJ | 1 | 64,926 | 100.0 | % | 100.0 | % | 36.50 | |||||||||||||||||||||||||||||||||||||||
| 211 Carnegie Center | Princeton NJ | 1 | 47,025 | — | % | — | % | — | |||||||||||||||||||||||||||||||||||||||
| 201 Carnegie Center | Princeton NJ | — | 6,500 | 100.0 | % | 100.0 | % | 34.09 | |||||||||||||||||||||||||||||||||||||||
| Subtotal | 17 | 2,191,666 | 72.6 | % | 76.2 | % | $ | 39.38 | |||||||||||||||||||||||||||||||||||||||
| SAN FRANCISCO | |||||||||||||||||||||||||||||||||||||||||||||||
| Office | |||||||||||||||||||||||||||||||||||||||||||||||
Gateway Commons (50% ownership) 4, 13 |
South San Francisco CA | 5 | 792,737 | 72.2 | % | 72.2 | % | $ | 73.49 | ||||||||||||||||||||||||||||||||||||||
751 Gateway (49% ownership) 4, 6 |
South San Francisco CA | 1 | 230,592 | 100.0 | % | 100.0 | % | 116.11 | |||||||||||||||||||||||||||||||||||||||
Mountain View Research Park 14 |
Mountain View CA | 16 | 571,884 | 59.0 | % | 62.7 | % | 64.32 | |||||||||||||||||||||||||||||||||||||||
| 2440 West El Camino Real | Mountain View CA | 1 | 142,711 | 57.8 | % | 57.8 | % | 95.39 | |||||||||||||||||||||||||||||||||||||||
| North First Business Park | San Jose CA | 5 | 191,033 | 58.4 | % | 58.4 | % | 30.15 | |||||||||||||||||||||||||||||||||||||||
| Subtotal | 28 | 1,928,957 | 69.2 | % | 70.3 | % | $ | 76.29 | |||||||||||||||||||||||||||||||||||||||
| WASHINGTON, DC | |||||||||||||||||||||||||||||||||||||||||||||||
| Office | |||||||||||||||||||||||||||||||||||||||||||||||
| Kingstowne Two | Springfield VA | 1 | 156,540 | 50.7 | % | 67.8 | % | $ | 38.59 | ||||||||||||||||||||||||||||||||||||||
Kingstowne Retail 5 |
Springfield VA | 1 | 88,288 | 100.0 | % | 100.0 | % | 31.36 | |||||||||||||||||||||||||||||||||||||||
| Subtotal | 2 | 244,828 | 68.5 | % | 79.4 | % | $ | 34.78 | |||||||||||||||||||||||||||||||||||||||
| Suburban Total | 74 | 9,003,591 | 71.2 | % | 74.3 | % | $ | 58.06 | |||||||||||||||||||||||||||||||||||||||
| BXP’s Share of Suburban | 70.6 | % | 73.8 | % | |||||||||||||||||||||||||||||||||||||||||||
| Total In-Service Properties: | 179 | 51,091,096 | 86.0 | % | 9 |
88.8 | % | 9 |
$ | 83.04 | 9 |
||||||||||||||||||||||||||||||||||||
BXP’s Share of Total In-Service Properties: 3 |
86.1 | % | 9 |
88.6 | % | 9 |
|||||||||||||||||||||||||||||||||||||||||
|
|
Q3 2025 | ||||
| Top 20 clients listing and portfolio client diversification | |||||
| No. | Client | BXP’s Share of Annualized Rental Obligations 1 |
Weighted Average Remaining Lease Term (years) 2 |
||||||||||||||||||||
| 1 | Salesforce | 3.34 | % | 6.5 | |||||||||||||||||||
| 2 | 2.88 | % | 11.6 | ||||||||||||||||||||
| 3 | Akamai Technologies | 2.15 | % | 9.1 | |||||||||||||||||||
| 4 | Kirkland & Ellis | 1.81 | % | 11.9 | |||||||||||||||||||
| 5 | Biogen | 1.78 | % | 2.6 | |||||||||||||||||||
| 6 | Snap | 1.61 | % | 8.3 | |||||||||||||||||||
| 7 | Fannie Mae | 1.52 | % | 11.9 | |||||||||||||||||||
| 8 | Millennium Management | 1.43 | % | 10.5 | |||||||||||||||||||
| 9 | Ropes & Gray | 1.35 | % | 12.3 | |||||||||||||||||||
| 10 | Weil Gotshal & Manges | 1.22 | % | 8.7 | |||||||||||||||||||
| 11 | Wellington Management | 1.17 | % | 10.8 | |||||||||||||||||||
| 12 | Microsoft | 1.14 | % | 7.9 | |||||||||||||||||||
| 13 | Arnold & Porter Kaye Scholer | 1.08 | % | 7.1 | |||||||||||||||||||
| 14 | Allen Overy Shearman Sterling | 1.03 | % | 15.9 | |||||||||||||||||||
| 15 | Bain Capital | 0.93 | % | 6.3 | |||||||||||||||||||
| 16 | Morrison & Foerster | 0.91 | % | 4.9 | |||||||||||||||||||
| 17 | Bank of America | 0.85 | % | 10.7 | |||||||||||||||||||
| 18 | C.V. Starr & Co | 0.85 | % | 8.6 | |||||||||||||||||||
| 19 | Wilmer Cutler Pickering Hale | 0.84 | % | 13.2 | |||||||||||||||||||
| 20 | Leidos | 0.84 | % | 7.6 | |||||||||||||||||||
| BXP’s Share of Annualized Rental Obligations | 28.73 | % | |||||||||||||||||||||
BXP’s Share of Square Feet 1 |
21.99 | % | |||||||||||||||||||||
| Weighted Average Remaining Lease Term (years) | 9.2 | ||||||||||||||||||||||
| Client | Property | Square Feet | ||||||||||||
| AstraZeneca | 290 Binney Street | 573,000 | ||||||||||||
| McDermott Will & Schulte | 725 12th Street, NW | 152,000 | ||||||||||||
| Cooley | 725 12th Street, NW | 126,000 | ||||||||||||
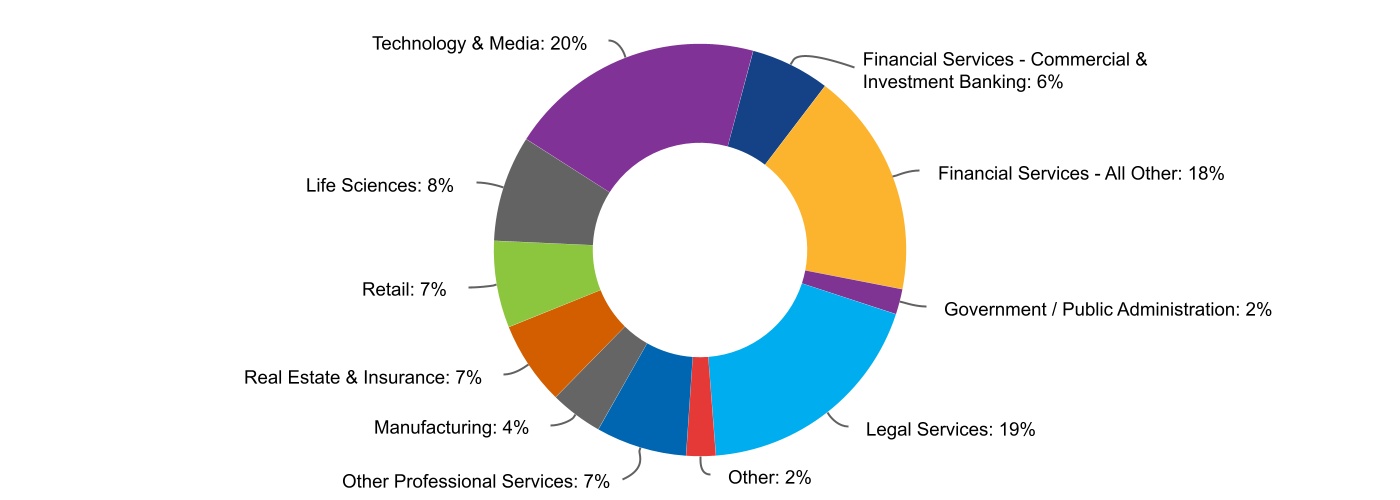
|
|
Q3 2025 | ||||
| Occupancy by location | |||||
| CBD | Suburban | Total | ||||||||||||||||||||||||||||||||||||
| Location | 30-Sep-25 | 30-Jun-25 | 30-Sep-25 | 30-Jun-25 | 30-Sep-25 | 30-Jun-25 | ||||||||||||||||||||||||||||||||
| Boston | 97.3 | % | 97.0 | % | 71.6 | % | 71.6 | % | 89.7 | % | 89.7 | % | ||||||||||||||||||||||||||
| Los Angeles | 86.7 | % | 86.3 | % | — | % | — | % | 86.7 | % | 86.3 | % | ||||||||||||||||||||||||||
| New York | 84.9 | % | 87.2 | % | 72.6 | % | 71.0 | % | 82.8 | % | 84.4 | % | ||||||||||||||||||||||||||
| San Francisco | 80.7 | % | 81.8 | % | 69.2 | % | 69.6 | % | 77.8 | % | 78.7 | % | ||||||||||||||||||||||||||
| Seattle | 82.6 | % | 84.6 | % | — | % | — | % | 82.6 | % | 84.6 | % | ||||||||||||||||||||||||||
| Washington, DC | 91.9 | % | 91.1 | % | 68.5 | % | 68.4 | % | 91.3 | % | 90.5 | % | ||||||||||||||||||||||||||
| Total Portfolio | 89.3 | % | 89.9 | % | 71.2 | % | 70.9 | % | 86.0 | % | 86.4 | % | ||||||||||||||||||||||||||
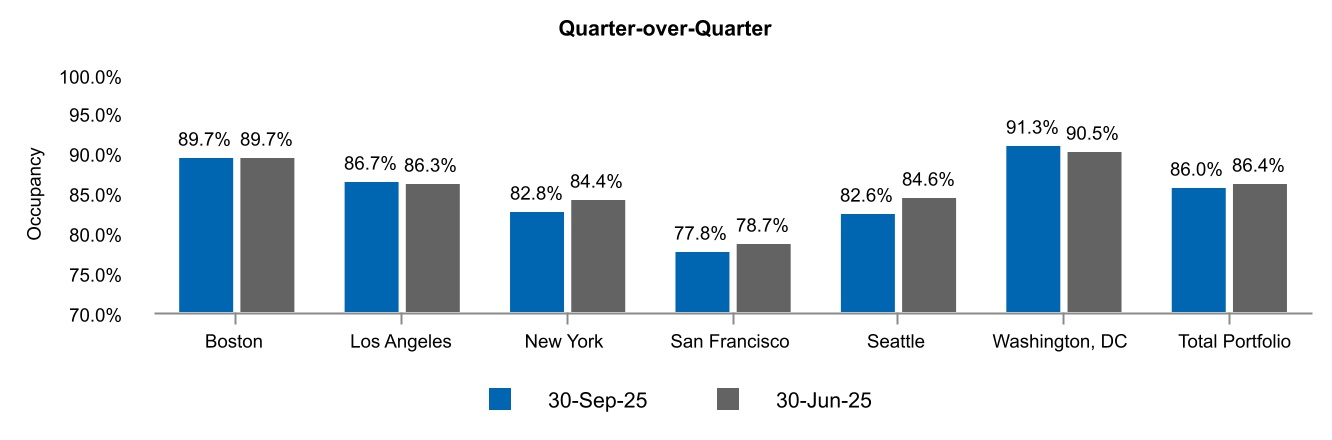
| CBD | Suburban | Total | ||||||||||||||||||||||||||||||||||||
| Location | 30-Sep-25 | 30-Sep-24 | 30-Sep-25 | 30-Sep-24 | 30-Sep-25 | 30-Sep-24 | ||||||||||||||||||||||||||||||||
| Boston | 97.2 | % | 95.7 | % | 74.8 | % | 82.0 | % | 91.2 | % | 92.0 | % | ||||||||||||||||||||||||||
| Los Angeles | 86.7 | % | 84.9 | % | — | % | — | % | 86.7 | % | 84.9 | % | ||||||||||||||||||||||||||
| New York | 87.3 | % | 88.9 | % | 72.6 | % | 67.3 | % | 84.8 | % | 85.1 | % | ||||||||||||||||||||||||||
| San Francisco | 80.7 | % | 84.2 | % | 69.2 | % | 71.2 | % | 77.8 | % | 80.9 | % | ||||||||||||||||||||||||||
| Seattle | 82.6 | % | 80.2 | % | — | % | — | % | 82.6 | % | 80.2 | % | ||||||||||||||||||||||||||
| Washington, DC | 92.8 | % | 91.2 | % | 68.5 | % | 82.6 | % | 92.2 | % | 90.9 | % | ||||||||||||||||||||||||||
| Total Portfolio | 90.1 | % | 90.0 | % | 72.7 | % | 75.7 | % | 87.0 | % | 87.5 | % | ||||||||||||||||||||||||||
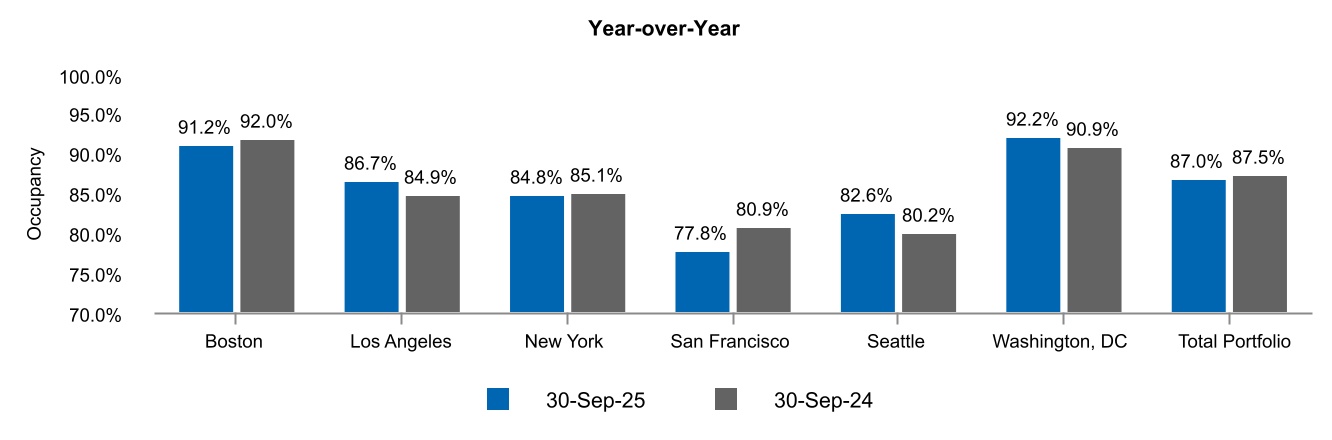
|
|
Q3 2025 | ||||
| Capital structure | |||||
| Aggregate Principal | |||||
| Mortgage Notes Payable | $ | 4,299,119 | |||
| Unsecured Line of Credit | — | ||||
| Unsecured Term Loans | 800,000 | ||||
| Unsecured Commercial Paper | 750,000 | ||||
| Unsecured Senior Notes, at face value | 9,850,000 | ||||
| Unsecured Exchangeable Senior Notes, at face value | 1,000,000 | ||||
| Outstanding Principal | 16,699,119 | ||||
| Discount on Unsecured Senior Notes | (9,007) | ||||
| Deferred Financing Costs, Net | (85,416) | ||||
| Consolidated Debt | $ | 16,604,696 | |||
| Interest Rate | ||||||||||||||||||||||||||
| Property | Maturity Date | GAAP 1 |
Stated 2 |
Outstanding Principal | ||||||||||||||||||||||
| 767 Fifth Avenue (The GM Building) (60% ownership) | June 9, 2027 | 3.64% | 3.43% | $ | 2,300,000 | |||||||||||||||||||||
| Santa Monica Business Park | October 8, 2028 | 5.36% | 5.24% | 200,000 | ||||||||||||||||||||||
| 90 Broadway, 325 Main Street, 355 Main Street and Kendall Center Green Garage | October 26, 2028 | 6.27% | 6.04% | 600,000 | ||||||||||||||||||||||
| 901 New York Avenue | January 5, 2029 | 5.06% | 5.00% | 199,119 | ||||||||||||||||||||||
| 601 Lexington Avenue (55% ownership) | January 9, 2032 | 2.93% | 2.79% | 1,000,000 | ||||||||||||||||||||||
| Total | $ | 4,299,119 | ||||||||||||||||||||||||
| Interest Rate | ||||||||||||||||||||||||||
| Maturity Date | GAAP 1 |
Stated | Outstanding Principal | |||||||||||||||||||||||
| Unsecured Senior Notes | February 1, 2026 | 3.77% | 3.65% | $ | 1,000,000 | |||||||||||||||||||||
| Unsecured Senior Notes | October 1, 2026 | 3.50% | 2.75% | 1,000,000 | ||||||||||||||||||||||
| Unsecured Senior Notes (“green bonds”) | December 1, 2027 | 6.92% | 6.75% | 750,000 | ||||||||||||||||||||||
| Unsecured Senior Notes (“green bonds”) | December 1, 2028 | 4.63% | 4.50% | 1,000,000 | ||||||||||||||||||||||
| Unsecured Senior Notes (“green bonds”) | June 21, 2029 | 3.51% | 3.40% | 850,000 | ||||||||||||||||||||||
| Unsecured Senior Notes | March 15, 2030 | 2.98% | 2.90% | 700,000 | ||||||||||||||||||||||
| Unsecured Senior Notes | January 30, 2031 | 3.34% | 3.25% | 1,250,000 | ||||||||||||||||||||||
| Unsecured Senior Notes (“green bonds”) | April 1, 2032 | 2.67% | 2.55% | 850,000 | ||||||||||||||||||||||
| Unsecured Senior Notes (“green bonds”) | October 1, 2033 | 2.52% | 2.45% | 850,000 | ||||||||||||||||||||||
| Unsecured Senior Notes (“green bonds”) | January 15, 2034 | 6.62% | 6.50% | 750,000 | ||||||||||||||||||||||
| Unsecured Senior Notes | January 15, 2035 | 5.84% | 5.75% | 850,000 | ||||||||||||||||||||||
| $ | 9,850,000 | |||||||||||||||||||||||||
| Interest Rate | ||||||||||||||||||||||||||
| Maturity Date | GAAP 1 |
Stated | Outstanding Principal | |||||||||||||||||||||||
| Unsecured Exchangeable Senior Notes | October 1, 2030 | 2.50% | 2.00% | $ | 1,000,000 | |||||||||||||||||||||
| $ | 1,000,000 | |||||||||||||||||||||||||
|
|
Q3 2025 | ||||
| Capital structure (continued) | |||||
| Shares/Units | Common Stock | |||||||||||||||||||
| Outstanding | Equivalents | Equivalent Value 5 |
||||||||||||||||||
| Common Stock | 158,400 | 158,400 | $ | 11,775,456 | ||||||||||||||||
| Common Operating Partnership Units | 18,399 | 18,399 | 1,367,782 | |||||||||||||||||
| Total Equity | 176,799 | $ | 13,143,238 | |||||||||||||||||
Consolidated Debt (A) |
$ | 16,604,696 | ||||||||||||||||||
Add: BXP’s share of unconsolidated joint venture debt 6 |
1,372,439 | |||||||||||||||||||
Less: Partners’ share of consolidated debt 7 |
1,363,861 | |||||||||||||||||||
BXP’s Share of Debt 8 (B) |
$ | 16,613,274 | ||||||||||||||||||
Consolidated Market Capitalization (C) |
$ | 29,747,934 | ||||||||||||||||||
BXP’s Share of Market Capitalization 8 (D) |
$ | 29,756,512 | ||||||||||||||||||
Consolidated Debt/Consolidated Market Capitalization (A÷C) |
55.82 | % | ||||||||||||||||||
BXP’s Share of Debt/BXP’s Share of Market Capitalization 8 (B÷D) |
55.83 | % | ||||||||||||||||||
|
|
Q3 2025 | ||||
Debt analysis 1 | |||||
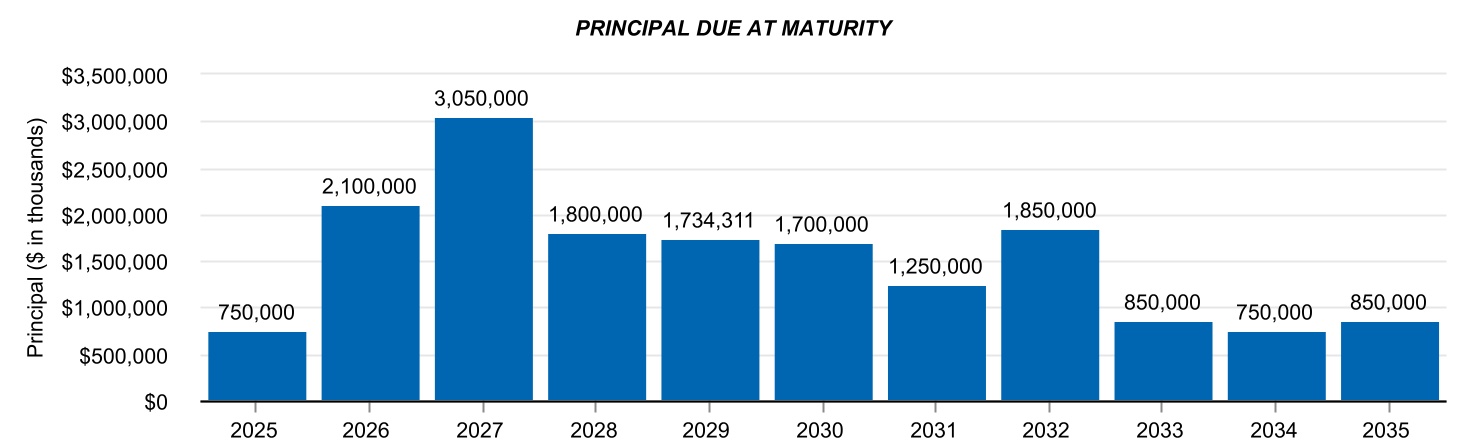
| Facility | Outstanding at September 30, 2025 | Remaining Capacity at September 30, 2025 | ||||||||||||||||||
| Unsecured Line of Credit | $ | 2,250,000 | $ | — | $ | 2,250,000 | ||||||||||||||
| Less: | ||||||||||||||||||||
Unsecured Commercial Paper 2 |
750,000 | |||||||||||||||||||
| Letters of Credit | 5,393 | |||||||||||||||||||
| Total Remaining Capacity | $ | 1,494,607 | ||||||||||||||||||
| Maturity Date | Facility | Outstanding Principal | ||||||||||||||||||
2024 Unsecured Term Loan 3 |
September 26, 2026 | $ | 100,000 | $ | 100,000 | |||||||||||||||
Unsecured Term Loan Facility 4 |
March 30, 2029 | $ | 700,000 | 700,000 | ||||||||||||||||
| $ | 800,000 | |||||||||||||||||||
| Weighted Average | ||||||||||||||||||||||||||
| % of Total Debt | Stated Rates | GAAP Rates 5 |
Maturity (years) | |||||||||||||||||||||||
| Unsecured Debt | 74.23 | % | 3.99 | % | 4.11 | % | 4.3 | |||||||||||||||||||
| Secured Debt | 25.77 | % | 3.80 | % | 3.99 | % | 3.1 | |||||||||||||||||||
| Consolidated Debt | 100.00 | % | 3.94 | % | 4.07 | % | 4.0 | |||||||||||||||||||
| Weighted Average | ||||||||||||||||||||||||||
| % of Total Debt | Stated Rates | GAAP Rates 5 |
Maturity (years) | |||||||||||||||||||||||
Floating Rate Debt 2 |
8.71 | % | 4.92 | % | 4.98 | % | 1.7 | |||||||||||||||||||
Fixed Rate Debt 3, 6 |
91.29 | % | 3.85 | % | 3.99 | % | 4.2 | |||||||||||||||||||
| Consolidated Debt | 100.00 | % | 3.94 | % | 4.07 | % | 4.0 | |||||||||||||||||||
|
|
Q3 2025 | ||||
| Senior unsecured debt covenant compliance ratios | |||||
| Senior Notes Issued Prior to December 4, 2017 | Senior Notes Issued On or After December 4, 2017 | ||||||||||||||||
| Test | Actual | ||||||||||||||||
Total Outstanding Debt/Total Assets 1 |
Less than 60% | 49.3 | % | 46.3 | % | ||||||||||||
| Secured Debt/Total Assets | Less than 50% | 15.8 | % | 14.8 | % | ||||||||||||
| Interest Coverage (Annualized Consolidated EBITDA to Annualized Interest Expense) | Greater than 1.50x | 2.94 | 2.94 | ||||||||||||||
| Unencumbered Assets/ Unsecured Debt | Greater than 150% | 222.0 | % | 238.4 | % | ||||||||||||
|
|
Q3 2025 | ||||
Net Debt to EBITDAre | |||||
| Three Months Ended | ||||||||||||||
| 30-Sep-25 | 30-Jun-25 | |||||||||||||
| Net income (loss) attributable to BXP, Inc. | $ | (121,712) | $ | 88,977 | ||||||||||
| Add: | ||||||||||||||
| Noncontrolling interest - common units of the Operating Partnership | (12,981) | 10,064 | ||||||||||||
| Noncontrolling interest in property partnerships | 17,853 | 20,100 | ||||||||||||
| Net income (loss) | (116,840) | 119,141 | ||||||||||||
| Add: | ||||||||||||||
| Interest expense | 164,299 | 162,783 | ||||||||||||
| Depreciation and amortization expense | 236,147 | 223,819 | ||||||||||||
| Impairment losses | 68,901 | — | ||||||||||||
| Less: | ||||||||||||||
| Gains on sales of real estate | 1,932 | 18,390 | ||||||||||||
Loss from unconsolidated joint ventures 2 |
(148,329) | (3,324) | ||||||||||||
| Add: | ||||||||||||||
BXP’s share of EBITDAre from unconsolidated joint ventures 3 |
32,054 | 32,222 | ||||||||||||
EBITDAre 1 |
530,958 | 522,899 | ||||||||||||
| Less: | ||||||||||||||
Partners’ share of EBITDAre from consolidated joint ventures 4 |
52,484 | 52,937 | ||||||||||||
BXP’s Share of EBITDAre 1 (A) |
478,474 | 469,962 | ||||||||||||
| Add: | ||||||||||||||
| Stock-based compensation expense | 4,404 | 11,612 | ||||||||||||
BXP’s Share of straight-line ground rent expense adjustment 1 |
(407) | 584 | ||||||||||||
BXP’s Share of lease transaction costs that qualify as rent inducements 1 |
4,999 | 3,482 | ||||||||||||
| Less: | ||||||||||||||
BXP’s Share of straight-line rent 1 |
23,859 | 20,535 | ||||||||||||
BXP’s Share of fair value lease revenue 1 |
3,019 | 3,029 | ||||||||||||
BXP’s Share of amortization and accretion related to sales type lease 1 |
265 | 261 | ||||||||||||
| Non-cash loss from early extinguishments of debt | — | — | ||||||||||||
BXP’s Share of EBITDAre – cash 1 |
$ | 460,327 | $ | 461,815 | ||||||||||
BXP’s Share of EBITDAre (Annualized) 5 (A x 4) |
$ | 1,913,896 | $ | 1,879,848 | ||||||||||
| 30-Sep-25 | 30-Jun-25 | |||||||||||||
| Consolidated debt | $ | 16,604,696 | $ | 15,811,005 | ||||||||||
| Less: | ||||||||||||||
| Cash and cash equivalents | 861,066 | 446,953 | ||||||||||||
| Cash held in escrow for 1031 exchange | — | — | ||||||||||||
Net debt 1 |
15,743,630 | 15,364,052 | ||||||||||||
| Add: | ||||||||||||||
BXP’s share of unconsolidated joint venture debt 3 |
1,372,439 | 1,386,046 | ||||||||||||
| Partners’ share of cash and cash equivalents from consolidated joint ventures | 88,172 | 143,319 | ||||||||||||
| Less: | ||||||||||||||
| BXP’s share of cash and cash equivalents from unconsolidated joint ventures | 98,449 | 115,199 | ||||||||||||
Partners’ share of consolidated joint venture debt 4 |
1,363,861 | 1,363,364 | ||||||||||||
| BXP’s share of related party note receivables | 30,500 | 30,500 | ||||||||||||
BXP’s Share of Net Debt 1 (B) |
$ | 15,711,431 | $ | 15,384,354 | ||||||||||
BXP’s Share of Net Debt to BXP’s Share of EBITDAre (Annualized) [B ÷ (A x 4)] |
8.21 | 8.18 | ||||||||||||
|
|
Q3 2025 | ||||
| Debt ratios | |||||
| Three Months Ended | ||||||||||||||
| 30-Sep-25 | 30-Jun-25 | |||||||||||||
BXP’s Share of interest expense 1 |
$ | 172,497 | $ | 169,763 | ||||||||||
| Less: | ||||||||||||||
BXP’s Share of hedge amortization, net of costs 1 |
1,781 | 1,808 | ||||||||||||
BXP’s share of fair value interest adjustment 1 |
638 | 1,217 | ||||||||||||
BXP’s Share of amortization of financing costs 1 |
4,700 | 4,665 | ||||||||||||
Adjusted interest expense excluding capitalized interest (A) |
165,378 | 162,073 | ||||||||||||
| Add: | ||||||||||||||
BXP’s Share of capitalized interest 1 |
14,239 | 14,016 | ||||||||||||
Adjusted interest expense including capitalized interest (B) |
$ | 179,617 | $ | 176,089 | ||||||||||
BXP’s Share of EBITDAre – cash 1, 2 (C) |
$ | 460,327 | $ | 461,815 | ||||||||||
Interest Coverage Ratio (excluding capitalized interest) (C÷A) |
2.78 | 2.85 | ||||||||||||
Interest Coverage Ratio (including capitalized interest) (C÷B) |
2.56 | 2.62 | ||||||||||||
| Three Months Ended | ||||||||||||||
| 30-Sep-25 | 30-Jun-25 | |||||||||||||
BXP’s Share of interest expense 1 |
$ | 172,497 | $ | 169,763 | ||||||||||
| Less: | ||||||||||||||
BXP’s Share of hedge amortization, net of costs 1 |
1,781 | 1,808 | ||||||||||||
BXP’s Share of fair value interest adjustment 1 |
638 | 1,217 | ||||||||||||
BXP’s Share of amortization of financing costs 1 |
4,700 | 4,665 | ||||||||||||
| Add: | ||||||||||||||
BXP’s Share of capitalized interest 1 |
14,239 | 14,016 | ||||||||||||
BXP’s Share of maintenance capital expenditures 1 |
23,341 | 30,211 | ||||||||||||
| Hotel improvements, equipment upgrades and replacements | 1,181 | 859 | ||||||||||||
Total Fixed Charges (A) |
$ | 204,139 | $ | 207,159 | ||||||||||
BXP’s Share of EBITDAre – cash 1, 2 (B) |
$ | 460,327 | $ | 461,815 | ||||||||||
Fixed Charge Coverage Ratio (B÷A) |
2.25 | 2.23 | ||||||||||||
|
|
Q3 2025 | ||||
| Consolidated joint ventures | |||||
| 767 Fifth Avenue | Total Consolidated | ||||||||||||||||||||||
| ASSETS | (The GM Building) 1 |
Norges Joint Ventures 1, 2 |
Joint Ventures | ||||||||||||||||||||
| Real estate, net | $ | 3,166,283 | $ | 3,145,343 | $ | 6,311,626 | |||||||||||||||||
| Cash and cash equivalents | 61,712 | 141,082 | 202,794 | ||||||||||||||||||||
| Other assets | 339,543 | 508,092 | 847,635 | ||||||||||||||||||||
| Total assets | $ | 3,567,538 | $ | 3,794,517 | $ | 7,362,055 | |||||||||||||||||
| LIABILITIES AND EQUITY | |||||||||||||||||||||||
| Liabilities: | |||||||||||||||||||||||
| Mortgage notes payable, net | $ | 2,294,109 | $ | 991,541 | $ | 3,285,650 | |||||||||||||||||
Other liabilities |
72,808 | 163,078 | 235,886 | ||||||||||||||||||||
| Total liabilities | 2,366,917 | 1,154,619 | 3,521,536 | ||||||||||||||||||||
| Equity: | |||||||||||||||||||||||
| BXP, Inc. | 721,855 | 1,163,767 | 1,885,622 | ||||||||||||||||||||
| Noncontrolling interests | 478,766 | 1,476,131 | 1,954,897 | 3 |
|||||||||||||||||||
| Total equity | 1,200,621 | 2,639,898 | 3,840,519 | ||||||||||||||||||||
| Total liabilities and equity | $ | 3,567,538 | $ | 3,794,517 | $ | 7,362,055 | |||||||||||||||||
| BXP’s nominal ownership percentage | 60% | 55% | |||||||||||||||||||||
Partners’ share of cash and cash equivalents 4 |
$ | 24,685 | $ | 63,487 | $ | 88,172 | |||||||||||||||||
Partners’ share of consolidated debt 4 |
$ | 917,668 | 5 |
$ | 446,193 | $ | 1,363,861 | ||||||||||||||||
|
|
Q3 2025 | ||||
| Consolidated joint ventures (continued) | |||||
| 767 Fifth Avenue | Total Consolidated | |||||||||||||||||||
| (The GM Building) | Norges Joint Ventures 1 |
Joint Ventures | ||||||||||||||||||
| Revenue | ||||||||||||||||||||
Lease 2 |
$ | 81,717 | $ | 104,152 | $ | 185,869 | ||||||||||||||
| Straight-line rent | 3,256 | 14,676 | 17,932 | |||||||||||||||||
| Fair value lease revenue | (27) | — | (27) | |||||||||||||||||
| Termination income | — | — | — | |||||||||||||||||
| Total lease revenue | 84,946 | 118,828 | 203,774 | |||||||||||||||||
| Parking and other | — | 1,622 | 1,622 | |||||||||||||||||
Total rental revenue 3 |
84,946 | 120,450 | 205,396 | |||||||||||||||||
| Expenses | ||||||||||||||||||||
| Operating | 35,557 | 45,983 | 81,540 | |||||||||||||||||
| Net Operating Income (NOI) | 49,389 | 74,467 | 123,856 | |||||||||||||||||
| Other income (expense) | ||||||||||||||||||||
| Development and management services revenue | — | — | — | |||||||||||||||||
Gains from investments in securities |
— | 8 | 8 | |||||||||||||||||
| Interest and other income | 776 | 1,816 | 2,592 | |||||||||||||||||
| Interest expense | (21,395) | (7,693) | (29,088) | |||||||||||||||||
| Depreciation and amortization expense | (18,366) | (32,298) | (50,664) | |||||||||||||||||
| General and administrative expense | (67) | (169) | (236) | |||||||||||||||||
| Total other income (expense) | (39,052) | (38,336) | (77,388) | |||||||||||||||||
| Net income | $ | 10,337 | $ | 36,131 | $ | 46,468 | ||||||||||||||
| BXP’s nominal ownership percentage | 60% | 55% | ||||||||||||||||||
| 767 Fifth Avenue | Total Consolidated | |||||||||||||||||||
| Reconciliation of Partners’ share of FFO | (The GM Building) | Norges Joint Ventures 1 |
Joint Ventures | |||||||||||||||||
| Net income | $ | 10,337 | $ | 36,131 | $ | 46,468 | ||||||||||||||
| Add: Depreciation and amortization expense | 18,366 | 32,298 | 50,664 | |||||||||||||||||
| Entity FFO | $ | 28,703 | $ | 68,429 | $ | 97,132 | ||||||||||||||
Noncontrolling interest in property partnerships (Partners’ NCI) 4 |
$ | 3,008 | $ | 14,845 | $ | 17,853 | ||||||||||||||
Partners’ share of depreciation and amortization expense after BXP’s basis differential 4 |
7,720 | 14,895 | 22,615 | |||||||||||||||||
Partners’ share FFO 4 |
$ | 10,728 | $ | 29,740 | $ | 40,468 | ||||||||||||||
| Reconciliation of BXP’s share of FFO | ||||||||||||||||||||
BXP’s share of net income adjusted for partners’ NCI |
$ | 7,329 | $ | 21,286 | $ | 28,615 | ||||||||||||||
Depreciation and amortization expense - BXP’s basis difference |
85 | 405 | 490 | |||||||||||||||||
BXP’s share of depreciation and amortization expense |
10,561 | 16,998 | 27,559 | |||||||||||||||||
| BXP’s share of FFO | $ | 17,975 | $ | 38,689 | $ | 56,664 | ||||||||||||||
|
|
Q3 2025 | ||||
Unconsolidated joint ventures 1 | |||||
| BXP’s Nominal Ownership | Mortgage/Construction Loans Payable, Net | Interest Rate | ||||||||||||||||||||||||||||||||||||
| Property | Net Equity | Maturity Date | Stated | GAAP 2 |
||||||||||||||||||||||||||||||||||
| Boston | ||||||||||||||||||||||||||||||||||||||
| The Hub on Causeway - Podium | 50.00 | % | $ | 55,231 | $ | 61,793 | April 9, 2031 | 5.73 | % | 5.94 | % | |||||||||||||||||||||||||||
100 Causeway Street |
50.00 | % | 48,833 | 168,076 | April 9, 2031 | 5.73 | % | 5.94 | % | |||||||||||||||||||||||||||||
| Hub50House | 50.00 | % | 33,654 | 92,042 | June 17, 2032 | 4.43 | % | 4.51 | % | |||||||||||||||||||||||||||||
| Hotel Air Rights | 50.00 | % | 11,849 | — | — | — | — | % | ||||||||||||||||||||||||||||||
| 1265 Main Street | 50.00 | % | 3,217 | 16,391 | January 1, 2032 | 3.77 | % | 3.84 | % | |||||||||||||||||||||||||||||
17 Hartwell Avenue 3 |
20.00 | % | 7,398 | — | July 10, 2030 | N/A | N/A | |||||||||||||||||||||||||||||||
| Los Angeles | ||||||||||||||||||||||||||||||||||||||
| Colorado Center | 50.00 | % | 69,015 | 274,835 | August 9, 2027 | 3.56 | % | 3.59 | % | |||||||||||||||||||||||||||||
Beach Cities Media Campus 4 |
50.00 | % | 98 | — | — | — | % | — | % | |||||||||||||||||||||||||||||
| New York | ||||||||||||||||||||||||||||||||||||||
| 360 Park Avenue South | 71.11 | % | 93,988 | 155,479 | December 13, 2027 | 6.65 | % | 6.96 | % | |||||||||||||||||||||||||||||
Dock 72 5 |
50.00 | % | (14,326) | 99,135 | December 18, 2025 | 5.91 | % | 6.19 | % | |||||||||||||||||||||||||||||
| 200 Fifth Avenue | 26.69 | % | 75,376 | 154,183 | November 24, 2028 | 4.34 | % | 5.60 | % | |||||||||||||||||||||||||||||
3 Hudson Boulevard 6 |
25.00 | % | 110,581 | 20,000 | August 7, 2024 | 11.86 | % | 11.86 | % | |||||||||||||||||||||||||||||
290 Coles Street - Common Equity 7 |
19.46 | % | 19,813 | — | March 5, 2029 | N/A | N/A | |||||||||||||||||||||||||||||||
290 Coles Street - Preferred Equity 8 |
— | % | 12,014 | — | — | — | % | — | % | |||||||||||||||||||||||||||||
| San Francisco | ||||||||||||||||||||||||||||||||||||||
| Platform 16 | 55.00 | % | 58,076 | — | — | — | % | — | % | |||||||||||||||||||||||||||||
Gateway Commons 9 |
50.00 | % | 125,090 | — | — | — | % | — | % | |||||||||||||||||||||||||||||
| 751 Gateway | 49.00 | % | 118,509 | — | — | — | % | — | % | |||||||||||||||||||||||||||||
| Seattle | ||||||||||||||||||||||||||||||||||||||
| Safeco Plaza | 33.67 | % | 121 | 84,070 | September 1, 2026 | 4.82 | % | 6.21 | % | |||||||||||||||||||||||||||||
| Washington, DC | ||||||||||||||||||||||||||||||||||||||
| 7750 Wisconsin Avenue (Marriott International Headquarters) | 50.00 | % | 47,363 | 124,604 | February 27, 2035 | 5.49 | % | 5.54 | % | |||||||||||||||||||||||||||||
| 1001 6th Street | 50.00 | % | 45,772 | — | — | — | % | — | % | |||||||||||||||||||||||||||||
| 13100 & 13150 Worldgate Drive | 50.00 | % | 19,855 | — | — | — | % | — | % | |||||||||||||||||||||||||||||
| Market Square North | 50.00 | % | (23,691) | 62,487 | November 10, 2025 | 6.61 | % | 6.78 | % | |||||||||||||||||||||||||||||
| Wisconsin Place Parking Facility | 33.33 | % | 29,209 | — | — | — | % | — | % | |||||||||||||||||||||||||||||
500 North Capitol Street, N.W. 10 |
30.00 | % | (12,435) | 31,399 | June 5, 2026 | 6.83 | % | 7.16 | % | |||||||||||||||||||||||||||||
| Skymark - Reston Next Residential | 20.00 | % | 14,702 | 27,945 | May 13, 2026 | 6.28 | % | 6.60 | % | |||||||||||||||||||||||||||||
| 949,312 | ||||||||||||||||||||||||||||||||||||||
Investments with deficit balances reflected within Other Liabilities |
50,452 | |||||||||||||||||||||||||||||||||||||
| Investments in Unconsolidated Joint Ventures | $ | 999,764 | ||||||||||||||||||||||||||||||||||||
| Mortgage/Construction Loans Payable, Net | $ | 1,372,439 | ||||||||||||||||||||||||||||||||||||
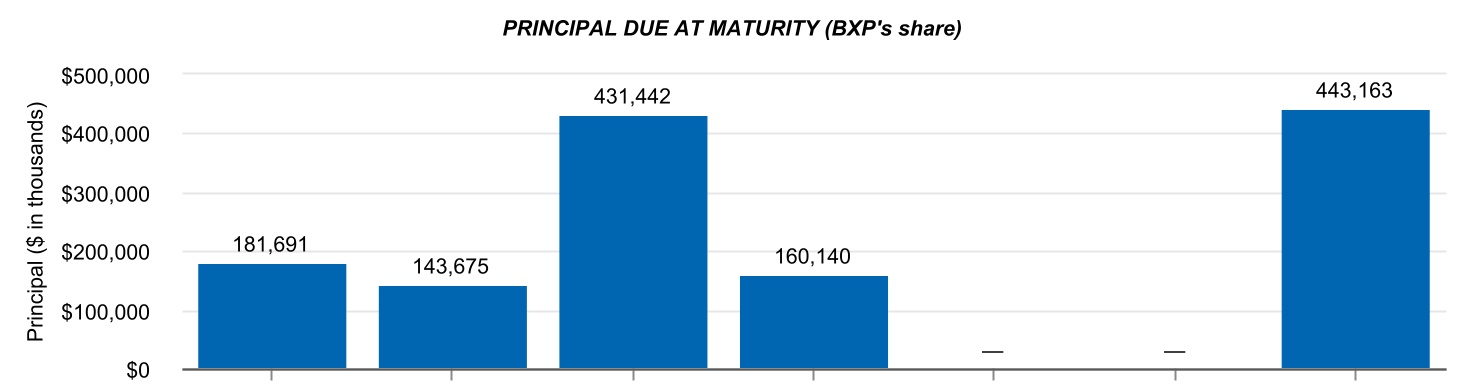
2025 6 |
2026 | 2027 | 2028 | 2029 | 2030 | Thereafter | |||||||||||||||||
|
|
Q3 2025 | ||||
Unconsolidated joint ventures (continued) 1 | |||||
| Weighted Average | ||||||||||||||||||||||||||
| % of Total Debt | Stated Rates | GAAP Rates 2 |
Maturity (years) | |||||||||||||||||||||||
| Floating Rate Debt | 32.72 | % | 6.55 | % | 7.01 | % | 1.0 | |||||||||||||||||||
Fixed Rate Debt 11 |
67.28 | % | 4.69 | % | 4.99 | % | 6.0 | |||||||||||||||||||
| Total Debt | 100.00 | % | 5.30 | % | 5.65 | % | 4.3 | |||||||||||||||||||
|
|
Q3 2025 | ||||
| Unconsolidated joint ventures (continued) | |||||
| Boston | Los Angeles | New York | San Francisco | Seattle | Washington, DC | Total Unconsolidated Joint Ventures | ||||||||||||||||||||||||||||||||||||||
| Revenue | ||||||||||||||||||||||||||||||||||||||||||||
Lease 2 |
$ | 27,278 | $ | 20,367 | $ | 16,354 | $ | 17,803 | $ | 8,537 | $ | 24,461 | $ | 114,800 | ||||||||||||||||||||||||||||||
| Straight-line rent | 590 | (1,428) | 3,922 | (172) | 684 | (123) | 3,473 | |||||||||||||||||||||||||||||||||||||
| Fair value lease revenue | — | — | 1,300 | — | 1,293 | — | 2,593 | |||||||||||||||||||||||||||||||||||||
| Termination income | — | — | — | 282 | — | — | 282 | |||||||||||||||||||||||||||||||||||||
| Amortization and accretion related to sales-type lease | 57 | — | — | — | — | — | 57 | |||||||||||||||||||||||||||||||||||||
| Total lease revenue | 27,925 | 18,939 | 21,576 | 17,913 | 10,514 | 24,338 | 121,205 | |||||||||||||||||||||||||||||||||||||
| Parking and other | 43 | 1,967 | 49 | 221 | 592 | 818 | 3,690 | |||||||||||||||||||||||||||||||||||||
Total rental revenue 3 |
27,968 | 20,906 | 21,625 | 18,134 | 11,106 | 25,156 | 124,895 | |||||||||||||||||||||||||||||||||||||
| Expenses | ||||||||||||||||||||||||||||||||||||||||||||
| Operating | 10,164 | 7,944 | 15,965 | 9,597 | 3,551 | 9,232 | 56,453 | |||||||||||||||||||||||||||||||||||||
| Net operating income | 17,804 | 12,962 | 5,660 | 8,537 | 7,555 | 15,924 | 68,442 | |||||||||||||||||||||||||||||||||||||
| Other income (expense) | ||||||||||||||||||||||||||||||||||||||||||||
| Development and management services revenue | — | — | 417 | — | — | — | 417 | |||||||||||||||||||||||||||||||||||||
| Interest and other income (loss) | 535 | 1,166 | 820 | 11 | 147 | 199 | 2,878 | |||||||||||||||||||||||||||||||||||||
| Interest expense | (10,562) | (5,052) | (17,385) | — | (4,159) | (10,044) | (47,202) | |||||||||||||||||||||||||||||||||||||
| Unrealized gain/loss on derivative instruments | — | — | (1,403) | 4 |
— | — | — | (1,403) | ||||||||||||||||||||||||||||||||||||
| Transaction costs | (27) | — | — | — | (28) | 53 | (2) | |||||||||||||||||||||||||||||||||||||
| Depreciation and amortization expense | (8,470) | (5,330) | (10,465) | (10,076) | (5,213) | (5,855) | (45,409) | |||||||||||||||||||||||||||||||||||||
| General and administrative expense | (1) | 5 | (111) | (4) | (14) | — | (125) | |||||||||||||||||||||||||||||||||||||
| Gain on sale of real estate | — | 4,762 | — | — | — | — | 4,762 | |||||||||||||||||||||||||||||||||||||
| Total other income (expense) | (18,525) | (4,449) | (28,127) | (10,069) | (9,267) | (15,647) | (86,084) | |||||||||||||||||||||||||||||||||||||
| Net income (loss) | $ | (721) | $ | 8,513 | $ | (22,467) | $ | (1,532) | $ | (1,712) | $ | 277 | $ | (17,642) | ||||||||||||||||||||||||||||||
| Reconciliation of BXP’s share of Funds from Operations (FFO) | ||||||||||||||||||||||||||||||||||||||||||||
| BXP’s share of net income (loss) | $ | (361) | $ | 4,257 | $ | (9,863) | $ | (867) | $ | (575) | $ | 796 | $ | (6,613) | ||||||||||||||||||||||||||||||
| Basis differential | ||||||||||||||||||||||||||||||||||||||||||||
| Straight-line rent | $ | — | $ | 91 | 5 |
$ | 101 | 5 |
$ | — | $ | — | $ | — | $ | 192 | ||||||||||||||||||||||||||||
| Fair value lease revenue | — | 305 | 5 |
15 | 5 |
— | — | — | 320 | |||||||||||||||||||||||||||||||||||
| Fair value interest adjustment | — | — | (499) | — | — | — | (499) | |||||||||||||||||||||||||||||||||||||
| Amortization of financing costs | — | — | 111 | — | — | — | 111 | |||||||||||||||||||||||||||||||||||||
| Unrealized gain/loss on derivative instruments | — | — | 374 | 4 |
— | — | — | 374 | ||||||||||||||||||||||||||||||||||||
| Depreciation and amortization expense | (6) | 520 | 5 |
591 | 5 |
1,301 | 5 |
772 | (114) | 3,064 | ||||||||||||||||||||||||||||||||||
| Gain on sale of real estate | — | (145) | — | — | — | — | (145) | |||||||||||||||||||||||||||||||||||||
Impairment loss on investment 6 |
— | — | — | (145,133) | — | — | (145,133) | |||||||||||||||||||||||||||||||||||||
Total basis differential 7 |
(6) | 771 | 5 |
693 | 5 |
(143,832) | 5 |
772 | (114) | (141,716) | ||||||||||||||||||||||||||||||||||
| Income (loss) from unconsolidated joint ventures | (367) | 5,028 | (9,170) | (144,699) | 197 | 682 | (148,329) | |||||||||||||||||||||||||||||||||||||
| Add: | ||||||||||||||||||||||||||||||||||||||||||||
| BXP’s share of depreciation and amortization expense | 4,237 | 2,144 | 5 |
3,929 | 5 |
3,714 | 5 |
983 | 2,265 | 17,272 | ||||||||||||||||||||||||||||||||||
Impairment loss on investment 6 |
— | — | — | 145,133 | — | — | 145,133 | |||||||||||||||||||||||||||||||||||||
| Less: | ||||||||||||||||||||||||||||||||||||||||||||
BXP’s share of gain on sale of real estate 8 |
— | 2,236 | — | — | — | — | 2,236 | |||||||||||||||||||||||||||||||||||||
| BXP’s share of FFO | $ | 3,870 | $ | 4,936 | $ | (5,241) | $ | 4,148 | $ | 1,180 | $ | 2,947 | $ | 11,840 | ||||||||||||||||||||||||||||||
|
|
Q3 2025 | ||||
Lease expirations - All in-service properties1, 2, 3 | |||||
| BXP’s Share | |||||||||||||||||||||||||||||||||||||||||||||||
| Year | Rentable Square Footage4 |
Rentable Square Footage4 |
Current Annualized Rental Obligations Under Expiring Leases | Annualized Rental Obligations Under Expiring Leases with future step-ups | |||||||||||||||||||||||||||||||||||||||||||
| Percentage of Total Square Feet | |||||||||||||||||||||||||||||||||||||||||||||||
| $ | $/PSF | $ | $/PSF | ||||||||||||||||||||||||||||||||||||||||||||
| 2025 | 295,798 | 243,386 | 18,608,901 | 76.46 | 18,610,804 | 76.47 | 0.61 | % | |||||||||||||||||||||||||||||||||||||||
| 2026 | 1,594,543 | 1,403,577 | 105,655,990 | 75.28 | 108,176,242 | 77.07 | 3.50 | % | |||||||||||||||||||||||||||||||||||||||
| 2027 | 1,941,938 | 1,833,589 | 135,239,999 | 73.76 | 138,914,602 | 75.76 | 4.58 | % | |||||||||||||||||||||||||||||||||||||||
| 2028 | 2,935,186 | 2,301,497 | 201,152,905 | 87.40 | 212,013,765 | 92.12 | 5.74 | % | |||||||||||||||||||||||||||||||||||||||
| 2029 | 3,696,659 | 3,063,138 | 231,359,395 | 75.53 | 245,352,899 | 80.10 | 7.65 | % | |||||||||||||||||||||||||||||||||||||||
| 2030 | 2,661,373 | 2,530,429 | 198,001,505 | 78.25 | 211,745,308 | 83.68 | 6.32 | % | |||||||||||||||||||||||||||||||||||||||
| 2031 | 2,638,440 | 2,432,521 | 212,291,568 | 87.27 | 228,564,324 | 93.96 | 6.07 | % | |||||||||||||||||||||||||||||||||||||||
| 2032 | 2,752,315 | 2,470,842 | 188,994,198 | 76.49 | 222,421,936 | 90.02 | 6.17 | % | |||||||||||||||||||||||||||||||||||||||
| 2033 | 3,060,150 | 2,884,737 | 236,834,208 | 82.10 | 273,747,789 | 94.90 | 7.20 | % | |||||||||||||||||||||||||||||||||||||||
| 2034 | 3,377,266 | 2,834,605 | 262,776,836 | 92.70 | 294,342,377 | 103.84 | 7.08 | % | |||||||||||||||||||||||||||||||||||||||
| Thereafter | 14,383,289 | 11,567,947 | 938,229,969 | 81.11 | 1,139,127,134 | 98.47 | 28.88 | % | |||||||||||||||||||||||||||||||||||||||
| BXP’s Share | |||||||||||||||||||||||||||||||||||||||||||||||
| Year | Rentable Square Footage4 |
Rentable Square Footage4 |
Current Annualized Rental Obligations Under Expiring Leases | Annualized Rental Obligations Under Expiring Leases with future step-ups | |||||||||||||||||||||||||||||||||||||||||||
| Percentage of Total Square Feet | |||||||||||||||||||||||||||||||||||||||||||||||
| $ | $/PSF | $ | $/PSF | ||||||||||||||||||||||||||||||||||||||||||||
| 2025 | 13,181 | 13,181 | 1,112,191 | 84.38 | 1,112,191 | 84.38 | 0.54 | % | |||||||||||||||||||||||||||||||||||||||
| 2026 | 98,762 | 84,415 | 14,436,343 | 171.02 | 14,470,352 | 171.42 | 3.46 | % | |||||||||||||||||||||||||||||||||||||||
| 2027 | 129,868 | 115,779 | 12,258,229 | 105.88 | 12,391,124 | 107.02 | 4.75 | % | |||||||||||||||||||||||||||||||||||||||
| 2028 | 93,498 | 91,721 | 9,574,304 | 104.39 | 9,834,055 | 107.22 | 3.76 | % | |||||||||||||||||||||||||||||||||||||||
| 2029 | 177,656 | 172,331 | 18,113,074 | 105.11 | 18,941,575 | 109.91 | 7.07 | % | |||||||||||||||||||||||||||||||||||||||
| 2030 | 171,340 | 135,365 | 12,555,309 | 92.75 | 13,359,970 | 98.70 | 5.56 | % | |||||||||||||||||||||||||||||||||||||||
| 2031 | 117,545 | 103,368 | 11,524,809 | 111.49 | 12,527,392 | 121.19 | 4.24 | % | |||||||||||||||||||||||||||||||||||||||
| 2032 | 99,134 | 97,425 | 7,356,661 | 75.51 | 8,428,775 | 86.52 | 4.00 | % | |||||||||||||||||||||||||||||||||||||||
| 2033 | 464,245 | 430,842 | 31,701,912 | 73.58 | 52,372,169 | 121.56 | 17.68 | % | |||||||||||||||||||||||||||||||||||||||
| 2034 | 361,438 | 264,966 | 34,914,121 | 131.77 | 40,494,643 | 152.83 | 10.87 | % | |||||||||||||||||||||||||||||||||||||||
| Thereafter | 515,820 | 425,727 | 48,283,861 | 113.42 | 46,350,940 | 108.87 | 17.47 | % | |||||||||||||||||||||||||||||||||||||||
| BXP’s Share | |||||||||||||||||||||||||||||||||||||||||||||||
| Year | Rentable Square Footage4 |
Rentable Square Footage4 |
Current Annualized Rental Obligations Under Expiring Leases | Annualized Rental Obligations Under Expiring Leases with future step-ups | |||||||||||||||||||||||||||||||||||||||||||
| Percentage of Total Square Feet | |||||||||||||||||||||||||||||||||||||||||||||||
| $ | $/PSF | $ | $/PSF | ||||||||||||||||||||||||||||||||||||||||||||
| 2025 | 308,979 | 256,567 | 19,721,092 | 76.87 | 19,722,995 | 76.87 | 0.60 | % | |||||||||||||||||||||||||||||||||||||||
| 2026 | 1,693,305 | 1,487,992 | 120,092,333 | 80.71 | 122,646,594 | 82.42 | 3.50 | % | |||||||||||||||||||||||||||||||||||||||
| 2027 | 2,071,806 | 1,949,368 | 147,498,228 | 75.66 | 151,305,726 | 77.62 | 4.59 | % | |||||||||||||||||||||||||||||||||||||||
| 2028 | 3,028,684 | 2,393,218 | 210,727,209 | 88.05 | 221,847,820 | 92.70 | 5.63 | % | |||||||||||||||||||||||||||||||||||||||
| 2029 | 3,874,315 | 3,235,469 | 249,472,469 | 77.11 | 264,294,474 | 81.69 | 7.61 | % | |||||||||||||||||||||||||||||||||||||||
| 2030 | 2,832,713 | 2,665,794 | 210,556,814 | 78.98 | 225,105,278 | 84.44 | 6.27 | % | |||||||||||||||||||||||||||||||||||||||
| 2031 | 2,755,985 | 2,535,889 | 223,816,377 | 88.26 | 241,091,716 | 95.07 | 5.97 | % | |||||||||||||||||||||||||||||||||||||||
| 2032 | 2,851,449 | 2,568,267 | 196,350,859 | 76.45 | 230,850,711 | 89.89 | 6.04 | % | |||||||||||||||||||||||||||||||||||||||
| 2033 | 3,524,395 | 3,315,579 | 268,536,120 | 80.99 | 326,119,958 | 98.36 | 7.80 | % | |||||||||||||||||||||||||||||||||||||||
| 2034 | 3,738,704 | 3,099,571 | 297,690,957 | 96.04 | 334,837,020 | 108.03 | 7.29 | % | |||||||||||||||||||||||||||||||||||||||
| Thereafter | 14,899,109 | 11,993,674 | 986,513,830 | 82.25 | 1,185,478,074 | 98.84 | 28.22 | % | |||||||||||||||||||||||||||||||||||||||
|
|
Q3 2025 | ||||
Lease expirations - Boston region in-service properties 1, 2, 3 | |||||
| BXP’s Share | |||||||||||||||||||||||||||||||||||||||||
| Year | Rentable Square Footage4 |
Rentable Square Footage4 |
Current Annualized Rental Obligations Under Expiring Leases | Annualized Rental Obligations Under Expiring Leases with future step-ups | |||||||||||||||||||||||||||||||||||||
| $ | $/PSF | $ | $/PSF | ||||||||||||||||||||||||||||||||||||||
| 2025 | 42,596 | 42,596 | 2,060,573 | 48.37 | 2,060,573 | 48.37 | |||||||||||||||||||||||||||||||||||
| 2026 | 382,431 | 331,659 | 22,913,895 | 69.09 | 23,213,404 | 69.99 | |||||||||||||||||||||||||||||||||||
| 2027 | 475,106 | 466,246 | 34,350,986 | 73.68 | 35,107,291 | 75.30 | |||||||||||||||||||||||||||||||||||
| 2028 | 886,507 | 861,278 | 83,027,254 | 96.40 | 87,818,498 | 101.96 | |||||||||||||||||||||||||||||||||||
| 2029 | 1,186,291 | 1,052,805 | 72,742,468 | 69.09 | 77,365,594 | 73.49 | |||||||||||||||||||||||||||||||||||
| 2030 | 1,291,831 | 1,275,952 | 91,885,973 | 72.01 | 97,276,853 | 76.24 | |||||||||||||||||||||||||||||||||||
| 2031 | 676,899 | 609,006 | 41,536,822 | 68.20 | 44,863,127 | 73.67 | |||||||||||||||||||||||||||||||||||
| 2032 | 1,019,296 | 1,019,296 | 80,028,426 | 78.51 | 98,043,321 | 96.19 | |||||||||||||||||||||||||||||||||||
| 2033 | 650,249 | 624,826 | 51,447,039 | 82.34 | 59,310,730 | 94.92 | |||||||||||||||||||||||||||||||||||
| 2034 | 1,427,022 | 1,278,225 | 110,993,081 | 86.83 | 124,685,920 | 97.55 | |||||||||||||||||||||||||||||||||||
| Thereafter | 4,879,901 | 3,948,359 | 326,616,353 | 82.72 | 410,438,113 | 103.95 | |||||||||||||||||||||||||||||||||||
| BXP’s Share | |||||||||||||||||||||||||||||||||||||||||
| Year | Rentable Square Footage4 |
Rentable Square Footage4 |
Current Annualized Rental Obligations Under Expiring Leases | Annualized Rental Obligations Under Expiring Leases with future step-ups | |||||||||||||||||||||||||||||||||||||
| $ | $/PSF | $ | $/PSF | ||||||||||||||||||||||||||||||||||||||
| 2025 | 3,774 | 3,774 | 620,191 | 164.33 | 620,191 | 164.33 | |||||||||||||||||||||||||||||||||||
| 2026 | 29,065 | 28,750 | 3,337,044 | 116.07 | 3,353,731 | 116.65 | |||||||||||||||||||||||||||||||||||
| 2027 | 54,187 | 47,873 | 8,216,445 | 171.63 | 8,288,448 | 173.14 | |||||||||||||||||||||||||||||||||||
| 2028 | 38,825 | 38,825 | 5,765,396 | 148.50 | 5,892,852 | 151.78 | |||||||||||||||||||||||||||||||||||
| 2029 | 76,098 | 75,423 | 10,032,875 | 133.02 | 10,286,533 | 136.38 | |||||||||||||||||||||||||||||||||||
| 2030 | 98,923 | 62,948 | 6,355,829 | 100.97 | 6,586,569 | 104.64 | |||||||||||||||||||||||||||||||||||
| 2031 | 14,668 | 14,668 | 1,196,760 | 81.59 | 1,292,196 | 88.10 | |||||||||||||||||||||||||||||||||||
| 2032 | 57,916 | 57,325 | 4,366,643 | 76.17 | 4,988,975 | 87.03 | |||||||||||||||||||||||||||||||||||
| 2033 | 287,788 | 254,385 | 21,337,445 | 83.88 | 41,404,589 | 162.76 | |||||||||||||||||||||||||||||||||||
| 2034 | 164,155 | 131,856 | 10,960,882 | 83.13 | 12,040,392 | 91.32 | |||||||||||||||||||||||||||||||||||
| Thereafter | 187,499 | 176,988 | 14,723,551 | 83.19 | 16,419,533 | 92.77 | |||||||||||||||||||||||||||||||||||
| BXP’s Share | |||||||||||||||||||||||||||||||||||||||||
| Year | Rentable Square Footage4 |
Rentable Square Footage4 |
Current Annualized Rental Obligations Under Expiring Leases | Annualized Rental Obligations Under Expiring Leases with future step-ups | |||||||||||||||||||||||||||||||||||||
| $ | $/PSF | $ | $/PSF | ||||||||||||||||||||||||||||||||||||||
| 2025 | 46,370 | 46,370 | 2,680,764 | 57.81 | 2,680,764 | 57.81 | |||||||||||||||||||||||||||||||||||
| 2026 | 411,496 | 360,409 | 26,250,939 | 72.84 | 26,567,135 | 73.71 | |||||||||||||||||||||||||||||||||||
| 2027 | 529,293 | 514,119 | 42,567,431 | 82.80 | 43,395,739 | 84.41 | |||||||||||||||||||||||||||||||||||
| 2028 | 925,332 | 900,103 | 88,792,650 | 98.65 | 93,711,350 | 104.11 | |||||||||||||||||||||||||||||||||||
| 2029 | 1,262,389 | 1,128,228 | 82,775,343 | 73.37 | 87,652,127 | 77.69 | |||||||||||||||||||||||||||||||||||
| 2030 | 1,390,754 | 1,338,900 | 98,241,802 | 73.38 | 103,863,422 | 77.57 | |||||||||||||||||||||||||||||||||||
| 2031 | 691,567 | 623,674 | 42,733,582 | 68.52 | 46,155,323 | 74.01 | |||||||||||||||||||||||||||||||||||
| 2032 | 1,077,212 | 1,076,621 | 84,395,069 | 78.39 | 103,032,296 | 95.70 | |||||||||||||||||||||||||||||||||||
| 2033 | 938,037 | 879,211 | 72,784,484 | 82.78 | 100,715,319 | 114.55 | |||||||||||||||||||||||||||||||||||
| 2034 | 1,591,177 | 1,410,081 | 121,953,963 | 86.49 | 136,726,312 | 96.96 | |||||||||||||||||||||||||||||||||||
| Thereafter | 5,067,400 | 4,125,347 | 341,339,904 | 82.74 | 426,857,646 | 103.47 | |||||||||||||||||||||||||||||||||||
|
|
Q3 2025 | ||||
Quarterly lease expirations - Boston region in-service properties 1, 2, 3 | |||||
| BXP’s Share | |||||||||||||||||||||||||||||||||||||||||
| Quarter | Rentable Square Footage4 |
Rentable Square Footage4 |
Current Annualized Rental Obligations Under Expiring Leases | Annualized Rental Obligations Under Expiring Leases with future step-ups | |||||||||||||||||||||||||||||||||||||
| $ | $/PSF | $ | $/PSF | ||||||||||||||||||||||||||||||||||||||
| Q1 2025 | — | — | — | — | — | — | |||||||||||||||||||||||||||||||||||
| Q2 2025 | — | — | — | — | — | — | |||||||||||||||||||||||||||||||||||
| Q3 2025 | — | — | — | — | — | — | |||||||||||||||||||||||||||||||||||
| Q4 2025 | 42,596 | 42,596 | 2,060,573 | 48.37 | 2,060,573 | 48.37 | |||||||||||||||||||||||||||||||||||
| Total 2025 | 42,596 | 42,596 | 2,060,573 | 48.37 | 2,060,573 | 48.37 | |||||||||||||||||||||||||||||||||||
| Q1 2026 | 92,806 | 87,407 | 5,743,209 | 65.71 | 5,743,209 | 65.71 | |||||||||||||||||||||||||||||||||||
| Q2 2026 | 71,316 | 45,106 | 2,957,267 | 65.56 | 3,159,837 | 70.05 | |||||||||||||||||||||||||||||||||||
| Q3 2026 | 87,899 | 75,233 | 5,248,340 | 69.76 | 5,248,341 | 69.76 | |||||||||||||||||||||||||||||||||||
| Q4 2026 | 130,410 | 123,914 | 8,965,080 | 72.35 | 9,062,018 | 73.13 | |||||||||||||||||||||||||||||||||||
| Total 2026 | 382,431 | 331,659 | 22,913,895 | 69.09 | 23,213,404 | 69.99 | |||||||||||||||||||||||||||||||||||
| BXP’s Share | |||||||||||||||||||||||||||||||||||||||||
| Quarter | Rentable Square Footage4 |
Rentable Square Footage4 |
Current Annualized Rental Obligations Under Expiring Leases | Annualized Rental Obligations Under Expiring Leases with future step-ups | |||||||||||||||||||||||||||||||||||||
| $ | $/PSF | $ | $/PSF | ||||||||||||||||||||||||||||||||||||||
| Q1 2025 | — | — | — | — | — | — | |||||||||||||||||||||||||||||||||||
| Q2 2025 | — | — | — | — | — | — | |||||||||||||||||||||||||||||||||||
| Q3 2025 | — | — | — | — | — | — | |||||||||||||||||||||||||||||||||||
| Q4 2025 | 3,774 | 3,774 | 620,191 | 164.33 | 620,191 | 164.33 | |||||||||||||||||||||||||||||||||||
| Total 2025 | 3,774 | 3,774 | 620,191 | 164.33 | 620,191 | 164.33 | |||||||||||||||||||||||||||||||||||
| Q1 2026 | 7,384 | 7,384 | 731,635 | 99.08 | 731,635 | 99.08 | |||||||||||||||||||||||||||||||||||
| Q2 2026 | 18,831 | 18,516 | 1,797,905 | 97.10 | 1,797,905 | 97.10 | |||||||||||||||||||||||||||||||||||
| Q3 2026 | 959 | 959 | 15,000 | 15.64 | 15,000 | 15.64 | |||||||||||||||||||||||||||||||||||
| Q4 2026 | 1,891 | 1,891 | 792,504 | 419.09 | 809,191 | 427.92 | |||||||||||||||||||||||||||||||||||
| Total 2026 | 29,065 | 28,750 | 3,337,044 | 116.07 | 3,353,731 | 116.65 | |||||||||||||||||||||||||||||||||||
| BXP’s Share | |||||||||||||||||||||||||||||||||||||||||
| Quarter | Rentable Square Footage4 |
Rentable Square Footage4 |
Current Annualized Rental Obligations Under Expiring Leases | Annualized Rental Obligations Under Expiring Leases with future step-ups | |||||||||||||||||||||||||||||||||||||
| $ | $/PSF | $ | $/PSF | ||||||||||||||||||||||||||||||||||||||
| Q1 2025 | — | — | — | — | — | — | |||||||||||||||||||||||||||||||||||
| Q2 2025 | — | — | — | — | — | — | |||||||||||||||||||||||||||||||||||
| Q3 2025 | — | — | — | — | — | — | |||||||||||||||||||||||||||||||||||
| Q4 2025 | 46,370 | 46,370 | 2,680,764 | 57.81 | 2,680,764 | 57.81 | |||||||||||||||||||||||||||||||||||
| Total 2025 | 46,370 | 46,370 | 2,680,764 | 57.81 | 2,680,764 | 57.81 | |||||||||||||||||||||||||||||||||||
| Q1 2026 | 100,190 | 94,791 | 6,474,844 | 68.31 | 6,474,844 | 68.31 | |||||||||||||||||||||||||||||||||||
| Q2 2026 | 90,147 | 63,622 | 4,755,172 | 74.74 | 4,957,742 | 77.92 | |||||||||||||||||||||||||||||||||||
| Q3 2026 | 88,858 | 76,192 | 5,263,340 | 69.08 | 5,263,341 | 69.08 | |||||||||||||||||||||||||||||||||||
| Q4 2026 | 132,301 | 125,805 | 9,757,584 | 77.56 | 9,871,209 | 78.46 | |||||||||||||||||||||||||||||||||||
| Total 2026 | 411,496 | 360,409 | 26,250,939 | 72.84 | 26,567,135 | 73.71 | |||||||||||||||||||||||||||||||||||
|
|
Q3 2025 | ||||
Lease expirations - Los Angeles region in-service properties 1, 2, 3 | |||||
| BXP’s Share | |||||||||||||||||||||||||||||||||||||||||
| Year | Rentable Square Footage4 |
Rentable Square Footage4 |
Current Annualized Rental Obligations Under Expiring Leases | Annualized Rental Obligations Under Expiring Leases with future step-ups | |||||||||||||||||||||||||||||||||||||
| $ | $/PSF | $ | $/PSF | ||||||||||||||||||||||||||||||||||||||
| 2025 | 766 | 766 | 51,290 | 66.96 | 51,290 | 66.96 | |||||||||||||||||||||||||||||||||||
| 2026 | 166,991 | 166,991 | 11,526,583 | 69.03 | 11,533,311 | 69.07 | |||||||||||||||||||||||||||||||||||
| 2027 | 7,367 | 7,367 | 305,388 | 41.45 | 316,294 | 42.93 | |||||||||||||||||||||||||||||||||||
| 2028 | 299,852 | 202,055 | 15,784,916 | 78.12 | 17,135,800 | 84.81 | |||||||||||||||||||||||||||||||||||
| 2029 | 417,056 | 242,100 | 17,519,838 | 72.37 | 19,514,626 | 80.61 | |||||||||||||||||||||||||||||||||||
| 2030 | 54,433 | 54,433 | 3,327,633 | 61.13 | 3,873,202 | 71.16 | |||||||||||||||||||||||||||||||||||
| 2031 | 7,752 | 7,752 | 540,350 | 69.70 | 638,831 | 82.41 | |||||||||||||||||||||||||||||||||||
| 2032 | 246,667 | 127,701 | 10,876,902 | 85.18 | 13,253,593 | 103.79 | |||||||||||||||||||||||||||||||||||
| 2033 | 186,894 | 93,447 | 6,578,697 | 70.40 | 11,108,262 | 118.87 | |||||||||||||||||||||||||||||||||||
| 2034 | 3,739 | 3,739 | 236,697 | 63.30 | 299,537 | 80.11 | |||||||||||||||||||||||||||||||||||
| Thereafter | 494,641 | 494,641 | 38,649,280 | 78.14 | 45,954,721 | 92.91 | |||||||||||||||||||||||||||||||||||
| BXP’s Share | |||||||||||||||||||||||||||||||||||||||||
| Year | Rentable Square Footage4 |
Rentable Square Footage4 |
Current Annualized Rental Obligations Under Expiring Leases | Annualized Rental Obligations Under Expiring Leases with future step-ups | |||||||||||||||||||||||||||||||||||||
| $ | $/PSF | $ | $/PSF | ||||||||||||||||||||||||||||||||||||||
| 2025 | — | — | — | — | — | — | |||||||||||||||||||||||||||||||||||
| 2026 | 19,188 | 9,594 | 135,600 | 14.13 | 135,600 | 14.13 | |||||||||||||||||||||||||||||||||||
| 2027 | — | — | — | — | — | — | |||||||||||||||||||||||||||||||||||
| 2028 | — | — | — | — | — | — | |||||||||||||||||||||||||||||||||||
| 2029 | 38,118 | 38,118 | 2,313,480 | 60.69 | 2,504,232 | 65.70 | |||||||||||||||||||||||||||||||||||
| 2030 | 11,364 | 11,364 | 1,333,803 | 117.37 | 1,445,678 | 127.22 | |||||||||||||||||||||||||||||||||||
| 2031 | — | — | — | — | — | — | |||||||||||||||||||||||||||||||||||
| 2032 | — | — | — | — | — | — | |||||||||||||||||||||||||||||||||||
| 2033 | — | — | — | — | — | — | |||||||||||||||||||||||||||||||||||
| 2034 | 19,993 | 9,997 | 248,448 | 24.85 | 248,448 | 24.85 | |||||||||||||||||||||||||||||||||||
| Thereafter | 13,870 | 13,870 | 1,308,795 | 94.36 | 1,420,420 | 102.41 | |||||||||||||||||||||||||||||||||||
| BXP’s Share | |||||||||||||||||||||||||||||||||||||||||
| Year | Rentable Square Footage4 |
Rentable Square Footage4 |
Current Annualized Rental Obligations Under Expiring Leases | Annualized Rental Obligations Under Expiring Leases with future step-ups | |||||||||||||||||||||||||||||||||||||
| $ | $/PSF | $ | $/PSF | ||||||||||||||||||||||||||||||||||||||
| 2025 | 766 | 766 | 51,290 | 66.96 | 51,290 | 66.96 | |||||||||||||||||||||||||||||||||||
| 2026 | 186,179 | 176,585 | 11,662,183 | 66.04 | 11,668,911 | 66.08 | |||||||||||||||||||||||||||||||||||
| 2027 | 7,367 | 7,367 | 305,388 | 41.45 | 316,294 | 42.93 | |||||||||||||||||||||||||||||||||||
| 2028 | 299,852 | 202,055 | 15,784,916 | 78.12 | 17,135,800 | 84.81 | |||||||||||||||||||||||||||||||||||
| 2029 | 455,174 | 280,218 | 19,833,318 | 70.78 | 22,018,858 | 78.58 | |||||||||||||||||||||||||||||||||||
| 2030 | 65,797 | 65,797 | 4,661,436 | 70.85 | 5,318,880 | 80.84 | |||||||||||||||||||||||||||||||||||
| 2031 | 7,752 | 7,752 | 540,350 | 69.70 | 638,831 | 82.41 | |||||||||||||||||||||||||||||||||||
| 2032 | 246,667 | 127,701 | 10,876,902 | 85.17 | 13,253,593 | 103.79 | |||||||||||||||||||||||||||||||||||
| 2033 | 186,894 | 93,447 | 6,578,697 | 70.40 | 11,108,262 | 118.87 | |||||||||||||||||||||||||||||||||||
| 2034 | 23,732 | 13,736 | 485,145 | 35.32 | 547,985 | 39.89 | |||||||||||||||||||||||||||||||||||
| Thereafter | 508,511 | 508,511 | 39,958,075 | 78.58 | 47,375,141 | 93.16 | |||||||||||||||||||||||||||||||||||
|
|
Q3 2025 | ||||
Quarterly lease expirations - Los Angeles region in-service properties 1, 2, 3 | |||||
| BXP’s Share | |||||||||||||||||||||||||||||||||||||||||
| Quarter | Rentable Square Footage4 |
Rentable Square Footage4 |
Current Annualized Rental Obligations Under Expiring Leases | Annualized Rental Obligations Under Expiring Leases with future step-ups | |||||||||||||||||||||||||||||||||||||
| $ | $/PSF | $ | $/PSF | ||||||||||||||||||||||||||||||||||||||
| Q1 2025 | — | — | — | — | — | — | |||||||||||||||||||||||||||||||||||
| Q2 2025 | — | — | — | — | — | — | |||||||||||||||||||||||||||||||||||
| Q3 2025 | — | — | — | — | — | — | |||||||||||||||||||||||||||||||||||
| Q4 2025 | 766 | 766 | 51,290 | 66.96 | 51,290 | 66.96 | |||||||||||||||||||||||||||||||||||
| Total 2025 | 766 | 766 | 51,290 | 66.96 | 51,290 | 66.96 | |||||||||||||||||||||||||||||||||||
| Q1 2026 | 160,397 | 160,397 | 11,215,534 | 69.92 | 11,215,534 | 69.92 | |||||||||||||||||||||||||||||||||||
| Q2 2026 | 3,708 | 3,708 | 129,389 | 34.89 | 132,362 | 35.70 | |||||||||||||||||||||||||||||||||||
| Q3 2026 | — | — | — | — | — | — | |||||||||||||||||||||||||||||||||||
| Q4 2026 | 2,886 | 2,886 | 181,660 | 62.95 | 185,416 | 64.25 | |||||||||||||||||||||||||||||||||||
| Total 2026 | 166,991 | 166,991 | 11,526,583 | 69.03 | 11,533,311 | 69.07 | |||||||||||||||||||||||||||||||||||
| BXP’s Share | |||||||||||||||||||||||||||||||||||||||||
| Quarter | Rentable Square Footage4 |
Rentable Square Footage4 |
Current Annualized Rental Obligations Under Expiring Leases | Annualized Rental Obligations Under Expiring Leases with future step-ups | |||||||||||||||||||||||||||||||||||||
| $ | $/PSF | $ | $/PSF | ||||||||||||||||||||||||||||||||||||||
| Q1 2025 | — | — | — | — | — | — | |||||||||||||||||||||||||||||||||||
| Q2 2025 | — | — | — | — | — | — | |||||||||||||||||||||||||||||||||||
| Q3 2025 | — | — | — | — | — | — | |||||||||||||||||||||||||||||||||||
| Q4 2025 | — | — | — | — | — | — | |||||||||||||||||||||||||||||||||||
| Total 2025 | — | — | — | — | — | — | |||||||||||||||||||||||||||||||||||
| Q1 2026 | — | — | — | — | — | — | |||||||||||||||||||||||||||||||||||
| Q2 2026 | — | — | — | — | — | — | |||||||||||||||||||||||||||||||||||
| Q3 2026 | 19,188 | 9,594 | 135,600 | 14.13 | 135,600 | 14.13 | |||||||||||||||||||||||||||||||||||
| Q4 2026 | — | — | — | — | — | — | |||||||||||||||||||||||||||||||||||
| Total 2026 | 19,188 | 9,594 | 135,600 | 14.13 | 135,600 | 14.13 | |||||||||||||||||||||||||||||||||||
| BXP’s Share | |||||||||||||||||||||||||||||||||||||||||
| Quarter | Rentable Square Footage4 |
Rentable Square Footage4 |
Current Annualized Rental Obligations Under Expiring Leases | Annualized Rental Obligations Under Expiring Leases with future step-ups | |||||||||||||||||||||||||||||||||||||
| $ | $/PSF | $ | $/PSF | ||||||||||||||||||||||||||||||||||||||
| Q1 2025 | — | — | — | — | — | — | |||||||||||||||||||||||||||||||||||
| Q2 2025 | — | — | — | — | — | — | |||||||||||||||||||||||||||||||||||
| Q3 2025 | — | — | — | — | — | — | |||||||||||||||||||||||||||||||||||
| Q4 2025 | 766 | 766 | 51,290 | 66.96 | 51,290 | 66.96 | |||||||||||||||||||||||||||||||||||
| Total 2025 | 766 | 766 | 51,290 | 66.96 | 51,290 | 66.96 | |||||||||||||||||||||||||||||||||||
| Q1 2026 | 160,397 | 160,397 | 11,215,534 | 69.92 | 11,215,534 | 69.92 | |||||||||||||||||||||||||||||||||||
| Q2 2026 | 3,708 | 3,708 | 129,389 | 34.89 | 132,362 | 35.70 | |||||||||||||||||||||||||||||||||||
| Q3 2026 | 19,188 | 9,594 | 135,600 | 14.13 | 135,600 | 14.13 | |||||||||||||||||||||||||||||||||||
| Q4 2026 | 2,886 | 2,886 | 181,660 | 62.95 | 185,416 | 64.25 | |||||||||||||||||||||||||||||||||||
| Total 2026 | 186,179 | 176,585 | 11,662,183 | 66.04 | 11,668,911 | 66.08 | |||||||||||||||||||||||||||||||||||
|
|
Q3 2025 | ||||
Lease expirations - New York region in-service properties 1, 2, 3 | |||||
| BXP’s Share | |||||||||||||||||||||||||||||||||||||||||
| Year | Rentable Square Footage4 |
Rentable Square Footage4 |
Current Annualized Rental Obligations Under Expiring Leases | Annualized Rental Obligations Under Expiring Leases with future step-ups | |||||||||||||||||||||||||||||||||||||
| $ | $/PSF | $ | $/PSF | ||||||||||||||||||||||||||||||||||||||
| 2025 | 31,836 | 31,836 | 2,603,948 | 81.79 | 2,603,948 | 81.79 | |||||||||||||||||||||||||||||||||||
| 2026 | 212,910 | 192,681 | 11,972,447 | 62.14 | 12,051,713 | 62.55 | |||||||||||||||||||||||||||||||||||
| 2027 | 380,020 | 341,729 | 20,934,872 | 61.26 | 21,051,816 | 61.60 | |||||||||||||||||||||||||||||||||||
| 2028 | 334,140 | 276,583 | 24,487,976 | 88.54 | 24,470,605 | 88.47 | |||||||||||||||||||||||||||||||||||
| 2029 | 939,595 | 727,252 | 62,706,478 | 86.22 | 64,385,737 | 88.53 | |||||||||||||||||||||||||||||||||||
| 2030 | 594,153 | 521,126 | 49,158,699 | 94.33 | 50,670,812 | 97.23 | |||||||||||||||||||||||||||||||||||
| 2031 | 630,623 | 548,341 | 45,924,237 | 83.75 | 48,339,562 | 88.16 | |||||||||||||||||||||||||||||||||||
| 2032 | 352,472 | 262,197 | 18,846,257 | 71.88 | 19,554,892 | 74.58 | |||||||||||||||||||||||||||||||||||
| 2033 | 416,853 | 372,262 | 39,580,574 | 106.32 | 43,326,941 | 116.39 | |||||||||||||||||||||||||||||||||||
| 2034 | 1,318,258 | 1,041,996 | 112,854,063 | 108.31 | 122,140,132 | 117.22 | |||||||||||||||||||||||||||||||||||
| Thereafter | 5,018,030 | 3,556,395 | 334,632,214 | 94.09 | 384,432,911 | 108.10 | |||||||||||||||||||||||||||||||||||
| BXP’s Share | |||||||||||||||||||||||||||||||||||||||||
| Year | Rentable Square Footage4 |
Rentable Square Footage4 |
Current Annualized Rental Obligations Under Expiring Leases | Annualized Rental Obligations Under Expiring Leases with future step-ups | |||||||||||||||||||||||||||||||||||||
| $ | $/PSF | $ | $/PSF | ||||||||||||||||||||||||||||||||||||||
| 2025 | 4,179 | 4,179 | 480,000 | 114.86 | 480,000 | 114.86 | |||||||||||||||||||||||||||||||||||
| 2026 | 15,044 | 12,423 | 9,468,098 | 762.13 | 9,468,098 | 762.13 | |||||||||||||||||||||||||||||||||||
| 2027 | 8,162 | 4,489 | 33,000 | 7.35 | 33,000 | 7.35 | |||||||||||||||||||||||||||||||||||
| 2028 | 2,424 | 647 | 211,395 | 326.75 | 211,395 | 326.75 | |||||||||||||||||||||||||||||||||||
| 2029 | 9,577 | 5,671 | 1,805,467 | 318.37 | 1,956,628 | 345.02 | |||||||||||||||||||||||||||||||||||
| 2030 | 1,512 | 1,512 | 390,270 | 258.12 | 476,962 | 315.45 | |||||||||||||||||||||||||||||||||||
| 2031 | 20,784 | 14,468 | 5,208,746 | 360.03 | 5,745,604 | 397.14 | |||||||||||||||||||||||||||||||||||
| 2032 | 12,182 | 11,064 | 1,074,466 | 97.11 | 1,253,759 | 113.32 | |||||||||||||||||||||||||||||||||||
| 2033 | 20,928 | 20,928 | 4,534,012 | 216.65 | 5,132,010 | 245.22 | |||||||||||||||||||||||||||||||||||
| 2034 | 139,214 | 85,037 | 21,228,854 | 249.64 | 25,500,984 | 299.88 | |||||||||||||||||||||||||||||||||||
| Thereafter | 219,678 | 143,217 | 26,512,826 | 185.12 | 21,657,102 | 151.22 | |||||||||||||||||||||||||||||||||||
| BXP’s Share | |||||||||||||||||||||||||||||||||||||||||
| Year | Rentable Square Footage4 |
Rentable Square Footage4 |
Current Annualized Rental Obligations Under Expiring Leases | Annualized Rental Obligations Under Expiring Leases with future step-ups | |||||||||||||||||||||||||||||||||||||
| $ | $/PSF | $ | $/PSF | ||||||||||||||||||||||||||||||||||||||
| 2025 | 36,015 | 36,015 | 3,083,948 | 85.63 | 3,083,948 | 85.63 | |||||||||||||||||||||||||||||||||||
| 2026 | 227,954 | 205,104 | 21,440,545 | 104.53 | 21,519,811 | 104.92 | |||||||||||||||||||||||||||||||||||
| 2027 | 388,182 | 346,218 | 20,967,872 | 60.56 | 21,084,816 | 60.90 | |||||||||||||||||||||||||||||||||||
| 2028 | 336,564 | 277,230 | 24,699,371 | 89.09 | 24,682,000 | 89.03 | |||||||||||||||||||||||||||||||||||
| 2029 | 949,172 | 732,923 | 64,511,945 | 88.02 | 66,342,365 | 90.52 | |||||||||||||||||||||||||||||||||||
| 2030 | 595,665 | 522,638 | 49,548,969 | 94.81 | 51,147,774 | 97.86 | |||||||||||||||||||||||||||||||||||
| 2031 | 651,407 | 562,809 | 51,132,983 | 90.85 | 54,085,166 | 96.10 | |||||||||||||||||||||||||||||||||||
| 2032 | 364,654 | 273,261 | 19,920,723 | 72.90 | 20,808,651 | 76.15 | |||||||||||||||||||||||||||||||||||
| 2033 | 437,781 | 393,190 | 44,114,586 | 112.20 | 48,458,951 | 123.25 | |||||||||||||||||||||||||||||||||||
| 2034 | 1,457,472 | 1,127,033 | 134,082,917 | 118.97 | 147,641,116 | 131.00 | |||||||||||||||||||||||||||||||||||
| Thereafter | 5,237,708 | 3,699,612 | 361,145,040 | 97.62 | 406,090,013 | 109.77 | |||||||||||||||||||||||||||||||||||
|
|
Q3 2025 | ||||
Quarterly lease expirations - New York region in-service properties 1, 2, 3 | |||||
| BXP’s Share | |||||||||||||||||||||||||||||||||||||||||
| Quarter | Rentable Square Footage4 |
Rentable Square Footage4 |
Current Annualized Rental Obligations Under Expiring Leases | Annualized Rental Obligations Under Expiring Leases with future step-ups | |||||||||||||||||||||||||||||||||||||
| $ | $/PSF | $ | $/PSF | ||||||||||||||||||||||||||||||||||||||
| Q1 2025 | — | — | — | — | — | — | |||||||||||||||||||||||||||||||||||
| Q2 2025 | — | — | — | — | — | — | |||||||||||||||||||||||||||||||||||
| Q3 2025 | — | — | — | — | — | — | |||||||||||||||||||||||||||||||||||
| Q4 2025 | 31,836 | 31,836 | 2,603,948 | 81.79 | 2,603,948 | 81.79 | |||||||||||||||||||||||||||||||||||
| Total 2025 | 31,836 | 31,836 | 2,603,948 | 81.79 | 2,603,948 | 81.79 | |||||||||||||||||||||||||||||||||||
| Q1 2026 | 99,800 | 94,391 | 6,641,064 | 70.36 | 6,695,334 | 70.93 | |||||||||||||||||||||||||||||||||||
| Q2 2026 | 9,157 | 8,310 | 363,533 | 43.75 | 364,553 | 43.87 | |||||||||||||||||||||||||||||||||||
| Q3 2026 | 43,993 | 33,832 | 2,304,582 | 68.12 | 2,306,120 | 68.16 | |||||||||||||||||||||||||||||||||||
| Q4 2026 | 59,960 | 56,149 | 2,663,267 | 47.43 | 2,685,706 | 47.83 | |||||||||||||||||||||||||||||||||||
| Total 2026 | 212,910 | 192,681 | 11,972,447 | 62.14 | 12,051,713 | 62.55 | |||||||||||||||||||||||||||||||||||
| BXP’s Share | |||||||||||||||||||||||||||||||||||||||||
| Quarter | Rentable Square Footage4 |
Rentable Square Footage4 |
Current Annualized Rental Obligations Under Expiring Leases | Annualized Rental Obligations Under Expiring Leases with future step-ups | |||||||||||||||||||||||||||||||||||||
| $ | $/PSF | $ | $/PSF | ||||||||||||||||||||||||||||||||||||||
| Q1 2025 | — | — | — | — | — | — | |||||||||||||||||||||||||||||||||||
| Q2 2025 | — | — | — | — | — | — | |||||||||||||||||||||||||||||||||||
| Q3 2025 | — | — | — | — | — | — | |||||||||||||||||||||||||||||||||||
| Q4 2025 | 4,179 | 4,179 | 480,000 | 114.86 | 480,000 | 114.86 | |||||||||||||||||||||||||||||||||||
| Total 2025 | 4,179 | 4,179 | 480,000 | 114.86 | 480,000 | 114.86 | |||||||||||||||||||||||||||||||||||
| Q1 2026 | 6,552 | 3,931 | 5,700,000 | 1,449.94 | 5,700,000 | 1,449.94 | |||||||||||||||||||||||||||||||||||
| Q2 2026 | 715 | 715 | 30,000 | 41.96 | 30,000 | 41.96 | |||||||||||||||||||||||||||||||||||
| Q3 2026 | 3,244 | 3,244 | 2,711,835 | 835.95 | 2,711,835 | 835.95 | |||||||||||||||||||||||||||||||||||
| Q4 2026 | 4,533 | 4,533 | 1,026,263 | 226.40 | 1,026,263 | 226.40 | |||||||||||||||||||||||||||||||||||
| Total 2026 | 15,044 | 12,423 | 9,468,098 | 762.13 | 9,468,098 | 762.13 | |||||||||||||||||||||||||||||||||||
| BXP’s Share | |||||||||||||||||||||||||||||||||||||||||
| Quarter | Rentable Square Footage4 |
Rentable Square Footage4 |
Current Annualized Rental Obligations Under Expiring Leases | Annualized Rental Obligations Under Expiring Leases with future step-ups | |||||||||||||||||||||||||||||||||||||
| $ | $/PSF | $ | $/PSF | ||||||||||||||||||||||||||||||||||||||
| Q1 2025 | — | — | — | — | — | — | |||||||||||||||||||||||||||||||||||
| Q2 2025 | — | — | — | — | — | — | |||||||||||||||||||||||||||||||||||
| Q3 2025 | — | — | — | — | — | — | |||||||||||||||||||||||||||||||||||
| Q4 2025 | 36,015 | 36,015 | 3,083,948 | 85.63 | 3,083,948 | 85.63 | |||||||||||||||||||||||||||||||||||
| Total 2025 | 36,015 | 36,015 | 3,083,948 | 85.63 | 3,083,948 | 85.63 | |||||||||||||||||||||||||||||||||||
| Q1 2026 | 106,352 | 98,322 | 12,341,064 | 125.52 | 12,395,334 | 126.07 | |||||||||||||||||||||||||||||||||||
| Q2 2026 | 9,872 | 9,025 | 393,533 | 43.60 | 394,553 | 43.72 | |||||||||||||||||||||||||||||||||||
| Q3 2026 | 47,237 | 37,076 | 5,016,417 | 135.30 | 5,017,955 | 135.34 | |||||||||||||||||||||||||||||||||||
| Q4 2026 | 64,493 | 60,682 | 3,689,530 | 60.80 | 3,711,969 | 61.17 | |||||||||||||||||||||||||||||||||||
| Total 2026 | 227,954 | 205,104 | 21,440,545 | 104.53 | 21,519,811 | 104.92 | |||||||||||||||||||||||||||||||||||
|
|
Q3 2025 | ||||
Lease expirations - San Francisco region in-service properties 1, 2, 3 | |||||
| BXP’s Share | |||||||||||||||||||||||||||||||||||||||||
| Year | Rentable Square Footage4 |
Rentable Square Footage4 |
Current Annualized Rental Obligations Under Expiring Leases | Annualized Rental Obligations Under Expiring Leases with future step-ups | |||||||||||||||||||||||||||||||||||||
| $ | $/PSF | $ | $/PSF | ||||||||||||||||||||||||||||||||||||||
| 2025 | 103,471 | 88,653 | 8,063,673 | 90.96 | 8,065,576 | 90.98 | |||||||||||||||||||||||||||||||||||
| 2026 | 587,155 | 497,971 | 46,043,426 | 92.46 | 48,024,327 | 96.44 | |||||||||||||||||||||||||||||||||||
| 2027 | 534,806 | 515,272 | 49,687,804 | 96.43 | 51,391,774 | 99.74 | |||||||||||||||||||||||||||||||||||
| 2028 | 460,357 | 440,599 | 44,746,698 | 101.56 | 46,909,392 | 106.47 | |||||||||||||||||||||||||||||||||||
| 2029 | 677,990 | 616,178 | 54,470,935 | 88.40 | 58,683,652 | 95.24 | |||||||||||||||||||||||||||||||||||
| 2030 | 480,894 | 450,665 | 39,916,450 | 88.57 | 44,773,935 | 99.35 | |||||||||||||||||||||||||||||||||||
| 2031 | 1,000,704 | 973,998 | 107,408,356 | 110.28 | 115,738,463 | 118.83 | |||||||||||||||||||||||||||||||||||
| 2032 | 405,461 | 369,063 | 31,644,456 | 85.74 | 37,525,178 | 101.68 | |||||||||||||||||||||||||||||||||||
| 2033 | 629,131 | 622,903 | 67,516,878 | 108.39 | 75,077,797 | 120.53 | |||||||||||||||||||||||||||||||||||
| 2034 | 331,223 | 213,621 | 21,335,893 | 99.88 | 26,577,563 | 124.41 | |||||||||||||||||||||||||||||||||||
| Thereafter | 439,094 | 437,053 | 42,932,058 | 98.23 | 56,355,705 | 128.94 | |||||||||||||||||||||||||||||||||||
| BXP’s Share | |||||||||||||||||||||||||||||||||||||||||
| Year | Rentable Square Footage4 |
Rentable Square Footage4 |
Current Annualized Rental Obligations Under Expiring Leases | Annualized Rental Obligations Under Expiring Leases with future step-ups | |||||||||||||||||||||||||||||||||||||
| $ | $/PSF | $ | $/PSF | ||||||||||||||||||||||||||||||||||||||
| 2025 | 5,228 | 5,228 | 12,000 | 2.30 | 12,000 | 2.30 | |||||||||||||||||||||||||||||||||||
| 2026 | 13,146 | 13,146 | 525,036 | 39.94 | 539,077 | 41.01 | |||||||||||||||||||||||||||||||||||
| 2027 | 14,385 | 14,385 | 744,862 | 51.78 | 797,991 | 55.47 | |||||||||||||||||||||||||||||||||||
| 2028 | 18,613 | 18,613 | 1,305,884 | 70.16 | 1,402,967 | 75.38 | |||||||||||||||||||||||||||||||||||
| 2029 | 4,246 | 4,246 | 388,652 | 91.53 | 430,173 | 101.31 | |||||||||||||||||||||||||||||||||||
| 2030 | 19,021 | 19,021 | 1,543,339 | 81.14 | 1,784,441 | 93.81 | |||||||||||||||||||||||||||||||||||
| 2031 | 39,623 | 34,207 | 2,254,105 | 65.90 | 2,383,999 | 69.69 | |||||||||||||||||||||||||||||||||||
| 2032 | 6,357 | 6,357 | 445,253 | 70.04 | 491,452 | 77.31 | |||||||||||||||||||||||||||||||||||
| 2033 | 9,383 | 9,383 | 1,052,424 | 112.16 | 1,117,442 | 119.09 | |||||||||||||||||||||||||||||||||||
| 2034 | — | — | — | — | — | — | |||||||||||||||||||||||||||||||||||
| Thereafter | — | — | — | — | — | — | |||||||||||||||||||||||||||||||||||
| BXP’s Share | |||||||||||||||||||||||||||||||||||||||||
| Year | Rentable Square Footage4 |
Rentable Square Footage4 |
Current Annualized Rental Obligations Under Expiring Leases | Annualized Rental Obligations Under Expiring Leases with future step-ups | |||||||||||||||||||||||||||||||||||||
| $ | $/PSF | $ | $/PSF | ||||||||||||||||||||||||||||||||||||||
| 2025 | 108,699 | 93,881 | 8,075,673 | $ | 86.02 | 8,077,576 | 86.04 | ||||||||||||||||||||||||||||||||||
| 2026 | 600,301 | 511,117 | 46,568,462 | 91.11 | 48,563,404 | 95.01 | |||||||||||||||||||||||||||||||||||
| 2027 | 549,191 | 529,657 | 50,432,666 | 95.22 | 52,189,765 | 98.54 | |||||||||||||||||||||||||||||||||||
| 2028 | 478,970 | 459,212 | 46,052,582 | 100.29 | 48,312,359 | 105.21 | |||||||||||||||||||||||||||||||||||
| 2029 | 682,236 | 620,424 | 54,859,587 | 88.42 | 59,113,825 | 95.28 | |||||||||||||||||||||||||||||||||||
| 2030 | 499,915 | 469,686 | 41,459,789 | 88.27 | 46,558,376 | 99.13 | |||||||||||||||||||||||||||||||||||
| 2031 | 1,040,327 | 1,008,205 | 109,662,461 | 108.77 | 118,122,462 | 117.16 | |||||||||||||||||||||||||||||||||||
| 2032 | 411,818 | 375,420 | 32,089,709 | 85.48 | 38,016,630 | 101.26 | |||||||||||||||||||||||||||||||||||
| 2033 | 638,514 | 632,286 | 68,569,302 | 108.45 | 76,195,239 | 120.51 | |||||||||||||||||||||||||||||||||||
| 2034 | 331,223 | 213,621 | 21,335,893 | 99.88 | 26,577,563 | 124.41 | |||||||||||||||||||||||||||||||||||
| Thereafter | 439,094 | 437,053 | 42,932,058 | 98.23 | 56,355,705 | 128.94 | |||||||||||||||||||||||||||||||||||
|
|
Q3 2025 | ||||
Quarterly lease expirations - San Francisco region in-service properties 1, 2, 3 | |||||
| BXP’s Share | |||||||||||||||||||||||||||||||||||||||||
| Quarter | Rentable Square Footage4 |
Rentable Square Footage4 |
Current Annualized Rental Obligations Under Expiring Leases | Annualized Rental Obligations Under Expiring Leases with future step-ups | |||||||||||||||||||||||||||||||||||||
| $ | $/PSF | $ | $/PSF | ||||||||||||||||||||||||||||||||||||||
| Q1 2025 | — | — | — | — | — | — | |||||||||||||||||||||||||||||||||||
| Q2 2025 | — | — | — | — | — | — | |||||||||||||||||||||||||||||||||||
| Q3 2025 | — | — | — | — | — | — | |||||||||||||||||||||||||||||||||||
| Q4 2025 | 103,471 | 88,653 | 8,063,673 | 90.96 | 8,065,576 | 90.98 | |||||||||||||||||||||||||||||||||||
| Total 2025 | 103,471 | 88,653 | 8,063,673 | 90.96 | 8,065,576 | 90.98 | |||||||||||||||||||||||||||||||||||
| Q1 2026 | 134,191 | 130,601 | 9,952,629 | 76.21 | 10,046,092 | 76.92 | |||||||||||||||||||||||||||||||||||
| Q2 2026 | 209,755 | 192,459 | 18,601,221 | 96.65 | 20,787,777 | 108.01 | |||||||||||||||||||||||||||||||||||
| Q3 2026 | 218,233 | 149,935 | 15,590,498 | 103.98 | 15,242,685 | 101.66 | |||||||||||||||||||||||||||||||||||
| Q4 2026 | 24,976 | 24,976 | 1,899,077 | 76.04 | 1,947,774 | 77.99 | |||||||||||||||||||||||||||||||||||
| Total 2026 | 587,155 | 497,971 | 46,043,426 | 92.46 | 48,024,327 | 96.44 | |||||||||||||||||||||||||||||||||||
| BXP’s Share | |||||||||||||||||||||||||||||||||||||||||
| Quarter | Rentable Square Footage4 |
Rentable Square Footage4 |
Current Annualized Rental Obligations Under Expiring Leases | Annualized Rental Obligations Under Expiring Leases with future step-ups | |||||||||||||||||||||||||||||||||||||
| $ | $/PSF | $ | $/PSF | ||||||||||||||||||||||||||||||||||||||
| Q1 2025 | — | — | — | — | — | — | |||||||||||||||||||||||||||||||||||
| Q2 2025 | — | — | — | — | — | — | |||||||||||||||||||||||||||||||||||
| Q3 2025 | — | — | — | — | — | — | |||||||||||||||||||||||||||||||||||
| Q4 2025 | 5,228 | 5,228 | 12,000 | 2.30 | 12,000 | 2.30 | |||||||||||||||||||||||||||||||||||
| Total 2025 | 5,228 | 5,228 | 12,000 | 2.30 | 12,000 | 2.30 | |||||||||||||||||||||||||||||||||||
| Q1 2026 | — | — | — | — | — | — | |||||||||||||||||||||||||||||||||||
| Q2 2026 | 1,821 | 1,821 | 37,056 | 20.35 | 37,056 | 20.35 | |||||||||||||||||||||||||||||||||||
| Q3 2026 | 1,613 | 1,613 | 163,440 | 101.33 | 163,440 | 101.33 | |||||||||||||||||||||||||||||||||||
| Q4 2026 | 9,712 | 9,712 | 324,540 | 33.42 | 338,580 | 34.86 | |||||||||||||||||||||||||||||||||||
| Total 2026 | 13,146 | 13,146 | 525,036 | 39.94 | 539,077 | 41.01 | |||||||||||||||||||||||||||||||||||
| BXP’s Share | |||||||||||||||||||||||||||||||||||||||||
| Quarter | Rentable Square Footage4 |
Rentable Square Footage4 |
Current Annualized Rental Obligations Under Expiring Leases | Annualized Rental Obligations Under Expiring Leases with future step-ups | |||||||||||||||||||||||||||||||||||||
| $ | $/PSF | $ | $/PSF | ||||||||||||||||||||||||||||||||||||||
| Q1 2025 | — | — | — | — | — | — | |||||||||||||||||||||||||||||||||||
| Q2 2025 | — | — | — | — | — | — | |||||||||||||||||||||||||||||||||||
| Q3 2025 | — | — | — | — | — | — | |||||||||||||||||||||||||||||||||||
| Q4 2025 | 108,699 | 93,881 | 8,075,673 | 86.02 | 8,077,576 | 86.04 | |||||||||||||||||||||||||||||||||||
| Total 2025 | 108,699 | 93,881 | 8,075,673 | 86.02 | 8,077,576 | 86.04 | |||||||||||||||||||||||||||||||||||
| Q1 2026 | 134,191 | 130,601 | 9,952,629 | 76.21 | 10,046,092 | 76.92 | |||||||||||||||||||||||||||||||||||
| Q2 2026 | 211,576 | 194,280 | 18,638,277 | 95.94 | 20,824,833 | 107.19 | |||||||||||||||||||||||||||||||||||
| Q3 2026 | 219,846 | 151,548 | 15,753,938 | 103.95 | 15,406,125 | 101.66 | |||||||||||||||||||||||||||||||||||
| Q4 2026 | 34,688 | 34,688 | 2,223,617 | 64.10 | 2,286,354 | 65.91 | |||||||||||||||||||||||||||||||||||
| Total 2026 | 600,301 | 511,117 | 46,568,462 | 91.11 | 48,563,404 | 95.01 | |||||||||||||||||||||||||||||||||||
|
|
Q3 2025 | ||||
Lease expirations - Seattle region in-service properties 1, 2, 3 | |||||
| BXP’s Share | |||||||||||||||||||||||||||||||||||||||||
| Year | Rentable Square Footage4 |
Rentable Square Footage4 |
Current Annualized Rental Obligations Under Expiring Leases | Annualized Rental Obligations Under Expiring Leases with future step-ups | |||||||||||||||||||||||||||||||||||||
| $ | $/PSF | $ | $/PSF | ||||||||||||||||||||||||||||||||||||||
| 2025 | 56,677 | 19,083 | 948,190 | 49.69 | 948,190 | 49.69 | |||||||||||||||||||||||||||||||||||
| 2026 | 71,003 | 67,221 | 4,010,729 | 59.66 | 4,097,839 | 60.96 | |||||||||||||||||||||||||||||||||||
| 2027 | 77,785 | 74,224 | 4,315,791 | 58.15 | 4,471,476 | 60.24 | |||||||||||||||||||||||||||||||||||
| 2028 | 601,382 | 302,445 | 17,037,863 | 56.33 | 17,863,556 | 59.06 | |||||||||||||||||||||||||||||||||||
| 2029 | 232,381 | 212,323 | 11,523,253 | 54.27 | 11,975,105 | 56.40 | |||||||||||||||||||||||||||||||||||
| 2030 | 40,707 | 40,707 | 2,413,273 | 59.28 | 2,655,900 | 65.24 | |||||||||||||||||||||||||||||||||||
| 2031 | 23,485 | 16,646 | 898,162 | 53.96 | 996,832 | 59.89 | |||||||||||||||||||||||||||||||||||
| 2032 | 70,933 | 57,584 | 4,211,558 | 73.14 | 4,866,692 | 84.51 | |||||||||||||||||||||||||||||||||||
| 2033 | — | — | — | — | — | — | |||||||||||||||||||||||||||||||||||
| 2034 | — | — | — | — | — | — | |||||||||||||||||||||||||||||||||||
| Thereafter | 63,925 | 23,614 | 1,638,595 | 69.39 | 2,006,913 | 84.99 | |||||||||||||||||||||||||||||||||||
| BXP’s Share | |||||||||||||||||||||||||||||||||||||||||
| Year | Rentable Square Footage4 |
Rentable Square Footage4 |
Current Annualized Rental Obligations Under Expiring Leases | Annualized Rental Obligations Under Expiring Leases with future step-ups | |||||||||||||||||||||||||||||||||||||
| $ | $/PSF | $ | $/PSF | ||||||||||||||||||||||||||||||||||||||
| 2025 | — | — | — | — | — | — | |||||||||||||||||||||||||||||||||||
| 2026 | — | — | — | — | — | — | |||||||||||||||||||||||||||||||||||
| 2027 | — | — | — | — | — | — | |||||||||||||||||||||||||||||||||||
| 2028 | 945 | 945 | 51,431 | 54.42 | 55,873 | 59.12 | |||||||||||||||||||||||||||||||||||
| 2029 | 1,121 | 377 | 7,306 | 19.36 | 7,306 | 19.36 | |||||||||||||||||||||||||||||||||||
| 2030 | — | — | — | — | — | — | |||||||||||||||||||||||||||||||||||
| 2031 | 6,734 | 4,289 | 288,475 | 67.26 | 322,123 | 75.10 | |||||||||||||||||||||||||||||||||||
| 2032 | — | — | — | — | — | — | |||||||||||||||||||||||||||||||||||
| 2033 | — | — | — | — | — | — | |||||||||||||||||||||||||||||||||||
| 2034 | — | — | — | — | — | — | |||||||||||||||||||||||||||||||||||
| Thereafter | — | — | — | — | — | — | |||||||||||||||||||||||||||||||||||
| BXP’s Share | |||||||||||||||||||||||||||||||||||||||||
| Year | Rentable Square Footage4 |
Rentable Square Footage4 |
Current Annualized Rental Obligations Under Expiring Leases | Annualized Rental Obligations Under Expiring Leases with future step-ups | |||||||||||||||||||||||||||||||||||||
| $ | $/PSF | $ | $/PSF | ||||||||||||||||||||||||||||||||||||||
| 2025 | 56,677 | 19,083 | 948,190 | 49.69 | 948,190 | 49.69 | |||||||||||||||||||||||||||||||||||
| 2026 | 71,003 | 67,221 | 4,010,729 | 59.66 | 4,097,839 | 60.96 | |||||||||||||||||||||||||||||||||||
| 2027 | 77,785 | 74,224 | 4,315,791 | 58.15 | 4,471,476 | 60.24 | |||||||||||||||||||||||||||||||||||
| 2028 | 602,327 | 303,390 | 17,089,294 | 56.33 | 17,919,429 | 59.06 | |||||||||||||||||||||||||||||||||||
| 2029 | 233,502 | 212,700 | 11,530,559 | 54.21 | 11,982,411 | 56.33 | |||||||||||||||||||||||||||||||||||
| 2030 | 40,707 | 40,707 | 2,413,273 | 59.28 | 2,655,900 | 65.24 | |||||||||||||||||||||||||||||||||||
| 2031 | 30,219 | 20,935 | 1,186,637 | 56.68 | 1,318,955 | 63.00 | |||||||||||||||||||||||||||||||||||
| 2032 | 70,933 | 57,584 | 4,211,558 | 73.14 | 4,866,692 | 84.51 | |||||||||||||||||||||||||||||||||||
| 2033 | — | — | — | — | — | — | |||||||||||||||||||||||||||||||||||
| 2034 | — | — | — | — | — | — | |||||||||||||||||||||||||||||||||||
| Thereafter | 63,925 | 23,614 | 1,638,595 | 69.39 | 2,006,913 | 84.99 | |||||||||||||||||||||||||||||||||||
|
|
Q3 2025 | ||||
Quarterly lease expirations - Seattle region in-service properties 1, 2, 3 | |||||
| BXP’s Share | |||||||||||||||||||||||||||||||||||||||||
| Quarter | Rentable Square Footage4 |
Rentable Square Footage4 |
Current Annualized Rental Obligations Under Expiring Leases | Annualized Rental Obligations Under Expiring Leases with future step-ups | |||||||||||||||||||||||||||||||||||||
| $ | $/PSF | $ | $/PSF | ||||||||||||||||||||||||||||||||||||||
| Q1 2025 | — | — | — | — | — | — | |||||||||||||||||||||||||||||||||||
| Q2 2025 | — | — | — | — | — | — | |||||||||||||||||||||||||||||||||||
| Q3 2025 | — | — | — | — | — | — | |||||||||||||||||||||||||||||||||||
| Q4 2025 | 56,677 | 19,083 | 948,190 | 49.69 | 948,190 | 49.69 | |||||||||||||||||||||||||||||||||||
| Total 2025 | 56,677 | 19,083 | 948,190 | 49.69 | 948,190 | 49.69 | |||||||||||||||||||||||||||||||||||
| Q1 2026 | 1,309 | 441 | 29,363 | 66.58 | 30,009 | 68.05 | |||||||||||||||||||||||||||||||||||
| Q2 2026 | 39,138 | 39,138 | 2,291,477 | 58.55 | 2,330,096 | 59.54 | |||||||||||||||||||||||||||||||||||
| Q3 2026 | — | — | — | — | — | — | |||||||||||||||||||||||||||||||||||
| Q4 2026 | 30,556 | 27,642 | 1,689,889 | 61.13 | 1,737,734 | 62.87 | |||||||||||||||||||||||||||||||||||
| Total 2026 | 71,003 | 67,221 | 4,010,729 | 59.66 | 4,097,839 | 60.96 | |||||||||||||||||||||||||||||||||||
| BXP’s Share | |||||||||||||||||||||||||||||||||||||||||
| Quarter | Rentable Square Footage4 |
Rentable Square Footage4 |
Current Annualized Rental Obligations Under Expiring Leases | Annualized Rental Obligations Under Expiring Leases with future step-ups | |||||||||||||||||||||||||||||||||||||
| $ | $/PSF | $ | $/PSF | ||||||||||||||||||||||||||||||||||||||
| Q1 2025 | — | — | — | — | — | — | |||||||||||||||||||||||||||||||||||
| Q2 2025 | — | — | — | — | — | — | |||||||||||||||||||||||||||||||||||
| Q3 2025 | — | — | — | — | — | — | |||||||||||||||||||||||||||||||||||
| Q4 2025 | — | — | — | — | — | — | |||||||||||||||||||||||||||||||||||
| Total 2025 | — | — | — | — | — | — | |||||||||||||||||||||||||||||||||||
| Q1 2026 | — | — | — | — | — | — | |||||||||||||||||||||||||||||||||||
| Q2 2026 | — | — | — | — | — | — | |||||||||||||||||||||||||||||||||||
| Q3 2026 | — | — | — | — | — | — | |||||||||||||||||||||||||||||||||||
| Q4 2026 | — | — | — | — | — | — | |||||||||||||||||||||||||||||||||||
| Total 2026 | — | — | — | — | — | — | |||||||||||||||||||||||||||||||||||
| BXP’s Share | |||||||||||||||||||||||||||||||||||||||||
| Quarter | Rentable Square Footage4 |
Rentable Square Footage4 |
Current Annualized Rental Obligations Under Expiring Leases | Annualized Rental Obligations Under Expiring Leases with future step-ups | |||||||||||||||||||||||||||||||||||||
| $ | $/PSF | $ | $/PSF | ||||||||||||||||||||||||||||||||||||||
| Q1 2025 | — | — | — | — | — | — | |||||||||||||||||||||||||||||||||||
| Q2 2025 | — | — | — | — | — | — | |||||||||||||||||||||||||||||||||||
| Q3 2025 | — | — | — | — | — | — | |||||||||||||||||||||||||||||||||||
| Q4 2025 | 56,677 | 19,083 | 948,190 | 49.69 | 948,190 | 49.69 | |||||||||||||||||||||||||||||||||||
| Total 2025 | 56,677 | 19,083 | 948,190 | 49.69 | 948,190 | 49.69 | |||||||||||||||||||||||||||||||||||
| Q1 2026 | 1,309 | 441 | 29,363 | 66.58 | 30,009 | 68.05 | |||||||||||||||||||||||||||||||||||
| Q2 2026 | 39,138 | 39,138 | 2,291,477 | 58.55 | 2,330,096 | 59.54 | |||||||||||||||||||||||||||||||||||
| Q3 2026 | — | — | — | — | — | — | |||||||||||||||||||||||||||||||||||
| Q4 2026 | 30,556 | 27,642 | 1,689,889 | 61.13 | 1,737,734 | 62.87 | |||||||||||||||||||||||||||||||||||
| Total 2026 | 71,003 | 67,221 | 4,010,729 | 59.66 | 4,097,839 | 60.96 | |||||||||||||||||||||||||||||||||||
|
|
Q3 2025 | ||||
Lease expirations - Washington, DC region in-service properties 1, 2, 3 | |||||
| BXP’s Share | |||||||||||||||||||||||||||||||||||||||||
| Year | Rentable Square Footage4 |
Rentable Square Footage4 |
Current Annualized Rental Obligations Under Expiring Leases | Annualized Rental Obligations Under Expiring Leases with future step-ups | |||||||||||||||||||||||||||||||||||||
| $ | $/PSF | $ | $/PSF | ||||||||||||||||||||||||||||||||||||||
| 2025 | 60,452 | 60,452 | 4,881,227 | 80.75 | 4,881,227 | 80.75 | |||||||||||||||||||||||||||||||||||
| 2026 | 174,053 | 147,054 | 9,188,910 | 62.49 | 9,255,648 | 62.94 | |||||||||||||||||||||||||||||||||||
| 2027 | 466,854 | 428,751 | 25,645,158 | 59.81 | 26,575,951 | 61.98 | |||||||||||||||||||||||||||||||||||
| 2028 | 352,948 | 218,537 | 16,068,198 | 73.53 | 17,815,914 | 81.52 | |||||||||||||||||||||||||||||||||||
| 2029 | 243,346 | 212,480 | 12,396,423 | 58.34 | 13,428,185 | 63.20 | |||||||||||||||||||||||||||||||||||
| 2030 | 199,355 | 187,546 | 11,299,477 | 60.25 | 12,494,606 | 66.62 | |||||||||||||||||||||||||||||||||||
| 2031 | 298,977 | 276,778 | 15,983,641 | 57.75 | 17,987,509 | 64.99 | |||||||||||||||||||||||||||||||||||
| 2032 | 657,486 | 635,001 | 43,386,599 | 68.33 | 49,178,260 | 77.45 | |||||||||||||||||||||||||||||||||||
| 2033 | 1,177,023 | 1,171,299 | 71,711,020 | 61.22 | 84,924,059 | 72.50 | |||||||||||||||||||||||||||||||||||
| 2034 | 297,024 | 297,024 | 17,357,102 | 58.44 | 20,639,225 | 69.49 | |||||||||||||||||||||||||||||||||||
| Thereafter | 3,487,698 | 3,107,885 | 193,761,469 | 62.35 | 239,938,771 | 77.20 | |||||||||||||||||||||||||||||||||||
| BXP’s Share | |||||||||||||||||||||||||||||||||||||||||
| Year | Rentable Square Footage4 |
Rentable Square Footage4 |
Current Annualized Rental Obligations Under Expiring Leases | Annualized Rental Obligations Under Expiring Leases with future step-ups | |||||||||||||||||||||||||||||||||||||
| $ | $/PSF | $ | $/PSF | ||||||||||||||||||||||||||||||||||||||
| 2025 | — | — | — | — | — | — | |||||||||||||||||||||||||||||||||||
| 2026 | 22,319 | 20,502 | 970,565 | 47.34 | 973,846 | 47.50 | |||||||||||||||||||||||||||||||||||
| 2027 | 53,134 | 49,032 | 3,263,922 | 66.57 | 3,271,685 | 66.73 | |||||||||||||||||||||||||||||||||||
| 2028 | 32,691 | 32,691 | 2,240,198 | 68.53 | 2,270,968 | 69.47 | |||||||||||||||||||||||||||||||||||
| 2029 | 48,496 | 48,496 | 3,565,294 | 73.52 | 3,756,703 | 77.46 | |||||||||||||||||||||||||||||||||||
| 2030 | 40,520 | 40,520 | 2,932,068 | 72.36 | 3,066,320 | 75.67 | |||||||||||||||||||||||||||||||||||
| 2031 | 35,736 | 35,736 | 2,576,723 | 72.10 | 2,783,470 | 77.89 | |||||||||||||||||||||||||||||||||||
| 2032 | 22,679 | 22,679 | 1,470,299 | 64.83 | 1,694,589 | 74.72 | |||||||||||||||||||||||||||||||||||
| 2033 | 146,146 | 146,146 | 4,778,031 | 32.69 | 4,718,128 | 32.28 | |||||||||||||||||||||||||||||||||||
| 2034 | 38,076 | 38,076 | 2,475,937 | 65.03 | 2,704,819 | 71.04 | |||||||||||||||||||||||||||||||||||
| Thereafter | 94,773 | 91,652 | 5,738,689 | 62.61 | 6,853,885 | 74.78 | |||||||||||||||||||||||||||||||||||
| BXP’s Share | |||||||||||||||||||||||||||||||||||||||||
| Year | Rentable Square Footage4 |
Rentable Square Footage4 |
Current Annualized Rental Obligations Under Expiring Leases | Annualized Rental Obligations Under Expiring Leases with future step-ups | |||||||||||||||||||||||||||||||||||||
| $ | $/PSF | $ | $/PSF | ||||||||||||||||||||||||||||||||||||||
| 2025 | 60,452 | 60,452 | 4,881,227 | 80.75 | 4,881,227 | 80.75 | |||||||||||||||||||||||||||||||||||
| 2026 | 196,372 | 167,556 | 10,159,475 | 60.63 | 10,229,494 | 61.05 | |||||||||||||||||||||||||||||||||||
| 2027 | 519,988 | 477,783 | 28,909,080 | 60.51 | 29,847,636 | 62.47 | |||||||||||||||||||||||||||||||||||
| 2028 | 385,639 | 251,228 | 18,308,396 | 72.88 | 20,086,882 | 79.95 | |||||||||||||||||||||||||||||||||||
| 2029 | 291,842 | 260,976 | 15,961,717 | 61.16 | 17,184,888 | 65.85 | |||||||||||||||||||||||||||||||||||
| 2030 | 239,875 | 228,066 | 14,231,545 | 62.40 | 15,560,926 | 68.23 | |||||||||||||||||||||||||||||||||||
| 2031 | 334,713 | 312,514 | 18,560,364 | 59.39 | 20,770,979 | 66.46 | |||||||||||||||||||||||||||||||||||
| 2032 | 680,165 | 657,680 | 44,856,898 | 68.20 | 50,872,849 | 77.35 | |||||||||||||||||||||||||||||||||||
| 2033 | 1,323,169 | 1,317,445 | 76,489,051 | 58.06 | 89,642,187 | 68.04 | |||||||||||||||||||||||||||||||||||
| 2034 | 335,100 | 335,100 | 19,833,039 | 59.19 | 23,344,044 | 69.66 | |||||||||||||||||||||||||||||||||||
| Thereafter | 3,582,471 | 3,199,537 | 199,500,158 | 62.35 | 246,792,656 | 77.13 | |||||||||||||||||||||||||||||||||||
|
|
Q3 2025 | ||||
Quarterly lease expirations - Washington, DC region in-service properties 1, 2, 3 | |||||
| BXP’s Share | |||||||||||||||||||||||||||||||||||||||||
| Quarter | Rentable Square Footage4 |
Rentable Square Footage4 |
Current Annualized Rental Obligations Under Expiring Leases | Annualized Rental Obligations Under Expiring Leases with future step-ups | |||||||||||||||||||||||||||||||||||||
| $ | $/PSF | $ | $/PSF | ||||||||||||||||||||||||||||||||||||||
| Q1 2025 | — | — | — | — | — | — | |||||||||||||||||||||||||||||||||||
| Q2 2025 | — | — | — | — | — | — | |||||||||||||||||||||||||||||||||||
| Q3 2025 | — | — | — | — | — | — | |||||||||||||||||||||||||||||||||||
| Q4 2025 | 60,452 | 60,452 | 4,881,227 | 80.75 | 4,881,227 | 80.75 | |||||||||||||||||||||||||||||||||||
| Total 2025 | 60,452 | 60,452 | 4,881,227 | 80.75 | 4,881,227 | 80.75 | |||||||||||||||||||||||||||||||||||
| Q1 2026 | 25,534 | 22,738 | 892,661 | 39.26 | 897,532 | 39.47 | |||||||||||||||||||||||||||||||||||
| Q2 2026 | 40,827 | 40,827 | 1,960,659 | 48.02 | 1,985,989 | 48.64 | |||||||||||||||||||||||||||||||||||
| Q3 2026 | 28,188 | 26,893 | 2,365,962 | 87.98 | 2,321,900 | 86.34 | |||||||||||||||||||||||||||||||||||
| Q4 2026 | 79,504 | 56,597 | 3,969,628 | 70.14 | 4,050,226 | 71.56 | |||||||||||||||||||||||||||||||||||
| Total 2026 | 174,053 | 147,054 | 9,188,910 | 62.49 | 9,255,648 | 62.94 | |||||||||||||||||||||||||||||||||||
| BXP’s Share | |||||||||||||||||||||||||||||||||||||||||
| Quarter | Rentable Square Footage4 |
Rentable Square Footage4 |
Current Annualized Rental Obligations Under Expiring Leases | Annualized Rental Obligations Under Expiring Leases with future step-ups | |||||||||||||||||||||||||||||||||||||
| $ | $/PSF | $ | $/PSF | ||||||||||||||||||||||||||||||||||||||
| Q1 2025 | — | — | — | — | — | — | |||||||||||||||||||||||||||||||||||
| Q2 2025 | — | — | — | — | — | — | |||||||||||||||||||||||||||||||||||
| Q3 2025 | — | — | — | — | — | — | |||||||||||||||||||||||||||||||||||
| Q4 2025 | — | — | — | — | — | — | |||||||||||||||||||||||||||||||||||
| Total 2025 | — | — | — | — | — | — | |||||||||||||||||||||||||||||||||||
| Q1 2026 | 7,963 | 6,146 | 316,039 | 51.42 | 316,039 | 51.42 | |||||||||||||||||||||||||||||||||||
| Q2 2026 | — | — | — | — | — | — | |||||||||||||||||||||||||||||||||||
| Q3 2026 | 3,872 | 3,872 | 230,945 | 59.64 | 230,945 | 59.64 | |||||||||||||||||||||||||||||||||||
| Q4 2026 | 10,484 | 10,484 | 423,581 | 40.40 | 426,863 | 40.72 | |||||||||||||||||||||||||||||||||||
| Total 2026 | 22,319 | 20,502 | 970,565 | 47.34 | 973,846 | 47.50 | |||||||||||||||||||||||||||||||||||
| BXP’s Share | |||||||||||||||||||||||||||||||||||||||||
| Quarter | Rentable Square Footage4 |
Rentable Square Footage4 |
Current Annualized Rental Obligations Under Expiring Leases | Annualized Rental Obligations Under Expiring Leases with future step-ups | |||||||||||||||||||||||||||||||||||||
| $ | $/PSF | $ | $/PSF | ||||||||||||||||||||||||||||||||||||||
| Q1 2025 | — | — | — | — | — | — | |||||||||||||||||||||||||||||||||||
| Q2 2025 | — | — | — | — | — | — | |||||||||||||||||||||||||||||||||||
| Q3 2025 | — | — | — | — | — | — | |||||||||||||||||||||||||||||||||||
| Q4 2025 | 60,452 | 60,452 | 4,881,227 | 80.75 | 4,881,227 | 80.75 | |||||||||||||||||||||||||||||||||||
| Total 2025 | 60,452 | 60,452 | 4,881,227 | 80.75 | 4,881,227 | 80.75 | |||||||||||||||||||||||||||||||||||
| Q1 2026 | 33,497 | 28,884 | 1,208,700 | 41.85 | 1,213,571 | 42.02 | |||||||||||||||||||||||||||||||||||
| Q2 2026 | 40,827 | 40,827 | 1,960,659 | 48.02 | 1,985,989 | 48.64 | |||||||||||||||||||||||||||||||||||
| Q3 2026 | 32,060 | 30,765 | 2,596,907 | 84.41 | 2,552,845 | 82.98 | |||||||||||||||||||||||||||||||||||
| Q4 2026 | 89,988 | 67,081 | 4,393,209 | 65.49 | 4,477,089 | 66.74 | |||||||||||||||||||||||||||||||||||
| Total 2026 | 196,372 | 167,556 | 10,159,475 | 60.63 | 10,229,494 | 61.05 | |||||||||||||||||||||||||||||||||||
|
|
Q3 2025 | ||||
Lease expirations - CBD properties 1, 2, 3 | |||||
| BXP’s Share | |||||||||||||||||||||||||||||||||||||||||
| Year | Rentable Square Footage4 |
Rentable Square Footage4 |
Current Annualized Rental Obligations Under Expiring Leases | Annualized Rental Obligations Under Expiring Leases with future step-ups | |||||||||||||||||||||||||||||||||||||
| $ | $/PSF | $ | $/PSF | ||||||||||||||||||||||||||||||||||||||
| 2025 | 14,253 | 14,253 | 1,167,867 | 81.94 | 1,167,867 | 81.94 | |||||||||||||||||||||||||||||||||||
| 2026 | 268,670 | 217,583 | 16,556,201 | 76.09 | 16,730,531 | 76.89 | |||||||||||||||||||||||||||||||||||
| 2027 | 356,135 | 340,960 | 31,611,322 | 92.71 | 32,152,457 | 94.30 | |||||||||||||||||||||||||||||||||||
| 2028 | 650,518 | 625,289 | 73,158,294 | 117.00 | 77,334,695 | 123.68 | |||||||||||||||||||||||||||||||||||
| 2029 | 787,449 | 653,288 | 59,135,415 | 90.52 | 61,722,719 | 94.48 | |||||||||||||||||||||||||||||||||||
| 2030 | 1,211,977 | 1,160,123 | 87,283,855 | 75.24 | 91,569,049 | 78.93 | |||||||||||||||||||||||||||||||||||
| 2031 | 57,461 | 49,909 | 4,212,754 | 84.41 | 4,639,666 | 92.96 | |||||||||||||||||||||||||||||||||||
| 2032 | 863,930 | 863,339 | 71,698,071 | 83.05 | 88,880,537 | 102.95 | |||||||||||||||||||||||||||||||||||
| 2033 | 587,671 | 528,845 | 45,594,804 | 86.22 | 69,648,806 | 131.70 | |||||||||||||||||||||||||||||||||||
| 2034 | 1,264,793 | 1,083,697 | 97,676,057 | 90.13 | 108,626,955 | 100.24 | |||||||||||||||||||||||||||||||||||
| Thereafter | 4,564,615 | 3,622,562 | 318,390,589 | 87.89 | 397,304,650 | 109.68 | |||||||||||||||||||||||||||||||||||
| BXP’s Share | |||||||||||||||||||||||||||||||||||||||||
| Year | Rentable Square Footage4 |
Rentable Square Footage4 |
Current Annualized Rental Obligations Under Expiring Leases | Annualized Rental Obligations Under Expiring Leases with future step-ups | |||||||||||||||||||||||||||||||||||||
| $ | $/PSF | $ | $/PSF | ||||||||||||||||||||||||||||||||||||||
| 2025 | 766 | 766 | 51,290 | 66.96 | 51,290 | 66.96 | |||||||||||||||||||||||||||||||||||
| 2026 | 186,179 | 176,585 | 11,662,183 | 66.04 | 11,668,911 | 66.08 | |||||||||||||||||||||||||||||||||||
| 2027 | 7,367 | 7,367 | 305,388 | 41.45 | 316,294 | 42.93 | |||||||||||||||||||||||||||||||||||
| 2028 | 299,852 | 202,055 | 15,784,916 | 78.12 | 17,135,800 | 84.81 | |||||||||||||||||||||||||||||||||||
| 2029 | 455,174 | 280,218 | 19,833,318 | 70.78 | 22,018,858 | 78.58 | |||||||||||||||||||||||||||||||||||
| 2030 | 65,797 | 65,797 | 4,661,436 | 70.85 | 5,318,880 | 80.84 | |||||||||||||||||||||||||||||||||||
| 2031 | 7,752 | 7,752 | 540,350 | 69.7 | 638,831 | 82.41 | |||||||||||||||||||||||||||||||||||
| 2032 | 246,667 | 127,701 | 10,876,902 | 85.18 | 13,253,593 | 103.79 | |||||||||||||||||||||||||||||||||||
| 2033 | 186,894 | 93,447 | 6,578,697 | 70.4 | 11,108,262 | 118.87 | |||||||||||||||||||||||||||||||||||
| 2034 | 23,732 | 13,736 | 485,145 | 35.32 | 547,985 | 39.90 | |||||||||||||||||||||||||||||||||||
| Thereafter | 508,511 | 508,511 | 39,958,075 | 78.58 | 47,375,141 | 93.16 | |||||||||||||||||||||||||||||||||||
| BXP’s Share | |||||||||||||||||||||||||||||||||||||||||
| Year | Rentable Square Footage4 |
Rentable Square Footage4 |
Current Annualized Rental Obligations Under Expiring Leases | Annualized Rental Obligations Under Expiring Leases with future step-ups | |||||||||||||||||||||||||||||||||||||
| $ | $/PSF | $ | $/PSF | ||||||||||||||||||||||||||||||||||||||
| 2025 | 32,944 | 32,944 | 2,992,843 | 90.85 | 2,992,843 | 90.85 | |||||||||||||||||||||||||||||||||||
| 2026 | 103,021 | 80,172 | 16,480,631 | 205.57 | 16,534,901 | 206.24 | |||||||||||||||||||||||||||||||||||
| 2027 | 165,431 | 123,467 | 12,404,512 | 100.47 | 12,372,484 | 100.21 | |||||||||||||||||||||||||||||||||||
| 2028 | 231,633 | 172,299 | 20,539,374 | 119.21 | 20,585,687 | 119.48 | |||||||||||||||||||||||||||||||||||
| 2029 | 790,423 | 574,174 | 58,866,662 | 102.52 | 60,445,103 | 105.27 | |||||||||||||||||||||||||||||||||||
| 2030 | 470,522 | 397,495 | 44,527,535 | 112.02 | 45,871,317 | 115.40 | |||||||||||||||||||||||||||||||||||
| 2031 | 465,739 | 377,140 | 43,543,414 | 115.46 | 46,149,939 | 122.37 | |||||||||||||||||||||||||||||||||||
| 2032 | 251,528 | 160,135 | 15,414,602 | 96.26 | 16,109,450 | 100.60 | |||||||||||||||||||||||||||||||||||
| 2033 | 396,861 | 352,270 | 42,561,437 | 120.82 | 46,763,611 | 132.75 | |||||||||||||||||||||||||||||||||||
| 2034 | 1,457,472 | 1,127,034 | 134,082,917 | 118.97 | 147,641,116 | 131 | |||||||||||||||||||||||||||||||||||
| Thereafter | 4,739,186 | 3,201,090 | 341,026,898 | 106.53 | 383,980,754 | 119.95 | |||||||||||||||||||||||||||||||||||
|
|
Q3 2025 | ||||
Lease expirations - CBD properties (continued) 1, 2, 3 | |||||
| BXP’s Share | |||||||||||||||||||||||||||||||||||||||||
| Year | Rentable Square Footage4 |
Rentable Square Footage4 |
Current Annualized Rental Obligations Under Expiring Leases | Annualized Rental Obligations Under Expiring Leases with future step-ups | |||||||||||||||||||||||||||||||||||||
| $ | $/PSF | $ | $/PSF | ||||||||||||||||||||||||||||||||||||||
| 2025 | 27,932 | 27,932 | 2,573,771 | 92.14 | 2,573,771 | 92.14 | |||||||||||||||||||||||||||||||||||
| 2026 | 306,367 | 306,367 | 30,189,836 | 98.54 | 32,154,058 | 104.95 | |||||||||||||||||||||||||||||||||||
| 2027 | 390,545 | 390,545 | 41,158,860 | 105.39 | 42,536,200 | 108.91 | |||||||||||||||||||||||||||||||||||
| 2028 | 357,968 | 357,968 | 40,845,965 | 114.11 | 43,192,933 | 120.66 | |||||||||||||||||||||||||||||||||||
| 2029 | 502,652 | 502,652 | 47,779,156 | 95.05 | 51,405,269 | 102.27 | |||||||||||||||||||||||||||||||||||
| 2030 | 347,638 | 347,638 | 33,908,791 | 97.54 | 38,055,019 | 109.47 | |||||||||||||||||||||||||||||||||||
| 2031 | 963,365 | 963,365 | 106,560,802 | 110.61 | 115,192,003 | 119.57 | |||||||||||||||||||||||||||||||||||
| 2032 | 339,022 | 339,022 | 29,672,972 | 87.53 | 35,349,034 | 104.27 | |||||||||||||||||||||||||||||||||||
| 2033 | 626,058 | 626,058 | 68,165,764 | 108.88 | 75,758,430 | 121.01 | |||||||||||||||||||||||||||||||||||
| 2034 | 100,631 | 100,631 | 8,216,811 | 81.65 | 10,342,472 | 102.78 | |||||||||||||||||||||||||||||||||||
| Thereafter | 435,011 | 435,011 | 42,830,391 | 98.46 | 56,223,053 | 129.25 | |||||||||||||||||||||||||||||||||||
| BXP’s Share | |||||||||||||||||||||||||||||||||||||||||
| Year | Rentable Square Footage4 |
Rentable Square Footage4 |
Current Annualized Rental Obligations Under Expiring Leases | Annualized Rental Obligations Under Expiring Leases with future step-ups | |||||||||||||||||||||||||||||||||||||
| $ | $/PSF | $ | $/PSF | ||||||||||||||||||||||||||||||||||||||
| 2025 | 56,677 | 19,083 | 948,190 | 49.69 | 948,190 | 49.69 | |||||||||||||||||||||||||||||||||||
| 2026 | 71,003 | 67,221 | 4,010,729 | 59.66 | 4,097,839 | 60.96 | |||||||||||||||||||||||||||||||||||
| 2027 | 77,785 | 74,224 | 4,315,791 | 58.15 | 4,471,476 | 60.24 | |||||||||||||||||||||||||||||||||||
| 2028 | 602,327 | 303,390 | 17,089,294 | 56.33 | 17,919,429 | 59.06 | |||||||||||||||||||||||||||||||||||
| 2029 | 233,502 | 212,700 | 11,530,560 | 54.21 | 11,982,412 | 56.33 | |||||||||||||||||||||||||||||||||||
| 2030 | 40,707 | 40,707 | 2,413,273 | 59.28 | 2,655,900 | 65.24 | |||||||||||||||||||||||||||||||||||
| 2031 | 30,219 | 20,935 | 1,186,637 | 56.68 | 1,318,955 | 63.00 | |||||||||||||||||||||||||||||||||||
| 2032 | 70,933 | 57,584 | 4,211,558 | 73.14 | 4,866,692 | 84.51 | |||||||||||||||||||||||||||||||||||
| 2033 | — | — | — | — | — | — | |||||||||||||||||||||||||||||||||||
| 2034 | — | — | — | — | — | — | |||||||||||||||||||||||||||||||||||
| Thereafter | 63,925 | 23,614 | 1,638,595 | 69.39 | 2,006,913 | 84.99 | |||||||||||||||||||||||||||||||||||
| BXP’s Share | |||||||||||||||||||||||||||||||||||||||||
| Year | Rentable Square Footage4 |
Rentable Square Footage4 |
Current Annualized Rental Obligations Under Expiring Leases | Annualized Rental Obligations Under Expiring Leases with future step-ups | |||||||||||||||||||||||||||||||||||||
| $ | $/PSF | $ | $/PSF | ||||||||||||||||||||||||||||||||||||||
| 2025 | 60,452 | 60,452 | 4,881,227 | 80.75 | 4,881,227 | 80.75 | |||||||||||||||||||||||||||||||||||
| 2026 | 176,445 | 147,629 | 9,323,774 | 63.16 | 9,389,757 | 63.60 | |||||||||||||||||||||||||||||||||||
| 2027 | 504,412 | 462,207 | 28,093,911 | 60.78 | 29,027,637 | 62.80 | |||||||||||||||||||||||||||||||||||
| 2028 | 385,639 | 251,228 | 18,308,396 | 72.88 | 20,086,882 | 79.95 | |||||||||||||||||||||||||||||||||||
| 2029 | 278,257 | 247,391 | 15,362,985 | 62.10 | 16,539,617 | 66.86 | |||||||||||||||||||||||||||||||||||
| 2030 | 215,890 | 204,081 | 13,326,874 | 65.30 | 14,554,338 | 71.32 | |||||||||||||||||||||||||||||||||||
| 2031 | 320,350 | 298,151 | 18,000,860 | 60.37 | 20,144,278 | 67.56 | |||||||||||||||||||||||||||||||||||
| 2032 | 680,165 | 657,680 | 44,856,897 | 68.20 | 50,872,849 | 77.35 | |||||||||||||||||||||||||||||||||||
| 2033 | 1,251,425 | 1,245,701 | 74,705,620 | 59.97 | 87,840,317 | 70.51 | |||||||||||||||||||||||||||||||||||
| 2034 | 326,638 | 326,638 | 19,499,475 | 59.70 | 22,938,637 | 70.23 | |||||||||||||||||||||||||||||||||||
| Thereafter | 3,582,471 | 3,199,537 | 199,500,158 | 62.35 | 246,792,656 | 77.13 | |||||||||||||||||||||||||||||||||||
|
|
Q3 2025 | ||||
Lease expirations - Suburban properties 1, 2, 3 | |||||
| BXP’s Share | |||||||||||||||||||||||||||||||||||||||||
| Year | Rentable Square Footage4 |
Rentable Square Footage4 |
Current Annualized Rental Obligations Under Expiring Leases | Annualized Rental Obligations Under Expiring Leases with future step-ups | |||||||||||||||||||||||||||||||||||||
| $ | $/PSF | $ | $/PSF | ||||||||||||||||||||||||||||||||||||||
| 2025 | 32,117 | 32,117 | 1,512,898 | 47.11 | 1,512,898 | 47.11 | |||||||||||||||||||||||||||||||||||
| 2026 | 142,826 | 142,826 | 9,694,739 | 67.88 | 9,836,605 | 68.87 | |||||||||||||||||||||||||||||||||||
| 2027 | 173,158 | 173,158 | 10,956,110 | 63.27 | 11,243,282 | 64.93 | |||||||||||||||||||||||||||||||||||
| 2028 | 274,814 | 274,814 | 15,634,357 | 56.89 | 16,376,655 | 59.59 | |||||||||||||||||||||||||||||||||||
| 2029 | 474,940 | 474,940 | 23,639,927 | 49.77 | 25,929,409 | 54.60 | |||||||||||||||||||||||||||||||||||
| 2030 | 178,777 | 178,777 | 10,957,948 | 61.29 | 12,294,373 | 68.77 | |||||||||||||||||||||||||||||||||||
| 2031 | 634,106 | 573,766 | 38,520,828 | 67.14 | 41,515,657 | 72.36 | |||||||||||||||||||||||||||||||||||
| 2032 | 213,282 | 213,282 | 12,696,998 | 59.53 | 14,151,759 | 66.35 | |||||||||||||||||||||||||||||||||||
| 2033 | 350,366 | 350,366 | 27,189,680 | 77.60 | 31,066,513 | 88.67 | |||||||||||||||||||||||||||||||||||
| 2034 | 326,384 | 326,384 | 24,277,906 | 74.38 | 28,099,357 | 86.09 | |||||||||||||||||||||||||||||||||||
| Thereafter | 502,785 | 502,785 | 22,949,315 | 45.64 | 29,552,996 | 58.78 | |||||||||||||||||||||||||||||||||||
| BXP’s Share | |||||||||||||||||||||||||||||||||||||||||
| Year | Rentable Square Footage4 |
Rentable Square Footage4 |
Current Annualized Rental Obligations Under Expiring Leases | Annualized Rental Obligations Under Expiring Leases with future step-ups | |||||||||||||||||||||||||||||||||||||
| $ | $/PSF | $ | $/PSF | ||||||||||||||||||||||||||||||||||||||
| 2025 | 3,071 | 3,071 | 91,105 | 29.67 | 91,105 | 29.67 | |||||||||||||||||||||||||||||||||||
| 2026 | 124,933 | 124,933 | 4,959,914 | 39.70 | 4,984,911 | 39.90 | |||||||||||||||||||||||||||||||||||
| 2027 | 222,751 | 222,751 | 8,563,360 | 38.44 | 8,712,331 | 39.11 | |||||||||||||||||||||||||||||||||||
| 2028 | 104,931 | 104,931 | 4,159,997 | 39.65 | 4,096,313 | 39.04 | |||||||||||||||||||||||||||||||||||
| 2029 | 158,749 | 158,749 | 5,645,283 | 35.56 | 5,897,263 | 37.15 | |||||||||||||||||||||||||||||||||||
| 2030 | 125,143 | 125,143 | 5,021,434 | 40.13 | 5,276,457 | 42.16 | |||||||||||||||||||||||||||||||||||
| 2031 | 185,668 | 185,668 | 7,589,569 | 40.88 | 7,935,227 | 42.74 | |||||||||||||||||||||||||||||||||||
| 2032 | 113,126 | 113,126 | 4,506,121 | 39.83 | 4,699,201 | 41.54 | |||||||||||||||||||||||||||||||||||
| 2033 | 40,920 | 40,920 | 1,553,150 | 37.96 | 1,695,341 | 41.43 | |||||||||||||||||||||||||||||||||||
| 2034 | — | — | — | — | — | — | |||||||||||||||||||||||||||||||||||
| Thereafter | 498,522 | 498,522 | 20,118,143 | 40.36 | 22,109,259 | 44.35 | |||||||||||||||||||||||||||||||||||
| BXP’s Share | |||||||||||||||||||||||||||||||||||||||||
| Year | Rentable Square Footage4 |
Rentable Square Footage4 |
Current Annualized Rental Obligations Under Expiring Leases | Annualized Rental Obligations Under Expiring Leases with future step-ups | |||||||||||||||||||||||||||||||||||||
| $ | $/PSF | $ | $/PSF | ||||||||||||||||||||||||||||||||||||||
| 2025 | 80,767 | 65,949 | 5,501,902 | 83.43 | 5,503,805 | 83.46 | |||||||||||||||||||||||||||||||||||
| 2026 | 293,934 | 204,750 | 16,378,626 | 79.99 | 16,409,346 | 80.14 | |||||||||||||||||||||||||||||||||||
| 2027 | 158,646 | 139,112 | 9,273,807 | 66.66 | 9,653,566 | 69.39 | |||||||||||||||||||||||||||||||||||
| 2028 | 121,002 | 101,244 | 5,206,617 | 51.43 | 5,119,426 | 50.57 | |||||||||||||||||||||||||||||||||||
| 2029 | 179,584 | 117,772 | 7,080,431 | 60.12 | 7,708,556 | 65.45 | |||||||||||||||||||||||||||||||||||
| 2030 | 152,277 | 122,048 | 7,550,998 | 61.87 | 8,503,358 | 69.67 | |||||||||||||||||||||||||||||||||||
| 2031 | 76,962 | 44,840 | 3,101,660 | 69.17 | 2,930,460 | 65.35 | |||||||||||||||||||||||||||||||||||
| 2032 | 72,796 | 36,398 | 2,416,737 | 66.40 | 2,667,595 | 73.29 | |||||||||||||||||||||||||||||||||||
| 2033 | 12,456 | 6,228 | 403,538 | 64.79 | 436,809 | 70.14 | |||||||||||||||||||||||||||||||||||
| 2034 | 230,592 | 112,990 | 13,119,082 | 116.11 | 16,235,091 | 143.69 | |||||||||||||||||||||||||||||||||||
| Thereafter | 4,083 | 2,042 | 101,667 | 49.80 | 132,652 | 64.98 | |||||||||||||||||||||||||||||||||||
|
|
Q3 2025 | ||||
Lease expirations - Suburban properties (continued) 1, 2, 3 | |||||
| BXP’s Share | |||||||||||||||||||||||||||||||||||||||||
| Year | Rentable Square Footage4 |
Rentable Square Footage4 |
Current Annualized Rental Obligations Under Expiring Leases | Annualized Rental Obligations Under Expiring Leases with future step-ups | |||||||||||||||||||||||||||||||||||||
| $ | $/PSF | $ | $/PSF | ||||||||||||||||||||||||||||||||||||||
| 2025 | — | — | — | — | — | — | |||||||||||||||||||||||||||||||||||
| 2026 | 19,927 | 19,927 | 835,700 | 41.94 | 839,736 | 42.14 | |||||||||||||||||||||||||||||||||||
| 2027 | 15,576 | 15,576 | 815,169 | 52.33 | 819,999 | 52.65 | |||||||||||||||||||||||||||||||||||
| 2028 | — | — | — | — | — | — | |||||||||||||||||||||||||||||||||||
| 2029 | 13,585 | 13,585 | 598,732 | 44.07 | 645,271 | 47.50 | |||||||||||||||||||||||||||||||||||
| 2030 | 23,985 | 23,985 | 904,671 | 37.72 | 1,006,588 | 41.97 | |||||||||||||||||||||||||||||||||||
| 2031 | 14,363 | 14,363 | 559,504 | 38.95 | 626,700 | 43.63 | |||||||||||||||||||||||||||||||||||
| 2032 | — | — | — | — | — | — | |||||||||||||||||||||||||||||||||||
| 2033 | 71,744 | 71,744 | 1,783,430 | 24.86 | 1,801,870 | 25.12 | |||||||||||||||||||||||||||||||||||
| 2034 | 8,462 | 8,462 | 333,564 | 39.42 | 405,407 | 47.91 | |||||||||||||||||||||||||||||||||||
| Thereafter | — | — | — | — | — | — | |||||||||||||||||||||||||||||||||||
|
|
Q3 2025 | ||||
| Research coverage | |||||
| Equity Research Coverage | |||||||||||
| Bank of America Merrill Lynch | Jeffrey Spector / Jana Galan | 646.855.1363 / 646.855.5042 | |||||||||
| Barclays | Brendan Lynch | 212.526.9428 | |||||||||
| BMO Capital | John Kim | 212.885.4115 | |||||||||
| BTIG | Tom Catherwood | 212.738.6140 | |||||||||
| Cantor | Richard Anderson | 929.441.6927 | |||||||||
| Citi | Nicholas Joseph / Seth Bergey | 212.816.1909 / 212.816.2066 | |||||||||
| Compass Point Research & Trading, LLC | Ken Billingsley | 202.534.1393 | |||||||||
| Deutsche Bank | Omotayo Okusanya | 212.250.9284 | |||||||||
| Evercore ISI | Steve Sakwa | 212.446.9462 | |||||||||
| Goldman Sachs | Caitlin Burrows | 212.902.4736 | |||||||||
| Green Street Advisors | Dylan Burzinski | 949.640.8780 | |||||||||
| Jefferies | Peter Abramowitz | 212.336.7241 | |||||||||
| J.P. Morgan Securities | Anthony Paolone | 212.622.6682 | |||||||||
| Keybanc Capital Market | Todd Thomas / Upal Rana | 917.368.2286 / 917.368.2316 | |||||||||
| Ladenburg Thalmann | Floris van Dijkum | 212.409.2075 | |||||||||
| Mizuho Securities | Vikram Malhotra | 212.209.9300 | |||||||||
| Morgan Stanley | Ronald Kamdem | 212.296.8319 | |||||||||
| Piper Sandler Companies | Alexander Goldfarb | 212.466.7937 | |||||||||
| Scotiabank GBM | Nicholas Yulico | 212.225.6904 | |||||||||
| Truist Securities | Michael Lewis | 212.319.5659 | |||||||||
UBS US Equity Research |
Michael Goldsmith | 212.713.2951 | |||||||||
| Wells Fargo Securities | Blaine Heck | 410.662.2556 | |||||||||
| Wolfe Research | Ally Yaseen | 646.582.9253 | |||||||||
| Debt Research Coverage | |||||||||||
| Barclays | Srinjoy Banerjee | 212.526.3521 | |||||||||
| J.P. Morgan Securities | Mark Streeter | 212.834.5086 | |||||||||
| US Bank | Bill Stafford | 877.558.2605 | |||||||||
| Wells Fargo | Kevin McClure | 704.410.1100 | |||||||||
| Rating Agencies | |||||||||||
| Moody’s Investors Service | Christian Azzi | 212.553.7718 | |||||||||
| Standard & Poor’s | Michael Souers | 212.438.2508 | |||||||||
|
|
Q3 2025 | ||||
| Definitions | |||||
|
|
Q3 2025 | ||||
| Definitions (continued) | |||||
|
|
Q3 2025 | ||||
| Definitions (continued) | |||||
|
|
Q3 2025 | ||||
| Definitions (continued) | |||||
|
|
Q3 2025 | ||||
| Reconciliations | |||||
| BXP’s Share of select items | |||||||||||
| Three Months Ended | |||||||||||
| 30-Sep-25 | 30-Jun-25 | ||||||||||
| Revenue | $ | 871,510 | $ | 868,457 | |||||||
| Partners’ share of revenue from consolidated joint ventures (JVs) | (88,181) | (88,271) | |||||||||
| BXP’s share of revenue from unconsolidated JVs | 56,016 | 55,481 | |||||||||
| BXP’s Share of revenue | $ | 839,345 | $ | 835,667 | |||||||
| Straight-line rent | $ | 30,105 | $ | 24,533 | |||||||
| Partners’ share of straight-line rent from consolidated JVs | (7,906) | (6,247) | |||||||||
| BXP’s share of straight-line rent from unconsolidated JVs | 1,660 | 2,249 | |||||||||
| BXP’s Share of straight-line rent | $ | 23,859 | $ | 20,535 | |||||||
Fair value lease revenue 1 |
$ | 1,906 | $ | 1,915 | |||||||
Partners’ share of fair value lease revenue from consolidated JVs 1 |
11 | 11 | |||||||||
BXP’s share of fair value lease revenue from unconsolidated JVs 1 |
1,102 | 1,103 | |||||||||
BXP’s Share of fair value lease revenue 1 |
$ | 3,019 | $ | 3,029 | |||||||
| Lease termination income | $ | 1,241 | $ | 909 | |||||||
| Partners’ share of termination income from consolidated JVs | — | — | |||||||||
| BXP’s share of termination income from unconsolidated JVs | 141 | (146) | |||||||||
| BXP’s Share of termination income | $ | 1,382 | $ | 763 | |||||||
| Non-cash termination income adjustment (fair value lease amounts) | $ | — | $ | — | |||||||
| Partners’ share of non-cash termination income adjustment (fair value lease amounts) from consolidated JVs | — | — | |||||||||
| BXP’s share of non-cash termination income adjustment (fair value lease amounts) from unconsolidated JVs | — | — | |||||||||
| BXP’s Share of non-cash termination income adjustment (fair value lease amounts) | $ | — | $ | — | |||||||
| Parking and other revenue | $ | 35,390 | $ | 34,799 | |||||||
| Partners’ share of parking and other revenue from consolidated JVs | (730) | (769) | |||||||||
| BXP’s share of parking and other revenue from unconsolidated JVs | 1,654 | 2,022 | |||||||||
| BXP’s Share of parking and other revenue | $ | 36,314 | $ | 36,052 | |||||||
| Hedge amortization, net of costs | $ | 1,590 | $ | 1,590 | |||||||
| Partners’ share of hedge amortization, net of costs from consolidated JVs | (144) | (144) | |||||||||
| BXP’s share of hedge amortization, net of costs from unconsolidated JVs | 335 | 362 | |||||||||
| BXP’s Share of hedge amortization, net of costs | $ | 1,781 | $ | 1,808 | |||||||
| Straight-line ground rent expense adjustment | $ | (530) | $ | 448 | |||||||
| Partners’ share of straight-line ground rent expense adjustment from consolidated JVs | — | — | |||||||||
| BXP’s share of straight-line ground rent expense adjustment from unconsolidated JVs | 123 | 136 | |||||||||
| BXP’s Share of straight-line ground rent expense adjustment | $ | (407) | $ | 584 | |||||||
| Depreciation and amortization | $ | 236,147 | $ | 223,819 | |||||||
| Noncontrolling interests in property partnerships’ share of depreciation and amortization | (22,615) | (20,945) | |||||||||
| BXP’s share of depreciation and amortization from unconsolidated JVs | 17,272 | 16,674 | |||||||||
| BXP’s Share of depreciation and amortization | $ | 230,804 | $ | 219,548 | |||||||
Lease transaction costs that qualify as rent inducements 2 |
$ | 5,894 | $ | 4,427 | |||||||
Partners’ share of lease transaction costs that qualify as rent inducements from consolidated JVs 2 |
(895) | (924) | |||||||||
BXP’s share of lease transaction costs that qualify as rent inducements from unconsolidated JVs 2 |
— | (21) | |||||||||
BXP’s Share of lease transaction costs that qualify as rent inducements 2 |
$ | 4,999 | $ | 3,482 | |||||||
| 2nd generation tenant improvements and leasing commissions | $ | 72,022 | $ | 69,064 | |||||||
Partners’ share of 2nd generation tenant improvements and leasing commissions from consolidated JVs |
(8,374) | (9,137) | |||||||||
BXP’s share of 2nd generation tenant improvements and leasing commissions from unconsolidated JVs |
1,067 | 1,496 | |||||||||
| BXP’s Share of 2nd generation tenant improvements and leasing commissions | $ | 64,715 | $ | 61,423 | |||||||
|
|
Q3 2025 | ||||
| Reconciliations (continued) | |||||
Maintenance capital expenditures 3 |
$ | 25,996 | $ | 32,934 | |||||||
Partners’ share of maintenance capital expenditures from consolidated JVs 3 |
(3,004) | (3,426) | |||||||||
BXP’s share of maintenance capital expenditures from unconsolidated JVs 3 |
349 | 703 | |||||||||
BXP’s Share of maintenance capital expenditures 3 |
$ | 23,341 | $ | 30,211 | |||||||
| Interest expense | $ | 164,299 | $ | 162,783 | |||||||
| Partners’ share of interest expense from consolidated JVs | (12,016) | (11,892) | |||||||||
| BXP’s share of interest expense from unconsolidated JVs | 20,214 | 18,872 | |||||||||
| BXP’s Share of interest expense | $ | 172,497 | $ | 169,763 | |||||||
| Capitalized interest | $ | 13,491 | $ | 12,148 | |||||||
| Partners’ share of capitalized interest from consolidated JVs | (21) | (23) | |||||||||
| BXP’s share of capitalized interest from unconsolidated JVs | 769 | 1,891 | |||||||||
| BXP’s Share of capitalized interest | $ | 14,239 | $ | 14,016 | |||||||
| Amortization of financing costs | $ | 4,764 | $ | 4,737 | |||||||
| Partners’ share of amortization of financing costs from consolidated JVs | (498) | (498) | |||||||||
| BXP’s share of amortization of financing costs from unconsolidated JVs | 434 | 426 | |||||||||
| BXP’s Share of amortization of financing costs | $ | 4,700 | $ | 4,665 | |||||||
| Fair value interest adjustment | $ | 139 | $ | 718 | |||||||
| Partners’ share of fair value of interest adjustment from consolidated JVs | — | — | |||||||||
| BXP’s share off fair value interest adjustment from unconsolidated JVs | 499 | 499 | |||||||||
| BXP’s Share of fair value interest adjustment | $ | 638 | $ | 1,217 | |||||||
| Amortization and accretion related to sales type lease | $ | 236 | $ | 232 | |||||||
| Partners’ share of amortization and accretion related to sales type lease from consolidated JVs | — | — | |||||||||
| BXP’s share off amortization and accretion related to sales type lease from unconsolidated JVs | 29 | 29 | |||||||||
| BXP’s Share of amortization and accretion related to sales type lease | $ | 265 | $ | 261 | |||||||
|
|
Q3 2025 | ||||
| Reconciliations (continued) | |||||
| CONSOLIDATED JOINT VENTURES | ||||||||||||||||||||
| 767 Fifth Avenue | Total Consolidated | |||||||||||||||||||
| (The GM Building) | Norges Joint Ventures 1 |
Joint Ventures | ||||||||||||||||||
| Revenue | ||||||||||||||||||||
Lease 2 |
$ | 81,717 | $ | 104,152 | $ | 185,869 | ||||||||||||||
| Straight-line rent | 3,256 | 14,676 | 17,932 | |||||||||||||||||
| Fair value lease revenue | (27) | — | (27) | |||||||||||||||||
| Termination income | — | — | — | |||||||||||||||||
| Total lease revenue | 84,946 | 118,828 | 203,774 | |||||||||||||||||
| Parking and other | — | 1,622 | 1,622 | |||||||||||||||||
Total rental revenue 3 |
84,946 | 120,450 | 205,396 | |||||||||||||||||
| Expenses | ||||||||||||||||||||
| Operating | 35,557 | 45,983 | 81,540 | |||||||||||||||||
| Net Operating Income (NOI) | 49,389 | 74,467 | 123,856 | |||||||||||||||||
| Other income (expense) | ||||||||||||||||||||
| Development and management services revenue | — | — | — | |||||||||||||||||
Gains from investments in securities |
— | 8 | 8 | |||||||||||||||||
| Interest and other income | 776 | 1,816 | 2,592 | |||||||||||||||||
| Interest expense | (21,395) | (7,693) | (29,088) | |||||||||||||||||
| Depreciation and amortization expense | (18,366) | (32,298) | (50,664) | |||||||||||||||||
| General and administrative expense | (67) | (169) | (236) | |||||||||||||||||
| Total other income (expense) | (39,052) | (38,336) | (77,388) | |||||||||||||||||
| Net income | $ | 10,337 | $ | 36,131 | $ | 46,468 | ||||||||||||||
| BXP’s nominal ownership percentage | 60% | 55% | ||||||||||||||||||
Partners’ share of NOI (after income allocation to private REIT shareholders) 4 |
$ | 19,002 | $ | 32,502 | $ | 51,504 | ||||||||||||||
| BXP’s share of NOI (after income allocation to private REIT shareholders) | $ | 30,387 | $ | 41,965 | $ | 72,352 | ||||||||||||||
Unearned portion of capitalized fees 5 |
$ | 198 | $ | 740 | $ | 938 | ||||||||||||||
Partners’ share of select items 4 |
||||||||||||||||||||
| Partners’ share of parking and other revenue | $ | — | $ | 730 | $ | 730 | ||||||||||||||
| Partners’ share of hedge amortization | $ | 144 | $ | — | $ | 144 | ||||||||||||||
| Partners’ share of amortization of financing costs | $ | 346 | $ | 152 | $ | 498 | ||||||||||||||
| Partners’ share of depreciation and amortization related to capitalized fees | $ | 408 | $ | 543 | $ | 951 | ||||||||||||||
| Partners’ share of capitalized interest | $ | — | $ | 21 | $ | 21 | ||||||||||||||
| Partners’ share of lease transactions costs which will qualify as rent inducements | $ | (38) | $ | (857) | $ | (895) | ||||||||||||||
| Partners’ share of management and other fees | $ | 756 | $ | 1,016 | $ | 1,772 | ||||||||||||||
| Partners’ share of basis differential depreciation and amortization expense | $ | (34) | $ | (182) | $ | (216) | ||||||||||||||
| Partners’ share of basis differential interest and other adjustments | $ | (4) | $ | 37 | $ | 33 | ||||||||||||||
Reconciliation of Partners’ share of EBITDAre 6 |
||||||||||||||||||||
| Partners’ NCI | $ | 3,008 | $ | 14,845 | $ | 17,853 | ||||||||||||||
| Add: | ||||||||||||||||||||
| Partners’ share of interest expense after BXP’s basis differential | 8,554 | 3,462 | 12,016 | |||||||||||||||||
| Partners’ share of depreciation and amortization expense after BXP’s basis differential | 7,720 | 14,895 | 22,615 | |||||||||||||||||
Partners’ share of EBITDAre |
$ | 19,282 | $ | 33,202 | $ | 52,484 | ||||||||||||||
|
|
Q3 2025 | ||||
| Reconciliations (continued) | |||||
| CONSOLIDATED JOINT VENTURES | ||||||||||||||||||||
| 767 Fifth Avenue | Total Consolidated | |||||||||||||||||||
Reconciliation of Partners’ share of Net Operating Income (Loss) (NOI) 6 |
(The GM Building) | Norges Joint Ventures 1 |
Joint Ventures | |||||||||||||||||
Rental revenue 3 |
$ | 33,978 | $ | 54,203 | $ | 88,181 | ||||||||||||||
| Less: Termination income | — | — | — | |||||||||||||||||
Rental revenue (excluding termination income) 3 |
33,978 | 54,203 | 88,181 | |||||||||||||||||
| Less: Operating expenses (including partners’ share of management and other fees) | 14,976 | 21,701 | 36,677 | |||||||||||||||||
| Income allocation to private REIT shareholders | — | — | — | |||||||||||||||||
| NOI (excluding termination income and after income allocation to private REIT shareholders) | $ | 19,002 | $ | 32,502 | $ | 51,504 | ||||||||||||||
Rental revenue (excluding termination income) 3 |
$ | 33,978 | $ | 54,203 | $ | 88,181 | ||||||||||||||
| Less: Straight-line rent | 1,302 | 6,604 | 7,906 | |||||||||||||||||
| Fair value lease revenue | (11) | — | (11) | |||||||||||||||||
| Add: Lease transaction costs that qualify as rent inducements | 38 | 857 | 895 | |||||||||||||||||
| Subtotal | 32,725 | 48,456 | 81,181 | |||||||||||||||||
| Less: Operating expenses (including partners’ share of management and other fees) | 14,976 | 21,701 | 36,677 | |||||||||||||||||
| Income allocation to private REIT shareholders | — | — | — | |||||||||||||||||
| NOI - cash (excluding termination income and after income allocation to private REIT shareholders) | $ | 17,749 | $ | 26,755 | $ | 44,504 | ||||||||||||||
Reconciliation of Partners’ share of Revenue 4 |
||||||||||||||||||||
Rental revenue 3 |
$ | 33,978 | $ | 54,203 | $ | 88,181 | ||||||||||||||
| Add: Development and management services revenue | — | — | — | |||||||||||||||||
| Revenue | $ | 33,978 | $ | 54,203 | $ | 88,181 | ||||||||||||||
|
|
Q3 2025 | ||||
| Reconciliations (continued) | |||||
| Boston | Los Angeles | New York | San Francisco | Seattle | Washington, DC | Total Unconsolidated Joint Ventures | ||||||||||||||||||||||||||||||||||||||
| Revenue | ||||||||||||||||||||||||||||||||||||||||||||
Lease 2 |
$ | 27,278 | $ | 20,367 | $ | 16,354 | $ | 17,803 | $ | 8,537 | $ | 24,461 | $ | 114,800 | ||||||||||||||||||||||||||||||
| Straight-line rent | 590 | (1,428) | 3,922 | (172) | 684 | (123) | 3,473 | |||||||||||||||||||||||||||||||||||||
| Fair value lease revenue | — | — | 1,300 | — | 1,293 | — | 2,593 | |||||||||||||||||||||||||||||||||||||
| Termination income | — | — | — | 282 | — | — | 282 | |||||||||||||||||||||||||||||||||||||
| Amortization and accretion related to sales-type lease | 57 | — | — | — | — | — | 57 | |||||||||||||||||||||||||||||||||||||
| Total lease revenue | 27,925 | 18,939 | 21,576 | 17,913 | 10,514 | 24,338 | 121,205 | |||||||||||||||||||||||||||||||||||||
| Parking and other | 43 | 1,967 | 49 | 221 | 592 | 818 | 3,690 | |||||||||||||||||||||||||||||||||||||
Total rental revenue 3 |
27,968 | 20,906 | 21,625 | 18,134 | 11,106 | 25,156 | 124,895 | |||||||||||||||||||||||||||||||||||||
| Expenses | ||||||||||||||||||||||||||||||||||||||||||||
| Operating | 10,164 | 7,944 | 15,965 | 4 |
9,597 | 3,551 | 9,232 | 56,453 | ||||||||||||||||||||||||||||||||||||
| Net operating income | 17,804 | 12,962 | 5,660 | 8,537 | 7,555 | 15,924 | 68,442 | |||||||||||||||||||||||||||||||||||||
| Other income (expense) | ||||||||||||||||||||||||||||||||||||||||||||
| Development and management services revenue | — | — | 417 | — | — | — | 417 | |||||||||||||||||||||||||||||||||||||
| Interest and other income (loss) | 535 | 1,166 | 820 | 11 | 147 | 199 | 2,878 | |||||||||||||||||||||||||||||||||||||
| Interest expense | (10,562) | (5,052) | (17,385) | — | (4,159) | (10,044) | (47,202) | |||||||||||||||||||||||||||||||||||||
| Unrealized gain/loss on derivative instruments | — | — | (1,403) | — | — | — | (1,403) | |||||||||||||||||||||||||||||||||||||
| Transaction costs | (27) | — | — | — | (28) | 53 | (2) | |||||||||||||||||||||||||||||||||||||
| Depreciation and amortization expense | (8,470) | (5,330) | (10,465) | (10,076) | (5,213) | (5,855) | (45,409) | |||||||||||||||||||||||||||||||||||||
| General and administrative expense | (1) | 5 | (111) | (4) | (14) | — | (125) | |||||||||||||||||||||||||||||||||||||
| Loss from early extinguishment of debt | — | — | — | — | — | — | — | |||||||||||||||||||||||||||||||||||||
| Gain on sale of real estate | — | 4,762 | — | — | — | — | 4,762 | |||||||||||||||||||||||||||||||||||||
| Total other income (expense) | (18,525) | (4,449) | (28,127) | (10,069) | (9,267) | (15,647) | (86,084) | |||||||||||||||||||||||||||||||||||||
| Net income (loss) | $ | (721) | $ | 8,513 | $ | (22,467) | $ | (1,532) | $ | (1,712) | $ | 277 | $ | (17,642) | ||||||||||||||||||||||||||||||
| BXP’s share of select items: | ||||||||||||||||||||||||||||||||||||||||||||
| BXP’s share of parking and other revenue | $ | 22 | $ | 984 | $ | 24 | $ | 111 | $ | 199 | $ | 314 | $ | 1,654 | ||||||||||||||||||||||||||||||
| BXP’s share of amortization of financing costs | $ | 132 | $ | 23 | $ | 157 | $ | — | $ | 28 | $ | 94 | $ | 434 | ||||||||||||||||||||||||||||||
| BXP’s share of hedge amortization, net of costs | $ | — | $ | — | $ | — | $ | — | $ | 335 | $ | — | $ | 335 | ||||||||||||||||||||||||||||||
| BXP’s share of fair value interest adjustment | $ | — | $ | — | $ | 499 | $ | — | $ | — | $ | — | $ | 499 | ||||||||||||||||||||||||||||||
| BXP’s share of capitalized interest | $ | — | $ | — | $ | 769 | $ | — | $ | — | $ | — | $ | 769 | ||||||||||||||||||||||||||||||
| BXP’s share of amortization and accretion related to sales-type lease | $ | 29 | $ | — | $ | — | $ | — | $ | — | $ | — | $ | 29 | ||||||||||||||||||||||||||||||
Reconciliation of BXP’s share of EBITDAre |
||||||||||||||||||||||||||||||||||||||||||||
| Income (loss) from unconsolidated joint ventures | $ | (367) | $ | 5,028 | $ | (9,170) | $ | (144,699) | $ | 197 | $ | 682 | $ | (148,329) | ||||||||||||||||||||||||||||||
| Add: | ||||||||||||||||||||||||||||||||||||||||||||
| BXP’s share of interest expense | 5,281 | 2,526 | 7,077 | — | 1,400 | 3,930 | 20,214 | |||||||||||||||||||||||||||||||||||||
| BXP’s share of depreciation and amortization expense | 4,237 | 2,144 | 5 |
3,929 | 5 |
3,714 | 5 |
983 | 2,265 | 17,272 | ||||||||||||||||||||||||||||||||||
Impairment loss on investment 6 |
— | — | — | 145,133 | — | — | 145,133 | |||||||||||||||||||||||||||||||||||||
| Less: | ||||||||||||||||||||||||||||||||||||||||||||
BXP’s share of gain on sale of real estate 7 |
— | 2,236 | — | — | — | — | 2,236 | |||||||||||||||||||||||||||||||||||||
BXP’s share of EBITDAre |
$ | 9,151 | $ | 7,462 | 5 |
$ | 1,836 | 5 |
$ | 4,148 | 5 |
$ | 2,580 | $ | 6,877 | $ | 32,054 | |||||||||||||||||||||||||||
|
|
Q3 2025 | ||||
| Reconciliations (continued) | |||||
UNCONSOLIDATED JOINT VENTURES 1 |
||||||||||||||||||||||||||||||||||||||||||||
| Reconciliation of BXP’s share of Net Operating Income (Loss) | Boston | Los Angeles | New York | San Francisco | Seattle | Washington, DC | Total Unconsolidated Joint Ventures | |||||||||||||||||||||||||||||||||||||
BXP’s share of rental revenue 3 |
$ | 13,985 | $ | 10,849 | 5 |
$ | 8,066 | 5 |
$ | 9,012 | $ | 3,739 | $ | 10,156 | $ | 55,807 | ||||||||||||||||||||||||||||
| BXP’s share of operating expenses | 5,082 | 3,973 | 6,643 | 4,866 | 1,194 | 3,374 | 25,132 | |||||||||||||||||||||||||||||||||||||
| BXP’s share of net operating income (loss) | 8,903 | 6,876 | 5 |
1,423 | 5 |
4,146 | 2,545 | 6,782 | 30,675 | |||||||||||||||||||||||||||||||||||
| Less: | ||||||||||||||||||||||||||||||||||||||||||||
| BXP’s share of termination income | — | — | — | 141 | — | — | 141 | |||||||||||||||||||||||||||||||||||||
| BXP’s share of net operating income (loss) (excluding termination income) | 8,903 | 6,876 | 1,423 | 4,005 | 2,545 | 6,782 | 30,534 | |||||||||||||||||||||||||||||||||||||
| Less: | ||||||||||||||||||||||||||||||||||||||||||||
| BXP’s share of straight-line rent | 295 | (623) | 5 |
1,894 | 5 |
(86) | 230 | (50) | 1,660 | |||||||||||||||||||||||||||||||||||
| BXP’s share of fair value lease revenue | — | 305 | 5 |
362 | 5 |
— | 435 | — | 1,102 | |||||||||||||||||||||||||||||||||||
| BXP’s share of amortization and accretion related to sales type lease | 29 | — | — | — | — | — | 29 | |||||||||||||||||||||||||||||||||||||
| Add: | ||||||||||||||||||||||||||||||||||||||||||||
| BXP’s share of straight-line ground rent expense adjustment | — | — | 123 | — | — | — | 123 | |||||||||||||||||||||||||||||||||||||
| BXP’s share of lease transaction costs that qualify as rent inducements | — | — | — | — | — | — | — | |||||||||||||||||||||||||||||||||||||
| BXP’s share of net operating income (loss) - cash (excluding termination income) | $ | 8,579 | $ | 7,194 | 5 |
$ | (710) | 5 |
$ | 4,091 | $ | 1,880 | $ | 6,832 | $ | 27,866 | ||||||||||||||||||||||||||||
| Reconciliation of BXP’s share of Revenue | ||||||||||||||||||||||||||||||||||||||||||||
BXP’s share of rental revenue 3 |
$ | 13,985 | $ | 10,849 | 5 |
$ | 8,066 | 5 |
$ | 9,012 | $ | 3,739 | $ | 10,156 | $ | 55,807 | ||||||||||||||||||||||||||||
| Add: | ||||||||||||||||||||||||||||||||||||||||||||
| BXP’s share of development and management services revenue | — | — | 209 | — | — | — | 209 | |||||||||||||||||||||||||||||||||||||
| BXP’s share of revenue | $ | 13,985 | $ | 10,849 | 5 |
$ | 8,275 | 5 |
$ | 9,012 | $ | 3,739 | $ | 10,156 | $ | 56,016 | ||||||||||||||||||||||||||||
|
|
Q3 2025 | ||||
| Reconciliations (continued) | |||||
| Three Months Ended | ||||||||||||||
| 30-Jun-25 | 30-Jun-24 | |||||||||||||
| Net income attributable to BXP, Inc. | $ | 88,977 | $ | 79,615 | ||||||||||
| Net income attributable to noncontrolling interests | ||||||||||||||
| Noncontrolling interest - common units of the Operating Partnership | 10,064 | 9,509 | ||||||||||||
| Noncontrolling interest in property partnerships | 20,100 | 17,825 | ||||||||||||
| Net income | 119,141 | 106,949 | ||||||||||||
| Add: | ||||||||||||||
| Interest expense | 162,783 | 149,642 | ||||||||||||
| Loss from unconsolidated joint ventures | 3,324 | 5,799 | ||||||||||||
| Depreciation and amortization expense | 223,819 | 219,542 | ||||||||||||
| Transaction costs | 357 | 189 | ||||||||||||
| Payroll and related costs from management services contracts | 4,104 | 4,148 | ||||||||||||
| General and administrative expense | 42,516 | 44,109 | ||||||||||||
| Less: | ||||||||||||||
| Interest and other income (loss) | 8,063 | 10,788 | ||||||||||||
| Unrealized gain (loss) on non-real estate investments | (39) | 58 | ||||||||||||
| Gains from investments in securities | 2,600 | 315 | ||||||||||||
| Gain on sale of real estate | 18,390 | — | ||||||||||||
| Direct reimbursements of payroll and related costs from management services contracts | 4,104 | 4,148 | ||||||||||||
| Development and management services revenue | 8,846 | 6,352 | ||||||||||||
| Net Operating Income (NOI) | 514,080 | 508,717 | ||||||||||||
| Add: | ||||||||||||||
| BXP’s share of NOI from unconsolidated joint ventures | 31,029 | 31,587 | ||||||||||||
| Less: | ||||||||||||||
| Partners’ share of NOI from consolidated joint ventures (after income allocation to private REIT shareholders) | 51,562 | 47,391 | ||||||||||||
| BXP’s Share of NOI | 493,547 | 492,913 | ||||||||||||
| Less: | ||||||||||||||
| Termination income | 909 | 841 | ||||||||||||
| BXP’s share of termination income from unconsolidated joint ventures | (146) | — | ||||||||||||
| Add: | ||||||||||||||
| Partners’ share of termination income from consolidated joint ventures | — | 40 | ||||||||||||
| BXP’s Share of NOI (excluding termination income) | $ | 492,784 | $ | 492,112 | ||||||||||
| Net Operating Income (NOI) | $ | 514,080 | $ | 508,717 | ||||||||||
| Less: | ||||||||||||||
| Termination income | 909 | 841 | ||||||||||||
| NOI from non Same Properties (excluding termination income) | 13,196 | 7,201 | ||||||||||||
| Same Property NOI (excluding termination income) | 499,975 | 500,675 | ||||||||||||
| Less: | ||||||||||||||
| Partners’ share of NOI from consolidated joint ventures (excluding termination income and after income allocation to private REIT shareholders) | 51,562 | 47,351 | ||||||||||||
| Add: | ||||||||||||||
| Partners’ share of NOI from non Same Properties from consolidated joint ventures (excluding termination income and after income allocation to private REIT shareholders) | 4,469 | — | ||||||||||||
| BXP’s share of NOI from unconsolidated joint ventures (excluding termination income) | 31,175 | 31,587 | ||||||||||||
| Less: | ||||||||||||||
| BXP’s share of NOI from non Same Properties from unconsolidated joint ventures (excluding termination income) | (132) | (212) | ||||||||||||
| BXP’s Share of Same Property NOI (excluding termination income) | $ | 484,189 | $ | 485,123 | ||||||||||
| Change in BXP’s Share of Same Property NOI (excluding termination income) | $ | (934) | ||||||||||||
| Change in BXP’s Share of Same Property NOI (excluding termination income) | (0.2) | % | ||||||||||||
|
|
Q3 2025 | ||||
| Reconciliations (continued) | |||||
| Three Months Ended | ||||||||||||||
| 30-Jun-25 | 30-Jun-24 | |||||||||||||
| Net income attributable to BXP, Inc. | $ | 88,977 | $ | 79,615 | ||||||||||
| Net income attributable to noncontrolling interests | ||||||||||||||
| Noncontrolling interest - common units of the Operating Partnership | 10,064 | 9,509 | ||||||||||||
| Noncontrolling interest in property partnerships | 20,100 | 17,825 | ||||||||||||
| Net income | 119,141 | 106,949 | ||||||||||||
| Add: | ||||||||||||||
| Interest expense | 162,783 | 149,642 | ||||||||||||
| Loss from unconsolidated joint ventures | 3,324 | 5,799 | ||||||||||||
| Depreciation and amortization expense | 223,819 | 219,542 | ||||||||||||
| Transaction costs | 357 | 189 | ||||||||||||
| Payroll and related costs from management services contracts | 4,104 | 4,148 | ||||||||||||
| General and administrative expense | 42,516 | 44,109 | ||||||||||||
| Less: | ||||||||||||||
| Interest and other income (loss) | 8,063 | 10,788 | ||||||||||||
| Unrealized gain (loss) on non-real estate investments | (39) | 58 | ||||||||||||
| Gains from investments in securities | 2,600 | 315 | ||||||||||||
| Gain on sale of real estate | 18,390 | — | ||||||||||||
| Direct reimbursements of payroll and related costs from management services contracts | 4,104 | 4,148 | ||||||||||||
| Development and management services revenue | 8,846 | 6,352 | ||||||||||||
| Net Operating Income (NOI) | 514,080 | 508,717 | ||||||||||||
| Less: | ||||||||||||||
| Straight-line rent | 24,533 | 16,094 | ||||||||||||
| Fair value lease revenue | 1,915 | 1,363 | ||||||||||||
| Amortization and accretion related to sales type lease | 232 | 246 | ||||||||||||
| Termination income | 909 | 841 | ||||||||||||
| Add: | ||||||||||||||
Straight-line ground rent expense adjustment 1 |
531 | 585 | ||||||||||||
Lease transaction costs that qualify as rent inducements 2 |
4,427 | 3,471 | ||||||||||||
| NOI - cash (excluding termination income) | 491,449 | 494,229 | ||||||||||||
| Less: | ||||||||||||||
| NOI - cash from non Same Properties (excluding termination income) | 10,276 | 17,006 | ||||||||||||
| Same Property NOI - cash (excluding termination income) | 481,173 | 477,223 | ||||||||||||
| Less: | ||||||||||||||
| Partners’ share of NOI - cash from consolidated joint ventures (excluding termination income and after income allocation to private REIT shareholders) | 46,250 | 45,068 | ||||||||||||
| Add: | ||||||||||||||
| Partners’ share of NOI - cash from non Same Properties from consolidated joint ventures (excluding termination income and after income allocation to private REIT shareholders) | 3,321 | — | ||||||||||||
| BXP’s share of NOI - cash from unconsolidated joint ventures (excluding termination income) | 27,909 | 27,473 | ||||||||||||
| Less: | ||||||||||||||
| BXP’s share of NOI - cash from non Same Properties from unconsolidated joint ventures (excluding termination income) | (1,774) | (300) | ||||||||||||
| BXP’s Share of Same Property NOI - cash (excluding termination income) | $ | 467,927 | $ | 459,928 | ||||||||||
| Change in BXP’s Share of Same Property NOI - cash (excluding termination income) | $ | 7,999 | ||||||||||||
| Change in BXP’s Share of Same Property NOI - cash (excluding termination income) | 1.7 | % | ||||||||||||
|
|
Q3 2025 | ||||
| Consolidated Income Statement - prior year | |||||
| Three Months Ended | ||||||||||||||
| 30-Sep-24 | 30-Jun-24 | |||||||||||||
| Revenue | ||||||||||||||
| Lease | $ | 799,471 | $ | 790,555 | ||||||||||
| Parking and other | 34,255 | 33,890 | ||||||||||||
| Insurance proceeds | — | 725 | ||||||||||||
| Hotel revenue | 15,082 | 14,812 | ||||||||||||
| Development and management services | 6,770 | 6,352 | ||||||||||||
| Direct reimbursements of payroll and related costs from management services contracts | 3,649 | 4,148 | ||||||||||||
| Total revenue | 859,227 | 850,482 | ||||||||||||
| Expenses | ||||||||||||||
| Operating | 178,834 | 175,545 | ||||||||||||
| Real estate taxes | 148,809 | 144,994 | ||||||||||||
| Restoration expenses related to insurance claims | 254 | 887 | ||||||||||||
| Hotel operating | 9,833 | 9,839 | ||||||||||||
| General and administrative | 33,352 | 44,109 | ||||||||||||
| Payroll and related costs from management services contracts | 3,649 | 4,148 | ||||||||||||
| Transaction costs | 188 | 189 | ||||||||||||
| Depreciation and amortization | 222,890 | 219,542 | ||||||||||||
| Total expenses | 597,809 | 599,253 | ||||||||||||
| Other income (expense) | ||||||||||||||
| Loss from unconsolidated joint ventures | (7,011) | (5,799) | ||||||||||||
| Gain on sale of real estate | 517 | — | ||||||||||||
| Gains from investments in securities | 2,198 | 315 | ||||||||||||
| Unrealized gain on non-real estate investments | 94 | 58 | ||||||||||||
| Interest and other income (loss) | 14,430 | 10,788 | ||||||||||||
| Interest expense | (163,194) | (149,642) | ||||||||||||
| Net income | 108,452 | 106,949 | ||||||||||||
| Net income attributable to noncontrolling interests | ||||||||||||||
| Noncontrolling interest in property partnerships | (15,237) | (17,825) | ||||||||||||
| Noncontrolling interest - common units of the Operating Partnership | (9,587) | (9,509) | ||||||||||||
| Net income attributable to BXP, Inc. | $ | 83,628 | $ | 79,615 | ||||||||||
| INCOME PER SHARE OF COMMON STOCK (EPS) | ||||||||||||||
| Net income attributable to BXP, Inc. per share - basic | $ | 0.53 | $ | 0.51 | ||||||||||
| Net income attributable to BXP, Inc. per share - diluted | $ | 0.53 | $ | 0.51 | ||||||||||

| Full Year 2025 | ||||||||||||||||||||
| Low | High | |||||||||||||||||||
| Projected EPS (diluted) | $ | 0.99 | $ | 1.02 | ||||||||||||||||
| Add: | ||||||||||||||||||||
| Projected Company share of real estate depreciation and amortization | 5.15 | 5.15 | ||||||||||||||||||
| Projected Company share of (gains)/losses on sales of real estate, gain on investment from unconsolidated joint venture and impairments | 0.75 | 0.75 | ||||||||||||||||||
| Projected FFO per share (diluted) | $ | 6.89 | $ | 6.92 | ||||||||||||||||
|
BXP, INC.
CONSOLIDATED BALANCE SHEETS
(Unaudited)
| |||||||||||
| September 30, 2025 | December 31, 2024 | ||||||||||
| (in thousands, except for share and par value amounts) | |||||||||||
| ASSETS | |||||||||||
| Real estate, at cost | $ | 26,718,660 | $ | 26,391,933 | |||||||
| Construction in progress | 1,322,608 | 764,640 | |||||||||
| Land held for future development | 568,516 | 714,050 | |||||||||
| Right of use assets - finance leases | 372,747 | 372,922 | |||||||||
| Right of use assets - operating leases | 321,063 | 334,767 | |||||||||
| Less: accumulated depreciation | (8,008,908) | (7,528,057) | |||||||||
| Total real estate | 21,294,686 | 21,050,255 | |||||||||
| Cash and cash equivalents | 861,066 | 1,254,882 | |||||||||
| Cash held in escrows | 77,663 | 80,314 | |||||||||
| Investments in securities | 43,604 | 39,706 | |||||||||
| Tenant and other receivables, net | 136,743 | 107,453 | |||||||||
| Note receivable, net | 8,898 | 4,947 | |||||||||
| Related party note receivables, net | 88,879 | 88,779 | |||||||||
| Sales-type lease receivable, net | 15,430 | 14,657 | |||||||||
| Accrued rental income, net | 1,532,403 | 1,466,220 | |||||||||
| Deferred charges, net | 802,785 | 813,345 | |||||||||
| Prepaid expenses and other assets | 137,561 | 70,839 | |||||||||
| Investments in unconsolidated joint ventures | 999,764 | 1,093,583 | |||||||||
| Total assets | $ | 25,999,482 | $ | 26,084,980 | |||||||
| LIABILITIES AND EQUITY | |||||||||||
| Liabilities: | |||||||||||
| Mortgage notes payable, net | $ | 4,279,482 | $ | 4,276,609 | |||||||
| Unsecured senior notes, net | 9,803,336 | 10,645,077 | |||||||||
| Unsecured exchangeable senior notes, net | 975,080 | — | |||||||||
| Unsecured line of credit | — | — | |||||||||
| Unsecured term loans, net | 796,798 | 798,813 | |||||||||
| Unsecured commercial paper | 750,000 | 500,000 | |||||||||
| Lease liabilities - finance leases | 363,207 | 370,885 | |||||||||
| Lease liabilities - operating leases | 379,792 | 392,686 | |||||||||
| Accounts payable and accrued expenses | 484,798 | 401,874 | |||||||||
| Dividends and distributions payable | 123,259 | 172,486 | |||||||||
| Accrued interest payable | 120,128 | 128,098 | |||||||||
| Other liabilities | 406,820 | 450,796 | |||||||||
| Total liabilities | 18,482,700 | 18,137,324 | |||||||||
| Commitments and contingencies | — | — | |||||||||
| Redeemable deferred stock units | 8,006 | 9,535 | |||||||||
| Equity: | |||||||||||
| Stockholders’ equity attributable to BXP, Inc.: | |||||||||||
Excess stock, $0.01 par value, 150,000,000 shares authorized, none issued or outstanding |
— | — | |||||||||
| Preferred stock, $0.01 par value, 50,000,000 shares authorized; none issued or outstanding | — | — | |||||||||
Common stock, $0.01 par value, 250,000,000 shares authorized, 158,479,314 and 158,253,895 issued and 158,400,414 and 158,174,995 outstanding at September 30, 2025 and December 31, 2024, respectively |
1,584 | 1,582 | |||||||||
| Additional paid-in capital | 6,827,889 | 6,836,093 | |||||||||
| Dividends in excess of earnings | (1,812,361) | (1,419,575) | |||||||||
Treasury common stock at cost, 78,900 shares at September 30, 2025 and December 31, 2024 |
(2,722) | (2,722) | |||||||||
| Accumulated other comprehensive loss | (14,831) | (2,072) | |||||||||
| Total stockholders’ equity attributable to BXP, Inc. | 4,999,559 | 5,413,306 | |||||||||
| Noncontrolling interests: | |||||||||||
| Common units of the Operating Partnership | 554,440 | 591,270 | |||||||||
| Property partnerships | 1,954,777 | 1,933,545 | |||||||||
| Total equity | 7,508,776 | 7,938,121 | |||||||||
| Total liabilities and equity | $ | 25,999,482 | $ | 26,084,980 | |||||||
| Three months ended September 30, | Nine months ended September 30, | |||||||||||||||||||||||||
| 2025 | 2024 | 2025 | 2024 | |||||||||||||||||||||||
| (in thousands, except for per share amounts) | ||||||||||||||||||||||||||
| Revenue | ||||||||||||||||||||||||||
| Lease | $ | 809,820 | $ | 799,471 | $ | 2,426,857 | $ | 2,378,616 | ||||||||||||||||||
| Parking and other | 35,390 | 34,255 | 100,431 | 101,086 | ||||||||||||||||||||||
| Hotel | 13,162 | 15,082 | 37,532 | 38,080 | ||||||||||||||||||||||
| Development and management services | 9,317 | 6,770 | 27,938 | 19,276 | ||||||||||||||||||||||
Direct reimbursements of payroll and related costs from management services contracts |
3,821 | 3,649 | 12,424 | 12,090 | ||||||||||||||||||||||
| Total revenue | 871,510 | 859,227 | 2,605,182 | 2,549,148 | ||||||||||||||||||||||
| Expenses | ||||||||||||||||||||||||||
| Operating | ||||||||||||||||||||||||||
| Rental | 331,736 | 327,897 | 995,376 | 963,480 | ||||||||||||||||||||||
| Hotel | 9,628 | 9,833 | 26,558 | 25,687 | ||||||||||||||||||||||
| General and administrative | 36,188 | 33,352 | 130,988 | 127,479 | ||||||||||||||||||||||
| Payroll and related costs from management services contracts | 3,821 | 3,649 | 12,424 | 12,090 | ||||||||||||||||||||||
| Transaction costs | 1,431 | 188 | 2,556 | 890 | ||||||||||||||||||||||
| Depreciation and amortization | 236,147 | 222,890 | 680,073 | 661,148 | ||||||||||||||||||||||
| Total expenses | 618,951 | 597,809 | 1,847,975 | 1,790,774 | ||||||||||||||||||||||
| Other income (expense) | ||||||||||||||||||||||||||
| Income (loss) from unconsolidated joint ventures | (148,329) | (7,011) | (153,792) | 6,376 | ||||||||||||||||||||||
| Gains on sales of real estate | 1,932 | 517 | 20,322 | 517 | ||||||||||||||||||||||
| Loss on sales-type lease | — | — | (2,490) | — | ||||||||||||||||||||||
| Interest and other income (loss) | 7,620 | 14,430 | 23,433 | 39,747 | ||||||||||||||||||||||
| Gains from investments in securities | 2,400 | 2,198 | 4,635 | 4,785 | ||||||||||||||||||||||
| Unrealized gain (loss) on non-real estate investments | 178 | 94 | (344) | 548 | ||||||||||||||||||||||
| Impairment losses | (68,901) | — | (68,901) | (13,615) | ||||||||||||||||||||||
| Loss from early extinguishment of debt | — | — | (338) | — | ||||||||||||||||||||||
| Interest expense | (164,299) | (163,194) | (490,526) | (474,727) | ||||||||||||||||||||||
| Net income (loss) | (116,840) | 108,452 | 89,206 | 322,005 | ||||||||||||||||||||||
| Net (income) loss attributable to noncontrolling interests | ||||||||||||||||||||||||||
| Noncontrolling interests in property partnerships | (17,853) | (15,237) | (56,702) | (50,283) | ||||||||||||||||||||||
Noncontrolling interest—common units of the Operating Partnership |
12,981 | (9,587) | (4,054) | (28,596) | ||||||||||||||||||||||
| Net income (loss) attributable to BXP, Inc. | $ | (121,712) | $ | 83,628 | $ | 28,450 | $ | 243,126 | ||||||||||||||||||
| Basic earnings per common share attributable to BXP, Inc. | ||||||||||||||||||||||||||
| Net income (loss) | $ | (0.77) | $ | 0.53 | $ | 0.18 | $ | 1.55 | ||||||||||||||||||
| Weighted average number of common shares outstanding | 158,345 | 157,725 | 158,287 | 157,250 | ||||||||||||||||||||||
| Diluted earnings per common share attributable to BXP, Inc. | ||||||||||||||||||||||||||
| Net income (loss) | $ | (0.77) | $ | 0.53 | $ | 0.18 | $ | 1.54 | ||||||||||||||||||
Weighted average number of common and common equivalent shares outstanding |
158,345 | 158,213 | 158,787 | 157,547 | ||||||||||||||||||||||
| Three months ended September 30, | Nine months ended September 30, | ||||||||||||||||||||||
| 2025 | 2024 | 2025 | 2024 | ||||||||||||||||||||
| (in thousands, except for per share amounts) | |||||||||||||||||||||||
| Net income (loss) attributable to BXP, Inc. | $ | (121,712) | $ | 83,628 | $ | 28,450 | $ | 243,126 | |||||||||||||||
| Add: | |||||||||||||||||||||||
Noncontrolling interest - common units of the Operating Partnership |
(12,981) | 9,587 | 4,054 | 28,596 | |||||||||||||||||||
Noncontrolling interests in property partnerships |
17,853 | 15,237 | 56,702 | 50,283 | |||||||||||||||||||
| Net income (loss) | (116,840) | 108,452 | 89,206 | 322,005 | |||||||||||||||||||
| Add: | |||||||||||||||||||||||
Depreciation and amortization expense |
236,147 | 222,890 | 680,073 | 661,148 | |||||||||||||||||||
Noncontrolling interests in property partnerships’ share of depreciation and amortization |
(22,615) | (18,857) | (64,024) | (56,755) | |||||||||||||||||||
Company’s share of depreciation and amortization from unconsolidated joint ventures |
17,272 | 20,757 | 51,273 | 60,807 | |||||||||||||||||||
Corporate-related depreciation and amortization |
(582) | (438) | (1,898) | (1,263) | |||||||||||||||||||
| Non-real estate related amortization | 2,130 | 2,130 | 6,391 | 6,390 | |||||||||||||||||||
| Loss on sales-type lease | — | — | 2,490 | — | |||||||||||||||||||
| Impairment losses | 68,901 | — | 68,901 | 13,615 | |||||||||||||||||||
| Impairment losses included within Income (loss) from unconsolidated joint ventures | 145,133 | — | 145,133 | — | |||||||||||||||||||
| Less: | |||||||||||||||||||||||
| Gains on sales of real estate | 1,932 | 517 | 20,322 | 517 | |||||||||||||||||||
| Gain on sale / consolidation included within income (loss) from unconsolidated joint ventures | 2,236 | — | 2,236 | 21,696 | |||||||||||||||||||
| Unrealized gain (loss) on non-real estate investments | 178 | 94 | (344) | 548 | |||||||||||||||||||
| Noncontrolling interests in property partnerships | 17,853 | 15,237 | 56,702 | 50,283 | |||||||||||||||||||
| Funds from operations (FFO) attributable to the Operating Partnership (including BXP, Inc.) | 307,347 | 319,086 | 898,629 | 932,903 | |||||||||||||||||||
| Less: | |||||||||||||||||||||||
Noncontrolling interest - common units of the Operating Partnership’s share of funds from operations |
30,673 | 32,228 | 89,683 | 96,369 | |||||||||||||||||||
| Funds from operations attributable to BXP, Inc. | $ | 276,674 | $ | 286,858 | $ | 808,946 | $ | 836,534 | |||||||||||||||
| BXP, Inc.’s percentage share of funds from operations - basic | 90.02 | % | 89.90 | % | 90.02 | % | 89.67 | % | |||||||||||||||
| Weighted average shares outstanding - basic | 158,345 | 157,725 | 158,287 | 157,250 | |||||||||||||||||||
FFO per share basic |
$ | 1.75 | $ | 1.82 | $ | 5.11 | $ | 5.32 | |||||||||||||||
| Weighted average shares outstanding - diluted | 158,928 | 158,213 | 158,787 | 157,547 | |||||||||||||||||||
FFO per share diluted |
$ | 1.74 | $ | 1.81 | $ | 5.09 | $ | 5.31 | |||||||||||||||
| CBD Portfolio | % Occupied by Location (1) |
% Leased by Location (2) |
|||||||||||||||||||||
| September 30, 2025 | December 31, 2024 | September 30, 2025 | December 31, 2024 | ||||||||||||||||||||
| Boston | 97.3 | % | 95.9 | % | 98.6 | % | 97.5 | % | |||||||||||||||
| Los Angeles | 86.7 | % | 84.9 | % | 87.1 | % | 87.4 | % | |||||||||||||||
| New York | 84.9 | % | 90.8 | % | 90.7 | % | 93.6 | % | |||||||||||||||
| San Francisco | 80.7 | % | 84.3 | % | 82.9 | % | 85.2 | % | |||||||||||||||
| Seattle | 82.6 | % | 81.6 | % | 85.1 | % | 83.5 | % | |||||||||||||||
| Washington, DC | 91.9 | % | 91.9 | % | 93.8 | % | 93.6 | % | |||||||||||||||
| CBD Portfolio | 89.3 | % | 90.9 | % | 92.0 | % | 92.8 | % | |||||||||||||||
| Total Portfolio | % Occupied by Location (1) |
% Leased by Location (2) |
|||||||||||||||||||||
| September 30, 2025 | December 31, 2024 | September 30, 2025 | December 31, 2024 | ||||||||||||||||||||
| Boston | 89.7 | % | 89.7 | % | 91.6 | % | 91.5 | % | |||||||||||||||
| Los Angeles | 86.7 | % | 84.9 | % | 87.1 | % | 87.4 | % | |||||||||||||||
| New York | 82.8 | % | 87.1 | % | 88.3 | % | 90.0 | % | |||||||||||||||
| San Francisco | 77.8 | % | 80.8 | % | 79.7 | % | 81.7 | % | |||||||||||||||
| Seattle | 82.6 | % | 81.6 | % | 85.1 | % | 83.5 | % | |||||||||||||||
| Washington, DC | 91.3 | % | 91.4 | % | 93.4 | % | 93.0 | % | |||||||||||||||
| Total Portfolio | 86.0 | % | 87.5 | % | 88.8 | % | 89.4 | % | |||||||||||||||