| Maryland | 001-12675 | 95-4598246 | |||||||||
| (State or other jurisdiction of incorporation or organization) |
(Commission File No.) | (I.R.S. Employer Identification No.) |
|||||||||
| (Registrant's telephone number, including area code) | ||||||||
| N/A | ||||||||
| (Former name, former address and former fiscal year, if changed since last report) | ||||||||
| Securities registered pursuant to Section 12(b) of the Act: | |||||||||||
| Registrant | Title of each class | Name of each exchange on which registered | Ticker Symbol | ||||||||
| Kilroy Realty Corporation | Common Stock, $.01 par value | New York Stock Exchange | KRC | ||||||||
| ☐ | Written communications pursuant to Rule 425 under the Securities Act (17 CFR 230.425) | ||||
| ☐ | Soliciting material pursuant to Rule 14a-12 under the Exchange Act (17 CFR 240.14a-12) | ||||
| ☐ | Pre-commencement communications pursuant to Rule 14d-2(b) under the Exchange Act (17 CFR 240.14d-2(b)) | ||||
| ☐ | Pre-commencement communications pursuant to Rule 13e-4(c) under the Exchange Act (17 CFR 240.13e-4(c)) | ||||
| (a) | Financial statements of businesses acquired: None. |
|||||||
| (b) | Pro forma financial information: None. | |||||||
| (c) | Shell company transactions: None. | |||||||
| (d) | Exhibits: | |||||||
| Exhibit No. | Description | |||||||
| 99.1* | ||||||||
| 99.2* | ||||||||
| 104 | Cover Page Interactive Data File (embedded within the Inline XBRL document) | |||||||
| Kilroy Realty Corporation | ||||||||||||||||||||
Date: May 2, 2024 |
||||||||||||||||||||
| By: | /s/ Merryl E. Werber | |||||||||||||||||||
| Merryl E. Werber Senior Vice President, Chief Accounting Officer and Controller |
||||||||||||||||||||
Q1 2024 Supplemental Financial Report |
|||||

Q1 2024 Supplemental Financial Report |
|||||
| Full Year 2024 Range as of February 2024 |
Full Year 2024 Range as of May 2024 |
||||||||||||||||||||||||||||
| Low End | High End | Low End | High End | ||||||||||||||||||||||||||
| $ and shares/units in thousands, except per share/unit amounts | |||||||||||||||||||||||||||||
| Net income available to common stockholders per share - diluted | $ | 1.45 | $ | 1.61 | $ | 1.46 | $ | 1.61 | |||||||||||||||||||||
Weighted average common shares outstanding - diluted (1) |
118,000 | 118,000 | 118,000 | 118,000 | |||||||||||||||||||||||||
| Net income available to common stockholders | $ | 171,000 | $ | 190,000 | $ | 172,500 | $ | 190,000 | |||||||||||||||||||||
| Adjustments: | |||||||||||||||||||||||||||||
| Net income attributable to noncontrolling common units of the Operating Partnership | 1,900 | 2,000 | 1,900 | 2,000 | |||||||||||||||||||||||||
| Net income attributable to noncontrolling interests in consolidated property partnerships | 20,500 | 21,000 | 20,500 | 21,000 | |||||||||||||||||||||||||
| Depreciation and amortization of real estate assets | 330,000 | 330,000 | 335,000 | 336,000 | |||||||||||||||||||||||||
| Gains on sales of depreciable real estate | — | — | — | — | |||||||||||||||||||||||||
| Funds From Operations attributable to noncontrolling interests in consolidated property partnerships | (30,000) | (32,000) | (31,000) | (32,000) | |||||||||||||||||||||||||
Funds From Operations (2) |
$ | 493,400 | $ | 511,000 | $ | 498,900 | $ | 517,000 | |||||||||||||||||||||
Weighted average common shares/units outstanding – diluted (3) |
120,250 | 120,250 | 120,250 | 120,250 | |||||||||||||||||||||||||
Funds From Operations per common share/unit – diluted (3) |
$ | 4.10 | $ | 4.25 | $ | 4.15 | $ | 4.30 | |||||||||||||||||||||
| Key Assumptions | February 2024 Assumptions | May 2024 Assumptions | ||||||||||||||||||
Change in same store cash NOI (2) |
(4.0%) to (6.0%) | (3.5%) to (5.5%) | ||||||||||||||||||
| Average full year occupancy | 82.5% to 84.0% | 82.5% to 84.0% | ||||||||||||||||||
| General and administrative expenses | $72 million to $80 million | $72 million to $80 million | ||||||||||||||||||
Total development spending (4) |
$200 million to $300 million | $200 million to $300 million | ||||||||||||||||||
Weighted average common shares/units outstanding – diluted (in thousands) (3) |
120,250 | 120,250 | ||||||||||||||||||
Q1 2024 Supplemental Financial Report |
|||||
Q1 2024 Supplemental Financial Report |
|||||
| Page | |||||
Q1 2024 Supplemental Financial Report |
|||||
| Board of Directors | Executive and Senior Management Team | Investor Relations | ||||||||||||||||||
| John Kilroy | Chair | Angela M. Aman | Chief Executive Officer | 12200 W. Olympic Blvd., Suite 200 Los Angeles, CA 90064 (310) 481-8400 Web: www.kilroyrealty.com E-mail: investorrelations@kilroyrealty.com |
||||||||||||||||
| Edward F. Brennan, PhD | Lead Independent | Justin W. Smart | President | |||||||||||||||||
| Angela M. Aman | Eliott Trencher | EVP, Chief Financial Officer and Chief Investment Officer | ||||||||||||||||||
| Jolie Hunt | ||||||||||||||||||||
| Scott S. Ingraham | Robert Paratte | EVP, Chief Leasing Officer | ||||||||||||||||||
| Louisa G. Ritter | Heidi R. Roth | EVP, Chief Administrative Officer | Bill Hutcheson |
|||||||||||||||||
| Gary R. Stevenson | John Osmond | EVP, Head of Asset Management | SVP, Investor Relations & Capital Markets | |||||||||||||||||
| Peter B. Stoneberg | Merryl Werber | SVP, Chief Accounting Officer and Controller | ||||||||||||||||||
| Equity Research Coverage | ||||||||||||||
| Barclays | Jefferies LLC | |||||||||||||
| Brendan Lynch | (212) 526-9428 | Peter Abramowitz | (212) 336-7241 | |||||||||||
| BofA Securities | J.P. Morgan | |||||||||||||
| Camille Bonnel | (646) 855-5042 | Anthony Paolone | (212) 622-6682 | |||||||||||
| BMO Capital Markets Corp. | Keybanc Capital Markets | |||||||||||||
| John P. Kim | (212) 885-4115 | Upal Rana | (917) 368-2316 | |||||||||||
| BTIG | Mizuho Securities USA LLC | |||||||||||||
| Thomas Catherwood | (212) 738-6140 | Vikram Malhotra | (212) 282-3827 | |||||||||||
| Citigroup Investment Research | RBC Capital Markets | |||||||||||||
| Michael Griffin | (212) 816-5871 | Mike Carroll | (440) 715-2649 | |||||||||||
| Deutsche Bank Securities, Inc. | Scotiabank | |||||||||||||
| Omotayo Okusanya | (212) 250-9284 | Nicholas Yulico | (212) 225-6904 | |||||||||||
| Evercore ISI | Wells Fargo | |||||||||||||
| Steve Sakwa | (212) 446-9462 | Blaine Heck | (443) 263-6529 | |||||||||||
| Goldman Sachs & Co. LLC | Wolfe Research | |||||||||||||
| Caitlin Burrows | (212) 902-4736 | Andrew Rosivach | (646) 582-9250 | |||||||||||
| Green Street Advisors | ||||||||||||||
| Dylan Burzinski | (949) 640-8780 | |||||||||||||
Q1 2024 Supplemental Financial Report |
|||||
| Three Months Ended | |||||||||||||||||||||||||||||||||||
| 3/31/2024 | 12/31/2023 | 9/30/2023 | 6/30/2023 | 3/31/2023 | |||||||||||||||||||||||||||||||
| INCOME ITEMS: | |||||||||||||||||||||||||||||||||||
| Revenues | $ | 278,581 | $ | 269,016 | $ | 283,594 | $ | 284,282 | $ | 292,802 | |||||||||||||||||||||||||
| Capitalized Interest and Debt Costs | 19,807 | 21,510 | 20,056 | 19,470 | 17,731 | ||||||||||||||||||||||||||||||
Cash Lease Termination Fees (1) |
3,851 | 3,437 | 1,682 | 225 | — | ||||||||||||||||||||||||||||||
| EARNINGS METRICS: | |||||||||||||||||||||||||||||||||||
| Net Income Available to Common Stockholders | $ | 49,920 | $ | 47,284 | $ | 52,762 | $ | 55,587 | $ | 56,608 | |||||||||||||||||||||||||
Net Operating Income (2) |
189,270 | 184,725 | 193,396 | 198,584 | 208,425 | ||||||||||||||||||||||||||||||
EBITDA, as adjusted (3) |
182,602 | 171,387 | 173,798 | 178,020 | 184,577 | ||||||||||||||||||||||||||||||
Company's Share of EBITDA, as adjusted (3) |
173,942 | 163,059 | 165,408 | 169,858 | 173,018 | ||||||||||||||||||||||||||||||
Company's Share of EBITDA, as adjusted less interest income (3) |
160,752 | 152,363 | 158,393 | 166,437 | 171,558 | ||||||||||||||||||||||||||||||
Funds From Operations (4) |
133,723 | 129,257 | 134,047 | 141,853 | 145,959 | ||||||||||||||||||||||||||||||
Funds Available for Distribution (4) |
125,328 | 109,528 | 118,698 | 119,546 | 132,533 | ||||||||||||||||||||||||||||||
PER SHARE INFORMATION (5): |
|||||||||||||||||||||||||||||||||||
| Net Income Available to Common Stockholders per common share – diluted | $ | 0.42 | $ | 0.40 | $ | 0.45 | $ | 0.47 | $ | 0.48 | |||||||||||||||||||||||||
Funds From Operations per common share – diluted (4) |
1.11 | 1.08 | 1.12 | 1.19 | 1.22 | ||||||||||||||||||||||||||||||
| Dividends declared per common share | 0.54 | 0.54 | 0.54 | 0.54 | 0.54 | ||||||||||||||||||||||||||||||
RATIOS (6): |
|||||||||||||||||||||||||||||||||||
Net Operating Income Margin (2) |
67.9 | % | 68.7 | % | 68.2 | % | 69.9 | % | 71.2 | % | |||||||||||||||||||||||||
Net Debt to Company's Share of EBITDA, as adjusted Ratio (3)(7) |
6.3x | 6.2x | 6.1x | 6.1x | 6.0x | ||||||||||||||||||||||||||||||
Net Debt to Company's Share of EBITDA, as adjusted less interest income Ratio (3)(7) |
6.6x | 6.5x | 6.2x | 6.2x | 6.1x | ||||||||||||||||||||||||||||||
| Fixed Charge Coverage Ratio - Net Income | 1.0x | 1.0x | 1.2x | 1.4x | 1.6x | ||||||||||||||||||||||||||||||
Fixed Charge Coverage Ratio - EBITDA, as adjusted (3) |
3.3x | 3.4x | 3.7x | 4.1x | 4.6x | ||||||||||||||||||||||||||||||
| Net Income Payout Ratio | 114.9 | % | 120.5 | % | 108.8 | % | 104.3 | % | 97.9 | % | |||||||||||||||||||||||||
FFO / FAD Payout Ratio (4) |
47.9 % / 51.1% | 49.5% / 58.4% | 47.7% / 53.9% | 45.0% / 53.4% | 43.8% / 48.2% | ||||||||||||||||||||||||||||||
| STABILIZED PORTFOLIO INFORMATION: | |||||||||||||||||||||||||||||||||||
Change in Same Store Net Operating Income (8) |
(9.4) | % | (10.6) | % | (5.0) | % | (2.3) | % | 3.6 | % | |||||||||||||||||||||||||
Change in Same Store Cash Net Operating Income (8) |
(7.2) | % | (1.2) | % | 0.2 | % | 2.7 | % | 16.3 | % | |||||||||||||||||||||||||
| Period End Occupancy Percentage | 84.2 | % | 85.0 | % | 86.2 | % | 86.6 | % | 89.6 | % | |||||||||||||||||||||||||
| Period End Leased Percentage | 85.7 | % | 86.4 | % | 87.5 | % | 88.6 | % | 91.6 | % | |||||||||||||||||||||||||
Lease Composition (Net / Gross) (9) |
51% / 49% | 51% / 49% | 49% / 51% | 49% / 51% | 48% / 52% | ||||||||||||||||||||||||||||||
Q1 2024 Supplemental Financial Report |
|||||
| 3/31/2024 | 12/31/2023 | 9/30/2023 | 6/30/2023 | 3/31/2023 | |||||||||||||||||||||||||||||||
| ASSETS: | |||||||||||||||||||||||||||||||||||
| Land and improvements | $ | 1,743,170 | $ | 1,743,170 | $ | 1,743,170 | $ | 1,738,242 | $ | 1,738,242 | |||||||||||||||||||||||||
| Buildings and improvements | 8,479,359 | 8,463,674 | 8,431,499 | 8,353,596 | 8,335,285 | ||||||||||||||||||||||||||||||
| Undeveloped land and construction in progress | 2,114,242 | 2,034,804 | 1,950,424 | 1,894,545 | 1,788,542 | ||||||||||||||||||||||||||||||
| Total real estate assets held for investment | 12,336,771 | 12,241,648 | 12,125,093 | 11,986,383 | 11,862,069 | ||||||||||||||||||||||||||||||
| Accumulated depreciation and amortization | (2,594,996) | (2,518,304) | (2,443,659) | (2,369,515) | (2,294,202) | ||||||||||||||||||||||||||||||
| Total real estate assets held for investment, net | 9,741,775 | 9,723,344 | 9,681,434 | 9,616,868 | 9,567,867 | ||||||||||||||||||||||||||||||
| Cash and cash equivalents | 855,007 | 510,163 | 618,794 | 361,885 | 476,358 | ||||||||||||||||||||||||||||||
| Marketable securities | 109,513 | 284,670 | 278,789 | 25,786 | 23,288 | ||||||||||||||||||||||||||||||
| Current receivables, net | 13,291 | 13,609 | 11,383 | 10,686 | 15,926 | ||||||||||||||||||||||||||||||
| Deferred rent receivables, net | 457,494 | 460,979 | 466,073 | 463,640 | 457,870 | ||||||||||||||||||||||||||||||
| Deferred leasing costs and acquisition-related intangible assets, net | 226,506 | 229,705 | 228,742 | 230,559 | 238,184 | ||||||||||||||||||||||||||||||
| Right of use ground lease assets | 130,026 | 125,506 | 125,765 | 126,022 | 126,277 | ||||||||||||||||||||||||||||||
| Prepaid expenses and other assets, net | 65,588 | 53,069 | 60,141 | 75,588 | 63,622 | ||||||||||||||||||||||||||||||
| TOTAL ASSETS | $ | 11,599,200 | $ | 11,401,045 | $ | 11,471,121 | $ | 10,911,034 | $ | 10,969,392 | |||||||||||||||||||||||||
| LIABILITIES AND EQUITY: | |||||||||||||||||||||||||||||||||||
| Liabilities: | |||||||||||||||||||||||||||||||||||
| Secured debt, net | $ | 601,990 | $ | 603,225 | $ | 604,480 | $ | 240,142 | $ | 241,547 | |||||||||||||||||||||||||
| Unsecured debt, net | 4,518,297 | 4,325,153 | 4,330,326 | 4,172,833 | 4,171,029 | ||||||||||||||||||||||||||||||
| Accounts payable, accrued expenses and other liabilities | 401,892 | 371,179 | 426,662 | 377,733 | 418,902 | ||||||||||||||||||||||||||||||
| Ground lease liabilities | 128,966 | 124,353 | 124,517 | 124,678 | 124,837 | ||||||||||||||||||||||||||||||
| Accrued dividends and distributions | 65,111 | 64,440 | 64,423 | 64,438 | 64,461 | ||||||||||||||||||||||||||||||
| Deferred revenue and acquisition-related intangible liabilities, net | 166,436 | 173,638 | 178,542 | 185,429 | 195,629 | ||||||||||||||||||||||||||||||
| Rents received in advance and tenant security deposits | 73,777 | 79,364 | 74,646 | 78,187 | 80,565 | ||||||||||||||||||||||||||||||
| Total liabilities | 5,956,469 | 5,741,352 | 5,803,596 | 5,243,440 | 5,296,970 | ||||||||||||||||||||||||||||||
| Equity: | |||||||||||||||||||||||||||||||||||
| Stockholders’ Equity | |||||||||||||||||||||||||||||||||||
| Common stock | 1,174 | 1,173 | 1,173 | 1,172 | 1,171 | ||||||||||||||||||||||||||||||
| Additional paid-in capital | 5,208,753 | 5,205,839 | 5,195,106 | 5,184,227 | 5,175,402 | ||||||||||||||||||||||||||||||
| Retained earnings | 203,080 | 221,149 | 237,665 | 248,695 | 257,079 | ||||||||||||||||||||||||||||||
| Total stockholders’ equity | 5,413,007 | 5,428,161 | 5,433,944 | 5,434,094 | 5,433,652 | ||||||||||||||||||||||||||||||
| Noncontrolling Interests | |||||||||||||||||||||||||||||||||||
| Common units of the Operating Partnership | 53,087 | 53,275 | 53,328 | 53,358 | 53,386 | ||||||||||||||||||||||||||||||
| Noncontrolling interests in consolidated property partnerships | 176,637 | 178,257 | 180,253 | 180,142 | 185,384 | ||||||||||||||||||||||||||||||
| Total noncontrolling interests | 229,724 | 231,532 | 233,581 | 233,500 | 238,770 | ||||||||||||||||||||||||||||||
| Total equity | 5,642,731 | 5,659,693 | 5,667,525 | 5,667,594 | 5,672,422 | ||||||||||||||||||||||||||||||
| TOTAL LIABILITIES AND EQUITY | $ | 11,599,200 | $ | 11,401,045 | $ | 11,471,121 | $ | 10,911,034 | $ | 10,969,392 | |||||||||||||||||||||||||
Q1 2024 Supplemental Financial Report |
|||||
| Three Months Ended | ||||||||||||||||||||||||||||||||||||||
| 3/31/2024 | 12/31/2023 | 9/30/2023 | 6/30/2023 | 3/31/2023 | ||||||||||||||||||||||||||||||||||
| REVENUES | ||||||||||||||||||||||||||||||||||||||
| Rental income | $ | 274,890 | $ | 265,643 | $ | 280,681 | $ | 281,309 | $ | 290,104 | ||||||||||||||||||||||||||||
| Other property income | 3,691 | 3,373 | 2,913 | 2,973 | 2,698 | |||||||||||||||||||||||||||||||||
| Total revenues | 278,581 | 269,016 | 283,594 | 284,282 | 292,802 | |||||||||||||||||||||||||||||||||
| EXPENSES | ||||||||||||||||||||||||||||||||||||||
| Property expenses | 57,320 | 60,731 | 59,445 | 55,008 | 53,780 | |||||||||||||||||||||||||||||||||
| Real estate taxes | 29,239 | 21,000 | 28,363 | 28,277 | 28,228 | |||||||||||||||||||||||||||||||||
| Ground leases | 2,752 | 2,560 | 2,390 | 2,413 | 2,369 | |||||||||||||||||||||||||||||||||
General and administrative expenses (1) |
17,579 | 22,078 | 24,761 | 22,659 | 23,936 | |||||||||||||||||||||||||||||||||
| Leasing costs | 2,279 | 1,956 | 1,852 | 1,326 | 1,372 | |||||||||||||||||||||||||||||||||
| Depreciation and amortization | 88,031 | 86,016 | 85,224 | 90,362 | 93,676 | |||||||||||||||||||||||||||||||||
| Total expenses | 197,200 | 194,341 | 202,035 | 200,045 | 203,361 | |||||||||||||||||||||||||||||||||
| OTHER INCOME (EXPENSES) | ||||||||||||||||||||||||||||||||||||||
| Interest income | 13,190 | 10,696 | 7,015 | 3,421 | 1,460 | |||||||||||||||||||||||||||||||||
| Interest expense | (38,871) | (32,325) | (29,837) | (26,383) | (25,671) | |||||||||||||||||||||||||||||||||
| Total other expenses | (25,681) | (21,629) | (22,822) | (22,962) | (24,211) | |||||||||||||||||||||||||||||||||
| NET INCOME | 55,700 | 53,046 | 58,737 | 61,275 | 65,230 | |||||||||||||||||||||||||||||||||
| Net income attributable to noncontrolling common units of the Operating Partnership | (502) | (471) | (515) | (537) | (560) | |||||||||||||||||||||||||||||||||
| Net income attributable to noncontrolling interests in consolidated property partnerships | (5,278) | (5,291) | (5,460) | (5,151) | (8,062) | |||||||||||||||||||||||||||||||||
| Total income attributable to noncontrolling interests | (5,780) | (5,762) | (5,975) | (5,688) | (8,622) | |||||||||||||||||||||||||||||||||
| NET INCOME AVAILABLE TO COMMON STOCKHOLDERS | $ | 49,920 | $ | 47,284 | $ | 52,762 | $ | 55,587 | $ | 56,608 | ||||||||||||||||||||||||||||
| Weighted average common shares outstanding – basic | 117,338 | 117,240 | 117,185 | 117,155 | 117,059 | |||||||||||||||||||||||||||||||||
| Weighted average common shares outstanding – diluted | 117,961 | 117,816 | 117,495 | 117,360 | 117,407 | |||||||||||||||||||||||||||||||||
| NET INCOME AVAILABLE TO COMMON STOCKHOLDERS PER SHARE | ||||||||||||||||||||||||||||||||||||||
| Net income available to common stockholders per share – basic | $ | 0.42 | $ | 0.40 | $ | 0.45 | $ | 0.47 | $ | 0.48 | ||||||||||||||||||||||||||||
| Net income available to common stockholders per share – diluted | $ | 0.42 | $ | 0.40 | $ | 0.45 | $ | 0.47 | $ | 0.48 | ||||||||||||||||||||||||||||
Q1 2024 Supplemental Financial Report |
|||||
| Three Months Ended | ||||||||||||||||||||||||||||||||||||||
| 3/31/2024 | 12/31/2023 | 9/30/2023 | 6/30/2023 | 3/31/2023 | ||||||||||||||||||||||||||||||||||
FUNDS FROM OPERATIONS (1): |
||||||||||||||||||||||||||||||||||||||
| Net income available to common stockholders | $ | 49,920 | $ | 47,284 | $ | 52,762 | $ | 55,587 | $ | 56,608 | ||||||||||||||||||||||||||||
| Adjustments: | ||||||||||||||||||||||||||||||||||||||
| Net income attributable to noncontrolling common units of the Operating Partnership | 502 | 471 | 515 | 537 | 560 | |||||||||||||||||||||||||||||||||
| Net income attributable to noncontrolling interests in consolidated property partnerships | 5,278 | 5,291 | 5,460 | 5,151 | 8,062 | |||||||||||||||||||||||||||||||||
| Depreciation and amortization of real estate assets | 86,460 | 84,402 | 83,518 | 88,473 | 91,671 | |||||||||||||||||||||||||||||||||
| Funds From Operations attributable to noncontrolling interests in consolidated property partnerships | (8,437) | (8,191) | (8,208) | (7,895) | (10,942) | |||||||||||||||||||||||||||||||||
Funds From Operations (1) |
$ | 133,723 | $ | 129,257 | $ | 134,047 | $ | 141,853 | $ | 145,959 | ||||||||||||||||||||||||||||
Weighted average common shares/units outstanding – basic (2) |
119,660 | 118,896 | 118,934 | 118,930 | 118,818 | |||||||||||||||||||||||||||||||||
Weighted average common shares/units outstanding – diluted (3) |
120,283 | 119,473 | 119,245 | 119,134 | 119,165 | |||||||||||||||||||||||||||||||||
FFO per common share/unit – basic (1) |
$ | 1.12 | $ | 1.09 | $ | 1.13 | $ | 1.19 | $ | 1.23 | ||||||||||||||||||||||||||||
FFO per common share/unit – diluted (1) |
$ | 1.11 | $ | 1.08 | $ | 1.12 | $ | 1.19 | $ | 1.22 | ||||||||||||||||||||||||||||
FUNDS AVAILABLE FOR DISTRIBUTION (1): |
||||||||||||||||||||||||||||||||||||||
Funds From Operations (1) |
$ | 133,723 | $ | 129,257 | $ | 134,047 | $ | 141,853 | $ | 145,959 | ||||||||||||||||||||||||||||
| Adjustments: | ||||||||||||||||||||||||||||||||||||||
| Recurring tenant improvements, leasing commissions and capital expenditures | (11,763) | (31,411) | (20,519) | (17,850) | (17,766) | |||||||||||||||||||||||||||||||||
Amortization of deferred revenue related to tenant-funded tenant improvements (4) |
(6,502) | (5,717) | (4,883) | (4,912) | (5,185) | |||||||||||||||||||||||||||||||||
| Net effect of straight-line rents | 3,536 | 5,143 | (2,382) | (5,720) | (5,619) | |||||||||||||||||||||||||||||||||
Amortization of net below market rents (5) |
(904) | (973) | (1,034) | (1,608) | (3,033) | |||||||||||||||||||||||||||||||||
| Amortization of deferred financing costs and net debt discount/premium | 1,757 | 1,279 | 1,312 | 1,254 | 1,355 | |||||||||||||||||||||||||||||||||
| Non-cash amortization of share-based compensation awards | 3,381 | 8,498 | 10,596 | 7,721 | 10,043 | |||||||||||||||||||||||||||||||||
Lease related adjustments, leasing costs and other (6) |
1,216 | 1,966 | (401) | (2,106) | 5,462 | |||||||||||||||||||||||||||||||||
| Adjustments attributable to noncontrolling interests in consolidated property partnerships | 884 | 1,486 | 1,962 | 914 | 1,317 | |||||||||||||||||||||||||||||||||
Funds Available for Distribution (1) |
$ | 125,328 | $ | 109,528 | $ | 118,698 | $ | 119,546 | $ | 132,533 | ||||||||||||||||||||||||||||
Q1 2024 Supplemental Financial Report |
|||||
| Three Months Ended March 31, | ||||||||||||||||||||||||||
| 2024 | 2023 | % Change | ||||||||||||||||||||||||
| Operating Revenues: | ||||||||||||||||||||||||||
Rental income (1) |
$ | 226,586 | $ | 243,507 | (6.9) | % | ||||||||||||||||||||
Tenant reimbursements (1) |
48,304 | 46,597 | 3.7 | % | ||||||||||||||||||||||
| Other property income | 3,691 | 2,698 | 36.8 | % | ||||||||||||||||||||||
| Total operating revenues | 278,581 | 292,802 | (4.9) | % | ||||||||||||||||||||||
| Operating Expenses: | ||||||||||||||||||||||||||
| Property expenses | 57,320 | 53,780 | 6.6 | % | ||||||||||||||||||||||
| Real estate taxes | 29,239 | 28,228 | 3.6 | % | ||||||||||||||||||||||
| Ground leases | 2,752 | 2,369 | 16.2 | % | ||||||||||||||||||||||
| Total operating expenses | 89,311 | 84,377 | 5.8 | % | ||||||||||||||||||||||
Net Operating Income (2) |
$ | 189,270 | $ | 208,425 | (9.2) | % | ||||||||||||||||||||


Q1 2024 Supplemental Financial Report |
|||||
| Three Months Ended March 31, | ||||||||||||||||||||||||||||||||
| 2024 | 2023 | % Change | % Contribution | |||||||||||||||||||||||||||||
Total Same Store Portfolio (1) |
||||||||||||||||||||||||||||||||
| Number of properties | 119 | 119 | ||||||||||||||||||||||||||||||
| Square Feet | 16,213,906 | 16,213,906 | ||||||||||||||||||||||||||||||
| Average Occupancy | 85.2 | % | 89.9 | % | ||||||||||||||||||||||||||||
| Percent of Stabilized Portfolio | 95.1 | % | ||||||||||||||||||||||||||||||
| Operating Revenues: | ||||||||||||||||||||||||||||||||
Rental income (2) |
$ | 217,777 | $ | 236,471 | (7.9) | % | (9.3) | % | ||||||||||||||||||||||||
Tenant reimbursements (2) |
44,809 | 43,400 | 3.2 | % | 0.7 | % | ||||||||||||||||||||||||||
| Other property income | 3,133 | 2,426 | 29.1 | % | 0.4 | % | ||||||||||||||||||||||||||
| Total operating revenues | 265,719 | 282,297 | (5.9) | % | (8.2) | % | ||||||||||||||||||||||||||
| Operating Expenses: | ||||||||||||||||||||||||||||||||
| Property expenses | 55,379 | 52,558 | 5.4 | % | (1.5) | % | ||||||||||||||||||||||||||
| Real estate taxes | 25,703 | 26,326 | (2.4) | % | 0.3 | % | ||||||||||||||||||||||||||
| Ground leases | 1,945 | 1,854 | 4.9 | % | 0.0 | % | ||||||||||||||||||||||||||
| Total operating expenses | 83,027 | 80,738 | 2.8 | % | (1.2) | % | ||||||||||||||||||||||||||
| Net Operating Income | $ | 182,692 | $ | 201,559 | (9.4) | % | (9.4) | % | ||||||||||||||||||||||||
| Same Store Analysis (Cash Basis) | ||||||||||||||||||||||||||||||||
| Three Months Ended March 31, | ||||||||||||||||||||||||||||||||
| 2024 | 2023 | % Change | % Contribution | |||||||||||||||||||||||||||||
Total operating revenues (3) |
$ | 263,181 | $ | 274,939 | (4.3) | % | (6.1) | % | ||||||||||||||||||||||||
| Total operating expenses | 82,930 | 80,638 | 2.8 | % | (1.1) | % | ||||||||||||||||||||||||||
Cash Net Operating Income (4) |
$ | 180,251 | $ | 194,301 | (7.2) | % | (7.2) | % | ||||||||||||||||||||||||
Q1 2024 Supplemental Financial Report |
|||||
| Portfolio Breakdown | Occupied at | Leased at | ||||||||||||||||||||||||||||||||||||||||||||||||
STABILIZED PORTFOLIO (1)(2) |
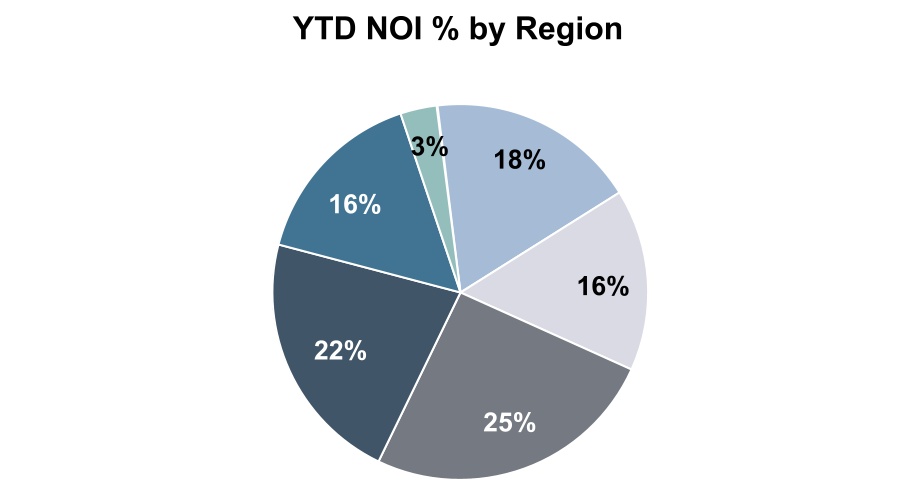
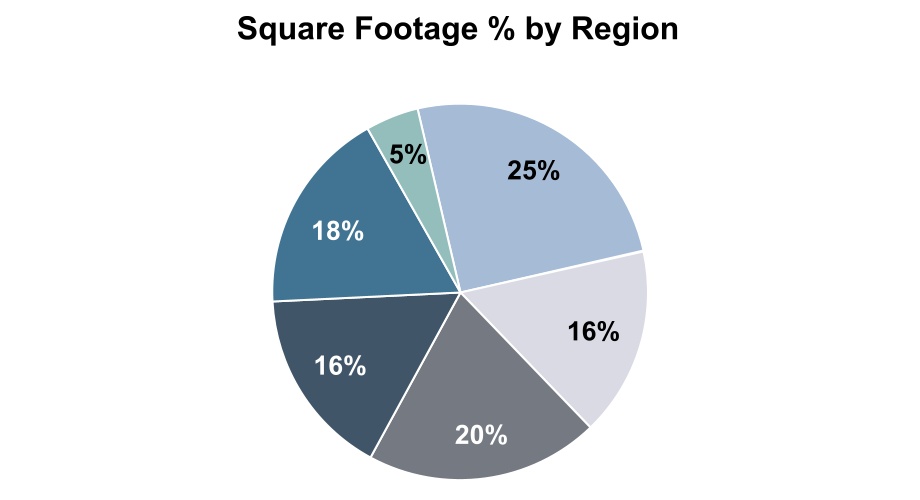
YTD NOI % | SF % | Total SF | 3/31/2024 | 12/31/2023 | 3/31/2024 | 12/31/2023 | |||||||||||||||||||||||||||||||||||||||||||
| Los Angeles | ||||||||||||||||||||||||||||||||||||||||||||||||||
| Hollywood / West Hollywood | 8.3 | % | 8.1 | % | 1,383,563 | 85.9 | % | 87.9 | % | 87.1 | % | 91.3 | % | |||||||||||||||||||||||||||||||||||||
| El Segundo | 3.7 | % | 6.4 | % | 1,103,595 | 76.0 | % | 75.4 | % | 76.0 | % | 75.6 | % | |||||||||||||||||||||||||||||||||||||
| Long Beach | 2.3 | % | 5.6 | % | 957,706 | 80.5 | % | 85.7 | % | 83.8 | % | 85.7 | % | |||||||||||||||||||||||||||||||||||||
| West Los Angeles | 3.1 | % | 4.3 | % | 726,975 | 58.8 | % | 60.0 | % | 58.8 | % | 60.0 | % | |||||||||||||||||||||||||||||||||||||
| Culver City | 0.5 | % | 1.0 | % | 166,207 | 55.6 | % | 71.9 | % | 55.6 | % | 71.9 | % | |||||||||||||||||||||||||||||||||||||
| Total Los Angeles | 17.9 | % | 25.4 | % | 4,338,046 | 76.5 | % | 79.0 | % | 77.6 | % | 80.1 | % | |||||||||||||||||||||||||||||||||||||
| San Diego | ||||||||||||||||||||||||||||||||||||||||||||||||||
| Del Mar | 12.8 | % | 10.5 | % | 1,791,486 | 96.5 | % | 96.9 | % | 98.1 | % | 97.1 | % | |||||||||||||||||||||||||||||||||||||
| I-15 Corridor | 1.5 | % | 2.5 | % | 433,851 | 79.9 | % | 82.6 | % | 83.8 | % | 85.5 | % | |||||||||||||||||||||||||||||||||||||
| Little Italy / Point Loma | 0.4 | % | 1.9 | % | 319,879 | 41.7 | % | 41.6 | % | 43.7 | % | 43.8 | % | |||||||||||||||||||||||||||||||||||||
| University Towne Center | 1.8 | % | 1.4 | % | 231,060 | 100.0 | % | 100.0 | % | 100.0 | % | 100.0 | % | |||||||||||||||||||||||||||||||||||||
| Total San Diego | 16.5 | % | 16.3 | % | 2,776,276 | 87.9 | % | 88.6 | % | 89.7 | % | 89.5 | % | |||||||||||||||||||||||||||||||||||||
| San Francisco Bay Area | ||||||||||||||||||||||||||||||||||||||||||||||||||
| San Francisco CBD | 25.1 | % | 20.0 | % | 3,400,600 | 84.7 | % | 85.0 | % | 84.8 | % | 85.5 | % | |||||||||||||||||||||||||||||||||||||
| Silicon Valley | 8.6 | % | 7.5 | % | 1,286,100 | 100.0 | % | 100.0 | % | 100.0 | % | 100.0 | % | |||||||||||||||||||||||||||||||||||||
| South San Francisco | 8.4 | % | 4.7 | % | 806,109 | 100.0 | % | 100.0 | % | 100.0 | % | 100.0 | % | |||||||||||||||||||||||||||||||||||||
| Other Peninsula | 4.7 | % | 4.0 | % | 677,213 | 85.3 | % | 93.2 | % | 96.6 | % | 96.6 | % | |||||||||||||||||||||||||||||||||||||
| Total San Francisco Bay Area | 46.8 | % | 36.2 | % | 6,170,022 | 89.9 | % | 91.0 | % | 91.3 | % | 91.6 | % | |||||||||||||||||||||||||||||||||||||
| Seattle | ||||||||||||||||||||||||||||||||||||||||||||||||||
| Lake Union / Denny Regrade | 10.1 | % | 12.2 | % | 2,080,883 | 78.8 | % | 78.9 | % | 79.2 | % | 78.9 | % | |||||||||||||||||||||||||||||||||||||
| Bellevue | 5.6 | % | 5.4 | % | 919,295 | 94.5 | % | 93.6 | % | 95.1 | % | 95.4 | % | |||||||||||||||||||||||||||||||||||||
| Total Seattle | 15.7 | % | 17.6 | % | 3,000,178 | 83.6 | % | 83.4 | % | 84.1 | % | 84.0 | % | |||||||||||||||||||||||||||||||||||||
| Austin | ||||||||||||||||||||||||||||||||||||||||||||||||||
| Austin CBD | 3.1 | % | 4.5 | % | 758,975 | 71.5 | % | 64.9 | % | 78.2 | % | 78.2 | % | |||||||||||||||||||||||||||||||||||||
| Total Austin | 3.1 | % | 4.5 | % | 758,975 | 71.5 | % | 64.9 | % | 78.2 | % | 78.2 | % | |||||||||||||||||||||||||||||||||||||
| TOTAL STABILIZED PORTFOLIO | 100.0 | % | 100.0 | % | 17,043,497 | 84.2 | % | 85.0 | % | 85.7 | % | 86.4 | % | |||||||||||||||||||||||||||||||||||||
| Average Occupancy | ||
| Quarter-to-Date | ||
| 84.5% | ||
Q1 2024 Supplemental Financial Report |
|||||
| Occupied at | Leased at | |||||||||||||||||||||||||||||||||||||||||||
| Submarket | Square Feet | 3/31/2024 | 12/31/2023 | 3/31/2024 | 12/31/2023 | |||||||||||||||||||||||||||||||||||||||
| Los Angeles, California | ||||||||||||||||||||||||||||||||||||||||||||
| 1350 Ivar Avenue | Hollywood | 16,448 | 100.0 | % | 100.0 | % | 100.0 | % | 100.0 | % | ||||||||||||||||||||||||||||||||||
| 1355 Vine Street | Hollywood | 183,129 | 100.0 | % | 100.0 | % | 100.0 | % | 100.0 | % | ||||||||||||||||||||||||||||||||||
| 1375 Vine Street | Hollywood | 159,236 | 100.0 | % | 100.0 | % | 100.0 | % | 100.0 | % | ||||||||||||||||||||||||||||||||||
| 1395 Vine Street | Hollywood | 2,575 | 100.0 | % | 100.0 | % | 100.0 | % | 100.0 | % | ||||||||||||||||||||||||||||||||||
| 1500 N. El Centro Avenue | Hollywood | 113,447 | 63.6 | % | 41.4 | % | 63.6 | % | 63.6 | % | ||||||||||||||||||||||||||||||||||
| 1525 N. Gower Street | Hollywood | 9,610 | 100.0 | % | 100.0 | % | 100.0 | % | 100.0 | % | ||||||||||||||||||||||||||||||||||
| 1575 N. Gower Street | Hollywood | 264,430 | 100.0 | % | 100.0 | % | 100.0 | % | 100.0 | % | ||||||||||||||||||||||||||||||||||
| 6115 W. Sunset Boulevard | Hollywood | 26,238 | 23.8 | % | 53.0 | % | 23.8 | % | 53.0 | % | ||||||||||||||||||||||||||||||||||
| 6121 W. Sunset Boulevard | Hollywood | 93,418 | 100.0 | % | 100.0 | % | 100.0 | % | 100.0 | % | ||||||||||||||||||||||||||||||||||
| 6255 W. Sunset Boulevard | Hollywood | 325,772 | 66.5 | % | 77.9 | % | 67.0 | % | 84.1 | % | ||||||||||||||||||||||||||||||||||
| 8560 W. Sunset Boulevard | West Hollywood | 76,359 | 77.4 | % | 87.6 | % | 91.7 | % | 87.6 | % | ||||||||||||||||||||||||||||||||||
| 8570 W. Sunset Boulevard | West Hollywood | 49,276 | 94.5 | % | 94.5 | % | 99.0 | % | 99.0 | % | ||||||||||||||||||||||||||||||||||
| 8580 W. Sunset Boulevard | West Hollywood | 6,875 | 59.0 | % | 59.0 | % | 59.0 | % | 59.0 | % | ||||||||||||||||||||||||||||||||||
| 8590 W. Sunset Boulevard | West Hollywood | 56,750 | 97.4 | % | 97.4 | % | 99.7 | % | 97.4 | % | ||||||||||||||||||||||||||||||||||
| 2240 E. Imperial Highway | El Segundo | 122,870 | 100.0 | % | 100.0 | % | 100.0 | % | 100.0 | % | ||||||||||||||||||||||||||||||||||
| 2250 E. Imperial Highway | El Segundo | 298,728 | 46.2 | % | 46.2 | % | 46.2 | % | 46.2 | % | ||||||||||||||||||||||||||||||||||
| 2260 E. Imperial Highway | El Segundo | 298,728 | 100.0 | % | 100.0 | % | 100.0 | % | 100.0 | % | ||||||||||||||||||||||||||||||||||
| 909 N. Pacific Coast Highway | El Segundo | 244,880 | 79.3 | % | 78.6 | % | 79.3 | % | 79.3 | % | ||||||||||||||||||||||||||||||||||
| 999 N. Pacific Coast Highway | El Segundo | 138,389 | 61.3 | % | 58.1 | % | 61.3 | % | 58.1 | % | ||||||||||||||||||||||||||||||||||
| 3750 Kilroy Airport Way | Long Beach | 10,718 | 100.0 | % | 100.0 | % | 100.0 | % | 100.0 | % | ||||||||||||||||||||||||||||||||||
| 3760 Kilroy Airport Way | Long Beach | 166,761 | 77.0 | % | 77.0 | % | 77.0 | % | 77.0 | % | ||||||||||||||||||||||||||||||||||
| 3780 Kilroy Airport Way | Long Beach | 221,452 | 89.9 | % | 91.4 | % | 91.8 | % | 91.4 | % | ||||||||||||||||||||||||||||||||||
| 3800 Kilroy Airport Way | Long Beach | 192,476 | 89.3 | % | 89.3 | % | 89.3 | % | 89.3 | % | ||||||||||||||||||||||||||||||||||
| 3840 Kilroy Airport Way | Long Beach | 138,441 | 77.6 | % | 77.6 | % | 77.6 | % | 77.6 | % | ||||||||||||||||||||||||||||||||||
| 3880 Kilroy Airport Way | Long Beach | 96,923 | 51.9 | % | 100.0 | % | 51.9 | % | 100.0 | % | ||||||||||||||||||||||||||||||||||
| 3900 Kilroy Airport Way | Long Beach | 130,935 | 78.7 | % | 78.7 | % | 100.0 | % | 78.7 | % | ||||||||||||||||||||||||||||||||||
| 12100 W. Olympic Boulevard | West Los Angeles | 155,679 | 74.1 | % | 74.1 | % | 74.1 | % | 74.1 | % | ||||||||||||||||||||||||||||||||||
| 12200 W. Olympic Boulevard | West Los Angeles | 154,544 | 32.0 | % | 32.0 | % | 32.0 | % | 32.0 | % | ||||||||||||||||||||||||||||||||||
| 12233 W. Olympic Boulevard | West Los Angeles | 156,746 | 48.5 | % | 52.7 | % | 48.5 | % | 52.7 | % | ||||||||||||||||||||||||||||||||||
| 12312 W. Olympic Boulevard | West Los Angeles | 76,644 | 100.0 | % | 100.0 | % | 100.0 | % | 100.0 | % | ||||||||||||||||||||||||||||||||||
| 2100/2110 Colorado Avenue | West Los Angeles | 104,853 | 55.4 | % | 55.4 | % | 55.4 | % | 55.4 | % | ||||||||||||||||||||||||||||||||||
| 501 Santa Monica Boulevard | West Los Angeles | 78,509 | 66.5 | % | 68.4 | % | 66.5 | % | 68.4 | % | ||||||||||||||||||||||||||||||||||
| 3101-3243 La Cienega Boulevard | Culver City | 166,207 | 55.6 | % | 71.9 | % | 55.6 | % | 71.9 | % | ||||||||||||||||||||||||||||||||||
| Total Los Angeles | 4,338,046 | 76.5 | % | 79.0 | % | 77.6 | % | 80.1 | % | |||||||||||||||||||||||||||||||||||
Q1 2024 Supplemental Financial Report |
|||||
| Occupied at | Leased at | |||||||||||||||||||||||||||||||||||||||||||
| Submarket | Square Feet | 3/31/2024 | 12/31/2023 | 3/31/2024 | 12/31/2023 | |||||||||||||||||||||||||||||||||||||||
| San Diego, California | ||||||||||||||||||||||||||||||||||||||||||||
| 12225 El Camino Real | Del Mar | 58,401 | 100.0 | % | 100.0 | % | 100.0 | % | 100.0 | % | ||||||||||||||||||||||||||||||||||
| 12235 El Camino Real | Del Mar | 53,751 | 100.0 | % | 100.0 | % | 100.0 | % | 100.0 | % | ||||||||||||||||||||||||||||||||||
| 12340 El Camino Real | Del Mar | 109,307 | 100.0 | % | 100.0 | % | 100.0 | % | 100.0 | % | ||||||||||||||||||||||||||||||||||
| 12390 El Camino Real | Del Mar | 73,238 | 100.0 | % | 100.0 | % | 100.0 | % | 100.0 | % | ||||||||||||||||||||||||||||||||||
| 12770 El Camino Real | Del Mar | 75,035 | 100.0 | % | 100.0 | % | 100.0 | % | 100.0 | % | ||||||||||||||||||||||||||||||||||
| 12780 El Camino Real | Del Mar | 140,591 | 100.0 | % | 100.0 | % | 100.0 | % | 100.0 | % | ||||||||||||||||||||||||||||||||||
| 12790 El Camino Real | Del Mar | 87,944 | 100.0 | % | 100.0 | % | 100.0 | % | 100.0 | % | ||||||||||||||||||||||||||||||||||
| 12830 El Camino Real | Del Mar | 196,444 | 100.0 | % | 100.0 | % | 100.0 | % | 100.0 | % | ||||||||||||||||||||||||||||||||||
| 12860 El Camino Real | Del Mar | 92,042 | 100.0 | % | 100.0 | % | 100.0 | % | 100.0 | % | ||||||||||||||||||||||||||||||||||
| 12348 High Bluff Drive | Del Mar | 39,192 | 100.0 | % | 100.0 | % | 100.0 | % | 100.0 | % | ||||||||||||||||||||||||||||||||||
| 12400 High Bluff Drive | Del Mar | 216,518 | 91.7 | % | 91.7 | % | 100.0 | % | 91.7 | % | ||||||||||||||||||||||||||||||||||
3579 Valley Centre Drive |
Del Mar | 54,960 | 94.7 | % | 94.7 | % | 94.7 | % | 94.7 | % | ||||||||||||||||||||||||||||||||||
| 3611 Valley Centre Drive | Del Mar | 132,425 | 100.0 | % | 100.0 | % | 100.0 | % | 100.0 | % | ||||||||||||||||||||||||||||||||||
| 3661 Valley Centre Drive | Del Mar | 131,662 | 95.3 | % | 100.0 | % | 100.0 | % | 100.0 | % | ||||||||||||||||||||||||||||||||||
| 3721 Valley Centre Drive | Del Mar | 115,193 | 78.4 | % | 78.4 | % | 78.4 | % | 78.4 | % | ||||||||||||||||||||||||||||||||||
| 3811 Valley Centre Drive | Del Mar | 118,912 | 100.0 | % | 100.0 | % | 100.0 | % | 100.0 | % | ||||||||||||||||||||||||||||||||||
| 3745 Paseo Place | Del Mar | 95,871 | 89.6 | % | 89.6 | % | 93.2 | % | 93.2 | % | ||||||||||||||||||||||||||||||||||
| 13480 Evening Creek Drive North | I-15 Corridor | 143,401 | 63.1 | % | 54.5 | % | 63.1 | % | 63.1 | % | ||||||||||||||||||||||||||||||||||
| 13500 Evening Creek Drive North | I-15 Corridor | 143,749 | 81.0 | % | 92.9 | % | 92.9 | % | 92.9 | % | ||||||||||||||||||||||||||||||||||
| 13520 Evening Creek Drive North | I-15 Corridor | 146,701 | 95.2 | % | 100.0 | % | 95.2 | % | 100.0 | % | ||||||||||||||||||||||||||||||||||
| 2100 Kettner Boulevard | Little Italy | 212,423 | 21.2 | % | 20.5 | % | 24.2 | % | 23.8 | % | ||||||||||||||||||||||||||||||||||
| 2305 Historic Decatur Road | Point Loma | 107,456 | 82.1 | % | 82.1 | % | 82.1 | % | 82.1 | % | ||||||||||||||||||||||||||||||||||
| 9455 Towne Centre Drive | University Towne Center | 160,444 | 100.0 | % | 100.0 | % | 100.0 | % | 100.0 | % | ||||||||||||||||||||||||||||||||||
| 9514 Towne Centre Drive * | University Towne Center | 70,616 | 100.0 | % | 100.0 | % | 100.0 | % | 100.0 | % | ||||||||||||||||||||||||||||||||||
| Total San Diego | 2,776,276 | 87.9 | % | 88.6 | % | 89.7 | % | 89.5 | % | |||||||||||||||||||||||||||||||||||
Q1 2024 Supplemental Financial Report |
|||||
| Occupied at | Leased at | |||||||||||||||||||||||||||||||||||||||||||
| Submarket | Square Feet | 3/31/2024 | 12/31/2023 | 3/31/2024 | 12/31/2023 | |||||||||||||||||||||||||||||||||||||||
| San Francisco Bay Area, California | ||||||||||||||||||||||||||||||||||||||||||||
| 100 Hooper Street | San Francisco CBD | 417,914 | 95.5 | % | 95.5 | % | 95.5 | % | 95.5 | % | ||||||||||||||||||||||||||||||||||
| 100 First Street | San Francisco CBD | 480,457 | 92.8 | % | 98.3 | % | 93.6 | % | 98.3 | % | ||||||||||||||||||||||||||||||||||
| 303 Second Street | San Francisco CBD | 784,658 | 73.2 | % | 71.1 | % | 73.2 | % | 73.5 | % | ||||||||||||||||||||||||||||||||||
| 201 Third Street | San Francisco CBD | 346,538 | 68.2 | % | 68.2 | % | 68.2 | % | 68.2 | % | ||||||||||||||||||||||||||||||||||
| 360 Third Street | San Francisco CBD | 436,357 | 66.6 | % | 66.6 | % | 66.6 | % | 66.6 | % | ||||||||||||||||||||||||||||||||||
| 250 Brannan Street | San Francisco CBD | 100,850 | 100.0 | % | 100.0 | % | 100.0 | % | 100.0 | % | ||||||||||||||||||||||||||||||||||
| 301 Brannan Street | San Francisco CBD | 82,834 | 100.0 | % | 100.0 | % | 100.0 | % | 100.0 | % | ||||||||||||||||||||||||||||||||||
| 333 Brannan Street | San Francisco CBD | 185,602 | 100.0 | % | 100.0 | % | 100.0 | % | 100.0 | % | ||||||||||||||||||||||||||||||||||
| 345 Brannan Street | San Francisco CBD | 110,050 | 99.7 | % | 99.7 | % | 99.7 | % | 99.7 | % | ||||||||||||||||||||||||||||||||||
| 350 Mission Street | San Francisco CBD | 455,340 | 99.7 | % | 99.7 | % | 99.7 | % | 99.7 | % | ||||||||||||||||||||||||||||||||||
| 1290-1300 Terra Bella Avenue | Silicon Valley | 114,175 | 100.0 | % | 100.0 | % | 100.0 | % | 100.0 | % | ||||||||||||||||||||||||||||||||||
| 680 E. Middlefield Road | Silicon Valley | 171,676 | 100.0 | % | 100.0 | % | 100.0 | % | 100.0 | % | ||||||||||||||||||||||||||||||||||
| 690 E. Middlefield Road | Silicon Valley | 171,215 | 100.0 | % | 100.0 | % | 100.0 | % | 100.0 | % | ||||||||||||||||||||||||||||||||||
| 1701 Page Mill Road | Silicon Valley | 128,688 | 100.0 | % | 100.0 | % | 100.0 | % | 100.0 | % | ||||||||||||||||||||||||||||||||||
| 3150 Porter Drive | Silicon Valley | 36,886 | 100.0 | % | 100.0 | % | 100.0 | % | 100.0 | % | ||||||||||||||||||||||||||||||||||
| 505 Mathilda Avenue | Silicon Valley | 212,322 | 100.0 | % | 100.0 | % | 100.0 | % | 100.0 | % | ||||||||||||||||||||||||||||||||||
| 555 Mathilda Avenue | Silicon Valley | 212,322 | 100.0 | % | 100.0 | % | 100.0 | % | 100.0 | % | ||||||||||||||||||||||||||||||||||
| 599 Mathilda Avenue | Silicon Valley | 76,031 | 100.0 | % | 100.0 | % | 100.0 | % | 100.0 | % | ||||||||||||||||||||||||||||||||||
| 605 Mathilda Avenue | Silicon Valley | 162,785 | 100.0 | % | 100.0 | % | 100.0 | % | 100.0 | % | ||||||||||||||||||||||||||||||||||
| 345 Oyster Point Boulevard | South San Francisco | 40,410 | 100.0 | % | 100.0 | % | 100.0 | % | 100.0 | % | ||||||||||||||||||||||||||||||||||
| 347 Oyster Point Boulevard | South San Francisco | 39,780 | 100.0 | % | 100.0 | % | 100.0 | % | 100.0 | % | ||||||||||||||||||||||||||||||||||
| 349 Oyster Point Boulevard | South San Francisco | 65,340 | 100.0 | % | 100.0 | % | 100.0 | % | 100.0 | % | ||||||||||||||||||||||||||||||||||
| 350 Oyster Point Boulevard | South San Francisco | 234,892 | 100.0 | % | 100.0 | % | 100.0 | % | 100.0 | % | ||||||||||||||||||||||||||||||||||
| 352 Oyster Point Boulevard | South San Francisco | 232,215 | 100.0 | % | 100.0 | % | 100.0 | % | 100.0 | % | ||||||||||||||||||||||||||||||||||
| 354 Oyster Point Boulevard | South San Francisco | 193,472 | 100.0 | % | 100.0 | % | 100.0 | % | 100.0 | % | ||||||||||||||||||||||||||||||||||
| 4100 Bohannon Drive | Other Peninsula | 47,643 | 100.0 | % | 100.0 | % | 100.0 | % | 100.0 | % | ||||||||||||||||||||||||||||||||||
| 4200 Bohannon Drive | Other Peninsula | 43,600 | 69.4 | % | 69.4 | % | 69.4 | % | 69.4 | % | ||||||||||||||||||||||||||||||||||
| 4300 Bohannon Drive | Other Peninsula | 63,430 | 48.8 | % | 48.8 | % | 85.1 | % | 85.1 | % | ||||||||||||||||||||||||||||||||||
| 4500 Bohannon Drive | Other Peninsula | 63,429 | 100.0 | % | 100.0 | % | 100.0 | % | 100.0 | % | ||||||||||||||||||||||||||||||||||
| 4600 Bohannon Drive | Other Peninsula | 48,413 | 100.0 | % | 100.0 | % | 100.0 | % | 100.0 | % | ||||||||||||||||||||||||||||||||||
| 4700 Bohannon Drive | Other Peninsula | 63,429 | 100.0 | % | 100.0 | % | 100.0 | % | 100.0 | % | ||||||||||||||||||||||||||||||||||
| 900 Jefferson Avenue | Other Peninsula | 228,505 | 100.0 | % | 100.0 | % | 100.0 | % | 100.0 | % | ||||||||||||||||||||||||||||||||||
| 900 Middlefield Road | Other Peninsula | 118,764 | 54.7 | % | 100.0 | % | 100.0 | % | 100.0 | % | ||||||||||||||||||||||||||||||||||
| Total San Francisco Bay Area | 6,170,022 | 89.9 | % | 91.0 | % | 91.3 | % | 91.6 | % | |||||||||||||||||||||||||||||||||||
Q1 2024 Supplemental Financial Report |
|||||
| Occupied at | Leased at | |||||||||||||||||||||||||||||||||||||||||||
| Submarket | Square Feet | 3/31/2024 | 12/31/2023 | 3/31/2024 | 12/31/2023 | |||||||||||||||||||||||||||||||||||||||
| Seattle, Washington | ||||||||||||||||||||||||||||||||||||||||||||
| 333 Dexter Avenue North | Lake Union | 618,766 | 100.0 | % | 100.0 | % | 100.0 | % | 100.0 | % | ||||||||||||||||||||||||||||||||||
| 701 N. 34th Street | Lake Union | 141,860 | 100.0 | % | 100.0 | % | 100.0 | % | 100.0 | % | ||||||||||||||||||||||||||||||||||
| 801 N. 34th Street | Lake Union | 173,615 | 100.0 | % | 100.0 | % | 100.0 | % | 100.0 | % | ||||||||||||||||||||||||||||||||||
| 837 N. 34th Street | Lake Union | 112,487 | 100.0 | % | 100.0 | % | 100.0 | % | 100.0 | % | ||||||||||||||||||||||||||||||||||
| 320 Westlake Avenue North | Lake Union | 184,644 | 94.3 | % | 96.1 | % | 94.3 | % | 96.1 | % | ||||||||||||||||||||||||||||||||||
| 321 Terry Avenue North | Lake Union | 135,755 | 100.0 | % | 100.0 | % | 100.0 | % | 100.0 | % | ||||||||||||||||||||||||||||||||||
| 401 Terry Avenue North | Lake Union | 174,530 | 100.0 | % | 100.0 | % | 100.0 | % | 100.0 | % | ||||||||||||||||||||||||||||||||||
| 2001 West 8th Avenue | Denny Regrade | 539,226 | 20.0 | % | 20.0 | % | 21.6 | % | 20.0 | % | ||||||||||||||||||||||||||||||||||
| 601 108th Avenue NE | Bellevue | 490,738 | 98.6 | % | 100.0 | % | 98.6 | % | 100.0 | % | ||||||||||||||||||||||||||||||||||
| 10900 NE 4th Street | Bellevue | 428,557 | 89.7 | % | 86.2 | % | 91.1 | % | 90.1 | % | ||||||||||||||||||||||||||||||||||
| Total Seattle | 3,000,178 | 83.6 | % | 83.4 | % | 84.1 | % | 84.0 | % | |||||||||||||||||||||||||||||||||||
| Austin, Texas | ||||||||||||||||||||||||||||||||||||||||||||
| 200 W. 6th Street * | Austin CBD | 758,975 | 71.5 | % | 64.9 | % | 78.2 | % | 78.2 | % | ||||||||||||||||||||||||||||||||||
| Total Austin | 758,975 | 71.5 | % | 64.9 | % | 78.2 | % | 78.2 | % | |||||||||||||||||||||||||||||||||||
| TOTAL STABILIZED PORTFOLIO | 17,043,497 | 84.2 | % | 85.0 | % | 85.7 | % | 86.4 | % | |||||||||||||||||||||||||||||||||||
| Average Residential Occupancy | ||||||||||||||||||||||||||||||||
| Quarter-to-Date | ||||||||||||||||||||||||||||||||
| RESIDENTIAL PROPERTIES | Submarket | Total No. of Units | 3/31/2024 | 12/31/2023 | ||||||||||||||||||||||||||||
| Los Angeles, California | ||||||||||||||||||||||||||||||||
| 1550 N. El Centro Avenue | Hollywood | 200 | 90.6% | 91.7% | ||||||||||||||||||||||||||||
| 6390 De Longpre Avenue | Hollywood | 193 | 92.4% | 91.2% | ||||||||||||||||||||||||||||
| San Diego, California | ||||||||||||||||||||||||||||||||
| 3200 Paseo Village Way | Del Mar | 608 | 94.1% | 93.1% | ||||||||||||||||||||||||||||
| TOTAL RESIDENTIAL PROPERTIES | 1,001 | 93.1% | 92.5% | |||||||||||||||||||||||||||||
Q1 2024 Supplemental Financial Report |
|||||
| Quarter to Date | # of Leases | Square Feet |
Weighted Average Lease Term (Mo.) |
TI/LC
Per Sq.Ft. (2)
|
TI/LC
Per Sq.Ft. /Year (2)
|
Changes in
GAAP Rents (3)
|
Changes in
Cash Rents (3)
|
||||||||||||||||||||||||||||||||||||||||||||||||||||||||||
| New | Renewal | New | Renewal | Total | |||||||||||||||||||||||||||||||||||||||||||||||||||||||||||||
2nd Gen Leasing (4)(5) |
10 | 12 | 109,490 | 129,776 | 239,266 | 54 | $ | 38.46 | $ | 8.55 | 4.3 | % | (7.1) | % | |||||||||||||||||||||||||||||||||||||||||||||||||||
|
1st Gen / Major Repositioning /
In-Process Development & Redevelopment Leasing (5)
|
2 | — | 53,469 | — | 53,469 | 182 | $ | 198.94 | $ | 13.12 | |||||||||||||||||||||||||||||||||||||||||||||||||||||||
| TOTAL | 12 | 12 | 162,959 | 129,776 | 292,735 | ||||||||||||||||||||||||||||||||||||||||||||||||||||||||||||
Q1 2024 Supplemental Financial Report |
|||||
Quarter to Date (2) |
# of Leases | Square Feet | Weighted Average Lease Term (Mo.) |
TI/LC
Per Sq.Ft. (3)
|
TI/LC
Per Sq.Ft. /Year (3)
|
Changes in
GAAP Rents (4)
|
Changes in
Cash Rents (4)
|
Retention Rates |
|||||||||||||||||||||||||||||||||||||||||||||||||||||||||||||||
| New | Renewal | New | Renewal | Total | |||||||||||||||||||||||||||||||||||||||||||||||||||||||||||||||||||
2nd Gen Leasing (5)(6) |
16 | 12 | 140,401 | 129,776 | 270,177 | 55 | $ | 42.91 | $ | 9.36 | 8.6 | % | (2.9) | % | 30.9 | % | |||||||||||||||||||||||||||||||||||||||||||||||||||||||
|
1st Gen / Major Repositioning /
In-Process Development & Redevelopment Leasing (6)
|
4 | — | 13,717 | — | 13,717 | 69 | $ | 50.24 | $ | 8.74 | |||||||||||||||||||||||||||||||||||||||||||||||||||||||||||||
| TOTAL | 20 | 12 | 154,118 | 129,776 | 283,894 | ||||||||||||||||||||||||||||||||||||||||||||||||||||||||||||||||||
Q1 2024 Supplemental Financial Report |
|||||
| Q1 2024 | Q4 2023 | Q3 2023 | Q2 2023 | Q1 2023 | |||||||||||||||||||||||||||||||
2nd Gen Capital Expenditures: (1) (2) |
|||||||||||||||||||||||||||||||||||
| Capital Improvements | $ | 4,962 | $ | 12,872 | $ | 6,361 | $ | 7,263 | $ | 7,297 | |||||||||||||||||||||||||
| Tenant Improvements & Leasing Commissions | 6,801 | 18,539 | 14,158 | 10,587 | 10,469 | ||||||||||||||||||||||||||||||
| Total | $ | 11,763 | $ | 31,411 | $ | 20,519 | $ | 17,850 | $ | 17,766 | |||||||||||||||||||||||||
| Average Capital Expenditures to Average NOI Ratio - Trailing Five Quarters | 10.2 | % | |||||||||||||||||||||||||||||||||
| Q1 2024 | Q4 2023 | Q3 2023 | Q2 2023 | Q1 2023 | |||||||||||||||||||||||||||||||
Major Repositioning Capital Expenditures: (1) (3) |
|||||||||||||||||||||||||||||||||||
| Capital Improvements | $ | 7,130 | $ | 1,411 | $ | 2,092 | $ | 1,298 | $ | 396 | |||||||||||||||||||||||||
| Tenant Improvements & Leasing Commissions | 89 | (329) | — | — | — | ||||||||||||||||||||||||||||||
| Total | $ | 7,219 | $ | 1,082 | $ | 2,092 | $ | 1,298 | $ | 396 | |||||||||||||||||||||||||
| Q1 2024 | Q4 2023 | Q3 2023 | Q2 2023 | Q1 2023 | |||||||||||||||||||||||||||||||
1st Gen Capital Expenditures: (1) (4) |
|||||||||||||||||||||||||||||||||||
| Tenant Improvements & Leasing Commissions | $ | 10,063 | N/A | N/A | N/A | N/A | |||||||||||||||||||||||||||||
| Total | $ | 10,063 | N/A | N/A | N/A | N/A | |||||||||||||||||||||||||||||
Q1 2024 Supplemental Financial Report |
|||||
| # of Expiring Leases | 46 | 70 | 63 | 71 | 52 | 38 | 44 | 42 | 15 | 13 | 20 | ||||||||||||||||||||||||
| % of Total Leased Sq. Ft. | 4.9 | % | 5.0 | % | 14.1 | % | 7.5 | % | 7.9 | % | 8.1 | % | 11.4 | % | 14.8 | % | 7.9 | % | 8.2 | % | 10.2 | % | |||||||||||||
Annualized Base Rent (“ABR”) |
$34,664 | $32,884 | $94,594 | $43,775 | $69,322 | $61,695 | $95,748 | $137,863 | $73,937 | $69,315 | $89,588 | ||||||||||||||||||||||||
% of Total ABR (2) |
4.3 | % | 4.1 | % | 11.8 | % | 5.4 | % | 8.6 | % | 7.7 | % | 11.9 | % | 17.3 | % | 9.2 | % | 8.6 | % | 11.1 | % | |||||||||||||
| Annualized Rent per Sq. Ft. | $50.26 | $46.09 | $47.37 | $41.00 | $61.85 | $54.00 | $59.41 | $66.01 | $66.29 | $59.92 | $62.15 | ||||||||||||||||||||||||
Q1 2024 Supplemental Financial Report |
|||||
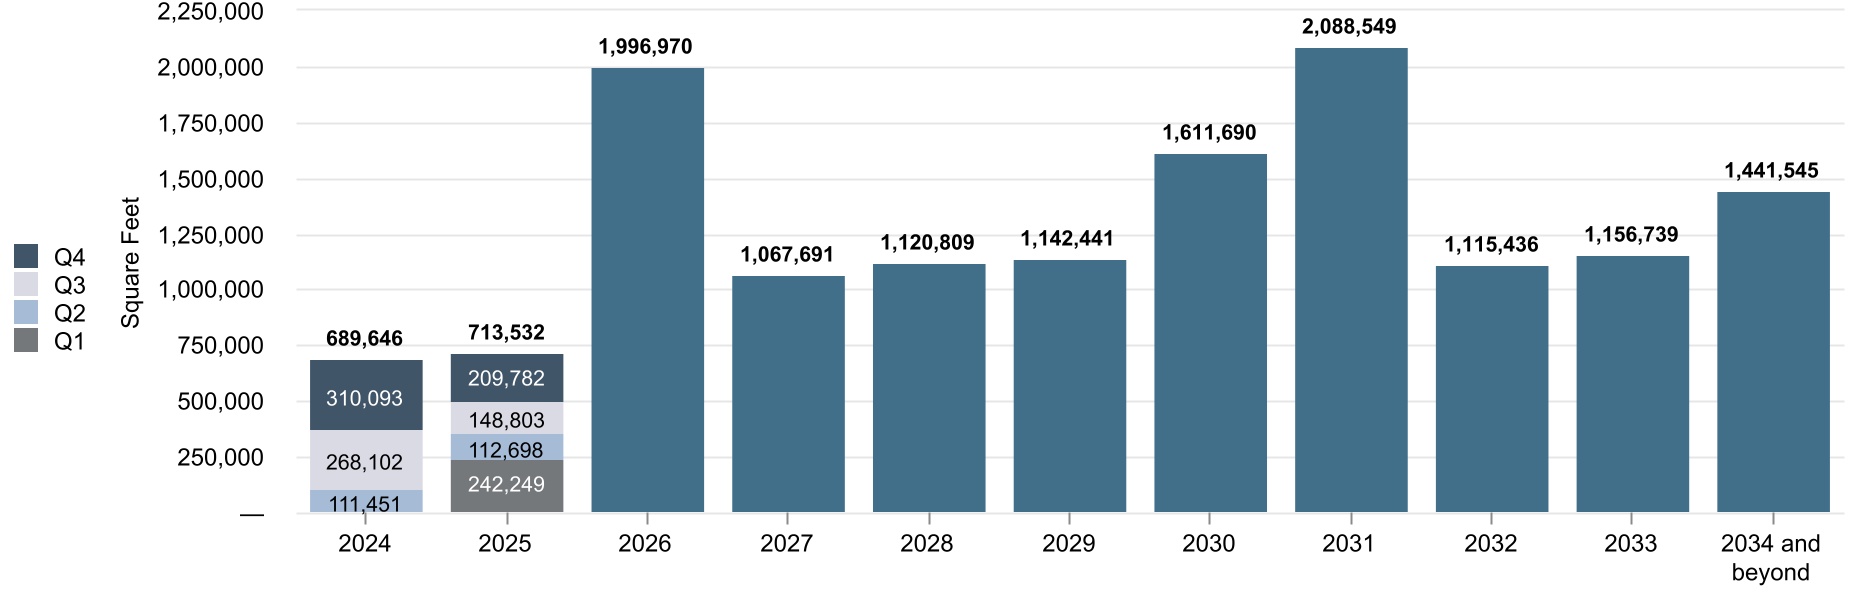
Year |
Region | # of Expiring Leases |
Total Square Feet |
% of Total Leased Sq. Ft. |
Annualized
Base Rent (1)
|
% of Total Annualized Base Rent |
Annualized Rent per Sq. Ft. |
|||||||||||||||||||||||||||||||||||||||||||
| 2024 | Los Angeles | 28 | 260,713 | 1.8 | % | $ | 11,831 | 1.4 | % | $ | 45.38 | |||||||||||||||||||||||||||||||||||||||
| San Diego | 5 | 39,344 | 0.3 | % | 1,399 | 0.2 | % | 35.56 | ||||||||||||||||||||||||||||||||||||||||||
| San Francisco Bay Area | 7 | 236,194 | 1.7 | % | 15,739 | 2.0 | % | 66.64 | ||||||||||||||||||||||||||||||||||||||||||
| Seattle | 6 | 153,395 | 1.1 | % | 5,695 | 0.7 | % | 37.13 | ||||||||||||||||||||||||||||||||||||||||||
| Austin | — | — | — | % | — | — | % | — | ||||||||||||||||||||||||||||||||||||||||||
| Total | 46 | 689,646 | 4.9 | % | $ | 34,664 | 4.3 | % | $ | 50.26 | ||||||||||||||||||||||||||||||||||||||||
| 2025 | Los Angeles | 34 | 223,255 | 1.6 | % | $ | 9,390 | 1.2 | % | $ | 42.06 | |||||||||||||||||||||||||||||||||||||||
| San Diego | 17 | 225,358 | 1.6 | % | 9,218 | 1.1 | % | 40.90 | ||||||||||||||||||||||||||||||||||||||||||
| San Francisco Bay Area | 9 | 124,088 | 0.8 | % | 8,725 | 1.1 | % | 70.31 | ||||||||||||||||||||||||||||||||||||||||||
| Seattle | 10 | 140,831 | 1.0 | % | 5,551 | 0.7 | % | 39.42 | ||||||||||||||||||||||||||||||||||||||||||
| Austin | — | — | — | % | — | — | % | — | ||||||||||||||||||||||||||||||||||||||||||
| Total | 70 | 713,532 | 5.0 | % | $ | 32,884 | 4.1 | % | $ | 46.09 | ||||||||||||||||||||||||||||||||||||||||
| 2026 | Los Angeles | 26 | 488,231 | 3.5 | % | $ | 20,153 | 2.5 | % | $ | 41.28 | |||||||||||||||||||||||||||||||||||||||
| San Diego | 9 | 162,192 | 1.0 | % | 8,582 | 1.1 | % | 52.91 | ||||||||||||||||||||||||||||||||||||||||||
| San Francisco Bay Area | 16 | 941,332 | 6.7 | % | 49,294 | 6.1 | % | 52.37 | ||||||||||||||||||||||||||||||||||||||||||
| Seattle | 12 | 405,215 | 2.9 | % | 16,565 | 2.1 | % | 40.88 | ||||||||||||||||||||||||||||||||||||||||||
| Austin | — | — | — | % | — | — | % | — | ||||||||||||||||||||||||||||||||||||||||||
| Total | 63 | 1,996,970 | 14.1 | % | $ | 94,594 | 11.8 | % | $ | 47.37 | ||||||||||||||||||||||||||||||||||||||||
| 2027 | Los Angeles | 38 | 732,877 | 5.2 | % | $ | 27,069 | 3.4 | % | $ | 36.94 | |||||||||||||||||||||||||||||||||||||||
| San Diego | 18 | 171,689 | 1.2 | % | 8,519 | 1.1 | % | 49.62 | ||||||||||||||||||||||||||||||||||||||||||
| San Francisco Bay Area | 5 | 76,582 | 0.5 | % | 4,922 | 0.5 | % | 64.27 | ||||||||||||||||||||||||||||||||||||||||||
| Seattle | 10 | 86,543 | 0.6 | % | 3,265 | 0.4 | % | 37.73 | ||||||||||||||||||||||||||||||||||||||||||
| Austin | — | — | — | % | — | — | % | — | ||||||||||||||||||||||||||||||||||||||||||
| Total | 71 | 1,067,691 | 7.5 | % | $ | 43,775 | 5.4 | % | $ | 41.00 | ||||||||||||||||||||||||||||||||||||||||
| 2028 | Los Angeles | 21 | 114,983 | 0.8 | % | $ | 5,978 | 0.7 | % | $ | 51.99 | |||||||||||||||||||||||||||||||||||||||
| San Diego | 12 | 214,134 | 1.5 | % | 12,173 | 1.5 | % | 56.85 | ||||||||||||||||||||||||||||||||||||||||||
| San Francisco Bay Area | 11 | 730,461 | 5.2 | % | 49,244 | 6.2 | % | 67.41 | ||||||||||||||||||||||||||||||||||||||||||
| Seattle | 8 | 61,231 | 0.4 | % | 1,927 | 0.2 | % | 31.47 | ||||||||||||||||||||||||||||||||||||||||||
| Austin | — | — | — | % | — | — | % | — | ||||||||||||||||||||||||||||||||||||||||||
| Total | 52 | 1,120,809 | 7.9 | % | $ | 69,322 | 8.6 | % | $ | 61.85 | ||||||||||||||||||||||||||||||||||||||||
| 2029 and Beyond |
Los Angeles | 45 | 1,401,704 | 10.0 | % | $ | 80,413 | 10.0 | % | $ | 57.37 | |||||||||||||||||||||||||||||||||||||||
| San Diego | 57 | 1,609,568 | 11.4 | % | 99,531 | 12.4 | % | 61.84 | ||||||||||||||||||||||||||||||||||||||||||
| San Francisco Bay Area | 36 | 3,391,679 | 24.0 | % | 250,073 | 31.1 | % | 73.73 | ||||||||||||||||||||||||||||||||||||||||||
| Seattle | 24 | 1,617,162 | 11.4 | % | 74,118 | 9.3 | % | 45.83 | ||||||||||||||||||||||||||||||||||||||||||
| Austin | 10 | 536,287 | 3.8 | % | 24,011 | 3.0 | % | 44.77 | ||||||||||||||||||||||||||||||||||||||||||
| Total | 172 | 8,556,400 | 60.6 | % | $ | 528,146 | 65.8 | % | $ | 61.73 | ||||||||||||||||||||||||||||||||||||||||
Q1 2024 Supplemental Financial Report |
|||||
Tenant Name (1) |
Region | Annualized Base Rental Revenue (2) |
Rentable Square Feet |
Percentage of Total Annualized Base Rental Revenue |
Percentage of Total Rentable Square Feet |
Year(s) of Significant Lease Expiration(s) (3) |
Weighted Average Remaining Lease Term (Years) |
|||||||||||||||||||||||||||||||||||||||||||
| Global technology company | Seattle / San Diego | $ | 44,851 | 849,826 | 5.6 | % | 5.0 | % | 2032 - 2033 / 2037 | 9.3 | ||||||||||||||||||||||||||||||||||||||||
| Cruise LLC | San Francisco Bay Area | 35,449 | 374,618 | 4.4 | % | 2.2 | % | 2031 | 7.7 | |||||||||||||||||||||||||||||||||||||||||
| Stripe, Inc. | San Francisco Bay Area | 33,110 | 425,687 | 4.1 | % | 2.5 | % | 2034 | 10.3 | |||||||||||||||||||||||||||||||||||||||||
Salesforce, Inc. (4) |
San Francisco Bay Area / Seattle |
29,981 | 613,497 | 3.7 | % | 3.6 | % | 2024 / 2029 - 2030 / 2032 | 4.8 | |||||||||||||||||||||||||||||||||||||||||
LinkedIn Corporation / Microsoft Corporation (5) |
San Francisco Bay Area | 29,752 | 663,460 | 3.7 | % | 3.9 | % | 2024 / 2026 | 2.2 | |||||||||||||||||||||||||||||||||||||||||
| Adobe Systems, Inc. | San Francisco Bay Area / Seattle |
27,897 | 522,879 | 3.5 | % | 3.1 | % | 2027 / 2031 | 7.1 | |||||||||||||||||||||||||||||||||||||||||
| Okta, Inc. | San Francisco Bay Area | 24,206 | 293,001 | 3.0 | % | 1.7 | % | 2028 | 4.6 | |||||||||||||||||||||||||||||||||||||||||
| DoorDash, Inc. | San Francisco Bay Area | 23,842 | 236,759 | 3.0 | % | 1.4 | % | 2032 | 7.8 | |||||||||||||||||||||||||||||||||||||||||
| Netflix, Inc. | Los Angeles | 21,854 | 361,388 | 2.7 | % | 2.1 | % | 2032 | 8.3 | |||||||||||||||||||||||||||||||||||||||||
| Cytokinetics, Inc. | San Francisco Bay Area | 18,167 | 234,892 | 2.3 | % | 1.4 | % | 2033 | 9.6 | |||||||||||||||||||||||||||||||||||||||||
| Box, Inc. | San Francisco Bay Area | 16,853 | 287,679 | 2.1 | % | 1.7 | % | 2028 | 4.3 | |||||||||||||||||||||||||||||||||||||||||
| DIRECTV, LLC | Los Angeles | 16,085 | 532,956 | 2.0 | % | 3.1 | % | 2026 - 2027 | 3.4 | |||||||||||||||||||||||||||||||||||||||||
| Synopsys, Inc. | San Francisco Bay Area | 15,492 | 342,891 | 1.9 | % | 2.0 | % | 2030 | 6.4 | |||||||||||||||||||||||||||||||||||||||||
| Amazon.com | Seattle | 14,989 | 340,705 | 1.9 | % | 2.0 | % | 2029 - 2030 | 5.8 | |||||||||||||||||||||||||||||||||||||||||
| Neurocrine Biosciences, Inc. | San Diego | 14,046 | 254,578 | 1.8 | % | 1.5 | % | 2025 / 2031 | 6.7 | |||||||||||||||||||||||||||||||||||||||||
Riot Games, Inc. (6) |
Los Angeles | 13,829 | 210,133 | 1.7 | % | 1.2 | % | 2024 / 2026 / 2031 | 3.2 | |||||||||||||||||||||||||||||||||||||||||
| Viacom International, Inc. | Los Angeles | 13,718 | 220,330 | 1.7 | % | 1.3 | % | 2028 | 4.8 | |||||||||||||||||||||||||||||||||||||||||
| Indeed, Inc. | Austin | 13,430 | 330,394 | 1.7 | % | 1.9 | % | 2034 | 10.8 | |||||||||||||||||||||||||||||||||||||||||
| Sony Interactive Entertainment, LLC | San Francisco Bay Area | 13,059 | 127,760 | 1.6 | % | 0.7 | % | 2030 | 6.0 | |||||||||||||||||||||||||||||||||||||||||
| Tandem Diabetes Care, Inc. | San Diego | 12,409 | 143,850 | 1.5 | % | 0.8 | % | 2035 | 11.1 | |||||||||||||||||||||||||||||||||||||||||
| Total Top 20 Tenants | $ | 433,019 | 7,367,283 | 53.9 | % | 43.1 | % | 6.6 | ||||||||||||||||||||||||||||||||||||||||||
Q1 2024 Supplemental Financial Report |
|||||
Annualized Base Rent (2) |
Square Feet Leased | ||||
Q1 2024 Supplemental Financial Report |
|||||
| Property | Venture Partner | Submarket | Rentable Square Feet |
KRC Ownership % |
||||||||||||||||||||||||||||
| 100 First Street, San Francisco, CA | Norges Bank Real Estate Management | San Francisco | 480,457 | 56% | ||||||||||||||||||||||||||||
| 303 Second Street, San Francisco, CA | Norges Bank Real Estate Management | San Francisco | 784,658 | 56% | ||||||||||||||||||||||||||||
|
900 Jefferson Avenue and 900 Middlefield Road,
Redwood City, CA (1)
|
Local developer | Redwood City | 347,269 | 93% | ||||||||||||||||||||||||||||
| Quarter-to-Date | ||||||||||||||
| Total operating revenues | $ | 30,447 | ||||||||||||
| Total operating expenses | 8,238 | |||||||||||||
Net Operating Income - Consolidated Ventures (2)(3) |
$ | 22,209 | ||||||||||||
| Adjustments: | ||||||||||||||
| Amortization of deferred revenue related to tenant-funded tenant improvements | (934) | |||||||||||||
| Net effect of straight-line rents | (372) | |||||||||||||
| Lease related adjustments, leasing costs and other | 1,870 | |||||||||||||
Other (4) |
81 | |||||||||||||
Cash Net Operating Income - Consolidated Ventures (3) |
$ | 22,854 | ||||||||||||
Company's Share of Cash Net Operating Income - Consolidated Ventures (3) |
$ | 15,685 | ||||||||||||
Q1 2024 Supplemental Financial Report |
|||||
| UNDER CONSTRUCTION | Location | Construction Start Date | Estimated Stabilization Date (1) |
Estimated Rentable Square Feet | Total Estimated Investment |
Total Cash Costs Incurred as of
3/31/2024 (2)(3)
|
% Leased | |||||||||||||||||||||||||||||||||||||||||||
| Office / Life Science | ||||||||||||||||||||||||||||||||||||||||||||||||||
| San Francisco Bay Area | ||||||||||||||||||||||||||||||||||||||||||||||||||
| Kilroy Oyster Point - Phase 2 | South San Francisco | 2Q 2021 | 4Q 2025 | 875,000 | $ | 1,000 | $ | 644 | —% | |||||||||||||||||||||||||||||||||||||||||
4400 Bohannon Drive (4) |
Other Peninsula | 4Q 2022 | 3Q 2025 | 48,000 | 55 | 22 | —% | |||||||||||||||||||||||||||||||||||||||||||
| San Diego County | ||||||||||||||||||||||||||||||||||||||||||||||||||
4690 Executive Drive (4) |
University Towne Center | 1Q 2022 | 2Q 2025 | 52,000 | 25 | 20 | —% | |||||||||||||||||||||||||||||||||||||||||||
| TOTAL: | 975,000 | $ | 1,080 | $ | 686 | —% | ||||||||||||||||||||||||||||||||||||||||||||
Q1 2024 Supplemental Financial Report |
|||||
| FUTURE DEVELOPMENT PIPELINE | Location |
Approx. Developable
Square Feet / Resi Units (1)
|
Total Cash Costs Incurred as of 3/31/2024 (2) |
|||||||||||||||||||||||||||||
| Los Angeles | ||||||||||||||||||||||||||||||||
| 1633 26th Street | West Los Angeles | 190,000 | $ | 15 | ||||||||||||||||||||||||||||
| San Diego | ||||||||||||||||||||||||||||||||
| Santa Fe Summit South / North | 56 Corridor | 600,000 - 650,000 | 115 | |||||||||||||||||||||||||||||
| 2045 Pacific Highway | Little Italy | 275,000 | 55 | |||||||||||||||||||||||||||||
| Kilroy East Village | East Village | 1,100 units | 68 | |||||||||||||||||||||||||||||
| San Francisco Bay Area | ||||||||||||||||||||||||||||||||
| Kilroy Oyster Point - Phases 3 and 4 | South San Francisco | 875,000 - 1,000,000 | 223 | |||||||||||||||||||||||||||||
| Flower Mart | SOMA | 2,300,000 | 579 | |||||||||||||||||||||||||||||
| Seattle | ||||||||||||||||||||||||||||||||
| SIX0 | Denny Regrade | 925,000 and 650 units | 185 | |||||||||||||||||||||||||||||
| Austin | ||||||||||||||||||||||||||||||||
| Stadium Tower | Stadium District / Domain | 493,000 | 72 | |||||||||||||||||||||||||||||
| TOTAL: | $ | 1,312 | ||||||||||||||||||||||||||||||

Q1 2024 Supplemental Financial Report |
|||||
| Shares/Units |
Aggregate Principal
Amount (1) or $
Value Equivalent
|
% of Total Market Capitalization | Stated Rate (2) |
Maturity Date | ||||||||||||||||||||||||||||||||||
| Unsecured Debt | ||||||||||||||||||||||||||||||||||||||
| Revolving Credit Facility | $ | — | — | % | 6.34 | % | 7/31/2028 (3) |
|||||||||||||||||||||||||||||||
| Term Loan Facility | 120,000 | 1.3 | % | 6.38 | % | 10/3/2026 (4) |
||||||||||||||||||||||||||||||||
| Term Loan Facility | 200,000 | 2.1 | % | 6.37 | % | 10/3/2027 (4) |
||||||||||||||||||||||||||||||||
| Private Placement Senior Notes Series A due 2026 | 50,000 | 0.5 | % | 4.30 | % | 7/18/2026 | ||||||||||||||||||||||||||||||||
| Private Placement Senior Notes Series B due 2026 | 200,000 | 2.1 | % | 4.35 | % | 10/18/2026 | ||||||||||||||||||||||||||||||||
| Private Placement Senior Notes Series A due 2027 | 175,000 | 1.8 | % | 3.35 | % | 2/17/2027 | ||||||||||||||||||||||||||||||||
| Private Placement Senior Notes Series B due 2029 | 75,000 | 0.8 | % | 3.45 | % | 2/17/2029 | ||||||||||||||||||||||||||||||||
| Private Placement Senior Notes due 2031 | 350,000 | 3.7 | % | 4.27 | % | 1/31/2031 | ||||||||||||||||||||||||||||||||
| Senior Notes due 2024 | 403,712 | 4.3 | % | 3.45 | % | 12/15/2024 | ||||||||||||||||||||||||||||||||
| Senior Notes due 2025 | 400,000 | 4.2 | % | 4.38 | % | 10/1/2025 | ||||||||||||||||||||||||||||||||
| Senior Notes due 2028 | 400,000 | 4.2 | % | 4.75 | % | 12/15/2028 | ||||||||||||||||||||||||||||||||
| Senior Notes due 2029 | 400,000 | 4.2 | % | 4.25 | % | 8/15/2029 | ||||||||||||||||||||||||||||||||
| Senior Notes due 2030 | 500,000 | 5.3 | % | 3.05 | % | 2/15/2030 | ||||||||||||||||||||||||||||||||
| Senior Notes due 2032 | 425,000 | 4.5 | % | 2.50 | % | 11/15/2032 | ||||||||||||||||||||||||||||||||
| Senior Notes due 2033 | 450,000 | 4.8 | % | 2.65 | % | 11/15/2033 | ||||||||||||||||||||||||||||||||
| Senior Notes due 2036 | 400,000 | 4.2 | % | 6.25 | % | 1/15/2036 | ||||||||||||||||||||||||||||||||
| $ | 4,548,712 | 48.0 | % | 4.06 | % | |||||||||||||||||||||||||||||||||
Secured Debt (5) |
||||||||||||||||||||||||||||||||||||||
| 12100,12200, and 12312 W. Olympic Blvd., Los Angeles | $ | 155,469 | 1.6 | % | 3.57 | % | 12/1/2026 | |||||||||||||||||||||||||||||||
| 320 Westlake Ave. N. and 321 Terry Ave. N., Seattle | 80,745 | 0.9 | % | 4.48 | % | 7/1/2027 | ||||||||||||||||||||||||||||||||
| One Paseo Mixed-Use Campus, San Diego | 375,000 | 4.0 | % | 5.90 | % | 8/10/2034 | ||||||||||||||||||||||||||||||||
| $ | 611,214 | 6.5 | % | 5.12 | % | |||||||||||||||||||||||||||||||||
| Total Debt | $ | 5,159,926 | 54.5 | % | 4.19 | % | ||||||||||||||||||||||||||||||||
Equity and Noncontrolling Interest in the Operating Partnership (6) |
||||||||||||||||||||||||||||||||||||||
Common limited partnership units outstanding (7) |
1,150,574 | $ | 41,915 | 0.4 | % | |||||||||||||||||||||||||||||||||
| Shares of common stock outstanding | 117,366,405 | 4,275,658 | 45.1 | % | ||||||||||||||||||||||||||||||||||
| Total Equity and Noncontrolling Interest in the Operating Partnership | $ | 4,317,573 | 45.5 | % | ||||||||||||||||||||||||||||||||||
| Total Market Capitalization | $ | 9,477,499 | 100.0 | % | ||||||||||||||||||||||||||||||||||
Q1 2024 Supplemental Financial Report |
|||||
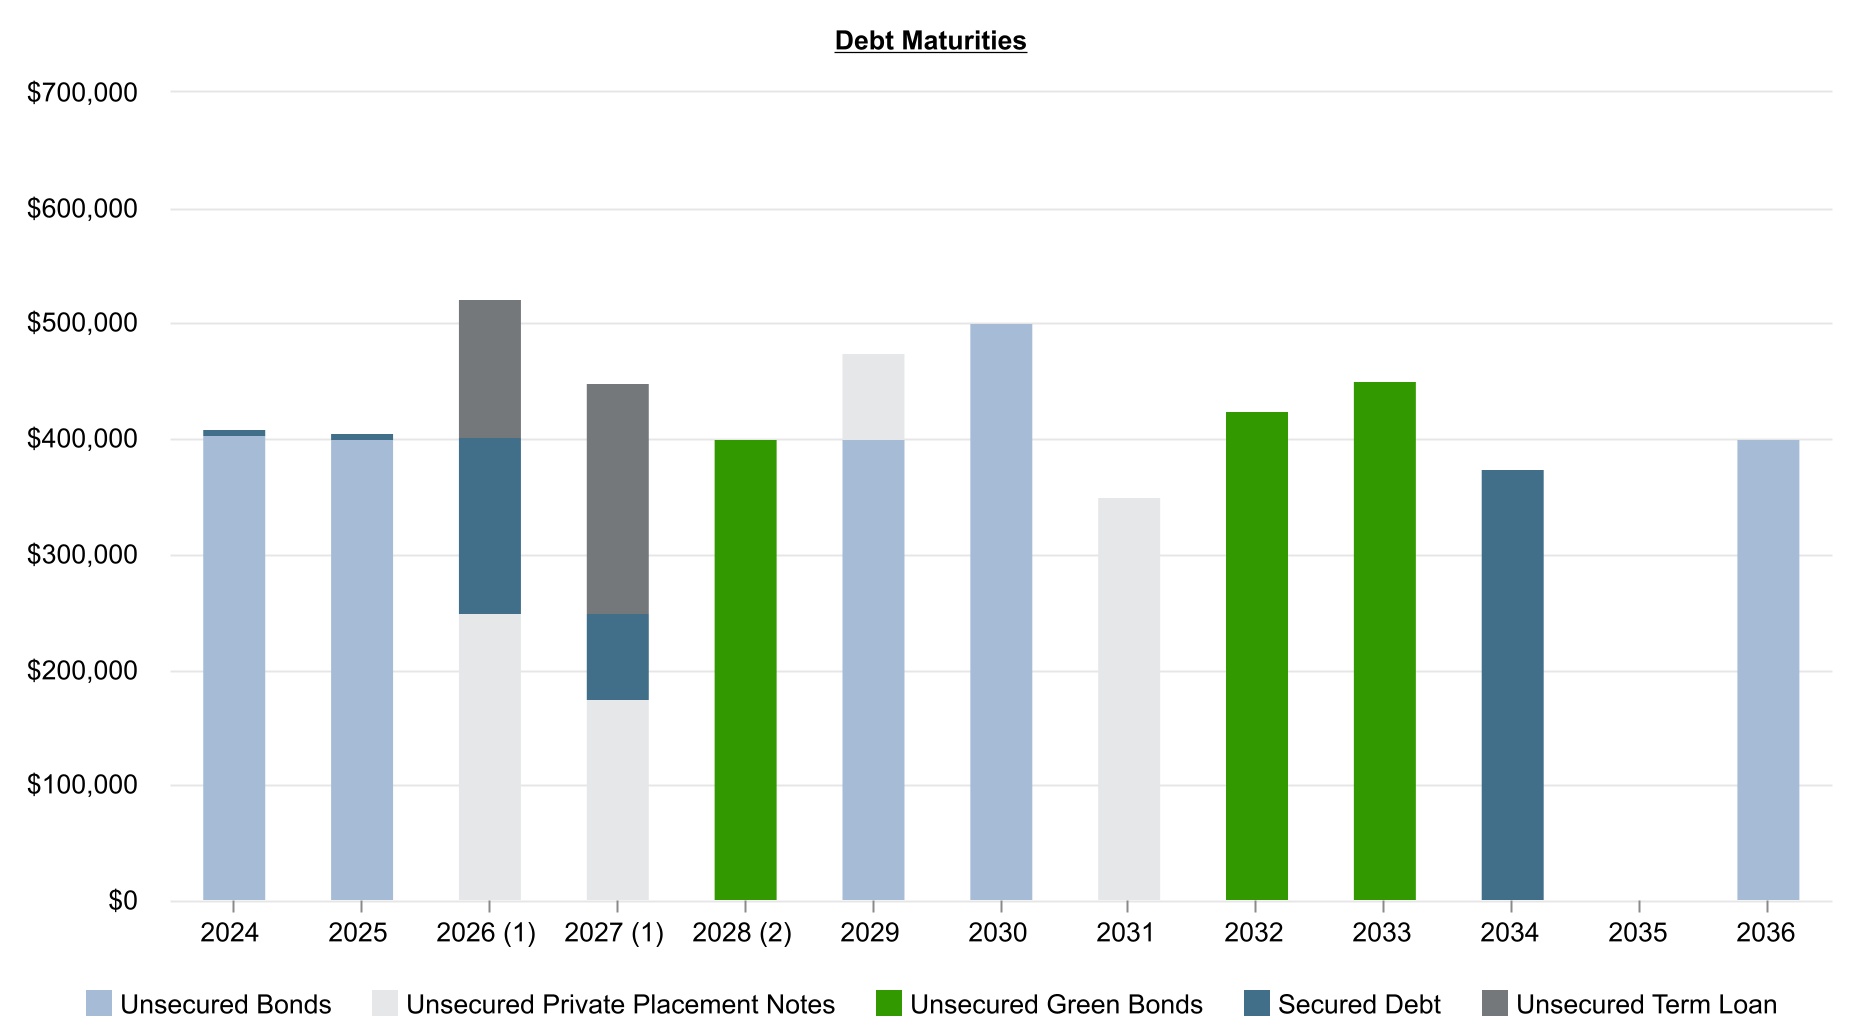
| Total Debt | $408,238 | $406,246 | $521,317 | $449,125 | $400,000 | $475,000 | $500,000 | $350,000 | $425,000 | $450,000 | $375,000 | — | $400,000 | ||||||||||||||||||||||||||||
| Weighted Average Stated Rate |
3.46% | 4.37% | 4.59% | 4.88% | 4.75% | 4.12% | 3.05% | 4.27% | 2.50% | 2.65% | 5.90% | —% | 6.25% | ||||||||||||||||||||||||||||
| % of Total | 8% | 8% | 10% | 8% | 8% | 9% | 10% | 7% | 8% | 9% | 7% | —% | 8% | ||||||||||||||||||||||||||||
Q1 2024 Supplemental Financial Report |
|||||
NET DEBT TO COMPANY'S SHARE OF EBITDA, AS ADJUSTED RATIOS (1) |
||||||||||||||||||||||||||||||||||||||
| 3/31/2024 | 12/31/2023 | 9/30/2023 | 6/30/2023 | 3/31/2023 | ||||||||||||||||||||||||||||||||||
| Total principal amount of debt | $ | 5,159,926 | $ | 4,961,406 | $ | 4,969,869 | $ | 4,440,610 | $ | 4,442,046 | ||||||||||||||||||||||||||||
| Cash and cash equivalents | (855,007) | (510,163) | (618,794) | (361,885) | (476,358) | |||||||||||||||||||||||||||||||||
| Certificates of deposit | (78,256) | (256,581) | (252,830) | — | — | |||||||||||||||||||||||||||||||||
| Net debt | $ | 4,226,663 | $ | 4,194,662 | $ | 4,098,245 | $ | 4,078,725 | $ | 3,965,688 | ||||||||||||||||||||||||||||
Trailing 12-months Company's share of EBITDA, as adjusted (2) |
$ | 672,267 | $ | 671,343 | $ | 673,324 | $ | 668,950 | $ | 660,112 | ||||||||||||||||||||||||||||
Trailing 12-months Company's share of EBITDA, as adjusted less interest income (2) |
$ | 637,945 | $ | 648,751 | $ | 656,196 | $ | 658,543 | $ | 653,001 | ||||||||||||||||||||||||||||
| Net debt to Company's share of EBITDA, as adjusted Ratio | 6.3x | 6.2x | 6.1x | 6.1x | 6.0x | |||||||||||||||||||||||||||||||||
| Net debt to Company's share of EBITDA, as adjusted less interest income Ratio | 6.6x | 6.5x | 6.2x | 6.2x | 6.1x | |||||||||||||||||||||||||||||||||
KEY DEBT COVENANTS (3) |
||||||||||||||||||||
| Covenant | Actual Performance as of March 31, 2024 |
|||||||||||||||||||
| Unsecured Credit and Term Loan Facilities and Private Placement Notes: | ||||||||||||||||||||
| Total debt to total asset value | less than 60% | 32% | ||||||||||||||||||
| Fixed charge coverage ratio | greater than 1.5x | 3.3x | ||||||||||||||||||
| Unsecured debt ratio | greater than 1.67x | 3.18x | ||||||||||||||||||
| Unencumbered asset pool debt service coverage | greater than 1.75x | 3.67x | ||||||||||||||||||
Unsecured Senior Notes due 2024, 2025, 2028, 2029, 2030, 2032, 2033 and 2036: |
||||||||||||||||||||
| Total debt to total asset value | less than 60% | 40% | ||||||||||||||||||
| Interest coverage | greater than 1.5x | 5.8x | ||||||||||||||||||
| Secured debt to total asset value | less than 40% | 5% | ||||||||||||||||||
| Unencumbered asset pool value to unsecured debt | greater than 150% | 274% | ||||||||||||||||||

Q1 2024 Supplemental Financial Report |
|||||
Q1 2024 Supplemental Financial Report |
|||||
Q1 2024 Supplemental Financial Report |
|||||
Q1 2024 Supplemental Financial Report |
|||||
Q1 2024 Supplemental Financial Report |
|||||
Q1 2024 Supplemental Financial Report |
|||||
| Same Store Portfolio Rollforward | ||||||||||||||||||||
| Number of Buildings | Square Feet | |||||||||||||||||||
| Same Store Portfolio as of December 31, 2023 | 115 | 15,063,419 | ||||||||||||||||||
| Stabilized Development and Redevelopment Properties Added | 4 | 1,151,118 | ||||||||||||||||||
| Remeasurements | — | (631) | ||||||||||||||||||
| Same Store Portfolio as of March 31, 2024 | 119 | 16,213,906 | ||||||||||||||||||
| Stabilized Development and Redevelopment Properties Excluded from Same Store | 2 | 829,591 | ||||||||||||||||||
| Stabilized Portfolio as of March 31, 2024 | 121 | 17,043,497 | ||||||||||||||||||
Q1 2024 Supplemental Financial Report |
|||||
Three Months Ended (1) |
||||||||||||||||||||||||||||||||||||||
| 3/31/2024 | 12/31/2023 | 9/30/2023 | 6/30/2023 | 3/31/2023 | ||||||||||||||||||||||||||||||||||
| Net Income Available to Common Stockholders | $ | 49,920 | $ | 47,284 | $ | 52,762 | $ | 55,587 | $ | 56,608 | ||||||||||||||||||||||||||||
| Net income attributable to noncontrolling common units of the Operating Partnership | 502 | 471 | 515 | 537 | 560 | |||||||||||||||||||||||||||||||||
| Net income attributable to noncontrolling interests in consolidated property partnerships | 5,278 | 5,291 | 5,460 | 5,151 | 8,062 | |||||||||||||||||||||||||||||||||
| Net Income | 55,700 | 53,046 | 58,737 | 61,275 | 65,230 | |||||||||||||||||||||||||||||||||
| Adjustments: | ||||||||||||||||||||||||||||||||||||||
| General and administrative expenses | 17,579 | 22,078 | 24,761 | 22,659 | 23,936 | |||||||||||||||||||||||||||||||||
| Leasing costs | 2,279 | 1,956 | 1,852 | 1,326 | 1,372 | |||||||||||||||||||||||||||||||||
| Depreciation and amortization | 88,031 | 86,016 | 85,224 | 90,362 | 93,676 | |||||||||||||||||||||||||||||||||
| Interest income | (13,190) | (10,696) | (7,015) | (3,421) | (1,460) | |||||||||||||||||||||||||||||||||
| Interest expense | 38,871 | 32,325 | 29,837 | 26,383 | 25,671 | |||||||||||||||||||||||||||||||||
Net Operating Income, as defined (2) |
189,270 | 184,725 | 193,396 | 198,584 | 208,425 | |||||||||||||||||||||||||||||||||
| Wholly-Owned Properties | 167,061 | 162,348 | 170,492 | 176,582 | 179,500 | |||||||||||||||||||||||||||||||||
Consolidated property partnerships: (3) |
||||||||||||||||||||||||||||||||||||||
100 First Street (4) |
5,958 | 6,561 | 6,782 | 6,075 | 6,011 | |||||||||||||||||||||||||||||||||
303 Second Street (4) |
10,794 | 10,099 | 10,243 | 9,706 | 17,247 | |||||||||||||||||||||||||||||||||
Crossing/900 (5) |
5,457 | 5,717 | 5,879 | 6,221 | 5,667 | |||||||||||||||||||||||||||||||||
Net Operating Income, as defined (2) |
189,270 | 184,725 | 193,396 | 198,584 | 208,425 | |||||||||||||||||||||||||||||||||
Non-Same Store Net Operating Income (6) |
(6,578) | (20,892) | (21,052) | (21,127) | (19,909) | |||||||||||||||||||||||||||||||||
| Same Store Net Operating Income | 182,692 | 163,833 | 172,344 | 177,457 | 188,516 | |||||||||||||||||||||||||||||||||
| Adjustments: | ||||||||||||||||||||||||||||||||||||||
| Amortization of deferred revenue related to tenant-funded tenant improvements | (6,190) | (5,215) | (4,384) | (4,461) | (4,517) | |||||||||||||||||||||||||||||||||
| Net effect of straight-line rents | 5,443 | 8,140 | 617 | (1,992) | (1,471) | |||||||||||||||||||||||||||||||||
| Amortization of net below market rents | (353) | (422) | (483) | (1,057) | (2,305) | |||||||||||||||||||||||||||||||||
| Lease related adjustments | (194) | 2,236 | (805) | (3,374) | 5,679 | |||||||||||||||||||||||||||||||||
Other (7) |
(1,147) | 1,144 | 432 | 1,003 | 436 | |||||||||||||||||||||||||||||||||
| Same Store Cash Net Operating Income | $ | 180,251 | $ | 169,716 | $ | 167,721 | $ | 167,576 | $ | 186,338 | ||||||||||||||||||||||||||||
Q1 2024 Supplemental Financial Report |
|||||
Three Months Ended (1) |
||||||||||||||||||||||||||||||||
| 12/31/2022 | 9/30/2022 | 6/30/2022 | 3/31/2022 | |||||||||||||||||||||||||||||
| Net Income Available to Common Stockholders | $ | 52,625 | $ | 79,757 | $ | 47,105 | $ | 53,128 | ||||||||||||||||||||||||
| Net income attributable to noncontrolling common units of the Operating Partnership | 588 | 664 | 515 | 516 | ||||||||||||||||||||||||||||
| Net income attributable to noncontrolling interests in consolidated property partnerships | 6,262 | 6,239 | 6,355 | 5,739 | ||||||||||||||||||||||||||||
| Net Income | 59,475 | 86,660 | 53,975 | 59,383 | ||||||||||||||||||||||||||||
| Adjustments: | ||||||||||||||||||||||||||||||||
| General and administrative expenses | 25,217 | 23,524 | 22,120 | 22,781 | ||||||||||||||||||||||||||||
| Leasing costs | 1,404 | 1,015 | 1,447 | 1,013 | ||||||||||||||||||||||||||||
| Depreciation and amortization | 91,396 | 81,140 | 96,415 | 88,660 | ||||||||||||||||||||||||||||
| Interest income | (1,264) | (295) | (125) | (81) | ||||||||||||||||||||||||||||
| Interest expense | 23,550 | 19,982 | 20,121 | 20,625 | ||||||||||||||||||||||||||||
| Gain on sale of depreciable operating property | — | (17,329) | — | — | ||||||||||||||||||||||||||||
Net Operating Income, as defined (2) |
199,778 | 194,697 | 193,953 | 192,381 | ||||||||||||||||||||||||||||
| Wholly-Owned Properties | 174,983 | 170,166 | 168,721 | 168,431 | ||||||||||||||||||||||||||||
Consolidated property partnerships: (3) |
||||||||||||||||||||||||||||||||
100 First Street (4) |
6,116 | 5,791 | 5,745 | 5,922 | ||||||||||||||||||||||||||||
303 Second Street (4) |
12,702 | 12,941 | 13,333 | 12,000 | ||||||||||||||||||||||||||||
Crossing/900 (5) |
5,977 | 5,799 | 6,154 | 6,028 | ||||||||||||||||||||||||||||
Net Operating Income, as defined (2) |
199,778 | 194,697 | 193,953 | 192,381 | ||||||||||||||||||||||||||||
Non-Same Store Net Operating Income (6) |
(16,435) | (13,335) | (12,239) | (10,440) | ||||||||||||||||||||||||||||
| Same Store Net Operating Income | 183,343 | 181,362 | 181,714 | 181,941 | ||||||||||||||||||||||||||||
| Adjustments: | ||||||||||||||||||||||||||||||||
| Amortization of deferred revenue related to tenant-funded tenant improvements | (4,607) | (4,646) | (4,631) | (4,009) | ||||||||||||||||||||||||||||
| Net effect of straight-line rents | (3,689) | (6,992) | (12,183) | (15,730) | ||||||||||||||||||||||||||||
| Amortization of net below market rents | (2,287) | (2,520) | (2,720) | (2,872) | ||||||||||||||||||||||||||||
| Lease related adjustments | (2,010) | (194) | 401 | 706 | ||||||||||||||||||||||||||||
Other (7) |
1,008 | 400 | 530 | 151 | ||||||||||||||||||||||||||||
| Same Store Cash Net Operating Income | $ | 171,758 | $ | 167,410 | $ | 163,111 | $ | 160,187 | ||||||||||||||||||||||||
Q1 2024 Supplemental Financial Report |
|||||
| Three Months Ended | ||||||||||||||||||||||||||||||||||||||
| 3/31/2024 | 12/31/2023 | 9/30/2023 | 6/30/2023 | 3/31/2023 | ||||||||||||||||||||||||||||||||||
| Net Income Available to Common Stockholders | $ | 49,920 | $ | 47,284 | $ | 52,762 | $ | 55,587 | $ | 56,608 | ||||||||||||||||||||||||||||
| Interest expense | 38,871 | 32,325 | 29,837 | 26,383 | 25,671 | |||||||||||||||||||||||||||||||||
| Depreciation and amortization | 88,031 | 86,016 | 85,224 | 90,362 | 93,676 | |||||||||||||||||||||||||||||||||
| Net income attributable to noncontrolling common units of the Operating Partnership | 502 | 471 | 515 | 537 | 560 | |||||||||||||||||||||||||||||||||
| Net income attributable to noncontrolling interests in consolidated property partnerships | 5,278 | 5,291 | 5,460 | 5,151 | 8,062 | |||||||||||||||||||||||||||||||||
EBITDA, as adjusted (1) |
182,602 | 171,387 | 173,798 | 178,020 | 184,577 | |||||||||||||||||||||||||||||||||
EBITDA, as adjusted (1), attributable to noncontrolling interests in consolidated property partnerships |
(8,660) | (8,328) | (8,390) | (8,162) | (11,559) | |||||||||||||||||||||||||||||||||
Company's share of EBITDA, as adjusted (1) |
$ | 173,942 | $ | 163,059 | $ | 165,408 | $ | 169,858 | $ | 173,018 | ||||||||||||||||||||||||||||
| Interest income | (13,190) | (10,696) | (7,015) | (3,421) | (1,460) | |||||||||||||||||||||||||||||||||
Company's share of EBITDA, as adjusted less interest income (1) |
$ | 160,752 | $ | 152,363 | $ | 158,393 | $ | 166,437 | $ | 171,558 | ||||||||||||||||||||||||||||
Q1 2024 Supplemental Financial Report |
|||||
| Three Months Ended | ||||||||||||||||||||||||||||||||||||||
| 3/31/2024 | 12/31/2023 | 9/30/2023 | 6/30/2023 | 3/31/2023 | ||||||||||||||||||||||||||||||||||
GAAP Net Cash Provided by Operating Activities |
$ | 167,869 | $ | 110,223 | $ | 208,816 | $ | 101,414 | $ | 182,136 | ||||||||||||||||||||||||||||
| Adjustments: | ||||||||||||||||||||||||||||||||||||||
| Recurring tenant improvements, leasing commissions and capital expenditures | (11,763) | (31,411) | (20,519) | (17,850) | (17,766) | |||||||||||||||||||||||||||||||||
| Depreciation of non-real estate furniture, fixtures and equipment | (1,571) | (1,614) | (1,706) | (1,889) | (2,005) | |||||||||||||||||||||||||||||||||
Net changes in operating assets and liabilities (1) |
(21,554) | 39,064 | (58,450) | 41,727 | (20,525) | |||||||||||||||||||||||||||||||||
Noncontrolling interests in consolidated property partnerships’ share of FFO and FAD |
(7,553) | (6,705) | (6,246) | (6,981) | (9,625) | |||||||||||||||||||||||||||||||||
| Cash adjustments related to investing and financing activities | (100) | (29) | (3,197) | 3,125 | 318 | |||||||||||||||||||||||||||||||||
Funds Available for Distribution (2) |
$ | 125,328 | $ | 109,528 | $ | 118,698 | $ | 119,546 | $ | 132,533 | ||||||||||||||||||||||||||||


| Contact: | FOR RELEASE: | ||||
| Eliott Trencher | May 2, 2024 | ||||
| Executive Vice President, | |||||
| Chief Financial Officer | |||||
| and Chief Investment Officer | |||||
| (310) 481-8587 | |||||
| or | |||||
| Bill Hutcheson | |||||
| Senior Vice President, | |||||
| Investor Relations & Capital Markets | |||||
| (415) 778-5678 | |||||
| Full Year 2024 Range as of February 2024 |
Full Year 2024 Range as of May 2024 |
||||||||||||||||||||||||||||
| Low End | High End | Low End | High End | ||||||||||||||||||||||||||
| $ and shares/units in thousands, except per share/unit amounts | |||||||||||||||||||||||||||||
| Net income available to common stockholders per share - diluted | $ | 1.45 | $ | 1.61 | $ | 1.46 | $ | 1.61 | |||||||||||||||||||||
Weighted average common shares outstanding - diluted (1) |
118,000 | 118,000 | 118,000 | 118,000 | |||||||||||||||||||||||||
| Net income available to common stockholders | $ | 171,000 | $ | 190,000 | $ | 172,500 | $ | 190,000 | |||||||||||||||||||||
| Adjustments: | |||||||||||||||||||||||||||||
| Net income attributable to noncontrolling common units of the Operating Partnership | 1,900 | 2,000 | 1,900 | 2,000 | |||||||||||||||||||||||||
| Net income attributable to noncontrolling interests in consolidated property partnerships | 20,500 | 21,000 | 20,500 | 21,000 | |||||||||||||||||||||||||
| Depreciation and amortization of real estate assets | 330,000 | 330,000 | 335,000 | 336,000 | |||||||||||||||||||||||||
| Gains on sales of depreciable real estate | — | — | — | — | |||||||||||||||||||||||||
| Funds From Operations attributable to noncontrolling interests in consolidated property partnerships | (30,000) | (32,000) | (31,000) | (32,000) | |||||||||||||||||||||||||
Funds From Operations (2) |
$ | 493,400 | $ | 511,000 | $ | 498,900 | $ | 517,000 | |||||||||||||||||||||
Weighted average common shares/units outstanding – diluted (3) |
120,250 | 120,250 | 120,250 | 120,250 | |||||||||||||||||||||||||
Funds From Operations per common share/unit – diluted (3) |
$ | 4.10 | $ | 4.25 | $ | 4.15 | $ | 4.30 | |||||||||||||||||||||
| Key Assumptions | February 2024 Assumptions | May 2024 Assumptions | ||||||||||||||||||
Change in same store cash NOI (4) |
(4.0%) to (6.0%) | (3.5%) to (5.5%) | ||||||||||||||||||
| Average full year occupancy | 82.5% to 84.0% | 82.5% to 84.0% | ||||||||||||||||||
| General and administrative expenses | $72 million to $80 million | $72 million to $80 million | ||||||||||||||||||
Total development spending (5) |
$200 million to $300 million | $200 million to $300 million | ||||||||||||||||||
|
Weighted average common shares/units outstanding – diluted
(in thousands) (3)
|
120,250 | 120,250 | ||||||||||||||||||
| Three Months Ended March 31, | |||||||||||
| 2024 | 2023 | ||||||||||
| Revenues | $ | 278,581 | $ | 292,802 | |||||||
| Net income available to common stockholders | $ | 49,920 | $ | 56,608 | |||||||
| Weighted average common shares outstanding – basic | 117,338 | 117,059 | |||||||||
| Weighted average common shares outstanding – diluted | 117,961 | 117,407 | |||||||||
| Net income available to common stockholders per share – basic | $ | 0.42 | $ | 0.48 | |||||||
| Net income available to common stockholders per share – diluted | $ | 0.42 | $ | 0.48 | |||||||
Funds From Operations (1)(2) |
$ | 133,723 | $ | 145,959 | |||||||
Weighted average common shares/units outstanding – basic (3) |
119,660 | 118,818 | |||||||||
Weighted average common shares/units outstanding – diluted (4) |
120,283 | 119,165 | |||||||||
Funds From Operations per common share/unit – basic (2) |
$ | 1.12 | $ | 1.23 | |||||||
Funds From Operations per common share/unit – diluted (2) |
$ | 1.11 | $ | 1.22 | |||||||
| Common shares outstanding at end of period | 117,366 | 117,121 | |||||||||
| Common partnership units outstanding at end of period | 1,151 | 1,151 | |||||||||
| Total common shares and units outstanding at end of period | 118,517 | 118,272 | |||||||||
| March 31, 2024 | March 31, 2023 | ||||||||||
Stabilized office portfolio occupancy rates: (5) |
|||||||||||
| Los Angeles | 76.5 | % | 80.8 | % | |||||||
| San Diego | 87.9 | % | 85.9 | % | |||||||
| San Francisco Bay Area | 89.9 | % | 94.7 | % | |||||||
| Seattle | 83.6 | % | 95.3 | % | |||||||
| Austin | 71.5 | % | — | % | |||||||
| Weighted average total | 84.2 | % | 89.6 | % | |||||||
Total square feet of stabilized office properties owned at end of period: (5) |
|||||||||||
| Los Angeles | 4,338 | 4,344 | |||||||||
| San Diego | 2,776 | 2,698 | |||||||||
| San Francisco Bay Area | 6,170 | 6,164 | |||||||||
| Seattle | 3,000 | 3,000 | |||||||||
| Austin | 759 | — | |||||||||
| Total | 17,043 | 16,206 | |||||||||
| March 31, 2024 | December 31, 2023 | ||||||||||
| ASSETS | |||||||||||
| REAL ESTATE ASSETS: | |||||||||||
| Land and improvements | $ | 1,743,170 | $ | 1,743,170 | |||||||
| Buildings and improvements | 8,479,359 | 8,463,674 | |||||||||
| Undeveloped land and construction in progress | 2,114,242 | 2,034,804 | |||||||||
| Total real estate assets held for investment | 12,336,771 | 12,241,648 | |||||||||
| Accumulated depreciation and amortization | (2,594,996) | (2,518,304) | |||||||||
| Total real estate assets held for investment, net | 9,741,775 | 9,723,344 | |||||||||
| Cash and cash equivalents | 855,007 | 510,163 | |||||||||
| Marketable securities | 109,513 | 284,670 | |||||||||
| Current receivables, net | 13,291 | 13,609 | |||||||||
| Deferred rent receivables, net | 457,494 | 460,979 | |||||||||
| Deferred leasing costs and acquisition-related intangible assets, net | 226,506 | 229,705 | |||||||||
| Right of use ground lease assets | 130,026 | 125,506 | |||||||||
| Prepaid expenses and other assets, net | 65,588 | 53,069 | |||||||||
| TOTAL ASSETS | $ | 11,599,200 | $ | 11,401,045 | |||||||
| LIABILITIES AND EQUITY | |||||||||||
| LIABILITIES: | |||||||||||
| Secured debt, net | $ | 601,990 | $ | 603,225 | |||||||
| Unsecured debt, net | 4,518,297 | 4,325,153 | |||||||||
| Accounts payable, accrued expenses and other liabilities | 401,892 | 371,179 | |||||||||
| Ground lease liabilities | 128,966 | 124,353 | |||||||||
| Accrued dividends and distributions | 65,111 | 64,440 | |||||||||
| Deferred revenue and acquisition-related intangible liabilities, net | 166,436 | 173,638 | |||||||||
| Rents received in advance and tenant security deposits | 73,777 | 79,364 | |||||||||
| Total liabilities | 5,956,469 | 5,741,352 | |||||||||
| EQUITY: | |||||||||||
| Stockholders’ Equity | |||||||||||
| Common stock | 1,174 | 1,173 | |||||||||
| Additional paid-in capital | 5,208,753 | 5,205,839 | |||||||||
| Retained earnings | 203,080 | 221,149 | |||||||||
| Total stockholders’ equity | 5,413,007 | 5,428,161 | |||||||||
| Noncontrolling Interests | |||||||||||
| Common units of the Operating Partnership | 53,087 | 53,275 | |||||||||
| Noncontrolling interests in consolidated property partnerships | 176,637 | 178,257 | |||||||||
| Total noncontrolling interests | 229,724 | 231,532 | |||||||||
| Total equity | 5,642,731 | 5,659,693 | |||||||||
| TOTAL LIABILITIES AND EQUITY | $ | 11,599,200 | $ | 11,401,045 | |||||||
| Three Months Ended March 31, | |||||||||||
| 2024 | 2023 | ||||||||||
| REVENUES | |||||||||||
| Rental income | $ | 274,890 | $ | 290,104 | |||||||
| Other property income | 3,691 | 2,698 | |||||||||
| Total revenues | 278,581 | 292,802 | |||||||||
| EXPENSES | |||||||||||
| Property expenses | 57,320 | 53,780 | |||||||||
| Real estate taxes | 29,239 | 28,228 | |||||||||
| Ground leases | 2,752 | 2,369 | |||||||||
General and administrative expenses (1) |
17,579 | 23,936 | |||||||||
| Leasing costs | 2,279 | 1,372 | |||||||||
| Depreciation and amortization | 88,031 | 93,676 | |||||||||
| Total expenses | 197,200 | 203,361 | |||||||||
| OTHER INCOME (EXPENSES) | |||||||||||
| Interest income | 13,190 | 1,460 | |||||||||
| Interest expense | (38,871) | (25,671) | |||||||||
| Total other expenses | (25,681) | (24,211) | |||||||||
| NET INCOME | 55,700 | 65,230 | |||||||||
| Net income attributable to noncontrolling common units of the Operating Partnership | (502) | (560) | |||||||||
| Net income attributable to noncontrolling interests in consolidated property partnerships | (5,278) | (8,062) | |||||||||
| Total income attributable to noncontrolling interests | (5,780) | (8,622) | |||||||||
| NET INCOME AVAILABLE TO COMMON STOCKHOLDERS | $ | 49,920 | $ | 56,608 | |||||||
| Weighted average shares of common stock outstanding – basic | 117,338 | 117,059 | |||||||||
| Weighted average shares of common stock outstanding – diluted | 117,961 | 117,407 | |||||||||
| Net income available to common stockholders per share – basic | $ | 0.42 | $ | 0.48 | |||||||
| Net income available to common stockholders per share – diluted | $ | 0.42 | $ | 0.48 | |||||||
| Three Months Ended March 31, | |||||||||||
| 2024 | 2023 | ||||||||||
| Net income available to common stockholders | $ | 49,920 | $ | 56,608 | |||||||
| Adjustments: | |||||||||||
| Net income attributable to noncontrolling common units of the Operating Partnership | 502 | 560 | |||||||||
| Net income attributable to noncontrolling interests in consolidated property partnerships | 5,278 | 8,062 | |||||||||
| Depreciation and amortization of real estate assets | 86,460 | 91,671 | |||||||||
| Funds From Operations attributable to noncontrolling interests in consolidated property partnerships | (8,437) | (10,942) | |||||||||
Funds From Operations(1)(2)(3) |
$ | 133,723 | $ | 145,959 | |||||||
Weighted average common shares/units outstanding – basic (4) |
119,660 | 118,818 | |||||||||
Weighted average common shares/units outstanding – diluted (5) |
120,283 | 119,165 | |||||||||
Funds From Operations per common share/unit – basic (2) |
$ | 1.12 | $ | 1.23 | |||||||
Funds From Operations per common share/unit – diluted (2) |
$ | 1.11 | $ | 1.22 | |||||||