| Maryland | 001-12675 | 95-4598246 | |||||||||
| (State or other jurisdiction of incorporation or organization) |
(Commission File No.) | (I.R.S. Employer Identification No.) |
|||||||||
| (Registrant's telephone number, including area code) | ||||||||
| N/A | ||||||||
| (Former name, former address and former fiscal year, if changed since last report) | ||||||||
| Securities registered pursuant to Section 12(b) of the Act: | |||||||||||
| Registrant | Title of each class | Name of each exchange on which registered | Ticker Symbol | ||||||||
| Kilroy Realty Corporation | Common Stock, $.01 par value | New York Stock Exchange | KRC | ||||||||
| ☐ | Written communications pursuant to Rule 425 under the Securities Act (17 CFR 230.425) | ||||
| ☐ | Soliciting material pursuant to Rule 14a-12 under the Exchange Act (17 CFR 240.14a-12) | ||||
| ☐ | Pre-commencement communications pursuant to Rule 14d-2(b) under the Exchange Act (17 CFR 240.14d-2(b)) | ||||
| ☐ | Pre-commencement communications pursuant to Rule 13e-4(c) under the Exchange Act (17 CFR 240.13e-4(c)) | ||||
| (a) | Financial statements of businesses acquired: None. |
|||||||
| (b) | Pro forma financial information: None. | |||||||
| (c) | Shell company transactions: None. | |||||||
| (d) | Exhibits: | |||||||
| Exhibit No. | Description | |||||||
| 99.1** | ||||||||
| 99.2** | ||||||||
| 104 | Cover Page Interactive Data File (embedded within the Inline XBRL document) | |||||||
| Kilroy Realty Corporation | ||||||||||||||||||||
| Date: April 26, 2023 | ||||||||||||||||||||
| By: | /s/ Merryl E. Werber | |||||||||||||||||||
| Merryl E. Werber Senior Vice President, Chief Accounting Officer and Controller |
||||||||||||||||||||

Q1 2023 Supplemental Financial Report |
|||||


Q1 2023 Supplemental Financial Report |
|||||
| Board of Directors | Executive and Senior Management Team | Investor Relations | ||||||||||||||||||
| John Kilroy | Chairman | John Kilroy | Chief Executive Officer | 12200 W. Olympic Blvd., Suite 200 Los Angeles, CA 90064 (310) 481-8400 Web: www.kilroyrealty.com E-mail: investorrelations@kilroyrealty.com |
||||||||||||||||
| Edward F. Brennan, PhD | Lead Independent | Justin W. Smart | President | |||||||||||||||||
| Jolie Hunt | Eliott Trencher | Executive VP, Chief Financial Officer and Chief Investment Officer | ||||||||||||||||||
| Scott S. Ingraham | ||||||||||||||||||||
| Louisa G. Ritter | Robert Paratte | Executive VP, Chief Leasing Officer and Senior Advisor to the Chairman | ||||||||||||||||||
| Gary R. Stevenson | ||||||||||||||||||||
| Peter B. Stoneberg | Heidi R. Roth | Executive VP, Chief Administrative Officer | Bill Hutcheson |
|||||||||||||||||
| John Osmond | Executive VP, Head of Asset Management | Senior VP, Investor Relations & Capital Markets | ||||||||||||||||||
| Merryl Werber | Senior VP, Chief Accounting Officer and Controller | |||||||||||||||||||
| Equity Research Coverage | ||||||||||||||
| BofA Securities | Green Street Advisors | |||||||||||||
| Camille Bonnel | (416) 369-2140 | Dylan Burzinski | (949) 640-8780 | |||||||||||
| BMO Capital Markets Corp. | Jefferies LLC | |||||||||||||
| John P. Kim | (212) 885-4115 | Peter Abramowitz | (212) 336-7241 | |||||||||||
| BTIG | J.P. Morgan | |||||||||||||
| Thomas Catherwood | (212) 738-6140 | Anthony Paolone | (212) 622-6682 | |||||||||||
| Citigroup Investment Research | Mizuho Securities USA LLC | |||||||||||||
| Michael Griffin | (212) 816-5871 | Vikram Malhotra | (212) 282-3827 | |||||||||||
| Credit Suisse | RBC Capital Markets | |||||||||||||
| Tayo Okusanya | (212) 325-1402 | Mike Carroll | (440) 715-2649 | |||||||||||
| Deutsche Bank Securities, Inc. | Scotiabank | |||||||||||||
| Derek Johnston | (210) 250-5683 | Nicholas Yulico | (212) 225-6904 | |||||||||||
| Evercore ISI | Wells Fargo | |||||||||||||
| Steve Sakwa | (212) 446-9462 | Blaine Heck | (443) 263-6529 | |||||||||||
| Goldman Sachs & Co. LLC | Wolfe Research | |||||||||||||
| Caitlin Burrows | (212) 902-4736 | Andrew Rosivach | (646) 582-9250 | |||||||||||
Q1 2023 Supplemental Financial Report |
|||||
| Quarterly Financial Highlights | Quarterly Operating Highlights | |||||||
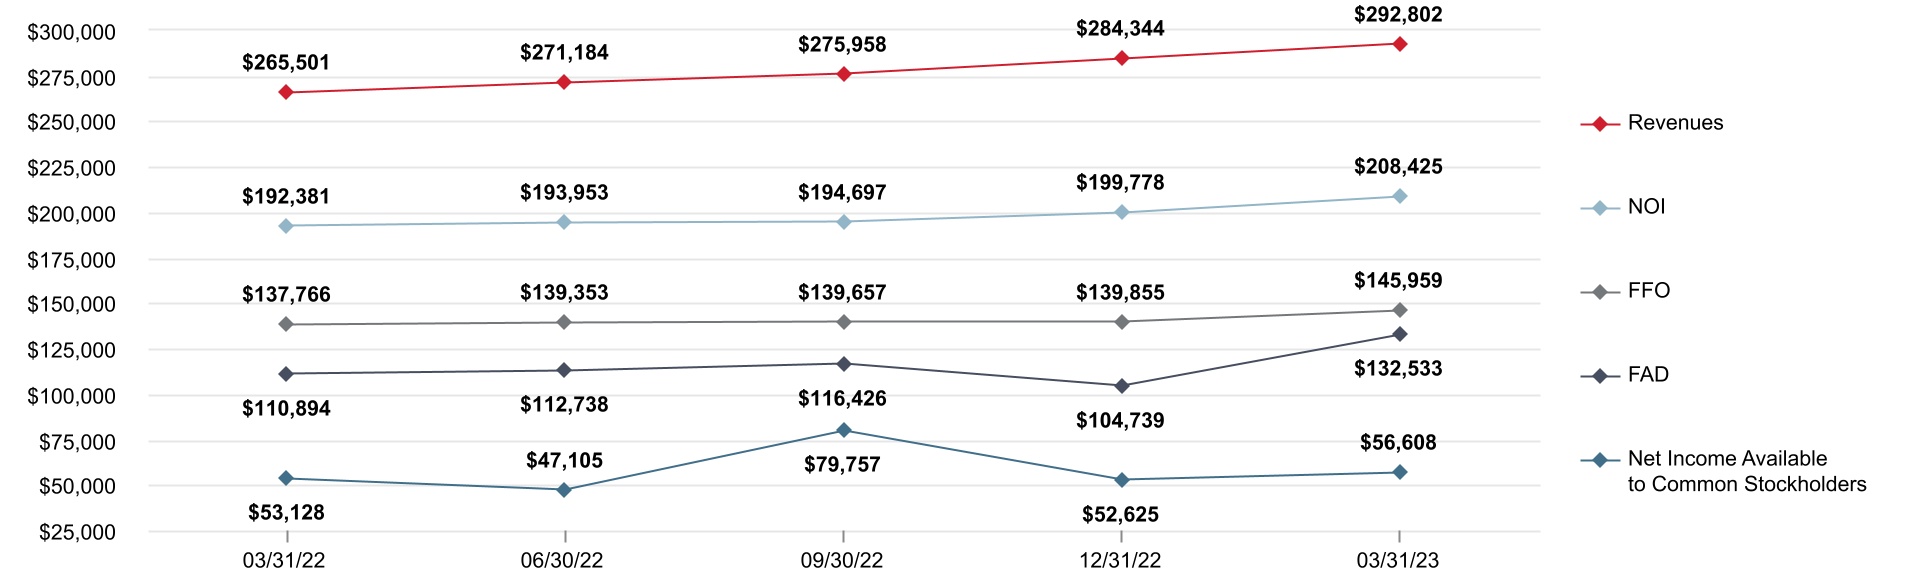
• Revenues grew approximately 10.3% to $292.8 million compared to the prior year |
• Stabilized portfolio was 89.6% occupied and 91.6% leased at quarter-end |
|||||||
• Net income available to common stockholders per diluted share of $0.48, an |
• Approximately 151,000 square feet of leases commenced in the stabilized |
|||||||
increase of approximately 6.7% compared to the prior year |
portfolio | |||||||
• FFO per diluted share of $1.22, an increase of approximately 5.2% compared |
• Approximately 286,000 square feet of leases executed in the stabilized portfolio |
|||||||
| to the prior year | ||||||||
◦GAAP rents increased approximately 4.2% from prior levels |
||||||||
• Same Store NOI and Same Store Cash NOI increased 3.6% and 16.3%, |
||||||||
| respectively, compared to the prior year | ◦Cash rents decreased approximately 4.4% from prior levels |
|||||||
◦Same Store NOI and Same Store Cash NOI includes $5.8 million and $12.1 |
• In April, signed approximately 52,000 square feet of leases, including an | |||||||
| million of non-recurring restoration fees, respectively. Prior year Same | approximately 20,000 square foot lease at Indeed Tower | |||||||
| Store NOI and Same Store Cash NOI includes $2.5 and $0.8 million of | ||||||||
| non-recurring income, respectively | ||||||||
| Capital Markets Highlights | Strategic Highlights | |||||||
| • As of the date of this report, approximately $1.6 billion of total liquidity comprised | • In April, completed construction of the core and shell of an approximately 71,000 | |||||||
| of approximately $330.0 million of cash and cash equivalents, $170.0 million | square foot office building in the University Towne Center submarket of San Diego | |||||||
| available under the unsecured term loan facility and full availability under the $1.1 | and moved the property into the tenant improvement phase. The building is 100% | |||||||
| billion unsecured revolving credit facility | leased | |||||||
| • During the quarter, amended the unsecured term loan facility to increase the | ||||||||
| capacity to $520.0 million. The Company has drawn a total of $350.0 million to | ||||||||
| date, including $150.0 million towards the end of March as per the terms of the | ||||||||
| agreement | ||||||||
Q1 2023 Supplemental Financial Report |
|||||
| Three Months Ended | |||||||||||||||||||||||||||||||||||
| 3/31/2022 | 6/30/2022 | 9/30/2022 (1) |
12/31/2022 | 3/31/2023 | |||||||||||||||||||||||||||||||
| INCOME ITEMS AND DIVIDENDS: | |||||||||||||||||||||||||||||||||||
| Capitalized Interest and Debt Costs | $ | 19,098 | $ | 19,491 | $ | 19,677 | $ | 19,216 | $ | 17,731 | |||||||||||||||||||||||||
Cash Lease Termination Fees (2) |
$ | 637 | $ | 374 | $ | 165 | $ | 503 | $ | — | |||||||||||||||||||||||||
Net Income Available to Common Stockholders per common share – diluted (3) |
$ | 0.45 | $ | 0.40 | $ | 0.68 | $ | 0.45 | $ | 0.48 | |||||||||||||||||||||||||
Funds From Operations per common share – diluted (4) |
$ | 1.16 | $ | 1.17 | $ | 1.17 | $ | 1.17 | $ | 1.22 | |||||||||||||||||||||||||
Dividends per common share (3) |
$ | 0.52 | $ | 0.52 | $ | 0.54 | $ | 0.54 | $ | 0.54 | |||||||||||||||||||||||||
EBITDA, as adjusted (5) |
$ | 168,668 | $ | 170,511 | $ | 170,453 | $ | 174,421 | $ | 184,577 | |||||||||||||||||||||||||
| RATIOS: | |||||||||||||||||||||||||||||||||||
| Net Operating Income Margins | 72.5 | % | 71.5 | % | 70.6 | % | 70.3 | % | 71.2 | % | |||||||||||||||||||||||||
| Fixed Charge Coverage Ratio - Net Income | 1.6x | 1.4x | 2.3x | 1.5x | 1.6x | ||||||||||||||||||||||||||||||
| Fixed Charge Coverage Ratio - EBITDA | 4.5x | 4.6x | 4.5x | 4.4x | 4.6x | ||||||||||||||||||||||||||||||
| Net Income Payout Ratio | 103.2 | % | 113.7 | % | 73.5 | % | 107.2 | % | 97.9 | % | |||||||||||||||||||||||||
| FFO Payout Ratio | 44.5 | % | 44.0 | % | 45.6 | % | 45.6 | % | 43.8 | % | |||||||||||||||||||||||||
| FAD Payout Ratio | 55.3 | % | 54.4 | % | 54.7 | % | 60.9 | % | 48.2 | % | |||||||||||||||||||||||||
Q1 2023 Supplemental Financial Report |
|||||
| Full Year 2023 Range | ||||||||||||||||||||
| Low End | High End | |||||||||||||||||||
| Net income available to common stockholders per share - diluted | $ | 1.60 | $ | 1.79 | ||||||||||||||||
Weighted average common shares outstanding - diluted (1) |
117,500 | 117,500 | ||||||||||||||||||
| Net income available to common stockholders | $ | 188,000 | $ | 210,000 | ||||||||||||||||
| Adjustments: | ||||||||||||||||||||
| Net income attributable to noncontrolling common units of the Operating Partnership | 1,800 | 2,300 | ||||||||||||||||||
| Net income attributable to noncontrolling interests in consolidated property partnerships | 23,500 | 25,500 | ||||||||||||||||||
| Depreciation and amortization of real estate assets | 335,000 | 335,000 | ||||||||||||||||||
| Gains on sales of depreciable real estate | — | — | ||||||||||||||||||
| Funds From Operations attributable to noncontrolling interests in consolidated property partnerships | (35,000) | (36,000) | ||||||||||||||||||
Funds From Operations (2) |
$ | 513,300 | $ | 536,800 | ||||||||||||||||
Weighted average common shares and units outstanding - diluted (3) |
119,400 | 119,400 | ||||||||||||||||||
FFO per common share/unit - diluted (3) |
$ | 4.30 | $ | 4.50 | ||||||||||||||||
| Key Assumptions | February 2023 Assumptions | Updated 2023 Assumptions | ||||||||||||||||||
Same Store Cash NOI growth (2) |
0.0% to 2.0% | 0.0% to 2.0% | ||||||||||||||||||
| Average occupancy | 86.5% to 88.0% | 86.5% to 88.0% | ||||||||||||||||||
| General & administrative expenses | $82 million to $90 million | $82 million to $90 million | ||||||||||||||||||
Executive retirement costs (4) |
— | $8 million to $14 million | ||||||||||||||||||
Total development spending (5) |
$450 million to $550 million | $400 million to $500 million | ||||||||||||||||||
| Dispositions | $0 to $200 million | $0 to $200 million | ||||||||||||||||||
Q1 2023 Supplemental Financial Report |
|||||
| 3/31/2023 | 12/31/2022 | 9/30/2022 | 6/30/2022 | 3/31/2022 | |||||||||||||||||||||||||||||||
| ASSETS: | |||||||||||||||||||||||||||||||||||
| Land and improvements | $ | 1,738,242 | $ | 1,738,242 | $ | 1,743,194 | $ | 1,713,152 | $ | 1,715,192 | |||||||||||||||||||||||||
| Buildings and improvements | 8,335,285 | 8,302,081 | 7,693,247 | 7,530,547 | 7,509,311 | ||||||||||||||||||||||||||||||
| Undeveloped land and construction in progress | 1,788,542 | 1,691,860 | 2,183,071 | 2,272,508 | 2,158,279 | ||||||||||||||||||||||||||||||
| Total real estate assets held for investment | 11,862,069 | 11,732,183 | 11,619,512 | 11,516,207 | 11,382,782 | ||||||||||||||||||||||||||||||
| Accumulated depreciation and amortization | (2,294,202) | (2,218,710) | (2,150,060) | (2,104,990) | (2,034,193) | ||||||||||||||||||||||||||||||
| Total real estate assets held for investment, net | 9,567,867 | 9,513,473 | 9,469,452 | 9,411,217 | 9,348,589 | ||||||||||||||||||||||||||||||
| Cash and cash equivalents | 476,358 | 347,379 | 249,981 | 210,044 | 331,685 | ||||||||||||||||||||||||||||||
| Restricted cash | — | — | 13,009 | 13,008 | 13,007 | ||||||||||||||||||||||||||||||
| Marketable securities | 23,288 | 23,547 | 22,390 | 22,988 | 25,829 | ||||||||||||||||||||||||||||||
| Current receivables, net | 15,926 | 20,583 | 15,885 | 13,268 | 12,107 | ||||||||||||||||||||||||||||||
| Deferred rent receivables, net | 457,870 | 452,200 | 442,987 | 435,549 | 420,895 | ||||||||||||||||||||||||||||||
| Deferred leasing costs and acquisition-related intangible assets, net | 238,184 | 250,846 | 214,484 | 217,026 | 228,426 | ||||||||||||||||||||||||||||||
| Right of use ground lease assets | 126,277 | 126,530 | 126,708 | 126,587 | 126,946 | ||||||||||||||||||||||||||||||
| Prepaid expenses and other assets, net | 63,622 | 62,429 | 65,096 | 65,554 | 57,338 | ||||||||||||||||||||||||||||||
| TOTAL ASSETS | $ | 10,969,392 | $ | 10,796,987 | $ | 10,619,992 | $ | 10,515,241 | $ | 10,564,822 | |||||||||||||||||||||||||
| LIABILITIES AND EQUITY: | |||||||||||||||||||||||||||||||||||
| Liabilities: | |||||||||||||||||||||||||||||||||||
| Secured debt, net | $ | 241,547 | $ | 242,938 | $ | 244,316 | $ | 245,680 | $ | 247,030 | |||||||||||||||||||||||||
| Unsecured debt, net | 4,171,029 | 4,020,058 | 3,823,532 | 3,822,482 | 3,821,433 | ||||||||||||||||||||||||||||||
| Accounts payable, accrued expenses and other liabilities | 418,902 | 392,360 | 424,087 | 357,253 | 391,920 | ||||||||||||||||||||||||||||||
| Ground lease liabilities | 124,837 | 124,994 | 125,065 | 125,277 | 125,414 | ||||||||||||||||||||||||||||||
| Accrued dividends and distributions | 64,461 | 64,285 | 64,271 | 61,880 | 61,951 | ||||||||||||||||||||||||||||||
| Deferred revenue and acquisition-related intangible liabilities, net | 195,629 | 195,959 | 176,105 | 176,845 | 171,121 | ||||||||||||||||||||||||||||||
| Rents received in advance and tenant security deposits | 80,565 | 81,432 | 82,839 | 73,273 | 80,192 | ||||||||||||||||||||||||||||||
| Total liabilities | 5,296,970 | 5,122,026 | 4,940,215 | 4,862,690 | 4,899,061 | ||||||||||||||||||||||||||||||
| Equity: | |||||||||||||||||||||||||||||||||||
| Stockholders’ Equity | |||||||||||||||||||||||||||||||||||
| Common stock | 1,171 | 1,169 | 1,169 | 1,169 | 1,167 | ||||||||||||||||||||||||||||||
| Additional paid-in capital | 5,175,402 | 5,170,760 | 5,162,088 | 5,151,705 | 5,149,968 | ||||||||||||||||||||||||||||||
| Retained earnings | 257,079 | 265,118 | 276,138 | 260,020 | 274,193 | ||||||||||||||||||||||||||||||
| Total stockholders’ equity | 5,433,652 | 5,437,047 | 5,439,395 | 5,412,894 | 5,425,328 | ||||||||||||||||||||||||||||||
| Noncontrolling Interests | |||||||||||||||||||||||||||||||||||
| Common units of the Operating Partnership | 53,386 | 53,524 | 53,475 | 53,289 | 53,472 | ||||||||||||||||||||||||||||||
| Noncontrolling interests in consolidated property partnerships | 185,384 | 184,390 | 186,907 | 186,368 | 186,961 | ||||||||||||||||||||||||||||||
| Total noncontrolling interests | 238,770 | 237,914 | 240,382 | 239,657 | 240,433 | ||||||||||||||||||||||||||||||
| Total equity | 5,672,422 | 5,674,961 | 5,679,777 | 5,652,551 | 5,665,761 | ||||||||||||||||||||||||||||||
| TOTAL LIABILITIES AND EQUITY | $ | 10,969,392 | $ | 10,796,987 | $ | 10,619,992 | $ | 10,515,241 | $ | 10,564,822 | |||||||||||||||||||||||||
Q1 2023 Supplemental Financial Report |
|||||
| Three Months Ended March 31, | ||||||||||||||||||||
| 2023 | 2022 | |||||||||||||||||||
| REVENUES | ||||||||||||||||||||
| Rental income | $ | 290,104 | $ | 263,208 | ||||||||||||||||
| Other property income | 2,698 | 2,293 | ||||||||||||||||||
| Total revenues | 292,802 | 265,501 | ||||||||||||||||||
| EXPENSES | ||||||||||||||||||||
| Property expenses | 53,780 | 45,424 | ||||||||||||||||||
| Real estate taxes | 28,228 | 25,870 | ||||||||||||||||||
| Ground leases | 2,369 | 1,826 | ||||||||||||||||||
| General and administrative expenses | 23,936 | 22,781 | ||||||||||||||||||
| Leasing costs | 1,372 | 1,013 | ||||||||||||||||||
| Depreciation and amortization | 93,676 | 88,660 | ||||||||||||||||||
| Total expenses | 203,361 | 185,574 | ||||||||||||||||||
| OTHER INCOME (EXPENSES) | ||||||||||||||||||||
| Interest and other income, net | 1,460 | 81 | ||||||||||||||||||
| Interest expense | (25,671) | (20,625) | ||||||||||||||||||
| Total other expenses | (24,211) | (20,544) | ||||||||||||||||||
| NET INCOME | 65,230 | 59,383 | ||||||||||||||||||
| Net income attributable to noncontrolling common units of the Operating Partnership | (560) | (516) | ||||||||||||||||||
| Net income attributable to noncontrolling interests in consolidated property partnerships | (8,062) | (5,739) | ||||||||||||||||||
| Total income attributable to noncontrolling interests | (8,622) | (6,255) | ||||||||||||||||||
| NET INCOME AVAILABLE TO COMMON STOCKHOLDERS | $ | 56,608 | $ | 53,128 | ||||||||||||||||
| Weighted average common shares outstanding – basic | 117,059 | 116,650 | ||||||||||||||||||
| Weighted average common shares outstanding – diluted | 117,407 | 117,060 | ||||||||||||||||||
| NET INCOME AVAILABLE TO COMMON STOCKHOLDERS PER SHARE | ||||||||||||||||||||
| Net income available to common stockholders per share – basic | $ | 0.48 | $ | 0.45 | ||||||||||||||||
| Net income available to common stockholders per share – diluted | $ | 0.48 | $ | 0.45 | ||||||||||||||||
Q1 2023 Supplemental Financial Report |
|||||
| Three Months Ended March 31, | ||||||||||||||||||||
| 2023 | 2022 | |||||||||||||||||||
FUNDS FROM OPERATIONS: (1) |
||||||||||||||||||||
| Net income available to common stockholders | $ | 56,608 | $ | 53,128 | ||||||||||||||||
| Adjustments: | ||||||||||||||||||||
| Net income attributable to noncontrolling common units of the Operating Partnership | 560 | 516 | ||||||||||||||||||
| Net income attributable to noncontrolling interests in consolidated property partnerships | 8,062 | 5,739 | ||||||||||||||||||
| Depreciation and amortization of real estate assets | 91,671 | 87,001 | ||||||||||||||||||
| Funds From Operations attributable to noncontrolling interests in consolidated property partnerships | (10,942) | (8,618) | ||||||||||||||||||
Funds From Operations (1)(2) |
$ | 145,959 | $ | 137,766 | ||||||||||||||||
Weighted average common shares/units outstanding – basic (3) |
118,818 | 118,628 | ||||||||||||||||||
Weighted average common shares/units outstanding – diluted (4) |
119,165 | 119,038 | ||||||||||||||||||
FFO per common share/unit – basic (1) |
$ | 1.23 | $ | 1.16 | ||||||||||||||||
FFO per common share/unit – diluted (1) |
$ | 1.22 | $ | 1.16 | ||||||||||||||||
FUNDS AVAILABLE FOR DISTRIBUTION: (1) |
||||||||||||||||||||
Funds From Operations (1)(2) |
$ | 145,959 | $ | 137,766 | ||||||||||||||||
| Adjustments: | ||||||||||||||||||||
| Recurring tenant improvements, leasing commissions and capital expenditures | (17,766) | (13,285) | ||||||||||||||||||
Amortization of deferred revenue related to tenant-funded tenant improvements (2)(5) |
(5,185) | (4,261) | ||||||||||||||||||
| Net effect of straight-line rents | (5,619) | (15,230) | ||||||||||||||||||
Amortization of net below market rents (6) |
(3,033) | (2,892) | ||||||||||||||||||
| Amortization of deferred financing costs and net debt discount/premium | 1,355 | 821 | ||||||||||||||||||
| Non-cash amortization of share-based compensation awards | 10,043 | 5,256 | ||||||||||||||||||
Lease related adjustments, leasing costs and other (7) |
5,462 | 1,264 | ||||||||||||||||||
| Adjustments attributable to noncontrolling interests in consolidated property partnerships | 1,317 | 1,455 | ||||||||||||||||||
Funds Available for Distribution (1) |
$ | 132,533 | $ | 110,894 | ||||||||||||||||
Q1 2023 Supplemental Financial Report |
|||||
| Three Months Ended March 31, | ||||||||||||||||||||
| 2023 | 2022 | |||||||||||||||||||
GAAP Net Cash Provided by Operating Activities |
$ | 182,136 | $ | 178,659 | ||||||||||||||||
| Adjustments: | ||||||||||||||||||||
| Recurring tenant improvements, leasing commissions and capital expenditures | (17,766) | (13,285) | ||||||||||||||||||
| Depreciation of non-real estate furniture, fixtures and equipment | (2,005) | (1,659) | ||||||||||||||||||
Net changes in operating assets and liabilities (1) |
(20,525) | (40,821) | ||||||||||||||||||
Noncontrolling interests in consolidated property partnerships’ share of FFO and FAD |
(9,625) | (7,163) | ||||||||||||||||||
| Cash adjustments related to investing and financing activities | 318 | (4,837) | ||||||||||||||||||
Funds Available for Distribution (2) |
$ | 132,533 | $ | 110,894 | ||||||||||||||||
Q1 2023 Supplemental Financial Report |
|||||
| Three Months Ended March 31, | ||||||||||||||||||||||||||
| 2023 | 2022 | % Change | ||||||||||||||||||||||||
| Operating Revenues: | ||||||||||||||||||||||||||
Rental income (2) |
$ | 243,507 | $ | 226,272 | 7.6 | % | ||||||||||||||||||||
Tenant reimbursements (2) |
46,597 | 36,936 | 26.2 | % | ||||||||||||||||||||||
| Other property income | 2,698 | 2,293 | 17.7 | % | ||||||||||||||||||||||
| Total operating revenues | 292,802 | 265,501 | 10.3 | % | ||||||||||||||||||||||
| Operating Expenses: | ||||||||||||||||||||||||||
| Property expenses | 53,780 | 45,424 | 18.4 | % | ||||||||||||||||||||||
| Real estate taxes | 28,228 | 25,870 | 9.1 | % | ||||||||||||||||||||||
| Ground leases | 2,369 | 1,826 | 29.7 | % | ||||||||||||||||||||||
| Total operating expenses | 84,377 | 73,120 | 15.4 | % | ||||||||||||||||||||||
| Net Operating Income | $ | 208,425 | $ | 192,381 | 8.3 | % | ||||||||||||||||||||


Q1 2023 Supplemental Financial Report |
|||||
| Three Months Ended March 31, | ||||||||||||||||||||||||||
| 2023 | 2022 | % Change | ||||||||||||||||||||||||
| Total Same Store Portfolio | ||||||||||||||||||||||||||
| Office Portfolio | ||||||||||||||||||||||||||
| Number of properties | 115 | 115 | ||||||||||||||||||||||||
| Square Feet | 15,056,915 | 15,056,915 | ||||||||||||||||||||||||
| Percent of Stabilized Portfolio | 92.9 | % | 98.9 | % | ||||||||||||||||||||||
| Average Occupancy | 90.5 | % | 91.6 | % | ||||||||||||||||||||||
| Operating Revenues: | ||||||||||||||||||||||||||
Rental income (2) |
$ | 221,363 | $ | 214,438 | 3.2 | % | ||||||||||||||||||||
Tenant reimbursements (2) |
41,892 | 35,282 | 18.7 | % | ||||||||||||||||||||||
| Other property income | 2,409 | 2,015 | 19.6 | % | ||||||||||||||||||||||
Total operating revenues (3) |
265,664 | 251,735 | 5.5 | % | ||||||||||||||||||||||
| Operating Expenses: | ||||||||||||||||||||||||||
| Property expenses | 50,717 | 43,559 | 16.4 | % | ||||||||||||||||||||||
| Real estate taxes | 24,577 | 24,497 | 0.3 | % | ||||||||||||||||||||||
| Ground leases | 1,854 | 1,738 | 6.7 | % | ||||||||||||||||||||||
| Total operating expenses | 77,148 | 69,794 | 10.5 | % | ||||||||||||||||||||||
Net Operating Income (4) |
$ | 188,516 | $ | 181,941 | 3.6 | % | ||||||||||||||||||||
| Same Store Analysis (Cash Basis) | ||||||||||||||||||||||||||
| Three Months Ended March 31, | ||||||||||||||||||||||||||
| 2023 | 2022 | % Change | ||||||||||||||||||||||||
Total operating revenues (5) |
$ | 263,386 | $ | 229,870 | 14.6 | % | ||||||||||||||||||||
| Total operating expenses | 77,048 | 69,683 | 10.6 | % | ||||||||||||||||||||||
Cash Net Operating Income (4) |
$ | 186,338 | $ | 160,187 | 16.3 | % | ||||||||||||||||||||
Q1 2023 Supplemental Financial Report |
|||||
| Portfolio Breakdown | Occupied at | Leased at | ||||||||||||||||||||||||||||||||||||||||||||||||
STABILIZED PORTFOLIO (1) |
Buildings | YTD NOI % | SF % | Total SF | 3/31/2023 | 12/31/2022 | 3/31/2023 | |||||||||||||||||||||||||||||||||||||||||||
| Greater Los Angeles | ||||||||||||||||||||||||||||||||||||||||||||||||||
| Culver City | 19 | 0.7 | % | 1.0 | % | 166,207 | 78.9 | % | 78.8 | % | 78.9 | % | ||||||||||||||||||||||||||||||||||||||
| El Segundo | 5 | 2.5 | % | 6.8 | % | 1,103,595 | 76.0 | % | 91.2 | % | 76.0 | % | ||||||||||||||||||||||||||||||||||||||
| Hollywood | 10 | 6.9 | % | 7.4 | % | 1,200,419 | 89.7 | % | 90.0 | % | 89.9 | % | ||||||||||||||||||||||||||||||||||||||
| Long Beach | 7 | 1.7 | % | 5.9 | % | 957,706 | 75.2 | % | 75.3 | % | 87.0 | % | ||||||||||||||||||||||||||||||||||||||
| West Hollywood | 4 | 0.9 | % | 1.2 | % | 189,459 | 80.0 | % | 80.0 | % | 84.1 | % | ||||||||||||||||||||||||||||||||||||||
| West Los Angeles | 8 | 4.4 | % | 4.5 | % | 726,975 | 80.9 | % | 83.8 | % | 80.9 | % | ||||||||||||||||||||||||||||||||||||||
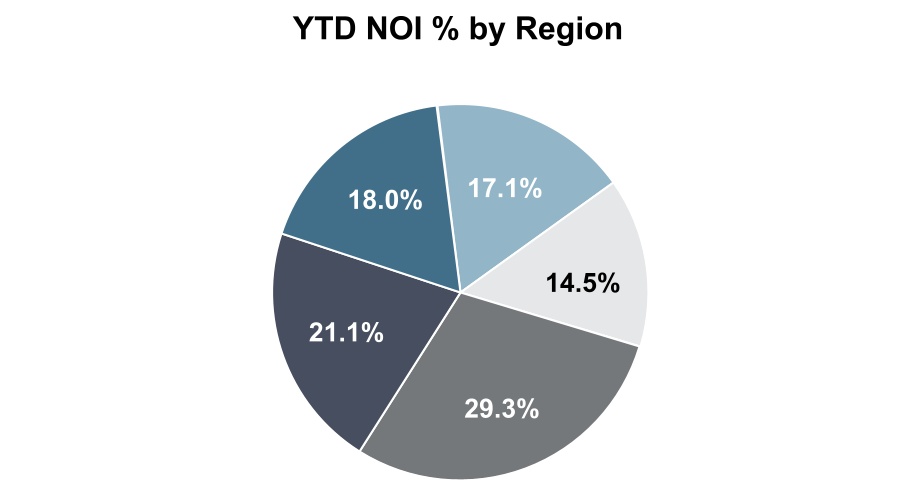
| Total Greater Los Angeles | 53 | 17.1 | % | 26.8 | % | 4,344,361 | 80.8 | % | 85.2 | % | 83.6 | % | ||||||||||||||||||||||||||||||||||||||
| San Diego County | ||||||||||||||||||||||||||||||||||||||||||||||||||
| Del Mar | 17 | 12.8 | % | 11.1 | % | 1,791,487 | 98.5 | % | 98.7 | % | 99.2 | % | ||||||||||||||||||||||||||||||||||||||
| I-15 Corridor | 3 | 0.7 | % | 2.7 | % | 433,851 | 67.3 | % | 68.2 | % | 83.6 | % | ||||||||||||||||||||||||||||||||||||||
| Little Italy / Point Loma | 2 | — | % | 2.0 | % | 312,249 | 32.3 | % | 32.3 | % | 42.2 | % | ||||||||||||||||||||||||||||||||||||||
| University Towne Center | 1 | 1.0 | % | 1.0 | % | 160,444 | 100.0 | % | 100.0 | % | 100.0 | % | ||||||||||||||||||||||||||||||||||||||
| Total San Diego County | 23 | 14.5 | % | 16.8 | % | 2,698,031 | 85.9 | % | 86.2 | % | 90.2 | % | ||||||||||||||||||||||||||||||||||||||
| San Francisco Bay Area | ||||||||||||||||||||||||||||||||||||||||||||||||||
| Menlo Park | 6 | 2.0 | % | 2.0 | % | 330,212 | 84.5 | % | 84.5 | % | 91.4 | % | ||||||||||||||||||||||||||||||||||||||
| Mountain View | 3 | 3.0 | % | 2.8 | % | 457,066 | 100.0 | % | 100.0 | % | 100.0 | % | ||||||||||||||||||||||||||||||||||||||
| Palo Alto | 2 | 1.2 | % | 1.0 | % | 165,574 | 100.0 | % | 100.0 | % | 100.0 | % | ||||||||||||||||||||||||||||||||||||||
| Redwood City | 2 | 2.7 | % | 2.1 | % | 347,269 | 100.0 | % | 100.0 | % | 100.0 | % | ||||||||||||||||||||||||||||||||||||||
| San Francisco | 10 | 29.3 | % | 20.9 | % | 3,394,039 | 91.9 | % | 93.3 | % | 93.9 | % | ||||||||||||||||||||||||||||||||||||||
| South San Francisco | 6 | 8.3 | % | 5.0 | % | 806,109 | 100.0 | % | 100.0 | % | 100.0 | % | ||||||||||||||||||||||||||||||||||||||
| Sunnyvale | 4 | 3.9 | % | 4.1 | % | 663,460 | 100.0 | % | 100.0 | % | 100.0 | % | ||||||||||||||||||||||||||||||||||||||
| Total San Francisco Bay Area | 33 | 50.4 | % | 37.9 | % | 6,163,729 | 94.7 | % | 95.5 | % | 96.2 | % | ||||||||||||||||||||||||||||||||||||||
| Greater Seattle | ||||||||||||||||||||||||||||||||||||||||||||||||||
| Bellevue | 2 | 5.2 | % | 5.7 | % | 919,295 | 91.5 | % | 99.3 | % | 91.5 | % | ||||||||||||||||||||||||||||||||||||||
| Lake Union / Denny Regrade | 8 | 12.8 | % | 12.8 | % | 2,080,883 | 97.0 | % | 97.1 | % | 97.0 | % | ||||||||||||||||||||||||||||||||||||||
| Total Greater Seattle | 10 | 18.0 | % | 18.5 | % | 3,000,178 | 95.3 | % | 97.7 | % | 95.3 | % | ||||||||||||||||||||||||||||||||||||||
| TOTAL STABILIZED PORTFOLIO | 119 | 100.0 | % | 100.0 | % | 16,206,299 | 89.6 | % | 91.6 | % | 91.6 | % | ||||||||||||||||||||||||||||||||||||||
| Average Occupancy | ||
| Quarter-to-Date | ||
| 89.9% | ||
Q1 2023 Supplemental Financial Report |
|||||
| Submarket | Square Feet | Occupied | Leased | |||||||||||||||||||||||||||||
| Greater Los Angeles, California | ||||||||||||||||||||||||||||||||
| 3101-3243 La Cienega Boulevard | Culver City | 166,207 | 78.9 | % | 78.9 | % | ||||||||||||||||||||||||||
| 2240 E. Imperial Highway | El Segundo | 122,870 | 100.0 | % | 100.0 | % | ||||||||||||||||||||||||||
2250 E. Imperial Highway (1) |
El Segundo | 298,728 | 46.2 | % | 46.2 | % | ||||||||||||||||||||||||||
| 2260 E. Imperial Highway | El Segundo | 298,728 | 100.0 | % | 100.0 | % | ||||||||||||||||||||||||||
| 909 N. Pacific Coast Highway | El Segundo | 244,880 | 81.3 | % | 81.3 | % | ||||||||||||||||||||||||||
| 999 N. Pacific Coast Highway | El Segundo | 138,389 | 58.1 | % | 58.1 | % | ||||||||||||||||||||||||||
| 1350 Ivar Avenue | Hollywood | 16,448 | 100.0 | % | 100.0 | % | ||||||||||||||||||||||||||
| 1355 Vine Street | Hollywood | 183,129 | 100.0 | % | 100.0 | % | ||||||||||||||||||||||||||
| 1375 Vine Street | Hollywood | 159,236 | 100.0 | % | 100.0 | % | ||||||||||||||||||||||||||
| 1395 Vine Street | Hollywood | 2,575 | 100.0 | % | 100.0 | % | ||||||||||||||||||||||||||
1500 N. El Centro Avenue (1) |
Hollywood | 113,447 | 28.8 | % | 28.8 | % | ||||||||||||||||||||||||||
| 1525 N. Gower Street | Hollywood | 9,610 | 100.0 | % | 100.0 | % | ||||||||||||||||||||||||||
| 1575 N. Gower Street | Hollywood | 264,430 | 100.0 | % | 100.0 | % | ||||||||||||||||||||||||||
| 6115 W. Sunset Boulevard | Hollywood | 26,238 | 80.0 | % | 80.0 | % | ||||||||||||||||||||||||||
| 6121 W. Sunset Boulevard | Hollywood | 93,418 | 100.0 | % | 100.0 | % | ||||||||||||||||||||||||||
| 6255 W. Sunset Boulevard | Hollywood | 331,888 | 88.8 | % | 89.2 | % | ||||||||||||||||||||||||||
| 3750 Kilroy Airport Way | Long Beach | 10,718 | 100.0 | % | 100.0 | % | ||||||||||||||||||||||||||
| 3760 Kilroy Airport Way | Long Beach | 166,761 | 96.4 | % | 100.0 | % | ||||||||||||||||||||||||||
| 3780 Kilroy Airport Way | Long Beach | 221,452 | 84.3 | % | 93.2 | % | ||||||||||||||||||||||||||
| 3800 Kilroy Airport Way | Long Beach | 192,476 | 87.7 | % | 87.7 | % | ||||||||||||||||||||||||||
| 3840 Kilroy Airport Way | Long Beach | 138,441 | 0.0 | % | 58.5 | % | ||||||||||||||||||||||||||
| 3880 Kilroy Airport Way | Long Beach | 96,923 | 100.0 | % | 100.0 | % | ||||||||||||||||||||||||||
| 3900 Kilroy Airport Way | Long Beach | 130,935 | 73.9 | % | 78.7 | % | ||||||||||||||||||||||||||
| 8560 W. Sunset Boulevard | West Hollywood | 76,558 | 59.0 | % | 69.2 | % | ||||||||||||||||||||||||||
| 8570 W. Sunset Boulevard | West Hollywood | 49,276 | 95.6 | % | 95.6 | % | ||||||||||||||||||||||||||
| 8580 W. Sunset Boulevard | West Hollywood | 6,875 | 59.0 | % | 59.0 | % | ||||||||||||||||||||||||||
| 8590 W. Sunset Boulevard | West Hollywood | 56,750 | 97.4 | % | 97.4 | % | ||||||||||||||||||||||||||
| 12100 W. Olympic Boulevard | West Los Angeles | 155,679 | 100.0 | % | 100.0 | % | ||||||||||||||||||||||||||
| 12200 W. Olympic Boulevard | West Los Angeles | 154,544 | 90.3 | % | 90.3 | % | ||||||||||||||||||||||||||
| 12233 W. Olympic Boulevard | West Los Angeles | 156,746 | 67.1 | % | 67.1 | % | ||||||||||||||||||||||||||
| 12312 W. Olympic Boulevard | West Los Angeles | 76,644 | 100.0 | % | 100.0 | % | ||||||||||||||||||||||||||
| 2100/2110 Colorado Avenue | West Los Angeles | 104,853 | 55.4 | % | 55.4 | % | ||||||||||||||||||||||||||
| 501 Santa Monica Boulevard | West Los Angeles | 78,509 | 67.8 | % | 67.8 | % | ||||||||||||||||||||||||||
| Total Greater Los Angeles | 4,344,361 | 80.8 | % | 83.6 | % | |||||||||||||||||||||||||||
Q1 2023 Supplemental Financial Report |
|||||
| Submarket | Square Feet | Occupied | Leased | |||||||||||||||||||||||||||||
| San Diego County, California | ||||||||||||||||||||||||||||||||
| 12225 El Camino Real | Del Mar | 58,401 | 100.0 | % | 100.0 | % | ||||||||||||||||||||||||||
| 12235 El Camino Real | Del Mar | 53,751 | 100.0 | % | 100.0 | % | ||||||||||||||||||||||||||
| 12340 El Camino Real * | Del Mar | 109,307 | 100.0 | % | 100.0 | % | ||||||||||||||||||||||||||
| 12390 El Camino Real | Del Mar | 73,238 | 100.0 | % | 100.0 | % | ||||||||||||||||||||||||||
| 12770 El Camino Real | Del Mar | 75,035 | 100.0 | % | 100.0 | % | ||||||||||||||||||||||||||
| 12780 El Camino Real | Del Mar | 140,591 | 100.0 | % | 100.0 | % | ||||||||||||||||||||||||||
| 12790 El Camino Real | Del Mar | 87,944 | 100.0 | % | 100.0 | % | ||||||||||||||||||||||||||
| 12830 El Camino Real | Del Mar | 196,444 | 100.0 | % | 100.0 | % | ||||||||||||||||||||||||||
| 12860 El Camino Real | Del Mar | 92,042 | 100.0 | % | 100.0 | % | ||||||||||||||||||||||||||
| 12348 High Bluff Drive | Del Mar | 39,193 | 100.0 | % | 100.0 | % | ||||||||||||||||||||||||||
| 12400 High Bluff Drive * | Del Mar | 216,518 | 100.0 | % | 100.0 | % | ||||||||||||||||||||||||||
3579 Valley Centre Drive |
Del Mar | 54,960 | 94.7 | % | 94.7 | % | ||||||||||||||||||||||||||
| 3611 Valley Centre Drive | Del Mar | 132,425 | 96.4 | % | 96.4 | % | ||||||||||||||||||||||||||
| 3661 Valley Centre Drive | Del Mar | 131,662 | 100.0 | % | 100.0 | % | ||||||||||||||||||||||||||
| 3721 Valley Centre Drive | Del Mar | 115,193 | 100.0 | % | 100.0 | % | ||||||||||||||||||||||||||
| 3811 Valley Centre Drive | Del Mar | 118,912 | 100.0 | % | 100.0 | % | ||||||||||||||||||||||||||
| 3745 Paseo Place | Del Mar | 95,871 | 80.5 | % | 93.8 | % | ||||||||||||||||||||||||||
| 13480 Evening Creek Drive North | I-15 Corridor | 143,401 | 6.4 | % | 55.7 | % | ||||||||||||||||||||||||||
| 13500 Evening Creek Drive North | I-15 Corridor | 143,749 | 100.0 | % | 100.0 | % | ||||||||||||||||||||||||||
| 13520 Evening Creek Drive North | I-15 Corridor | 146,701 | 94.8 | % | 94.8 | % | ||||||||||||||||||||||||||
| 2100 Kettner Boulevard * | Little Italy | 204,793 | 0.0 | % | 15.1 | % | ||||||||||||||||||||||||||
| 2305 Historic Decatur Road | Point Loma | 107,456 | 93.9 | % | 93.9 | % | ||||||||||||||||||||||||||
| 9455 Towne Centre Drive | University Towne Center | 160,444 | 100.0 | % | 100.0 | % | ||||||||||||||||||||||||||
| Total San Diego County | 2,698,031 | 85.9 | % | 90.2 | % | |||||||||||||||||||||||||||
Q1 2023 Supplemental Financial Report |
|||||
| Submarket | Square Feet | Occupied | Leased | |||||||||||||||||||||||||||||
| San Francisco Bay Area, California | ||||||||||||||||||||||||||||||||
| 4100 Bohannon Drive | Menlo Park | 47,379 | 100.0 | % | 100.0 | % | ||||||||||||||||||||||||||
| 4200 Bohannon Drive | Menlo Park | 45,451 | 65.8 | % | 65.8 | % | ||||||||||||||||||||||||||
| 4300 Bohannon Drive | Menlo Park | 63,079 | 48.7 | % | 85.3 | % | ||||||||||||||||||||||||||
| 4500 Bohannon Drive | Menlo Park | 63,078 | 100.0 | % | 100.0 | % | ||||||||||||||||||||||||||
| 4600 Bohannon Drive | Menlo Park | 48,147 | 93.0 | % | 93.0 | % | ||||||||||||||||||||||||||
| 4700 Bohannon Drive | Menlo Park | 63,078 | 100.0 | % | 100.0 | % | ||||||||||||||||||||||||||
| 1290-1300 Terra Bella Avenue | Mountain View | 114,175 | 100.0 | % | 100.0 | % | ||||||||||||||||||||||||||
| 680 E. Middlefield Road | Mountain View | 171,676 | 100.0 | % | 100.0 | % | ||||||||||||||||||||||||||
| 690 E. Middlefield Road | Mountain View | 171,215 | 100.0 | % | 100.0 | % | ||||||||||||||||||||||||||
| 1701 Page Mill Road | Palo Alto | 128,688 | 100.0 | % | 100.0 | % | ||||||||||||||||||||||||||
| 3150 Porter Drive | Palo Alto | 36,886 | 100.0 | % | 100.0 | % | ||||||||||||||||||||||||||
| 900 Jefferson Avenue | Redwood City | 228,505 | 100.0 | % | 100.0 | % | ||||||||||||||||||||||||||
| 900 Middlefield Road | Redwood City | 118,764 | 100.0 | % | 100.0 | % | ||||||||||||||||||||||||||
| 100 Hooper Street | San Francisco | 417,914 | 95.5 | % | 95.5 | % | ||||||||||||||||||||||||||
| 100 First Street | San Francisco | 480,457 | 94.8 | % | 98.8 | % | ||||||||||||||||||||||||||
| 303 Second Street | San Francisco | 784,658 | 84.9 | % | 91.0 | % | ||||||||||||||||||||||||||
| 201 Third Street | San Francisco | 346,538 | 74.6 | % | 74.6 | % | ||||||||||||||||||||||||||
| 360 Third Street | San Francisco | 429,796 | 94.8 | % | 94.8 | % | ||||||||||||||||||||||||||
| 250 Brannan Street | San Francisco | 100,850 | 100.0 | % | 100.0 | % | ||||||||||||||||||||||||||
| 301 Brannan Street | San Francisco | 82,834 | 100.0 | % | 100.0 | % | ||||||||||||||||||||||||||
| 333 Brannan Street | San Francisco | 185,602 | 100.0 | % | 100.0 | % | ||||||||||||||||||||||||||
| 345 Brannan Street | San Francisco | 110,050 | 99.7 | % | 99.7 | % | ||||||||||||||||||||||||||
| 350 Mission Street | San Francisco | 455,340 | 99.7 | % | 99.7 | % | ||||||||||||||||||||||||||
| 345 Oyster Point Boulevard | South San Francisco | 40,410 | 100.0 | % | 100.0 | % | ||||||||||||||||||||||||||
| 347 Oyster Point Boulevard | South San Francisco | 39,780 | 100.0 | % | 100.0 | % | ||||||||||||||||||||||||||
| 349 Oyster Point Boulevard | South San Francisco | 65,340 | 100.0 | % | 100.0 | % | ||||||||||||||||||||||||||
| 350 Oyster Point Boulevard | South San Francisco | 234,892 | 100.0 | % | 100.0 | % | ||||||||||||||||||||||||||
| 352 Oyster Point Boulevard | South San Francisco | 232,215 | 100.0 | % | 100.0 | % | ||||||||||||||||||||||||||
| 354 Oyster Point Boulevard | South San Francisco | 193,472 | 100.0 | % | 100.0 | % | ||||||||||||||||||||||||||
| 505 Mathilda Avenue | Sunnyvale | 212,322 | 100.0 | % | 100.0 | % | ||||||||||||||||||||||||||
| 555 Mathilda Avenue | Sunnyvale | 212,322 | 100.0 | % | 100.0 | % | ||||||||||||||||||||||||||
| 599 Mathilda Avenue | Sunnyvale | 76,031 | 100.0 | % | 100.0 | % | ||||||||||||||||||||||||||
| 605 Mathilda Avenue | Sunnyvale | 162,785 | 100.0 | % | 100.0 | % | ||||||||||||||||||||||||||
| Total San Francisco Bay Area | 6,163,729 | 94.7 | % | 96.2 | % | |||||||||||||||||||||||||||
Q1 2023 Supplemental Financial Report |
|||||
| Submarket | Square Feet | Occupied | Leased | |||||||||||||||||||||||||||||
| Greater Seattle, Washington | ||||||||||||||||||||||||||||||||
| 601 108th Avenue NE | Bellevue | 490,738 | 99.8 | % | 99.8 | % | ||||||||||||||||||||||||||
| 10900 NE 4th Street | Bellevue | 428,557 | 82.1 | % | 82.1 | % | ||||||||||||||||||||||||||
| 2001 West 8th Avenue | Denny Regrade | 539,226 | 89.6 | % | 89.6 | % | ||||||||||||||||||||||||||
| 333 Dexter Avenue North * | Lake Union | 618,766 | 100.0 | % | 100.0 | % | ||||||||||||||||||||||||||
| 701 N. 34th Street | Lake Union | 141,860 | 100.0 | % | 100.0 | % | ||||||||||||||||||||||||||
| 801 N. 34th Street | Lake Union | 173,615 | 100.0 | % | 100.0 | % | ||||||||||||||||||||||||||
| 837 N. 34th Street | Lake Union | 112,487 | 100.0 | % | 100.0 | % | ||||||||||||||||||||||||||
| 320 Westlake Avenue North | Lake Union | 184,644 | 96.1 | % | 96.1 | % | ||||||||||||||||||||||||||
| 321 Terry Avenue North | Lake Union | 135,755 | 100.0 | % | 100.0 | % | ||||||||||||||||||||||||||
| 401 Terry Avenue North | Lake Union | 174,530 | 100.0 | % | 100.0 | % | ||||||||||||||||||||||||||
| Total Greater Seattle | 3,000,178 | 95.3 | % | 95.3 | % | |||||||||||||||||||||||||||
| TOTAL STABILIZED OFFICE PORTFOLIO | 16,206,299 | 89.6 | % | 91.6 | % | |||||||||||||||||||||||||||
| Average Residential Occupancy | ||||||||||||||||||||||||||
| RESIDENTIAL PROPERTIES | Submarket | Total No. of Units | Quarter-to-Date | |||||||||||||||||||||||
| Greater Los Angeles | ||||||||||||||||||||||||||
| 1550 N. El Centro Avenue | Hollywood | 200 | 94.0% | |||||||||||||||||||||||
| 6390 De Longpre Avenue | Hollywood | 193 | 93.4% | |||||||||||||||||||||||
| San Diego County | ||||||||||||||||||||||||||
| 3200 Paseo Village Way | Del Mar | 608 | 93.1% | |||||||||||||||||||||||
| TOTAL RESIDENTIAL PROPERTIES | 1,001 | 93.4% | ||||||||||||||||||||||||
Q1 2023 Supplemental Financial Report |
|||||
| Quarter to Date | # of Leases (2) |
Square Feet (2) |
Weighted Average Lease Term (Mo.) |
TI/LC
Per Sq.Ft. (3)
|
TI/LC
Per Sq.Ft. /Year (3)
|
Changes in GAAP Rents |
Changes in Cash Rents |
||||||||||||||||||||||||||||||||||||||||||||||||||||||||||
| New | Renewal | New | Renewal | Total | |||||||||||||||||||||||||||||||||||||||||||||||||||||||||||||
2nd Generation (4) |
6 | 9 | 34,634 | 116,595 | 151,229 | 42 | $ | 23.33 | $ | 6.66 | 19.1 | % | 5.4 | % | |||||||||||||||||||||||||||||||||||||||||||||||||||
Q1 2023 Supplemental Financial Report |
|||||
Quarter to Date (2) |
# of Leases (3) |
Square Feet (3) |
Weighted Average Lease Term (Mo.) |
TI/LC
Per Sq.Ft. (4)
|
TI/LC
Per Sq.Ft. /Year (4)
|
Changes in GAAP Rents |
Changes in Cash Rents |
Retention Rates |
|||||||||||||||||||||||||||||||||||||||||||||||||||||||||||||||
| New | Renewal | New | Renewal | Total | |||||||||||||||||||||||||||||||||||||||||||||||||||||||||||||||||||
| 2nd Generation | 12 | 8 | 169,861 | 116,595 | 286,456 | 53 | $ | 58.09 | $ | 13.15 | 4.2 | % | (4.4) | % | 25.1 | % | |||||||||||||||||||||||||||||||||||||||||||||||||||||||
Q1 2023 Supplemental Financial Report |
|||||
| Q1 2023 | |||||||||||
1st Generation (Nonrecurring) Capital Expenditures: (1) |
|||||||||||
| Capital Improvements | $ | 347 | |||||||||
Tenant Improvements & Leasing Commissions (2) |
— | ||||||||||
| Total | $ | 347 | |||||||||
| Q1 2023 | |||||||||||
2nd Generation (Recurring) Capital Expenditures: (1) |
|||||||||||
| Capital Improvements | $ | 7,297 | |||||||||
Tenant Improvements & Leasing Commissions (2) |
10,469 | ||||||||||
| Total | $ | 17,766 | |||||||||
Q1 2023 Supplemental Financial Report |
|||||

| # of Expiring Leases | 11 | 15 | 20 | 28 | 14 | 17 | 17 | 63 | 59 | 63 | 40 | 22 | 37 | 31 | 14 | 14 | ||||||||||||||||||||||||||||||||||
| % of Total Leased Sq. Ft. | 4.0 | % | 2.0 | % | 2.1 | % | 2.0 | % | 1.0 | % | 2.1 | % | 2.7 | % | 4.8 | % | 13.7 | % | 7.8 | % | 7.6 | % | 6.7 | % | 10.7 | % | 13.4 | % | 7.4 | % | 12.0 | % | ||||||||||||||||||
| Annualized Base Rent | $29,539 | $13,450 | $16,415 | $13,585 | $5,924 | $11,749 | $23,297 | $33,148 | $91,545 | $46,177 | $67,752 | $53,105 | $91,142 | $129,460 | $71,560 | $112,783 | ||||||||||||||||||||||||||||||||||
% of Total Annualized Base Rent (3) |
3.6 | % | 1.7 | % | 2.0 | % | 1.7 | % | 0.7 | % | 1.4 | % | 2.9 | % | 4.1 | % | 11.3 | % | 5.7 | % | 8.4 | % | 6.6 | % | 11.2 | % | 16.0 | % | 8.8 | % | 13.9 | % | ||||||||||||||||||
| Annualized Rent per Sq. Ft. | $51.63 | $44.83 | $55.13 | $47.00 | $42.39 | $37.45 | $59.97 | $48.22 | $46.77 | $41.42 | $62.66 | $55.17 | $59.74 | $67.71 | $67.85 | $66.00 | ||||||||||||||||||||||||||||||||||
Q1 2023 Supplemental Financial Report |
|||||
Year |
Region | # of Expiring Leases |
Total Square Feet |
% of Total Leased Sq. Ft. |
Annualized
Base Rent (1)
|
% of Total Annualized Base Rent |
Annualized Rent per Sq. Ft. |
|||||||||||||||||||||||||||||||||||||||||||
| 2023 | Greater Los Angeles | 31 | 352,000 | 2.5 | % | $ | 18,810 | 2.3 | % | $ | 53.44 | |||||||||||||||||||||||||||||||||||||||
| San Diego | 5 | 134,366 | 0.9 | % | 5,798 | 0.7 | % | 43.15 | ||||||||||||||||||||||||||||||||||||||||||
| San Francisco Bay Area | 7 | 296,300 | 2.1 | % | 17,423 | 2.1 | % | 58.80 | ||||||||||||||||||||||||||||||||||||||||||
| Greater Seattle | 3 | 387,141 | 2.6 | % | 17,373 | 2.2 | % | 44.88 | ||||||||||||||||||||||||||||||||||||||||||
| Total | 46 | 1,169,807 | 8.1 | % | $ | 59,404 | 7.3 | % | $ | 50.78 | ||||||||||||||||||||||||||||||||||||||||
| 2024 | Greater Los Angeles | 46 | 573,413 | 4.0 | % | $ | 25,110 | 3.1 | % | $ | 43.79 | |||||||||||||||||||||||||||||||||||||||
| San Diego | 9 | 57,303 | 0.3 | % | 3,199 | 0.4 | % | 55.83 | ||||||||||||||||||||||||||||||||||||||||||
| San Francisco Bay Area | 11 | 269,858 | 1.9 | % | 18,040 | 2.2 | % | 66.85 | ||||||||||||||||||||||||||||||||||||||||||
| Greater Seattle | 10 | 230,393 | 1.6 | % | 8,206 | 1.0 | % | 35.62 | ||||||||||||||||||||||||||||||||||||||||||
| Total | 76 | 1,130,967 | 7.8 | % | $ | 54,555 | 6.7 | % | $ | 48.24 | ||||||||||||||||||||||||||||||||||||||||
| 2025 | Greater Los Angeles | 25 | 192,663 | 1.3 | % | $ | 8,467 | 1.0 | % | $ | 43.95 | |||||||||||||||||||||||||||||||||||||||
| San Diego | 18 | 217,300 | 1.5 | % | 10,392 | 1.3 | % | 47.82 | ||||||||||||||||||||||||||||||||||||||||||
| San Francisco Bay Area | 9 | 120,942 | 0.9 | % | 8,501 | 1.1 | % | 70.29 | ||||||||||||||||||||||||||||||||||||||||||
| Greater Seattle | 11 | 156,575 | 1.1 | % | 5,788 | 0.7 | % | 36.97 | ||||||||||||||||||||||||||||||||||||||||||
| Total | 63 | 687,480 | 4.8 | % | $ | 33,148 | 4.1 | % | $ | 48.22 | ||||||||||||||||||||||||||||||||||||||||
| 2026 | Greater Los Angeles | 20 | 386,767 | 2.7 | % | $ | 14,982 | 1.8 | % | $ | 38.74 | |||||||||||||||||||||||||||||||||||||||
| San Diego | 13 | 234,893 | 1.6 | % | 10,971 | 1.4 | % | 46.71 | ||||||||||||||||||||||||||||||||||||||||||
| San Francisco Bay Area | 15 | 940,216 | 6.6 | % | 49,396 | 6.1 | % | 52.54 | ||||||||||||||||||||||||||||||||||||||||||
| Greater Seattle | 11 | 395,359 | 2.8 | % | 16,196 | 2.0 | % | 40.97 | ||||||||||||||||||||||||||||||||||||||||||
| Total | 59 | 1,957,235 | 13.7 | % | $ | 91,545 | 11.3 | % | $ | 46.77 | ||||||||||||||||||||||||||||||||||||||||
| 2027 | Greater Los Angeles | 33 | 718,971 | 5.0 | % | $ | 26,463 | 3.2 | % | $ | 36.81 | |||||||||||||||||||||||||||||||||||||||
| San Diego | 16 | 239,005 | 1.7 | % | 11,926 | 1.5 | % | 49.90 | ||||||||||||||||||||||||||||||||||||||||||
| San Francisco Bay Area | 4 | 70,381 | 0.5 | % | 4,523 | 0.6 | % | 64.26 | ||||||||||||||||||||||||||||||||||||||||||
| Greater Seattle | 10 | 86,543 | 0.6 | % | 3,265 | 0.4 | % | 37.73 | ||||||||||||||||||||||||||||||||||||||||||
| Total | 63 | 1,114,900 | 7.8 | % | $ | 46,177 | 5.7 | % | $ | 41.42 | ||||||||||||||||||||||||||||||||||||||||
| 2028 and Beyond |
Greater Los Angeles | 41 | 1,164,356 | 8.3 | % | $ | 68,198 | 8.4 | % | $ | 58.57 | |||||||||||||||||||||||||||||||||||||||
| San Diego | 49 | 1,415,704 | 9.9 | % | 87,885 | 10.8 | % | 62.08 | ||||||||||||||||||||||||||||||||||||||||||
| San Francisco Bay Area | 44 | 4,085,604 | 28.6 | % | 296,822 | 36.6 | % | 72.65 | ||||||||||||||||||||||||||||||||||||||||||
| Greater Seattle | 24 | 1,579,219 | 11.0 | % | 72,897 | 9.1 | % | 46.16 | ||||||||||||||||||||||||||||||||||||||||||
| Total | 158 | 8,244,883 | 57.8 | % | $ | 525,802 | 64.9 | % | $ | 63.77 | ||||||||||||||||||||||||||||||||||||||||
Q1 2023 Supplemental Financial Report |
|||||
| Tenant Name | Region | Annualized Base Rental Revenue (2) |
Rentable Square Feet |
Percentage of Total Annualized Base Rental Revenue |
Percentage of Total Rentable Square Feet |
Year(s) of Lease Expiration | ||||||||||||||||||||||||||||||||||||||
| Global technology company | Greater Seattle / San Diego County |
$ | 39,631 | 779,210 | 4.9 | % | 4.8 | % | 2032 - 2033 | |||||||||||||||||||||||||||||||||||
| Cruise LLC | San Francisco Bay Area | 35,449 | 374,618 | 4.4 | % | 2.3 | % | 2031 | ||||||||||||||||||||||||||||||||||||
| Stripe, Inc. | San Francisco Bay Area | 33,110 | 425,687 | 4.1 | % | 2.6 | % | 2034 | ||||||||||||||||||||||||||||||||||||
Amazon.com (3) |
Greater Seattle | 31,437 | 709,276 | 3.9 | % | 4.4 | % | 2023 / 2029 - 2030 | ||||||||||||||||||||||||||||||||||||
| Salesforce, Inc. / Tableau Software, LLC | San Francisco Bay Area / Greater Seattle |
30,100 | 613,497 | 3.7 | % | 3.8 | % | 2024 / 2029 - 2032 | ||||||||||||||||||||||||||||||||||||
| LinkedIn Corporation / Microsoft Corporation | San Francisco Bay Area | 29,752 | 663,460 | 3.7 | % | 4.1 | % | 2024 / 2026 | ||||||||||||||||||||||||||||||||||||
| Adobe Systems, Inc. | San Francisco Bay Area / Greater Seattle |
27,897 | 523,416 | 3.4 | % | 3.2 | % | 2027 / 2031 | ||||||||||||||||||||||||||||||||||||
| DoorDash, Inc. | San Francisco Bay Area | 23,842 | 236,759 | 2.9 | % | 1.5 | % | 2032 | ||||||||||||||||||||||||||||||||||||
Riot Games, Inc. (4) |
Greater Los Angeles | 22,967 | 340,584 | 2.8 | % | 2.1 | % | 2023 - 2024 / 2031 | ||||||||||||||||||||||||||||||||||||
| Okta, Inc. | San Francisco Bay Area | 22,387 | 273,371 | 2.8 | % | 1.7 | % | 2028 | ||||||||||||||||||||||||||||||||||||
| Netflix, Inc. | Greater Los Angeles | 21,854 | 361,388 | 2.7 | % | 2.2 | % | 2032 | ||||||||||||||||||||||||||||||||||||
| Box, Inc. | San Francisco Bay Area | 20,390 | 341,441 | 2.5 | % | 2.1 | % | 2028 | ||||||||||||||||||||||||||||||||||||
| Cytokinetics, Inc. | San Francisco Bay Area | 18,167 | 234,892 | 2.2 | % | 1.4 | % | 2033 | ||||||||||||||||||||||||||||||||||||
| DIRECTV, LLC | Greater Los Angeles | 16,085 | 532,956 | 2.0 | % | 3.3 | % | 2026 - 2027 | ||||||||||||||||||||||||||||||||||||
| Synopsys, Inc. | San Francisco Bay Area | 15,492 | 342,891 | 1.9 | % | 2.1 | % | 2030 | ||||||||||||||||||||||||||||||||||||
| Total Top Fifteen Tenants | $ | 388,560 | 6,753,446 | 47.9 | % | 41.6 | % | |||||||||||||||||||||||||||||||||||||
Q1 2023 Supplemental Financial Report |
|||||
Property (1) |
Venture Partner | Submarket | Rentable Square Feet | KRC Ownership % | ||||||||||||||||||||||||||||
| 100 First Street, San Francisco, CA | Norges Bank Real Estate Management | San Francisco | 480,457 | 56% | ||||||||||||||||||||||||||||
| 303 Second Street, San Francisco, CA | Norges Bank Real Estate Management | San Francisco | 784,658 | 56% | ||||||||||||||||||||||||||||
900 Jefferson Avenue and 900 Middlefield Road, Redwood City, CA (2) |
Local developer | Redwood City | 347,269 | 93% | ||||||||||||||||||||||||||||

Q1 2023 Supplemental Financial Report |
|||||
| Location | Construction Start Date | Estimated Stabilization Date (2) |
Estimated Rentable Square Feet (3) |
Total Estimated Investment |
Total Cash Costs Incurred as of
3/31/2023 (4)
|
% Leased | Total Project % Occupied | |||||||||||||||||||||||||||||||||||||||||||||||||
TENANT IMPROVEMENT (1) |
||||||||||||||||||||||||||||||||||||||||||||||||||||||||
| Office | ||||||||||||||||||||||||||||||||||||||||||||||||||||||||
| Austin | ||||||||||||||||||||||||||||||||||||||||||||||||||||||||
| Indeed Tower | Austin CBD | 2Q 2021 | 4Q 2023 | 734,000 | $ | 690.0 | $ | 614.8 | 74% | 60% | ||||||||||||||||||||||||||||||||||||||||||||||
| TOTAL: | 734,000 | $ | 690.0 | $ | 614.8 | 74% | 60% | |||||||||||||||||||||||||||||||||||||||||||||||||
| UNDER CONSTRUCTION | Location | Construction Start Date | Estimated Stabilization Date (2) |
Estimated Rentable Square Feet (3) |
Total Estimated Investment |
Total Cash Costs Incurred as of
3/31/2023 (4)(5)
|
% Leased | |||||||||||||||||||||||||||||||||||||||||||
| Office / Life Science | ||||||||||||||||||||||||||||||||||||||||||||||||||
| San Francisco Bay Area | ||||||||||||||||||||||||||||||||||||||||||||||||||
| Kilroy Oyster Point - Phase 2 | South San Francisco | 2Q 2021 | 2Q 2025 | 875,000 | $ | 940.0 | $ | 394.2 | —% | |||||||||||||||||||||||||||||||||||||||||
4400 Bohannon Drive (6) |
Menlo Park | 4Q 2022 | 3Q 2025 | 48,000 | 55.0 | 17.4 | —% | |||||||||||||||||||||||||||||||||||||||||||
| San Diego County | ||||||||||||||||||||||||||||||||||||||||||||||||||
| 9514 Towne Centre Drive | University Towne Center | 3Q 2021 | 4Q 2023 | 71,000 | 60.0 | 38.4 | 100% | |||||||||||||||||||||||||||||||||||||||||||
4690 Executive Drive (6)(7) |
University Towne Center | 1Q 2022 | 3Q 2024 | 52,000 | 25.0 | 16.8 | —% | |||||||||||||||||||||||||||||||||||||||||||
| TOTAL: | 1,046,000 | $ | 1,080.0 | $ | 466.8 | 7% | ||||||||||||||||||||||||||||||||||||||||||||
Q1 2023 Supplemental Financial Report |
|||||
| FUTURE DEVELOPMENT PIPELINE | Location |
Approx. Developable
Square Feet (1)
|
Total Cash Costs Incurred as of 3/31/2023 (2) |
|||||||||||||||||||||||||||||
| Greater Los Angeles | ||||||||||||||||||||||||||||||||
| 1633 26th Street | West Los Angeles | 190,000 | $ | 14.7 | ||||||||||||||||||||||||||||
| San Diego County | ||||||||||||||||||||||||||||||||
| Santa Fe Summit South / North | 56 Corridor | 600,000 - 650,000 | 109.5 | |||||||||||||||||||||||||||||
| 2045 Pacific Highway | Little Italy | 275,000 | 52.5 | |||||||||||||||||||||||||||||
| Kilroy East Village | East Village | TBD | 67.1 | |||||||||||||||||||||||||||||
| San Francisco Bay Area | ||||||||||||||||||||||||||||||||
| Kilroy Oyster Point - Phases 3 and 4 | South San Francisco | 875,000 - 1,000,000 | 207.9 | |||||||||||||||||||||||||||||
| Flower Mart | SOMA | 2,300,000 | 495.6 | |||||||||||||||||||||||||||||
| Greater Seattle | ||||||||||||||||||||||||||||||||
| SIX0 - Office & Residential | Denny Regrade | 925,000 | 176.1 | |||||||||||||||||||||||||||||
| Austin | ||||||||||||||||||||||||||||||||
| Stadium Tower | Stadium District / Domain | 493,000 | 62.2 | |||||||||||||||||||||||||||||
| TOTAL: | $ | 1,185.6 | ||||||||||||||||||||||||||||||

Q1 2023 Supplemental Financial Report |
|||||

Debt Balance (3) |
Stated Rate | Maturity Date | ||||||||||||
Unsecured Debt (4) | ||||||||||||||
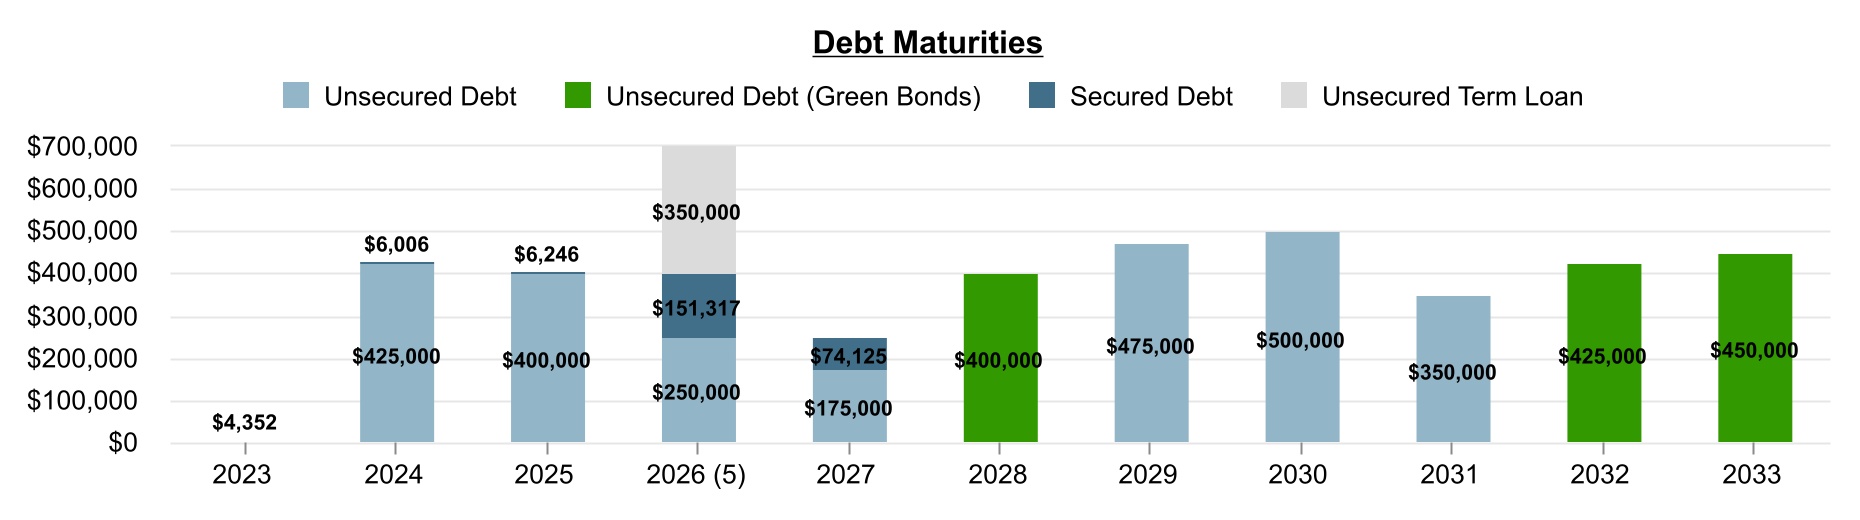
| $ | 425,000 | 3.45 | % | 12/15/2024 | ||||||||||
| $ | 400,000 | 4.38 | % | 10/1/2025 | ||||||||||
| $ | 50,000 | 4.30 | % | 7/18/2026 | ||||||||||
| $ | 350,000 | 5.77 | % | 10/3/2026 (5) |
||||||||||
| $ | 200,000 | 4.35 | % | 10/18/2026 | ||||||||||
| $ | 175,000 | 3.35 | % | 2/17/2027 | ||||||||||
| $ | 400,000 | 4.75 | % | 12/15/2028 | ||||||||||
| $ | 75,000 | 3.45 | % | 2/17/2029 | ||||||||||
| $ | 400,000 | 4.25 | % | 8/15/2029 | ||||||||||
| $ | 500,000 | 3.05 | % | 2/15/2030 | ||||||||||
| $ | 350,000 | 4.27 | % | 1/31/2031 | ||||||||||
| $ | 425,000 | 2.50 | % | 11/15/2032 | ||||||||||
| $ | 450,000 | 2.65 | % | 11/15/2033 | ||||||||||
| $ | 4,200,000 | 3.82 | % | |||||||||||
| Secured Debt | ||||||||||||||
| $ | 159,088 | 3.57 | % | 12/1/2026 | ||||||||||
| $ | 82,958 | 4.48 | % | 7/1/2027 | ||||||||||
| $ | 242,046 | 3.88 | % | |||||||||||
Q1 2023 Supplemental Financial Report |
|||||
TOTAL DEBT COMPOSITION (1) |
||||||||||||||||||||
| Weighted Average | ||||||||||||||||||||
| Interest Rate | Years to Maturity (2) |
|||||||||||||||||||
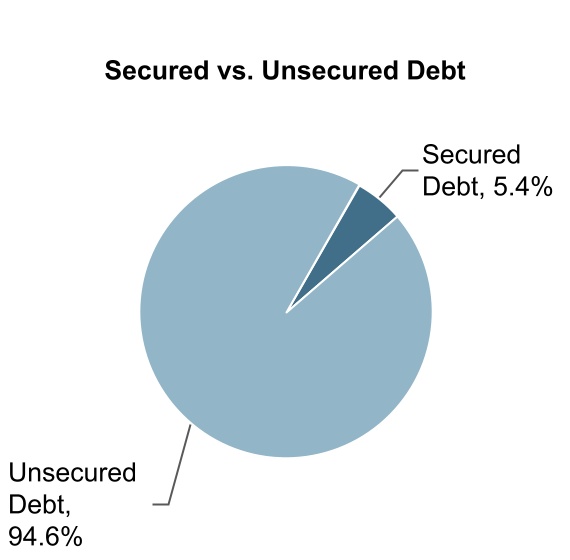
| Secured vs. Unsecured Debt | ||||||||||||||||||||
| Unsecured Debt | 3.8% | 5.9 | ||||||||||||||||||
| Secured Debt | 3.9% | 3.9 | ||||||||||||||||||
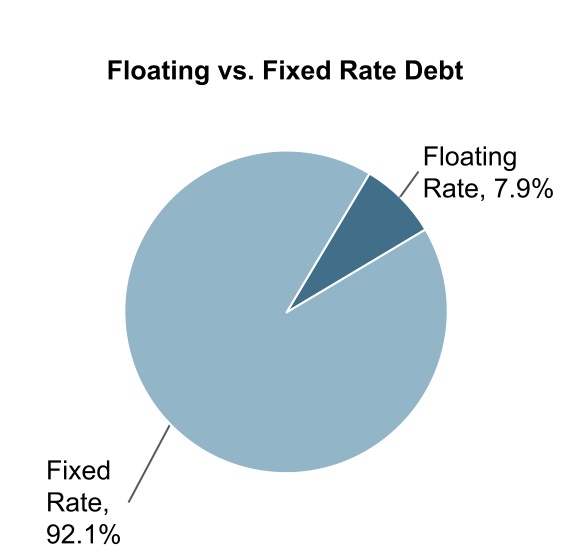
| Floating vs. Fixed-Rate Debt | ||||||||||||||||||||
| Floating-Rate Debt | 5.8% | 3.5 | ||||||||||||||||||
| Fixed-Rate Debt | 3.7% | 6.0 | ||||||||||||||||||
| Stated Interest Rate | 3.8% | 5.8 | ||||||||||||||||||
| GAAP Effective Rate | 3.9% | |||||||||||||||||||
| GAAP Effective Rate Including Debt Issuance Costs | 4.1% | |||||||||||||||||||
KEY DEBT COVENANTS (3) |
||||||||||||||||||||
| Covenant | Actual Performance as of March 31, 2023 |
|||||||||||||||||||
| Unsecured Credit and Term Loan Facility and Private Placement Notes: | ||||||||||||||||||||
| Total debt to total asset value | less than 60% | 28% | ||||||||||||||||||
| Fixed charge coverage ratio | greater than 1.5x | 3.9x | ||||||||||||||||||
| Unsecured debt ratio | greater than 1.67x | 3.47x | ||||||||||||||||||
| Unencumbered asset pool debt service coverage | greater than 1.75x | 4.59x | ||||||||||||||||||
Unsecured Senior Notes due 2024, 2025, 2028, 2029, 2030, 2032 and 2033: |
||||||||||||||||||||
| Total debt to total asset value | less than 60% | 37% | ||||||||||||||||||
| Interest coverage | greater than 1.5x | 8.2x | ||||||||||||||||||
| Secured debt to total asset value | less than 40% | 2% | ||||||||||||||||||
| Unencumbered asset pool value to unsecured debt | greater than 150% | 278% | ||||||||||||||||||

Q1 2023 Supplemental Financial Report |
|||||
Q1 2023 Supplemental Financial Report |
|||||
Q1 2023 Supplemental Financial Report |
|||||

Q1 2023 Supplemental Financial Report |
|||||
Q1 2023 Supplemental Financial Report |
|||||
Q1 2023 Supplemental Financial Report |
|||||
| Three Months Ended March 31, | ||||||||||||||||||||
| 2023 | 2022 | |||||||||||||||||||
| Net Income Available to Common Stockholders | $ | 56,608 | $ | 53,128 | ||||||||||||||||
| Net income attributable to noncontrolling common units of the Operating Partnership | 560 | 516 | ||||||||||||||||||
| Net income attributable to noncontrolling interests in consolidated property partnerships | 8,062 | 5,739 | ||||||||||||||||||
| Net Income | 65,230 | 59,383 | ||||||||||||||||||
| Adjustments: | ||||||||||||||||||||
| General and administrative expenses | 23,936 | 22,781 | ||||||||||||||||||
| Leasing costs | 1,372 | 1,013 | ||||||||||||||||||
| Depreciation and amortization | 93,676 | 88,660 | ||||||||||||||||||
| Interest income and other income, net | (1,460) | (81) | ||||||||||||||||||
| Interest expense | 25,671 | 20,625 | ||||||||||||||||||
Net Operating Income, as defined (1) |
208,425 | 192,381 | ||||||||||||||||||
| Wholly-Owned Properties | 179,500 | 168,431 | ||||||||||||||||||
Consolidated property partnerships: (2) |
||||||||||||||||||||
100 First Street (3) |
6,011 | 5,922 | ||||||||||||||||||
303 Second Street (3) |
17,247 | 12,000 | ||||||||||||||||||
Crossing/900 (4) |
5,667 | 6,028 | ||||||||||||||||||
Net Operating Income, as defined (1) |
208,425 | 192,381 | ||||||||||||||||||
Non-Same Store Net Operating Income (5) |
(19,909) | (10,440) | ||||||||||||||||||
| Same Store Net Operating Income | 188,516 | 181,941 | ||||||||||||||||||
| GAAP to Cash Adjustments: | ||||||||||||||||||||
GAAP Operating Revenues Adjustments, net (6) |
(2,278) | (21,865) | ||||||||||||||||||
| GAAP Operating Expenses Adjustments, net | 100 | 111 | ||||||||||||||||||
| Same Store Cash Net Operating Income | $ | 186,338 | $ | 160,187 | ||||||||||||||||
Q1 2023 Supplemental Financial Report |
|||||
| Three Months Ended March 31, | ||||||||||||||||||||
| 2023 | 2022 | |||||||||||||||||||
| Net Income Available to Common Stockholders | $ | 56,608 | $ | 53,128 | ||||||||||||||||
| Interest expense | 25,671 | 20,625 | ||||||||||||||||||
| Depreciation and amortization | 93,676 | 88,660 | ||||||||||||||||||
| Net income attributable to noncontrolling common units of the Operating Partnership | 560 | 516 | ||||||||||||||||||
| Net income attributable to noncontrolling interests in consolidated property partnerships | 8,062 | 5,739 | ||||||||||||||||||
EBITDA, as adjusted (1) |
$ | 184,577 | $ | 168,668 | ||||||||||||||||


| Contact: | FOR RELEASE: | ||||
| Eliott Trencher | April 26, 2023 | ||||
| Executive Vice President, | |||||
| Chief Financial Officer | |||||
| and Chief Investment Officer | |||||
| (310) 481-8587 | |||||
| Or | |||||
| Bill Hutcheson | |||||
| Senior Vice President, | |||||
| Investor Relations & Capital Markets | |||||
| (415) 778-5678 | |||||
| Full Year 2023 Range | |||||||||||||||||
| Low End | High End | ||||||||||||||||
| Net income available to common stockholders per share - diluted | $ | 1.60 | $ | 1.79 | |||||||||||||
Weighted average common shares outstanding - diluted (1) |
117,500 | 117,500 | |||||||||||||||
| Net income available to common stockholders | $ | 188,000 | $ | 210,000 | |||||||||||||
| Adjustments: | |||||||||||||||||
| Net income attributable to noncontrolling common units of the Operating Partnership | 1,800 | 2,300 | |||||||||||||||
| Net income attributable to noncontrolling interests in consolidated property partnerships | 23,500 | 25,500 | |||||||||||||||
| Depreciation and amortization of real estate assets | 335,000 | 335,000 | |||||||||||||||
| Gains on sales of depreciable real estate | — | — | |||||||||||||||
| Funds From Operations attributable to noncontrolling interests in consolidated property partnerships | (35,000) | (36,000) | |||||||||||||||
Funds From Operations (2) |
$ | 513,300 | $ | 536,800 | |||||||||||||
Weighted average common shares/units outstanding – diluted (3) |
119,400 | 119,400 | |||||||||||||||
Funds From Operations per common share/unit – diluted (3) |
$ | 4.30 | $ | 4.50 | |||||||||||||
| Key Assumptions | February 2023 Assumptions | Updated 2023 Assumptions | ||||||||||||||||||
Same Store Cash NOI growth (4) |
0.0% to 2.0% | 0.0% to 2.0% | ||||||||||||||||||
| Average occupancy | 86.5% to 88.0% | 86.5% to 88.0% | ||||||||||||||||||
| General & administrative expenses | $82 million to $90 million | $82 million to $90 million | ||||||||||||||||||
Executive retirement costs (5) |
— | $8 million to $14 million | ||||||||||||||||||
Total development spending (6) |
$450 million to $550 million | $400 million to $500 million | ||||||||||||||||||
| Dispositions | $0 to $200 million | $0 to $200 million | ||||||||||||||||||
| Three Months Ended March 31, | |||||||||||
| 2023 | 2022 | ||||||||||
| Revenues | $ | 292,802 | $ | 265,501 | |||||||
| Net income available to common stockholders | $ | 56,608 | $ | 53,128 | |||||||
| Weighted average common shares outstanding – basic | 117,059 | 116,650 | |||||||||
| Weighted average common shares outstanding – diluted | 117,407 | 117,060 | |||||||||
| Net income available to common stockholders per share – basic | $ | 0.48 | $ | 0.45 | |||||||
| Net income available to common stockholders per share – diluted | $ | 0.48 | $ | 0.45 | |||||||
Funds From Operations (1)(2) |
$ | 145,959 | $ | 137,766 | |||||||
Weighted average common shares/units outstanding – basic (3) |
118,818 | 118,628 | |||||||||
Weighted average common shares/units outstanding – diluted (4) |
119,165 | 119,038 | |||||||||
Funds From Operations per common share/unit – basic (2) |
$ | 1.23 | $ | 1.16 | |||||||
Funds From Operations per common share/unit – diluted (2) |
$ | 1.22 | $ | 1.16 | |||||||
| Common shares outstanding at end of period | 117,121 | 116,716 | |||||||||
| Common partnership units outstanding at end of period | 1,151 | 1,151 | |||||||||
| Total common shares and units outstanding at end of period | 118,272 | 117,867 | |||||||||
| March 31, 2023 | March 31, 2022 | ||||||||||
Stabilized office portfolio occupancy rates: (5) |
|||||||||||
| Greater Los Angeles | 80.8 | % | 85.7 | % | |||||||
| San Diego County | 85.9 | % | 89.4 | % | |||||||
| San Francisco Bay Area | 94.7 | % | 92.9 | % | |||||||
| Greater Seattle | 95.3 | % | 99.2 | % | |||||||
| Weighted average total | 89.6 | % | 91.3 | % | |||||||
Total square feet of stabilized office properties owned at end of period: (5) |
|||||||||||
| Greater Los Angeles | 4,344 | 4,457 | |||||||||
| San Diego County | 2,698 | 2,171 | |||||||||
| San Francisco Bay Area | 6,164 | 6,212 | |||||||||
| Greater Seattle | 3,000 | 2,381 | |||||||||
| Total | 16,206 | 15,221 | |||||||||
| March 31, 2023 | December 31, 2022 | ||||||||||
| ASSETS | |||||||||||
| REAL ESTATE ASSETS: | |||||||||||
| Land and improvements | $ | 1,738,242 | $ | 1,738,242 | |||||||
| Buildings and improvements | 8,335,285 | 8,302,081 | |||||||||
| Undeveloped land and construction in progress | 1,788,542 | 1,691,860 | |||||||||
| Total real estate assets held for investment | 11,862,069 | 11,732,183 | |||||||||
| Accumulated depreciation and amortization | (2,294,202) | (2,218,710) | |||||||||
| Total real estate assets held for investment, net | 9,567,867 | 9,513,473 | |||||||||
| Cash and cash equivalents | 476,358 | 347,379 | |||||||||
| Marketable securities | 23,288 | 23,547 | |||||||||
| Current receivables, net | 15,926 | 20,583 | |||||||||
| Deferred rent receivables, net | 457,870 | 452,200 | |||||||||
| Deferred leasing costs and acquisition-related intangible assets, net | 238,184 | 250,846 | |||||||||
| Right of use ground lease assets | 126,277 | 126,530 | |||||||||
| Prepaid expenses and other assets, net | 63,622 | 62,429 | |||||||||
| TOTAL ASSETS | $ | 10,969,392 | $ | 10,796,987 | |||||||
| LIABILITIES AND EQUITY | |||||||||||
| LIABILITIES: | |||||||||||
| Secured debt, net | $ | 241,547 | $ | 242,938 | |||||||
| Unsecured debt, net | 4,171,029 | 4,020,058 | |||||||||
| Accounts payable, accrued expenses and other liabilities | 418,902 | 392,360 | |||||||||
| Ground lease liabilities | 124,837 | 124,994 | |||||||||
| Accrued dividends and distributions | 64,461 | 64,285 | |||||||||
| Deferred revenue and acquisition-related intangible liabilities, net | 195,629 | 195,959 | |||||||||
| Rents received in advance and tenant security deposits | 80,565 | 81,432 | |||||||||
| Total liabilities | 5,296,970 | 5,122,026 | |||||||||
| EQUITY: | |||||||||||
| Stockholders’ Equity | |||||||||||
| Common stock | 1,171 | 1,169 | |||||||||
| Additional paid-in capital | 5,175,402 | 5,170,760 | |||||||||
| Retained earnings | 257,079 | 265,118 | |||||||||
| Total stockholders’ equity | 5,433,652 | 5,437,047 | |||||||||
| Noncontrolling Interests | |||||||||||
| Common units of the Operating Partnership | 53,386 | 53,524 | |||||||||
| Noncontrolling interests in consolidated property partnerships | 185,384 | 184,390 | |||||||||
| Total noncontrolling interests | 238,770 | 237,914 | |||||||||
| Total equity | 5,672,422 | 5,674,961 | |||||||||
| TOTAL LIABILITIES AND EQUITY | $ | 10,969,392 | $ | 10,796,987 | |||||||
| Three Months Ended March 31, | |||||||||||
| 2023 | 2022 | ||||||||||
| REVENUES | |||||||||||
| Rental income | $ | 290,104 | $ | 263,208 | |||||||
| Other property income | 2,698 | 2,293 | |||||||||
| Total revenues | 292,802 | 265,501 | |||||||||
| EXPENSES | |||||||||||
| Property expenses | 53,780 | 45,424 | |||||||||
| Real estate taxes | 28,228 | 25,870 | |||||||||
| Ground leases | 2,369 | 1,826 | |||||||||
| General and administrative expenses | 23,936 | 22,781 | |||||||||
| Leasing costs | 1,372 | 1,013 | |||||||||
| Depreciation and amortization | 93,676 | 88,660 | |||||||||
| Total expenses | 203,361 | 185,574 | |||||||||
| OTHER INCOME (EXPENSES) | |||||||||||
| Interest and other income, net | 1,460 | 81 | |||||||||
| Interest expense | (25,671) | (20,625) | |||||||||
| Total other expenses | (24,211) | (20,544) | |||||||||
| NET INCOME | 65,230 | 59,383 | |||||||||
| Net income attributable to noncontrolling common units of the Operating Partnership | (560) | (516) | |||||||||
| Net income attributable to noncontrolling interests in consolidated property partnerships | (8,062) | (5,739) | |||||||||
| Total income attributable to noncontrolling interests | (8,622) | (6,255) | |||||||||
| NET INCOME AVAILABLE TO COMMON STOCKHOLDERS | $ | 56,608 | $ | 53,128 | |||||||
| Weighted average common shares outstanding – basic | 117,059 | 116,650 | |||||||||
| Weighted average common shares outstanding – diluted | 117,407 | 117,060 | |||||||||
| Net income available to common stockholders per share – basic | $ | 0.48 | $ | 0.45 | |||||||
| Net income available to common stockholders per share – diluted | $ | 0.48 | $ | 0.45 | |||||||
| Three Months Ended March 31, | |||||||||||
| 2023 | 2022 | ||||||||||
| Net income available to common stockholders | $ | 56,608 | $ | 53,128 | |||||||
| Adjustments: | |||||||||||
| Net income attributable to noncontrolling common units of the Operating Partnership | 560 | 516 | |||||||||
| Net income attributable to noncontrolling interests in consolidated property partnerships | 8,062 | 5,739 | |||||||||
| Depreciation and amortization of real estate assets | 91,671 | 87,001 | |||||||||
| Funds From Operations attributable to noncontrolling interests in consolidated property partnerships | (10,942) | (8,618) | |||||||||
Funds From Operations(1)(2)(3) |
$ | 145,959 | $ | 137,766 | |||||||
Weighted average common shares/units outstanding – basic (4) |
118,818 | 118,628 | |||||||||
Weighted average common shares/units outstanding – diluted (5) |
119,165 | 119,038 | |||||||||
Funds From Operations per common share/unit – basic (2) |
$ | 1.23 | $ | 1.16 | |||||||
Funds From Operations per common share/unit – diluted (2) |
$ | 1.22 | $ | 1.16 | |||||||