
© 2023 Pegasystems Inc. Investor Session 2023 June 12, 2023
Safe Harbor Statement Certain statements contained in this presentation may be construed as “forward-looking statements” as defined in the Private Securities Litigation Reform Act of 1995. The words expects, anticipates, intends, plans, believes, will, could, should, estimates, may, targets, strategies, intends to, projects, forecasts, guidance, likely, and usually or variations of such words and other similar expressions identify forward-looking statements, which speak only as of the date the statement was made and are based on current expectations and assumptions. Because such statements deal with future events, they are subject to various risks and uncertainties. Actual results for fiscal year 2023 and beyond could differ materially from the Company’s current expectations. Factors that could cause the Company’s results to differ materially from those expressed in forward-looking statements are contained in the Company’s press release announcing its Q1 2023 earnings, its Annual Report on Form 10-K for the year ended December 31, 2022, its Quarterly Report on Form 10-Q for the quarter ended March 31, 2023 and other recent filings with the United States Securities and Exchange Commission. Investors are cautioned not to place undue reliance on such forward-looking statements and there are no assurances that the results contained in such statements will be achieved. Although subsequent events may cause our view to change, except as required by applicable law, we do not undertake and specifically disclaim any obligation to publicly update or revise these forward-looking statements whether as the result of new information, future events, or otherwise. The forward-looking statements in this presentation represent our views as of June 12, 2023. The information in this presentation is not an offer or commitment by Pegasystems and does not create any legal obligation for Pegasystems, including to deliver any material, code, or functionality. The timing of the development and release of any features or functionality described about our products remains at our sole discretion. Non-GAAP Financial Measures This presentation includes non-GAAP financial measures. Our non-GAAP financial measures are not meant to be considered in isolation or as a substitute for comparable GAAP measures, and it should be read only in conjunction with our consolidated financial statements prepared in accordance with GAAP. For a detailed explanation of the adjustments made to comparable GAAP measures, the reasons why management uses these measures, the usefulness of these measures, and the material limitations on the usefulness of these measures, see the disclosures included with the Company’s press release announcing its Q1 2023 financial results available on our investor relations website at http://www.pega.com/about/investors and the reconciliations included in the appendix to this presentation. 2© Pegasystems Inc.
© 2023 Pegasystems Inc. Financial Update Ken Stillwell | COO & CFO June 12, 2023
Financial Outlook 4 Margin Expansion Opportunities Massive Market Opportunity High Growth, Recurring Model Transition to Subscription Wrapping up in 2023 © Pegasystems Inc.
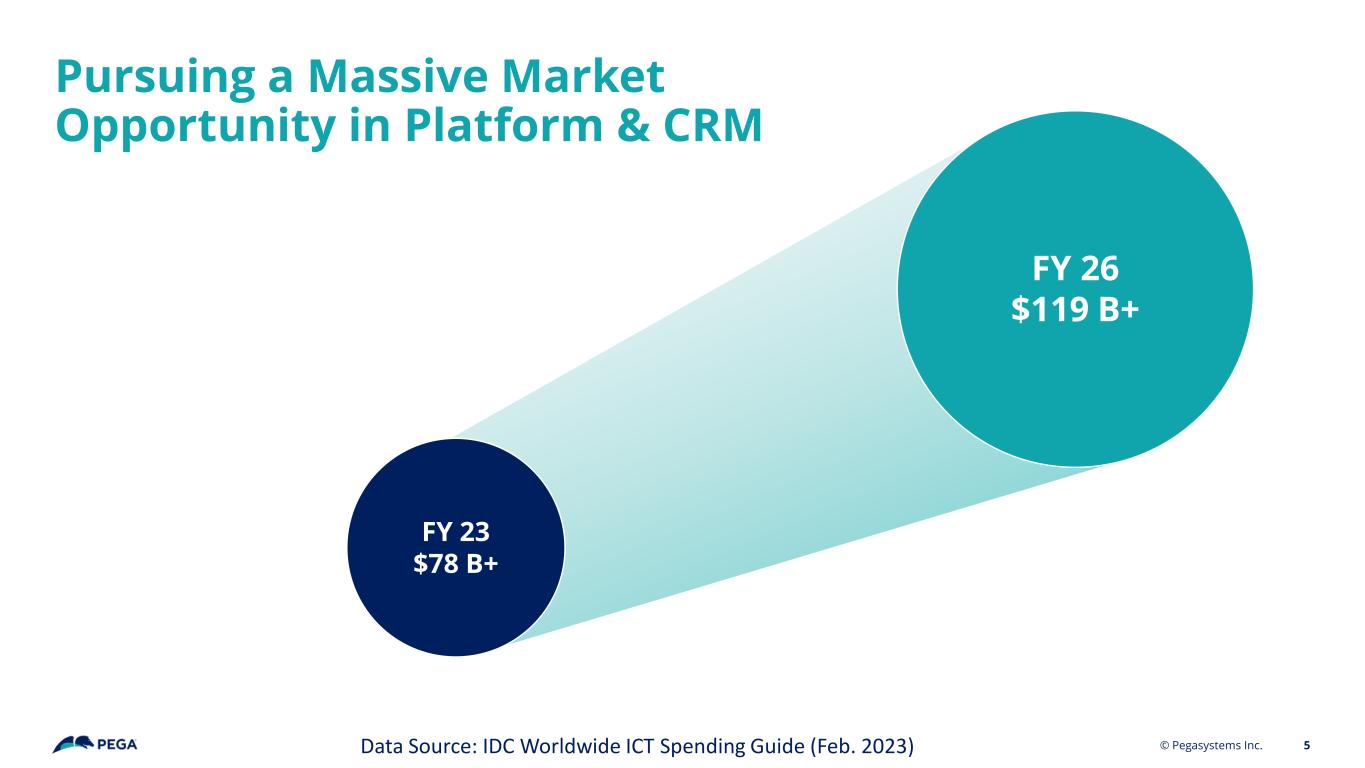
Pursuing a Massive Market Opportunity in Platform & CRM 5 FY 23 $78 B+ FY 26 $119 B+ Data Source: IDC Worldwide ICT Spending Guide (Feb. 2023) © Pegasystems Inc.
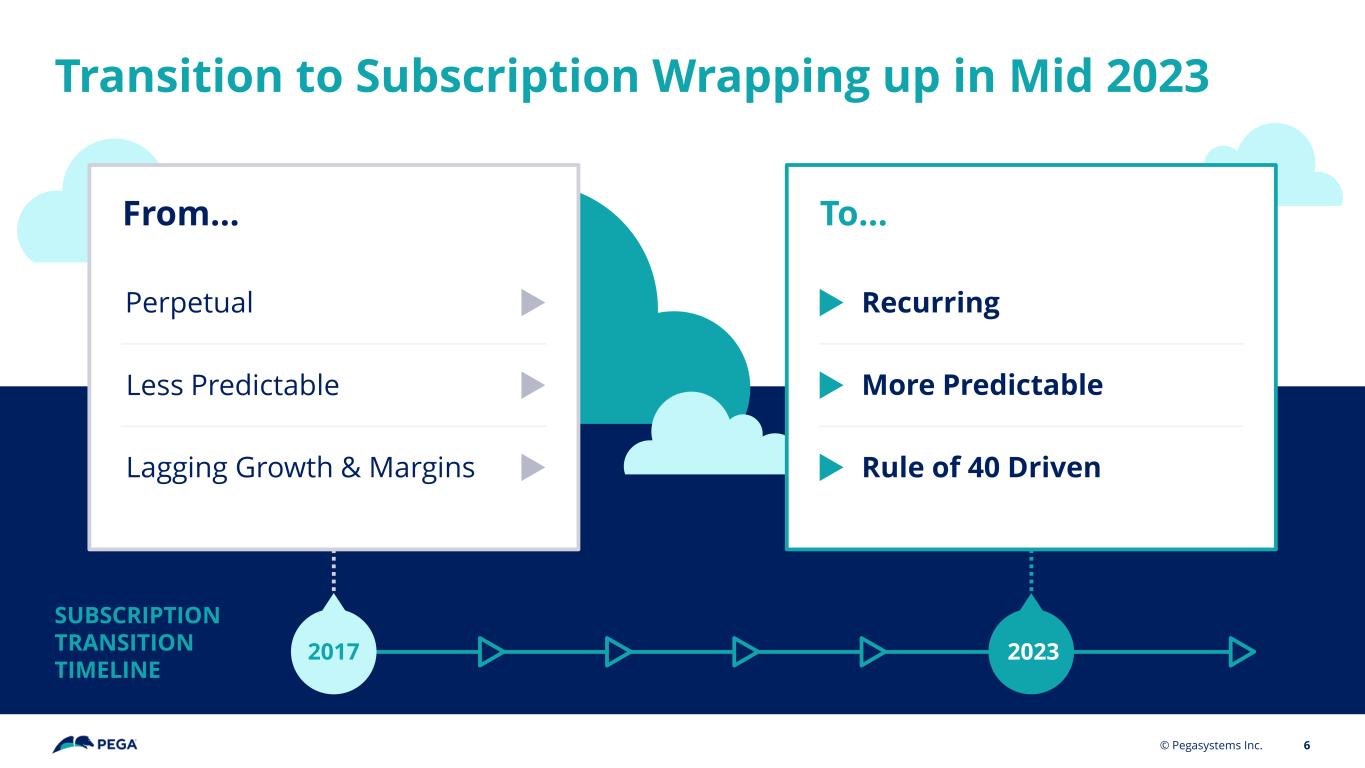
© Pegasystems Inc. 6 SUBSCRIPTION TRANSITION TIMELINE 2017 2023 To…From… Recurring More Predictable Rule of 40 Driven Perpetual Less Predictable Lagging Growth & Margins Transition to Subscription Wrapping up in Mid 2023
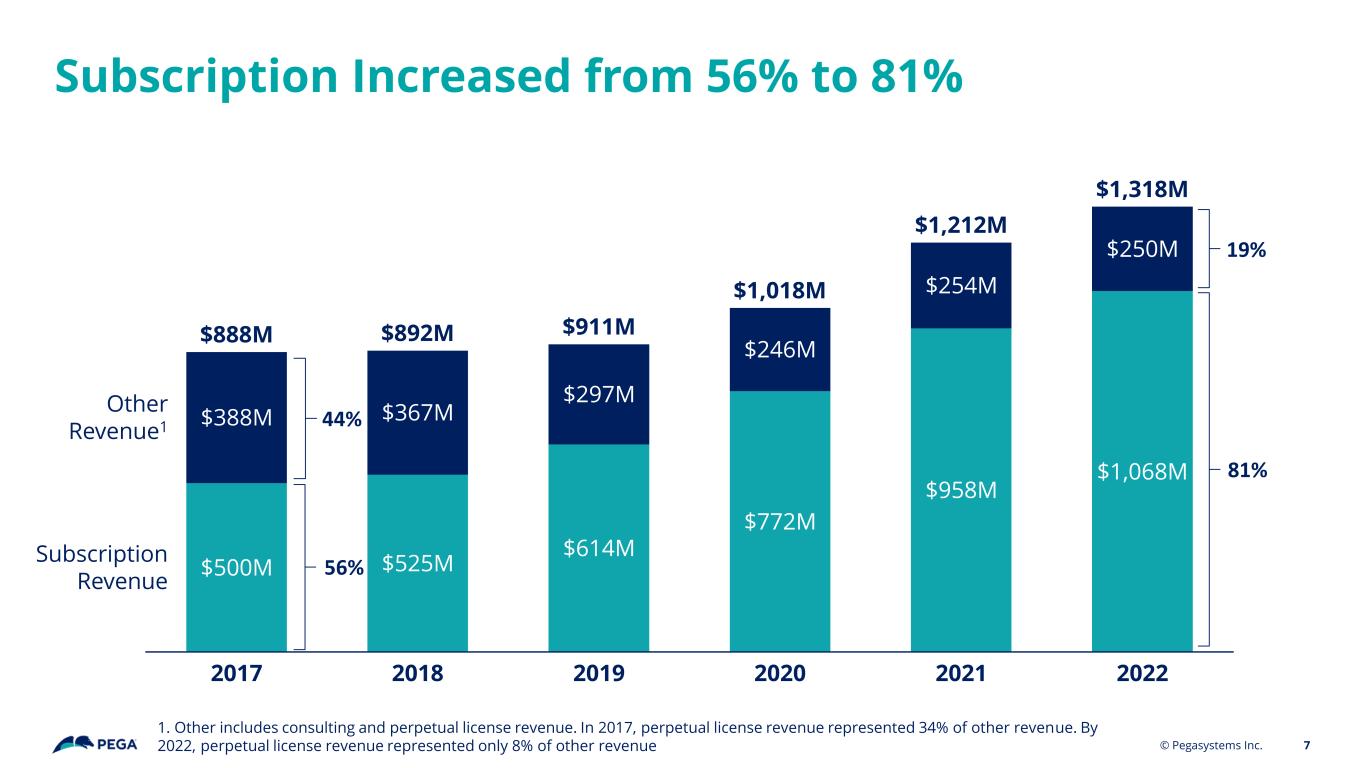
Subscription Increased from 56% to 81% 7 2022 $614M $1,318M $388M $500M 2018 $297M 2017 $525M $367M $772M 2019 $246M $1,212M 2020 $254M Subscription Revenue $958M 2021 $250M $1,068M Other Revenue1 $892M$888M $911M $1,018M 44% 56% © Pegasystems Inc. 19% 81% 1. Other includes consulting and perpetual license revenue. In 2017, perpetual license revenue represented 34% of other revenue. By 2022, perpetual license revenue represented only 8% of other revenue
8 1. Annual Contract Value (ACV)1 Growth 2. Free Cash Flow2 © Pegasystems Inc. 1. Annual Contract Value (ACV) represents the annualized value of our active contracts as of the measurement date. The contract's total value is divided by its duration in years to calculate ACV. ACV is a performance measure that we believe provides useful information to our management and investors. In 2023, we changed our ACV calculation methodology for maintenance and all contracts less than 12 months to align with other contract types. Previously disclosed ACV amounts have been updated to allow for comparability. 2. Free Cash Flow (FCF) is calculated as cash provided by operating activities adjusted for the net impact of (a) investment in property and equipment, (b) interest expense, and (c) other items outside the ordinary operations of the business. Transition to Subscription: Key Growth Metrics as we Finish the Transition
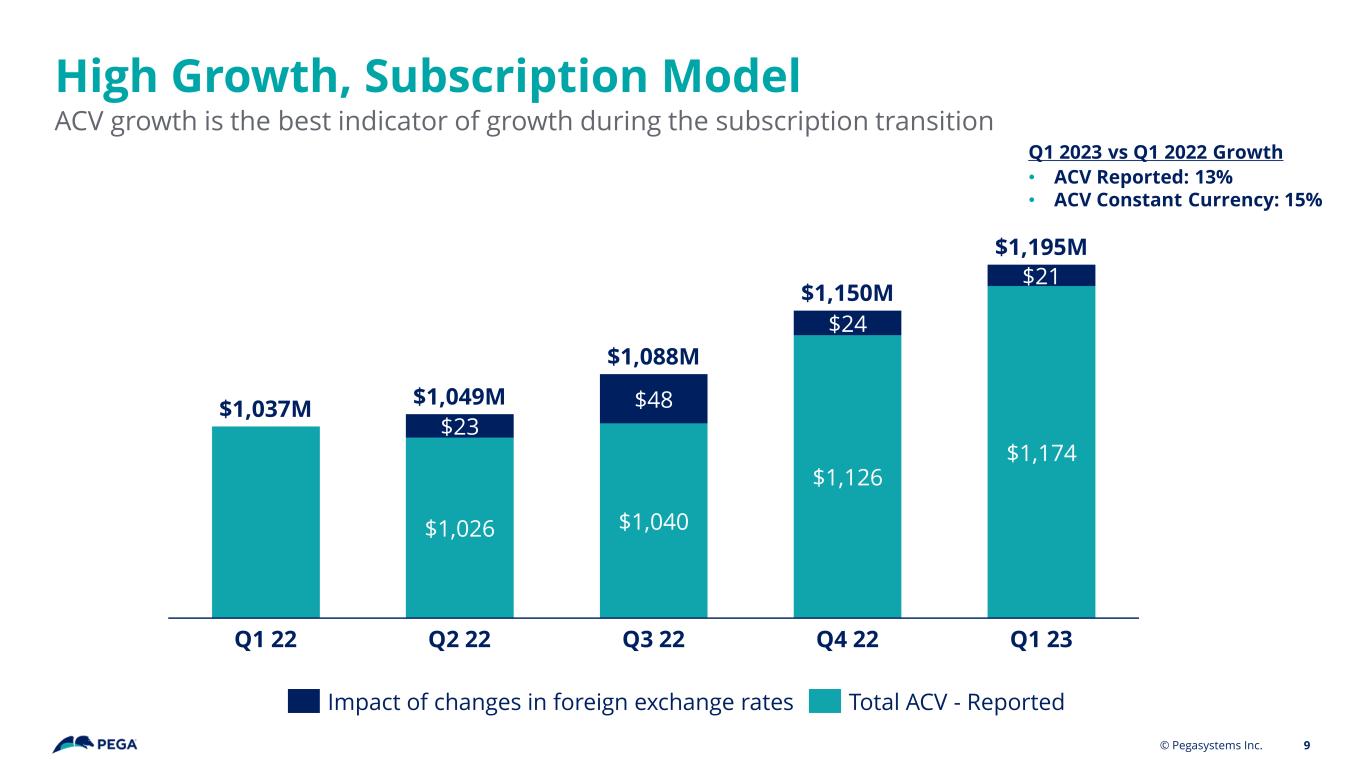
High Growth, Subscription Model ACV growth is the best indicator of growth during the subscription transition © Pegasystems Inc. 9 $1,026 $1,040 $1,126 $1,174 $23 $48 $24 $21 $1,037M Q2 22Q1 22 Q3 22 Q4 22 Q1 23 $1,049M $1,088M $1,150M $1,195M Q1 2023 vs Q1 2022 Growth • ACV Reported: 13% • ACV Constant Currency: 15% Impact of changes in foreign exchange rates Total ACV - Reported
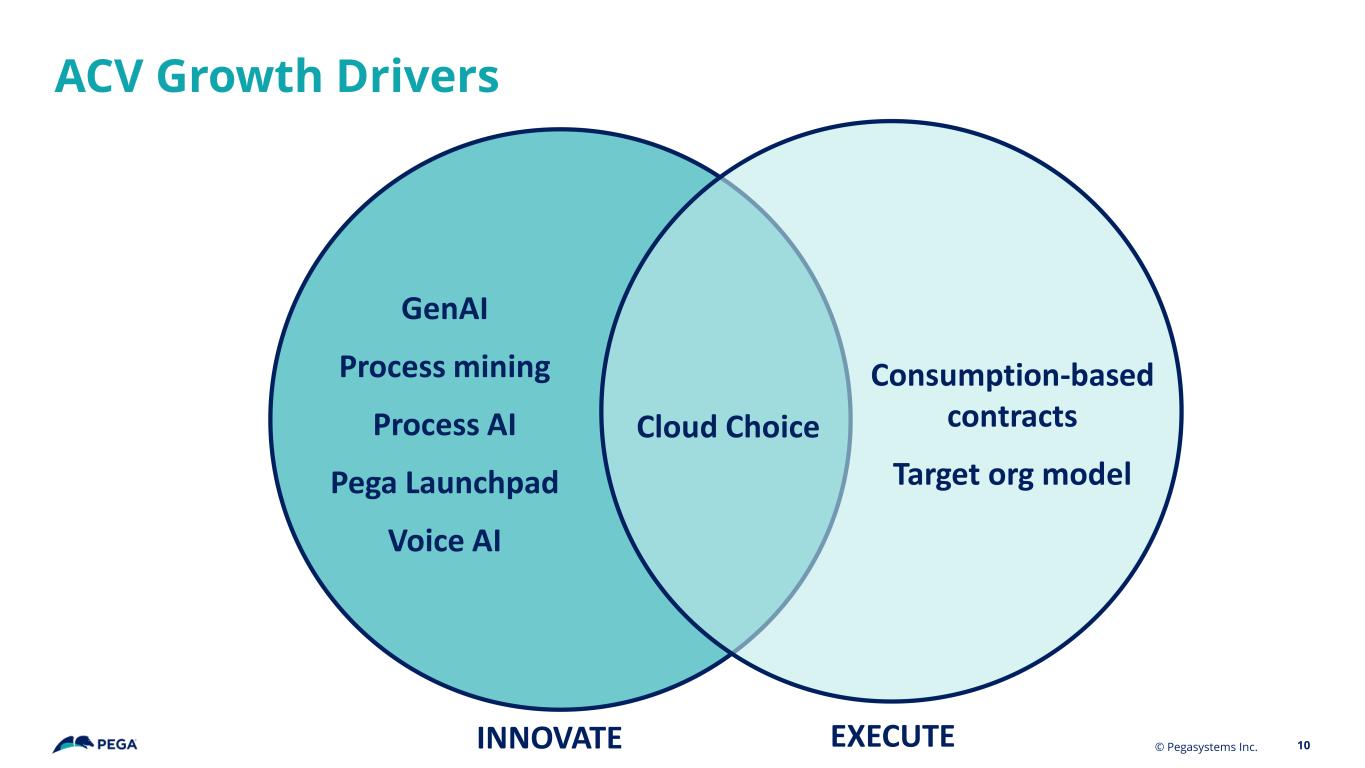
ACV Growth Drivers GenAI Process mining Process AI Pega Launchpad Voice AI 10© Pegasystems Inc.INNOVATE EXECUTE Consumption-based contracts Target org model Cloud Choice
Transition to Subscription: Key Growth Metrics as we Finish the Transition © Pegasystems Inc. 11 1. Annual Contract Value (ACV)1 Growth 2. Free Cash Flow2 1. Annual Contract Value (ACV) represents the annualized value of our active contracts as of the measurement date. The contract's total value is divided by its duration in years to calculate ACV. ACV is a performance measure that we believe provides useful information to our management and investors. In 2023, we changed our ACV calculation methodology for maintenance and all contracts less than 12 months to align with other contract types. Previously disclosed ACV amounts have been updated to allow for comparability. 2. Free Cash Flow (FCF) is calculated as cash provided by operating activities adjusted for the net impact of (a) investment in property and equipment, (b) interest expense, and (c) other items outside the ordinary operations of the business.
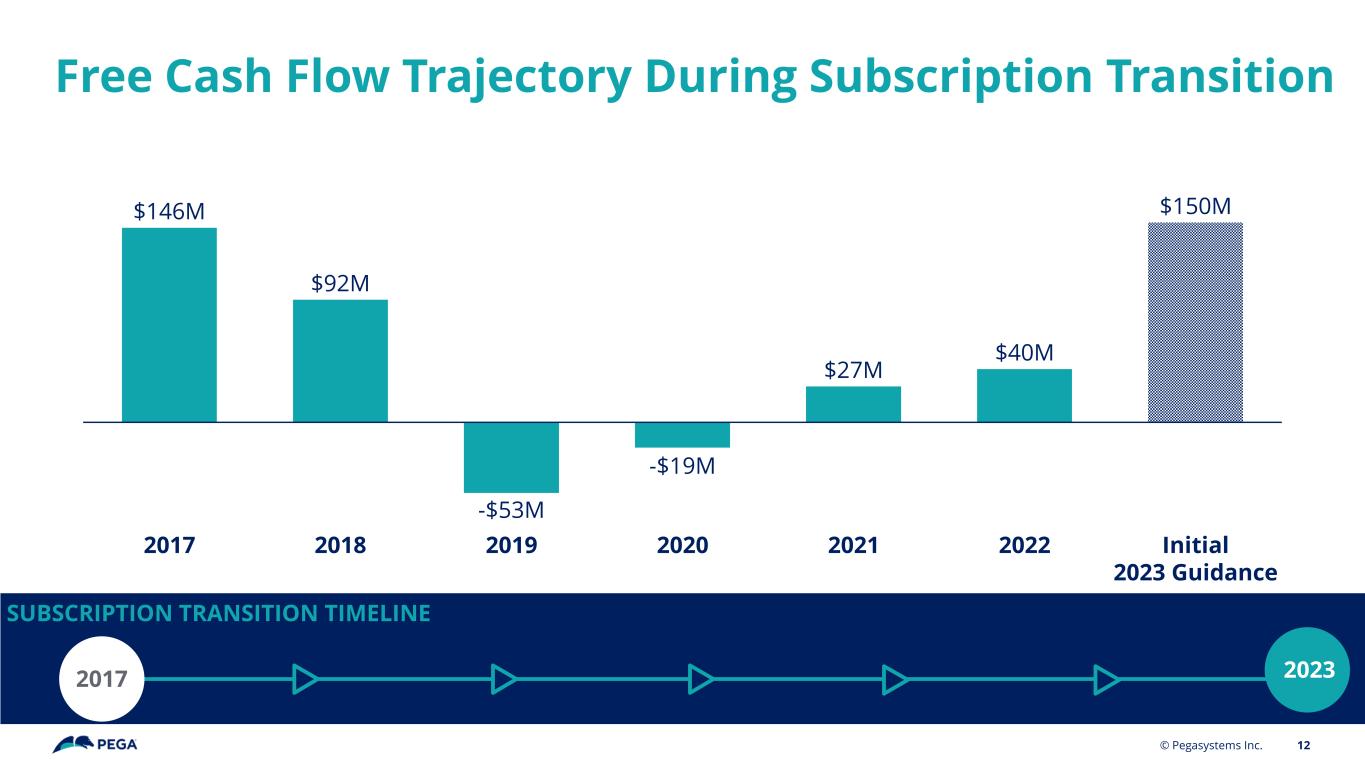
Free Cash Flow Trajectory During Subscription Transition © Pegasystems Inc. 12 SUBSCRIPTION TRANSITION TIMELINE 20232017 $146M $92M -$53M -$19M $27M $40M $150M Initial 2023 Guidance 20182017 2019 2020 20222021
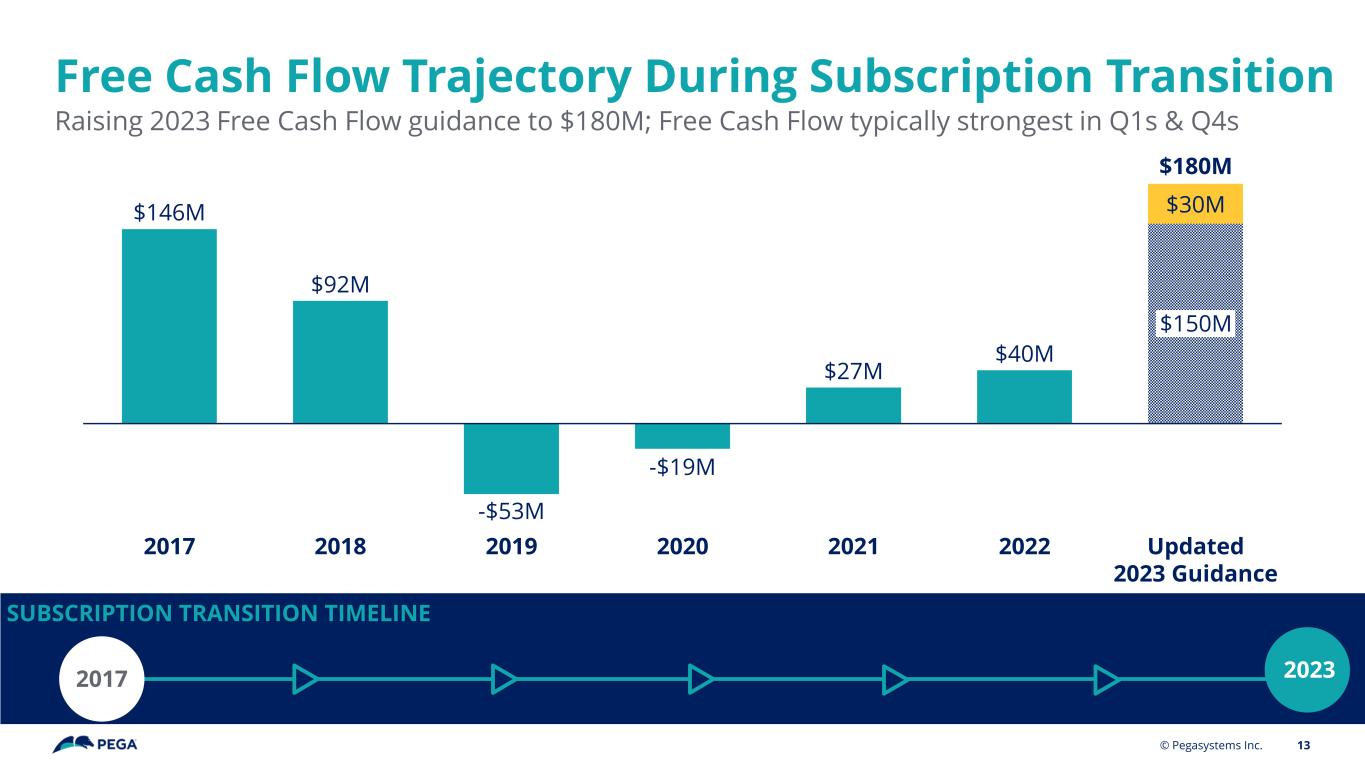
Free Cash Flow Trajectory During Subscription Transition Raising 2023 Free Cash Flow guidance to $180M; Free Cash Flow typically strongest in Q1s & Q4s © Pegasystems Inc. 13 SUBSCRIPTION TRANSITION TIMELINE 20232017 $146M $92M -$53M -$19M $27M $40M $30M $150M 20222017 20212018 2019 2020 Updated 2023 Guidance $180M
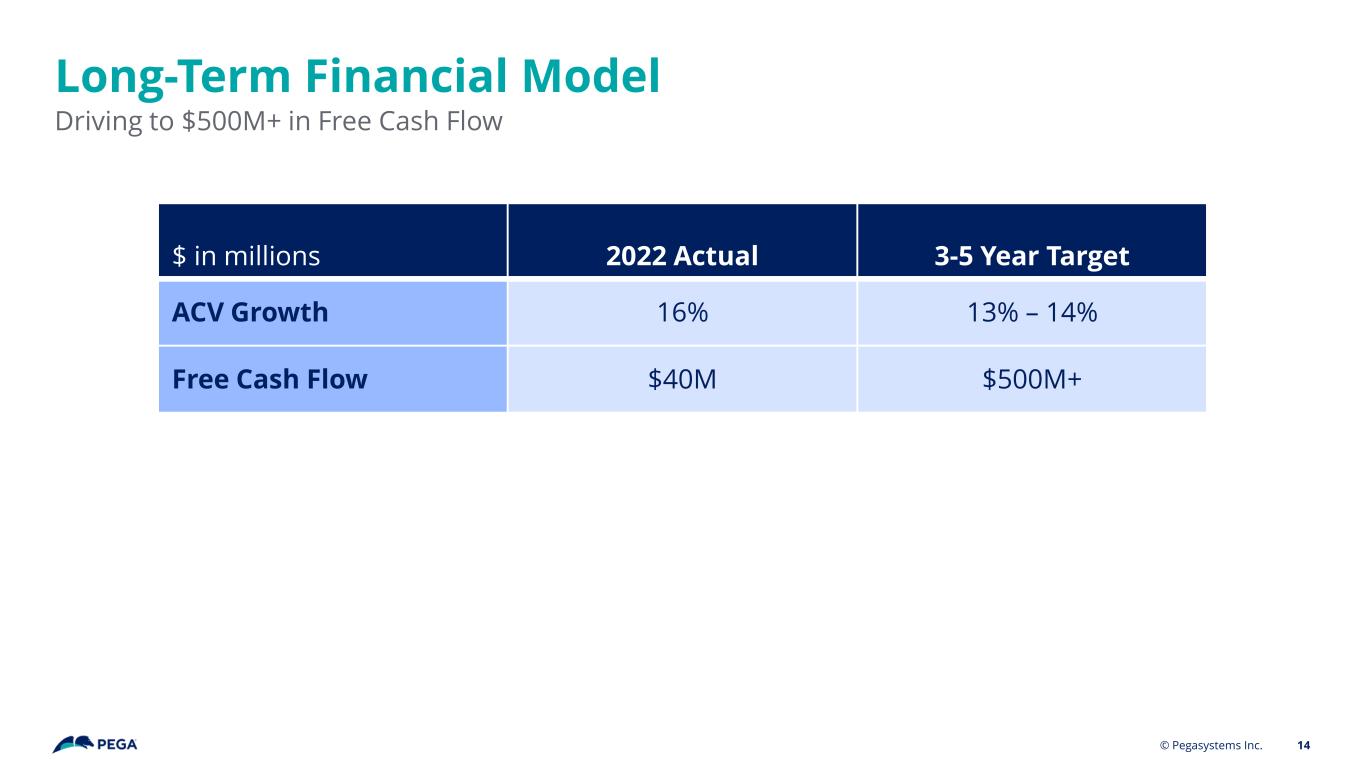
Long-Term Financial Model Driving to $500M+ in Free Cash Flow $ in millions 2022 Actual 3-5 Year Target ACV Growth 16% 13% – 14% Free Cash Flow $40M $500M+ 14© Pegasystems Inc.
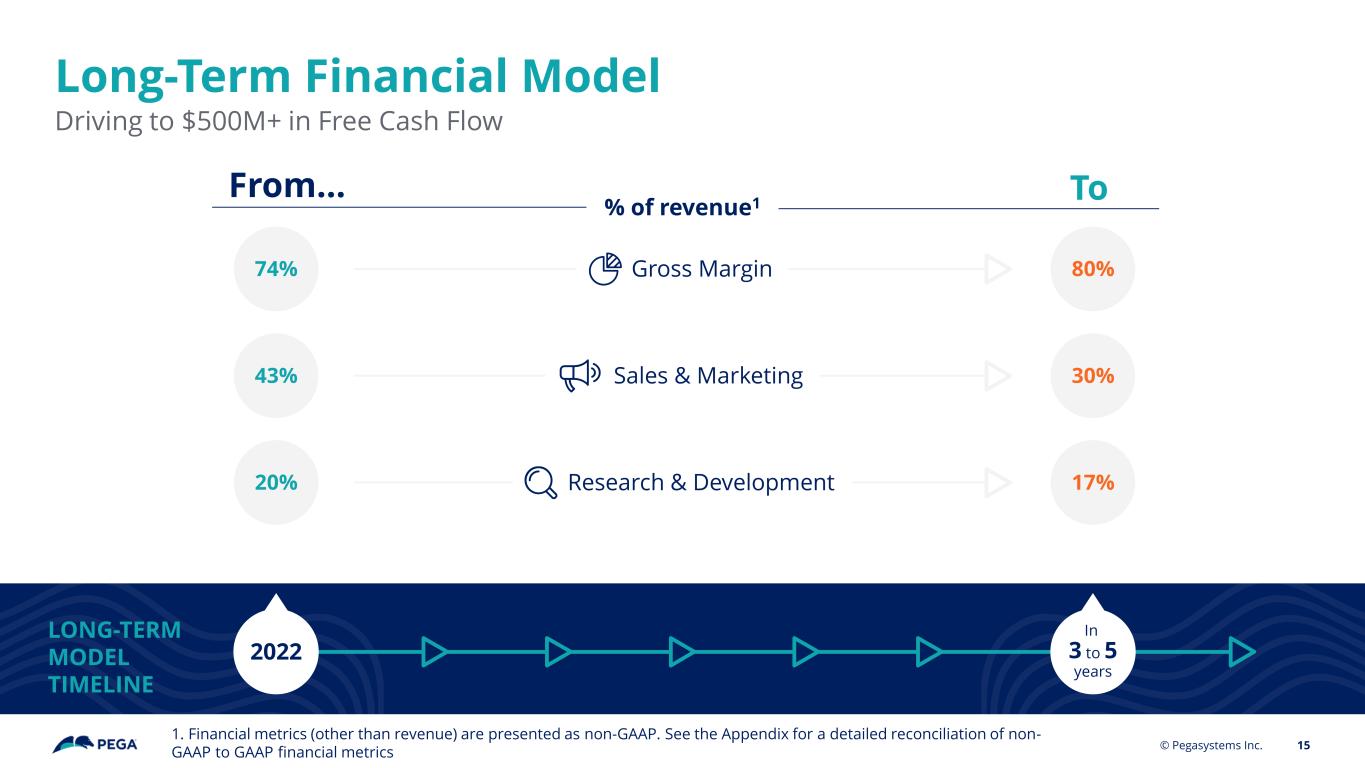
Long-Term Financial Model Driving to $500M+ in Free Cash Flow © Pegasystems Inc. 15 LONG-TERM MODEL TIMELINE 2022 In 3 to 5 years 30%Sales & Marketing43% % of revenue1 Gross Margin 80%74% From… To 17%20% Research & Development 1. Financial metrics (other than revenue) are presented as non-GAAP. See the Appendix for a detailed reconciliation of non- GAAP to GAAP financial metrics
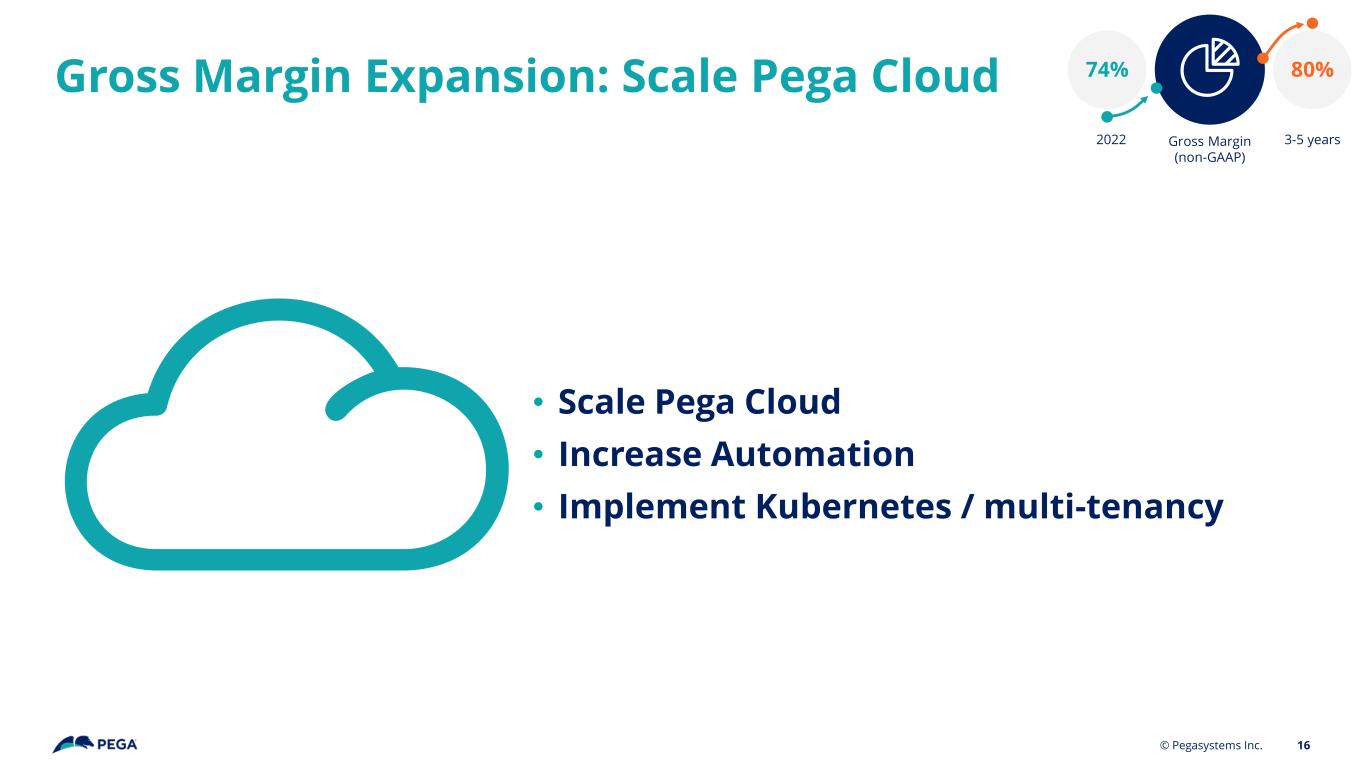
Gross Margin Expansion: Scale Pega Cloud © Pegasystems Inc. 16 80%74% • Scale Pega Cloud • Increase Automation • Implement Kubernetes / multi-tenancy Gross Margin (non-GAAP) 2022 3-5 years
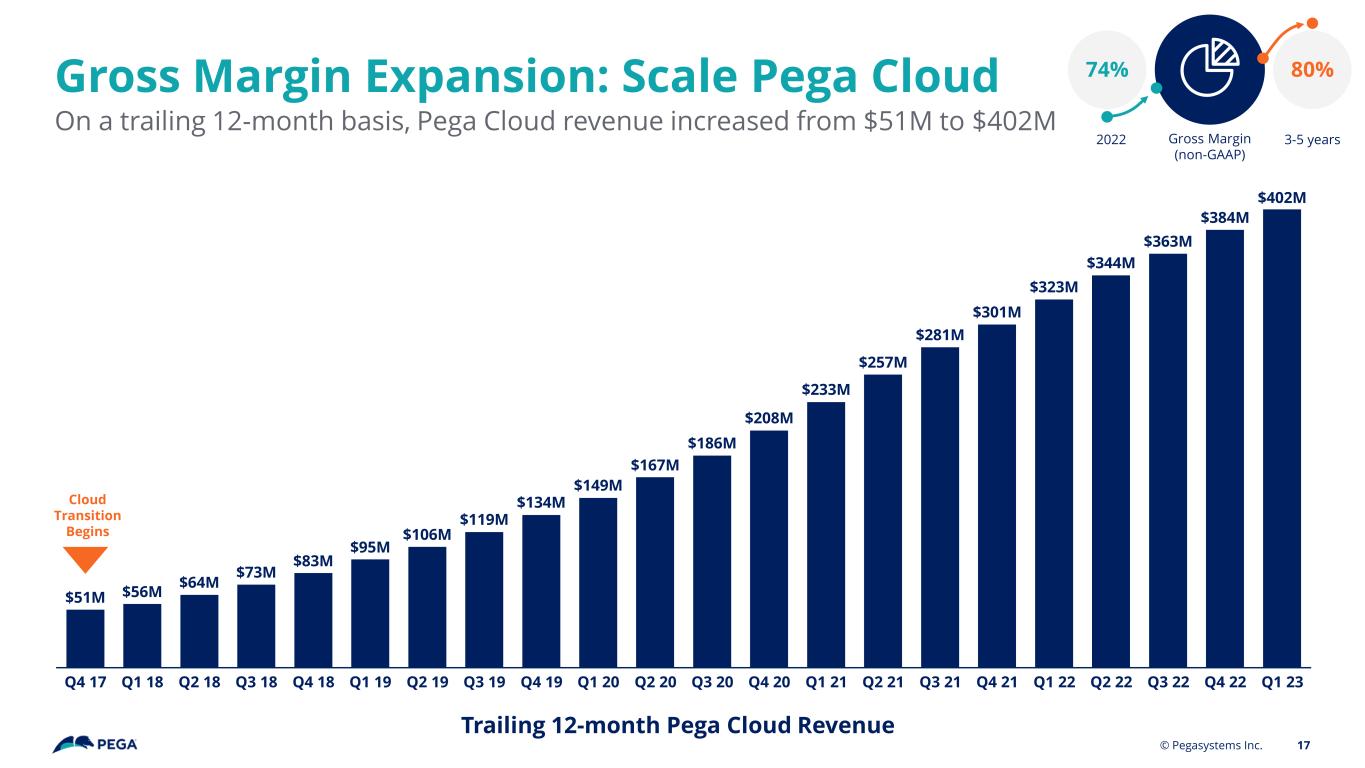
Gross Margin Expansion: Scale Pega Cloud On a trailing 12-month basis, Pega Cloud revenue increased from $51M to $402M © Pegasystems Inc. 17 $51M $56M $64M $73M $83M $95M $106M $119M $134M $149M $167M $186M $208M $233M $257M $281M $301M $323M $344M $363M $384M $402M Q4 17 Q1 18 Q4 19Q4 18Q2 18 Q3 18 Q1 19 Q2 19 Q3 19 Q2 22 Q4 22Q2 20 Q3 21Q1 20 Q3 20 Q2 21Q4 20 Q1 21 Q4 21 Q1 22 Q3 22 Q1 23 Cloud Transition Begins 80%74% Gross Margin (non-GAAP) 2022 3-5 years Trailing 12-month Pega Cloud Revenue
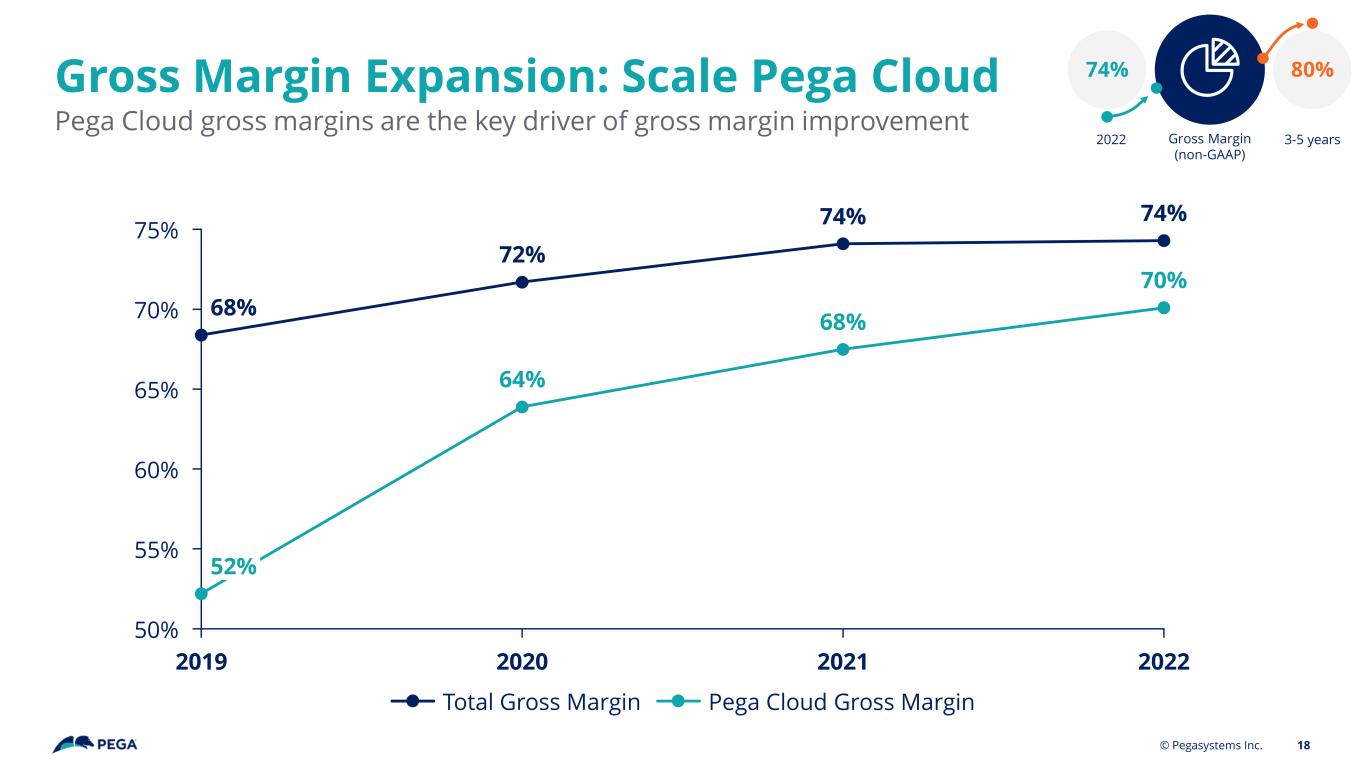
Gross Margin Expansion: Scale Pega Cloud Pega Cloud gross margins are the key driver of gross margin improvement © Pegasystems Inc. 18 2019 2020 2021 2022 50% 70% 55% 60% 65% 75% 68% 52% 72% 64% 74% 68% 74% 70% 80%74% Total Gross Margin Pega Cloud Gross Margin Gross Margin (non-GAAP) 2022 3-5 years
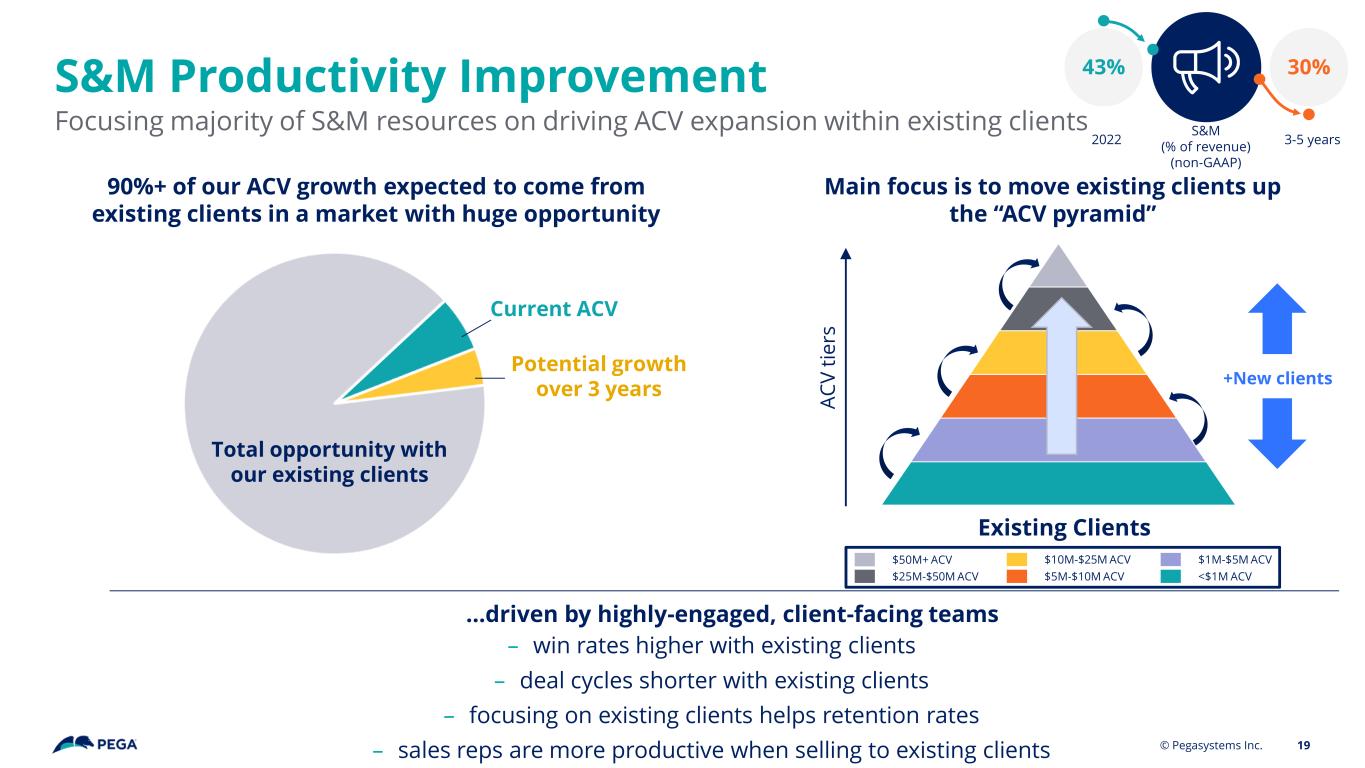
Total opportunity with our existing clients Current ACV Potential growth over 3 years 90%+ of our ACV growth expected to come from existing clients in a market with huge opportunity +New clients A C V t ie rs Main focus is to move existing clients up the “ACV pyramid” – win rates higher with existing clients – deal cycles shorter with existing clients – focusing on existing clients helps retention rates – sales reps are more productive when selling to existing clients <$1M ACV $50M+ ACV $25M-$50M ACV $10M-$25M ACV $5M-$10M ACV $1M-$5M ACV 30%43%S&M Productivity Improvement Focusing majority of S&M resources on driving ACV expansion within existing clients S&M (% of revenue) (non-GAAP) 2022 3-5 years 19© Pegasystems Inc. Existing Clients …driven by highly-engaged, client-facing teams
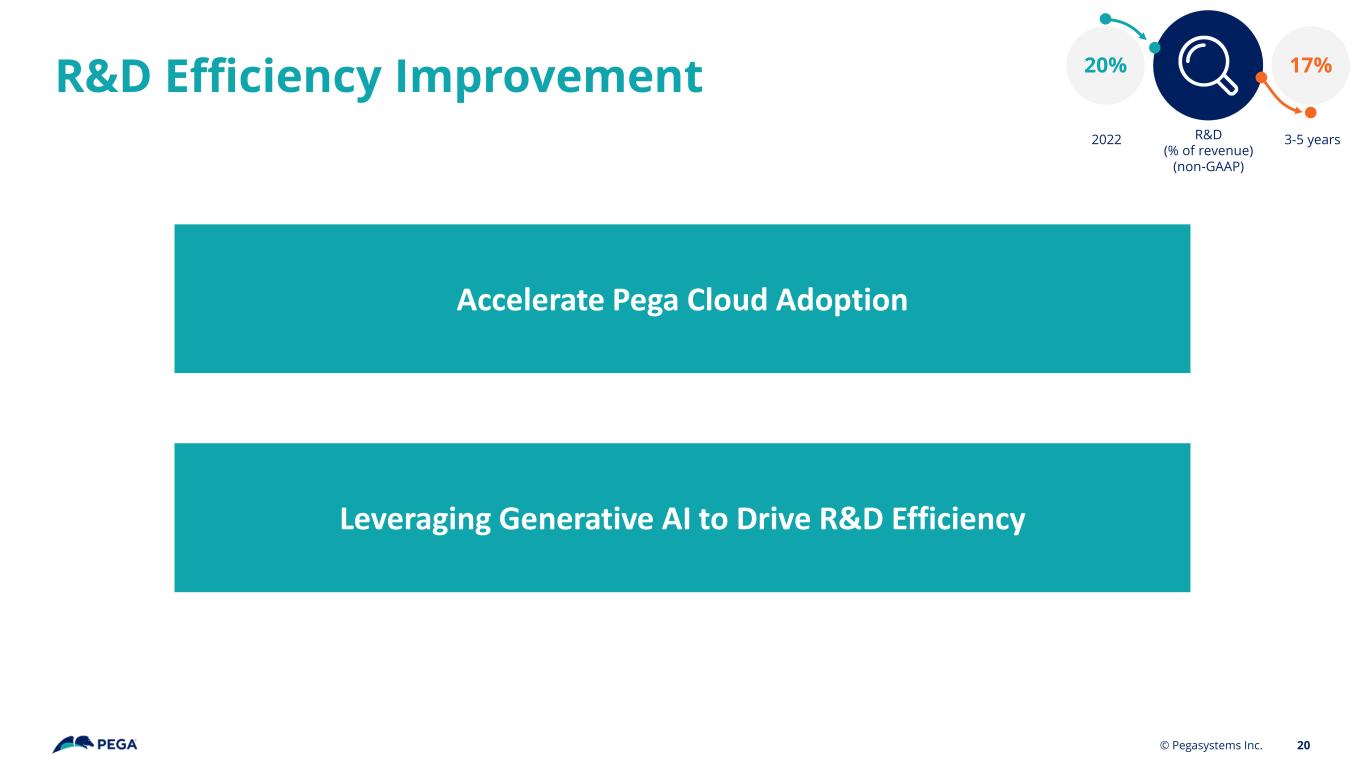
R&D Efficiency Improvement © Pegasystems Inc. 20 Accelerate Pega Cloud Adoption 17%20% Leveraging Generative AI to Drive R&D Efficiency R&D (% of revenue) (non-GAAP) 2022 3-5 years
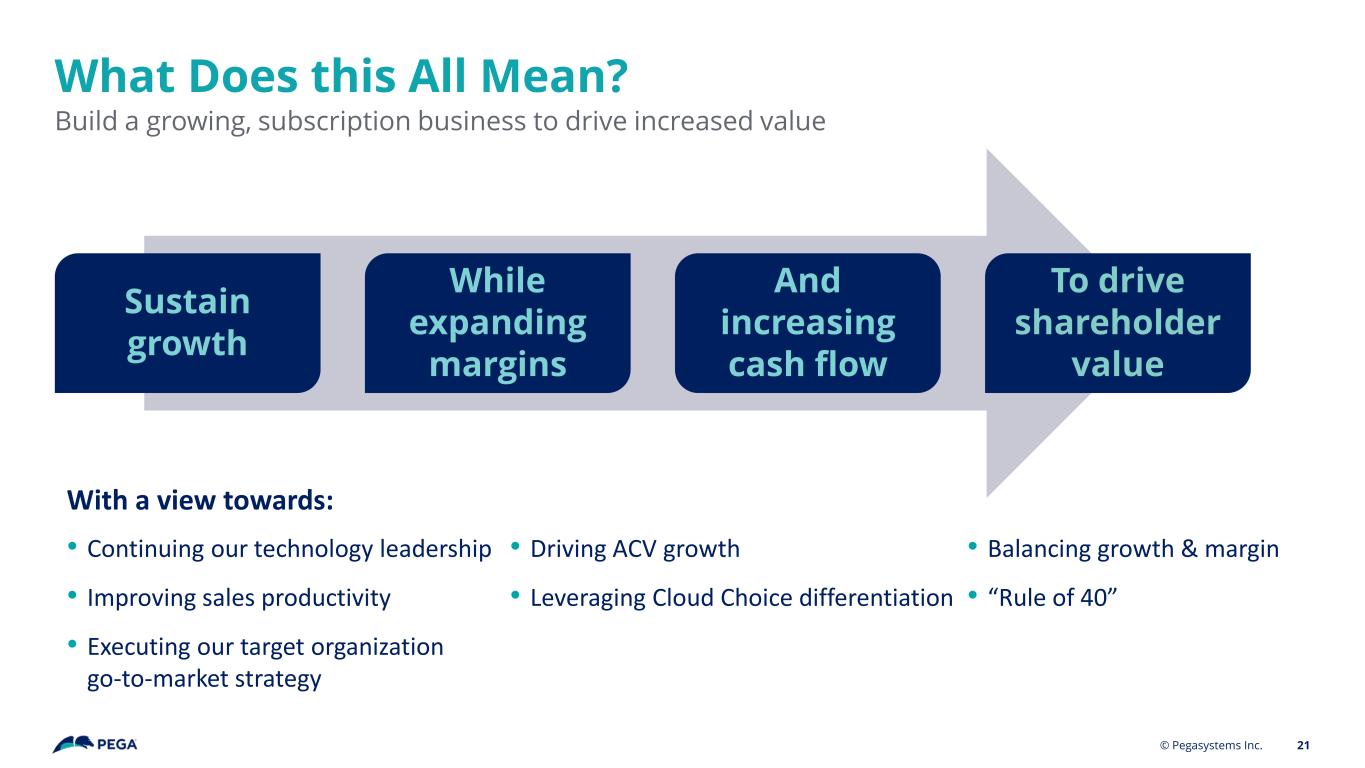
What Does this All Mean? Build a growing, subscription business to drive increased value 21 • Continuing our technology leadership • Improving sales productivity • Executing our target organization go-to-market strategy • Driving ACV growth • Leveraging Cloud Choice differentiation • Balancing growth & margin • “Rule of 40” Sustain growth While expanding margins And increasing cash flow To drive shareholder value © Pegasystems Inc. With a view towards: © Pegasystems Inc.
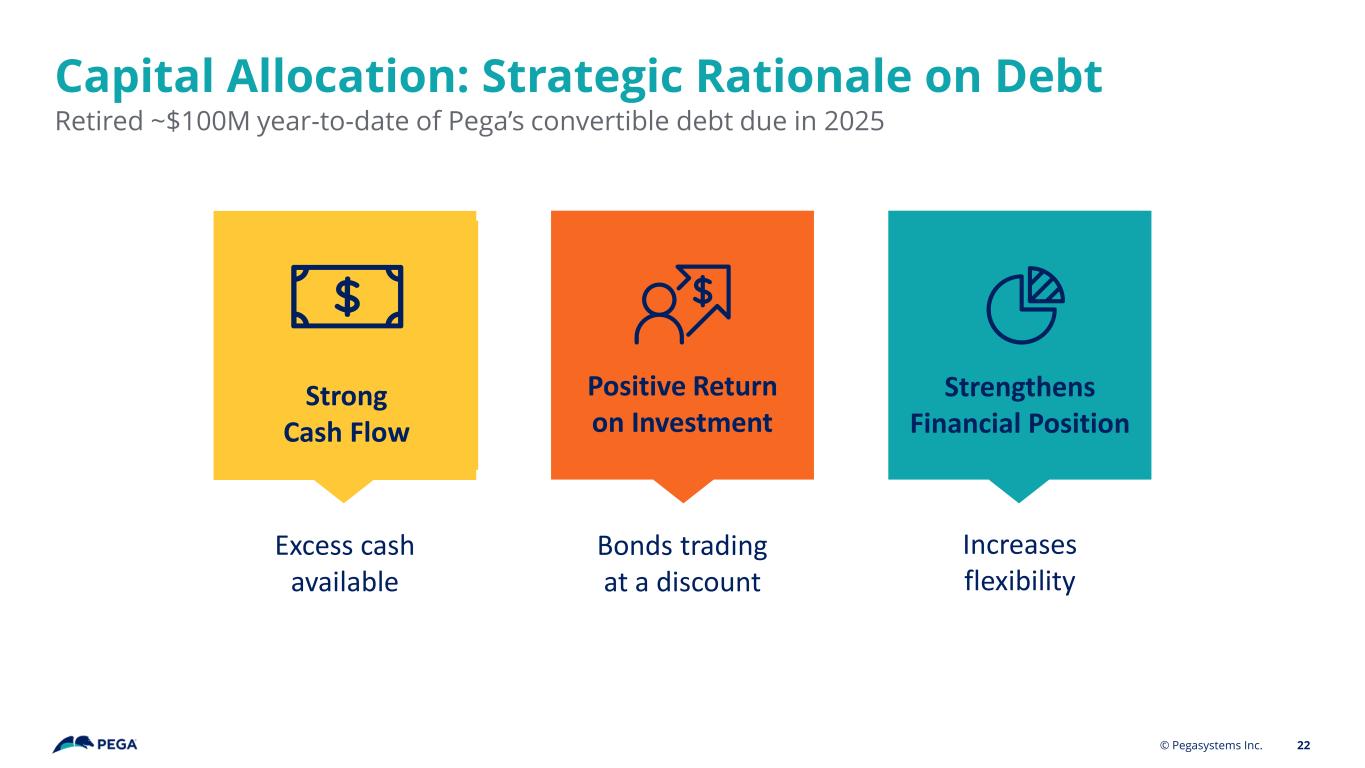
Excess cash available Bonds trading at a discount Capital Allocation: Strategic Rationale on Debt Retired ~$100M year-to-date of Pega’s convertible debt due in 2025 22 Strong Cash Flow Positive Return on Investment Strengthens Financial Position Increases flexibility © Pegasystems Inc.
© 2023 Pegasystems Inc. Q&A Ken Stillwell | COO & CFO
To Ask a Question… 24 IN THE ROOM ON THE PHONE • Raise your hand • Wait for the microphone • Please state your name and the firm you are with • Email pegainvestorrelations@pega.com or peter.welburn@pega.com © Pegasystems Inc.
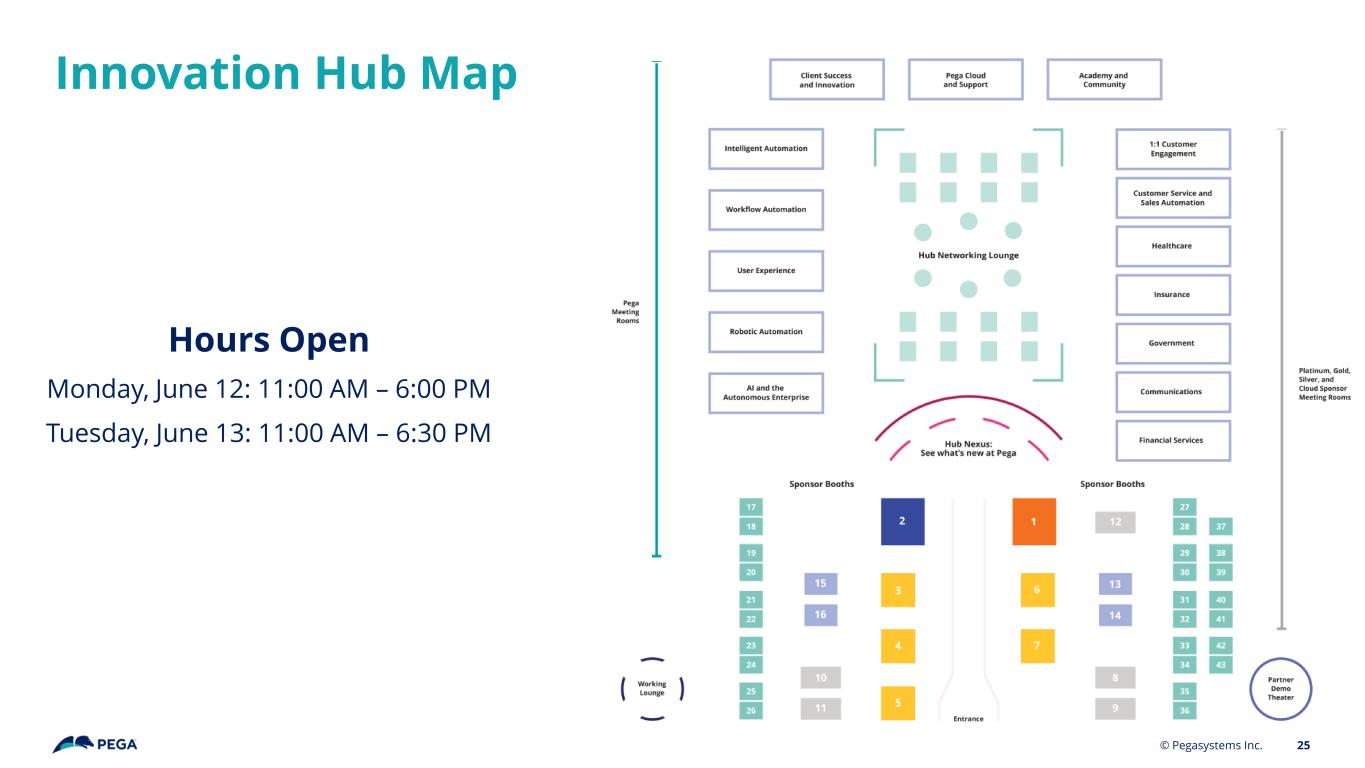
25 Hours Open Monday, June 12: 11:00 AM – 6:00 PM Tuesday, June 13: 11:00 AM – 6:30 PM Innovation Hub Map © Pegasystems Inc.

Appendix 26© Pegasystems Inc.
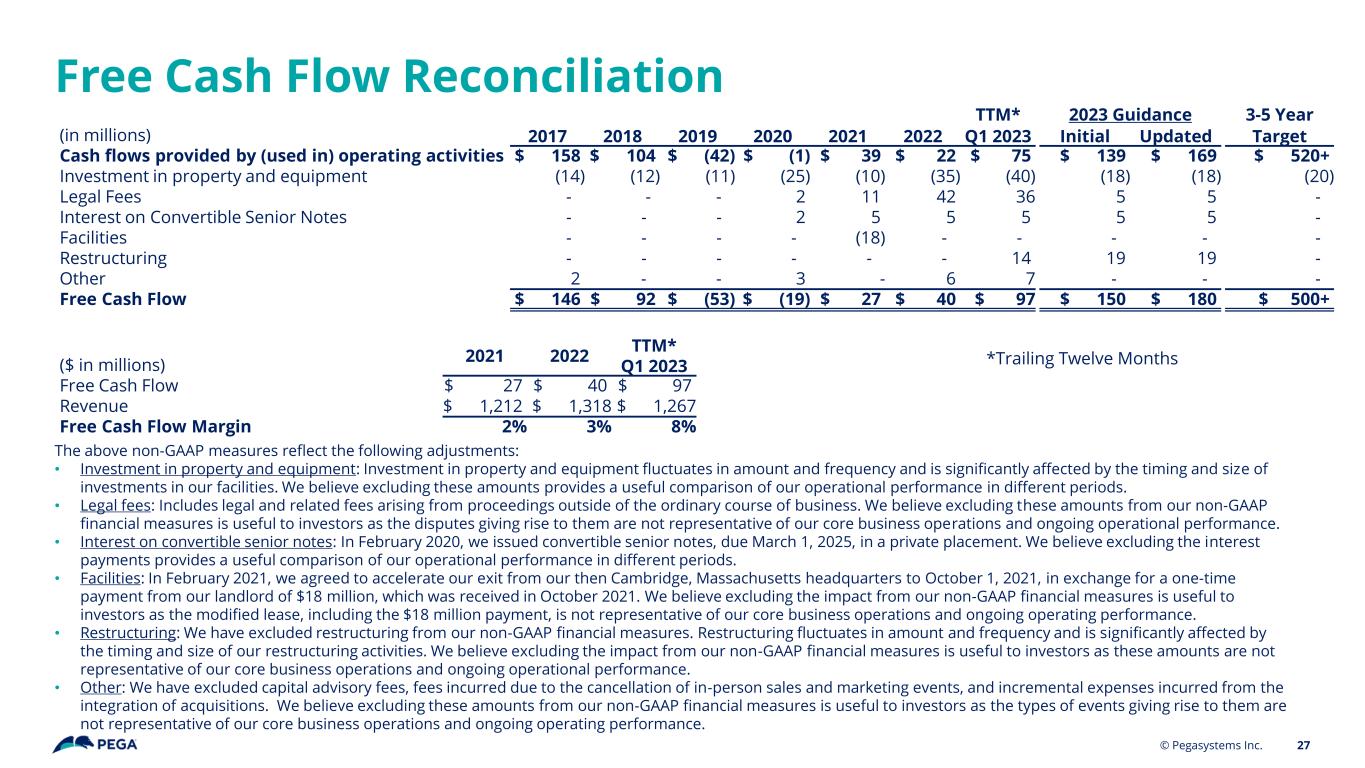
Free Cash Flow Reconciliation 27 TTM* 2023 Guidance 3-5 Year (in millions) 2017 2018 2019 2020 2021 2022 Q1 2023 Initial Updated Target Cash flows provided by (used in) operating activities $ 158 $ 104 $ (42) $ (1) $ 39 $ 22 $ 75 $ 139 $ 169 $ 520+ Investment in property and equipment (14) (12) (11) (25) (10) (35) (40) (18) (18) (20) Legal Fees - - - 2 11 42 36 5 5 - Interest on Convertible Senior Notes - - - 2 5 5 5 5 5 - Facilities - - - - (18) - - - - - Restructuring - - - - - - 14 19 19 - Other 2 - - 3 - 6 7 - - - Free Cash Flow $ 146 $ 92 $ (53) $ (19) $ 27 $ 40 $ 97 $ 150 $ 180 $ 500+ The above non-GAAP measures reflect the following adjustments: • Investment in property and equipment: Investment in property and equipment fluctuates in amount and frequency and is significantly affected by the timing and size of investments in our facilities. We believe excluding these amounts provides a useful comparison of our operational performance in different periods. • Legal fees: Includes legal and related fees arising from proceedings outside of the ordinary course of business. We believe excluding these amounts from our non-GAAP financial measures is useful to investors as the disputes giving rise to them are not representative of our core business operations and ongoing operational performance. • Interest on convertible senior notes: In February 2020, we issued convertible senior notes, due March 1, 2025, in a private placement. We believe excluding the interest payments provides a useful comparison of our operational performance in different periods. • Facilities: In February 2021, we agreed to accelerate our exit from our then Cambridge, Massachusetts headquarters to October 1, 2021, in exchange for a one-time payment from our landlord of $18 million, which was received in October 2021. We believe excluding the impact from our non-GAAP financial measures is useful to investors as the modified lease, including the $18 million payment, is not representative of our core business operations and ongoing operating performance. • Restructuring: We have excluded restructuring from our non-GAAP financial measures. Restructuring fluctuates in amount and frequency and is significantly affected by the timing and size of our restructuring activities. We believe excluding the impact from our non-GAAP financial measures is useful to investors as these amounts are not representative of our core business operations and ongoing operational performance. • Other: We have excluded capital advisory fees, fees incurred due to the cancellation of in-person sales and marketing events, and incremental expenses incurred from the integration of acquisitions. We believe excluding these amounts from our non-GAAP financial measures is useful to investors as the types of events giving rise to them are not representative of our core business operations and ongoing operating performance. © Pegasystems Inc. ($ in millions) 2021 2022 TTM* Q1 2023 Free Cash Flow $ 27 $ 40 $ 97 Revenue $ 1,212 $ 1,318 $ 1,267 Free Cash Flow Margin 2% 3% 8% *Trailing Twelve Months
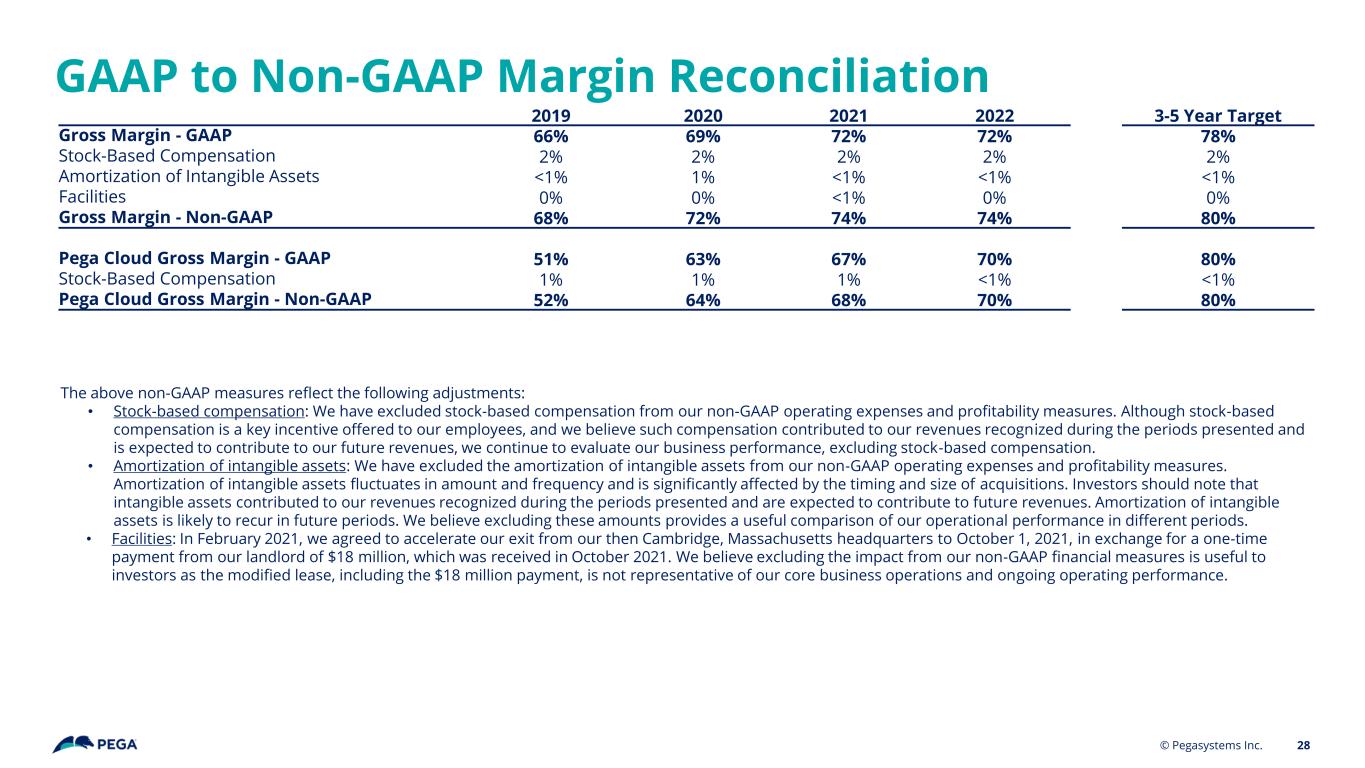
GAAP to Non-GAAP Margin Reconciliation 28 2019 2020 2021 2022 3-5 Year Target Gross Margin - GAAP 66% 69% 72% 72% 78% Stock-Based Compensation 2% 2% 2% 2% 2% Amortization of Intangible Assets <1% 1% <1% <1% <1% Facilities 0% 0% <1% 0% 0% Gross Margin - Non-GAAP 68% 72% 74% 74% 80% Pega Cloud Gross Margin - GAAP 51% 63% 67% 70% 80% Stock-Based Compensation 1% 1% 1% <1% <1% Pega Cloud Gross Margin - Non-GAAP 52% 64% 68% 70% 80% The above non-GAAP measures reflect the following adjustments: • Stock-based compensation: We have excluded stock-based compensation from our non-GAAP operating expenses and profitability measures. Although stock-based compensation is a key incentive offered to our employees, and we believe such compensation contributed to our revenues recognized during the periods presented and is expected to contribute to our future revenues, we continue to evaluate our business performance, excluding stock-based compensation. • Amortization of intangible assets: We have excluded the amortization of intangible assets from our non-GAAP operating expenses and profitability measures. Amortization of intangible assets fluctuates in amount and frequency and is significantly affected by the timing and size of acquisitions. Investors should note that intangible assets contributed to our revenues recognized during the periods presented and are expected to contribute to future revenues. Amortization of intangible assets is likely to recur in future periods. We believe excluding these amounts provides a useful comparison of our operational performance in different periods. • Facilities: In February 2021, we agreed to accelerate our exit from our then Cambridge, Massachusetts headquarters to October 1, 2021, in exchange for a one-time payment from our landlord of $18 million, which was received in October 2021. We believe excluding the impact from our non-GAAP financial measures is useful to investors as the modified lease, including the $18 million payment, is not representative of our core business operations and ongoing operating performance. © Pegasystems Inc.
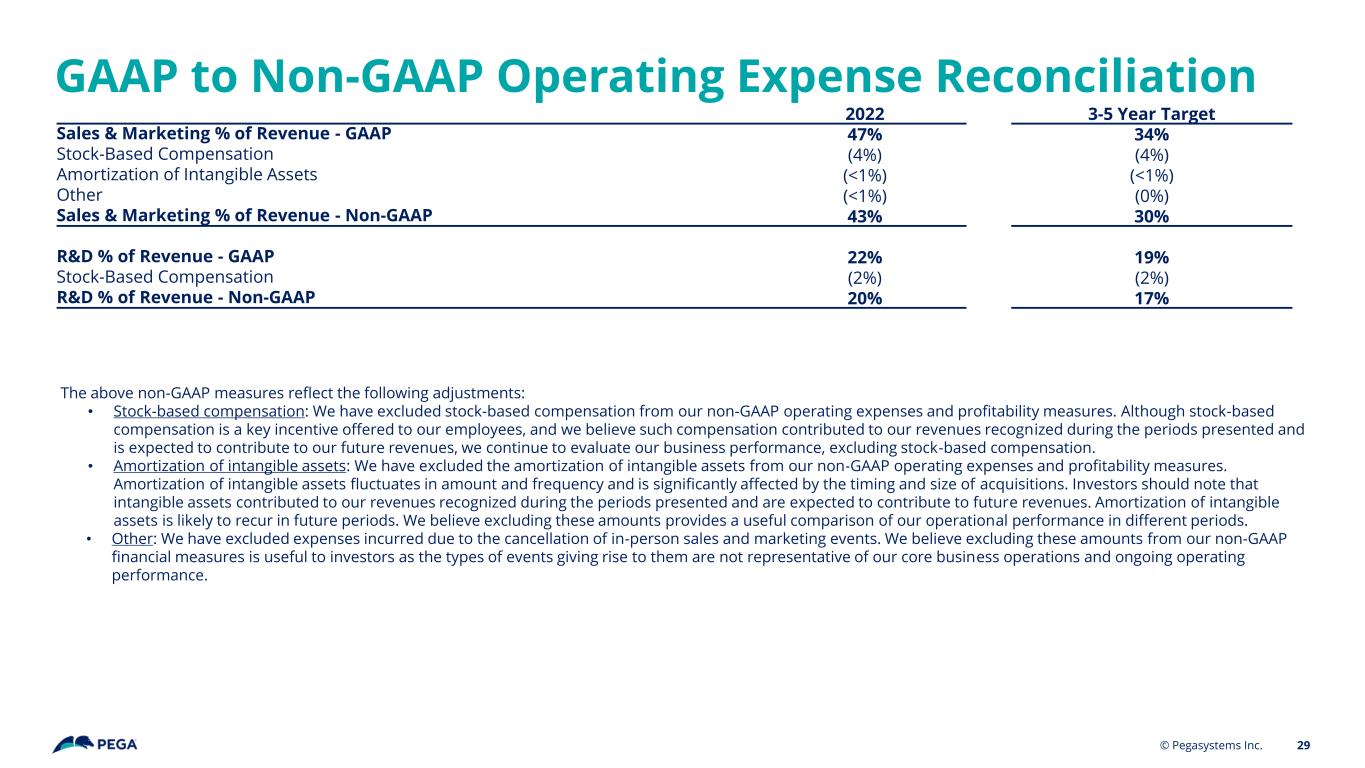
GAAP to Non-GAAP Operating Expense Reconciliation 29 2022 3-5 Year Target Sales & Marketing % of Revenue - GAAP 47% 34% Stock-Based Compensation (4%) (4%) Amortization of Intangible Assets (<1%) (<1%) Other (<1%) (0%) Sales & Marketing % of Revenue - Non-GAAP 43% 30% R&D % of Revenue - GAAP 22% 19% Stock-Based Compensation (2%) (2%) R&D % of Revenue - Non-GAAP 20% 17% The above non-GAAP measures reflect the following adjustments: • Stock-based compensation: We have excluded stock-based compensation from our non-GAAP operating expenses and profitability measures. Although stock-based compensation is a key incentive offered to our employees, and we believe such compensation contributed to our revenues recognized during the periods presented and is expected to contribute to our future revenues, we continue to evaluate our business performance, excluding stock-based compensation. • Amortization of intangible assets: We have excluded the amortization of intangible assets from our non-GAAP operating expenses and profitability measures. Amortization of intangible assets fluctuates in amount and frequency and is significantly affected by the timing and size of acquisitions. Investors should note that intangible assets contributed to our revenues recognized during the periods presented and are expected to contribute to future revenues. Amortization of intangible assets is likely to recur in future periods. We believe excluding these amounts provides a useful comparison of our operational performance in different periods. • Other: We have excluded expenses incurred due to the cancellation of in-person sales and marketing events. We believe excluding these amounts from our non-GAAP financial measures is useful to investors as the types of events giving rise to them are not representative of our core business operations and ongoing operating performance. © Pegasystems Inc.


