UNITED STATES
SECURITIES AND EXCHANGE COMMISSION
Washington, D.C. 20549
FORM 6-K
REPORT OF FOREIGN PRIVATE ISSUER
PURSUANT TO RULE 13a-16 OR 15d-16 OF THE
SECURITIES EXCHANGE ACT OF 1934
For the Month of October 2023
Commission file number 001- 41291
MEIHUA INTERNATIONAL MEDICAL TECHNOLOGIES CO., LTD.
(Translation of registrant’s name into English)
88 Tongda Road, Touqiao Town
Guangling District, Yangzhou, 225000
People’s Republic of China
(Address of principal executive office)
Indicate by check mark whether the registrant files or will file annual reports under cover of Form 20-F or Form 40-F:
Form 20-F ☒ Form 40-F ☐
Explanatory Note
Meihua International Medical Technologies Co., Ltd. (the “Company”) is furnishing its unaudited financial statements for the six months ended June 30, 2023 and incorporating such financial statements into the Company’s registration statement referenced below. The financial statements and notes are attached as Exhibit 99.1 to this report. Management’s Discussion and Analysis of Financial Condition and Results of Operations for the six months ended June 30, 2023 is attached as Exhibit 99.2 to this report.
This Form 6-K is hereby incorporated by reference into the registration statement on Form F-3 of the Company (File Number 333-274194), as amended, and into the prospectus contained within the foregoing registration statement, to the extent not superseded by documents or reports subsequently filed or furnished by the Company under the Securities Act of 1933, as amended, or the Securities Exchange Act of 1934, as amended.
EXHIBIT INDEX
| Exhibit No. | Description | |
| 99.1 | Unaudited Condensed Consolidated Financial Statements for the Six Months Ended June 30, 2023 and 2022 | |
| 99.2 | Management’s Discussion and Analysis of Financial Condition and Results of Operations | |
| 99.3 | Press Release, dated October 2, 2023 | |
| 101.INS | Inline XBRL Instance Document | |
| 101.SCH | Inline XBRL Taxonomy Extension Schema Document | |
| 101.CAL | Inline XBRL Taxonomy Extension Calculation Linkbase Document | |
| 101.DEF | Inline XBRL Taxonomy Extension Definition Linkbase Document | |
| 101.LAB | Inline XBRL Taxonomy Extension Label Linkbase Document | |
| 101.PRE | Inline XBRL Taxonomy Extension Presentation Linkbase Document | |
| 104 | Cover Page Interactive Data File (formatted as Inline XBRL and contained in Exhibit 101) |
SIGNATURES
Pursuant to the requirements of the Securities Exchange Act of 1934, the registrant has duly caused this report to be signed on its behalf by the undersigned, thereunto duly authorized.
| Meihua International Medical Technologies Co., Ltd. | ||
| Dated: October 2, 2023 | ||
| By: | /s/ Xin Wang | |
| Name: | Xin Wang | |
| Title: | Chief Executive Officer | |
| (Principal Executive Officer) | ||
Exhibit 99.1
INDEX TO THE UNAUDITED CONDENSED CONSOLIDATED FINANCIAL STATEMENTS
MEIHUA INTERNATIONAL MEDICAL TECHNOLOGIES CO., LTD.
UNAUDITED CONDENSED CONSOLIDATED FINANCIAL STATEMENTS
TABLE OF CONTENTS
F-
MEIHUA INTERNATIONAL MEDICAL TECHNOLOGIES CO., LTD.
UNAUDITED CONDENSED CONSOLIDATED BALANCE SHEETS
As of June 30, 2023 and December 31, 2022
(US$, except share data or otherwise noted)
|
June 30, 2023 |
December 31, 2022 |
|||||||
| Assets | ||||||||
| Current Assets | ||||||||
| Cash | $ | 17,861,214 | $ | 26,736,700 | ||||
| Bank acceptance receivables | 18,374,380 | 22,085,846 | ||||||
| Accounts receivable | 79,052,428 | 68,945,792 | ||||||
| Inventories | 1,647,146 | 1,122,038 | ||||||
| Prepayment and other current assets | 15,329,511 | 16,428,779 | ||||||
| Total current assets | 132,264,679 | 135,319,155 | ||||||
| Property, plant and equipment | 8,617,192 | 8,758,047 | ||||||
| Intangible assets | 3,876,027 | 497,600 | ||||||
| Investment | 5,997,634 | 6,669,655 | ||||||
| Other noncurrent assets | 11,856,920 | 12,333,122 | ||||||
| Total assets | $ | 162,612,452 | $ | 163,577,579 | ||||
| Liabilities and shareholders’ equity | ||||||||
| Liabilities | ||||||||
| Current liabilities | ||||||||
| Short-term bank borrowings | $ | 7,171,128 | $ | 6,089,428 | ||||
| Accounts payable | 13,820,348 | 16,096,165 | ||||||
| Taxes payable | 1,451,855 | 1,131,276 | ||||||
| Accrued expenses and other current liabilities | 778,369 | 856,698 | ||||||
| Total current liabilities | 23,221,700 | 24,173,567 | ||||||
| Long term loan | - | 724,932 | ||||||
| Total liabilities | 23,221,700 | 24,898,499 | ||||||
| Commitments and contingencies | ||||||||
| Shareholders’ equity | ||||||||
| Ordinary share, $0.0005 par value, 80,000,000 shares authorized, 23,940,000 and 23,940,000 shares issued and outstanding as of June 30, 2023 and December 31, 2022, respectively | 11,970 | 11,970 | ||||||
| Preferred share, $0.0005 par value, 20,000,000 shares authorized, no shares issued and outstanding as of as of June 30, 2023 and December 31, 2022 | ||||||||
| Additional paid-in capital | 42,967,006 | 42,967,006 | ||||||
| Statutory surplus reserves | 15,665,860 | 15,665,860 | ||||||
| Retained earnings | 90,392,246 | 83,330,239 | ||||||
| Accumulated other comprehensive income (loss) | (10,146,195 | ) | (3,852,138 | ) | ||||
| Total shareholders’ equity | 138,890,887 | 138,122,937 | ||||||
| Non-controlling interest | 499,865 | 556,143 | ||||||
| TOTAL EQUITY | 139,390,752 | 138,679,080 | ||||||
| Total liabilities and shareholders’ equity | $ | 162,612,452 | $ | 163,577,579 | ||||
The accompanying notes form an integral part of these consolidated financial statements.
F-
MEIHUA INTERNATIONAL MEDICAL TECHNOLOGIES CO., LTD.
UNAUDITED CONDENSED CONSOLIDATED STATEMENTS OF INCOME AND COMPREHENSIVE INCOME
For the six months ended June 30, 2023 and 2022
(US$, except share data or otherwise noted)
| For the Six months Ended June 30, |
||||||||
| 2023 | 2022 | |||||||
| Revenues | ||||||||
| Third party sales | $ | 48,178,325 | $ | 54,803,181 | ||||
| Related party sales | 11,751 | 29,666 | ||||||
| Total revenues | 48,190,076 | 54,832,847 | ||||||
| Cost of revenues | 31,019,347 | 33,941,115 | ||||||
| Gross profit | 17,170,729 | 20,891,732 | ||||||
| Operating expenses | ||||||||
| Selling | 3,161,070 | 3,311,649 | ||||||
| General and administrative | 3,452,610 | 4,799,711 | ||||||
| Research and development | 1,460,376 | 1,642,204 | ||||||
| Written-off Tai He deposit | 2,469,466 | |||||||
| Total operating expenses | 8,074,056 | 12,223,030 | ||||||
| Income from operations | 9,096,673 | 8,668,702 | ||||||
| Other (income) expense: | ||||||||
| Interest expense | 128,973 | 98,805 | ||||||
| Interest income | (361,532 | ) | (19,725 | ) | ||||
| Currency exchange gain | 119,193 | (449,217 | ) | |||||
| Other expense, net | 114,298 | 50,180 | ||||||
| Total other (income) expenses | 932 | (319,957 | ) | |||||
| Income before income tax provision | 9,095,741 | 8,988,659 | ||||||
| Income taxes expense | 2,064,212 | 2,433,772 | ||||||
| Net income | 7,031,529 | $ | 6,554,887 | |||||
| Net loss attributable to non-controlling interests | (30,478 | ) | ||||||
| Net income attributable to shareholders | 7,062,007 | 6,554,887 | ||||||
| Foreign currency translation adjustment – gain / (loss) | (6,319,857 | ) | (6,133,093 | ) | ||||
| Comprehensive (loss) income | $ | 711,672 | $ | 421,794 | ||||
| Comprehensive loss attributable to non-controlling interests | (56,278 | ) | ||||||
| Comprehensive (loss) income attributable to shareholders | 767,950 | 421,794 | ||||||
| 23,940,000 | 22,873,370 | |||||||
| $ | 0.29 | $ | 0.29 | |||||
The accompanying notes form an integral part of these consolidated financial statements.
F-
MEIHUA INTERNATIONAL MEDICAL TECHNOLOGIES CO., LTD.
UNAUDITED CONDENSED CONSOLIDATED STATEMENTS OF CHANGES IN SHAREHOLDERS’ EQUITY
For the six months ended June 30, 2023 and 2022
(US$, except share data)
| Ordinary shares |
Ordinary shares amount |
Additional paid-in capital |
Ordinary shares subscribed |
Statutory surplus reserves |
Retained earnings |
Accumulated other comprehensive income (loss) |
Non- controlling interests |
Total Equity |
||||||||||||||||||||||||||||
| Balance as of December 31, 2021 | 20,000,000 | $ | 10,000 | $ | 9,716,484 | $ | - | $ | 15,178,467 | $ | 77,574,663 | $ | 5,288,988 | - | $ | 107,768,602 | ||||||||||||||||||||
| Ordinary shares subscribed | 3,940,000 | 1,970 | 33,748,358 | - | - | - | - | - | 33,750,328 | |||||||||||||||||||||||||||
| Net income | - | - | - | - | - | 6,554,887 | - | - | 6,554,887 | |||||||||||||||||||||||||||
| Currency translation adjustment | - | - | - | - | - | - | (6,133,093 | ) | - | (6,133,093 | ) | |||||||||||||||||||||||||
| Balance as of June 30, 2022 | 23,940,000 | $ | 11,970 | $ | 43,464,842 | - | $ | 15,178,467 | $ | 84,129,550 | $ | (844,105 | ) | - | $ | 141,940,724 | ||||||||||||||||||||
| Balance as of December 31, 2022 | 23,940,000 | $ | 11,970 | $ | 42,967,006 | - | $ | 15,665,860 | $ | 83,330,239 | $ | (3,852,138 | ) | 556,143 | $ | 138,679,080 | ||||||||||||||||||||
| Net income | - | - | - | - | - | 7,062,007 | - | (30,478 | ) | 7,031,529 | ||||||||||||||||||||||||||
| Currency translation adjustment | - | - | - | - | - | - | (6,294,057 | ) | (25,800 | ) | (6,319,857 | ) | ||||||||||||||||||||||||
| Balance as of June 30, 2023 | 23,940,000 | 11,970 | 42,967,006 | - | 15,665,860 | 90,392,246 | (10,146,195 | ) | 499,865 | 139,390,752 | ||||||||||||||||||||||||||
The accompanying notes form an integral part of these consolidated financial statements.
F-
MEIHUA INTERNATIONAL MEDICAL TECHNOLOGIES CO., LTD.
UNAUDITED CONDENSED CONSOLIDATED STATEMENTS OF CASH FLOWS
For the six months ended June 30, 2023 and 2022
(US$)
|
For The Six Months Ended June 30, |
||||||||
| 2023 | 2022 | |||||||
| Cash Flows from operating activities: | ||||||||
| Net income | $ | 7,031,529 | $ | 6,554,887 | ||||
| Adjustments for items not affecting cash: | ||||||||
| Depreciation | 283,484 | 239,597 | ||||||
| Amortization | 13,733 | 13,417 | ||||||
| Net loss from disposal of property, plant and equipment | 104,572 | |||||||
| Written-off Tai He deposit | 2,469,466 | |||||||
| Deferred tax expenses (benefit) | (294,567 | ) | ||||||
| Currency exchange (gain) loss | 119,193 | |||||||
| Loss from equity method investments | 1,632 | |||||||
| Gain from cost method investments | (202 | ) | ||||||
| Changes in operating assets and liabilities: | ||||||||
| Bank acceptance receivables | 2,755,706 | (9,730,622 | ) | |||||
| Accounts receivable | (14,101,576 | ) | 3,472,261 | |||||
| Inventories | (606,934 | ) | (7,197 | ) | ||||
| Prepayments and other assets | 178,920 | (5,268,377 | ) | |||||
| Due from related parties | (33,523 | ) | ||||||
| Accounts payable | (1,559,255 | ) | (4,851,578 | ) | ||||
| Taxes payable | 393,343 | (285,556 | ) | |||||
| Accrued expenses and other current liabilities | (38,714 | ) | (64,985 | ) | ||||
| Advance from customers | (12,039 | ) | ||||||
| Net cash used in operating activities | (5,424,569 | ) | (7,798,816 | ) | ||||
| Cash flows from investing activities: | ||||||||
| Purchases of property, plant and equipment | (1,001,925 | ) | (459,163 | ) | ||||
| Additions to intangible assets | (3,581,058 | ) | ||||||
| Proceeds from disposal of property, plant and equipment | 355,993 | |||||||
| Proceeds from disposal of long-term investment | 360,839 | |||||||
| Net cash used in investing activities | (3,866,151 | ) | (459,163 | ) | ||||
| Cash flows from financing activities: | ||||||||
| Proceeds from short-term bank borrowings | 5,340,415 | 3,549,857 | ||||||
| Repayments of short-term bank borrowings | (4,618,738 | ) | (2,932,491 | ) | ||||
| Shareholder contribution | 34,527,480 | |||||||
| Net cash provided by financing activities | 721,677 | 35,144,846 | ||||||
| Effect of foreign exchange rate changes | (306,443 | ) | (370,615 | ) | ||||
| Net increase (decrease) in cash | (8,875,486 | ) | 26,516,252 | |||||
| Cash, beginning of year | 26,736,700 | 8,149,276 | ||||||
| Cash, end of year | $ | 17,861,214 | $ | 34,665,528 | ||||
| SUPPLEMENTAL DISCLOSURE OF CASH FLOWS INFORMATION: | ||||||||
| Cash paid during the period for: | ||||||||
| Cash paid for income tax | $ | 2,313,417 | $ | 2,956,643 | ||||
| Cash paid for interest | $ | 128,973 | $ | 98,804 | ||||
| Non-cash transactions | ||||||||
| Shareholder contribution through deferred cost | 1,277,152 | |||||||
The accompanying notes form an integral part of these consolidated financial statements.
F-
MEIHUA INTERNATIONAL MEDICAL TECHNOLOGIES CO., LTD.
NOTES TO UNAUDITED CONDENSED CONSOLIDATED FINANCIAL STATEMENTS
1. Organization and principal activities
Principal Activities:
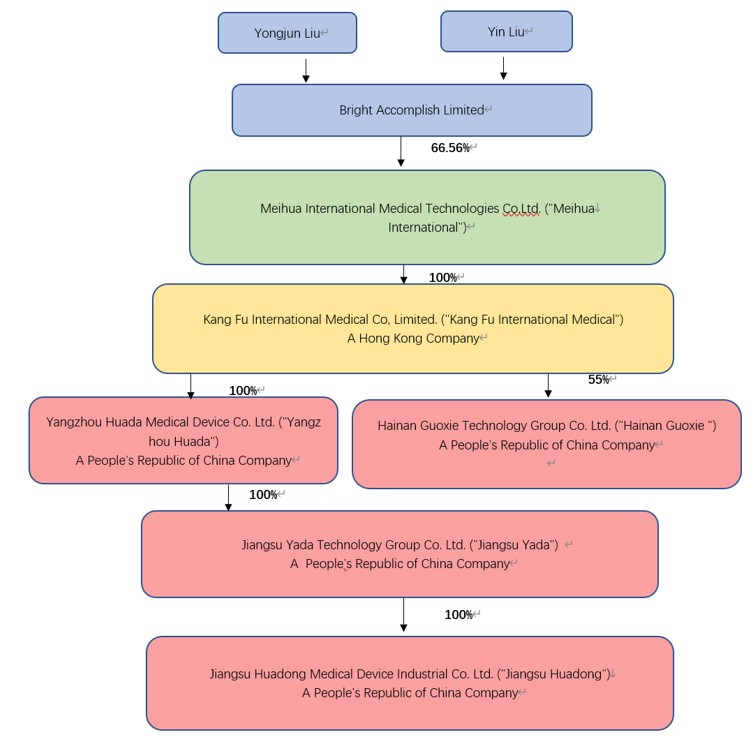
Meihua International Medical Technologies Co., Ltd. (“Meihua”) was incorporated on November 10, 2020 in the Cayman Islands. Meihua is a holding company with no operations. Meihua produces and sells medical consumables through its wholly owned subsidiaries located in People’s Republic of China (“PRC” or “China”). Below is Meihua’s organizational chart, as well as a description of the ownership structure.
F-
|
Entity Name |
Registered Location |
Percentage of ownership |
Date of incorporation |
Principal activities |
||||
| Meihua International Medical Technologies Co., Ltd. (“Meihua”) | Cayman | Parent | November 10, 2020 | Investment holding | ||||
| 康复国际医疗有限公司 Kang Fu International Medical Co., Limited (“Kang Fu”) |
Hong Kong | 100% by Meihua | October 13, 2015 | Investment holding | ||||
| 扬州华达医疗器械有限公司 Yangzhou Huada Medical Equipment Co., Ltd. (“Huada”) |
Yangzhou | 100% by Kang Fu | December 24, 2001 | Medical Equipment Sales | ||||
| 江苏亚达科技集团有限公司 Jiangsu Yada Technology Group Co., Ltd. (“Yada”) |
Yangzhou | 100% by Huada | December 5, 1991 | Medical Equipment Sales | ||||
| 江苏华东医疗器械实业有限公司 Jiangsu Huadong Medical Device Industry Co., Ltd. (“Huadong”) |
Yangzhou | 100% by Yada | November 18, 2000 | Medical Equipment Sales | ||||
| 扬州光辉医疗科技有限公司* Yangzhou Guanghui Medical Technology Co., Ltd. (“Guanghui”) |
Yangzhou | 100% by Huadong | December 22, 2020 | Medical Equipment Sales | ||||
| 海南国械医疗科技有限公司 Hainan GuoxieTechnology Group Co. Ltd. (“Hainan Guoxie”) |
Hainan | 55% by Kang Fu |
October 07, 2021 |
Medical Equipment Sales |
Kang Fu was incorporated on October 13, 2015 with a registered capital of HKD 53,911,815 ($6,911,771). Kang Fu is a holding company with no operations. The following operating entities (Huada, Yada and Huadong) are all directly and indirectly 100% owned by Kang Fu for all the periods presented.
Huada is a subsidiary wholly owned by Kang Fu and established in Yangzhou, China on December 24, 2001 with a registered capital of $17,193,021.
Yada is a subsidiary wholly owned by Huada and was established in Yangzhou, China on December 5, 1991 with a registered capital of RMB51,390,000.
Huadong is a subsidiary wholly owned by Yada and was established in Yangzhou, China on November 18, 2000 with a registered capital of RMB50,000,000.
Those three subsidiaries primarily manufacture and sell Class I, II and III disposable medical devices under the Company’s own brands, and distribute Class I, II and III disposable medical devices sourced from other manufacturers to our domestic and overseas customers.
Guanghui was a subsidiary wholly owned by Huadong and was dissolved on June 1, 2023.
Hainan Guoxie is a subsidiary 55% owned by Kang Fu and established in Hainan, China on October 07, 2021 with a registered capital of RMB100,000,000.
F-
2. Summary of Significant Accounting Policies
Basis of Presentation
The accompanying unaudited condensed consolidated financial statements have been prepared in accordance with accounting principles generally accepted in the United States of America (“U.S. GAAP”) pursuant to the rules and regulations of the Securities Exchange Commission (“SEC”). The interim results of operations are not necessarily indicative of results to be expected for any other interim period or for a full year. In the opinion of management, all adjustments, consisting only of normal recurring adjustments, considered necessary for a fair presentation of its financial position and operating results have been included. These financial statements should be read in conjunction with the Company’s audited consolidated financial statements and the related notes thereto for the fiscal years ended December 31, 2022 and 2021.
Use of Estimates
The preparation of unaudited condensed consolidated financial statements in conformity with U.S. GAAP requires management to make certain estimates and assumptions that affect the amounts reported and disclosed in the consolidated financial statements and related notes.
The most significant estimates and judgments include allowance for bad debts and the valuation of inventory. Actual amounts could differ from those estimates.
Non-controlling interests
Non-controlling interest represents the portion of the net assets of subsidiaries attributable to interests that are not owned or controlled by the Company. The non-controlling interest is presented in the consolidated balance sheets, separately from equity attributable to the shareholders of the Company. Non-controlling interest’s operating results are presented on the face of the consolidated statements of income and comprehensive income as an allocation of the total income for the year between non-controlling shareholders and the shareholders of the Company. As of June 30, 2023, non-controlling interests represent one non-controlling shareholders’ proportionate share of equity interests in Hainan Guoxie.
Functional Currency and Foreign Currency Translation
The Company’s reporting currency is the United States dollar (“US$”). The Company’s operations are principally conducted through the PRC subsidiaries where the local currency is the functional currency. Therefore, the functional currency of Kang Fu is the Hong Kong dollar and the functional currency of Huada, Yada, Huadong and Guanghui is the Renminbi (“RMB”).
Transactions denominated in currencies other than the functional currencies are translated into the functional currency of the entity at the exchange rates prevailing on the transaction dates. Monetary assets and liabilities denominated in currencies other than the applicable functional currency are translated into the functional currency at the prevailing rates of exchange at the balance date. The resulting exchange differences are reported in the consolidated statements of income and comprehensive income.
F-
The assets and liabilities of the Company are translated at the exchange spot rate at the balance sheet date, stockholders’ equity is translated at the historical rates and the revenues and expenses are translated at the average exchange rates for the periods, except that the exchange rate used for translation from Hong Kong dollar to US$ was 7.8000, a pegged rate determined by the linked exchange rate system in Hong Kong. This pegged rate was used to translate Kang Fu’s balance sheets, income statement items and cash flow items for both the six months ended June 30, 2023 and 2022. The resulting translation adjustments are reported under other comprehensive income in the consolidated statements of income and comprehensive income in accordance with Financial Accounting Standards Board (“FASB”) Accounting Standards Codification (“ASC”) 220, Comprehensive Income. The following are the exchange rates that were used in translating the Company’s PRC subsidiaries’ financial statements into the consolidated financial statements:
|
June 30, 2023 |
December 31, 2022 |
June 30, 2022 |
||||
| Period-end spot rate | US$1=RMB 7.2513 | US$1=RMB 6.8972 | US$1=RMB 6.6981 | |||
| Average rate | US$1=RMB 6.9283 | US$1=RMB 6.7290 | US$1=RMB 6.4791 |
Certain Risks and Concentration
The Company’s financial instruments that potentially subject the Company to significant concentrations of credit risk consist primarily of cash and receivables. As of six months ended June 30, 2023 and December 31, 2022 substantially all the Company’s cash were held in major financial institutions located in Hong Kong and the PRC, which management considers to be of high credit quality.
For the six months ended June 30, 2023, two customers accounted for approximately 18.18% and 10.01% of the Company’s total revenues. For the six months ended June 30, 2022, two customers accounted for approximately 32.53% and 11.25% of the Company’s total revenues.
As of June 30, 2023, two customers accounted for approximately 30.92% and 21.31% of the Company’s accounts receivable. As of December 31, 2022, two customers accounted for approximately 27.73% and 13.14% respectively, of the Company’s accounts receivable.
For the six months ended June 30, 2023, one supplier accounted for approximately 14.73% of the Company’s total purchases. As of six months ended June 30, 2022, there was no supplier that individually represented greater than 10% of the total purchase of the Company’s total purchases.
F-
Fair Value Measurement
Fair value is the price that would be received from selling an asset or paid to transfer a liability in an orderly transaction between market participants at the measurement date. When determining the fair value measurements for assets and liabilities required or permitted to be recorded at fair value, the Company considers the principal or most advantageous market in which it would transact, and it considers assumptions that market participants would use when pricing the asset or liability.
The Company adopted the guidance of Accounting Standards Codification (“ASC”) 820 for fair value measurements which clarifies the definition of fair value, prescribes methods for measuring fair value, and establishes a fair value hierarchy to classify the inputs used in measuring fair value as follows:
| Level 1: | Inputs are unadjusted quoted prices in active markets for identical assets or liabilities available at the measurement date. | |
| Level 2: | Inputs are unadjusted quoted prices for similar assets and liabilities in active markets, quoted prices for identical or similar assets and liabilities in markets that are not active, inputs other than quoted prices that are observable, and inputs derived from or corroborated by observable market data. | |
| Level 3: | Inputs are unobservable inputs which reflect the reporting entity’s own assumptions on what assumptions the market participants would use in pricing the asset or liability based on the best available information. |
The Company’s financial instruments include cash, accounts receivable, bank acceptance receivables, due from related parties, accounts payable, other liabilities and accrued expenses and short-term bank borrowings. The carrying amounts approximate their fair values due to their short maturities as of June 30, 2023 and December 31, 2022.
The Company noted no transfers between levels during any of the periods presented. The Company did not have any instruments that were measured at fair value on a recurring or non-recurring basis as of June 30, 2023 and December 31, 2022.
Cash
Cash consists of petty cash on hand and cash held in banks, which are highly liquid and are unrestricted as to withdrawal or use.
Bank Acceptance Receivables
Bank acceptance receivables are issued by bank under the request of the Company’s customers, to pay for the purchased goods. The Company can choose to hold acceptance notes until maturity and receive the face value payment from the bank, or sell (exchange) the acceptance notes at a discount to another party willing to wait until maturity to receive the bank’s promised payment. The maturity date of the receivables is all within one year of the original issuance date and carried at face value. The Company is not lending money, it just sells goods to the customers (customers can pay the purchased goods by cash, accounts receivable or bank acceptance receivables). The receivables mature within one year, and are non-interest bearing. As bank acceptance receivables are issued by the banks and payments are guaranteed. The Company has not discounted any bank acceptances and there were no endorsed bank acceptances that are unmatured as of June 30, 2023. The Company collected approximately $6.0 million as of August 31, 2023.
F-
Accounts Receivable and Allowance for Doubtful Accounts
Accounts receivable represent trade receivables and are recognized initially at fair value and subsequently adjusted for any allowance for doubtful accounts or impairment.
The Company follows the guidance under ASC 326, Financial Instruments – Credit Losses, Measurement of Credit Losses on Financial Instruments. The standard uses a new forward-looking “methodology that reflects expected credit losses and requires consideration of a broader range of reasonable and supportable information to inform credit loss estimates.” The Company has adopted the loss rate methodology to estimate historical losses on accounts receivables. The Company has adopted the aging methodology to estimate the credit losses on accounts receivables. The historical data is adjusted to account for forecasted changes in the macroeconomic environment in order to calculate the current expected credit loss. The provision is recorded against accounts receivables balances, with a corresponding charge recorded in the consolidated statements of operations and comprehensive income.
The Company historically has not had material bad debts in accounts receivable. There were no bad debt expenses related to accounts receivable for six months ended June 30, 2023 and 2022, and there was no provision for doubtful accounts as of June 30, 2023 and December 31, 2022.
Inventories
Inventories are valued using the lower of cost or net realizable value. Cost is principally determined using the weighted-average method. Manufactured inventories included cost of materials, labor and overhead expenses. The Company records adjustments to inventory for excess quantities, obsolescence, or impairment, when appropriate, to reflect inventory at net realizable value. These adjustments are based upon a combination of factors including current sales volume, market conditions, lower of cost or market analysis and expected realizable value of the inventory.
There were no write-downs recognized of inventories as of June 30, 2023 and December 31, 2022.
Prepayment and other current assets
As of June 30, 2023 and December 31, 2022, prepayment and other current assets were $15,329,511 and $16,428,779.
Prepayment and other assets primarily consist of prepayments for land use right and property, refundable tax credits and receivables, security deposits made to customers, advances to employees, which are presented net of allowance for doubtful accounts. These balances are unsecured and are reviewed periodically to determine whether their carrying value has become impaired. The Company considers the balances to be impaired if the utilization or refund of the balances becomes doubtful. The Company uses the aging method to estimate the allowance for uncollectible balances. The allowance is also based on management’s best estimate of specific losses on individual exposures, as well as a provision on historical trends of collections and utilizations. Actual amounts received or utilized may differ from management’s estimate of credit worthiness and the economic environment. Delinquent account balances are written off against allowance for doubtful accounts after management has determined that the likelihood of collection is not probable. The allowance for doubtful accounts amounted to nil as of June 30, 2023 and December 31, 2022.
F-
Property, Plant and Equipment
Property, plant and equipment items are recorded at their historic cost, less accumulated depreciation and impairment losses. The Company calculates depreciation using the straight-line method, after consideration of the estimated residual values, over the following estimated useful lives:
| Category | Useful lives | Estimated residual value |
||||
| Buildings | 20 years | 10 | % | |||
| Machinery and Equipment | 10 years | 10 | % | |||
| Motor vehicles | 5 years | 10 | % | |||
| Electronic Equipment | 5 years | 10 | % | |||
| Office Equipment | 3 years | 10 | % | |||
| Inspection Equipment | 5 years | 10 | % | |||
Major improvements are capitalized and expenditures for maintenance and repairs are expensed as incurred. Construction in progress represents property, plant and equipment under construction or being installed. Costs include original cost, installation, construction and other direct costs. Interest expenses directly related to construction in progress would be capitalized. Construction in progress is transferred to the appropriate fixed asset account and depreciation commences when the asset has been substantially completed and placed in service.
Intangible Assets
Intangible assets are non-monetary assets without physical substance. These items are initially measured at cost and subsequently carried at cost less any accumulated amortization and impairment losses. Intangible assets with finite useful lives are amortized on a straight-line basis over their estimated useful lives. Amortization of finite-lived intangible assets is computed using the straight-line method over the estimated useful lives, which is as follows:
| Category | Useful lives | |
| Land use rights | 50 years | |
| Patent | 5 years | |
| Trademark | 10 years |
Impairment of Long-Lived Assets
The Company accounts for impairment of long-lived assets in accordance with Accounting Standards Codification (“ASC”) 360, Property, Plant and Equipment. (“ASC 360”). Long-lived assets consist primarily of property, plant and equipment, and intangible assets. In accordance with ASC 360, the Company evaluates the carrying value of long-lived assets when it determines a triggering event has occurred, or whenever events or changes in circumstances indicate that the carrying amount of an asset may not be recoverable. When indicators exist, recoverability of assets is measured by a comparison of the carrying value of the asset group to the estimated undiscounted future net cash flows expected to be generated by the asset. Examples of such triggering events include a significant disposal of a portion of such assets, and adverse change in the market involving the business employing the related assets. If such assets are determined not to be recoverable, the Company performs an analysis of the fair value of the asset group and will recognize an impairment loss when the fair value is less than the carrying amounts of such assets. The fair value, based on reasonable and supportable assumptions and projections, require subjective judgments. Depending on the assumptions and estimates used, the appraised fair value projected in the evaluation of long-lived assets can vary within a range of outcomes. The Company considers the likelihood of possible outcomes in determining the best estimate for the fair value of the assets. The Company did not record any impairment charges for the six months ended June 30, 2023 and 2022. There can be no assurance that future events will not have impact on company revenue or financial position which could result in impairment in the future.
F-
Investment
In accordance with Financial Accounting Standards Board (“FASB”) ASC 321, “Investment-Equity Securities,” the Company accounts for non-marketable securities on a prospective basis. Equity investments that do not have readily determinable fair values and do not qualify for the net asset value practical expedient are eligible for the measurement alternative.
On March 3, 2011, Yada invested in Yangzhou Juyuan Guarantee Co., Ltd (“Juyuan”) and obtained 12% equity interest of Juyuan. For the Company’s passive and without significant influence or control equity investment in private company which do not have readily determinable fair values, the Company has elected the measurement alternative defined as cost, less impairment, plus or minus adjustments resulting from observable price changes in orderly transactions for the identical or a similar investment of the Company. The investment is reviewed periodically to determine if its value has been impaired and adjustments are recorded as necessary in profit or loss for the period. On January 5, 2023, majority shareholder of Juyuan purchased 5% equity interest of Juyuan from Yada for a consideration of $360,839 (RMB 2.5 million).
Investments in entities in which the Company can exercise significant influence but does not own a majority equity interest or control are accounted for using the equity method of accounting in accordance with ASC 323, Investments-Equity Method and Joint Ventures (“ASC 323”). Under the equity method, the Company initially records its investment at cost and the difference between the cost of the equity investee and the amount of the underlying equity in the net assets of the equity investee is accounted for as if the investee were a consolidated subsidiary. The share of earnings or losses of the investee are recognized in the consolidated statements of comprehensive loss. Equity method adjustments include the Company’s proportionate share of investee income or loss, adjustments to recognize certain differences between the Company’s carrying value and its equity in net assets of the investee at the date of investment, impairments, and other adjustments required by the equity method. The Company assesses its equity investment for other-than-temporary impairment by considering factors as well as all relevant and available information including, but not limited to, current economic and market conditions, the operating performance of the investees including current earnings trends, the general market conditions in the investee’s industry or geographic area, factors related to the investee’s ability to remain in business, such as the investee’s liquidity, debt ratios, and cash burn rate and other company-specific information.
Investments in equity securities without readily determinable fair values are measured at cost minus impairment adjusted by observable price changes in orderly transactions for the identical or a similar investment of the same issuer. These investments are measured at fair value on a nonrecurring basis when there are events or changes in circumstances that may have a significant adverse effect. An impairment loss is recognized in the consolidated statements of comprehensive loss equal to the amount by which the carrying value exceeds the fair value of the investment. Prior to the adoption of ASU 2016-01 on January 1, 2019, these investments were accounted for using the cost method of accounting, measured at cost less other-than-temporary impairment.
On December 1, 2022, Huadong invested RMB 40 million into Jiangsu Zhongxiangxin International Science and Technology Innovation Park Co., Ltd. (“Zhongxiangxin”), and obtained 25% ownership interest of Zhongxiangxin. Zhongxiangxin manufactures and sells medical materials in the PRC. The Company accounted for the investments using equity method, because the Company has significant influence but does not own a majority equity interest or otherwise control over the equity investee. Under the equity method, the Company adjusts the carrying amount of the investment and recognizes investment income or loss for its share of the earnings or loss of the investee after the date of investment. When the Company’s share of losses in the equity investee equals or exceeds its interest in the equity investee, the Company does not recognize further losses, unless the Company has incurred obligations or made payments or guarantees on behalf of the equity investee. For the six months ended June 30, 2023 and 2022, the investment loss from Zhongxiangxin was $1,632 and nil.
F-
The Company continually reviews its investments in equity investees to determine whether a decline in fair value below the carrying value is other-than-temporary. The primary factors the Company considers in its determination include the financial condition, operating performance and the prospects of the equity investee; other company specific information such as recent financing rounds; the geographic region, market and industry in which the equity investee operates; and the length of time that the fair value of the investment is below its carrying value. If the decline in fair value is deemed to be other-than-temporary, the carrying value of the equity investee is written down to fair value.
For the for the six months ended June 30, 2023 and 2022, no impairment indicators were identified of its investment in the private company was no impairment recorded.
Value-added Tax
Value-added taxes (“VAT”) collected from customers relating to product sales and remitted to governmental authorities are presented on a net basis. VAT collected from customers is excluded from revenue which is recorded in VAT payable. The Company is subject to a VAT rate of 13%. The VAT payable may be offset by VAT paid by the Company on raw materials and other materials included in the cost of producing or acquiring its finished products.
Related Parties
Parties are considered to be related to the Company if the parties, directly or indirectly, through one or more intermediaries, control, are controlled by, or are under common control with the Company. Related parties also include principal owners of the Company, its management, members of the immediate families of principal owners of the Company and its management and other parties with which the Company may deal with if one party controls or can significantly influence the management or operating policies of the other to an extent that one of the transacting parties might be prevented from fully pursuing its own separate interests. The Company discloses all significant related party transactions.
Revenue Recognition
Based on the requirements of ASC Topic 606, the Company recognizes revenue when control of the promised goods or services is transferred to the customers in an amount that reflects the consideration the Company expects to be entitled to receive in exchange for those goods or services. The Company primarily sells its products to hospitals and medical equipment companies. Revenue is recognized when the following 5-step revenue recognition criteria are met:
| 1) | Identify the contract with a customer |
| 2) | Identify the performance obligations in the contract |
| 3) | Determine the transaction price |
| 4) | Allocate the transaction price |
| 5) | Recognize revenue when or as the entity satisfies a performance obligation |
Revenue from product sales is recognized at the point in time control of the products is transferred, generally upon customer receipt based upon the standard contract terms. Shipping and handling activities are considered to be fulfillment activities rather than promised services and are not, therefore, considered to be separate performance obligations. The Company’s sales terms provide no right of return outside of a standard quality policy and returns are generally not significant. Payment terms for product sales are generally set at 90 to 180 days after customer acceptance of the product.
F-
Revenue Disaggregation
The Company’s disaggregated revenues are represented by two categories which are type of goods and type of customers.
Type of Goods
| For The Six Months Ended June 30, |
||||||||
| 2023 | 2022 | |||||||
| US$ | US$ | |||||||
| Self-Manufactured Products | 23,435,544 | 27,046,663 | ||||||
| Resales of Sourced Disposable Medical Devices from Third Party Manufacturers | 24,754,532 | 27,786,184 | ||||||
| Total Revenue | 48,190,076 | 54,832,847 | ||||||
Type of Customers
| For The Six Months Ended June 30, |
||||||||
| 2023 | 2022 | |||||||
| US$ | US$ | |||||||
| Direct sales | 4,305,506 | 4,582,321 | ||||||
| Distributors | 43,884,570 | 50,250,526 | ||||||
| Total Revenue | 48,190,076 | 54,832,847 | ||||||
Earnings per Ordinary Share
Earnings (loss) per ordinary share is calculated in accordance with ASC 260, Earnings per Share. Basic earnings (loss) per ordinary share is computed by dividing the net income (loss) attributable to shareholders of the Company by the weighted average number of ordinary shares outstanding during the year. Diluted earnings per ordinary share is computed in accordance with the treasury stock method and based on the weighted average number of ordinary shares and dilutive ordinary share equivalents. Dilutive ordinary share equivalents are excluded from the computation of diluted earnings per ordinary share if their effects would be anti-dilutive. There is no ordinary share equivalent issued to date.
Comprehensive Income (Loss)
ASC 220, Comprehensive Income (“ASC 220”) establishes rules for reporting and display of comprehensive income and its components. ASC 220 requires that unrealized gains and losses on the Company’s foreign currency translation adjustments be included in comprehensive income (loss).
Advertising Costs
The Company’s advertising costs are expensed as incurred. Advertising expenses are included in selling expenses in the accompanying consolidated statements of income and comprehensive income. Advertising expenses were $8,275, and $7,603 for the six months ended June 30, 2023, and 2022, respectively.
Research and Development Costs
Research and development expenses are expensed as incurred. Research and development expenses were $1,460,376 and $1,642,204 for the six months ended June 30, 2023, and 2022, respectively.
F-
Income Tax
Current income taxes are provided on the basis of net profit for financial reporting purposes, adjusted for income and expense items which are not assessable or deductible for income tax purposes, in accordance with the regulations of the relevant tax jurisdictions.
Deferred income taxes are recognized for temporary differences between the tax bases of assets and liabilities and their reported amounts in the consolidated financial statements, net operating loss carry forwards and credits. Deferred tax assets are reduced by a valuation allowance when, in the opinion of management, it is more likely than not that some portion or all of the deferred tax assets will not be realized. Current income taxes are provided in accordance with the laws of the relevant taxing authorities. Deferred tax assets and liabilities are measured using enacted rates expected to apply to taxable income in which temporary differences are expected to be reversed or settled. The effect on deferred tax assets and liabilities of changes in tax rates is recognized in the statement of comprehensive income in the period of the enactment of the change.
The Company considers positive and negative evidence when determining whether a portion or all of its deferred tax assets will more likely than not be realized. This assessment considers, among other matters, the nature, frequency and severity of current and cumulative losses, forecasts of future profitability, the duration of statutory carry-forward periods, its experience with tax attributes expiring unused, and its tax planning strategies. The ultimate realization of deferred tax assets is dependent upon its ability to generate sufficient future taxable income within the carry-forward periods provided for in the tax law and during the periods in which the temporary differences become deductible. When assessing the realization of deferred tax assets, the Company has considered possible sources of taxable income including (i) future reversals of existing taxable temporary differences, (ii) future taxable income exclusive of reversing temporary differences and carryforwards, (iii) future taxable income arising from implementing tax planning strategies, and (iv) specific known trend of profits expected to be reflected within the industry.
The Company recognizes a tax benefit associated with an uncertain tax position when, in its judgment, it is more likely than not that the position will be sustained upon examination by a taxing authority. For a tax position that meets the more-likely-than-not recognition threshold, the Company initially and subsequently measures the tax benefit as the largest amount that the Company judges to have a greater than 50% likelihood of being realized upon ultimate settlement with a taxing authority. The Company’s liability associated with unrecognized tax benefits is adjusted periodically due to changing circumstances, such as the progress of tax audits, case law developments and new or emerging legislation. Such adjustments are recognized entirely in the period in which they are identified. The Company’s effective tax rate includes the net impact of changes in the liability for unrecognized tax benefits and subsequent adjustments as considered appropriate by management. The Company classifies interest and penalties recognized on the liability for unrecognized tax benefits as income tax expense.
Segment Reporting
FASB ASC 280, “Segment Reporting,” establishes standards for reporting information about operating segments on a basis consistent with the Company’s internal organizational structure as well as information of the Company’s business segments, geographical areas, segments and major customers. The Company uses the “management approach” in determining reportable operating segments. The management approach considers the internal organization and reporting used by the Company’s chief operating decision maker for making operating decisions and assessing performance as the source for determining the Company’s reportable segments. The chief operating decision maker is the Company’s president and Chief Executive Officer (“CEO”). Management, including the chief operating decision maker, reviews operating results of different products at revenue level with no allocation of operating costs. Consequently, based on management’s assessment, the Company has determined that it has only one operating segment as defined by FASB ASC 280.
F-
The Company has disclosed the type of revenue by government category as follows.
| June 30, 2023 | June 30, 2022 | |||||||||||||||||||||||
| US$ | US$ | |||||||||||||||||||||||
| Category | Produced | Purchased | Total | Produced | Purchased | Total | ||||||||||||||||||
| Class I | 3,561,156 | 4,462,704 | 8,023,860 | 3,812,092 | 3,845,205 | 7,657,297 | ||||||||||||||||||
| Class II | 17,313,377 | 17,761,970 | 35,075,347 | 20,185,052 | 19,712,006 | 39,897,058 | ||||||||||||||||||
| Class III | 524,802 | 873,575 | 1,398,377 | 416,595 | 1,168,221 | 1,584,816 | ||||||||||||||||||
| Others | 2,036,209 | 1,656,283 | 3,692,492 | 2,632,924 | 3,060,752 | 5,693,676 | ||||||||||||||||||
| Total | 23,435,544 | 24,754,532 | 48,190,076 | 27,046,663 | 27,786,184 | 54,832,847 | ||||||||||||||||||
Class I, II, and III medical devices are defined by the National Medical Products Administration of China according to their risk levels under the Regulation on the Supervision and Administration of Medical Devices (2021 Revision), Article 6 as follows:
| ● | “Class I Medical Devices” means medical devices with low risks, whose safety and effectiveness can be ensured through routine administration. |
| ● | “Class II Medical Devices” means medical devices with moderate risks, which shall be strictly controlled and administered to ensure their safety and effectiveness. |
| ● | “Class III Medical Devices” means medical devices with relatively high risks, which shall be strictly controlled and administered through special measures to ensure their safety and effectiveness. |
Furthermore, the Company has disclosed revenue by major product type included in each government category.
|
June 30, 2023 |
June 30, 2022 |
|||||||||
| Category | Products | US$ | US$ | |||||||
| Class I | Eye drops bottle | 1,073,853 | 1,346,164 | |||||||
| Oral medicine bottle | 1,830,363 | 2,189,018 | ||||||||
| Anal bag | 849,099 | 395,292 | ||||||||
| Other Class I | 4,270,545 | 3,726,823 | ||||||||
| Subtotal-Class I | 8,023,860 | 7,657,297 | ||||||||
| Class II | Masks | 47,946 | 211,468 | |||||||
| Identification tape | 5,494,306 | 7,218,564 | ||||||||
| Disposable medical brush | 4,481,601 | 4,606,634 | ||||||||
| Gynecological inspection kits | 3,022,727 | 5,807,398 | ||||||||
| Surgical kit | 2,206,201 | 13,546,908 | ||||||||
| Medical brush | 2,809,448 | 2,586,945 | ||||||||
| Medical kit | 983,584 | 883,977 | ||||||||
| Other Class II | 16,029,534 | 5,035,164 | ||||||||
| Subtotal-Class II | 35,075,347 | 39,897,058 | ||||||||
| Class III | Electronic pump | 138,751 | 67,866 | |||||||
| Anesthesia puncture kit | 229,616 | 205,218 | ||||||||
| Disposable infusion pump | 113,335 | 78,453 | ||||||||
| Infusion pump | 178,461 | 90,036 | ||||||||
| Electronic infusion pump | 330 | 43,397 | ||||||||
| Laparoscopic trocar | 38 | 94,337 | ||||||||
| Other Class III | 737,846 | 1,005,509 | ||||||||
| Subtotal-Class III | 1,398,377 | 1,584,816 | ||||||||
| Others | 3,692,492 | 5,693,676 | ||||||||
| Total | 48,190,076 | 54,832,847 | ||||||||
For the six months ended June 30, 2023, and 2022, revenues and assets within PRC contributed over 99.1% of the Company’s total revenues and assets.
F-
The Outbreak of COVID-19
On January 30, 2020, the World Health Organization declared the outbreak of the coronavirus disease (COVID-19) a “Public Health Emergency of International Concern,” and on March 11, 2020, the World Health Organization characterized the outbreak as a “pandemic.” COVID-19 has had a severe and negative impact on the Chinese and the global economy and such impact persists as of the date of this annual report.
In fiscal year 2020, COVID-19 had a significant impact on our business and results of operations as the sales volume of masks rose sharply while the sales of products other than masks declined due to an overall decrease in market demand. In fiscal year 2021, with the stable control of the domestic epidemic in China, the market of masks was no longer in urgent shortage compared to the same period in 2020, and the production of epidemic prevention products resumed more normal production levels. In general, with the precise control of the epidemic in China, our production and operations have recovered smoothly, and the demand for other products has increased gradually. After the initial outbreak of COVID-19, from time to time, some instances of COVID-19 infections have emerged in various regions of China, including the infections caused by the Omicron variants in 2022. For example, a wave of infections caused by the Omicron variants emerged in Shanghai in 2022, and a series of restrictions and quarantines were implemented to contain the spread.
Many of the restrictive measures previously adopted by the PRC governments at various levels to control the spread of the COVID-19 virus have been revoked or replaced with more flexible measures since December 2022. While the revocation or replacement of the restrictive measures to contain the COVID-19 pandemic could have a positive impact on our normal operations, the extent of the impact on the Company’s future financial results will be dependent on future developments such as the length and severity of the crisis, the potential resurgence of the crisis, future government actions in response to the crisis and the overall impact of the COVID-19 pandemic on the global economy and capital markets, among many other factors, all of which remain highly uncertain and unpredictable. Given this uncertainty, the Company is currently unable to quantify the expected impact of the COVID-19 pandemic on its future operations, financial condition, liquidity and results of operations if the current situation continues.
F-
Recently Issued Accounting Standards
In October 2021, the FASB issued ASU No. 2021-08, “‘Business Combinations (Topic 805): Accounting for Contract Assets and Contract Liabilities from Contracts with Customers” (“ASU 2021-08”). This ASU requires entities to apply Topic 606 to recognize and measure contract assets and contract liabilities in a business combination. The amendments improve comparability after the business combination by providing consistent recognition and measurement guidance for revenue contracts with customers acquired in a business combination and revenue contracts with customers not acquired in a business combination. The amendments are effective for the Company beginning after December 15, 2023, and are applied prospectively to business combinations that occur after the effective date. The Company does not expect the adoption of ASU 2021-04 will have a material effect on the consolidated financial statements.
In June 2022, the FASB issued ASU 2022-03 Fair Value Measurement (Topic 820): Fair Value Measurement of Equity Securities Subject to Contractual Sale Restrictions. The update clarifies that a contractual restriction on the sale of an equity security is not considered part of the unit of account of the equity security and, therefore, is not considered in measuring fair value. The update also clarifies that an entity cannot, as a separate unit of account, recognize and measure a contractual sale restriction. The update also requires certain additional disclosures for equity securities subject to contractual sale restrictions. For public business entities, the amendments in this Update are effective for fiscal years beginning after December 15, 2023, and interim periods within those fiscal years. For all other entities, the amendments are effective for fiscal years beginning after December 15, 2024, and interim periods within those fiscal years. Early adoption is permitted for both interim and annual financial statements that have not yet been issued or made available for issuance. As an emerging growth company, the standard is effective for the Company for the year ended December 31, 2025. The Company is in the process of evaluating the impact of the new guidance on its consolidated financial statements.
3. Prepayments and other assets
Prepayments and other current assets consist of the following:
|
June 30, 2023 |
December 31, 2022 |
|||||||
| US$ | US$ | |||||||
| Other receivable | 159,817 | 239,148 | ||||||
| Prepaid tax | 250,410 | |||||||
| Prepaid for land use right (1) | 15,169,694 | 15,948,501 | ||||||
| Prepaid for property (2) | 11,856,920 | 12,323,842 | ||||||
| Total | 27,186,431 | 28,761,901 | ||||||
| Less: non-current portion | (11,856,920 | ) | (12,333,122 | ) | ||||
| Prepayments and other current assets | 15,329,511 | 16,428,779 | ||||||
| (1) | On October 22, 2018, the Company signed a land use right agreement with the government of Touqiao Town, Yangzhou City and paid RMB 50 million ($6.9 million) and RMB 60 million ($8.27 million), respectively, in 2018 and 2019 according to the agreement. As a result of COVID-19, the land use right had not been transferred to the Company as scheduled. Both parties agreed to cancel the transaction and the funds prepaid for land use right will be returned to the Company before December 31, 2023. |
| (2) | On April 20, 2020, the Company signed a factory building purchase agreement with Jiangsu Qionghua Group Co., Ltd. and paid deposit of RMB 85 million ($11.72 million). As a result of COVID-19, the factory building had not been completed as scheduled. Both parties agreed to cancel the transaction and that the deposit for the building would be returned to the Company on or before December 31, 2025, with such deposit accumulating interest at an annual interest rate of 3.5%. |
F-
4. Inventories
Inventories consist of the following:
|
June 30, 2023 |
December 31, 2021 |
|||||||
| US$ | US$ | |||||||
| Raw material | 493,143 | 177,474 | ||||||
| Work-in-process | 20,501 | 343,795 | ||||||
| Finished goods | 977,974 | 560,119 | ||||||
| Goods in transit | 95,814 | |||||||
| Low-value consumables | 59,714 | 40,650 | ||||||
| Total | 1,647,146 | 1,122,038 | ||||||
For the six months ended June 30, 2023 and 2022, there were no writes-down of inventories.
5. Intangible Assets
Intangible assets consisted of the following:
|
June 30, 2023 |
December 31, 2022 |
|||||||
| US$ | US$ | |||||||
| Land use rights | 4,134,521 | 752,887 | ||||||
| Patents | 27,582 | 28,997 | ||||||
| Software | 12,113 | 9,424 | ||||||
| Trademarks | 115,836 | 121,789 | ||||||
| Total | 4,290,052 | 913,097 | ||||||
| Less: accumulated amortization | 414,025 | 415,497 | ||||||
| Intangible assets, net | 3,876,027 | 497,600 | ||||||
Amortization expense was $13,733 and $13,417 for the six months ended June 30, 2023 and 2022, respectively. Hainan Guoxie spent $3.4 million in purchasing land use right for the six months ended June 30, 2023 and the price was fully paid. The land will be used for manufacturing facility.
The following table sets forth the Company’s amortization expenses for the twelve months ending December 31 of the following years:
| 2023 | $ | 41,870 | ||
| 2024 | 83,740 | |||
| 2025 | 83,740 | |||
| 2026 | 82,953 | |||
| 2027 | 82,690 | |||
| Thereafter | 3,501,034 | |||
| $ | 3,876,027 |
As of June 30, 2023 and December 31, 2022, the Company pledged land use rights to secure bank borrowings to the Company as disclosed in Note 7.
F-
6. Investment
On March 3, 2011, Yada invested RMB 6 million into Yangzhou Juyuan Guarantee Co., Ltd. (“Juyuan”) and obtained 12% equity interest of Juyuan. Juyuan mainly provides financing guarantee services and relevant consulting services to customers. Juyuan has only one executive director and one supervisor. Neither the executive director nor supervisor is related to Yada. Therefore, Yada has neither control nor significant influence over Juyuan. For the Company’s passive and without significant influence or control equity investment in a private company which does not have readily determinable fair values, the Company has elected the measurement alternative defined as cost, less impairment, plus or minus adjustments resulting from observable price changes in orderly transactions for the identical or a similar investment of the same issuer. On January 5, 2023, majority shareholder of Juyuan purchased 5% equity interest of Juyuan from Yada for a consideration of $360,839(RMB 2.5 million). The carrying value of the investment amounted to approximately $0.5 million as of June 30, 2023.
On December 1, 2022, Huadong invested RMB40 million into Zhongxiangxin, and obtained 25% ownership interest of Zhongxiangxin. Zhongxiangxin manufactures and sells medical materials in the PRC. The Company accounted for the investments using the equity method, because the Company has significant influence but does not own a majority equity interest or otherwise control over the equity investee. Under the equity method, the Company adjusts the carrying amount of the investment and recognizes investment income or loss for its share of the earnings or loss of the investee after the date of investment. When the Company’s share of losses in the equity investee equals or exceeds its interest in the equity investee, the Company does not recognize further losses, unless the Company has incurred obligations or made payments or guarantees on behalf of the equity investee. For the six months ended June 30, 2023 and 2022, the investment loss from Zhongxiangxin was $1,632 and $nil.
For the six months ended June 30, 2023 and 2022, no impairment indicators were identified related to revaluation of its investment in the private company was recorded.
F-
7. Bank Borrowings
Bank borrowings are working capital loans from banks in China. Short-term bank borrowings as of June 30, 2023 consisted of the following:
| Lender | Company | Rate | Issuance Date |
Expiration Date |
Amount- RMB |
Amount- US$ |
||||||||||||
| Bank of Communications | Huadong | 3.55 | % | 1/18/2023 | 5/25/2024 | 4,000,000 | 551,625 | |||||||||||
| Bank of Communications | Huadong | 3.50 | % | 11/3/2022 | 4/25/2024 | 5,000,000 | 689,532 | |||||||||||
| Agricultural Bank of China | Huadong | 3.60 | % | 8/12/2022 | 7/12/2023 | 9,000,000 | 1,241,157 | |||||||||||
| Jiangsu Yangzhou Rural Commercial Bank | Huadong | 3.95 | % | 1/30/2023 | 2/15/2024 | 5,000,000 | 689,532 | |||||||||||
| Bank of China | Huadong | 3.80 | % | 3/10/2023 | 3/9/2024 | 10,000,000 | 1,379,063 | |||||||||||
| Agricultural Bank of China | Yada | 3.60 | % | 12/8/2022 | 12/6/2023 | 10,000,000 | 1,379,063 | |||||||||||
| Industrial and Commercial Bank of China* | Yada | 3.45 | % | 2/17/2022 | 2/16/2024 | 9,000,000 | 1,241,156 | |||||||||||
| Total | 52,000,000 | 7,171,128 | ||||||||||||||||
Short-term bank borrowings as of December 31, 2022 consisted of the following:
| Lender | Company | Rate | Issuance Date |
Expiration Date |
Amount- RMB |
Amount- US$ |
||||||||||||
| Bank of Communications | Huadong | 3.55 | % | 3/9/2022 | 1/19/2023* | 4,000,000 | 579,946 | |||||||||||
| Agricultural Bank of China | Huadong | 3.40 | % | 12/8/2022 | 12/7/2023* | 9,000,000 | 1,304,877 | |||||||||||
| Jiangsu Yangzhou Rural Commercial Bank | Huadong | 3.95 | % | 2/17/2022 | 3/2/2023* | 5,000,000 | 724,932 | |||||||||||
| Bank of China | Huadong | 3.55 | % | 3/9/2022 | 1/19/2023* | 5,000,000 | 724,932 | |||||||||||
| Agricultural Bank of China | Yada | 3.60 | % | 12/8/2022 | 12/6/2023* | 10,000,000 | 1,449,864 | |||||||||||
| Industrial and Commercial Bank of China | Yada | 3.70 | % | 2/18/2022 | 2/21/2023* | 9,000,000 | 1,304,877 | |||||||||||
| Total | 42,000,000 | 6,089,428 | ||||||||||||||||
| * | These loans were renewed upon maturity. |
Interest expense was $128,973, and $98,805 for the six months ended June 30, 2023 and 2022, respectively.
The Company’s short-term bank borrowings are pledged by the Company’s assets and guaranteed by the Company’s major shareholders Yongjun Liu, Yin Liu and its subsidiary Yada.
The carrying values of the Company’s pledged assets to secure short-term borrowings by the Company are as follows:
|
June 30, 2023 |
December 31, 2022 |
|||||||
| US$ | US$ | |||||||
| Buildings, net | 3,432,150 | 2,777,379 | ||||||
| Land use right, net | 90,322 | 96,416 | ||||||
| Total | 3,522,472 | 2,873,795 | ||||||
F-
8. Long-term bank loan
There was no long-term bank loan as of June 30, 2023.
Long-term bank borrowings as of December 31, 2022 consisted of the following:
| Lender | Company | Rate | Issuance Date |
Expiration Date |
Amount- RMB |
Amount- US$ |
||||||||||||
| Bank of Communications | Huadong | 3.50 | % | 11/3/2022 | 4/25/2024 | 5,000,000 | 724,932 | |||||||||||
| Total | 5,000,000 | 724,932 | ||||||||||||||||
On November 3, 2022, the Company signed a loan agreement with Bank of Communications to obtain a two-year loan of RMB5 million ($724,932). The loan bears a floating interest rate of a benchmark rate (3.50%). Huada mortgages the property and land for guaranteed repayment of the loan. The principal shall be repaid on April 25, 2024. The balance was reclassified to short-term bank loan as of June 30, 2023.
9. Taxes Payable
Taxes payable consisted of the following:
|
June 30, 2023 |
December 31, 2022 |
|||||||
| US$ | US$ | |||||||
| VAT payable | 368,195 | 380,926 | ||||||
| Income tax payable | 1,012,775 | 690,824 | ||||||
| Other tax payable | 71,348 | 59,526 | ||||||
| Total | 1,452,318 | 1,131,276 | ||||||
10. Income Taxes
Cayman Islands
Under the current laws of the Cayman Islands, the Company is not subject to tax on income or capital gain. Additionally, upon payments of dividends to the shareholders, no Cayman Islands withholding tax is imposed.
Hong Kong
Under the current Hong Kong Inland Revenue Ordinance, the Company’s Hong Kong subsidiary, Kang Fu, is subject to 16.5% income tax on its taxable income generated from operations in Hong Kong. On December 29, 2017, the Hong Kong government announced a two-tiered profit tax rate regime. Under the two-tiered tax rate regime, the first HK$2.0 million earned in assessable profits will be subject to an 8.25% lower tax rate and the remaining taxable income will continue to be taxed at the existing 16.5% tax rate. The two-tiered tax regime becomes effective from the assessment year of 2018 and 2019, which is on or after April 1, 2018. The application of the two-tiered rates is restricted to only one nominated enterprise among connected entities. Kang Fu has been nominated by the Company as the entity to apply the two-tiered rates among the group for the assessment years of 2023 and 2022.
F-
PRC
Provisions for income tax are as follows:
|
June 30, 2023 |
June 30, 2022 |
|||||||
| US$ | US$ | |||||||
| Provisions for current income tax | 2,064,697 | 2,433,772 | ||||||
| Provisions for deferred income tax | ||||||||
| Total | 2,064,697 | 2,433,772 | ||||||
The following is a reconciliation of the Company’s total income tax expense to the income before income taxes for the six months ended June 30, 2023 and 2022, respectively:
|
June 30, 2023 |
June 30, 2022 |
|||||||
| US$ | US$ | |||||||
| Income before income tax provision | 9,097,681 | 8,988,658 | ||||||
| Tax at the PRC EIT tax rates | 2,203,896 | 2,689,271 | ||||||
| Change in valuation allowance | 16,934 | |||||||
| Tax effect of non-deductible expenses | 208,961 | 157,007 | ||||||
| Tax effect of R&D expenses additional deduction* | (365,094 | ) | (412,506 | ) | ||||
| Income tax expense | 2,064,697 | 2,433,772 | ||||||
| * | According to PRC tax regulations, an additional of 100% of current year R&D expenses may be deducted from tax income. |
Under the Enterprise Income Tax Law (“EIT Law”), Foreign Investment Enterprises (“FIEs”) and domestic companies are subject to Enterprise Income Tax (“EIT”) at a uniform rate of 25%.
Huadong was granted a High and New Technology Enterprise (“HNTE”) certificate and received a preferential tax rate of 15% for a three-year validity period from November 30, 2016 and the HNTE certificate was renewed on December 22, 2022 with a three-year validity period. Thus, Huadong will remain eligible for a 15% preferential tax rate from January 1, 2016 through December 31, 2025.
The EIT Law also provides that an enterprise established under the laws of a foreign country or region but whose “de facto management body” is located in the PRC be treated as a resident enterprise for PRC tax purposes and consequently be subject to the PRC income tax at the rate of 25% for its global income. The Implementing Rules of the EIT Law define the location of the “de facto management body” as “the place where the exercising, in substance, of the overall management and control of the production and business operation, personnel, accounting, properties, etc., of a non-PRC company is located.” Based on a review of surrounding facts and circumstances, the Company does not believe that it is likely that its entities registered outside of the PRC should be considered as resident enterprises for the PRC tax purposes.
The EIT Law also imposes a withholding income tax on dividends distributed by a FIE to its immediate holding company outside of the PRC. As a result, Kang Fu, which is the parent of Huada, Yada and Huadong, is therefore subject to a maximum withholding tax of 10% on dividends distributed by Huada, Yada and Huadong. In accordance with accounting guidance, all undistributed earnings are presumed to be transferred to the parent company and are subject to the withholding taxes. The presumption may be overcome if the Company has sufficient evidence to demonstrate that the undistributed dividends will be re-invested and the remittance of the dividends will be postponed indefinitely. As of June 30, 2023, the Company has determined that the undistributed earnings in Huada, Yada and Huadong will be re-invested into the subsidiary for the expansion of the Company’s business in mainland China and hence the remittance of dividends will be postponed indefinitely.
F-
Uncertain tax positions
The Company evaluates each uncertain tax position (including the potential application of interest and penalties) based on the technical merits, and measure the unrecognized benefits associated with the tax positions. As of June 30, 2023, and 2022, the Company did not have any significant unrecognized uncertain tax positions.
11. Commitments and Contingencies
Operating lease
The Company has an operating lease to rent an office space in Shanghai. The lease term is 12 months, with the option to renew annually. Rent expense was $5,856 and $5,856 and is included in general and administrative expenses for the six months ended June 30, 2023 and 2022, respectively. The Company has renewed the same operating lease with a term from January 1, 2023 to December 31, 2023, with all other lease terms remaining the same.
Other commitments
The Company did not have other significant commitments, long-term obligations or guarantees as of June 30, 2023 and 2022.
Contingencies
The Company is subject to legal proceedings and regulatory actions in the ordinary course of business. The results of such proceedings cannot be predicted with certainty, but the Company does not anticipate that the final outcome arising out of any such matter will have a material adverse effect on our consolidated business, financial position, cash flows or results of operations taken as a whole.
On February 4, 2022, Macias Gini & O’Connell, LLP (“Plaintiff”) initiated a lawsuit in San Francisco Superior Court. Plaintiff, a certified public accounting firm based in the U.S., was hired by Kang Fu International Medical Co, and subsequently by Meihua International Medical Technologies Co, Ltd. (collectively, “Meihua”), to audit Meihua’s consolidated financial statements for the 2018 and 2019 calendar years. Plaintiff seeks damages from Meihua for its alleged failure to pay for services rendered in the amount of $210,000, plus interest and attorneys’ fees. The case was dismissed with prejudice in August of 2023.
On August 29, 2023, Zhu Cheng initiated a lawsuit against Yada, Huada, Huadong and Kang Fu in Yangzhou Economic Development Zone Court. Zhu Cheng seeks damages from the above entities for service fee of approximately $2.3 million (RMB 17.0 million). The Company is preparing to file a motion to dismiss the case. No contingent liability has been accrued since the Company has deemed the possibility of loss to be remote.
12. Statutory Surplus Reserves and Restricted Net Assets
Pursuant to laws applicable to entities incorporated in the PRC, the Company is required to make appropriations to certain reserve funds, comprising the statutory surplus reserve and the discretionary surplus reserve, based on after-tax net income determined in accordance with generally accepted accounting principles of the PRC (“PRC GAAP”). Appropriations to the statutory surplus reserve are required to be at least 10% of the after-tax net income determined in accordance with PRC GAAP until the reserve is equal to 50% of the entity’s registered capital. Appropriations to the discretionary surplus reserve are made at the discretion of the Board of Directors. As of December 31, 2022 and June 30, 2023, the Company did not have a discretionary surplus reserve. As of December 31, 2022, all of the Company’s PRC subsidiaries reserves had reached 50% of their registered capital threshold and, as a result, the Company stopped being required to allocate after-tax profits to this reserve.
As a result of these PRC laws and regulations and the requirement that distributions by PRC entities can only be paid out of distributable profits computed in accordance with PRC GAAP, the PRC entities are restricted from transferring a portion of their net assets to the Company. Amounts restricted include paid-in capital and the statutory reserves of the Company’s PRC subsidiaries. The aggregate amounts of capital and statutory reserves restricted which represented the amount of net assets of the relevant subsidiaries in the Company not available for distribution was $15,665,860 as of June 30, 2023 and December 31, 2022.
Under PRC laws and regulations, statutory surplus reserves are restricted to set-off against losses, expansion of production and operation and increasing registered capital of the respective company and are not distributable other than upon liquidation. The reserves are not allowed to be transferred to the Company in terms of cash dividends, loans or advances, nor allowed for distribution except under liquidation.
F-
13. Related Party Transactions and Balances
Related Parties:
| Name of related parties | Relationship with the Company | |
| Shanghai Xinya Pharmaceutical Hanjiang Co., Ltd. | An entity controlled by Kai Liu, son of Yongjun Liu | |
| Yangzhou Meihua Import and Export Co., Ltd. | An entity controlled by Kai Liu, son of Yongjun Liu |
Related Party Sales
The Company sells products to its related parties and the sales amount from related parties for the six months end 2023 and 2022 are as follows:
Sales:
| For the Six Months ended June 30, |
||||||||
| Name of related party | 2023 | 2022 | ||||||
| Yangzhou Meihua Import and Export Co., Ltd. | $ | 11,751 | $ | 18,849 | ||||
| Shanghai Xinya Pharmaceutical Hanjiang Co., Ltd. | 10,818 | |||||||
| Total | $ | 11,751 | $ | 29,667 | ||||
14. Subsequent Events
The Company has evaluated the impact of events that have occurred subsequent to June 30, 2023, through the issuance date of the consolidated financial statements, and concluded that no subsequent events have occurred that would require recognition in the consolidated financial statements or disclosure in the notes to the consolidated financial statements.
F-26
Exhibit 99.2
Management’s discussion and analysis of the financial condition and results of operations of Meihua International Medical Technologies Co., Ltd., a Cayman Islands company (“Meihua International,” the “Company,” “we,” “our,” or “us”), for the semi-annual period ended June 30, 2023 is set forth below:
MANAGEMENT’S DISCUSSION AND ANALYSIS OF FINANCIAL CONDITION AND RESULTS OF OPERATIONS
The following discussion and analysis of our financial condition and results of operations should be read in conjunction with our condensed consolidated financial statements and the related notes included elsewhere in this filing. This discussion contains forward-looking statements that involve risks and uncertainties. Actual results and the timing of selected events could differ materially from those anticipated in these forward-looking statements as a result of various factors.
A. Operating Results
Business Overview
Meihua International Medical Technologies Co., Ltd., through its operating subsidiaries, is mainly engaged in the manufacture, research and development and sales of Class I, II and III medical devices. It has a history of more than 30 years and has multiple product categories, with more than 800 domestic products and more than 120 export products. The main product lines include disposable infusion pumps, anesthesia puncture kits, electronic pumps, full anesthesia kits, urethral catheterization kits, gynecological examination kits, endotracheal intubation, dressing applications and various tubes. It is the leading enterprise in China’s medical consumables industry. The Company has received qualification to manufacture and produce China’s first, second and third type of medical device consumables and, at the same time, the Company has acquired FDA registration and the European Union’s CE certification. Relevant permissions have been obtained in major sales markets to meet local regulatory requirements.
The Company’s distribution network covers major global markets. Internationally, the Company mainly exports medical devices through exporting distributors. To date, the Company has 334 exporting distributors responsible for distributing its products to end users in Europe, North America, Asia, South America, Africa, and Oceania. In the Chinese market, the Company sells products under its own brand to customers all over the country. The Company’s product permeation for mainland China has reached major medical institutions and pharmacies through some 3,159 distributors. At the same time, the Company has established a cooperative network with more than 531 hospitals through its own direct sales channels.
Revenues decreased by $6.6 million, or approximately 12.1%, to $48.2 million in the six months ended June 30, 2023 from $54.8 million in the six months ended June 30, 2022. The decrease was mainly due to a decline in demand for customer orders.
Net income increased by $0.5 million, or approximately 7.3%, to $7.0 million in the six months ended June 30, 2023 from $6.6 million in the six months ended June 30, 2022. The increase was mainly due to decrease in operating expenses in the six months ended June 30, 2023.
Recent Developments
On August 24, 2023, the Company filed with the U.S. Securities and Exchange Commission (the “SEC”) a registration statement on Form F-3 under the Securities Act of 1933, as amended (the “Securities Act”), utilizing a “shelf” registration process through which the company may offer and selling, from time to time, up to $100,000,000 of the Company’s ordinary shares, par value $0.0005 per share, debt securities, warrants, rights, and units, or any combination thereof, together or separately as described in the prospectus.
Coronavirus (COVID-19) Update
On January 30, 2020, the World Health Organization declared the outbreak of the corona-virus disease (COVID-19) a “Public Health Emergency of International Concern,” and on March 11, 2020, the World Health Organization characterized the outbreak as a “pandemic.” Governments in affected countries have imposed travel bans, quarantines and other emergency public health measures, which have caused material disruption to businesses globally and result in an economic slowdown. These measures, though temporary in nature, may continue and increase depending on developments in the COVID-19’s outbreak.
In fiscal year 2020, COVID-19 had a significant impact on our business and results of operations as the sales volume of masks rose sharply, while at the same time sales of products other than masks declined due to a decrease in market demand. In fiscal year 2021, as circumstances surrounding the COVID-19 epidemic stabilized within the PRC, the market for masks was no longer in urgent shortage compared to the same period in 2020, and the production of other epidemic prevention products resumed normal production levels. In general, with the precise control of the epidemic in the PRC, our production and operations recovered smoothly, and the demand for other products has increased gradually.
After the initial outbreak of COVID-19, from time to time, some instances of COVID-19 infections have emerged in various regions of China, including the infections caused by the Omicron variants in 2022. For example, a wave of infections caused by the Omicron variants emerged in Shanghai in 2022, and a series of restrictions and quarantines were implemented to contain the spread.
Many of the restrictive measures previously adopted by the PRC governments at various levels to control the spread of the COVID-19 virus have been revoked or replaced with more flexible measures since December 2022. While the revocation or replacement of the restrictive measures to contain the COVID-19 pandemic could have a positive impact on our normal operations, the extent of the impact on the Company’s future financial results will be dependent on future developments such as the length and severity of the crisis, the potential resurgence of the crisis, future government actions in response to the crisis and the overall impact of the COVID-19 pandemic on the global economy and capital markets, among many other factors, all of which remain highly uncertain and unpredictable. Given this uncertainty, the Company is currently unable to quantify the expected impact of the COVID-19 pandemic on its future operations, financial condition, liquidity and results of operations if the current situation continues.
In preparing these consolidated financial statements, the Company has evaluated events and transactions for potential recognition or disclosure through six months ended June 30, 2023, the date the consolidated financial statements were available to be issued. No events require additional adjustment to or disclosure in the consolidated financial statements.
Results of Operations for the Six Months Ended June 30, 2023 and 2022
The following table sets forth a summary of our consolidated results of operations for the periods presented. This information should be read together with our consolidated financial statements and related notes included elsewhere in this Annual Report. The results of operations in any period are not necessarily indicative of our future trends.
(Amounts expressed in U.S. dollars, except share data and per share data, or otherwise noted)
For the Six months Ended June 30, 2023 and 2022
| For the Six months Ended June 30, |
||||||||
| 2023 | 2022 | |||||||
| Revenues | ||||||||
| Third party sales | $ | 48,178,325 | $ | 54,803,181 | ||||
| Related party sales | 11,751 | 29,666 | ||||||
| Total revenues | 48,190,076 | 54,832,847 | ||||||
| Cost of revenues | 31,019,347 | 33,941,115 | ||||||
| Gross profit | 17,170,729 | 20,891,732 | ||||||
| Operating expenses | ||||||||
| Selling | 3,161,070 | 3,311,649 | ||||||
| General and administrative | 3,452,610 | 4,799,711 | ||||||
| Research and development | 1,460,376 | 1,642,204 | ||||||
| Written-off Tai He deposit | - | 2,469,466 | ||||||
| Total operating expenses | 8,074,056 | 12,223,030 | ||||||
| Income from operations | 9,096,673 | 8,668,702 | ||||||
| Other (income) expense: | ||||||||
| Interest expense | 128,973 | 98,805 | ||||||
| Interest income | (361,532 | ) | (19,725 | ) | ||||
| Currency exchange (gain) loss | 119,193 | (449,217 | ) | |||||
| Other expense, net | 114,298 | 50,180 | ||||||
| Total other (income) expenses | 932 | (319,957 | ) | |||||
| Income before income tax provision | 9,095,741 | 8,988,659 | ||||||
| Income taxes expense | 2,064,212 | 2,433,772 | ||||||
| Net income | $ | 7,031,529 | $ | 6,554,887 | ||||
For the Six months Ended June 30, 2023 and 2022
Revenues
Revenues decreased by $6.6 million, or approximately 12.1%, to $48.2 million for the six months ended June 30, 2023 from $54.8 million in the six months ended June 30, 2022. The decrease was mainly due to a decline in demand for customer orders.
Cost of revenues
Cost of revenues primarily include cost of materials, direct labor costs, overhead, and other related incidental expenses that are directly attributable to the Company’s principal operations. Cost of revenues decreased by $2.9 million, or approximately 8.6%, to $31.0 million in the six months ended June 30, 2023 from $33.9 million in the six months ended June 30, 2022. The decrease was generally in line with decrease in revenue except some fixed cost such as lease expense and salary of administrative employees in production department.
Gross profit margin
The following table sets forth the overall gross profit margin of the Company:
| For the Six months Ended June 30 |
||||||||
| 2023 | 2022 | |||||||
| Revenues | $ | 48,190,076 | $ | 54,832,847 | ||||
| Costs of revenues | 31,019,347 | 33,941,115 | ||||||
| Gross profit | $ | 17,170,729 | $ | 20,891,732 | ||||
| Gross profit margin % | 35.6 | % | 38.1 | % | ||||
Gross profit decreased by $3.7 million, or approximately 17.8%, to $17.2 million in the six months ended June 30, 2023 from $20.9 million in the six months ended June 30, 2022. Gross profit margin decreased from 38.1% in the six months ended June 30, 2022 to 35.6% in the six months ended June 30, 2023 due to some fixed cost did not decrease proportionately with revenue.
Operating costs and expenses
Our operating costs and expenses consist of selling expenses, general and administrative expenses and research and development expenses.
Selling
The following table sets forth a breakdown of the selling expenses of the Company:
For the Six months Ended June 30,2023 and 2022
| 2023 | 2022 | |||||||
| Transportation expenses | $ | 1,137,936 | $ | 1,404,106 | ||||
| Salaries and benefits | 698,086 | 787,279 | ||||||
| Entertainment expenses | 500,485 | 427,447 | ||||||
| Conference expenses | 493,850 | 415,750 | ||||||
| Travel allowance | 177,807 | 159,228 | ||||||
| Auto expenses | 118,629 | 101,031 | ||||||
| Advertising expenses | 8,275 | 7,603 | ||||||
| Other expenses | 26,002 | 9,205 | ||||||
| Total | $ | 3,161,070 | $ | 3,311,649 | ||||
Selling expenses decreased by $0.1 million, or approximately 4.5%, to $3.2 million in the six months ended June 30, 2023 from $3.3 million in the six months ended June 30, 2022. The decrease was mainly attributable to the combined effects of the followings:
| (a) | Our conference expenses increased by $78,100, or approximately 18.8% to $0.5 million in the six months ended June 30, 2023 from $0.4 million in the six months ended June 30, 2022. Conference expenses are mainly related to the company’s market expansion, business development, business negotiation, medical expo, and exhibition affairs. These expenditures helped the Company promote its products, develop markets and channels, strengthen customer communication, and establish long-term and stable cooperative relations; |
| (b) | Our transportation expenses decreased by $0.3 million, or approximately 19.0%, to $1.1 million in the six months ended June 30, 2023 from $1.4 million in the six months ended June 30, 2022. The reduction in business travel was due to a decline in demand for customer orders. |
| (c) | Our salaries and benefits expenses decreased by $89,193 or approximately 11.3%, to $0.7 million in the six months ended June 30, 2023 from $0.8 million in the six months ended June 30, 2022. The decrease was due to a decrease in the salary and benefits of the sales team, which was in line with revenue decrease. |
| (d) | Our entertainment expenses increased by $73,038, or approximately 17.1%, to $0.5 million in the six months ended June 30, 2023 from $0.4 million in the six months ended June 30, 2022. The increase was mainly attributable to new customer acquisition efforts. |
General and administrative
General and administrative expenses primarily consist of the following expenses:
For the Six months Ended June 30, 2023 and 2022
| 2023 | 2022 | |||||||
| Salaries and benefits | $ | 738,077 | $ | 600,682 | ||||
| Entertainment expenses | 606,820 | 481,334 | ||||||
| Conference fee | 374,022 | 311,786 | ||||||
| Auto expenses | 113,810 | 83,363 | ||||||
| Maintenance expenses | 50,199 | 65,278 | ||||||
| Depreciation expenses | 45,951 | 16,793 | ||||||
| Travel allowance | 72,283 | 63,044 | ||||||
| Office expenses | 45,664 | 50,288 | ||||||
| Surtax expenses | 302,376 | 338,190 | ||||||
| Amortization expenses | 19,696 | 13,416 | ||||||
| Rental expenses | 7,299 | 7,805 | ||||||
| Insurance expenses | 118,000 | 50,336 | ||||||
| Service expenses | 726,302 | 2,496,058 | ||||||
| Other expenses | 232,111 | 221,338 | ||||||
| Total | $ | 3,452,610 | $ | 4,799,711 | ||||
General and administrative expenses decreased by $1.3 million, or approximately 28.1%, to $3.5 million in the six months ended June 30, 2023 from $4.8 million in the six months ended June 30, 2022. The decrease was primarily due to (a) service expenses decreasing by approximately $1.8 million from approximately $2.5 million in the six months ended June 30, 2022 to approximately $0.7 million in the six months ended June 30, 2023, offset by (b) salaries and benefits increasing by approximately $137,000 from approximately $601,000 in the six months ended June 30, 2022 to approximately $738,000 in the six months ended June 30, 2023, and (c) entertainment expenses increasing by $125,000 or 26.1% from approximately $481,000 in the six months ended June 30, 2022 to approximately $607,000 in the six months ended June 30, 2023
Research and development
The following table sets forth a breakdown of the research and development expenses of the Company:
For the Six months Ended June 30,2023 and 2022
| 2023 | 2022 | |||||||
| Sample manufacturing expenses | $ | 676,283 | $ | 850,532 | ||||
| Salaries and benefits | 564,114 | 586,062 | ||||||
| Travel allowance | 58,886 | 64,201 | ||||||
| Depreciation expenses | 5,113 | 3,993 | ||||||
| Design expenses | 38,985 | 52,337 | ||||||
| Material expenses | 13,495 | 11,943 | ||||||
| Other expenses | 103,500 | 73,136 | ||||||
| Total | $ | 1,460,376 | $ | 1,642,204 | ||||
The research and development expenses decreased by $0.2 million, or approximately 11.1%, to $1.5 million in the six months ended June 30, 2023, from $1.6 million in the six months ended June 30, 2022. The decrease was mainly due to decrease in sample manufacturing expenses.
Income from operations
As a result of the factors described above, our income from operations increased by $0.4 million, or approximately 4.9%, to $9.1 million in the six months ended June 30, 2023 from $8.7 million in the six months ended June 30, 2022.
Income tax expense
The provision for income taxes decreased by $0.4 million, or approximately 15.2%, to $2.1 million in the six months ended June 30, 2023 from $2.4 million in the six months ended June 30, 2022. The decrease was mainly due to the decrease of taxable income for the six months ended June 30, 2023.
Net income
As a result of the factors described above, our net income increased by $0.5 million, or approximately 7.3%, to $7.0 million in the six months ended June 30, 2023 from $6.6 million in the six months ended June 30, 2022.
Unrealized foreign currency translation adjustment
The Company’s reporting currency is the United States dollar (“US$”). The Company’s operations are primarily conducted through the PRC subsidiaries where the local currency is the functional currency. The functional currency of Kang Fu HK is the Hong Kong dollar and the functional currency of Huada, Yada, Huadong and Guanghui is the Renminbi (“RMB”). Results of operations and cash flows are translated at average exchange rates during the period, assets and liabilities are translated at the unified exchange rate at the end of the period and equity is translated at historical exchange rates. Translation adjustments resulting from the process of translating the financial statements denominated in RMB into U.S. dollars are included in other comprehensive income. Our foreign currency translation loss in the six months ended June 30, 2023 was $6.3 million, compared to the foreign currency translation loss of $6.1 million in the six months ended June 30, 2022. The change was primarily due to the exchange rate fluctuation of RMB against the U.S. dollars.
B. Liquidity and Capital Resources
Cash Flows and Working Capital
As of June 30, 2023 and 2022, we had cash of $17.9 million and $34.7 million, respectively. We believe that our current cash, cash to be generated from our operations and access to capital market will be sufficient to meet our working capital needs for at least the next twelve months. We do not have any amounts committed to be provided by our related party. We are also not dependent upon future financing to meet our liquidity needs for the next twelve months. In order to implement our growth strategies, we plan to expand our business. With additional capacity, and varied product offerings, the Company will provide tailored “one-stop” services from wound care, to surgical auxiliary supplies, to disease prevention. To do so, we may need more capital through equity financing to expand our production and meet market demands.
Substantially all of our operations are conducted in China and all of our revenues, expense and cash are denominated in RMB. RMB is subject to the exchange control regulation in China, and, as a result, we may have difficulty in distributing any dividends outside of China due to PRC exchange control regulations which restrict the ability to convert RMB into U.S. Dollars.
Under applicable PRC regulations, foreign-invested enterprises in China may pay dividends only out of their accumulated profits, if any, determined in accordance with PRC accounting standards and regulations. In addition, a foreign-invested enterprise in China is required to set aside at least 10% of its after-tax profit every year as its general reserves based on PRC accounting standards until the accumulative amount of such reserves reaches 50% of its registered capital. These reserves can’t be distributed as cash dividends. The board of directors of a foreign-invested enterprise has the discretion to allocate a portion of its after-tax profits to staff welfare and bonus funds, which can’t be distributed to equity owners except liquidation. Under PRC law, RMB can be converted into U.S. Dollars under the company’s “current account” (including dividends, trade and service-related foreign exchange transactions) rather than the “capital account” (including foreign direct investments and loans, without the prior approval of the SAFE).
For retained earnings accrued after such date, the board of directors will declare dividends after taking into account our operations, earnings, financial condition, the demand for cash and availability and other relevant factors. Any declaration, payment and amount of dividends should be subject to our By-laws, charter and applicable Chinese and U.S. state and federal laws and regulations, including the approval from the shareholders of each subsidiary which intends to declare such dividends, if applicable.
We have limited financial obligations dominated in U.S. dollars, thus the foreign currency restrictions and regulations in PRC on the dividends distribution will not have a material impact on the liquidity, financial condition and results of operations of our Company.
Cash Flow Summary
For the Six months Ended June 30, 2023 and 2022
| 2023 | 2022 | |||||||
| Net Cash Used in Operating Activities | $ | (5,424,569 | ) | $ | (7,798,816 | ) | ||
| Net Cash Used in Investing Activities | (3,866,151 | ) | (459,163 | ) | ||||
| Net Cash Provided by Financing Activities | 721,677 | 35,144,846 | ||||||
| Effect of Exchange Rate Changes on Cash | (306,443 | ) | (370,615 | ) | ||||
| Cash at Beginning of Year | 26,736,700 | 8,149,276 | ||||||
| Cash at End of Year | $ | 17,861,214 | $ | 34,665,528 | ||||
For the Six months Ended June 30, 2023 and 2022
Cash Flow in Operating Activities
Net cash used in operating activities was $5.4 million in the six months ended June 30, 2023, primarily comprised of net income of approximately $7.0 million and adjusted for non-cash items approximately $0.5 million, increase in accounts receivable of approximately $14.1 million, decrease of bank acceptance receivable of approximately $2.8 million, decrease of accounts payable of approximately $1.6 million, increase in inventory of approximately $0.6 million.
Net cash used in operating activities was $7.8 million in the six months ended June 30, 2022, primarily comprised of net income of approximately $6.6 million and adjusted for non-cash items approximately $2.4 million, decrease in accounts receivable of approximately $3.5 million, increase of bank acceptance receivable of approximately $9.7 million, decrease of accounts payable of approximately $4.9 million, increase in prepayments and other assets of approximately $5.3 million.
Cash Flow in Investing Activities
Net cash used in investing activities was $3.9 million in the six months ended June 30, 2023. It consisted of purchases of property and equipment of $1.0 million, intangible assets of $3.6 million, proceeds from disposal of fixed assets of $0.4 million, and proceeds from disposal of long-term investment of $0.4 million.
Net cash used in investing activities was $0.5 million in the six months ended June 30, 2022. It consisted of purchases of property and equipment.
Cash Flow in Financing Activities
For the six months ended June 30, 2023, the Company had net cash provided by financing activities of $0.7 million, which consisted of the proceeds from short-term bank loans of $5.3 million, and repayments of short-term bank loans of $4.6 million.
For the six months ended June 30, 2022, the Company had net cash provided by financing activities of $35.1 million, which consisted of the proceeds from short-term bank loans of $3.5 million, and repayments of short-term bank loans of $2.9 million.
Off-Balance Sheet Arrangements
As of June 30, 2023 and December 31, 2022, there were no off-balance sheet arrangements.
C. Research and Development, Patents and Licenses, etc.
Please see Item 4.A. “Information on the Company—Business Overview—Intellectual Property,” in 20-F/A filed on August 29, 2023.
D. Trend Information
Other than as disclosed elsewhere in this Annual Report, we are not aware of any trends, uncertainties, demands, commitments or events for the six months ended June 30, 2023 that are reasonably likely to have a material adverse effect on our net revenues, income, profitability, liquidity or capital resources, or that would cause the disclosed financial information to be not necessarily indicative of future operating results or financial conditions.
E. Critical Accounting Estimates
Our discussion and analysis of our financial condition and results of operations are based upon our unaudited condensed consolidated financial statements. These financial statements are prepared in accordance with U.S. GAAP, which requires us to make estimates and assumptions that affect the reported amounts of our assets and liabilities and revenue and expenses, to disclose contingent assets and liabilities on the date of the unaudited condensed consolidated financial statements, and to disclose the reported amounts of revenue and expenses incurred during the financial reporting period. The most significant estimates and assumptions include allowance for bad debts and the valuation of inventory. We continue to evaluate these estimates and assumptions that we believe to be reasonable under the circumstances. We rely on these evaluations as the basis for making judgments about the carrying values of assets and liabilities that are not readily apparent from other sources. Since the use of estimates is an integral component of the financial reporting process, actual results could differ from those estimates. Some of our accounting policies require higher degrees of judgment than others in their application. We believe critical accounting policies as disclosed in this report reflect the more significant judgments and estimates used in preparation of our consolidated financial statements. We believe there have been no material changes to our critical accounting policies and estimates.
Accounts Receivable and Allowance for Doubtful Accounts
Accounts receivable represent trade receivables and are recognized initially at fair value and subsequently adjusted for any allowance for doubtful accounts or impairment.
The Company records impairment losses for accounts receivable based on assessments of the recoverability of the trade and other receivables and individual account analysis, including the current creditworthiness and the past collection history of each debtor. Impairments arise when there is objective evidence indicating that the balances may not be collectible. The identification of bad and doubtful debts, in particular of a loss event, requires the use of judgment and estimates, which involve the estimates of specific losses on individual exposures, as well as a provision on historical trends of collections. Based on management of customers’ credit and ongoing relationship, management makes conclusions whether any balances outstanding at the end of the period will be deemed non-collectible on an individual basis and on aging analysis basis. The provision is recorded against accounts receivables balances, with a corresponding charge recorded in the consolidated statements of operations and comprehensive income. Delinquent account balances are written-off against the allowance for doubtful accounts after management has determined that the likelihood of collection is not probable.
Inventories
Inventories are valued using the lower of cost or net realizable value. Cost is principally determined using the weighted-average method. The Company records adjustments to inventory for excess quantities, obsolescence, or impairment, when appropriate, to reflect inventory at net realizable value. These adjustments are based upon a combination of factors including current sales volume, market conditions, lower of cost or market analysis and expected realizable value of the inventory.
Exhibit 99.3
Meihua International Medical Technologies Co., Ltd. Reports Unaudited 2023 First Half Financial Results
YANGZHOU, China, October 2, 2023 /PRNewswire/ -- Meihua International Medical Technologies Co., Ltd. (“MHUA” or the “Company”) (NASDAQ: MHUA), a reputable manufacturer and provider of Class I, II, and III disposable medical devices with operating subsidiaries in China, today reported its unaudited financial results for the six months ended June 30, 2023. All amounts below are in U.S. dollars.
First Half 2023 Financial Metrics:
| ● | Revenues decreased by 12.1% to approximately $48.2 million for the six months ended June 30, 2023, from approximately $54.8 million in the same period of fiscal year 2022. |
| ● | Gross profit decreased by 17.8% to approximately $17.2 million for the six months ended June 30, 2023, from approximately $20.9 million in the same period of fiscal year 2022. |
| ● | Gross margin decreased from 38.1% in the six months ended June 30, 2022 to 35.6% in the six months ended June 30, 2023. |
| ● | Income from operations increased by 4.9% to $9.1 million for the six months ended June 30, 2023, from $8.7 million for the six months ended June 30, 2022. |
| ● | Net income increased by 7.3% to approximately $7.0 million for the six months ended June 30, 2023 from $6.6 million in the same period of fiscal year 2022. |
| For the six months ended June 30, | ||||||||||||
| (in $ millions, except earnings per share; difference due to rounding) | 2023 | 2022 | % Change | |||||||||
| Revenues | $ | 48.2 | $ | 54.8 | (12.1 | )% | ||||||
| Gross profit | $ | 17.2 | $ | 20.9 | (17.8 | )% | ||||||
| Gross margin | 35.6 | % | 38.1 | % | (2.5 percentage point | ) | ||||||
| Income from operation | $ | 9.1 | $ | 8.7 | 4.9 | % | ||||||
| Net income | $ | 7.0 | $ | 6.6 | 7.3 | % | ||||||
| Net income per share - Basic and Diluted | $ | 0.29 | $ | 0.29 | 0.0 | % | ||||||
Mr. Yongjun Liu, Chairman of the Company, commented: “With a rich legacy spanning over three decades, we have forged enduring partnerships with 334 distributors across Europe, North America, Asia, South America, Africa, and Oceania. We believe that this extensive network empowers us to cater to the discerning clientele on a global scale. Domestically, we have established a formidable presence, leveraging a robust network of 3,159 distributors nationwide to propel our brand. Moreover, we believe that our strategic collaborations with over 531 hospitals and direct sales channels have further propelled our market penetration, solidifying our influence.”
“While we experienced a temporary downturn in revenue for the period ended June 30, 2023, our overall financial performance remains resilient. In the first half of 2023, we achieved revenues of $48.2 million, exhibiting a slight decrease from the corresponding period in 2022, which stood at $54.8 million. Notwithstanding this decrease in revenues, which we believe is temporary, we believe our unwavering focus on optimizing operational costs has yielded substantial growth in net income. During the same timeframe, our net income increased to $7.0 million, reflecting a commendable 7.3% increase from $6.6 million in 2022.”
“Despite the impact of the global COVID-19 pandemic on the sales and market dynamics of certain essential medical products, leading to a partial decline in profits, our proactive strategic planning has helped to ensure the smooth progress in the development of our state-of-the-art medical facility in China’s Hainan Province. As production and operations gradually regain momentum, we believe market demand for our future products will be poised to surge. We firmly believe that Meihua International’s strategic transformation is on the cusp of yielding tangible results, gradually evolving into a cohesive entity. Through planning and strategic execution, we believe our future endeavors will enable us to transcend the confines of the traditional medical consumables market, and allow us to channel our efforts towards high-value products imbued with technological prowess. Consequently, we anticipate Meihua International will experience a stable rebound across our overall business, generating confidence in the future market landscape.”
“Looking ahead, we remain steadfast in our commitment to continued growth and expansion. Through continuous innovation, expansion of our product portfolio, and an unwavering dedication to excellence, we are poised to reinforce our position as a global leader in the medical equipment industry. Harnessing our expertise and expanding our market influence, we are confident that we will continue to offer groundbreaking solutions that revolutionize healthcare outcomes on a global scale.”
First Half 2023 Financial Results
Revenues
Revenue decreased by approximately $6.6 million, or 12.1%, to approximately $48.2 million for the six months ended June 30, 2023 from $54.8 million for the six months ended June 30, 2022. The decrease in revenues was primarily driven by a decline in demand for customer orders.
Cost of revenues
Cost of revenues primarily include cost of materials, direct labor costs, overhead, and other related incidental expenses that are directly attributable to the Company’s principal operations. Cost of revenues decreased by $2.9 million, or approximately 8.6%, to $31.0 million in the six months ended June 30, 2023 from $33.9 million in the six months ended June 30, 2022. The decrease was driven by an increase related to some ongoing fixed costs such as lease expense and salary of administrative employees, which was generally in line with our decrease in revenue experienced during the period.
Gross profit and margin
Gross profit decreased by $3.7 million, or approximately 17.8%, to $17.2 million in the six months ended June 30, 2023 from $20.9 million in the six months ended June 30, 2022. Gross profit margin decreased from 38.1% in the six months ended June 30, 2022 to 35.6% in the six months ended June 30, 2023. This decrease was due to some fixed cost that did not decrease proportionately with revenue.
Operating costs and expenses
Operating costs and expenses consist of selling expenses, general and administrative expenses and research and development expenses.
Selling
Selling expenses decreased by $0.1 million, or approximately 4.5%, to $3.2 million in the six months ended June 30, 2023 from $3.3 million in the six months ended June 30, 2022. The decrease was mainly attributable to the combined effects of the following:
| (a) | Conference expenses increased by $78,100, or approximately 18.8% to $0.5 million in the six months ended June 30, 2023 from $0.4 million in the six months ended June 30, 2022. Conference expenses are mainly related to the company’s market expansion, business development, business negotiation, medical expo and exhibition affairs. These expenditures helped the Company promote its products, develop markets and channels, strengthen customer communication, and establish long-term and stable cooperative relations; |
| (b) | Transportation expenses decreased by $0.3 million, or approximately 19.0%, to $1.1 million in the six months ended June 30, 2023 from $1.4 million in the six months ended June 30, 2022. The reduction in business travel was due to a decline in demand for customer orders; |
| (c) | Salaries and benefits expenses decreased by $89,193, or approximately 11.3%, to $0.7 million in the six months ended June 30, 2023 from $0.8 million in the six months ended June 30, 2022. The decrease was due to a decrease in salaries and benefits paid to the sales team, which was in line with the decrease in revenue; and |
| (d) | Entertainment expenses increased by $73,038, or approximately 17.1%, to $0.5 million in the six months ended June 30, 2023 from $0.4 million in the six months ended June 30, 2022. The increase was mainly attributable to new customer acquisition efforts. |
General and administrative expenses
General and administrative expenses decreased by $1.3 million, or approximately 28.1%, to $3.5 million in the six months ended June 30, 2023 from $4.8 million in the six months ended June 30, 2022. The decrease was primarily due to (a) service expenses decreasing by approximately $1.8 million from approximately $2.5 million in the six months ended June 30, 2022 to approximately $0.7 million in the six months ended June 30, 2023, offset by (b) salaries and benefits increasing by approximately $137,000 from approximately $601,000 in the six months ended June 30, 2022 to approximately $738,000 in the six months ended June 30, 2023, and (c) entertainment expenses increasing by $125,000 or 26.1% from approximately $481,000 in the six months ended June 30, 2022 to approximately $607,000 in the six months ended June 30, 2023.
Research and development expenses
Research and development expenses decreased by $0.2 million, or approximately 11.1%, to $1.5 million in the six months ended June 30, 2023 from $1.6 million in the six months ended June 30, 2022. The decrease was mainly due to decrease in sample manufacturing expenses.
Income from operations
Income from operations, as a result of the factors described above, increased by $0.4 million, or approximately 4.9%, to $9.1 million in the six months ended June 30, 2023 from $8.7 million in the six months ended June 30, 2022.
Net income
Net income increased by $0.5 million, or approximately 7.3%, to $7.0 million in the six months ended June 30, 2023 from $6.6 million in the six months ended June 30, 2022.
Recent development
On May 15, 2023, the Company announced that its wholly-owned subsidiary, Jiangsu Huadong Medical Device Industrial Co., Ltd., has been invited to participate for the 12th consecutive year in the 87th China International Medical Equipment Fair, the largest and most prestigious medical industry fair in China. The event, which runs from May 14th to 17th, 2023, will provide an excellent platform for Jiangsu Huadong to showcase its cutting-edge medical devices and technologies.
On May 1, 2023, the Company announced that via its subsidiary Hainan Guoxie Technology Group Co., Ltd., has completed the purchase of land use rights in the South of Hainan Free Trade Port Boao Hope City in Qionghai city for investment and construction of an integrated medical industrial park. The Company plans to develop a comprehensive industrial park on the land, including a product research and development, production and sales training center, and import/export product assembly and technology license-in projects. The site will also include a hospital and a retirement and rehabilitation-integrated service center.
About Meihua International Medical Technologies Co., Ltd.
Meihua International Medical Technologies, Ltd. (“Meihua International” of the “Company”) is a reputable manufacturer and provider of Class I, II, and III disposable medical devices with operating subsidiaries in China. The Company manufactures and sells Class I disposable medical devices, such as HDPE bottles for tablets and LDPE bottles for eye drops, throat strip and anal bags, and Class II and III disposable medical devices, such as disposable identification bracelets, gynecological examination kits, inspection kits, surgical kits, medical brushes, medical dressing, medical catheters, uterine tissue suction tables, virus sampling tubes, disposable infusion pumps, electronic pumps and anesthesia puncture kits, among other products which are sold under Meihua’s brands and are also sourced and distributed from other manufacturers. The Company has received international “CE” certification and ISO 13485 system certification and has also registered with the FDA (registration number: 3006554788) for over 20 Class I products. The Company has served hospitals, pharmacies, medical institutions and medical equipment companies for more than 30 years, providing over 1,000 types of products for domestic sales, as well as over 120 products which are exported to more than 30 countries internationally across Europe, North America, South America, Asia, Africa and Oceania. For more information, please visit www.meihuamed.com.
Forward-Looking Statement
This press release contains forward-looking statements as defined by the Private Securities Litigation Reform Act of 1995. Forward-looking statements include statements concerning plans, objectives, goals, strategies, future events or performance, and underlying assumptions and other statements that are other than statements of historical facts. When the Company uses words such as “may,” “will,” “intend,” “should,” “believe,” “expect,” “anticipate,” “project,” “estimate” or similar expressions that do not relate solely to historical matters, it is making forward-looking statements. Forward-looking statements are not guarantees of future performance and involve risks and uncertainties that may cause the actual results to differ materially from the Company’s expectations discussed in the forward-looking statements. These statements are subject to uncertainties and risks including, but not limited to, the following: the Company’s ability to achieve its goals and strategies, and its ability to fully execute on the planned agreement, the Company’s future business development and plans of future business development, including its ability to successfully develop robotic assisted surgery systems and obtain licensure and certification for such systems, financial conditions and results of operations, product and service demand and acceptance, reputation and brand, the impact of competition and pricing, changes in technology, government regulations, fluctuations in general economic and business conditions in China, and assumptions underlying or related to any of the foregoing and other risks contained in reports filed by the Company with the U.S. Securities and Exchange Commission (“SEC”). For these reasons, among others, investors are cautioned not to place undue reliance upon any forward-looking statements in this press release. Additional factors are discussed in the Company’s filings with the SEC, including under the section entitled “Risk Factors” in its annual report on Form 20-F, as filed with the SEC on April 14, 2023, as amended and most recently filed on August 29, 2023, as well as its current reports on Form 6-K and other filings, all of which are available for review at www.sec.gov. The Company undertakes no obligation to publicly revise these forward-looking statements to reflect events or circumstances that arise after the date hereof.
For more information, please contact:
Janice Wang
Wealth Financial Services LLC
Phone:
+86 13811768599
+1 (628) 283 9214
Email: services@wealthfsllc.com
MEIHUA INTERNATIONAL MEDICAL TECHNOLOGIES CO., LTD.
UNAUDITED CONDENSED CONSOLIDATED BALANCE SHEETS
As of June 30, 2023 and December 31, 2022
(US$, except share data or otherwise noted)
|
June 30, 2023 |
December 31, 2022 |
|||||||
| Assets | ||||||||
| Current Assets | ||||||||
| Cash | $ | 17,861,214 | $ | 26,736,700 | ||||
| Bank acceptance receivables | 18,374,380 | 22,085,846 | ||||||
| Accounts receivable | 79,052,428 | 68,945,792 | ||||||
| Inventories | 1,647,146 | 1,122,038 | ||||||
| Prepayment and other current assets | 15,329,511 | 16,428,779 | ||||||
| Total current assets | 132,264,679 | 135,319,155 | ||||||
| Property, plant and equipment | 8,617,192 | 8,758,047 | ||||||
| Intangible assets | 3,876,027 | 497,600 | ||||||
| Investment | 5,997,634 | 6,669,655 | ||||||
| Other noncurrent assets | 11,856,920 | 12,333,122 | ||||||
| Total assets | $ | 162,612,452 | $ | 163,577,579 | ||||
| Liabilities and shareholders’ equity | ||||||||
| Liabilities | ||||||||
| Current liabilities | ||||||||
| Short-term bank borrowings | $ | 7,171,128 | $ | 6,089,428 | ||||
| Accounts payable | 13,820,348 | 16,096,165 | ||||||
| Taxes payable | 1,451,855 | 1,131,276 | ||||||
| Accrued expenses and other current liabilities | 778,369 | 856,698 | ||||||
| Total current liabilities | 23,221,700 | 24,173,567 | ||||||
| Long term loan | - | 724,932 | ||||||
| Total liabilities | 23,221,700 | 24,898,499 | ||||||
| Commitments and contingencies | ||||||||
| Shareholders’ equity | ||||||||
| Ordinary share, $0.0005 par value, 80,000,000 shares authorized, 23,940,000 and 23,940,000 shares issued and outstanding as of June 30, 2023 and December 31, 2022, respectively | 11,970 | 11,970 | ||||||
| Preferred share, $0.0005 par value, 20,000,000 shares authorized, no shares issued and outstanding as of as of June 30, 2023 and December 31, 2022 | - | - | ||||||
| Additional paid-in capital | 42,967,006 | 42,967,006 | ||||||
| Statutory surplus reserves | 15,665,860 | 15,665,860 | ||||||
| Retained earnings | 90,392,246 | 83,330,239 | ||||||
| Accumulated other comprehensive income (loss) | (10,146,195 | ) | (3,852,138 | ) | ||||
| Total shareholders’ equity | 138,890,887 | 138,122,937 | ||||||
| Non-controlling interest | 499,865 | 556,143 | ||||||
| TOTAL EQUITY | 139,390,752 | 138,679,080 | ||||||
| Total liabilities and shareholders’ equity | $ | 162,612,452 | $ | 163,577,579 | ||||
MEIHUA INTERNATIONAL MEDICAL TECHNOLOGIES CO., LTD.
UNAUDITED CONDENSED CONSOLIDATED STATEMENTS OF INCOME AND COMPREHENSIVE INCOME
For the six months ended June 30, 2023 and 2022
(US$, except share data or otherwise noted)
| For the Six months Ended June 30, |
||||||||
| 2023 | 2022 | |||||||
| Revenues | ||||||||
| Third party sales | $ | 48,178,325 | $ | 54,803,181 | ||||
| Related party sales | 11,751 | 29,666 | ||||||
| Total revenues | 48,190,076 | 54,832,847 | ||||||
| Cost of revenues | 31,019,347 | 33,941,115 | ||||||
| Gross profit | 17,170,729 | 20,891,732 | ||||||
| Operating expenses | ||||||||
| Selling | 3,161,070 | 3,311,649 | ||||||
| General and administrative | 3,452,610 | 4,799,711 | ||||||
| Research and development | 1,460,376 | 1,642,204 | ||||||
| Written-off Tai He deposit | - | 2,469,466 | ||||||
| Total operating expenses | 8,074,056 | 12,223,030 | ||||||
| Income from operations | 9,096,673 | 8,668,702 | ||||||
| Other (income) expense: | ||||||||
| Interest expense | 128,973 | 98,805 | ||||||
| Interest income | (361,532 | ) | (19,725 | ) | ||||
| Currency exchange gain | 119,193 | (449,217 | ) | |||||
| Other expense, net | 114,298 | 50,180 | ||||||
| Total other (income) expenses | 932 | (319,957 | ) | |||||
| Income before income tax provision | 9,095,741 | 8,988,659 | ||||||
| Income taxes expense | 2,064,212 | 2,433,772 | ||||||
| Net income | 7,031,529 | $ | 6,554,887 | |||||
| Net loss attributable to non-controlling interests | (30,478 | ) | - | |||||
| Net income attributable to shareholders | 7,062,007 | 6,554,887 | ||||||
| Foreign currency translation adjustment – gain / (loss) | (6,319,857 | ) | (6,133,093 | ) | ||||
| Comprehensive (loss) income | $ | 711,672 | $ | 421,794 | ||||
| Comprehensive loss attributable to non-controlling interests | (56,278 | ) | - | |||||
| Comprehensive (loss) income attributable to shareholders | 767,950 | 421,794 | ||||||
| Weighted average number of ordinary shares - basic and diluted | 23,940,000 | 22,873,370 | ||||||
| Basic & diluted net income per ordinary share | $ | 0.29 | $ | 0.29 | ||||
6