Document
FOR IMMEDIATE RELEASE
INNOVATE Corp. Announces Second Quarter 2026 Results
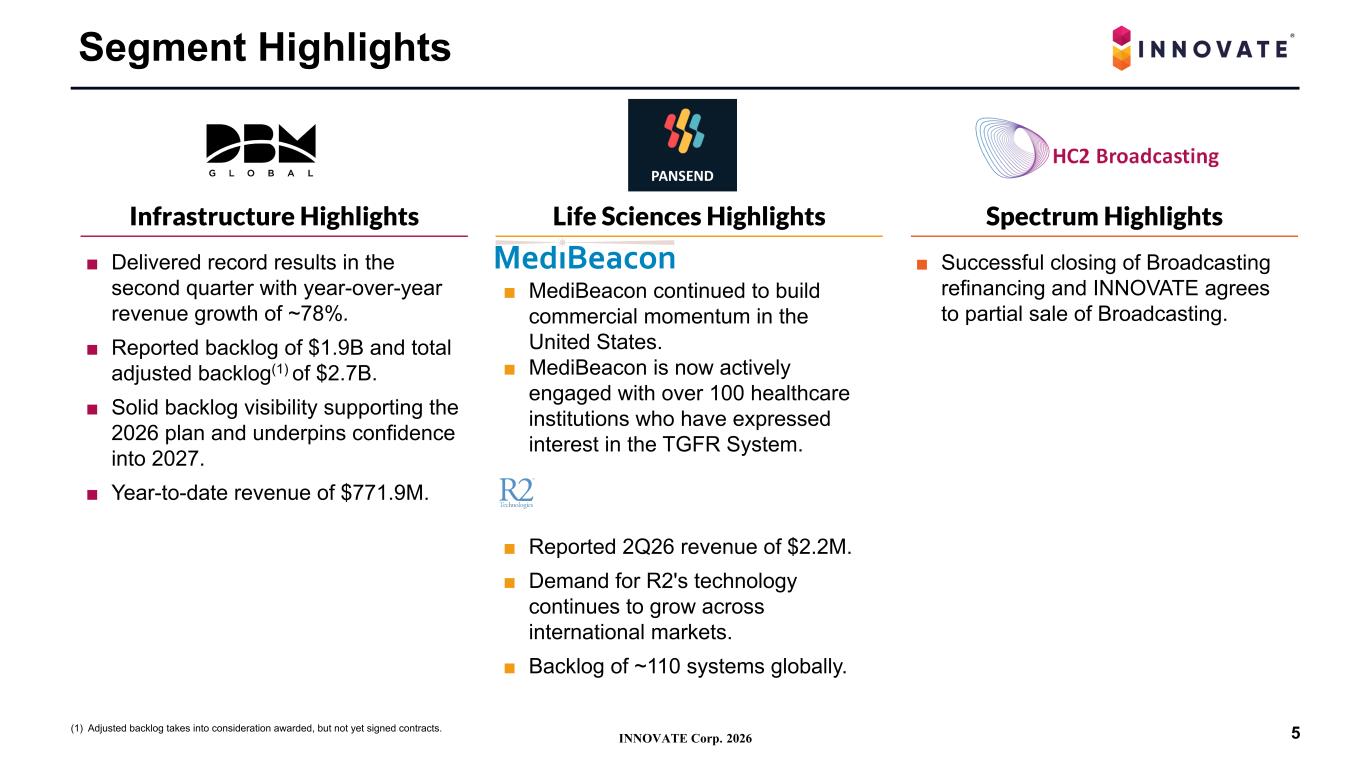
- Infrastructure: DBM Global delivered record results in the second quarter with year-over-year revenue growth of ~78%
- Life Sciences: MediBeacon continued targeted introduction of TGFR system at centers of excellence in the U.S. and China
- Spectrum: Successful closing of Broadcasting refinancing and INNOVATE agreed to partial sale of Broadcasting
NEW YORK, NY, August 6, 2026 - INNOVATE CORP.® (“INNOVATE” or the “Company”) (NYSE: VATE) announced today its consolidated results for the second quarter.
Financial Summary
|
|
|
|
|
|
|
|
|
|
|
|
|
|
|
|
|
|
|
|
|
|
|
|
|
|
|
|
|
|
|
|
|
|
|
|
| (in millions, except per share amounts) |
Three Months Ended June 30, |
|
Six Months Ended June 30, |
|
2026 |
|
2025 |
|
Increase / (Decrease) |
|
2026 |
|
2025 |
|
Increase / (Decrease) |
| Revenue |
$ |
421.6 |
|
|
$ |
242.0 |
|
|
74.2 |
% |
|
$ |
786.4 |
|
|
$ |
516.2 |
|
|
52.3 |
% |
| Net income (loss) attributable to common stockholders and participating preferred stockholders |
$ |
10.4 |
|
|
$ |
(22.0) |
|
|
147.3 |
% |
|
$ |
(6.8) |
|
|
$ |
(46.8) |
|
|
85.5 |
% |
| Basic earnings (loss) per share attributable to common stockholders |
$ |
0.74 |
|
|
$ |
(1.67) |
|
|
144.3 |
% |
|
$ |
(0.51) |
|
|
$ |
(3.56) |
|
|
85.7 |
% |
| Diluted earnings (loss) per share attributable to common stockholders |
$ |
0.71 |
|
|
$ |
(1.67) |
|
|
142.5 |
% |
|
$ |
(0.51) |
|
|
$ |
(3.56) |
|
|
85.7 |
% |
Total Adjusted EBITDA(1)
|
$ |
46.3 |
|
|
$ |
15.7 |
|
|
194.9 |
% |
|
$ |
66.0 |
|
|
$ |
22.9 |
|
|
188.2 |
% |
(1) Reconciliation of GAAP to Non-GAAP measures follows.
Commentary
"INNOVATE delivered a strong second quarter and continued to execute on several important strategic priorities across the portfolio," said Avie Glazer, Chairman of INNOVATE. “At Infrastructure, DBM Global delivered a record-breaking quarter, reflecting continued strong financial performance with margin expansion and backlog growth. During the quarter, Broadcasting strengthened its financial position through a refinancing transaction, and our Life Sciences businesses continued to advance key commercialization and regulatory initiatives."
"We continue to make progress across our key strategic priorities and believe the momentum we saw during the second quarter reinforces the value and potential of our portfolio," said Paul Voigt, Interim CEO of INNOVATE. “DBM Global delivered exceptional results, supported by strong execution, robust backlog growth, and favorable end-market demand. At MediBeacon, we continue to focus on commercialization efforts, reimbursement initiatives, and global regulatory activities, while R2 exited the quarter with strong demand and an expanding international presence. We remain focused on strengthening our balance sheet, advancing growth initiatives and creating long-term value for our shareholders."
Second Quarter 2026 and Recent Highlights
•As previously announced, HC2 Broadcasting Holdings Inc. (“Broadcasting”) closed on a refinancing transaction and Broadcasting and HC2 Broadcasting Holdco, LLC (“HC2 Holdco”), subsidiaries of INNOVATE, have entered into a definitive agreement pursuant to which INNOVATE will sell a controlling interest in Broadcasting to CONX CORP. (“CONX”), subject to the satisfaction of customary closing conditions, including the receipt of required regulatory approvals. After the closing of the transaction, it is expected that CONX will own approximately 75% of Broadcasting and INNOVATE will own approximately 25% of Broadcasting through HC2 Holdco. See INNOVATE's Form 8-K filed on June 1, 2026 for additional information.
•INNOVATE continues to pursue highly substantial asset dispositions, including a sales process for all or substantially all of DBMG's assets or equity interests, and the disposition of a majority interest in Broadcasting (as described above). INNOVATE has also made substantial changes to its debt arrangements and other liabilities, including following June 30, 2026, and expects to make further changes.
Infrastructure
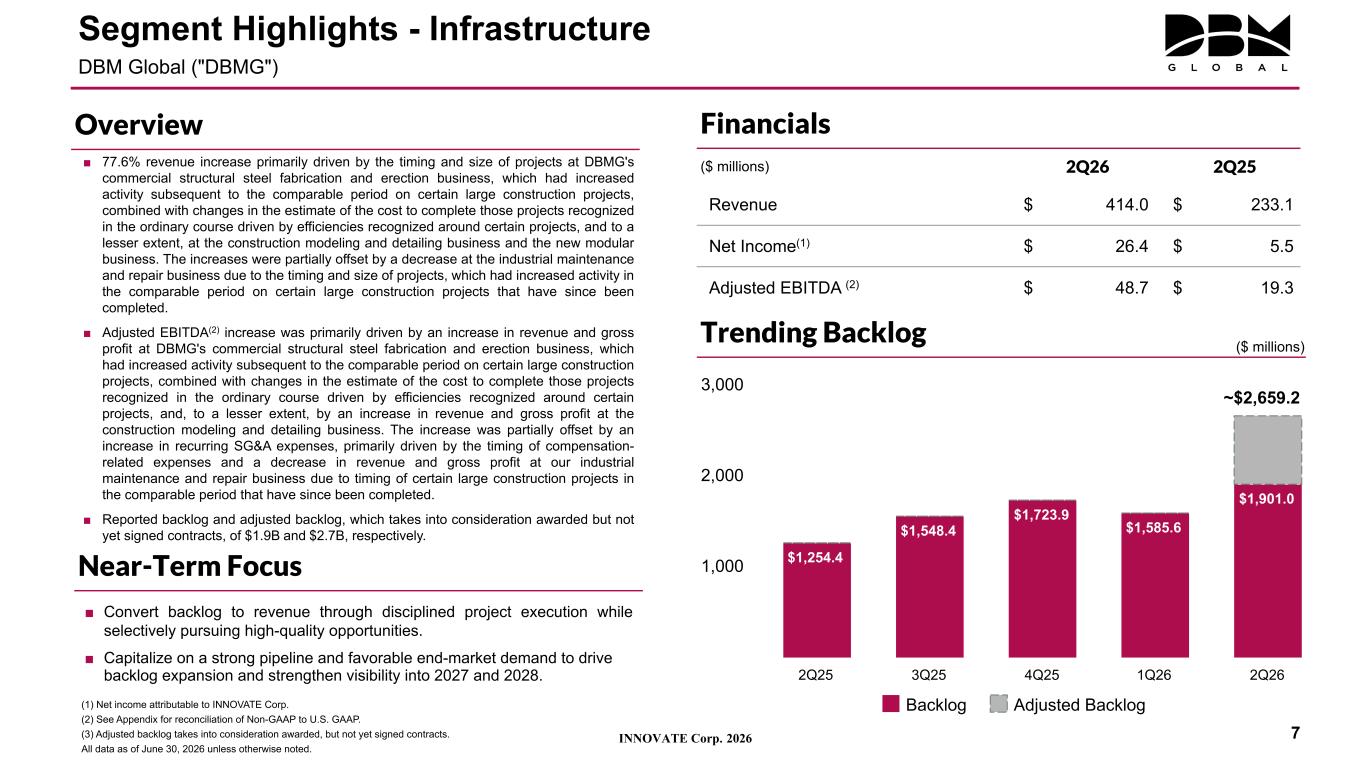
•DBMG reported second quarter 2026 revenue of $414.0 million, an increase of 77.6%, compared to $233.1 million in the prior year quarter. Net income attributable to INNOVATE was $26.4 million, compared to $5.5 million for the prior year quarter. Adjusted EBITDA increased to $48.7 million from $19.3 million in the prior year quarter.
•DBMG reported gross margin of 18.5% in the second quarter, an increase of approximately 60 basis points year-over-year and Adjusted EBITDA margin of 11.8% in the second quarter, an increase of approximately 350 basis points year-over-year.
•DBMG’s reported backlog and adjusted backlog, which takes into consideration awarded but not yet signed contracts, was $1.9 billion and $2.7 billion respectively, as of June 30, 2026, compared to reported and adjusted backlog of $1.7 billion and $1.8 billion, respectively, as of December 31, 2025.
•DBMG delivered a record second quarter, highlighted by strong margin expansion, exceptional execution, and adjusted backlog growth to a record $2.7 billion. Healthy sales activity and strong conversion rates continue to drive backlog growth and visibility into 2027 and 2028, while sustained demand across technology, healthcare, AI infrastructure, and advanced manufacturing markets supports confidence in the business's long-term growth outlook.
Life Sciences
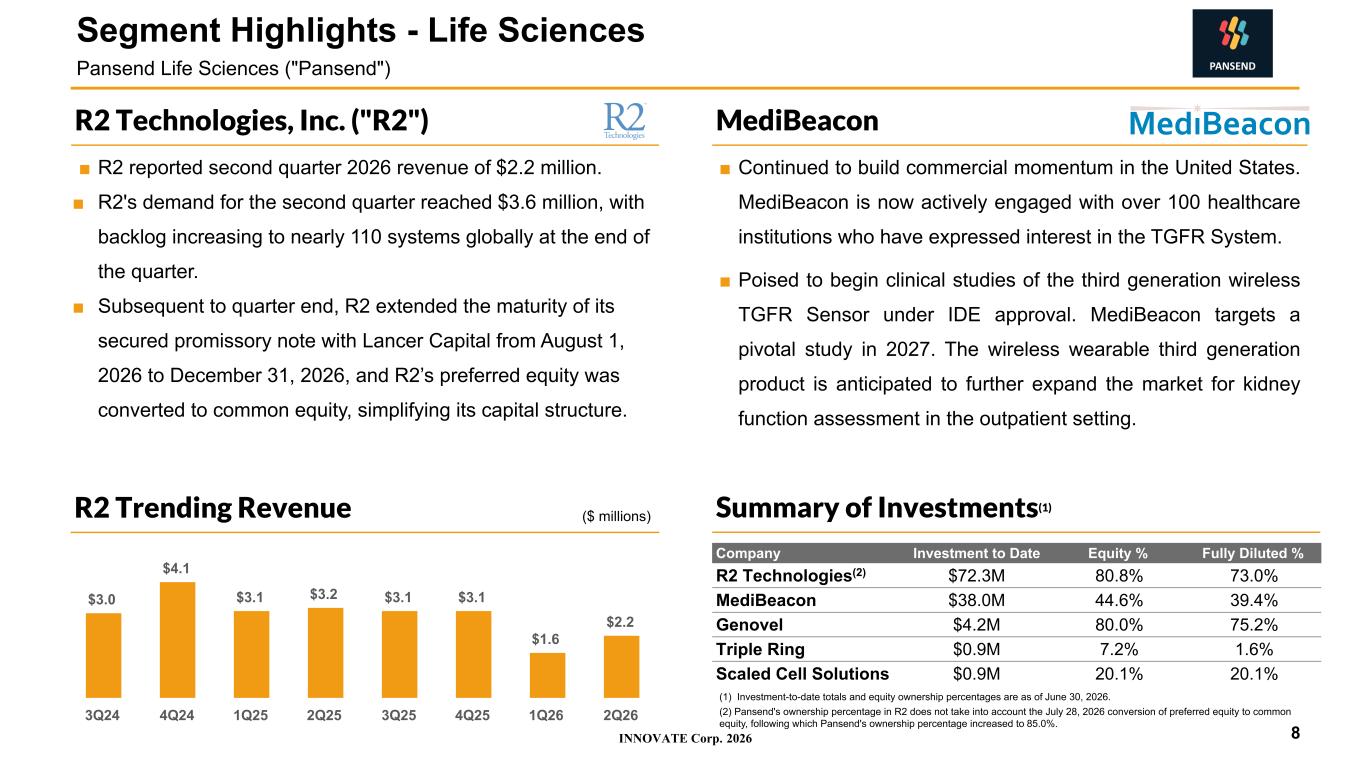
•MediBeacon continued to build commercial momentum in the United States, putting the technology in the hands of the clinicians who need it most and building the evidence base that will drive long-term adoption. MediBeacon is now actively engaged with over 100 healthcare institutions who have expressed interest in the TGFR System.
•MediBeacon is poised to begin clinical studies of the third generation wireless TGFR Sensor under IDE approval. MediBeacon targets a pivotal study in 2027. The wireless wearable third generation product is anticipated to further expand the market for kidney function assessment in the outpatient setting.
•R2 Technologies, Inc. ("R2") reported second quarter 2026 revenue of $2.2 million.
•R2's demand for the second quarter reached $3.6 million, with backlog at approximately 110 systems globally at the end of the quarter.
•R2 reduced its operating expenditure by approximately 50% over the same period in 2025.
•Subsequent to quarter end, R2 extended the maturity of its secured promissory note with Lancer Capital from August 1, 2026 to December 31, 2026, and R2’s preferred equity was converted to common equity, simplifying its capital structure.
Spectrum
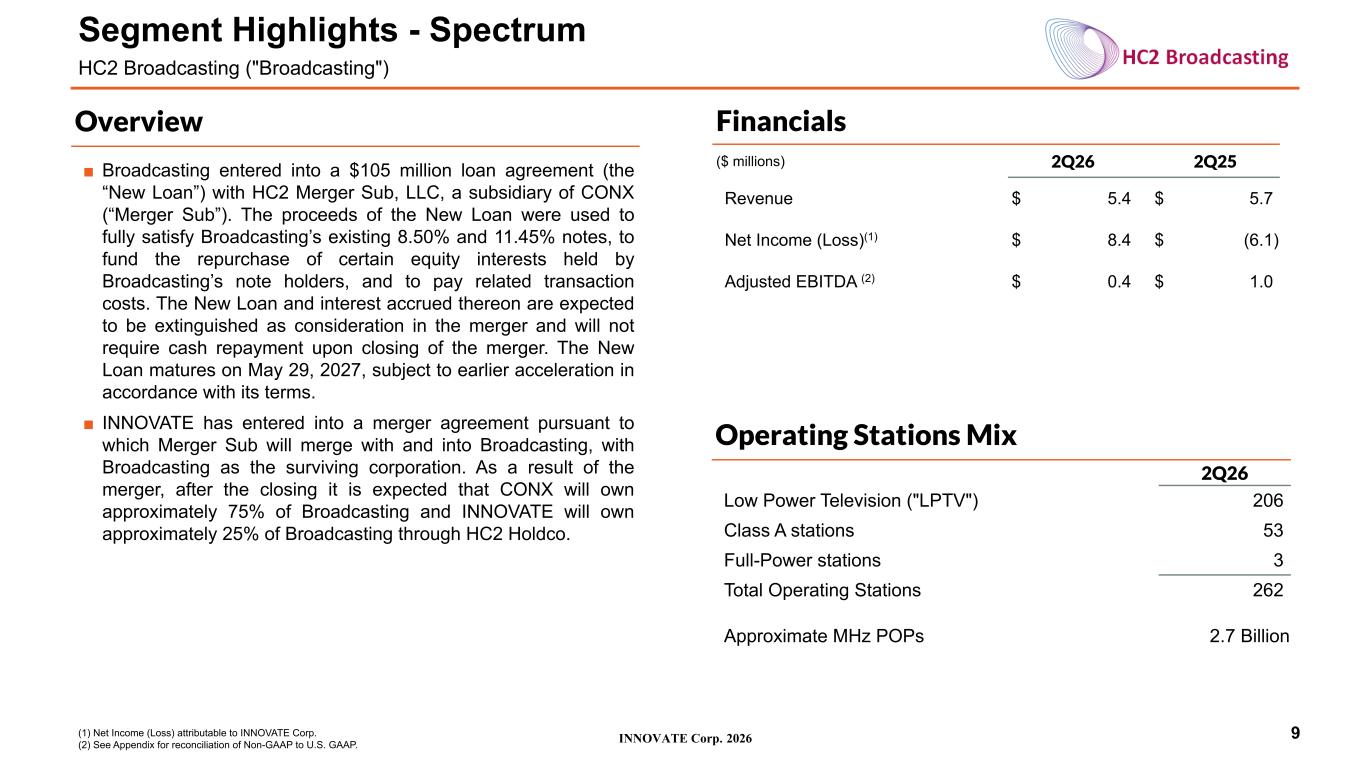
•Broadcasting reported second quarter 2026 revenue of $5.4 million, compared to $5.7 million in the prior year quarter. Net income attributable to INNOVATE was $8.4 million compared to Net loss of $6.1 million in the prior year quarter. Adjusted EBITDA was $0.4 million, compared to $1.0 million in the prior year quarter.
•Broadcasting entered into a $105 million loan agreement (the “New Loan”) with HC2 Merger Sub, LLC, a subsidiary of CONX (“Merger Sub”). The proceeds of the New Loan were used to fully satisfy Broadcasting’s existing 8.50% and 11.45% notes, to fund the repurchase of certain equity interests held by Broadcasting’s note holders, and to pay related transaction costs. The New Loan and interest accrued thereon are expected to be extinguished as consideration in the merger and will not require cash repayment upon closing of the merger. The New Loan matures on May 29, 2027, subject to earlier acceleration in accordance with its terms.
•INNOVATE has entered into a merger agreement pursuant to which Merger Sub will merge with and into Broadcasting, with Broadcasting as the surviving corporation. As a result of the merger, after the closing it is expected that CONX will own approximately 75% of Broadcasting and INNOVATE will own approximately 25% of Broadcasting through HC2 Holdco.
Second Quarter 2026 Financial Highlights
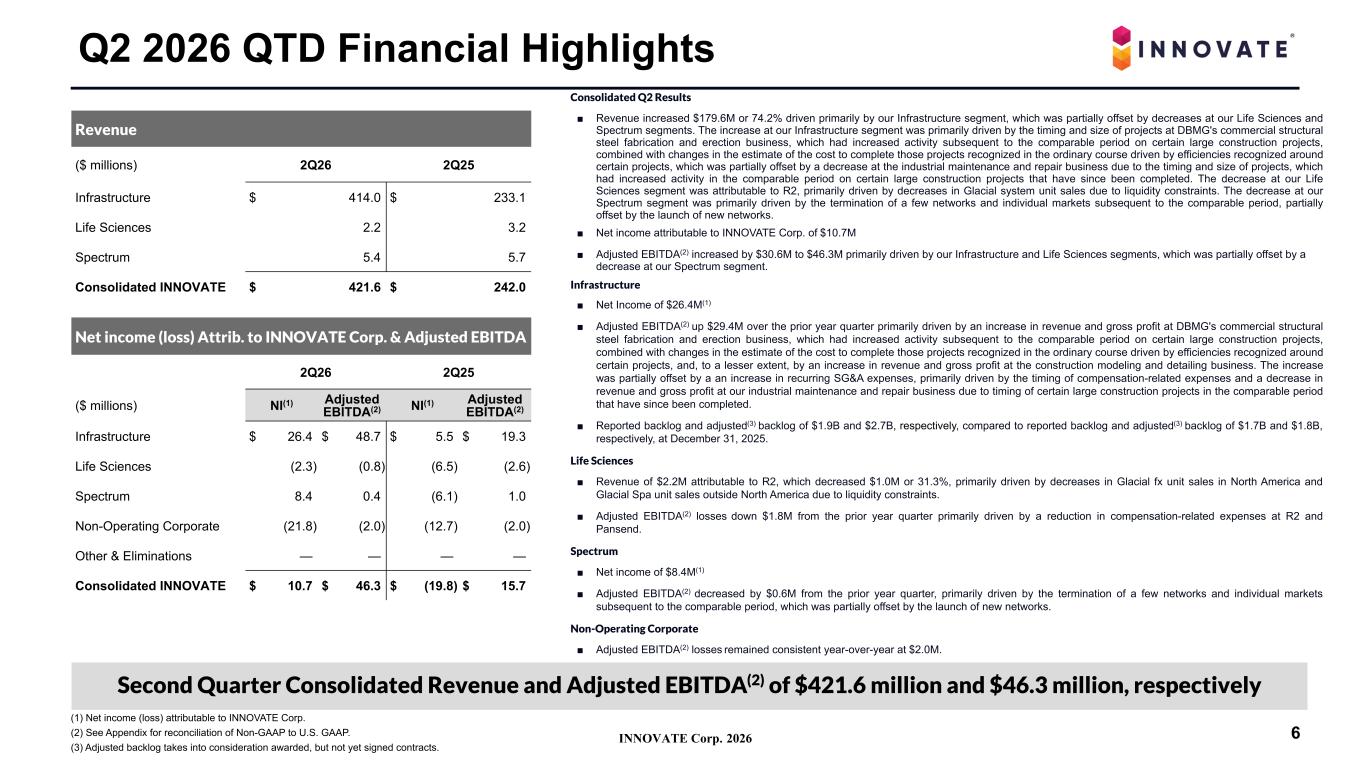
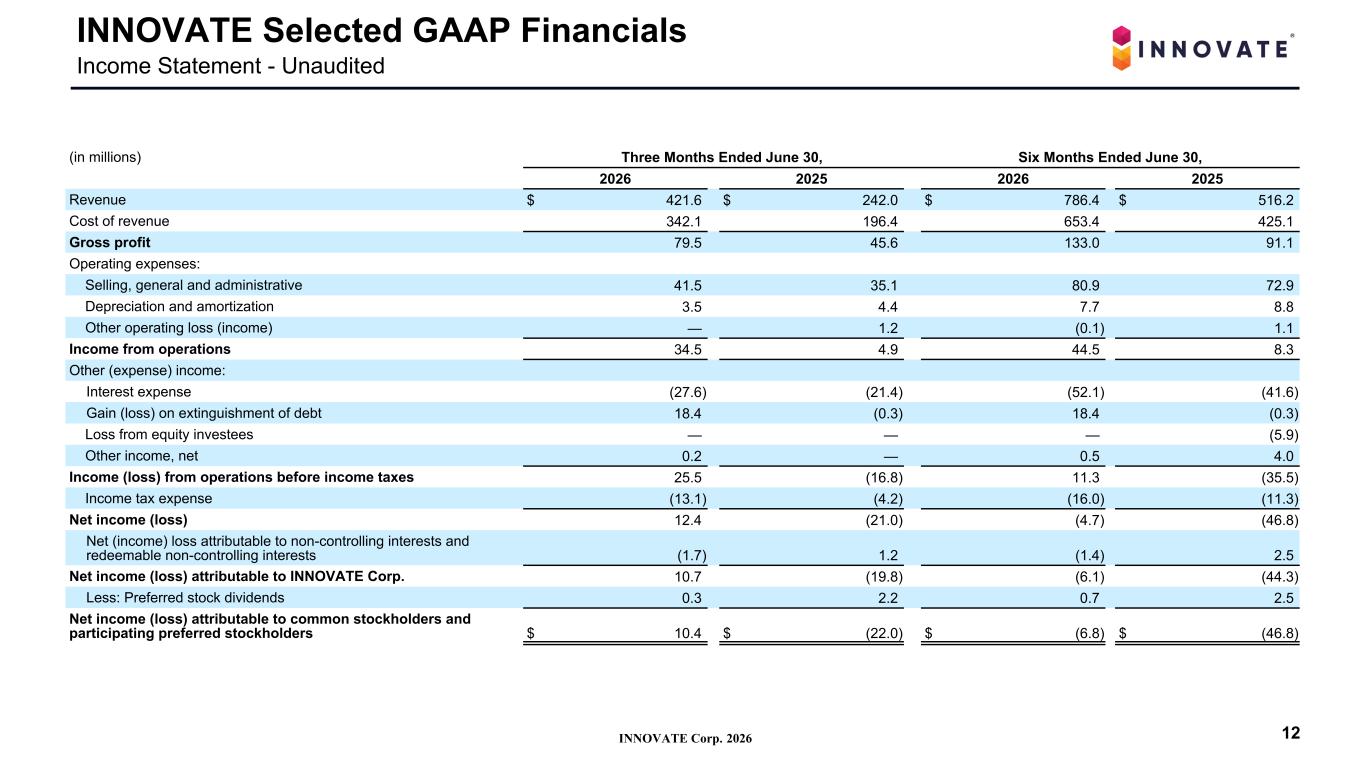
•Revenue: For the second quarter of 2026, INNOVATE's consolidated revenue was $421.6 million, an increase of 74.2%, compared to $242.0 million for the prior year quarter. The increase was driven primarily by our Infrastructure segment, which was partially offset by a decrease at our Life Sciences and Spectrum segments. The increase at our Infrastructure segment was primarily driven by the timing and size of projects at DBMG's commercial structural steel fabrication and erection business, which had increased activity subsequent to the comparable period on certain large construction projects, combined with changes in the estimate of the cost to complete those projects recognized in the ordinary course driven by efficiencies recognized around certain projects. This increase was partially offset by a decrease at the industrial maintenance and repair business due to the timing and size of projects, which had increased activity in the comparable period on certain large construction projects that have since been completed. The decrease at our Life Sciences segment was attributable to R2, primarily driven by decreases in Glacial fx unit sales in North America and Glacial Spa unit sales outside North America due to liquidity constraints. The decrease at our Spectrum segment was primarily driven by the termination of a few networks and individual markets subsequent to the comparable period, partially offset by the launch of new networks.
|
|
|
|
|
|
|
|
|
|
|
|
|
|
|
|
|
|
|
|
|
|
|
|
|
|
|
|
|
|
|
|
|
|
|
|
REVENUE by OPERATING SEGMENT |
|
|
|
|
|
|
|
|
|
|
|
|
|
|
|
|
|
|
|
| (in millions) |
Three Months Ended June 30, |
|
Six Months Ended June 30, |
|
2026 |
|
2025 |
|
Increase / (Decrease) |
|
2026 |
|
2025 |
|
Increase/(Decrease) |
| Infrastructure |
$ |
414.0 |
|
|
$ |
233.1 |
|
|
$ |
180.9 |
|
|
$ |
771.9 |
|
|
$ |
498.0 |
|
|
$ |
273.9 |
|
| Life Sciences |
2.2 |
|
|
3.2 |
|
|
(1.0) |
|
|
3.8 |
|
|
6.3 |
|
|
(2.5) |
|
| Spectrum |
5.4 |
|
|
5.7 |
|
|
(0.3) |
|
|
10.7 |
|
|
11.9 |
|
|
(1.2) |
|
Consolidated INNOVATE |
$ |
421.6 |
|
|
$ |
242.0 |
|
|
$ |
179.6 |
|
|
$ |
786.4 |
|
|
$ |
516.2 |
|
|
$ |
270.2 |
|
•Net Income (Loss): For the second quarter of 2026, INNOVATE reported Net income attributable to common stockholders and participating preferred stockholders of $10.4 million, or $0.71 per fully diluted share, compared to a Net loss of $22.0 million, or $1.67 per fully diluted share, for the prior year quarter. The increase in Net income was primarily driven by a net increase in gross profit of $33.9 million, and an $18.7 million increase in gain on extinguishment of debt, which was partially offset by an $8.9 million increase in tax expense, a net increase in selling, general and administrative (“SG&A”)
expenses of $6.4 million and a $6.2 million increase in interest expense. The net increase in gross profit was primarily driven by our Infrastructure segment due to timing and size of projects in the current period, which had increased activity subsequent to the comparable period, combined with changes in the estimate of the cost to complete those projects recognized in the ordinary course driven by efficiencies recognized around certain projects. The increase in gain on extinguishment of debt was primarily driven by Spectrum's refinancing transaction during the current period. The increase in tax expense was primarily driven by higher pre-tax income combined with an increase in the annual effective tax rate, including as a result of limitations on the utilization of net operating losses (“NOL”) by INNOVATE's U.S. consolidated group under Internal Revenue Code Section 382 and the Tax Cuts and Jobs Act's 80 percent limitation on NOLs incurred after 2017. The net increase in SG&A was driven by our Infrastructure segment, primarily due to timing of compensation-related expenses, and an increase at our Spectrum segment primarily driven by transaction-related expenses in the current period. These increases in SG&A were partially offset by a decrease in SG&A at our Life Sciences segment due to a reduction in compensation-related expenses at R2 and Pansend. The net increase in interest expense was primarily driven by our Non-Operating Corporate segment, reflecting refinancing transactions that closed subsequent to the comparable period, and by our Spectrum segment, reflecting the accretion of the New Loan entered into in the current period, under which the effective interest rate includes the stated interest rate and accretion of a contractually specified minimum return on the New Loan through its stated maturity, which was partially offset by our Life Sciences segment, reflecting refinancing transactions that closed subsequent to the comparable period, and further offset by our Infrastructure segment due to a net decrease in principal balance.
|
|
|
|
|
|
|
|
|
|
|
|
|
|
|
|
|
|
|
|
|
|
|
|
|
|
|
|
|
|
|
|
|
|
|
|
| NET INCOME (LOSS) by OPERATING SEGMENT |
|
|
|
|
|
|
|
|
|
|
|
|
| (in millions) |
Three Months Ended June 30, |
|
Six Months Ended June 30, |
|
2026 |
|
2025 |
|
Increase / (Decrease) |
|
2026 |
|
2025 |
|
Increase / (Decrease) |
| Infrastructure |
$ |
26.4 |
|
|
$ |
5.5 |
|
|
$ |
20.9 |
|
|
$ |
35.7 |
|
|
$ |
10.1 |
|
|
$ |
25.6 |
|
| Life Sciences |
(2.3) |
|
|
(6.5) |
|
|
4.2 |
|
|
(5.6) |
|
|
(14.1) |
|
|
8.5 |
|
| Spectrum |
8.4 |
|
|
(6.1) |
|
|
14.5 |
|
|
1.9 |
|
|
(11.5) |
|
|
13.4 |
|
Non-Operating Corporate |
(21.8) |
|
|
(12.7) |
|
|
(9.1) |
|
|
(38.1) |
|
|
(28.8) |
|
|
(9.3) |
|
| Other and eliminations |
— |
|
|
— |
|
|
— |
|
|
— |
|
|
— |
|
|
— |
|
|
|
|
|
|
|
|
|
|
|
|
|
|
|
|
|
|
|
|
|
|
|
|
|
| Net income (loss) attributable to INNOVATE Corp. |
$ |
10.7 |
|
|
$ |
(19.8) |
|
|
30.5 |
|
|
$ |
(6.1) |
|
|
$ |
(44.3) |
|
|
$ |
38.2 |
|
| Less: Preferred stock dividends |
0.3 |
|
|
2.2 |
|
|
(1.9) |
|
|
0.7 |
|
|
2.5 |
|
|
(1.8) |
|
| Net income (loss) attributable to common stockholders and participating preferred stockholders |
$ |
10.4 |
|
|
$ |
(22.0) |
|
|
$ |
32.4 |
|
|
$ |
(6.8) |
|
|
$ |
(46.8) |
|
|
$ |
40.0 |
|
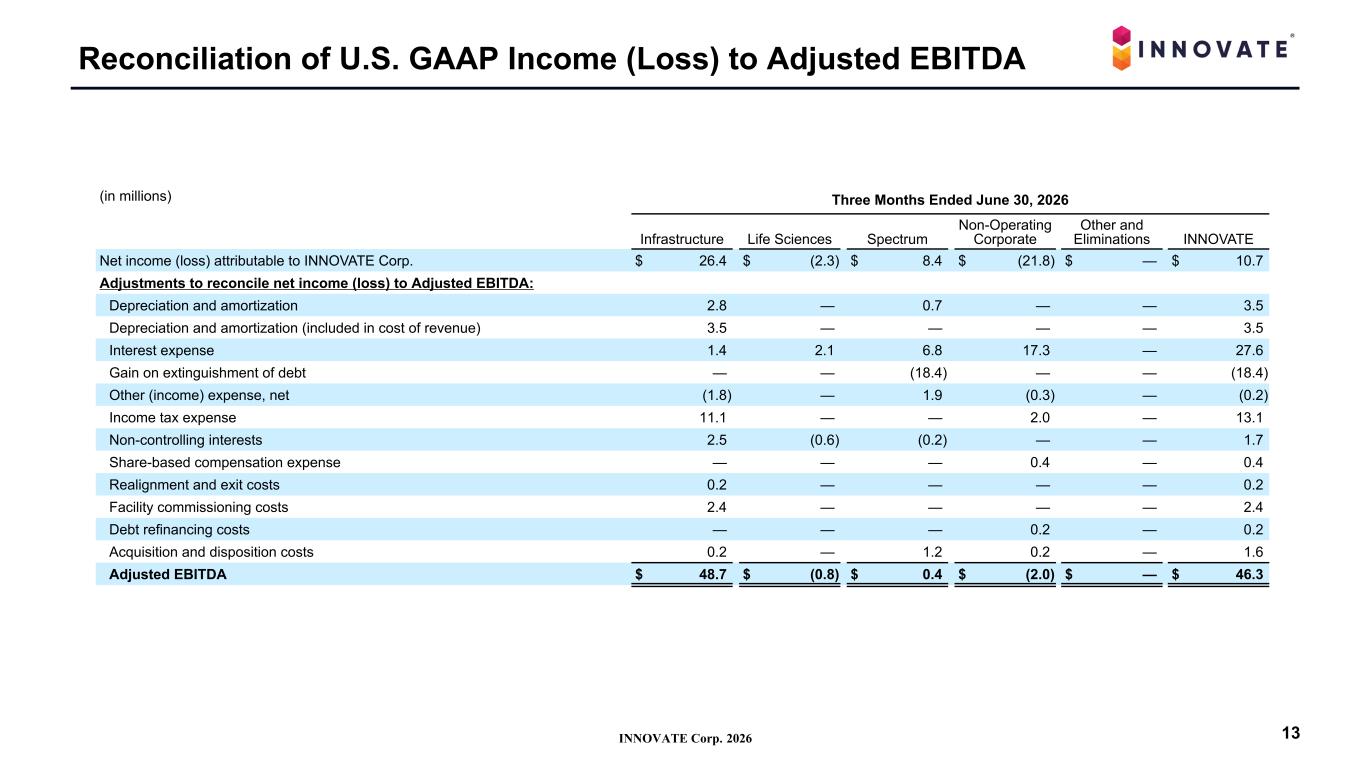
•Adjusted EBITDA: For the second quarter of 2026, Total Adjusted EBITDA was $46.3 million compared to Total Adjusted EBITDA of $15.7 million for the prior year quarter. The increase in Adjusted EBITDA was primarily driven by our Infrastructure and Life Sciences segments, which was partially offset by a decrease at our Spectrum segment. The increase in Adjusted EBITDA was primarily driven by an increase in revenue and gross profit at DBMG's commercial structural steel fabrication and erection business, which had increased activity subsequent to the comparable period on certain large construction projects, combined with changes in the estimate of the cost to complete those projects recognized in the ordinary course driven by efficiencies recognized around certain projects, and, to a lesser extent, by an increase in revenue and gross profit at the construction modeling and detailing business. The increase was partially offset by an increase in recurring SG&A expenses, primarily driven by the timing of compensation-related expenses and a decrease in revenue and gross profit at our industrial maintenance and repair business due to timing of certain large construction projects in the comparable period that have since been completed. The increase at our Life Sciences segment was primarily driven by a decrease in recurring SG&A due to a reduction in compensation-related expenses at R2 and Pansend. The decrease in Adjusted EBITDA at our Spectrum segment was primarily driven by the decrease in revenue.
|
|
|
|
|
|
|
|
|
|
|
|
|
|
|
|
|
|
|
|
|
|
|
|
|
|
|
|
|
|
|
|
|
|
|
|
| ADJUSTED EBITDA by OPERATING SEGMENT |
|
|
|
|
|
|
|
|
|
|
|
|
|
|
|
|
|
|
|
| (in millions) |
Three Months Ended June 30, |
|
Six Months Ended June 30, |
|
2026 |
|
2025 |
|
Increase / (Decrease) |
|
2026 |
|
2025 |
|
Increase/(Decrease) |
| Infrastructure |
$ |
48.7 |
|
|
$ |
19.3 |
|
|
$ |
29.4 |
|
|
$ |
71.7 |
|
|
$ |
36.0 |
|
|
$ |
35.7 |
|
| Life Sciences |
(0.8) |
|
|
(2.6) |
|
|
1.8 |
|
|
(2.8) |
|
|
(11.3) |
|
|
8.5 |
|
| Spectrum |
0.4 |
|
|
1.0 |
|
|
(0.6) |
|
|
1.1 |
|
|
2.4 |
|
|
(1.3) |
|
Non-Operating Corporate |
(2.0) |
|
|
(2.0) |
|
|
— |
|
|
(4.0) |
|
|
(4.2) |
|
|
0.2 |
|
| Other and eliminations |
— |
|
|
— |
|
|
— |
|
|
— |
|
|
— |
|
|
— |
|
Total Adjusted EBITDA(1)
|
$ |
46.3 |
|
|
$ |
15.7 |
|
|
$ |
30.6 |
|
|
$ |
66.0 |
|
|
$ |
22.9 |
|
|
$ |
43.1 |
|
(1) Reconciliation of GAAP to Non-GAAP measures follows.
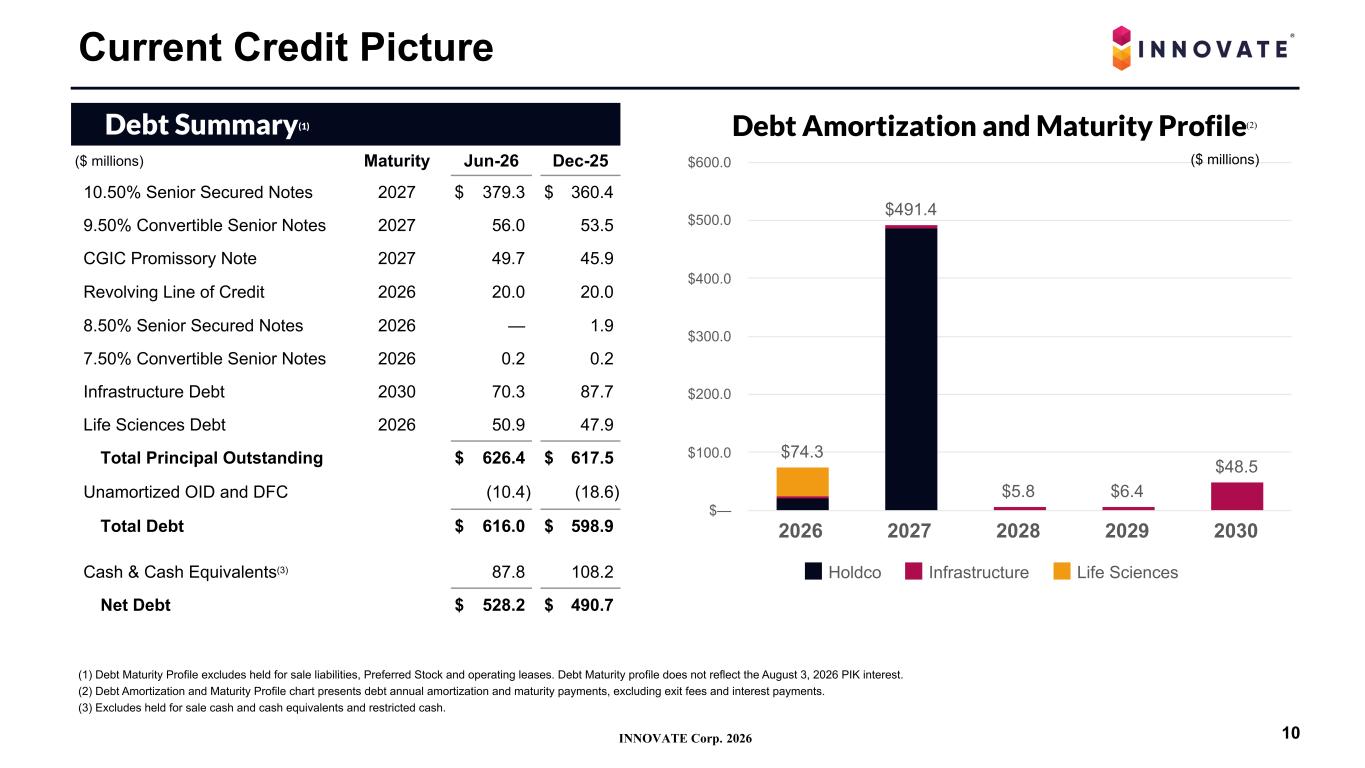
•Balance Sheet: As of June 30, 2026, INNOVATE had cash and cash equivalents, excluding restricted cash and cash and cash equivalents held for sale, of $87.8 million compared to $108.2 million as of December 31, 2025. On a stand-alone basis, as of June 30, 2026, our Non-Operating Corporate segment had cash and cash equivalents of $1.5 million compared to $4.2 million as of December 31, 2025.
Conference Call
INNOVATE will host a live conference call to discuss its second quarter 2026 financial results and operations today at 4:30 p.m. ET. The Company will post an earnings supplemental presentation in the Investor Relations section of the INNOVATE website at innovate-ir.com to accompany the conference call. Dial-in instructions for the conference call and the replay follows.
•Live Webcast and Call. A live webcast of the conference call can be accessed by interested parties through the Investor Relations section of the INNOVATE website at innovate-ir.com.
–Dial-in: 1-877-704-4453 (Domestic Toll Free) / 1-201-389-0920 (Toll/International)
•Conference Replay*
–Dial-in: 1-844-512-2921 (Domestic Toll Free) / 1-412-317-6671 (Toll/International)
–Conference Number: 13761666
*Available approximately three hours after the end of the conference call through August 20, 2026.
About INNOVATE
INNOVATE is a portfolio of best-in-class assets in three key areas of the new economy – Infrastructure, Life Sciences and Spectrum. Dedicated to stakeholder capitalism, INNOVATE employs approximately 3,700 people across its subsidiaries. For more information, please visit: www.INNOVATECorp.com.
Contacts
Investor Contact:
Anthony Rozmus
ir@innovatecorp.com
(212) 235-2691
Non-GAAP Financial Measures
In this press release, INNOVATE refers to certain financial measures that are not presented in accordance with U.S. generally accepted accounting principles (“U.S. GAAP”), including Total Adjusted EBITDA (excluding discontinued operations, if applicable) and Adjusted EBITDA for its operating segments. In addition, other companies may define Adjusted EBITDA differently than we do, which could limit its usefulness.
Adjusted EBITDA
Management believes that Adjusted EBITDA provides investors with meaningful information for gaining an understanding of our results as it is frequently used by the financial community to provide insight into an organization’s operating trends and facilitates comparisons between peer companies, since interest, taxes, depreciation, amortization and the other items listed in the definition of Adjusted EBITDA below can differ greatly between organizations as a result of differing capital structures and tax strategies. Adjusted EBITDA can also be a useful measure of a company’s ability to service debt. While management believes that non-U.S. GAAP measurements are useful supplemental information, such adjusted results are not intended to replace our U.S. GAAP financial results. Using Adjusted EBITDA as a performance measure has inherent limitations as an analytical tool as compared to net income (loss) or other U.S. GAAP financial measures, as this non-U.S. GAAP measure excludes certain items, including items
that are recurring in nature, which may be meaningful to investors. As a result of the exclusions, Adjusted EBITDA should not be considered in isolation and does not purport to be an alternative to net income (loss) or other U.S. GAAP financial measures as a measure of our operating performance.
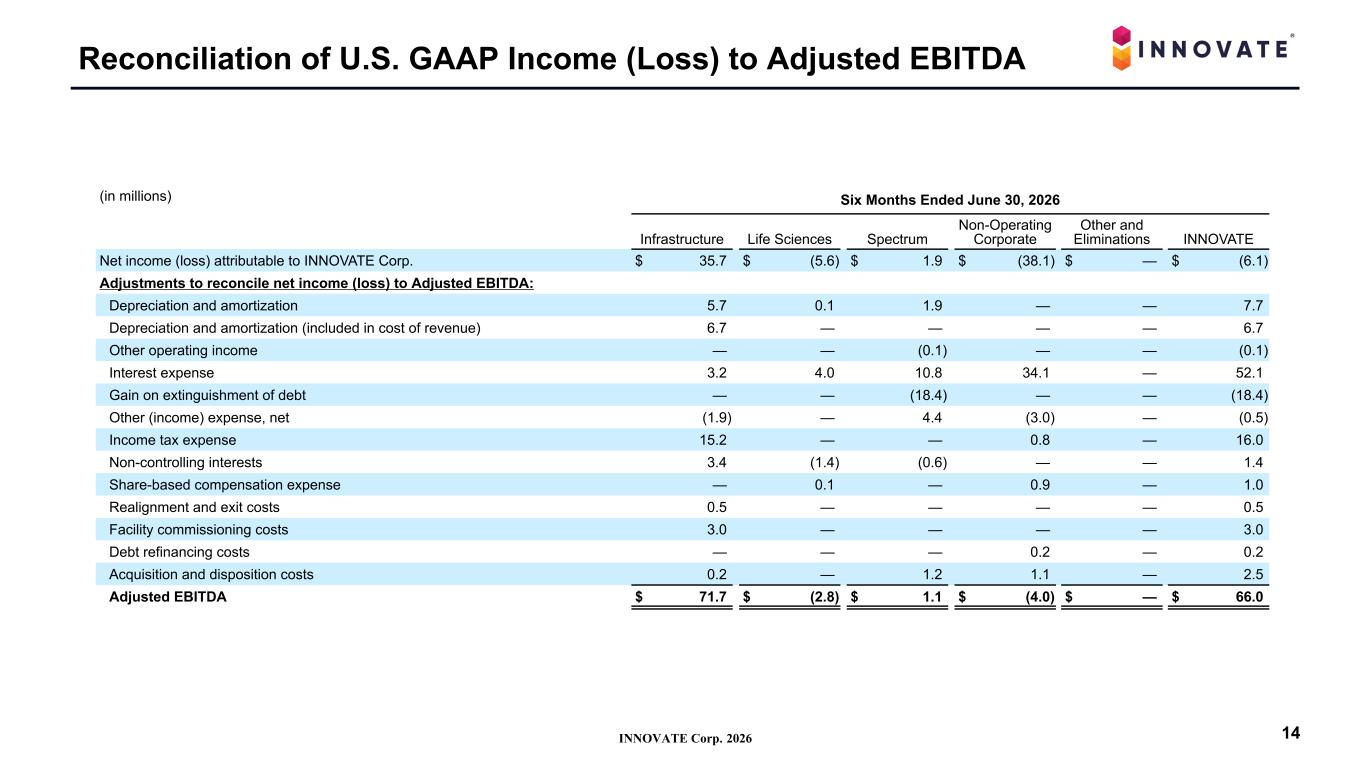
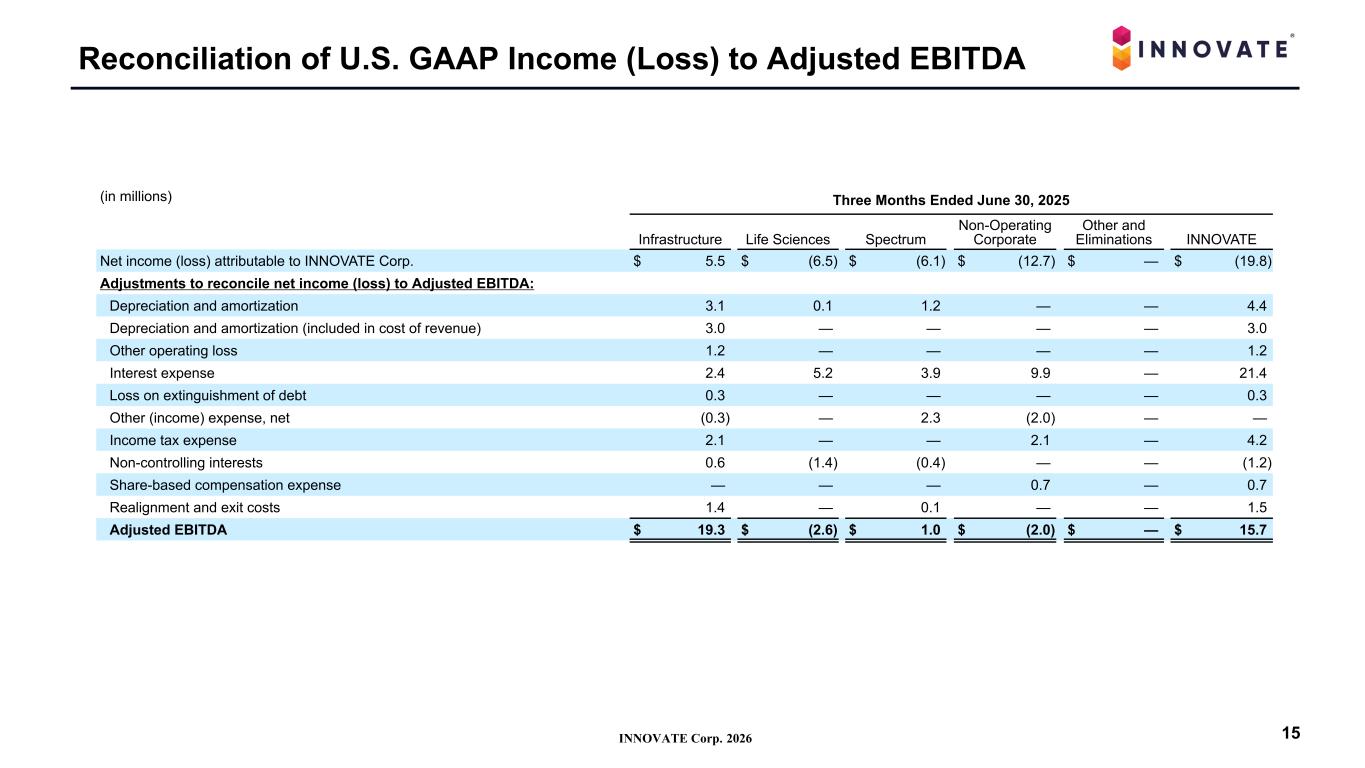
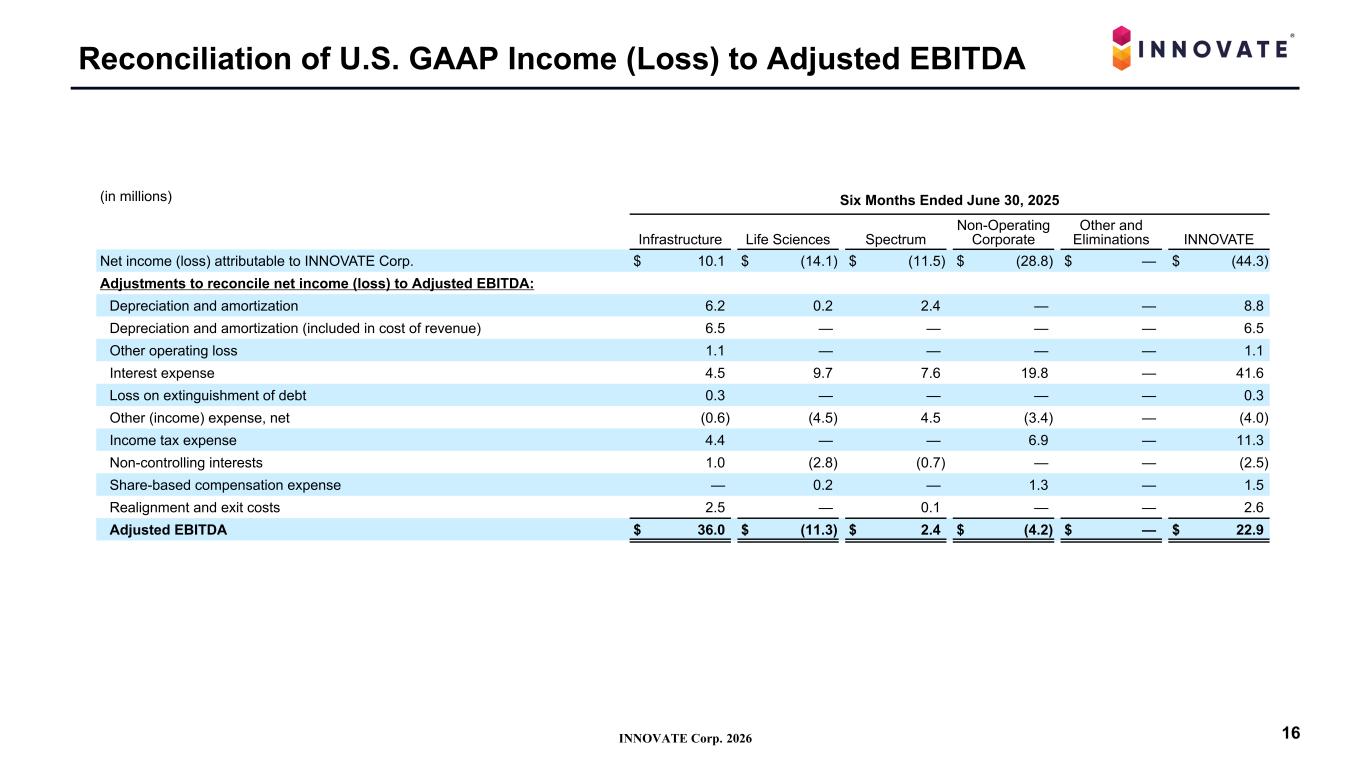
The calculation of Adjusted EBITDA, as defined by us, consists of Net income (loss) attributable to INNOVATE Corp., excluding: discontinued operations, if applicable; depreciation and amortization; other operating (income) loss (which is inclusive of (gain) loss on sale or disposal of assets, lease termination costs, (gains) losses on lease modifications, and asset impairment expense); interest expense; (gain) loss on extinguishment of debt; other (income) expense, net; income tax expense (benefit); non-controlling interests; share-based compensation expense; realignment and exit costs; facility commissioning costs; debt refinancing costs and acquisition and disposition costs.
Cautionary Statement Regarding Forward-Looking Statements
Safe Harbor Statement under the Private Securities Litigation Reform Act of 1995: This press release contains, and certain oral statements made by our representatives from time to time may contain, “forward-looking statements.” Generally, forward-looking statements include information describing actions, events, results, strategies and expectations and are generally identifiable by use of the words “believes,” “expects,” “intends,” “anticipates,” “plans,” “seeks,” “estimates,” “projects,” “may,” “will,” “could,” “might,” or “continues” or similar expressions. Such forward-looking statements are based on current expectations and inherently involve certain risks, assumptions and uncertainties. The forward-looking statements in this press release include, without limitation, any statements regarding INNOVATE’s plans and expectations for future growth and ability to capitalize on potential opportunities, the achievement of INNOVATE’s strategic objectives, expectations for performance of new projects and realization of revenue from the backlog at DBMG and the Infrastructure segment, anticipated success from the continued sale of new products in the Life Sciences segment, expectations for advertising revenue growth, new technologies, networks and stations, and potential commercial opportunities in datacasting in the Spectrum segment. Such statements are based on the beliefs and assumptions of INNOVATE’s management and the management of INNOVATE’s subsidiaries and portfolio companies.
The Company believes these judgments are reasonable, but these statements are not guarantees of performance, results or the creation of stockholder value and the Company’s actual results could differ materially from those expressed or implied in the forward-looking statements due to a variety of important factors, both positive and negative, including those that may be identified in subsequent statements and reports filed with the Securities and Exchange Commission (“SEC”), including in our reports on Forms 10-K, 10-Q, and 8-K. Such important factors include, without limitation: our dependence on distributions from our subsidiaries to fund our operations and payments on our obligations; substantial doubt about our ability to continue operating as a going concern; our expectations and timing with respect to any strategic dispositions and sales of our operating subsidiaries, or businesses, including, without limitation, the sales of DBMG and Broadcasting; obtaining FCC regulatory approval for the Broadcasting merger; the possibility of indemnification claims arising out of divestitures of businesses; the impact on our business and financial condition of our substantial indebtedness and any significant additional indebtedness and other financing obligations we may incur; our possible inability to raise additional capital when needed or refinance our existing debt, on attractive terms, or at all; our anticipated business profile following the highly substantial asset dispositions we are pursuing, including the potential absence of material operating revenue and uncertainty regarding the nature of any future operations; our dependence on the retaining and recruitment of key personnel; volatility in the trading price of our common stock; the impact of potential supply chain disruptions, labor shortages and increases in overall price levels, including in steel and transportation costs; interest rate
environment; developments relating to the hostilities in Ukraine, the Middle East and Venezuela; increased competition in the markets in which our operating segments conduct their businesses; our ability to successfully identify any strategic acquisitions or business opportunities; uncertain global economic conditions in the markets in which our operating segments conduct their businesses; changes in regulations and tax laws; covenant noncompliance risk; tax consequences associated with our acquisitions, holding and disposition of target companies and assets; the ability of our operating segments to attract and retain customers; and our expectations regarding the timing, extent and effectiveness of any cost reduction initiatives and management’s ability to moderate or control discretionary spending.
Although INNOVATE believes its expectations and assumptions regarding its future operating performance are reasonable, there can be no assurance that the expectations reflected herein will be achieved. These risks and other important factors discussed under the caption “Risk Factors” in our most recent Annual Report on Form 10-K filed with the SEC, and our other reports filed with the SEC could cause actual results to differ materially from those indicated by the forward-looking statements made in this press release.
You should not place undue reliance on forward-looking statements. All forward-looking statements attributable to INNOVATE or persons acting on its behalf are expressly qualified in their entirety by the foregoing cautionary statements. All such statements speak only as of the date made, and unless legally required, INNOVATE undertakes no obligation to update or revise publicly any forward-looking statements, whether as a result of new information, future events or otherwise.
INNOVATE CORP.
CONDENSED CONSOLIDATED STATEMENTS OF OPERATIONS
(Unaudited, in millions, except shares and per share amounts)
|
|
|
|
|
|
|
|
|
|
|
|
|
|
|
|
|
|
|
|
|
|
|
|
|
|
|
|
|
|
|
|
|
|
|
|
Three Months Ended June 30, |
|
Six Months Ended June 30, |
|
|
2026 |
|
2025 |
|
2026 |
|
2025 |
| Revenue |
|
$ |
421.6 |
|
|
$ |
242.0 |
|
|
$ |
786.4 |
|
|
$ |
516.2 |
|
| Cost of revenue |
|
342.1 |
|
|
196.4 |
|
|
653.4 |
|
|
425.1 |
|
| Gross profit |
|
79.5 |
|
|
45.6 |
|
|
133.0 |
|
|
91.1 |
|
| Operating expenses: |
|
|
|
|
|
|
|
|
| Selling, general and administrative |
|
41.5 |
|
|
35.1 |
|
|
80.9 |
|
|
72.9 |
|
| Depreciation and amortization |
|
3.5 |
|
|
4.4 |
|
|
7.7 |
|
|
8.8 |
|
|
|
|
|
|
|
|
|
|
| Other operating loss (income) |
|
— |
|
|
1.2 |
|
|
(0.1) |
|
|
1.1 |
|
| Income from operations |
|
34.5 |
|
|
4.9 |
|
|
44.5 |
|
|
8.3 |
|
| Other (expense) income: |
|
|
|
|
|
|
|
|
| Interest expense |
|
(27.6) |
|
|
(21.4) |
|
|
(52.1) |
|
|
(41.6) |
|
|
|
|
|
|
|
|
|
|
| Gain (loss) on extinguishment of debt |
|
18.4 |
|
|
(0.3) |
|
|
18.4 |
|
|
(0.3) |
|
|
|
|
|
|
|
|
|
|
| Loss from equity investees |
|
— |
|
|
— |
|
|
— |
|
|
(5.9) |
|
|
|
|
|
|
|
|
|
|
| Other income, net |
|
0.2 |
|
|
— |
|
|
0.5 |
|
|
4.0 |
|
| Income (loss) from operations before income taxes |
|
25.5 |
|
|
(16.8) |
|
|
11.3 |
|
|
(35.5) |
|
Income tax expense |
|
(13.1) |
|
|
(4.2) |
|
|
(16.0) |
|
|
(11.3) |
|
|
|
|
|
|
|
|
|
|
|
|
|
|
|
|
|
|
|
| Net income (loss) |
|
12.4 |
|
|
(21.0) |
|
|
(4.7) |
|
|
(46.8) |
|
| Net (income) loss attributable to non-controlling interests and redeemable non-controlling interests |
|
(1.7) |
|
|
1.2 |
|
|
(1.4) |
|
|
2.5 |
|
| Net income (loss) attributable to INNOVATE Corp. |
|
10.7 |
|
|
(19.8) |
|
|
(6.1) |
|
|
(44.3) |
|
| Less: Preferred stock dividends |
|
0.3 |
|
|
2.2 |
|
|
0.7 |
|
|
2.5 |
|
| Net income (loss) attributable to common stockholders and participating preferred stockholders |
|
$ |
10.4 |
|
|
$ |
(22.0) |
|
|
$ |
(6.8) |
|
|
$ |
(46.8) |
|
|
|
|
|
|
|
|
|
|
| Earnings (loss) per common share |
|
|
|
|
|
|
|
|
| Basic |
|
$ |
0.74 |
|
|
$ |
(1.67) |
|
|
$ |
(0.51) |
|
|
$ |
(3.56) |
|
| Diluted |
|
$ |
0.71 |
|
|
$ |
(1.67) |
|
|
$ |
(0.51) |
|
|
$ |
(3.56) |
|
|
|
|
|
|
|
|
|
|
|
|
|
|
|
|
|
|
|
|
|
|
|
|
|
|
|
|
|
|
|
|
|
|
|
|
|
|
|
|
|
|
|
|
|
|
|
|
|
|
|
|
|
|
|
|
|
|
|
|
|
|
|
|
|
|
|
|
|
|
|
|
|
|
|
|
|
|
|
|
|
|
| Weighted-average common shares outstanding |
|
|
|
|
|
|
|
|
| Basic |
|
13,374,803 |
|
|
13,146,750 |
|
|
13,360,333 |
|
|
13,130,930 |
|
|
|
|
|
|
|
|
|
|
| Diluted |
|
13,968,004 |
|
|
13,146,750 |
|
|
13,360,333 |
|
|
13,130,930 |
|
INNOVATE CORP.
CONDENSED CONSOLIDATED BALANCE SHEETS
(Unaudited, in millions, except share amounts)
|
|
|
|
|
|
|
|
|
|
|
|
|
|
|
|
|
|
|
|
|
|
June 30,
2026 |
|
December 31,
2025 |
|
|
|
| Assets |
|
|
|
|
| Current assets |
|
|
|
|
| Cash and cash equivalents |
|
$ |
87.8 |
|
|
$ |
108.2 |
|
| Accounts receivable, net |
|
284.4 |
|
|
239.4 |
|
| Contract assets |
|
52.6 |
|
|
64.1 |
|
| Inventory |
|
14.8 |
|
|
16.0 |
|
|
|
|
|
|
| Current assets held for sale |
|
5.5 |
|
|
6.8 |
|
| Other current assets |
|
34.2 |
|
|
16.9 |
|
| Total current assets |
|
479.3 |
|
|
451.4 |
|
| Investments |
|
2.2 |
|
|
1.8 |
|
|
|
|
|
|
|
|
|
|
|
|
|
|
|
|
|
|
|
|
|
|
|
|
|
|
|
|
|
|
|
| Deferred tax asset |
|
2.0 |
|
|
2.0 |
|
| Property, plant and equipment, net |
|
136.3 |
|
|
131.6 |
|
| Goodwill |
|
105.7 |
|
|
105.6 |
|
| Intangibles, net |
|
44.0 |
|
|
47.3 |
|
Assets held for sale |
|
169.5 |
|
|
167.7 |
|
| Other assets |
|
67.7 |
|
|
42.7 |
|
| Total assets |
|
$ |
1,006.7 |
|
|
$ |
950.1 |
|
|
|
|
|
|
| Liabilities, temporary equity and stockholders’ deficit |
|
|
|
|
| Current liabilities |
|
|
|
|
| Accounts payable |
|
$ |
137.2 |
|
|
$ |
140.5 |
|
| Accrued liabilities |
|
77.9 |
|
|
64.8 |
|
| Current portion of debt obligations |
|
553.9 |
|
|
518.6 |
|
| Contract liabilities |
|
182.7 |
|
|
171.9 |
|
| Current liabilities held for sale |
|
118.7 |
|
|
126.5 |
|
|
|
|
|
|
| Other current liabilities |
|
13.0 |
|
|
11.8 |
|
| Total current liabilities |
|
1,083.4 |
|
|
1,034.1 |
|
|
|
|
|
|
|
|
|
|
|
|
|
|
|
|
| Deferred tax liability |
|
1.9 |
|
|
2.1 |
|
| Debt obligations |
|
62.1 |
|
|
80.3 |
|
| Liabilities held for sale |
|
22.1 |
|
|
19.4 |
|
| Other liabilities |
|
57.2 |
|
|
29.5 |
|
| Total liabilities |
|
1,226.7 |
|
|
1,165.4 |
|
| Commitments and contingencies |
|
|
|
|
| Temporary equity |
|
|
|
|
| Preferred Stock Series A-3 and Preferred Stock Series A-4, $0.001 par value |
|
9.7 |
|
|
9.3 |
|
| Shares authorized: 20,000,000; Shares issued and outstanding: 6,125 of Series A-3; 1,937 of Series A-4 |
|
|
|
|
|
|
|
|
|
| Redeemable non-controlling interests |
|
(1.1) |
|
|
1.6 |
|
| Total temporary equity |
|
8.6 |
|
|
10.9 |
|
| Stockholders’ deficit |
|
|
|
|
| Common stock, $0.001 par value |
|
— |
|
|
— |
|
Shares authorized: 250,000,000; Shares issued: 13,818,904; Shares outstanding: 13,641,866 and 13,655,062, respectively |
|
|
|
|
|
|
|
|
|
|
|
|
|
|
| Additional paid-in capital |
|
352.9 |
|
|
350.1 |
|
| Treasury stock, at cost: 177,038 and 163,842 shares, respectively |
|
(5.6) |
|
|
(5.6) |
|
| Accumulated deficit |
|
(588.6) |
|
|
(582.5) |
|
| Accumulated other comprehensive loss |
|
(1.9) |
|
|
(2.1) |
|
| Total INNOVATE Corp. stockholders’ deficit |
|
(243.2) |
|
|
(240.1) |
|
| Non-controlling interests |
|
14.6 |
|
|
13.9 |
|
| Total stockholders’ deficit |
|
(228.6) |
|
|
(226.2) |
|
| Total liabilities, temporary equity and stockholders’ deficit |
|
$ |
1,006.7 |
|
|
$ |
950.1 |
|
INNOVATE CORP.
RECONCILIATION OF NET INCOME (LOSS) TO ADJUSTED EBITDA
(Unaudited, in millions)
|
|
|
|
|
|
|
|
|
|
|
|
|
|
|
|
|
|
|
|
|
|
|
|
|
|
|
|
|
|
|
|
|
|
|
|
|
|
|
|
|
Three Months Ended June 30, 2026 |
|
|
Infrastructure |
|
Life Sciences |
|
Spectrum |
|
Non-Operating Corporate |
|
Other and Eliminations |
|
INNOVATE |
|
|
|
|
|
|
|
|
|
|
|
|
|
|
|
|
|
|
|
|
|
|
|
|
|
|
| Net income (loss) attributable to INNOVATE Corp. |
|
$ |
26.4 |
|
|
$ |
(2.3) |
|
|
$ |
8.4 |
|
|
$ |
(21.8) |
|
|
$ |
— |
|
|
$ |
10.7 |
|
| Adjustments to reconcile net income (loss) to Adjusted EBITDA: |
|
|
|
|
|
|
|
|
|
|
|
|
| Depreciation and amortization |
|
2.8 |
|
|
— |
|
|
0.7 |
|
|
— |
|
|
— |
|
|
3.5 |
|
| Depreciation and amortization (included in cost of revenue) |
|
3.5 |
|
|
— |
|
|
— |
|
|
— |
|
|
— |
|
|
3.5 |
|
|
|
|
|
|
|
|
|
|
|
|
|
|
|
|
|
|
|
|
|
|
|
|
|
|
|
|
|
|
|
|
|
|
|
|
|
|
|
|
|
|
|
|
|
|
|
|
|
|
|
|
|
|
|
|
|
|
|
|
|
|
|
|
|
|
|
|
|
|
|
|
|
|
|
|
|
|
|
|
|
|
|
|
|
|
|
|
|
|
|
|
| Interest expense |
|
1.4 |
|
|
2.1 |
|
|
6.8 |
|
|
17.3 |
|
|
— |
|
|
27.6 |
|
| Gain on extinguishment of debt |
|
— |
|
|
— |
|
|
(18.4) |
|
|
— |
|
|
— |
|
|
(18.4) |
|
|
|
|
|
|
|
|
|
|
|
|
|
|
| Other (income) expense, net |
|
(1.8) |
|
|
— |
|
|
1.9 |
|
|
(0.3) |
|
|
— |
|
|
(0.2) |
|
|
|
|
|
|
|
|
|
|
|
|
|
|
|
|
|
|
|
|
|
|
|
|
|
|
|
| Income tax expense |
|
11.1 |
|
|
— |
|
|
— |
|
|
2.0 |
|
|
— |
|
|
13.1 |
|
| Non-controlling interests |
|
2.5 |
|
|
(0.6) |
|
|
(0.2) |
|
|
— |
|
|
— |
|
|
1.7 |
|
|
|
|
|
|
|
|
|
|
|
|
|
|
| Share-based compensation expense |
|
— |
|
|
— |
|
|
— |
|
|
0.4 |
|
|
— |
|
|
0.4 |
|
| Realignment and exit costs |
|
0.2 |
|
|
— |
|
|
— |
|
|
— |
|
|
— |
|
|
0.2 |
|
Facility commissioning costs |
|
2.4 |
|
|
— |
|
|
— |
|
|
— |
|
|
— |
|
|
2.4 |
|
| Debt refinancing costs |
|
— |
|
|
— |
|
|
— |
|
|
0.2 |
|
|
— |
|
|
0.2 |
|
| Acquisition and disposition costs |
|
0.2 |
|
|
— |
|
|
1.2 |
|
|
0.2 |
|
|
— |
|
|
1.6 |
|
| Adjusted EBITDA |
|
$ |
48.7 |
|
|
$ |
(0.8) |
|
|
$ |
0.4 |
|
|
$ |
(2.0) |
|
|
$ |
— |
|
|
$ |
46.3 |
|
|
|
|
|
|
|
|
|
|
|
|
|
|
|
|
|
|
|
|
|
|
|
|
|
|
|
|
|
|
|
|
|
|
|
|
|
|
|
|
|
|
|
|
|
|
|
|
|
|
|
|
|
|
|
|
|
|
|
|
|
|
|
|
|
|
|
|
Three Months Ended June 30, 2025 |
|
|
Infrastructure |
|
Life Sciences |
|
Spectrum |
|
Non-Operating Corporate |
|
Other and Eliminations |
|
INNOVATE |
|
|
|
|
|
|
|
|
|
|
|
|
|
|
|
|
|
|
|
|
|
|
|
|
|
|
| Net income (loss) attributable to INNOVATE Corp. |
|
$ |
5.5 |
|
|
$ |
(6.5) |
|
|
$ |
(6.1) |
|
|
$ |
(12.7) |
|
|
$ |
— |
|
|
$ |
(19.8) |
|
| Adjustments to reconcile net income (loss) to Adjusted EBITDA: |
|
|
|
|
|
|
|
|
|
|
|
|
| Depreciation and amortization |
|
3.1 |
|
|
0.1 |
|
|
1.2 |
|
|
— |
|
|
— |
|
|
4.4 |
|
| Depreciation and amortization (included in cost of revenue) |
|
3.0 |
|
|
— |
|
|
— |
|
|
— |
|
|
— |
|
|
3.0 |
|
|
|
|
|
|
|
|
|
|
|
|
|
|
|
|
|
|
|
|
|
|
|
|
|
|
|
|
|
|
|
|
|
|
|
|
|
|
|
|
|
|
|
|
|
|
|
|
|
|
|
|
|
|
|
|
|
|
|
|
|
|
|
|
|
|
|
|
|
|
|
|
|
|
|
|
|
|
|
| Other operating loss |
|
1.2 |
|
|
— |
|
|
— |
|
|
— |
|
|
— |
|
|
1.2 |
|
| Interest expense |
|
2.4 |
|
|
5.2 |
|
|
3.9 |
|
|
9.9 |
|
|
— |
|
|
21.4 |
|
|
|
|
|
|
|
|
|
|
|
|
|
|
| Loss on extinguishment of debt |
|
0.3 |
|
|
— |
|
|
— |
|
|
— |
|
|
— |
|
|
0.3 |
|
| Other (income) expense, net |
|
(0.3) |
|
|
— |
|
|
2.3 |
|
|
(2.0) |
|
|
— |
|
|
— |
|
|
|
|
|
|
|
|
|
|
|
|
|
|
|
|
|
|
|
|
|
|
|
|
|
|
|
| Income tax expense |
|
2.1 |
|
|
— |
|
|
— |
|
|
2.1 |
|
|
— |
|
|
4.2 |
|
| Non-controlling interests |
|
0.6 |
|
|
(1.4) |
|
|
(0.4) |
|
|
— |
|
|
— |
|
|
(1.2) |
|
|
|
|
|
|
|
|
|
|
|
|
|
|
| Share-based compensation expense |
|
— |
|
|
— |
|
|
— |
|
|
0.7 |
|
|
— |
|
|
0.7 |
|
|
|
|
|
|
|
|
|
|
|
|
|
|
| Realignment and exit costs |
|
1.4 |
|
|
— |
|
|
0.1 |
|
|
— |
|
|
— |
|
|
1.5 |
|
|
|
|
|
|
|
|
|
|
|
|
|
|
|
|
|
|
|
|
|
|
|
|
|
|
|
| Adjusted EBITDA |
|
$ |
19.3 |
|
|
$ |
(2.6) |
|
|
$ |
1.0 |
|
|
$ |
(2.0) |
|
|
$ |
— |
|
|
$ |
15.7 |
|
|
|
|
|
|
|
|
|
|
|
|
|
|
|
|
|
|
|
|
|
|
|
|
|
|
|
INNOVATE CORP.
RECONCILIATION OF NET INCOME (LOSS) TO ADJUSTED EBITDA
(Unaudited, in millions)
|
|
|
|
|
|
|
|
|
|
|
|
|
|
|
|
|
|
|
|
|
|
|
|
|
|
|
|
|
|
|
|
|
|
|
|
|
|
|
|
|
Six Months Ended June 30, 2026 |
|
|
Infrastructure |
|
Life Sciences |
|
Spectrum |
|
Non-Operating Corporate |
|
Other and Eliminations |
|
INNOVATE |
|
|
|
|
|
|
|
|
|
|
|
|
|
|
|
|
|
|
|
|
|
|
|
|
|
|
| Net income (loss) attributable to INNOVATE Corp. |
|
$ |
35.7 |
|
|
$ |
(5.6) |
|
|
$ |
1.9 |
|
|
$ |
(38.1) |
|
|
$ |
— |
|
|
$ |
(6.1) |
|
| Adjustments to reconcile net income (loss) to Adjusted EBITDA: |
|
|
|
|
|
|
|
|
|
|
|
|
| Depreciation and amortization |
|
5.7 |
|
|
0.1 |
|
|
1.9 |
|
|
— |
|
|
— |
|
|
7.7 |
|
| Depreciation and amortization (included in cost of revenue) |
|
6.7 |
|
|
— |
|
|
— |
|
|
— |
|
|
— |
|
|
6.7 |
|
|
|
|
|
|
|
|
|
|
|
|
|
|
|
|
|
|
|
|
|
|
|
|
|
|
|
|
|
|
|
|
|
|
|
|
|
|
|
|
|
|
|
|
|
|
|
|
|
|
|
|
|
|
|
|
|
|
|
|
|
|
|
|
|
|
|
|
|
|
|
|
|
|
|
|
|
|
|
| Other operating income |
|
— |
|
|
— |
|
|
(0.1) |
|
|
— |
|
|
— |
|
|
(0.1) |
|
| Interest expense |
|
3.2 |
|
|
4.0 |
|
|
10.8 |
|
|
34.1 |
|
|
— |
|
|
52.1 |
|
| Gain on extinguishment of debt |
|
— |
|
|
— |
|
|
(18.4) |
|
|
— |
|
|
— |
|
|
(18.4) |
|
|
|
|
|
|
|
|
|
|
|
|
|
|
| Other (income) expense, net |
|
(1.9) |
|
|
— |
|
|
4.4 |
|
|
(3.0) |
|
|
— |
|
|
(0.5) |
|
|
|
|
|
|
|
|
|
|
|
|
|
|
|
|
|
|
|
|
|
|
|
|
|
|
|
| Income tax expense |
|
15.2 |
|
|
— |
|
|
— |
|
|
0.8 |
|
|
— |
|
|
16.0 |
|
Non-controlling interests |
|
3.4 |
|
|
(1.4) |
|
|
(0.6) |
|
|
— |
|
|
— |
|
|
1.4 |
|
|
|
|
|
|
|
|
|
|
|
|
|
|
| Share-based compensation expense |
|
— |
|
|
0.1 |
|
|
— |
|
|
0.9 |
|
|
— |
|
|
1.0 |
|
| Realignment and exit costs |
|
0.5 |
|
|
— |
|
|
— |
|
|
— |
|
|
— |
|
|
0.5 |
|
Facility commissioning costs |
|
3.0 |
|
|
— |
|
|
— |
|
|
— |
|
|
— |
|
|
3.0 |
|
| Debt refinancing costs |
|
— |
|
|
— |
|
|
— |
|
|
0.2 |
|
|
— |
|
|
0.2 |
|
| Acquisition and disposition costs |
|
0.2 |
|
|
— |
|
|
1.2 |
|
|
1.1 |
|
|
— |
|
|
2.5 |
|
| Adjusted EBITDA |
|
$ |
71.7 |
|
|
$ |
(2.8) |
|
|
$ |
1.1 |
|
|
$ |
(4.0) |
|
|
$ |
— |
|
|
$ |
66.0 |
|
|
|
|
|
|
|
|
|
|
|
|
|
|
|
|
|
|
|
|
|
|
|
|
|
|
|
|
|
|
|
|
|
|
|
|
|
|
|
|
|
|
|
|
|
|
|
|
|
|
|
|
|
|
|
|
|
|
|
|
|
|
|
|
|
|
|
|
Six Months Ended June 30, 2025 |
|
|
Infrastructure |
|
Life Sciences |
|
Spectrum |
|
Non-Operating Corporate |
|
Other and Eliminations |
|
INNOVATE |
|
|
|
|
|
|
|
|
|
|
|
|
|
|
|
|
|
|
|
|
|
|
|
|
|
|
| Net income (loss) attributable to INNOVATE Corp. |
|
$ |
10.1 |
|
|
$ |
(14.1) |
|
|
$ |
(11.5) |
|
|
$ |
(28.8) |
|
|
$ |
— |
|
|
$ |
(44.3) |
|
| Adjustments to reconcile net income (loss) to Adjusted EBITDA: |
|
|
|
|
|
|
|
|
|
|
|
|
| Depreciation and amortization |
|
6.2 |
|
|
0.2 |
|
|
2.4 |
|
|
— |
|
|
— |
|
|
8.8 |
|
| Depreciation and amortization (included in cost of revenue) |
|
6.5 |
|
|
— |
|
|
— |
|
|
— |
|
|
— |
|
|
6.5 |
|
|
|
|
|
|
|
|
|
|
|
|
|
|
|
|
|
|
|
|
|
|
|
|
|
|
|
|
|
|
|
|
|
|
|
|
|
|
|
|
|
|
|
|
|
|
|
|
|
|
|
|
|
|
|
|
|
|
|
|
|
|
|
|
|
|
|
|
|
|
|
|
|
|
|
|
|
|
|
| Other operating loss |
|
1.1 |
|
|
— |
|
|
— |
|
|
— |
|
|
— |
|
|
1.1 |
|
| Interest expense |
|
4.5 |
|
|
9.7 |
|
|
7.6 |
|
|
19.8 |
|
|
— |
|
|
41.6 |
|
|
|
|
|
|
|
|
|
|
|
|
|
|
| Loss on extinguishment of debt |
|
0.3 |
|
|
— |
|
|
— |
|
|
— |
|
|
— |
|
|
0.3 |
|
| Other (income) expense, net |
|
(0.6) |
|
|
(4.5) |
|
|
4.5 |
|
|
(3.4) |
|
|
— |
|
|
(4.0) |
|
|
|
|
|
|
|
|
|
|
|
|
|
|
|
|
|
|
|
|
|
|
|
|
|
|
|
| Income tax expense |
|
4.4 |
|
|
— |
|
|
— |
|
|
6.9 |
|
|
— |
|
|
11.3 |
|
Non-controlling interests |
|
1.0 |
|
|
(2.8) |
|
|
(0.7) |
|
|
— |
|
|
— |
|
|
(2.5) |
|
|
|
|
|
|
|
|
|
|
|
|
|
|
| Share-based compensation expense |
|
— |
|
|
0.2 |
|
|
— |
|
|
1.3 |
|
|
— |
|
|
1.5 |
|
|
|
|
|
|
|
|
|
|
|
|
|
|
| Realignment and exit costs |
|
2.5 |
|
|
— |
|
|
0.1 |
|
|
— |
|
|
— |
|
|
2.6 |
|
|
|
|
|
|
|
|
|
|
|
|
|
|
|
|
|
|
|
|
|
|
|
|
|
|
|
| Adjusted EBITDA |
|
$ |
36.0 |
|
|
$ |
(11.3) |
|
|
$ |
2.4 |
|
|
$ |
(4.2) |
|
|
$ |
— |
|
|
$ |
22.9 |
|
|
|
|
|
|
|
|
|
|
|
|
|
|
|
|
|
|
|
|
|
|
|
|
|
|
|
 エドガーで原本を確認する