UNITED STATES
SECURITIES AND EXCHANGE COMMISSION
WASHINGTON, D.C. 20549
FORM 8-K
CURRENT REPORT
Pursuant to Section 13 or 15(d) of the Securities Exchange Act of 1934
Date of Report (Date of earliest event reported): March 12, 2025 |
National CineMedia, Inc.
(Exact name of Registrant as Specified in Its Charter)
Delaware |
001-33296 |
20-5665602 |
||
(State or Other Jurisdiction |
(Commission File Number) |
(IRS Employer |
||
|
|
|
|
|
6300 S. Syracuse Way, Suite 300 |
|
|||
Centennial, Colorado |
|
80111 |
||
(Address of Principal Executive Offices) |
|
(Zip Code) |
||
Registrant’s Telephone Number, Including Area Code: (303) 792-3600 |
|
(Former Name or Former Address, if Changed Since Last Report)
Check the appropriate box below if the Form 8-K filing is intended to simultaneously satisfy the filing obligation of the registrant under any of the following provisions:
Securities registered pursuant to Section 12(b) of the Act:
|
|
Trading |
|
|
Common Stock, par value $0.01 per share |
|
NCMI |
|
The Nasdaq Stock Market LLC |
Indicate by check mark whether the registrant is an emerging growth company as defined in Rule 405 of the Securities Act of 1933 (§ 230.405 of this chapter) or Rule 12b-2 of the Securities Exchange Act of 1934 (§ 240.12b-2 of this chapter).
Emerging growth company ☐
If an emerging growth company, indicate by check mark if the registrant has elected not to use the extended transition period for complying with any new or revised financial accounting standards provided pursuant to Section 13(a) of the Exchange Act. ☐
Item 7.01 Regulation FD Disclosure.
On March 13, 2025, National CineMedia, Inc. (“the Company”) will be hosting, via a live webcast, an Investor Day Event that can be accessed on the Company's investor webpage. The Company is furnishing the investor presentation that will be used at the Investor Day Event (the “Investor Day Presentation”) attached as Exhibit 99.1 to this Current Report on Form 8-K, which is incorporated by reference into this Item 7.01.
On March 13, 2025, the Company issued a press release announcing the reintroduction of a quarterly dividend on the Company’s common stock, the launch of a new advertising offering and other information related to the Investor Day Event. A copy of the press release is furnished as Exhibit 99.2 to this report.
The information in this Item 7.01 is being furnished and shall not be deemed “filed” for purposes of Section 18 of the Securities Exchange Act of 1934, as amended (the “Exchange Act”), nor shall it be deemed incorporated by reference in any filing under the Securities Act of 1933, as amended, or the Exchange Act, except as shall be expressly set forth by reference to such filing. The Company undertakes no duty or obligation to publicly update or revise the information contained in this Item 7.01 or the Investor Day Presentation, although it may do so from time to time as its management believes is appropriate or as required by applicable law.
Item 8.01 Other Events.
On March 12, 2025, the Board of Directors of the Company declared a cash dividend on the Company's common stock in an amount of $0.03 per share to stockholders of record as of March 24, 2025, payable on April 7, 2025.
Item 9.01 Financial Statements and Exhibits.
Exhibit No. |
|
Description |
99.1 |
|
|
99.2 |
|
|
101 |
|
Cover Page Interactive Data File (embedded within the Inline XBRL document). |
SIGNATURES
Pursuant to the requirements of the Securities Exchange Act of 1934, the registrant has duly caused this report to be signed on its behalf by the undersigned hereunto duly authorized.
|
|
|
NATIONAL CINEMEDIA, INC. |
|
|
|
|
Date: |
March 13, 2025 |
By: |
/s/ Ronnie Y. Ng |
|
|
|
Ronnie Y. Ng |
Forward-Looking Statements The following presentations contain various forward-looking statements that reflect management’s current expectations or beliefs regarding future events, including statements regarding the Company’s anticipated future financial performance. Investors are cautioned that reliance on these forward-looking statements involves risks and uncertainties. Although the Company believes that the assumptions used in the forward-looking statements are reasonable, any of these assumptions could prove to be inaccurate and, as a result, actual results could differ materially from those expressed or implied in the forward-looking statements. The factors that could cause actual results to differ materially from those expressed or implied in the forward-looking statements are, among others, 1) level of theater attendance or viewership of the Noovie® show; 2) the availability and predictability of major motion pictures displayed in theaters, including as a result of strikes or other production delays in the entertainment industry; 3) increased competition for advertising expenditures; 4) changes to the ESAs or network affiliate agreements and the relationships with NCM LLC’s ESA Parties and network affiliates; 5)inability to implement or achieve new revenue opportunities; 6) failure to realize the anticipated benefits of the post-showtime inventory in our network; 7) technological changes and innovations; 8) economic conditions, including the level of expenditures on and perception of cinema advertising; 9) our ability to renew or replace expiring advertising and content contracts; 10) the ongoing effects of NCM LLC’s emergence from bankruptcy; 11) reinvestment in our network and product offerings may require significant funding and resulting reallocation of resources; and 12) fluctuations in and timing of operating costs. In addition, the outlook provided does not include the impact of any future unusual or infrequent transactions; sales and acquisitions of operating assets and investments; any future non-cash impairments of intangible and fixed assets; amounts related to litigation or the related impact of taxes that may occur from time to time due to management decisions and changing business circumstances. The Company is currently unable to forecast precisely the timing and/or magnitude of any such amounts or events. Please refer to the Company’s Securities and Exchange Commission filings, including the “Risk Factor” section of the Company’s Annual Report on Form 10-K for the year ended December 26, 2024, for further information about these and other risks. Investors are cautioned not to place undue reliance on any such forward-looking statements, which speak only as of the date they are made. The Company undertakes no obligation to update any forward-looking statement, whether as a result, of new information, future events or otherwise, except as required by law. The presentations contain references to Non-GAAP financial measures including Adjusted OIBDA (Operating Income Before Depreciation and Amortization expense, adjusted to exclude non-cash share-based payment costs, impairment of long-lived assets, executive transition costs, advisor fees related to abandoned financing transactions, workforce reorganization costs, system optimization costs, satellite transition costs, termination of the Regal ESA and advisor fees related to involvement in the Cineworld Proceeding and Chapter 11 Case), unlevered free cash flow, and adjusted operating expense. A reconciliation of these measures is available in the appendix of this presentation and on the investor page of the Company’s website at www.ncm.com. 2

Tom Lesinski Chief Executive Officer Welcome

Today’s Agenda 3:00 PM ET 3:55 PM ET 4:45 PM ET Executive Leadership Team Q&A Break Welcome Tom Lesinski | Chief Executive Officer 4:25 PM ET Management Presentation Ronnie Ng | Chief Financial Officer 3:05 PM ET Tom Lesinski | Chief Executive Officer Management Presentations Manu Singh | Chief Data & Innovation Officer Catherine Sullivan | President 4:05 PM ET Panel Discussion Sara Light | US & LATAM Brand Media Lead, Expedia Group Chris Poydenis | Chief Revenue Officer, Influential Catherine Sullivan | President 4

The Largest Cinema Advertising Network in the U.S. with Unmatched Scale & Reach Sought-after, Young Audiences& Innovative Buying Options 5

The Most Effective Brand & PerformanceMarketing Platform inToday’s Media Landscape Unduplicated, Incremental Reach Proven Brand & Performance Outcomes World’s Best Content Young, Diverse, Audiences 6

Best-in-Class Leadership Team Tom Lesinski Chief Executive Officer Ronnie Ng Chief Financial Officer Catherine Sullivan President Mike Rosen Chief Revenue Officer John Calkins Chief Corporate Development Officer Manu Singh Chief Data &Innovation Officer 7 Maria Woods General Counsel & Secretary

Our Story
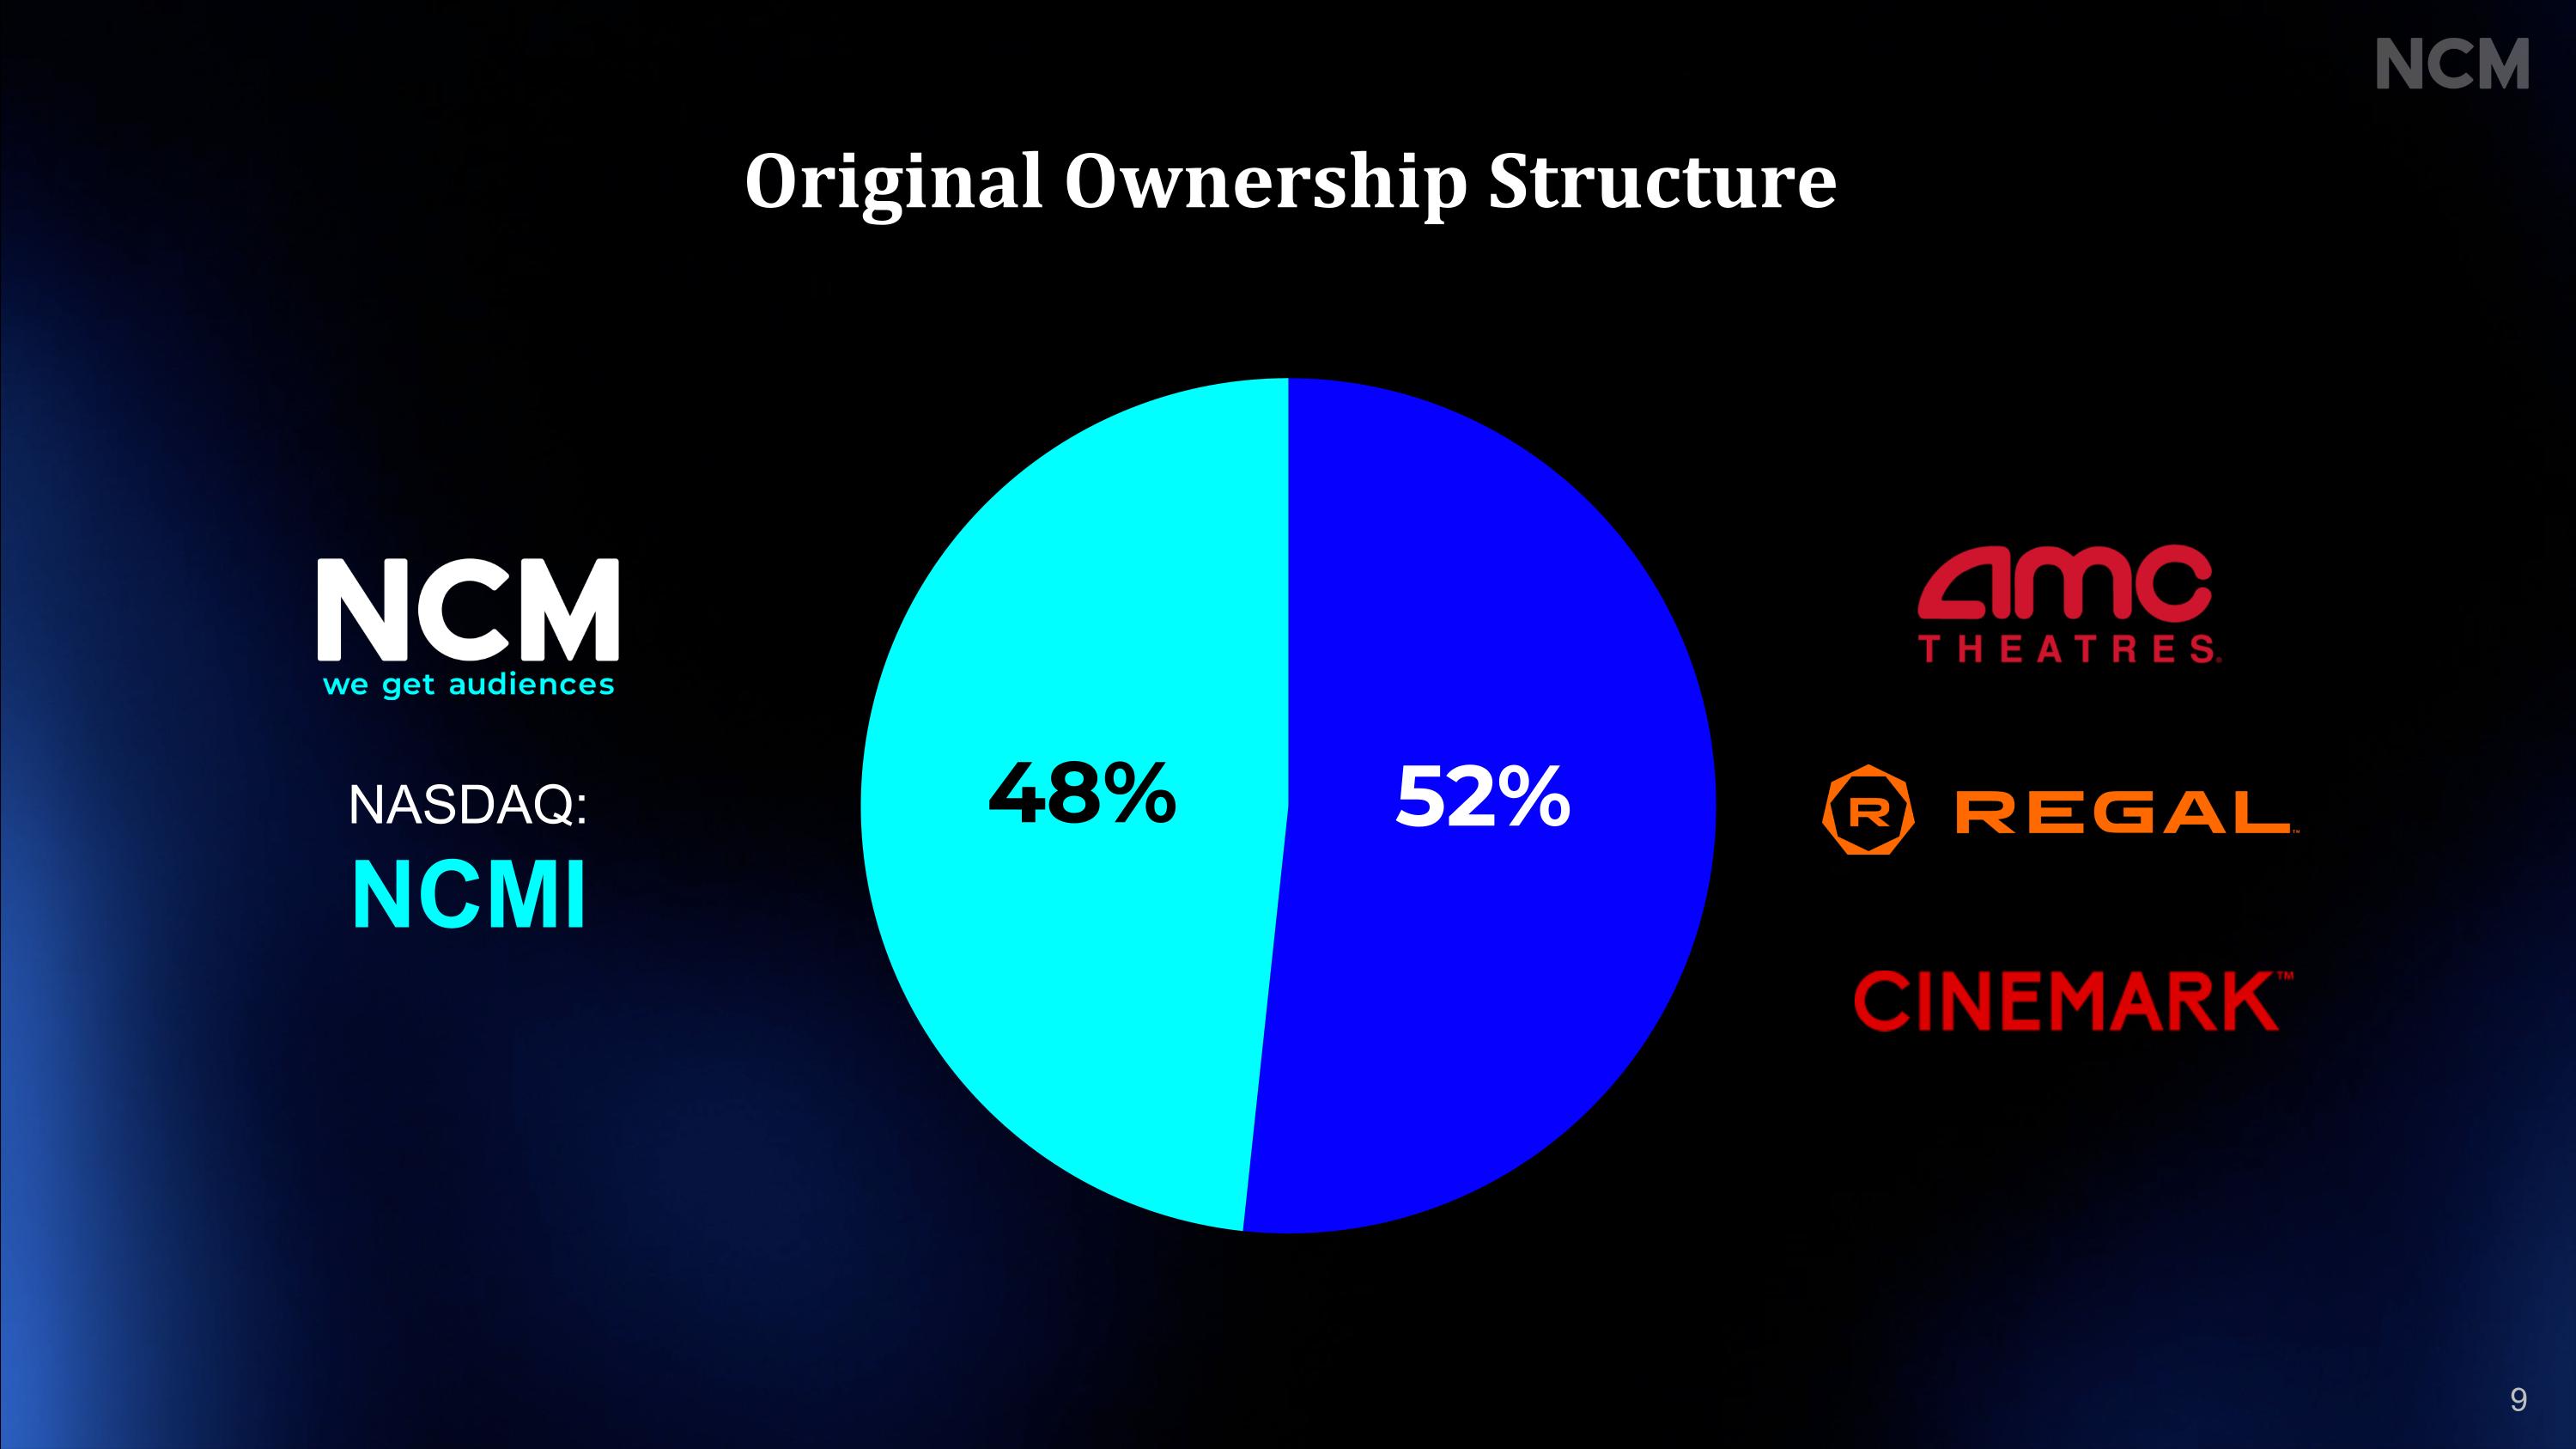
NASDAQ:NCMI Original Ownership Structure 9

Headwinds Disrupting the Cinema Industry Challenged established theatrical release model New Release Models The Rise of Streaming Introduceda shift in how audiences consume content 10
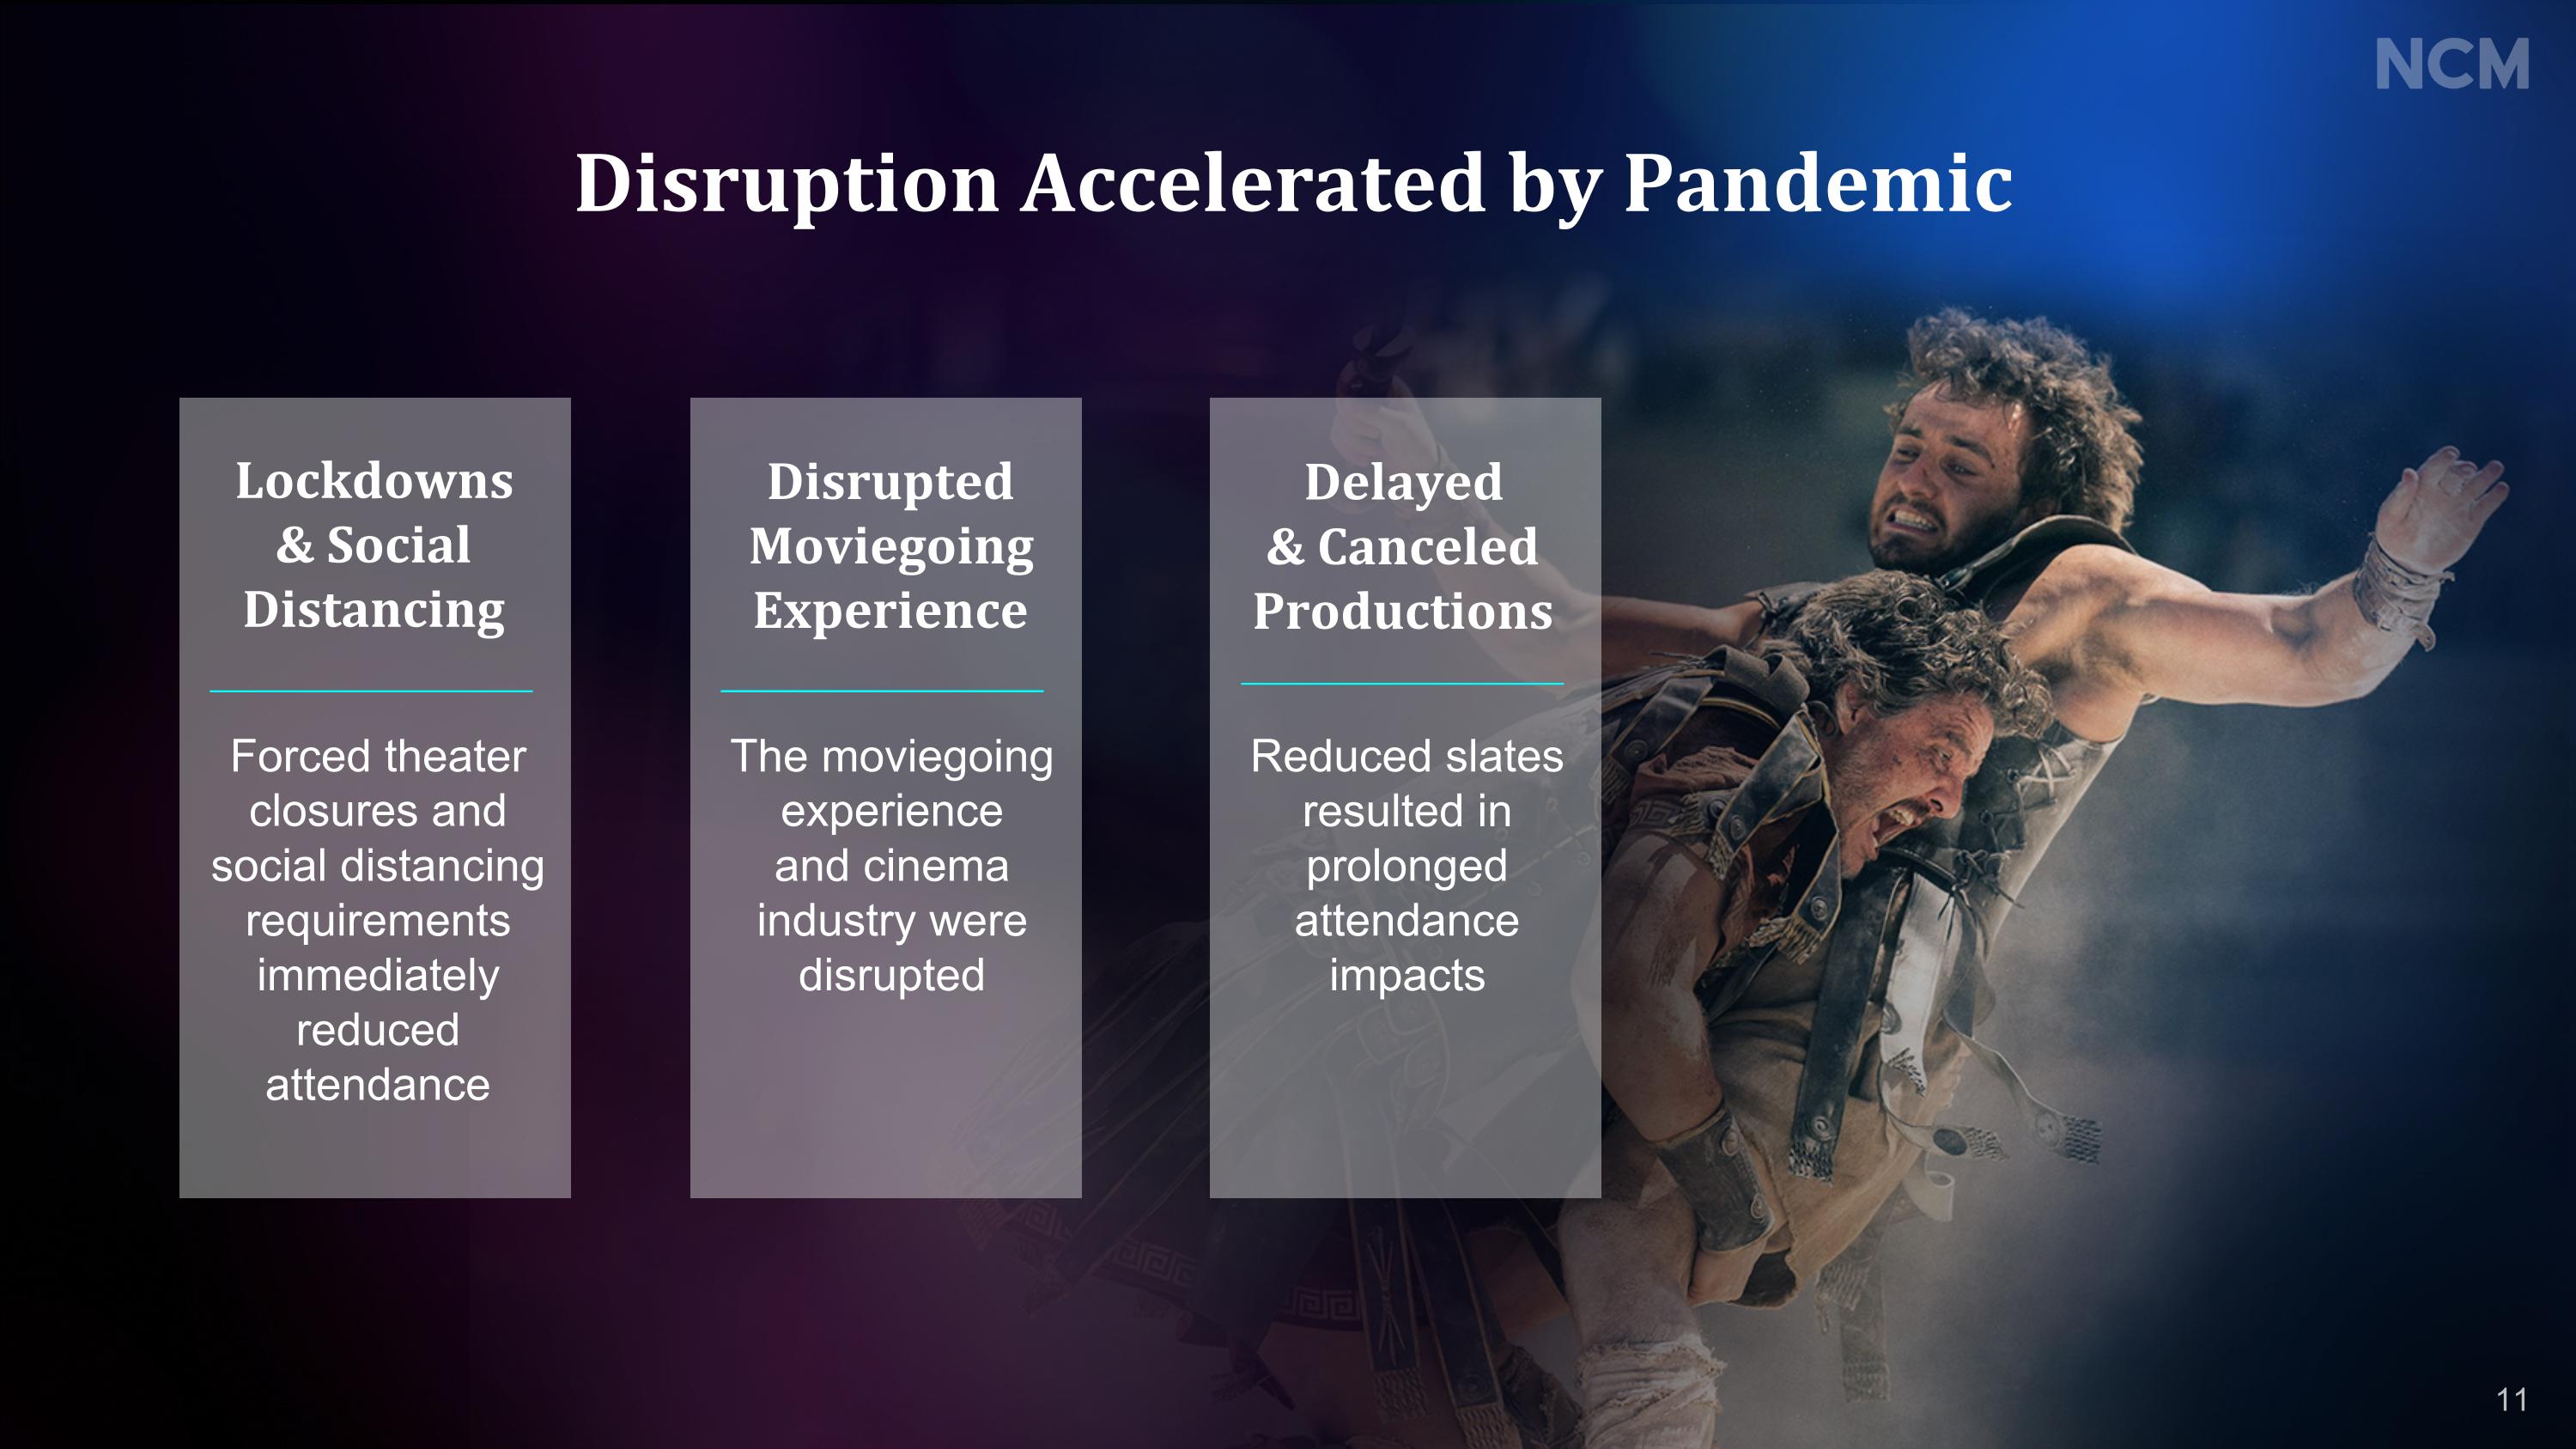
Disruption Accelerated by Pandemic Reduced slates resulted in prolonged attendance impacts Delayed & Canceled Productions Disrupted Moviegoing Experience The moviegoing experience and cinema industry were disrupted Lockdowns & Social Distancing Forced theater closures and social distancing requirements immediately reduced attendance 11
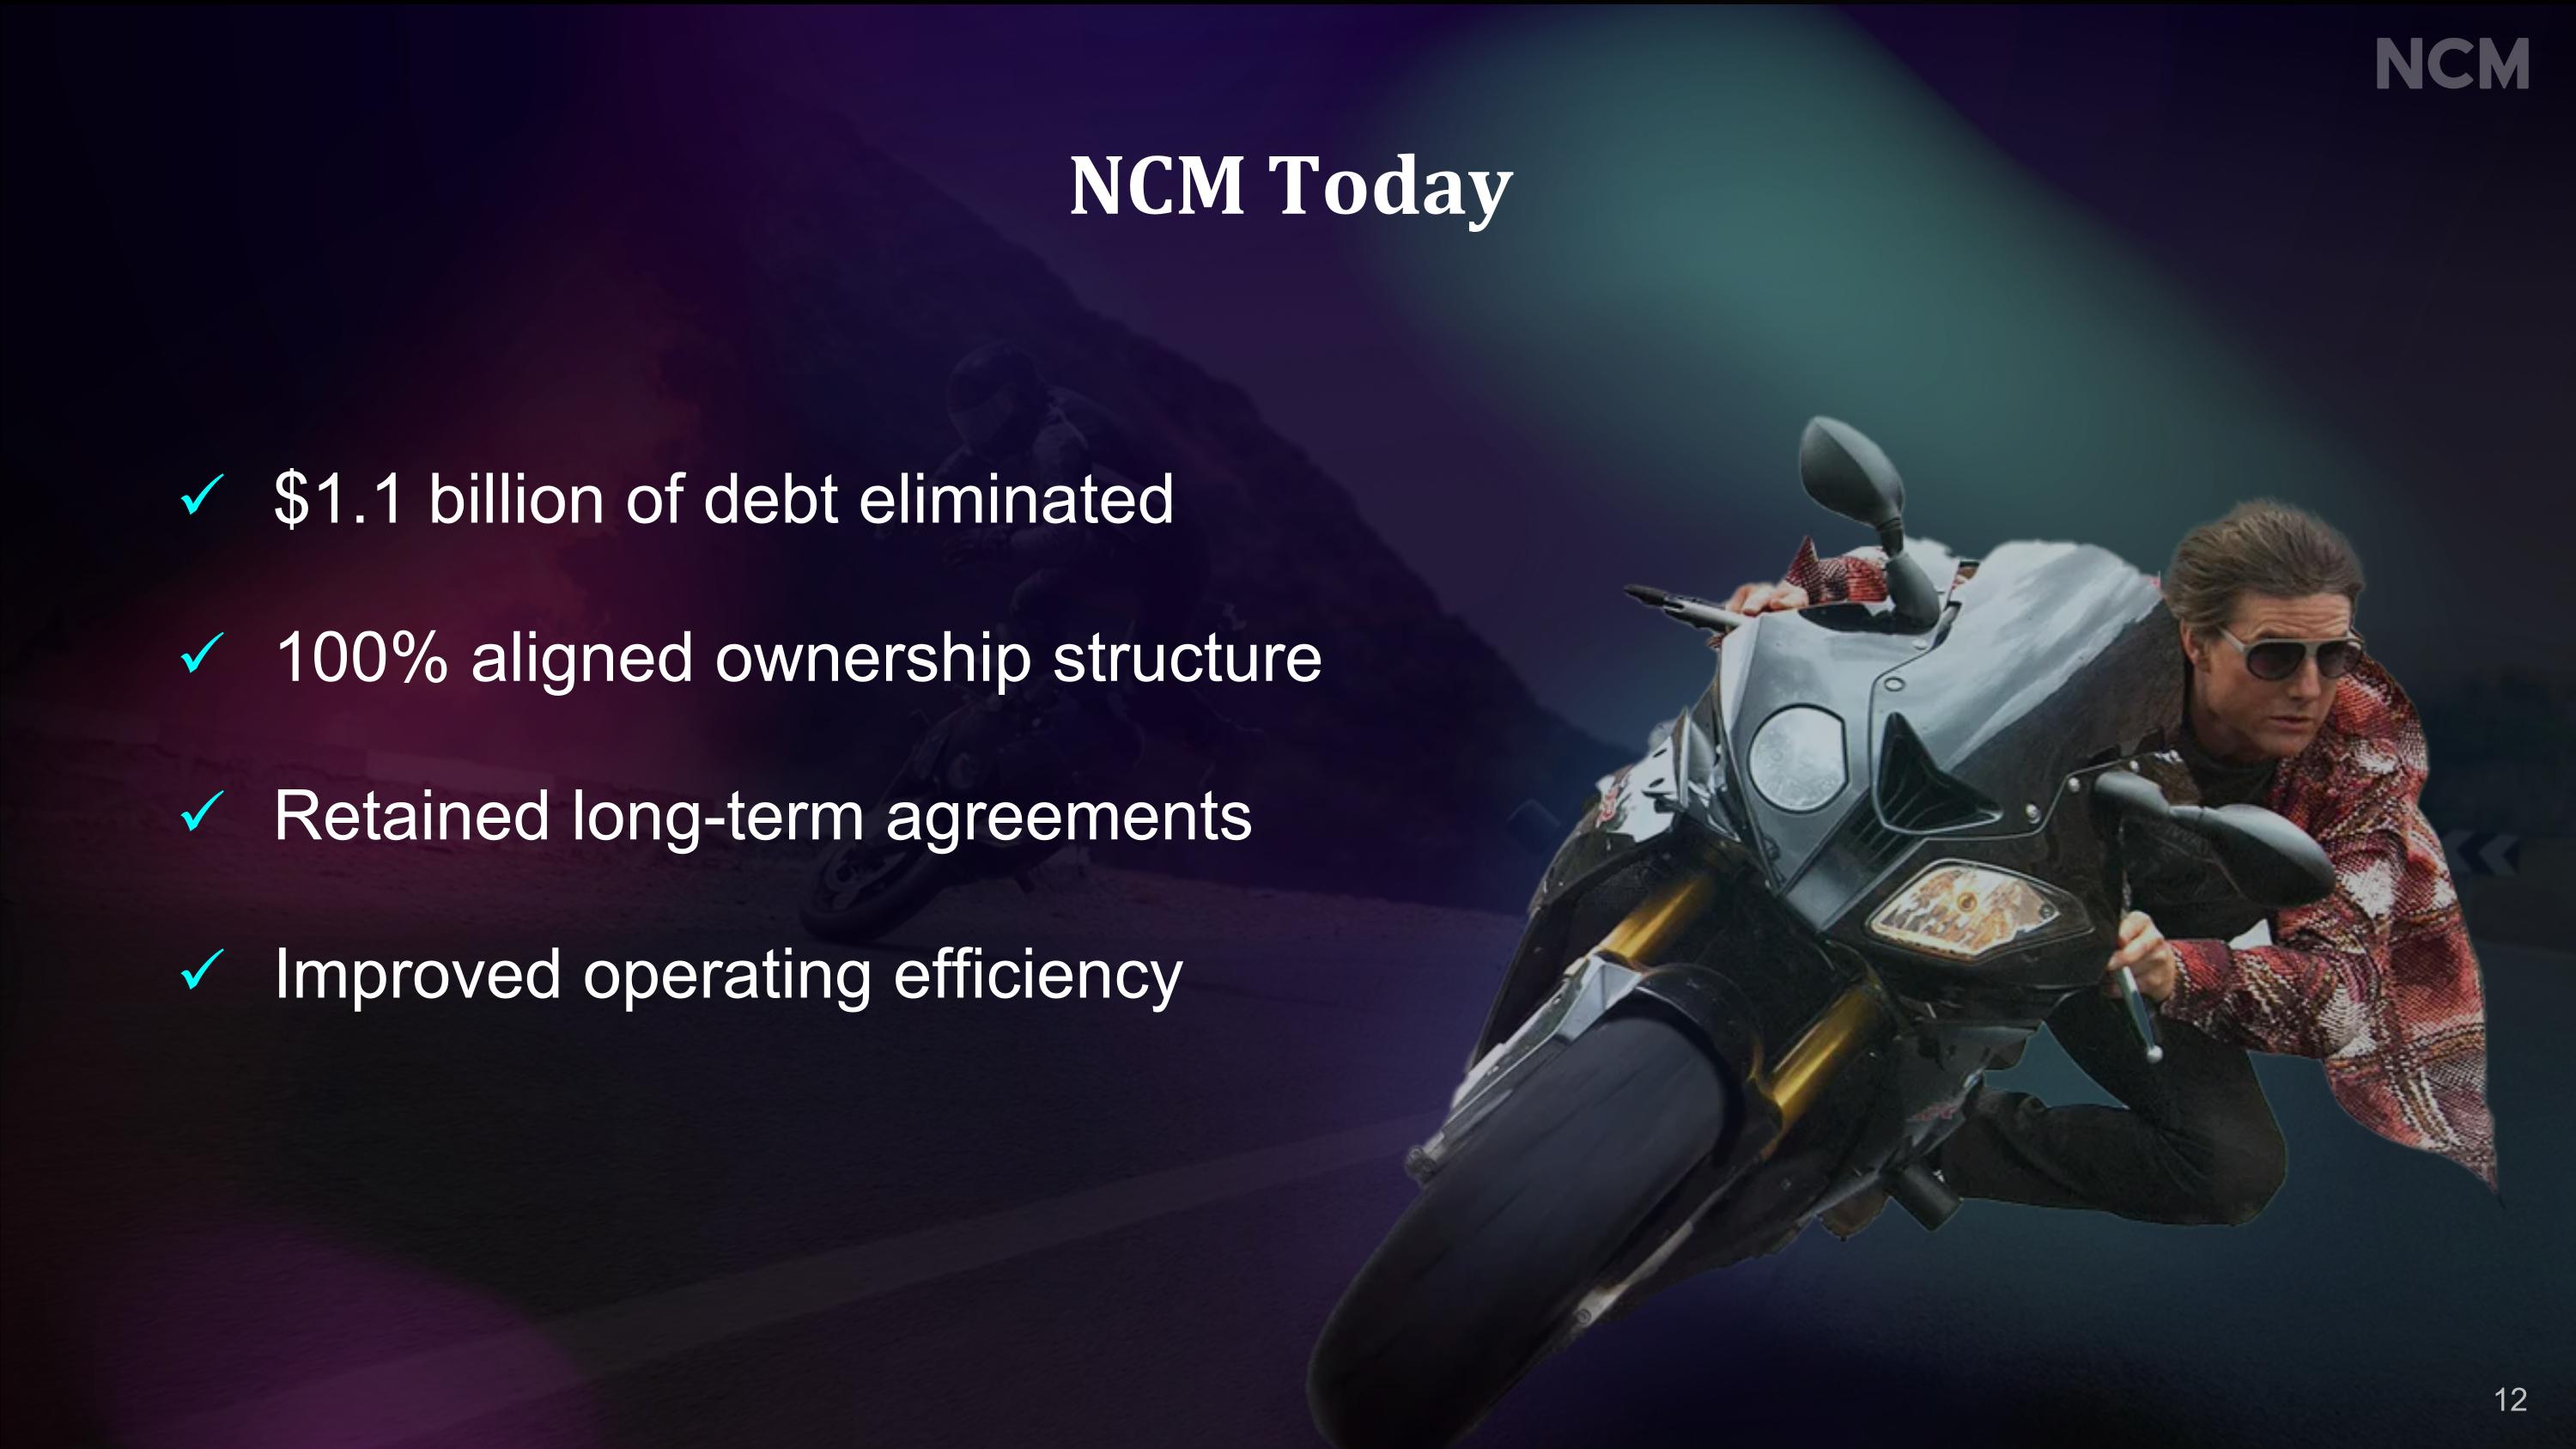
NCM Today $1.1 billion of debt eliminated 100% aligned ownership structure Retained long-term agreements Improved operating efficiency 12

Highest-quality premium content Immersive shared experience Captivating 50-foot screens People Continue to Love Going to the Movies 13


Strategy
Well-Positioned to Win Attractive Industry Dynamics Premium Audience & Product Competitive Edge Compelling Financial Position 2 1 3 4 16
Competitive Edge

Long-Term Contracts with the Largest U.S. Exhibitors Affiliate Exhibitor Market Share 26% 17% 17% 9% Other NCM Affiliates $8.6B Source: Box Office Essentials, 2024 18

Show Structure Provides Multiple Opportunities to Reach Audiences Platinum Spot Trailers “Turn Off Your Cellphones”SPONSORSHIP Feature Film Trailers SHOWTIME Gold Silver Post-Showtime 19

71% Share of U.S. Cinema Attendance Viewing Ads Top 10 DMAs Key Metrics Impressions Opening Weekend Box Office Share 18,000+ 4B+ 70%+ Total Theaters Audience* 400M+ 1,400+ Dominant Position in the Biggest Markets Total Screens *Trailing three-year average 20

IndustryDynamics
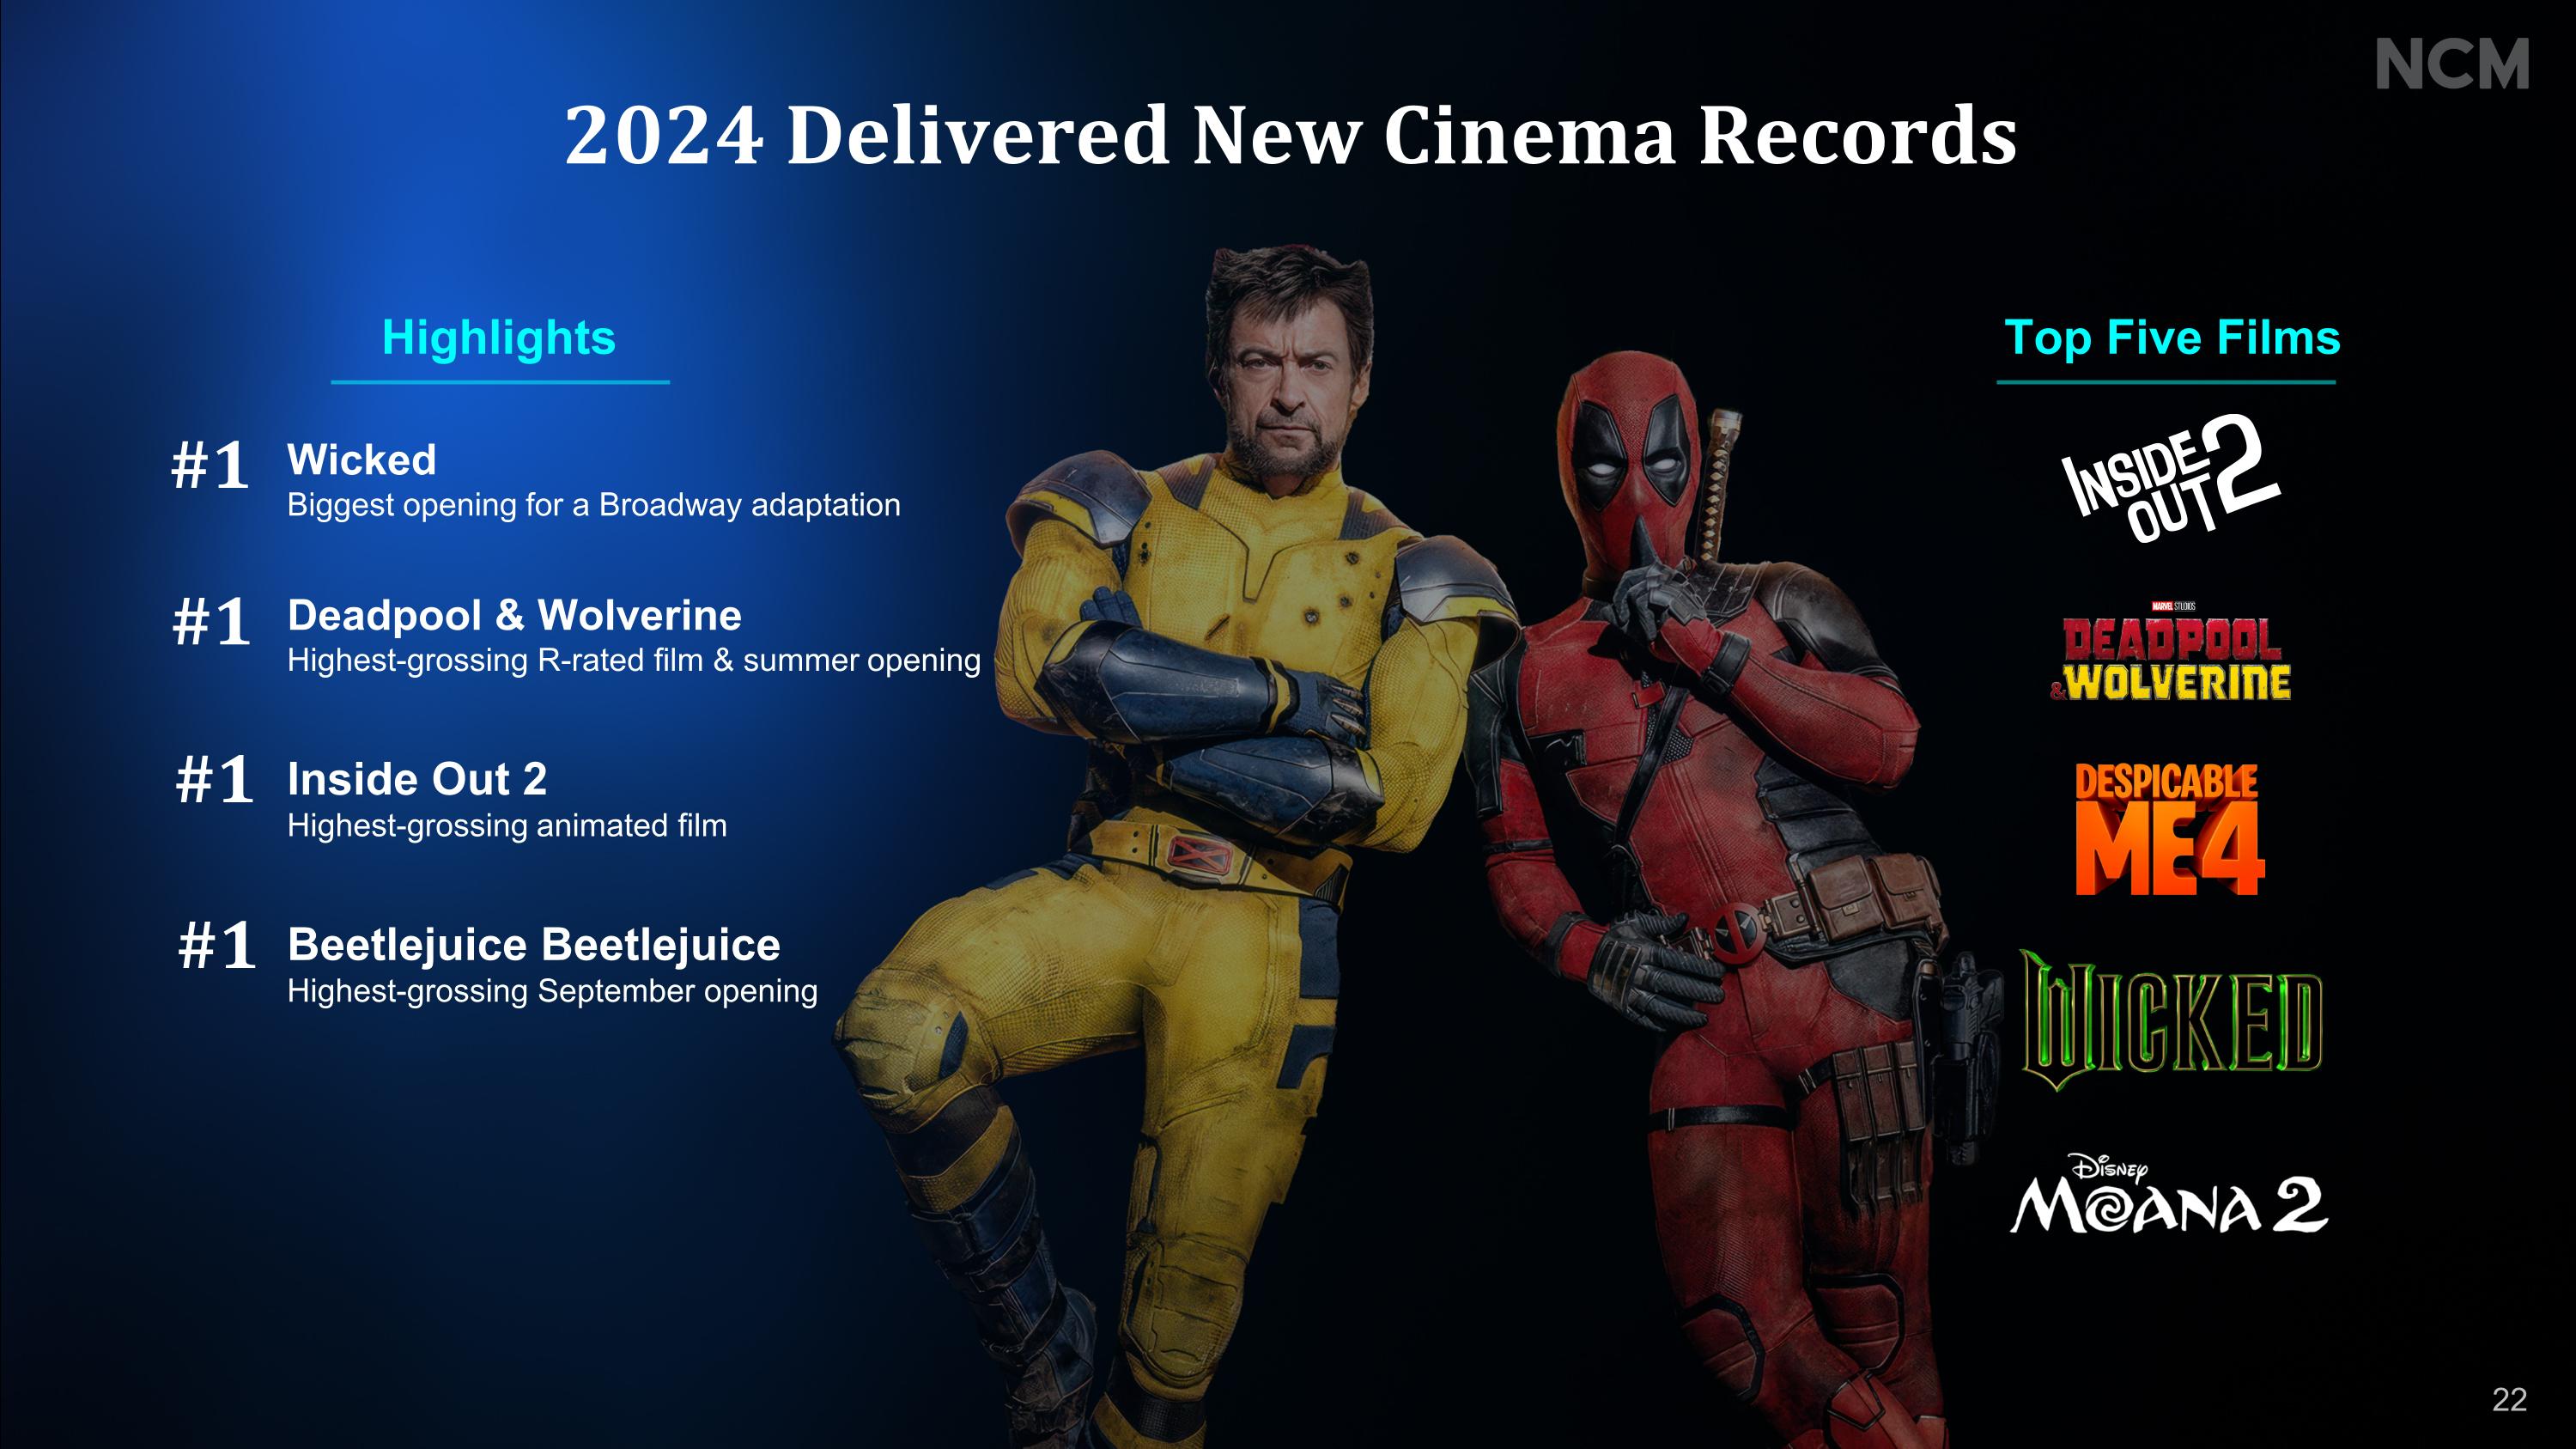
Highlights Top Five Films #1 Wicked Biggest opening for a Broadway adaptation #1 Deadpool & Wolverine Highest-grossing R-rated film & summer opening #1 Inside Out 2 Highest-grossing animated film #1 Beetlejuice Beetlejuice Highest-grossing September opening 2024 Delivered New Cinema Records 22

Source: Box Office Mojo, BoxOffice Pro’s 2025 Domestic Forecast Box Office is on a Strong Trajectory, with Dollars Swinging Back to Studios & Cinemas 23

Source: EMARKETER Forecast November 2024 Targeting Premium Video Budgets Broadcast & Cable Connected TV

Premium Audience & Platform
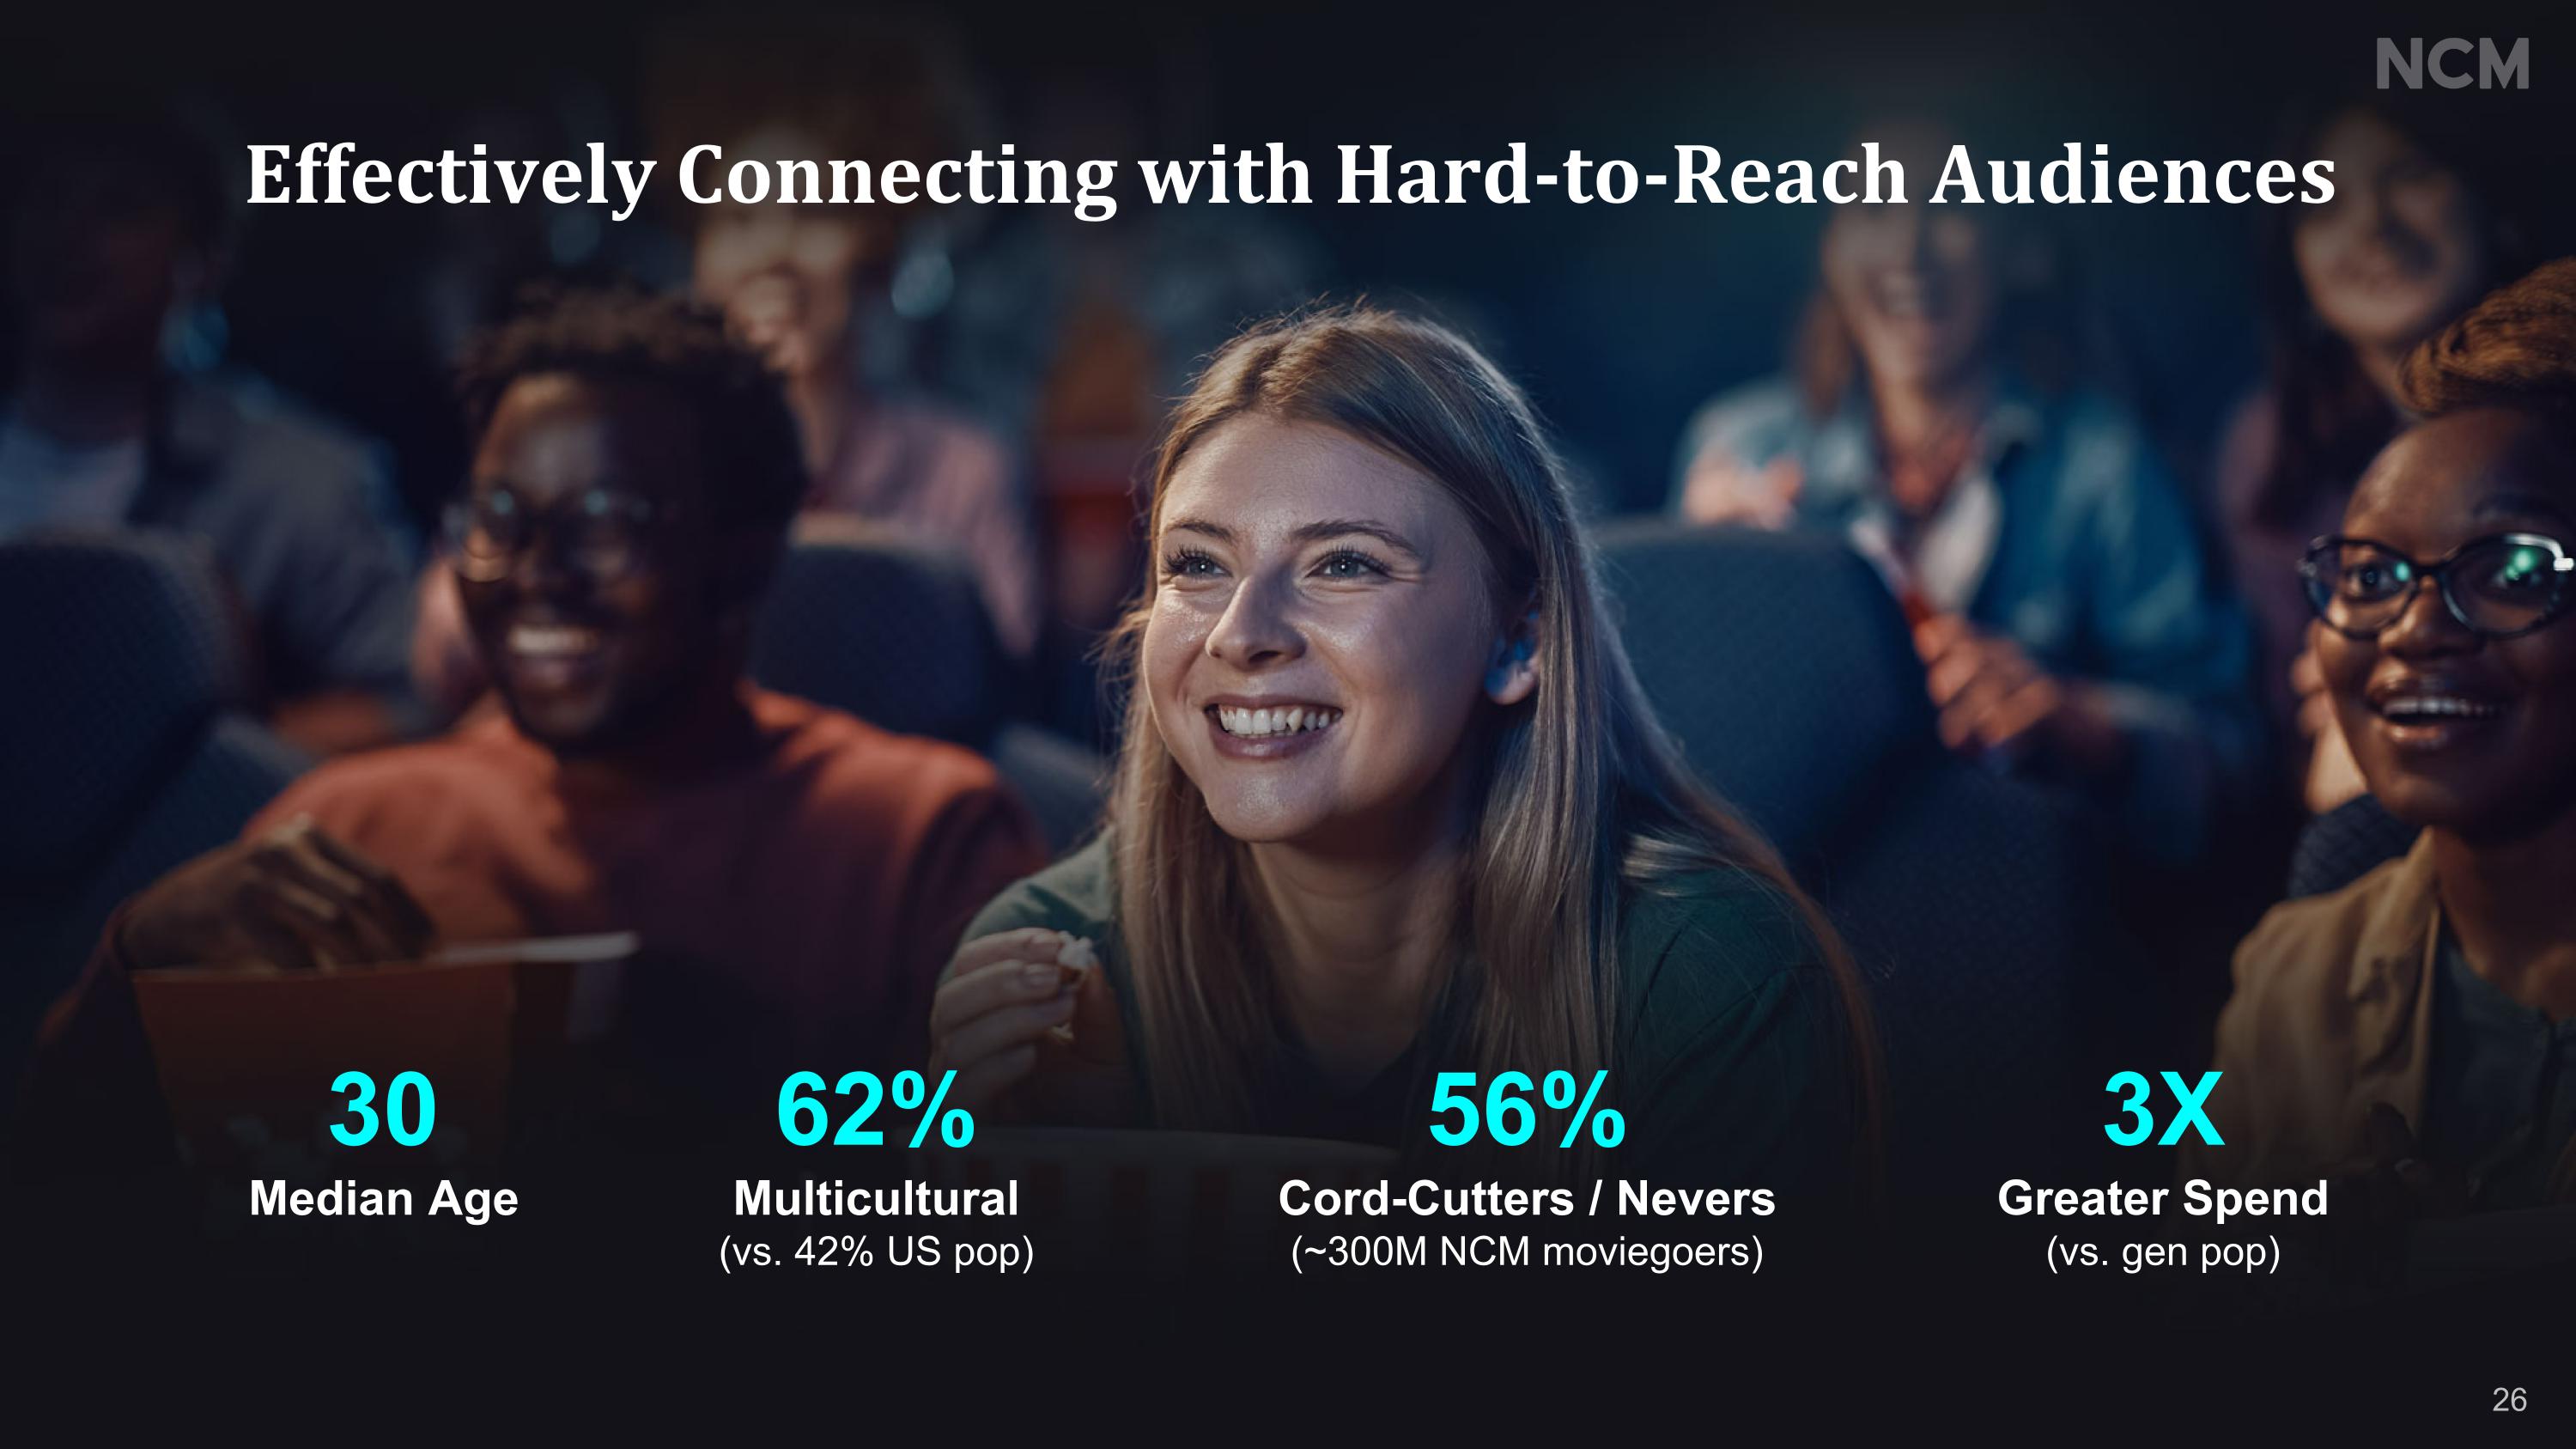
30 Median Age 62% Multicultural (vs. 42% US pop) 56% Cord-Cutters / Nevers (~300M NCM moviegoers) 3X Greater Spend (vs. gen pop) Effectively Connecting with Hard-to-Reach Audiences 26


Pioneered Performance Marketing in Cinema Performance Attribution Continued Engagement Cross-Channel Reach Hyper-Localization TM 28

Compelling Financial Position

Total Revenue $241M Adj. OIBDA $46M Unlevered FCF $58M 2024 Financial Highlights 30
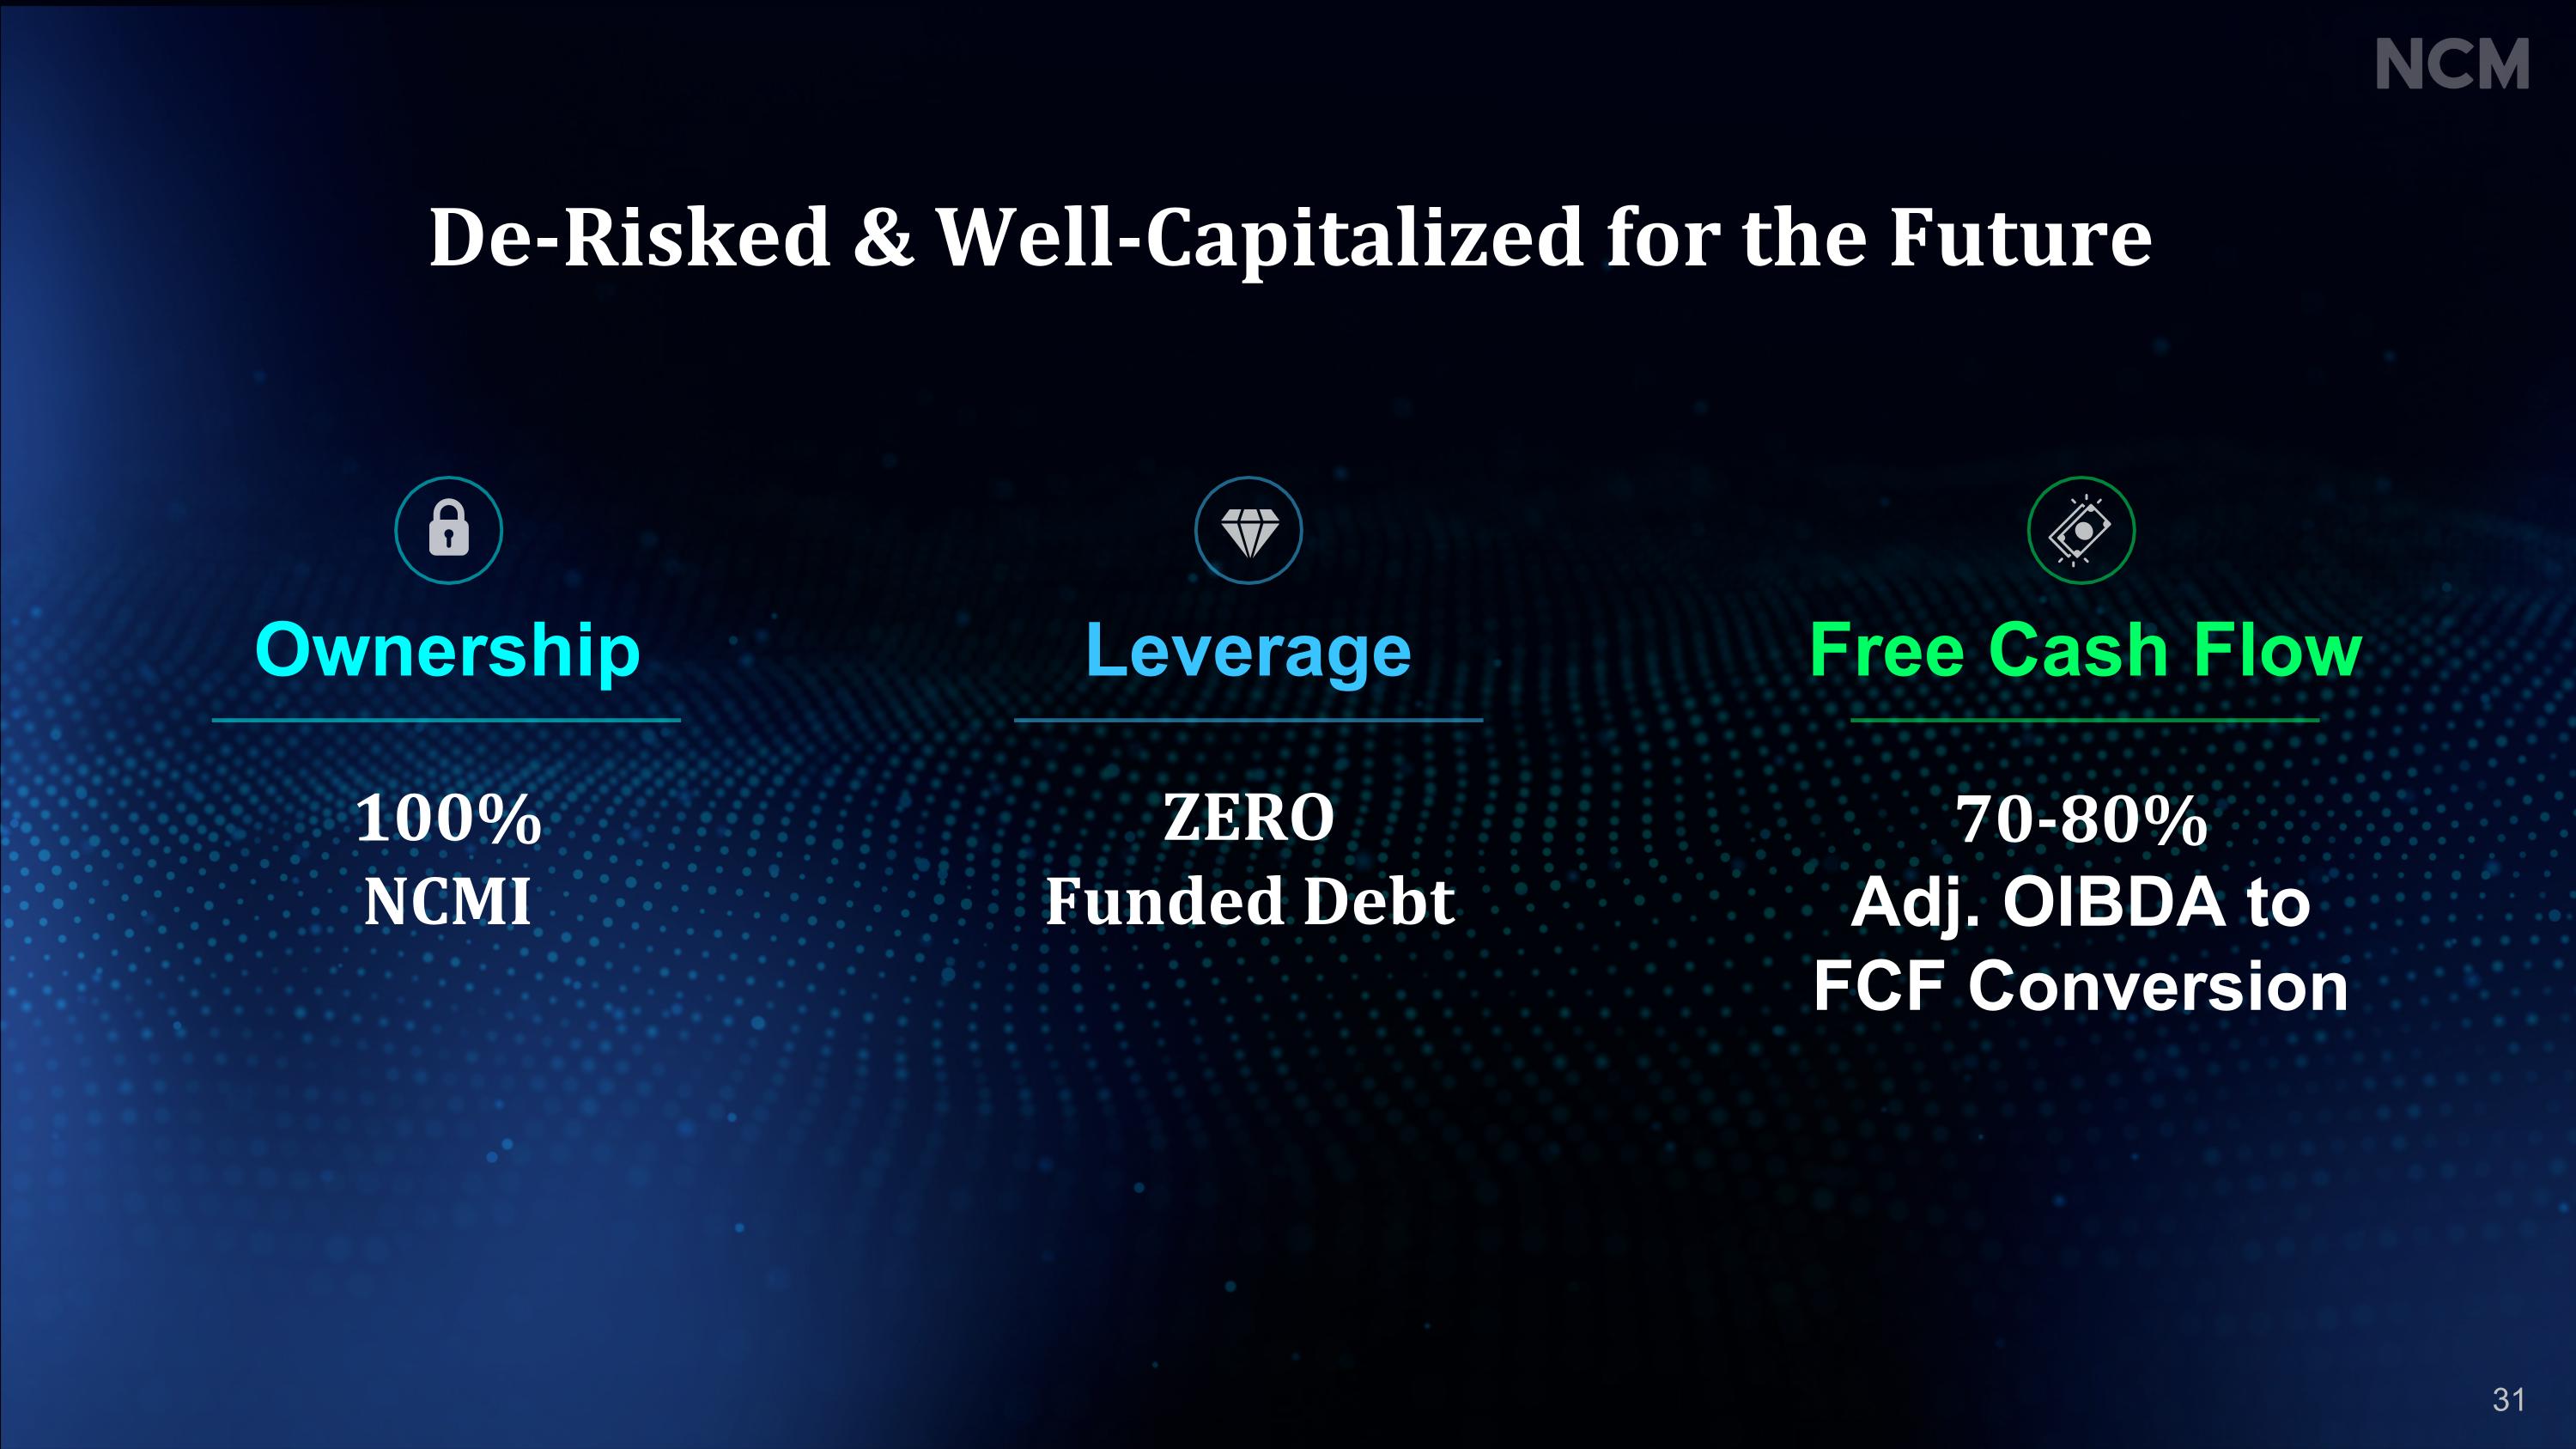
De-Risked & Well-Capitalized for the Future 100% NCMI Ownership ZERO Funded Debt Leverage 70-80% Adj. OIBDA to FCF Conversion Free Cash Flow 31
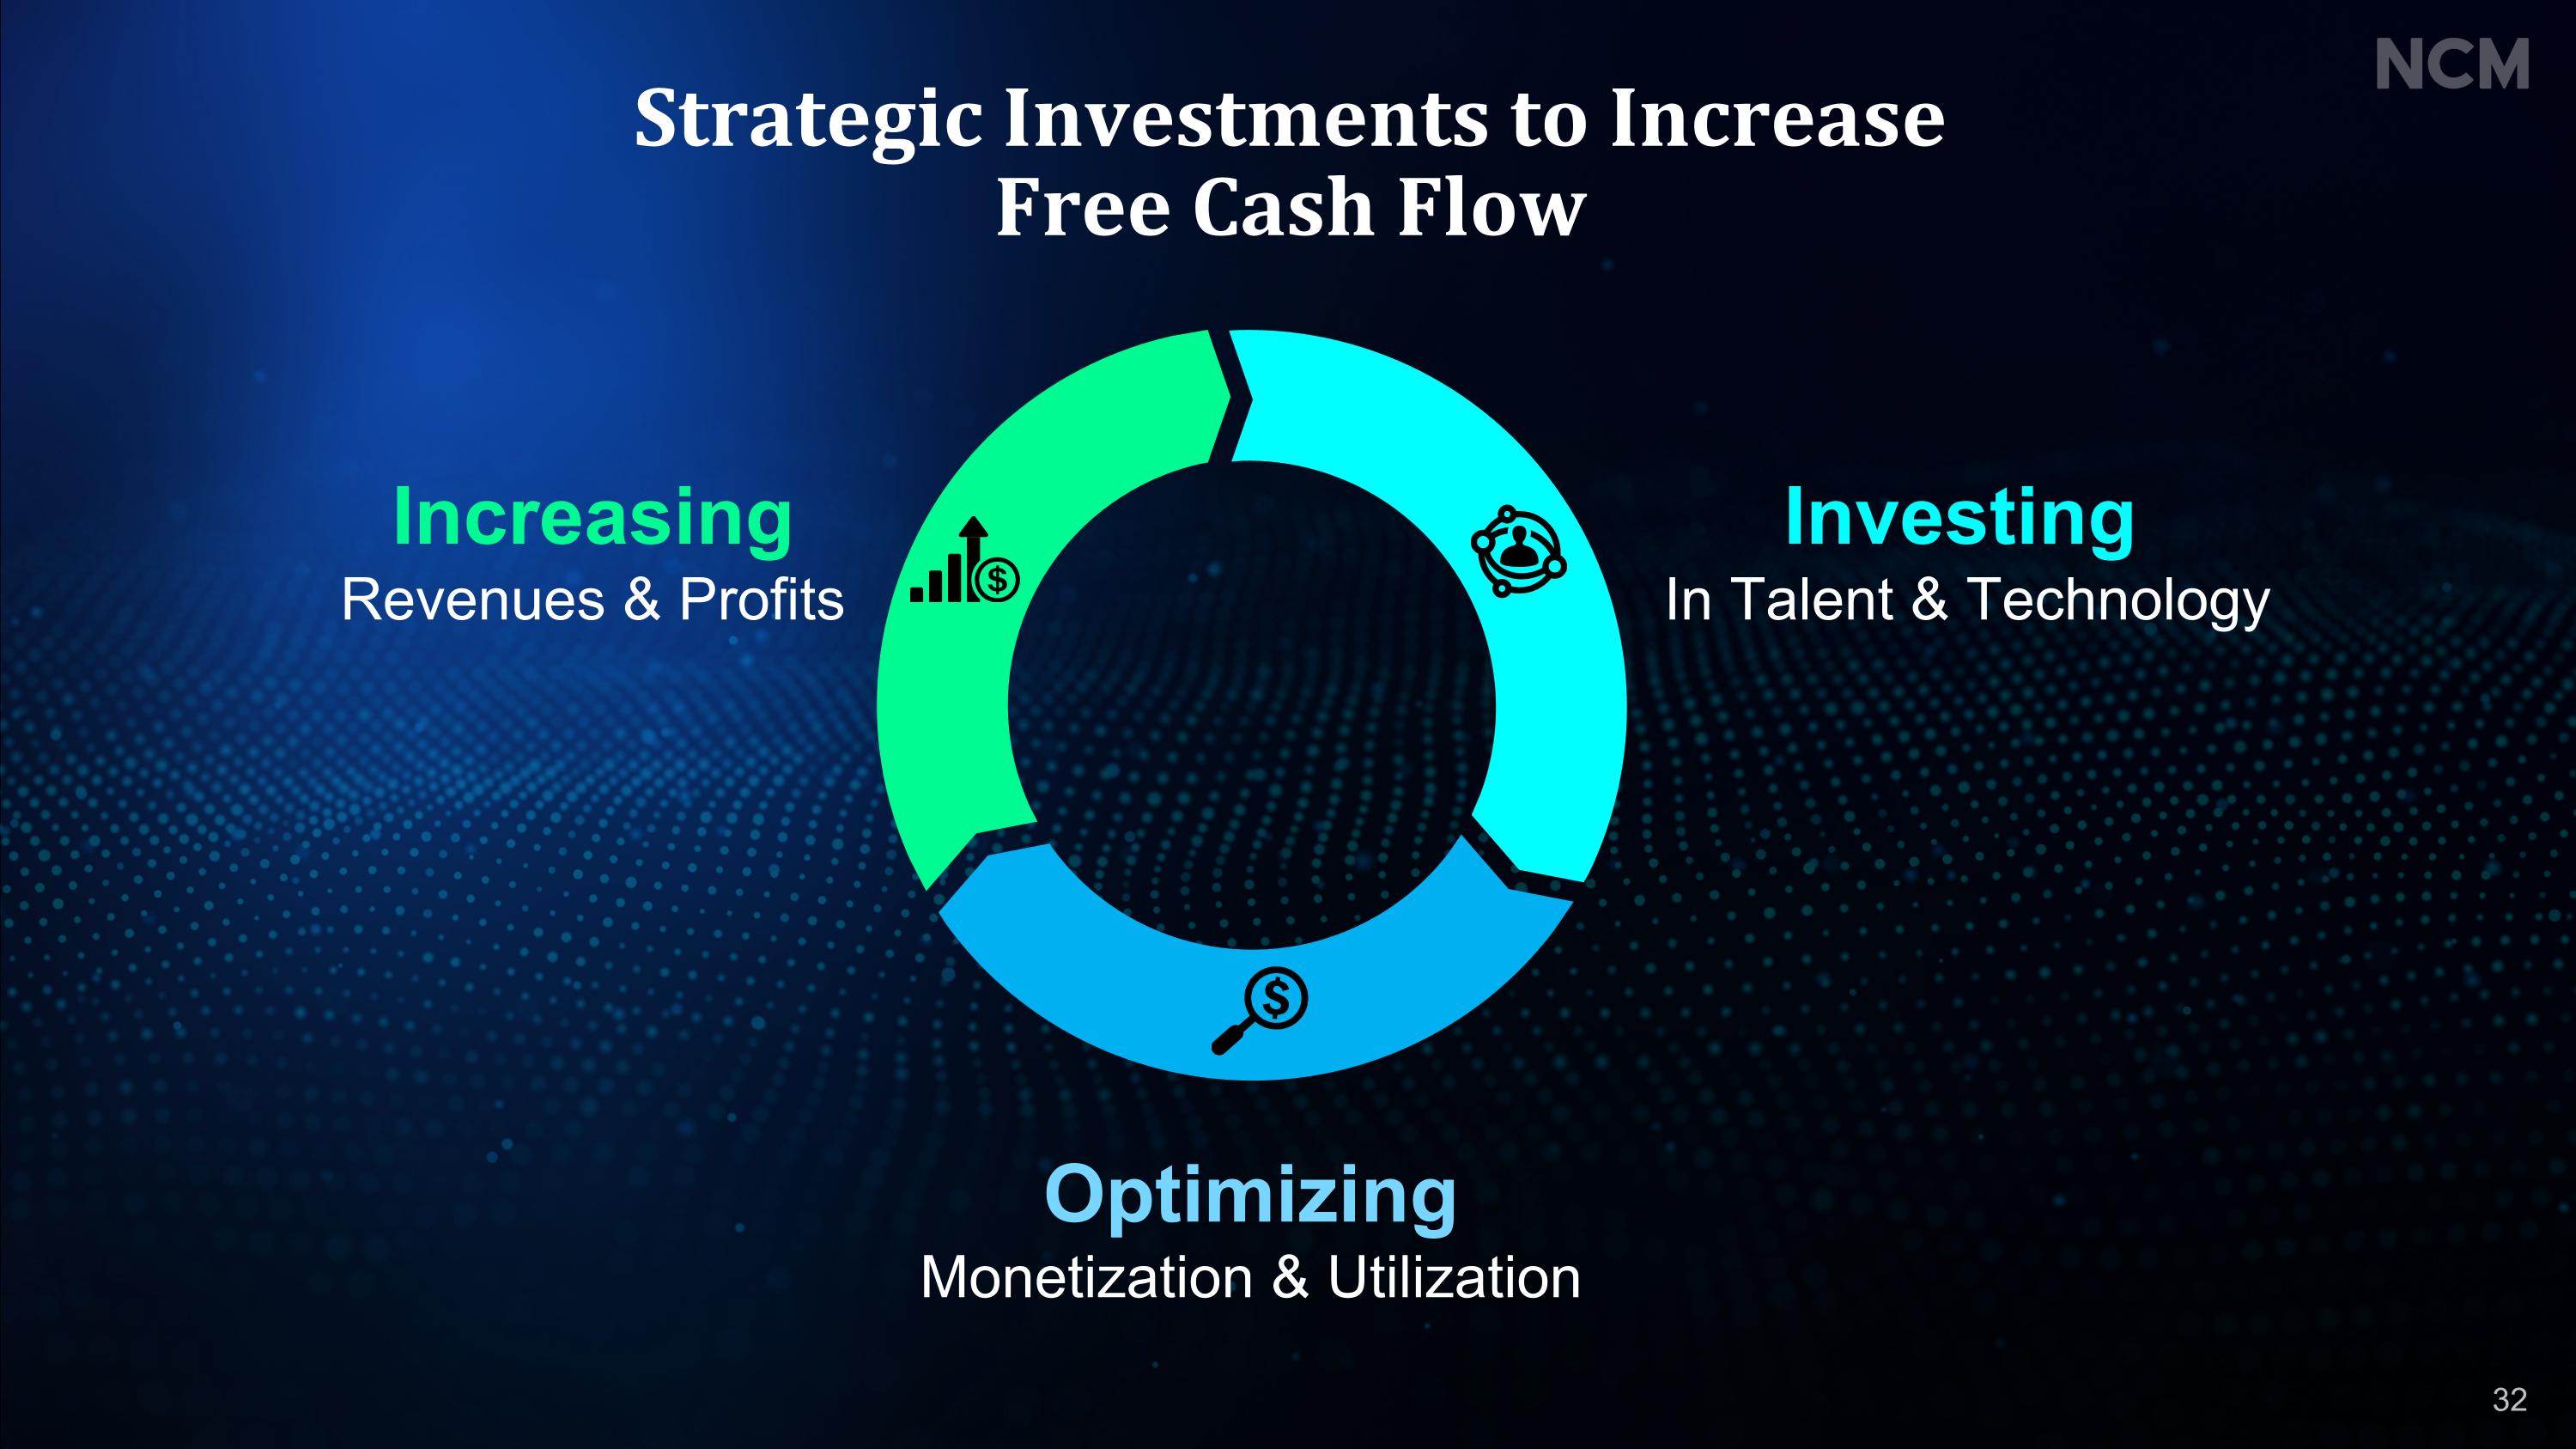
Investing In Talent & Technology Optimizing Monetization & Utilization Increasing Revenues & Profits Strategic Investments to Increase Free Cash Flow 32

Dividend Reintroducing quarterly dividend Share Repurchases Opportunistically repurchasing shares Optimizing Shareholder Return Increase FCF Investing in Tech & Talent to Optimize Monetization 33

Well-Positioned to Win Attractive Industry Dynamics Premium Audience & Product Competitive Edge Compelling Financial Position 2 1 3 4 34

Driving Growth in Advertising Catherine Sullivan President

NCM’s Unifying Growth Vision Harnessing a Growing Opportunity Enhancing Capabilities to Compete Positioned to Win 36

Harnessing a Growing Opportunity Enhancing Capabilities to Compete Positioned to Win NCM’s Unifying Growth Vision 37

Evolving Market Trends Share of Total Viewing (Q2’24) Share of Total Ad Time (Q2’24) 38 Source: Nielsen Guage Report 2024 Average; Comscore Score Report, 2024 Average
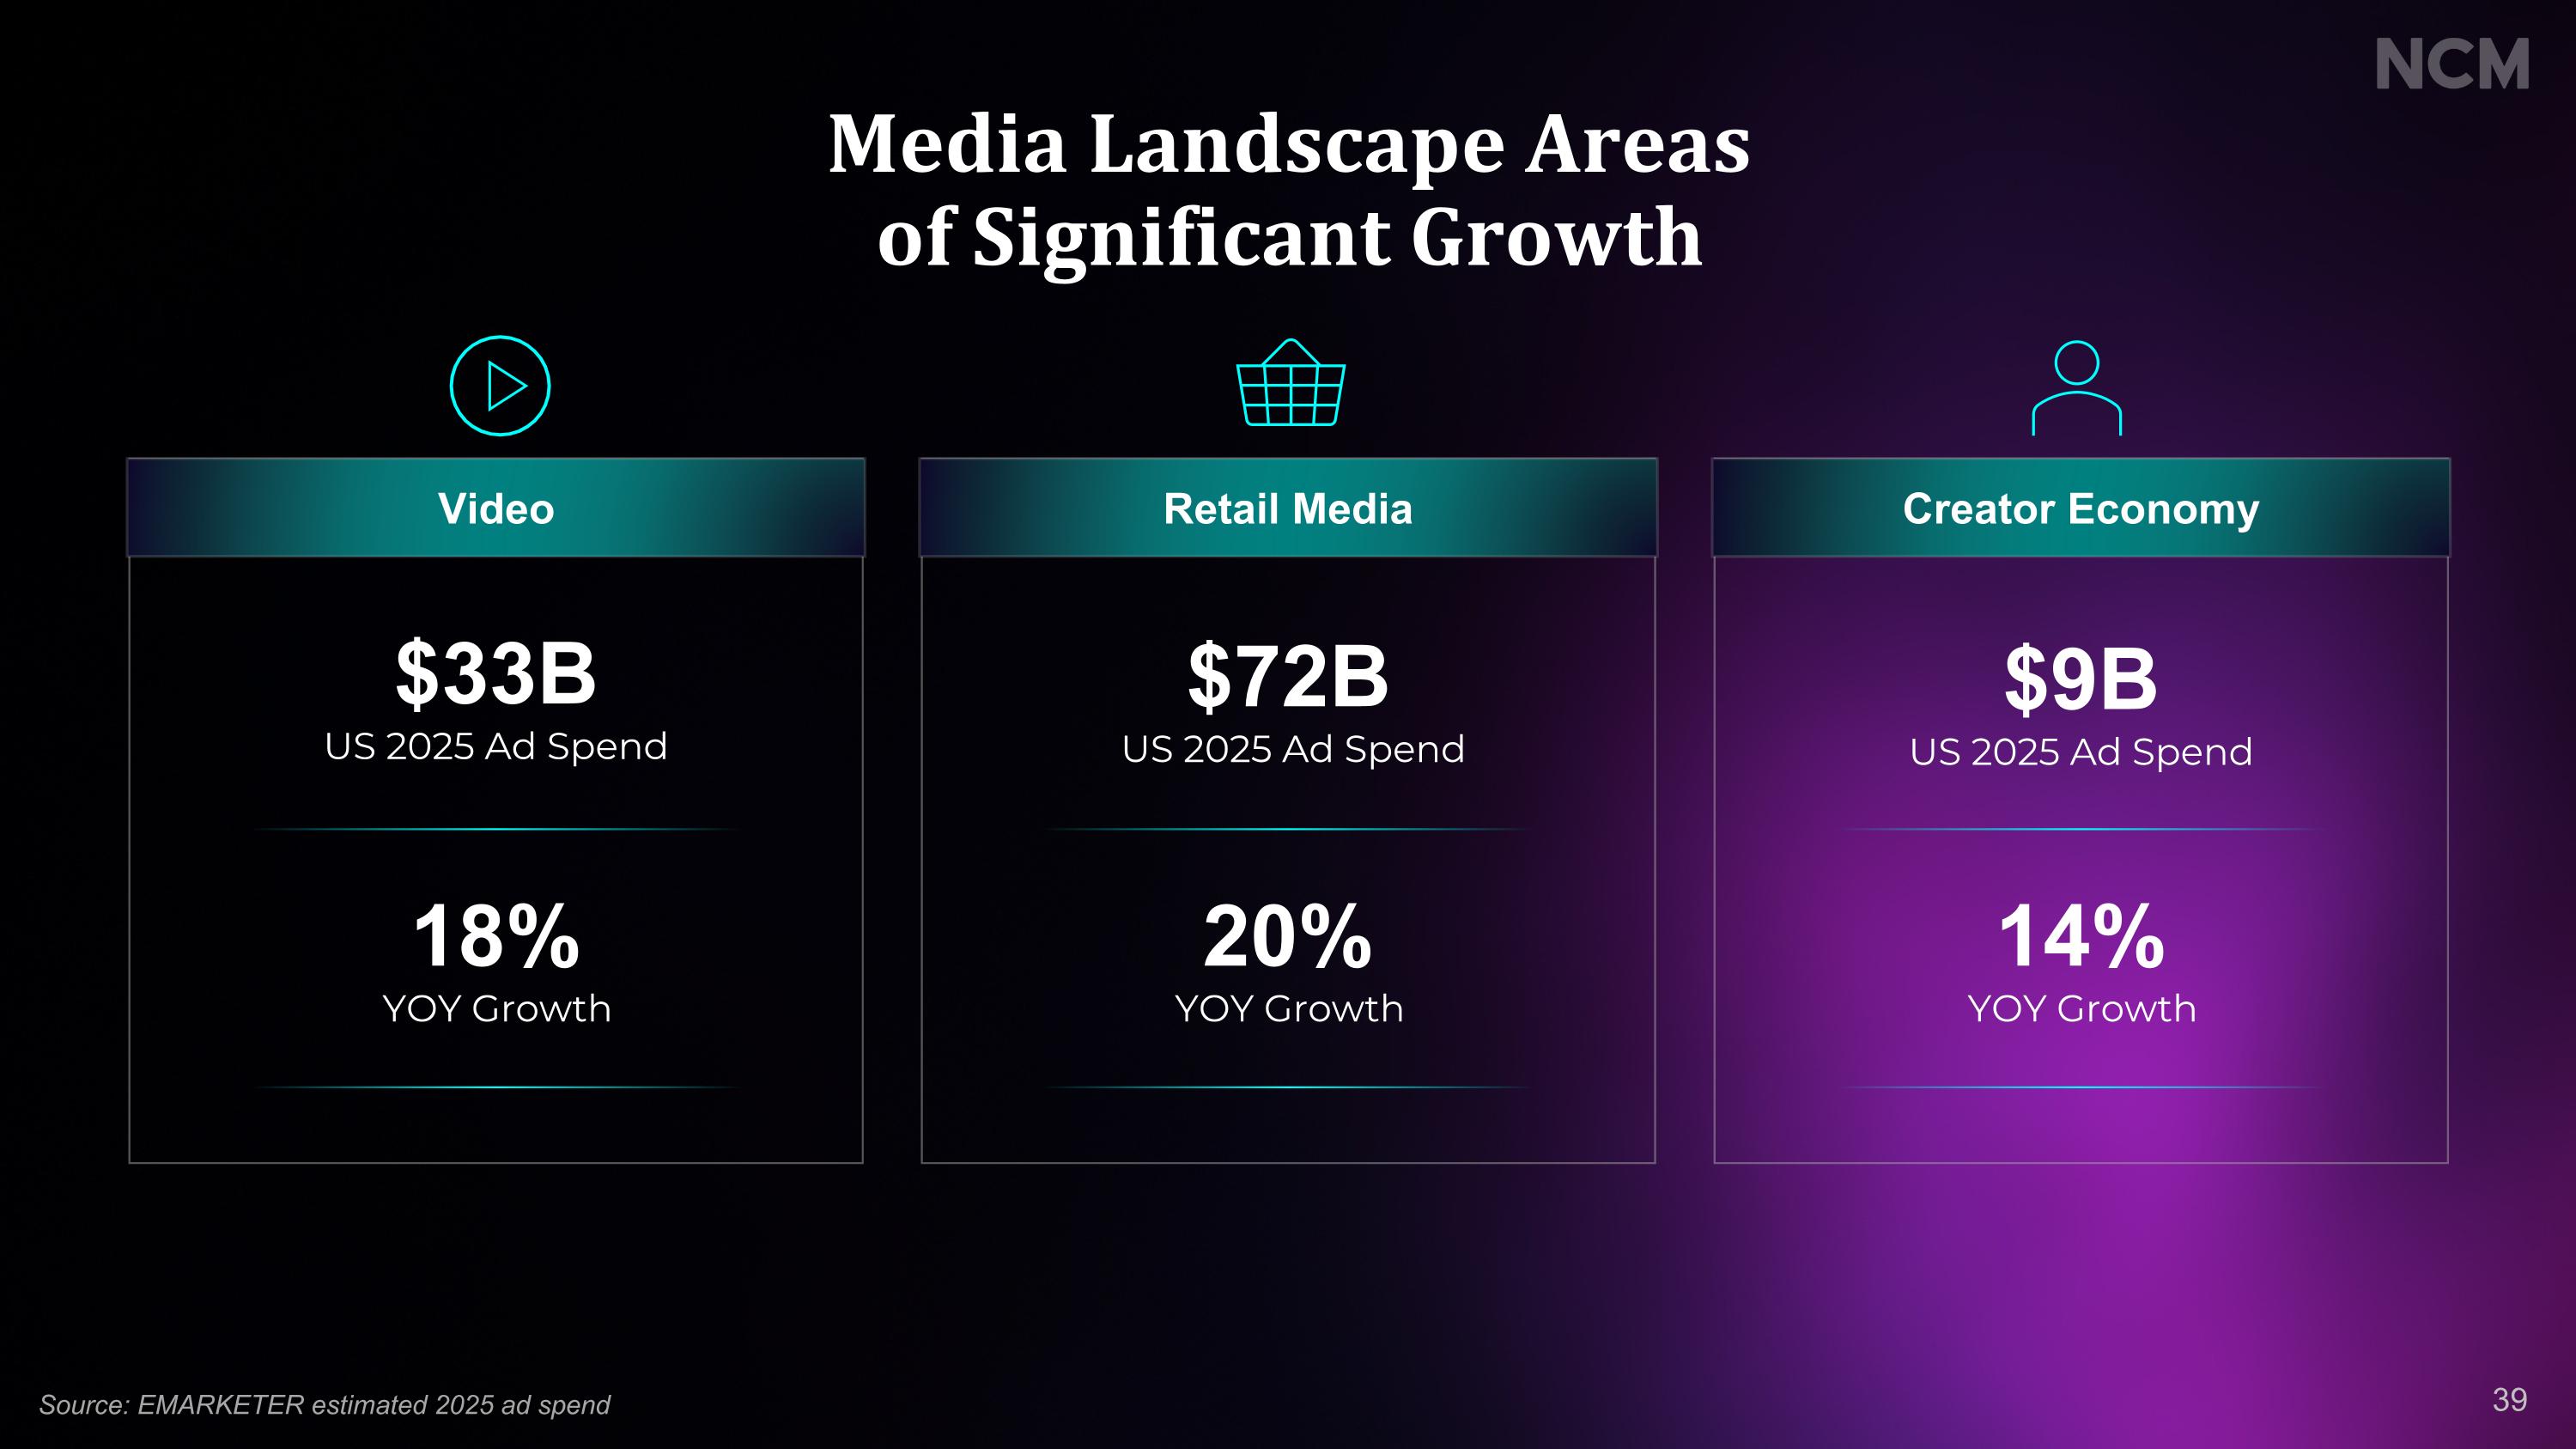
Media Landscape Areas of Significant Growth $33B US 2025 Ad Spend 18% YOY Growth Video $72B US 2025 Ad Spend 20% YOY Growth Retail Media $9B US 2025 Ad Spend 14% YOY Growth Creator Economy 39 Source: EMARKETER estimated 2025 ad spend

Harnessing a Growing Opportunity Enhancing Capabilities to Compete Positioned to Win NCM’s Unifying Growth Vision 40

Improved Utilization Streamline Ad Sales and Operations Optimized Forecasting 2 1 3 Reporting 4 Self-Serve and Programmatic 5 Investment inTech Fueled Improvementto Our Platform 41

Enhancing Our Ability to Convert & Activate Concentrated Coverage Across the Top 25 Selected DMAs Local National Relaunched with New Platform Fueled by Real-Time Data Investment Focus for Easy Activation Self-Serve Programmatic 42
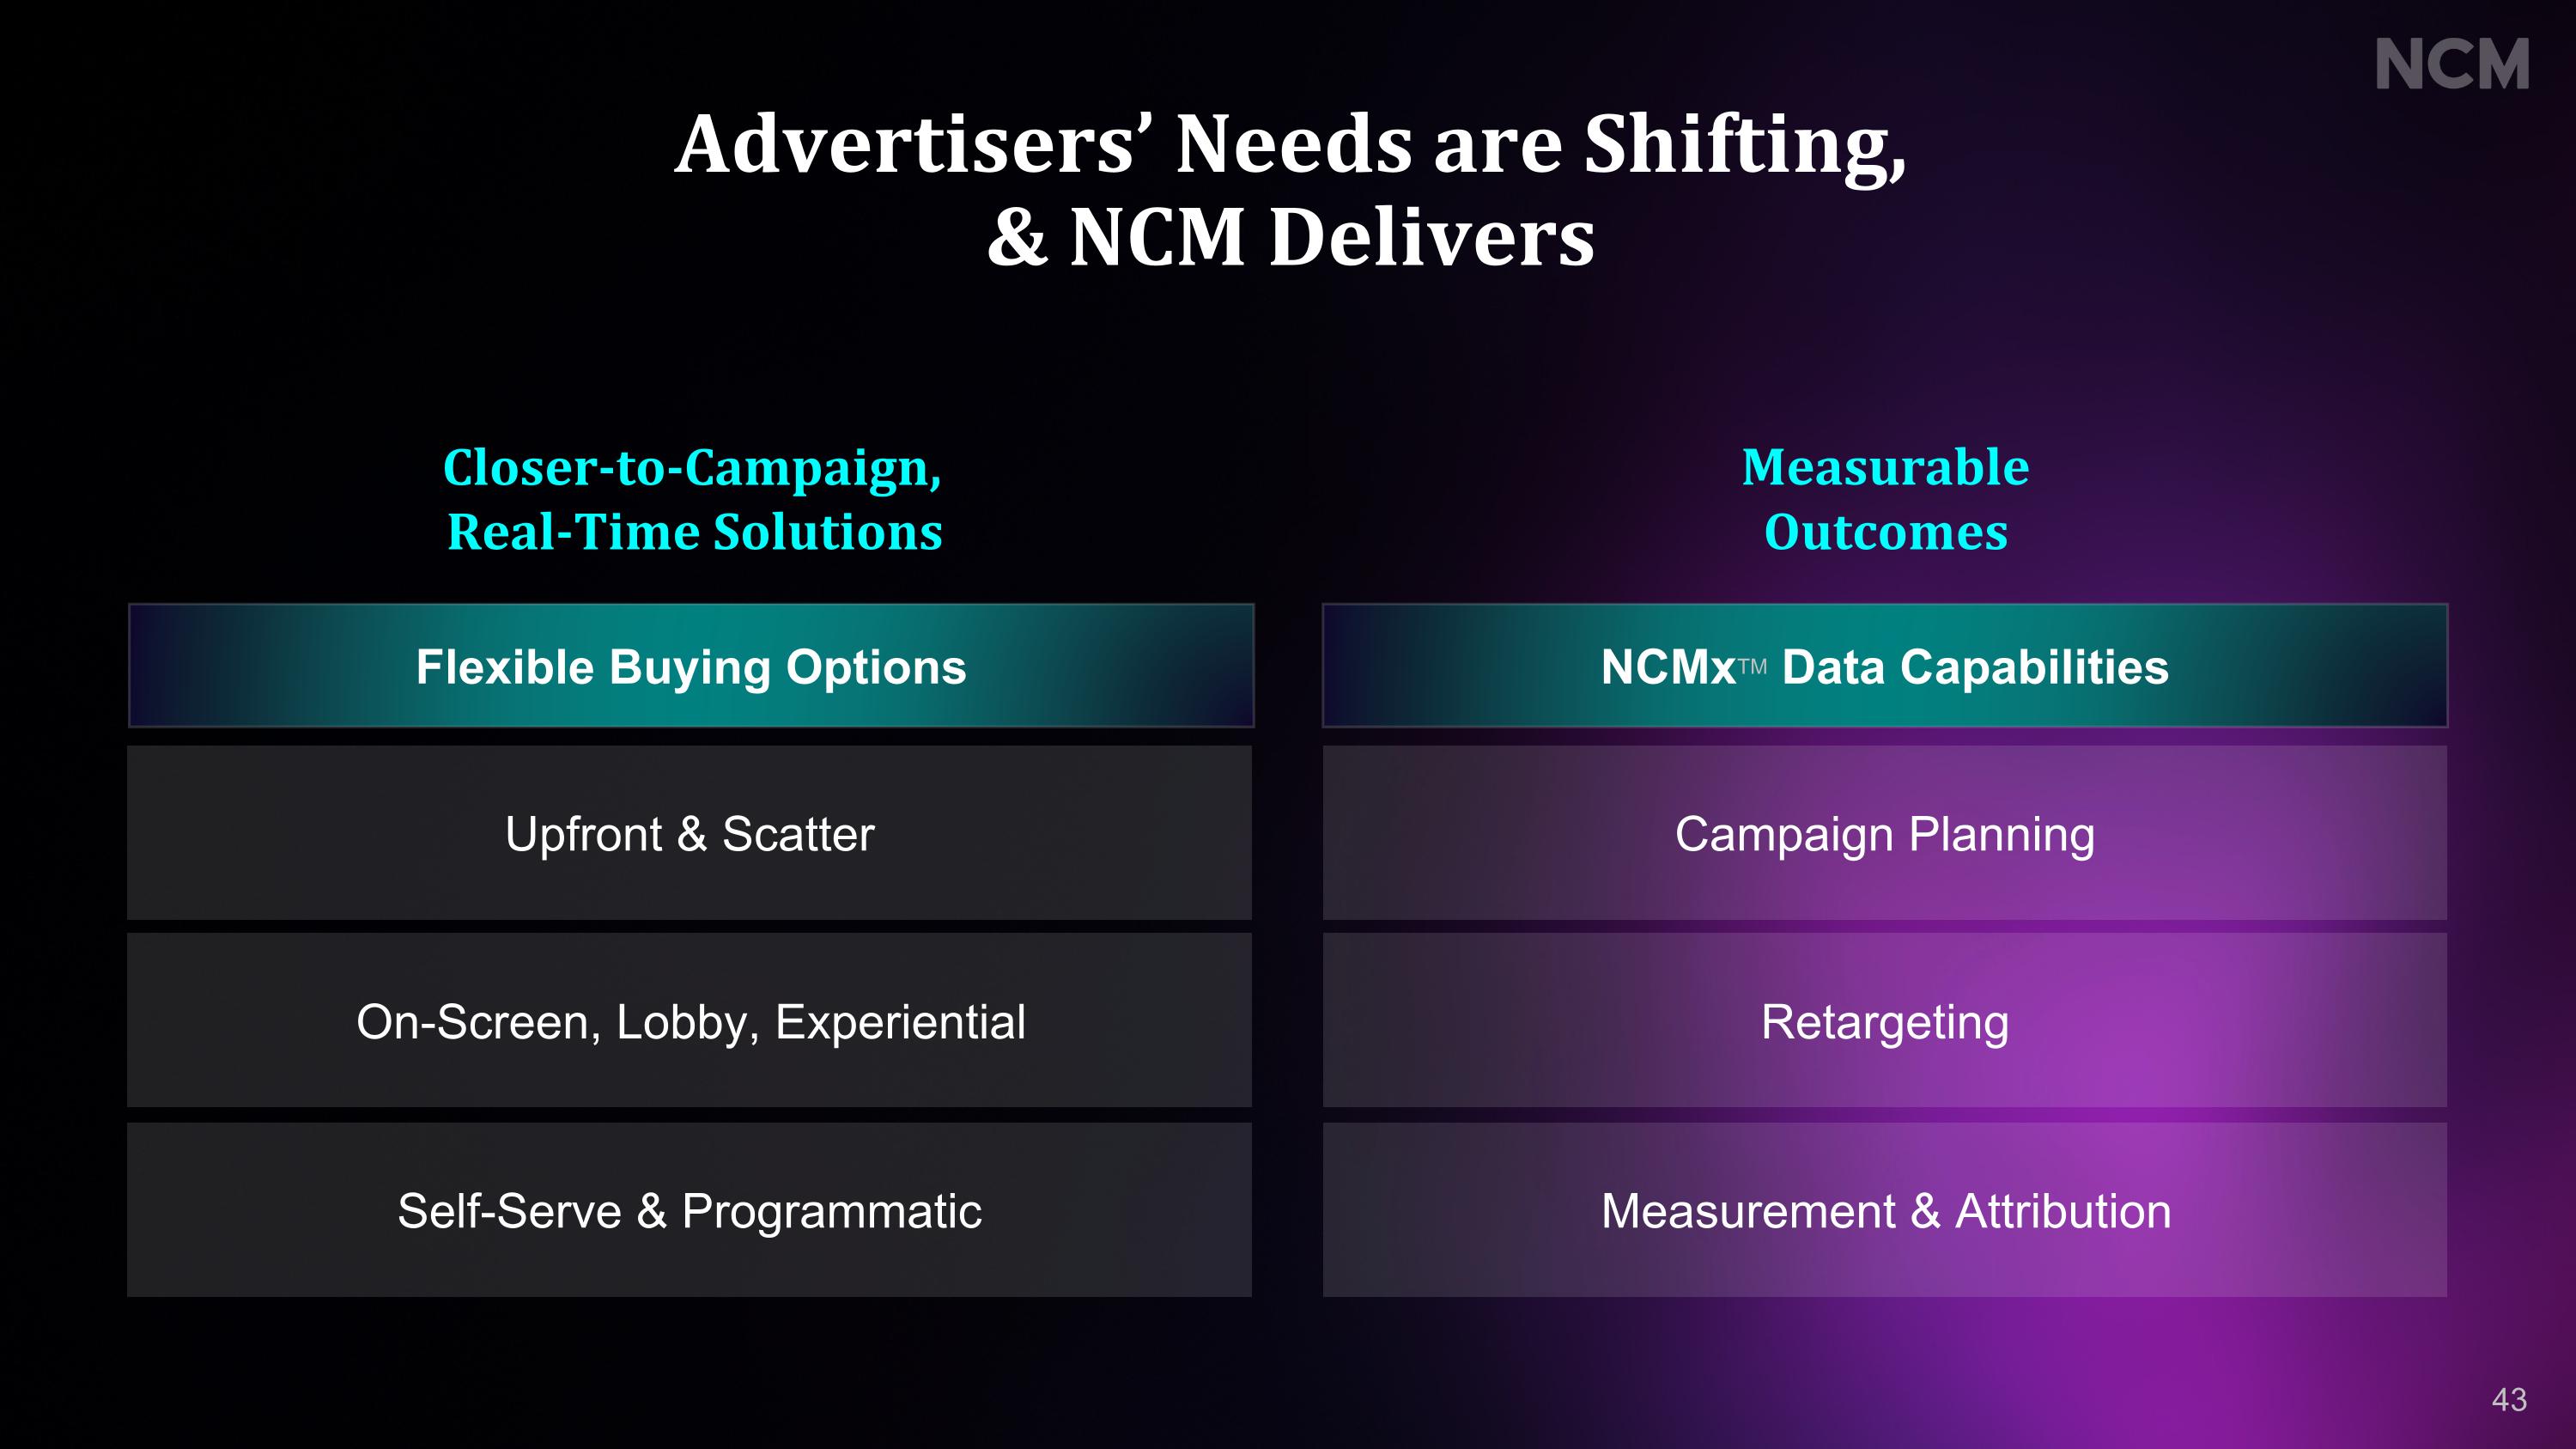
Closer-to-Campaign, Real-Time Solutions Measurable Outcomes Advertisers’ Needs are Shifting, & NCM Delivers Flexible Buying Options NCMxTM Data Capabilities On-Screen, Lobby, Experiential Self-Serve & Programmatic Upfront & Scatter Campaign Planning Retargeting Measurement & Attribution 43

New Partnerships Driving Growth 44


Harnessing a Growing Opportunity Enhancing Capabilities to Compete Positioned to Win NCM’s Unifying Growth Vision 46
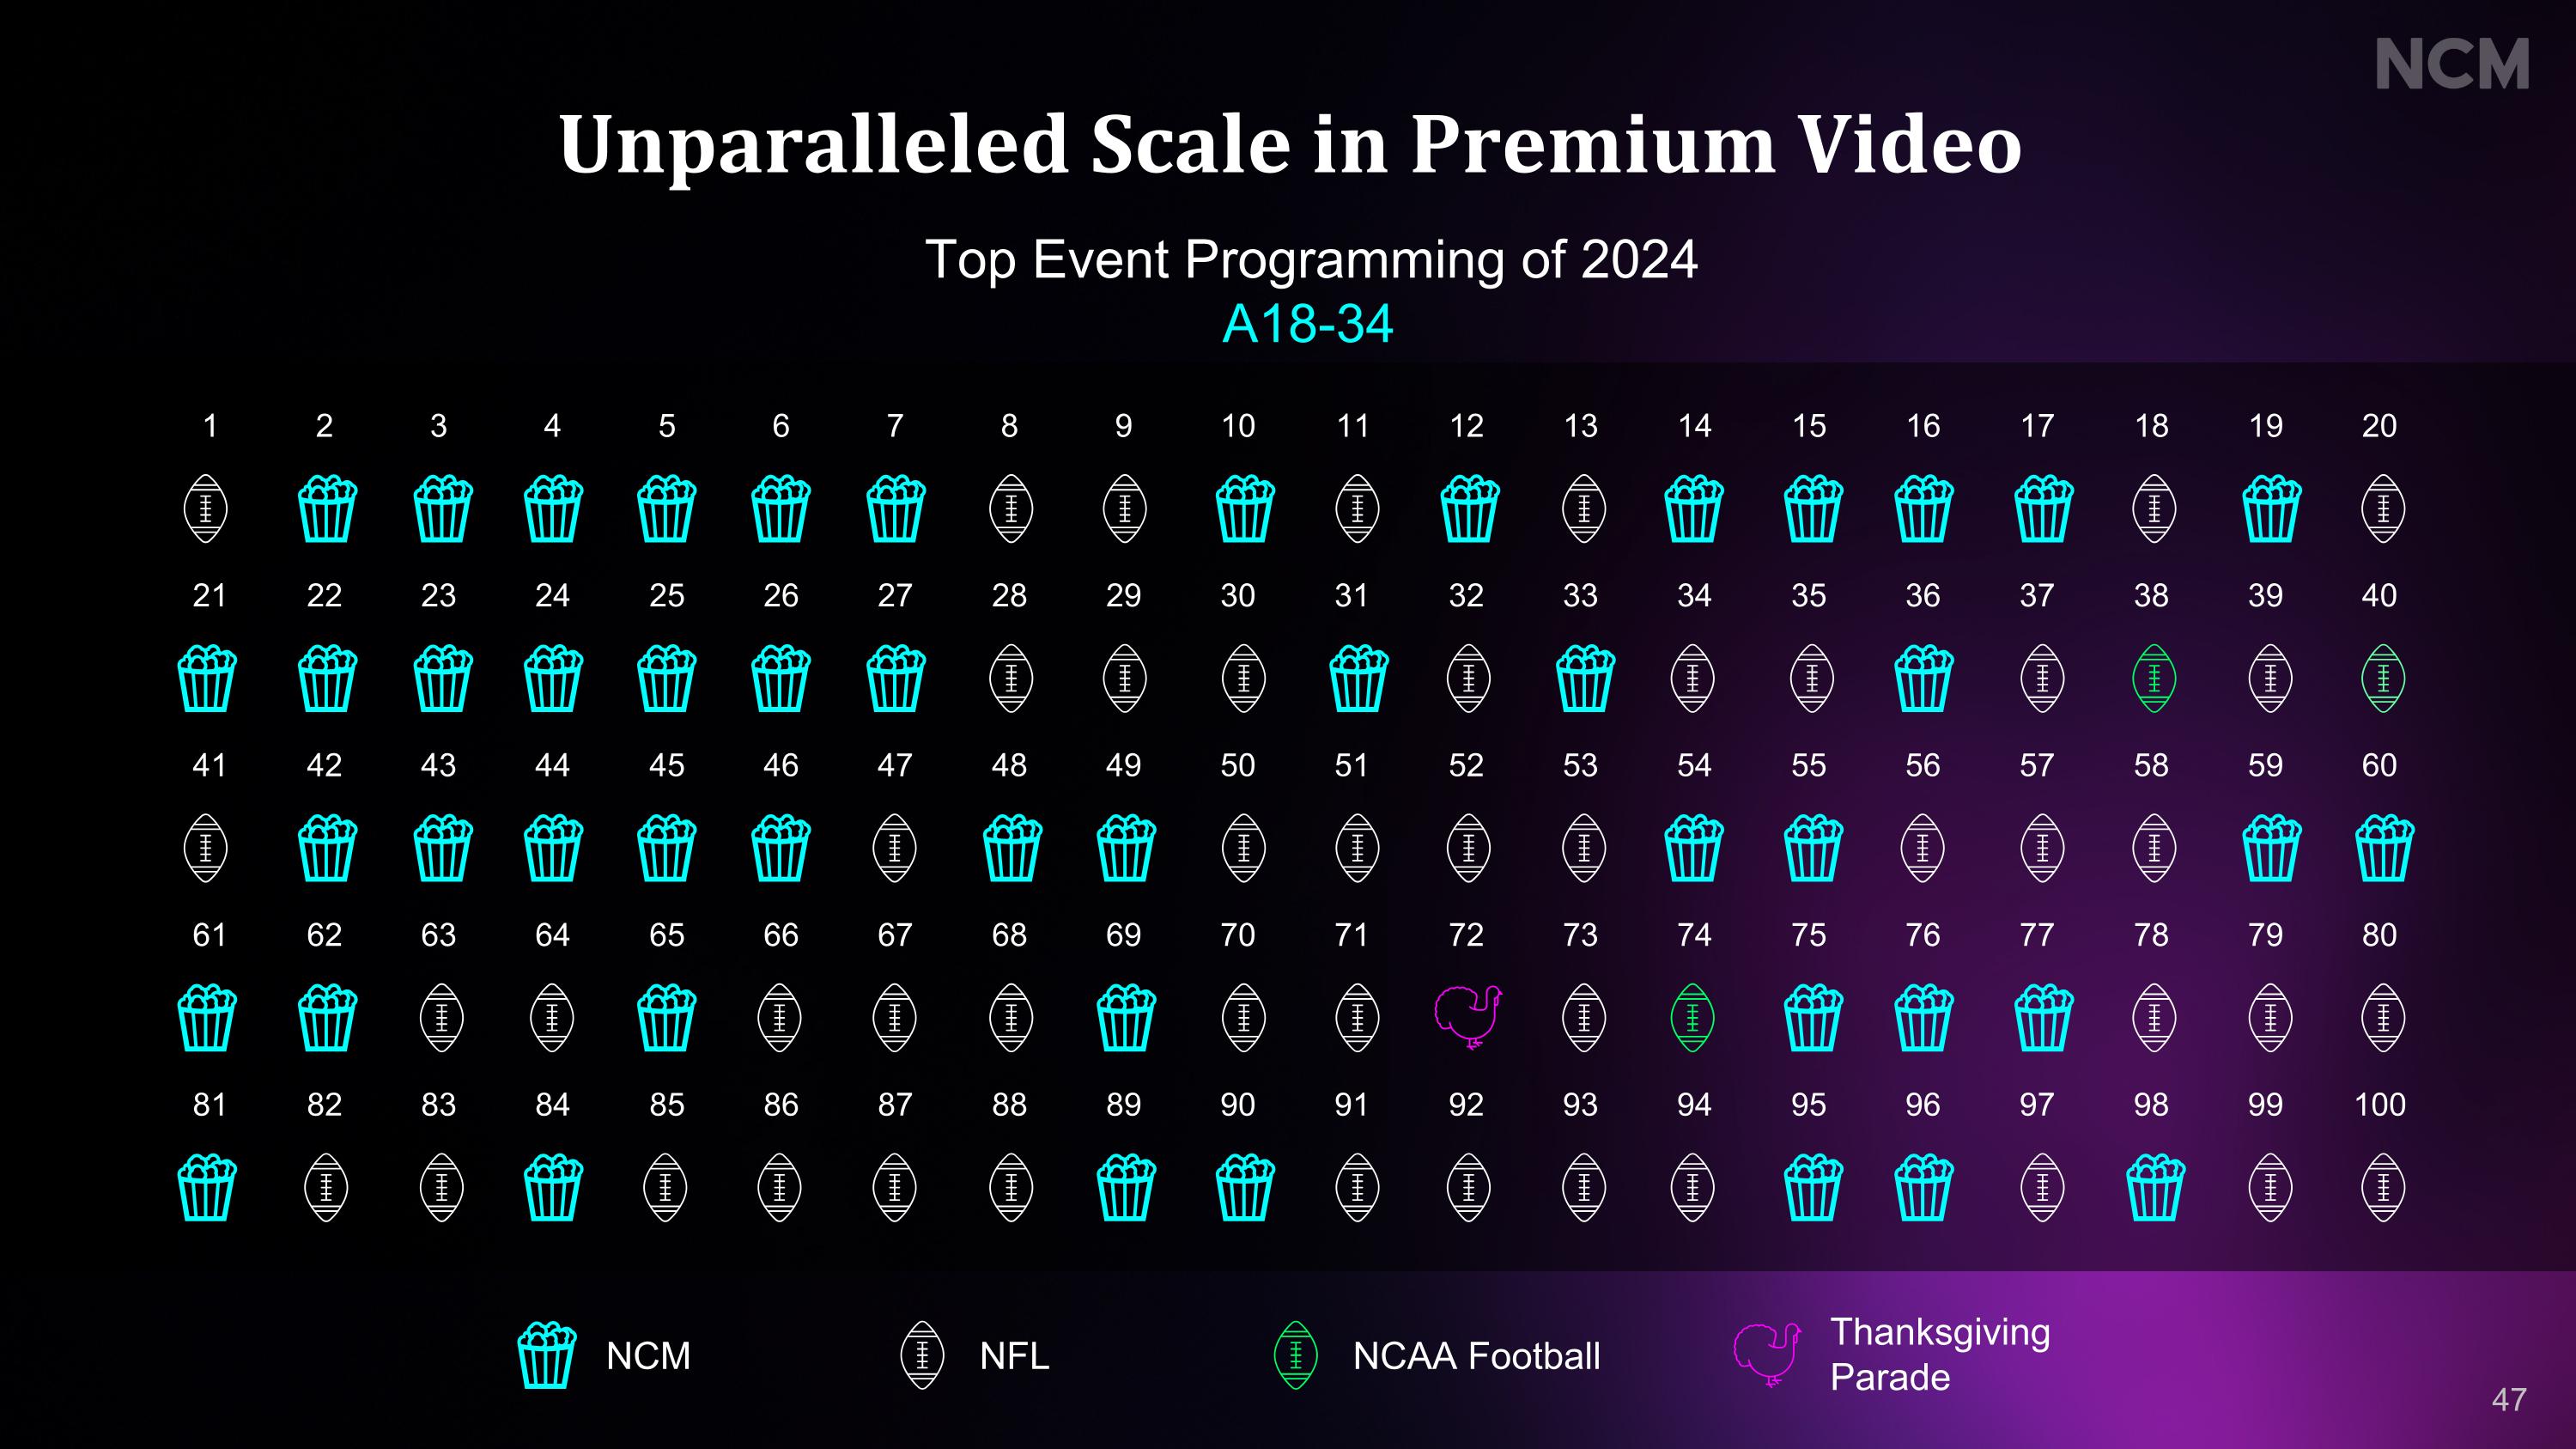
1 2 3 4 5 6 7 8 9 10 11 12 13 14 15 16 17 18 19 20 21 22 23 24 25 26 27 28 29 30 31 32 33 34 35 36 37 38 39 40 41 42 43 44 45 46 47 48 49 50 51 52 53 54 55 56 57 58 59 60 61 62 63 64 65 66 67 68 69 70 71 72 73 74 75 76 77 78 79 80 81 82 83 84 85 86 87 88 89 90 91 92 93 94 95 96 97 98 99 100 NCM NFL NCAA Football Thanksgiving Parade Unparalleled Scale in Premium Video Top Event Programming of 2024 A18-34 47

Weekly Average Ratings Crushing CTV A18-34 48 Source: Nielsen NPOWER, Live+7, Linear+Digital+VOD, 2024; The People Platform, Cinema Data, Box Office Mojo 2024

26% of the reach generated by NCM in any given month is unique Totals (AVOD + SVOD) Unduplicated Audiences at Scale 49 Source: Nielsen Media Impact, 2024 (Demo=A18-49; Unduplicated Audience = % of each network’s reach that is unique to that platform)
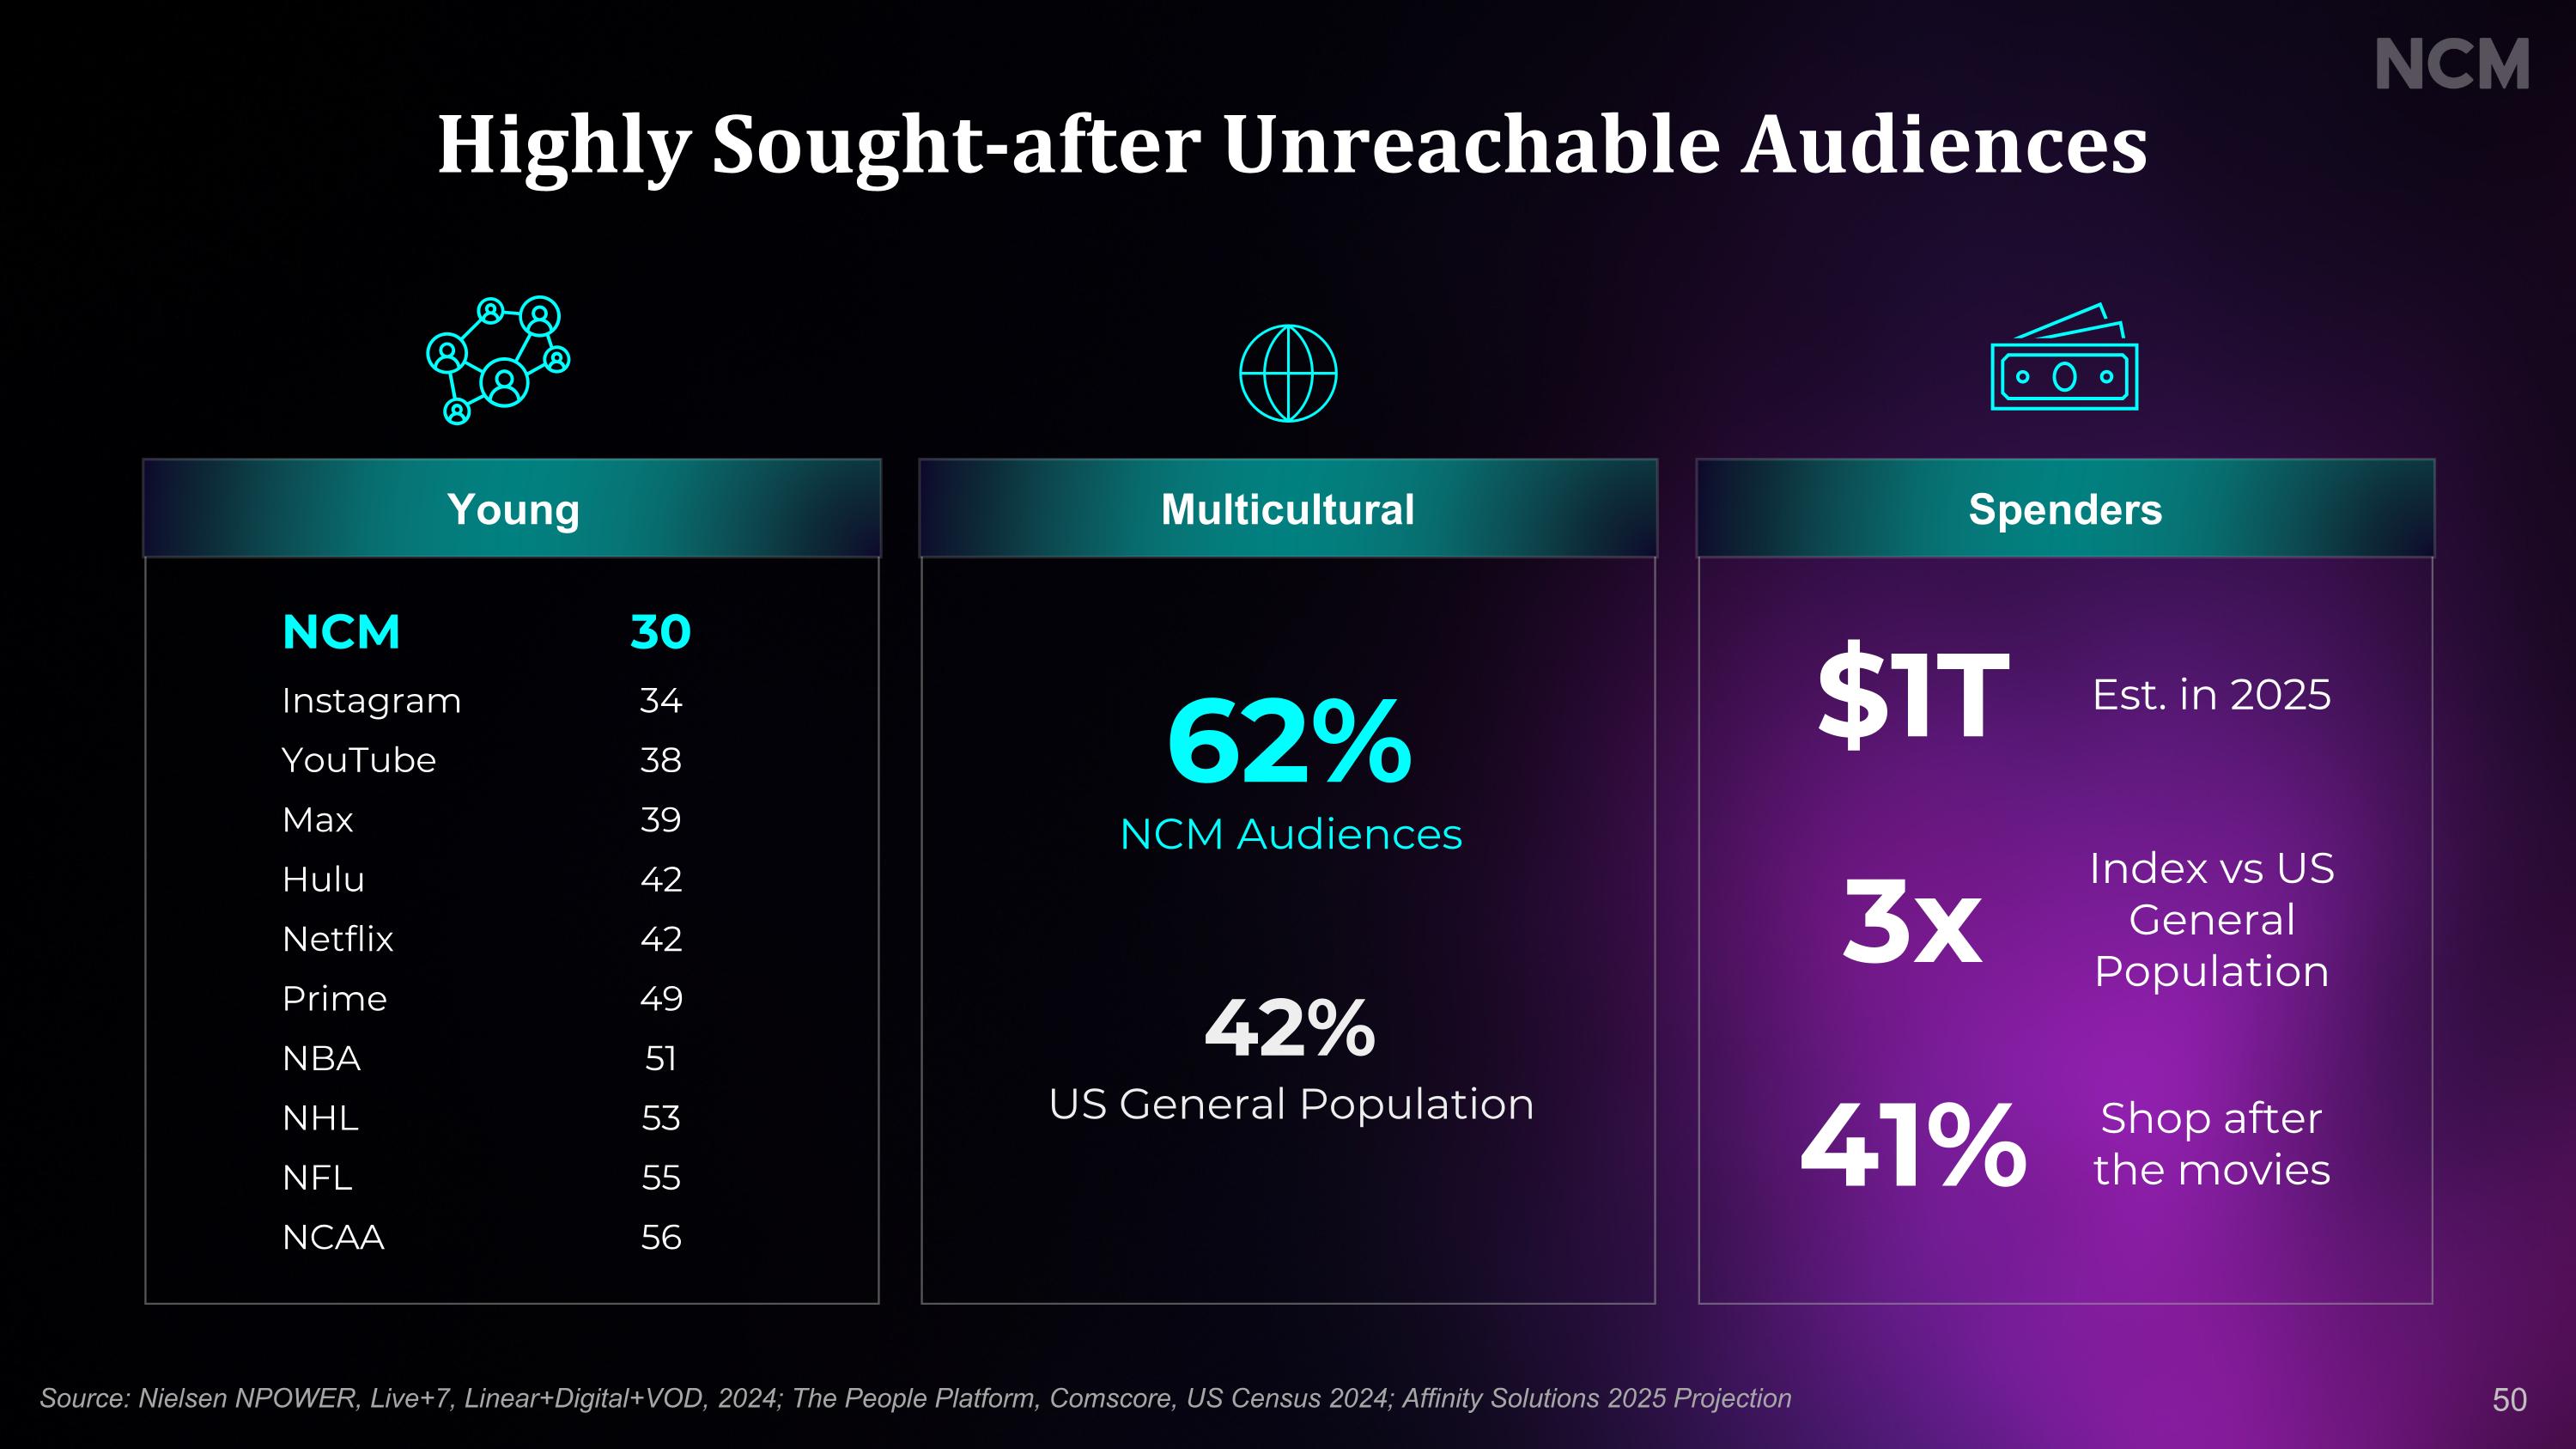
MEDIAN AGE NCM 30 Instagram 34 YouTube 38 Max 39 Hulu 42 Netflix 42 Prime 49 NBA 51 NHL 53 NFL 55 NCAA 56 NCM Audiences 62% 42% US General Population NCM VS US GENERAL POPULATION NCM MOVIEGOER SPENDING $1T Est. in 2025 3x Index vs US General Population 41% Shop after the movies Highly Sought-after Unreachable Audiences Young Multicultural Spenders 50 Source: Nielsen NPOWER, Live+7, Linear+Digital+VOD, 2024; The People Platform, Comscore, US Census 2024; Affinity Solutions 2025 Projection

(seconds watched) Unmatched Attention 30-Second Ads (seconds watched) NCM’s Ad Recall Advantage :60 Linear Live Sports Premium AVOD 3x 5x 5x 5x 6x 2x 3x :30 51 Source: NCM/Lumen Attention Study Oct 8-12, 2023, N=364 A18+; TVision Norms Oct 2022-Oct 2023 *Any live sports event airing during the period inclusive of playoffs and championship games like the Super Bowl Lumen/Holdco proprietary Audio/Social/Digital 2023 study
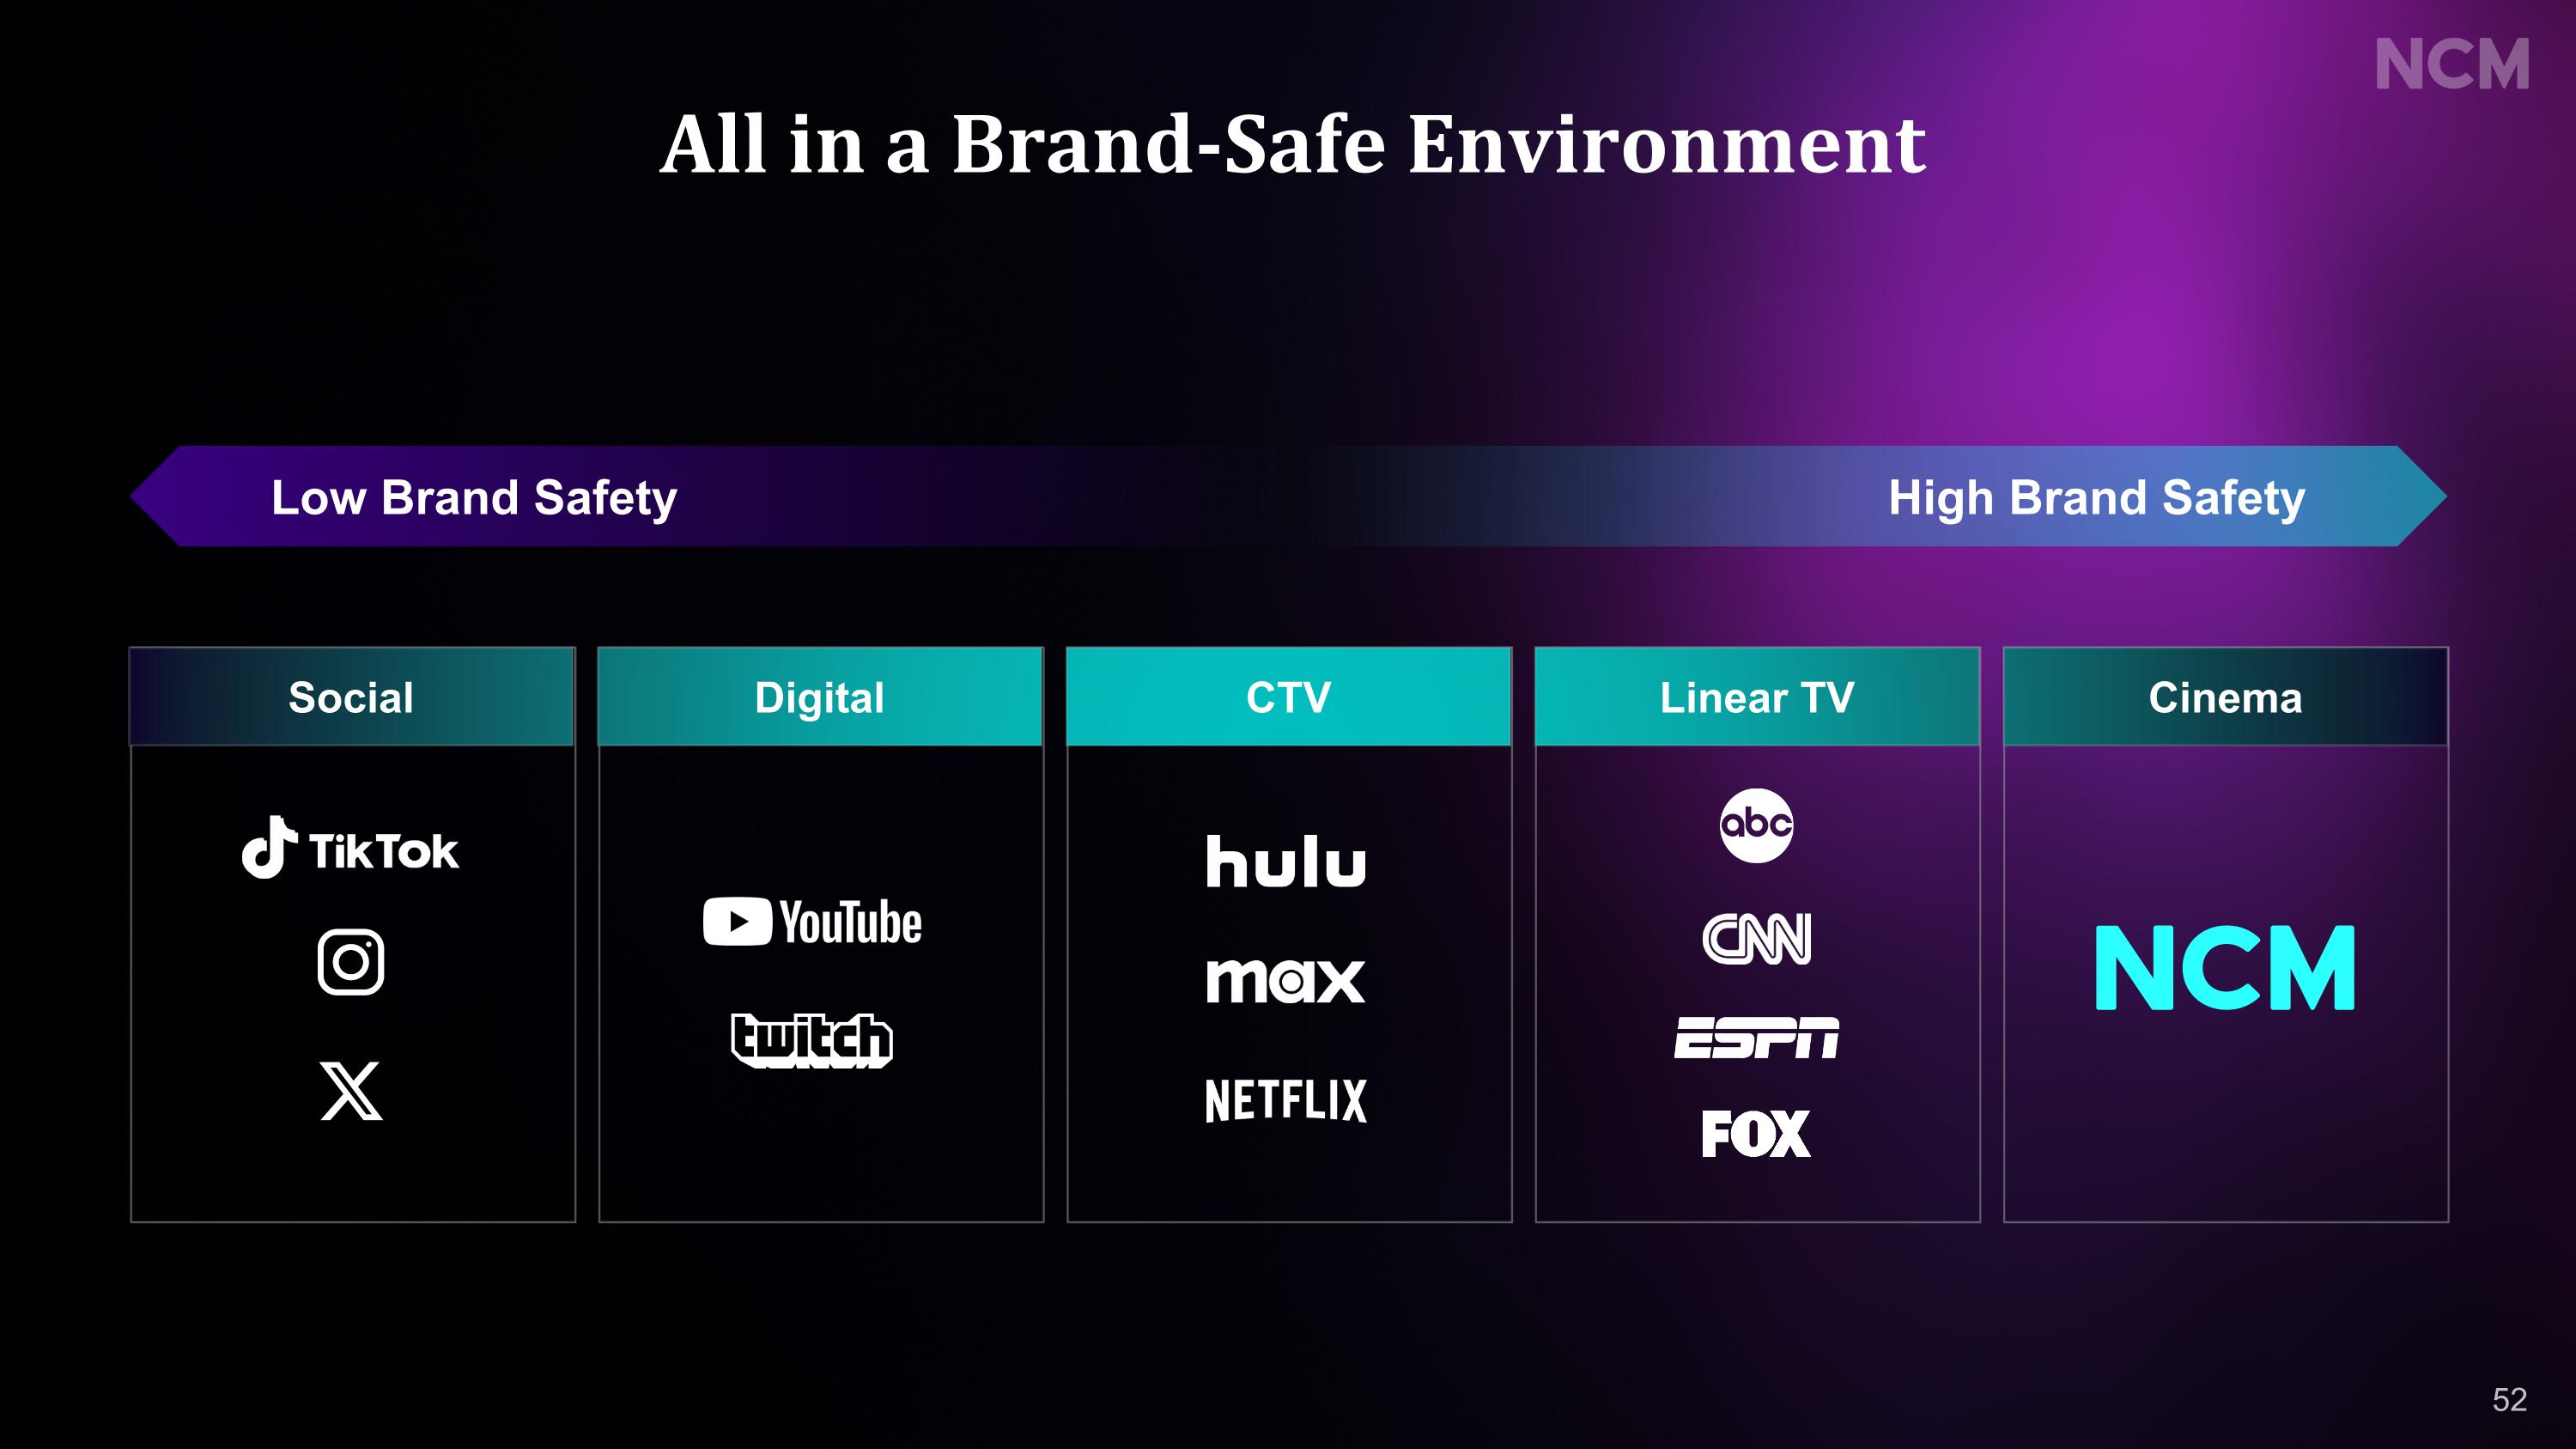
All in a Brand-Safe Environment Social Digital CTV Linear TV Cinema High Brand Safety Low Brand Safety 52

NCM Linear TV Sports Premium AVOD FAST Nets Social Median Age 30 61 55 43 53 32 Attention Score 83% 16% 35% 27% 25% 9% A18-34 Avg Rating 6.8 0.8 1.1 2.6 0.4 -- Audience, Attention, RatingsKey Drivers of Growth 53


LeveragingData to Drive ProfitableGrowth Manu Singh Chief Data & Innovation Officer

Content is King. Audience is Key. Data is the Box Office Gold. 56
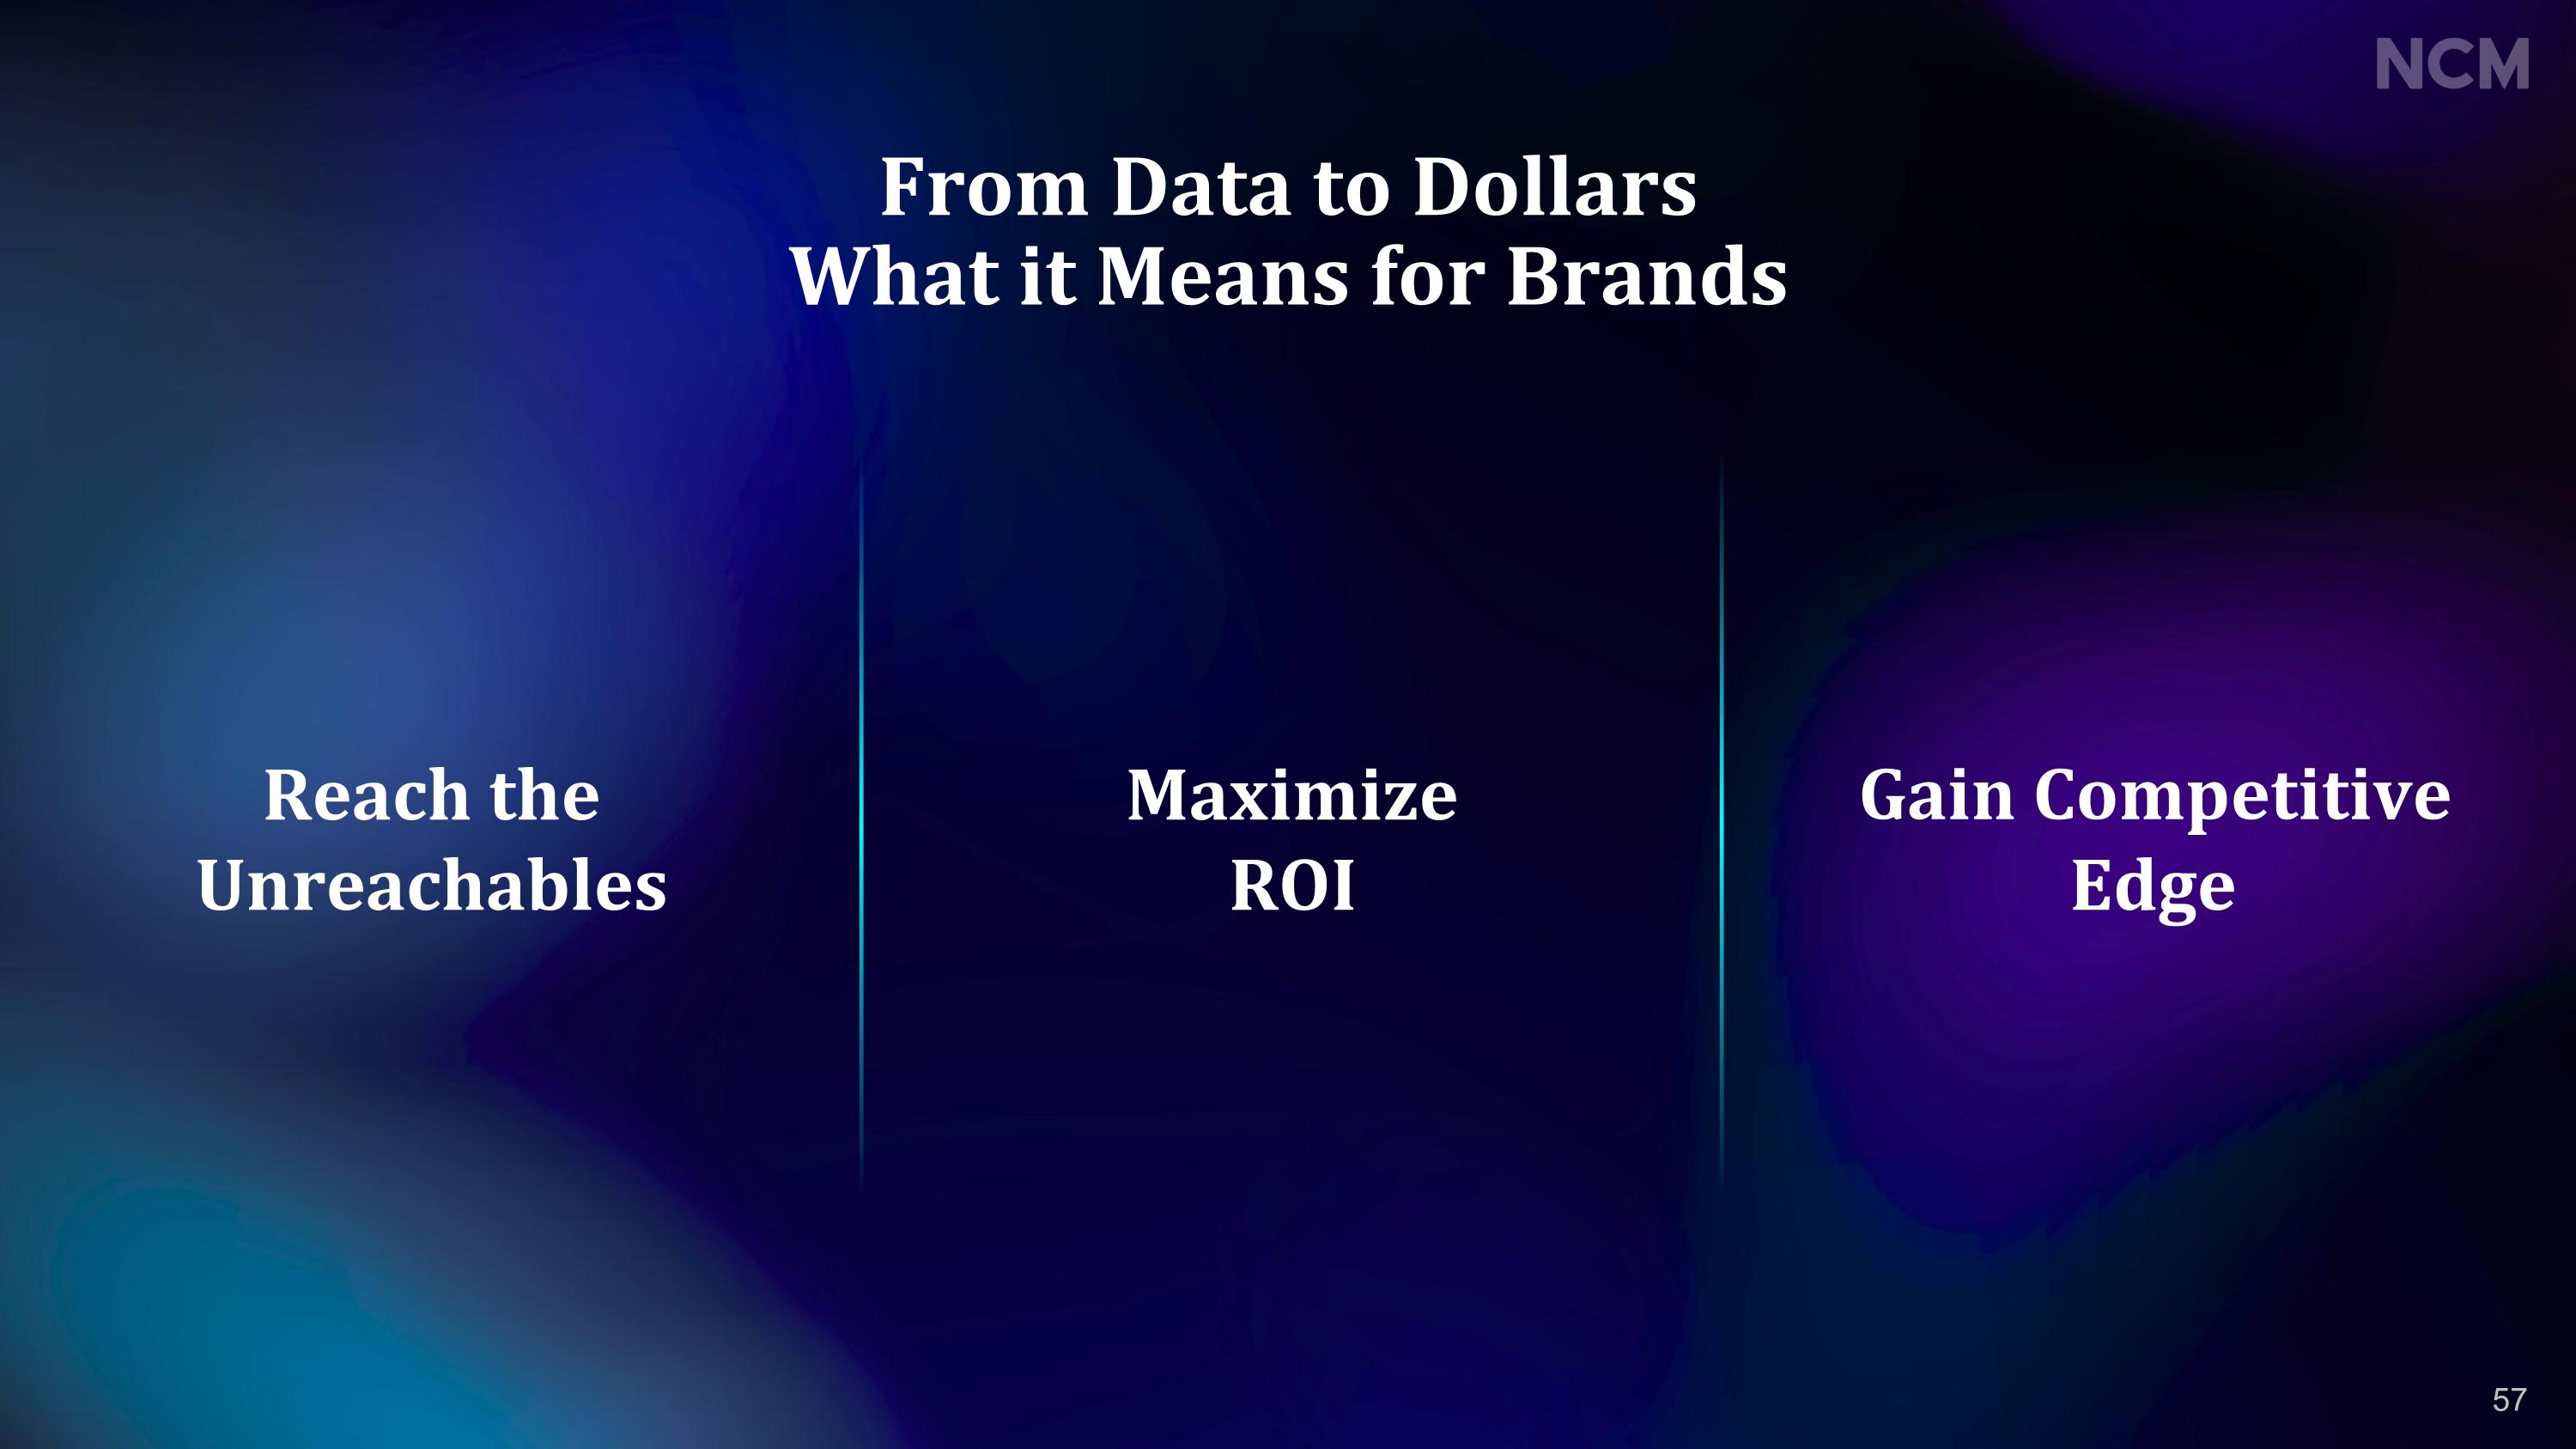
Reach the Unreachables MaximizeROI Gain Competitive Edge From Data to DollarsWhat it Means for Brands 57
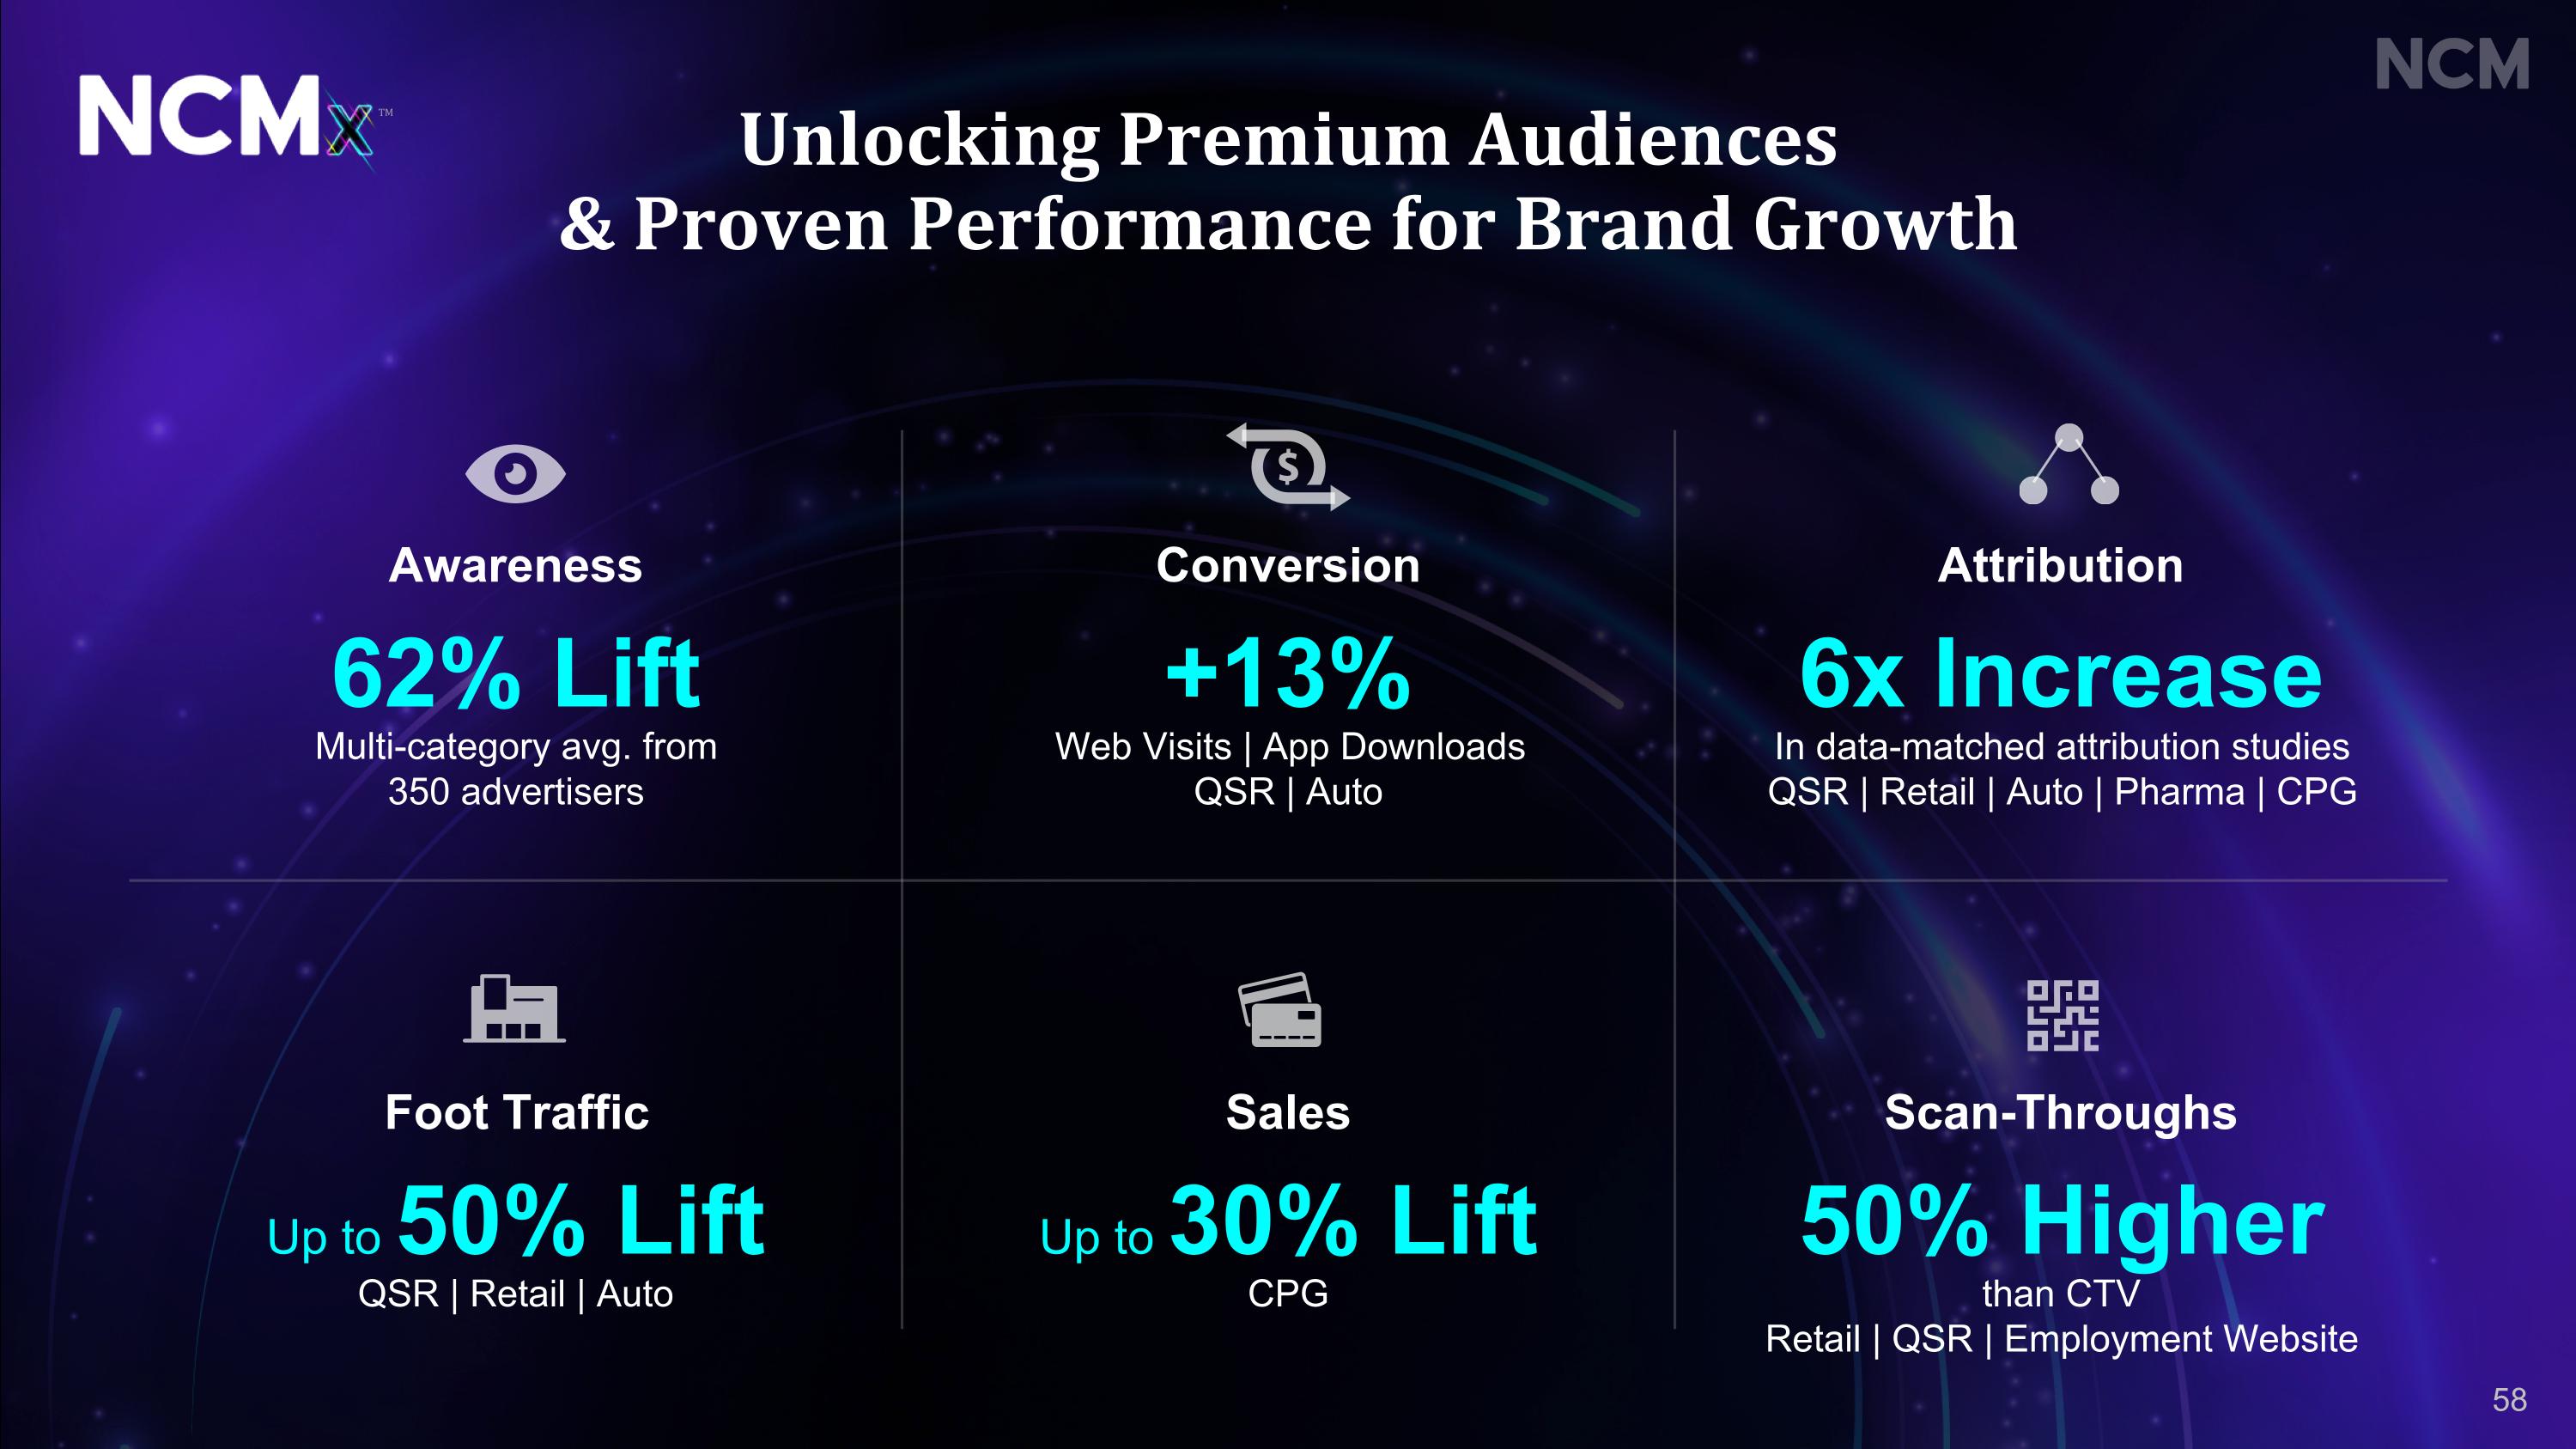
Awareness Multi-category avg. from 350 advertisers Unlocking Premium Audiences & Proven Performance for Brand Growth Conversion Web Visits | App DownloadsQSR | Auto Attribution In data-matched attribution studies QSR | Retail | Auto | Pharma | CPG Foot Traffic QSR | Retail | Auto Sales CPG Scan-Throughs than CTV Retail | QSR | Employment Website TM 62% Lift +13% 6x Increase Up to 50% Lift Up to 30% Lift 50% Higher 58

PRE-TRAILERRELEASE Social ListeningCollection TRAILERDROP PlanningAudience Analysis CONSUMERACTION Measurement Attribution KPIs Met LOBBYEXCITEMENT Experiential High-impact Lobbies LEN Screens Foot Traffic Data PRE-SHOW On-screen With QR Code Omnichannel Retargeting NCMx Boost RETARGETING TARGETED REMINDERS Reminder Messaging Text Reminders after movie FEAUTREFILM Contextual Advertising Moviegoer exposure data by title Moviegoer Data Journey 59
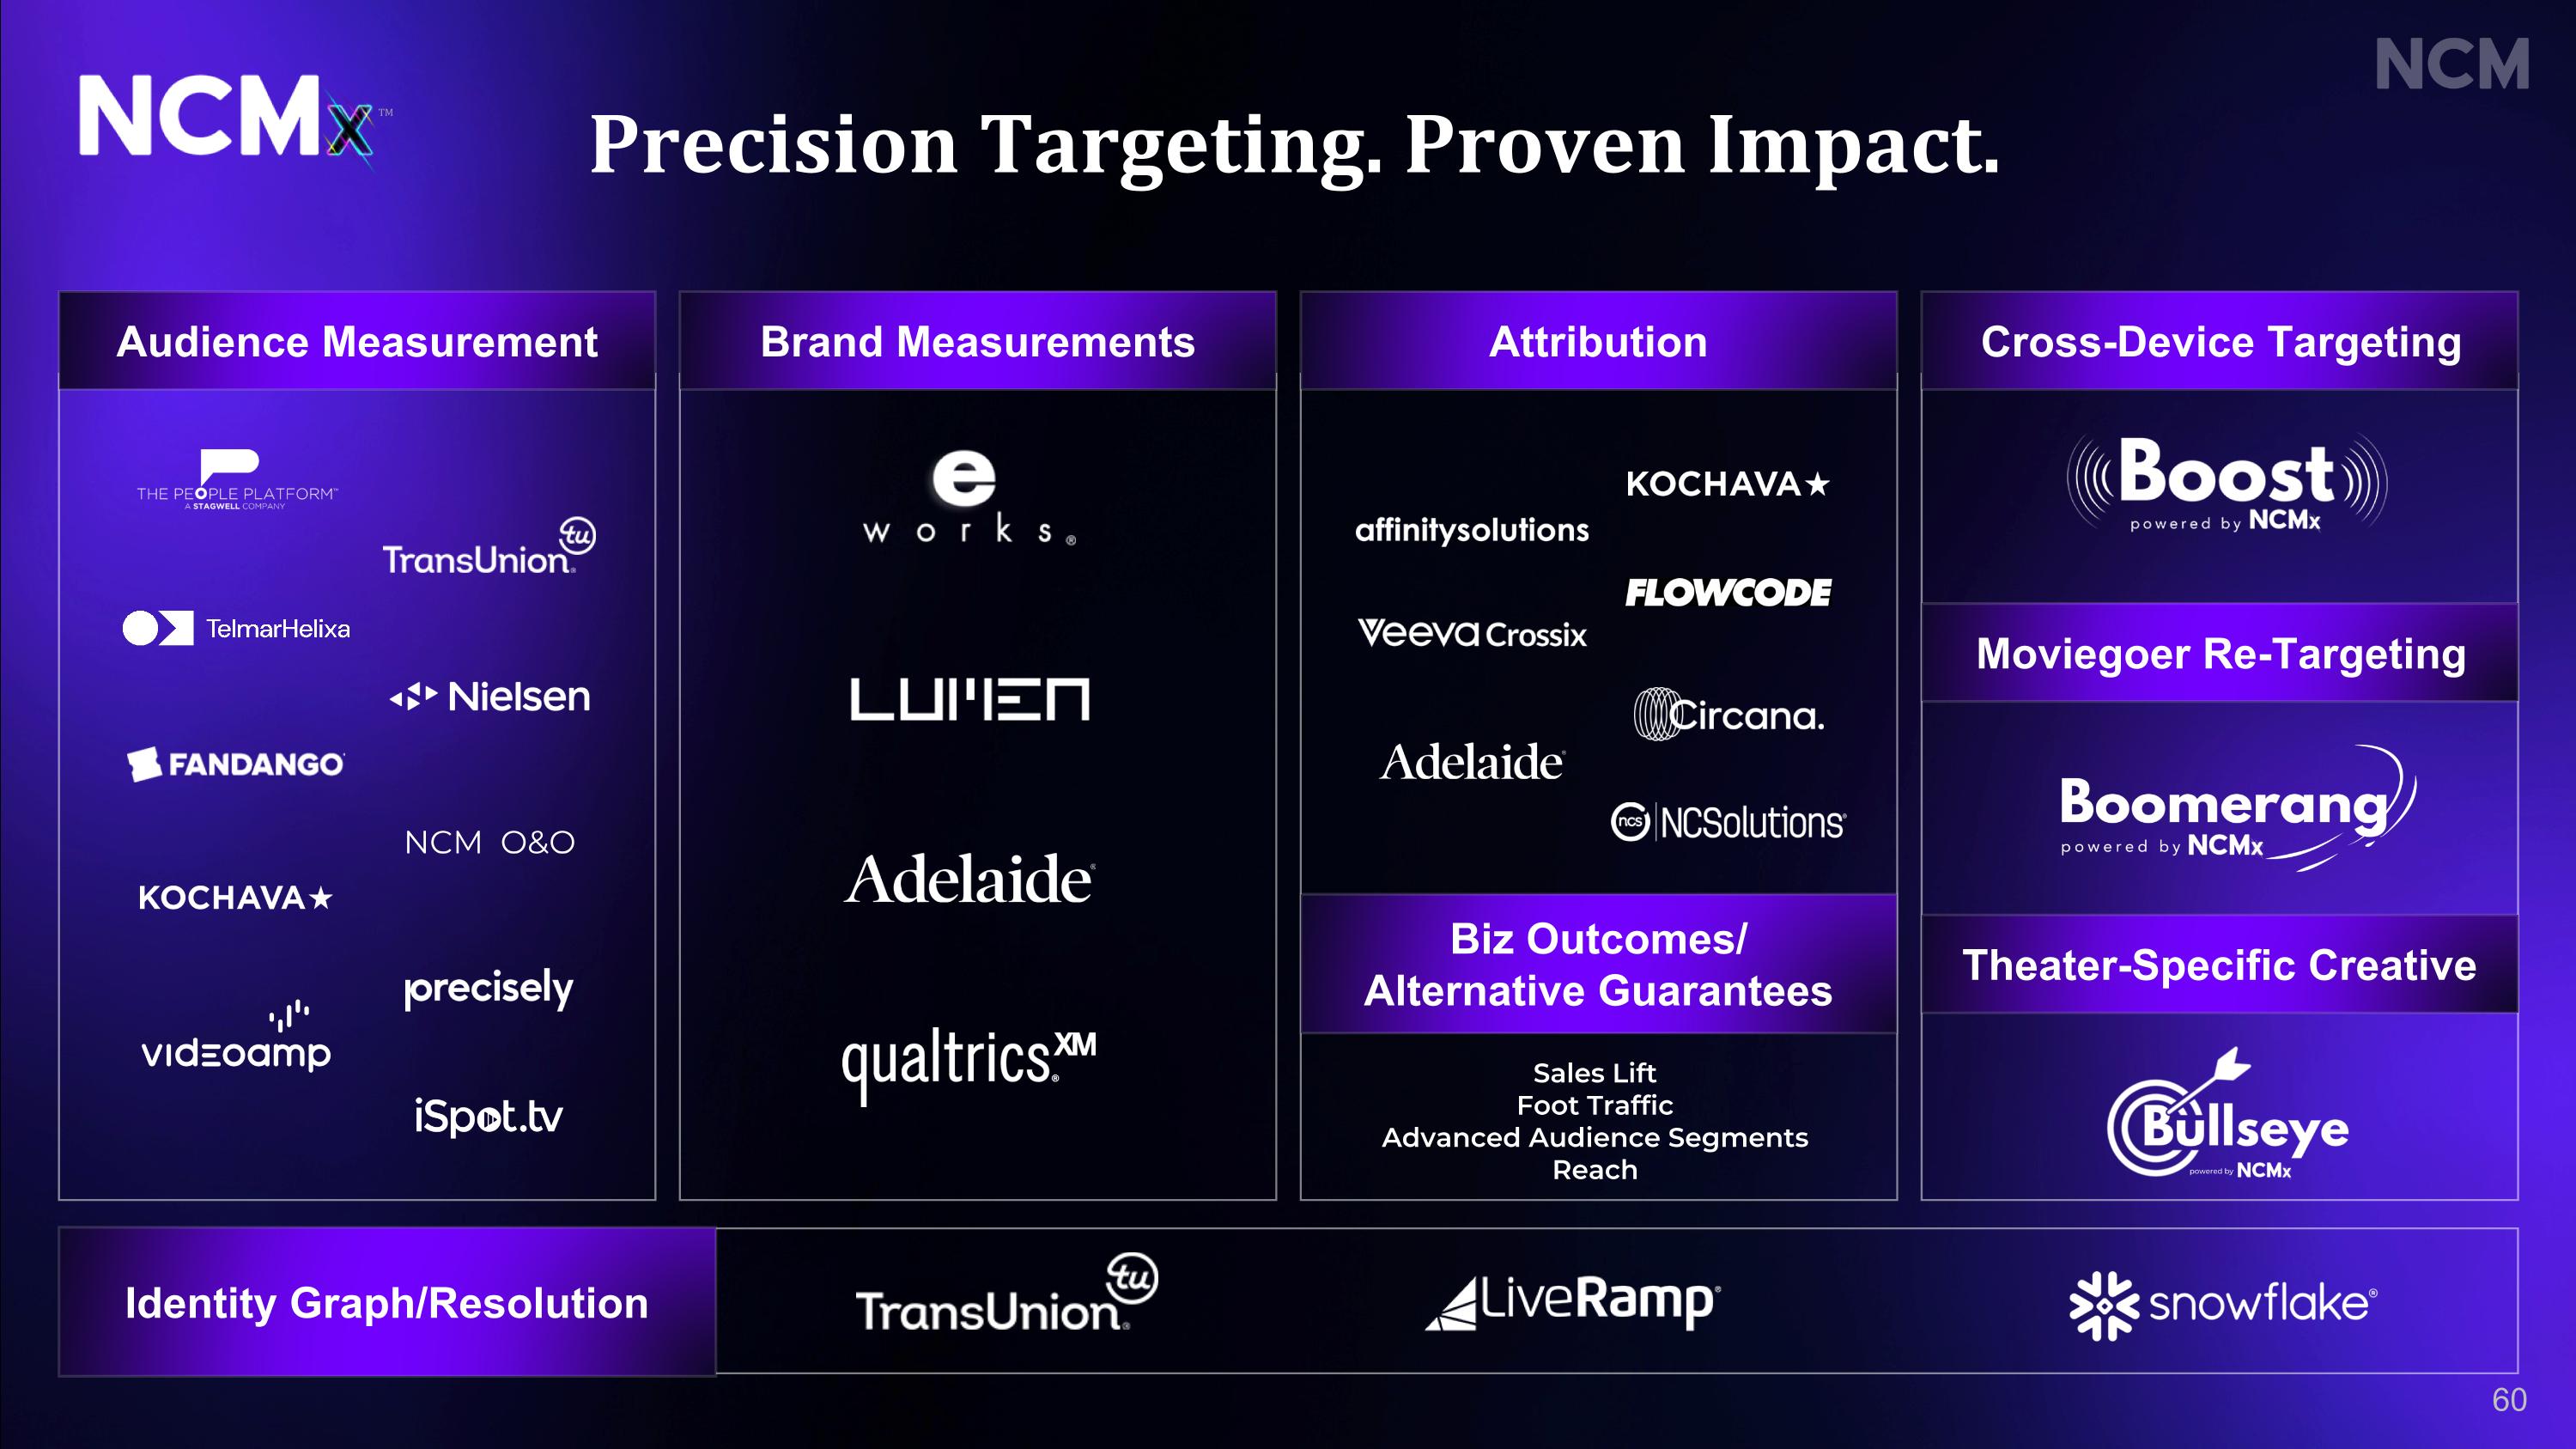
Precision Targeting. Proven Impact. NCM O&O Sales Lift Foot Traffic Advanced Audience Segments Reach Audience Measurement Brand Measurements Attribution Cross-Device Targeting Identity Graph/Resolution Biz Outcomes/ Alternative Guarantees Theater-Specific Creative Moviegoer Re-Targeting TM 60

From Data to Seats Predicting Who’s Coming to the Movies 67% Male $108K Average Income 33% Female Retail 128 Auto 113 Dining 113 Key Category Over-indexing 65% A18-34 Psychographic Insights Affinity Score Luxury Brands 1.8x Fashion Influencers 2.4x Home Improvement 1.8x Gamers 1.9x Netizens 3.2x Foodies 2.2x Tech-thusiasts 3.4x Not Bargain Shoppers 2.8x Who’s Watching 61

Mapping the Moviegoer Journey Beyond the Theater $45B 46% go out to eat after the movies $3B Avg 5+ visitsa month $13B $25B 55% of retail visits occur same day as trip to the theater $5B Moviegoers Change Telco Brands Often 170 Index $36B 2X higher avg spendvs US Pop $5B Over 3MM active permits near theaters Gas Station / Convenience Store 62
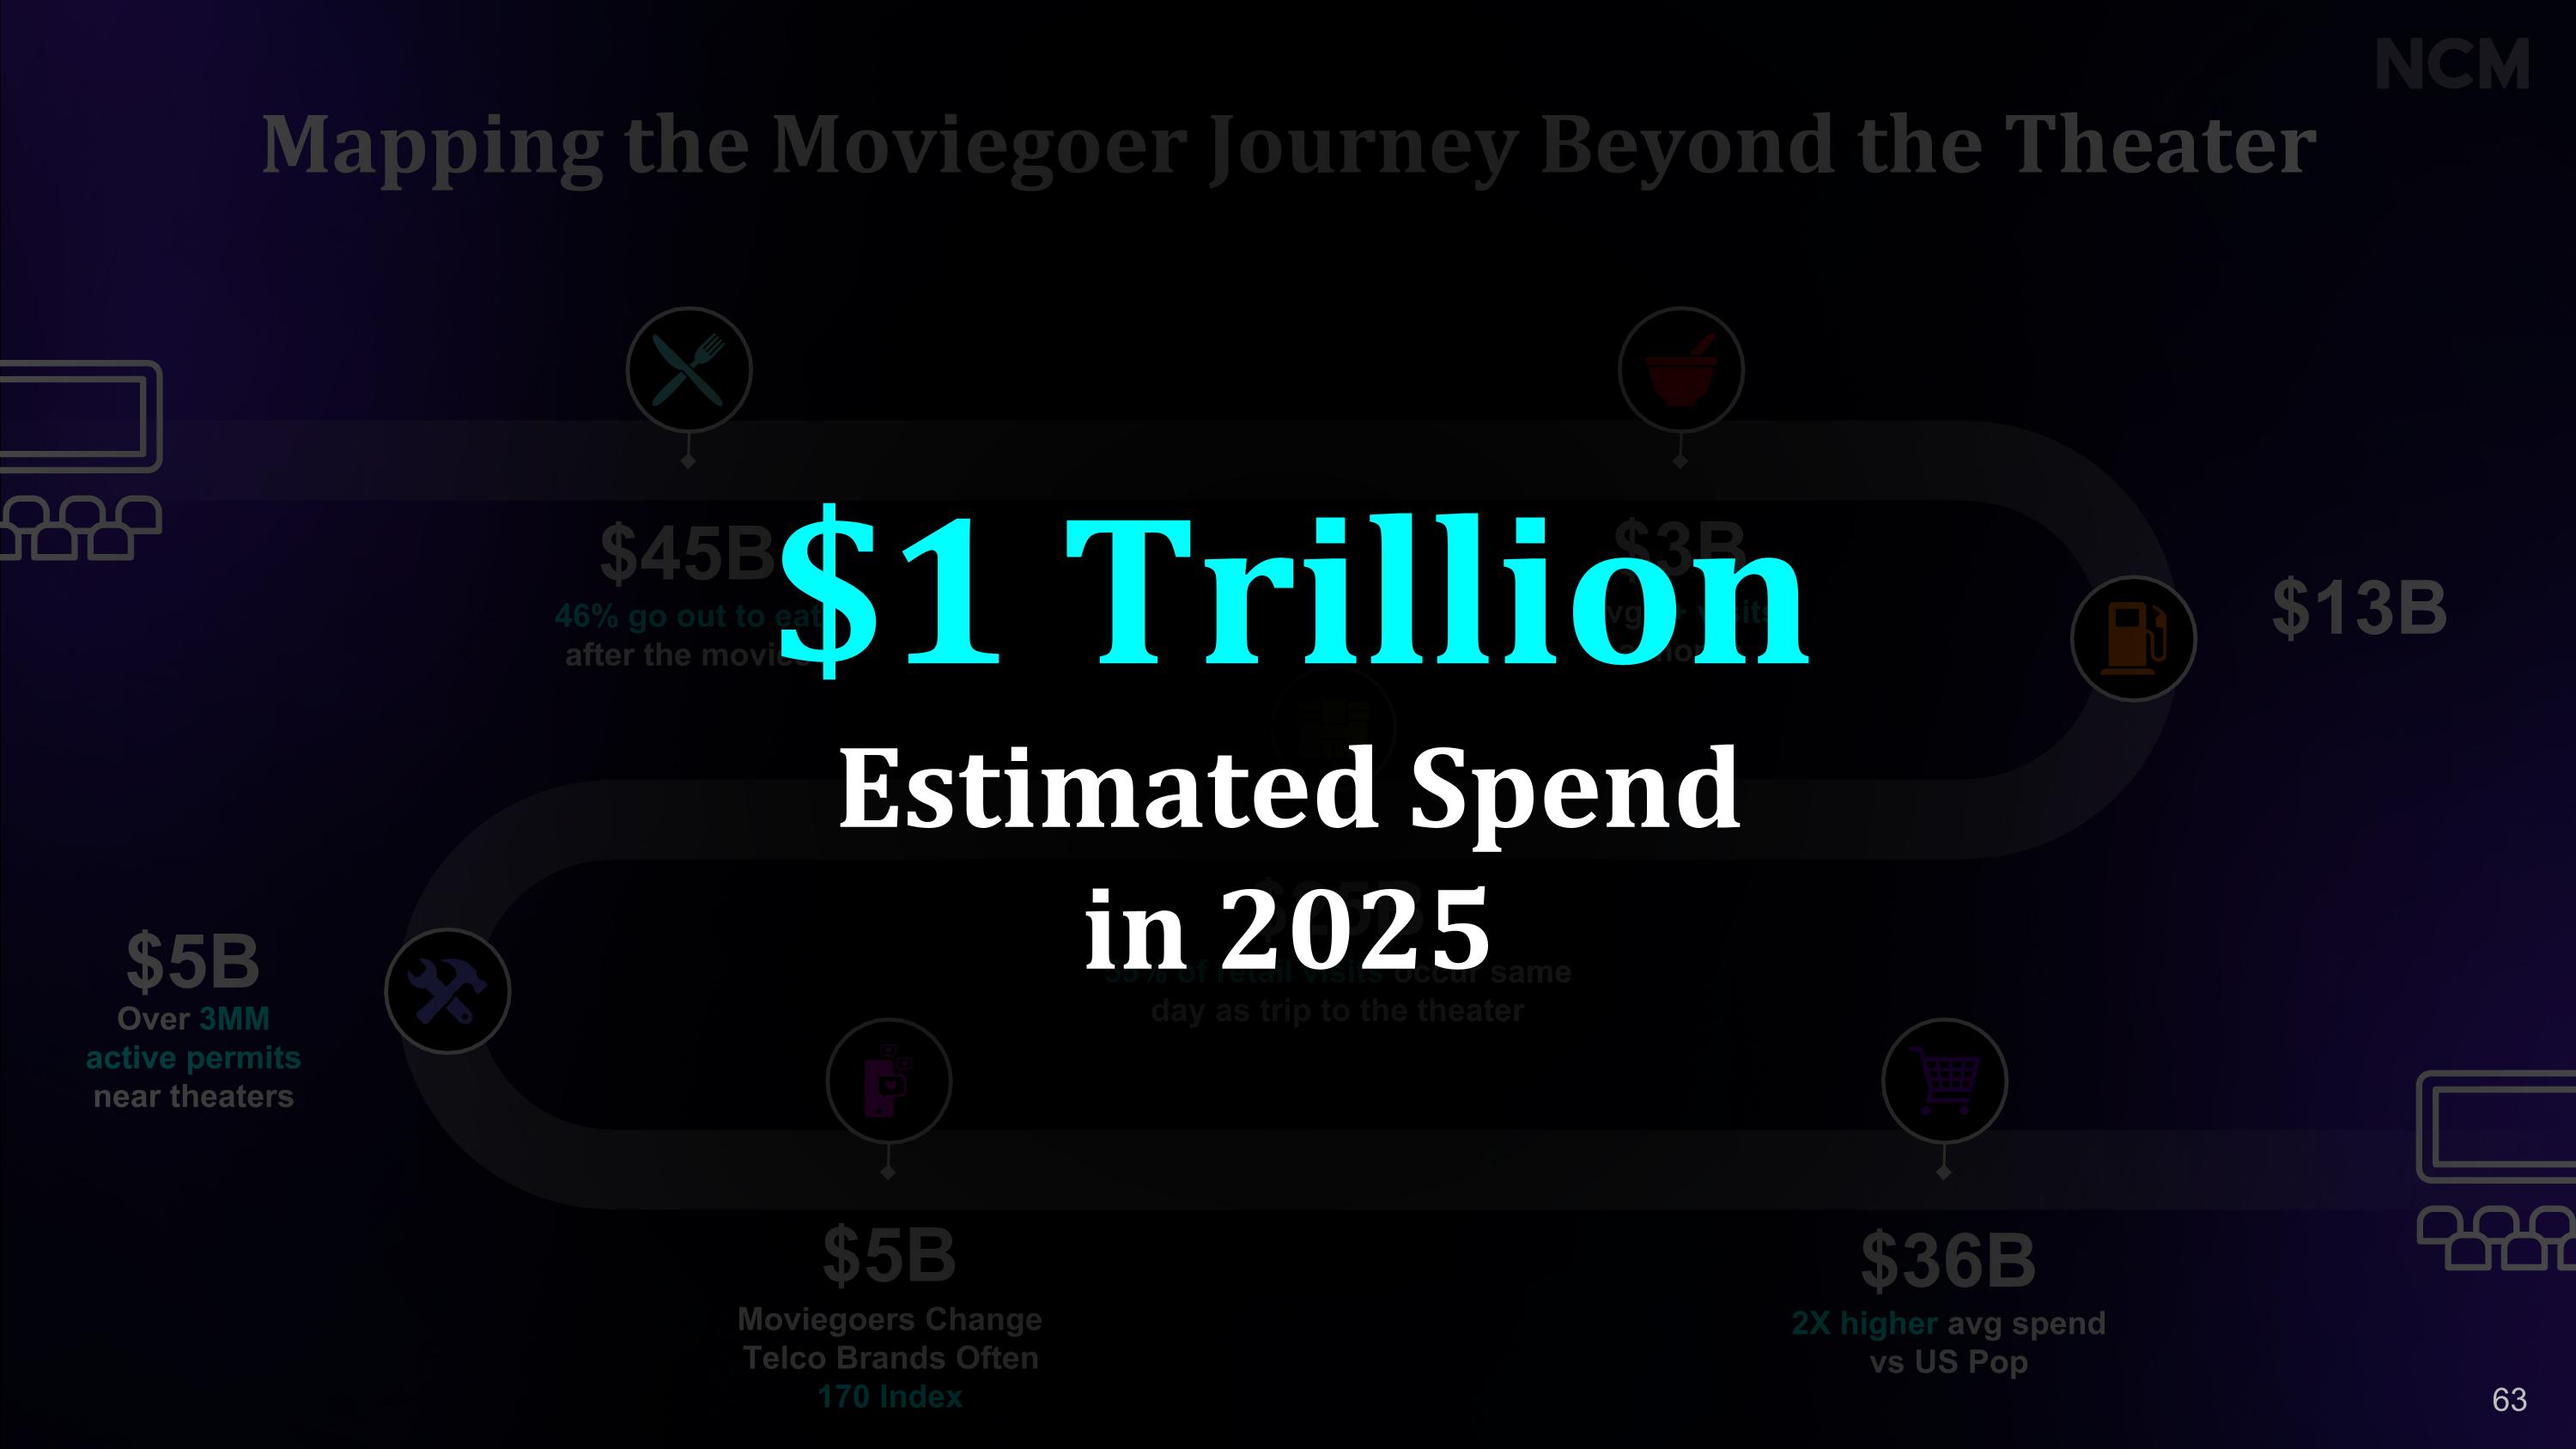
Mapping the Moviegoer Journey Beyond the Theater $45B 46% go out to eat after the movies $3B Avg 5+ visitsa month $13B $25B 55% of retail visits occur same day as trip to the theater $5B Moviegoers Change Telco Brands Often 170 Index $36B 2X higher avg spendvs US Pop $5B Over 3MM active permits near theaters $1 Trillion Estimated Spend in 2025 63

QSR +48% Foot Traffic Lift Pharma +21% Specialist Visitation CPG +22% Sales Lift Travel +150% Unaided Awareness Retail $4M Incremental Revenue Alcohol 86% Ad Recall Insurance +71% Unaided Awareness Entertainment /Streaming +12% Tune-in Lift Auto +22% Foot Traffic Lift Incremental Results Across All Categories 64

Proven Performance Across Every Category Hyper-Local Targeting Import Automotive Client +25% Foot traffic lift across four dealership regions Actionable insights at the local level on cinema ad impact encourages more dealership groups to invest in localized campaigns 65

Proven Performance Across Every Category QR Codes Incremental Foot Traffic Large Beauty Retailer 2X QR Code Scan Rates vs CTV Norms 119K Incremental Store Visits Geo-Targeted Messaging QR Codes & Exclusive Offers Seasonal Promotions Sales & Footfall Tracking 66

Dining out top post-movie activity 85% of visits occur within 5 miles of movie theater Proven Performance Across Every Category Drive Post-Movie Traffic Top National QSR Chain +23% Foot Traffic Lift +$1.2M Incremental Revenue 67
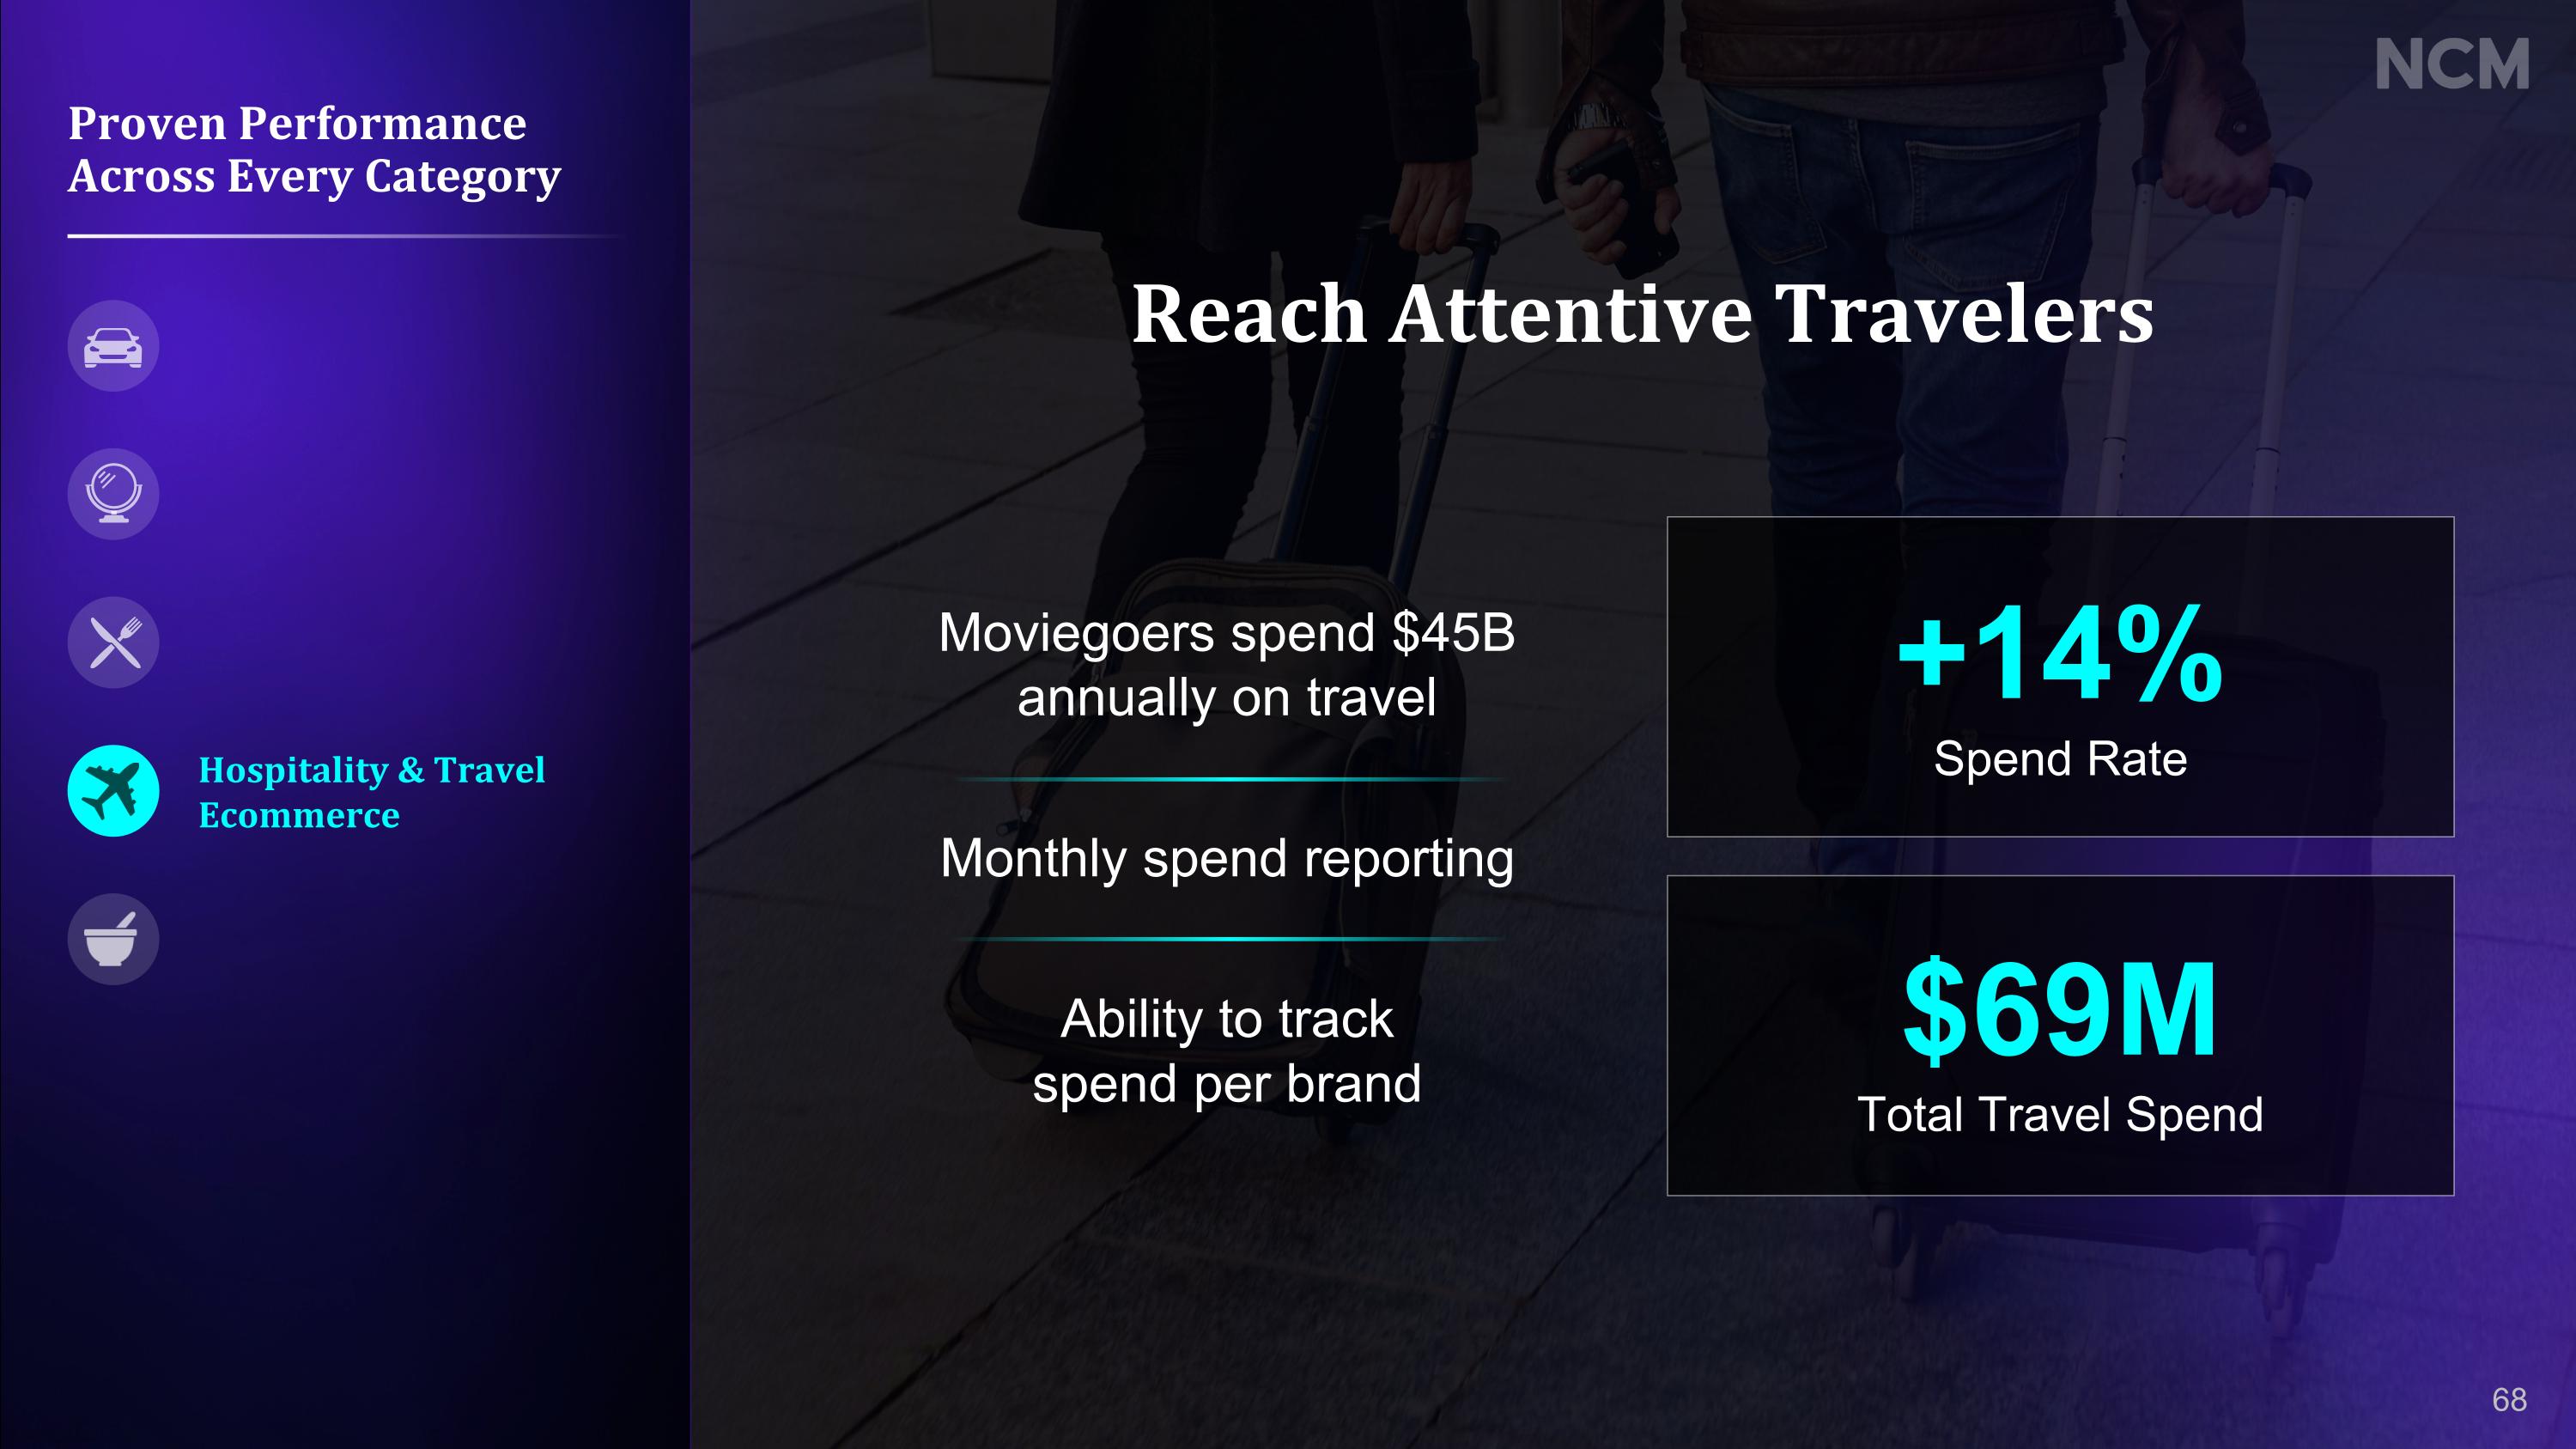
Moviegoers spend $45B annually on travel Monthly spend reporting Ability to track spend per brand Proven Performance Across Every Category Reach Attentive Travelers Hospitality & Travel Ecommerce +14% Spend Rate $69MTotal Travel Spend 68
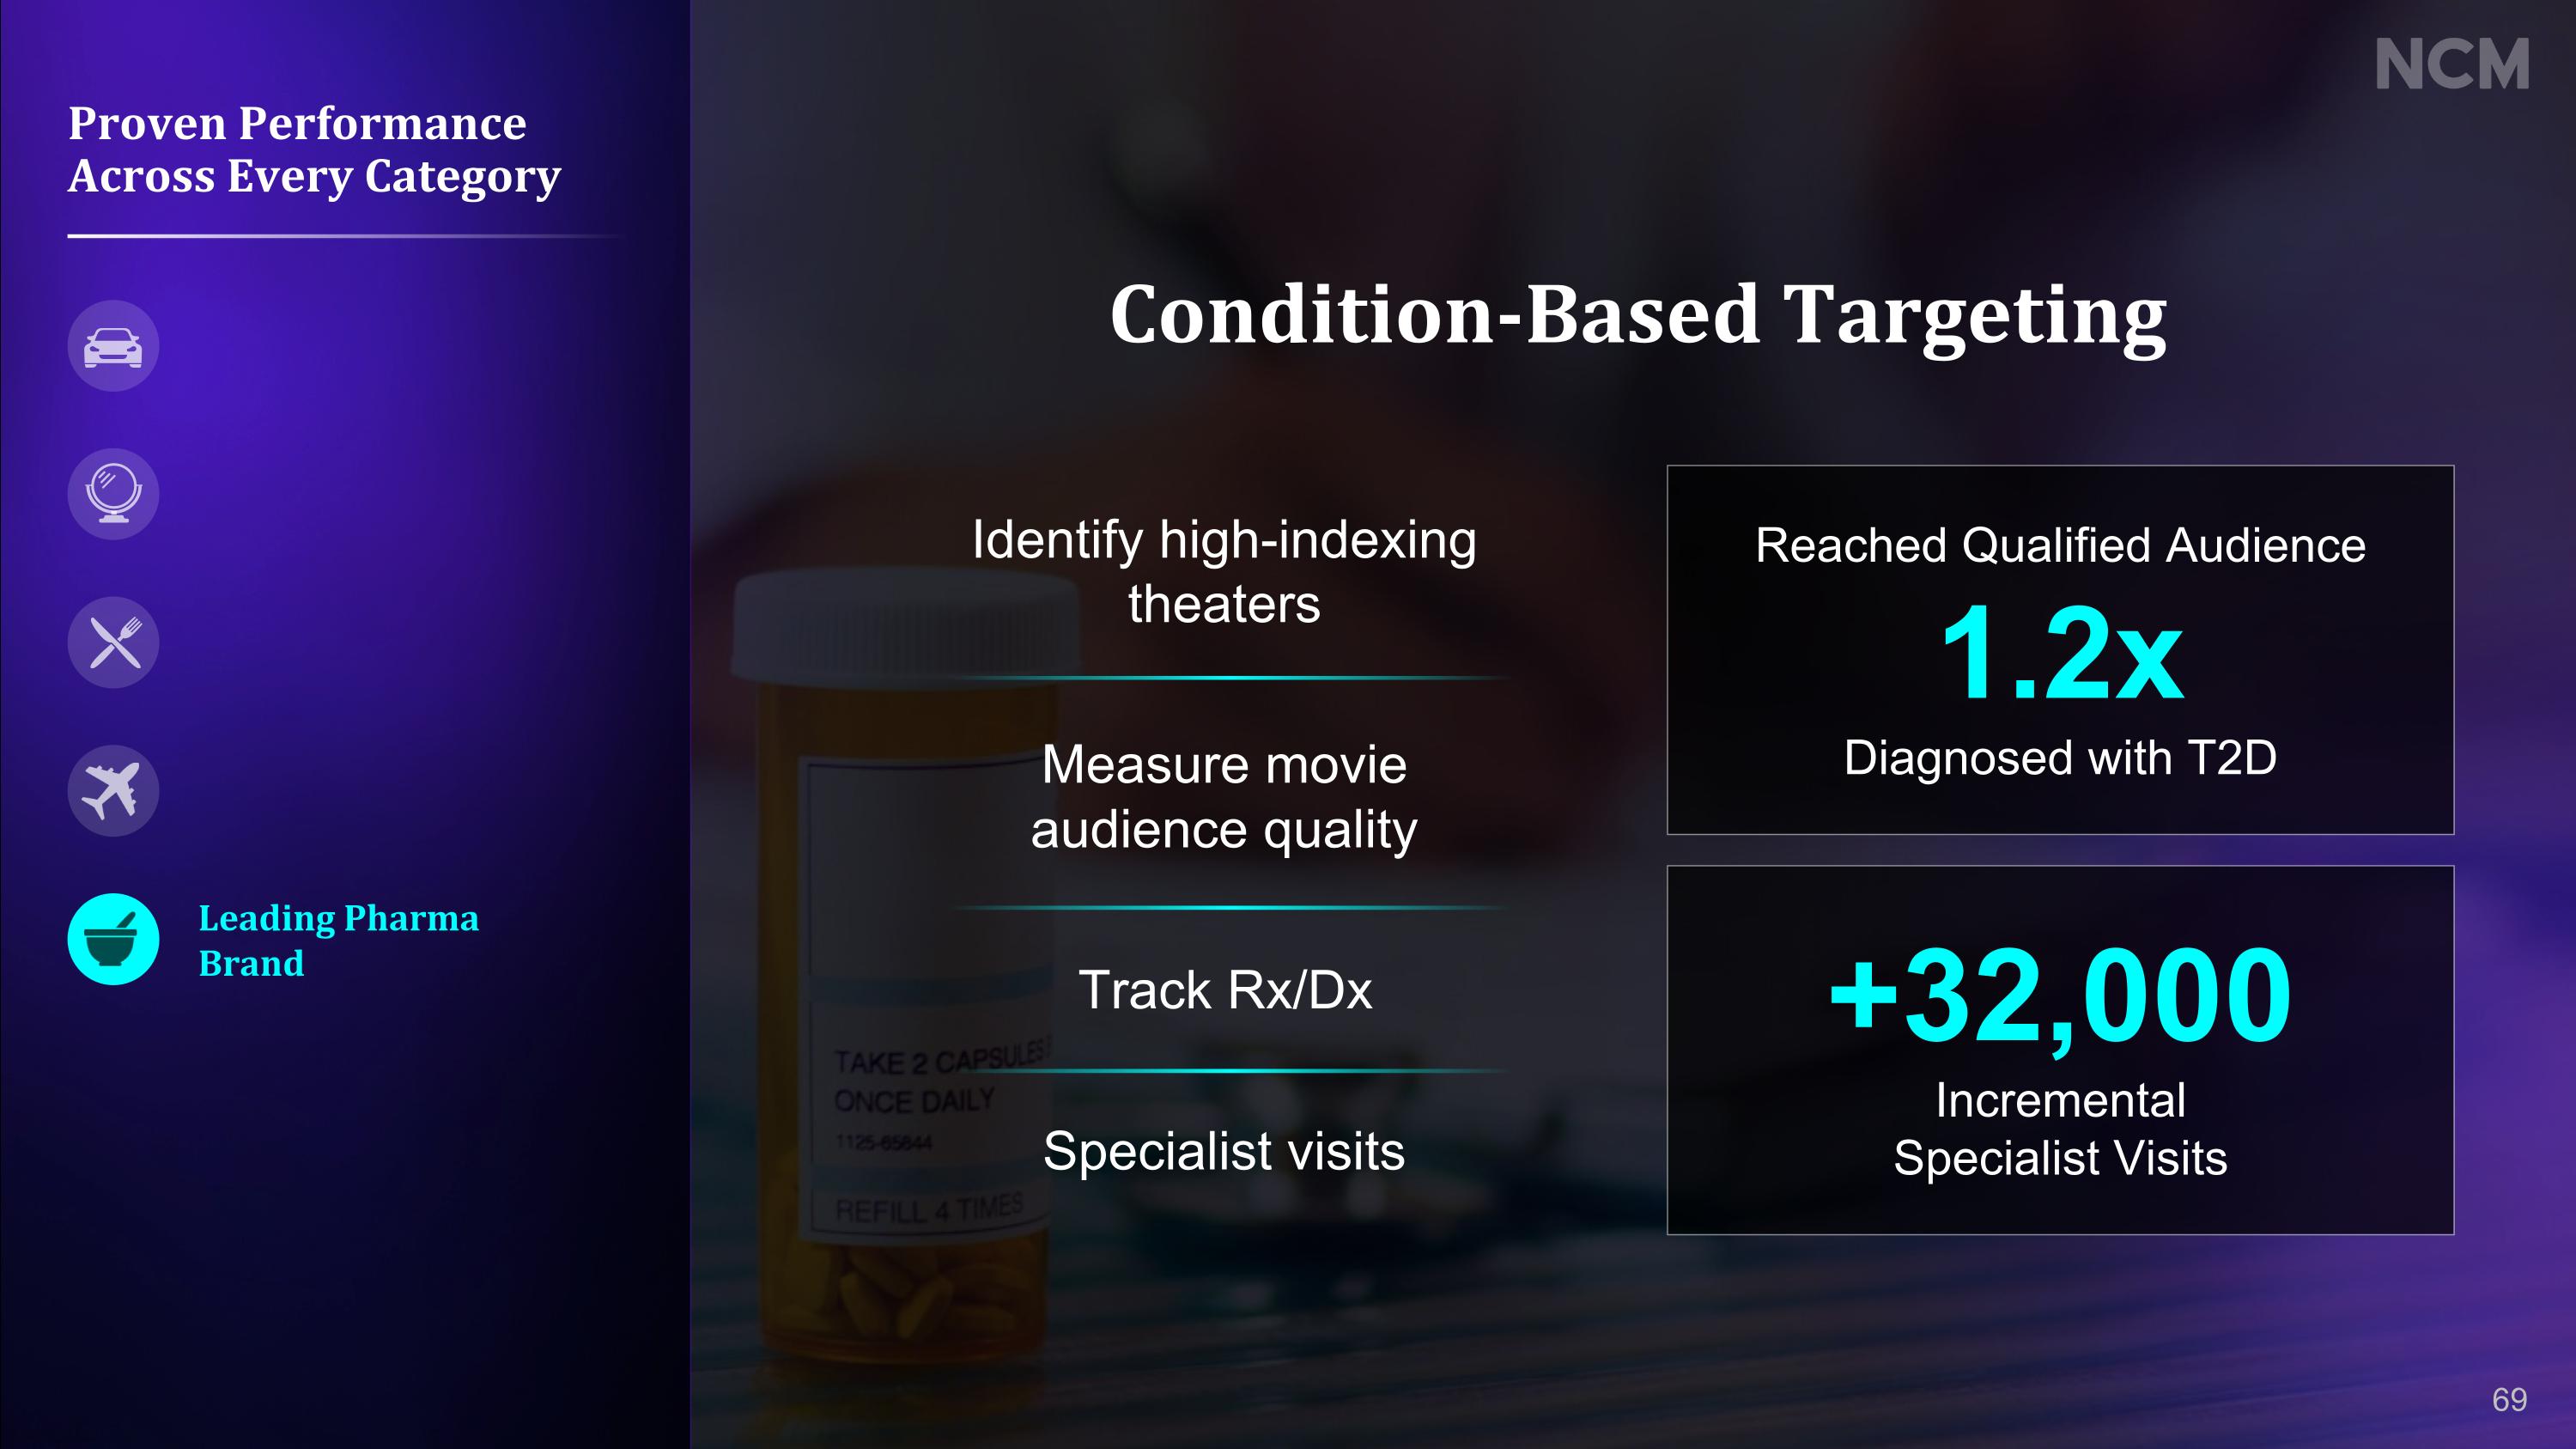
Proven Performance Across Every Category Condition-Based Targeting Identify high-indexingtheaters Measure movie audience quality Track Rx/Dx Specialist visits Leading Pharma Brand Reached Qualified Audience 1.2xDiagnosed with T2D +32,000Incremental Specialist Visits 69

Amplifying TM
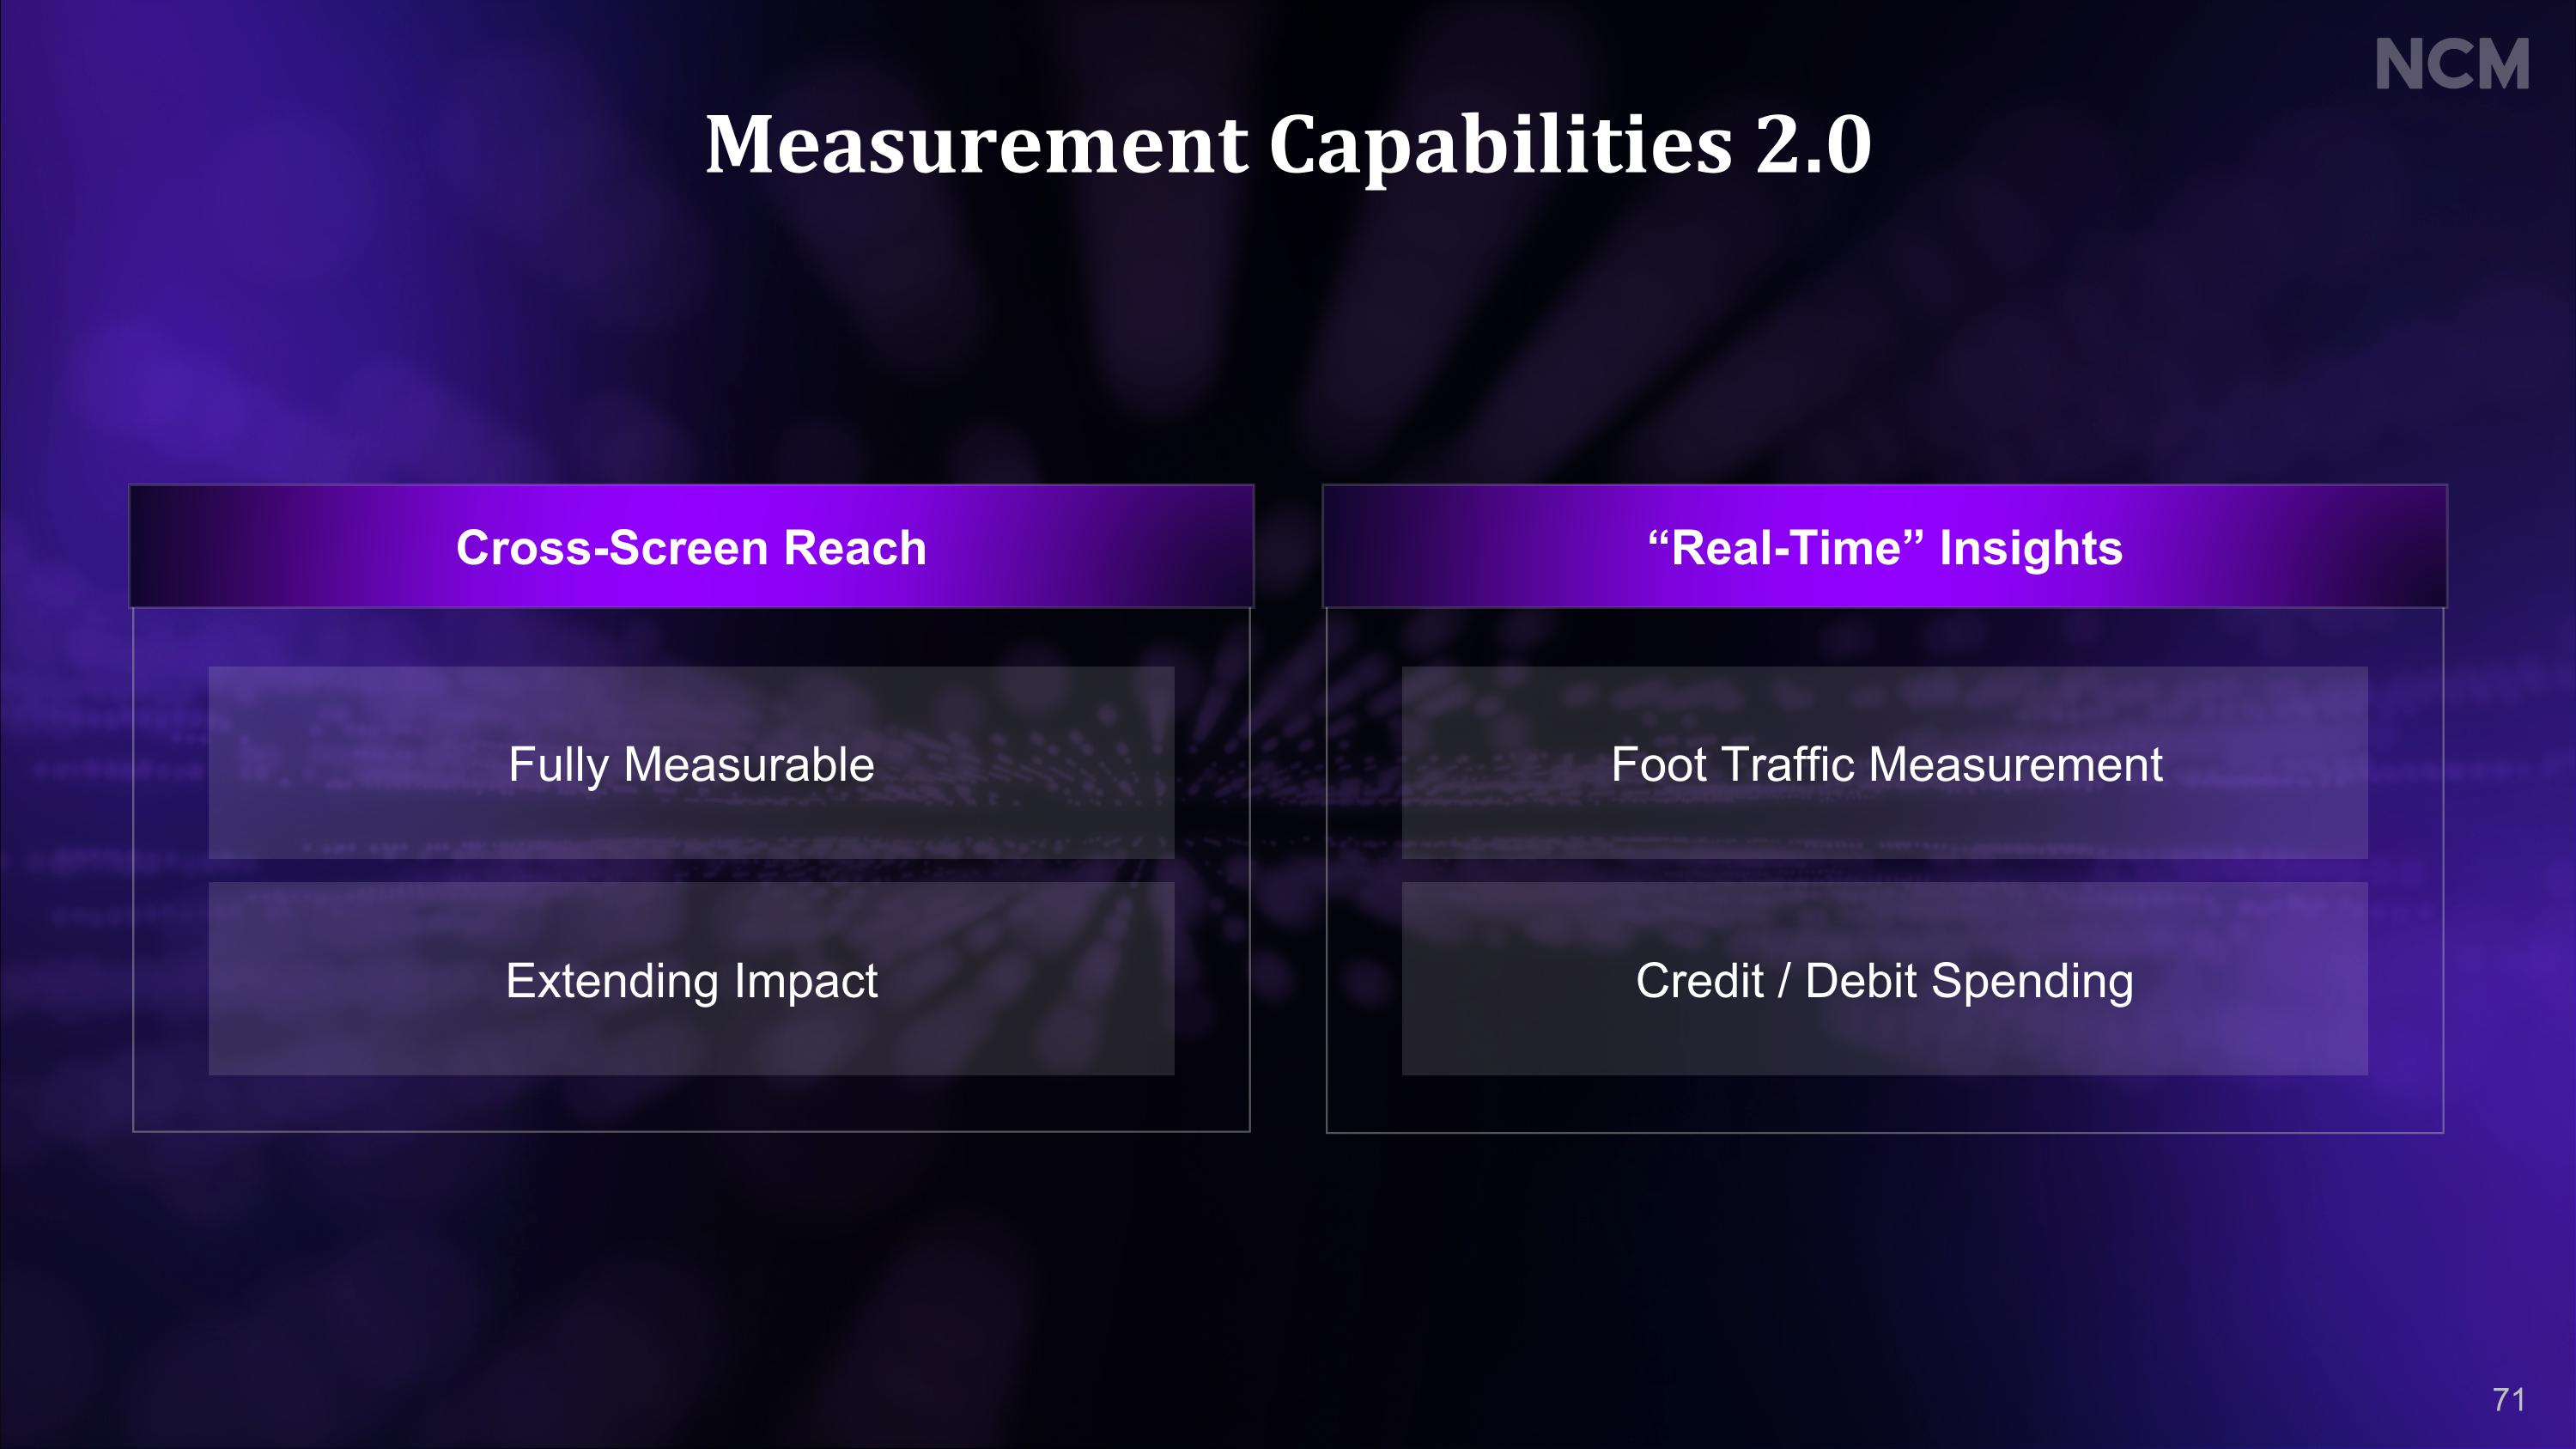
Measurement Capabilities 2.0 Fully Measurable Extending Impact Cross-Screen Reach Credit / Debit Spending Foot Traffic Measurement “Real-Time” Insights 71

Guaranteed Outcomes That Drive Results Audience Composition Guarantee Sales Lift & Foot Traffic Guarantees Incremental Reach Guarantee Attention Ratings Guarantee 72
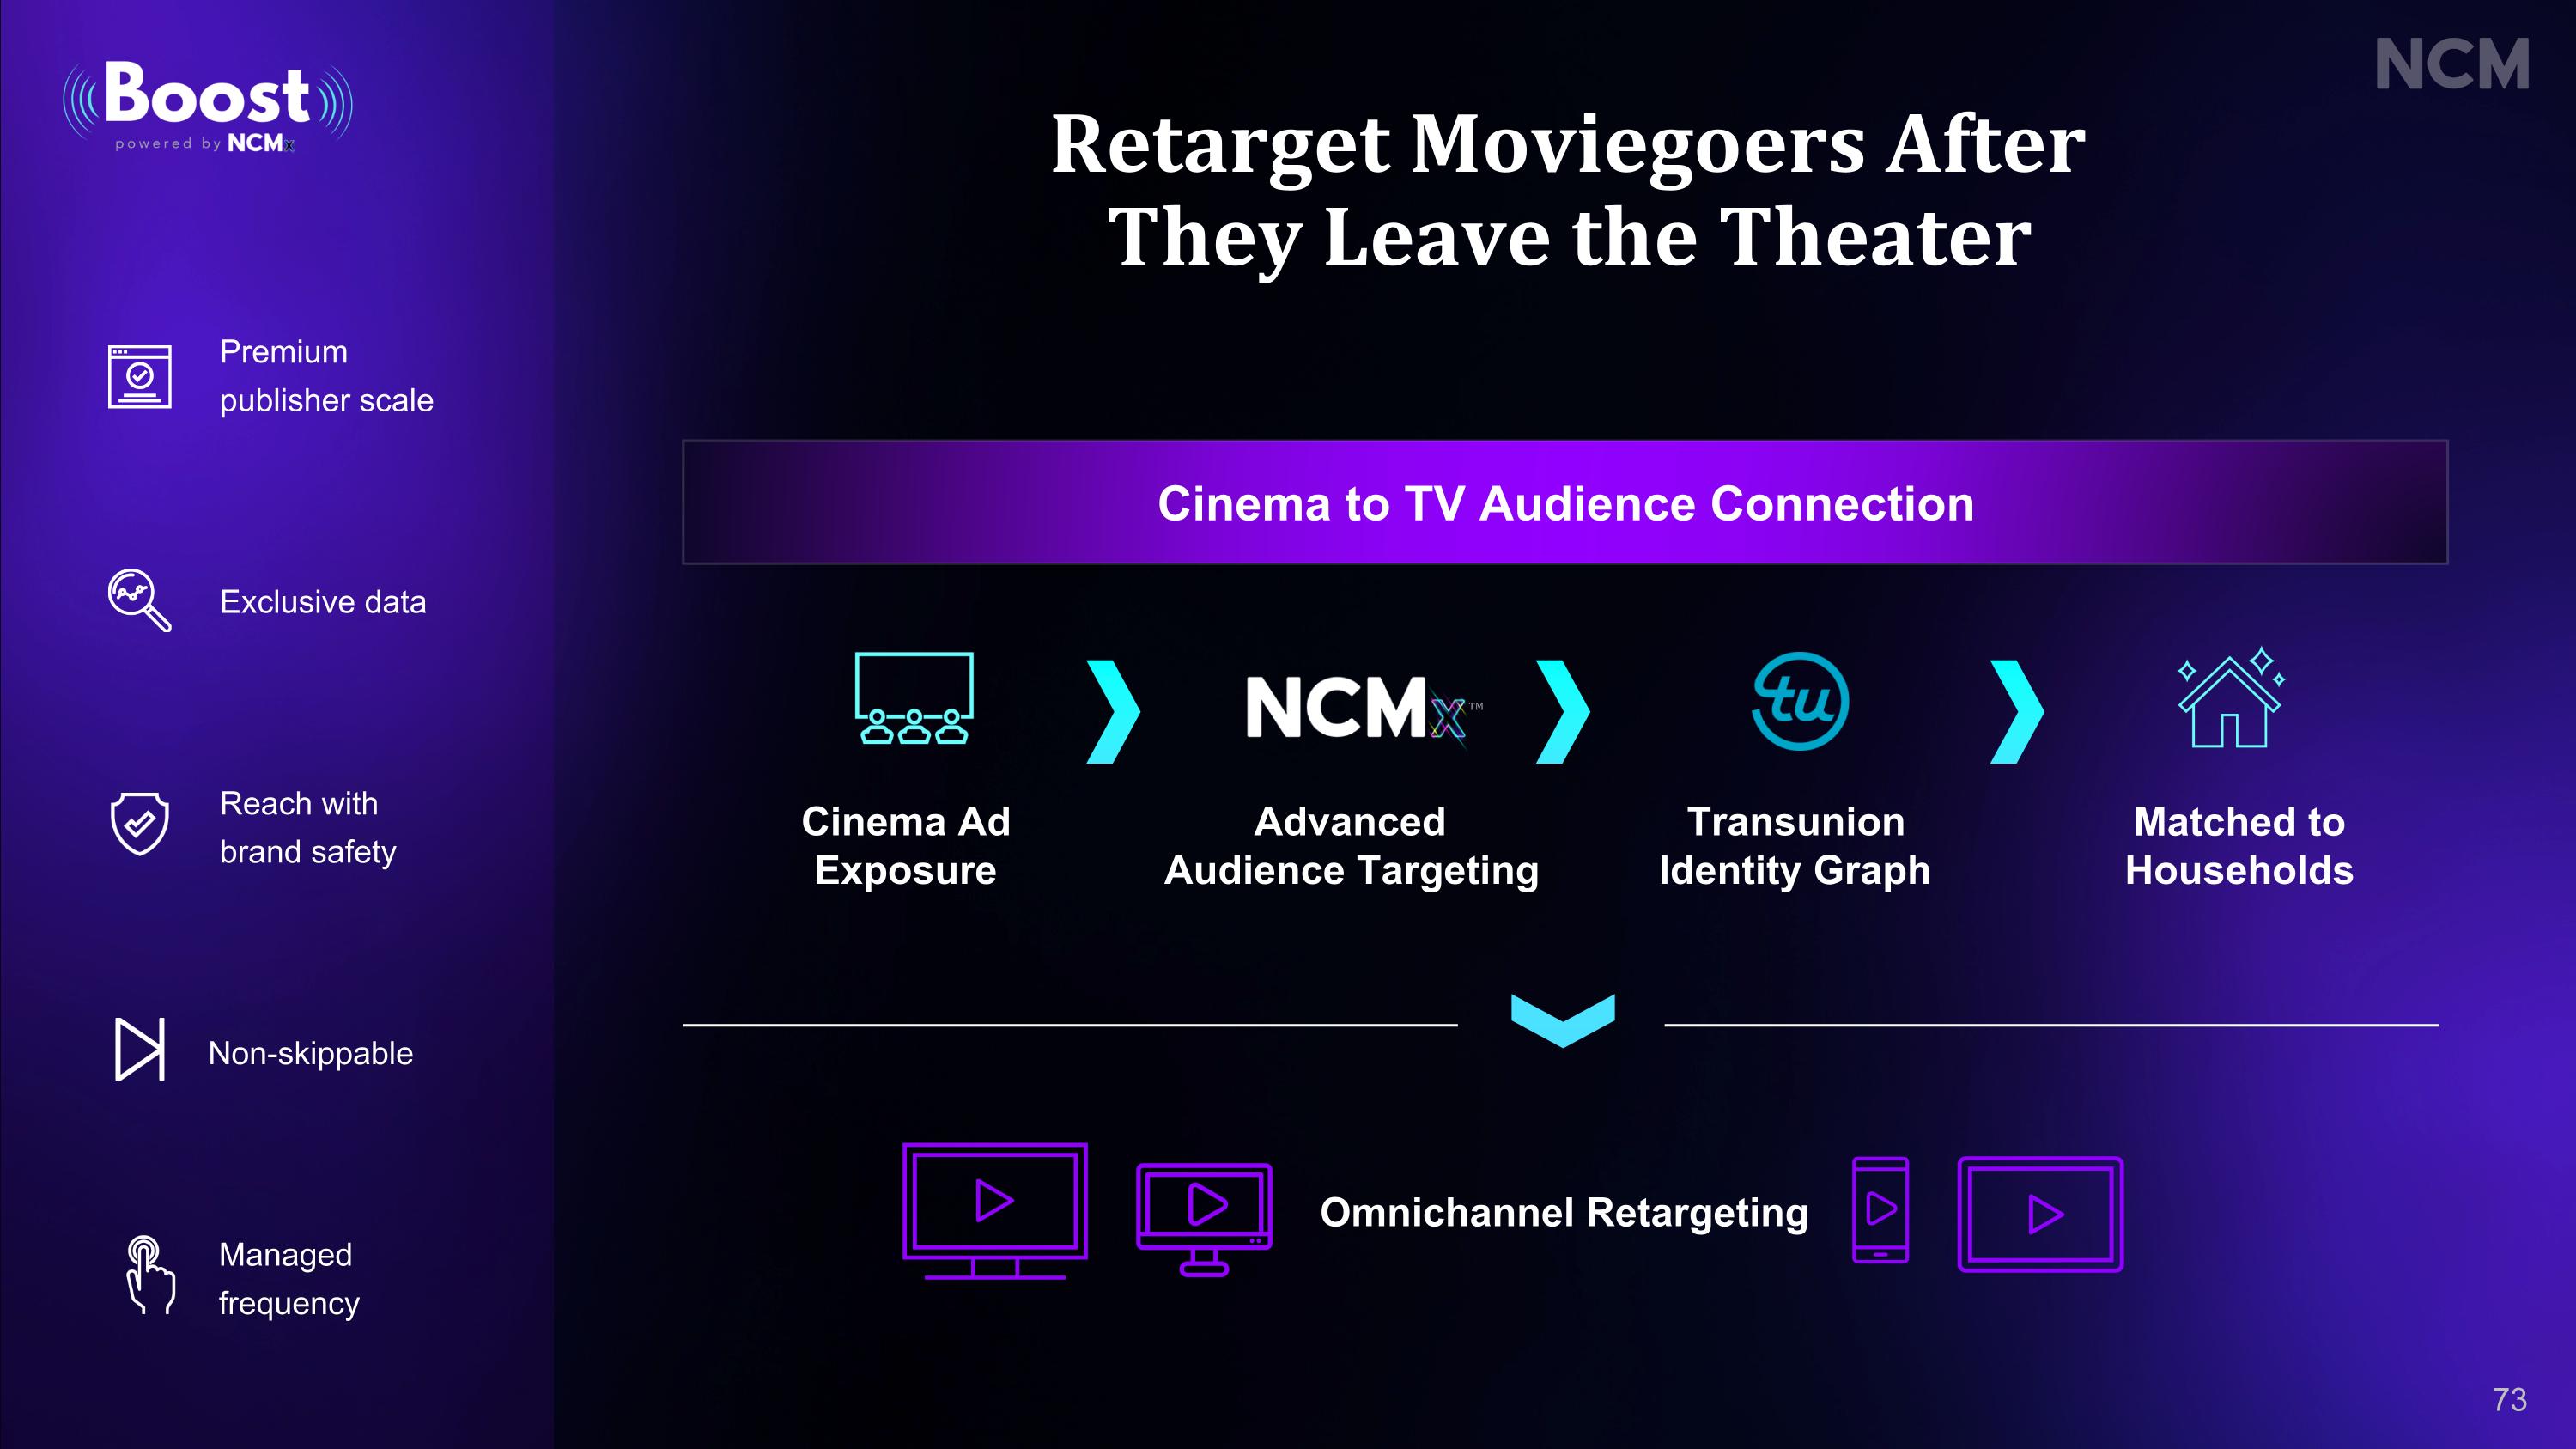
Retarget Moviegoers After They Leave the Theater Premium publisher scale Exclusive data Reach with brand safety Non-skippable Managed frequency Cinema to TV Audience Connection Advanced Audience Targeting Transunion Identity Graph Matched toHouseholds Cinema Ad Exposure Omnichannel Retargeting TM 73
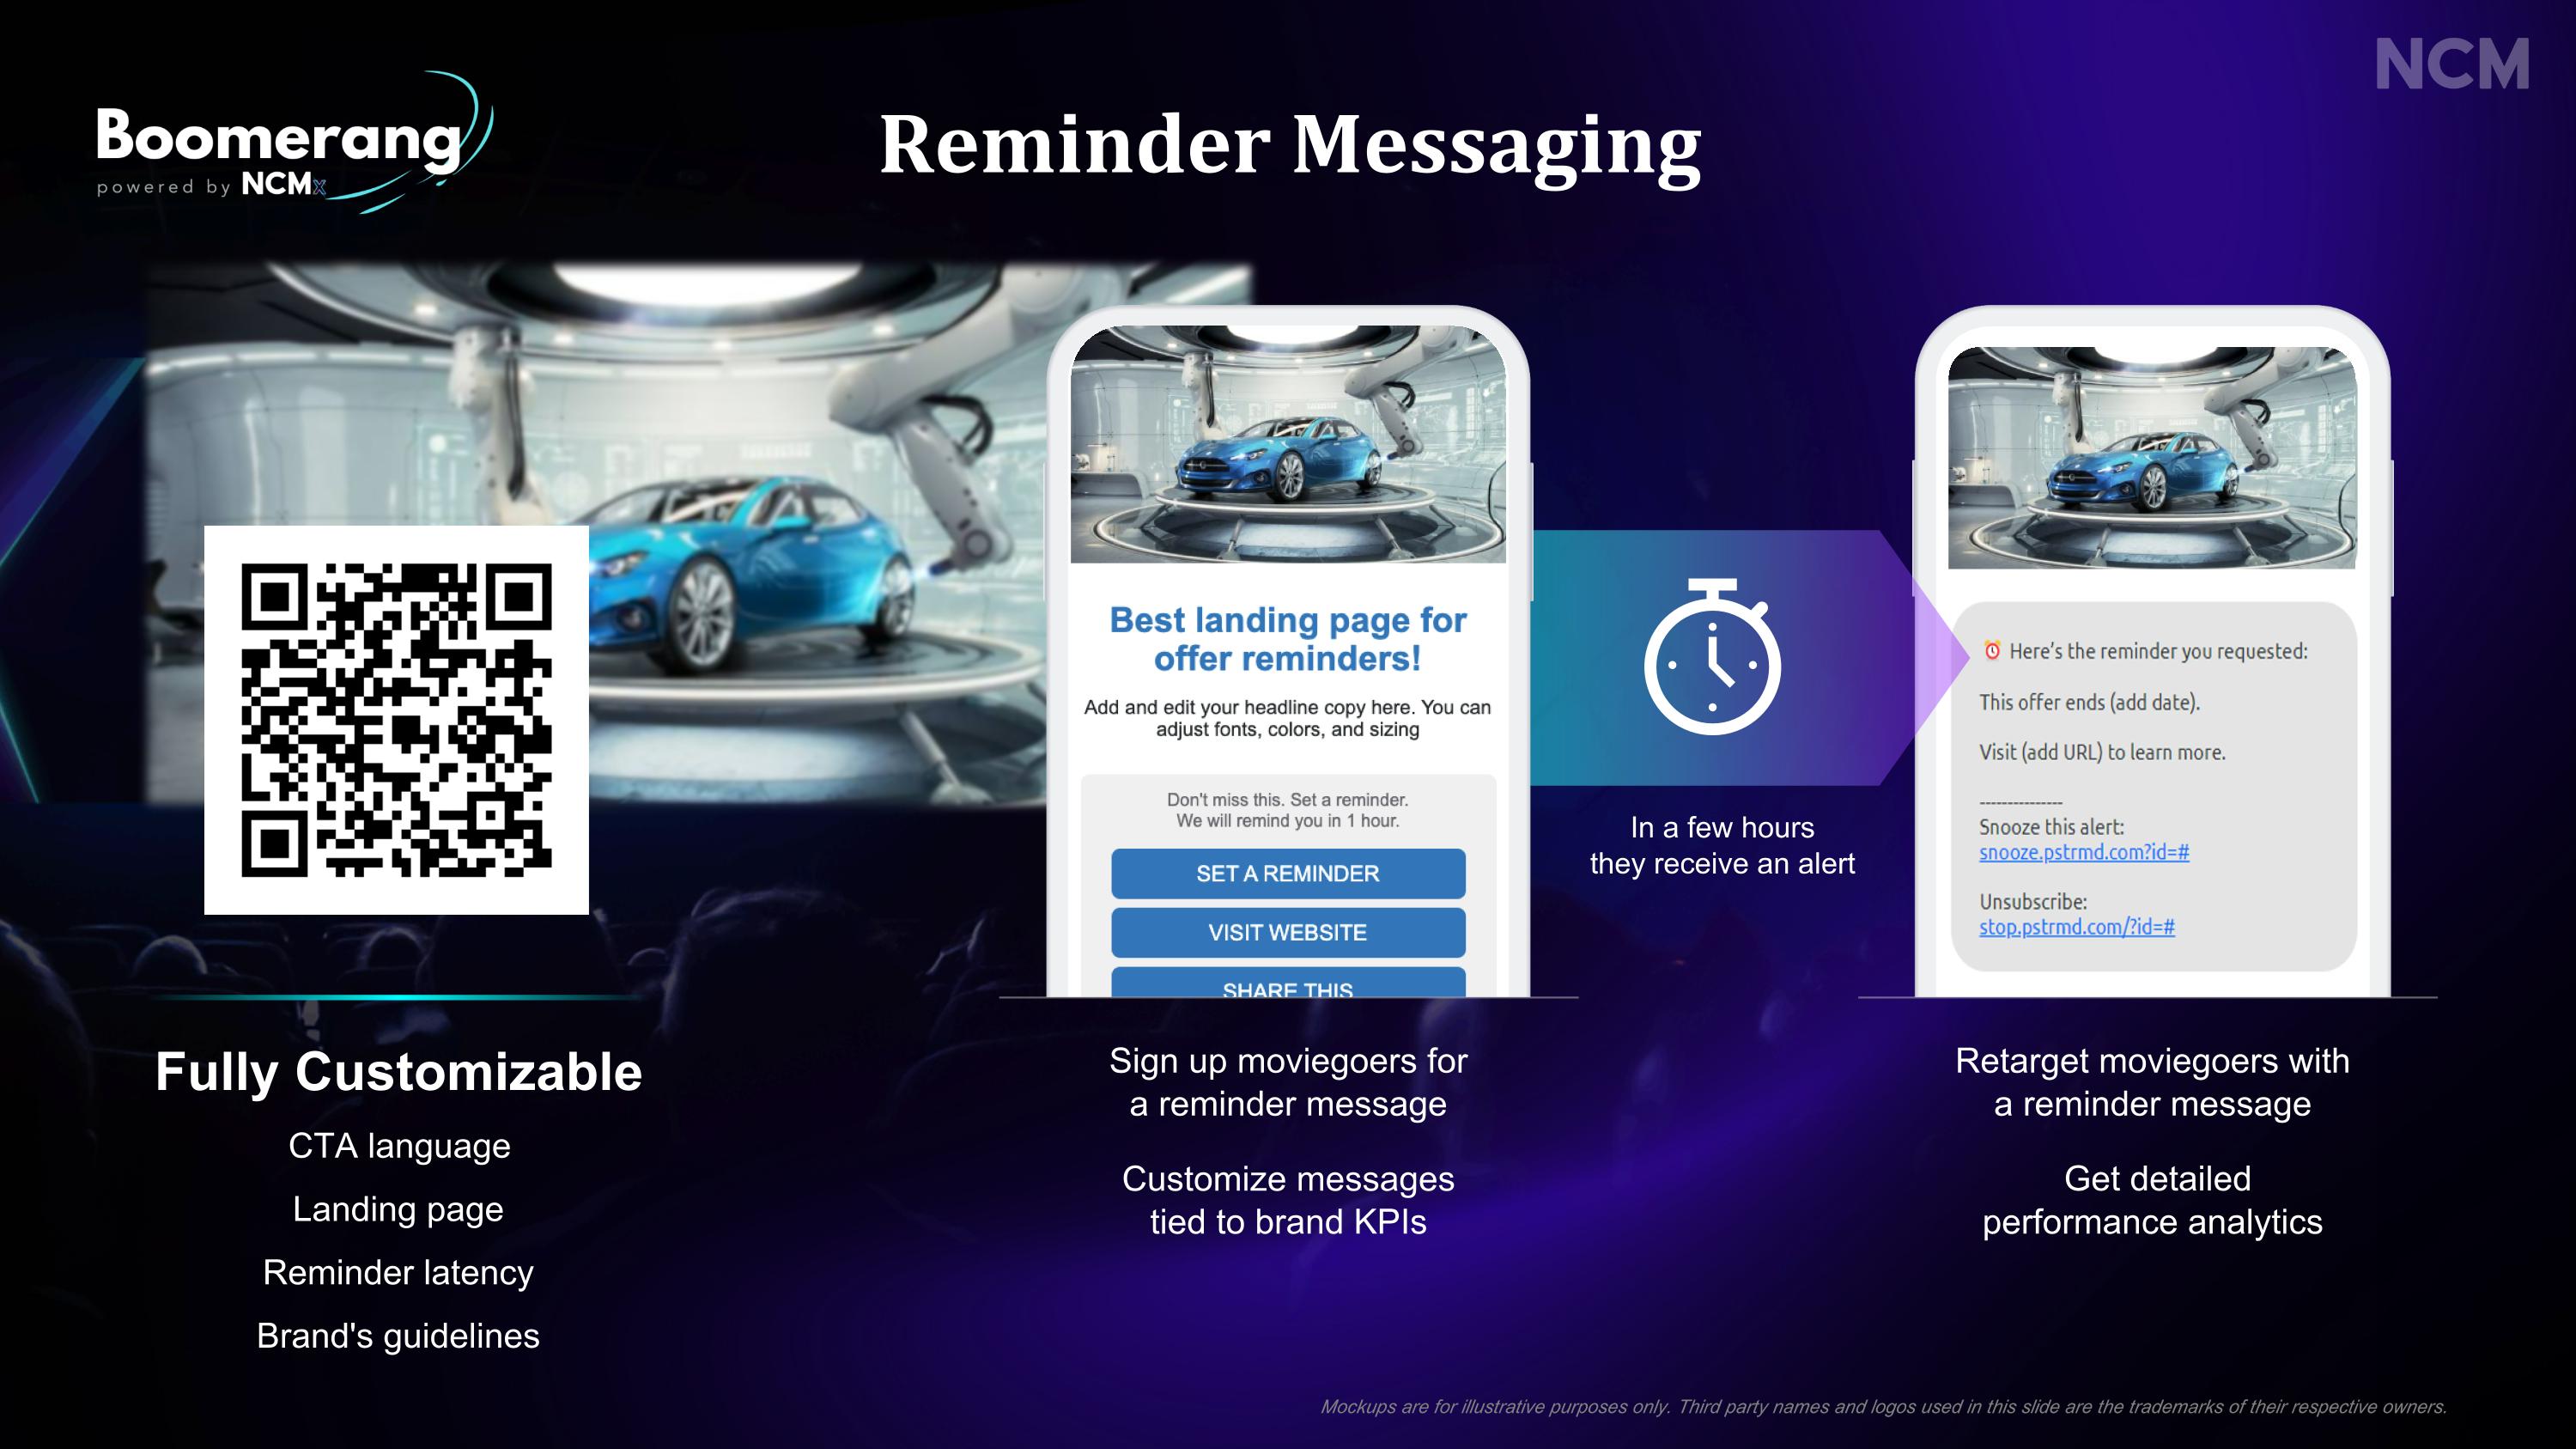
Retarget moviegoers witha reminder message Get detailedperformance analytics Mockups are for illustrative purposes only. Third party names and logos used in this slide are the trademarks of their respective owners. Reminder Messaging Sign up moviegoers fora reminder message Customize messagestied to brand KPIs In a few hours they receive an alert Fully Customizable CTA language Landing page Reminder latency Brand's guidelines

One-click e-commerce purchases via QR code High-Impact Shoppable Ads 75 Mockups are for illustrative purposes only. Third party names and logos used in this slide are the trademarks of their respective owners.

Store Locator Weather Conditions Location-Based Features It will be 62° and Sunny after the movie! Download the app now or set a reminder. We will remind you in 3 hours. Remind me after the movie Download weather app Share this Download The Weather App to stay informed for the rest of the week. Mockups are for illustrative purposes only. Third party names and logos used in this slide are the trademarks of their respective owners. 76
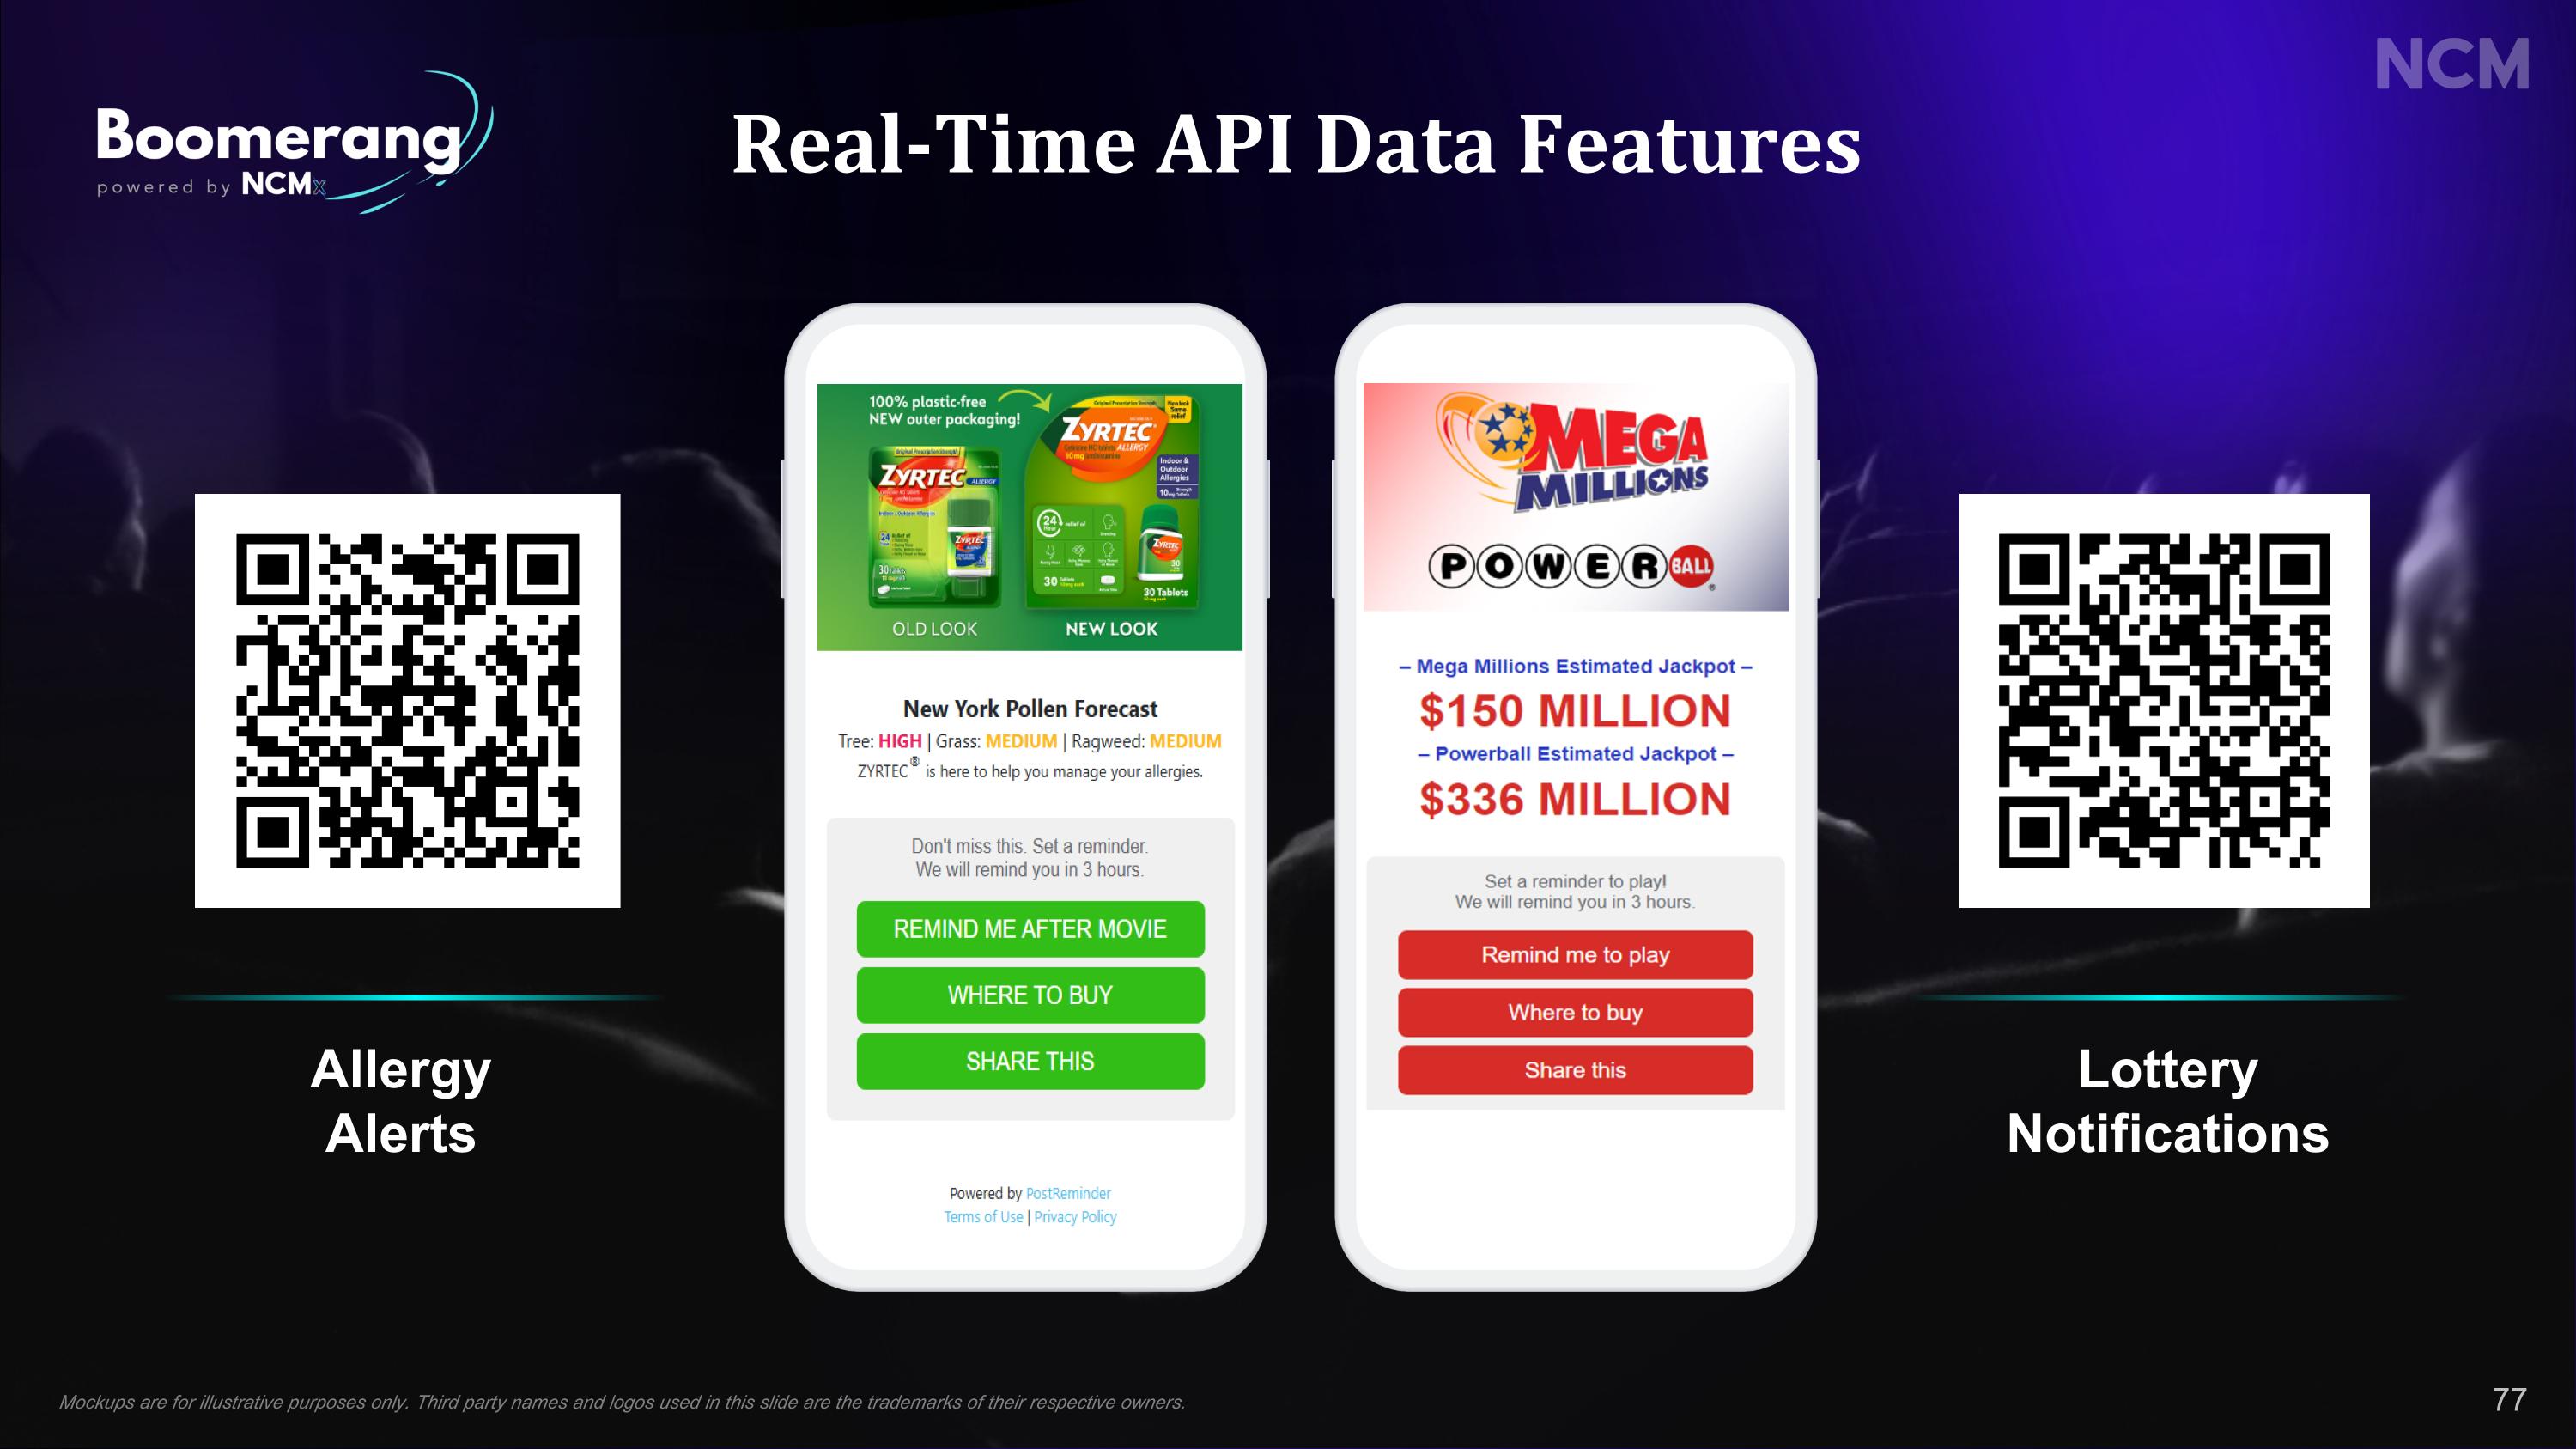
Real-Time API Data Features Allergy Alerts LotteryNotifications 77 Mockups are for illustrative purposes only. Third party names and logos used in this slide are the trademarks of their respective owners.

Real-Time Construction Permit Data 5 mi. 3 mi. 1 mi. Residential 1,873,778 Commercial 1,158,409 Active Permits Near Theaters (past six months) Roofing New Construction Remodel Plumbing Demolition Grading Electrical HVAC Gas Remodel Bathroom New Construction 78

Deliver the right creative to the right audience at the right theater — all in real time Dynamic Creative Versioning Serve multiple different versions across theaters Location-Based Targeting Customize messaging by region, DMA or individual zip code (theaters) Hyperlocal Relevance Align offers and messaging to local audience preference Real-Time Optimization Adjust creative based on audience data and behaviors and / or based on successful offers Introducing Precision Targeting on the Biggest Screen 79




Growth Driven by Data QSR +33% Foot Traffic Lift Pharma +67,500 Specialist Visitation Retail $6.4M Incremental Revenue Travel $2.4M Incremental Quarterly Spend CPG ~$5M Avg. Total Sales ~50% of sales revenue supported by data 83

The Power of Cinema

Ronnie Ng Chief Financial Officer Financial Strategy& Outlook

Strong Financial Trajectory Revenue & Expense Drivers Capital Allocation Reinforced Financial Foundation Outlook 2 1 3 4 86

NCM Historically Generated Significant Unlevered Free Cash Flow 87

Reduced Film Slate + Pull-Back in Ad Spend Pandemic Disruption Significantly Impacted the Business Forced Theater Closures + Social Distancing Requirements Limited Attendance + Disrupted Experience 2019 2020 2021 88

Management Transformed NCM to Enhance Flexibility Streamlined Business Units & Increased Productivity Personnel Reduction 52% SG&A Annual Cost Savings Increased Ad Rev per Sales Employee $38M +25% 89
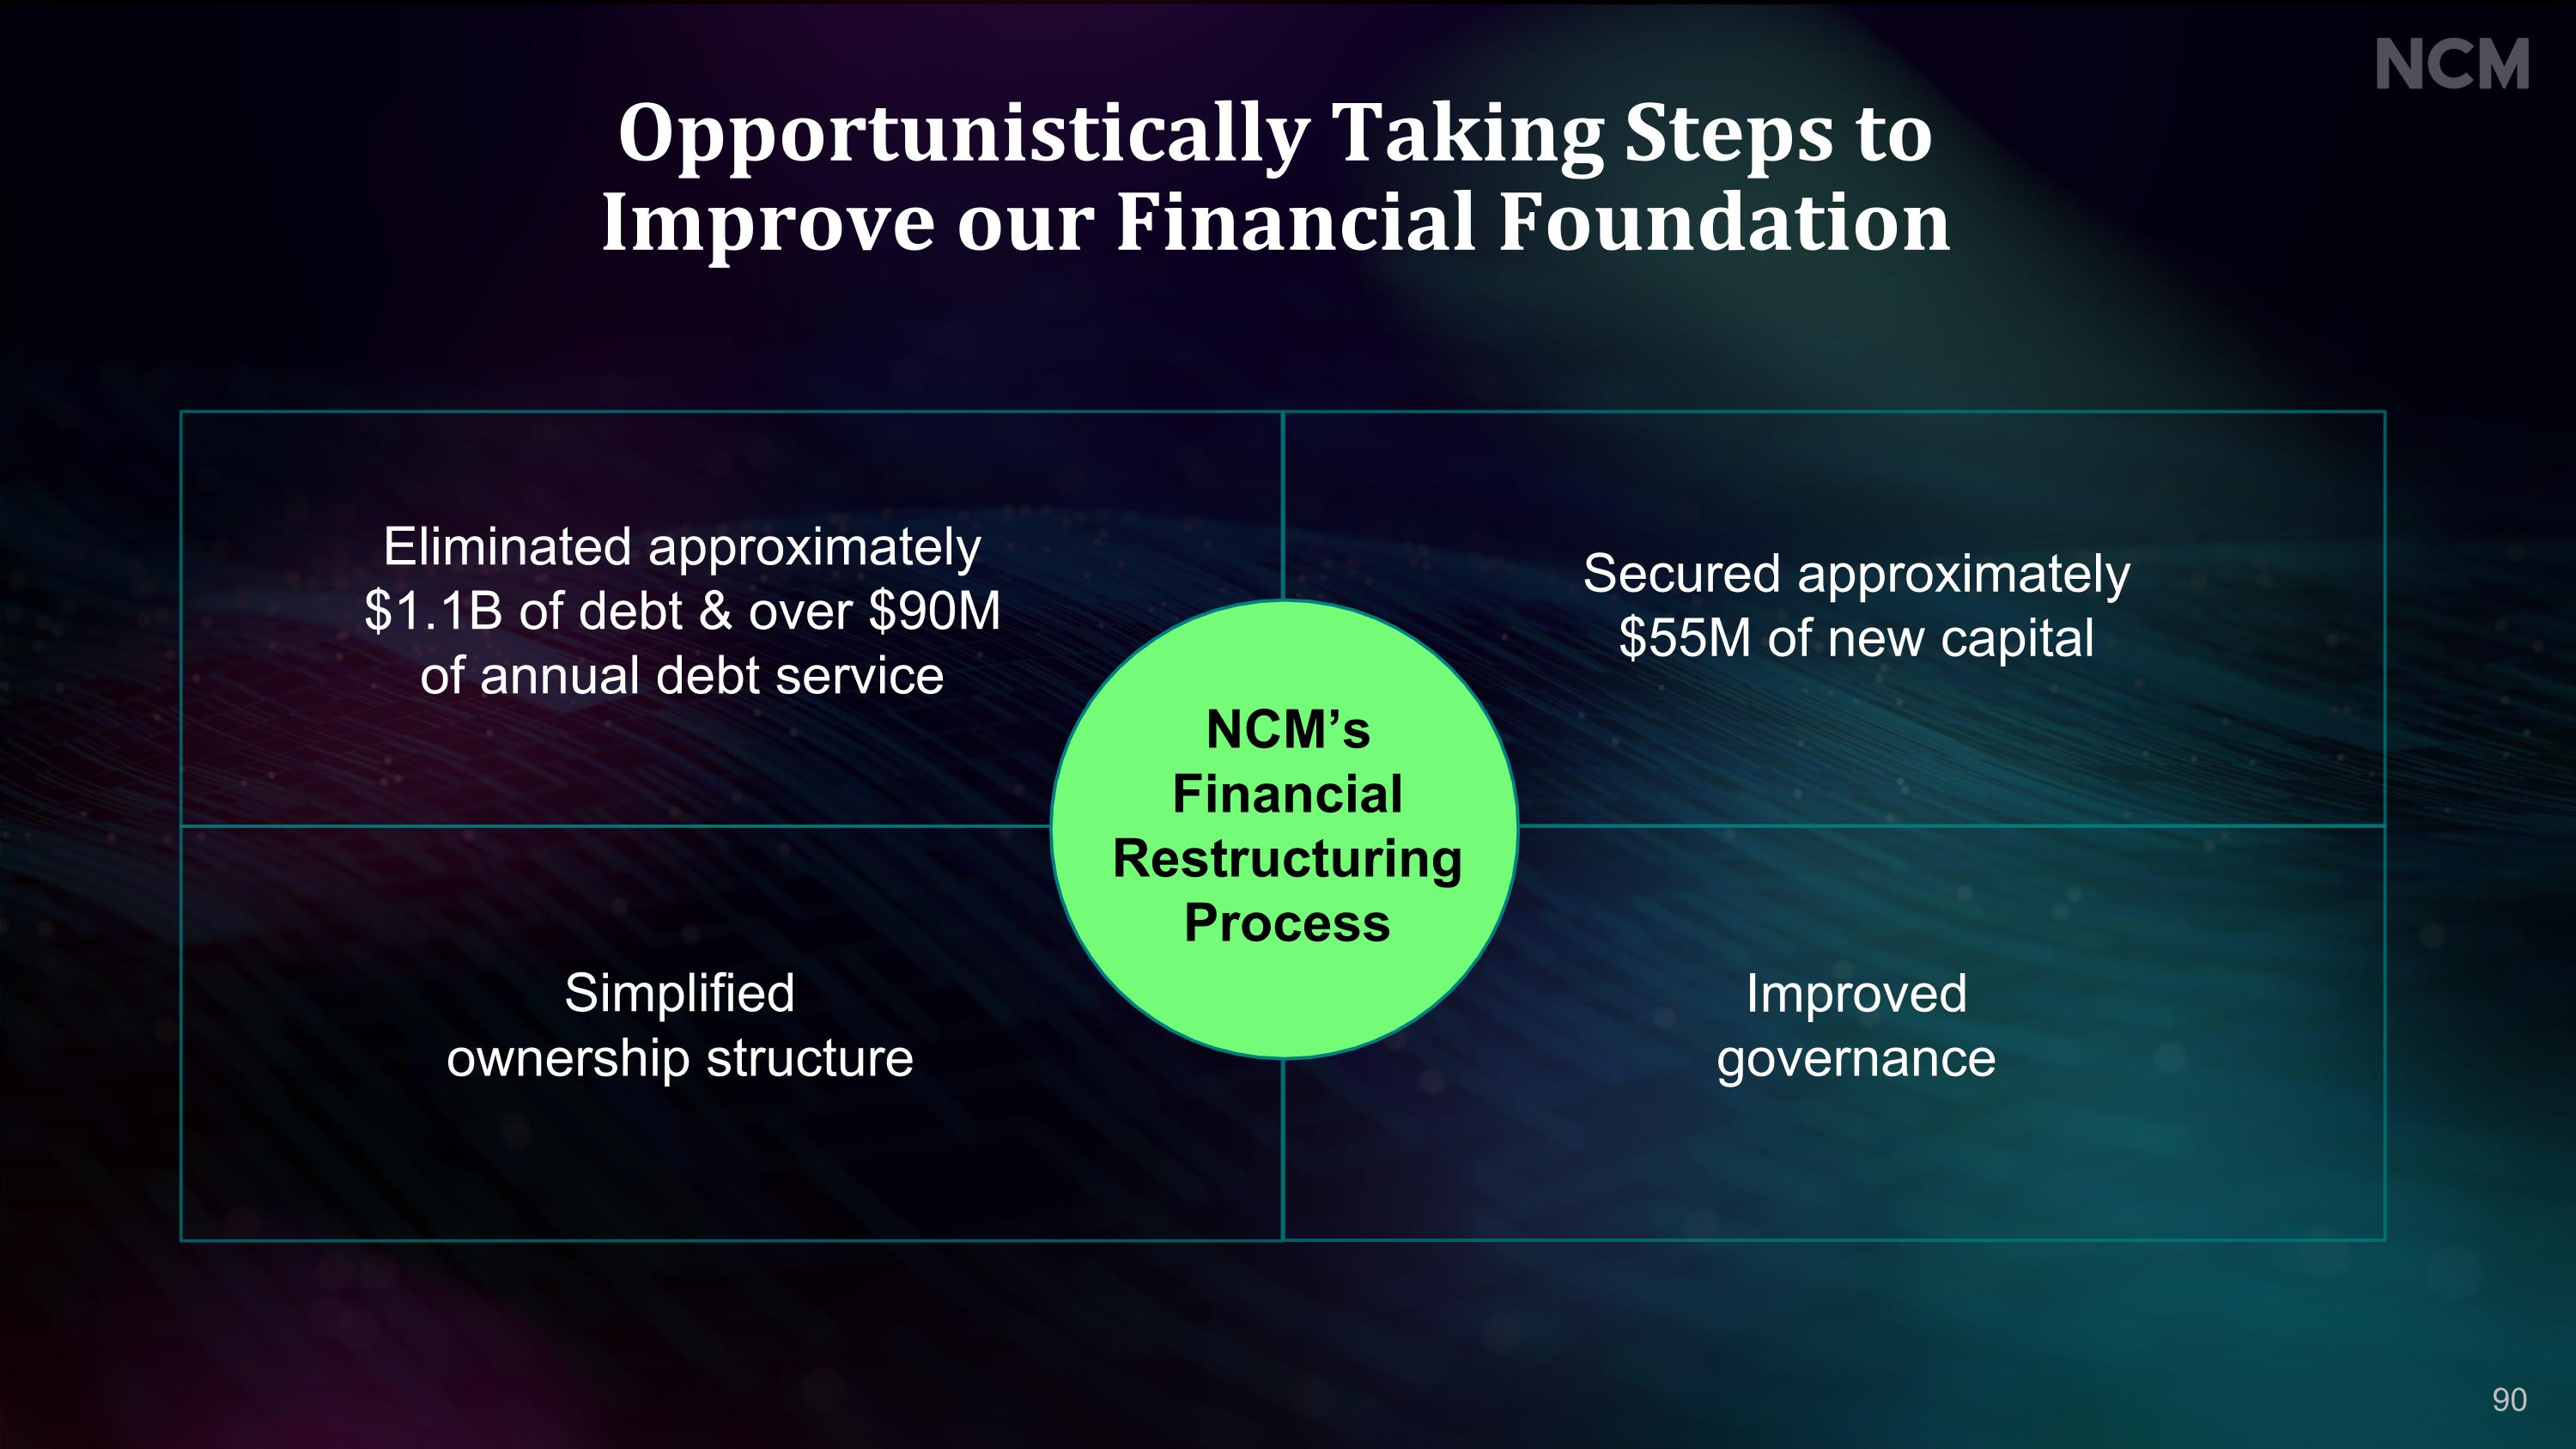
Opportunistically Taking Steps toImprove our Financial Foundation Eliminated approximately$1.1B of debt & over $90Mof annual debt service Simplified ownership structure Secured approximately $55M of new capital Improvedgovernance NCM’s Financial Restructuring Process 90

Fortified Balance Sheet Optimized leverage ratio with zero funded debt Net Debt to Adj. OIBDA Ratio 4.47x 0.19x 0.22x 0.00x // New $45 Million Cash Flow Based Revolving Credit Facility Reduced Cost of Debt by >200 bps Reduced Annual Interest Expense by $1 Million 91

Positioning the Business for Long-Term Growth Meaningfully Lower Risk Profile Consolidated Business Units $4 million cost savings Eliminated Unprofitable Contracts $5 million cost savings 92

Revenue & Expense Drivers

Attendance Analysis // NCM Attendance by Quarter (M) 94

Consistent Monetization // Total Advertising Revenue per Attendee 95
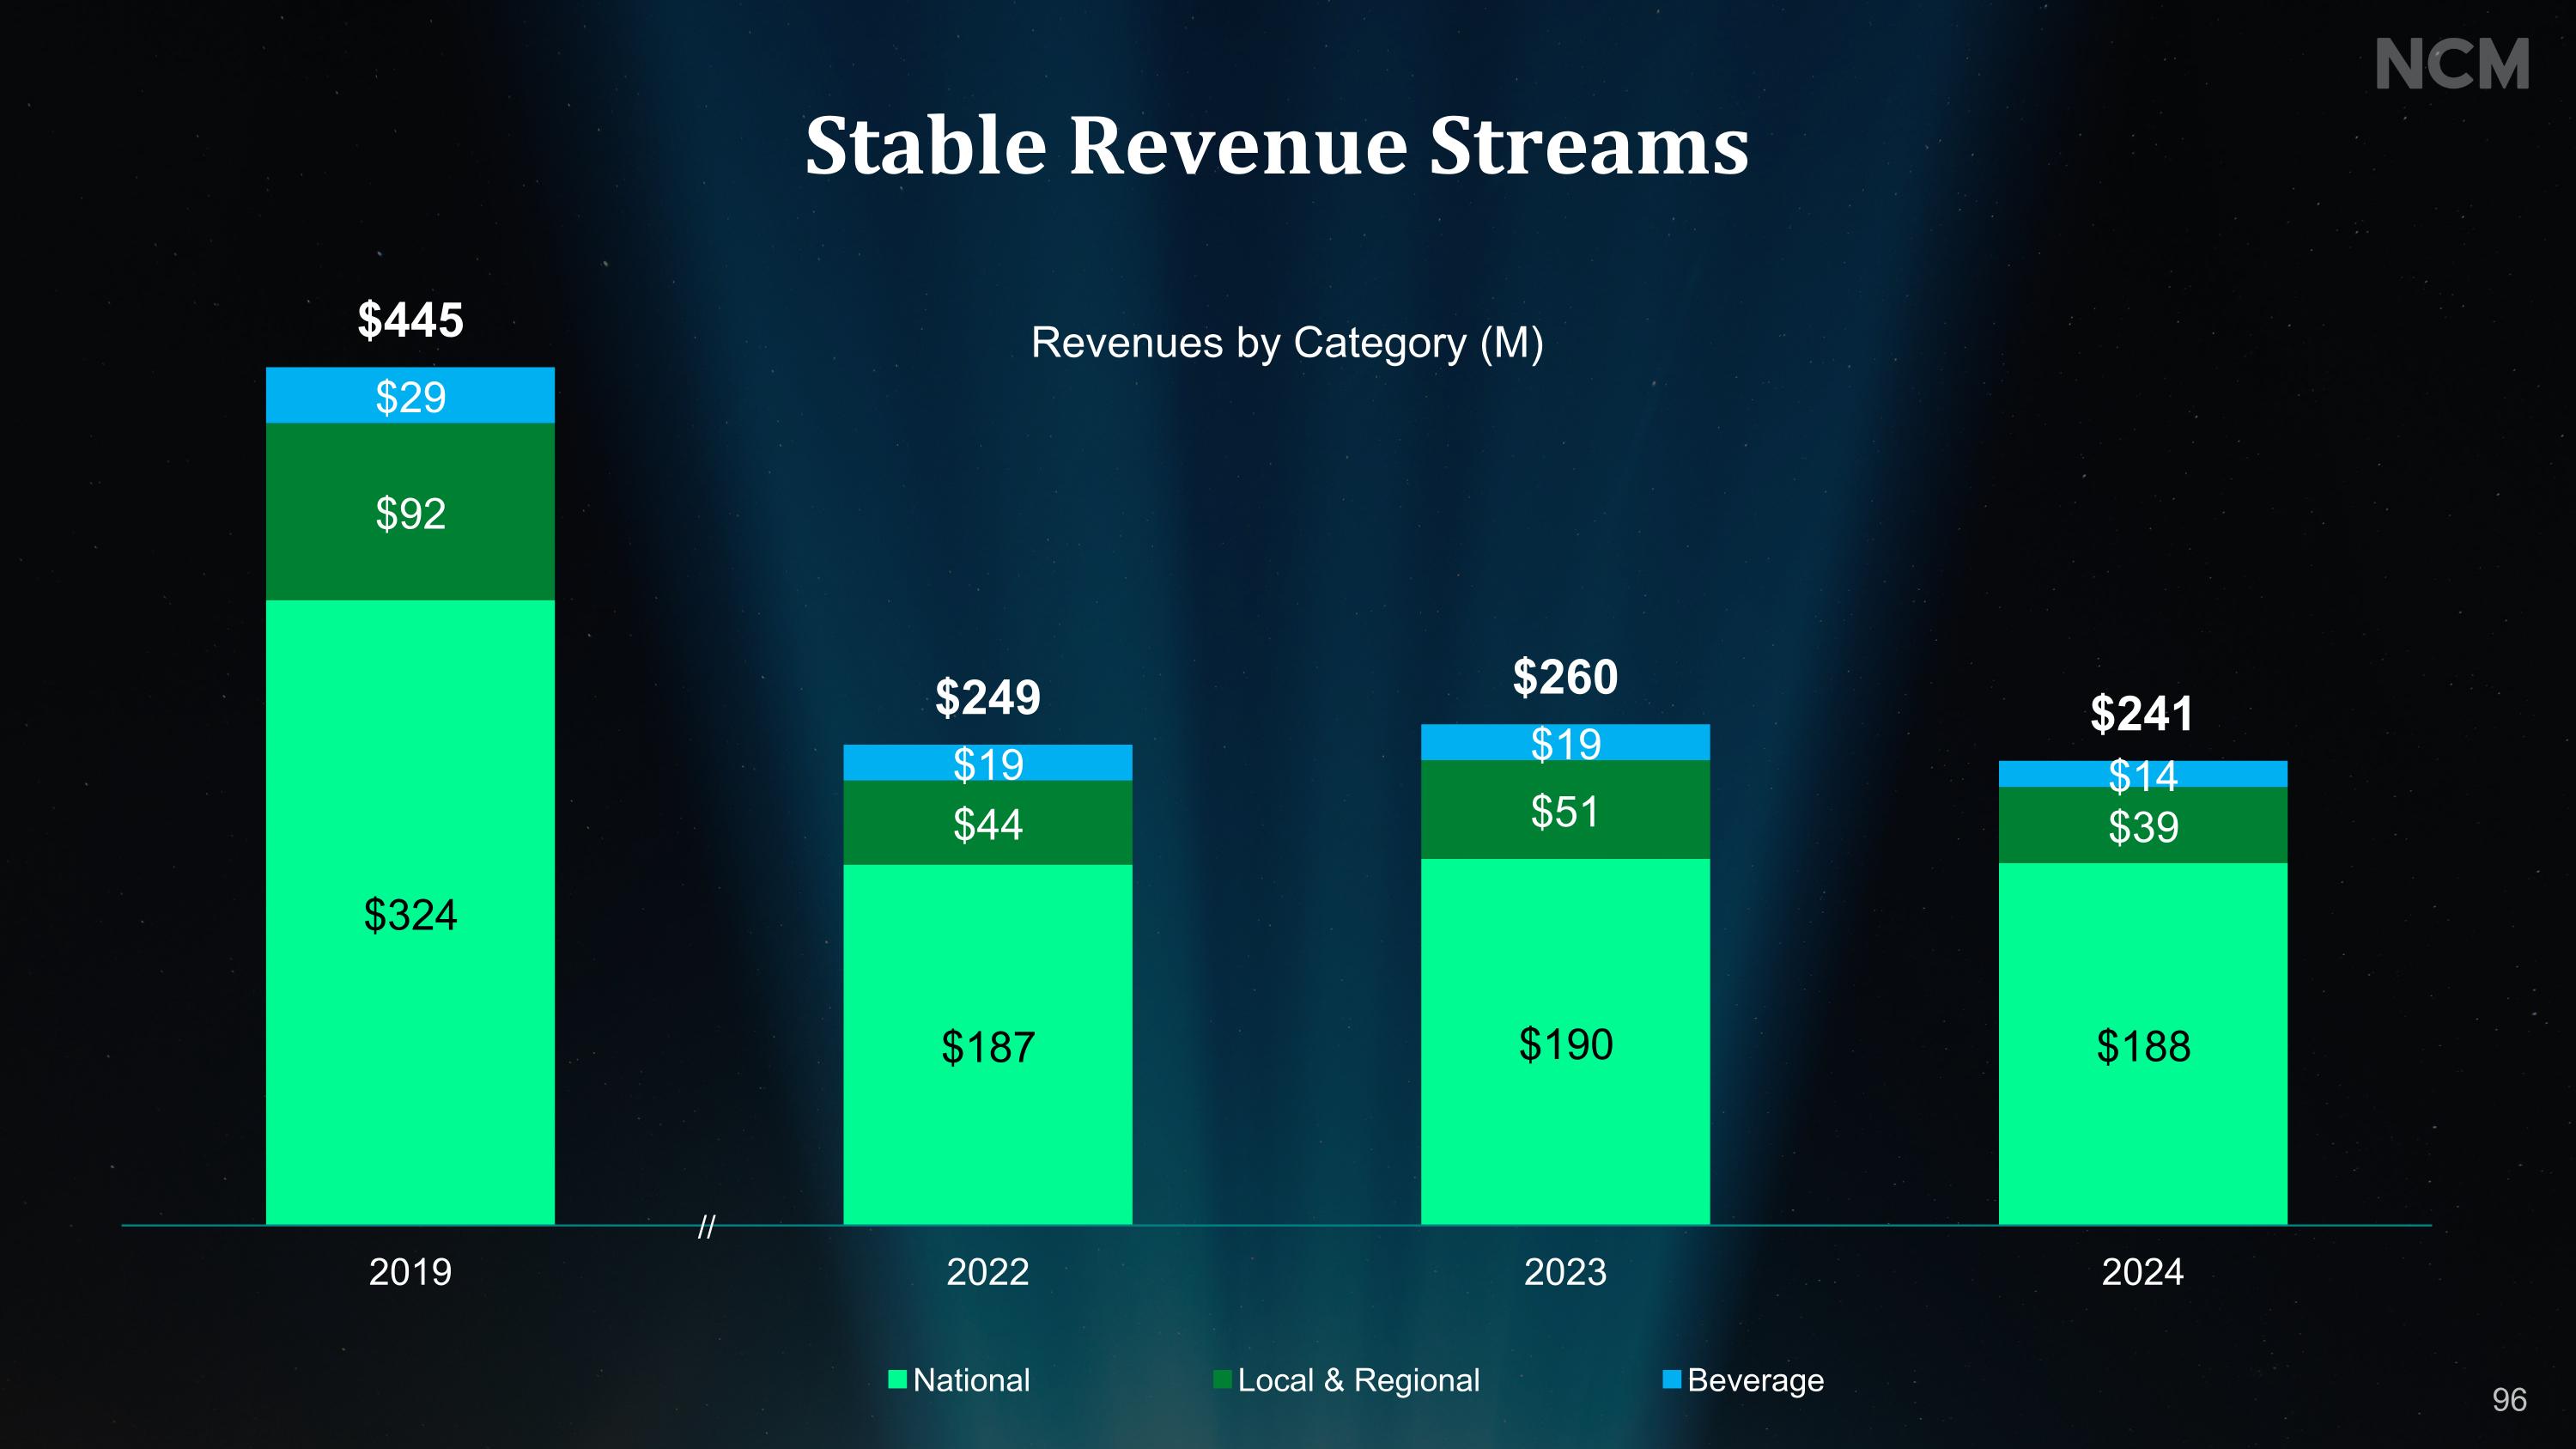
Stable Revenue Streams // Revenues by Category (M) 96

Optimizing Expenses Through Cost Initiatives Total Operating Expenses (M)* $237 $192 $207 $195 Cost Initiatives Consolidation of select business units Reductions in headcount Termination of certain network affiliate agreements // *Excluding one-time items, depreciation, amortization, and non-cash share-based compensation 97
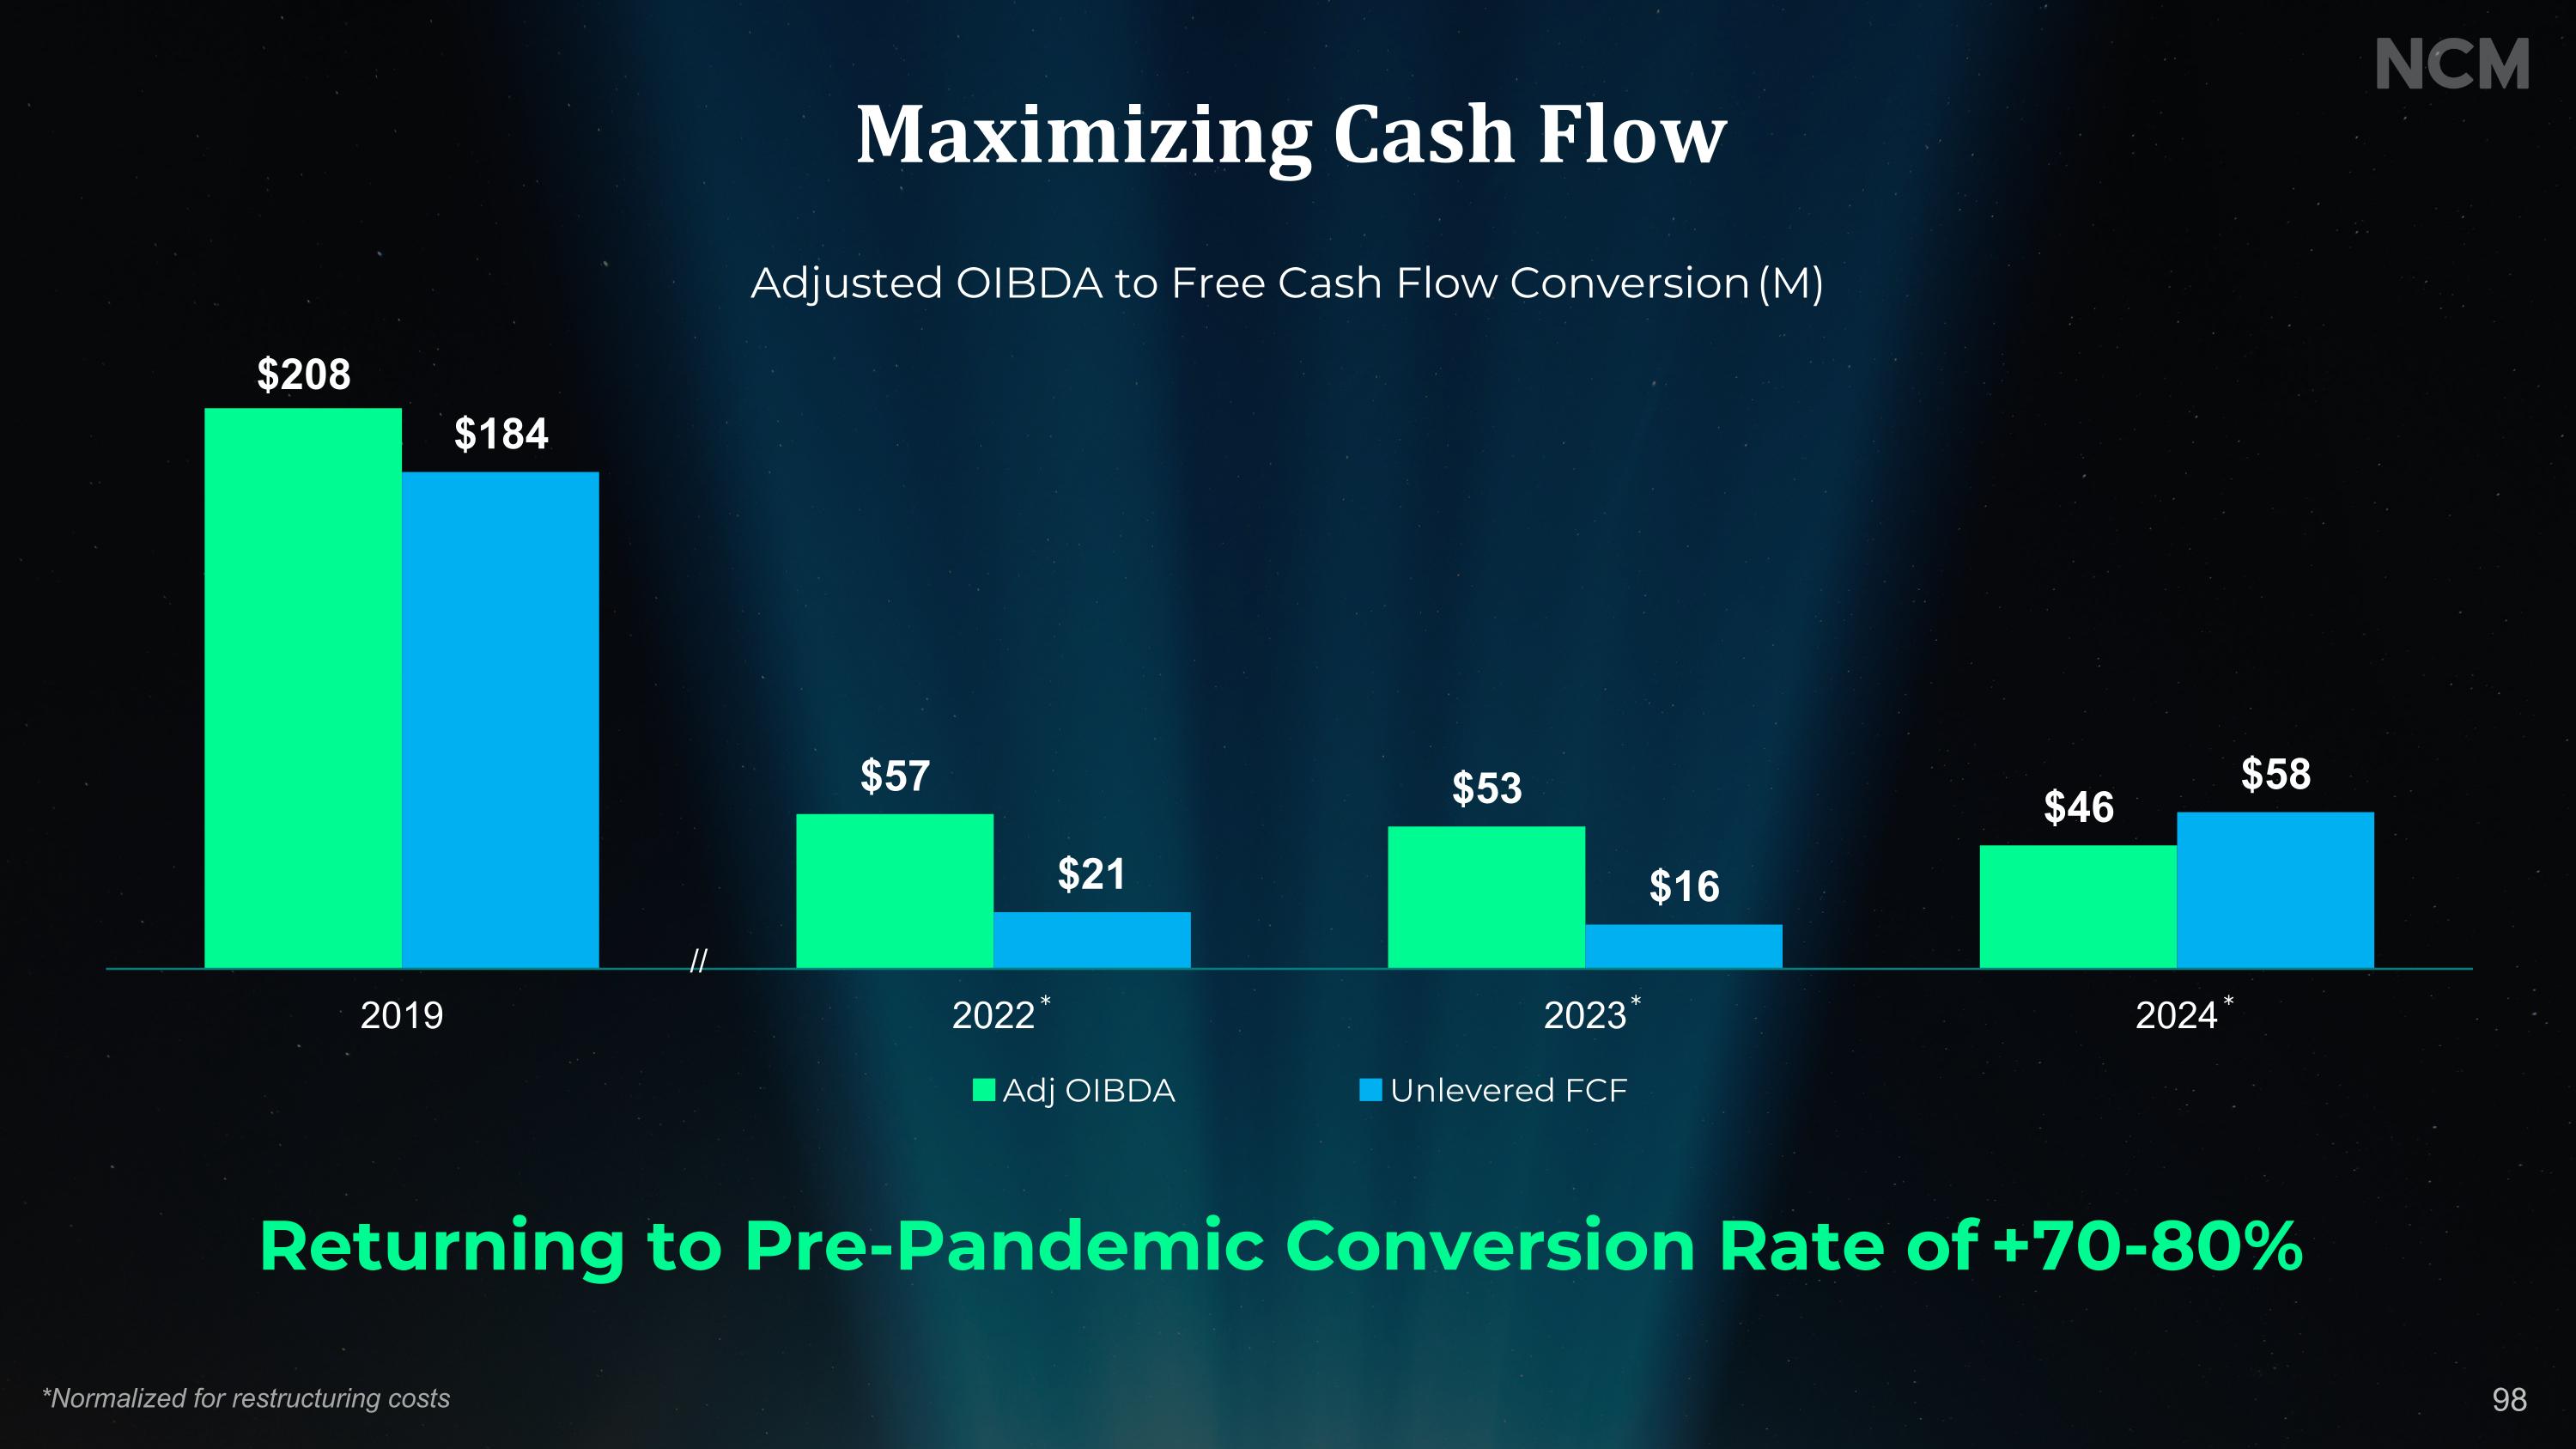
Maximizing Cash Flow Returning to Pre-Pandemic Conversion Rate of +70-80% Adjusted OIBDA to Free Cash Flow Conversion (M) * // 98 *Normalized for restructuring costs * *

CapitalAllocation

Enhancing Our Platform by Investingin Technology and Talent Strategic Data Partnerships Self-Serve Programmatic InventoryMonetization Tools New Sales Talent 100

Opportunistically Buying Back Shares 3M Total Shares Repurchased Continuing to repurchase shares at prevailing market prices to return value to shareholders Value of Shares Repurchased $17M of Shares Outstanding 3% Since launch of $100M repurchase program *As of March 3, 2025 * 101

Reintroduction of Dividend Program Attractive Tax-Deferred Dividend Utilizing $11.5 Million ofUnlevered Free Cash Flow in 2025 $0.12 Per Share Annually Paid Quarterly Record Date: March 24, 2025Payment Date: April 7, 2025 102

Outlook

2025 Box Office & Advertising Market Projections Domestic Box Office Growth Total US Core Ad Market Growth +10% 2024-2025E +8% 2024-2025E 104 Source: Wall Street Research

Q1’25 Guidance Revenue Adj. OIBDA $34.0 Million - $36.0 Million $(9.5) Million - $(7.5) Million 105

Quarterly Revenue Contribution // $445 $249 $260 $249 Revenue Contribution by Quarter (M) 106

2025 Look-Ahead Q2’25 sales pacing well ahead of prior year, signaling positive momentum for fiscal 2025 driven by: Improving content lineup Growing advertiser demand Continued expansion of client solutions 107

Increase in operational support cost New sales technology infrastructure Sales commissions from increasing revenue Investment in sales team and go-to-market initiatives SG&A to Increase HSD% YOY in FY2025 Allocation of Planned Incremental 2025 SG&A Investment 108
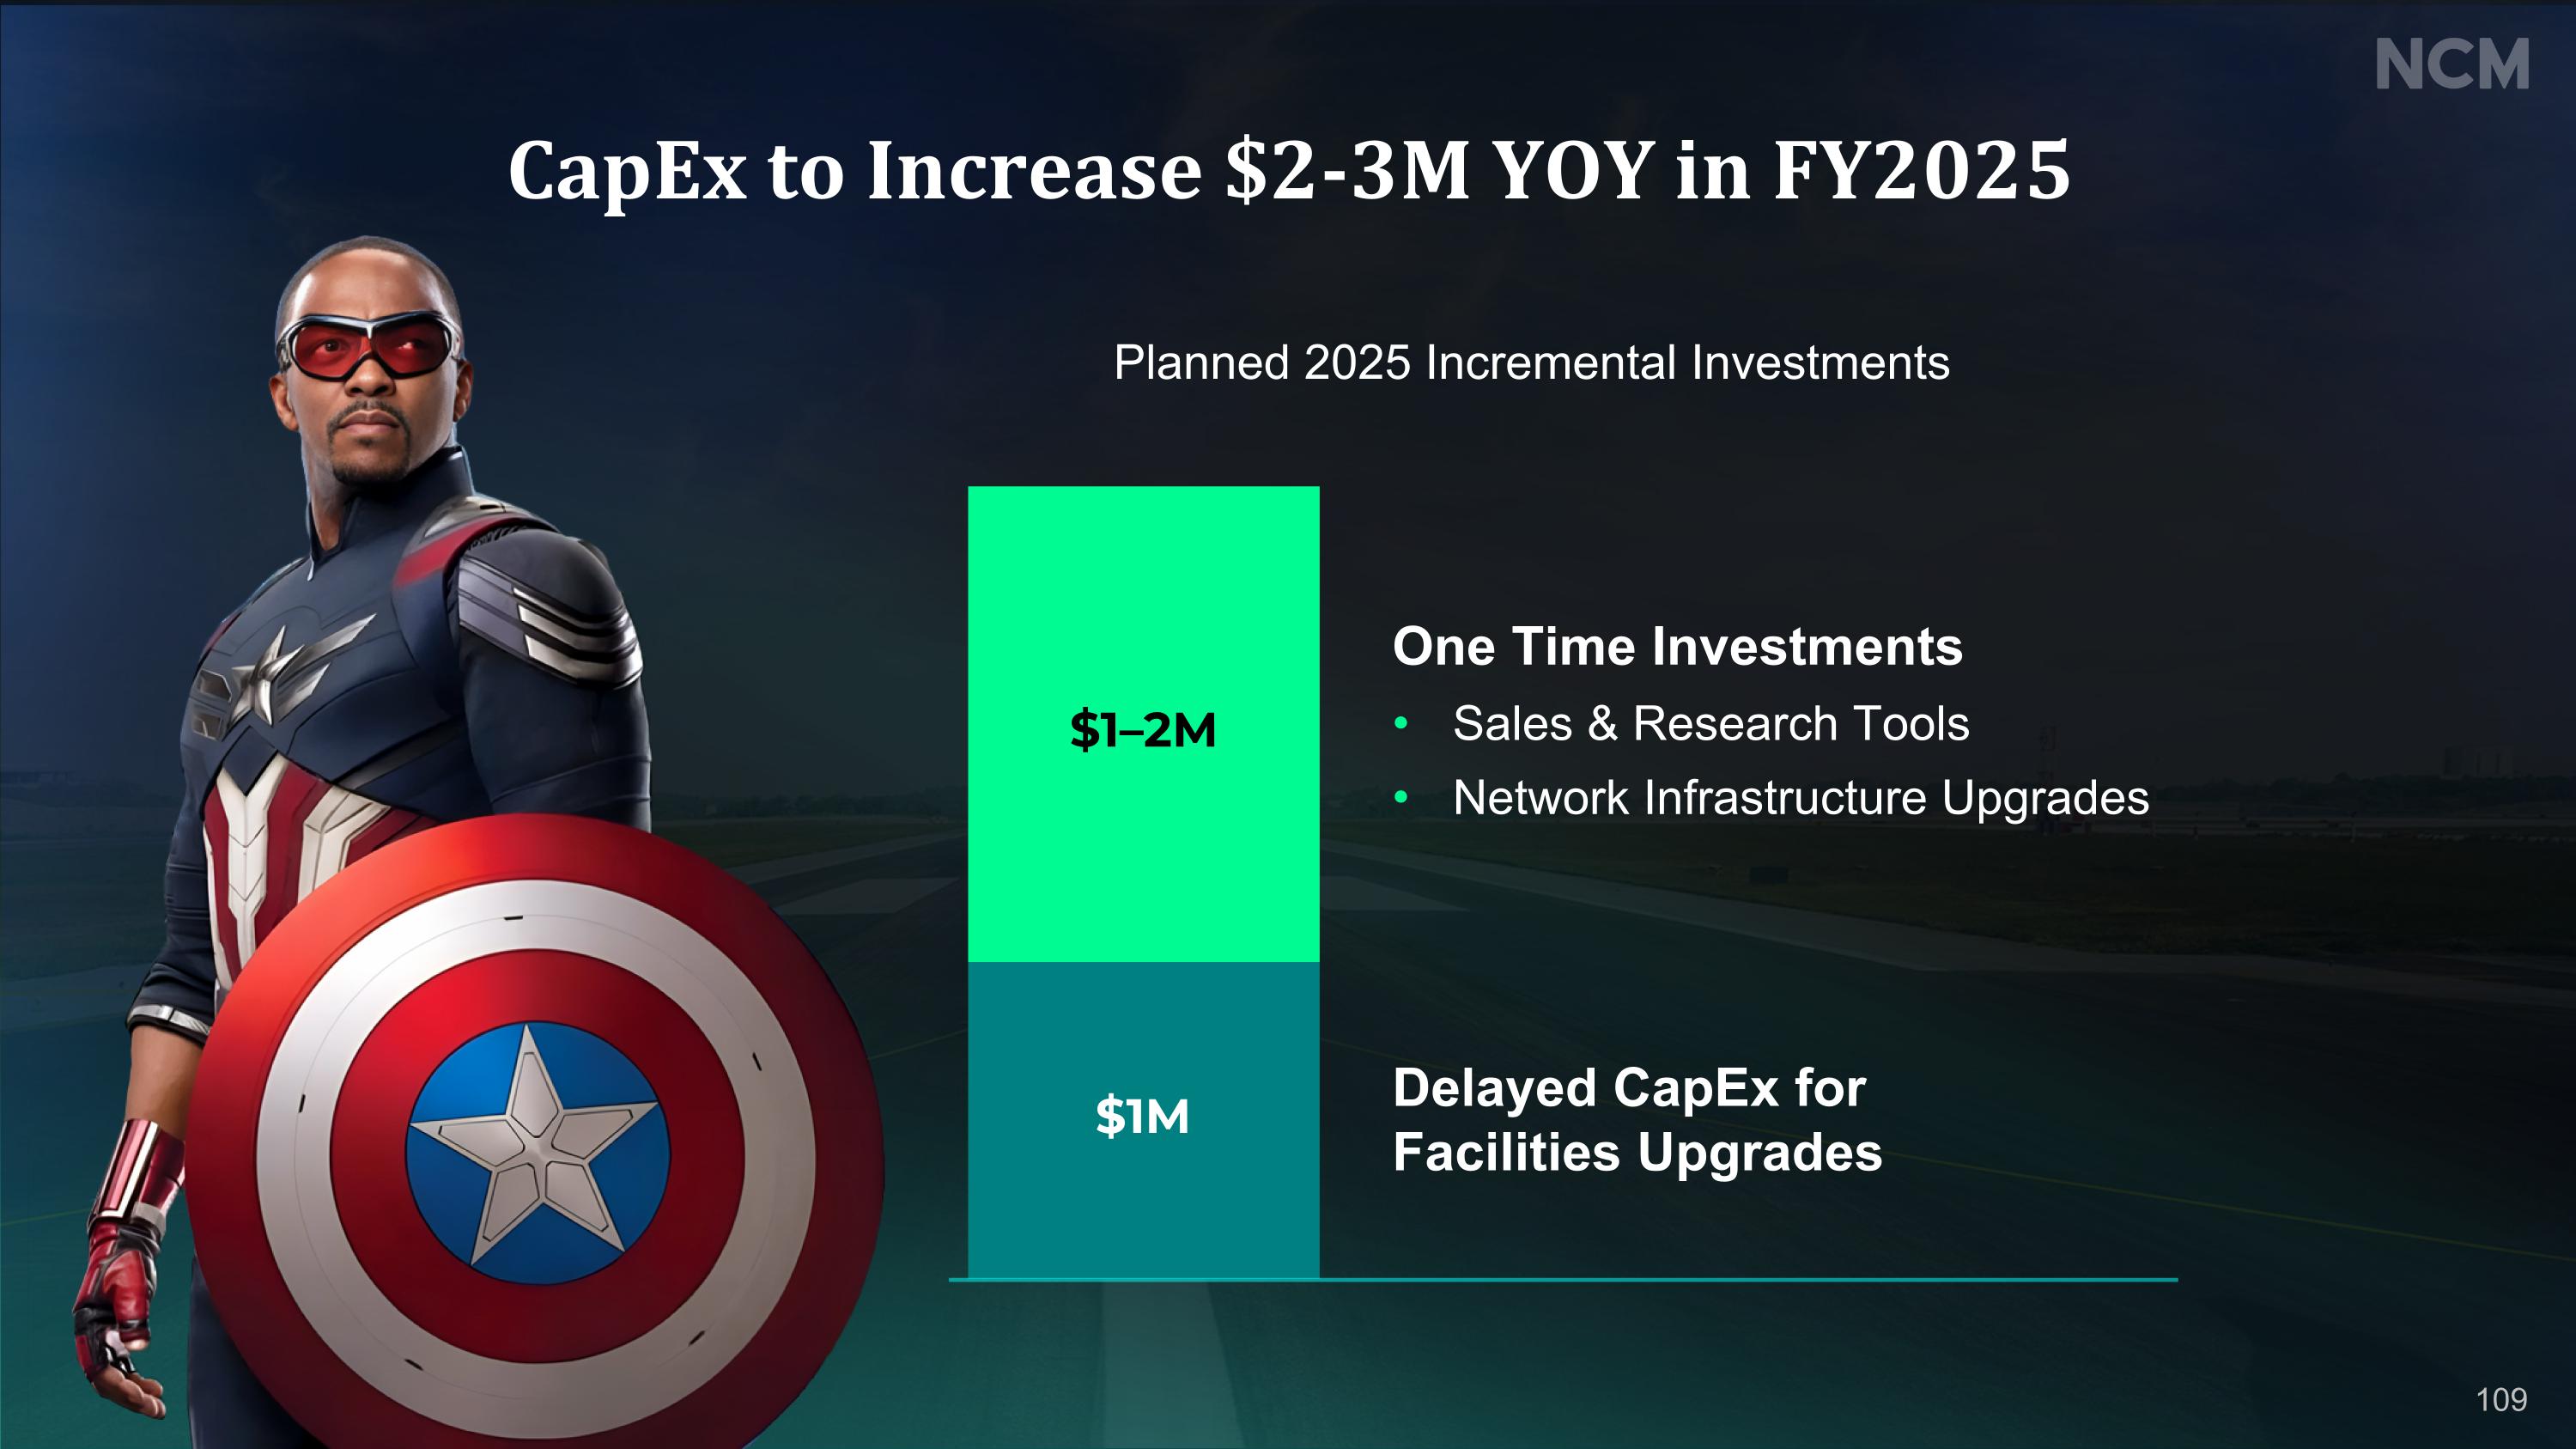
CapEx to Increase $2-3M YOY in FY2025 One Time Investments Sales & Research Tools Network Infrastructure Upgrades Delayed CapEx for Facilities Upgrades $1–2M $1M Planned 2025 Incremental Investments 109
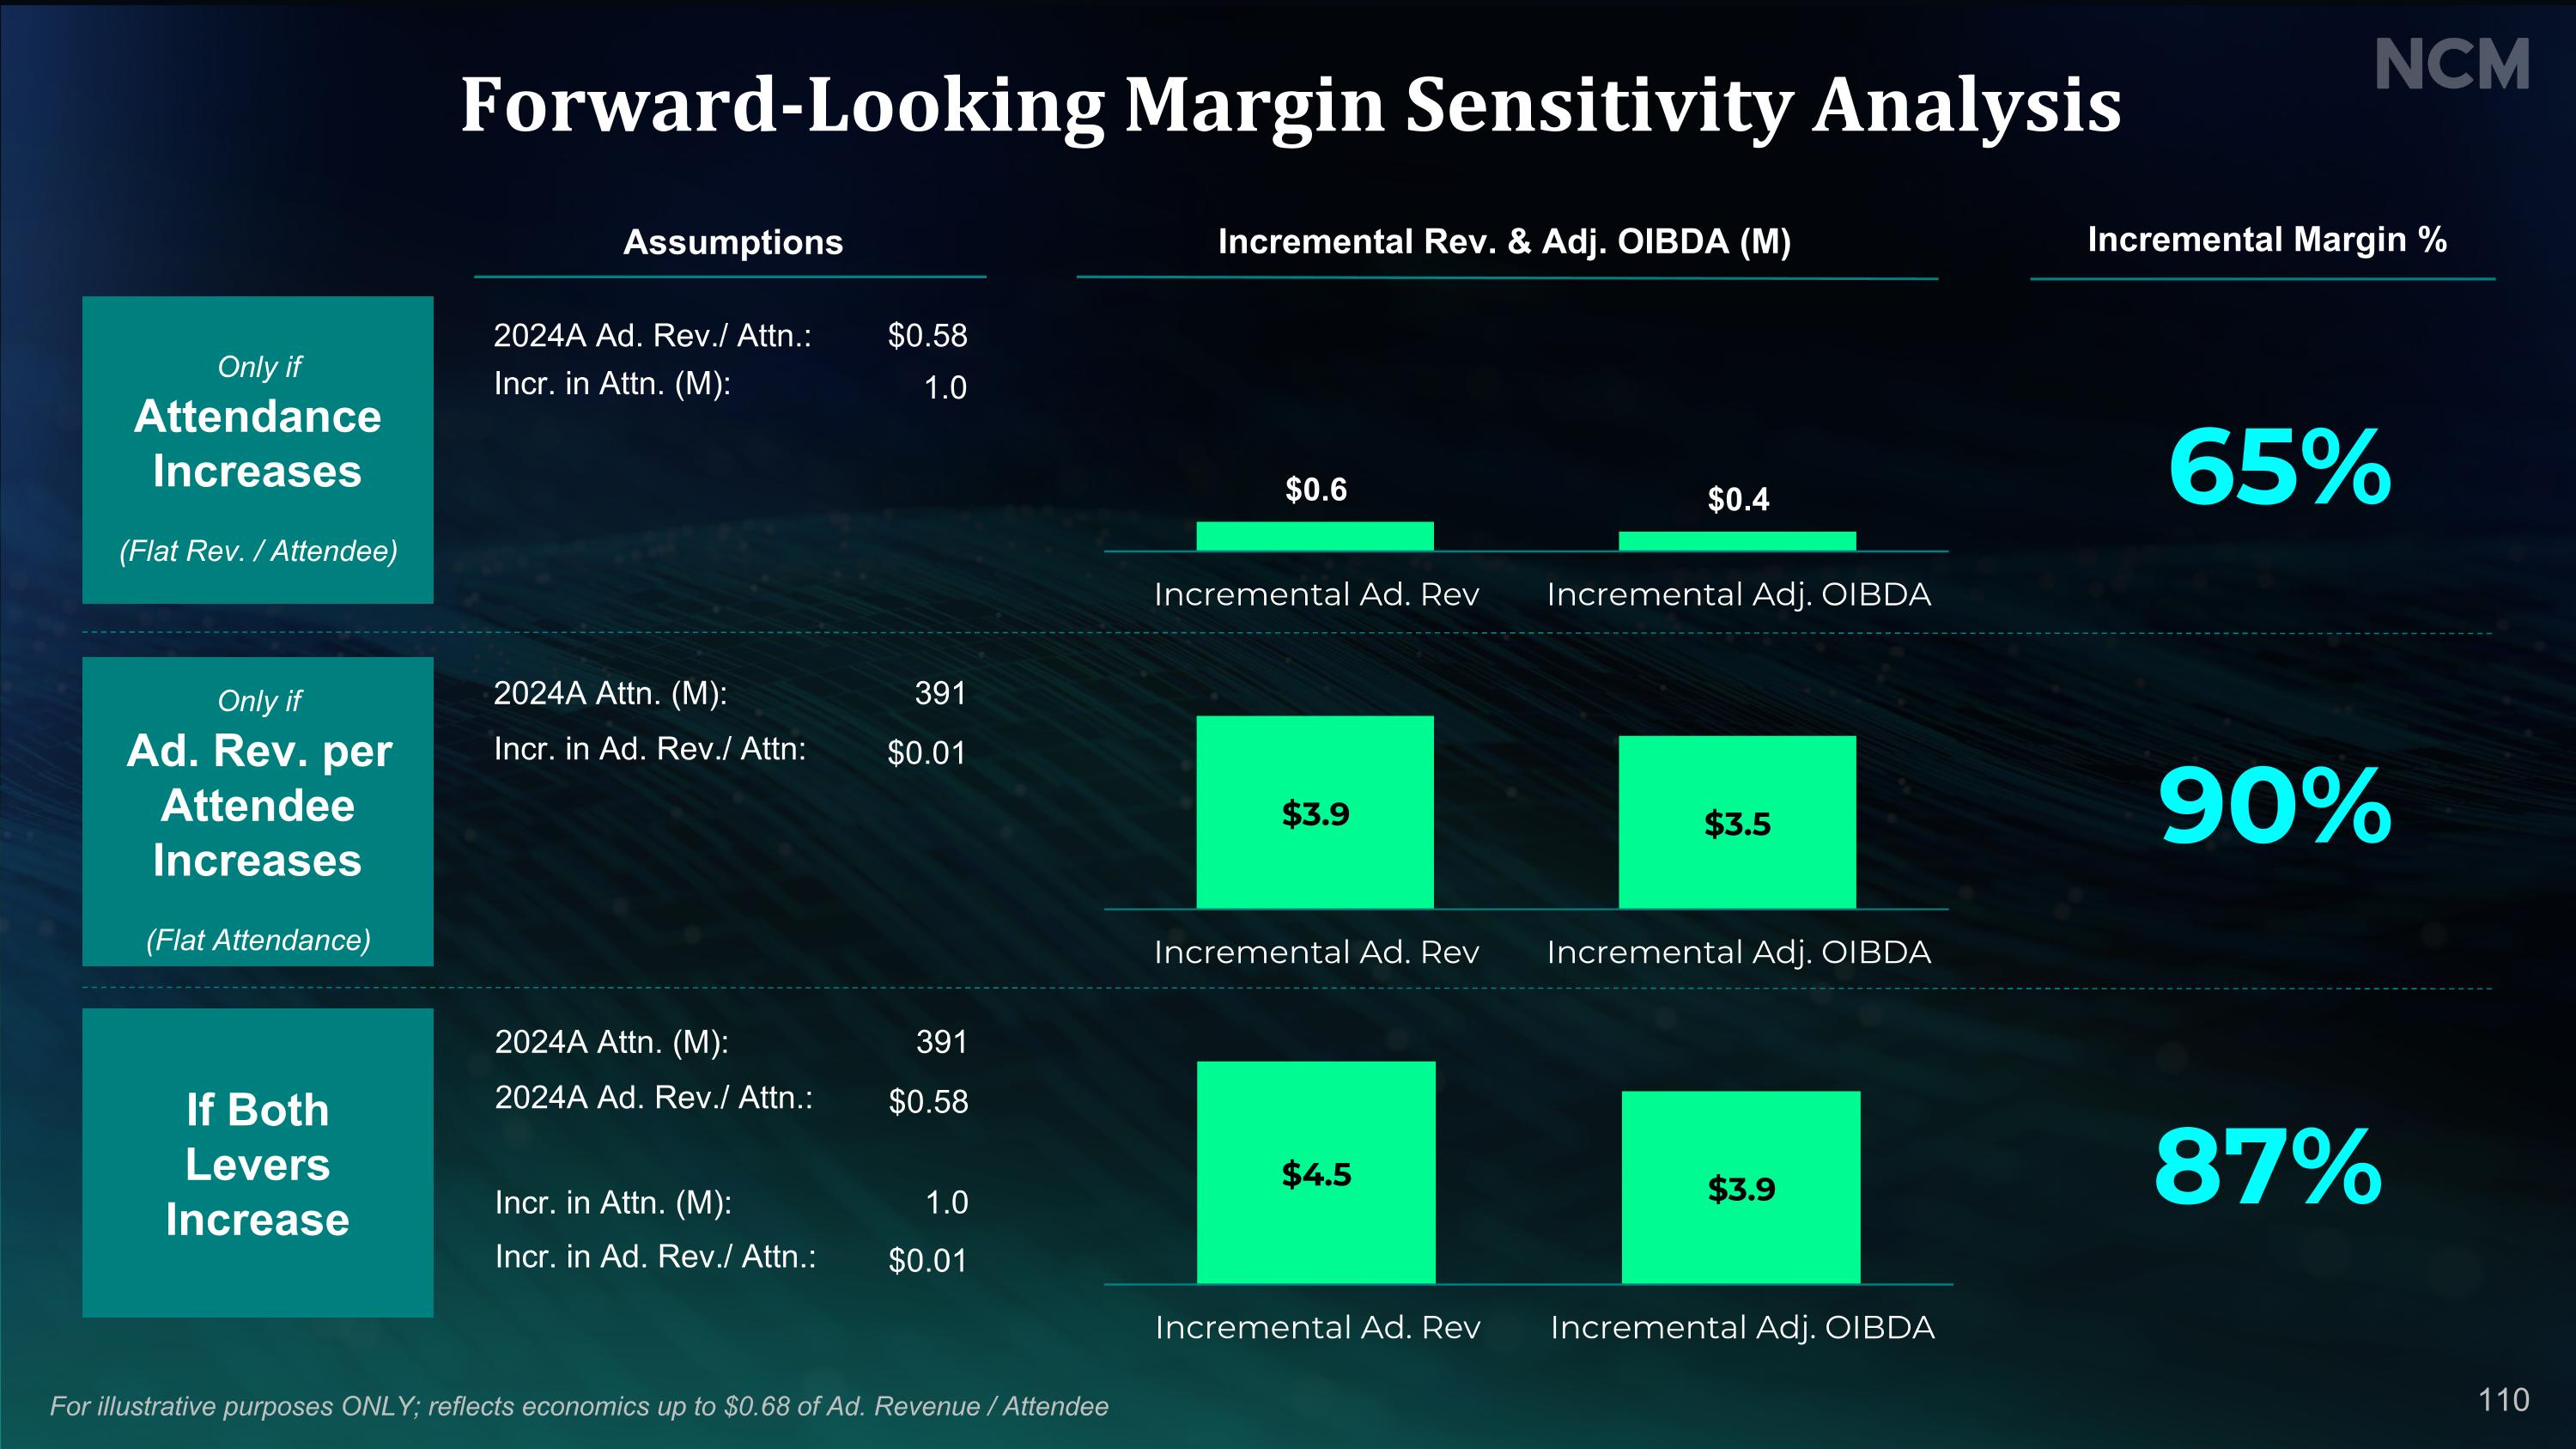
Forward-Looking Margin Sensitivity Analysis For illustrative purposes ONLY; reflects economics up to $0.68 of Ad. Revenue / Attendee Only if Attendance Increases (Flat Rev. / Attendee) Only if Ad. Rev. per Attendee Increases (Flat Attendance) If Both Levers Increase Assumptions 2024A Ad. Rev./ Attn.: Incr. in Attn. (M): $0.58 1.0 2024A Attn. (M): Incr. in Ad. Rev./ Attn: 391 $0.01 Incremental Rev. & Adj. OIBDA (M) Incremental Margin % 2024A Attn. (M): 2024A Ad. Rev./ Attn.: 391 $0.58 Incr. in Attn. (M): Incr. in Ad. Rev./ Attn.: 1.0 $0.01 65% 90% 87% 110

Well-Positioned to Drive Value Creation Attractive Industry Dynamics Premium Audience & Product Competitive Edge Compelling Financial Position 2 1 3 4 111

Q&A

Thank You

Appendix

2024 Adjusted OIBDA $45.7M $6.5M $0.4M $0.8M $2.9M $12.2M $37.8M $4.6M -$19.5M 116
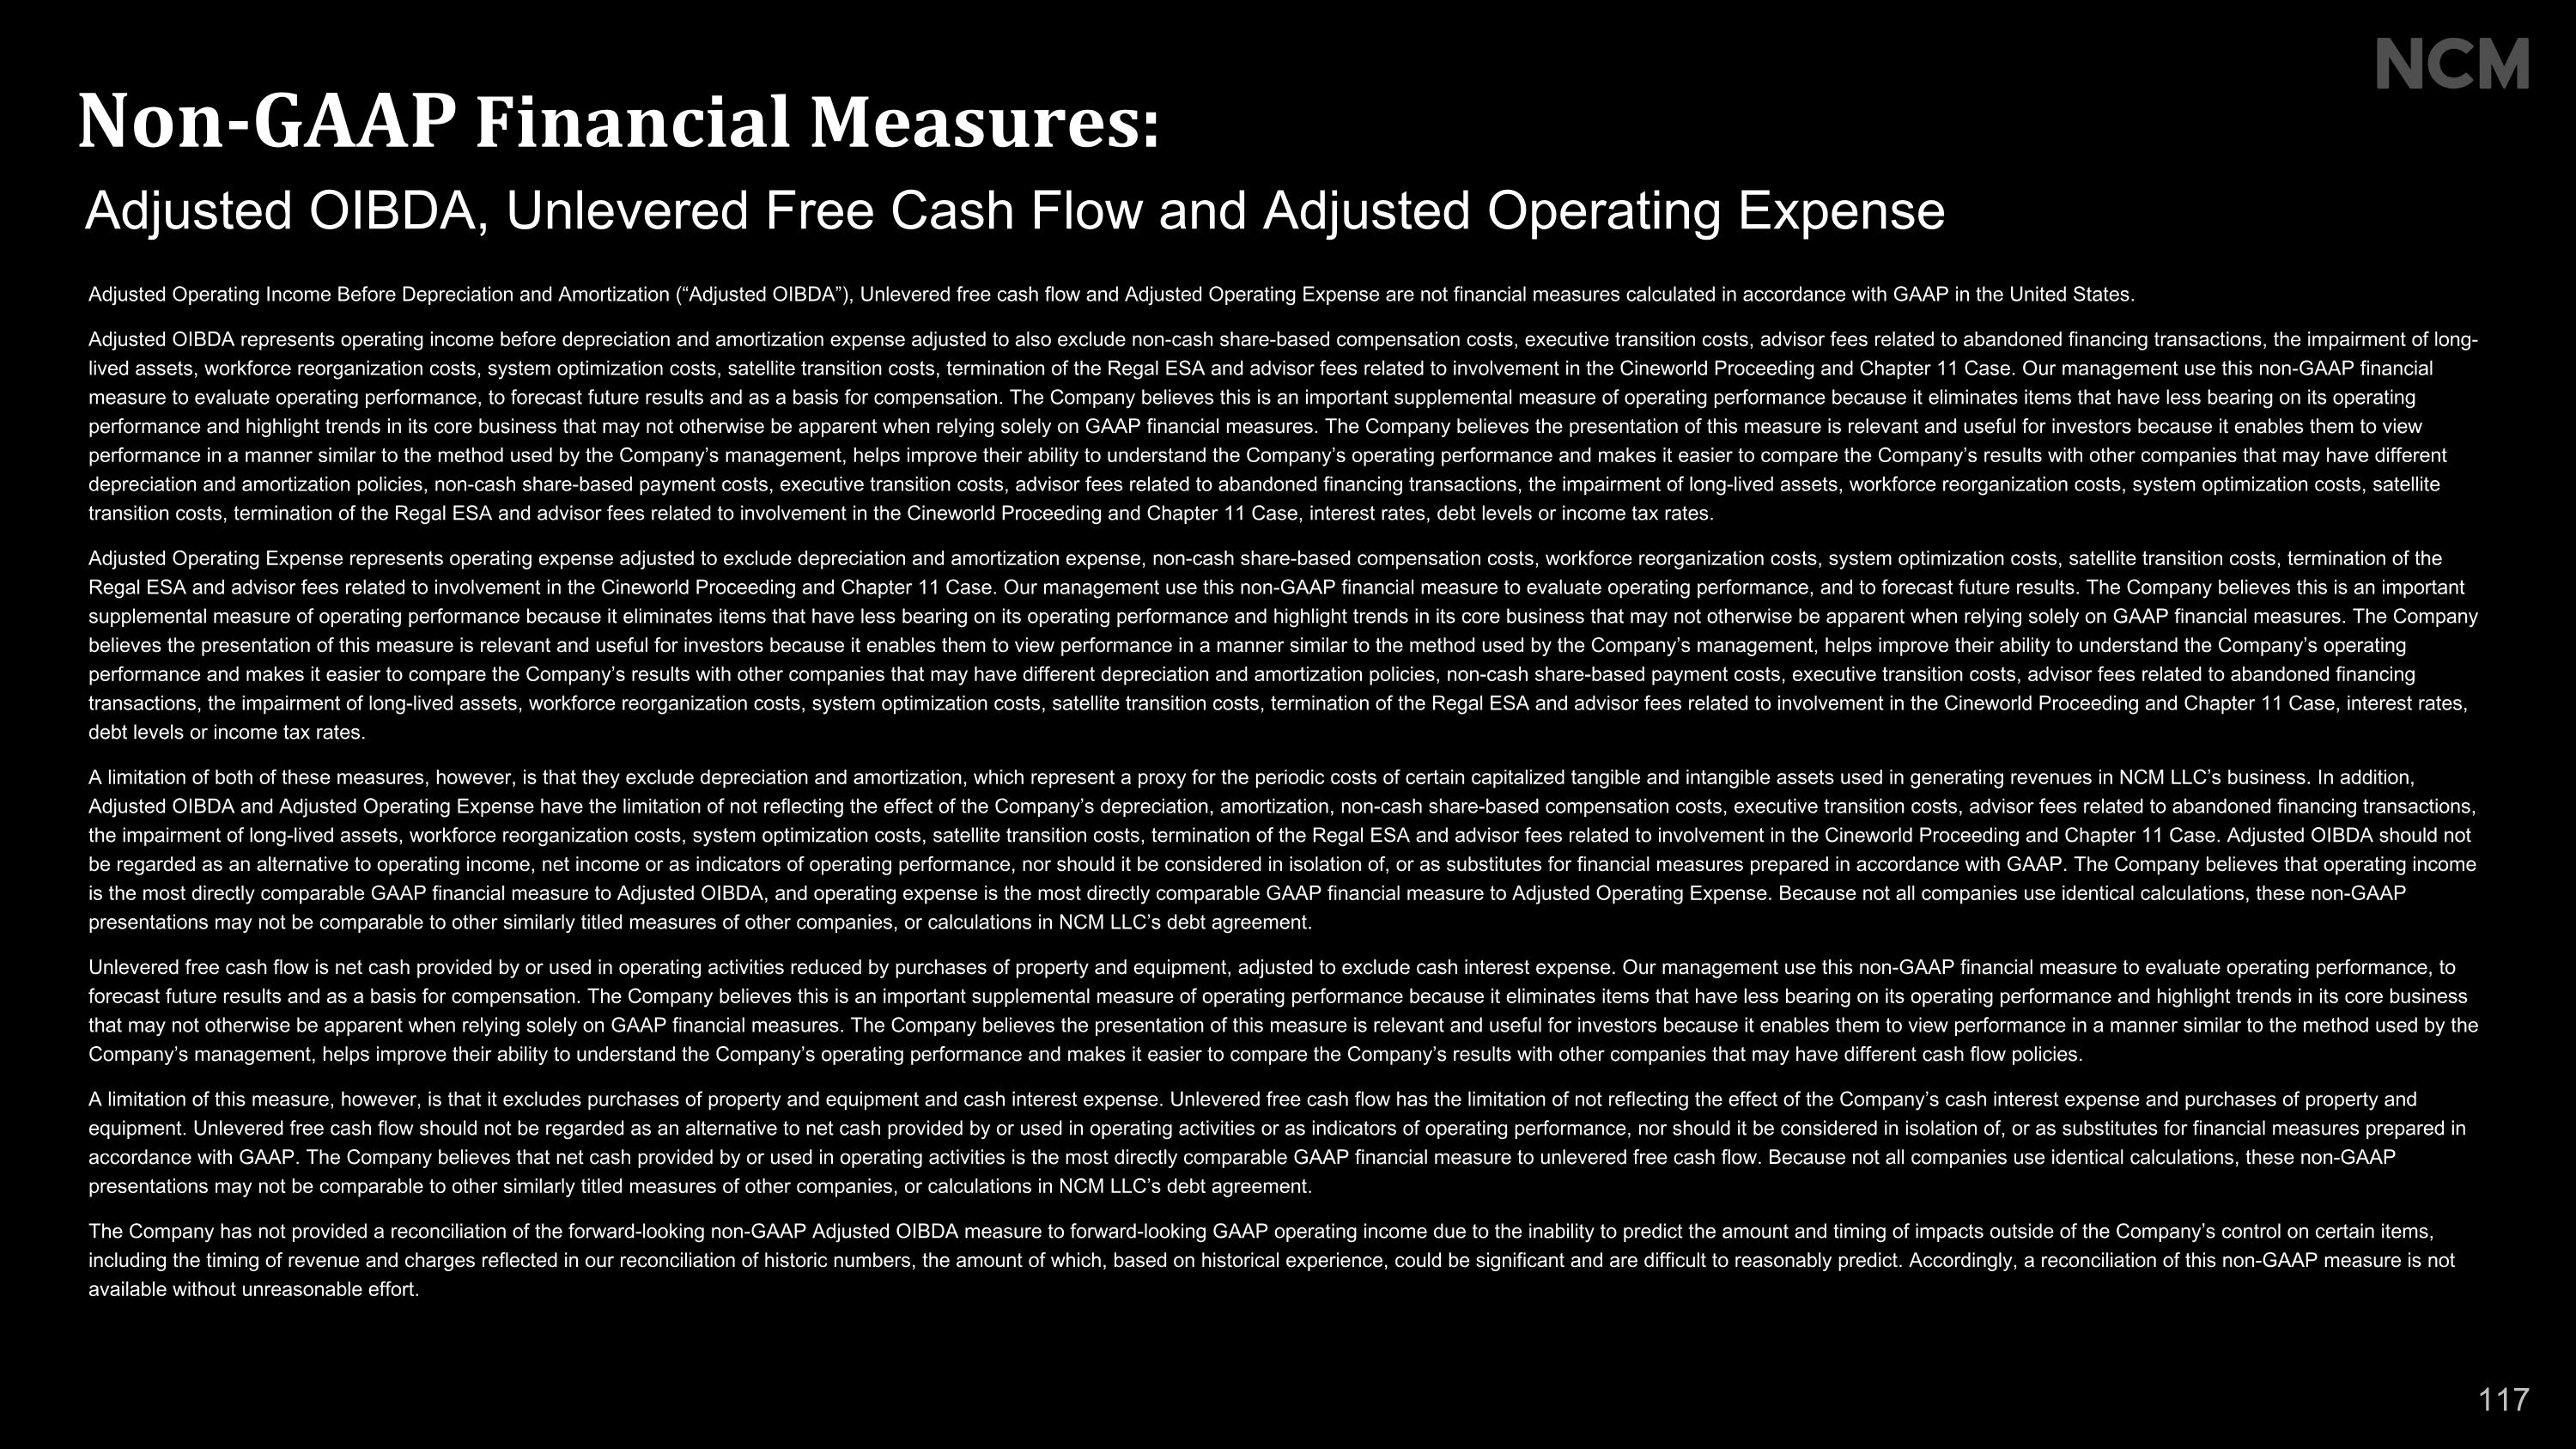
Adjusted Operating Income Before Depreciation and Amortization (“Adjusted OIBDA”), Unlevered free cash flow and Adjusted Operating Expense are not financial measures calculated in accordance with GAAP in the United States. Adjusted OIBDA represents operating income before depreciation and amortization expense adjusted to also exclude non-cash share-based compensation costs, executive transition costs, advisor fees related to abandoned financing transactions, the impairment of long-lived assets, workforce reorganization costs, system optimization costs, satellite transition costs, termination of the Regal ESA and advisor fees related to involvement in the Cineworld Proceeding and Chapter 11 Case. Our management use this non-GAAP financial measure to evaluate operating performance, to forecast future results and as a basis for compensation. The Company believes this is an important supplemental measure of operating performance because it eliminates items that have less bearing on its operating performance and highlight trends in its core business that may not otherwise be apparent when relying solely on GAAP financial measures. The Company believes the presentation of this measure is relevant and useful for investors because it enables them to view performance in a manner similar to the method used by the Company’s management, helps improve their ability to understand the Company’s operating performance and makes it easier to compare the Company’s results with other companies that may have different depreciation and amortization policies, non-cash share-based payment costs, executive transition costs, advisor fees related to abandoned financing transactions, the impairment of long-lived assets, workforce reorganization costs, system optimization costs, satellite transition costs, termination of the Regal ESA and advisor fees related to involvement in the Cineworld Proceeding and Chapter 11 Case, interest rates, debt levels or income tax rates. Adjusted Operating Expense represents operating expense adjusted to exclude depreciation and amortization expense, non-cash share-based compensation costs, workforce reorganization costs, system optimization costs, satellite transition costs, termination of the Regal ESA and advisor fees related to involvement in the Cineworld Proceeding and Chapter 11 Case. Our management use this non-GAAP financial measure to evaluate operating performance, and to forecast future results. The Company believes this is an important supplemental measure of operating performance because it eliminates items that have less bearing on its operating performance and highlight trends in its core business that may not otherwise be apparent when relying solely on GAAP financial measures. The Company believes the presentation of this measure is relevant and useful for investors because it enables them to view performance in a manner similar to the method used by the Company’s management, helps improve their ability to understand the Company’s operating performance and makes it easier to compare the Company’s results with other companies that may have different depreciation and amortization policies, non-cash share-based payment costs, executive transition costs, advisor fees related to abandoned financing transactions, the impairment of long-lived assets, workforce reorganization costs, system optimization costs, satellite transition costs, termination of the Regal ESA and advisor fees related to involvement in the Cineworld Proceeding and Chapter 11 Case, interest rates, debt levels or income tax rates. A limitation of both of these measures, however, is that they exclude depreciation and amortization, which represent a proxy for the periodic costs of certain capitalized tangible and intangible assets used in generating revenues in NCM LLC’s business. In addition, Adjusted OIBDA and Adjusted Operating Expense have the limitation of not reflecting the effect of the Company’s depreciation, amortization, non-cash share-based compensation costs, executive transition costs, advisor fees related to abandoned financing transactions, the impairment of long-lived assets, workforce reorganization costs, system optimization costs, satellite transition costs, termination of the Regal ESA and advisor fees related to involvement in the Cineworld Proceeding and Chapter 11 Case. Adjusted OIBDA should not be regarded as an alternative to operating income, net income or as indicators of operating performance, nor should it be considered in isolation of, or as substitutes for financial measures prepared in accordance with GAAP. The Company believes that operating income is the most directly comparable GAAP financial measure to Adjusted OIBDA, and operating expense is the most directly comparable GAAP financial measure to Adjusted Operating Expense. Because not all companies use identical calculations, these non-GAAP presentations may not be comparable to other similarly titled measures of other companies, or calculations in NCM LLC’s debt agreement. Unlevered free cash flow is net cash provided by or used in operating activities reduced by purchases of property and equipment, adjusted to exclude cash interest expense. Our management use this non-GAAP financial measure to evaluate operating performance, to forecast future results and as a basis for compensation. The Company believes this is an important supplemental measure of operating performance because it eliminates items that have less bearing on its operating performance and highlight trends in its core business that may not otherwise be apparent when relying solely on GAAP financial measures. The Company believes the presentation of this measure is relevant and useful for investors because it enables them to view performance in a manner similar to the method used by the Company’s management, helps improve their ability to understand the Company’s operating performance and makes it easier to compare the Company’s results with other companies that may have different cash flow policies. A limitation of this measure, however, is that it excludes purchases of property and equipment and cash interest expense. Unlevered free cash flow has the limitation of not reflecting the effect of the Company’s cash interest expense and purchases of property and equipment. Unlevered free cash flow should not be regarded as an alternative to net cash provided by or used in operating activities or as indicators of operating performance, nor should it be considered in isolation of, or as substitutes for financial measures prepared in accordance with GAAP. The Company believes that net cash provided by or used in operating activities is the most directly comparable GAAP financial measure to unlevered free cash flow. Because not all companies use identical calculations, these non-GAAP presentations may not be comparable to other similarly titled measures of other companies, or calculations in NCM LLC’s debt agreement. The Company has not provided a reconciliation of the forward-looking non-GAAP Adjusted OIBDA measure to forward-looking GAAP operating income due to the inability to predict the amount and timing of impacts outside of the Company’s control on certain items, including the timing of revenue and charges reflected in our reconciliation of historic numbers, the amount of which, based on historical experience, could be significant and are difficult to reasonably predict. Accordingly, a reconciliation of this non-GAAP measure is not available without unreasonable effort. Adjusted OIBDA, Unlevered Free Cash Flow and Adjusted Operating Expense Non-GAAP Financial Measures: 117

(1) Share-based compensation costs are included in network operations, selling and marketing and administrative expense in NCM LLC’s unaudited Condensed Consolidated Financial Statements. (2) Chief Executive Officer transition costs represent severance, consulting and related other costs and are included in administrative expense in the accompanying financial tables. (3) The impairment of long-lived assets primarily relates to the write down of certain internally developed software no longer in use or acquired. (4) Workforce reorganization costs represents redundancy costs associated with changes to the Company’s workforce primarily implemented during the first quarter of 2024, as well as related office relocations. (5) The net impact of Regal’s termination of the ESA resulting from the disposal of the intangible asset partially offset by the surrender of Regal’s ownership in the Company and the forgiveness of prepetition claims. (6) One-time costs of transitioning satellite providers in the second and third quarter of 2024. (7) System optimization costs represents costs incurred related to a one-time assessment of the technology surrounding the Company's programmatic offerings incurred in the third quarter of 2024. (8) Advisor and legal fees and expenses incurred in connection with the Company’s involvement in the Cineworld Proceeding and Chapter 11 Case and related litigation during the first, second and third quarter of 2024, as well as retention related expenses and retainers to the members of the special and restructuring committees of the Company's Board of Directors during the first, second and third quarter of 2023. (9) Represents cash transactions related to advisor and legal fees and expenses incurred in connection with the Company’s involvement in the Cineworld Proceeding and Chapter 11 Case as noted on Note 8. Adjusted OIBDA and Unlevered Free Cash Flow Reconciliation for NCM, LLC (dollars in millions) Year Ended (unaudited) December 26, 2019 December 29, 2022 December 28, 2023 December 26, 2024 Operating loss $ 161.3 $ 6.9 $ (180.9) $ (19.5) Depreciation expense 13.6 6.5 4.6 4.6 Amortization expense 26.7 25.0 29.8 37.8 Share-based compensation costs (1) 5.5 7.1 5.5 12.2 Executive transition costs (2) 0.4 — — — Advisor fees related to abandoned financing transactions — 0.5 — — Impairment of long-lived assets (3) — 5.8 8.9 — Workforce reorganization costs (4) — 0.4 — 2.9 Loss on termination of Regal ESA, net (5) — — 125.6 — Satellite transition costs (6) — — — 0.8 System optimization costs (7) — — — 0.4 Fees and expenses related to the Cineworld Proceeding and Chapter 11 Case included within Operating Income (8) — 5.1 59.2 6.5 Adjusted OIBDA $ 207.5 $ 57.3 $ 52.7 $ 45.7 Net cash provided by/(used in) operating activities $ 143.6 $ (47.3) $ (44.8) $ 60.3 Purchases of property and equipment (14.0) (2.9) (4.0) (5.8) Cash interest expense 54.3 66.5 12.5 0.9 Unlevered Free Cash Flow $ 183.9 $ 16.3 $ (36.3) $ 55.4 Restructuring costs (9) — 5.1 52.7 2.6 Adjusted Unlevered Free Cash Flow $ 183.9 $ 21.4 $ 16.4 $ 58.0 118

Adjusted Operating Expense Reconciliation for NCM, LLC (dollars in millions) Year Ended (unaudited) December 26, 2019 December 29, 2022 December 28, 2023 December 26, 2024 Operating Expense $ 283.5 $ 242.3 $ 440.7 $ 260.3 Depreciation expense (13.6) (6.5) (4.6) (4.6) Amortization expense (26.7) (25.0) (29.8) (37.8) Share-based compensation costs (1) (5.5) (7.1) (5.5) (12.2) Executive transition costs (2) (0.4) — — — Advisor fees related to abandoned financing transactions — (0.5) — — Impairment of long-lived assets (3) — (5.8) (8.9) — Workforce reorganization costs (4) — (0.4) — (2.9) Loss on termination of Regal ESA, net (5) — — (125.6) — Satellite transition costs (6) — — — (0.8) System optimization costs (7) — — — (0.4) Fees and expenses related to the Cineworld Proceeding and Chapter 11 Case included within Operating Income (8) — (5.1) (59.2) (6.5) Adjusted Operating Expense $ 237.3 $ 191.9 $ 207.1 $ 195.1 (1) Share-based compensation costs are included in network operations, selling and marketing and administrative expense in NCM LLC’s unaudited Condensed Consolidated Financial Statements. (2) Chief Executive Officer transition costs represent severance, consulting and related other costs and are included in administrative expense in the accompanying financial tables. (3) The impairment of long-lived assets primarily relates to the write down of certain internally developed software no longer in use or acquired. (4) Workforce reorganization costs represents redundancy costs associated with changes to the Company’s workforce primarily implemented during the first quarter of 2024, as well as related office relocations. (5) The net impact of Regal’s termination of the ESA resulting from the disposal of the intangible asset partially offset by the surrender of Regal’s ownership in the Company and the forgiveness of prepetition claims. (6) One-time costs of transitioning satellite providers in the second and third quarter of 2024. (7) System optimization costs represents costs incurred related to a one-time assessment of the technology surrounding the Company's programmatic offerings incurred in the third quarter of 2024. (8) Advisor and legal fees and expenses incurred in connection with the Company’s involvement in the Cineworld Proceeding and Chapter 11 Case and related litigation during the first, second and third quarter of 2024, as well as retention related expenses and retainers to the members of the special and restructuring committees of the Company's Board of Directors during the first, second and third quarter of 2023. 119

Investor Contact Media Contact Chan Park Doug Serton investors@ncm.com press@ncm.com 120
Exhibit 99.2
NCM Unveils Strategic Growth Opportunities for Long-Term Shareholder Value Creation
at 2025 Investor Day
Reintroduces annual dividend of $0.12 per share
Provides plans to accelerate advertising growth through investment in technology and talent
Centennial, CO - March 13, 2025 - National CineMedia, Inc. (NASDAQ: NCMI) (“the Company” or “NCM”), the managing member and owner of approximately 100% of National CineMedia, LLC (“NCM LLC”), the operator of the largest cinema advertising platform in the U.S., today will host its 2025 Investor Day in New York, New York. The Company will outline its strategic market position, compelling financial position, and key growth initiatives. The Company will also discuss its investments in technology and talent across the business to enhance NCM’s platform, capture growth within premium video advertising, and drive shareholder returns, including:
“We are excited to share our strategic vision for the future of NCM with the investment community today. This is an important opportunity to showcase the strength of our business, the progress we’ve made over the last several years, and the steps we are taking to capitalize on the significant opportunities ahead,” said Tom Lesinski, Chief Executive Officer. “Our reintroduced dividend program underscores our confidence in our business trajectory and reaffirms our commitment to delivering long-term value to our shareholders. With unmatched scale and an industry-leading data platform, we continue to prove that cinema delivers high-impact, performance-driven advertising to engaged, young, and hard-to-reach audiences.”
Reintroduces Quarterly Dividend Program
NCM remains focused on returning value to shareholders as it continues to make strategic investments in business growth. The Company announced that its Board of Directors has declared an annual cash dividend of $0.12 per share of outstanding common stock, paid quarterly, which at current share prices would imply an approximate annual dividend yield of 2.2%. The first dividend payment will be made on April 7, 2025, to shareholders of record as of the close of business on March 24, 2025. For tax purposes, this dividend is expected to be treated as a return of capital to shareholders.
The Company is confident that it will have the capacity to sustain the amount of the dividend in the future. Additionally, the Company plans to accelerate share repurchases under its $100 million share repurchase program, which runs through 2027.
Introduces NCMx Bullseye
NCM introduced Bullseye, the latest addition to its NCMx™ suite, leveraging AI-generated creative to deliver dynamic, hyper-localized messaging at scale. By integrating key signals such as designated market area, geo-targeting, local offers, and audience insights, Bullseye enables advertisers to optimize campaigns with precision across the NCM network. Bullseye joins Boomerang and Boost in NCMx’s premier suite of data-driven solutions, further solidifying NCM’s leadership as a performance-driven, premium video platform.
Event and Presentation Details
How to Participate: The Investor Day event will be accessible to all interested parties via live webcast starting at 3:00 PM ET on the Company's Investor Relations website at https://investor.ncm.com/news/events. A replay of the conference and the presentation materials will be available on the Investor Relations website following the event.
|
|
|
Exhibit 99.2
The Investor Day will include presentations from NCM Chief Executive Officer Tom Lesinski, Chief Financial Officer Ronnie Ng, President Catherine Sullivan, and Chief Data and Innovation Officer Manu Singh. The event will also include a panel discussion with Sara Light, U.S. and LATAM Brand Media Lead of Expedia Group, and Chris Poydenis, Chief Revenue Officer at Influential, moderated by Sullivan. The presentations and panel will be followed by a question-and-answer session with NCM management.
About National CineMedia, Inc.
National CineMedia, Inc. (NCM, NASDAQ:NCMI) is the largest cinema advertising platform in the US. With unparalleled reach and scale, NCM connects brands to sought-after young, diverse audiences through the power of movies and pop culture. A premium video, full-funnel marketing solution for advertisers, NCM enhances marketers' ability to measure and drive results. NCM’s Noovie® Show is presented exclusively in 42 leading national and regional theater circuits including the only three national chains, AMC Entertainment Inc. (NYSE:AMC), Cinemark Holdings, Inc. (NYSE:CNK) and Regal Entertainment Group (a subsidiary of Cineworld Group PLC). NCM’s cinema advertising platform consists of more than 18,000 screens in over 1,400 theaters in 196 Designated Market Areas® (all of the top 50). For more information, visit www.ncm.com and www.noovie.com.
Forward-Looking Statements
This press release contains various forward-looking statements that reflect management’s current expectations or beliefs regarding future events, including statements regarding the Company’s anticipated future financial performance. Investors are cautioned that reliance on these forward-looking statements involves risks and uncertainties. Although the Company believes that the assumptions used in the forward-looking statements are reasonable, any of these assumptions could prove to be inaccurate and, as a result, actual results could differ materially from those expressed or implied in the forward-looking statements. The factors that could cause actual results to differ materially from those expressed or implied in the forward-looking statements are, among others, 1) level of theater attendance or viewership of the Noovie® show; 2) the availability and predictability of major motion pictures displayed in theaters, including as a result of strikes or other production delays in the entertainment industry; 3) increased competition for advertising expenditures; 4) changes to the ESAs or network affiliate agreements and the relationships with NCM LLC’s ESA Parties and network affiliates; 5) inability to implement or achieve new revenue opportunities; 6) failure to realize the anticipated benefits of the post-showtime inventory in our network; 7) technological changes and innovations; 8) economic conditions, including the level of expenditures on and perception of cinema advertising; 9) our ability to renew or replace expiring advertising and content contracts; 10) the ongoing effects of NCM LLC’s emergence from bankruptcy; 11) reinvestment in our network and product offerings may require significant funding and resulting reallocation of resources; and 12) fluctuations in and timing of operating costs. In addition, the outlook provided does not include the impact of any future unusual or infrequent transactions; sales and acquisitions of operating assets and investments; any future non-cash impairments of intangible and fixed assets; amounts related to litigation or the related impact of taxes that may occur from time to time due to management decisions and changing business circumstances. The Company is currently unable to forecast precisely the timing and/or magnitude of any such amounts or events. Please refer to the Company’s Securities and Exchange Commission filings, including the “Risk Factor” section of the Company’s Annual Report on Form 10-K for the year ended December 26, 2024, for further information about these and other risks. Investors are cautioned not to place undue reliance on any such forward-looking statements, which speak only as of the date they are made. The Company undertakes no obligation to update any forward-looking statement, whether as a result, of new information, future events or otherwise, except as required by law.
INVESTOR CONTACT: |
MEDIA CONTACT: |
Chan Park |
Doug Serton |
investors@ncm.com |
press@ncm.com |
|
|
|