f
UNITED STATES
SECURITIES AND EXCHANGE COMMISSION
Washington, D.C. 20549
FORM 10-K
☒ ANNUAL REPORT PURSUANT TO SECTION 13 OR 15(d) OF THE SECURITIES EXCHANGE ACT OF 1934
For the Fiscal Year Ended December 31, 2024
OR
☐ TRANSITION REPORT PURSUANT TO SECTION 13 OR 15(d) OF THE SECURITIES EXCHANGE ACT OF 1934
For the Transition Period from ___________ to ___________
001-34809
Commission File Number
GLOBAL INDEMNITY GROUP, LLC
(Exact name of registrant as specified in its charter)
Delaware |
|
85-2619578 |
|
(State or other jurisdiction of incorporation or organization) |
|
(I.R.S. Employer Identification No.) |
112 S. French Street, Suite 105
Wilmington, DE
19801
(Address of principal executive office including zip code)
Registrant's telephone number, including area code: (302) 691-6276
SECURITIES REGISTERED PURSUANT TO SECTION 12(b) OF THE ACT:
Title of each class |
|
Trading Symbol |
|
Name of each exchange on which registered |
Class A Common Shares |
|
GBLI |
|
New York Stock Exchange |
SECURITIES REGISTERED PURSUANT TO SECTION 12(g) OF THE ACT: NONE
Indicate by check mark if the registrant is a well-known seasoned issuer, as defined in Rule 405 of the Securities Act. YES ☐ NO ☒
Indicate by check mark if the registrant is not required to file reports pursuant to Section 13 or Section 15(d) of the Act. YES ☐ NO ☒
Indicate by check mark whether the registrant (1) has filed all reports required to be filed by Section 13 or 15(d) of the Securities Exchange Act of 1934 during the preceding 12 months (or for such shorter period that the registrant was required to file such reports), and (2) has been subject to such filing requirements for the past 90 days. YES ☒ NO ☐
Indicate by check mark whether the registrant has submitted electronically every Interactive Data File required to be submitted pursuant to Rule 405 of Regulation S-T (§232.405 of this chapter) during the preceding 12 months (or for such shorter period that the registrant was required to submit such files). YES ☒ NO ☐
Indicate by check mark whether the registrant is a large accelerated filer, an accelerated filer, a non-accelerated filer, smaller reporting company, or emerging growth company. See definitions of “large accelerated filer,” “accelerated filer,” “smaller reporting company” and “emerging growth company” in Rule 12b-2 of the Exchange Act.:
Large accelerated filer ☐; Accelerated filer ☒; Non-accelerated filer ☐; Smaller reporting company ☐; Emerging growth company ☐
If an emerging growth company, indicate by check mark if the registrant has elected not to use the extended transition period for complying with any new or revised financial accounting standards provided pursuant to Section 13(a) of the Exchange Act. ☐
Indicate by check mark whether the registrant has filed a report on and attestation to its management’s assessment of the effectiveness of its internal control over financial reporting under Section 404(b) of the Sarbanes-Oxley Act (15 U.S.C. 7262(b)) by the registered public accounting firm that prepared or issued its audit report. ☒
If securities are registered pursuant to Section 12(b) of the Act, indicate by check mark whether the financial statements of the registrant included in the filing reflect the correction of an error to previously issued financial statements. ☐
Indicate by check mark whether any of those error corrections are restatements that required a recovery analysis of incentive-based compensation received by any of the registrant’s executive officers during the relevant recovery period pursuant to §240.10D-1(b). ☐
Indicate by check mark whether the registrant is a shell company (as defined in Rule 12b-2 of the Act). YES ☐ NO ☒
The aggregate market value of the common equity held by non-affiliates of the registrant, computed by reference to the price of the registrant’s class A common shares as of the last business day of the registrant’s most recently completed second fiscal quarter (based on the last reported sale price on the New York Stock Exchange as of such date), was $215,621,306. There are no class B common shares held by non-affiliates of the registrant.
As of March 11, 2025, the registrant had outstanding 10,464,587 class A common shares (including 550,000 class A common shares designated as class A-2 common shares) and 3,793,612 class B common shares.
DOCUMENTS INCORPORATED BY REFERENCE
Portions of the Registrant’s Proxy Statement relating to the 2025 Annual Meeting of Shareholders to be filed with the SEC within 120 days of the fiscal year ended December 31, 2024 are incorporated by reference into Part III of this report.
TABLE OF CONTENTS
|
|
|
Page |
|
|
PART I |
|
|
|
|
|
Item 1. |
|
4 |
|
|
|
|
|
Item 1A. |
|
20 |
|
|
|
|
|
Item 1B. |
|
35 |
|
|
|
|
|
Item 1C. |
|
35 |
|
|
|
|
|
Item 2. |
|
37 |
|
|
|
|
|
Item 3. |
|
37 |
|
|
|
|
|
Item 4. |
|
37 |
|
|
|
|
|
|
|
PART II |
|
|
|
|
|
Item 5. |
|
38 |
|
|
|
|
|
Item 6. |
|
39 |
|
|
|
|
|
Item 7. |
|
MANAGEMENT’S DISCUSSION AND ANALYSIS OF FINANCIAL CONDITION AND RESULTS OF OPERATIONS |
40 |
|
|
|
|
Item 7A. |
|
64 |
|
|
|
|
|
Item 8. |
|
66 |
|
|
|
|
|
Item 9. |
|
CHANGES IN AND DISAGREEMENTS WITH ACCOUNTANTS ON ACCOUNTING AND FINANCIAL DISCLOSURE |
121 |
|
|
|
|
Item 9A. |
|
121 |
|
|
|
|
|
Item 9B. |
|
123 |
|
|
|
|
|
Item 9C. |
|
DISCLOSURE REGARDING FOREIGN JURISDICTIONS THAT PREVENT INSPECTIONS |
123 |
|
|
|
|
|
|
PART III |
|
|
|
|
|
Item 10. |
|
124 |
|
|
|
|
|
Item 11. |
|
124 |
|
|
|
|
|
Item 12. |
|
SECURITY OWNERSHIP OF CERTAIN BENEFICIAL OWNERS AND MANAGEMENT, AND RELATED STOCKHOLDER MATTERS |
124 |
|
|
|
|
Item 13. |
|
CERTAIN RELATIONSHIPS AND RELATED TRANSACTIONS, AND DIRECTOR INDEPENDENCE |
124 |
|
|
|
|
Item 14. |
|
124 |
|
|
|
|
|
|
|
PART IV |
|
|
|
|
|
Item 15. |
|
125 |
|
|
|
|
|
Item 16. |
|
127 |
3
PART I
Item 1. BUSINESS
Some of the information contained in this Item 1 or set forth elsewhere in this report, including information with respect to Global Indemnity Group, LLC and its subsidiaries’ plans and strategy, constitutes forward-looking statements that involve risks and uncertainties. Please see "Cautionary Note Regarding Forward-Looking Statements" at the end of Item 7 of Part II and “Risk Factors” in Item 1A of Part I for a discussion of important factors that could cause actual results to differ materially from the results described in or implied by the forward-looking statements contained herein.
History
Global Indemnity Group, LLC (“Global Indemnity” or “the Company”), is a Delaware limited liability company. Global Indemnity Group, LLC’s class A common shares are publicly traded on the New York Stock Exchange (“NYSE”). Global Indemnity Group, LLC’s predecessors have been publicly traded since 2003.
Global Indemnity Group, LLC is a publicly traded partnership for U.S. federal income tax purposes. Global Indemnity Group, LLC believes that it has met in previous taxable years, and intends to manage its affairs so that it will continue to meet in the current and subsequent taxable years, the qualifying income exception to maintain partnership status for U.S. federal income tax purposes. As a partnership, Global Indemnity Group, LLC is generally not subject to federal income tax and most state income taxes. For U.S. federal income tax purposes, a holder of Global Indemnity Group, LLC’s class A common shares is treated as a partner in a partnership. Shareholders are required to take into account their allocable share of Global Indemnity Group, LLC’s items of income, gains, losses, deductions, and other items of the partnership for Global Indemnity Group, LLC’s taxable year ending within or with the shareholders’ taxable year, regardless of whether any cash or other distributions are made to shareholders. Global Indemnity Group, LLC will furnish to each shareholder, as soon as reasonably practical after the close of each calendar year, specific tax information, including a Schedule K-1, which describes the shareholders’ share of Global Indemnity Group, LLC’s income, gains, losses, and deductions for Global Indemnity Group, LLC’s preceding taxable year. Income earned by the subsidiaries of Global Indemnity Group, LLC is subject to corporate tax in the United States and, therefore, is not taxable to Global Indemnity Group, LLC’s shareholders until the income is distributed by the subsidiaries to Global Indemnity Group, LLC.
Global Indemnity provides diversified offerings for both specialty property and casualty insurance in the excess and surplus lines market through its two subsidiaries.
Penn-America Underwriters, LLC was created in December 2024, through an internal reorganization, a significant milestone positioning the Company for enhanced operational efficiency and growth by:
Further, through that internal reorganization, the Company’s five specialty insurance companies were de-stacked in a holding company structure under Belmont Holdings GX, Inc. resulting in an increased consolidated surplus of the insurance companies and allowing for more efficient management of capital and liquidity.
Fox Paine & Company, LLC conceived, designed, and directed the Company's successful completion of this reorganization. On March 6, 2025, the Board of Directors approved a grant of 550,000 class A common shares designated as class A-2 common shares to Fox Paine & Company, LLC as payment for its services.
4
Unless otherwise determined by the Board, the class A common shares designated as class A-2 common shares may not be assigned, sold, pledged, hypothecated, transferred, or disposed of in any manner until the occurrence of a Change of Control Transaction (as defined in the Third Amended and Restated Limited Liability Company Agreement (“LLCA”)). See “Other Information” in Item 9B of Part II of this report and Note 26 of the notes to the consolidated financial statements in Item 8 of Part II of this report regarding this grant of these shares.
The Company's management team is experienced in the insurance industry and the excess and surplus lines marketplace and has long-standing relationships in the industry. The Company’s organizational structure allows it to be highly responsive and flexible in interactions with its agents.
Collectively, the Company’s insurance subsidiaries are licensed in all 50 states, the District of Columbia, Puerto Rico, and the U.S. Virgin Islands.
Business Segments
The Company currently operates its business through two segments, Penn-America and Non-Core Operations. Penn-America consists of all core products from its Wholesale Commercial, Specialty Products, InsurTech, and Assumed Reinsurance divisions. InsurTech products consist of Collectibles, VacantExpress, and niche products which are distributed via the internet. Penn-America’s gross premiums written in 2024 were $400.0 million. Non-Core Operations includes business that has been de-emphasized or is no longer written.
See Note 22 of the notes to the consolidated financial statements in Item 8 of Part II of this report for gross and net written premiums, income, and total assets of each operating segment for the years ended December 31, 2024, 2023 and 2022. For a discussion of the variances between years 2024 and 2023, see “Results of Operations” in Item 7 of Part II of this report.
PENN-AMERICA
The Penn-America segment distributes specialty property and casualty insurance products in the excess and surplus lines marketplace. Penn-America targets Main Street Specialty Excess & Surplus Lines focusing on small businesses such as Artisan Contractors, Habitational (Landlord), General Services, Vacant Properties, Mercantile & Restaurants, Bars & Taverns, Commercial Buildings, and Collectibles. Penn-America is one of the larger providers of insurance to Main Street businesses and built this position by focusing on this market for over 40 years. Penn-America underwrites commercial coverages for 900 classes of casualty business and 200 classes of property business. Companies within the Insurance Operations are eligible to write on a surplus lines (non-admitted) basis and others are licensed to write on an admitted basis in all 50 U.S. States, the District of Columbia, Puerto Rico, and the U.S. Virgin Islands. This provides the Company with flexibility in designing products and in determining rates to meet emerging risks and discontinuities in the marketplace.
Penn-America’s insurance products target specific, defined groups of insureds with customized coverage to meet their needs. The primary business divisions within the Penn-America segment include:
5
The following table sets forth the gross written premiums for each of the primary business divisions within Penn-America:
|
|
For the Years Ended December 31, |
|
|||||||||||||||||||||
|
|
2024 |
|
|
2023 |
|
|
2022 |
|
|||||||||||||||
(Dollars in thousands) |
|
Amount |
|
|
Percent |
|
|
Amount |
|
|
Percent |
|
|
Amount |
|
|
Percent |
|
||||||
Wholesale Commercial |
|
$ |
248,600 |
|
|
|
62.2 |
% |
|
$ |
234,941 |
|
|
|
63.6 |
% |
|
$ |
219,688 |
|
|
|
56.6 |
% |
Specialty Products |
|
|
69,612 |
|
|
|
17.3 |
|
|
|
72,535 |
|
|
|
19.5 |
|
|
|
121,838 |
|
|
|
31.4 |
|
InsurTech |
|
|
56,341 |
|
|
|
14.1 |
|
|
|
48,309 |
|
|
|
13.1 |
|
|
|
40,977 |
|
|
|
10.6 |
|
Assumed Reinsurance |
|
|
25,423 |
|
|
|
6.4 |
|
|
|
13,875 |
|
|
|
3.8 |
|
|
|
5,464 |
|
|
|
1.4 |
|
Total |
|
$ |
399,976 |
|
|
|
100.0 |
% |
|
$ |
369,660 |
|
|
|
100.0 |
% |
|
$ |
387,967 |
|
|
|
100.0 |
% |
Excess and Surplus Lines Marketplace
Penn-America operates in the excess and surplus lines marketplace. The excess and surplus lines market provides coverage for businesses that often do not fit the underwriting criteria of an insurance company operating in the standard markets due to their relatively unpredictable loss patterns and unique niches of exposure requiring rate and policy form flexibility. Without the excess and surplus lines market, certain businesses would have to self-insure their exposures, or seek coverage outside the U.S. market.
Competition in the excess and surplus lines market tends to focus less on price and more on availability, service, and other considerations. While excess and surplus lines market exposures may have higher perceived insurance risk than their standard market counterparts, excess and surplus lines market underwriters historically have been able to generate underwriting profitability superior to standard market underwriters.
In the standard property and casualty insurance market, insurance rates and forms are highly regulated; products and coverage are largely uniform and have relatively predictable exposures. In the standard market, policies must be written by insurance companies that are admitted to transact business in the state in which the policy is issued. As a result, in the standard property and casualty insurance market, insurance companies tend to compete for customers primarily on the basis of price, coverage, value-added service, and financial strength.
The Company offers several specialized products that are sold in the admitted market. The insurance products required by these insureds are not otherwise available from standard market insurers. These policies are subject to greater state regulation than the surplus lines market, particularly with regards to rate and form filing requirements and the ability to enter and exit lines of business. Insureds purchasing coverage from specialty admitted insurance companies do so because the insurance product is not otherwise available from standard market insurers. VacantExpress represents a large majority of policies that Penn-America writes in this manner.
In 2024, excluding Assumed Reinsurance, Penn-America wrote 89% of their business on a non-admitted basis and 11% on an admitted basis.
Marketing and Distribution
The Company offers its insurance products across a wide distribution network that includes wholesale general agents, retail agents, and direct-to-consumer. The Company’s primary distribution strategy is to maintain longstanding strong relationships with high-quality wholesale general agents and retail agents. Penn-America’s average tenure with its wholesale agents is 15 years. The Company has an extensive process of selecting and appointing agents qualified to distribute excess and surplus lines business based on their expertise, experience and reputation. Prior to appointing a new wholesale agent, the Company conducts financial and product expertise due diligence.
The Company grants wholesale general agents “trial period access” to its proprietary systems and underwriting tools to “test quote” policies. The Company evaluates the ability of the agent to execute procedures properly before giving full authority to produce business. Contracts are executed for each agent reflecting key terms such as direct commissions and profit commissions. Agents are eligible for profit commissions for superior underwriting results.
For Wholesale Commercial and Specialty Products, the appointed agents’ performance is routinely monitored by Penn-America's internal underwriting staff. Production, loss results, findings from policy reviews, etc. are shared as part of Penn-America's agency management practices. Additionally, in-person visitations are conducted as needed by their assigned underwriter and/or manager with several additional visits conducted virtually to foster relationships. Agents are visited at various industry events.
6
Penn-America products, excluding assumed reinsurance, are distributed through approximately 360 wholesale general agents, 2,800 retail agents, and 20,000 direct-to-consumer policies. None of these agents accounted for more than 10% of gross written premiums within the Penn-America segment for the year ended December 31, 2024.
Penn-America’s assumed reinsurance treaties were acquired through 4 brokers. None of these brokers accounted for 10% or more of Penn-America’s gross written premium or 10% or more of the Company’s consolidated revenues for the year ended December 31, 2024.
Technology Platform
Penn-America provides its agents with rate, quote and policy issuance systems to transact business. These systems allow the Company to maintain and easily change rates, policy terms and conditions, and underwriting guidelines for its products. Penn-America's agents can typically transact a piece of business in 20 minutes or less.
The technology platforms capture key underwriting and rating elements. This enables the Company to perform profitability and predictive risk analytics. Proprietary automated reports, which monitor key business performance criteria, were developed by Penn-America’s underwriting teams. They measure rate, retention, new business growth, and overall profitability. Analytics are performed over a multitude of dimensions such as geography, agent, class of business, policy limits, and coverages. Proprietary automated reports are also developed to monitor key attributes of risk exposures.
The Company is investing in its subsidiary, Kaleidoscope Insurance Technology, Inc, by developing a multi-year technology strategy to enhance (i) rate, quote, and policy issuance systems connecting with its wholesale general agents, (ii) the maintenance of key underwriting elements, including but not limited to rates, forms, rules, underwriting guidelines, and underwriting authorities, (iii) underwriting workflow management and (iv) data analytics capabilities. This investment will deliver a cloud-hosted, multi-tenant platform specifically designed for Property and Casualty insurance products. In 2024, Penn-America successfully launched the Wholesale Commercial Excess Liability product in this new cloud-hosted, multi-tenant platform.
Pricing
Penn-America's actuaries customize pricing for each product, contributing expertise in factors such as historical loss data, changes in rate levels over time, outputs from property catastrophe modeling, and individual risk and coverage attributes. Additionally, they draw valuable insights from industry data to refine pricing strategy. The company typically references actuarial loss costs provided by the Insurance Services Office as a baseline for pricing across most products. For certain products, proprietary rating methods, including the use of machine learning, advanced statistical analyses, competitor comparison, and refined analytical techniques for risk segmentation and pricing, may be employed when deemed suitable. Penn-America prioritizes writing business with the goal of achieving a satisfactory risk-adjusted rate of return.
Underwriting
Penn-America’s insurance products are primarily underwritten via specific binding authority in which the Company grants delegated underwriting authority to its wholesale general agents. The Company’s wholesale general agents and program administrators contract to underwrite submissions received in accordance with the Company’s underwriting guidelines.
Approximately 90% of Penn-America’s policies are fully automated and are processed by the agents utilizing the Company’s technology platform to rate, quote and issue policies. The Company’s underwriters have defined levels of authority that vary based on experience and performance. Agents have no authority to change forms or underwriting rules and have very limited discretionary pricing authority. The Company and its agents perform additional loss control activities through inspection of insured properties. Premiums audits are performed on the Company’s casualty business rated on revenue and payroll exposure.
A comprehensive, regularly updated underwriting manual that specifically outlines risk eligibility which is developed based on the type of insured, nature of exposure and overall expected profitability is used for underwriting. This manual also outlines (a) rates, (b) underwriting guidelines, including but not limited to policy forms, terms and conditions, and (c) policy issuance instructions.
Training on the Company’s underwriting guidelines is done via in person agency visits, marketing calls, agency conferences, or webinars.
7
Risks that are not within the specific binding authority must be submitted to Penn-America’s underwriting personnel directly for underwriting review and approval or denial.
The Company regularly monitors the underwriting quality of its wholesale general agents through a disciplined system of controls which includes one or more of the following:
Penn-America generally provides incentives to certain wholesale general agents and program administrators through profit commissions that are tied directly to producing profitable business.
Geographic Concentration
The following table sets forth the geographic distribution of Penn-America’s gross written premiums for the periods indicated:
|
|
For the Years Ended December 31, |
|
|||||||||||||||||||||
|
|
2024 |
|
|
2023 |
|
|
2022 |
|
|||||||||||||||
(Dollars in thousands) |
|
Amount |
|
|
Percent |
|
|
Amount |
|
|
Percent |
|
|
Amount |
|
|
Percent |
|
||||||
California |
|
$ |
57,308 |
|
|
|
14.3 |
% |
|
$ |
56,361 |
|
|
|
15.2 |
% |
|
$ |
65,048 |
|
|
|
16.7 |
% |
Florida |
|
|
51,295 |
|
|
|
12.8 |
|
|
|
46,859 |
|
|
|
12.7 |
|
|
|
49,902 |
|
|
|
12.9 |
|
Texas |
|
|
41,478 |
|
|
|
10.4 |
|
|
|
34,413 |
|
|
|
9.3 |
|
|
|
36,448 |
|
|
|
9.4 |
|
New York |
|
|
36,846 |
|
|
|
9.2 |
|
|
|
38,812 |
|
|
|
10.5 |
|
|
|
45,409 |
|
|
|
11.7 |
|
Massachusetts |
|
|
18,932 |
|
|
|
4.7 |
|
|
|
17,940 |
|
|
|
4.9 |
|
|
|
19,283 |
|
|
|
5.0 |
|
Louisiana |
|
|
14,494 |
|
|
|
3.6 |
|
|
|
13,188 |
|
|
|
3.6 |
|
|
|
11,811 |
|
|
|
3.0 |
|
New Jersey |
|
|
14,137 |
|
|
|
3.5 |
|
|
|
11,189 |
|
|
|
3.0 |
|
|
|
11,935 |
|
|
|
3.1 |
|
Pennsylvania |
|
|
12,718 |
|
|
|
3.2 |
|
|
|
11,413 |
|
|
|
3.1 |
|
|
|
12,289 |
|
|
|
3.2 |
|
Illinois |
|
|
11,388 |
|
|
|
2.9 |
|
|
|
11,386 |
|
|
|
3.1 |
|
|
|
11,042 |
|
|
|
2.8 |
|
Georgia |
|
|
11,372 |
|
|
|
2.8 |
|
|
|
8,148 |
|
|
|
2.2 |
|
|
|
11,011 |
|
|
|
2.9 |
|
Subtotal |
|
|
269,968 |
|
|
|
67.4 |
|
|
|
249,709 |
|
|
|
67.6 |
|
|
|
274,178 |
|
|
|
70.7 |
|
All other states |
|
|
104,587 |
|
|
|
26.2 |
|
|
|
106,076 |
|
|
|
28.6 |
|
|
|
108,325 |
|
|
|
27.9 |
|
Assumed Reinsurance |
|
|
25,421 |
|
|
|
6.4 |
|
|
|
13,875 |
|
|
|
3.8 |
|
|
|
5,464 |
|
|
|
1.4 |
|
Total |
|
$ |
399,976 |
|
|
|
100.0 |
% |
|
$ |
369,660 |
|
|
|
100.0 |
% |
|
$ |
387,967 |
|
|
|
100.0 |
% |
NON-CORE OPERATIONS
The Company’s Non-Core Operations segment represents lines of business that have been de-emphasized or are no longer being written. Net earned premiums were $7.2 million in 2024 compared to $118.8 million in 2023.
The two key activities of Non-Core Operations are managing transition service agreements related to the sales of the Company’s renewal rights and handling claims activity and loss reserves on de-emphasized and terminated business.
At the end of 2022, the Company ceased writing new business and non-renewed existing policies for its four brokerage divisions: Professional Liability, Excess Casualty, Environmental, and Middle Market Property. On August 8, 2022, the Company sold the renewal rights related to its Farm, Ranch & Stable business for policies written on or after August 8, 2022 to Everett Cash Mutual Insurance Company. On October 26, 2021, the Company sold the renewal rights related to its manufactured and dwelling homes business. In 2021, the Company decided to cease writing certain Property Brokerage business which was part of the Commercial Specialty segment (now known as Penn-America), as well as non-renewing several treaties within the prior Reinsurance Operations segment which are now included in Non-Core Operations.
8
See Note 2 of the notes to the consolidated financial statements in Item 8 of Part II of this report for additional information on the sale of the renewal rights related to the Company’s Farm, Ranch & Stable business and Note 2 of the notes to the consolidated financial statements in Item 8 Part II of the Company’s 2023 Annual Report on Form 10-K for more information on the sale of renewal rights related to the Company's manufactured and dwelling homes business.
The manufactured home, dwelling, motorcycle, watercraft, certain homeowners products, and farm, ranch & equine business within Non-Core Operations operated primarily in the standard or admitted markets and were distributed through retail agents, wholesale general agents, and brokers. These insurance products were either underwritten via limited binding authority, specific binding authority, or by internal personnel. The Property Brokerage product within Non-Core Operations operated predominantly in the excess and surplus lines or non-admitted markets and were distributed through wholesale brokers and underwritten by the Company’s personnel and selected brokers with limited binding authority. The retrocessional reinsurance treaties within Non-Core Operations were distributed through brokers and on a direct basis.
Information technology development initiatives related to business lines within Non-Core Operations have been discontinued.
Additional capital has and will become available as a result of de-emphasizing and exiting non-core business. This additional capital will support future growth in the Company's Penn-America segment and provide capital for business initiatives including share repurchases.
Reinsuring Underwriting Risk
The Company’s philosophy is to purchase reinsurance from third parties to limit its liability on individual risks and to protect against property catastrophe and casualty clash losses. Reinsurance assists the Company in controlling exposure to severe losses and protecting capital resources. The type, cost and limits of reinsurance it purchases can vary from year to year based upon the Company’s desired retention levels and the availability of quality reinsurance at an acceptable price. The Company purchases reinsurance based on guidelines established by management. Some of the Company’s reinsurance contracts renew on an annual basis. Although reinsurance does not legally discharge an insurer from its primary liability for the full amount of limits on the policies it has written, it does make the assuming reinsurer liable to the insurer to the extent of the insurance ceded. The Company primarily utilizes treaty reinsurance products made up of proportional and excess of loss reinsurance. Additionally, the Company may purchase facultative reinsurance protection on single risks when deemed necessary.
The Company purchases specific types and structures of reinsurance depending upon the characteristics of the lines of business and specialty products underwritten. The Company will typically seek to place proportional reinsurance for umbrella and excess products, certain specialty products, or new products in the development stage. The Company believes that this approach allows it to control net exposure in these product areas most cost effectively.
The Company purchases reinsurance on an excess of loss basis to cover individual risk severity. These structures are utilized to protect the Company’s primary positions on property and casualty products. The excess of loss structures allow the Company to maximize underwriting profits over time by retaining its desired amount of risk in each product written while helping to protect against the possibility of unforeseen volatility.
The Company analyzes its reinsurance contracts to ensure that they meet the risk transfer requirements of applicable accounting guidance, which requires that the reinsurer must assume significant insurance risk under the reinsured portions of the underlying insurance contracts and that there must be a reasonably possible chance that the reinsurer may realize a significant loss from the transaction.
The Company continually evaluates its retention levels across its entire line of business and specialty product portfolio seeking to ensure that the ultimate reinsurance structures are aligned with the Company’s corporate risk tolerance levels associated with such products. Any decision to decrease the Company’s reliance upon proportional reinsurance or to increase the Company’s excess of loss retentions could increase the Company’s earnings volatility. In cases where the Company decides to increase its excess of loss retentions, such decisions will be a result of a change or progression in the Company’s risk tolerance level. The Company endeavors to purchase reinsurance from financially strong reinsurers with which it has long-standing relationships. In addition, in certain circumstances, the Company holds collateral, including letters of credit, under reinsurance agreements.
9
To the extent that there may be an increase or decrease in catastrophe or casualty clash exposure in the future, the Company may increase or decrease its reinsurance protection for these exposures commensurately.
The Company’s material reinsurance treaties are as follows:
Property Catastrophe Excess of Loss – The Company’s current property writings create exposure to catastrophic events. To protect against these exposures, the Company purchases a property catastrophe treaty. Effective June 1, 2024, the Company purchased two layers of occurrence coverage for losses of $50 million in excess of $25 million. The first layer provides coverage of 100% of $25 million in excess of $25 million and can be reinstated once for an additional charge. The second layer provides coverage of $25 million in excess of $50 million and can be reinstated once for an additional charge . This replaced the treaty that was effective June 1, 2023, where the Company purchased two layers of occurrence coverage for losses of $50 million in excess of $25 million. The first layer provided coverage of 100% of $25 million in excess of $25 million and could be reinstated once for no additional charge. The second layer provided coverage of $25 million in excess of $50 million and could be reinstated once for no additional charge.
Property Per Risk Excess of Loss – Effective January 1, 2025, the Company renewed its property per risk excess of loss treaty. For property risks excluding cannabis property risks, this treaty provides coverage of 100% of $2.5 million per risk in excess of $2.5 million per risk and 95% of $5.0 million per risk in excess of $5.0 million per risk for the entire Company. For cannabis property risks, this treaty provides coverage of 70% of $2.5 million per risk in excess of $2.5 million per risk and 65% of $5.0 million per risk in excess of $5.0 million per risk. Multiple reinstatements are available at no charge on both layers. This replaced the property treaty which expired December 31, 2024 and provided coverage for property risks excluding cannabis property risks of 100% of $2.5 million per risk in excess of $2.5 million per risk and 85% of $5.0 million per risk in excess of $5.0 million per risk for the entire Company. For cannabis property risks, this treaty provided coverage of 70% of $2.5 million per risk in excess of $2.5 million per risk and 55% of $5.0 million per risk in excess of $5.0 million per risk.
Casualty Excess of Loss – Effective January 1, 2025, the Company renewed its treaty which provide coverage of 80% of $10 million per occurrence in excess of $2.5 million per occurrence for casualty lines of business. The treaty is subject to an aggregate limit of $20 million. This replaced the treaty that was effective January 1, 2024 which provided coverage of 80% of $10 million per occurrence in excess of $2.5 million per occurrence for casualty lines of business. The treaty was subject to an aggregate limit of $20 million.
Umbrella and Excess Liability Quota Share – Effective July 1, 2024, the Company renewed its umbrella and excess liability quota share which provides 50% coverage up to $5 million for excess casualty and umbrella lines of business. This replaced the treaty that was effective July 1, 2023, which provides 50% coverage up to $5 million for excess casualty and umbrella lines of business.
Quota Share Reinsurance Agreements for Non-Core Products:
10
The following table sets forth the ten reinsurers for which the Company has the largest reinsurance receivables as of December 31, 2024. Also shown are the amounts of premiums ceded by the Company to these reinsurers during the year ended December 31, 2024.
(Dollars in millions) |
|
AM |
|
Gross |
|
|
Percent |
|
|
Ceded |
|
|
Percent |
|
||||
Munich Re America Corp. |
|
A+ |
|
$ |
35.8 |
|
|
|
47.2 |
% |
|
$ |
4.3 |
|
|
|
40.6 |
% |
General Reinsurance Corp. |
|
A++ |
|
|
9.9 |
|
|
|
13.0 |
|
|
|
1.4 |
|
|
|
13.2 |
|
Swiss Reinsurance America Corp. |
|
A+ |
|
|
5.7 |
|
|
|
7.5 |
|
|
|
1.3 |
|
|
|
12.2 |
|
Allianz Risk Transfer |
|
A+ |
|
|
4.4 |
|
|
|
5.8 |
|
|
|
— |
|
|
|
— |
|
Westport Insurance Corporation |
|
A+ |
|
|
2.2 |
|
|
|
2.9 |
|
|
|
— |
|
|
|
— |
|
Argo Re, Ltd |
|
A- |
|
|
2.2 |
|
|
|
2.9 |
|
|
|
— |
|
|
|
— |
|
Clearwater Insurance Company |
|
NR |
|
|
2.1 |
|
|
|
2.8 |
|
|
|
— |
|
|
|
— |
|
Factory Mutual Insurance Company |
|
A+ |
|
|
1.9 |
|
|
|
2.5 |
|
|
|
1.4 |
|
|
|
13.2 |
|
Scor Reinsurance Company |
|
A |
|
|
1.7 |
|
|
|
2.2 |
|
|
|
0.4 |
|
|
|
3.8 |
|
Hannover Rück SE |
|
A+ |
|
|
1.6 |
|
|
|
2.1 |
|
|
|
(0.3 |
) |
|
|
(2.8 |
) |
Subtotal |
|
|
|
$ |
67.5 |
|
|
|
88.9 |
% |
|
$ |
8.5 |
|
|
|
80.2 |
% |
All other reinsurers |
|
|
|
|
8.4 |
|
|
|
11.1 |
|
|
|
2.1 |
|
|
|
19.8 |
|
Total reinsurance receivables before allowance for expected credit losses |
|
|
|
$ |
75.9 |
|
|
|
100.0 |
% |
|
$ |
10.6 |
|
|
|
100.0 |
% |
Allowance for expected credit losses |
|
|
|
|
(9.0 |
) |
|
|
|
|
|
|
|
|
|
|||
Total receivables, net of allowance for expected credit losses |
|
|
|
|
66.9 |
|
|
|
|
|
|
|
|
|
|
|||
Collateral held in trust from reinsurers |
|
|
|
|
(6.5 |
) |
|
|
|
|
|
|
|
|
|
|||
Net receivables |
|
|
|
$ |
60.4 |
|
|
|
|
|
|
|
|
|
|
|||
At December 31, 2024, the Company carried reinsurance receivables, net of collateral held in trust, of $60.4 million. This amount is net of an allowance for expected credit losses of $9.0 million at December 31, 2024.
Historically, there have been insolvencies following a period of competitive pricing in the industry. While the Company has recorded allowances for expected credit losses for reinsurance receivables based on relevant information about past events including historical experience, currently available information, and supportable forecasts that affect the collectability, conditions may change or additional information might be obtained that may require the Company to record additional allowances. On a quarterly basis, the Company reviews its financial exposure to the reinsurance market and assesses the adequacy of its collateral and allowance for expected credit losses. The Company continues to take actions to mitigate its exposure to possible loss.
Claims Management and Administration
The Company’s approach to claims management is designed to investigate reported incidents at the earliest juncture, to select, manage, and supervise all legal and adjustment aspects of claims, including settlement, for the mutual benefit of the Company, its professional general agents, wholesale brokers, reinsurers and insureds. The Company’s professional general agents and wholesale brokers have no authority to settle claims or otherwise exercise control over the claims process. The claims management staff supervises or processes all claims. The Company has a formal claims review process, and all claims greater than $250,000 are reviewed by senior claims management and certain senior executives. Large loss trends and analysis are reviewed by a Large Loss committee.
To handle claims, the Company utilizes its own in-house claims department as well as third-party assuming reinsurers, to whom it delegates limited claims handling authority. The experienced in-house staff of claims management professionals are assigned to one of four dedicated claim units: casualty, property, subrogation, and construction defect. In-house claims management professionals are responsible for coverage confirmation, investigation, customer service, claims adjustment, and disposition and use a network of Company-approved independent adjusters and attorneys to assist in the adjustment process.
Approximately 93% of claims are handled by in-house claims management professionals and approximately 7% are handled by the Company’s assuming reinsurers. The Company reviews and supervises the claims handled by its reinsurers seeking to protect its reputation and minimize exposure.
11
Reserves for Unpaid Losses and Loss Adjustment Expenses
Applicable insurance laws require the Company to maintain reserves to cover its estimated ultimate losses under insurance policies and reinsurance treaties that it writes and for loss adjustment expenses relating to the investigation and settlement of claims.
The Company establishes losses and loss adjustment expense reserves for individual claims by evaluating reported claims on the basis of:
The Company generally estimates such losses and claims costs through an evaluation of individual reported claims. The Company also establishes reserves for incurred but not reported losses (“IBNR”). The Company’s IBNR reserves include provisions for development on known cases as well as provisions for claims that have occurred but not been reported. IBNR reserves are based on the Company's historical statistical information with respect to the expected number and nature of claims arising from occurrences that have not been reported, supplemented with industry experience when deemed appropriate. The Company also establishes its reserves based on estimates of future trends in claims severity and other judgmental factors. Insurance companies are not permitted to reserve for a catastrophe until it has occurred. Reserves are recorded on an undiscounted basis other than fair value adjustments recorded under purchase accounting. The Company’s reserves are reviewed quarterly by the in-house actuarial staff; however, management is responsible for the final determination of loss reserve selections. Reserve reviews for Insurance Operations are summarized on both a gross and net of reinsurance basis.
In addition to the Company’s internal reserve analysis, independent external actuaries perform a full, detailed review of the reserves annually. The Company does not rely upon the review by the independent actuaries to develop its reserves; however, the review is used to corroborate the analysis performed by the in-house actuarial staff. The results of the detailed reserve reviews by internal and external actuaries are summarized and discussed with the Company’s senior management to determine Management's best estimate of reserves.
With respect to some classes of risks, the period of time between the occurrence of an insured event and the final resolution of a claim may be many years, and during this period it often becomes necessary to adjust the claim estimates either upward or downward. Certain classes of umbrella and excess liability that the Company underwrites have historically had longer intervals between the occurrence of an insured event, reporting of the claim, and final resolution. In such cases, the Company must estimate reserves over long periods of time with the possibility of several adjustments to reserves. Other classes of insurance that the Company underwrites, such as most property insurance, historically have shorter intervals between the occurrence of an insured event, reporting of the claim, and final resolution. Reserves with respect to these classes are therefore inherently less likely to be adjusted.
The losses and loss adjustment expense reserving process is intended to reflect the impact of inflation and other factors affecting loss payments by taking into account changes in historical payment patterns and perceived trends. However, there is no precise method for the subsequent evaluation of the adequacy of the consideration given to inflation, or to any other specific factor, or to the way one factor may affect another.
See the notes to the consolidated financial statements in Item 8 of Part II of this report for a reconciliation of the Company’s liability for losses and loss adjustment expenses, net of reinsurance ceded, as well as further discussion surrounding changes to reserves for prior accident years.
12
Asbestos and Environmental (“A&E”) Exposure
The Company’s environmental exposure arises from the sale of general liability and commercial multi-peril insurance. Currently, the Company’s policies continue to exclude classic environmental contamination claims. However, in some states, the Company is required, depending on the circumstances, to provide coverage for certain bodily injury claims, such as an individual's exposure to a release of chemicals. The Company has also issued policies that were intended to provide limited pollution and environmental coverage. These policies were specific to certain types of products underwritten by the Company. The Company has also received a number of asbestos-related claims, the majority of which are declined based on well-established exclusions. In establishing the liability for unpaid losses and loss adjustment expenses related to A&E exposures, management considers facts currently known and the current state of the law and coverage litigations. Estimates of these liabilities are reviewed and updated continually.
Uncertainty remains as to the Company’s ultimate liability for asbestos-related claims due to such factors as the long latency period between asbestos exposure and disease manifestation and the resulting potential for involvement of multiple policy periods for individual claims. Other emerging mass torts with long latency periods also contribute to the uncertainty in the estimated ultimate environmental liability.
The liability for unpaid losses and loss adjustment expenses, inclusive of A&E reserves, reflects Management’s best estimates for future amounts needed to pay losses and related loss adjustment expenses as of each of the balance sheet dates reflected in the financial statements herein in accordance with generally accepted accounting principles ("GAAP"). As of December 31, 2024, the Company had $10.7 million of net loss reserves for asbestos-related claims and $10.0 million for environmental claims. The Company attempts to estimate the full impact of the A&E exposures by establishing specific case reserves on all known losses. See Note 12 of the notes to the consolidated financial statements in Item 8 of Part II of this report for tables showing the Company’s gross and net reserves for A&E losses.
In addition to the factors referenced above, establishing reserves for A&E and other mass tort claims involves considerably more judgment than other types of claims due to factors including, but not limited to, inconsistent court decisions, an increase in bankruptcy filings as a result of asbestos-related liabilities, and judicial interpretations that often expand theories of recovery and broaden the scope of coverage.
See Note 12 of the notes to the consolidated financial statements in Item 8 of Part II of this report for the survival ratios on a gross and net basis for the Company’s A&E claims.
Investments
The Company’s investment policy is determined by the Investment Committee of the Board of Directors. The Company engages third-party investment advisors to oversee and manage its investments and to make recommendations to the Investment Committee. The Company projects its cash flows from investments and operations to assure it has adequate liquidity to run its business. The Company’s investment policy allows it to invest in taxable and tax-exempt fixed income investments including corporate bonds as well as publicly traded equities and private equity and private debt investments. The insurance group holds $1,323.4 million of investments, of which, are comprised of 99.1% of fixed income and 0.9% of preferred stock. To provide diversification, the Company limits exposure to individual issuers. With respect to fixed income investments, the maximum exposure per issuer varies as a function of the credit quality of the security. The allocation between taxable and tax-exempt bonds is determined based on market conditions and tax considerations. As of December 31, 2024, the Company had $1,440.6 million of investments and cash and cash equivalent assets, including $12.3 million of preferred stock, and $29.4 million of limited partnership investments.
Insurance company investments must comply with applicable statutory regulations that prescribe the type, quality, and concentration of investments. These regulations permit investments, within specified limits and subject to certain qualifications, in federal, state, and municipal obligations, corporate bonds, and preferred and common equity securities.
13
The following table summarizes by type the estimated fair value of Global Indemnity’s investments and cash and cash equivalents as of December 31, 2024, 2023, and 2022:
|
|
December 31, 2024 |
|
|
December 31, 2023 |
|
|
December 31, 2022 |
|
|||||||||||||||
(Dollars in thousands) |
|
Estimated |
|
|
Percent |
|
|
Estimated |
|
|
Percent |
|
|
Estimated |
|
|
Percent |
|
||||||
Cash and cash equivalents |
|
$ |
17,009 |
|
|
|
1.2 |
% |
|
$ |
38,037 |
|
|
|
2.7 |
% |
|
$ |
38,846 |
|
|
|
2.9 |
% |
U.S. treasuries |
|
|
875,246 |
|
|
|
60.7 |
|
|
|
494,223 |
|
|
|
35.6 |
|
|
|
344,103 |
|
|
|
25.6 |
|
Obligations of states and political subdivisions |
|
|
16,335 |
|
|
|
1.1 |
|
|
|
26,150 |
|
|
|
1.9 |
|
|
|
31,595 |
|
|
|
2.4 |
|
Mortgage-backed securities (1) |
|
|
58,920 |
|
|
|
4.1 |
|
|
|
58,927 |
|
|
|
4.3 |
|
|
|
62,116 |
|
|
|
4.6 |
|
Asset-backed securities |
|
|
135,427 |
|
|
|
9.4 |
|
|
|
202,952 |
|
|
|
14.6 |
|
|
|
189,400 |
|
|
|
14.1 |
|
Commercial mortgage-backed securities |
|
|
65,568 |
|
|
|
4.6 |
|
|
|
79,080 |
|
|
|
5.7 |
|
|
|
98,664 |
|
|
|
7.3 |
|
Corporate bonds |
|
|
156,096 |
|
|
|
10.8 |
|
|
|
291,713 |
|
|
|
21.0 |
|
|
|
338,780 |
|
|
|
25.3 |
|
Foreign corporate bonds |
|
|
74,316 |
|
|
|
5.2 |
|
|
|
140,748 |
|
|
|
10.2 |
|
|
|
183,540 |
|
|
|
13.7 |
|
Total fixed maturities |
|
|
1,381,908 |
|
|
|
95.9 |
|
|
|
1,293,793 |
|
|
|
93.3 |
|
|
|
1,248,198 |
|
|
|
93.0 |
|
Equity securities |
|
|
12,284 |
|
|
|
0.9 |
|
|
|
16,508 |
|
|
|
1.2 |
|
|
|
17,520 |
|
|
|
1.3 |
|
Other invested assets |
|
|
29,413 |
|
|
|
2.0 |
|
|
|
38,236 |
|
|
|
2.8 |
|
|
|
38,176 |
|
|
|
2.8 |
|
Total investments and cash and cash equivalents (2) |
|
$ |
1,440,614 |
|
|
|
100.0 |
% |
|
$ |
1,386,574 |
|
|
|
100.0 |
% |
|
$ |
1,342,740 |
|
|
|
100.0 |
% |
The Company does not acquire fixed maturities with the intention to sell these securities in a short period of time. The Company can hold fixed maturities to recovery and/or maturity; however, the Company regularly re-evaluates its positions and will sell a security if warranted by market conditions.
The overall weighted average duration of the Company’s fixed maturities portfolio was 0.8 years as of December 31, 2024 compared to 1.1 years at December 31, 2023. Duration was lowered in response to rising interest rates. The Company’s fixed maturities, excluding the asset-backed, mortgage-backed, commercial mortgage-backed and collateralized mortgage obligations, had a weighted average maturity of 0.8 years and a weighted average duration, including cash and short-term investments, of 0.7 years as of December 31, 2024. The weighted average duration of the Company’s asset-backed, mortgage-backed and commercial mortgage-backed securities was 1.8 years as of December 31, 2024. At December 31, 2024, the Company’s embedded book yield on its fixed maturities, not including cash, was 4.4% compared with 4.0% at December 31, 2023.
The Company’s financial statements reflect a net unrealized loss on fixed maturities available for sale as of December 31, 2024 of $12.7 million on a pre-tax basis.
The following table shows the average amount of fixed maturities, income earned on fixed maturities, and the book yield thereon, as well as unrealized gain (loss) for the periods indicated:
|
|
Years Ended December 31, |
|
|||||||||
(Dollars in thousands) |
|
2024 |
|
|
2023 |
|
|
2022 |
|
|||
Average fixed maturities at book value |
|
$ |
1,358,366 |
|
|
$ |
1,311,908 |
|
|
$ |
1,247,735 |
|
Gross income on fixed maturities (1) |
|
$ |
58,675 |
|
|
$ |
49,987 |
|
|
$ |
33,852 |
|
Book yield |
|
|
4.32 |
% |
|
|
3.81 |
% |
|
|
2.71 |
% |
Fixed maturities at book value |
|
$ |
1,394,639 |
|
|
$ |
1,322,092 |
|
|
$ |
1,301,723 |
|
Unrealized gain (loss) |
|
$ |
(12,731 |
) |
|
$ |
(28,299 |
) |
|
$ |
(53,525 |
) |
The Company has sought to structure its portfolio to reduce the risk of default on collateralized commercial real estate obligations and asset-backed securities. Of the $58.9 million of mortgage-backed securities, $4.2 million is invested in U.S. agency paper and $54.7 million is invested in collateralized mortgage obligations, of which $32.1 million, or 58.6%, are rated AA or better. In addition, the Company holds $135.4 million in asset-backed securities, of which 79.6% are rated A- or better and $65.6 million in bonds commercial mortgaged-backed securities, of which 83.6% are rated AA- or better. The weighted average credit enhancement for the Company’s asset-backed securities is 38.7.
14
The Company also faces liquidity risk. Liquidity risk is when the fair value of an investment is not able to be realized due to lack of interest by outside parties in the marketplace. The Company attempts to diversify its investment holdings to minimize this risk. The Company’s investment managers run periodic analysis of liquidity costs to the fixed income portfolio. The Company also faces credit risk. 96.2% of the Company’s fixed income securities are investment grade securities. 7.5% of the Company’s fixed maturities are rated AAA. See “Quantitative and Qualitative Disclosures about Market Risk” in Item 7A of Part II of this report for a more detailed discussion of the credit market and the Company’s investment strategy.
The following table summarizes, by Standard & Poor's rating classifications, the estimated fair value of Global Indemnity’s investments in fixed maturities, as of December 31, 2024 and 2023:
|
|
December 31, 2024 |
|
|
December 31, 2023 |
|
||||||||||
(Dollars in thousands) |
|
Estimated |
|
|
Percent |
|
|
Estimated |
|
|
Percent |
|
||||
AAA |
|
$ |
103,130 |
|
|
|
7.5 |
% |
|
$ |
335,381 |
|
|
|
25.9 |
% |
AA |
|
|
942,524 |
|
|
|
68.1 |
|
|
|
391,983 |
|
|
|
30.3 |
|
A |
|
|
131,287 |
|
|
|
9.5 |
|
|
|
257,714 |
|
|
|
19.9 |
|
BBB |
|
|
152,893 |
|
|
|
11.1 |
|
|
|
225,934 |
|
|
|
17.5 |
|
BB |
|
|
6,938 |
|
|
|
0.5 |
|
|
|
14,537 |
|
|
|
1.1 |
|
B |
|
|
2,521 |
|
|
|
0.2 |
|
|
|
1,592 |
|
|
|
0.1 |
|
CCC |
|
|
1,865 |
|
|
|
0.1 |
|
|
|
4,020 |
|
|
|
0.3 |
|
CC |
|
|
3,502 |
|
|
|
0.3 |
|
|
|
2,779 |
|
|
|
0.2 |
|
C |
|
|
1,387 |
|
|
|
0.1 |
|
|
|
2,338 |
|
|
|
0.2 |
|
D |
|
|
2,419 |
|
|
|
0.2 |
|
|
|
2,420 |
|
|
|
0.2 |
|
Not rated |
|
|
33,442 |
|
|
|
2.4 |
|
|
|
55,095 |
|
|
|
4.3 |
|
Total fixed maturities |
|
$ |
1,381,908 |
|
|
|
100.0 |
% |
|
$ |
1,293,793 |
|
|
|
100.0 |
% |
The following table sets forth the expected maturity distribution of the Company’s fixed maturities portfolio at their estimated market value as of December 31, 2024 and 2023:
|
|
December 31, 2024 |
|
|
December 31, 2023 |
|
||||||||||
(Dollars in thousands) |
|
Estimated |
|
|
Percent |
|
|
Estimated |
|
|
Percent |
|
||||
Due in one year or less |
|
$ |
923,861 |
|
|
|
66.8 |
% |
|
$ |
660,141 |
|
|
|
51.0 |
% |
Due in one year through five years |
|
|
180,523 |
|
|
|
13.1 |
|
|
|
270,667 |
|
|
|
20.9 |
|
Due in five years through ten years |
|
|
8,600 |
|
|
|
0.6 |
|
|
|
11,619 |
|
|
|
0.9 |
|
Due after ten years |
|
|
9,009 |
|
|
|
0.7 |
|
|
|
10,407 |
|
|
|
0.8 |
|
Securities with fixed maturities |
|
|
1,121,993 |
|
|
|
81.2 |
|
|
|
952,834 |
|
|
|
73.6 |
|
Mortgaged-backed securities |
|
|
58,920 |
|
|
|
4.3 |
|
|
|
58,927 |
|
|
|
4.6 |
|
Commercial mortgage-backed securities |
|
|
65,568 |
|
|
|
4.7 |
|
|
|
79,080 |
|
|
|
6.1 |
|
Asset-backed securities |
|
|
135,427 |
|
|
|
9.8 |
|
|
|
202,952 |
|
|
|
15.7 |
|
Total fixed maturities |
|
$ |
1,381,908 |
|
|
|
100.0 |
% |
|
$ |
1,293,793 |
|
|
|
100.0 |
% |
The value of the Company’s portfolio of bonds is inversely related to changes in market interest rates. In addition, some of the Company’s bonds have call or prepayment options. This could subject the Company to reinvestment risk should interest rates fall and issuers call their securities and the Company is forced to invest the proceeds at lower interest rates. The Company seeks to mitigate its reinvestment risk by investing in securities with varied maturity dates, so that only a portion of the portfolio will mature, be called, or be prepaid at any point in time.
As of December 31, 2024, the Company had aggregate equity securities of $12.3 million that consisted of preferred stocks.
The Company’s investments in other invested assets are comprised of three limited partnerships. At December 31, 2024, a partnership that invests in stressed and distressed debt instruments was valued at $2.6 million, a partnership that invests in Real Estate Investment Trust (“REIT”) qualifying assets was valued at $8.9 million, and a partnership comprised of performing, stressed or distressed securities and loans across the global fixed income markets was valued at $17.9 million. The carrying value of these investments approximates fair value. There is no readily available independent market price for these limited liability partnership investments and the Company does not have access to daily valuations. The Company receives annual audited financial statements from each of the partnership investments it owns.
15
Net realized investment gains (losses) were $0.5 million, ($2.1) million, and ($32.9) million for the years ended December 31, 2024, 2023, and 2022, respectively.
Competition
The Company competes with numerous domestic and international insurance companies, mutual companies, specialty insurance companies, underwriting agencies, diversified financial services companies, Lloyd's syndicates, risk retention groups, insurance buying groups, risk securitization products and alternative self-insurance mechanisms. In particular, the Company competes against insurance subsidiaries of the groups in the specialty insurance market noted below, insurance companies, and others, including:
In addition to the companies mentioned above, the Company is facing competition from standard line companies who are continuing to write risks that traditionally had been written by excess and surplus lines carriers, Bermuda companies who are establishing relationships with wholesale brokers and purchasing carriers, and other excess and surplus lines competitors.
Competition may take the form of lower prices, broader coverage, greater product flexibility, higher quality services, reputation and financial strength or higher ratings by independent rating agencies. In all of the Company’s markets, it competes by developing insurance products to satisfy well-defined market needs and by maintaining relationships with wholesale agents and insureds that rely on the Company’s expertise. The Company differentiates itself from the competition by distributing products that are not readily available in the market. Each of the Company’s products has its own distinct competitive environment. The Company seeks to compete through innovative products, appropriate pricing, niche underwriting expertise, and quality service to policyholders and general agencies.
16
Employees
The Company had 266 employees on December 31, 2024 and 2023. As of December 31, 2024, this included 206 insurance and technology services-based employees of Penn-America Underwriters, LLC and 60 operational and support based employees of Belmont Holdings SGX, LLC. None of the Company’s employees are covered by collective bargaining agreements as of December 31, 2024. The Company focuses on attracting, developing and retaining a team of highly talented and motivated employees. The Company conducts regular assessments of its compensation and benefit practices and pay levels to help ensure that its employees are compensated fairly and competitively. The Company devotes resources to employee training and development. Individual objectives are set annually for each employee, and attainment of those objectives is an element of the employee’s performance assessment. The Company recognizes that its success is based on the talents and dedication of those it employs and is highly invested in its employees' success.
Ratings
AM Best has seven rating categories in the AM Best Financial Strength Rating Scale. The categories ranging from best to worst are Superior, Excellent, Good, Fair, Marginal, Weak, and Poor. Within each rating category, there are rating notches of plus or minus to show additional gradation of the ratings. AM Best currently assigns the Company’s insurance companies with a financial strength rating of "A" (Excellent).
Publications of AM Best indicate that "A" (Excellent) ratings are assigned to those companies that, in AM Best's opinion, have an excellent ability to meet their ongoing obligations to policyholders. To determine a credit rating, AM Best performs quantitative and qualitative analysis which includes evaluating balance sheet strength, operating performance, enterprise risk management, and the business profile. These ratings are based on factors relevant to policyholders, general agencies, insurance brokers and intermediaries and are not directed to the protection of investors.
Regulation
General
The insurance industry is regulated in most countries, although the degree and type of regulation varies significantly from one jurisdiction to another. Global Indemnity's companies are all U.S. companies or have made elections to be taxed as a U.S. company.
U.S. Regulation
At December 31, 2024, the Company had five subsidiaries operating as insurance companies domiciled in the United States; United National Insurance Company, Penn-America Insurance Company, and Penn-Star Insurance Company, which are domiciled in Pennsylvania; Diamond State Insurance Company which is domiciled in Indiana; and Penn-Patriot Insurance Company, which is domiciled in Virginia.
As the parent of these insurance companies, Global Indemnity is subject to the insurance holding company laws of Pennsylvania, Indiana, and Virginia. These laws generally require each of the insurance companies to register with its respective domestic state insurance department and to annually furnish financial and other information about the operations of the companies within the insurance holding company system. Generally, all material transactions among affiliated companies in the holding company system to which any of the insurance companies is a party must be fair, and, if material or of a specified category, require prior notice and approval or absence of disapproval by the insurance department where the subsidiary is domiciled. Material transactions include sales, loans, contributions, reinsurance agreements, certain types of dividends, and service agreements with the non-insurance companies within Global Indemnity’s family of companies.
State Insurance Regulation
State insurance authorities have broad regulatory powers with respect to various aspects of the business of insurance companies, including, but not limited to, licensing companies to transact admitted business or determining eligibility to write surplus lines business, accreditation of reinsurers, admittance of assets to statutory surplus, regulating unfair trade and claims practices, establishing reserve requirements and solvency standards, management of enterprise risk, regulating investments and dividends, approving policy forms and related materials in certain instances and approving premium rates in certain instances. State insurance laws and regulations may require the Company’s insurance companies to file financial statements with insurance departments everywhere they will be licensed or eligible or accredited to conduct insurance business, and their operations are subject to review by those departments at any time. The Company’s insurance companies prepare statutory financial statements in accordance with statutory accounting principles ("SAP") and procedures prescribed or permitted by these departments. State insurance departments also conduct periodic examinations of the books and records, financial reporting, policy filings and market conduct of insurance companies domiciled in their states, generally once every three to five years, although market conduct examinations may take place at any time.
17
These examinations are generally carried out in cooperation with the insurance departments of other states under guidelines promulgated by the National Association of Insurance Commissioners (“NAIC”). In addition, admitted insurers are subject to targeted market conduct examinations involving specific insurers by state insurance regulators in any state in which the insurer is admitted. The insurance departments for the states of Indiana, Virginia, and Pennsylvania completed their most recent financial examinations of the Company’s insurance subsidiaries for the period from January 1, 2018 through December 31, 2022. No material adverse findings were reported to the Company. Their final reports were issued in 2024.
Before a person can acquire control of a U.S. insurance company, prior written approval must be obtained from the insurance commissioner of the state where the insurer is domiciled. Prior to granting approval of an application to acquire control of a domestic insurer, the state insurance commissioner will consider factors such as the financial strength of the applicant, the integrity and management of the applicant's board of directors and executive officers, the acquirer’s plans for the management, board of directors, executive officers, and employees of the company being acquired, the acquirer’s plans for the future operations of the domestic insurer and any anti-competitive results that may arise from the consummation of the acquisition of control. Generally, state statutes provide that control over a domestic insurer is presumed to exist if any person, directly or indirectly, owns, controls, holds with the power to vote, or holds proxies representing 10% or more of the voting securities of the domestic insurer. Because a person acquiring 10% or more of Global Indemnity Group, LLC’s common shares would indirectly control the same percentage of the stock of the insurance companies, the insurance change of control laws of Pennsylvania, Indiana, and Virginia would likely apply to such a transaction.
These laws may discourage potential acquisition proposals and may delay, deter or prevent a change of control of Global Indemnity Group, LLC, including through transactions, and in particular unsolicited transactions, that some or all of the shareholders of Global Indemnity Group, LLC might consider desirable.
Insurance Regulatory Information System Ratios
The NAIC Insurance Regulatory Information System ("IRIS") was developed by a committee of the state insurance regulators and is intended primarily to assist state insurance departments in executing their statutory mandates to oversee the financial condition of insurance companies operating in their respective states. IRIS identifies thirteen industry ratios and specifies "usual values" for each ratio. Departure from the usual values of the ratios can lead to inquiries from individual state insurance commissioners that require the insurer to describe certain aspects of a business that are causing such departures. It is not uncommon for companies to have ratios that fall outside of these usual values. Although the Company’s insurance subsidiaries have departures from usual values of certain IRIS ratios, the Company believes that its insurance subsidiaries have adequate capital and liquidity to meet their operational needs.
The Company’s insurance subsidiaries' departures from usual values of certain IRIS ratios are as follows:
Risk-Based Capital Regulations
The state insurance departments of Pennsylvania, Indiana, and Virginia require that each domestic insurer report its risk-based capital based on a formula calculated by applying factors to various asset, premium and reserve items. The formula takes into account the risk characteristics of the insurer, including asset risk, insurance risk, interest rate risk and business risk. The respective state insurance regulators use the formula as an early warning regulatory tool to identify possible inadequately capitalized insurers for purposes of initiating regulatory action, and generally not as a means to rank insurers. State insurance laws impose broad confidentiality requirements on those engaged in insurance (including insurers, general agencies, brokers and others) and on state insurance departments as to the use and publication of risk-based capital data. The respective state insurance regulators have explicit regulatory authority to require various actions by, or to take various actions against, insurers whose total adjusted capital does not exceed certain company action level risk-based capital levels.
18
Based on the standards currently adopted, the insurance companies reported in their 2024 statutory filings that their capital and surplus are above the prescribed risk-based capital requirements. See Note 21 of the notes to the consolidated financial statements in Item 8 of Part II of this report for additional information on the NAIC's risk-based capital model for determining the levels of statutory capital and surplus an insurer must maintain.
Statutory Accounting Principles (“SAP”)
SAP is a basis of accounting developed to assist insurance regulators in monitoring and regulating the solvency of insurance companies. SAP is primarily concerned with measuring an insurer's surplus. Accordingly, statutory accounting focuses on valuing assets and liabilities of insurers at financial reporting dates in accordance with appropriate insurance laws, regulatory provisions, and practices prescribed or permitted by each insurer's domiciliary state.
GAAP is concerned with a company's solvency, but it is also concerned with other financial measurements, such as matching revenues and expenses, income, and cash flows. As a direct result, different line item groupings of assets and liabilities and different amounts of assets and liabilities are reflected in financial statements prepared in accordance with GAAP than financial statements prepared in accordance with SAP.
Statutory accounting practices established by the NAIC and adopted in part by the Pennsylvania, Indiana, and Virginia regulators determine, among other things, the amount of statutory surplus and statutory net income (loss) of the insurance companies and thus determine, in part, the amount of funds these subsidiaries have available to pay dividends.
State Dividend Limitations
The insurance companies are restricted by statute as to the amount of dividends that they may pay without the prior approval of the applicable state regulatory authorities. Dividends may be paid without advanced regulatory approval only out of unassigned surplus. The dividend limitations imposed by the applicable state laws are based on the statutory financial results of each company within the Insurance Operations that are determined using statutory accounting practices that differ in various respects from accounting principles used in financial statements prepared in conformity with GAAP. See “Regulation – Statutory Accounting Principles.” Key differences relate to, among other items, deferred acquisition costs, limitations on deferred income taxes, reserve calculation assumptions and surplus notes, if any.
See the “Liquidity and Capital Resources” section in Item 7 of Part II of this report for a more complete description of the state dividend limitations. See Note 21 of the notes to the consolidated financial statements in Item 8 of Part II of this report for the maximum amount of distributions that the Company’s insurance companies could pay as dividends in 2025.
Guaranty Associations and Similar Arrangements
Most of the jurisdictions in which the insurance companies are admitted to transact business require property and casualty insurers doing business within that jurisdiction to participate in guaranty associations. These associations are organized to pay contractual benefits owed pursuant to insurance policies issued by impaired, insolvent or failed insurers. These associations levy assessments, up to prescribed limits, on all member insurers in a particular state on the basis of the proportionate share of the premiums written by member insurers in the lines of business in which the impaired, insolvent, or failed insurer is engaged. Some states permit member insurers to recover assessments paid through full or partial premium tax offsets or in limited circumstances by surcharging policyholders.
Federal Insurance Regulation
The Dodd-Frank Wall Street Reform and Consumer Protection Act (the “Dodd-Frank Act”) includes a number of provisions having a direct impact on the insurance industry, most notably, streamlining of surplus lines insurance, credit for reinsurance, and systemic risk regulation. With respect to surplus lines insurance, the Dodd-Frank Act gives exclusive authority to regulate surplus lines transactions to the home state of the insured, and the requirement that a surplus lines broker must first attempt to place coverage in the admitted market is substantially softened with respect to large commercial policyholders. Significantly, the Dodd-Frank Act provides that a state may not prevent a surplus lines broker from placing surplus lines insurance with a non-U.S. insurer that appears on the quarterly listing of non-admitted insurers maintained by the International Insurers Department of the NAIC. Regarding credit for reinsurance, the Dodd-Frank Act generally provides that the state of domicile of the ceding company (and no other state) may regulate financial statement credit for the ceded risk. The Dodd-Frank Act also provides the U.S. Federal Reserve with supervisory authority over insurance companies that are deemed to be “systemically important.”
19
Privacy, Data Protection and Cybersecurity
The Company is subject to numerous U.S. federal and state laws governing the protection of personal and confidential information. These laws and regulations are increasing in complexity, and the requirements are extensive and detailed. Numerous states require the Company to certify its compliance with their data protection laws. Some examples of privacy, data protection and cybersecurity laws and regulations include:
The New York Department of Financial Services' (“NYDFS”) Cybersecurity Regulation which mandates detailed cybersecurity standards for all institutions, including insurance entities, authorized by the NYDFS to operate in New York. Among the requirements are the maintenance of a cybersecurity program with governance controls, risk-based minimum data security standards for technology systems, cyber breach preparedness and response requirements, including reporting obligations, vendor oversight, training, program record keeping, and certification obligations.
The NAIC adopted an Insurance Data Security Model Law, which requires licensed insurance entities to comply with detailed information security requirements. The NAIC model law is similar in many respects to the NYDFS Cybersecurity Regulation.
The California Consumer Privacy Act, which took effect in January 2020, as amended by the California Privacy Rights Act, which took effect in January 2023, adopted significant compliance requirements for companies doing business in California. Among other things, the California Privacy Rights Act expanded consumer privacy rights and established a new privacy regulatory agency.
Available Information
The Company maintains a website at www.gbli.com. The information on the Company’s website is not incorporated herein by reference. The Company will make available, free of charge on its website, the most recent annual report on Form 10-K and subsequently filed quarterly reports on Form 10-Q, current reports on Form 8-K and amendments to those reports filed or furnished pursuant to Section 13(a) or 15(d) of the Securities Exchange Act of 1934, as amended, as soon as reasonably practicable after the Company files such material with, or furnishes it to, the United States Securities and Exchange Commission (“SEC”).
The SEC maintains, free of charge, a website (www.sec.gov) that contains reports, proxy and information statements, and other information filed or furnished electronically by the Company with the SEC.
Investors and others should note that the Company uses its website to communicate with investors and the public about the Company, and from time to time, the Company may announce material information through its website. Therefore, the Company encourages investors, the media and others interested in the Company to monitor and review the information made available on its website.
Item 1A. RISK FACTORS
The risks and uncertainties described below are those the Company believes to be material. If any of the following actually occur, the Company’s business, prospects, financial condition, results of operations and cash flows could be materially and adversely affected.
Risks Related to the Company’s Business
Restructuring of insurance operations may not yield the expected benefits.
The restructuring initiative may not produce the anticipated benefits and may result in unintended consequences which could have a material adverse impact on the Company’s financial condition and results of operations. The restructuring initiative could result in an unexpected loss of key personnel. This could have a material adverse impact on the Company’s business due to the loss of skill, knowledge of the Company’s product offerings, years of industry experience, and in some cases, the difficulty of promptly finding qualified replacement personnel. In addition, the restructuring could harm the Company’s relationships with its agents or it may not be able to execute its strategies as efficiently as before the restructuring.
The Company may not be able to effectively start up or integrate new product opportunities.
The Company's ability to grow the business depends, in part, on the creation, implementation or acquisition of new insurance products that are profitable and fit within the Company's business model. The Company's ability to grow profitably requires the identification of market opportunities, which may include acquisitions, and the ability to attract and retain underwriting.
20
marketing, and claims expertise to support that growth. New product launches, as well as resources to integrate business acquisitions, are subject to many obstacles, including ensuring the Company has sufficient business and systems processes, determining appropriate pricing, obtaining reinsurance, assessing opportunity costs and regulatory burdens, and planning for internal infrastructure needs. The Company's ability to grow profitably could be impaired if it cannot effectively overcome these obstacles or it improperly implements new insurance products.
If actual claims payments exceed the Company’s reserves for losses and loss adjustment expenses, the Company’s financial condition and results of operations could be adversely affected.
The Company’s success depends upon its ability to accurately assess the risks associated with the insurance and reinsurance policies that it writes. The Company establishes reserves on an undiscounted basis to cover its estimated liability for the payment of all losses and loss adjustment expenses incurred with respect to premiums earned on the insurance policies that it writes. Reserves do not represent an exact calculation of liability. Rather, reserves are estimates of what the Company expects to be the ultimate cost of resolution and administration of claims under the insurance policies that it writes. These estimates are based upon actuarial and statistical projections, the Company’s assessment of currently available data, as well as estimates and assumptions as to future trends in claims severity and frequency, judicial theories of liability and other factors. The Company continually refines its reserve estimates in an ongoing process as experience develops and claims are reported and settled.
Establishing an appropriate level of reserves is an inherently uncertain process. The following factors may have a substantial impact on the Company’s future actual losses and loss adjustment experience:
For example, as industry practices and legal, judicial, social and other conditions change, unexpected and unintended exposures related to claims and coverage may emerge. These exposures may either extend coverage beyond the Company’s underwriting intent or increase the frequency or severity of claims. As a result, such developments could cause the Company’s level of reserves to be inadequate.
Actual losses and loss adjustment expenses the Company incurs under insurance policies that it writes may be different from the amount of reserves it establishes, and to the extent that actual losses and loss adjustment expenses exceed the Company’s expectations and the reserves reflected on its financial statements, the Company will be required to immediately reflect those changes by increasing its reserves. In addition, regulators could require that the Company increase its reserves if they determine that the reserves were understated in the past. When the Company increases reserves, pre-tax income for the period in which it does so will decrease by a corresponding amount. In addition to having an effect on reserves and pre-tax income, increasing or "strengthening" reserves causes a reduction in the Company’s insurance companies' surplus and could cause the rating of its insurance company subsidiaries to be downgraded or placed on credit watch. Such a downgrade could, in turn, adversely affect the Company’s ability to sell insurance policies.
The failure of any of the loss limitations or exclusions employed by the Company, or changes in other claims or coverage issues, could have a material adverse effect on the Company's financial condition or results of operations.
Although the Company seeks to mitigate its loss exposure through a variety of methods, the future is inherently unpredictable. It is difficult to predict the timing, frequency and severity of losses with statistical certainty. It is not possible to completely eliminate the Company's exposure to unforecasted or unpredictable events and, to the extent that losses from such risks occur, the Company's financial condition and results of operations could be materially adversely affected.
For instance, various provisions within policies issued by the Company, such as limitations or exclusions from coverage or choice of forum, which have been negotiated to limit the Company's risks, may not be enforceable in the manner intended by the Company.
In addition, policy terms are designed to manage the Company's exposure to expanding theories of legal liability like those which have given rise to claims for lead paint asbestos, mold, construction defects and environmental matters. Many of the policies issued by the Company also include conditions requiring the prompt reporting of claims to the Company and entitle the Company to decline coverage in the event of a violation of those conditions.
21
Also, many of the Company's policies limit the period during which a policyholder may bring a claim under the policy, which in many cases is shorter than the statutory period under which such claims can be brought against the Company's policyholders.
While these exclusions and limitations help the Company to assess and reduce its loss exposure and help eliminate known exposures to certain risks, it is possible that a court or regulatory authority could nullify or void an exclusion or legislation could be enacted modifying or barring the use of such endorsements and limitations. These types of governmental actions could result in higher than anticipated losses and loss adjustment expenses, which could have a material adverse effect on the Company's financial condition or results of operations.
As industry practices and legal, judicial, social and other environmental conditions change, unexpected and unintended issues related to claims and coverage may emerge. An example is court decisions that read policy exclusions narrowly so as to expand coverage, thereby requiring insurers to create and write new exclusions.
These issues may adversely affect the Company's business by either broadening coverage beyond its underwriting intent or by increasing the number or size of claims. In some instances, these changes may not become apparent until sometime after the Company has issued insurance contracts that are affected by the changes. As a result, the full extent of liability under the Company's insurance contracts may not be known for many years after a contract is issued.
The occurrence of natural or man-made disasters could adversely affect the Company’s business, financial condition and results of operations.
The Company is exposed to various risks arising out of natural disasters, including earthquakes, hurricanes, fires, floods, landslides, tornadoes, typhoons, tsunamis, hailstorms, explosions, climate events or weather patterns, public health crises such as illness, epidemics or pandemic health events, as well as man-made disasters, including acts of terrorism, military actions, cyber-terrorism, explosions and biological, chemical or radiological events. The continued threat of terrorism and ongoing military actions may cause significant volatility in global financial markets, and a natural or man-made disaster could trigger an economic downturn in the areas directly or indirectly affected by the disaster. These consequences could, among other things, result in a decline in business and increased claims from those areas. They could also result in reduced underwriting capacity making it more difficult for the Company’s agents to place business. In addition, there could be unanticipated problems with the Company’s disaster recovery processes, or a support failure from external providers, that could have an adverse effect on the Company’s ability to conduct business if a significant number of employees were unable to work in the event of a disaster. Disasters also could disrupt public and private infrastructure, including communications and financial services, which could disrupt the Company’s ordinary business operations.
A natural or man-made disaster could also disrupt the operations of the Company’s counterparties or result in increased prices for the products and services they provide to the Company. A natural or man-made disaster could increase the incidence or severity of errors and omissions claims against the Company.
The Company may also experience disruptions to its business as a result of a pandemic and any associated protective or preventative measures including but not limited to:
As a result, it is possible that any, or a combination of all, of these factors related to natural or man-made disasters could have a material adverse effect on the Company’s business, financial condition, and results of operations.
22
Adverse economic factors, including recession, inflation, periods of high unemployment or lower economic activity could
result in the sale of fewer policies than expected or an increase in the frequency of claims and premium defaults, or a combination of these effects, which, in turn, could affect the Company's growth and profitability.
Factors, such as business revenue, economic conditions, the volatility and strength of the capital markets, trade disputes, including the imposition of new or increased tariffs and inflation can affect the business and economic environment. These same factors affect the Company's ability to generate revenue and profits. In an economic downturn that is characterized by higher unemployment, declining spending and reduced corporate revenue, the demand for insurance products is generally adversely affected, which directly affects the Company's premium levels and profitability. These outcomes would reduce the Company's underwriting profit to the extent these factors are not reflected in the rates charged.
A decline in rating for any of the Company’s insurance subsidiaries could adversely affect its position in the insurance market; making it more difficult to market its insurance products and cause premiums and earnings to decrease.
If the rating of any of the Company’s insurance companies is reduced from its current level of “A” (Excellent) by AM Best, the Company’s competitive position in the insurance industry could suffer, and it could be more difficult to market its insurance products. A downgrade could result in a significant reduction in the number of insurance contracts the Company writes and in a substantial loss of business; as such business could move to other competitors with higher ratings, thus causing premiums and earnings to decrease.
These ratings are not an evaluation of, nor are they directed to, investors in Global Indemnity Group, LLC’s class A common shares and are not a recommendation to buy, sell or hold Global Indemnity Group, LLC’s class A common shares. Publications of AM Best indicate that companies are assigned "A" (Excellent) ratings if, in AM Best's opinion, they have an excellent ability to meet their ongoing obligations to policyholders. These ratings are subject to periodic review by, and may be revised downward or revoked at the sole discretion of AM Best.
A failure in the Company’s operational systems or infrastructure or those of third parties, including security breaches or cyber-attacks, could disrupt the Company’s business, its reputation, and / or cause losses which could have an adverse effect on the Company’s business operations and financial results.
The Company’s business is dependent upon the secure processing, storage, and transmission of information over computer networks using applications, systems and other technologies. The business depends on effective information security and systems to perform accounting, policy administration, claims, underwriting, actuarial and all aspects of day-to-day operations necessary to service the Company’s customers and agents, to value the Company’s investments and to timely and accurately report the Company’s financial results.
The information systems the Company relies upon must ensure confidentiality, integrity, and availability of the data, including systems maintained by the Company as well as data in and assets held through third-party service providers and systems. The Company employs various measures, systems, applications and software to address data security. The Company reviews its existing security measures and systems on a continuing basis through internal and independent evaluations. The Company has implemented administrative and technical controls and takes protective actions in an attempt to reduce the risk of cyber incidents.
The Company’s internal and external controls, processes, and the vendors used to protect networks, systems and applications, individually or together, may be insufficient to prevent a security incident. Employee or third-party vendor errors, malicious acts, unauthorized access, computer viruses, malware, the introduction of malicious code, system failures and disruptions, and cyber-attacks can result in business interruption, compromise of data and loss of assets. Complexity of the Company’s technology increases regularly and has increased the risk of a security incident involving data, network, systems and applications.
Third parties, including third party administrators and cloud-based systems, are also subject to cyber-attacks and breaches of confidential information, along with the other risks outlined above, any one of which may result in the Company incurring substantial costs and other negative consequences, including a material adverse effect on the Company's business, reputation, financial condition, results of operations or liquidity. The Company's increased use of open source software, cloud technology and software as a service can make it more difficult to identify and remedy such situations due to the disparate location of code utilized in its operations.
Security incidents have the potential to interrupt business, cause delays in processes and procedures directly affecting the Company, and jeopardize the Company’s, insureds’, claimants’, agents’ and others’ confidential data resulting in data loss, loss of assets, and reputational damages.
23
If this occurs, it could have a material adverse effect on the Company’s business operations and financial results.
Security incidents could require significant resources, both internal and external, to resolve or remediate and could result in financial losses that may not be covered by insurance or not fully recoverable under any insurance. The Company may be subject to litigation and damages or regulatory action under data protection and privacy laws and regulations enacted by federal, state and foreign governments, or other regulatory bodies. As a result, the Company’s ability to conduct its business and its results of operations might be materially and adversely affected.
The Company’s business success and profitability depend, in part, on effective information technology systems and on continuing to develop and implement improvements in technology, particularly as the Company’s business processes become more digital.
The Company depends in large part on its technology systems for conducting business and processing claims, as well as for providing the data and analytics the Company utilizes to manage its business. As a result, the Company’s business success is dependent on maintaining the effectiveness of existing technology systems and on continuing to develop and enhance technology systems that support the Company’s business processes and strategic initiatives in an efficient manner, particularly as business processes become more digital and certain of the Company’s products are more technology-based. Some system development projects are long-term in nature and may negatively impact the Company’s expense ratios and may cost more than expected to complete. In addition, system development projects may not deliver the benefits or perform as expected, or may be replaced or become obsolete more quickly than expected, which could result in operational difficulties, additional costs or accelerated recognition of expenses. The Company’s ability to provide competitive services to, and conduct business with, new and existing customers in a cost effective manner as well as its ability to implement the Company’s strategic initiatives could be adversely impacted if the Company does not effectively and efficiently manage and upgrade its technology portfolio or if the costs of doing so are higher than expected.
Artificial intelligence is an evolving and rapidly growing technology.
The rapid evolution of artificial intelligence (“AI”) could exacerbate the information technology related risks described above, as well as alter the competitive landscape. While the Company anticipates that it will continue to research and implement AI-based technology solutions in an effort to both mitigate risk and increase automation in its environment, it is possible that bad actors and/or competitors will leverage AI solutions more quickly or more effectively than the Company, and exploit vulnerabilities or take market share, which could impair the Company's ability to compete effectively and adversely affect its results of operations. AI is still in its early stages, and the introduction and incorporation of AI technologies may result in unintended consequences or other new or expanded risks and liabilities, such as unintended or inadvertent transmission of proprietary or sensitive information. Additionally, if the content, analyses or recommendations that AI applications assist in producing are, or are alleged to be, deficient, inaccurate or biased, such as due to limitations in AI algorithms, insufficient or biased base data or flawed training methodologies, the Company's business, financial condition, results of operations and reputation may be adversely affected. Further, AI technology is continuously evolving, and the Company may incur costs to adopt and deploy AI technologies that could become obsolete earlier than expected, and there can be no assurance that the Company will realize the desired or anticipated benefits from AI.
In addition, technological advancements in the industry, including with respect to AI and machine learning technologies, could result in increased demand and competition for qualified professionals with such skills and technological knowledge. There can be no assurance that the Company will be successful in finding, attracting and retaining such qualified individuals.
Also, there is uncertainty in the legal and regulatory landscape for AI, which is not fully developed, and any laws, regulations or industry standards adopted in response to the emergence of AI may be burdensome, could entail significant costs, and may restrict or impede the Company's ability to successfully develop, adopt and deploy AI technologies efficiently and effectively.
Any of these factors could adversely impact the Company's business, financial condition and results of operations.
24
Investment Related Risks
The Company’s investment performance may suffer as a result of adverse capital market developments or other factors, which would in turn adversely affect its financial condition and results of operations.
The Company derives a significant portion of its income from its invested assets. As a result, the Company’s operating results depend in part on the performance of its investment portfolio. The Company’s operating results are subject to a variety of investment risks, including risks relating to general economic conditions, market volatility, interest rate fluctuations, liquidity risk and credit and default risk. The fair value of fixed income investments can fluctuate depending on changes in interest rates and the credit quality of underlying issuers. Generally, the fair market value of these investments has an inverse relationship with changes in interest rates, while net investment income earned by the Company from future investments in fixed maturities will generally increase or decrease with changes in interest rates. Additionally, with respect to certain of its investments, the Company is subject to pre-payment or reinvestment risk.
Credit tightening could negatively impact the Company’s future investment returns and limit the ability to invest in certain classes of investments. Credit tightening may cause opportunities that are marginally attractive to not be financed, which could cause a decrease in the number of bond issuances. If marginally attractive opportunities are financed, they may be at higher interest rates, which would cause credit risk of such opportunities to increase. If new debt supply is curtailed, it could cause interest rates on securities that are deemed to be credit-worthy to decline. Funds generated by operations, sales, and maturities will need to be invested. If the Company invests during a tight credit market, investment returns could be lower than the returns the Company is currently realizing and/or it may have to invest in higher risk securities.
With respect to its longer-term liabilities, the Company strives to structure its investments in a manner that recognizes liquidity needs for its future liabilities. However, if the Company’s liquidity needs or general and specific liability profile unexpectedly changes, it may not be successful in continuing to structure its investment portfolio in that manner. To the extent that the Company is unsuccessful in correlating its investment portfolio with its expected liabilities, the Company may be forced to liquidate its investments at times and prices that are not optimal, which could have a material adverse effect on the performance of its investment portfolio. The Company refers to this risk as liquidity risk, which is when the fair value of an investment is not able to be realized due to low demand by outside parties in the marketplace.
The Company is also subject to credit risk due to non-payment of principal or interest. Several classes of securities that the Company holds have default risk. As interest rates rise for companies that are deemed to be less creditworthy, there is a greater risk that they will be unable to pay contractual interest or principal on their debt obligations.
Interest rates are highly sensitive to many factors, including governmental monetary policies, domestic and international economic and political conditions and other factors beyond the Company’s control. Although the Company attempts to take measures to manage the risks of investing in a changing interest rate environment, the Company may not be able to mitigate interest rate sensitivity effectively. A significant increase in interest rates could have a material adverse effect on the market value of the Company’s fixed maturities securities.
The Company has investments in limited partnerships which are not liquid. For several limited partnership investments, the Company does not have the contractual option to redeem its interests but receives distributions based on the liquidation of the underlying assets. During the third quarter of 2023, the Company provided the Global Debt Fund, LP with a formal withdrawal request in full. Going forward, one fifth of the partnership will be redeemed based on June 30th and December 31st fair values until the limited partnership investment is fully liquidated. The Company does not have the ability to sell or transfer its limited partnership interests without consent from the general partner. The Company’s returns could be negatively affected if the market values of the limited partnerships decline. If the Company needs liquidity, it might be forced to liquidate other investments at a time when prices are not optimal.
See Note 5 of the notes to the consolidated financial statements in Item 8 of Part II of this report for further information surrounding the Company’s investments as of December 31, 2024 and 2023.
Risks Related to the Company’s Business Partners
The Company cannot guarantee that its reinsurers will pay in a timely fashion, if at all, and as a result, the Company could experience losses.
The Company cedes a portion of gross written premiums to third-party reinsurers under reinsurance contracts. Although reinsurance makes the reinsurer liable to the Company to the extent the risk is transferred, it does not relieve the Company of its liability to its policyholders.
25
Upon payment of claims, the Company will bill its reinsurers for their share of such claims. The reinsurers may not pay the reinsurance receivables that they owe to the Company or they may not pay such receivables on a timely basis. If the reinsurers fail to pay it or fail to pay on a timely basis, the Company’s financial results would be adversely affected. Lack of reinsurer liquidity, perceived improper underwriting or claim handling by the Company, and other factors could cause a reinsurer not to pay. See "Business – Reinsurance of Underwriting Risk" in Item 1 of Part I of this report.
See Note 10 of the notes to the consolidated financial statements in Item 8 of Part II of this report for further information surrounding the Company’s reinsurance receivable balances as of December 31, 2024 and 2023.
Since the Company depends on wholesale general agents and retail agents as well as other insurance companies and reinsurance companies for a significant portion of its revenue, a loss of one or more could adversely affect the Company.
The Company’s Penn-America products are distributed through approximately 360 wholesale general agents that have specific quoting and binding authority and that in turn sell the Company’s insurance products to insureds through retail insurance brokers. Penn-America also distributes its products through approximately 2,800 retail agents. The Company markets and distributes its reinsurance products through third-party brokers, insurance companies and reinsurance companies. A loss of all or substantially all of the business produced by one or more of these wholesale general agents or larger retail agents as well as other insurance companies or reinsurance companies could have an adverse effect on the Company’s results of operations.
Because the Company relies on these distributors as its sales channel and for some additional services that it receives from these distributors, any deterioration in the relationships with the Company's distributors or failure to provide competitive compensation could lead its distributors to place more premium with other carriers and less premium with the Company. In addition, the Company could be adversely affected if the distributors with which it does business exceed their granted authority, fail to transfer collected premium to the Company, breach the obligations that they owe to the Company or fail to perform such additional services. Although the Company routinely monitors its distribution relationships, such actions could expose the Company to liability. As the speed of digitization accelerates, the Company is subject to risks associated with both its distributors and their ability to keep pace. In an increasingly digital world, distributors who cannot provide a digital or technology-driven experience risk losing customers who demand such an experience, and such customers may choose to do business with more technology-driven distributors.
If market conditions cause reinsurance to be more costly or unavailable, the Company may be required to bear increased risks or reduce the level of its underwriting commitments.
As part of the Company’s overall strategy of risk and capacity management, it purchases reinsurance for a portion of the risk underwritten by its insurance subsidiaries. Market conditions beyond the Company’s control determine the availability and cost of the reinsurance it purchases, which may affect the level of its business and profitability. The Company’s third-party reinsurance facilities are generally subject to annual renewal. The Company may be unable to maintain its current reinsurance facilities or obtain other reinsurance facilities in adequate amounts and at favorable rates. If the Company is unable to renew expiring facilities or obtain new reinsurance facilities, either the net exposure to risk would increase or, if the Company is unwilling to bear an increase in net risk exposures, it would have to reduce the amount of risk it underwrites.
The Company’s financial and business results may fluctuate as a result of many factors, including cyclical changes in the insurance industry.
Historically, the results of companies in the property and casualty insurance industry have been subject to significant fluctuations and uncertainties. The industry's profitability can be affected significantly by:
26
The demand for property and casualty insurance and reinsurance can also vary significantly, rising as the overall level of economic activity increases and falling as that activity decreases. The property and casualty insurance industry historically is cyclical in nature. These fluctuations in demand and competition could produce underwriting results that would have a negative impact on the Company’s consolidated results of operations and financial condition.
The Company faces significant competitive pressures in its business that could cause demand for its products to fall and adversely affect the Company’s profitability.
The Company competes with a large number of other companies in its selected lines of business. The Company competes, and will continue to compete, with major U.S. and non-U.S. insurers and other regional companies, as well as mutual companies, specialty insurance companies, reinsurance companies, underwriting agencies and diversified financial services companies. Some of the Company’s competitors have greater financial and marketing resources than the Company does. The Company’s profitability could be adversely affected if it loses business to competitors offering similar products at or below the Company’s prices.
The Company's general agencies collect insurance premiums on the Company's behalf. As a result, the Company is exposed to credit risk.
Insurance premiums generally flow from the insured to their retail broker, then into a trust account controlled by the Company’s professional general agencies. Several of the Company’s professional general agencies are required to forward funds, net of commissions, to the Company following the end of each month. Consequently, the Company assumes a degree of credit risk on the aggregate amount of these balances that have been paid by the insured but have yet to reach the Company.
Brokers, insurance companies and reinsurance companies typically pay premiums on reinsurance treaties written with the Company on a quarterly basis. This accumulation of balances due to the Company exposes it to credit risk.
Assumed premiums on reinsurance treaties generally flow from the ceding companies to the Company on a quarterly basis. In some instances, the reinsurance treaties allow for funds to be withheld for longer periods as specified in the treaties. Consequently, the Company assumes a degree of credit risk on the aggregate amount of these balances that have been collected by the reinsured but have yet to reach the Company.
Because the Company provides its general agencies with specific quoting and binding authority, if any of them fail to comply with pre-established guidelines, the Company’s results of operations could be adversely affected.
The Company markets and distributes its insurance products through professional general agencies that have limited quoting and binding authority and that in turn sell the Company’s insurance products to insureds through retail insurance brokers. These professional general agencies can bind certain risks without the Company’s initial approval. If any of these professional general agencies fail to comply with the Company’s underwriting guidelines and the terms of their appointment, the Company could be bound on a particular risk or number of risks that were not anticipated when it developed the insurance products or estimated losses and loss adjustment expenses. Such actions could adversely affect the Company’s results of operations.
Risks Related to Regulation of the Company
Global Indemnity Group, LLC’s regulatory constraints limit its ability to receive dividends from insurance company subsidiaries in order to meet its cash requirements.
Global Indemnity Group, LLC and its wholly owned subsidiary, Belmont Holdings GX, Inc., are holding companies and, as such, have no substantial operations of their own. The assets of Global Indemnity Group, LLC and Belmont Holdings GX, Inc. primarily consist of cash, an investment portfolio, and ownership of the shares of its direct and indirect subsidiaries.
27
Global Indemnity Group LLC’s primary source of funds to meet ongoing liquidity needs is investment income generated by its investment portfolio, interest and principal payments on intercompany debt with Belmont Holdings GX, Inc. and reimbursement for equity awards granted to employees of Belmont Holdings GX, Inc. and Penn-America Underwriters, LLC.
Belmont Holdings GX, Inc.’s source of funds to meet ongoing liquidity needs is investment income generated by its investment portfolio and dividends from their insurance company subsidiaries.
The future liquidity of Global Indemnity Group, LLC and Belmont Holdings GX, Inc. is dependent on the ability of its subsidiaries to generate income to pay dividends. In addition, the Company’s insurance subsidiaries are subject to significant regulatory restrictions limiting their ability to declare and pay dividends. The inability of the Company’s insurance subsidiaries to pay dividends in an amount sufficient to enable the Company to meet its cash requirements at the holding company level could have a material adverse effect on its operations.
See "Regulation – U.S. Regulation” in Item 1 of Part I of this report and “Liquidity and Capital Resources” section in Item 7 of Part II of this report for more information on state dividend limitations. Also, see Note 21 of the notes to the consolidated financial statements in Item 8 of Part II of this report for the maximum amount of dividends that could be paid by the Company’s U.S. insurance subsidiaries in 2025.
The Company’s insurance company subsidiary businesses are heavily regulated and changes in regulation may limit the way it operates.
The Company's insurance company subsidiaries are subject to extensive supervision and regulation in the U.S. states in which it operates. This is particularly true in those states in which the Company’s insurance subsidiaries are licensed, as opposed to those states where its insurance subsidiaries write business on a surplus lines basis. The supervision and regulation relate to numerous aspects of the Company’s business and financial condition. The primary purpose of the supervision and regulation is the protection of the Company’s insurance policyholders and not its investors. The extent of regulation varies, but generally is governed by state statutes. These statutes delegate regulatory, supervisory, and administrative authority to state insurance departments. This system of regulation covers, among other things:
The statutes or the state insurance department regulations may affect the cost or demand for the Company’s products and may impede the Company from obtaining rate increases or taking other actions it might wish to take to increase profitability. Further, the Company may be unable to maintain all required licenses and approvals and its business may not fully comply with the wide variety of applicable laws and regulations or the relevant authority's interpretation of the laws and regulations. Also, regulatory authorities have discretion to grant, renew or revoke licenses and approvals subject to the applicable state statutes and appeal process. If the Company does not have the requisite licenses and approvals (including in some states the requisite secretary of state registration) or do not comply with applicable regulatory requirements, the insurance regulatory authorities could stop or temporarily suspend the Company from carrying on some or all of its activities or monetarily penalize the Company.
The U.S. insurance regulatory framework has come under increased federal scrutiny and some state legislators have considered or enacted laws that may alter or increase state regulation of insurance and reinsurance companies and holding companies.
28
Moreover, the NAIC, which is an association of the insurance commissioners of all 50 U.S. States and the District of Columbia, and state insurance regulators regularly re-examine existing laws and regulations. Changes in these laws and regulations, including as a result of executive orders, or in the interpretation of these laws and regulations could have a material adverse effect on the Company’s business.
Although the U.S. federal government has not historically regulated the insurance business, there have been proposals from time to time to impose federal regulation on the insurance industry. The Dodd-Frank Act establishes a Federal Insurance Office within the U.S. Department of the Treasury. The Federal Insurance Office initially has limited regulatory authority and is empowered to gather data and information regarding the insurance industry and insurers, including conducting a study for submission to the U.S. Congress on how to modernize and improve insurance regulation in the U.S. Further, the Dodd-Frank Act gives the Federal Reserve supervisory authority over a number of financial services companies, including insurance companies, if they are designated by a two-thirds vote of a Financial Stability Oversight Council as "systemically important." While the Company does not believe that it is "systemically important," as defined in the Dodd-Frank Act, it is possible that the Financial Stability Oversight Council may conclude that it is. If the Company were designated as "systemically important," the Federal Reserve's supervisory authority could include the ability to impose heightened financial regulation and could impact requirements regarding the Company’s capital, liquidity, leverage, business and investment conduct. As a result of the foregoing, the Dodd-Frank Act, or other additional federal regulation that is adopted in the future, could impose significant burdens on the Company, including impacting the ways in which it conducts business, increasing compliance costs and duplicating state regulation, and could result in a competitive disadvantage, particularly relative to smaller insurers who may not be subject to the same level of regulation.
The Company’s business practices with respect to data could give rise to liabilities or reputational harm as a result of governmental regulation, legal requirements or industry standards relating to consumer privacy and data protection.
If the Company fails to protect the privacy of third-party data or implement practices and procedures deemed necessary by regulators or consumers, the Company may be subject to fines, penalties, litigation, and reputational harm and its business may be seriously harmed. In addition, various government and consumer agencies and public advocacy groups have called for new regulation and changes in industry practices. It is possible that new laws, regulations, standards, recommendations, best practices or requirements will be adopted that would affect the Company’s business. To the extent that the Company is subject to new laws or recommendations or chooses to adopt new standards, recommendations, or other requirements, the Company may have greater compliance burdens. If the Company is perceived as not operating in accordance with industry best practices or any such guidelines or codes with regard to privacy, the Company’s reputation may suffer, and the Company could lose relationships with customers or partners.
Risks Related to Ownership of Global Indemnity Group, LLC’s Shares and Certain LLCA Provisions
The interests of holders of class A common shares may conflict with the interests of Global Indemnity Group, LLC’s controlling shareholder.
Fox Paine Capital Fund II International L.P. (the “Fox Paine Fund”), an investment fund managed by Fox Paine & Company, LLC, together with Fox Mercury Investments, L.P. and certain of its affiliates (the “FM Entities”), and Fox Paine & Company LLC (collectively, the “Fox Paine Entities”) beneficially own shares representing approximately 83.8% of Global Indemnity Group, LLC’s total voting power. The percentage of Global Indemnity Group, LLC’s total voting power that the Fox Paine Entities may exercise is greater than the percentage of Global Indemnity Group, LLC’s total shares that the Fox Paine Entities beneficially own because the Fox Paine Entities beneficially own all of Global Indemnity Group, LLC’s class B common shares, which are entitled to ten votes per share as opposed to class A common shares (including class A common shares designated as class A-2 common shares), which are entitled to one vote per share. The class A common shares (including class A common shares designated as class A-2 common shares) and the class B common shares generally vote together as a single class on matters presented to Global Indemnity Group, LLC’s shareholders. As a result, the Fox Paine Entities have and will continue to have control over the outcome of certain matters requiring shareholder approval, including the power to, among other things:
29
Subject to certain exceptions, the Fox Paine Entities may also be able to prevent or cause (either by way of a sale of their own stake or by approving the merger or sale of Global Indemnity Group, LLC as a whole) a change of control of Global Indemnity Group, LLC. The Fox Paine Entities’ control over Global Indemnity Group, LLC, and the Fox Paine Entities’ ability in certain circumstances to prevent or cause a change of control of Global Indemnity Group, LLC, may delay or prevent a change of control, or cause a change of control to occur at a time when it is not favored by other shareholders. As a result, the trading price of Global Indemnity Group, LLC’s class A common shares could be adversely affected.
In addition, Global Indemnity Group, LLC has agreed to pay Fox Paine & Company, LLC an annual management fee which is adjusted annually to reflect change in the consumer price index published by the US Department of Labor Bureau of Labor Statistics “CPI-U”, in exchange for management services. The current fee charged for the twelve month period beginning September 5, 2024 was $3.2 million. Global Indemnity Group, LLC has also agreed to pay a termination fee of cash in an amount to be agreed upon, plus reimbursement of expenses, upon the termination of Fox Paine & Company, LLC’s management services in connection with the consummation of a change of control transaction that does not involve Fox Paine & Company, LLC and its affiliates. Global Indemnity Group, LLC has also agreed to pay Fox Paine & Company, LLC a transaction advisory fee of cash in an amount to be agreed upon, plus reimbursement of expenses upon the consummation of a change of control transaction that does not involve Fox Paine & Company, LLC and its affiliates in exchange for advisory services to be provided by Fox Paine & Company, LLC in connection therewith. These management services arrangements may make a change of control transaction for Global Indemnity Group, LLC less attractive to a potential acquiror and may affect any economic allocation of proceeds that a potential acquiror may pay in any such transaction as between the Fox Paine Entities and the holders of class A common shares (including class A common shares designated as class A-2 common shares). The Fox Paine Entities may in the future make significant investments in other insurance or reinsurance companies. Some of these companies may compete with Global Indemnity Group, LLC or its subsidiaries. The Fox Paine Entities are not obligated to advise Global Indemnity Group, LLC of any investment or business opportunities of which they are aware, and they are not prohibited or restricted from competing with Global Indemnity Group, LLC or its subsidiaries.
Global Indemnity Group, LLC’s controlling shareholder has the right to appoint a certain number of the members of the Board of Directors proportionate to such shareholder’s ownership in Global Indemnity Group, LLC and also otherwise controls the election of Directors due to its share ownership.
While the Fox Paine Entities have the right under the terms of the LLCA to appoint a certain number of directors of the Board of Directors, equal in aggregate to the pro rata percentage of the voting power in Global Indemnity Group, LLC beneficially held by the Fox Paine Entities for so long as the Fox Paine Entities beneficially own (i) a majority of the outstanding class B common shares and (ii) shares representing, in the aggregate, at least 25% or more of the voting power in Global Indemnity Group, LLC, it also controls the election of all directors to the Board of Directors due to its controlling share ownership. The Board of Directors currently consists of six directors, all of whom were either identified and proposed for consideration for the Board of Directors by the Fox Paine Entities or appointed by the Fox Paine Entities.
Global Indemnity Group, LLC’s LLCA contains an exclusive forum provision that may discourage lawsuits against the Company or Global Indemnity Group, LLC’s directors and officers.
Global Indemnity Group, LLC’s LLCA requires that, unless Global Indemnity Group, LLC otherwise consents, the United States District Court for the District of Delaware shall be the sole and exclusive forum for any federal securities laws claims brought under the Securities Act or the Exchange Act, although, for the avoidance of doubt, all claims accompanying any such federal securities laws claim will be subject to the mandatory arbitration provisions of Global Indemnity Group, LLC’s LLCA. Any person or entity purchasing or otherwise acquiring any interest in Global Indemnity Group, LLC’s capital stock is deemed to have received notice of and consented to these provisions.
Global Indemnity Group, LLC believes that these provisions are enforceable under both state and federal law. Nevertheless, federal courts have concurrent jurisdiction over all suits brought to enforce any duty or liability created by the Securities Act or the rules and regulations thereunder. Investors cannot waive compliance with the federal securities laws and the rules and regulations thereunder. Accordingly, there is uncertainty as to whether a court would enforce this provision.
These provisions may increase costs to bring a claim, discourage claims or limit a shareholder’s ability to bring a claim in a judicial forum that it finds favorable for disputes with Global Indemnity Group, LLC or Global Indemnity Group, LLC’s directors, officers or other employees, which may discourage such lawsuits against Global Indemnity Group, LLC or Global Indemnity Group, LLC’s directors, officers or other employees. If a court were to find Global Indemnity Group, LLC’s choice of forum provision to be inapplicable or unenforceable in an action, Global Indemnity Group, LLC may incur additional costs associated with resolving such action in other jurisdictions.
30
Because the Company relies on certain services provided by Fox Paine & Company, LLC, the loss of such services could adversely affect its business.
Fox Paine & Company, LLC provides certain management services to the Company. To the extent that Fox Paine & Company, LLC is unable or unwilling to provide similar services in the future, and the Company is unable to perform those services itself or is unable to secure replacement services, the Company’s business could be adversely affected.
The Company's share repurchase program may affect or increase the volatility of the price of its class A common shares.
Since October 2022 and through March 11, 2025, Global Indemnity Group, LLC repurchased and retired an aggregate of 1,357,082 shares of its class A common shares in the open market and in privately negotiated transactions at an aggregate price of $34.0 million or an average of $25.05 per share. As of such date, under its share repurchase program, Global Indemnity Group, LLC had a remaining authorization to purchase up to an additional $101.0 million of its class A common shares. Although Global Indemnity Group, LLC’s Board of Directors has determined that the repurchase program is in the best interests of its shareholders, the repurchases expose the Company to risks including:
The existence of a share repurchase program may cause the Company's class A share price to be higher than it would be in the absence of the program. In addition, the program may be suspended or discontinued at any time, which could cause the market price of the Company's class A common shares to decline.
Risks Related to Taxation
Legislative and regulatory action by the U.S. Congress or other tax authorities in the jurisdictions in which we operate could materially and adversely affect the Company.
The Company’s tax position could be adversely impacted by changes in tax laws or tax regulations or the interpretation or enforcement thereof. Legislative action may be taken by the U.S. Congress or other tax authorities in the jurisdictions in which we operate which, if ultimately enacted, could, among other things, adversely affect the Company’s effective tax rate and cash tax position.
The Company may be subject to adverse foreign taxes related to its historic non-US subsidiaries.
Although the Company and its subsidiaries have eliminated most of their historic foreign subsidiaries, the statute of limitations remains open in certain foreign jurisdictions, and it is possible that the Company could be subject to materially adverse foreign taxes with respect to its historic operations. Such adverse foreign taxes could also potentially arise as a result of retroactive changes in law.
Holders of Global Indemnity Group, LLC’s common shares may be subject to U.S. federal income tax and state and local income taxes on their share of Global Indemnity Group, LLC’s taxable income, regardless of whether they receive any cash distributions from Global Indemnity Group, LLC.
Under current law, so long as Global Indemnity Group, LLC is not required to register as an investment company under the Investment Company Act and 90% of Global Indemnity Group, LLC’s gross income for each taxable year constitutes “qualifying income” within the meaning of the Internal Revenue Code on a continuing basis, Global Indemnity Group, LLC currently expects that it has been and will continue to be treated, for U.S. federal income tax purposes, as a partnership and not as an association or publicly traded partnership taxable as a corporation. Holders of Global Indemnity Group, LLC’s common shares may be subject to U.S.
31
federal, state and local taxation on their allocable share of Global Indemnity Group, LLC’s items of income, gain, loss, deduction and credit, for each of Global Indemnity Group, LLC’s taxable years ending with or within their taxable year, regardless of whether they receive any cash distributions from Global Indemnity Group, LLC. Such holders may not receive cash distributions equal to their allocable share of Global Indemnity Group, LLC’s net taxable income or even the tax liability that results from that income. Accordingly, such holders may be required to make tax payments in connection with their ownership of Global Indemnity Group, LLC’s common shares that significantly exceed cash distributions received by them in any specific year. Income earned by the subsidiaries of Global Indemnity Group, LLC is subject to corporate tax in the United States and certain foreign jurisdictions and, therefore, is not taxable to Global Indemnity Group, LLC’s shareholders until the income is distributed by the subsidiaries to Global Indemnity Group, LLC.
There can be no assurance that amounts paid as distributions on Global Indemnity Group, LLC’s common shares will be sufficient to cover the tax liability arising from ownership of the common shares.
Any distributions paid on Global Indemnity Group, LLC’s common shares will not take into account a holder’s particular tax situation and, therefore, because of the foregoing as well as other possible reasons, may not be sufficient to pay their full amount of tax based upon such holder’s share of Global Indemnity Group, LLC’s net taxable income. In addition, the actual amount and timing of distributions will always be subject to the discretion of Global Indemnity Group, LLC’s Board of Directors. Even if Global Indemnity Group, LLC does not distribute cash in an amount that is sufficient to fund a holder’s tax liabilities, such holder will still be required to pay income taxes on their share of Global Indemnity Group, LLC’s taxable income.
If Global Indemnity Group, LLC is treated as a corporation for U.S. federal income tax purposes, the value of the shares could be adversely affected.
The value of an investment in Global Indemnity Group, LLC’s common shares may depend in part on Global Indemnity Group, LLC being treated as a partnership for U.S. federal income tax purposes. A publicly traded partnership will be treated as a partnership, and not as a corporation, for U.S. federal income tax purposes so long as 90% or more of its gross income for each taxable year constitutes “qualifying income” within the meaning of the Internal Revenue Code, and it is not required to register as an investment company under the Investment Company Act of 1940 and related rules. Qualifying income generally includes dividends, interest, capital gains from the sale or other disposition of stocks and securities and certain other forms of investment income.
Although Global Indemnity Group, LLC believes that it has met in previous taxable years, and intends to manage its affairs so that it will continue to meet in the current and subsequent taxable years, the 90% test described above in each taxable year, no assurance can be given as to the types of income that will be earned in any given year. Global Indemnity Group, LLC may not meet these requirements or Global Indemnity Group, LLC may determine it is prudent to change Global Indemnity Group, LLC’s structure. In either case, Global Indemnity Group, LLC may be treated as a corporation for U.S. federal income tax purposes in the future. Global Indemnity Group, LLC has not requested, and does not plan to request, a ruling from the Internal Revenue Service (the “IRS”) on its treatment as a partnership for U.S. federal income tax purposes, or on any other matter affecting the taxation of Global Indemnity Group, LLC and its subsidiaries.
Global Indemnity Group, LLC’s interests in certain businesses are held through entities that are treated as corporations for U.S. federal income tax purposes; such corporations may be liable for significant taxes and may create other adverse tax consequences, which could potentially adversely affect the value of an investment in Global Indemnity Group, LLC.
In light of the publicly traded partnership rules under U.S. federal income tax law and other requirements, Global Indemnity Group, LLC currently holds interests in certain businesses through entities that are treated as corporations for U.S. federal income tax purposes, including, in particular, each of Global Indemnity Group, LLC’s insurance company subsidiaries. Each such corporation could be liable for significant U.S. federal income taxes and applicable state, local and other taxes, which could adversely affect the value of an investment in Global Indemnity Group, LLC. Furthermore, it is possible that the IRS or other tax authority could challenge the manner in which such corporation’s taxable income is computed by the Company.
Taxable gain or loss on a sale or other disposition of Global Indemnity Group, LLC’s common shares could be more or less than expected.
If a sale or other disposition of Global Indemnity Group, LLC’s common shares by a holder of such shares is taxable in the United States, the holder will recognize gain or loss equal to the difference between the amount realized by such holder on the sale or other disposition and such holder’s adjusted tax basis in those shares. A holder’s adjusted tax basis in the shares at the time of sale or other disposition will generally be lower than the holder’s original tax basis in the shares to the extent that prior distributions to such holder exceed the total taxable income allocated to such holder. A holder of Global Indemnity Group, LLC’s common shares may therefore recognize a gain on a sale or other disposition of Global Indemnity Group, LLC’s common shares if the shares are sold or disposed of at a price that is less than their original cost.
32
In addition, a portion of the amount realized, whether or not representing gain, may be treated as ordinary income to such holder to the extent attributable to the holder’s allocable share of unrealized gain or loss in Global Indemnity Group, LLC’s assets that consist of certain unrealized receivables or inventory (if any).
Global Indemnity Group, LLC cannot match transferors and transferees of Global Indemnity Group, LLC’s common shares, and therefore, Global Indemnity Group, LLC has adopted certain income tax accounting conventions that may not conform with all aspects of applicable tax requirements.
The Internal Revenue Code provides that items of partnership income and deductions must be allocated between transferors and transferees of Global Indemnity Group, LLC’s common shares. Because Global Indemnity Group, LLC cannot match transferors and transferees of Global Indemnity Group, LLC’s common shares, Global Indemnity Group, LLC will apply certain assumptions and conventions in an attempt to comply with applicable tax rules and to report income, gain, loss, deduction and credit to holders in a manner that reflects such holders’ beneficial shares of Global Indemnity Group, LLC’s items. These conventions are designed to more closely align the receipt of cash and the allocation of income between holders of Global Indemnity Group, LLC’s common shares, but these assumptions and conventions may not be in compliance with all aspects of applicable tax requirements. In addition, as a result of such allocation method, holders may be allocated income even if they do not receive any distributions.
If Global Indemnity Group, LLC’s conventions are not allowed by the Treasury Regulations (or only apply to transfers of less than all of a holder’s shares) or if the IRS otherwise does not accept Global Indemnity Group, LLC’s conventions, the IRS may contend that Global Indemnity Group, LLC’s income or losses must be reallocated among the holders of Global Indemnity Group, LLC’s common shares. If such a contention were sustained, certain holders’ respective tax liabilities would be adjusted to the possible detriment of certain other holders.
Tax-exempt shareholders may face certain adverse U.S. tax consequences from owning Global Indemnity Group, LLC’s common shares.
Global Indemnity Group, LLC is not required to manage its operations in a manner that would minimize the likelihood of generating income that would constitute “unrelated business taxable income” (“UBTI”) to the extent allocated to a tax-exempt shareholder. Although Global Indemnity Group, LLC’s insurance operations are conducted by subsidiaries that are treated as corporations for U.S. federal income tax purposes and the operations of such corporation would generally not result in an allocation of UBTI to a shareholder on account of the activities of those subsidiaries, Global Indemnity Group, LLC may make certain investments other than through a corporate subsidiary.
Moreover, UBTI also includes income attributable to debt-financed property, and Global Indemnity Group, LLC is not prohibited from incurring debt to finance its investments, including investments in subsidiaries. Furthermore, Global Indemnity Group, LLC is not prohibited from being (or causing a subsidiary to be) a guarantor of loans made to a subsidiary. If Global Indemnity Group, LLC (or certain of Global Indemnity Group, LLC’s subsidiaries) were treated as the borrower for U.S. tax purposes on account of such guarantees, some or all of Global Indemnity Group, LLC’s investments could be considered debt-financed property. The potential for income to be characterized as UBTI could make Global Indemnity Group, LLC’s common shares an unsuitable investment for a tax-exempt entity. Tax-exempt shareholders are urged to consult their own tax advisors regarding the tax consequences of an investment in Global Indemnity Group, LLC’s common shares.
The IRS Schedules K-1 Global Indemnity Group, LLC provides to holders of Global Indemnity Group, LLC’s common shares each year are more complicated than the IRS Forms 1099 provided by corporations to their stockholders. In addition, Global Indemnity Group, LLC may not be able to furnish to each holder of Global Indemnity Group, LLC’s common shares specific tax information within 90 days after the close of each calendar year and such holders may be required to request an extension of time to file their tax returns.
Holders of Global Indemnity Group, LLC’s common shares are required to take into account their allocable share of Global Indemnity Group, LLC’s items of income, gain, loss, deduction and other items of the partnership for Global Indemnity Group, LLC’s taxable year ending within or with their taxable year, regardless of whether they received cash distributions. As a publicly traded partnership, Global Indemnity Group, LLC’s operating results, including distributions of income, dividends, gains, losses or deductions and adjustments to carrying basis, for each year will be reported on IRS Schedules K-1 (and, if applicable, Schedules K-2 and K-3). Income earned by the subsidiaries of Global Indemnity Group, LLC is subject to corporate tax in the United States and certain foreign jurisdictions and, therefore, is not taxable to Global Indemnity Group, LLC’s shareholders until the income is distributed by the subsidiaries to Global Indemnity Group, LLC. Global Indemnity Group, LLC intends to furnish holders of the common shares, as soon as reasonably practicable after the close of each calendar year, with tax information (including IRS Schedules K-1), which describes their allocable share of gross ordinary income for Global Indemnity Group, LLC’s preceding taxable year.
33
However, it may require longer than 90 days after the end of Global Indemnity Group, LLC’s calendar year to obtain the requisite information so that IRS Schedules K-1 (and, if applicable, Schedules K-2 and K-3) may be prepared by Global Indemnity Group, LLC. Consequently, holders of Global Indemnity Group, LLC’s common shares who are U.S. taxpayers may need to file annually with the IRS (and certain states) a request for an extension past the April 15 or the otherwise applicable due date of their income tax return for the taxable year.
In addition, holders of Global Indemnity Group, LLC’s common shares are required to report for all tax purposes consistently with the information provided by Global Indemnity Group, LLC for each taxable year. As a result, it is possible that a holder of Global Indemnity Group, LLC’s common shares will be required to file amended income tax returns as a result of adjustments to items on the corresponding income tax returns of the partnership. Any obligation for a holder of Global Indemnity Group, LLC’s common shares to file amended income tax returns for that or any other reason, including any costs incurred in the preparation or filing of such returns, are the responsibility of each such holder.
Finally, because holders are required to report their allocable share of gross ordinary income, tax reporting for holders of Global Indemnity Group, LLC’s common shares is more complicated than for shareholders of a regular corporation.
Holders of Global Indemnity Group, LLC’s common shares may be subject to an additional U.S. federal income tax on net investment income allocated to such holder by Global Indemnity Group, LLC and on gain on the sale of Global Indemnity Group, LLC’s common shares.
Individuals, estates and trusts are currently subject to an additional 3.8% tax on “net investment income” (or undistributed “net investment income,” in the case of estates and trusts) for each taxable year, with such tax applying to the lesser of such income or the excess of such person’s adjusted gross income (with certain adjustments) over a specified amount. Net investment income includes net income from interest, dividends, annuities, royalties and rents and net gain attributable to the disposition of investment property. It is anticipated that net income and gain attributable to an investment in Global Indemnity Group, LLC will be included in a holder of Global Indemnity Group, LLC’s common share’s “net investment income” subject to this additional tax.
The ability of Global Indemnity Group, LLC’s corporate subsidiaries to use their net operating losses to offset their future taxable income and use capital loss carryforwards to offset future capital gains may be subject to limitations.
The ability of Global Indemnity Group, LLC’s corporate subsidiaries to use their federal net operating losses and built-in losses (“NOLs”) to offset potential future taxable income and related income taxes may be limited. The Internal Revenue Code imposes an annual limitation on the amount of taxable income that may be offset by loss carryforwards of a “loss corporation” if the corporation experiences an “ownership change” (generally, a cumulative change in ownership that exceeds 50% of the value of a corporation’s stock over a rolling three-year period). Global Indemnity Group, LLC’s corporate subsidiaries may experience an ownership change as a result of issuances or other changes in ownership of Global Indemnity Group, LLC’s shares. In addition, certain anti-avoidance rules could result in the application of similar limitations on the ability of Global Indemnity Group, LLC’s corporate subsidiaries to use their NOLs. To the extent Global Indemnity Group, LLC’s corporate subsidiaries experience an ownership change or the above rules otherwise become applicable, the ability of Global Indemnity Group, LLC’s corporate subsidiaries to utilize their federal NOLs could be significantly limited, and similar limitations may apply at the state level. Further, these NOLs are limited to a carryforward of 15 years and these capital losses are limited to a carryforward of 5 years.
Risks Related to Employees
The Company is dependent on its senior executives and the loss of any of these executives or the Company’s inability to attract and retain other key personnel could adversely affect its business.
The Company’s success depends upon its ability to attract and retain qualified employees and upon the ability of senior management and other key employees to implement the Company’s business strategy. The Company believes there are a limited number of available, qualified executives in the business lines in which it competes. The success of the Company’s initiatives and future performance depend, in significant part, upon the continued service of the senior management team and transitions of senior management when new members come on and/or existing members leave. The future loss of any of the services of members of the Company’s senior management team or the inability to attract and retain other talented personnel could impede the further implementation of the Company’s business strategy, which could have a material adverse effect on its business. In addition, the Company does not currently maintain key man life insurance policies with respect to any of its employees.
34
General Risk Factors
If the Company is unable to maintain effective internal control over financial reporting, the Company’s business may be adversely affected, investors may lose confidence in the accuracy and completeness of the Company’s financial reports and the market price of Global Indemnity Group, LLC’s common stock could be adversely affected.
The Company is required to maintain internal control over financial reporting and to report any material weaknesses in such internal control. The Sarbanes-Oxley Act requires that the Company evaluate and determine the effectiveness of its internal control over financial reporting, provide a management report on internal control over financial reporting and requires that the Company’s internal control over financial reporting be attested to by its independent registered public accounting firm.
The Company may discover material weaknesses in the future which may lead to its financial statements being materially misstated. As a result, the market price of Global Indemnity Group, LLC’s common stock could be adversely affected, and Global Indemnity Group, LLC could become subject to investigations by the stock exchange on which its securities are listed, the SEC, or other regulatory authorities, which could require additional financial and management resources. The cost of remediating a potential material weakness could materially adversely affect the Company’s business and financial condition.
The Company’s operating results and shareholders’ equity may be adversely affected by currency fluctuations.
The Company’s functional currency is the U.S. dollar. The Company conducts business with some customers in foreign currencies and several of the Company’s U.S. and non-U.S. subsidiaries maintain cash accounts in foreign currencies. At period-end, the Company re-measures non-U.S. currency financial assets to their current U.S. dollar equivalent. The resulting gain or loss on foreign denominated cash accounts is reflected in income during the period. Financial liabilities, if any, are generally adjusted within the reserving process. However, for known losses on claims to be paid in foreign currencies, the Company re-measures the liabilities to their current U.S. dollar equivalent each period end with the resulting gain or loss reflected in income during the period. Foreign exchange risk is reviewed as part of the Company’s risk management process. The Company may experience losses resulting from fluctuations in the values of non-U.S. currencies relative to the strength of the U.S. dollar, which could adversely impact the Company’s results of operations and financial condition.
Item 1B. UNRESOLVED STAFF COMMENTS
None.
Item 1C. CYBERSECURITY
Risk Management and Strategy
The Company recognizes the importance of developing, implementing and maintaining cybersecurity measures to safeguard its information systems and protect the confidentiality, integrity, and availability of its data. The Company maintains a cybersecurity program to assess, identify and manage cybersecurity threat risks. The Company assesses risks from cybersecurity threats, monitors its information systems for potential vulnerabilities and tests those systems pursuant to the Company’s cybersecurity policies, processes, and practices, which are integrated into the Company’s overall risk management process. To help protect the Company’s information systems from cybersecurity threats, the Company uses various security tools and personnel that help the Company identify, escalate, investigate, resolve, and recover from security incidents.
Managing Material Risks & Integrated Overall Risk Management
The Company has incorporated cybersecurity risk management within its Enterprise Risk Management framework. Led by the Company’s Senior Vice President of Operations, the Company's risk management team, comprised of senior management team members, integrates the evaluation of cybersecurity risks in accordance with its business objectives, operational needs, and legal requirements.
Acknowledging the intricate and dynamic landscape of cybersecurity threats, the Company collaborates with external experts, such as cybersecurity assessors, consultants, and auditors, to assess and test its risk mitigation tools. The Company’s engagement with these external entities encompasses routine reviews, threat assessments, and ongoing consultations to enhance the Company’s security measures.
35
Prior to engagement, the Company undertakes security assessments of third-party providers that process or store confidential Company information, and monitors their activities for alignment with the Company’s cybersecurity standards. This monitoring involves evaluations performed by the Company’s team of security analysts, and annual review by the Company’s Chief Information Security Officer (“CISO”).
Risks from Cybersecurity Threats
To date, the Company believes that the risks from identified cybersecurity threats, including as a result of previous cybersecurity incidents, have not materially affected and are not reasonably likely to materially affect the Company, including its business strategy, results of operations, or financial condition. Refer to the risk factor captioned “A failure in the Company’s operational systems or infrastructure or those of third parties, including security breaches or cyber-attacks, could disrupt the Company’s business, its reputation, and / or cause losses which would have a material effect on the Company’s business operations and financial results” in Part I, Item 1A. “Risk Factors” for additional information on cybersecurity risks that could adversely impact the Company’s business, results of operations or financial condition.
Governance
Management’s Role Managing Risk
The CISO advises the Enterprise Risk Management Committee (the “ERM Committee”) of the Board of Directors on cybersecurity risks. The CISO provides the following information to the ERM Committee on a quarterly basis:
The Company conducts an annual review of the Company’s cybersecurity posture and the effectiveness of its risk mitigation strategies. This review helps in identifying areas for improvement and aligning cybersecurity efforts with the overall risk management framework.
Risk Management Personnel
Primary responsibility for assessing, monitoring, and managing the Company’s cybersecurity risks rests with the CISO. The CISO, has obtained cybersecurity credentials for the role, possesses expertise in the technical domain, and receives assistance from industry experts in decision-making. The CISO oversees the information security policies and data protection programs, implementation of protective and detective tools, tests the Company’s compliance with standards, and remediates known risks. These initiatives include phishing simulations, semi-annual cybersecurity education to employees, and competency assessments. Additionally, the Company conducts table-top incident response practices and other measures to enhance overall cybersecurity preparedness. These efforts underscore the organization's commitment to addressing a wide range of potential threats and cybersecurity challenges.
Monitoring Cybersecurity Incidents
The CISO is informed about the developments in cybersecurity, including potential threats and risk management techniques. This ongoing knowledge acquisition is crucial for the prevention, detection, mitigation, and remediation of cybersecurity incidents. In the event of a cybersecurity incident, the CISO is equipped with a cyber incident response plan (“CIRP”) supported by a cross-functional cyber incident response team (“CIRT”). The CIRT oversees and responds to cybersecurity incidents. Its core objectives encompass detection and response, conducting incident analysis and investigation, implementing containment and eradication measures, and facilitating recovery processes. It also entails coordinating and communicating with the Company's management, regulators, affected parties, and external security experts. The CIRT determines the materiality of the incident, maintains documentation and reporting practices, and fosters a culture of improvement.
36
Reporting to Board of Directors
The ERM Committee is central to the Board’s oversight of cybersecurity risks and bears the primary responsibility for this area. The CISO, in his capacity, informs the Chief Executive Officer, the Chief Financial Officer, the Chief Audit Executive, the Chief Information Officer, and the Legal Department of aspects related to cybersecurity risks and incidents. Furthermore, the CISO escalates significant cybersecurity matters to the ERM Committee.
The Board has established oversight mechanisms to govern risks associated with cybersecurity threats because they recognize the significance of these threats to the Company’s operational integrity and stakeholder confidence.
Item 2. PROPERTIES
At December 31, 2024, office space leased in Bala Cynwyd, Pennsylvania, holds the Penn-America segment’s principal executive offices and headquarters. The Company believes the Bala Cynwyd, Pennsylvania location is suitable and adequate to meet its needs.
The Company exercised the early lease termination clauses for its Omaha, Nebraska and Cavan, Ireland leases and intends to exercise the early termination clause for its Scottsdale, Arizona lease. Employees at these offices work remotely.
Item 3. LEGAL PROCEEDINGS
The Company is, from time to time, involved in various legal proceedings in the ordinary course of business. The Company purchased insurance and reinsurance coverage for risks in amounts that it considers adequate. However, there can be no assurance that the insurance and reinsurance coverage that the Company maintains is sufficient or will be available in adequate amounts or at a reasonable cost. The Company does not believe that the resolution of any currently pending legal proceedings, either individually or taken as a whole, will have a material adverse effect on its business, results of operations, cash flows, or financial condition.
There is a greater potential for disputes with reinsurers who are in runoff. Some of the Company’s reinsurers have operations that are in runoff, and therefore, the Company closely monitors those relationships. The Company anticipates that, similar to the rest of the insurance and reinsurance industry, it will continue to be subject to litigation and arbitration proceedings in the ordinary course of business.
Item 4. MINE SAFETY DISCLOSURES Item 5.
None.
37
PART II
MARKET FOR REGISTRANT'S COMMON EQUITY, RELATED STOCKHOLDER MATTERS AND ISSUER PURCHASES OF EQUITY SECURITIES
Market for Global Indemnity Group, LLC’s Class A Common Shares
Global Indemnity Group, LLC’s class A common shares are publicly traded on the New York Stock Exchange. Global Indemnity Group, LLC’s predecessors have been publicly traded since 2003.
There is no established public trading market for Global Indemnity Group, LLC’s class B common shares or class A common shares designated as class A-2 common shares. References to Global Indemnity Group, LLC’s class A common shares herein exclude class A common shares designated as class A-2 common shares unless otherwise noted.
As of December 31, 2024, Global Indemnity Group, LLC’s class A common shares were held by approximately 140 shareholders of record. Because most of Global Indemnity Group, LLC’s class A common shares are held by brokers and other institutions on behalf of its shareholders, this number is not representative of Global Indemnity Group, LLC’s total shareholders. The Fox Paine Entities comprise the two holders of record of Global Indemnity Group, LLC’s class B common shares as of December 31, 2024.
See Note 18 to the consolidated financial statements in Item 8 of Part II of this report for information regarding securities authorized under Global Indemnity Group, LLC’s equity compensation plans.
Performance of Global Indemnity Group, LLC’s Class A Common Shares
The following graph represents a five-year comparison of the cumulative total return to shareholders for the Company’s class A common shares and stock of companies included in the NASDAQ Insurance Index and NASDAQ Composite Index.
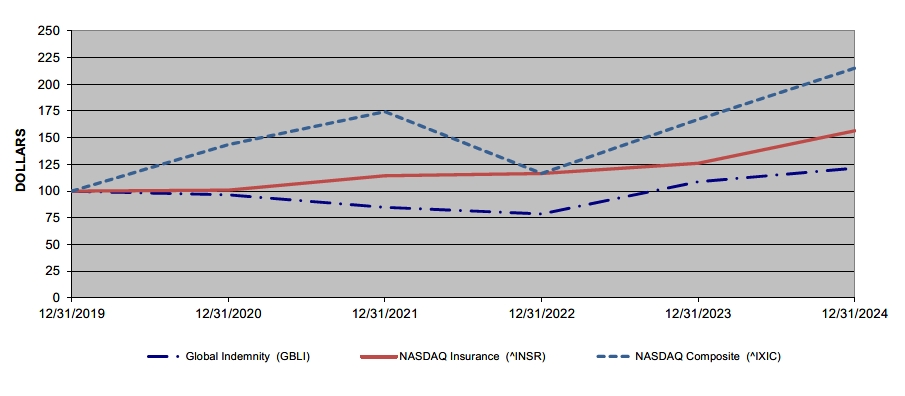
|
|
12/31/19 |
|
|
12/31/20 |
|
|
12/31/21 |
|
|
12/31/22 |
|
|
12/31/23 |
|
|
12/31/24 |
|
||||||
Global Indemnity |
|
$ |
100.0 |
|
|
$ |
96.5 |
|
|
$ |
84.8 |
|
|
$ |
78.7 |
|
|
$ |
108.8 |
|
|
$ |
121.5 |
|
NASDAQ Insurance Index |
|
|
100.0 |
|
|
|
100.9 |
|
|
|
114.3 |
|
|
|
116.5 |
|
|
|
126.1 |
|
|
|
156.5 |
|
NASDAQ Composite Index |
|
|
100.0 |
|
|
|
143.6 |
|
|
|
174.4 |
|
|
|
116.6 |
|
|
|
167.3 |
|
|
|
215.2 |
|
38
Recent Sales of Unregistered Securities
There were no sales of unregistered equity securities during the year ended December 31, 2024.
Global Indemnity Group, LLC’s Purchases of Class A Common Shares
Global Indemnity Group, LLC’s Share Incentive Plan allows employees to surrender class A common shares as payment for the tax liability incurred upon the vesting of restricted stock and restricted stock units that were issued under the Share Incentive Plan. During 2024, Global Indemnity Group, LLC purchased an aggregate 16,527 of surrendered class A common shares from employees for $0.5 million.
On October 21, 2022, Global Indemnity Group, LLC announced it commenced a share repurchase program beginning in the fourth quarter of 2022. Global Indemnity Group, LLC's Board of Directors have authorized share repurchases of up to $135 million in aggregate under this program that expires on December 31, 2027. The timing and actual number of shares repurchased, if any, will depend on a variety of factors, including price, general business and market conditions, and alternative investment opportunities.
Under the repurchase program, repurchases may be made from time to time using a variety of methods, including open market purchases or privately negotiated transactions, all in compliance with Global Indemnity Group, LLC’s Insider Trading Policy, the United States Securities and Exchange Commission, and other applicable legal requirements. The repurchase program does not obligate Global Indemnity Group, LLC to acquire any particular amount of class A common shares, and the repurchase program may be suspended or discontinued at any time at Global Indemnity Group, LLC’s discretion.
Under the repurchase program, the Company repurchased 1,357,082 shares from third parties for an aggregate amount of $34.0 million, or $25.05 per share during the year ended December 31, 2023. As a result of these transactions, book value per share increased by $1.69 per share.
All shares repurchased from third parties and employees are held as treasury stock and recorded at cost until formally retired.
See Note 15 to the consolidated financial statements in Item 8 of Part II of this report for additional information on the retirement of Global Indemnity Group, LLC’s class A common shares as well as a tabular disclosure of Global Indemnity Group, LLC’s share repurchases by month.
Distributions
Future dividends remain subject to the discretion of Global Indemnity Group, LLC’s Board of Directors, including the Board of Director’s evaluation of the Company’s financial performance, capital and reserve positions, liquidity, balance sheet, and other factors. See Note 15 of the consolidated financial statements in Item 8 of Part II of this report for distributions declared during the years ended December 31, 2024, 2023, and 2022.
Global Indemnity Group, LLC is a holding company and has no direct operations. The ability of Global Indemnity to pay distributions is subject to the LLCA, and depends, in part, on the ability of its subsidiaries to pay dividends. The Company’s insurance subsidiaries are subject to significant regulatory restrictions limiting their ability to declare and pay dividends. See “Management’s Discussion and Analysis of Financial Condition – Liquidity and Capital Resources – Sources and Uses of Funds” in Item 7 of Part II of this report for dividend limitation and Note 21 of the notes to the consolidated financial statement in Item 8 of Part II of this report for the dividends declared and paid by the Company’s insurance subsidiaries in 2024. For a discussion of factors affecting the Company’s ability to make distributions, see “Business – Regulation” in Item 1 of Part I, “Management’s Discussion and Analysis of Financial Condition and Results of Operations – Liquidity and Capital Resources – Sources and Uses of Funds” in Item 7 of Part II, and Note 21 of the notes to the consolidated financial statements in Item 8 of Part II of this report.
Item 6. [Reserved]
Not applicable
39
Item 7. MANAGEMENT'S DISCUSSION AND ANALYSIS OF FINANCIAL CONDITION AND RESULTS OF OPERATIONS
The following discussion and analysis of the Company’s financial condition and results of operations for the years ended December 31, 2024 and 2023, including year-to-year comparisons between 2024 and 2023, should be read in conjunction with the consolidated financial statements and accompanying notes of Global Indemnity included elsewhere in this report. Year-to-year comparisons between 2023 and 2022 have been omitted from this Form 10-K but may be found in “Management’s Discussion and Analysis of Financial Condition and Results of Operations” in Part II, Item 7 of the Company’s Annual Report on Form 10-K for the year ended December 31, 2023, filed with the SEC on March 15, 2024. Some of the information contained in this discussion and analysis or set forth elsewhere in this report, including information with respect to the Company’s plans and strategy, constitutes forward-looking statements that involve risks and uncertainties. Please see "Cautionary Note Regarding Forward-Looking Statements" at the end of this Item 7 and “Risk Factors” in Item 1A above for more information. You should review “Risk Factors” in Item 1A above for a discussion of important factors that could cause actual results to differ materially from the results described in or implied by the forward-looking statements contained herein.
Financial Highlights
2024 Consolidated Results of Operations
2024 Consolidated Financial Condition
Overview
The Company currently operates and manages its business through two business segments: Penn-America and Non-Core Operations.
The Company’s Penn-America products are distributed through approximately 360 wholesale general agents, 2,800 retail agents, and 20,000 direct-to-consumer policies. The Company’s wholesale general agents have limited quoting and binding authority. Penn-America operates in the excess and surplus lines marketplace. Penn-America offers specialty property and casualty products designed for its Wholesale Commercial, Specialty Products, InsurTech, and Assumed Reinsurance product offerings.
40
The Company’s Non-Core Operations segment represents lines of business that have been de-emphasized or are no longer being written. Non-Core Operations includes manufactured and dwelling home business, farm, ranch and equine business, specialty personal lines products such as motorcycle, watercraft, and certain homeowners, property brokerage, non-renewed retrocessional reinsurance treaties, several smaller casualty lines, and terminated commercial products. The two key activities of Non-Core Operations are managing transition service agreements related to the sales of the Company’s renewal rights and handling claims activity and loss reserves on de-emphasized and terminated business. See Note 2 of the notes to the consolidated financial statements in Item 8 of Part II of this report for additional information on the sale of the renewal rights related to the Company’s Farm, Ranch & Stable business and Note 2 of the notes to the consolidated financial statements in Item 8 Part II of the Company’s 2023 Annual Report on Form 10-K for more information on the sale of renewal rights related to the Company's manufactured and dwelling homes business.
The Company derives its revenues primarily from premiums paid on insurance policies that it writes and from income generated by its investment portfolio, net of fees paid for investment management services. The amount of insurance premiums that the Company receives is a function of the amount and type of policies it writes, as well as prevailing market prices.
The Company’s expenses include losses and loss adjustment expenses, net commission expenses, and other underwriting expenses, corporate and other operating expenses, interest, investment expenses, and income taxes. Losses and loss adjustment expenses are estimated by management and reflect the Company’s best estimate of ultimate losses and costs arising during the reporting period and revisions of prior period estimates. The Company records its best estimate of losses and loss adjustment expenses considering both internal and external actuarial analyses of the estimated losses the Company expects to incur on the insurance policies it writes. The ultimate losses and loss adjustment expenses will depend on the actual costs to resolve claims. Net commission expenses are typically a percentage of the premiums on the insurance policies the Company writes, net of ceding commissions earned from reinsurers. Other underwriting expenses consist primarily of personnel expenses and general operating expenses related to underwriting activities. Corporate and other operating expenses are comprised primarily of outside legal fees, other professional and accounting fees, directors’ fees, management fees & advisory fees, and salaries and benefits for company personnel whose services relate to the support of corporate activities. Interest expense is primarily comprised of amounts due on outstanding debt.
Critical Accounting Estimates and Policies
The Company’s consolidated financial statements are prepared in conformity with GAAP, which require it to make estimates and assumptions that affect the reported amounts of assets and liabilities at the date of the financial statements and the reported amounts of revenues and expenses during the reporting periods. See Note 4 of the notes to the consolidated financial statements contained in Item 8 of Part II of this report. Actual results could differ from those estimates and assumptions.
The Company believes that of the Company’s significant accounting policies, the following may involve a higher degree of judgment and estimation.
Liability for Unpaid Losses and Loss Adjustment Expenses
Although variability is inherent in estimates, the Company believes that the liability for unpaid losses and loss adjustment expenses reflects Management’s best estimate for future amounts needed to pay losses and related loss adjustment expenses and the impact of its reinsurance coverage with respect to insured events.
In developing losses and loss adjustment expense ("loss" or "losses") reserve estimates, the Company’s actuaries perform detailed reserve analyses each quarter. To perform the analysis, the data is organized at a "reserve category" level. A reserve category can be a line of business such as commercial automobile liability, or it can be a particular type of claim such as construction defect. The reserves within a reserve category level are characterized as long-tail or short-tail. For long-tail business, it will generally be several years between the time the business is written and the time when all claims are settled. The Company’s long-tail exposures include general liability, professional liability, products liability, commercial automobile liability, and excess and umbrella. Short-tail exposures include property, commercial automobile physical damage, and equine mortality. The Company also reviews assumed reinsurance segments each quarter by treaty and treaty year which is comprised primarily of long-tailed business. To manage its Insurance Operations, the Company's insurance products target specific, defined groups of insureds with customized coverage to meet their needs. For further discussion about the Company’s business divisions, see “General – Business Segments – Insurance Operations” in Item 1 of Part I of this report.
41
Each of the Company’s business divisions contain both long-tail and short-tail exposures. Every reserve category is analyzed by the Company’s actuaries each quarter. Management is responsible for the final determination of loss reserve selections.
In addition to the Company’s internal reserve analysis, independent external actuaries perform a full, detailed review of the reserves annually. The Company reviews both the internal and external actuarial analyses in determining its reserve position.
The actuarial methods used to project ultimate losses for both long-tail and short-tail reserve categories include, but are not limited to, the following:
The Paid Development method estimates ultimate losses by reviewing paid loss patterns and applying them to accident years with further expected changes in paid loss. Selection of the paid loss pattern requires analysis of several factors including the impact of inflation on claims costs, the rate at which claims professionals make claim payments and close claims, the impact of judicial decisions, the impact of underwriting changes, the impact of large claim payments, and other factors. Claim cost inflation requires evaluation of changes in the cost of repairing or replacing property, changes in the cost of medical care, changes in the cost of wage replacement, judicial decisions, legislative changes, and other factors. Because this method assumes that losses are paid at a consistent rate, changes in any of these factors can impact the results. Since the method does not rely on case reserves, it is not directly influenced by changes in the adequacy of case reserves.
For many reserve categories, paid loss data for recent periods may be too immature or erratic for reliable loss projections. This situation often exists for long-tail exposures. In addition, changes in the factors described above may result in inconsistent payment patterns. Finally, estimating the paid loss pattern subsequent to the most mature point available in the data analyzed often involves considerable uncertainty for long-tail reserve categories.
The Incurred Development method is similar to the Paid Development method, but it uses case incurred losses instead of paid losses. Since this method uses more data (case reserves in addition to paid losses) than the Paid Development method, the incurred development patterns may be less variable than paid development patterns. However, selection of the incurred loss pattern requires analysis of all of the factors listed in the description of the Paid Development method. In addition, the inclusion of case reserves can lead to distortions if changes in case reserving practices have taken place and the use of case incurred losses may not eliminate the issues associated with estimating the incurred loss pattern subsequent to the most mature point available.
The Expected Loss Ratio method multiplies premiums by an expected loss ratio to produce ultimate loss estimates for each accident year. This method may be useful if loss development patterns are inconsistent, losses emerge very slowly, or there is relatively little loss history from which to estimate future losses. The selection of the expected loss ratio requires analysis of loss ratios from earlier accident years or pricing studies and analysis of inflationary trends, frequency trends, rate changes, underwriting changes, and other applicable factors.
The Bornhuetter-Ferguson method using premiums and paid losses is a combination of the Paid Development method and the Expected Loss Ratio method. This method normally determines expected loss ratios similar to the method used for the Expected Loss Ratio method and requires analysis of the same factors described above. The method assumes that only future losses will develop at the expected loss ratio level. The percent of paid loss to ultimate loss implied from the Paid Development method is used to determine what percentage of ultimate loss is yet to be paid. The use of the pattern from the Paid Development method requires consideration of all factors listed in the description of the Paid Development method. The estimate of losses yet to be paid is added to current paid losses to estimate the ultimate loss for each accident year. This method will react very slowly if actual ultimate loss ratios are different from expectations due to changes not accounted for by the Expected Loss Ratio calculation.
42
The Bornhuetter-Ferguson method using premiums and incurred losses is similar to the Bornhuetter-Ferguson method using premiums and paid losses except that it uses case incurred losses. The use of case incurred losses instead of paid losses can result in development patterns that are less variable than paid development patterns. However, the inclusion of case reserves can lead to distortions if changes in case reserving practices have taken place. The method requires analysis of all the factors that need to be reviewed for the Expected Loss Ratio and Incurred Development methods.
The Average Loss method multiplies a projected number of ultimate incurred claims by an estimated ultimate average loss for each accident year to produce ultimate loss estimates. Since projections of the ultimate number of claims are often less variable than projections of ultimate loss, this method can provide more reliable results for reserve categories where loss development patterns are inconsistent or too variable to be relied on exclusively. In addition, this method can more directly account for changes in coverage that impact the number and size of claims. However, this method can be difficult to apply to situations where very large claims or a substantial number of unusual claims result in volatile average claim sizes. Projecting the ultimate number of claims requires analysis of several factors including the rate at which policyholders report claims to the Company, the impact of judicial decisions, the impact of underwriting changes, and other factors. Estimating the ultimate average loss requires analysis of the impact of large losses and claim cost trends based on changes in the cost of repairing or replacing property, changes in the cost of medical care, changes in the cost of wage replacement, judicial decisions, legislative changes, and other factors.
For many reserve categories, especially those that can be considered long-tail, a particular accident year may not have a sufficient volume of paid losses to produce a statistically reliable estimate of ultimate losses. In such a case, the Company’s actuaries typically assign more weight to the Incurred Development method than to the Paid Development method. As claims continue to settle and the volume of paid losses increases, the Company's actuaries may assign additional weight to the Paid Development method. For most of the Company’s reserve categories, even the case incurred losses for accident years that are early in the claim settlement process will not be of sufficient volume to produce a reliable estimate of ultimate losses. In these cases, the Company's actuaries will not assign any weight to the Paid and Incurred Development methods and will use the Bornhuetter-Ferguson and Expected Loss Ratio methods. For short-tail exposures, the Paid and Incurred Development methods can often be relied on sooner primarily because the Company’s history includes a sufficient number of accident years to cover the entire period over which paid and incurred losses are expected to change. However, the Company's actuaries may also assign weights to the Expected Loss Ratio, Bornhuetter-Ferguson, and Average Loss methods for short-tail exposures when developing estimates of ultimate losses.
Generally, reserves for long-tail lines give more weight to the Expected Loss Ratio method in the more recent immature years. As the accident years mature, weight shifts to the Bornhuetter-Ferguson methods and eventually to the Incurred and/or Paid Development method. Claims related to umbrella business are usually reported later than claims for other long-tail lines. For umbrella business, the shift from the Expected Loss Ratio method to the Bornhuetter-Ferguson methods to the Loss Development method may be more protracted than for most long-tailed lines. Reserves for short-tail lines tend to make the shift across methods more quickly than the long-tail lines.
For other more complex reserve categories where the above methods may not produce reliable indications, the Company's actuaries use additional methods tailored to the characteristics of the specific situation. Such reserve categories include losses from A&E claims.
Establishing reserves for A&E and other mass tort claims involves considerably more judgment than other types of claims due to factors including, but not limited to, inconsistent court decisions, bankruptcy filings as a result of asbestos-related liabilities, and judicial interpretations that often expand theories of recovery and broaden the scope of coverage. The insurance industry continues to receive a substantial number of asbestos-related bodily injury claims, with an increasing focus being directed toward other parties, including installers of products containing asbestos rather than against asbestos manufacturers. This shift has resulted in significant insurance coverage litigation implicating applicable coverage defenses or determinations, if any, including but not limited to, determinations as to whether or not an asbestos-related bodily injury claim is subject to aggregate limits of liability found in most comprehensive general liability policies. The Company continues to closely monitor its asbestos exposure and make adjustments where they are warranted.
Reserve analyses performed by the Company’s internal and external actuaries result in actuarial point estimates. The results of the detailed reserve reviews were summarized and discussed with the Company’s senior management to determine Management's best estimate of reserves. Management considered many factors in making this decision. The factors included, but were not limited to, the historical pattern and volatility of the actuarial indications, the sensitivity of the actuarial indications to changes in paid and incurred loss patterns, the consistency of claims handling processes, the consistency of case reserving practices, changes in the Company’s pricing and underwriting, and overall pricing and underwriting trends in the insurance market.
43
Management’s best estimate at December 31, 2024 was recorded as the loss reserve. Management’s best estimate is as of a particular point in time and is based upon known facts, the Company’s actuarial analyses, current law, and the Company’s judgment. This resulted in carried gross and net reserves of $800.4 million and $739.6 million, respectively, as of December 31, 2024. A breakout of the Company’s gross and net reserves as of December 31, 2024 is as follows:
|
|
Gross Reserves |
|
|||||||||
(Dollars in thousands) |
|
Case |
|
|
IBNR (1) |
|
|
Total |
|
|||
Penn-America |
|
$ |
146,261 |
|
|
$ |
298,925 |
|
|
$ |
445,186 |
|
Non-Core Operations |
|
|
104,145 |
|
|
|
251,060 |
|
|
|
355,205 |
|
Total |
|
$ |
250,406 |
|
|
$ |
549,985 |
|
|
$ |
800,391 |
|
|
|
Net Reserves (2) |
|
|||||||||
(Dollars in thousands) |
|
Case |
|
|
IBNR (1) |
|
|
Total |
|
|||
Penn-America |
|
$ |
146,197 |
|
|
$ |
289,955 |
|
|
$ |
436,152 |
|
Non-Core Operations |
|
|
67,055 |
|
|
|
236,430 |
|
|
|
303,485 |
|
Total |
|
$ |
213,252 |
|
|
$ |
526,385 |
|
|
$ |
739,637 |
|
The Company regularly reviews these estimates and, based on new developments and information, includes adjustments of the estimated ultimate liability in the operating results for the periods in which the adjustments are made. The establishment of losses and loss adjustment expense reserves makes no provision for the possible broadening of coverage by legislative action or judicial interpretation, or the emergence of new types of losses not sufficiently represented in the Company’s historical experience or that cannot yet be quantified or estimated. The Company regularly analyzes its reserves and reviews reserving methodologies so that future adjustments to prior accident year reserves can be minimized. However, given the complexity of this process, reserves require continual updates and the ultimate liability may be higher or lower than previously indicated. Changes in estimates for losses and loss adjustment expense reserves are recorded in the period that the change in these estimates is made. See Note 12 to the consolidated financial statements in Item 8 of Part II of this report for details concerning the changes in the estimate for incurred losses and loss adjustment expenses related to prior accident years.
The detailed reserve analyses that the Company’s internal and external actuaries complete use a variety of generally accepted actuarial methods and techniques to produce a number of estimates of ultimate loss. The Company determines its best estimate of ultimate loss by reviewing the various estimates provided by its actuaries and other relevant information. The reserve estimate is the difference between the estimated ultimate loss and the losses paid to date. The difference between the estimated ultimate loss and the case incurred loss (paid loss plus case reserve) is considered to be IBNR which includes a provision for development on known cases as well as a provision for claims that have occurred but have not yet been reported to the Company.
In light of the many uncertainties associated with establishing the estimates and making the assumptions necessary to establish reserve levels, the Company reviews its reserve estimates on a regular basis and makes adjustments in the period that the need for such adjustments is determined.
The key assumptions fundamental to the reserving process are often different for various reserve categories and accident years. Some of these assumptions are explicit assumptions that are required of a particular method, but most of the assumptions are implicit and cannot be precisely quantified. An example of an explicit assumption is the pattern employed in the Paid Development method. However, the assumed pattern is itself based on several implicit assumptions such as the impact of inflation on medical costs and the rate at which claim professionals close claims. Loss frequency is a measure of the number of claims per unit of insured exposure, and loss severity is a measure of the average size of claims. Each reserve category has an implicit frequency and severity for each accident year as a result of the various assumptions made.
Previous reserve analyses have resulted in the Company’s identification of information and trends that have caused it to increase or decrease frequency and severity assumptions in prior periods and could lead to the identification of a need for additional material changes in losses and loss adjustment expense reserves, which could materially affect results of operations, equity, business and insurer financial strength and debt ratings. Factors affecting loss frequency include, but are not limited to, the effectiveness of loss controls and safety programs and changes in economic activity or weather patterns. Factors affecting loss severity include, but are not limited to, changes in policy limits and deductibles, rate of inflation, and judicial interpretations. Another factor affecting estimates of loss frequency and severity is the loss reporting lag, which is the period of time between the occurrence of a loss and the date the loss is reported to the Company. The length of the loss reporting lag affects the Company’s ability to accurately predict loss frequency (loss frequencies are more predictable for short-tail lines) as well as the amount of reserves needed for IBNR.
44
If the actual levels of loss frequency and severity are higher or lower than expected, the ultimate losses will be different than Management’s best estimate. For most of its reserve categories, the Company believes that frequency can be predicted with greater accuracy than severity. Therefore, the Company believes Management’s best estimate is more likely influenced by changes in severity than frequency. The following table, which the Company believes reflects a reasonable range of variability around its best estimate based on historical loss experience and Management’s judgment, reflects the impact of changes (which could be favorable or unfavorable) in frequency and severity on the Company’s current accident year net loss estimate of $213.1 million for claims occurring during the year ended December 31, 2024:
|
|
|
|
Severity Change |
|
|||||||||||||||||
(Dollars in thousands) |
|
|
|
-10% |
|
|
-5% |
|
|
0% |
|
|
5% |
|
|
10% |
|
|||||
Frequency Change |
|
-5% |
|
|
(30,900 |
) |
|
|
(20,777 |
) |
|
|
(10,655 |
) |
|
|
(533 |
) |
|
|
9,589 |
|
|
|
-3% |
|
|
(27,064 |
) |
|
|
(16,728 |
) |
|
|
(6,393 |
) |
|
|
3,942 |
|
|
|
14,278 |
|
|
|
-2% |
|
|
(25,146 |
) |
|
|
(14,704 |
) |
|
|
(4,262 |
) |
|
|
6,180 |
|
|
|
16,622 |
|
|
|
-1% |
|
|
(23,228 |
) |
|
|
(12,679 |
) |
|
|
(2,131 |
) |
|
|
8,417 |
|
|
|
18,966 |
|
|
|
0% |
|
|
(21,310 |
) |
|
|
(10,655 |
) |
|
|
— |
|
|
|
10,655 |
|
|
|
21,310 |
|
|
|
1% |
|
|
(19,392 |
) |
|
|
(8,631 |
) |
|
|
2,131 |
|
|
|
12,893 |
|
|
|
23,654 |
|
|
|
2% |
|
|
(17,474 |
) |
|
|
(6,606 |
) |
|
|
4,262 |
|
|
|
15,130 |
|
|
|
25,998 |
|
|
|
3% |
|
|
(15,556 |
) |
|
|
(4,582 |
) |
|
|
6,393 |
|
|
|
17,368 |
|
|
|
28,342 |
|
|
|
5% |
|
|
(11,721 |
) |
|
|
(533 |
) |
|
|
10,655 |
|
|
|
21,843 |
|
|
|
33,031 |
|
The Company’s net reserves for losses and loss adjustment expenses of $739.6 million as of December 31, 2024 relate to multiple accident years. Therefore, the impact of changes in frequency and severity for more than one accident year could be higher or lower than the amounts reflected above.
Recoverability of Reinsurance Receivables
The Company regularly reviews the collectability of its reinsurance receivables, and includes adjustments resulting from this review in earnings in the period in which the adjustment arises. An allowance for expected credit losses for reinsurance receivables is recognized based upon the Company’s ongoing review of key aspects of amounts outstanding, including but not limited to, length of collection periods, disputes, applicable coverage defenses, insolvent reinsurers, financial strength of solvent reinsurers based on AM Best Ratings and other relevant factors. Changes in loss reserves can also affect the valuation of reinsurance receivables if the change is related to loss reserves that are ceded to reinsurers. Certain amounts may be uncollectible if the Company’s reinsurers dispute a loss or if the reinsurer is unable to pay. If its reinsurers do not pay, the Company remains legally obligated to pay the loss.
See Note 10 of the notes to the consolidated financial statements in Item 8 of Part II of this report for further information surrounding the Company’s reinsurance receivable balances and collectability as of December 31, 2024 and 2023. For a listing of the ten reinsurers for which the Company has the largest reinsurance asset amounts as of December 31, 2024, see “Reinsurance of Underwriting Risk” in Item 1 of Part I of this report.
Investments
The carrying amount of the Company’s investments approximates their fair value. The Company regularly performs various analytical valuation procedures with respect to investments, including reviewing each fixed maturity security in an unrealized loss position to determine whether the decline in fair value below amortized cost basis has resulted from a credit loss or other factors, such as changes in interest rates. In assessing whether a credit loss exists, the Company compares the present value of the cash flows expected to be collected from the security to the amortized cost basis of the security. If the present value of the cash flows expected to be collected is less than the amortized cost basis of the security, a credit loss exists and an allowance for expected credit losses is recorded. Subsequent changes in the allowances are recorded in the period of change as either credit loss expense or reversal of credit loss expense. Any impairments related to factors other than credit losses or the intent to sell are recorded through other comprehensive income, net of taxes. During its review, the Company considers credit rating, market price, and issuer specific financial information, among other factors, to assess the likelihood of collection of all principal and interest as contractually due. See Note 5 of the notes to the consolidated financial statements in Item 8 of Part II of this report for the specific methodologies and significant assumptions used by asset class as well as an analysis of the Company’s securities with gross unrealized losses as of December 31, 2024 and 2023.
45
Fair Value Measurements
The Company categorizes its invested assets that are accounted for at fair value in the consolidated statements into a fair value hierarchy. The fair value hierarchy is directly related to the amount of subjectivity associated with the inputs utilized to determine the fair value of these assets. The reported value of financial instruments not carried at fair value, principally cash and cash equivalents, approximate fair value. See Note 7 of the notes to the consolidated financial statements in Item 8 of Part II of this report for further information about the fair value hierarchy and the Company’s assets that are accounted for at fair value.
Goodwill and Intangible Assets
The Company tests for impairment of goodwill at least annually and more frequently as circumstances warrant in accordance with applicable accounting guidance. Accounting guidance allows for the testing of goodwill for impairment using both qualitative and quantitative factors. Impairment of goodwill is recognized only if the carrying amount of the reporting unit, including goodwill, exceeds the fair value of the reporting unit. The amount of the impairment loss would be equal to the excess carrying value of the goodwill over the implied fair value of the reporting unit goodwill.
Impairment of intangible assets with indefinite useful lives is tested at least annually and more frequently as circumstances warrant in accordance with applicable accounting guidance. Accounting guidance allows for the testing of intangible assets for impairment using both qualitative and quantitative factors. Impairment of indefinite lived intangible assets is recognized only if the carrying amount of the intangible assets exceeds the fair value of said assets. The amount of the impairment loss would be equal to the excess carrying value of the assets over the fair value of said assets.
Intangible assets that are not deemed to have an indefinite useful life are amortized over their estimated useful lives. The carrying amounts of definite lived intangible assets are regularly reviewed for indicators of impairment in accordance with applicable accounting guidance. Impairment is recognized only if the carrying amount of the intangible asset is in excess of its undiscounted projected cash flows. The impairment is measured as the difference between the carrying amount and the estimated fair value of the asset.
See Note 8 of the notes to the consolidated financial statements in Item 8 of Part II of this report for more details concerning the Company’s goodwill and intangible assets as well as the result of its impairment testing.
Deferred Acquisition Costs
The costs of acquiring new and renewal insurance and reinsurance contracts primarily include commissions, premium taxes and certain other costs that are directly related to the successful acquisition of new and renewal insurance and reinsurance contracts. The excess of the Company’s costs of acquiring new and renewal insurance and reinsurance contracts over the related ceding commissions earned from reinsurers is capitalized as deferred acquisition costs and amortized over the period in which the related premiums are earned.
In accordance with accounting guidance for insurance enterprises, the method followed in computing such amounts limits them to amounts recoverable from premium to be earned, related investment income, losses and loss adjustment expenses, and certain other costs expected to be incurred as the premium is earned. A premium deficiency is recognized if the sum of expected losses and loss adjustment expenses and unamortized acquisition costs exceeds related unearned premium. This evaluation is done at a distribution and product line/treaty level. Any future expected loss on the related unearned premium is recorded first by impairing the unamortized acquisition costs on the related unearned premium followed by an increase to losses and loss adjustment expense reserves on additional expected loss in excess of unamortized acquisition costs. The Company calculates deferred acquisition costs for Penn-America and Non-Core Operations separately by distribution lines. For reinsurance treaties, the Company calculates deferred acquisition costs separately for each treaty.
Taxation
The Company provides for income taxes in accordance with applicable accounting guidance. The Company’s deferred tax assets and liabilities primarily result from temporary differences between the amounts recorded in the consolidated financial statements and the tax basis of the Company’s assets and liabilities.
At each balance sheet date, management assesses the need to establish a valuation allowance that reduces deferred tax assets when it is more likely than not that all, or some portion, of the deferred tax assets will not be realized. A valuation allowance would be based on all available information including the Company’s assessment of uncertain tax positions and projections of future taxable income from each tax-paying component in each jurisdiction, principally derived from business plans and available tax planning strategies.
46
As of December 31, 2024, the Company had a deferred tax asset of approximately $2.5 million related to net unrealized losses on fixed maturity available for sale securities. In the assessment of the future realizability of this deferred tax asset, management considered tax planning strategies and concluded that unrealized losses were caused by factors other than credit loss, and the Company have the intent and ability to hold these securities to recovery and collect all of the contractual cash flows.
There are no valuation allowances as of December 31, 2024 and 2023. The deferred tax asset balance is analyzed regularly by management. This assessment requires significant judgment and considers, among other matters, the nature, frequency and severity of current and cumulative losses, forecasts of future profitability, the duration of carryforward periods, and tax planning strategies and/or actions. Based on these analyses, the Company has determined that its deferred tax asset is recoverable. Projections of future taxable income incorporate several assumptions of future business and operations that are apt to differ from actual experience. If, in the future, the Company’s assumptions and estimates that resulted in the forecast of future taxable income for each tax-paying component prove to be incorrect, a valuation allowance may be required. This could have a material adverse effect on the Company’s financial condition, results of operations, and liquidity.
The Company applies a more likely than not recognition threshold for all tax uncertainties, only allowing the recognition of those tax benefits that have a greater than 50% likelihood of being sustained upon examination by relevant taxing authorities. Please see Note 11 of the notes to the consolidated financial statements in Item 8 of Part II of this report for a discussion of the Company’s tax uncertainties.
Leases
The Company determines if an arrangement is a lease at inception. Leases with a term of 12 months or less are not recorded on the consolidated balance sheets. Lease right-of-use assets (“ROU”) and lease liabilities are included on the consolidated balance sheets.
Lease ROU assets and lease liabilities are recognized based on the present value of the future minimum lease payments over the lease term at the commencement date. The Company’s leases do not provide an implicit rate; therefore, the Company uses its incremental borrowing rate at the commencement date in determining the present value of future payments. The ROU asset is calculated using the initial lease liability amount, plus any lease payments made at or before the commencement date, minus any lease incentives received, plus any initial direct costs incurred. Lease expenses for minimum lease payments are recognized on a straight-line basis over the lease term.
The Company’s lease agreements may contain both lease and non-lease components which are accounted separately. The Company elected the practical expedient on not separating lease components from non-lease components for its equipment leases.
Rental income derived from subleases are recognized on a straight-line basis over the operating lease term.
Business Segments
The Company manages the distribution of its core product offerings through its Penn-America segment. The Penn-America segment comprises the Company’s Insurance Operations, which currently includes the operations of United National Insurance Company, Diamond State Insurance Company, Penn-America Insurance Company, Penn-Star Insurance Company, and Penn-Patriot Insurance Company. The Company also has a Non-Core Operations segment that contains lines of business that have been de-emphasized or are no longer being written.
The Company evaluates the performance of these segments based on gross and net written premiums, revenues in the form of net earned premiums, and expenses in the form of (1) net losses and loss adjustment expenses, (2) net commission expenses, and (3) other underwriting expenses.
Segment results for 2022 have been revised to reflect changes in the Company's reportable segments that occurred in 2023 resulting from the Company's restructuring initiative. Please see Note 3 of the notes to the consolidated financial statements in Item 8 of Part II of this report for additional information on the restructuring.
See “Business Segments” in Item 1 of Part I of this report for a description of the Company’s segments.
47
Results of Operations
The Company's net income (loss) was $43.2 million, $25.4 million, and ($0.9) million during the years ended December 31, 2024, 2023, and 2022, respectively.
Net investment income was $62.4 million, $55.4 million, $27.6 million for the years ended December 31, 2024, 2023, and 2022, respectively. This increase in net investment income was primarily due to strategies employed by the Company to take advantage of rising interest rates which resulted in an increase in book yields on fixed maturities of 10.0% in 2024 compared to 2023 and an increase of 14.3% in 2023 compared to 2022. Book yields on the fixed maturities portfolio were 4.4%, 4.0% and 3.5% at December 31, 2024, 2023, and 2022, respectively. The weighted average duration of the fixed maturities portfolio was 0.8 years, 1.1 years, and 1.7 years as of December 31, 2024, 2023, and 2022, respectively.
The Company generated underwriting income of $17.8 million, $3.0 million, and $8.3 million for the years ended December 31, 2024, 2023, and 2022. The increase in underwriting income for 2024 is driven by strong underwriting results within the Company's Penn-America segment due to growth in gross written premiums and improved current accident year combined ratios compared to the same period in 2023. Penn-America’s gross written premiums increased 8.2% in 2024. Penn-America’s accident year combined ratio improved to 94.4% for 2024 compared to 95.2% for same period in 2023 due to improved non-catastrophe and catastrophe property results.
The following table summarizes the Company’s results for the years ended December 31, 2024, 2023, and 2022:
|
|
Years Ended |
|
|
% |
|
|
Years Ended |
|
|
% |
|
||||||||||||
(Dollars in thousands) |
|
2024 |
|
|
2023 |
|
|
Change |
|
|
2023 |
|
|
2022 |
|
|
Change |
|
||||||
Gross written premiums |
|
$ |
389,758 |
|
|
$ |
416,397 |
|
|
|
(6.4 |
%) |
|
$ |
416,397 |
|
|
$ |
727,603 |
|
|
|
(42.8 |
%) |
Net written premiums |
|
$ |
379,190 |
|
|
$ |
399,319 |
|
|
|
(5.0 |
%) |
|
$ |
399,319 |
|
|
$ |
591,331 |
|
|
|
(32.5 |
%) |
|
|
|
|
|
|
|
|
|
|
|
|
|
|
|
|
|
|
|
||||||
Net earned premiums |
|
$ |
376,992 |
|
|
$ |
473,357 |
|
|
|
(20.4 |
%) |
|
$ |
473,357 |
|
|
$ |
602,471 |
|
|
|
(21.4 |
%) |
Other income |
|
|
1,365 |
|
|
|
1,435 |
|
|
|
(4.9 |
%) |
|
|
1,435 |
|
|
|
1,462 |
|
|
|
(1.8 |
%) |
Total revenues |
|
|
378,357 |
|
|
|
474,792 |
|
|
|
(20.3 |
%) |
|
|
474,792 |
|
|
|
603,933 |
|
|
|
(21.4 |
%) |
Losses and expenses: |
|
|
|
|
|
|
|
|
|
|
|
|
|
|
|
|
|
|
||||||
Net losses and loss adjustment expenses |
|
|
213,190 |
|
|
|
289,153 |
|
|
|
(26.3 |
%) |
|
|
289,153 |
|
|
|
359,228 |
|
|
|
(19.5 |
%) |
Acquisition costs and other underwriting expenses |
|
|
147,345 |
|
|
|
182,617 |
|
|
|
(19.3 |
%) |
|
|
182,617 |
|
|
|
236,381 |
|
|
|
(22.7 |
%) |
Underwriting income |
|
|
17,822 |
|
|
|
3,022 |
|
|
|
489.7 |
% |
|
|
3,022 |
|
|
|
8,324 |
|
|
|
(63.7 |
%) |
Net investment income |
|
|
62,375 |
|
|
|
55,444 |
|
|
|
12.5 |
% |
|
|
55,444 |
|
|
|
27,627 |
|
|
|
100.7 |
% |
Net realized investment gains (losses) |
|
|
455 |
|
|
|
(2,107 |
) |
|
|
(121.6 |
%) |
|
|
(2,107 |
) |
|
|
(32,929 |
) |
|
|
(93.6 |
%) |
Other income |
|
|
— |
|
|
|
— |
|
|
|
— |
|
|
|
— |
|
|
|
29,903 |
|
|
|
(100.0 |
%) |
Corporate and other operating expenses |
|
|
(25,696 |
) |
|
|
(23,383 |
) |
|
|
9.9 |
% |
|
|
(23,383 |
) |
|
|
(24,421 |
) |
|
|
(4.3 |
%) |
Interest expense |
|
|
— |
|
|
|
— |
|
|
|
— |
|
|
|
— |
|
|
|
(3,004 |
) |
|
|
(100.0 |
%) |
Loss on extinguishment of debt |
|
|
— |
|
|
|
— |
|
|
|
— |
|
|
|
— |
|
|
|
(3,529 |
) |
|
|
(100.0 |
%) |
Income before income taxes |
|
|
54,956 |
|
|
|
32,976 |
|
|
|
66.7 |
% |
|
|
32,976 |
|
|
|
1,971 |
|
|
NM |
|
|
Income tax expense |
|
|
(11,715 |
) |
|
|
(7,547 |
) |
|
|
55.2 |
% |
|
|
(7,547 |
) |
|
|
(2,821 |
) |
|
|
167.5 |
% |
Net income (loss) |
|
$ |
43,241 |
|
|
$ |
25,429 |
|
|
|
70.0 |
% |
|
$ |
25,429 |
|
|
$ |
(850 |
) |
|
NM |
|
|
Underwriting Ratios: |
|
|
|
|
|
|
|
|
|
|
|
|
|
|
|
|
|
|
||||||
Loss ratio (1) |
|
|
56.6 |
% |
|
|
61.1 |
% |
|
|
|
|
|
61.1 |
% |
|
|
59.6 |
% |
|
|
|
||
Expense ratio (2) |
|
|
39.0 |
% |
|
|
38.6 |
% |
|
|
|
|
|
38.6 |
% |
|
|
39.2 |
% |
|
|
|
||
Combined ratio (3) |
|
|
95.6 |
% |
|
|
99.7 |
% |
|
|
|
|
|
99.7 |
% |
|
|
98.8 |
% |
|
|
|
||
NM – not meaningful
48
Selected Financial Data by Business Segment
Premiums
The following table summarizes the change in premium volume by business segment:
|
|
Years Ended |
|
|
% |
|
|
Years Ended |
|
|
% |
|
||||||||||||
(Dollars in thousands) |
|
2024 |
|
|
2023 |
|
|
Change |
|
|
2023 |
|
|
2022 |
|
|
Change |
|
||||||
Gross written premiums (1) |
|
|
|
|
|
|
|
|
|
|
|
|
|
|
|
|
|
|
||||||
Penn-America |
|
$ |
399,976 |
|
|
$ |
369,660 |
|
|
|
8.2 |
% |
|
$ |
369,660 |
|
|
$ |
387,967 |
|
|
|
(4.7 |
%) |
Non-Core Operations |
|
|
(10,218 |
) |
|
|
46,737 |
|
|
|
(121.9 |
%) |
|
|
46,737 |
|
|
|
339,636 |
|
|
|
(86.2 |
%) |
Total gross written premiums |
|
$ |
389,758 |
|
|
$ |
416,397 |
|
|
|
(6.4 |
%) |
|
$ |
416,397 |
|
|
$ |
727,603 |
|
|
|
(42.8 |
%) |
Ceded premiums written |
|
|
|
|
|
|
|
|
|
|
|
|
|
|
|
|
|
|
||||||
Penn-America |
|
$ |
10,394 |
|
|
$ |
12,864 |
|
|
|
(19.2 |
%) |
|
$ |
12,864 |
|
|
$ |
17,661 |
|
|
|
(27.2 |
%) |
Non-Core Operations |
|
|
174 |
|
|
|
4,214 |
|
|
|
(95.9 |
%) |
|
|
4,214 |
|
|
|
118,611 |
|
|
|
(96.4 |
%) |
Total ceded premiums written |
|
$ |
10,568 |
|
|
$ |
17,078 |
|
|
|
(38.1 |
%) |
|
$ |
17,078 |
|
|
$ |
136,272 |
|
|
|
(87.5 |
%) |
Net written premiums (2) |
|
|
|
|
|
|
|
|
|
|
|
|
|
|
|
|
|
|
||||||
Penn-America |
|
$ |
389,582 |
|
|
$ |
356,796 |
|
|
|
9.2 |
% |
|
$ |
356,796 |
|
|
$ |
370,306 |
|
|
|
(3.6 |
%) |
Non-Core Operations |
|
|
(10,392 |
) |
|
|
42,523 |
|
|
|
(124.4 |
%) |
|
|
42,523 |
|
|
|
221,025 |
|
|
|
(80.8 |
%) |
Total net written premiums |
|
$ |
379,190 |
|
|
$ |
399,319 |
|
|
|
(5.0 |
%) |
|
$ |
399,319 |
|
|
$ |
591,331 |
|
|
|
(32.5 |
%) |
Net earned premiums |
|
|
|
|
|
|
|
|
|
|
|
|
|
|
|
|
|
|
||||||
Penn-America |
|
$ |
369,806 |
|
|
$ |
354,518 |
|
|
|
4.3 |
% |
|
$ |
354,518 |
|
|
$ |
359,597 |
|
|
|
(1.4 |
%) |
Non-Core Operations |
|
|
7,186 |
|
|
|
118,839 |
|
|
|
(94.0 |
%) |
|
|
118,839 |
|
|
|
242,874 |
|
|
|
(51.1 |
%) |
Total net earned premiums |
|
$ |
376,992 |
|
|
$ |
473,357 |
|
|
|
(20.4 |
%) |
|
$ |
473,357 |
|
|
$ |
602,471 |
|
|
|
(21.4 |
%) |
Gross written premiums decreased by 6.4% in 2024 to $389.8 million compared to $416.4 million in 2023 due to runoff of premiums from the Company’s Non-Core Operations segment. Penn-America’s gross written premium increased by 8.2% in 2024 to $400.0 million driven by its Wholesale Commercial, InsurTech and Assumed Reinsurance divisions. In aggregate, Penn-America's Wholesale Commercial, InsurTech, and Assumed Reinsurance divisions grew by 11.2% in 2024 as compared to 2023. The growth in Wholesale Commercial and InsurTech is driven by premium rate increases, new agency appointments, organic growth of existing agents, and new products. The growth in Assumed Reinsurance is primarily due to new treaties entered into during 2023 and 2024 and increased participation or organic growth from existing treaties.
Net Retention
The ratio of net written premiums to gross written premiums is referred to as the Company’s net premium retention.
The Company's net premium retention increased 1.4 points to 97.3% in 2024 from 95.9% in 2023 primarily due to the termination of two quota share agreements and lower cost on the Company's catastrophe reinsurance treaty.
Net Earned Premiums
Net earned premiums decreased by 20.4% in 2024 to $377.0 million compared to $473.4 million in 2023 due to runoff of premiums from the Company’s Non-Core Operations segment.
Penn-America’s net earned premiums increased by of 4.3% to $369.8 million compared to $354.5 million in 2023 due to growth in its gross written premiums. Property net earned premiums were $167.2 million in 2024 and $140.5 million in 2023. Casualty net earned premiums were $202.6 million in 2024 and $214.0 million in 2023.
Net earned premiums within the Non-Core Operations segment decreased by 94.0% in 2024 as compared to the same period in 2023 primarily due to the non-renewal of a casualty treaty and a reduction in earned premiums due to the sale of Farm, Ranch & Stable renewal rights on August 8, 2022. There were no property earned premiums in 2024. Property net earned premiums were $14.2 million in 2023. Casualty net earned premiums were $7.3 million in 2024 and $104.6 million in 2023.
49
Underwriting Results
Penn-America
Penn-America's accident year underwriting income improved to $19.7 million in 2024 compared to an underwriting loss of $11.6 million in 2023.
The components of income (loss) from the Company’s Penn-America segment and corresponding underwriting ratios are as follows:
|
|
Years Ended |
|
|
% |
|
|
Years Ended |
|
|
% |
|
||||||||||||
(Dollars in thousands) |
|
2024 |
|
|
2023 |
|
|
Change |
|
|
2023 |
|
|
2022 |
|
|
Change |
|
||||||
Gross written premiums |
|
$ |
399,976 |
|
|
$ |
369,660 |
|
|
|
8.2 |
% |
|
$ |
369,660 |
|
|
$ |
387,967 |
|
|
|
(4.7 |
%) |
Net written premiums |
|
$ |
389,582 |
|
|
$ |
356,796 |
|
|
|
9.2 |
% |
|
$ |
356,796 |
|
|
$ |
370,306 |
|
|
|
(3.6 |
%) |
Net earned premiums |
|
$ |
369,806 |
|
|
$ |
354,518 |
|
|
|
4.3 |
% |
|
$ |
354,518 |
|
|
$ |
359,597 |
|
|
|
(1.4 |
%) |
Other income |
|
|
1,336 |
|
|
|
1,257 |
|
|
|
6.3 |
% |
|
|
1,257 |
|
|
|
1,029 |
|
|
|
22.2 |
% |
Total revenues |
|
|
371,142 |
|
|
|
355,775 |
|
|
|
4.3 |
% |
|
|
355,775 |
|
|
|
360,626 |
|
|
|
(1.3 |
%) |
Losses and expenses: |
|
|
|
|
|
|
|
|
|
|
|
|
|
|
|
|
|
|
||||||
Net losses and loss adjustment expenses |
|
|
210,293 |
|
|
|
233,239 |
|
|
|
(9.8 |
%) |
|
|
233,239 |
|
|
|
214,854 |
|
|
|
8.6 |
% |
Net commission expenses |
|
|
86,863 |
|
|
|
81,691 |
|
|
|
6.3 |
% |
|
|
81,691 |
|
|
|
84,081 |
|
|
|
(2.8 |
%) |
Other underwriting expenses |
|
|
54,270 |
|
|
|
52,464 |
|
|
|
3.4 |
% |
|
|
52,464 |
|
|
|
51,064 |
|
|
|
2.7 |
% |
Total expenses |
|
|
351,426 |
|
|
|
367,394 |
|
|
|
(4.3 |
%) |
|
|
367,394 |
|
|
|
349,999 |
|
|
|
5.0 |
% |
Underwriting income (loss) |
|
$ |
19,716 |
|
|
$ |
(11,619 |
) |
|
|
269.7 |
% |
|
$ |
(11,619 |
) |
|
$ |
10,627 |
|
|
|
(209.3 |
%) |
|
|
|
|
|
|
|
|
|
|
|
|
|
|
|
|
|
|
|
||||||
Accident year underwriting income |
|
$ |
22,072 |
|
|
$ |
18,509 |
|
|
|
19.3 |
% |
|
$ |
18,509 |
|
|
$ |
13,480 |
|
|
|
37.3 |
% |
|
|
Years Ended |
|
|
Point |
|
|
Years Ended |
|
|
Point |
|
||||||||||||
|
|
2024 |
|
|
2023 |
|
|
Change |
|
|
2023 |
|
|
2022 |
|
|
Change |
|
||||||
Underwriting Ratios: |
|
|
|
|
|
|
|
|
|
|
|
|
|
|
|
|
|
|
||||||
Loss ratio: |
|
|
|
|
|
|
|
|
|
|
|
|
|
|
|
|
|
|
||||||
Current accident year |
|
|
56.4 |
% |
|
|
57.4 |
% |
|
|
(1.0 |
) |
|
|
57.4 |
% |
|
|
59.0 |
% |
|
|
(1.6 |
) |
Prior accident year |
|
|
0.5 |
% |
|
|
8.4 |
% |
|
|
(7.9 |
) |
|
|
8.4 |
% |
|
|
0.8 |
% |
|
|
7.6 |
|
Calendar year loss ratio |
|
|
56.9 |
% |
|
|
65.8 |
% |
|
|
(8.9 |
) |
|
|
65.8 |
% |
|
|
59.8 |
% |
|
|
6.0 |
|
Expense ratio |
|
|
38.1 |
% |
|
|
37.8 |
% |
|
|
0.3 |
|
|
|
37.8 |
% |
|
|
37.6 |
% |
|
|
0.2 |
|
Combined ratio |
|
|
95.0 |
% |
|
|
103.6 |
% |
|
|
(8.6 |
) |
|
|
103.6 |
% |
|
|
97.4 |
% |
|
|
6.2 |
|
|
|
|
|
|
|
|
|
|
|
|
|
|
|
|
|
|
|
|
||||||
Accident year combined ratio (2) |
|
|
94.4 |
% |
|
|
95.2 |
% |
|
|
|
|
|
95.2 |
% |
|
|
96.5 |
% |
|
|
|
||
Premiums
See “Result of Operations” above for a discussion on consolidated premiums.
50
Other Income
Other income, comprised of fee income, was $1.3 million in 2024 and 2023.
Loss Ratio
The calendar year loss ratio for 2024 was 56.9% (includes an increase of $1.8 million, or 0.5 percentage points related to prior accident years) compared to 65.8% (includes an increase of $29.9 million, or 8.4 percentage points related to prior accident years) in 2023. Please see Note 12 of the notes to the consolidated financial statements in Item 8 of Part II of this report for further discussion on prior accident year development.
The current accident year loss ratio improved by 1.0 points to 56.4% in 2024 from 57.4% in 2023. The current accident year losses and loss ratio is summarized as follows:
|
|
Years Ended |
|
|
|
|
|
Years Ended |
|
|
|
|
||||||||||||
(Dollars in thousands) |
|
2024 |
|
|
2023 |
|
|
% Change |
|
|
2024 |
|
|
2023 |
|
|
Point Change |
|
||||||
Property losses |
|
|
|
|
|
|
|
|
|
|
|
|
|
|
|
|
|
|
||||||
Non-catastrophe |
|
$ |
77,388 |
|
|
$ |
61,231 |
|
|
|
26.4 |
% |
|
|
46.3 |
% |
|
|
43.6 |
% |
|
|
2.7 |
|
Catastrophe |
|
|
12,696 |
|
|
|
13,839 |
|
|
|
(8.3 |
%) |
|
|
7.6 |
% |
|
|
9.8 |
% |
|
|
(2.2 |
) |
Property losses |
|
|
90,084 |
|
|
|
75,070 |
|
|
|
20.0 |
% |
|
|
53.9 |
% |
|
|
53.4 |
% |
|
|
0.5 |
|
Casualty losses |
|
|
118,389 |
|
|
|
128,289 |
|
|
|
(7.7 |
%) |
|
|
58.4 |
% |
|
|
59.9 |
% |
|
|
(1.5 |
) |
Total accident year losses |
|
$ |
208,473 |
|
|
$ |
203,359 |
|
|
|
2.5 |
% |
|
|
56.4 |
% |
|
|
57.4 |
% |
|
|
(1.0 |
) |
Expense Ratios
The expense ratio increased 0.3 points to 38.1% in 2024 from 37.8% for 2023 mainly due to commission from mix of business and contingent commissions.
51
Reconciliation of non-GAAP financial measures and ratios
The table below reconciles the non-GAAP financial measures or ratios, which excludes the impact of prior accident year adjustments, to its most directly comparable GAAP measure or ratio. The Company believes the non-GAAP financial measures or ratios are useful to investors when evaluating the Company's underwriting performance as trends in the Company's Penn-America segment may be obscured by prior accident year adjustments. These non-GAAP financial measures or ratios should not be considered as a substitute for its most directly comparable GAAP measure or ratio and do not reflect the overall underwriting profitability of the Company.
|
|
Years Ended December 31, |
|
|||||||||||||||||||||
|
|
2024 |
|
|
2023 |
|
|
2022 |
|
|||||||||||||||
|
|
Losses |
|
|
Loss |
|
|
Losses |
|
|
Loss |
|
|
Losses |
|
|
Loss |
|
||||||
Property |
|
|
|
|
|
|
|
|
|
|
|
|
|
|
|
|
|
|
||||||
Non catastrophe property losses and ratio excluding the effect of prior accident year (1) |
|
$ |
77,388 |
|
|
|
46.3 |
% |
|
$ |
61,231 |
|
|
|
43.6 |
% |
|
$ |
71,907 |
|
|
|
50.5 |
% |
Effect of prior accident year |
|
|
(10,581 |
) |
|
|
(6.3 |
%) |
|
|
(2,143 |
) |
|
|
(1.5 |
%) |
|
|
(3,624 |
) |
|
|
(2.5 |
%) |
Non catastrophe property losses and ratio (2) |
|
$ |
66,807 |
|
|
|
40.0 |
% |
|
$ |
59,088 |
|
|
|
42.1 |
% |
|
$ |
68,283 |
|
|
|
48.0 |
% |
Catastrophe losses and ratio excluding the effect of prior accident year (1) |
|
$ |
12,696 |
|
|
|
7.6 |
% |
|
$ |
13,839 |
|
|
|
9.8 |
% |
|
$ |
10,979 |
|
|
|
7.7 |
% |
Effect of prior accident year |
|
|
374 |
|
|
|
0.2 |
% |
|
|
3,400 |
|
|
|
2.4 |
% |
|
|
431 |
|
|
|
0.3 |
% |
Catastrophe losses and ratio (2) |
|
$ |
13,070 |
|
|
|
7.8 |
% |
|
$ |
17,239 |
|
|
|
12.2 |
% |
|
$ |
11,410 |
|
|
|
8.0 |
% |
Total property losses and ratio excluding the effect of prior accident year (1) |
|
$ |
90,084 |
|
|
|
53.9 |
% |
|
$ |
75,070 |
|
|
|
53.4 |
% |
|
$ |
82,886 |
|
|
|
58.2 |
% |
Effect of prior accident year |
|
|
(10,207 |
) |
|
|
(6.1 |
%) |
|
|
1,257 |
|
|
|
0.9 |
% |
|
|
(3,193 |
) |
|
|
(2.2 |
%) |
Total property losses and ratio (2) |
|
$ |
79,877 |
|
|
|
47.8 |
% |
|
$ |
76,327 |
|
|
|
54.3 |
% |
|
$ |
79,693 |
|
|
|
56.0 |
% |
Casualty |
|
|
|
|
|
|
|
|
|
|
|
|
|
|
|
|
|
|
||||||
Total Casualty losses and ratio excluding the effect of prior accident year (1) |
|
$ |
118,389 |
|
|
|
58.4 |
% |
|
$ |
128,289 |
|
|
|
59.9 |
% |
|
$ |
129,172 |
|
|
|
59.5 |
% |
Effect of prior accident year |
|
|
12,027 |
|
|
|
6.0 |
% |
|
|
28,623 |
|
|
|
13.4 |
% |
|
|
5,989 |
|
|
|
2.8 |
% |
Total Casualty losses and ratio (2) |
|
$ |
130,416 |
|
|
|
64.4 |
% |
|
$ |
156,912 |
|
|
|
73.3 |
% |
|
$ |
135,161 |
|
|
|
62.3 |
% |
Total |
|
|
|
|
|
|
|
|
|
|
|
|
|
|
|
|
|
|
||||||
Total net losses and loss adjustment expense and total loss ratio excluding the effect of prior accident year (1) |
|
$ |
208,473 |
|
|
|
56.4 |
% |
|
$ |
203,359 |
|
|
|
57.4 |
% |
|
$ |
212,058 |
|
|
|
59.0 |
% |
Effect of prior accident year |
|
|
1,820 |
|
|
|
0.5 |
% |
|
|
29,880 |
|
|
|
8.4 |
% |
|
|
2,796 |
|
|
|
0.8 |
% |
Total net losses and loss adjustment expense and total loss ratio (2) |
|
$ |
210,293 |
|
|
|
56.9 |
% |
|
$ |
233,239 |
|
|
|
65.8 |
% |
|
$ |
214,854 |
|
|
|
59.8 |
% |
52
Non-Core Operations
The components of income (loss) from the Company’s Non-Core Operations segment and corresponding underwriting ratios are as follows:
|
|
Years Ended |
|
|
% |
|
|
Years Ended |
|
|
% |
|
||||||||||||
(Dollars in thousands) |
|
2024 |
|
|
2023 |
|
|
Change |
|
|
2023 |
|
|
2022 |
|
|
Change |
|
||||||
Gross written premiums |
|
$ |
(10,218 |
) |
|
$ |
46,737 |
|
|
|
(121.9 |
%) |
|
$ |
46,737 |
|
|
$ |
339,636 |
|
|
|
(86.2 |
%) |
Net written premiums |
|
$ |
(10,392 |
) |
|
$ |
42,523 |
|
|
|
(124.4 |
%) |
|
$ |
42,523 |
|
|
$ |
221,025 |
|
|
|
(80.8 |
%) |
Net earned premiums |
|
$ |
7,186 |
|
|
$ |
118,839 |
|
|
|
(94.0 |
%) |
|
$ |
118,839 |
|
|
$ |
242,874 |
|
|
|
(51.1 |
%) |
Other income |
|
|
29 |
|
|
|
178 |
|
|
|
(83.7 |
%) |
|
|
178 |
|
|
|
433 |
|
|
|
(58.9 |
%) |
Total revenues |
|
|
7,215 |
|
|
|
119,017 |
|
|
|
(93.9 |
%) |
|
|
119,017 |
|
|
|
243,307 |
|
|
|
(51.1 |
%) |
Losses and expenses: |
|
|
|
|
|
|
|
|
|
|
|
|
|
|
|
|
|
|
||||||
Net losses and loss adjustment expenses |
|
|
2,897 |
|
|
|
55,914 |
|
|
|
(94.8 |
%) |
|
|
55,914 |
|
|
|
144,374 |
|
|
|
(61.3 |
%) |
Net commission expenses |
|
|
2,712 |
|
|
|
36,580 |
|
|
|
(92.6 |
%) |
|
|
36,580 |
|
|
|
64,643 |
|
|
|
(43.4 |
%) |
Other underwriting expenses |
|
|
3,500 |
|
|
|
11,882 |
|
|
|
(70.5 |
%) |
|
|
11,882 |
|
|
|
36,593 |
|
|
|
(67.5 |
%) |
Total expenses |
|
|
9,109 |
|
|
|
104,376 |
|
|
|
(91.3 |
%) |
|
|
104,376 |
|
|
|
245,610 |
|
|
|
(57.5 |
%) |
Underwriting income (loss) |
|
$ |
(1,894 |
) |
|
$ |
14,641 |
|
|
NM |
|
|
$ |
14,641 |
|
|
$ |
(2,303 |
) |
|
NM |
|
||
|
|
Years Ended |
|
|
Point |
|
|
Years Ended |
|
|
Point |
|
||||||||||||
|
|
2024 |
|
|
2023 |
|
|
Change |
|
|
2023 |
|
|
2022 |
|
|
Change |
|
||||||
Underwriting Ratios: |
|
|
|
|
|
|
|
|
|
|
|
|
|
|
|
|
|
|
||||||
Loss ratio: |
|
|
|
|
|
|
|
|
|
|
|
|
|
|
|
|
|
|
||||||
Current accident year |
|
|
64.6 |
% |
|
|
64.2 |
% |
|
|
0.4 |
|
|
|
64.2 |
% |
|
|
63.9 |
% |
|
|
0.3 |
|
Prior accident year |
|
|
(24.3 |
%) |
|
|
(17.1 |
%) |
|
|
(7.2 |
) |
|
|
(17.1 |
%) |
|
|
(4.5 |
%) |
|
|
(12.6 |
) |
Calendar year loss ratio |
|
|
40.3 |
% |
|
|
47.1 |
% |
|
|
(6.8 |
) |
|
|
47.1 |
% |
|
|
59.4 |
% |
|
|
(12.3 |
) |
Expense ratio |
|
|
86.5 |
% |
|
|
40.8 |
% |
|
|
45.7 |
|
|
|
40.8 |
% |
|
|
41.7 |
% |
|
|
(0.9 |
) |
Combined ratio |
|
|
126.8 |
% |
|
|
87.9 |
% |
|
|
38.9 |
|
|
|
87.9 |
% |
|
|
101.1 |
% |
|
|
(13.2 |
) |
|
|
|
|
|
|
|
|
|
|
|
|
|
|
|
|
|
|
|
||||||
Accident year combined ratio (1) |
|
|
145.6 |
% |
|
|
103.7 |
% |
|
|
|
|
|
103.7 |
% |
|
|
104.1 |
% |
|
|
|
||
NM - not meaningful
Premiums
See “Result of Operations” above for a discussion on consolidated premiums for 2024.
Other Income
Other income, comprised of fee income net of bank fees, was less than $0.1 million in 2024 compared to $0.2 million in 2023.
53
Loss Ratio
The calendar year loss ratio in 2024 was 40.3% (includes a decrease of $1.7 million, or 24.3 percentage points related to prior accident years) compared to 47.1% (includes a decrease of $20.3 million, or 17.1 percentage points related to prior accident years) in 2023. Please see Note 12 of the notes to the consolidated financial statements in Item 8 of Part II of this report for further discussion on prior accident year development.
The current accident year loss ratio improved by 0.4 points to 64.6% in 2024 from 64.2% in 2023. The current accident year losses and loss ratio is summarized as follows:
|
|
Years Ended |
|
|
|
|
|
Years Ended |
|
|
|
|
||||||||||||
(Dollars in thousands) |
|
2024 |
|
|
2023 |
|
|
% Change |
|
|
2024 |
|
|
2023 |
|
|
Point Change |
|
||||||
Property losses |
|
|
|
|
|
|
|
|
|
|
|
|
|
|
|
|
|
|
||||||
Non-catastrophe |
|
$ |
301 |
|
|
$ |
6,588 |
|
|
|
(95.4 |
%) |
|
|
(253.0 |
%) |
|
|
46.3 |
% |
|
|
(299.3 |
) |
Catastrophe |
|
|
38 |
|
|
|
3,393 |
|
|
|
(98.9 |
%) |
|
|
(31.9 |
%) |
|
|
23.8 |
% |
|
|
(55.7 |
) |
Property losses |
|
|
339 |
|
|
|
9,981 |
|
|
|
(96.6 |
%) |
|
|
(284.9 |
%) |
|
|
70.1 |
% |
|
|
(355.0 |
) |
Casualty losses |
|
|
4,306 |
|
|
|
66,269 |
|
|
|
(93.5 |
%) |
|
|
58.9 |
% |
|
|
63.3 |
% |
|
|
(4.4 |
) |
Total accident year losses |
|
$ |
4,645 |
|
|
$ |
76,250 |
|
|
|
(93.9 |
%) |
|
|
64.6 |
% |
|
|
64.2 |
% |
|
|
0.4 |
|
The declines in accident year losses in Non-Core Operations is due to lines of business that have been de-emphasized or no longer written.
Expense Ratios
The expense ratio was 86.5% in 2024 compared to 40.8% in 2023 primarily due to lower earned premiums as a result of exiting various lines of business.
54
Reconciliation of non-GAAP financial measures and ratios
The table below reconciles the non-GAAP financial measures or ratios, which excludes the impact of prior accident year adjustments, to its most directly comparable GAAP financial measure or ratio. The Company believes the non-GAAP financial measures or ratios are useful to investors when evaluating the Company's underwriting performance as trends in the Company's Non-Core Operations segment may be obscured by prior accident year adjustments. These non-GAAP financial measures or ratios should not be considered as a substitute for its most directly comparable GAAP measure or ratio and does not reflect the overall underwriting profitability of the Company.
|
|
Years Ended December 31, |
|
|||||||||||||||||||||
|
|
2024 |
|
|
2023 |
|
|
2022 |
|
|||||||||||||||
|
|
Losses |
|
|
Loss |
|
|
Losses |
|
|
Loss |
|
|
Losses |
|
|
Loss |
|
||||||
Property |
|
|
|
|
|
|
|
|
|
|
|
|
|
|
|
|
|
|
||||||
Non catastrophe property losses and ratio excluding the effect of prior accident year (1) |
|
$ |
301 |
|
|
|
(253.0 |
%) |
|
$ |
6,588 |
|
|
|
46.3 |
% |
|
$ |
33,713 |
|
|
|
52.2 |
% |
Effect of prior accident year |
|
|
(413 |
) |
|
|
347.1 |
% |
|
|
(9,506 |
) |
|
|
(66.8 |
%) |
|
|
(4,096 |
) |
|
|
(6.3 |
%) |
Non catastrophe property losses and ratio (2) |
|
$ |
(112 |
) |
|
|
94.1 |
% |
|
$ |
(2,918 |
) |
|
|
(20.5 |
%) |
|
$ |
29,617 |
|
|
|
45.9 |
% |
Catastrophe losses and ratio excluding the effect of prior accident year (1) |
|
$ |
38 |
|
|
|
(31.9 |
%) |
|
$ |
3,393 |
|
|
|
23.8 |
% |
|
$ |
11,012 |
|
|
|
17.0 |
% |
Effect of prior accident year |
|
|
(710 |
) |
|
|
596.6 |
% |
|
|
(7,416 |
) |
|
|
(52.1 |
%) |
|
|
(868 |
) |
|
|
(1.3 |
%) |
Catastrophe losses and ratio (2) |
|
$ |
(672 |
) |
|
|
564.7 |
% |
|
$ |
(4,023 |
) |
|
|
(28.3 |
%) |
|
$ |
10,144 |
|
|
|
15.7 |
% |
Total property losses and ratio excluding the effect of prior accident year (1) |
|
$ |
339 |
|
|
|
(284.9 |
%) |
|
$ |
9,981 |
|
|
|
70.1 |
% |
|
$ |
44,725 |
|
|
|
69.2 |
% |
Effect of prior accident year |
|
|
(1,123 |
) |
|
|
943.7 |
% |
|
|
(16,922 |
) |
|
|
(118.9 |
%) |
|
|
(4,964 |
) |
|
|
(7.6 |
%) |
Total property losses and ratio (2) |
|
$ |
(784 |
) |
|
|
658.8 |
% |
|
$ |
(6,941 |
) |
|
|
(48.8 |
%) |
|
$ |
39,761 |
|
|
|
61.6 |
% |
Casualty |
|
|
|
|
|
|
|
|
|
|
|
|
|
|
|
|
|
|
||||||
Total Casualty losses and ratio excluding the effect of prior accident year (1) |
|
$ |
4,306 |
|
|
|
58.9 |
% |
|
$ |
66,269 |
|
|
|
63.3 |
% |
|
$ |
110,515 |
|
|
|
62.0 |
% |
Effect of prior accident year |
|
|
(625 |
) |
|
|
(8.5 |
%) |
|
|
(3,414 |
) |
|
|
(3.3 |
%) |
|
|
(5,902 |
) |
|
|
(3.3 |
%) |
Total Casualty losses and ratio (2) |
|
$ |
3,681 |
|
|
|
50.4 |
% |
|
$ |
62,855 |
|
|
|
60.0 |
% |
|
$ |
104,613 |
|
|
|
58.7 |
% |
Total |
|
|
|
|
|
|
|
|
|
|
|
|
|
|
|
|
|
|
||||||
Total net losses and loss adjustment expense and total loss ratio excluding the effect of prior accident year (1) |
|
$ |
4,645 |
|
|
|
64.6 |
% |
|
$ |
76,250 |
|
|
|
64.2 |
% |
|
$ |
155,240 |
|
|
|
63.9 |
% |
Effect of prior accident year |
|
|
(1,748 |
) |
|
|
(24.3 |
%) |
|
|
(20,336 |
) |
|
|
(17.1 |
%) |
|
|
(10,866 |
) |
|
|
(4.5 |
%) |
Total net losses and loss adjustment expense and total loss ratio (2) |
|
$ |
2,897 |
|
|
|
40.3 |
% |
|
$ |
55,914 |
|
|
|
47.1 |
% |
|
$ |
144,374 |
|
|
|
59.4 |
% |
55
Unallocated Corporate Items
The Company’s fixed income portfolio, excluding cash, continues to maintain high quality with an AA- average rating and a duration of 0.8 years.
Net Investment Income
|
|
Years Ended |
|
|
% |
|
|
Years Ended |
|
|
% |
|
||||||||||||
(Dollars in thousands) |
|
2024 |
|
|
2023 |
|
|
Change |
|
|
2023 |
|
|
2022 |
|
|
Change |
|
||||||
Gross investment income (1) |
|
$ |
64,438 |
|
|
$ |
56,960 |
|
|
|
13.1 |
% |
|
$ |
56,960 |
|
|
$ |
29,776 |
|
|
|
91.3 |
% |
Investment expenses |
|
|
(2,063 |
) |
|
|
(1,516 |
) |
|
|
36.1 |
% |
|
|
(1,516 |
) |
|
|
(2,149 |
) |
|
|
(29.5 |
%) |
Net investment income |
|
$ |
62,375 |
|
|
$ |
55,444 |
|
|
|
12.5 |
% |
|
$ |
55,444 |
|
|
$ |
27,627 |
|
|
|
100.7 |
% |
Gross investment income for 2024 increased by 13.1% and net investment income for 2024 increased by 12.5% compared to 2023. This increase in net investment income was primarily due to strategies employed by the Company to take advantage of rising interest rates which resulted in a 9% increase in book yield on the fixed maturities portfolio to 4.4% at December 31, 2024 from 4.0% at December 31, 2023.
The Company's fixed maturities portfolio consist of the following:
|
|
As of December 31, |
|
|||||
(Dollars in thousands) |
|
2024 |
|
|
2023 |
|
||
Structured bonds (1) |
|
$ |
259,915 |
|
|
$ |
340,959 |
|
Other fixed maturities |
|
|
246,747 |
|
|
|
458,611 |
|
U.S. treasuries |
|
|
875,246 |
|
|
|
494,223 |
|
Total fixed maturities |
|
$ |
1,381,908 |
|
|
$ |
1,293,793 |
|
(1) Structured bonds include asset-backed, mortgage-backed, commercial mortgage-backed and collateralized mortgage obligations
Excluding the structured bonds, the average duration of the Company’s fixed maturities portfolio was 0.5 years as of December 31, 2024, compared with 0.9 years as of December 31, 2023. The structured bonds have conditional prepayment rates and bonds with a set maturity date. Changes in interest rates can cause principal payments on structured bonds to extend or shorten which can impact duration.
Net Realized Investment Gains (Losses)
The components of net realized investment gains (losses) for the years ended December 31, 2024, 2023, and 2022 were as follows:
|
|
Years Ended December 31, |
|
|||||||||
(Dollars in thousands) |
|
2024 |
|
|
2023 |
|
|
2022 |
|
|||
Equity securities |
|
$ |
1,311 |
|
|
$ |
(453 |
) |
|
$ |
(3,392 |
) |
Fixed maturities |
|
|
(856 |
) |
|
|
(1,654 |
) |
|
|
(13,405 |
) |
Derivatives |
|
|
— |
|
|
|
— |
|
|
|
10,073 |
|
Other-than-temporary impairment losses |
|
|
— |
|
|
|
— |
|
|
|
(26,205 |
) |
Net realized investment gains (losses) |
|
$ |
455 |
|
|
$ |
(2,107 |
) |
|
$ |
(32,929 |
) |
In response to a rising interest rate environment, the Company took action early in April 2022 to shorten the duration of its fixed maturities portfolio. In connection with these actions, the Company identified fixed maturities securities with a weighted average life of five years or greater as having an intent to sell, the majority of which were sold in the second quarter of 2022. Since April 2022, the Company has been investing in securities with much shorter durations. As a result of these actions, the Company's book yield rose over time. Book yield was approximately 2.2% at December 31, 2021 and 4.4% at December 31, 2024.
See Note 5 of the notes to the consolidated financial statements in Item 8 of Part II of this report for an analysis of total investment return on a pre-tax basis for the years ended December 31, 2024, 2023, and 2022.
56
Corporate and Other Operating Expenses
Corporate expenses consist of outside legal fees, other professional fees, directors’ fees, management fees & advisory fees, salaries and benefits for holding company personnel, development costs for new products, impairment losses, and taxes incurred which are not directly related to operations. Corporate expenses increased to $25.7 million in 2024 compared to $23.4 million in 2023 primarily due to $4.1 million in third party professional fees related to the Company’s internal reorganization executed in December 2024.
Interest Expense
The Company had no interest expense for the years ended December 31, 2024 or 2023.
See Note 13 of the notes to the consolidated financial statements in Item 8 of Part II of this report for details on the Company’s debt.
Income Tax Benefit/ Expense
The income tax expense increased to $11.7 million in 2024 compared to $7.5 million in 2023 due to higher taxable income in the Company's U.S. subsidiaries.
See Note 11 of the notes to the consolidated financial statements in Item 8 of Part II of this report for a comparison of income tax between periods.
Net Income (Loss)
The factors described above resulted in net income of $43.2 million in 2024 compared to $25.4 million in 2023.
Liquidity and Capital Resources
Sources and Uses of Funds
Global Indemnity Group, LLC is a holding company. Its principal asset is its ownership in the shares of Belmont Holdings GX, Inc., an insurance holding company that owns the insurance companies: United National Insurance Company, Diamond State Insurance Company, Penn-America Insurance Company, Penn-Star Insurance Company, and Penn-Patriot Insurance Company, and Penn-America Underwriters, LLC, an agency and specialized service holding company.
In 2024, the Company underwent an internal corporate reorganization of the Company’s subsidiaries: (i) the five specialty insurance companies were de-stacked in a holding company structure under Belmont Holdings GX, Inc. and (ii) Penn-America Underwriters, LLC was formed to position the Company for enhanced operational efficiency and growth by:
The Penn-America Underwriters, LLC Holding Group is responsible for agency/distribution services, marketing and sales, underwriting, product management including pricing, policy operations, billings and collections, claims, IT development, service and support, and enterprise data and analytics.
Global Indemnity Group, LLC’s current short-term and long-term liquidity needs include but are not limited to the payment of corporate expenses, distributions to shareholders, and share repurchases. In order to meet its current short-term and long-term needs, its principal sources of cash include investment income, interest and principal payments on intercompany debt with Belmont Holdings GX, Inc., reimbursement for equity awards granted to employees of Belmont Holdings GX, Inc. and Penn-America Underwriters, LLC.
Penn-America Underwriters, LLC consist of six agency and specialized service companies whose current short-term and long-term liquidity needs include but are not limited to the payment of corporate expenses, operating expenses, and capital expenditures in developing information technology platforms. In order to meet its current short-term and long-term needs, its principal sources of cash include fees from third parties, commissions / service fees from Belmont Holdings GX, Inc., and capital contributions from Global Indemnity Group, LLC.
57
Belmont Holdings GX, Inc.’s current short-term and long-term liquidity needs include but are not limited to the payment of corporate expenses, payment of interest and principal on intercompany debt, and payment for equity awards granted to its employees by Global Indemnity Group, LLC. In order to meet its current short-term and long-term needs, its principal sources of cash include dividends from their insurance company subsidiaries and investment income.
The insurance companies’ current short-term and long-term liquidity needs include but are not limited to the payment of claims, commissions, operating expenses, federal taxes, and dividends. Its principal sources of funds include cash from direct and assumed business written, investment income, and proceeds from sales and maturities of investments.
The Company continuously reviews and assesses the short-term and long-term needs of each of its holding companies, service companies, and insurance companies. In addition, the Company periodically reviews opportunities related to business acquisitions and as a result, liquidity may arise in the future.
Belmont Holdings Inc. is dependent on dividends from its insurance subsidiaries which are restricted by statute as to the amount of dividends that they may pay without the prior approval of regulatory authorities. The dividend limitations imposed by state laws are based on the statutory financial results of each insurance company that are determined by using statutory accounting practices that differ in various respects from accounting principles used in financial statements prepared in conformity with GAAP. See “Regulation—Statutory Accounting Principles.” Key differences relate to, among other items, deferred acquisition costs, limitations on deferred income taxes, reserve calculation assumptions and surplus notes.
Under Virginia law, Penn-Patriot Insurance Company may not pay any dividend or make any distribution of cash or other property, the fair market value of which, together with that of any other dividends or distributions made within the preceding 12 consecutive months exceeds the greater of either (1) 10% of its surplus as of the 31st day of December of the last preceding year, or (2) its net income, not including net realized capital gains, for the 12 month period ending on the 31st day of December of the last preceding year, not including pro rata distributions of any class of its securities, unless the commissioner approves the proposed payment or fails to disapprove such payment within 30 days after receiving notice of such payment. In determining whether the dividend must be approved, undistributed net income from the second and third preceding years, not including net realized capital gains, may be carried forward.
Under Pennsylvania law, United National Insurance Company, Penn-America Insurance Company, and Penn-Star Insurance Company may not pay any dividend or make any distribution that, together with other dividends or distributions made within the preceding 12 consecutive months, exceeds the greater of (1) 10% of its surplus as shown on its last annual statement on file with the commissioner or (2) its net income for the period covered by such statement, not including pro rata distributions of any class of its own securities, unless the commissioner has received notice from the insurer of the declaration of the dividend and the commissioner approves the proposed payment or fails to disapprove such payment within 30 days after receiving notice of such payment. An additional limitation is that Pennsylvania does not permit a domestic insurer to declare or pay a dividend except out of unassigned funds (surplus) unless otherwise approved by the commissioner before the dividend is paid. Furthermore, no dividend or other distribution may be declared or paid by a Pennsylvania insurance company that would reduce its total capital and surplus to an amount that is less than the amount required by the Insurance Department for the kind or kinds of business that it is authorized to transact. Pennsylvania law allows loans to affiliates up to 10% of statutory surplus without prior regulatory approval.
Under Indiana law, Diamond State Insurance Company may not pay any dividend or make any distribution of cash or other property, the fair market value of which, together with that of any other dividends or distributions made within the 12 consecutive months ending on the date on which the proposed dividend or distribution is scheduled to be made, exceeds the greater of (1) 10% of its surplus as of the 31st day of December of the last preceding year, or (2) its net income for the 12 month period ending on the 31st day of December of the last preceding year, unless the commissioner approves the proposed payment or fails to disapprove such payment within 30 days after receiving notice of such payment. An additional limitation is that Indiana does not permit a domestic insurer to declare or pay a dividend except out of unassigned surplus unless otherwise approved by the commissioner before the dividend is paid.
In 2024, Penn-Patriot Insurance Company declared a dividend in the amount of $40.0 million which will be paid in the first quarter of 2025. In addition, Penn-Patriot Insurance Company, Penn-America Insurance Company, and United National Insurance Company received approval from their respective state insurance departments for distributions of investments in subsidiaries related to the Company’s reorganization completed in December 2024. These distributions improve the Company’s ability to manage capital and liquidity within the holding company structure Belmont Holdings GX, Inc. and increased the aggregate capital at the Global Indemnity Group Pool.
58
As a result of these distributions which occurred in December 2024, Penn-Patriot Insurance Company, Penn-America Insurance Company, and United National Insurance Company will require approval from their respective state insurance departments for any dividends in 2025.
The Company also has commitments in the form of operating leases, commitments to fund limited liability investments, and unpaid losses and loss expense obligations. See the contractual obligation table below for additional information on these commitments.
Surplus Levels
The insurance companies are required by law to maintain a certain minimum level of policyholders’ surplus on a statutory basis. Policyholders’ surplus is calculated by subtracting total liabilities from total assets. The NAIC has risk-based capital standards that are designed to identify property and casualty insurers that may be inadequately capitalized based on the inherent risks of each insurer’s assets and liabilities and mix of net written premiums. Insurers falling below a calculated threshold may be subject to varying degrees of regulatory action. Based on the standards currently adopted, the policyholders’ surplus of each of the insurance companies is in excess of the prescribed minimum company action level risk-based capital requirements.
Sources of operating funds consist primarily of net written premiums and investment income. Funds are used primarily to pay claims and operating expenses and to purchase investments. As a result of the distribution policy, funds may also be used to pay distributions to shareholders of the Company.
The reconciliation of net income (loss) to net cash provided by operations is generally influenced by the following:
Net cash provided by operating activities in 2024 and 2023 was $38.8 million and $42.9 million, respectively.
In 2024, the decrease in operating cash flows of approximately $4.1 million from the prior year was primarily a net result of the following items:
(Dollars in thousands) |
|
2024 |
|
|
2023 |
|
|
Change |
|
|||
Net premiums collected |
|
$ |
393,069 |
|
|
$ |
454,139 |
|
|
$ |
(61,070 |
) |
Net losses paid |
|
|
(243,931 |
) |
|
|
(265,676 |
) |
|
|
21,745 |
|
Underwriting and corporate expenses |
|
|
(158,168 |
) |
|
|
(192,226 |
) |
|
|
34,058 |
|
Net investment income |
|
|
50,676 |
|
|
|
47,262 |
|
|
|
3,414 |
|
Net federal income taxes paid |
|
|
(2,794 |
) |
|
|
(613 |
) |
|
|
(2,181 |
) |
Interest paid |
|
|
(17 |
) |
|
|
— |
|
|
|
(17 |
) |
Net cash provided by operating activities |
|
$ |
38,835 |
|
|
$ |
42,886 |
|
|
$ |
(4,051 |
) |
See the consolidated statements of cash flows in the consolidated financial statements in Item 8 of Part II of this report for details concerning the Company’s investing and financing activities.
Liquidity
Currently, the Company believes each of its insurance companies maintains sufficient liquidity to pay claims through cash generated by operations and liquid investments. The holding companies also maintain sufficient liquidity to meet their obligations. The Company monitors its investment portfolios to assure liability and investment durations are closely matched.
Prospectively, as fixed income investments mature and new cash is obtained, the cash available to invest will be invested in accordance with the Company’s investment policy. The Company’s investment policy allows the Company to invest in taxable and tax-exempt fixed income investments as well as publicly traded and private equity investments. With respect to bonds, the Company’s credit exposure limit for each issuer varies with the issuer’s credit quality. The allocation between taxable and tax-exempt bonds is determined based on market conditions and tax considerations. The fixed income portfolio currently has a duration of 0.8 years.
59
As of December 31, 2024, the Company also had future funding commitments of $14.2 million related to investments. Since the investment period has concluded, the Company does not expect any capital calls will be made prospectively.
The Company has access to various capital sources including dividends from insurance subsidiaries and access to the debt and equity capital markets. The Company believes it has sufficient liquidity to meet its capital needs. See Note 21 of the notes to the consolidated financial statements in Item 8 of Part II of this report for a discussion of the Company’s dividend capacity. However, the Company’s future capital requirements depend on many factors, including the amount of premium it writes, the amount of loss reserves by lines of business, and catastrophe exposure. To the extent that the Company needs to raise additional funds, any equity or debt financing for this purpose, if available at all, may be on terms that are not favorable to the Company. If the Company cannot obtain adequate capital, its business, results of operations and financial condition could be adversely affected.
Series A Cumulative Fixed Rate Perpetual Preferred Shares
On August 27, 2020, Global Indemnity Group, LLC issued and sold to Wyncote LLC, an affiliate of Fox Paine & Company, LLC, 4,000 Series A Cumulative Fixed Rate Perpetual Preferred Interests at a price of $1,000 per Series A Cumulative Fixed Rate Perpetual Preferred Interest, for the aggregate purchase price of $4,000,000. The Series A Cumulative Fixed Rate Perpetual Preferred Shares are redeemable at the discretion of Global Indemnity Group, LLC after five years or at the discretion of the holders upon the occurrence of a Change of Control (as defined in the Series A Preferred Share Designation) of Global Indemnity Group, LLC.
Share Repurchase Program
On October 21, 2022, Global Indemnity Group, LLC announced it commenced a share repurchase program beginning in the fourth quarter of 2022. Global Indemnity Group, LLC's Board of Directors have authorized share repurchases of up to $135 million in aggregate under this program that expires on December 31, 2027. As of December 31, 2024, the Company’s remaining authorization to repurchase shares is $101.0 million. The timing and actual number of shares repurchased, if any, will depend on a variety of factors, including price, general business and market conditions, and alternative investment opportunities.
Under the repurchase program, repurchases may be made from time to time using a variety of methods, including open market purchases or privately negotiated transactions, all in compliance with Global Indemnity Group, LLC’s Insider Trading Policy, the United States Securities and Exchange Commission, and other applicable legal requirements. The repurchase program does not obligate Global Indemnity Group, LLC to acquire any particular amount of class A common shares, and the repurchase program may be suspended or discontinued at any time at Global Indemnity Group, LLC’s discretion.
From the time of the initial announcement on October 21, 2022, a total of 1,357,082 shares were repurchased for approximately $34.0 million at an average purchase price of $25.05 per share. 138,151 shares that were acquired were reissued in December 2022 at an average price per share of $24.17. As a result of these transactions, book value per share increased by $1.69 per share since inception of the share repurchase program in October 2022.
Restructuring Related to Exited Lines of Business
The Company restructured its insurance operations to strengthen its market presence and enhance its focus on core products. The restructuring plan was initiated in the fourth quarter of 2022 and was completed in the first quarter of 2023. The Company incurred restructuring charges of $3.4 million in 2022 and $2.0 million in 2023 for a total of $5.4 million.
Distributions
On March 6, 2025, the Board of Directors approved a dividend rate of $0.35 per common share payable on March 28, 2025 to all shareholders of record as of the close of business on March 21, 2025. As of March 11, 2025, there were 14,258,199 shares outstanding. Future dividends remain subject to the discretion of Global Indemnity Group, LLC's Board of Directors, including the Board of Director’s evaluation of the company’s financial performance, capital and reserve positions, liquidity, balance sheet, and other factors.
During 2024, the Board of Directors approved a distribution payment of $0.35 per common share to all shareholders of record on the close of business on March 21, 2024, June 21, 2024, September 30, 2024, and December 24, 2024. Distributions paid to common shareholders were $19.4 million during the year ended December 31, 2024. In addition, distributions of $0.4 million were paid to Global Indemnity Group, LLC’s preferred shareholder during the year ended December 31, 2024.
60
During 2023, the Board of Directors approved a distribution payment of $0.25 per common share to all shareholders of record on the close of business on March 24, 2023, June 23, 2023, October 9, 2023, and December 22, 2023. Distributions paid to common shareholders were $14.2 million during the year ended December 31, 2023. In addition, distributions of $0.4 million were paid to Global Indemnity Group, LLC’s preferred shareholder during the year ended December 31, 2023.
Investment Portfolio
As a result of duration shortening, the Company significantly reduced its interest rate risk with 90% of the fixed maturity portfolio maturing over the next three years. With a shorter duration, the investment portfolio is well positioned to increase book yield by investing maturities in higher yielding bonds. At December 31, 2024, the Company's embedded book yield on its fixed maturities, not including cash, was 4.4% compared with 4.0% at December 31, 2023 and 3.5% at December 31, 2022.
On July 31, 2023, the Company provided the Global Debt Fund, LP with a formal withdrawal request to fully redeem the partnership interest. Partial redemption proceeds of $8.7 million were received during 2024. The remaining proceeds are expected to be received in 2025 and 2026. The Global Debt Fund, LP had a fair market value of $17.9 million at December 31, 2024.
Trust accounts
The Company established trust accounts, which are held by Penn-Patriot Insurance Company, to collateralize exposure it had to certain third-party ceding companies. The Company believes that Penn-Patriot Insurance Company will have sufficient liquidity to pay claims prospectively.
Capital Resources
Investment Portfolio
In response to a rising interest rate environment, the Company took action early in April 2022 to shorten the duration of its fixed maturities portfolio. In connection with these actions, the Company identified fixed maturities securities with a weighted average life of five years or greater as having an intent to sell. Since April 2022, the Company has been investing in securities with much shorter durations. As a result of these actions, the Company's book yield rose over time. Book yield was approximately 2.2% at December 31, 2021 and 4.4% at December 31, 2024.
Intercompany Pooling Arrangement
The Company’s U.S. insurance companies participate in an intercompany pooling arrangement whereby premiums, losses, and expenses are shared pro rata amongst the U.S. insurance companies. Prior to completion of the sale of American Reliable, American Reliable comprised 30% of the pool. Due to the sale of American Reliable on December 31, 2022, the intercompany pooling agreement was amended. American Reliable was removed from the pool and its 30% participation in the business and capital was allocated to the Company’s remaining five insurance companies.
The intercompany reinsurance agreement was updated in 2022 to require each company in the reinsurance pool to fund its proportionate share of collateral required to fund certain third party ceding companies.
For additional information on the Sale of American Reliable, please see the liquidity section above.
Intercompany Loan
On April 13, 2022, GBLI Holdings, LLC issued a promissory note to Global Indemnity Group, LLC for the principal amount of $69.4 million. This note bore interest at a rate equal to the short-term, annual compounded Applicable Federal Rate ("AFR") in effect for April 2022 which was 1.26%. In connection with the corporate internal reorganization, there were a series of mergers which resulted in GBLI Holdings, LLC merging out of existence and Belmont Holdings GX, Inc. assuming all of the obligations of this promissory note. The interest rate was amended to the short-term, annual compounded AFR in effect for December 2024 which was 4.3%. On each third anniversary of this restated Note, the interest rate shall reset to the then applicable short-term, annual compounded AFR for such month.
61
The Note is due on April 13, 2031. The outstanding balance on this note was $69.4 million at December 31, 2024.
On April 13, 2022, GBLI Holdings, LLC issued a promissory note to Global Indemnity Investment Inc. for the principal amount of $18.4 million. This note bore interest at a rate equal to the short-term, annual compounded AFR in effect for April 2022 which was 1.26%. In connection with the corporate internal reorganization, there were a series of mergers which resulted in GBLI Holdings, LLC merging out of existence and Belmont Holdings GX, Inc. assuming all of the obligations of this promissory note. The interest rate was amended to the short-term, annual compounded AFR in effect for December 2024 which was 4.3%. On each third anniversary of this restated Note, the interest rate shall reset to the then applicable short-term, annual compounded AFR for such month. The Note is due on April 13, 2031. The outstanding balance on this note was $18.4 million at December 31, 2024.
Intercompany Dividends and Capital Contributions
In 2024, there were a series of transactions in connection with the Company's internal corporate reorganization. Please see the "Sources and Uses of Funds" section with the "Liquidity and Capital Resources" section above for additional information.
All of the intercompany transactions discussed above eliminate in consolidation and have no impact on the consolidating financial statements.
Contractual Obligations
The Company has commitments in the form of operating leases, commitments to fund limited liability investments, and unpaid losses and loss expense obligations. As of December 31, 2024, contractual obligations related to Global Indemnity’s commitments were as follows:
|
|
|
|
|
Payment Due by Period |
|
||||||||||||||
(Dollars in thousands) |
|
Total |
|
|
Less than 1 year |
|
|
1 – 3 |
|
|
3 – 5 |
|
|
More than |
|
|||||
Operating leases (1) |
|
$ |
12,165 |
|
|
$ |
2,890 |
|
|
$ |
2,916 |
|
|
$ |
2,473 |
|
|
$ |
3,886 |
|
Commitments to fund limited partnership investment (2) |
|
|
14,214 |
|
|
|
14,214 |
|
|
|
— |
|
|
|
— |
|
|
|
— |
|
Unpaid losses and loss adjustment expenses obligations (3) |
|
|
800,391 |
|
|
|
267,330 |
|
|
|
284,139 |
|
|
|
124,861 |
|
|
|
124,061 |
|
Total |
|
$ |
826,770 |
|
|
$ |
284,434 |
|
|
$ |
287,055 |
|
|
$ |
127,334 |
|
|
$ |
127,947 |
|
Inflation
Property and casualty insurance premiums are established before the Company knows the amount of losses and loss adjustment expenses or the extent to which inflation may affect such amounts. The Company attempts to anticipate the potential impact of inflation in establishing its reserves.
Future increases in inflation could result in future increases in interest rates, which in turn are likely to result in a decline in the market value of the investment portfolio and resulting in unrealized losses and reductions in shareholders' equity.
62
Cautionary Note Regarding Forward-Looking Statements
Some of the statements under “Business,” “Management’s Discussion and Analysis of Financial Condition and Results of Operations” and elsewhere in this report are forward-looking statements within the meaning of Section 21E of the Security Exchange Act of 1934, as amended. These forward-looking statements reflect the Company’s current views as of the date of this report. Forward-looking statements are statements that are not historical facts. These statements can be identified by the use of forward-looking terminology such as “believe,” “expect,” “may,” “will,” “should,” “project,” “plan,” “seek,” “intend,” or “anticipate” or the negative thereof or comparable terminology, and include discussions of strategy, financial projections and estimates and their underlying assumptions, statements regarding plans, objectives, expectations or consequences of identified transactions or natural disasters, and statements about the future performance, operations, products and services of the companies.
The forward-looking statements contained in this report are primarily based on the Company’s current expectations and projections about future events and trends that it believes may affect the Company’s business, financial condition, results of operations, prospects, business strategy and financial needs. The outcome of the events described in these forward-looking statements is subject to risks, uncertainties, assumptions, including, but not limited to, the impact of legislative or regulatory actions, the impact of natural or man-made disasters, the sufficiency of the Company’s reserves, the impact of emerging claims issues, adverse capital market developments impacting investment performance, ability to effectively start-up or integrate new product opportunities, adverse effect of cyber-attacks, and other factors described in the section captioned “Risk Factors” and elsewhere in this report. These risks are not exhaustive, and new risks and uncertainties emerge from time to time. It is not possible for the Company to predict all risks and uncertainties that could have an impact on the forward-looking statements contained in this report. The Company cannot provide assurance that the results, events and circumstances reflected in the forward-looking statements will be achieved or occur, and actual results, events or circumstances could differ materially from those described in the forward-looking statements. Forward-looking statements are inherently uncertain and investors are cautioned not to unduly rely upon such statements.
The Company’s forward-looking statements speak only as of the date of this report or as of the date they were made. The Company undertakes no obligation to publicly update or review any forward-looking statement, whether as a result of new information, future developments or otherwise.
63
Item 7A. QUANTITATIVE AND QUALITATIVE DISCLOSURES ABOUT MARKET RISK
Market Risk
Market risk is the risk of economic losses due to adverse changes in the estimated fair value of a financial instrument as the result of changes in interest rates, equity prices, credit risk, illiquidity, foreign exchange rates and commodity prices. The Company’s consolidated balance sheets includes the estimated fair values of assets that are subject to market risk. The Company’s primary market risks are interest rate risk and credit risks associated with investments in fixed maturities, equity price risk associated with investments in equity securities, and foreign exchange risk associated with premium received that is denominated in foreign currencies. Each of these risks is discussed in more detail below. The Company has no commodity risk.
Interest Rate Risk
The Company’s primary market risk exposure is to changes in interest rates. The Company’s fixed income investments are exposed to interest rate risk. Fluctuations in interest rates have a direct impact on the market valuation of these securities. As interest rates rise, the market value of the Company’s fixed income investments fall, and the converse is also true. The Company seeks to manage interest rate risk through an active portfolio management strategy that involves the selection, by the Company’s managers, of investments with appropriate characteristics, such as duration, yield, currency, and liquidity that are tailored to the anticipated cash outflow characteristics of the Company’s liabilities. The Company’s strategy for managing interest rate risk also includes maintaining a high quality bond portfolio with a relatively short duration to reduce the effect of interest rate changes on book value. A significant portion of the Company’s investment portfolio matures each year, allowing for reinvestment at current market rates.
As of December 31, 2024, assuming identical shifts in interest rates for securities of all maturities, the table below illustrates the sensitivity of market value in Global Indemnity’s bonds to selected hypothetical changes in basis point increases and decreases:
(Dollars in thousands) |
|
|
Change in Market Value |
|
||||||||
Basis Point Change |
|
Market Value |
|
|
|
|
|
% |
|
|||
(200) |
|
$ |
1,401,644 |
|
|
|
19,736 |
|
|
|
1.4 |
% |
(100) |
|
|
1,391,793 |
|
|
|
9,885 |
|
|
|
0.7 |
% |
No change |
|
|
1,381,908 |
|
|
|
— |
|
|
|
— |
|
100 |
|
|
1,371,995 |
|
|
|
(9,913 |
) |
|
|
(0.7 |
%) |
200 |
|
|
1,362,086 |
|
|
|
(19,822 |
) |
|
|
(1.4 |
%) |
Credit Risk
The Company’s investment policy requires that its investments in debt instruments are of high credit quality issuers and limit the amount of credit exposure to any one issuer based upon the rating of the security.
As of December 31, 2024, the Company had approximately $20.5 million worth of investment exposure to subprime and Alt-A investments. As of December 31, 2024, approximately $9.7 million of those investments have been rated BBB to AAA by Standard & Poor’s and $10.8 million were rated below investment grade. As of December 31, 2023, the Company had approximately $27.8 million worth of investment exposure to subprime and Alt-A investments. As of December 31, 2023, approximately $15.1 million of those investments have been rated BBB to AAA by Standard & Poor’s and $12.7 million were rated below investment grade. There was no credit loss recorded on these investments during the years ended December 31, 2024 or 2023.
In addition, the Company has credit risk exposure to its general agencies and reinsurers. The Company seeks to mitigate and control its risks to producers by typically requiring its general agencies to render payments within no more than 45 days after the month in which a policy is effective and including provisions within the Company’s general agency contracts that allow it to terminate a general agency's authority in the event of non-payment.
With respect to its credit exposure to reinsurers, the Company seeks to mitigate and control its risk by ceding business to only those reinsurers having adequate financial strength and sufficient capital to fund their obligation. In addition, the Company seeks to mitigate credit risk to reinsurers through the use of trusts and letters of credit for collateral.
64
Equity Price Risk
The Company holds a minimal amount of preferred stocks as of December 31, 2024, however, the positions do not pose a significant equity price risk.
Foreign Currency Exchange Risk
The Company has foreign currency exchange risk associated with a portion of the business previously written at Global Indemnity Reinsurance, as well as a small portion of expenses related to corporate overhead in its Ireland office. The Company also maintains cash accounts in foreign currencies in order to pay expenses in foreign countries. At period-end, the Company re-measures those non-U.S. currency financial assets to their current U.S. dollar equivalent. Financial liabilities, if any, are generally adjusted within the reserving process. However, for known losses on claims to be paid in foreign currencies, the Company re-measures the liabilities to their current U.S. dollar equivalent each period end.
65
Item 8. FINANCIAL STATEMENTS AND SUPPLEMENTARY DATA
GLOBAL INDEMNITY GROUP, LLC
Index to Financial Statements
Report of Independent Registered Public Accounting Firm (PCAOB ID: 42) |
|
67 |
|
|
|
|
69 |
|
|
|
|
|
70 |
|
|
|
|
|
71 |
|
|
|
|
|
72 |
|
|
|
|
|
73 |
|
|
|
|
|
74 |
Index to Financial Statement Schedules
Schedule I |
|
Summary of Investments – Other Than Investments in Related Parties |
|
S-1 |
|
|
|
|
|
Schedule II |
|
|
S-2 |
|
|
|
|
|
|
Schedule III |
|
|
S-5 |
|
|
|
|
|
|
Schedule IV |
|
|
S-6 |
|
|
|
|
|
|
Schedule V |
|
|
S-7 |
|
|
|
|
|
|
Schedule VI |
|
Supplementary Information for Property Casualty Underwriters |
|
S-8 |
66
Report of Independent Registered Public Accounting Firm
To the Shareholders and the Board of Directors of Global Indemnity Group, LLC
Opinion on the Financial Statements
We have audited the accompanying consolidated balance sheets of Global Indemnity Group, LLC (the Company) as of December 31, 2024 and 2023, the related consolidated statements of operations, comprehensive income (loss), changes in shareholders' equity and cash flows for each of the three years in the period ended December 31, 2024, and the related notes and financial statement schedules listed in the Index at Item 15(a)(2) (collectively referred to as the “consolidated financial statements”). In our opinion, the consolidated financial statements present fairly, in all material respects, the financial position of the Company at December 31, 2024 and 2023, and the results of its operations and its cash flows for each of the three years in the period ended December 31, 2024, in conformity with U.S. generally accepted accounting principles.
We also have audited, in accordance with the standards of the Public Company Accounting Oversight Board (United States) (PCAOB), the Company's internal control over financial reporting as of December 31, 2024, based on criteria established in Internal Control—Integrated Framework issued by the Committee of Sponsoring Organizations of the Treadway Commission (2013 framework), and our report dated March 11, 2025 expressed an unqualified opinion thereon.
Basis for Opinion
These financial statements are the responsibility of the Company's management. Our responsibility is to express an opinion on the Company’s financial statements based on our audits. We are a public accounting firm registered with the PCAOB and are required to be independent with respect to the Company in accordance with the U.S. federal securities laws and the applicable rules and regulations of the Securities and Exchange Commission and the PCAOB.
We conducted our audits in accordance with the standards of the PCAOB. Those standards require that we plan and perform the audit to obtain reasonable assurance about whether the financial statements are free of material misstatement, whether due to error or fraud. Our audits included performing procedures to assess the risks of material misstatement of the financial statements, whether due to error or fraud, and performing procedures that respond to those risks. Such procedures included examining, on a test basis, evidence regarding the amounts and disclosures in the financial statements. Our audits also included evaluating the accounting principles used and significant estimates made by management, as well as evaluating the overall presentation of the financial statements. We believe that our audits provide a reasonable basis for our opinion.
Critical Audit Matter
The critical audit matter communicated below is a matter arising from the current period audit of the financial statements that was communicated or required to be communicated to the audit committee and that: (1) relates to accounts or disclosures that are material to the financial statements and (2) involved our especially challenging, subjective or complex judgments. The communication of the critical audit matter does not alter in any way our opinion on the consolidated financial statements, taken as a whole, and we are not, by communicating the critical audit matter below, providing a separate opinion on the critical audit matter or on the account or disclosure to which it relates.
|
|
Valuation of Unpaid Losses and Loss Adjustment Expenses |
Description of the Matter |
|
At December 31, 2024, the Company’s liability for unpaid losses and loss adjustment expenses was $800 million, of which a significant portion represents incurred but not reported reserves. As described in Note 4 of the consolidated financial statements, the liability for unpaid losses and loss adjustment expenses represents the Company’s best estimate of future amounts needed to pay losses and related settlement expenses with respect to events insured by the Company. The difference between the estimated ultimate loss and loss adjustment expenses and the case incurred loss (paid loss plus case reserve) is considered to be incurred but not reported. There is significant uncertainty inherent in determining management’s best estimate of the ultimate loss and loss adjustment expenses, requiring the use of informed actuarially based estimates and management’s judgment. In particular, the Company’s long-tail reserve categories (such as certain general liability and environmental exposures) are influenced by factors that are subject to significant variation over a long period of time or have high potential severities within the selection and weighting of actuarial methods and assumptions. Assumptions fundamental to the reserving process include claims frequency and severity as well as the review of historical payment and claim reporting patterns and expected loss ratios. |
67
|
|
Auditing management’s best estimate of the liability for unpaid losses and loss adjustment expenses was complex and involved the use of our actuarial specialists due to the significant estimation uncertainty associated with evaluating management’s methods and assumptions in determining the Company’s recorded loss and loss adjustment expense reserves.
|
How We Addressed the Matter in Our Audit |
|
We obtained an understanding, evaluated the design and tested the operating effectiveness of internal controls over management’s process for estimating loss and loss adjustment expense reserves. This included, among others, the review and approval processes management has in place for the methods and assumptions used in estimating the loss and loss adjustment expense reserves.
To test the Company’s estimate of loss and loss adjustment expense reserves, our audit procedures included among others, the use of our actuarial specialists to evaluate the selection and the weighting of actuarial methods used by management with those methods used in prior periods and those used in the industry. In addition, we also used our actuarial specialists to evaluate the assumptions used in the actuarial methods, by comparing the significant assumptions, including claims frequency and severity, historical payment and claims reporting patterns and expected loss ratios to the Company’s historical experience. We developed a range of reserve estimates which included performing independent projections for a sample of lines of business and compared the range of reserve estimates to the Company’s recorded reserves. We also performed an analysis of historical results of the development of the loss and loss adjustment expense reserves related to prior years. |
/s/ Ernst & Young LLP
We have served as the Company’s auditor since 2015.
Philadelphia, Pennsylvania
March 11, 2025
68
GLOBAL INDEMNITY GROUP, LLC
Consolidated Balance Sheets
(In thousands, except share amounts)
ASSETS |
|
December 31, 2024 |
|
|
December 31, 2023 |
|
||
Fixed maturities: |
|
|
|
|
|
|
||
Available for sale, at fair value (amortized cost: $1,394,639 and $1,322,092; net of allowance for expected credit losses of: $0 at December 31, 2024 and 2023) |
|
$ |
1,381,908 |
|
|
$ |
1,293,793 |
|
Equity securities, at fair value |
|
|
12,284 |
|
|
|
16,508 |
|
Other invested assets |
|
|
29,413 |
|
|
|
38,236 |
|
Total investments |
|
|
1,423,605 |
|
|
|
1,348,537 |
|
Cash and cash equivalents |
|
|
17,009 |
|
|
|
38,037 |
|
Premium receivables, net of allowance for expected credit losses of $3,530 and $4,796 at December 31, 2024 and 2023, respectively |
|
|
75,088 |
|
|
|
102,158 |
|
Reinsurance receivables, net of allowance for expected credit losses of $8,992 |
|
|
66,855 |
|
|
|
80,439 |
|
Funds held by ceding insurers |
|
|
30,026 |
|
|
|
16,989 |
|
Deferred federal income taxes |
|
|
22,459 |
|
|
|
36,802 |
|
Deferred acquisition costs |
|
|
41,136 |
|
|
|
42,445 |
|
Intangible assets |
|
|
14,103 |
|
|
|
14,456 |
|
Goodwill |
|
|
4,820 |
|
|
|
4,820 |
|
Prepaid reinsurance premiums |
|
|
3,320 |
|
|
|
4,958 |
|
Receivable for securities |
|
|
52 |
|
|
|
3,858 |
|
Federal income tax receivable |
|
|
825 |
|
|
|
— |
|
Lease right of use assets |
|
|
9,295 |
|
|
|
9,715 |
|
Other assets |
|
|
22,660 |
|
|
|
26,362 |
|
Total assets |
|
$ |
1,731,253 |
|
|
$ |
1,729,576 |
|
LIABILITIES AND SHAREHOLDERS’ EQUITY |
|
|
|
|
|
|
||
Liabilities: |
|
|
|
|
|
|
||
Unpaid losses and loss adjustment expenses |
|
$ |
800,391 |
|
|
$ |
850,599 |
|
Unearned premiums |
|
|
183,411 |
|
|
|
182,852 |
|
Reinsurance balances payable |
|
|
8,181 |
|
|
|
2,642 |
|
Federal income tax payable |
|
|
— |
|
|
|
1,595 |
|
Contingent commissions |
|
|
6,826 |
|
|
|
5,632 |
|
Lease liabilities |
|
|
10,371 |
|
|
|
12,733 |
|
Other liabilities |
|
|
32,924 |
|
|
|
24,770 |
|
Total liabilities |
|
|
1,042,104 |
|
|
|
1,080,823 |
|
Commitments and contingencies (Note 17) |
|
|
— |
|
|
|
— |
|
Shareholders’ equity: |
|
|
|
|
|
|
||
Series A cumulative fixed rate preferred shares, $1,000 par value; 100,000,000 shares authorized, shares issued and outstanding: 4,000 and 4,000 shares, respectively, liquidation preference: $1,000 per share and $1,000 per share, respectively |
|
|
4,000 |
|
|
|
4,000 |
|
Common shares: no par value; 900,000,000 common shares authorized; class A common shares issued: 11,202,355 and 11,042,670, respectively; class A common shares outstanding: 9,914,587 and 9,771,429, respectively; class B common shares issued and outstanding: 3,793,612 and 3,793,612, respectively |
|
|
— |
|
|
|
— |
|
Additional paid-in capital |
|
|
459,578 |
|
|
|
454,791 |
|
Accumulated other comprehensive income (loss), net of tax |
|
|
(10,410 |
) |
|
|
(22,863 |
) |
Retained earnings |
|
|
268,673 |
|
|
|
244,988 |
|
Class A common shares in treasury, at cost: 1,287,768 and 1,271,241 shares, respectively |
|
|
(32,692 |
) |
|
|
(32,163 |
) |
Total shareholders’ equity |
|
|
689,149 |
|
|
|
648,753 |
|
Total liabilities and shareholders’ equity |
|
$ |
1,731,253 |
|
|
$ |
1,729,576 |
|
See accompanying notes to the consolidated financial statements.
69
GLOBAL INDEMNITY GROUP, LLC
Consolidated Statements of Operations
(In thousands, except shares and per share data)
|
|
Years Ended December 31, |
|
|||||||||
|
|
2024 |
|
|
2023 |
|
|
2022 |
|
|||
Revenues: |
|
|
|
|
|
|
|
|
|
|||
Gross written premiums |
|
$ |
389,758 |
|
|
$ |
416,397 |
|
|
$ |
727,603 |
|
Ceded written premiums |
|
|
(10,568 |
) |
|
|
(17,078 |
) |
|
|
(136,272 |
) |
Net written premiums |
|
|
379,190 |
|
|
|
399,319 |
|
|
|
591,331 |
|
Change in net unearned premiums |
|
|
(2,198 |
) |
|
|
74,038 |
|
|
|
11,140 |
|
Net earned premiums |
|
|
376,992 |
|
|
|
473,357 |
|
|
|
602,471 |
|
Net investment income |
|
|
62,375 |
|
|
|
55,444 |
|
|
|
27,627 |
|
Net realized investment gains (losses) |
|
|
455 |
|
|
|
(2,107 |
) |
|
|
(32,929 |
) |
Other income |
|
|
1,365 |
|
|
|
1,435 |
|
|
|
31,365 |
|
Total revenues |
|
|
441,187 |
|
|
|
528,129 |
|
|
|
628,534 |
|
Losses and Expenses: |
|
|
|
|
|
|
|
|
|
|||
Net losses and loss adjustment expenses |
|
|
213,190 |
|
|
|
289,153 |
|
|
|
359,228 |
|
Acquisition costs and other underwriting expenses |
|
|
147,345 |
|
|
|
182,617 |
|
|
|
236,381 |
|
Corporate and other operating expenses |
|
|
25,696 |
|
|
|
23,383 |
|
|
|
24,421 |
|
Interest expense |
|
|
— |
|
|
|
— |
|
|
|
3,004 |
|
Loss on extinguishment of debt |
|
|
— |
|
|
|
— |
|
|
|
3,529 |
|
Income before income taxes |
|
|
54,956 |
|
|
|
32,976 |
|
|
|
1,971 |
|
Income tax expense |
|
|
11,715 |
|
|
|
7,547 |
|
|
|
2,821 |
|
Net income (loss) |
|
|
43,241 |
|
|
|
25,429 |
|
|
|
(850 |
) |
Less: preferred stock distributions |
|
|
440 |
|
|
|
440 |
|
|
|
440 |
|
Net income (loss) available to common shareholders |
|
$ |
42,801 |
|
|
$ |
24,989 |
|
|
$ |
(1,290 |
) |
Per share data: |
|
|
|
|
|
|
|
|
|
|||
Net income (loss) available to common shareholders (1) |
|
|
|
|
|
|
|
|
|
|||
Basic |
|
$ |
3.14 |
|
|
$ |
1.84 |
|
|
$ |
(0.09 |
) |
Diluted |
|
$ |
3.12 |
|
|
$ |
1.83 |
|
|
$ |
(0.09 |
) |
Weighted-average number of shares outstanding |
|
|
|
|
|
|
|
|
|
|||
Basic |
|
|
13,635,582 |
|
|
|
13,553,168 |
|
|
|
14,482,164 |
|
Diluted |
|
|
13,705,715 |
|
|
|
13,666,408 |
|
|
|
14,482,164 |
|
Cash distributions declared per common share |
|
$ |
1.40 |
|
|
$ |
1.00 |
|
|
$ |
1.00 |
|
See accompanying notes to the consolidated financial statements.
70
GLOBAL INDEMNITY GROUP, LLC
Consolidated Statements of Comprehensive Income (Loss)
(In thousands)
|
|
Years Ended December 31, |
|
|||||||||
|
|
2024 |
|
|
2023 |
|
|
2022 |
|
|||
Net income (loss) |
|
$ |
43,241 |
|
|
$ |
25,429 |
|
|
$ |
(850 |
) |
Other comprehensive income (loss), net of tax: |
|
|
|
|
|
|
|
|
|
|||
Unrealized holding gains (losses) |
|
|
11,827 |
|
|
|
18,892 |
|
|
|
(81,729 |
) |
Reclassification adjustment for losses included in net income (loss) |
|
|
683 |
|
|
|
1,350 |
|
|
|
32,253 |
|
Unrealized foreign currency translation gains (losses) |
|
|
(57 |
) |
|
|
(47 |
) |
|
|
14 |
|
Other comprehensive income (loss), net of tax |
|
|
12,453 |
|
|
|
20,195 |
|
|
|
(49,462 |
) |
Comprehensive income (loss), net of tax |
|
$ |
55,694 |
|
|
$ |
45,624 |
|
|
$ |
(50,312 |
) |
See accompanying notes to the consolidated financial statements.
71
GLOBAL INDEMNITY GROUP, LLC
(In thousands, except share amounts)
|
|
Years Ended December 31, |
|
|||||||||
|
|
2024 |
|
|
2023 |
|
|
2022 |
|
|||
Number of Series A Cumulative Fixed Rate Preferred Shares |
|
|
|
|
|
|
|
|
|
|||
Number at beginning and end of period |
|
|
4,000 |
|
|
|
4,000 |
|
|
|
4,000 |
|
Number of class A common shares issued: |
|
|
|
|
|
|
|
|
|
|||
Number at beginning of period |
|
|
11,042,670 |
|
|
|
10,876,041 |
|
|
|
10,574,589 |
|
Common shares issued under share incentive plans, net of forfeitures |
|
|
65,182 |
|
|
|
75,541 |
|
|
|
50,598 |
|
Common shares issued to directors |
|
|
94,503 |
|
|
|
91,088 |
|
|
|
97,260 |
|
Share conversion |
|
|
— |
|
|
|
— |
|
|
|
153,594 |
|
Number at end of period |
|
|
11,202,355 |
|
|
|
11,042,670 |
|
|
|
10,876,041 |
|
Number of class B common shares issued: |
|
|
|
|
|
|
|
|
|
|||
Number at beginning of period |
|
|
3,793,612 |
|
|
|
3,793,612 |
|
|
|
3,947,206 |
|
Share conversion |
|
|
— |
|
|
|
— |
|
|
|
(153,594 |
) |
Number at end of period |
|
|
3,793,612 |
|
|
|
3,793,612 |
|
|
|
3,793,612 |
|
Par value of Series A Cumulative Fixed Rate Preferred Shares: |
|
|
|
|
|
|
|
|
|
|||
Balance at beginning and end of period |
|
$ |
4,000 |
|
|
$ |
4,000 |
|
|
$ |
4,000 |
|
Additional paid-in capital: |
|
|
|
|
|
|
|
|
|
|||
Balance at beginning of period |
|
$ |
454,791 |
|
|
$ |
451,305 |
|
|
$ |
447,406 |
|
Share compensation plans |
|
|
4,787 |
|
|
|
3,486 |
|
|
|
3,899 |
|
Balance at end of period |
|
$ |
459,578 |
|
|
$ |
454,791 |
|
|
$ |
451,305 |
|
Accumulated other comprehensive income (loss), net of deferred income tax: |
|
|
|
|
|
|
|
|
|
|||
Balance at beginning of period |
|
$ |
(22,863 |
) |
|
$ |
(43,058 |
) |
|
$ |
6,404 |
|
Other comprehensive income (loss): |
|
|
|
|
|
|
|
|
|
|||
Change in unrealized holding gains (losses) |
|
|
12,510 |
|
|
|
20,242 |
|
|
|
(49,476 |
) |
Unrealized foreign currency translation gains (losses) |
|
|
(57 |
) |
|
|
(47 |
) |
|
|
14 |
|
Other comprehensive income (loss) |
|
|
12,453 |
|
|
|
20,195 |
|
|
|
(49,462 |
) |
Balance at end of period |
|
$ |
(10,410 |
) |
|
$ |
(22,863 |
) |
|
$ |
(43,058 |
) |
Retained earnings: |
|
|
|
|
|
|
|
|
|
|||
Balance at beginning of period |
|
$ |
244,988 |
|
|
$ |
233,468 |
|
|
$ |
249,301 |
|
Net income (loss) |
|
|
43,241 |
|
|
|
25,429 |
|
|
|
(850 |
) |
Preferred share distributions |
|
|
(440 |
) |
|
|
(440 |
) |
|
|
(440 |
) |
Distributions to shareholders |
|
|
(19,116 |
) |
|
|
(13,469 |
) |
|
|
(14,543 |
) |
Balance at end of period |
|
$ |
268,673 |
|
|
$ |
244,988 |
|
|
$ |
233,468 |
|
Number of treasury shares: |
|
|
|
|
|
|
|
|
|
|||
Number at beginning of period |
|
|
1,271,241 |
|
|
|
802,381 |
|
|
|
17,496 |
|
Class A common shares purchased |
|
|
16,527 |
|
|
|
468,860 |
|
|
|
923,036 |
|
Class A common shares purchased by GBLI director |
|
|
— |
|
|
|
— |
|
|
|
(138,151 |
) |
Number at end of period |
|
|
1,287,768 |
|
|
|
1,271,241 |
|
|
|
802,381 |
|
Treasury shares, at cost: |
|
|
|
|
|
|
|
|
|
|||
Balance at beginning of period |
|
$ |
(32,163 |
) |
|
$ |
(19,486 |
) |
|
$ |
(490 |
) |
Class A common shares purchased, at cost |
|
|
(529 |
) |
|
|
(12,677 |
) |
|
|
(22,335 |
) |
Class A common shares purchased by GBLI director |
|
|
— |
|
|
|
— |
|
|
|
3,339 |
|
Balance at end of period |
|
$ |
(32,692 |
) |
|
$ |
(32,163 |
) |
|
$ |
(19,486 |
) |
Total shareholders’ equity |
|
$ |
689,149 |
|
|
$ |
648,753 |
|
|
$ |
626,229 |
|
See accompanying notes to the consolidated financial statements.
72
GLOBAL INDEMNITY GROUP, LLC
Consolidated Statements of Cash Flows
(In thousands)
|
|
Years Ended December 31, |
|
|||||||||
|
|
2024 |
|
|
2023 |
|
|
2022 |
|
|||
Cash flows from operating activities: |
|
|
|
|
|
|
|
|
|
|||
Net income (loss) |
|
$ |
43,241 |
|
|
$ |
25,429 |
|
|
$ |
(850 |
) |
Adjustments to reconcile net income (loss) to net cash provided by operating |
|
|
|
|
|
|
|
|
|
|||
Amortization and depreciation |
|
|
5,764 |
|
|
|
6,199 |
|
|
|
8,398 |
|
Amortization of debt issuance costs |
|
|
— |
|
|
|
— |
|
|
|
41 |
|
Gross proceeds from sale of renewal rights |
|
|
— |
|
|
|
— |
|
|
|
(30,000 |
) |
Adjustment on lease right of use assets and lease liability |
|
|
(917 |
) |
|
|
— |
|
|
|
— |
|
Impairment loss on lease right of use assets |
|
|
— |
|
|
|
— |
|
|
|
488 |
|
Impairment loss on furniture and fixtures and leasehold improvements |
|
|
394 |
|
|
|
— |
|
|
|
— |
|
Impairment loss on software |
|
|
— |
|
|
|
— |
|
|
|
508 |
|
Impairment loss on goodwill and intangible assets |
|
|
— |
|
|
|
— |
|
|
|
5,657 |
|
Restricted stock and stock option expense |
|
|
4,787 |
|
|
|
3,486 |
|
|
|
3,899 |
|
Deferred federal income taxes |
|
|
11,300 |
|
|
|
5,326 |
|
|
|
2,395 |
|
Amortization of bond premium and discount, net |
|
|
(15,656 |
) |
|
|
(6,749 |
) |
|
|
1,267 |
|
Net realized investment (gains) losses |
|
|
(455 |
) |
|
|
2,107 |
|
|
|
32,929 |
|
Loss on extinguishment of debt |
|
|
— |
|
|
|
— |
|
|
|
3,529 |
|
(Income) loss from equity method investments, net of distributions |
|
|
(80 |
) |
|
|
(2,369 |
) |
|
|
6,549 |
|
Changes in: |
|
|
|
|
|
|
|
|
|
|||
Premium receivables, net |
|
|
27,070 |
|
|
|
66,585 |
|
|
|
(40,299 |
) |
Reinsurance receivables, net |
|
|
13,584 |
|
|
|
5,282 |
|
|
|
14,143 |
|
Funds held by ceding insurers |
|
|
(13,109 |
) |
|
|
2,142 |
|
|
|
8,785 |
|
Unpaid losses and loss adjustment expenses |
|
|
(50,208 |
) |
|
|
18,195 |
|
|
|
72,500 |
|
Unearned premiums |
|
|
559 |
|
|
|
(86,501 |
) |
|
|
(47,213 |
) |
Reinsurance balances payable |
|
|
5,539 |
|
|
|
(14,599 |
) |
|
|
(18,099 |
) |
Other assets and liabilities |
|
|
5,301 |
|
|
|
(14,970 |
) |
|
|
(12,814 |
) |
Contingent commissions |
|
|
1,194 |
|
|
|
(3,184 |
) |
|
|
913 |
|
Federal income tax receivable / payable |
|
|
(2,420 |
) |
|
|
1,595 |
|
|
|
— |
|
Deferred acquisition costs |
|
|
1,309 |
|
|
|
22,449 |
|
|
|
(4,563 |
) |
Prepaid reinsurance premiums |
|
|
1,638 |
|
|
|
12,463 |
|
|
|
36,073 |
|
Net cash provided by operating activities |
|
|
38,835 |
|
|
|
42,886 |
|
|
|
44,236 |
|
Cash flows from investing activities: |
|
|
|
|
|
|
|
|
|
|||
Proceeds from sale of fixed maturities |
|
|
112,507 |
|
|
|
148,164 |
|
|
|
933,554 |
|
Proceeds from sale of equity securities |
|
|
— |
|
|
|
1,158 |
|
|
|
88,726 |
|
Proceeds from maturity of fixed maturities |
|
|
973,523 |
|
|
|
280,115 |
|
|
|
81,546 |
|
Proceeds from maturity of preferred stock |
|
|
5,534 |
|
|
|
500 |
|
|
|
1,000 |
|
Proceeds from other invested assets |
|
|
8,902 |
|
|
|
2,309 |
|
|
|
107,925 |
|
Amounts received in connection with derivatives |
|
|
— |
|
|
|
— |
|
|
|
12,726 |
|
Purchases of fixed maturities |
|
|
(1,139,971 |
) |
|
|
(448,465 |
) |
|
|
(1,164,683 |
) |
Purchases of equity securities |
|
|
— |
|
|
|
(111 |
) |
|
|
(10,660 |
) |
Gross proceeds from sale of renewal rights |
|
|
— |
|
|
|
— |
|
|
|
30,000 |
|
Net cash provided by (used for) investing activities |
|
|
(39,505 |
) |
|
|
(16,330 |
) |
|
|
80,134 |
|
Cash flows from financing activities: |
|
|
|
|
|
|
|
|
|
|||
Distributions paid to common shareholders |
|
|
(19,389 |
) |
|
|
(14,248 |
) |
|
|
(14,366 |
) |
Distributions paid to preferred shareholders |
|
|
(440 |
) |
|
|
(440 |
) |
|
|
(440 |
) |
Purchases of class A common shares |
|
|
(529 |
) |
|
|
(12,677 |
) |
|
|
(22,335 |
) |
Issuance of class A common shares |
|
|
— |
|
|
|
— |
|
|
|
3,339 |
|
Redemption of subordinated notes |
|
|
— |
|
|
|
— |
|
|
|
(130,000 |
) |
Net cash used for financing activities |
|
|
(20,358 |
) |
|
|
(27,365 |
) |
|
|
(163,802 |
) |
Net change in cash and cash equivalents |
|
|
(21,028 |
) |
|
|
(809 |
) |
|
|
(39,432 |
) |
Cash and cash equivalents at beginning of period |
|
|
38,037 |
|
|
|
38,846 |
|
|
|
78,278 |
|
Cash and cash equivalents at end of period |
|
$ |
17,009 |
|
|
$ |
38,037 |
|
|
$ |
38,846 |
|
See accompanying notes to the consolidated financial statements.
73
Global Indemnity Group, LLC (“Global Indemnity” or "the Company") is a Delaware limited liability company. Global Indemnity Group, LLC’s class A common shares are publicly traded on the New York Stock Exchange under the ticker symbol GBLI. Global Indemnity Group, LLC’s predecessors have been publicly traded since 2003.
Global Indemnity Group, LLC is a holding company that is classified as a publicly traded partnership for U.S. federal income tax purposes and meets the qualifying income exception to maintain partnership status.
Global Indemnity Group, LLC owns all shares of its direct and indirect subsidiaries, including those of its insurance companies: United National Insurance Company, Diamond State Insurance Company, Penn-America Insurance Company, Penn-Star Insurance Company, and Penn-Patriot Insurance Company.
The insurance companies’ primary activity is providing insurance products across a distribution network that includes wholesale general agents, retail agents, and direct-to-consumer. The Company manages the distribution of its core product offerings through Penn-America. Penn-America offers specialty property and casualty products designed for its Wholesale Commercial, Specialty Products, InsurTech, and Assumed Reinsurance product offerings. These product lines are offered in the excess and surplus lines marketplace. The Company also has a Non-Core Operations segment that contains lines of business that have been de-emphasized or are no longer being written. See Note 22 for additional information regarding segments. Collectively, the Company’s insurance subsidiaries are licensed in all 50 states, the District of Columbia, Puerto Rico, and the U.S. Virgin Islands.
The consolidated financial statements have been prepared in conformity with United States of America generally accepted accounting principles (“GAAP”), which differs in certain respects from those principles followed in reports to insurance regulatory authorities. The preparation of consolidated financial statements in conformity with GAAP requires management to make estimates and assumptions that affect the reported amounts of assets and liabilities and disclosure of contingent assets and liabilities at the date of the consolidated financial statements and the reported amounts of revenues and expenses during the reporting period. Actual results could differ from those estimates.
The consolidated financial statements include the accounts of Global Indemnity Group, LLC and its wholly-owned subsidiaries. All intercompany balances and transactions have been eliminated in consolidation.
Farm, Ranch & Stable
On August 8, 2022, the Company sold the renewal rights related to its Farm, Ranch & Stable business for policies written on or after August 8, 2022 to Everett Cash Mutual Insurance Company for $30.0 million. The Company retained the unearned premium reserves for business written prior to August 8, 2022.
The gross proceeds from this sale of $30.0 million are included in other income on the Company’s consolidated statements of operations for the year ended December 31, 2022. In addition, the Company also recorded an impairment of goodwill, intangible assets, software, and lease costs in the amount of $0.6 million, $5.1 million, $0.5 million, and $0.5 million, respectively, for the year ended December 31, 2022. Legal expenses and merger and acquisition fees related to the sale were $2.5 million for the year ended December 31, 2022. The impairments and expenses related to sale are included on the Company’s consolidated statements of operations as follows:
|
|
Years Ended December 31, |
|
|||||||||
(Dollars in thousands) |
|
2024 |
|
|
2023 |
|
|
2022 |
|
|||
Acquisition costs and other underwriting expenses |
|
$ |
— |
|
|
$ |
— |
|
|
$ |
1,034 |
|
Corporate and other operating expenses |
|
|
— |
|
|
|
— |
|
|
|
8,142 |
|
Total impairments and expenses related to sale |
|
$ |
— |
|
|
$ |
— |
|
|
$ |
9,176 |
|
See Note 8 for additional information on the impairment of goodwill and intangible assets and Note 14 for additional information on impairment of leases.
In conjunction with this sale, Everett Cash Mutual Insurance Company also acquired the Company’s wholly-owned subsidiary, American Reliable Insurance Company, on December 31, 2022 for an amount equal to book value, which was $10.0 million, at the time of closing.
74
The Company restructured its insurance operations to strengthen its market presence and enhance its focus on core products. As a result, the Company exited its four brokerage divisions: Professional Liability, Excess Casualty, Environmental, and Middle Market Property. The Company ceased writing new business and non-renewed existing policies for these four divisions. The restructuring plan, which was initiated in the fourth quarter of 2022, was completed in the first quarter of 2023.
In connection with the restructuring plan, the Company incurred restructuring costs of $3.4 million in 2022 and $2.0 million in 2023 for total restructuring costs of $5.4 million. No additional restructuring costs were incurred during the year ended December 31, 2024.
The following table summarizes charges incurred by expense type and the remaining liability as of December 31, 2024, 2023 and 2022:
|
|
|
|
|
|
|
|
|
||||||
(Dollars in thousands) |
|
Consolidated Statements of Operations Line |
|
Employee Termination |
|
|
Lease Right of Use Asset Impairment |
|
|
Total |
|
|||
Charges incurred in 2022 |
|
Corporate and other operating expenses |
|
$ |
2,635 |
|
|
$ |
— |
|
|
$ |
2,635 |
|
Charges incurred in 2022 |
|
Acquisition costs and other underwriting expenses (1) |
|
|
— |
|
|
|
812 |
|
|
|
812 |
|
Non-cash asset charges |
|
|
|
|
— |
|
|
|
(812 |
) |
|
|
(812 |
) |
Liability at December 31, 2022 |
|
|
|
|
2,635 |
|
|
|
— |
|
|
|
2,635 |
|
Charges incurred in 2023 |
|
Corporate and other operating expenses |
|
|
1,997 |
|
|
— |
|
|
|
1,997 |
|
|
Cash payments in 2023 |
|
|
|
|
(4,554 |
) |
|
|
— |
|
|
|
(4,554 |
) |
Liability at December 31, 2023 |
|
|
|
|
78 |
|
|
|
— |
|
|
|
78 |
|
Cash payments in 2024 |
|
|
|
|
(78 |
) |
|
|
— |
|
|
|
(78 |
) |
Liability at December 31, 2024 |
|
|
|
$ |
— |
|
|
$ |
— |
|
|
$ |
— |
|
(1) These charges were recorded within the Company's Non-Core Operations segment.
Any information technology development initiatives related to business lines within Non-Core Operations have been discontinued.
Investments
The Company’s investments in fixed maturities, which are classified as available for sale, and equity securities are carried at their fair value. Fair value is defined as the price that would be received to sell an asset or paid to transfer a liability in an orderly transaction between market participants at the measurement date. The fair values of the Company's fixed maturities and equity securities are determined on the basis of quoted market prices where available. If quoted market prices are not available, the Company uses third-party pricing services to assist in determining fair value. In many instances, these services examine the pricing of similar instruments to estimate fair value. The Company purchases bonds with the expectation of holding them to their maturity; however, changes to the portfolio are sometimes required to assure it is appropriately matched to liabilities. In addition, changes in financial market conditions and tax considerations may cause the Company to sell an investment before it matures. The difference between amortized cost and fair value of the Company’s fixed maturity portfolio, net of the effect of deferred income taxes, is reflected in accumulated other comprehensive income (loss) within shareholders’ equity and, accordingly, has no effect on net income (loss) other than for the credit loss component of impairments and losses recognized as a result of the intent to sell. Equity securities are measured at fair value with the changes in fair value recognized in net income (loss).
For investments in limited partnerships and limited liability companies where the ownership interest is less than 3%, the Company carries these investments at fair value, and the change in the difference between cost and the fair value of these interests, net of the effect of deferred income taxes, is reflected in accumulated other comprehensive income (loss) within shareholders' equity and, accordingly, has no effect on net income (loss). The Company uses the equity method to account for investments in limited partnerships and limited liability companies where its ownership interest exceeds 3%. The equity method of accounting for an investment in a limited partnership and limited liability company requires that its cost basis be updated to account for the income or loss earned on the investment. The receipt of results for investments in limited partnerships and limited liability companies may vary. If results are received on a timely basis, they are included in current results. If they are not received on a timely basis, they are recorded on a one quarter lag. The recording of such results is applied consistently for each investment once the timing of receiving the results has been established. The income or loss associated with the limited partnerships and limited liability companies is reflected in the consolidated statements of operations, and the adjusted cost basis approximates fair value.
75
The Company’s investments in other invested assets were valued at $29.4 million and $38.2 million as of December 31, 2024 and 2023. These amounts relate to investments in limited partnerships and limited liability companies whose carrying value approximates fair value.
Net realized gains and losses on investments are determined based on the first-in, first-out method.
The Company regularly performs various analytical valuation procedures with respect to its investments, including reviewing each available for sale debt security in an unrealized loss position to assess whether the decline in fair value below amortized cost basis has resulted from a credit loss or other factors. In assessing whether a credit loss exists, the Company compares the present value of the cash flows expected to be collected from the security to the amortized cost basis of the security. If the present value of the cash flows expected to be collected is less than the amortized cost basis of the security, a credit loss exists and an allowance for expected credit losses is recorded. Subsequent changes in the allowances are recorded in the period of change as either credit loss expense or reversal of credit loss expense. Any declines in value related to factors other than credit losses and the intent to sell are recorded through other comprehensive income, net of taxes.
For fixed maturities, the factors considered in reaching the conclusion that a credit loss exists include, among others, whether:
According to accounting guidance for debt securities in an unrealized loss position, the Company is required to assess whether it has the intent to sell the debt security or more likely than not will be required to sell the debt security before the anticipated recovery. If either of these conditions is met, any allowance for expected credit losses is written off and the amortized cost basis is written down to the fair value of the fixed maturity security with any incremental impairment reported in earnings. The new amortized cost basis shall not be adjusted for subsequent recoveries in fair value.
The Company elected the practical expedient to exclude accrued interest from both the fair value and the amortized cost basis of the available for sale debt securities for the purposes of identifying and measuring an impairment and to not measure an allowance for expected credit losses for accrued interest receivables. Accrued interest receivable is written off through net realized investment gains (losses) at the time the issuer of the bond defaults or is expected to default on payment. The Company made an accounting policy election to present the accrued interest receivable balance with other assets on the Company’s consolidated statements of financial position. Accrued interest receivable related to fixed maturities was $3.5 million and $7.5 million as of December 31, 2024 and 2023, respectively.
Variable Interest Entities
A Variable Interest Entity (“VIE”) refers to an investment in which an investor holds a controlling interest that is not based on the majority of voting rights. Under the VIE model, the party that has the power to exercise significant management influence and maintain a controlling financial interest in the entity’s economics is said to be the primary beneficiary, and is required to consolidate the entity within their results. Other entities that participate in a VIE, for which their financial interests fluctuate with changes in the fair value of the investment entity’s net assets but do not have significant management influence and the ability to direct the VIE’s significant economic activities are said to have a variable interest in the VIE but do not consolidate the VIE in their financial results.
The Company has a variable interest in two limited partnership investments for which it is not the primary beneficiary. These investments are accounted for under the equity method since its ownership interest exceeds 3%.
76
Cash and Cash Equivalents
For the purpose of the statements of cash flows, the Company considers all liquid instruments with an original maturity of three months or less to be cash equivalents, with the exception of treasury bills, which are classified as fixed maturities. The Company has a cash management program that provides for the investment of excess cash balances primarily in short-term money market instruments. Generally, bank balances exceed federally insured limits. The carrying amount of cash and cash equivalents approximates fair value.
At December 31, 2024 and 2023, the Company had approximately $15.3 million and $36.9 million, respectively, of cash and cash equivalents that was invested in a diversified portfolio of high quality short-term debt securities.
Valuation of Premium Receivables
The Company evaluates the collectability of premium receivables based on a combination of factors. In instances in which the Company is aware of a specific circumstance where a party may be unable to meet its financial obligations to the Company, a specific allowance for expected credit losses against amounts due is recorded to reduce the net receivable to the amount reasonably believed by management to be collectible. For all remaining balances, the allowance is based upon the Company’s ongoing review of key aspects of amounts outstanding, including but not limited to, length of collection periods, direct placement with collection agencies, solvency of insured or agent, terminated agents, and other relevant factors. The allowance for expected credit losses was $3.5 million and $4.8 million as of December 31, 2024 and 2023, respectively.
Goodwill and Intangible Assets
The Company tests for impairment of goodwill at least annually and more frequently as circumstances warrant in accordance with applicable accounting guidance. Accounting guidance allows for the testing of goodwill for impairment using both qualitative and quantitative factors. Impairment of goodwill is recognized only if the carrying amount of the reporting unit, including goodwill, exceeds the fair value of the reporting unit. The amount of the impairment loss would be equal to the excess carrying value of the goodwill over the implied fair value of the reporting unit goodwill.
Impairment of intangible assets with an indefinite useful life is tested at least annually and more frequently as circumstances warrant in accordance with applicable accounting guidance. Accounting guidance allows for the testing of indefinite lived intangible assets for impairment using both qualitative and quantitative factors. Impairment of indefinite lived intangible assets is recognized only if the carrying amount of the intangible assets exceeds the fair value of said assets. The amount of the impairment loss would be equal to the excess carrying value of the assets over the fair value of said assets.
Intangible assets that are not deemed to have an indefinite useful life are amortized over their estimated useful lives. The carrying amounts of definite lived intangible assets are regularly reviewed for indicators of impairment in accordance with applicable accounting guidance. Impairment is recognized only if the carrying amount of the intangible asset is in excess of its undiscounted projected cash flows. The impairment is measured as the difference between the carrying amount and the estimated fair value of the asset.
See Note 8 for additional information on goodwill and intangible assets as well as the results of qualitative impairment assessments performed.
Reinsurance
In the normal course of business, the Company seeks to reduce the loss that may arise from events that cause unfavorable underwriting results by reinsuring certain levels of risk from various areas of exposure with reinsurers. Amounts receivable from reinsurers are estimated in a manner consistent with the reinsured policy and the reinsurance contract.
The Company regularly reviews the collectability of reinsurance receivables. An allowance for uncollectible reinsurance receivables is recognized based upon the Company’s ongoing review of key aspects of amounts outstanding, including but not limited to, length of collection periods, disputes, applicable coverage defenses, insolvent reinsurers, financial strength of solvent reinsurers based on AM Best Ratings and other relevant factors. Any changes in the allowance resulting from this review are included in net losses and loss adjustment expenses on the consolidated statements of operations during the period in which the determination is made. The allowance for expected credit losses was $9.0 million as of December 31, 2024 and 2023,.
The applicable accounting guidance requires that the reinsurer must assume significant insurance risk under the reinsured portions of the underlying insurance contracts and that there must be a reasonably possible chance that the reinsurer may realize a significant loss from the transaction. The Company has evaluated its reinsurance contracts and concluded that each contract qualifies for reinsurance accounting treatment pursuant to this guidance.
77
Income Taxes
Deferred tax assets and liabilities are recognized for the future tax consequences attributable to differences between the financial statement carrying amounts of existing assets and liabilities and their respective tax bases. Deferred tax assets and liabilities are measured using enacted tax rates expected to apply to taxable income in the years in which those temporary differences are expected to be recovered or settled. The effect on deferred tax assets and liabilities of a change in tax rates is recognized in income in the period that includes the enactment date.
A valuation allowance is provided when it is more likely than not that some portion of the deferred tax assets will not be realized. The deferred tax asset balance is analyzed regularly by management. This assessment requires significant judgment and considers, among other matters, the nature, frequency and severity of current and cumulative losses, forecasts of future profitability, the duration of carryforward periods, and tax planning strategies and/or actions. Management believes that it is more likely than not that the results of future operations can generate sufficient taxable income to realize the remaining deferred income tax assets, and accordingly, the Company has not established any valuation allowances.
Deferred Acquisition Costs
The costs of acquiring new and renewal insurance and reinsurance contracts primarily include commissions, premium taxes and certain other costs that are directly related to the successful acquisition of new and renewal insurance and reinsurance contracts. The excess of the Company’s costs of acquiring new and renewal insurance and reinsurance contracts over the related ceding commissions earned from reinsurers is capitalized as deferred acquisition costs and amortized over the period in which the related premiums are earned.
The amortization of deferred acquisition costs for the years ended December 31, 2024, 2023, and 2022 was $87.6 million, $120.9 million, and $150.9 million, respectively.
Premium Deficiency
A premium deficiency is recognized if the sum of expected loss and loss adjustment expenses and unamortized acquisition costs exceeds related unearned premium after consideration of investment income. This evaluation is done at a distribution and product line/treaty level. Any future expected loss on the related unearned premium is recorded first by impairing the unamortized acquisition costs on the related unearned premium followed by an increase to loss and loss adjustment expense reserves on additional expected loss in excess of unamortized acquisition costs. No premium deficiency reserve existed as of December 31, 2024 or 2023.
Derivative Instruments
The Company used derivative instruments to manage its exposure to cash flow variability from interest rate risk. The derivative instruments were carried on the balance sheet at fair value and included in other assets and other liabilities. Changes in the fair value of the derivative instruments and the periodic net interest settlements under the derivatives instruments were recognized as net realized investment gains (losses) on the consolidated statements of operations.
Unpaid Losses and Loss Adjustment Expenses
The liability for unpaid losses and loss adjustment expenses represents the Company’s best estimate of future amounts needed to pay losses and related settlement expenses with respect to events insured by the Company. This liability is based upon the accumulation of individual case estimates for losses reported prior to the close of the accounting period with respect to direct business, estimates received from ceding companies with respect to assumed reinsurance, and estimates of unreported losses.
The process of establishing the liability for unpaid losses and loss adjustment is complex, requiring the use of informed actuarially based estimates and Management’s judgment. In some cases, significant periods of time, up to several years or more, may elapse between the occurrence of an insured loss and the reporting of that loss to the Company. To establish this liability, the Company regularly reviews and updates the methods of making such estimates and establishing the resulting liabilities. Any resulting adjustments are recorded in consolidated statements of operations during the period in which the determination is made.
Share Repurchases
Shares repurchased from employees or third parties by Global Indemnity Group, LLC are held as treasury stock and recorded at cost until formally retired by Global Indemnity Group, LLC.
Retirement of Treasury Stock
Upon the formal retirement of treasury stock, Global Indemnity Group, LLC offsets the par value of the treasury stock that is being retired against common shares and reflects any excess of cost over par value as a deduction from Additional Paid-in Capital.
78
Share Redemptions
When shares are redeemed, Global Indemnity Group, LLC offsets the par value of the redeemed shares against common shares and reflects any excess of cost over par value as a deduction from Retained Earnings.
Premiums
Premiums are recognized as revenue ratably over the term of the respective policies and treaties. Unearned premiums are computed on a pro rata basis to the day of expiration.
Mandatory reinstatement premiums assessed on reinsurance policies are earned in the period of the loss event that gave rise to the reinstatement premiums.
Contingent Commissions
Certain professional general agencies of Global Indemnity are paid special incentives, referred to as contingent commissions, when results of business produced by these agencies are more favorable than predetermined thresholds. Similarly, in some circumstances, companies that cede business to Global Indemnity are paid profit commissions based on the profitability of the ceded portfolio. These commissions are charged to other underwriting expenses when incurred.
Share-Based Compensation
The Company accounts for stock options and other equity based compensation using the modified prospective application of the fair value-based method permitted by the appropriate accounting guidance. See Note 18 for details.
Earnings per Share
Basic earnings per share have been calculated by dividing net income (loss) available to common shareholders by the weighted-average common shares outstanding. In periods of net income, diluted earnings per share have been calculated by dividing net income available to common shareholders by the sum of the weighted-average common shares outstanding and the weighted-average common share equivalents outstanding, which include options and other equity awards. In periods of net loss, diluted earnings per share is the same as basic earnings per share. See Note 20 for details.
Foreign Currency
At times, the Company maintains investments and cash accounts in foreign currencies related to the operations of its business. At period-end, the Company re-measures non-U.S. currency financial assets to their current U.S. dollar equivalent. The resulting gain or loss for foreign denominated fixed maturity investments, if any, is reflected in accumulated other comprehensive income (loss) within shareholders’ equity; whereas, the gain or loss on foreign denominated cash accounts and equity securities is reflected in income during the period. Financial liabilities, if any, are generally adjusted within the reserving process. However, for known losses on claims to be paid in foreign currencies, the Company re-measures the liabilities to their current U.S. dollar equivalent each period end with the resulting gain or loss reflected in income during the period. Net transaction gains and losses, primarily comprised of re-measurement of known losses on claims to be paid in foreign currencies, were a gain of $0.1 million, a loss of $0.5 million, and a gain of $0.3 million for the years ended December 31, 2024, 2023, and 2022, respectively.
Leases
The Company determines if an arrangement is a lease at inception. Leases with a term of 12 months or less are not recorded on the consolidated balance sheets. For leases with a term of greater than 12 months, lease right-of-use assets (“ROU”) and lease liabilities are included on the consolidated balance sheets.
Lease ROU assets and lease liabilities are recognized based on the present value of the future minimum lease payments over the lease term at the commencement date. The Company’s leases do not provide an implicit rate; therefore, the Company uses its incremental borrowing rate at the commencement date in determining the present value of future payments. The ROU asset is calculated using the initial lease liability amount, plus any lease payments made at or before the commencement date, minus any lease incentives received, plus any initial direct costs incurred. Lease expenses for minimum lease payments are recognized on a straight-line basis over the lease term.
The Company’s lease agreements may contain both lease and non-lease components which are accounted separately. The Company elected the practical expedient on not separating lease components from non-lease components for its equipment leases.
Rental income derived from subleases are recognized on a straight-line basis over the operating lease term.
79
Other Income
Other income is primarily comprised of fee income, foreign exchange gains and losses, and gain on sale of the renewal rights.
Capitalized Software Costs
Capitalized software costs, which represent costs directly related to obtaining, developing or upgrading internal use software, are capitalized during the application development stage. These costs generally consist of internal personnel costs, external consulting fees, and software license fees. Capitalized software costs, which are included in other assets on the Company’s Consolidated Balance Sheets, are amortized using the straight-line method over its estimated useful life beginning when the software is put into service. Internal and external costs incurred during the preliminary project stage, training costs, most data conversion costs, and maintenance costs are charged to expense as incurred.
Capitalized software costs were $10.0 million and $4.0 million at December 31, 2024 and 2023, respectively. Amortization expense related to capitalized software for the years ended December 31, 2024, 2023, and 2022 was $4.4 million, $4.9 million, and $6.1 million, respectively.
The amortized cost and estimated fair value of the Company’s fixed maturities securities were as follows as of December 31, 2024 and 2023:
(Dollars in thousands) |
|
Amortized |
|
|
Allowance for Expected Credit Losses |
|
|
Gross |
|
|
Gross |
|
|
Estimated |
|
|||||
As of December 31, 2024 |
|
|
|
|
|
|
|
|
|
|
|
|
|
|
|
|||||
Fixed maturities: |
|
|
|
|
|
|
|
|
|
|
|
|
|
|
|
|||||
U.S. treasuries |
|
$ |
875,273 |
|
|
$ |
— |
|
|
$ |
757 |
|
|
$ |
(784 |
) |
|
$ |
875,246 |
|
Obligations of states and political subdivisions |
|
|
17,125 |
|
|
|
— |
|
|
|
— |
|
|
|
(790 |
) |
|
|
16,335 |
|
Mortgage-backed securities |
|
|
61,905 |
|
|
|
— |
|
|
|
299 |
|
|
|
(3,284 |
) |
|
|
58,920 |
|
Asset-backed securities |
|
|
137,445 |
|
|
|
— |
|
|
|
864 |
|
|
|
(2,882 |
) |
|
|
135,427 |
|
Commercial mortgage-backed securities |
|
|
68,041 |
|
|
|
— |
|
|
|
15 |
|
|
|
(2,488 |
) |
|
|
65,568 |
|
Corporate bonds |
|
|
158,798 |
|
|
|
— |
|
|
|
189 |
|
|
|
(2,891 |
) |
|
|
156,096 |
|
Foreign corporate bonds |
|
|
76,052 |
|
|
|
— |
|
|
|
81 |
|
|
|
(1,817 |
) |
|
|
74,316 |
|
Total fixed maturities |
|
$ |
1,394,639 |
|
|
$ |
— |
|
|
$ |
2,205 |
|
|
$ |
(14,936 |
) |
|
$ |
1,381,908 |
|
(Dollars in thousands) |
|
Amortized |
|
|
Allowance for Expected Credit Losses |
|
|
Gross |
|
|
Gross |
|
|
Estimated |
|
|||||
As of December 31, 2023 |
|
|
|
|
|
|
|
|
|
|
|
|
|
|
|
|||||
Fixed maturities: |
|
|
|
|
|
|
|
|
|
|
|
|
|
|
|
|||||
U.S. treasuries |
|
$ |
497,099 |
|
|
$ |
— |
|
|
$ |
515 |
|
|
$ |
(3,391 |
) |
|
$ |
494,223 |
|
Obligations of states and political subdivisions |
|
|
27,326 |
|
|
|
— |
|
|
|
— |
|
|
|
(1,176 |
) |
|
|
26,150 |
|
Mortgage-backed securities |
|
|
63,173 |
|
|
|
— |
|
|
|
229 |
|
|
|
(4,475 |
) |
|
|
58,927 |
|
Asset-backed securities |
|
|
207,375 |
|
|
|
— |
|
|
|
668 |
|
|
|
(5,091 |
) |
|
|
202,952 |
|
Commercial mortgage-backed securities |
|
|
84,062 |
|
|
|
— |
|
|
|
12 |
|
|
|
(4,994 |
) |
|
|
79,080 |
|
Corporate bonds |
|
|
298,526 |
|
|
|
— |
|
|
|
116 |
|
|
|
(6,929 |
) |
|
|
291,713 |
|
Foreign corporate bonds |
|
|
144,531 |
|
|
|
— |
|
|
|
40 |
|
|
|
(3,823 |
) |
|
|
140,748 |
|
Total fixed maturities |
|
$ |
1,322,092 |
|
|
$ |
— |
|
|
$ |
1,580 |
|
|
$ |
(29,879 |
) |
|
$ |
1,293,793 |
|
As of December 31, 2024 and 2023, the Company’s investments in equity securities consist of preferred stock in the amounts of $12.3 million and $16.5 million, respectively.
Excluding U.S. treasuries and limited partnerships, the Company did not hold any debt or equity investments in a single issuer in excess of 1.7% and 2.1% of shareholders' equity at December 31, 2024 and 2023, respectively.
80
The amortized cost and estimated fair value of the Company’s fixed maturities portfolio classified as available for sale at December 31, 2024, by contractual maturity, are shown below. Actual maturities may differ from contractual maturities because borrowers may have the right to call or prepay obligations with or without call or prepayment penalties.
(Dollars in thousands) |
|
Amortized |
|
|
Estimated |
|
||
Due in one year or less |
|
$ |
923,761 |
|
|
$ |
923,861 |
|
Due in one year through five years |
|
|
184,069 |
|
|
|
180,523 |
|
Due in five years through ten years |
|
|
9,524 |
|
|
|
8,600 |
|
Due after ten years |
|
|
9,894 |
|
|
|
9,009 |
|
Mortgage-backed securities |
|
|
61,905 |
|
|
|
58,920 |
|
Asset-backed securities |
|
|
137,445 |
|
|
|
135,427 |
|
Commercial mortgage-backed securities |
|
|
68,041 |
|
|
|
65,568 |
|
Total |
|
$ |
1,394,639 |
|
|
$ |
1,381,908 |
|
The following table contains an analysis of the Company’s fixed income securities with gross unrealized losses that are not deemed to have credit losses, categorized by the period that the securities were in a continuous loss position as of December 31, 2024. The fair value amounts reported in the table are estimates that are prepared using the process described in Note 7.
|
|
Less than 12 months |
|
|
12 months or longer |
|
|
Total |
|
|||||||||||||||
(Dollars in thousands) |
|
Fair Value |
|
|
Gross |
|
|
Fair Value |
|
|
Gross |
|
|
Fair Value |
|
|
Gross |
|
||||||
Fixed maturities: |
|
|
|
|
|
|
|
|
|
|
|
|
|
|
|
|
|
|
||||||
U.S. treasuries |
|
$ |
12,909 |
|
|
$ |
(180 |
) |
|
$ |
67,662 |
|
|
$ |
(604 |
) |
|
$ |
80,571 |
|
|
$ |
(784 |
) |
Obligations of states and political subdivisions |
|
|
— |
|
|
|
— |
|
|
|
16,335 |
|
|
|
(790 |
) |
|
|
16,335 |
|
|
|
(790 |
) |
Mortgage-backed securities |
|
|
20,832 |
|
|
|
(336 |
) |
|
|
26,802 |
|
|
|
(2,948 |
) |
|
|
47,634 |
|
|
|
(3,284 |
) |
Asset-backed securities |
|
|
7,239 |
|
|
|
(49 |
) |
|
|
46,792 |
|
|
|
(2,833 |
) |
|
|
54,031 |
|
|
|
(2,882 |
) |
Commercial mortgage-backed securities |
|
|
7,551 |
|
|
|
(242 |
) |
|
|
55,750 |
|
|
|
(2,246 |
) |
|
|
63,301 |
|
|
|
(2,488 |
) |
Corporate bonds |
|
|
14,325 |
|
|
|
(54 |
) |
|
|
95,266 |
|
|
|
(2,837 |
) |
|
|
109,591 |
|
|
|
(2,891 |
) |
Foreign corporate bonds |
|
|
17,635 |
|
|
|
(62 |
) |
|
|
46,696 |
|
|
|
(1,755 |
) |
|
|
64,331 |
|
|
|
(1,817 |
) |
Total fixed maturities |
|
$ |
80,491 |
|
|
$ |
(923 |
) |
|
$ |
355,303 |
|
|
$ |
(14,013 |
) |
|
$ |
435,794 |
|
|
$ |
(14,936 |
) |
The following table contains an analysis of the Company’s fixed income securities with gross unrealized losses that are not deemed to have credit losses, categorized by the period that the securities were in a continuous loss position as of December 31, 2023. The fair value amounts reported in the table are estimates that are prepared using the process described in Note 7.
|
|
Less than 12 months |
|
|
12 months or longer |
|
|
Total |
|
|||||||||||||||
(Dollars in thousands) |
|
Fair Value |
|
|
Gross |
|
|
Fair Value |
|
|
Gross |
|
|
Fair Value |
|
|
Gross |
|
||||||
Fixed maturities: |
|
|
|
|
|
|
|
|
|
|
|
|
|
|
|
|
|
|
||||||
U.S. treasuries |
|
$ |
55,447 |
|
|
$ |
(342 |
) |
|
$ |
239,254 |
|
|
$ |
(3,049 |
) |
|
$ |
294,701 |
|
|
$ |
(3,391 |
) |
Obligations of states and political subdivisions |
|
|
— |
|
|
|
— |
|
|
|
26,150 |
|
|
|
(1,176 |
) |
|
|
26,150 |
|
|
|
(1,176 |
) |
Mortgage-backed securities |
|
|
12,432 |
|
|
|
(406 |
) |
|
|
39,734 |
|
|
|
(4,069 |
) |
|
|
52,166 |
|
|
|
(4,475 |
) |
Asset-backed securities |
|
|
38,828 |
|
|
|
(469 |
) |
|
|
108,947 |
|
|
|
(4,622 |
) |
|
|
147,775 |
|
|
|
(5,091 |
) |
Commercial mortgage-backed securities |
|
|
13 |
|
|
|
(2 |
) |
|
|
76,467 |
|
|
|
(4,992 |
) |
|
|
76,480 |
|
|
|
(4,994 |
) |
Corporate bonds |
|
|
34,658 |
|
|
|
(264 |
) |
|
|
231,816 |
|
|
|
(6,665 |
) |
|
|
266,474 |
|
|
|
(6,929 |
) |
Foreign corporate bonds |
|
|
7,096 |
|
|
|
(13 |
) |
|
|
111,750 |
|
|
|
(3,810 |
) |
|
|
118,846 |
|
|
|
(3,823 |
) |
Total fixed maturities |
|
$ |
148,474 |
|
|
$ |
(1,496 |
) |
|
$ |
834,118 |
|
|
$ |
(28,383 |
) |
|
$ |
982,592 |
|
|
$ |
(29,879 |
) |
Subject to the risks and uncertainties in evaluating the potential impairment of a security’s value, the impairment evaluation conducted by the Company as of December 31, 2024 and 2023 concluded the unrealized losses in the tables above are non-credit losses on securities where management does not intend to sell, and it is more likely than not that the Company will not be required to sell the security before recovery. The impairment evaluation process is discussed in the “Investment” section of Note 4 (“Summary of Significant Accounting Policies”).
81
The following is a description, by asset type, of the methodology and significant inputs that the Company used to measure the amount of credit loss recognized in earnings, if any:
U.S. treasuries – As of December 31, 2024, gross unrealized losses related to U.S. treasuries were $0.784 million. To assess whether the decline in fair value below amortized cost has resulted from a credit loss or other factors, macroeconomic and market analysis is conducted in evaluating these securities. Consideration is given to the interest rate environment, duration and yield curve management of the portfolio, sector allocation and security selection. Based on the analysis performed, the Company did not recognize a credit loss on U.S. treasuries during the period.
Obligations of states and political subdivisions – As of December 31, 2024, gross unrealized losses related to obligations of states and political subdivisions were $0.790 million. To assess whether the decline in fair value below amortized cost has resulted from a credit loss or other factors, elements that may influence the performance of the municipal bond market are considered in evaluating these securities such as investor expectations, supply and demand patterns, and current versus historical yield and spread relationships. The analysis relies on the output of fixed income credit analysts, as well as dedicated municipal bond analysts who perform extensive in-house fundamental analysis on each issuer, regardless of their rating by the major agencies. Based on the analysis performed, the Company did not recognize a credit loss on obligations of states and political subdivisions during the period.
Mortgage-backed securities (“MBS”) – As of December 31, 2024, gross unrealized losses related to mortgage-backed securities were $3.284 million. To assess whether the decline in fair value below amortized cost has resulted from a credit loss or other factors, mortgage-backed securities are modeled to project principal losses under downside, base, and upside scenarios for the economy and home prices. The primary assumption that drives the security and loan level modeling is the Home Price Index (“HPI”) projection. These forecasts incorporate not just national macro-economic trends, but also regional impacts to arrive at the most granular and accurate projections. These assumptions are incorporated into the model as a basis to generate delinquency probabilities, default curves, loss severity curves, and voluntary prepayment curves at the loan level within each deal. The model utilizes HPI-adjusted current loan to value, payment history, loan terms, loan modification history, and borrower characteristics as inputs to generate expected cash flows and principal loss for each bond under various scenarios. Based on the analysis performed, the Company did not recognize a credit loss on mortgage-backed securities during the period.
Asset backed securities (“ABS”) - As of December 31, 2024, gross unrealized losses related to asset backed securities were $2.882 million. The weighted average credit enhancement for the Company’s asset backed portfolio is 38.7. This represents the percentage of pool losses that can occur before an asset backed security will incur its first dollar of principal losses. To assess whether the decline in fair value below amortized cost has resulted from a credit loss or other factors, every ABS transaction is analyzed on a stand-alone basis. This analysis involves a thorough review of the collateral, prepayment, and structural risk in each transaction. Additionally, the analysis includes an in-depth credit analysis of the originator and servicer of the collateral. The analysis projects an expected loss for a deal given a set of assumptions specific to the asset type. These assumptions are used to calculate at what level of losses the deal will incur its first dollar of principal loss. The major assumptions used to calculate this ratio are loss severities, recovery lags, and no advances on principal and interest. Based on the analysis performed, the Company did not recognize a credit loss on asset backed securities during the period.
Commercial mortgage-backed securities (“CMBS”) - As of December 31, 2024, gross unrealized losses related to the CMBS portfolio were $2.488 million. The weighted average credit enhancement for the Company’s CMBS portfolio is 45.4. This represents the percentage of pool losses that can occur before a commercial mortgage-backed security will incur its first dollar of principal loss. To assess whether the decline in fair value below amortized cost has resulted from a credit loss or other factors, a loan level analysis is utilized where every underlying CMBS loan is re-underwritten based on a set of assumptions reflecting expectations for the future path of the economy. Each loan is analyzed over time using a series of tests to determine if a credit event will occur during the life of the loan. Inherent in this process are several economic scenarios and their corresponding rent/vacancy and capital market states. The five primary credit events that frame the analysis include loan modifications, term default, balloon default, extension, and ability to pay off the balloon. The resulting output is the expected loss adjusted cash flows for each bond under the base case and distressed scenarios. Based on the analysis performed, the Company did not recognize a credit loss on commercial mortgage-backed securities during the period.
Corporate bonds - As of December 31, 2024, gross unrealized losses related to corporate bonds were $2.891 million. To assess whether the decline in fair value below amortized cost has resulted from a credit loss or other factors, analysis for this asset class includes maintaining detailed financial models that include a projection of each issuer’s future financial performance, including prospective debt servicing capabilities, capital structure composition, and the value of the collateral. The analysis incorporates the macroeconomic environment, industry conditions in which the issuer operates, the issuer’s current competitive position, its vulnerability to changes in the competitive and regulatory environment, issuer liquidity, issuer commitment to bondholders, issuer creditworthiness, and asset protection. Part of the process also includes running downside scenarios to evaluate the expected likelihood of default as well as potential losses in the event of default. Based on the analysis performed, the Company did not recognize a credit loss on corporate bonds during the period.
82
Foreign bonds – As of December 31, 2024, gross unrealized losses related to foreign bonds were $1.817 million. To assess whether the decline in fair value below amortized cost has resulted from a credit loss or other factors, detailed financial models are maintained that include a projection of each issuer’s future financial performance, including prospective debt servicing capabilities, capital structure composition, and the value of the collateral. The analysis incorporates the macroeconomic environment, industry conditions in which the issuer operates, the issuer’s current competitive position, its vulnerability to changes in the competitive and regulatory environment, issuer liquidity, issuer commitment to bondholders, issuer creditworthiness, and asset protection. Part of the process also includes running downside scenarios to evaluate the expected likelihood of default as well as potential losses in the event of default. Based on the analysis performed, the Company did not recognize a credit loss on foreign bonds during the period.
The Company has evaluated its investment portfolio and has determined that an allowance for expected credit losses on its investments is not required.
The Company recorded the following impairments on its investment portfolio for the years ended December 31, 2024, 2023, and 2022 and are related to securities in an unrealized loss position where the Company had an intent to sell the securities:
|
|
Years Ended December 31, |
|
|||||||||
(Dollars in thousands) |
|
2024 |
|
|
2023 |
|
|
2022 (1) |
|
|||
Fixed maturities: |
|
|
|
|
|
|
|
|
|
|||
Impairment related to intent to sell |
|
$ |
— |
|
|
$ |
— |
|
|
$ |
(26,205 |
) |
Total |
|
$ |
— |
|
|
$ |
— |
|
|
$ |
(26,205 |
) |
(1) In response to a rising interest rate environment, the Company took action early in April 2022 to shorten the duration of its fixed maturities portfolio. In connection with these actions, the Company identified fixed maturities securities with a weighted average life of five years or greater as having an intent to sell resulting in other-than-temporary impairment losses. The majority of which were sold in the second quarter of 2022. Since April 2022, the Company has been investing in securities with much shorter durations. As a result of these actions, the Company's book yield rose over time. Book yield was approximately 2.2% at December 31, 2021 and 4.4% at December 31, 2024.
Accumulated Other Comprehensive Income (Loss), Net of Tax
Accumulated other comprehensive income (loss), net of tax, as of December 31, 2024 and 2023 was as follows:
|
|
December 31, |
|
|||||
(Dollars in thousands) |
|
2024 |
|
|
2023 |
|
||
Net unrealized gains (losses) from: |
|
|
|
|
|
|
||
Fixed maturities |
|
$ |
(12,731 |
) |
|
$ |
(28,299 |
) |
Foreign currency fluctuations |
|
|
(259 |
) |
|
|
(187 |
) |
Deferred taxes |
|
|
2,580 |
|
|
|
5,623 |
|
Accumulated other comprehensive income (loss), net of tax |
|
$ |
(10,410 |
) |
|
$ |
(22,863 |
) |
The following tables present the changes in accumulated other comprehensive income (loss) by components, for the years ended December 31, 2024 and 2023:
Year Ended December 31, 2024 |
|
Unrealized Gains |
|
|
Foreign Currency |
|
|
Accumulated Other |
|
|||
Beginning balance, net of tax |
|
$ |
(22,715 |
) |
|
$ |
(148 |
) |
|
$ |
(22,863 |
) |
Other comprehensive income (loss) before reclassification, before tax |
|
|
14,712 |
|
|
|
(72 |
) |
|
|
14,640 |
|
Amounts reclassified from accumulated other comprehensive income, before tax |
|
|
856 |
|
|
|
— |
|
|
|
856 |
|
Other comprehensive income (loss), before tax |
|
|
15,568 |
|
|
|
(72 |
) |
|
|
15,496 |
|
Income tax benefit (expense) |
|
|
(3,058 |
) |
|
|
15 |
|
|
|
(3,043 |
) |
Ending balance, net of tax |
|
$ |
(10,205 |
) |
|
$ |
(205 |
) |
|
$ |
(10,410 |
) |
83
Year Ended December 31, 2023 |
|
Unrealized Gains |
|
|
Foreign Currency |
|
|
Accumulated Other |
|
|||
Beginning balance, net of tax |
|
$ |
(42,958 |
) |
|
$ |
(100 |
) |
|
$ |
(43,058 |
) |
Other comprehensive income (loss) before reclassification, before tax |
|
|
23,572 |
|
|
|
(60 |
) |
|
|
23,512 |
|
Amounts reclassified from accumulated other comprehensive income, before tax |
|
|
1,654 |
|
|
|
— |
|
|
|
1,654 |
|
Other comprehensive income (loss), before tax |
|
|
25,226 |
|
|
|
(60 |
) |
|
|
25,166 |
|
Income tax benefit (expense) |
|
|
(4,983 |
) |
|
|
12 |
|
|
|
(4,971 |
) |
Ending balance, net of tax |
|
$ |
(22,715 |
) |
|
$ |
(148 |
) |
|
$ |
(22,863 |
) |
The reclassifications out of accumulated other comprehensive income (loss) for the years ended December 31, 2024 and 2023 were as follows:
(Dollars in thousands) |
|
|
|
Amounts Reclassified from |
|
|||||
|
|
|
|
Years Ended December 31, |
|
|||||
Details about Accumulated Other |
|
Affected Line Item in the Consolidated Statements of Operations |
|
2024 |
|
|
2023 |
|
||
Unrealized gains and losses on available for sale securities |
|
Other net realized investment (gains) losses |
|
$ |
856 |
|
|
$ |
1,654 |
|
|
|
Other than temporary impairment losses on investments |
|
|
— |
|
|
|
— |
|
|
|
Total before tax |
|
$ |
856 |
|
|
$ |
1,654 |
|
|
|
Income tax expense (benefit) |
|
|
(173 |
) |
|
|
(304 |
) |
|
|
Total reclassifications, net of tax |
|
$ |
683 |
|
|
$ |
1,350 |
|
Net Realized Investment Gains (Losses)
The components of net realized investment gains (losses) for the years ended December 31, 2024, 2023, and 2022 were as follows:
|
|
Years Ended December 31, |
|
|||||||||
(Dollars in thousands) |
|
2024 |
|
|
2023 |
|
|
2022 |
|
|||
Fixed maturities: |
|
|
|
|
|
|
|
|
|
|||
Gross realized gains |
|
$ |
54 |
|
|
$ |
49 |
|
|
$ |
688 |
|
Gross realized losses |
|
|
(910 |
) |
|
|
(1,703 |
) |
|
|
(40,298 |
) |
Net realized gains (losses) |
|
|
(856 |
) |
|
|
(1,654 |
) |
|
|
(39,610 |
) |
Equity securities: |
|
|
|
|
|
|
|
|
|
|||
Gross realized gains |
|
|
1,325 |
|
|
|
1,061 |
|
|
|
2,289 |
|
Gross realized losses |
|
|
(14 |
) |
|
|
(1,514 |
) |
|
|
(5,681 |
) |
Net realized gains (losses) |
|
|
1,311 |
|
|
|
(453 |
) |
|
|
(3,392 |
) |
Derivatives: |
|
|
|
|
|
|
|
|
|
|||
Gross realized gains |
|
|
— |
|
|
|
— |
|
|
|
12,844 |
|
Gross realized losses |
|
|
— |
|
|
|
— |
|
|
|
(2,771 |
) |
Net realized gains (losses) (1) |
|
|
— |
|
|
|
— |
|
|
|
10,073 |
|
Total net realized investment gains (losses) |
|
$ |
455 |
|
|
$ |
(2,107 |
) |
|
$ |
(32,929 |
) |
The following table shows the calculation of the portion of realized gains and losses related to equity securities held as of December 31, 2024, 2023, and 2022:
|
|
Years Ended December 31, |
|
|||||||||
(Dollars in thousands) |
|
2024 |
|
|
2023 |
|
|
2022 |
|
|||
Net gains (losses) recognized during the period on equity securities |
|
$ |
1,311 |
|
|
$ |
(453 |
) |
|
$ |
(3,392 |
) |
Less: net gains (losses) recognized during the period on equity securities sold during the period |
|
|
(423 |
) |
|
|
(36 |
) |
|
|
10,577 |
|
Unrealized gains (losses) recognized during the reporting period on equity securities still held |
|
$ |
1,734 |
|
|
$ |
(417 |
) |
|
$ |
(13,969 |
) |
84
The proceeds from sales and redemptions of available for sale and equity securities resulting in net realized investment gains (losses) for the years ended December 31, 2024, 2023, and 2022 were as follows:
|
|
Years Ended December 31, |
|
|||||||||
(Dollars in thousands) |
|
2024 |
|
|
2023 |
|
|
2022 |
|
|||
Fixed maturities |
|
$ |
112,507 |
|
|
$ |
148,164 |
|
|
$ |
933,554 |
|
Equity securities |
|
|
— |
|
|
|
1,158 |
|
|
|
88,726 |
|
Net Investment Income
The sources of net investment income for the years ended December 31, 2024, 2023, and 2022 were as follows:
|
|
Years Ended December 31, |
|
|||||||||
(Dollars in thousands) |
|
2024 |
|
|
2023 |
|
|
2022 |
|
|||
Fixed maturities |
|
$ |
58,675 |
|
|
$ |
49,987 |
|
|
$ |
33,852 |
|
Equity securities |
|
|
784 |
|
|
|
917 |
|
|
|
1,100 |
|
Cash and cash equivalents |
|
|
2,838 |
|
|
|
1,593 |
|
|
|
790 |
|
Other invested assets |
|
|
2,141 |
|
|
|
4,463 |
|
|
|
(5,966 |
) |
Total investment income |
|
|
64,438 |
|
|
|
56,960 |
|
|
|
29,776 |
|
Investment expense |
|
|
(2,063 |
) |
|
|
(1,516 |
) |
|
|
(2,149 |
) |
Net investment income |
|
$ |
62,375 |
|
|
$ |
55,444 |
|
|
$ |
27,627 |
|
As of December 31, 2024 and 2023, the Company did not own any fixed maturity securities that were non-income producing for the preceding twelve months.
The Company’s total investment return on a pre-tax basis for the years ended December 31, 2024, 2023, and 2022 were as follows:
|
|
Years Ended December 31, |
|
|||||||||
(Dollars in thousands) |
|
2024 |
|
|
2023 |
|
|
2022 |
|
|||
Net investment income |
|
$ |
62,375 |
|
|
$ |
55,444 |
|
|
$ |
27,627 |
|
Net realized investment gains (losses) |
|
|
455 |
|
|
|
(2,107 |
) |
|
|
(32,929 |
) |
Change in unrealized holding gains (losses) |
|
|
15,496 |
|
|
|
25,166 |
|
|
|
(61,627 |
) |
Net realized and unrealized investment returns |
|
|
15,951 |
|
|
|
23,059 |
|
|
|
(94,556 |
) |
Total investment return |
|
$ |
78,326 |
|
|
$ |
78,503 |
|
|
$ |
(66,929 |
) |
Total investment return % |
|
|
5.5 |
% |
|
|
5.7 |
% |
|
|
(4.7 |
%) |
Average investment portfolio (1) |
|
$ |
1,415,549 |
|
|
$ |
1,366,553 |
|
|
$ |
1,437,327 |
|
Insurance Enhanced Asset-Backed and Credit Securities
As of December 31, 2024, the Company held insurance enhanced municipal bonds with a market value of approximately $1.7 million, which represented 0.1% of the Company’s total cash and invested assets, net of payable/receivable for securities. The financial guarantors of the Company’s $1.7 million municipal bonds include Assured Guaranty Corporation ($0.8 million) and Ambac Financial Group ($0.9 million).
The Company had no direct investments in the entities that have provided financial guarantees or other credit support to any security held by the Company at December 31, 2024.
85
Bonds Held on Deposit
Certain cash and cash equivalents and bonds available for sale were deposited with various governmental authorities in accordance with statutory requirements, were held as collateral, or were held in trust. The fair values were as follows as of December 31, 2024 and 2023:
|
|
Estimated Fair Value |
|
|||||
(Dollars in thousands) |
|
December 31, 2024 |
|
|
December 31, 2023 |
|
||
On deposit with governmental authorities |
|
$ |
19,378 |
|
|
$ |
19,262 |
|
Held in trust pursuant to third-party requirements |
|
|
158,964 |
|
|
|
150,796 |
|
Total (1) |
|
$ |
178,342 |
|
|
$ |
170,058 |
|
Variable Interest Entities
A Variable Interest Entity (“VIE”) refers to an investment in which an investor holds a controlling interest that is not based on the majority of voting rights. Under the VIE model, the party that has the power to exercise significant management influence and maintain a controlling financial interest in the entity’s economics is said to be the primary beneficiary, and is required to consolidate the entity within their results. Other entities that participate in a VIE, for which their financial interests fluctuate with changes in the fair value of the investment entity’s net assets but do not have significant management influence and the ability to direct the VIE’s significant economic activities are said to have a variable interest in the VIE but do not consolidate the VIE in their financial results.
The Company has interests in three limited partnership investments with a carrying value approximating fair value of $29.4 million and $38.2 million as of December 31, 2024 and 2023, respectively. The Company has a variable interest in two of these limited partnership investments for which it is not the primary beneficiary. These investments are accounted for under the equity method since its ownership interest exceeds 3%.
The carrying value of one of the Company’s VIE’s, which invests in distressed securities and assets, was $2.6 million and $4.0 million as of December 31, 2024 and 2023, respectively. The Company’s maximum exposure to loss from this VIE, which factors in future funding commitments of $14.2 million, was $16.8 million and $18.3 million as of December 31, 2024 and 2023, respectively. Since the investment period has concluded, the Company does not expect any capital calls will be made prospectively. The carrying value and maximum exposure to loss of a second VIE that invests in Real Estate Investment Trust (“REIT”) qualifying assets was $8.9 million and $8.2 million as of December 31, 2024 and 2023, respectively. The Company’s investment in VIEs is included in other invested assets on the consolidated balance sheets with changes in carrying value recorded in the consolidated statements of operations.
Derivatives were used by the Company to reduce risks from changes in interest rates. The Company used interest rate swaps with terms to exchange, at specified intervals, the difference between fixed rate and floating rate interest amounts as calculated by reference to an agreed notional amount.
The Company terminated its outstanding interest rate swaps in the fourth quarter of 2022. There are no outstanding amounts related to the interest rate swap agreements on the consolidated balance sheets as of December 31, 2024 or 2023. The Company recorded net realized investment gains related to the interest rate swaps of $10.1 million for the year ended December 31, 2022. There were no realized investment gains or losses related to interest rate swaps for the years ended December 31, 2024 and 2023.
The accounting standards related to fair value measurements define fair value, establish a framework for measuring fair value, outline a fair value hierarchy based on inputs used to measure fair value, and enhance disclosure requirements for fair value measurements. These standards do not change existing guidance as to whether or not an instrument is carried at fair value. The Company has determined that its fair value measurements are in accordance with the requirements of these accounting standards.
The Company’s invested assets are carried at their fair value and are categorized based upon a fair value hierarchy:
86
In certain cases, the inputs used to measure fair value may fall into different levels of the fair value hierarchy. In such cases, the level in the fair value hierarchy within which the fair value measurement falls has been determined based on the lowest level input that is significant to the fair value measurement in its entirety. The Company’s assessment of the significance of a particular input to the fair value measurement in its entirety requires judgment, and considers factors specific to the asset.
The following table presents information about the Company’s invested assets measured at fair value on a recurring basis as of December 31, 2024 and 2023 and indicates the fair value hierarchy of the valuation techniques utilized by the Company to determine such fair value.
As of December 31, 2024 |
|
Fair Value Measurements |
|
|||||||||||||
(Dollars in thousands) |
|
Level 1 |
|
|
Level 2 |
|
|
Level 3 |
|
|
Total |
|
||||
Assets: |
|
|
|
|
|
|
|
|
|
|
|
|
||||
Fixed maturities: |
|
|
|
|
|
|
|
|
|
|
|
|
||||
U.S. treasuries |
|
$ |
875,246 |
|
|
$ |
— |
|
|
$ |
— |
|
|
$ |
875,246 |
|
Obligations of states and political subdivisions |
|
|
— |
|
|
|
16,335 |
|
|
|
— |
|
|
|
16,335 |
|
Mortgage-backed securities |
|
|
— |
|
|
|
58,920 |
|
|
|
— |
|
|
|
58,920 |
|
Commercial mortgage-backed securities |
|
|
— |
|
|
|
65,568 |
|
|
|
— |
|
|
|
65,568 |
|
Asset-backed securities |
|
|
— |
|
|
|
135,427 |
|
|
|
— |
|
|
|
135,427 |
|
Corporate bonds |
|
|
— |
|
|
|
156,096 |
|
|
|
— |
|
|
|
156,096 |
|
Foreign corporate bonds |
|
|
— |
|
|
|
74,316 |
|
|
|
— |
|
|
|
74,316 |
|
Total fixed maturities |
|
|
875,246 |
|
|
|
506,662 |
|
|
|
— |
|
|
|
1,381,908 |
|
Equity securities |
|
|
— |
|
|
|
12,284 |
|
|
|
— |
|
|
|
12,284 |
|
Total assets measured at fair value |
|
$ |
875,246 |
|
|
$ |
518,946 |
|
|
$ |
— |
|
|
$ |
1,394,192 |
|
As of December 31, 2023 |
|
Fair Value Measurements |
|
|||||||||||||
(Dollars in thousands) |
|
Level 1 |
|
|
Level 2 |
|
|
Level 3 |
|
|
Total |
|
||||
Assets: |
|
|
|
|
|
|
|
|
|
|
|
|
||||
Fixed maturities: |
|
|
|
|
|
|
|
|
|
|
|
|
||||
U.S. treasuries |
|
$ |
494,223 |
|
|
$ |
— |
|
|
$ |
— |
|
|
$ |
494,223 |
|
Obligations of states and political subdivisions |
|
|
— |
|
|
|
26,150 |
|
|
|
— |
|
|
|
26,150 |
|
Mortgage-backed securities |
|
|
— |
|
|
|
58,927 |
|
|
|
— |
|
|
|
58,927 |
|
Commercial mortgage-backed securities |
|
|
— |
|
|
|
79,080 |
|
|
|
— |
|
|
|
79,080 |
|
Asset-backed securities |
|
|
— |
|
|
|
202,952 |
|
|
|
— |
|
|
|
202,952 |
|
Corporate bonds |
|
|
— |
|
|
|
291,713 |
|
|
|
— |
|
|
|
291,713 |
|
Foreign corporate bonds |
|
|
— |
|
|
|
140,748 |
|
|
|
— |
|
|
|
140,748 |
|
Total fixed maturities |
|
|
494,223 |
|
|
|
799,570 |
|
|
|
— |
|
|
|
1,293,793 |
|
Equity securities |
|
|
— |
|
|
|
16,508 |
|
|
|
— |
|
|
|
16,508 |
|
Total assets measured at fair value |
|
$ |
494,223 |
|
|
$ |
816,078 |
|
|
$ |
— |
|
|
$ |
1,310,301 |
|
The securities classified as Level 1 in the above tables consist of U.S. treasuries actively traded on an exchange.
The securities classified as Level 2 in the above tables consist primarily of fixed maturities and preferred stocks. Based on the typical trading volumes and the lack of quoted market prices for fixed maturities and preferred stocks, security prices are derived through recent reported trades for identical or similar securities making adjustments through the reporting date based upon available market observable information. If there are no recent reported trades, matrix or model processes are used to develop a security price where future cash flow expectations are developed based upon collateral performance and discounted at an estimated market rate. Included in the pricing of asset-backed securities, collateralized mortgage obligations, and mortgage-backed securities are estimates of the rate of future prepayments of principal over the remaining life of the securities. Such estimates are derived based on the characteristics of the underlying structure and prepayment speeds previously experienced at the interest rate levels projected for the underlying collateral.
87
The following table presents changes in Level 3 investments measured at fair value on a recurring basis for the years ended December 31, 2024, 2023, and 2022:
|
|
Years Ended December 31, |
|
|||||||||
(Dollars in thousands) |
|
2024 |
|
|
2023 |
|
|
2022 |
|
|||
Beginning balance |
|
$ |
— |
|
|
$ |
4,571 |
|
|
$ |
2,769 |
|
Total gains / (losses) (realized / unrealized): |
|
|
|
|
|
|
|
|
|
|||
Included in accumulated other comprehensive income (loss) |
|
|
— |
|
|
|
30 |
|
|
|
(21 |
) |
Included in earnings attributable to realized gains / losses |
|
|
— |
|
|
|
(290 |
) |
|
|
(61 |
) |
Transfers into level 3 |
|
|
— |
|
|
|
— |
|
|
|
857 |
|
Transfers out of level 3 |
|
|
— |
|
|
|
— |
|
|
|
— |
|
Amortization of bond premium and discount, net |
|
|
— |
|
|
|
5 |
|
|
|
6 |
|
Purchases |
|
|
— |
|
|
|
332 |
|
|
|
2,304 |
|
Sales |
|
|
— |
|
|
|
(4,648 |
) |
|
|
(1,283 |
) |
Ending balance |
|
|
— |
|
|
|
— |
|
|
|
4,571 |
|
Gains (losses) included in earnings attributable to the change in unrealized gains (losses) related to assets still held at end of reporting period |
|
$ |
— |
|
|
$ |
(155 |
) |
|
$ |
95 |
|
Fair Value of Alternative Investments
Other invested assets consist of limited partnerships whose carrying value approximates fair value.
The following table provides the fair value and future funding commitments related to these investments at December 31, 2024 and 2023.
|
|
December 31, 2024 |
|
|
December 31, 2023 |
|
||||||||||
(Dollars in thousands) |
|
Fair Value |
|
|
Future Funding |
|
|
Fair Value |
|
|
Future Funding |
|
||||
European Non-Performing Loan Fund, LP (1) |
|
$ |
2,628 |
|
|
$ |
14,214 |
|
|
$ |
4,048 |
|
|
$ |
14,214 |
|
Mortgage Debt Fund, LP (2) |
|
|
8,882 |
|
|
|
— |
|
|
|
8,172 |
|
|
|
— |
|
Global Debt Fund, LP (3) |
|
|
17,903 |
|
|
|
— |
|
|
|
26,016 |
|
|
|
— |
|
Total |
|
$ |
29,413 |
|
|
$ |
14,214 |
|
|
$ |
38,236 |
|
|
$ |
14,214 |
|
Limited Liability Companies and Limited Partnerships with ownership interest exceeding 3%
The Company uses the equity method to account for investments in limited liability companies and limited partnerships where its ownership interest exceeds 3%. The equity method of accounting for an investment in limited liability companies and limited partnerships requires that its cost basis be updated to account for the income or loss earned on the investment. In the Fair Value of Alternative Investments table above, all of the investments are booked on a one quarter lag due to non-availability of data at the time the financial statements are prepared. The investment income (loss) associated with the limited liability companies and limited partnerships whose ownership interest exceeds 3% is reflected in the consolidated statements of operations in the amounts of $0.6 million, $0.8 million, and ($5.0) million for the years ended December 31, 2024, 2023, and 2022, respectively.
Pricing
The Company’s pricing vendors provide prices for all investment categories except for investments in limited liability companies and limited partnerships. Two primary vendors are utilized to provide prices for equity and fixed maturity securities.
88
The following is a description of the valuation methodologies used by the Company’s pricing vendors for investment securities carried at fair value:
The Company performs certain procedures to validate whether the pricing information received from the pricing vendors is reasonable, to ensure that the fair value determination is consistent with accounting guidance, and to ensure that its assets are properly classified in the fair value hierarchy. The Company’s procedures include, but are not limited to:
During 2024 and 2023, the Company has not adjusted quotes or prices obtained from the pricing vendors.
Goodwill
As a result of an acquisition in 2010, the Company has goodwill within the Penn-America segment of $4.8 million at December 31, 2024 and 2023. The goodwill represents the excess purchase price over the Company’s best estimate of the fair value of the assets acquired. There were no changes in the carrying value of Penn-America's goodwill during 2024 and 2023 and there were no accumulated impairment losses at December 31, 2024 and 2023. Impairment testing performed in 2024, 2023, and 2022 did not result in an impairment of goodwill within the Penn-America segment.
As a result of an acquisition in 2015, the Company had goodwill of $1.7 million within the Non-Core Operations segment. Of this amount, $0.6 million was allocated to its Farm, Ranch & Stable business and $1.1 million was allocated to its specialty property business. The goodwill allocated to the specialty business of $1.1 million was impaired in 2021 due to the sale of the renewal rights related to the manufactured and dwelling homes business. The remaining goodwill of $0.6 million was impaired due to the sale of the Farm, Ranch & Stable renewal rights resulting in an impairment loss of $0.6 million which was included in corporate and other operating expenses on the Company’s consolidated statements of operations for the year ended December 31, 2022. There was no goodwill within the Non-Core Operations segment at December 31, 2024 and 2023.
Please see Note 2 of this report for additional information on the sale of the renewal rights related to the Company’s Farm, Ranch & Stable business and Note 2 of the notes to the consolidated financial statements in Item 8 Part II of the Company’s 2023 Annual Report on Form 10-K for more information on the sale of renewal rights related to the Company's manufactured and dwelling homes business.
89
Intangible assets
The following table presents details of the Company’s intangible assets as of December 31, 2024:
(Dollars in thousands) |
|
Weighted Average Amortization Period |
|
Cost |
|
|
Accumulated |
|
|
Impairment |
|
|
Net Value |
|
||||
Trademarks |
|
Indefinite |
|
$ |
4,800 |
|
|
$ |
— |
|
|
$ |
— |
|
|
$ |
4,800 |
|
Tradenames |
|
Indefinite |
|
|
4,200 |
|
|
|
— |
|
|
|
— |
|
|
|
4,200 |
|
State insurance licenses |
|
Indefinite |
|
|
5,000 |
|
|
|
— |
|
|
|
— |
|
|
|
5,000 |
|
Customer relationships |
|
15 years |
|
|
5,300 |
|
|
|
5,197 |
|
|
|
— |
|
|
|
103 |
|
|
|
|
|
$ |
19,300 |
|
|
$ |
5,197 |
|
|
$ |
— |
|
|
$ |
14,103 |
|
The following table presents details of the Company’s intangible assets as of December 31, 2023:
(Dollars in thousands) |
|
Weighted Average Amortization Period |
|
Cost |
|
|
Accumulated |
|
|
Impairment |
|
|
Net Value |
|
||||
Trademarks |
|
Indefinite |
|
$ |
4,800 |
|
|
$ |
— |
|
|
$ |
— |
|
|
$ |
4,800 |
|
Tradenames |
|
Indefinite |
|
|
4,200 |
|
|
|
— |
|
|
|
— |
|
|
|
4,200 |
|
State insurance licenses |
|
Indefinite |
|
|
5,000 |
|
|
|
— |
|
|
|
— |
|
|
|
5,000 |
|
Customer relationships |
|
15 years |
|
|
5,300 |
|
|
|
4,844 |
|
|
|
— |
|
|
|
456 |
|
|
|
|
|
$ |
19,300 |
|
|
$ |
4,844 |
|
|
$ |
— |
|
|
$ |
14,456 |
|
Amortization related to the Company’s definite lived intangible assets was $0.4 million for each of the years ended December 31, 2024, 2023, and 2022. The weighted average amortization period for total definite lived intangible assets was 15.0 years at both December 31, 2024 and 2023.
The Company expects that amortization expense for the next five years will be as follows:
(Dollars in thousands) |
|
|
|
|
2025 |
|
$ |
103 |
|
2026 |
|
|
— |
|
2027 |
|
|
— |
|
2028 |
|
|
— |
|
2029 |
|
|
— |
|
Intangible assets with indefinite lives
As of both December 31, 2024 and 2023, indefinite lived intangible assets, which are comprised of tradenames, trademarks, and state insurance licenses, was $14.0 million.
State licenses with a net value of $5.0 million, within the Company’s Non-Core Operations segment, were impaired due to the sale of the renewal rights related to the Company’s Farm, Ranch & Stable business. This impairment loss of $5.0 million was included in corporate and other operating expenses on the Company’s consolidated statements of operations for the year ended December 31, 2022. Please see Note 2 for additional information on the sale of the renewal rights related to the Company’s Farm, Ranch & Stable business.
There was no impairment of intangible assets with indefinite lives in 2024 and 2023.
Intangible assets with definite lives
As of December 31, 2024 and 2023, definite lived intangible assets, net of accumulated amortization, were $0.1 million and $0.5 million, respectively, and were comprised of customer relationships.
Agent relationships with a net value of $0.1 million were impaired due to the sale of the renewal rights related to the Company's Farm, Ranch & Stable business. This impairment was within the Company’s Non-Core Operations segment. This impairment loss of $0.1 million was included in corporate and other operating expenses on the Company’s consolidated statements of operations for the year ended December 31, 2022. Please see Note 2 for additional information on the sale of the renewal rights related to the Company’s Farm, Ranch & Stable business.
There was no impairment of intangible assets with definite lives in 2024 and 2023.
90
For premium receivables, the allowance is based upon the Company’s ongoing review of key aspects of amounts outstanding, including but not limited to, length of collection periods, direct placement with collection agencies, solvency of insured, agents, or reinsurers on assumed reinsurance, terminated agents, and other relevant factors.
The following table is an analysis of the allowance for expected credit losses related to the Company's premium receivables for the years ended December 31, 2024 and 2023:
|
|
Years Ended December 31, |
|
|||||
(Dollars in thousands) |
|
2024 |
|
|
2023 |
|
||
Beginning balance |
|
$ |
4,796 |
|
|
$ |
3,322 |
|
Current period provision for expected credit losses |
|
|
(609 |
) |
|
|
1,636 |
|
Write-offs |
|
|
(657 |
) |
|
|
(162 |
) |
Ending balance |
|
$ |
3,530 |
|
|
$ |
4,796 |
|
For reinsurance receivables, the allowance is based upon the Company’s ongoing review of key aspects of amounts outstanding, including but not limited to, length of collection periods, disputes, applicable coverage defenses, insolvent reinsurers, financial strength of solvent reinsurers based on AM Best Ratings and other relevant factors.
The allowance for expected credit losses related to the Company's reinsurance receivables was $9.0 million at December 31, 2024 and 2023.
The Company cedes risk to unrelated reinsurers on a pro rata (“quota share”) and excess of loss basis in the ordinary course of business to limit its net loss exposure on direct business insurance contracts. Reinsurance ceded arrangements do not discharge the Company of primary liability. Moreover, reinsurers may fail to pay the Company due to a lack of reinsurer liquidity, perceived improper underwriting, and losses for risks that are excluded from reinsurance coverage and other similar factors, all of which could adversely affect the Company’s financial results.
The Company had the following reinsurance balances as of December 31, 2024 and 2023:
(Dollars in thousands) |
|
December 31, 2024 |
|
|
December 31, 2023 |
|
||
Reinsurance receivables, net |
|
$ |
66,855 |
|
|
$ |
80,439 |
|
Collateral securing reinsurance receivables |
|
|
(6,461 |
) |
|
|
(8,752 |
) |
Reinsurance receivables, net of collateral |
|
$ |
60,394 |
|
|
$ |
71,687 |
|
Allowance for expected credit losses |
|
$ |
8,992 |
|
|
$ |
8,992 |
|
Prepaid reinsurance premiums |
|
|
3,320 |
|
|
|
4,958 |
|
As of December 31, 2024, the Company had the following aggregated unsecured reinsurance receivables from one reinsurer that exceeded 3% of shareholders’ equity. Unsecured reinsurance receivables include amounts receivable for paid and unpaid losses and loss adjustment expenses, less amounts secured by collateral.
(Dollars in thousands) |
|
Reinsurance Receivables |
|
|
AM Best Ratings |
|
Munich Re America Corporation |
|
$ |
35,826 |
|
|
A+ |
91
The effect of reinsurance on premiums written and earned is as follows:
(Dollars in thousands) |
|
Written |
|
|
Earned |
|
||
For the year ended December 31, 2024: |
|
|
|
|
|
|
||
Direct |
|
$ |
369,818 |
|
|
$ |
354,747 |
|
Assumed |
|
|
19,940 |
|
|
|
34,451 |
|
Ceded |
|
|
(10,568 |
) |
|
|
(12,206 |
) |
Net premiums |
|
$ |
379,190 |
|
|
$ |
376,992 |
|
For the year ended December 31, 2023: |
|
|
|
|
|
|
||
Direct |
|
$ |
350,748 |
|
|
$ |
376,288 |
|
Assumed |
|
|
65,649 |
|
|
|
126,611 |
|
Ceded |
|
|
(17,078 |
) |
|
|
(29,542 |
) |
Net premiums |
|
$ |
399,319 |
|
|
$ |
473,357 |
|
For the year ended December 31, 2022: |
|
|
|
|
|
|
||
Direct |
|
$ |
573,412 |
|
|
$ |
589,131 |
|
Assumed |
|
|
154,191 |
|
|
|
135,896 |
|
Ceded |
|
|
(136,272 |
) |
|
|
(122,556 |
) |
Net premiums |
|
$ |
591,331 |
|
|
$ |
602,471 |
|
Ceded losses and loss adjustment expenses incurred were ($6.3) million, $27.6 million, and $48.7 million for the years ended December 31, 2024, 2023, and 2022, respectively.
Global Indemnity Group, LLC is a publicly traded partnership for U.S. federal income tax purposes and meets the qualifying income exception to maintain partnership status. As a publicly traded partnership, Global Indemnity Group, LLC is generally not subject to federal income tax and most state income taxes. However, income earned by the subsidiaries of Global Indemnity Group, LLC is subject to corporate tax in the United States and certain foreign jurisdictions.
As of December 31, 2024, the Company conducts business in the United States where the statutory income tax rate is 21% and conducts certain functions in Ireland where the statutory income tax rate is 25% on non-trading income, 33% on capital gains and 12.5% on trading income. The statutory income tax rate of each country is applied against the expected annual taxable income of the Company in each country to estimate the annual income tax expense.
The Company's income before income taxes is derived from its U.S. subsidiaries for the years ended December 31, 2024, 2023, and 2022.
The following table summarizes the components of income tax expense:
|
|
Years Ended December 31, |
|
|||||||||
(Dollars in thousands) |
|
2024 |
|
|
2023 |
|
|
2022 |
|
|||
Current income tax expense: |
|
|
|
|
|
|
|
|
|
|||
Foreign |
|
$ |
41 |
|
|
$ |
14 |
|
|
$ |
4 |
|
U.S. Federal |
|
|
374 |
|
|
|
2,207 |
|
|
|
422 |
|
Total current income tax expense |
|
|
415 |
|
|
|
2,221 |
|
|
|
426 |
|
Deferred income tax expense: |
|
|
|
|
|
|
|
|
|
|||
U.S. Federal |
|
|
11,300 |
|
|
|
5,326 |
|
|
|
2,395 |
|
Total deferred income tax expense |
|
|
11,300 |
|
|
|
5,326 |
|
|
|
2,395 |
|
Total income tax expense |
|
$ |
11,715 |
|
|
$ |
7,547 |
|
|
$ |
2,821 |
|
The tax provision has been calculated using income before income taxes in each jurisdiction multiplied by that jurisdiction’s applicable statutory tax rate.
92
The following table summarizes the differences between the actual income tax expense and differences from the income tax calculated at the statutory U.S. federal tax rate:
|
|
Years Ended December 31, |
|
|||||||||||||||||||||
|
|
2024 |
|
|
2023 |
|
|
2022 |
|
|||||||||||||||
(Dollars in thousands) |
|
Amount |
|
|
% of Pre- |
|
|
Amount |
|
|
% of Pre- |
|
|
Amount |
|
|
% of Pre- |
|
||||||
U.S. federal income tax at statutory rate |
|
$ |
11,541 |
|
|
|
21.0 |
% |
|
$ |
6,925 |
|
|
|
21.0 |
% |
|
$ |
414 |
|
|
|
21.0 |
% |
Adjustments: |
|
|
|
|
|
|
|
|
|
|
|
|
|
|
|
|
|
|
||||||
Non-deductible executive compensation |
|
|
420 |
|
|
|
0.7 |
|
|
|
1,753 |
|
|
|
5.3 |
|
|
|
— |
|
|
|
— |
|
Dividend exclusion |
|
|
(61 |
) |
|
|
(0.1 |
) |
|
|
(76 |
) |
|
|
(0.2 |
) |
|
|
(89 |
) |
|
|
(4.5 |
) |
Meals & entertainment |
|
|
56 |
|
|
|
0.1 |
|
|
|
— |
|
|
|
— |
|
|
|
— |
|
|
|
— |
|
Change in tax status |
|
|
— |
|
|
|
— |
|
|
|
— |
|
|
|
— |
|
|
|
700 |
|
|
|
35.5 |
|
Parent income treated as partnership for tax |
|
|
(934 |
) |
|
|
(1.7 |
) |
|
|
(1,260 |
) |
|
|
(3.8 |
) |
|
|
2,156 |
|
|
|
109.4 |
|
Transaction costs |
|
|
653 |
|
|
|
1.2 |
|
|
|
— |
|
|
|
— |
|
|
|
— |
|
|
|
— |
|
Other |
|
|
40 |
|
|
|
0.1 |
|
|
|
205 |
|
|
|
0.6 |
|
|
|
(360 |
) |
|
|
(18.3 |
) |
Income tax expense |
|
$ |
11,715 |
|
|
|
21.3 |
% |
|
$ |
7,547 |
|
|
|
22.9 |
% |
|
$ |
2,821 |
|
|
|
143.1 |
% |
The effective income tax rate for 2024 is 21.3%, compared with an effective income tax rate of 22.9% for 2023 and 143.1% for 2022. The differences between years are primarily due to the change in income or loss at the parent company, treated as a partnership for tax purposes, as well as the impact of non-tax deductible transaction costs related to the Company's internal reorganization executed in 2024.
Intra-entity transfers of certain intangible assets were recorded on this internal reorganization resulting in tax expense on sale of $3.8 million, offset by the establishment of deferred tax assets and related tax benefits of $3.8 million. The tax-deductible amortization related to the transferred intangible assets will be recognized over a period of 15 years.
The tax effects of temporary differences that give rise to significant portions of the net deferred tax assets at December 31, 2024 and 2023 are presented below:
(Dollars in thousands) |
|
2024 |
|
|
2023 |
|
||
Deferred tax assets: |
|
|
|
|
|
|
||
Discounted unpaid losses and loss adjustment expenses |
|
$ |
9,429 |
|
|
$ |
9,668 |
|
Unearned premiums |
|
|
7,564 |
|
|
|
7,472 |
|
Net operating loss carryforward |
|
|
4,352 |
|
|
|
16,540 |
|
Partnership K1 basis differences |
|
|
943 |
|
|
|
753 |
|
Capital loss carryforwards |
|
|
4,546 |
|
|
|
4,241 |
|
Investment impairments |
|
|
390 |
|
|
|
337 |
|
Stock options |
|
|
462 |
|
|
|
416 |
|
Stat-to-GAAP reinsurance reserve |
|
|
1,668 |
|
|
|
1,668 |
|
Unrealized loss on securities available-for-sale |
|
|
2,526 |
|
|
|
5,583 |
|
Depreciation and amortization |
|
|
— |
|
|
|
1,368 |
|
Software |
|
|
1,045 |
|
|
|
1,260 |
|
Intangible assets |
|
|
3,805 |
|
|
|
— |
|
Goodwill |
|
|
172 |
|
|
|
— |
|
Other |
|
|
1,799 |
|
|
|
998 |
|
Total deferred tax assets |
|
|
38,701 |
|
|
|
50,304 |
|
Deferred tax liabilities: |
|
|
|
|
|
|
||
Intangible assets |
|
|
2,961 |
|
|
|
3,036 |
|
Deferred acquisition costs |
|
|
8,639 |
|
|
|
8,914 |
|
Bond discount |
|
|
3,989 |
|
|
|
1,550 |
|
Other |
|
|
653 |
|
|
|
2 |
|
Total deferred tax liabilities |
|
|
16,242 |
|
|
|
13,502 |
|
Total net deferred tax assets |
|
$ |
22,459 |
|
|
$ |
36,802 |
|
The deferred tax assets and deferred tax liabilities listed in the table above relate to temporary differences between the Company’s accounting and tax carrying values and carryforwards for its companies in the United States. Management believes it is more likely than not that the remaining deferred tax assets will be completely utilized in future years.
93
As a result, the Company has not recorded a valuation allowance at December 31, 2024 and 2023.
The Company has a net operating loss (“NOL”) carryforward and a capital loss carryforward of $20.7 million and $21.6 million, respectively, as of December 31, 2024, which begins to expire in 2038 and 2027, respectively, based on when the original carryforwards were generated. The Company’s NOL carryforward and capital loss carryforward were $78.8 million and $20.2 million, respectively, as of December 31, 2023.
The Company and some of its subsidiaries file income tax returns in the U.S. federal jurisdiction and various U.S. states and certain foreign jurisdictions. The Company is no longer subject to U.S. federal tax examinations by tax authorities for tax years before 2021.
The Company applies a more-likely-than-not recognition threshold for all tax uncertainties whereby it only recognizes those tax benefits that have a greater than 50% likelihood of being sustained upon examination by relevant taxing authorities. All tax benefits recognized by the Company in 2024, 2023, and 2022 have a greater than 50% likelihood of being sustained upon examination by relevant taxing authorities.
The Company classifies all interest and penalties related to uncertain tax positions as income tax expense. The Company did not incur any interest and penalties related to uncertain tax positions during the years ended December 31, 2024, 2023, and 2022. As of December 31, 2024, the Company did not record any significant liabilities for tax-related interest and penalties on its consolidated balance sheets.
Consolidated Activity
Activity in the liability for unpaid losses and loss adjustment expenses is summarized as follows:
|
|
Years Ended December 31, |
|
|||||||||
(Dollars in thousands) |
|
2024 |
|
|
2023 |
|
|
2022 |
|
|||
Balance at beginning of period |
|
$ |
850,599 |
|
|
$ |
832,404 |
|
|
$ |
759,904 |
|
Less: ceded reinsurance receivables |
|
|
72,829 |
|
|
|
73,021 |
|
|
|
94,443 |
|
Net balance at beginning of period |
|
|
777,770 |
|
|
|
759,383 |
|
|
|
665,461 |
|
Incurred losses and loss adjustment expenses related to: |
|
|
|
|
|
|
|
|
|
|||
Current year |
|
|
213,118 |
|
|
|
279,609 |
|
|
|
367,298 |
|
Prior years |
|
|
72 |
|
|
|
9,544 |
|
|
|
(8,070 |
) |
Total incurred losses and loss adjustment expenses |
|
|
213,190 |
|
|
|
289,153 |
|
|
|
359,228 |
|
Paid losses and loss adjustment expenses related to: |
|
|
|
|
|
|
|
|
|
|||
Current year |
|
|
40,063 |
|
|
|
72,717 |
|
|
|
103,442 |
|
Prior years |
|
|
211,260 |
|
|
|
198,049 |
|
|
|
161,864 |
|
Total paid losses and loss adjustment expenses |
|
|
251,323 |
|
|
|
270,766 |
|
|
|
265,306 |
|
Net balance at end of period |
|
|
739,637 |
|
|
|
777,770 |
|
|
|
759,383 |
|
Plus: ceded reinsurance receivables |
|
|
60,754 |
|
|
|
72,829 |
|
|
|
73,021 |
|
Balance at end of period |
|
$ |
800,391 |
|
|
$ |
850,599 |
|
|
$ |
832,404 |
|
When analyzing loss reserves and prior year development, the Company considers many factors, including the frequency and severity of claims, loss trends, case reserve settlements that may have resulted in significant development, and any other additional or pertinent factors that may impact reserve estimates.
During 2024, the Company increased its prior accident year loss reserves by $0.1 million, which consisted of a $1.8 million increase related to Penn-America and a $1.7 million decrease related to Non-Core Operations.
94
During 2023, the Company increased its prior accident year loss reserves by $9.5 million, which consisted of a $29.9 million increase related to Penn-America and a $20.3 million decrease related to Non-Core Operations.
During 2022, the Company decreased its prior accident year loss reserves by $8.1 million, which consisted of a $2.8 million increase related to Penn-America and a $10.9 million decrease related to Non-Core Operations.
Prior to 2001, the Company underwrote multi-peril business insuring general contractors, developers, and sub-contractors primarily involved in residential construction that has resulted in significant exposure to construction defect (“CD”) claims. The Company’s reserves for CD claims are established based upon Management’s best estimate in consideration of known facts, existing case law, and generally accepted actuarial methodologies. However, due to the inherent uncertainty concerning this type of business, the ultimate exposure for these claims may vary significantly from the amounts currently recorded. As of December 31, 2024 and 2023, gross reserves for CD claims were $25.8 million and $30.4 million, respectively, and net reserves for CD claims were $24.8 million and $28.8 million, respectively.
The Company has exposure to asbestos and environmental (“A&E”) claims. The asbestos exposure primarily arises from the sale of product liability insurance, and the environmental exposure arises from the sale of general liability and commercial multi-peril insurance. In establishing the liability for unpaid losses and loss adjustment expenses related to A&E exposures, management considers facts currently known and the current state of the law and coverage litigation. Liabilities are recognized for known claims (including the cost of related litigation) when sufficient information has been developed to indicate the involvement of a specific insurance policy, and management can reasonably estimate its liability. In addition, liabilities have been established to cover additional exposures on both known and unasserted claims. Estimates of the liabilities are reviewed and updated regularly. Case law continues to evolve for such claims, and uncertainty exists about the outcome of coverage litigation and whether past claim experience will be representative of future claim experience. Included in net unpaid losses and loss adjustment expenses as of December 31, 2024, 2023, and 2022 were IBNR reserves of $15.2 million, $17.3 million, and $18.9 million, respectively, and case reserves of approximately $5.5 million, $3.8 million, and $2.8 million, respectively, for known A&E-related claims.
95
The following table shows the Company’s gross reserves for A&E losses:
|
|
Years Ended December 31, |
|
|||||||||
(Dollars in thousands) |
|
2024 |
|
|
2023 |
|
|
2022 |
|
|||
Gross reserve for A&E losses and loss adjustment expenses – beginning of period |
|
$ |
36,831 |
|
|
$ |
37,142 |
|
|
$ |
39,153 |
|
Plus: Change in incurred losses and loss adjustment expenses |
|
|
179 |
|
|
|
1,419 |
|
|
|
2,658 |
|
Less: Payments |
|
|
1,122 |
|
|
|
1,730 |
|
|
|
4,669 |
|
Gross reserves for A&E losses and loss adjustment expenses – end of period |
|
$ |
35,888 |
|
|
$ |
36,831 |
|
|
$ |
37,142 |
|
The following table shows the Company’s net reserves for A&E losses:
|
|
Years Ended December 31, |
|
|||||||||
(Dollars in thousands) |
|
2024 |
|
|
2023 |
|
|
2022 |
|
|||
Net reserve for A&E losses and loss adjustment expenses – beginning of period |
|
$ |
21,107 |
|
|
$ |
21,647 |
|
|
$ |
21,985 |
|
Plus: Change in incurred losses and loss adjustment expenses |
|
|
2 |
|
|
|
(1 |
) |
|
|
1,962 |
|
Less: Payments |
|
|
413 |
|
|
|
539 |
|
|
|
2,300 |
|
Net reserves for A&E losses and loss adjustment expenses – end of period |
|
$ |
20,696 |
|
|
$ |
21,107 |
|
|
$ |
21,647 |
|
Establishing reserves for A&E and other mass tort claims involves more judgment than other types of claims due to factors including, but not limited to, inconsistent court decisions, an increase in bankruptcy filings as a result of asbestos-related liabilities, and judicial interpretations that often expand theories of recovery and broaden the scope of coverage. The insurance industry continues to receive a substantial number of asbestos-related bodily injury claims, with an increasing focus being directed toward other parties, including installers of products containing asbestos rather than against asbestos manufacturers. This shift has resulted in significant insurance coverage litigation implicating applicable coverage defenses or determinations, if any, including but not limited to, determinations as to whether or not an asbestos-related bodily injury claim is subject to aggregate limits of liability found in most comprehensive general liability policies.
As of December 31, 2024, 2023, and 2022, the survival ratio on a gross basis for the Company’s open A&E claims was 14.3 years, 15.1 years, and 16.9 years, respectively. As of December 31, 2024, 2023, and 2022, the survival ratio on a net basis for the Company’s open A&E claims was 19.1 years, 20.9 years, and 22.8 years, respectively. The survival ratio, which is the ratio of gross or net reserves to the 3-year average of annual paid claims, is a financial measure that indicates how long the current amount of gross or net reserves are expected to last based on the current rate of paid claims.
Line of Business Categories
The following is information, presented by lines of business with similar characteristics including similar payout patterns, about incurred and paid claims development as of December 31, 2024, net of reinsurance, as well as cumulative claim frequency and the total of incurred-but-not-reported liabilities included within the net incurred claims amounts. The years included represent the number of years for which claims incurred typically remain outstanding but need not exceed 10 years including the most recent report period presented.
The information about incurred and paid claims development for the years ended December 31, 2015 to 2023, is presented as required supplementary unaudited information.
Penn-America
Property and Casualty Methodologies
Penn-America’s internal actuarial reserve reviews were completed for loss and allocated loss adjustment expenses (“ALAE”) separately for property excluding catastrophe experience, property catastrophes, and casualty reserve categories. The internal actuarial reserve reviews were completed with data through December 2024. Actuarial methodologies, such as the Loss Development and Bornhuetter-Ferguson methods, were employed to develop estimates of ultimate loss & ALAE for most reserve categories. Management’s ultimate selections considered the internal actuarial review and a third-party actuarial review completed during the fourth quarter of 2024. Case incurred is subtracted from the management selected ultimates to obtain the booked IBNR reserves. These methodologies are consistent with last year.
Penn-America’s cumulative claim frequency has been calculated at the claim level and includes claims closed without payment.
96
Penn-America – Property
(Dollars in thousands)
|
|
Incurred Claims and Allocated Claims Adjustment Expenses, |
|
|
|
|
|
|
|
|||||||||||
|
|
For the Years Ended December 31, |
|
|
As of December 31, 2024 |
|
||||||||||||||
Accident |
|
2022 |
|
|
2023 |
|
|
2024 |
|
|
IBNR (1) |
|
|
Cumulative Number |
|
|||||
|
|
(unaudited) |
|
|
(unaudited) |
|
|
|
|
|
|
|
|
|
|
|||||
2022 |
|
$ |
80,485 |
|
|
$ |
81,232 |
|
|
$ |
75,739 |
|
|
$ |
2,000 |
|
|
|
3,620 |
|
2023 |
|
|
|
|
|
72,862 |
|
|
|
71,298 |
|
|
|
5,438 |
|
|
|
3,055 |
|
|
2024 |
|
|
|
|
|
|
|
|
88,354 |
|
|
|
19,693 |
|
|
|
3,269 |
|
||
Total |
|
|
$ |
235,391 |
|
|
|
|
|
|
|
|||||||||
|
|
|
|
|
|
|
|
|
|
|
|
|
|
|
|
|||||
|
|
Cumulative Paid Claims and Allocated Claims Adjustment Expenses, |
|
|
|
|
|
|
|
|||||||||||
|
|
For the Years Ended December 31, |
|
|
|
|
|
|
|
|||||||||||
Accident |
|
2022 |
|
|
2023 |
|
|
2024 |
|
|
|
|
|
|
|
|||||
|
|
(unaudited) |
|
|
(unaudited) |
|
|
|
|
|
|
|
|
|
|
|||||
2022 |
|
$ |
48,646 |
|
|
$ |
71,530 |
|
|
$ |
73,138 |
|
|
|
|
|
|
|
||
2023 |
|
|
|
|
|
50,543 |
|
|
|
64,492 |
|
|
|
|
|
|
|
|||
2024 |
|
|
|
|
|
|
|
|
51,575 |
|
|
|
|
|
|
|
||||
Total |
|
|
$ |
189,205 |
|
|
|
|
|
|
|
|||||||||
|
|
|
|
|
|
|
|
|
|
|
|
|
|
|
|
|||||
All outstanding liabilities for the accident years presented, net of reinsurance |
|
|
$ |
46,186 |
|
|
|
|
|
|
|
|||||||||
All outstanding liabilities before 2022, net of reinsurance |
|
|
|
3,721 |
|
|
|
|
|
|
|
|||||||||
Liabilities for unpaid losses and loss adjustment expenses, net of reinsurance |
|
|
$ |
49,907 |
|
|
|
|
|
|
|
|||||||||
The following is required supplementary information about average historical claims duration as of December 31, 2024:
|
|
Average Annual Percentage Payout of Incurred Claims by Age, |
|
|||||||||
Year |
|
1 |
|
|
2 |
|
|
3 |
|
|||
Penn-America - Property |
|
|
64.5 |
% |
|
|
24.9 |
% |
|
|
2.1 |
% |
97
Penn-America – Casualty
(Dollars in thousands)
|
|
Incurred Claims and Allocated Claim Adjustment Expenses, Net of Reinsurance |
|
|
|
|
|
|
|
|||||||||||||||||||||||||||||||||||||||
|
|
For the Years Ended December 31, |
|
|
As of December 31, 2024 |
|
||||||||||||||||||||||||||||||||||||||||||
Accident |
|
2015 |
|
|
2016 |
|
|
2017 |
|
|
2018 |
|
|
2019 |
|
|
2020 |
|
|
2021 |
|
|
2022 |
|
|
2023 |
|
|
2024 |
|
|
IBNR (1) |
|
|
Cumulative |
|
||||||||||||
|
|
(unaudited) |
|
|
(unaudited) |
|
|
(unaudited) |
|
|
(unaudited) |
|
|
(unaudited) |
|
|
(unaudited) |
|
|
(unaudited) |
|
|
(unaudited) |
|
|
(unaudited) |
|
|
|
|
|
|
|
|
|
|
||||||||||||
2015 |
|
$ |
47,299 |
|
|
$ |
46,306 |
|
|
$ |
47,055 |
|
|
$ |
46,958 |
|
|
$ |
48,462 |
|
|
$ |
45,968 |
|
|
$ |
45,439 |
|
|
$ |
45,254 |
|
|
$ |
43,764 |
|
|
$ |
43,502 |
|
|
$ |
822 |
|
|
|
1,787 |
|
2016 |
|
|
|
|
|
45,684 |
|
|
|
45,230 |
|
|
|
44,758 |
|
|
|
43,055 |
|
|
|
42,798 |
|
|
|
42,237 |
|
|
|
42,291 |
|
|
|
42,166 |
|
|
|
41,622 |
|
|
|
712 |
|
|
|
1,646 |
|
|
2017 |
|
|
|
|
|
|
|
|
46,050 |
|
|
|
45,970 |
|
|
|
44,720 |
|
|
|
44,078 |
|
|
|
45,071 |
|
|
|
45,581 |
|
|
|
45,212 |
|
|
|
43,503 |
|
|
|
1,380 |
|
|
|
1,656 |
|
||
2018 |
|
|
|
|
|
|
|
|
|
|
|
48,830 |
|
|
|
48,450 |
|
|
|
47,783 |
|
|
|
47,175 |
|
|
|
47,726 |
|
|
|
47,721 |
|
|
|
48,100 |
|
|
|
1,430 |
|
|
|
2,009 |
|
|||
2019 |
|
|
|
|
|
|
|
|
|
|
|
|
|
|
59,512 |
|
|
|
59,384 |
|
|
|
61,055 |
|
|
|
63,139 |
|
|
|
69,013 |
|
|
|
72,663 |
|
|
|
3,475 |
|
|
|
2,359 |
|
||||
2020 |
|
|
|
|
|
|
|
|
|
|
|
|
|
|
|
|
|
72,149 |
|
|
|
71,693 |
|
|
|
75,412 |
|
|
|
86,132 |
|
|
|
90,542 |
|
|
|
6,907 |
|
|
|
2,515 |
|
|||||
2021 |
|
|
|
|
|
|
|
|
|
|
|
|
|
|
|
|
|
|
|
|
96,705 |
|
|
|
96,268 |
|
|
|
108,042 |
|
|
|
114,164 |
|
|
|
17,096 |
|
|
|
3,162 |
|
||||||
2022 |
|
|
|
|
|
|
|
|
|
|
|
|
|
|
|
|
|
|
|
|
|
|
|
123,985 |
|
|
|
129,796 |
|
|
|
130,487 |
|
|
|
44,021 |
|
|
|
3,292 |
|
|||||||
2023 |
|
|
|
|
|
|
|
|
|
|
|
|
|
|
|
|
|
|
|
|
|
|
|
|
|
|
122,770 |
|
|
|
123,133 |
|
|
|
75,154 |
|
|
|
2,230 |
|
||||||||
2024 |
|
|
|
|
|
|
|
|
|
|
|
|
|
|
|
|
|
|
|
|
|
|
|
|
|
|
|
|
|
113,767 |
|
|
|
94,301 |
|
|
|
1,358 |
|
|||||||||
|
|
|
|
|
|
|
|
|
|
|
|
|
|
|
|
|
|
|
|
|
|
|
|
|
|
Total |
|
|
$ |
821,483 |
|
|
|
|
|
|
|
|||||||||||
|
|
|
|
|
|
|
|
|
|
|
|
|
|
|
|
|
|
|
|
|
|
|
|
|
|
|
|
|
|
|
|
|
|
|
|
|
||||||||||||
|
|
Cumulative Paid Claims and Allocated Claims Adjustment Expenses, Net of Reinsurance |
|
|
|
|
|
|
|
|||||||||||||||||||||||||||||||||||||||
|
|
For the Years Ended December 31, |
|
|
|
|
|
|
|
|||||||||||||||||||||||||||||||||||||||
Accident |
|
2015 |
|
|
2016 |
|
|
2017 |
|
|
2018 |
|
|
2019 |
|
|
2020 |
|
|
2021 |
|
|
2022 |
|
|
2023 |
|
|
2024 |
|
|
|
|
|
|
|
||||||||||||
|
|
(unaudited) |
|
|
(unaudited) |
|
|
(unaudited) |
|
|
(unaudited) |
|
|
(unaudited) |
|
|
(unaudited) |
|
|
(unaudited) |
|
|
(unaudited) |
|
|
(unaudited) |
|
|
|
|
|
|
|
|
|
|
||||||||||||
2015 |
|
$ |
2,903 |
|
|
$ |
11,999 |
|
|
$ |
20,459 |
|
|
$ |
28,579 |
|
|
$ |
34,932 |
|
|
$ |
37,850 |
|
|
$ |
39,078 |
|
|
$ |
40,596 |
|
|
$ |
41,655 |
|
|
$ |
42,261 |
|
|
|
|
|
|
|
||
2016 |
|
|
|
|
|
3,478 |
|
|
|
11,130 |
|
|
|
17,314 |
|
|
|
28,601 |
|
|
|
33,734 |
|
|
|
36,472 |
|
|
|
38,597 |
|
|
|
39,466 |
|
|
|
39,924 |
|
|
|
|
|
|
|
|||
2017 |
|
|
|
|
|
|
|
|
4,412 |
|
|
|
10,286 |
|
|
|
19,818 |
|
|
|
26,834 |
|
|
|
31,766 |
|
|
|
36,672 |
|
|
|
39,833 |
|
|
|
40,137 |
|
|
|
|
|
|
|
||||
2018 |
|
|
|
|
|
|
|
|
|
|
|
3,575 |
|
|
|
11,622 |
|
|
|
17,714 |
|
|
|
27,571 |
|
|
|
34,019 |
|
|
|
41,133 |
|
|
|
44,556 |
|
|
|
|
|
|
|
|||||
2019 |
|
|
|
|
|
|
|
|
|
|
|
|
|
|
4,818 |
|
|
|
12,015 |
|
|
|
24,082 |
|
|
|
38,153 |
|
|
|
51,672 |
|
|
|
61,450 |
|
|
|
|
|
|
|
||||||
2020 |
|
|
|
|
|
|
|
|
|
|
|
|
|
|
|
|
|
3,795 |
|
|
|
14,672 |
|
|
|
33,882 |
|
|
|
55,914 |
|
|
|
68,866 |
|
|
|
|
|
|
|
|||||||
2021 |
|
|
|
|
|
|
|
|
|
|
|
|
|
|
|
|
|
|
|
|
5,639 |
|
|
|
20,405 |
|
|
|
44,663 |
|
|
|
67,334 |
|
|
|
|
|
|
|
||||||||
2022 |
|
|
|
|
|
|
|
|
|
|
|
|
|
|
|
|
|
|
|
|
|
|
|
10,346 |
|
|
|
29,358 |
|
|
|
55,355 |
|
|
|
|
|
|
|
|||||||||
2023 |
|
|
|
|
|
|
|
|
|
|
|
|
|
|
|
|
|
|
|
|
|
|
|
|
|
|
7,378 |
|
|
|
23,662 |
|
|
|
|
|
|
|
||||||||||
2024 |
|
|
|
|
|
|
|
|
|
|
|
|
|
|
|
|
|
|
|
|
|
|
|
|
|
|
|
|
|
6,571 |
|
|
|
|
|
|
|
|||||||||||
Total |
|
|
$ |
450,116 |
|
|
|
|
|
|
|
|||||||||||||||||||||||||||||||||||||
|
|
|
|
|
|
|
|
|
|
|
|
|
|
|
|
|
|
|
|
|
|
|
|
|
|
|
|
|
|
|
|
|
|
|
|
|
||||||||||||
All outstanding liabilities for the accident years presented, net of reinsurance |
|
|
$ |
371,367 |
|
|
|
|
|
|
|
|||||||||||||||||||||||||||||||||||||
All outstanding liabilities before 2015, net of reinsurance |
|
|
|
4,737 |
|
|
|
|
|
|
|
|||||||||||||||||||||||||||||||||||||
Liabilities for unpaid losses and loss adjustment expenses, net of reinsurance |
|
|
$ |
376,104 |
|
|
|
|
|
|
|
|||||||||||||||||||||||||||||||||||||
The following is required supplementary information about average historical claims duration as of December 31, 2024:
|
|
Average Annual Percentage Payout of Incurred Claims by Age, |
|
|||||||||||||||||||||||||||||||||||||
Year |
|
1 |
|
|
2 |
|
|
3 |
|
|
4 |
|
|
5 |
|
|
6 |
|
|
7 |
|
|
8 |
|
|
9 |
|
|
10 |
|
||||||||||
Penn-America - Casualty |
|
|
6.8 |
% |
|
|
14.7 |
% |
|
|
18.5 |
% |
|
|
20.9 |
% |
|
|
14.1 |
% |
|
|
10.6 |
% |
|
|
5.6 |
% |
|
|
2.1 |
% |
|
|
1.8 |
% |
|
|
1.4 |
% |
Non-Core Operations
Property and Casualty Methodologies
Non-Core Operations’ internal actuarial reserve reviews were completed for loss and allocated loss adjustment expenses (“ALAE”) separately for property excluding catastrophe experience, property catastrophes, and casualty reserve categories. The internal actuarial reserve reviews were completed with data through December 2024. Actuarial methodologies, such as the Loss Development and Bornhuetter-Ferguson methods, were employed to develop estimates of ultimate loss & ALAE. Additional actuarial methodologies were employed to develop estimates of ultimate loss & ALAE for mass tort reserve categories due to the unique characteristics of the exposures involved. Management’s ultimate selections considered the internal actuarial review and a third-party actuarial review completed during the fourth quarter of 2024.
98
Case incurred is subtracted from the management selected ultimates to obtain the booked IBNR reserves. These methodologies are consistent with last year.
Non-Core Operations includes experience for reinsurance contracts which the Company does not have direct access to claim frequency information, so claim frequency information will not be provided for Non-Core Operations as it is not available for all the experience contained within this category.
Non-Core Operations – Property
(Dollars in thousands)
|
|
Incurred Claims and Allocated Claims Adjustment Expenses, |
|
|
|
|
|
|
|
|||||||||||||||
|
|
For the Years Ended December 31, |
|
|
As of December 31, 2024 |
|
||||||||||||||||||
Accident |
|
2021 |
|
|
2022 |
|
|
2023 |
|
|
2024 |
|
|
IBNR (1) |
|
|
Cumulative Number |
|
||||||
|
|
(unaudited) |
|
|
(unaudited) |
|
|
(unaudited) |
|
|
|
|
|
|
|
|
|
|
||||||
2021 |
|
$ |
111,042 |
|
|
$ |
108,443 |
|
|
$ |
109,047 |
|
|
$ |
109,567 |
|
|
$ |
3,791 |
|
|
|
10,406 |
|
2022 |
|
|
|
|
|
44,668 |
|
|
|
47,558 |
|
|
|
47,765 |
|
|
|
1,816 |
|
|
|
8,755 |
|
|
2023 |
|
|
|
|
|
|
|
|
10,105 |
|
|
|
9,724 |
|
|
|
1,701 |
|
|
|
3,269 |
|
||
2024 |
|
|
|
|
|
|
|
|
|
|
|
179 |
|
|
|
134 |
|
|
|
175 |
|
|||
Total |
|
|
$ |
167,235 |
|
|
|
|
|
|
|
|||||||||||||
|
|
|
|
|
|
|
|
|
|
|
|
|
|
|
|
|
|
|
||||||
|
|
Cumulative Paid Claims and Allocated Claims Adjustment Expenses, |
|
|
|
|
|
|
|
|||||||||||||||
|
|
For the Years Ended December 31, |
|
|
|
|
|
|
|
|||||||||||||||
Accident |
|
2021 |
|
|
2022 |
|
|
2023 |
|
|
2024 |
|
|
|
|
|
|
|
||||||
|
|
(unaudited) |
|
|
(unaudited) |
|
|
(unaudited) |
|
|
|
|
|
|
|
|
|
|
||||||
2021 |
|
$ |
84,333 |
|
|
$ |
100,865 |
|
|
$ |
102,420 |
|
|
$ |
104,575 |
|
|
|
|
|
|
|
||
2022 |
|
|
|
|
|
35,635 |
|
|
|
43,468 |
|
|
|
45,613 |
|
|
|
|
|
|
|
|||
2023 |
|
|
|
|
|
|
|
|
7,802 |
|
|
|
8,008 |
|
|
|
|
|
|
|
||||
2024 |
|
|
|
|
|
|
|
|
|
|
|
32 |
|
|
|
|
|
|
|
|||||
Total |
|
|
$ |
158,228 |
|
|
|
|
|
|
|
|||||||||||||
|
|
|
|
|
|
|
|
|
|
|
|
|
|
|
|
|
|
|
||||||
All outstanding liabilities for the accident years presented, net of reinsurance |
|
|
$ |
9,007 |
|
|
|
|
|
|
|
|||||||||||||
All outstanding liabilities before 2021, net of reinsurance |
|
|
|
33,350 |
|
|
|
|
|
|
|
|||||||||||||
Liabilities for unpaid losses and loss adjustment expenses, net of reinsurance |
|
|
$ |
42,357 |
|
|
|
|
|
|
|
|||||||||||||
The following is required supplementary information about average historical claims duration as of December 31, 2024.
|
|
Average Annual Percentage Payout of Incurred Claims by Age, |
|
|||||||||||||
Year |
|
1 |
|
|
2 |
|
|
3 |
|
|
4 |
|
||||
Non-Core Operations - Property |
|
|
76.4 |
% |
|
|
14.7 |
% |
|
|
2.4 |
% |
|
|
2.0 |
% |
99
Non-Core Operations – Casualty
(Dollars in thousands)
|
|
Incurred Claims and Allocated Claims Adjustment Expenses, Net of Reinsurance |
|
|
|
|
|
|
|
|||||||||||||||||||||||||||||||||||||||
|
|
For the Years Ended December 31, |
|
|
As of December 31, 2024 |
|
||||||||||||||||||||||||||||||||||||||||||
Accident |
|
2015 |
|
|
2016 |
|
|
2017 |
|
|
2018 |
|
|
2019 |
|
|
2020 |
|
|
2021 |
|
|
2022 |
|
|
2023 |
|
|
2024 |
|
|
IBNR (1) |
|
|
Cumulative |
|
||||||||||||
|
|
(unaudited) |
|
|
(unaudited) |
|
|
(unaudited) |
|
|
(unaudited) |
|
|
(unaudited) |
|
|
(unaudited) |
|
|
(unaudited) |
|
|
(unaudited) |
|
|
(unaudited) |
|
|
|
|
|
|
|
|
|
|
||||||||||||
2015 |
|
$ |
31,802 |
|
|
$ |
33,731 |
|
|
$ |
35,350 |
|
|
$ |
36,534 |
|
|
$ |
35,081 |
|
|
$ |
32,297 |
|
|
$ |
30,885 |
|
|
$ |
29,905 |
|
|
$ |
29,820 |
|
|
$ |
29,563 |
|
|
$ |
231 |
|
|
|
— |
|
2016 |
|
|
|
|
|
33,548 |
|
|
|
33,246 |
|
|
|
32,042 |
|
|
|
29,685 |
|
|
|
30,308 |
|
|
|
30,047 |
|
|
|
26,130 |
|
|
|
29,460 |
|
|
|
29,556 |
|
|
|
778 |
|
|
|
— |
|
|
2017 |
|
|
|
|
|
|
|
|
32,645 |
|
|
|
32,097 |
|
|
|
31,138 |
|
|
|
32,040 |
|
|
|
31,077 |
|
|
|
31,260 |
|
|
|
26,168 |
|
|
|
24,629 |
|
|
|
1,235 |
|
|
|
— |
|
||
2018 |
|
|
|
|
|
|
|
|
|
|
|
29,798 |
|
|
|
30,168 |
|
|
|
31,126 |
|
|
|
34,749 |
|
|
|
35,067 |
|
|
|
34,131 |
|
|
|
35,965 |
|
|
|
2,249 |
|
|
|
— |
|
|||
2019 |
|
|
|
|
|
|
|
|
|
|
|
|
|
|
36,892 |
|
|
|
36,933 |
|
|
|
40,469 |
|
|
|
41,398 |
|
|
|
37,619 |
|
|
|
35,919 |
|
|
|
5,237 |
|
|
|
— |
|
||||
2020 |
|
|
|
|
|
|
|
|
|
|
|
|
|
|
|
|
|
55,088 |
|
|
|
56,041 |
|
|
|
57,890 |
|
|
|
53,765 |
|
|
|
53,651 |
|
|
|
15,306 |
|
|
|
— |
|
|||||
2021 |
|
|
|
|
|
|
|
|
|
|
|
|
|
|
|
|
|
|
|
|
76,971 |
|
|
|
79,396 |
|
|
|
81,538 |
|
|
|
80,870 |
|
|
|
32,660 |
|
|
|
— |
|
||||||
2022 |
|
|
|
|
|
|
|
|
|
|
|
|
|
|
|
|
|
|
|
|
|
|
|
109,182 |
|
|
|
114,189 |
|
|
|
118,123 |
|
|
|
66,732 |
|
|
|
— |
|
|||||||
2023 |
|
|
|
|
|
|
|
|
|
|
|
|
|
|
|
|
|
|
|
|
|
|
|
|
|
|
66,102 |
|
|
|
68,229 |
|
|
|
48,361 |
|
|
|
— |
|
||||||||
2024 |
|
|
|
|
|
|
|
|
|
|
|
|
|
|
|
|
|
|
|
|
|
|
|
|
|
|
|
|
|
4,272 |
|
|
|
3,550 |
|
|
|
— |
|
|||||||||
Total |
|
|
$ |
480,777 |
|
|
|
|
|
|
|
|||||||||||||||||||||||||||||||||||||
|
|
|
|
|
|
|
|
|
|
|
|
|
|
|
|
|
|
|
|
|
|
|
|
|
|
|
|
|
|
|
|
|
|
|
|
|
||||||||||||
|
|
Cumulative Paid Claims and Allocated Claims Adjustment Expenses, Net of Reinsurance |
|
|
|
|
|
|
|
|||||||||||||||||||||||||||||||||||||||
|
|
For the Years Ended December 31, |
|
|
|
|
|
|
|
|||||||||||||||||||||||||||||||||||||||
Accident |
|
2015 |
|
|
2016 |
|
|
2017 |
|
|
2018 |
|
|
2019 |
|
|
2020 |
|
|
2021 |
|
|
2022 |
|
|
2023 |
|
|
2024 |
|
|
|
|
|
|
|
||||||||||||
|
|
(unaudited) |
|
|
(unaudited) |
|
|
(unaudited) |
|
|
(unaudited) |
|
|
(unaudited) |
|
|
(unaudited) |
|
|
(unaudited) |
|
|
(unaudited) |
|
|
(unaudited) |
|
|
|
|
|
|
|
|
|
|
||||||||||||
2015 |
|
$ |
3,979 |
|
|
$ |
11,470 |
|
|
$ |
17,615 |
|
|
$ |
23,354 |
|
|
$ |
26,144 |
|
|
$ |
27,005 |
|
|
$ |
28,231 |
|
|
$ |
28,379 |
|
|
$ |
28,445 |
|
|
$ |
28,609 |
|
|
|
|
|
|
|
||
2016 |
|
|
|
|
|
4,164 |
|
|
|
9,782 |
|
|
|
14,495 |
|
|
|
18,196 |
|
|
|
19,383 |
|
|
|
22,005 |
|
|
|
23,539 |
|
|
|
25,791 |
|
|
|
27,355 |
|
|
|
|
|
|
|
|||
2017 |
|
|
|
|
|
|
|
|
2,633 |
|
|
|
7,230 |
|
|
|
11,915 |
|
|
|
18,263 |
|
|
|
20,183 |
|
|
|
21,912 |
|
|
|
22,904 |
|
|
|
23,207 |
|
|
|
|
|
|
|
||||
2018 |
|
|
|
|
|
|
|
|
|
|
|
2,063 |
|
|
|
6,769 |
|
|
|
13,320 |
|
|
|
19,773 |
|
|
|
23,041 |
|
|
|
25,403 |
|
|
|
31,092 |
|
|
|
|
|
|
|
|||||
2019 |
|
|
|
|
|
|
|
|
|
|
|
|
|
|
2,406 |
|
|
|
7,814 |
|
|
|
15,271 |
|
|
|
21,877 |
|
|
|
25,553 |
|
|
|
28,016 |
|
|
|
|
|
|
|
||||||
2020 |
|
|
|
|
|
|
|
|
|
|
|
|
|
|
|
|
|
3,346 |
|
|
|
12,074 |
|
|
|
18,816 |
|
|
|
27,235 |
|
|
|
32,237 |
|
|
|
|
|
|
|
|||||||
2021 |
|
|
|
|
|
|
|
|
|
|
|
|
|
|
|
|
|
|
|
|
4,820 |
|
|
|
11,121 |
|
|
|
23,355 |
|
|
|
37,785 |
|
|
|
|
|
|
|
||||||||
2022 |
|
|
|
|
|
|
|
|
|
|
|
|
|
|
|
|
|
|
|
|
|
|
|
4,517 |
|
|
|
14,607 |
|
|
|
33,305 |
|
|
|
|
|
|
|
|||||||||
2023 |
|
|
|
|
|
|
|
|
|
|
|
|
|
|
|
|
|
|
|
|
|
|
|
|
|
|
4,000 |
|
|
|
11,077 |
|
|
|
|
|
|
|
||||||||||
2024 |
|
|
|
|
|
|
|
|
|
|
|
|
|
|
|
|
|
|
|
|
|
|
|
|
|
|
|
|
|
378 |
|
|
|
|
|
|
|
|||||||||||
Total |
|
|
$ |
253,061 |
|
|
|
|
|
|
|
|||||||||||||||||||||||||||||||||||||
|
|
|
|
|
|
|
|
|
|
|
|
|
|
|
|
|
|
|
|
|
|
|
|
|
|
|
|
|
|
|
|
|
|
|
|
|
||||||||||||
All outstanding liabilities for the accident years presented, net of reinsurance |
|
|
$ |
227,716 |
|
|
|
|
|
|
|
|||||||||||||||||||||||||||||||||||||
All outstanding liabilities before 2015, net of reinsurance |
|
|
|
28,510 |
|
|
|
|
|
|
|
|||||||||||||||||||||||||||||||||||||
Liabilities for unpaid losses and loss adjustment expenses, net of reinsurance |
|
|
$ |
256,226 |
|
|
|
|
|
|
|
|||||||||||||||||||||||||||||||||||||
The following is required supplementary information about average historical claims duration as of December 31, 2024:
|
|
Average Annual Percentage Payout of Incurred Claims |
|
|||||||||||||||||||||||||||||||||||||
Year |
|
1 |
|
|
2 |
|
|
3 |
|
|
4 |
|
|
5 |
|
|
6 |
|
|
7 |
|
|
8 |
|
|
9 |
|
|
10 |
|
||||||||||
Non-Core Operations - Casualty |
|
|
8.1 |
% |
|
|
14.9 |
% |
|
|
17.3 |
% |
|
|
18.2 |
% |
|
|
8.3 |
% |
|
|
6.4 |
% |
|
|
7.3 |
% |
|
|
3.1 |
% |
|
|
2.8 |
% |
|
|
0.6 |
% |
100
The reconciliation of the net incurred and paid claims development tables to the liability for unpaid losses and loss adjustment expenses in the consolidated balance sheets as of December 31, 2024 is as follows:
Net outstanding liabilities |
|
|
|
|
Penn-America – Property |
|
$ |
49,907 |
|
Penn-America – Casualty |
|
|
376,104 |
|
Non-Core Operations – Property |
|
|
42,357 |
|
Non-Core Operations – Casualty |
|
|
256,226 |
|
Liabilities for unpaid losses and loss adjustment expenses, net of reinsurance |
|
|
724,594 |
|
Reinsurance recoverable on unpaid claims |
|
|
|
|
Penn-America – Property |
|
|
2,199 |
|
Penn-America – Casualty |
|
|
6,835 |
|
Non-Core Operations – Property |
|
|
19,264 |
|
Non-Core Operations – Casualty |
|
|
32,456 |
|
Total reinsurance recoverable on unpaid claims |
|
|
60,754 |
|
Other outstanding liabilities |
|
|
|
|
Penn-America |
|
|
|
|
Ceded Allowance |
|
|
— |
|
Unallocated claims adjustment expenses |
|
|
11,534 |
|
Loss Clearing |
|
|
(1,393 |
) |
Non-Core Operations |
|
|
|
|
Ceded Allowance |
|
|
8,992 |
|
Unallocated claims adjustment expenses |
|
|
5,006 |
|
Loss Clearing |
|
|
(8,169 |
) |
Other |
|
|
(927 |
) |
Total other outstanding liabilities |
|
|
15,043 |
|
Total gross liability for unpaid losses and loss adjustment expenses |
|
$ |
800,391 |
|
7.875% Subordinated Notes due 2047
On April 15, 2022, the Company redeemed the entire $130.0 million in aggregate principal amount of the outstanding notes plus accrued and unpaid interest on the notes redeemed to, but not including the redemption date of April 15, 2022. In connection with the redemption, the Company wrote off deferred issuance costs of $3.5 million which was recognized as a loss on extinguishment of debt in its consolidated statements of operations for the year ended December 31, 2022.
Interest expense, including amortization of deferred issuance costs through the date of redemption, recognized on these notes was $3.0 million for the year ended December 31, 2022. The Company did not incur any interest expense related to these notes for the years ended December 31, 2024 or 2023.
In connection with the redemption of these notes, the Supplemental Indenture and the co-obligor transaction are no longer effective. Please see Note 13 of the notes to the consolidated financial statements in Item 8 Part II of the Company’s 2021 Annual Report on Form 10-K for more information on the Supplemental Indenture and the co-obligor transaction.
As a result of this redemption, the Company no longer has any outstanding debt with third parties.
The Company leases office space and equipment under various operating lease arrangements. The Company’s leases have remaining lease terms ranging from 22 months to 8 years. In December 2024, the Company entered into a new lease at its principal location in Bala Cynwyd, Pennsylvania through December 31, 2032. The principal changes in terms include less square footage, lower cost per square foot, and enhanced services provided by the building manager. The ROU asset and lease liability associated with the Bala Cynwyd lease were revalued as of the effective date of the lease, resulting in a $0.9 million adjustment which reduced acquisition costs and other underwriting expenses on the Company's Consolidated Statements of Operations during the year ended December 31, 2024.
101
There were no impairment losses related to lease ROU assets for the years ended December 31, 2024 and 2023. The Company recognized the following impairment losses related to its lease ROU assets for the year ended December 31, 2022:
(Dollars in thousands) |
|
Consolidated Statements of Operations Line |
|
Impairment Loss |
|
|
Scottsdale, Arizona (1) |
|
Acquisition costs and other underwriting expenses |
|
|
681 |
|
Omaha, Nebraska (2) |
|
Acquisition costs and other underwriting expenses |
|
|
488 |
|
Cavan, Ireland (3) |
|
Acquisition costs and other underwriting expenses |
|
|
168 |
|
Total lease impairment |
|
|
|
$ |
1,337 |
|
(1) Impairment was in connection with the sale of the Company's manufactured and dwelling homes business renewal rights.
(2) Impairment was in connection with the sale of the Company's Farm, Ranch & Stable renewal rights.
(3) Terminated lease due to employees in Ireland working remotely.
See Note 2 of the notes to the consolidated financial statements in Item 8 of Part II of this report for additional information on the sale of the renewal rights related to the Company’s Farm, Ranch & Stable business and Note 2 of the notes to the consolidated financial statements in Item 8 Part II of the Company’s 2023 Annual Report on Form 10-K for more information on the sale of renewal rights related to the Company's manufactured and dwelling homes business.
The components of lease expenses were as follows:
|
|
Years Ended December 31, |
|
|||||||||
(Dollars in thousands) |
|
2024 |
|
|
2023 |
|
|
2022 |
|
|||
Operating lease expenses |
|
$ |
2,032 |
|
|
$ |
2,052 |
|
|
$ |
2,372 |
|
Short-term lease expenses |
|
|
32 |
|
|
|
12 |
|
|
|
15 |
|
Sublease income (1) |
|
|
(331 |
) |
|
|
(331 |
) |
|
|
(331 |
) |
Total lease expenses |
|
$ |
1,733 |
|
|
$ |
1,733 |
|
|
$ |
2,056 |
|
(1) In connection with the sale of the renewal rights related to the Company's manufactured and dwelling homes business in 2021, K2 is subleasing approximately one third of the Company's Scottsdale, Arizona office. The Company intends to exercise its early termination clause in the Scottsdale, Arizona lease and expects to receive $1.6 million in sublease payments between October 2021 through October 2026.
Supplemental cash flow information related to leases was as follows:
|
|
Years Ended December 31, |
|
|||||||||
(Dollars in thousands) |
|
2024 |
|
|
2023 |
|
|
2022 |
|
|||
Cash paid for amounts included in the measurement of liabilities: |
|
|
|
|
|
|
|
|
|
|||
Operating leases |
|
$ |
1,733 |
|
|
$ |
1,852 |
|
|
$ |
2,056 |
|
Right-of-use assets obtained in exchange for new lease obligations: |
|
|
|
|
|
|
|
|
|
|||
Operating leases |
|
$ |
158 |
|
|
$ |
— |
|
|
$ |
— |
|
Supplemental balance sheet information related to leases was as follows:
The table below presents the lease-related assets and liabilities recorded on the consolidated balance sheets.
|
|
|
|
December 31, |
|
|||||
(Dollars in thousands) |
|
Classification on the |
|
2024 |
|
|
2023 |
|
||
Assets: |
|
|
|
|
|
|
|
|
||
Operating lease assets |
|
Lease right of use assets |
|
$ |
9,295 |
|
|
$ |
9,715 |
|
|
|
|
|
|
|
|
|
|
||
Liabilities: |
|
|
|
|
|
|
|
|
||
Operating lease liabilities |
|
Lease liabilities |
|
$ |
10,371 |
|
|
$ |
12,733 |
|
|
|
|
|
|
|
|
|
|
||
Weighted-average remaining lease term |
|
|
|
|
|
|
|
|
||
Operating leases |
|
|
|
4.3 years |
|
|
5.0 years |
|
||
|
|
|
|
|
|
|
|
|
||
Weighted-average discount rate |
|
|
|
|
|
|
|
|
||
Operating leases (1) |
|
|
|
|
4.2 |
% |
|
|
0.8 |
% |
(1) Represents the Company’s incremental borrowing rate at the time the leases were contracted.
102
At December 31, 2024, future minimum lease payments under non-cancelable operating leases were as follows:
(Dollars in thousands) |
|
Operating Leases (1) |
|
|
Expected Sublease Income |
|
||
2025 |
|
$ |
2,890 |
|
|
$ |
388 |
|
2026 |
|
|
1,700 |
|
|
|
342 |
|
2027 |
|
|
1,216 |
|
|
|
— |
|
2028 |
|
|
1,225 |
|
|
|
— |
|
2029 |
|
|
1,248 |
|
|
|
— |
|
Thereafter |
|
|
3,886 |
|
|
|
— |
|
Total future minimum lease payments |
|
|
12,165 |
|
|
|
730 |
|
Less: amount representing interest |
|
|
1,794 |
|
|
|
— |
|
Present value of minimum lease payments |
|
$ |
10,371 |
|
|
$ |
730 |
|
Distribution Restrictions
The ability of Global Indemnity Group, LLC to pay distributions is subject to applicable federal and state laws and Global Indemnity Group, LLC’s LLCA. Distributions of cash or other assets of Global Indemnity Group, LLC may be paid to Global Indemnity Group, LLC’s shareholders out of Global Indemnity Group, LLC’s assets legally available therefor only when, and if determined by the Board. Each holder of Series A Preferred Shares (as defined in the LLCA) is entitled to a “Priority Return” (as defined in the applicable Share Designation). On each Distribution Date, Global Indemnity Group, LLC shall make a distribution to each holder of the Series A Preferred Shares out of, and subject to a determination by the Board that the Company has on the applicable Distribution Date, funds legally available therefor, payable in cash only, in an amount equal to the estimated amount necessary to reduce the Unpaid Priority Return of each Series A Preferred Share immediately after such Distribution Date to zero. All such distributions shall be made pro rata in relation to each such Series A Preferred Share’s Unpaid Priority Return.
Since Global Indemnity Group, LLC is a holding company and has no direct operations, its ability to pay distributions depends, in part, on the ability of its subsidiaries to generate income to pay dividends and interest on intercompany debt and maturities. The Company's insurance subsidiaries are subject to significant regulatory restrictions limiting their ability to declare and pay dividends. Global Indemnity Investments, Inc. is dependent on generating investment income in order to pay a dividend to Global Indemnity Group, LLC. See Note 21 for additional information regarding dividend limitations imposed on the Company's insurance subsidiaries.
Distributions
Quarterly distribution payments of $0.35 per common share were declared during the year ended December 31, 2024 as follows:
Approval Date |
|
Record Date |
|
Payment Date |
|
Total Distributions Declared |
|
|
March 6, 2024 |
|
March 21, 2024 |
|
March 28, 2024 |
|
$ |
4,752 |
|
June 6, 2024 |
|
June 21, 2024 |
|
June 28, 2024 |
|
|
4,774 |
|
September 19, 2024 |
|
September 30, 2024 |
|
October 7, 2024 |
|
|
4,782 |
|
December 5, 2024 |
|
December 24, 2024 |
|
December 31, 2024 |
|
|
4,790 |
|
Various (1) |
|
Various |
|
Various |
|
|
18 |
|
Total |
|
|
|
|
|
$ |
19,116 |
|
103
Quarterly distribution payments of $0.25 per common share were declared during the year ended December 31, 2023 as follows:
Approval Date |
|
Record Date |
|
Payment Date |
|
Total Distributions Declared |
|
|
March 2, 2023 |
|
March 24, 2023 |
|
March 31, 2023 |
|
$ |
3,410 |
|
June 1, 2023 |
|
June 23, 2023 |
|
June 30, 2023 |
|
|
3,375 |
|
September 28, 2023 |
|
October 9, 2023 |
|
October 16, 2023 |
|
|
3,385 |
|
December 7, 2023 |
|
December 22, 2023 |
|
December 29, 2023 |
|
|
3,385 |
|
Various (1) |
|
Various |
|
Various |
|
|
(86 |
) |
Total |
|
|
|
|
|
$ |
13,469 |
|
Quarterly distribution payments of $0.25 per common share were declared during the year ended December 31, 2022 as follows:
Approval Date |
|
Record Date |
|
Payment Date |
|
Total Distributions Declared |
|
|
March 3, 2022 |
|
March 21, 2022 |
|
March 31, 2022 |
|
$ |
3,597 |
|
June 2, 2022 |
|
June 20, 2022 |
|
June 30, 2022 |
|
|
3,602 |
|
September 23, 2022 |
|
October 4, 2022 |
|
October 11, 2022 |
|
|
3,616 |
|
December 8, 2022 |
|
December 23, 2022 |
|
December 30, 2022 |
|
|
3,389 |
|
Various (1) |
|
Various |
|
Various |
|
|
339 |
|
Total |
|
|
|
|
|
$ |
14,543 |
|
In addition, distributions of $0.4 million were paid to Global Indemnity Group, LLC’s preferred shareholder during each of the years ended December 31, 2024, 2023, and 2022.
There were no accrued distributions on unvested common shares as of December 31, 2024. Accrued distributions on unvested common shares, which were included in other liabilities on the consolidated balance sheets, were $0.3 million as of December 31, 2023. Accrued preferred distributions were less than $0.1 million as of December 31, 2024 and 2023 and were also included in other liabilities on the consolidated balance sheets.
Repurchases and Redemptions of Global Indemnity Group, LLC’s Common Shares
Global Indemnity Group, LLC allows employees to surrender class A common shares as payment for the tax liability incurred upon the vesting of restricted stock that was issued under the Company’s share incentive plan in effect at the time of issuance. During 2024, 2023, and 2022, Global Indemnity purchased an aggregate of 16,527, 18,860 and 15,954, respectively, of surrendered class A common shares from its employees for $0.5 million, $0.6 million, and $0.4 million, respectively.
On October 21, 2022, Global Indemnity Group, LLC announced it commenced a share repurchase program beginning in the fourth quarter of 2022. Global Indemnity Group, LLC's Board of Directors have authorized share repurchases of up to $135 million in aggregate under this program that expires on December 31, 2027. As of December 31, 2024, the Company’s remaining authorization to repurchase shares is $101.0 million. The timing and actual number of shares repurchased, if any, will depend on a variety of factors, including price, general business and market conditions, and alternative investment opportunities.
Under the repurchase program, repurchases may be made from time to time using a variety of methods, including open market purchases or privately negotiated transactions, all in compliance with Global Indemnity Group, LLC’s Insider Trading Policy, the United States Securities and Exchange Commission, and other applicable legal requirements. The repurchase program does not obligate Global Indemnity Group, LLC to acquire any particular amount of class A common shares, and the repurchase program may be suspended or discontinued at any time at Global Indemnity Group, LLC’s discretion.
From the time of the initial announcement, a total of 1,357,082 shares were repurchased for approximately $34.0 million at an average purchase price of $25.05 per share. 138,151 shares that were acquired were reissued in December 2022 to one of the Directors of Global Indemnity Group, LLC at an average price per share of $24.17. As a result of these transactions, book value per share increased by $1.69 per share since inception of the share repurchase program in October 2022.
Shares purchased from employees or third parties by Global Indemnity Group, LLC are held as treasury stock and recorded at cost until formally retired by Global Indemnity Group, LLC.
104
The following table provides information with respect to the class A common shares that were surrendered, repurchased, or redeemed in 2024:
(Dollars in thousands, |
|
Total Number |
|
|
Average |
|
|
Total Number of Shares |
|
|
Approximate Dollar |
|
||||
Class A common shares: |
|
|
|
|
|
|
|
|
|
|
|
|
||||
June 1-30, 2024 |
|
|
16,527 |
|
(3) |
$ |
32.00 |
|
|
|
— |
|
|
$ |
101,004 |
|
Total |
|
|
16,527 |
|
|
$ |
32.00 |
|
|
|
— |
|
|
|
|
|
The following table provides information with respect to the class A common shares that were surrendered, repurchased, or redeemed in 2023:
(Dollars in thousands, |
|
Total Number |
|
|
Average |
|
|
Total Number of Shares |
|
|
Approximate Dollar |
|
||||
Class A common shares: |
|
|
|
|
|
|
|
|
|
|
|
|
||||
January 1-31, 2023 |
|
|
3,302 |
|
(3) |
$ |
23.31 |
|
|
|
— |
|
|
$ |
106,604 |
|
January 1-31, 2023 |
|
|
250,000 |
|
(4) |
$ |
25.90 |
|
|
|
250,000 |
|
|
$ |
106,604 |
|
April 1-30, 2023 |
|
|
200,000 |
|
(4) |
$ |
28.00 |
|
|
|
200,000 |
|
|
$ |
101,004 |
|
June 1-30, 2023 |
|
|
15,558 |
|
(3) |
$ |
33.74 |
|
|
|
— |
|
|
$ |
101,004 |
|
Total |
|
|
468,860 |
|
|
$ |
27.04 |
|
|
|
450,000 |
|
|
|
|
|
Global Indemnity Group, LLC converted 153,594 of class B common shares to class A common shares on November 14, 2022. There were no other class B common shares that were surrendered, repurchased, or redeemed in 2024 or 2023.
Each class A common share has one vote and each class B common share has ten votes.
As of December 31, 2024, Global Indemnity Group, LLC’s class A common shares were held by approximately 140 shareholders of record. The Fox Paine Entities comprise the two holders of record of Global Indemnity Group, LLC’s class B common shares as of December 31, 2024. Global Indemnity Group, LLC’s preferred shares were held by 1 holder of record, an affiliate of Fox Paine & Company, LLC, as of December 31, 2024.
105
Fox Paine Entities
Pursuant to Global Indemnity Group, LLC’s LLCA, Fox Paine Capital Fund II International, L.P. (the “Fox Paine Fund”), together with Fox Mercury Investments, L.P. and certain of its affiliates (the “FM Entities”), and Fox Paine & Company LLC (collectively, the “Fox Paine Entities”) currently constitute a Class B Majority Shareholder (as defined in the LLCA) and, as such, have the right to appoint a number of Global Indemnity Group, LLC’s directors equal in aggregate to the pro rata percentage of the voting power in Global Indemnity Group, LLC beneficially held by the Fox Paine Entities, rounded up to the nearest whole number of directors. The Fox Paine Entities beneficially own shares representing approximately 83.8% of the voting power of Global Indemnity Group, LLC as of December 31, 2024. The Fox Paine Entities control the appointment or election of all of Global Indemnity Group, LLC’s Directors due to the LLCA and their controlling share ownership. Global Indemnity Group, LLC’s Chairman is the Chief Executive and founder of Fox Paine & Company, LLC.
On August 27, 2020, Global Indemnity Group, LLC issued and sold to Wyncote LLC, an affiliate of Fox Paine & Company, LLC, 4,000 Series A Cumulative Fixed Rate Perpetual Preferred Interests at a price of $1,000 per Series A Cumulative Fixed Rate Perpetual Preferred Interest, for the aggregate purchase price of $4,000,000. While the Series A Preferred Shares are non-voting, the preferred shareholders are entitled to appoint two additional members to Global Indemnity Group, LLC’s Board of Directors whenever the “Unpaid Targeted Priority Return” with respect to the Series A Preferred Shares exceed zero immediately following six or more “Distribution Dates”, whether or not such Distribution Dates occur consecutively. Global Indemnity Group, LLC’s Board of Directors is obligated to take, and cause Global Indemnity Group, LLC’s officers to take, any necessary actions to effectuate such appointments, including expanding the size of the Board of Directors, in connection with any exercise of the foregoing provisions. Distributions of $0.4 million were paid to Wyncote LLC during each of the years ended December 31, 2024, 2023, and 2022.
Pursuant to the Third Amended and Restated Management Agreement, (“Management Agreement”) dated August 28, 2020, between Global Indemnity Group, LLC and Fox Paine & Company, LLC, Global Indemnity Group, LLC agrees to pay, or to cause one of its affiliates to pay, an annual service fee (“Annual Service Fee”) as compensation for Fox Paine & Company, LLC’s ongoing provision of certain financial and strategic consulting, advisory and other services to Global Indemnity Group, LLC and its affiliates, and to reimburse all direct and indirect expenses paid or incurred in connection with such services upon request, excluding expenses for travel, lodging, meals, and other items relating to attendance at regularly scheduled meetings of the Board of Directors. The Annual Service Fee is adjusted annually to reflect the aggregate increase in the CPI-U. The current fee charged for the twelve month period beginning September 5, 2024 was $3.2 million. Should Global Indemnity Group, LLC and Fox Paine & Company, LLC agree that the Annual Service Fee will be deferred, the Annual Service Fee will become subject to an annual adjustment equal to the percentage rate of return the Company earns on its investment portfolio multiplied by the aggregate Annual Service Fees and adjustment amounts accumulated and unpaid through such date.
Management fee expense of $3.2 million, $3.1 million, and $2.9 million was incurred during the years ended December 31, 2024, 2023, and 2022, respectively. Prepaid management fees, which were included in other assets on the consolidated balance sheets, were $2.2 million and $2.1 million as of December 31, 2024 and 2023, respectively.
In addition, Fox Paine & Company, LLC may also propose and negotiate transaction fees with the Company subject to the provisions of the Company’s related party transaction and conflict matter policies, including approval of Global Indemnity Group, LLC’s Conflicts Committee of the Board of Directors, for those services from time to time. Each of the Company’s transactions with Fox Paine & Company, LLC are reviewed and approved by Global Indemnity Group, LLC’s Conflicts Committee, which is composed of Disinterested Directors (as defined in the LLCA), and upon the recommendation of the Conflicts Committee, the Board of Directors (Saul A. Fox, Chairman of the Board of Directors of Global Indemnity Group, LLC and Chief Executive of Fox Paine & Company, LLC, is not a member of the Conflicts Committee and recused himself from deliberations related to fees paid to Fox Paine & Company, LLC or its affiliates).
Please see Note 26 for information on the approval of an advisory fee for services provided by Fox Paine & Company, LLC related to the internal reorganization.
Greenberg Traurig, LLP’s
The Company incurred $0.2 million for legal services rendered by Greenberg Traurig, LLP during the year ended December 31, 2024. Fred Karlinsky, Shareholder and Co-Chair of Greenberg Traurig, LLP, has been a member of Global Indemnity Group, LLC's Board of Directors since December 5, 2023.
Effective January 17, 2025, Fred Karlinsky was appointed to the Audit Committee, and as a result, the Company is precluded from obtaining legal services from Greenberg Traurig, LLP.
106
Legal Proceedings
The Company is, from time to time, involved in various legal proceedings in the ordinary course of business. The Company maintains insurance and reinsurance coverage for such risks in amounts that it considers adequate. However, there can be no assurance that the insurance and reinsurance coverage that the Company maintains is sufficient or will be available in adequate amounts or at a reasonable cost. The Company does not believe that the resolution of any currently pending legal proceedings, either individually or taken as a whole, will have a material adverse effect on its business, results of operations, cash flows, or financial condition.
There is a greater potential for disputes with reinsurers who are in runoff. Some of the Company’s reinsurers have operations that are in runoff, and therefore, the Company closely monitors those relationships. The Company anticipates that, similar to the rest of the insurance and reinsurance industry, it will continue to be subject to litigation and arbitration proceedings in the ordinary course of business.
Commitments
In 2014, the Company entered into a $50 million commitment to purchase an alternative investment vehicle which is comprised of European non-performing loans. As of December 31, 2024, the Company has funded $35.8 million of this commitment leaving $14.2 million as unfunded. Since the investment period has concluded, the Company does not expect any capital calls will be made prospectively.
Other Commitments
The Company is party to a Management Agreement, as amended, with Fox Paine & Company, LLC, whereby in connection with certain management services provided to it by Fox Paine & Company, LLC, the Company agreed to pay an annual management fee to Fox Paine & Company, LLC. See Note 16 above for additional information pertaining to this management agreement.
The fair value method of accounting recognizes share-based compensation to employees and non-employee directors in the consolidated statements of operations using the grant-date fair value of the stock options and other equity-based compensation expensed over the requisite service and vesting period.
For the purpose of determining the fair value of stock option awards, the Company uses the Black-Scholes option-pricing model. The Company elected a policy to accrue for compensation cost based on the number of awards that are expected to vest. An estimation of forfeitures is required when recognizing compensation expense which is then adjusted over the requisite service period should actual forfeitures differ from such estimates. Changes in estimated forfeitures are recognized through a cumulative adjustment to compensation in the period of change.
Excess tax benefits and tax deficiencies associated with share-based payment awards are required to be recognized as an income tax benefit or expense in net income (loss) with the corresponding cash flows recognized as an operating activity in the Consolidated Statement of Cash Flow.
Share Incentive Plan
On June 14, 2023, the Company’s Shareholders approved the Global Indemnity Group, LLC 2023 Share Incentive Plan (“the 2023 Plan”). The primary purpose of the 2023 Plan is to provide Global Indemnity a competitive advantage in attracting, retaining, and motivating officers, employees, consultants and non-employee directors, and to position Global Indemnity to offer incentives linked to the financial results of the Company’s business and increases in shareholder value. Under the 2023 Plan, the Company may issue up to 2.5 million class A common shares pursuant to awards granted under the Plan. The 2023 Plan replaced the Global Indemnity Group, LLC 2018 Share Incentive Plan, as amended and restated on August 28, 2020, which expired pursuant to its terms on March 4, 2023.
107
Options
Award activity for stock options granted under the Plan and the weighted average exercise price per share are summarized as follows:
|
|
Time-Based |
|
|
Performance- |
|
|
Total |
|
|
Weighted |
|
||||
Options outstanding at January 1, 2022 |
|
|
600,000 |
|
|
|
93,333 |
|
|
|
693,333 |
|
|
|
33.23 |
|
Options issued |
|
|
200,000 |
|
|
|
— |
|
|
|
200,000 |
|
|
|
20.77 |
|
Options forfeited |
|
|
— |
|
|
|
(46,666 |
) |
|
|
(46,666 |
) |
|
|
28.70 |
|
Options exercised |
|
|
— |
|
|
|
— |
|
|
|
— |
|
|
|
— |
|
Options expired |
|
|
— |
|
|
|
— |
|
|
|
— |
|
|
|
— |
|
Options purchased by the Company |
|
|
— |
|
|
|
— |
|
|
|
— |
|
|
|
— |
|
Options outstanding at December 31, 2022 |
|
|
800,000 |
|
|
|
46,667 |
|
|
|
846,667 |
|
|
|
30.54 |
|
Options issued |
|
|
— |
|
|
|
— |
|
|
|
— |
|
|
|
— |
|
Options forfeited |
|
|
(600,000 |
) |
|
|
(46,667 |
) |
|
|
(646,667 |
) |
|
|
33.56 |
|
Options exercised |
|
|
— |
|
|
|
— |
|
|
|
— |
|
|
|
— |
|
Options expired |
|
|
— |
|
|
|
— |
|
|
|
— |
|
|
|
— |
|
Options purchased by the Company |
|
|
— |
|
|
|
— |
|
|
|
— |
|
|
|
— |
|
Options outstanding at December 31, 2023 |
|
|
200,000 |
|
|
|
— |
|
|
|
200,000 |
|
|
|
20.77 |
|
Options issued |
|
|
550,000 |
|
|
|
— |
|
|
|
550,000 |
|
|
|
30.73 |
|
Options forfeited |
|
|
— |
|
|
|
— |
|
|
|
— |
|
|
|
— |
|
Options exercised |
|
|
— |
|
|
|
— |
|
|
|
— |
|
|
|
— |
|
Options expired |
|
|
— |
|
|
|
— |
|
|
|
— |
|
|
|
— |
|
Options purchased by the Company |
|
|
— |
|
|
|
— |
|
|
|
— |
|
|
|
— |
|
Options outstanding at December 31, 2024 (1) |
|
|
750,000 |
|
|
|
— |
|
|
|
750,000 |
|
|
$ |
28.07 |
|
Options exercisable at December 31, 2024 |
|
|
400,000 |
|
|
|
— |
|
|
|
400,000 |
|
|
$ |
26.39 |
|
The Company recorded $1.6 million, $0.2 million, and $0.3 million of compensation expense for stock options under the Plan during the years ended December 31, 2024, 2023, and 2022, respectively.
The Company did not receive any proceeds from the exercise of options during 2024, 2023, or 2022 under the Plan.
Compensation expense related to options outstanding under the Plan as of December 31, 2024 is anticipated to be $0.7 million, $0.7 million, and $0.1 million in 2025, 2026, and 2027, respectively.
Option intrinsic values, which are the differences between the fair value of $36.00 at December 31, 2024 and the weighted average strike price of the option, are as follows:
|
|
Number |
|
|
Weighted Average Strike Price |
|
|
Intrinsic Value |
|
|||
Outstanding |
|
|
750,000 |
|
|
|
28.07 |
|
|
$5.9 Million |
|
|
Exercisable |
|
|
400,000 |
|
|
|
26.39 |
|
|
$3.8 Million |
|
|
Exercised (1) |
|
|
— |
|
|
|
— |
|
|
|
— |
|
The weighted average fair value of options granted under the Plan was $5.72 in 2024 and $2.98 in 2022 using a Black-Scholes option-pricing model and the following weighted average assumptions.
|
|
2024 |
|
2022 |
Dividend yield |
|
2.9% |
|
2.0% |
Expected volatility |
|
28.88% |
|
22.56% |
Risk-free interest rate |
|
4.32% |
|
4.49% |
Expected option life |
|
3.0 years |
|
2.0 years |
There were no options granted under the Plan in 2023.
108
The following tables summarize the range of exercise prices of options outstanding at December 31, 2024, 2023, and 2022:
Ranges of |
|
Outstanding at December 31, 2024 |
|
|
|
Weighted Average Per |
|
|
Weighted Average |
||
$20.00 - $24.99 |
|
|
200,000 |
|
|
|
$ |
20.77 |
|
|
4.8 years |
$30.00 - $34.99 |
|
|
550,000 |
|
|
|
$ |
30.73 |
|
|
4.8 years |
Total |
|
|
750,000 |
|
|
|
|
|
|
|
|
Ranges of |
|
Outstanding at December 31, 2023 |
|
|
|
Weighted Average Per |
|
|
Weighted Average |
||
$20.00 - $24.99 |
|
|
200,000 |
|
|
|
$ |
20.77 |
|
|
5.8 years |
Total |
|
|
200,000 |
|
|
|
|
|
|
|
|
Ranges of |
|
Outstanding at December 31, 2022 |
|
|
|
Weighted Average Per |
|
|
Weighted Average |
||
$15.00 - $19.99 |
|
|
300,000 |
|
|
|
$ |
17.87 |
|
|
0.0 years |
$20.00 - $24.99 |
|
|
200,000 |
|
|
|
$ |
20.77 |
|
|
6.8 years |
$25.00 - $39.99 |
|
|
46,667 |
|
|
|
$ |
28.70 |
|
|
8.1 years |
$50.00 - $59.99 |
|
|
300,000 |
|
|
|
$ |
50.00 |
|
|
5.0 years |
Total |
|
|
846,667 |
|
|
|
|
|
|
|
|
Restricted Shares / Restricted Stock Units
The Plan also provides for the granting of restricted shares and restricted stock units to employees and non-employee Directors. The Company recognized compensation expense for restricted shares of $3.0 million, $2.7 million, and $2.0 million for 2024, 2023, and 2022, respectively. There is no unrecognized compensation expense for the non-vested restricted shares at December 31, 2024. The Company recognized compensation expense for restricted stock units of $0.2 million, $0.5 million, and $1.5 million for 2024, 2023 and 2022, respectively. There is no unrecognized compensation expense for the non-vested restricted stock units at December 31, 2024.
The following table summarizes the restricted stock grants since the 2003 inception of the original share incentive plan:
|
|
Restricted Stock Awards |
|
|||||||||
Year |
|
Employees |
|
|
Directors |
|
|
Total |
|
|||
Inception through 2021 |
|
|
1,171,576 |
|
|
|
830,800 |
|
|
|
2,002,376 |
|
2022 |
|
|
— |
|
|
|
97,260 |
|
|
|
97,260 |
|
2023 |
|
|
— |
|
|
|
91,088 |
|
|
|
91,088 |
|
2024 |
|
|
— |
|
|
|
94,503 |
|
|
|
94,503 |
|
|
|
|
1,171,576 |
|
|
|
1,113,651 |
|
|
|
2,285,227 |
|
The following table summarizes the non-vested restricted shares activity for the years ended December 31, 2024, 2023, and 2022:
|
|
Number of |
|
|
Weighted |
|
||
Non-vested Restricted Shares at January 1, 2022 |
|
|
14,639 |
|
|
|
36.23 |
|
Shares issued |
|
|
97,260 |
|
|
|
25.08 |
|
Shares vested |
|
|
(100,975 |
) |
|
|
25.49 |
|
Shares forfeited |
|
|
(10,924 |
) |
|
|
36.23 |
|
Non-vested Restricted Shares at December 31, 2022 |
|
|
— |
|
|
|
— |
|
Shares issued |
|
|
91,088 |
|
|
|
29.83 |
|
Shares vested |
|
|
(91,088 |
) |
|
|
29.83 |
|
Shares forfeited |
|
|
— |
|
|
|
— |
|
Non-vested Restricted Shares at December 31, 2023 |
|
|
— |
|
|
|
— |
|
Shares issued |
|
|
94,503 |
|
|
|
31.64 |
|
Shares vested |
|
|
(94,503 |
) |
|
|
31.64 |
|
Shares forfeited |
|
|
— |
|
|
|
— |
|
Non-vested Restricted Shares at December 31, 2024 |
|
|
— |
|
|
$ |
— |
|
109
The following table summarizes the restricted stock unit grants since the 2003 inception of the original share incentive plan through 2020:
|
|
|
|
|
|
|
Restricted Stock Unit Awards |
|
|
Employees |
|
|
336,736 |
|
Directors |
|
|
41,667 |
|
|
|
|
378,403 |
|
No additional restricted stock units have been granted since 2020.
The following table summarizes the non-vested restricted stock units activity for the years ended December 31, 2024, 2023, and 2022:
|
|
Number |
|
|
Weighted Average Price Per Restricted Stock Unit |
|
||
Non-vested Restricted Stock Units at January 1, 2022 |
|
|
227,356 |
|
|
$ |
30.33 |
|
Restricted Stock Units issued |
|
|
— |
|
|
|
— |
|
Restricted Stock Units vested |
|
|
(47,633 |
) |
|
|
30.35 |
|
Restricted Stock Units forfeited |
|
|
(51,885 |
) |
|
|
29.82 |
|
Non-vested Restricted Stock Units at December 31, 2022 |
|
|
127,838 |
|
|
$ |
30.53 |
|
Restricted Stock Units issued |
|
|
— |
|
|
|
— |
|
Restricted Stock Units vested |
|
|
(61,652 |
) |
|
|
30.43 |
|
Restricted Stock Units forfeited |
|
|
(14,893 |
) |
|
|
30.18 |
|
Non-vested Restricted Stock Units at December 31, 2023 |
|
|
51,293 |
|
|
$ |
30.75 |
|
Restricted Stock Units issued |
|
|
— |
|
|
|
— |
|
Restricted Stock Units vested |
|
|
(51,293 |
) |
|
|
30.75 |
|
Restricted Stock Units forfeited |
|
|
— |
|
|
|
— |
|
Non-vested Restricted Stock Units at December 31, 2024 |
|
|
— |
|
|
$ |
— |
|
Upon vesting, the restricted stock units are converted to restricted class A common shares. Based on the terms of the restricted share and restricted stock unit grants, all forfeited shares revert back to the Company.
During 2024, 2023, and 2022, the Company granted 94,503, 91,088, and 97,260 class A common shares, respectively, at a weighted average grant date value of $31.64, $29.83, and $25.08 per share, respectively, to non-employee directors of the Company under the Plan. The Company previously granted 157,139 shares to a non-employee director with deferred vesting. These shares vested on January 13, 2023. All other shares granted to non-employee directors of the Company are fully vested but subject to certain restrictions.
There were no restricted class A common shares or restricted stock units granted to key employees during the years ended December 31, 2024, 2023, or 2022.
Book Value Appreciation Rights (“BVAR”)
In 2021, the Company granted 2.9 million Penn-Patriot BVARs which entitled the holder to a payment based on the value of the pre-BVAR appreciation in Penn-Patriot Insurance Company’s book value. These BVARs were forfeited in 2022. Compensation expense in 2022 was reduced by $2.3 million due to these forfeitures.
Book Value Rights ("BVR")
Book Value Rights are awards issued to employees and are indexed to Belmont Holdings GX, Inc.'s equity. The BVRs are paid in cash. The Company does have the ability to issue Global Indemnity Group, LLC's class A common shares in lieu of cash. Vesting of the BVRs are subject to the employee's continuous service with the Company and remaining in good standing through the vesting date.
In 2024, the Company granted 114,146 Book Value Rights. Of these BVR, 14,063 BVR were forfeited. 10,834 BVR will vest on January 23, 2027, 58,854 BVR will vest 50% on March 6, 2026 and 50% on March 6, 2027 and the remaining 30,395 BVR will vest 50% on June 10, 2026 and 50% on June 10, 2027.
110
In 2023, the Company granted 177,045 Book Value Rights. Of these BVR, 39,545 BVR were forfeited. The remaining 137,500 BVR will vest 50% on March 3, 2025 and 50% on March 3, 2026.
In 2022, the Company granted 179,096 Book Value Rights. Of these BVR, 5,163 and 7,335 of the BVR vested in 2024 and 2023, respectively, and 81,876 BVR were forfeited. The remaining 84,722 BVR will vest as follows:
There are no unvested BVR related to years prior to 2022.
The Company recorded $1.9 million, $0.6 million, and $0.8 million in compensation expense during the years ended December 31, 2024, 2023, and 2022, respectively, and had $2.6 million and $1.3 million accrued as of December 31, 2024, and 2023, respectively, related to the book value rights.
Chief Executive Officer
Effective October 21, 2022, Global Indemnity Group, LLC's Board of Directors appointed Joseph W. Brown as its Chief Executive Officer ("CEO"). The CEO Agreement provided for a grant of 200,000 stock options to acquire the Company's class A common shares with an exercise price equal to the closing price of the Company’s class A common shares on the date of the grant. The options vested in four equal tranches as follows: 25% on each of November 1, 2022, February 1, 2023, May 1, 2023 and August 1, 2023 and are exercisable within 7 years of the grant. The stock options are subject to the terms and conditions for stock options as reflected in the Company’s 2018 Share Incentive Plan and written option agreement.
The Company entered into a new Chief Executive Officer Agreement ("2024 CEO Agreement") with Joseph W. Brown on January 18, 2024. The 2024 CEO agreement provides for a grant of 200,000 stock options to acquire the Company's class A common shares with an exercise price equal to the closing price of the Company's class A common shares on the date of the grant. The options vested in four equal tranches as follows: 25% on each of the first business day of each quarter in 2024 and are exercisable within 7 years of the grant. The stock options are subject to the terms and conditions for stock options as reflected in the Company’s 2023 Share Incentive Plan and written option agreement.
The 2024 CEO Agreement further provides that on the first business day of each year, beginning in 2025 through 2028, if Mr. Brown is employed by the Company, he shall be granted 50,000 stock options to acquire the Company's class A common shares with an exercise price equal to the closing price of the Company's class A common shares on the date of the grant. The options, if granted, will vest on December 31, 2028 (subject to Mr. Brown remaining employed with the Company or serving on the Company's Board of Directors through the vesting date), and to the extent vested, are exercisable within 7 years of the grant notwithstanding any earlier termination of employment. The stock options are subject to the terms and conditions for stock options as reflected in the Company’s 2023 Share Incentive Plan and written option agreement.
The Company maintains a 401(k) defined contribution plan that covers all eligible U.S. employees. Under this plan, the Company matches 100% of the first 6% contributed by an employee. Vesting on contributions made by the Company is immediate. Total expenses for the plan were $1.6 million, $1.6 million, and $2.0 million for the three years ended December 31, 2024, 2023, and 2022, respectively.
111
Earnings per share was computed using the weighted average number of common shares and common share equivalents outstanding during the period.
The following table sets forth the computation of basic and diluted earnings per share:
|
|
Years Ended December 31, |
|
|||||||||
(Dollars in thousands, except share and per share data) |
|
2024 |
|
|
2023 |
|
|
2022 |
|
|||
Numerator: |
|
|
|
|
|
|
|
|
|
|||
Net income (loss) |
|
$ |
43,241 |
|
|
$ |
25,429 |
|
|
$ |
(850 |
) |
Less: preferred stock distributions |
|
|
440 |
|
|
|
440 |
|
|
|
440 |
|
Net income (loss) available to common shareholders |
|
$ |
42,801 |
|
|
$ |
24,989 |
|
|
$ |
(1,290 |
) |
|
|
|
|
|
|
|
|
|
|
|||
Denominator: |
|
|
|
|
|
|
|
|
|
|||
Weighted average shares for basic earnings per share |
|
|
13,635,582 |
|
|
|
13,553,168 |
|
|
|
14,482,164 |
|
Non-vested restricted stock units |
|
|
— |
|
|
|
49,616 |
|
|
|
— |
|
Options |
|
|
70,133 |
|
|
|
63,624 |
|
|
|
— |
|
Weighted average shares for diluted earnings per share (1) |
|
|
13,705,715 |
|
|
|
13,666,408 |
|
|
|
14,482,164 |
|
|
|
|
|
|
|
|
|
|
|
|||
Net income (loss) per share available to common shareholders |
|
|
|
|
|
|
|
|
|
|||
Basic |
|
$ |
3.14 |
|
|
$ |
1.84 |
|
|
$ |
(0.09 |
) |
Diluted |
|
$ |
3.12 |
|
|
$ |
1.83 |
|
|
$ |
(0.09 |
) |
If the Company had not incurred a loss during the year ended December 31, 2022, 14,644,274 weighted average shares would have been used to compute the diluted loss per share calculation. In addition to the basic shares, weighted average shares for the diluted calculation for the year ended December 31, 2022 would have included 74,987 restricted stock units and 87,124 share equivalents for options.
The weighted average shares outstanding used to determine dilutive earnings per share for the years ended December 31, 2024 and 2022 does not include 550,000 and 346,667 options, respectively, which were deemed to be anti-dilutive. The year ended December 31, 2023 did not have any options that were deemed to be anti-dilutive.
GAAP differs in certain respects from Statutory Accounting Principles (“SAP”) as prescribed or permitted by the various U.S. state insurance departments. The principal differences between SAP and GAAP are as follows:
112
The National Association of Insurance Commissioners (“NAIC”) issues model laws and regulations, many of which have been adopted by state insurance regulators, relating to: (a) risk-based capital ("RBC") standards; (b) codification of insurance accounting principles; (c) investment restrictions; and (d) restrictions on the ability of insurance companies to pay dividends.
The Company’s insurance subsidiaries are required by law to maintain certain minimum surplus on a statutory basis, and are subject to regulations under which payment of a dividend from statutory surplus is restricted and may require prior approval of regulatory authorities. In 2024, Penn-Patriot Insurance Company declared a dividend in the amount of $40.0 million which will be paid in the first quarter of 2025. In addition, Penn-Patriot Insurance Company's, Penn-America Insurance Company's, and United National Insurance Company's distribution of their investment in subsidiaries at its underlying statutory value was considered an extraordinary dividend. These distributions improve the Company’s ability to manage capital and liquidity within the holding company structure Belmont Holdings GX, Inc. and increased the aggregate capital at the Global Indemnity Group Pool. The following extraordinary dividends were declared at December 31, 2024:
(Dollars in thousands) |
|
|
|
|
|
|
Company |
|
Property Distributed |
|
Statutory Value at December 31, 2024 |
|
|
Penn-Patriot Insurance Company |
|
Stock of American Insurance Services, Inc. |
|
|
351,923 |
|
Penn-America Insurance Company |
|
Stock of Penn-Star Insurance Company |
|
|
108,955 |
|
United National Insurance Company |
|
Stock of Diamond State Insurance Company and Penn Independent Corporation |
|
|
129,599 |
|
As a result of these extraordinary dividends which occurred in December 2024, Penn-Patriot Insurance Company, Penn-America Insurance Company, and United National Insurance Company will require approval from their respective state insurance departments for any dividends in 2025. Applying the current regulatory restrictions as of December 31, 2024, the maximum amount of distributions that could be paid in 2025 by Diamond State Insurance Company and Penn-Star Insurance Company under applicable laws and regulations without regulatory approval is approximately $11.0 million and $13.8 million, respectively.
The NAIC's RBC model provides a tool for insurance regulators to determine the levels of statutory capital and surplus an insurer must maintain in relation to its insurance and investment risks, as well as its reinsurance exposures, to assess the potential need for regulatory attention. The model provides four levels of regulatory attention, varying with the ratio of an insurance company's total adjusted capital to its authorized control level RBC ("ACLRBC"). If a company’s total adjusted capital is:
Based on the standards currently adopted, the Company reported in its 2024 statutory filings that the capital and surplus of the insurance companies are above the prescribed Company Action Level RBC requirements.
113
The following is selected information for the Company’s insurance companies, net of intercompany eliminations, where applicable, as determined in accordance with SAP:
|
|
Years Ended December 31, |
|
|||||||||
(Dollars in thousands) |
|
2024 |
|
|
2023 |
|
|
2022 |
|
|||
Statutory capital and surplus, as of end of period |
|
$ |
498,531 |
|
|
$ |
402,838 |
|
|
$ |
367,275 |
|
Statutory net income |
|
|
65,865 |
|
|
|
60,976 |
|
|
|
23,044 |
|
The Company manages its products through two segments: Penn-America and Non-Core Operations.
The Company analyzes the operating performance of each segment using the segment’s income (loss). Segment income (loss) does not equate to “net income (loss)” as determined in accordance with U.S. GAAP but is the measure of segment profit or loss used by the Company’s Chief Operating Decision Maker (“CODM”), the CEO, to evaluate segment performance and allocate resources, and consistent with authoritative guidance, is the measure of segment performance presented below.
Both segments follow the same accounting policies used for the Company’s consolidated financial statements. For further disclosure regarding the Company’s accounting policies, please see Note 4.
Segment results for 2022 have been revised to reflect changes in the Company's reportable segments that occurred in 2023 resulting from the Company's restructuring initiative. Please see Note 3 for additional information on the restructuring.
114
The following are tabulations of business segment information for the years ended December 31, 2024, 2023, and 2022. Corporate information is included to reconcile segment data to the consolidated financial statements.
2024: |
|
Penn- |
|
|
Non-Core Operations |
|
|
Total |
|
|||
Revenues: |
|
|
|
|
|
|
|
|
|
|||
Gross written premiums |
|
$ |
399,976 |
|
|
$ |
(10,218 |
) |
|
$ |
389,758 |
|
Net written premiums |
|
$ |
389,582 |
|
|
$ |
(10,392 |
) |
|
$ |
379,190 |
|
Net earned premiums |
|
$ |
369,806 |
|
|
$ |
7,186 |
|
|
$ |
376,992 |
|
Other income |
|
|
1,336 |
|
|
|
29 |
|
|
|
1,365 |
|
Total segment revenues |
|
|
371,142 |
|
|
|
7,215 |
|
|
|
378,357 |
|
Reconciliation of revenue |
|
|
|
|
|
|
|
|
|
|||
Net investment income |
|
|
|
|
|
|
|
|
62,375 |
|
||
Net realized investment gains |
|
|
|
|
|
|
|
|
455 |
|
||
Total consolidated revenues |
|
|
|
|
|
|
|
$ |
441,187 |
|
||
|
|
|
|
|
|
|
|
|
|
|||
Less: (1) |
|
|
|
|
|
|
|
|
|
|||
Net losses and loss adjustment expenses |
|
|
210,293 |
|
|
|
2,897 |
|
|
|
213,190 |
|
Net commission expenses |
|
|
86,863 |
|
|
|
2,712 |
|
|
|
89,575 |
|
Other underwriting expenses (2) |
|
|
54,270 |
|
|
|
3,500 |
|
|
|
57,770 |
|
Income (loss) from segments |
|
$ |
19,716 |
|
|
$ |
(1,894 |
) |
|
$ |
17,822 |
|
|
|
|
|
|
|
|
|
|
|
|||
Reconciliation of segment profit (loss) |
|
|
|
|
|
|
|
|
|
|||
Unallocated items: |
|
|
|
|
|
|
|
|
|
|||
Net investment income |
|
|
|
|
|
|
|
|
62,375 |
|
||
Net realized investment gains |
|
|
|
|
|
|
|
|
455 |
|
||
Corporate and other operating expenses |
|
|
|
|
|
|
|
|
(25,696 |
) |
||
Income before income taxes |
|
|
|
|
|
|
|
|
54,956 |
|
||
Income tax expense |
|
|
|
|
|
|
|
|
(11,715 |
) |
||
Net income |
|
|
|
|
|
|
|
$ |
43,241 |
|
||
|
|
|
|
|
|
|
|
|
|
|||
Segment assets |
|
$ |
986,492 |
|
|
$ |
481,045 |
|
|
$ |
1,467,537 |
|
Corporate assets |
|
|
|
|
|
|
|
|
263,716 |
|
||
Total assets |
|
|
|
|
|
|
|
$ |
1,731,253 |
|
||
115
2023: |
|
Penn- |
|
|
Non-Core Operations |
|
|
Total |
|
|||
Revenues: |
|
|
|
|
|
|
|
|
|
|||
Gross written premiums |
|
$ |
369,660 |
|
|
$ |
46,737 |
|
|
$ |
416,397 |
|
Net written premiums |
|
$ |
356,796 |
|
|
$ |
42,523 |
|
|
$ |
399,319 |
|
Net earned premiums |
|
$ |
354,518 |
|
|
$ |
118,839 |
|
|
$ |
473,357 |
|
Other income |
|
|
1,257 |
|
|
|
178 |
|
|
|
1,435 |
|
Total segment revenues |
|
|
355,775 |
|
|
|
119,017 |
|
|
|
474,792 |
|
Reconciliation of revenue |
|
|
|
|
|
|
|
|
|
|||
Net investment income |
|
|
|
|
|
|
|
|
55,444 |
|
||
Net realized investment losses |
|
|
|
|
|
|
|
|
(2,107 |
) |
||
Total consolidated revenues |
|
|
|
|
|
|
|
$ |
528,129 |
|
||
|
|
|
|
|
|
|
|
|
|
|||
Less: (1) |
|
|
|
|
|
|
|
|
|
|||
Net losses and loss adjustment expenses |
|
|
233,239 |
|
|
|
55,914 |
|
|
|
289,153 |
|
Net commission expenses |
|
|
81,691 |
|
|
|
36,580 |
|
|
|
118,271 |
|
Other underwriting expenses (2) |
|
|
52,464 |
|
|
|
11,882 |
|
|
|
64,346 |
|
Income (loss) from segments |
|
$ |
(11,619 |
) |
|
$ |
14,641 |
|
|
|
3,022 |
|
|
|
|
|
|
|
|
|
|
|
|||
Reconciliation of segment profit (loss) |
|
|
|
|
|
|
|
|
|
|||
Unallocated items: |
|
|
|
|
|
|
|
|
|
|||
Net investment income |
|
|
|
|
|
|
|
|
55,444 |
|
||
Net realized investment losses |
|
|
|
|
|
|
|
|
(2,107 |
) |
||
Corporate and other operating expenses |
|
|
|
|
|
|
|
|
(23,383 |
) |
||
Income before income taxes |
|
|
|
|
|
|
|
|
32,976 |
|
||
Income tax expense |
|
|
|
|
|
|
|
|
(7,547 |
) |
||
Net income |
|
|
|
|
|
|
|
$ |
25,429 |
|
||
|
|
|
|
|
|
|
|
|
|
|||
Segment assets |
|
$ |
982,083 |
|
|
$ |
603,433 |
|
|
$ |
1,585,516 |
|
Corporate assets |
|
|
|
|
|
|
|
|
144,060 |
|
||
Total assets |
|
|
|
|
|
|
|
$ |
1,729,576 |
|
||
116
2022: |
|
Penn- |
|
|
Non-Core Operations |
|
|
Total |
|
|||
Revenues: |
|
|
|
|
|
|
|
|
|
|||
Gross written premiums |
|
$ |
387,967 |
|
|
$ |
339,636 |
|
|
$ |
727,603 |
|
Net written premiums |
|
$ |
370,306 |
|
|
$ |
221,025 |
|
|
$ |
591,331 |
|
Net earned premiums |
|
$ |
359,597 |
|
|
$ |
242,874 |
|
|
$ |
602,471 |
|
Other income |
|
|
1,029 |
|
|
|
433 |
|
|
|
1,462 |
|
Total segment revenues |
|
|
360,626 |
|
|
|
243,307 |
|
|
|
603,933 |
|
Reconciliation of revenue |
|
|
|
|
|
|
|
|
|
|||
Net investment income |
|
|
|
|
|
|
|
|
27,627 |
|
||
Net realized investment losses |
|
|
|
|
|
|
|
|
(32,929 |
) |
||
Other income |
|
|
|
|
|
|
|
|
29,903 |
|
||
Total consolidated revenues |
|
|
|
|
|
|
|
$ |
628,534 |
|
||
|
|
|
|
|
|
|
|
|
|
|||
Less: (1) |
|
|
|
|
|
|
|
|
|
|||
Net losses and loss adjustment expenses |
|
|
214,854 |
|
|
|
144,374 |
|
|
|
359,228 |
|
Net commission expenses |
|
|
84,081 |
|
|
|
64,643 |
|
|
|
148,724 |
|
Other underwriting expenses (2) |
|
|
51,064 |
|
|
|
36,593 |
|
|
|
87,657 |
|
Income (loss) from segments |
|
$ |
10,627 |
|
|
$ |
(2,303 |
) |
|
$ |
8,324 |
|
|
|
|
|
|
|
|
|
|
|
|||
Reconciliation of segment profit (loss) |
|
|
|
|
|
|
|
|
|
|||
Unallocated items: |
|
|
|
|
|
|
|
|
|
|||
Net investment income |
|
|
|
|
|
|
|
|
27,627 |
|
||
Net realized investment losses |
|
|
|
|
|
|
|
|
(32,929 |
) |
||
Other income |
|
|
|
|
|
|
|
|
29,903 |
|
||
Corporate and other operating expenses |
|
|
|
|
|
|
|
|
(24,421 |
) |
||
Interest expense |
|
|
|
|
|
|
|
|
(3,004 |
) |
||
Loss on extinguishment of debt |
|
|
|
|
|
|
|
|
(3,529 |
) |
||
Income before income taxes |
|
|
|
|
|
|
|
|
1,971 |
|
||
Income tax expense |
|
|
|
|
|
|
|
|
(2,821 |
) |
||
Net loss |
|
|
|
|
|
|
|
$ |
(850 |
) |
||
|
|
|
|
|
|
|
|
|
|
|||
Segment assets |
|
$ |
937,919 |
|
|
$ |
824,256 |
|
|
$ |
1,762,175 |
|
Corporate assets |
|
|
|
|
|
|
|
|
38,600 |
|
||
Total assets |
|
|
|
|
|
|
|
$ |
1,800,775 |
|
||
Taxes and Interest Paid
The Company paid the following net federal income taxes and interest:
|
|
Years Ended December 31, |
|
|||||||||
(Dollars in thousands) |
|
2024 |
|
|
2023 |
|
|
2022 |
|
|||
Federal income taxes paid |
|
$ |
2,794 |
|
|
$ |
613 |
|
|
$ |
426 |
|
Interest paid |
|
|
17 |
|
|
|
— |
|
|
|
5,125 |
|
Enacted in March 2020, the Coronavirus Aid, Relief, and Economic Security Act ("CARES Act") provides tax relief and incentives to help in the recovery of businesses that partially or fully suspended operations during the coronavirus (“COVID-19”) pandemic in 2020. The CARES Act contains numerous benefits, one of which is the Employee Retention Credit for Employers Subject to Closure Due to COVID-19 (the “COVID-19 Employee Retention Credit” or “ERC”). The ERC was further enhanced with the passage of the Consolidated Appropriation Act (“CAA”) in December 2020.
117
The Company qualified for a $5.3 million credit in 2021 by continuing to pay employees at locations that were fully or partially suspended as a result of a COVID-19 related government order. In 2021, qualified wages paid by employers with an average of 500 or less full time employees is defined as all wages paid during any quarter in which the employer is eligible for the ERC. In 2021, the credit was 70% of qualified wages up to a maximum credit of $7,000 per employee per quarter.
The Company received $5.5 million during the year ended December 31, 2022. Of this amount, $5.3 million was recorded as a reduction to compensation cost, which is a component of corporate and other operating expenses, and $0.2 million was recorded as interest income on the Company’s consolidated statements of operations during the year ended December 31, 2022. The Company did not receive any amounts during the years ended December 31, 2024 and 2023.
Accounting Standard Adopted in 2024
In November 2023, the Financial Accounting Standards Board ("FASB") issued ASU No. 2023-07, Improvements to Reportable Segment Disclosures to address improvements to reportable segment disclosures. The standard primarily requires the following disclosure on an annual and interim basis: (i) significant segment expenses that are regularly provided to the chief operating decision maker ("CODM") and included within each reported measure of segment profit or loss; and (ii) other segment items and description of its composition. The standard also requires current annual disclosures about a reportable segment's profits or losses and assets to be disclosed in interim periods and the title and position of the CODM with an explanation of how the CODM uses the reported measure(s) of segment profits or losses in assessing segment performance and deciding how to allocate resources. The guidance is effective for public companies for fiscal years beginning after December 15, 2023 and interim periods within those fiscal years beginning after December 15, 2024, with early adoption permitted. The amendment is applied retrospectively to all prior periods presented. The Company adopted this guidance in its 2024 Annual Report on Form 10-K. Since the new guidance only requires additional disclosures, the adoption of this new accounting guidance did not have an impact on the Company's financial condition, results of operations, or cash flows.
Recently Issued Accounting Guidance Not Yet Adopted
In November 2024, the FASB issued ASU No. 2024-03, Disaggregation of Income Statement Expenses (“ASU 2024-03”). The new standard requires disclosures about specific types of expenses included in the expense captions presented on the face of the income statement. The guidance is effective for annual reporting periods beginning after December 15, 2026, and interim reporting periods within annual reporting periods beginning after December 15, 2027. The requirements will be applied prospectively with the option for retrospective application. The Company is currently evaluating the effect the updated guidance will have on the Company’s financial statement disclosures.
In December 2023, the FASB issued ASU No. 2023-09, Improvements to Income Tax Disclosures (“ASU 2023-09”). The standard requires disaggregated information about a company’s effective tax rate reconciliation as well as information on income taxes paid. The standard is effective for public companies for annual periods beginning after December 15, 2024, with early adoption permitted. The standard should be applied on a prospective basis, but retrospective application is permitted. The Company is currently evaluating the effect the updated guidance will have on the Company’s financial statement disclosures.
Related Party Advisory Fee
Fox Paine & Company, LLC conceived, designed, and directed the Company's successful completion of an extensive reorganization of its business. This reorganization is a significant milestone, positioning the Company for enhanced operational efficiency and growth by:
118
In accordance with the Management Agreement, Fox Paine & Company, LLC may propose and negotiate advisory fees for such services with the Company, subject to the provisions of the Company’s related party transaction policies. On March 6, 2025, upon the recommendation of the Conflicts Committee of the Board of Directors, Global Indemnity Group, LLC’s Board of Directors (other than Joseph Brown, Chief Executive Officer of Global Indemnity Group, LLC, who recused himself due to his inherent conflict of interest in approving a compensation matter for Fox Paine) approved the issuance of 550,000 class A common shares designated as class A-2 common shares, as described below, with a grant date fair value of $11.0 million and additional consideration of $0.2 million in cash for services performed in connection with the Company’s internal corporate reorganization. Of the grant date fair value of the class A common shares designated as class A-2 common shares, $2.7 million will be recorded in the first quarter of 2025. The remaining $8.3 million will be recognized, if at all, upon a Change of Control Transaction.
Class A common shares designated as class A-2 common shares issuance
On March 6, 2025, Global Indemnity Group, LLC issued 550,000 class A common shares designated as class A-2 common shares to Fox Paine & Company, LLC. These shares represent an interest in the profits of the Company in excess of a threshold amount of $475.3 million which is equal to the product of (i) the volume weighted average closing sale price of a class A common share on the New York Stock Exchange for the 30 consecutive calendar days ending on and including the grant date of March 6, 2025, which is equal to $34.67 per share, multiplied by (ii) the total number of outstanding class A and class B common shares of 13,708,199, subject to adjustment as set forth in the class A common shares designated as class A-2 common shares grant agreement. These shares are fully vested and non-forfeitable. The class A common shares designated as class A-2 common shares have the same voting rights as the class A common shares and are entitled to ordinary cash dividends or other regular distributions in the same manner as both the class A and class B common shares. Other than distributions made in connection with a Change of Control Transaction, the class A common shares designated as class A-2 common shares are also entitled to receive any special dividends or distributions that may be declared by the Board in the same manner as the class A and class B common shares provided the distribution relates solely to Company profits accrued since the grant date and does not result in the reduction of the threshold amount. Unless otherwise determined by the Board and the Conflicts Committee of the Board of Directors, the class A common shares designated as class A-2 common shares may not be assigned, sold, pledged, hypothecated, transferred, or disposed of in any manner until the occurrence of a Change of Control Transaction. Upon a Change of Control Transaction, the holders of shares, including the class A common shares designated as class A-2 common shares shall be entitled to receive distributions, if any, from the proceeds of the sale of the Company or the Company’s assets in the following order:
Amendment of the Limited Liability Company Agreement
Effective January 16, 2025, the Company amended and restated its Second Amended and Restated Limited Liability Company Agreement (such amended and restated agreement, the Third Amended and Restated Limited Liability Company Agreement (“LLCA”). The LLCA incorporates certain amendments, including, the authorization of 5,000,000 class A common shares that the Board may designate as class A-2 common shares pursuant to a grant agreement, as well as establishing the rights of the class A common shares designated as class A-2 common shares.
In addition, pursuant to the Third LLCA, certain changes were made to the Board. Specifically, the Designated Directors (as defined in the Third LLCA) will be appointed for one-year calendar terms running from January 1 to December 31. Any Designated Directors appointed to fill a vacancy will serve for the remainder of the calendar year term. Further, a nonvoting, “Ex-Officio Director” role was added for the Chief Executive Officer (the “CEO”). The CEO will automatically become the Ex-Officio Director, but the Board has authority to determine that the CEO will not fill this role (for a specified time, or indefinitely), and in that case the CEO will be eligible for appointment or election as a voting director. Mr. Brown, the Company’s CEO, remains a voting director.
119
Distribution
On March 6, 2025, the Board of Directors approved a dividend rate of $0.35 per common share payable on March 28, 2025 to all shareholders of record as of the close of business on March 21, 2025.
California Wildfires
The Company expects pretax net catastrophe losses of approximately $15.6 million from the California wildfires for the first quarter of 2025.
120
Item 9. CHANGES IN AND DISAGREEMENTS WITH ACCOUNTANTS ON ACCOUNTING AND FINANCIAL DISCLOSURE
None
Item 9A. CONTROLS AND PROCEDURES
Evaluation of Disclosure Controls and Procedures
The Company maintains disclosure controls and procedures (as that term is defined in Rules 13a-15(e) and 15d-15(e) under the Securities Exchange Act of 1934, as amended (the “Exchange Act”)) that are designed to ensure that information required to be disclosed in the Company's reports under the Exchange Act is recorded, processed, summarized and reported within the time periods specified in the Securities and Exchange Commission's rules and forms, and that such information is accumulated and communicated to the Company's management, including its Principal Executive Officer and Chief Financial Officer, as appropriate, to allow timely decisions regarding required disclosures. Any controls and procedures, no matter how well designed and operated, can provide only reasonable assurance of achieving the desired control objectives. The Company's management, with the participation of its Principal Executive Officer and Chief Financial Officer, has evaluated the effectiveness of the design and operation of disclosure controls and procedures as of December 31, 2024. Based upon that evaluation and subject to the foregoing, the Principal Executive Officer and Chief Financial Officer concluded that, as of December 31, 2024, the design and operation of the Company's disclosure controls and procedures were effective to accomplish their objectives at the reasonable assurance level.
Management’s Report on Internal Control over Financial Reporting
Management of the Company is responsible for establishing and maintaining adequate internal control over financial reporting. The Company's internal control over financial reporting is designed to provide reasonable assurances regarding the reliability of financial reporting and the preparation of the consolidated financial statements of the Company in accordance with U.S. generally accepted accounting principles.
The Company's internal control over financial reporting includes those policies and procedures that:
Because of its inherent limitations, internal control over financial reporting may not prevent or detect misstatements. Also, projections of any evaluation of effectiveness to future periods are subject to the risk that controls may become inadequate because of changes in conditions, or that the degree of compliance with the policies or procedures may deteriorate.
Management has assessed the Company's internal control over financial reporting as of December 31, 2024. The standard measures adopted by management in making its evaluation are the measures in the Internal Control Integrated Framework published by the Committee of Sponsoring Organizations of the Treadway Commission in 2013.
Based upon its assessment, management has concluded that the Company's internal control over financial reporting was effective as of December 31, 2024, and that there were no material weaknesses in the Company's internal control over financial reporting as of that date.
Ernst & Young, LLP, an independent registered public accounting firm, which has audited and reported on the consolidated financial statements contained in this Form 10-K, has issued its report on the effectiveness of the Company's internal control over financial reporting. See “Report of Independent Registered Public Accounting Firm” on page 122.
Changes in Internal Control over Financial Reporting
There have been no changes in the Company’s internal control over financial reporting that occurred during the quarter ended December 31, 2024 that have materially affected, or are reasonably likely to materially affect, the Company’s internal control over financial reporting.
121
Report of Independent Registered Public Accounting Firm
To the Shareholders and the Board of Directors of Global Indemnity Group, LLC
Opinion on Internal Control Over Financial Reporting
We have audited Global Indemnity Group, LLC’s internal control over financial reporting as of December 31, 2024, based on criteria established in Internal Control—Integrated Framework issued by the Committee of Sponsoring Organizations of the Treadway Commission (2013 framework) (the COSO criteria). In our opinion, Global Indemnity Group, LLC (the Company) maintained, in all material respects, effective internal control over financial reporting as of December 31, 2024, based on the COSO criteria.
We also have audited, in accordance with the standards of the Public Company Accounting Oversight Board (United States) (PCAOB), the consolidated balance sheets of the Company as of December 31, 2024 and 2023, the related consolidated statements of operations, comprehensive income (loss), changes in shareholders' equity and cash flows for each of the three years in the period ended December 31, 2024, and the related notes and financial statement schedules listed in the Index at Item 15(a)(2) and our report dated March 11, 2025 expressed an unqualified opinion thereon.
Basis for Opinion
The Company’s management is responsible for maintaining effective internal control over financial reporting and for its assessment of the effectiveness of internal control over financial reporting included in the accompanying Management’s Report on Internal Control over Financial Reporting. Our responsibility is to express an opinion on the Company’s internal control over financial reporting based on our audit. We are a public accounting firm registered with the PCAOB and are required to be independent with respect to the Company in accordance with the U.S. federal securities laws and the applicable rules and regulations of the Securities and Exchange Commission and the PCAOB.
We conducted our audit in accordance with the standards of the PCAOB. Those standards require that we plan and perform the audit to obtain reasonable assurance about whether effective internal control over financial reporting was maintained in all material respects.
Our audit included obtaining an understanding of internal control over financial reporting, assessing the risk that a material weakness exists, testing and evaluating the design and operating effectiveness of internal control based on the assessed risk, and performing such other procedures as we considered necessary in the circumstances. We believe that our audit provides a reasonable basis for our opinion.
Definition and Limitations of Internal Control Over Financial Reporting
A company’s internal control over financial reporting is a process designed to provide reasonable assurance regarding the reliability of financial reporting and the preparation of financial statements for external purposes in accordance with generally accepted accounting principles. A company’s internal control over financial reporting includes those policies and procedures that (1) pertain to the maintenance of records that, in reasonable detail, accurately and fairly reflect the transactions and dispositions of the assets of the company; (2) provide reasonable assurance that transactions are recorded as necessary to permit preparation of financial statements in accordance with generally accepted accounting principles, and that receipts and expenditures of the company are being made only in accordance with authorizations of management and directors of the company; and (3) provide reasonable assurance regarding prevention or timely detection of unauthorized acquisition, use, or disposition of the company’s assets that could have a material effect on the financial statements.
Because of its inherent limitations, internal control over financial reporting may not prevent or detect misstatements. Also, projections of any evaluation of effectiveness to future periods are subject to the risk that controls may become inadequate because of changes in conditions, or that the degree of compliance with the policies or procedures may deteriorate.
/s/ Ernst & Young LLP
Philadelphia, Pennsylvania
March 11, 2025
122
Item 9B. OTHER INFORMATION
Rule 10b5-1 and Non-Rule 10b5-1 Trading Arrangements
None of the Company's directors or Section 16 officers adopted or terminated a Rule 10b5-1 or non-Rule 10b5-1 trading arrangement, as each term is defined by Item 408 of Regulation S-K, during the quarter ended December 31, 2024.
Class A common shares designated as class A-2 common shares issuance to Fox Paine & Company, LLC
On March 6, 2025, Global Indemnity Group, LLC issued 550,000 class A common shares designated as class A-2 common shares to Fox Paine & Company, LLC. These shares represent an interest in the profits of the Company in excess of a threshold amount of $475.3 million which is equal to the product of (i) the volume weighted average closing sale price of a class A common share on the New York Stock Exchange for the 30 consecutive calendar days ending on and including the grant date of March 6, 2025, which is equal to $34.67 per share, multiplied by (ii) the total number of outstanding class A and class B common shares of 13,708,199, subject to adjustment as set forth in the class A common shares designated as class A-2 common shares grant agreement. These shares are fully vested and non-forfeitable. The class A common shares designated as class A-2 common shares have the same voting rights as the class A common shares and are entitled to ordinary cash dividends or other regular distributions in the same manner as both the class A and class B common shares. Other than distributions made in connection with a Change of Control Transaction, the class A common shares designated as class A-2 common shares are also entitled to receive any special dividends or distributions that may be declared by the Board in the same manner as the class A and class B common shares provided the distribution relates solely to Company profits accrued since the grant date and does not result in the reduction of the threshold amount. Unless otherwise determined by the Board and the Conflicts Committee of the Board of Directors, the class A common shares designated as class A-2 common shares may not be assigned, sold, pledged, hypothecated, transferred, or disposed of in any manner until the occurrence of a Change of Control Transaction. Upon a Change of Control Transaction, the holders of shares, including the class A common shares designated as class A-2 common shares shall be entitled to receive distributions, if any, from the proceeds of the sale of the Company or the Company’s assets in the following order:
The foregoing description of the class A common shares designated as class A-2 common shares is qualified in its entirety by reference to the class A common shares designated as class A-2 common shares grant agreement attached hereto as Exhibit 10.27 and is incorporated by reference herein.
Item 9C. DISCLOSURE REGARDING FOREIGN JURISDICTIONS THAT PREVENT INSPECTIONS Item 10.
Not applicable
123
PART III
DIRECTORS, EXECUTIVE OFFICERS, AND CORPORATE GOVERNANCE
The information required by this Item can be found in the “Proposal One: Election of Director”, “Executive Officers” and “Corporate Governance Guidelines and Code of Business Conduct and Ethics” sections of the Company’s definitive proxy statement relating to the 2025 Annual Meeting of Shareholders to be filed with the SEC within 120 days of the fiscal year ended December 31, 2024 (“2025 Proxy Statement”).
The Company has adopted a Code of Business Conduct and Ethics (Code of Ethics) that applies to all of the directors, officers and employees of Global Indemnity and its subsidiaries. A copy of the Company's Corporate Governance Guidelines and Code of Business Conduct and Ethics is available on the Company's website at www.gbli.com. Within the time period specified, and to the extent required, by the SEC and the NYSE Listed Company Manual, the Company will post on its website any amendment to its Corporate Governance Guidelines and Code of Business Conduct and Ethics and any waiver applicable to its executive officers, including the Company's principal executive officer, principal financial officer and principal accounting officer, or its Board.
The Company has adopted an insider trading policy governing the purchase, sale and other dispositions of the Company's securities by the Company’s directors, officer and employees, as well as by the Company itself. The Company believes its insider trading policy is reasonably designed to promote compliance with insider trading laws, rules and regulations, and listing standards applicable to the Company. The Company’s insider trading policy is filed as Exhibit 19.1 to this Form 10-K.
Item 11. EXECUTIVE COMPENSATION
The information required by this Item can be found in the “Compensation Discussion and Analysis”, “Committee Activities and Compensation Paid to Named Executive Officers With Respect to 2024”, “Compensation Committee Report” and “Executive Compensation Tables, Employment Agreements, Chief Executive Officer Pay Ratio and Pay versus Performance” sections of the Company’s 2025 Proxy Statement and is incorporated herein by reference.
Item 12. SECURITY OWNERSHIP OF CERTAIN BENEFICIAL OWNERS AND MANAGEMENT, AND RELATED STOCKHOLDER MATTERS
The information required by this Item can be found in the “Principal Shareholders and Security Ownership of Management” section of the Company’s 2025 Proxy Statement and is incorporated herein by reference.
The information required by this Item can be found in the “Related Party Transactions” section of the Company’s 2025 Proxy Statement and is incorporated herein by reference.
Item 14. PRINCIPAL ACCOUNTANT FEES AND SERVICES
The information required by this Item can be found in the “Proposal Two: Ratification of the Appointment of Global Indemnity Group, LLC’s Independent Registered Public Accounting Firm” section of the Company’s 2025 Proxy Statement and is incorporated herein by reference.
124
PART IV
Item 15. EXHIBITS AND FINANCIAL STATEMENT SCHEDULES
The agreements and other documents filed as exhibits to this report are not intended to provide factual information or other disclosure other than with respect to the terms of the agreements or other documents themselves, and you should not rely on them for that purpose. In particular, any representations and warranties made by the Company in these agreements or other documents were made solely within the specific context of the relevant agreement or document and may not describe the actual state of affairs as of the date they were made or at any other time.
The following documents are filed as part of this report:
(a)(1) The Financial Statements listed in the accompanying index on page 66 are filed as part of this report.
(a)(2) The Financial Statement Schedules listed in the accompanying index on page 66 are filed as part of this report.
|
Exhibit No. |
|
Description |
|
|
|
3.1 |
|
|
|
|
|
3.2 |
|
|
|
|
|
4.1+ |
|
|
|
|
|
4.2 |
|
|
|
|
|
4.3 |
|
|
|
|
|
4.4 |
|
|
|
|
|
4.5 |
|
|
|
|
|
4.6 |
|
|
|
|
|
4.7 |
|
|
|
|
|
4.8 |
|
|
|
|
|
4.9 |
|
|
|
|
|
10.1* |
|
|
|
|
|
10.2* |
|
125
|
|
|
10.3* |
|
|
|
|
|
10.4* |
|
|
|
|
|
10.5* |
|
|
|
|
|
10.6* |
|
|
|
|
|
10.7* |
|
|
|
|
|
10.8* |
|
|
|
|
|
10.9* |
|
|
|
|
|
10.10* |
|
|
|
|
|
10.11* |
|
|
|
|
|
10.12* |
|
|
|
|
|
10.13* |
|
|
|
|
|
10.14* |
|
|
|
|
|
10.15* |
|
|
|
|
|
10.16* |
|
|
|
|
|
10.17* |
|
|
|
|
|
10.18* |
|
|
|
|
|
10.19* |
|
|
|
|
|
126
10.20* |
|
|
|
|
|
10.21* |
|
|
|
|
|
10.22 |
|
|
|
|
|
10.23 |
|
|
|
|
|
10.24 |
|
|
|
|
|
10.25 |
|
|
|
|
|
10.26* |
|
|
|
|
|
10.27+ |
|
|
|
|
|
19.1+ |
|
|
|
|
|
21.1+ |
|
|
|
|
|
23.1+ |
|
|
|
|
|
31.1+ |
|
|
|
|
|
31.2+ |
|
Certification of Chief Financial Officer pursuant to Section 302 of the Sarbanes-Oxley Act of 2002. |
|
|
|
32.1+ |
|
|
|
|
|
32.2+ |
|
|
|
|
|
97.1 |
|
|
|
|
|
101.INS |
|
Inline XBRL Instance Document – the instance document does not appear in the Interactive Data File because its XBRL tags are embedded within the Inline XBRL document. |
|
|
|
101.SCH |
|
Inline XBRL Taxonomy Extension Schema With Embedded Linkbases Document |
|
|
|
104 |
|
Cover Page Interactive Data File (embedded within the Inline XBRL document) |
|
|
|
+ |
|
Filed or furnished herewith. |
|
|
|
* |
|
Management contract or compensatory plan or arrangement required to be filed as an exhibit to this Form 10-K. |
Item 16. Form 10-K Summary Pursuant to the requirements of the Section 13 or 15 (d) of the Securities Exchange Act of 1934, Global Indemnity has duly caused this report to be signed on its behalf by the undersigned, thereunto duly authorized.
None.
127
SIGNATURES
GLOBAL INDEMNITY GROUP, LLC
By: |
|
/s/ Joseph W. Brown |
Name: |
|
Joseph W. Brown |
Title: |
|
Chief Executive Officer |
Date: |
|
March 11, 2025 |
Pursuant to the requirements of the Securities Exchange Act of 1934, this report has been signed by the following persons on behalf of the registrant and in the capacities indicated below on March 11, 2025.
SIGNATURE |
|
TITLE |
|
|
|
/s/ Saul A. Fox |
|
Chairman |
Saul A. Fox |
|
|
|
|
|
/s/ Joseph W. Brown |
|
Chief Executive Officer and Director (Principal Executive Officer) |
Joseph W. Brown |
|
|
|
|
|
/s/ Brian J. Riley |
|
Chief Financial Officer (Principal Financial and Accounting Officer) |
Brian J. Riley |
|
|
|
|
|
/s/ Seth J. Gersch |
|
Director |
Seth J. Gersch |
|
|
|
|
|
/s/ Fred E. Karlinsky |
|
Director |
Fred E. Karlinsky |
|
|
|
|
|
/s/ Bruce R. Lederman |
|
Director |
Bruce R. Lederman |
|
|
|
|
|
/s/ Thomas M. McGeehan |
|
Director |
Thomas M. McGeehan |
|
|
|
|
|
128
GLOBAL INDEMNITY GROUP, LLC
SCHEDULE I -- SUMMARY OF INVESTMENTS -- OTHER THAN INVESTMENTS
IN RELATED PARTIES
(In thousands)
|
|
As of December 31, 2024 |
|
|||||||||
|
|
Cost * |
|
|
Value |
|
|
Amount |
|
|||
Type of Investment: |
|
|
|
|
|
|
|
|
|
|||
Fixed maturities: |
|
|
|
|
|
|
|
|
|
|||
United States government and government agencies and authorities |
|
$ |
875,273 |
|
|
$ |
875,246 |
|
|
$ |
875,246 |
|
States, municipalities, and political subdivisions |
|
|
17,125 |
|
|
|
16,335 |
|
|
|
16,335 |
|
Mortgage-backed and asset-backed securities |
|
|
267,391 |
|
|
|
259,915 |
|
|
|
259,915 |
|
Public utilities |
|
|
10,090 |
|
|
|
9,759 |
|
|
|
9,759 |
|
All other corporate bonds |
|
|
224,760 |
|
|
|
220,653 |
|
|
|
220,653 |
|
Total fixed maturities |
|
|
1,394,639 |
|
|
|
1,381,908 |
|
|
|
1,381,908 |
|
Equity securities: |
|
|
|
|
|
|
|
|
|
|||
Public utilities |
|
|
— |
|
|
|
— |
|
|
|
— |
|
Industrial and miscellaneous |
|
|
12,284 |
|
|
|
12,284 |
|
|
|
12,284 |
|
Total equity securities |
|
|
12,284 |
|
|
|
12,284 |
|
|
|
12,284 |
|
Other long-term investments |
|
|
29,413 |
|
|
|
29,413 |
|
|
|
29,413 |
|
Total investments |
|
$ |
1,436,336 |
|
|
$ |
1,423,605 |
|
|
$ |
1,423,605 |
|
* Original cost of fixed maturities adjusted for amortization of premiums and accretion of discounts; original cost of equity securities and other long-term investments adjusted for income or loss earned on investments in accordance with equity method of accounting. All amounts are shown net of impairment losses.
S-1
GLOBAL INDEMNITY GROUP, LLC
SCHEDULE II – Condensed Financial Information of Registrant
(Parent Only)
Balance Sheets
(Dollars in thousands, except share data)
ASSETS |
|
December 31, 2024 |
|
|
December 31, 2023 |
|
||
Fixed maturities |
|
$ |
66,824 |
|
|
$ |
70,464 |
|
Equity securities, at fair value |
|
|
483 |
|
|
|
436 |
|
Other invested assets |
|
|
17,903 |
|
|
|
26,016 |
|
Total investments |
|
|
85,210 |
|
|
|
96,916 |
|
Cash and cash equivalents |
|
|
110 |
|
|
|
40 |
|
Intercompany note receivable (1) |
|
|
69,400 |
|
|
|
69,400 |
|
Interest receivable – affiliates |
|
|
633 |
|
|
|
1,501 |
|
Equity in unconsolidated subsidiaries (1) |
|
|
576,394 |
|
|
|
482,653 |
|
Other assets |
|
|
388 |
|
|
|
997 |
|
Total assets |
|
$ |
732,135 |
|
|
$ |
651,507 |
|
LIABILITIES AND SHAREHOLDERS' EQUITY |
|
|
|
|
|
|
||
Liabilities: |
|
|
|
|
|
|
||
Due to affiliates (1) |
|
$ |
42,919 |
|
|
$ |
2,411 |
|
Other liabilities |
|
|
67 |
|
|
|
343 |
|
Total liabilities |
|
|
42,986 |
|
|
|
2,754 |
|
Commitments and contingencies |
|
|
— |
|
|
|
— |
|
Shareholders’ equity: |
|
|
|
|
|
|
||
Series A cumulative fixed rate preferred shares, $1,000 par value; 100,000,000 shares authorized, shares issued and outstanding: 4,000 and 4,000 shares, respectively, liquidation preference: $1,000 per share and $1,000 per share, respectively |
|
|
4,000 |
|
|
|
4,000 |
|
Common shares: no par value; 900,000,000 common shares authorized; class A common shares issued: 11,202,355 and 11,042,670, respectively; class A common shares outstanding: 9,914,587 and 9,771,429, respectively; class B common shares issued and outstanding: 3,793,612 and 3,793,612, respectively |
|
|
— |
|
|
|
— |
|
Additional paid-in capital |
|
|
459,578 |
|
|
|
454,791 |
|
Accumulated other comprehensive income (loss), net of tax |
|
|
(10,410 |
) |
|
|
(22,863 |
) |
Retained earnings |
|
|
268,673 |
|
|
|
244,988 |
|
Class A common shares in treasury, at cost: 1,287,768 and 1,271,241 shares, respectively |
|
|
(32,692 |
) |
|
|
(32,163 |
) |
Total shareholders' equity |
|
|
689,149 |
|
|
|
648,753 |
|
Total liabilities and shareholders’ equity |
|
$ |
732,135 |
|
|
$ |
651,507 |
|
See Notes to the Consolidated Financial Statements included in Item 8.
S-2
GLOBAL INDEMNITY GROUP, LLC
SCHEDULE II – Condensed Financial Information of Registrant (continued)
(Parent Only)
Statement of Operations and Comprehensive Income
(Dollars in thousands)
|
|
Years Ended December 31, |
|
|||||||||
|
|
2024 |
|
|
2023 |
|
|
2022 |
|
|||
Revenues: |
|
|
|
|
|
|
|
|
|
|||
Net investment income |
|
$ |
4,067 |
|
|
$ |
6,141 |
|
|
$ |
(1,980 |
) |
Intercompany interest income (1) |
|
|
880 |
|
|
|
874 |
|
|
|
627 |
|
Net realized investment gains (losses) |
|
|
14 |
|
|
|
(416 |
) |
|
|
(4,620 |
) |
Total revenues |
|
|
4,961 |
|
|
|
6,599 |
|
|
|
(5,973 |
) |
Expenses: |
|
|
|
|
|
|
|
|
|
|||
Intercompany interest expense (1) |
|
|
— |
|
|
|
— |
|
|
|
2 |
|
Interest expense |
|
|
— |
|
|
|
— |
|
|
|
41 |
|
Corporate and other operating expenses |
|
|
1,015 |
|
|
|
601 |
|
|
|
723 |
|
Loss on extinguishment of debt |
|
|
— |
|
|
|
— |
|
|
|
3,529 |
|
Income (loss) before equity in earnings of unconsolidated subsidiaries |
|
|
3,946 |
|
|
|
5,998 |
|
|
|
(10,268 |
) |
Equity in earnings of unconsolidated subsidiaries (1) |
|
|
39,295 |
|
|
|
19,431 |
|
|
|
9,418 |
|
Net income (loss) |
|
|
43,241 |
|
|
|
25,429 |
|
|
|
(850 |
) |
Other comprehensive income (loss), net of tax: |
|
|
|
|
|
|
|
|
|
|||
Unrealized holdings gain (losses) arising during the period |
|
|
973 |
|
|
|
1,287 |
|
|
|
(8,274 |
) |
Equity in other comprehensive income (loss) of unconsolidated subsidiaries (1) |
|
|
11,446 |
|
|
|
18,703 |
|
|
|
(45,764 |
) |
Recognition of previously unrealized holding losses |
|
|
34 |
|
|
|
205 |
|
|
|
4,576 |
|
Other comprehensive income (loss), net of tax |
|
|
12,453 |
|
|
|
20,195 |
|
|
|
(49,462 |
) |
Comprehensive income (loss), net of tax |
|
$ |
55,694 |
|
|
$ |
45,624 |
|
|
$ |
(50,312 |
) |
See Notes to the Consolidated Financial Statements included in Item 8.
S-3
GLOBAL INDEMNITY GROUP, LLC
Condensed Financial Information of Registrant – (continued)
(Parent Only)
Statements of Cash Flows
(Dollars in thousands)
|
|
Years Ended December 31, |
|
|||||||||
|
|
2024 |
|
|
2023 |
|
|
2022 |
|
|||
Net cash provided by operating activities |
|
$ |
7,124 |
|
|
$ |
4,388 |
|
|
$ |
7,720 |
|
Cash flows from investing activities: |
|
|
|
|
|
|
|
|
|
|||
Proceeds from sale of fixed maturities |
|
|
709 |
|
|
|
17,226 |
|
|
|
70,151 |
|
Proceeds from sale of equity securities |
|
|
— |
|
|
|
1,158 |
|
|
|
76,466 |
|
Proceeds from maturity of fixed maturities |
|
|
91,213 |
|
|
|
240 |
|
|
|
438 |
|
Proceeds from other invested assets |
|
|
8,113 |
|
|
|
— |
|
|
|
58,577 |
|
Purchases of fixed maturities |
|
|
(86,731 |
) |
|
|
(271 |
) |
|
|
(105,025 |
) |
Purchases of equity securities |
|
|
— |
|
|
|
(111 |
) |
|
|
(939 |
) |
Net cash provided by investing activities |
|
|
13,304 |
|
|
|
18,242 |
|
|
|
99,668 |
|
Cash flows from financing activities: |
|
|
|
|
|
|
|
|
|
|||
Distributions paid to common shareholders |
|
|
(19,389 |
) |
|
|
(14,248 |
) |
|
|
(14,366 |
) |
Distributions paid to preferred shareholders |
|
|
(440 |
) |
|
|
(440 |
) |
|
|
(440 |
) |
Issuance of note receivable to affiliates |
|
|
— |
|
|
|
— |
|
|
|
(69,400 |
) |
Repayment of note payable to affiliates |
|
|
— |
|
|
|
— |
|
|
|
(2,800 |
) |
Purchase of class A common shares |
|
|
(529 |
) |
|
|
(12,677 |
) |
|
|
(22,335 |
) |
Issuance of class A common shares |
|
|
— |
|
|
|
— |
|
|
|
3,339 |
|
Net cash used in financing activities |
|
|
(20,358 |
) |
|
|
(27,365 |
) |
|
|
(106,002 |
) |
Net change in cash and equivalents |
|
|
70 |
|
|
|
(4,735 |
) |
|
|
1,386 |
|
Cash and cash equivalents at beginning of period |
|
|
40 |
|
|
|
4,775 |
|
|
|
3,389 |
|
Cash and cash equivalents at end of period |
|
$ |
110 |
|
|
$ |
40 |
|
|
$ |
4,775 |
|
Supplemental Non-Cash Disclosure:
In connection with the internal reorganization in December 2024, Global Indemnity Group, LLC entered into the following non-cash transactions in 2024:
All of these transactions are eliminated in the Company’s Consolidated Financial Statements.
See Notes to the Consolidated Financial Statements included in Item 8.
S-4
GLOBAL INDEMNITY GROUP, LLC
SCHEDULE III -- SUPPLEMENTARY INSURANCE INFORMATION
(Dollars in thousands)
Segment |
|
Deferred |
|
|
Future Policy |
|
|
Unearned |
|
|
Other Policy |
|
||||
At December 31, 2024: |
|
|
|
|
|
|
|
|
|
|
|
|
||||
Penn-America |
|
$ |
40,091 |
|
|
$ |
445,186 |
|
|
$ |
180,310 |
|
|
$ |
— |
|
Non-Core Operations |
|
|
1,045 |
|
|
|
355,205 |
|
|
|
3,101 |
|
|
|
— |
|
At December 31, 2023: |
|
|
|
|
|
|
|
|
|
|
|
|
||||
Penn-America |
|
$ |
34,908 |
|
|
$ |
408,720 |
|
|
$ |
161,135 |
|
|
$ |
— |
|
Non-Core Operations |
|
|
7,537 |
|
|
|
441,879 |
|
|
|
21,717 |
|
|
|
— |
|
At December 31, 2022: |
|
|
|
|
|
|
|
|
|
|
|
|
||||
Penn-America |
|
$ |
34,290 |
|
|
$ |
366,133 |
|
|
$ |
159,554 |
|
|
$ |
— |
|
Non-Core Operations |
|
|
30,604 |
|
|
|
466,271 |
|
|
|
109,799 |
|
|
|
— |
|
Segment |
|
Premium |
|
|
Benefits, Claims, |
|
|
Amortization of |
|
|
Net |
|
||||
For the year ended December 31, 2024: |
|
|
|
|
|
|
|
|
|
|
|
|
||||
Penn-America |
|
$ |
369,806 |
|
|
$ |
210,293 |
|
|
$ |
84,691 |
|
|
$ |
389,582 |
|
Non-Core Operations |
|
|
7,186 |
|
|
|
2,897 |
|
|
|
2,944 |
|
|
|
(10,392 |
) |
Total |
|
$ |
376,992 |
|
|
$ |
213,190 |
|
|
$ |
87,635 |
|
|
$ |
379,190 |
|
For the year ended December 31, 2023: |
|
|
|
|
|
|
|
|
|
|
|
|
||||
Penn-America |
|
$ |
354,518 |
|
|
$ |
233,239 |
|
|
$ |
80,226 |
|
|
$ |
356,796 |
|
Non-Core Operations |
|
|
118,839 |
|
|
|
55,914 |
|
|
|
40,657 |
|
|
|
42,523 |
|
Total |
|
$ |
473,357 |
|
|
$ |
289,153 |
|
|
$ |
120,883 |
|
|
$ |
399,319 |
|
For the year ended December 31, 2022: |
|
|
|
|
|
|
|
|
|
|
|
|
||||
Penn-America |
|
$ |
359,597 |
|
|
$ |
214,854 |
|
|
$ |
81,638 |
|
|
$ |
370,306 |
|
Non-Core Operations |
|
|
242,874 |
|
|
|
144,374 |
|
|
|
69,308 |
|
|
|
221,025 |
|
Total |
|
$ |
602,471 |
|
|
$ |
359,228 |
|
|
$ |
150,946 |
|
|
$ |
591,331 |
|
Unallocated Corporate Items |
|
Net |
|
|
Corporate and |
|
||
For the year ended December 31, 2024: |
|
$ |
62,375 |
|
|
$ |
25,696 |
|
For the year ended December 31, 2023: |
|
|
55,444 |
|
|
|
23,383 |
|
For the year ended December 31, 2022: |
|
|
27,627 |
|
|
|
24,421 |
|
S-5
GLOBAL INDEMNITY GROUP, LLC
SCHEDULE IV -- REINSURANCE
EARNED PREMIUMS
(Dollars in thousands)
|
|
Direct |
|
|
Ceded to |
|
|
Assumed from |
|
|
Net |
|
|
Percentage |
||||
For the year ended December 31, 2024: |
|
|
|
|
|
|
|
|
|
|
|
|
|
|
||||
Property & Liability Insurance |
|
$ |
354,747 |
|
|
$ |
12,206 |
|
|
$ |
34,451 |
|
|
$ |
376,992 |
|
|
9.1% |
For the year ended December 31, 2023: |
|
|
|
|
|
|
|
|
|
|
|
|
|
|
||||
Property & Liability Insurance |
|
$ |
376,288 |
|
|
$ |
29,542 |
|
|
$ |
126,611 |
|
|
$ |
473,357 |
|
|
26.7% |
For the year ended December 31, 2022: |
|
|
|
|
|
|
|
|
|
|
|
|
|
|
||||
Property & Liability Insurance |
|
$ |
589,131 |
|
|
$ |
122,556 |
|
|
$ |
135,896 |
|
|
$ |
602,471 |
|
|
22.6% |
S-6
GLOBAL INDEMNITY GROUP, LLC
SCHEDULE V - VALUATION AND QUALIFYING ACCOUNTS AND RESERVES
(Dollars in thousands)
Description |
|
Balance at Beginning of Period |
|
|
Charged (Credited) to Costs and Expenses |
|
|
Charged (Credited) to Other Accounts |
|
|
Other Deductions |
|
|
Balance at End of Period |
|
|||||
For the year ended December 31, 2024: |
|
|
|
|
|
|
|
|
|
|
|
|
|
|||||||
Investment asset valuation reserves: |
|
|
|
|
|
|
|
|
|
|
|
|
|
|
|
|||||
Mortgage loans |
|
$ |
— |
|
|
$ |
— |
|
|
$ |
— |
|
|
$ |
— |
|
|
$ |
— |
|
Real estate |
|
|
— |
|
|
|
— |
|
|
|
— |
|
|
|
— |
|
|
|
— |
|
Allowance for doubtful accounts: |
|
|
|
|
|
|
|
|
|
|
|
|
|
|
|
|||||
Premiums, accounts and notes receivable |
|
$ |
4,796 |
|
|
$ |
(1,266 |
) |
|
$ |
— |
|
|
$ |
— |
|
|
$ |
3,530 |
|
Deferred tax asset valuation allowance |
|
|
— |
|
|
|
— |
|
|
|
— |
|
|
|
— |
|
|
|
— |
|
Reinsurance receivables |
|
|
8,992 |
|
|
|
— |
|
|
|
— |
|
|
|
— |
|
|
|
8,992 |
|
For the year ended December 31, 2023: |
|
|
|
|
|
|
|
|
|
|
|
|
|
|||||||
Investment asset valuation reserves: |
|
|
|
|
|
|
|
|
|
|
|
|
|
|
|
|||||
Mortgage loans |
|
$ |
— |
|
|
$ |
— |
|
|
$ |
— |
|
|
$ |
— |
|
|
$ |
— |
|
Real estate |
|
|
— |
|
|
|
— |
|
|
|
— |
|
|
|
— |
|
|
|
— |
|
Allowance for doubtful accounts: |
|
|
|
|
|
|
|
|
|
|
|
|
|
|
|
|||||
Premiums, accounts and notes receivable |
|
$ |
3,322 |
|
|
$ |
1,474 |
|
|
$ |
— |
|
|
$ |
— |
|
|
$ |
4,796 |
|
Deferred tax asset valuation allowance |
|
|
— |
|
|
|
— |
|
|
|
— |
|
|
|
— |
|
|
|
— |
|
Reinsurance receivables |
|
|
8,992 |
|
|
|
— |
|
|
|
— |
|
|
|
— |
|
|
|
8,992 |
|
For the year ended December 31, 2022: |
|
|
|
|
|
|
|
|
|
|
|
|
|
|||||||
Investment asset valuation reserves: |
|
|
|
|
|
|
|
|
|
|
|
|
|
|
|
|||||
Mortgage loans |
|
$ |
— |
|
|
$ |
— |
|
|
$ |
— |
|
|
$ |
— |
|
|
$ |
— |
|
Real estate |
|
|
— |
|
|
|
— |
|
|
|
— |
|
|
|
— |
|
|
|
— |
|
Allowance for doubtful accounts: |
|
|
|
|
|
|
|
|
|
|
|
|
|
|
|
|||||
Premiums, accounts and notes receivable |
|
$ |
2,996 |
|
|
$ |
326 |
|
|
$ |
— |
|
|
$ |
— |
|
|
$ |
3,322 |
|
Deferred tax asset valuation allowance |
|
|
— |
|
|
|
— |
|
|
|
— |
|
|
|
— |
|
|
|
— |
|
Reinsurance receivables |
|
|
8,992 |
|
|
|
— |
|
|
|
— |
|
|
|
— |
|
|
|
8,992 |
|
S-7
GLOBAL INDEMNITY GROUP, LLC
SCHEDULE VI -- SUPPLEMENTARY INFORMATION FOR PROPERTY CASUALTY UNDERWRITERS
(Dollars in thousands)
|
|
Deferred Policy |
|
|
Reserves for |
|
|
Discount If |
|
|
Unearned |
|
||||
Consolidated Property & Casualty Entities: |
|
|
|
|
|
|
|
|
|
|
|
|
||||
As of December 31, 2024 |
|
$ |
41,136 |
|
|
$ |
800,391 |
|
|
$ |
— |
|
|
$ |
183,411 |
|
As of December 31, 2023 |
|
|
42,445 |
|
|
|
850,599 |
|
|
|
— |
|
|
|
182,852 |
|
As of December 31, 2022 |
|
|
64,894 |
|
|
|
832,404 |
|
|
|
— |
|
|
|
269,353 |
|
|
|
Earned |
|
|
Net |
|
|
Claims and Claim Adjustment |
|
|
Amortization Of Deferred Policy |
|
|
Paid Claims |
|
|
Premiums |
|
||||||||||
|
|
Premiums |
|
|
Income |
|
|
Current Year |
|
|
Prior Year |
|
|
Acquisition Costs |
|
|
Expenses |
|
|
Written |
|
|||||||
Consolidated Property & Casualty Entities: |
|
|
|
|
|
|
|
|
|
|
|
|
|
|
|
|
||||||||||||
For the year ended December 31, 2024: |
|
$ |
376,992 |
|
|
$ |
62,375 |
|
|
$ |
213,118 |
|
|
$ |
72 |
|
|
$ |
87,635 |
|
|
$ |
251,323 |
|
|
$ |
379,190 |
|
For the year ended December 31, 2023: |
|
|
473,357 |
|
|
|
55,444 |
|
|
|
279,609 |
|
|
|
9,544 |
|
|
|
120,883 |
|
|
|
270,766 |
|
|
|
399,319 |
|
For the year ended December 31, 2022: |
|
|
602,471 |
|
|
|
27,627 |
|
|
|
367,298 |
|
|
|
(8,070 |
) |
|
|
150,946 |
|
|
|
265,306 |
|
|
|
591,331 |
|
Note: All of the Company's insurance subsidiaries are 100% owned and consolidated.
S-8
Exhibit 4.1
DESCRIPTION OF SECURITIES
The following description sets forth certain material terms of each class of securities of Global Indemnity Group, LLC (the “Company”) that is registered under Section 12 of the Securities Exchange Act of 1934, as amended (“Exchange Act”), as of December 31, 2024, the end of the period covered by the Annual Report on Form 10-K (the “Form 10-K”) of which this Exhibit is a part.
As of December 31, 2024, the Company had one class of securities registered pursuant to Section 12 of the Exchange Act:
The following summary description of securities does not purport to be complete and is qualified in its entirety by reference to (i) the Company’s Third Amended and Restated Limited Liability Company Agreement (the “LLCA”), (ii) the applicable provisions of the Delaware Limited Liability Company Act (the “Delaware Act”). The LLCA are each incorporated by reference as exhibits to the Form 10-K of which this Exhibit is a part. Unless otherwise stated herein, capitalized terms have the same meaning as in the LLCA, or Form 10-K, as applicable.
DESCRIPTION OF THE CLASS A COMMON SHARES
Under the LLCA, the Company has the authority to issue 600,000,000 Class A Common Shares, without par value. All Class A Common Shares issued or that may be issued are or will be fully paid and non-assessable, except as such non-assessability may be affected by the Delaware Act. The Class A Common Shares have no sinking fund provision.
Global Indemnity Group, LLC’s class A common shares are publicly traded on the New York Stock Exchange under the ticker symbol GBLI.
Subject to the applicable provisions of the Delaware Act, the LLCA, and the terms of any Share Designation, distributions of cash or assets of the Company may be paid to the Shareholders, including Class A Common Shareholders, out of the Company’s assets legally available therefor only when, as and if determined by the Company’s Board of Directors.
Holders of the Company’s Class A Common Shares are entitled to one vote per Class A Common Share held on all matters voted or consented upon by the Company’s shareholders.
Holders of the Class A Common Shares do not have any preemptive, subscription, preferential or similar rights regarding the issuance of the Company’s securities.
The LLCA does not provide for any appraisal rights, except to the limited extent provided with respect to the required redemption or repurchase of shares in connection with an Adverse Consequence.
Upon a dissolution, the Company will be wound up and its assets will be distributed (a) to its creditors, including shareholders and directors who are creditors, (b) to the shareholders and former shareholders in satisfaction of liabilities for distributions, and (c) to the shareholders, including Class A Common Shareholders, in proportion to the number of shares held by them.
The Company’s Board of Directors has the authority to (i) issue any authorized but unissued shares of any existing class or series of shares, including Class B Common Shares, and (ii)(A) create additional classes or series of shares, with such distinctive designations, preferences and other rights (including voting rights) that may adversely affect the rights of the holders of the Class A Common Shares, and such qualifications, limitations or restrictions, in each case, as set forth in a Share Designation with respect to such additional classes or series of shares, and (B) authorize and issue shares of any such newly created class or series. Under certain circumstances, the LLCA authorizes the Company’s Board of Directors to decline to approve or register a purported transfer of shares. Notwithstanding anything to the contrary in the LLCA, nothing prevents the settling of any transaction involving shares entered into through NYSE or any other applicable national securities exchange.
Exhibit 10.27
GLOBAL INDEMNITY GROUP, LLC
2023 SHARE INCENTIVE PLAN
CLASS A-2 COMMON SHARE GRANT AGREEMENT
This CLASS A-2 COMMON SHARE GRANT AGREEMENT (this “Agreement”), dated March 6, 2025 (the “Grant Date”), is delivered by Global Indemnity Group, LLC (the “Company”) to Fox Paine & Company, LLC (the “Grantee”).
RECITALS
A. The Global Indemnity Group, LLC 2023 Share Incentive Plan (the “Plan”) provides for the grant of Awards, including Other Share-Based Awards, to officers, directors, employees and certain consultants and other service providers of the Company and its Affiliates, in accordance with the terms and conditions of the Plan.
B. The Grantee has provided services to the Company related to an internal corporate restructuring of the Company’s subsidiaries intended to benefit the Company and its shareholders by potentially increasing the Company’s operating income, enhancing the recruitment of executives, simplifying the Company’s corporate structure and creating other efficiencies.
C. The Board, acting as the Committee pursuant to its authority under the Plan, has determined that it is to the advantage and interest of the Company to make a grant of 550,000 Common Shares designated as Class A-2 Common Shares and a cash payment of $200,000, to the Grantee, in full satisfaction of a mutually agreed advisory or arrangement/finders’ fee due to the Grantee pursuant to the Third Amended and Restated Management Agreement between the Company and the Grantee, dated August 28, 2020, for services performed by Grantee in connection with the Company’s internal restructuring.
D. This grant, which shall constitute an Award, including an “Other Share-Based Award” as defined under the Plan (which, for the avoidance of doubt, is not contingent upon the attainment of Performance Goals) is subject to the terms of the Plan, which are hereby incorporated into this Agreement by this reference. Capitalized terms used but not defined herein shall have the meaning set forth in the Plan.
NOW, THEREFORE, the parties to this Agreement, intending to be legally bound hereby, agree as follows:
2
3
4
5
IN WITNESS WHEREOF, the Company has caused its duly authorized officers to execute and attest to this Agreement, and the Grantee has placed his signature hereon, effective as of the Grant Date.
GLOBAL INDEMNITY GROUP, LLC |
|
|
|
|
|
By: |
/s/ Joseph W. Brown |
6
I hereby accept the grant of Award Shares described in this Agreement. I have read the Global Indemnity Group, LLC 2023 Share Incentive Plan, this Agreement and the Limited Liability Company Agreement and agree to be bound by the terms of the Plan, this Agreement and the Limited Liability Company Agreement.
On behalf of the Grantee, accepted and agreed as of the date first above written:
/s/ Saul Fox |
Saul Fox |
|
Chief Executive Fox Paine & Company, LLC |
7
EXHIBIT A
Change of Control Transaction Payment Mechanics
Notwithstanding anything in the Limited Liability Company Agreement to the contrary, upon a Change of Control Transaction, the Grantee shall be entitled to receive distributions (if any) from the proceeds of the sale of the Company or the Company’s assets with respect to the Award Shares in the following order:
8
Exhibit 19.1
GLOBAL INDEMNITY GROUP, LLC
Insider Trading Policy
1. Purpose
This Insider Trading Policy (“Policy”) is intended to (i) prevent trading in securities of Global Indemnity Group, LLC (together with its subsidiaries, the “Company”) by any director, officer, or employee of the Company (“Global Personnel”), including Global Personnel’s household and immediate family members (together with Global Personnel, “Insiders”), who is aware of material, non-public information concerning the Company and (ii) establish guidelines for purchases and sales of the Company’s securities by directors, officers, and employees. This Policy applies to all Global Personnel.
It is also Company policy to comply with applicable securities laws concerning trading in Company securities on the Company’s behalf.
The Company has adopted this Policy to help ensure compliance with federal and state securities laws as well as to avoid inadvertent violations and even the appearance of impropriety on the part of anyone employed by or associated with the Company. Prosecution, or even an investigation, under federal or state securities laws could harm the Company’s reputation for high standards of integrity and ethical conduct.
2. Legal Background; Enforcement
United States federal and state securities laws govern the use and public disclosure of corporate inside information (also referred to herein as “material, non-public information”). The purpose of such laws is to assure that all persons trading in a company’s securities have equal access to all “material” information about that company.
In general, it is a violation of federal securities laws for any person who is aware of material, non-public information concerning a company to (i) buy or sell securities of such company or (ii) provide other people with such information or to recommend that they buy or sell securities of such company (this activity is called “tipping”). In the latter case, both the person who “tips” and the person who receives the information may be held liable for insider trading violations.
Securities violations are subject to strict enforcement proceedings and may result in stringent criminal and civil penalties for the individuals and the Company. The Company and its executive officers and directors also may be liable for insider trading violations by the Company’s personnel if they do not take appropriate steps to prevent such violations. Moreover, an employee or officer who violates this Policy is subject to disciplinary action by the Company, up to and including dismissal for cause.
3. Policy
Prohibition of Insider Trading
Trading in the Company’s Securities. No director, officer, or employee shall place a purchase or sale order, or recommend that another person place a purchase or sale order, in the Company’s securities when he or she is aware of material, non-public information concerning the Company. Each director, officer, and employee aware of material, non-public information shall refrain from trading or recommending that others trade until the information has been disseminated to the general public in such a fashion that investors have had a reasonable opportunity to assess and evaluate it. Although there is no fixed period for how long it takes for information to have been adequately absorbed by the marketplace, out of prudence, a person in possession of material, non-public information should refrain from any trading activity for two full trading days after its official release by the Company.
March 2025
It is important to note that information is not necessarily public merely because it has been discussed in the press or on social media, which will sometimes report rumors. You should presume that information is non-public, unless you can point to the official release of that information by the Company, such as in a public filing with the Securities and Exchange Commission (“SEC”).
In addition, as discussed below, the Company prohibits directors, officers, and employees from purchasing the Company’s securities on margin and from holding the Company’s securities in margin accounts. The Company also prohibits directors, officers, and employees from engaging in short sales of the Company’s securities or trading in any derivative securities (including, but not limited to put and call options) to buy or sell Company securities.
Speculation. The Company discourages directors, officers, and employees from speculating in the Company’s securities. The Company does encourage directors, officers, and employees to invest in the Company’s securities, but investing means buying to share in the long-term growth of the Company; it does not mean short-term speculation based on fluctuations in the market. The Company recommends that personnel plan to hold any of the Company’s securities purchased in the open market for at least six months. (The directors and executive officers of the Company are subject to the federal short swing profit rules.)
Trading in Other Securities. No director, officer, or employee shall place a purchase or sale order, or recommend that another person place a purchase or sale order, in the securities (including related derivative securities, such as put or call options) of certain other entities (such as collaborators, customers, vendors, suppliers and other business partners of the Company) if the director, officer, or employee learns in the course of his or her position with the Company material, non-public information about such other company. For example, it would be a violation of this Policy, and of federal law, if an employee learned through Company sources that the Company intended to purchase assets from another company, and then bought or sold stock in that other company because of the likely increase or decrease in the value of its securities.
Confidentiality
No director, officer, or employee of the Company who acquires material, non-public information relating to the Company or the affairs of the Company shall communicate or provide such information to any other person (including family members or friends) except to the extent that such person has a need to know the information for legitimate Company-related reasons.
You may be subject to the insider trading penalties described above and/or disciplinary action by the Company for disclosing material, non-public information to persons who then purchase or sell the Company’s securities, whether or not you personally derived benefits from the trade.
This policy does not mean that ordinary business disclosure cannot or should not be made in the course of conducting business on behalf of the Company. However, the distinction between ordinary business disclosure and disclosure of material, non-public information is sometimes not clear. You should, in close cases, consult with the Company’s general counsel or, if at any time the Company does not have a general counsel, the Company’s Legal Department (the “Legal Department”). It is, of course, a corporate decision whether and when to make public disclosure of material information concerning the Company. These decisions will be made based upon judgments by senior management that take into account business objectives and relevant legal rules as to when a duty to disclose may arise. See the Company’s Code of Business Conduct and Ethics for additional information on your obligations to maintain the confidentiality of the Company’s information.
2
March 2025
Trading Windows
Window Period. The two-week period (the “window period”) beginning on the third trading day after quarter-end information is released to the public by the Company is generally considered an open trading window. There is no guarantee, however, that you will be able to trade during this window period; directors, officers, and employees must, even during this two-week window period, consider whether they are aware of material, non-public information that will preclude trading during this period.
Blackout Period. Because of their access to confidential information on a regular basis and to avoid the appearance of trading on material, non-public information, all directors and all officers of the Company and their assistants and any other employees designated from time to time by senior management (collectively, the “Blackout Group”) shall be subject to the following restrictions on trading in the Company’s securities:
• An individual in the Blackout Group may not trade the Company’s securities during a blackout period (the “Blackout Period”) beginning on the fifteenth day of the last month of any fiscal quarter and continuing until the third trading day after the Company issues a press release reporting its financial results for the quarter.
• No trades, including private transfers and gifts, may be made by members of the Blackout Group within the Blackout Period; provided, however, that:
• Individuals in the Blackout Group are also subject to the general policy regarding prohibition of insider trading applicable to all directors, officers, and employees set forth above.
• For all individuals in the Blackout Group, this Policy continues in effect until the opening of the first window period after termination of employment or other relationship with the Company, except that the pre-clearance requirements set forth above continue to apply to all officers and directors for six months after their termination of their status as members of the Blackout Group.
• Directors and officers shall promptly (and, in any event, within one business day) notify the Legal Department of any trading of the Company’s securities that is required to be reported under Section 16(a) of the Securities Exchange Act of 1934.
3
March 2025
Pre-Clearance. With respect to any proposed trade of the Company’s securities, members of the Company’s Board of Directors, the Chief Executive Officer, the Chief Financial Officer, and any other officer designated by the Company’s Board of Directors from time to time (collectively referred to as “Trader”), shall, no later than two business days prior to such proposed trade, provide notification to the Legal Department of such proposed trade on a form provided by the Legal Department (the “Notification Form”). Upon receiving the Notification Form, the Legal Department shall notify the Chairman, the Chief Executive Officer and the Chief Financial Officer of such proposed trade and provide a copy of the Notification Form signed by the Trader to them. Such notice shall not apply to the Certain Exceptions as listed below.
The Trader shall not make the proposed trade unless and until he or she receives notice from the Legal Department approving the Trade.
As to the directors only, these notification and approval requirements shall apply both while serving on the Board and until the completion of twelve calendar months after such Board service ends. Compliance with these requirements eliminates the need to obtain separate prior clearance from the Legal Department.
Certain Exceptions
The prohibition on trading in the Company’s securities set forth above does not apply to:
10b5-1 Plans/Margin Accounts and Pledges/Short Sales
10b5-1 Trading Plans. A 10b5-1 trading plan is a binding, written contract between you and your broker that specifies the price, amount, and date of trades to be executed in your account in the future, or provides a formula or mechanism that your broker will follow, that complies with the requirements of SEC Rule 10b5-1. A 10b5-1 trading plan can only be established when you do not possess material, non-public information.
4
March 2025
Therefore, Insiders cannot enter into these plans at any time when in possession of material, non-public information and, in addition, members of the Blackout Group may not enter into these plans during a Blackout Period. In addition, a 10b5-1 trading plan must not permit you to exercise any subsequent influence over how, when, or whether the purchases or sales are made.
SEC Rule 10b5-1 provides an affirmative defense against insider trading liability under Rule 10b-5 if your trade was made under a 10b5-1 trading plan that you entered into in good faith when you were not aware of material, non-public information and that otherwise complies with the requirements of Rule 10b5-1. The rules regarding 10b5-1 trading plans are complex and you must fully comply with them. You should consult with your legal advisor before proceeding.
Each Insider must pre-clear with the Legal Department its proposed 10b5-1 trading plan prior to the establishment of such plan. All such plans must comply with the requirements of Rule 10b5-1 (including specified waiting periods and limitations on multiple overlapping plans and single trade plans) and the Company reserves the right to withhold pre-clearance of any 10b5-1 trading plan that the Company determines is not consistent with the rules regarding such plans. Notwithstanding any pre-clearance of a 10b5-1 trading plan, the Company assumes no liability for the consequences of any transaction made pursuant to such plan.
If you enter into a 10b5-1 trading plan, your 10b5-1 trading plan should be structured to avoid purchases or sales shortly before known announcements, such as quarterly or annual earnings announcements. Transactions that occur at times shortly before we announce material news, even if executed in accordance with a properly formulated 10b5-1 trading plan, could result in negative publicity for you and the Company and SEC investigation.
For Insiders, any modification of a pre-approved 10b5-1 trading plan requires pre-approval by the Legal Department. Such modification must occur before you become aware of any material, non-public information and must comply with the requirements of the rules regarding 10b5-1 trading plans and, if you are subject to window period restrictions, during a window period. You should understand that frequent modifications or terminations of a 10b5-1 trading plan may call into question your good faith in entering into the plan (and therefore may jeopardize the availability of the affirmative defense against insider trading allegations).
Transactions effected pursuant to a pre-cleared 10b5-1 trading plan will not require further pre-clearance at the time of the transaction if the plan specifies the dates, prices and amounts of the contemplated trades, or establishes a formula for determining the dates, prices and amounts.
Finally, if you are in the Blackout Group, 10b5-1 trading plans require special care. Because in a 10b5-1 trading plan you can specify conditions that trigger a purchase or sale, you may not even be aware that a transaction has taken place and you may not be able to comply with the SEC’s requirement that you report your transaction to the SEC within two business days after its execution. Therefore, for the Blackout Group, you must arrange with your broker to notify the Company of all trades under the 10b5-1 trading plan in sufficient time to permit the Company to timely file all required filings under the SEC rules.
Margin Accounts and Pledges. Securities purchased on margin may be sold by the broker without the customer’s consent if the customer fails to meet a margin call. Similarly, securities held in an account which may be borrowed against or are otherwise pledged (or hypothecated) as collateral for a loan may be sold in foreclosure if the borrower defaults on the loan. Accordingly, if you purchase securities on margin or pledge them as collateral for a loan, a margin sale or foreclosure sale may occur at a time when you are aware of material, non-public information or otherwise are not permitted to trade in our securities. The sale, even though not initiated at your request, is still a sale for your benefit and may subject you to liability under the insider trading rules if made at a time when you are aware of material, non-public information.
5
March 2025
Similar cautions apply to a bank or other loans for which you have pledged stock as collateral.
Therefore, no Global Personnel, whether or not in possession of material, non-public information, may purchase the Company’s securities on margin, or borrow against any account in which the Company’s securities are held, or pledge the Company’s securities as collateral for a loan.
No Short Sales or Speculative Transactions. No Global Personnel, whether or not he or she possesses material, non-public information, may trade in options, warrants, puts and calls or similar instruments on the Company’s securities or sell such securities “short” (i.e., selling stock that is not owned and borrowing the shares to make delivery). Such activities may put the personal gain of the Global Personnel in conflict with the best interests of the Company and its securityholders or otherwise give the appearance of impropriety.
No Hedging Transactions. Global Personnel may not engage (directly or indirectly) in hedging transactions, or otherwise engage in transactions that hedge or offset, or are designed to hedge or offset, any decrease in the market value of Company securities. Hedging transactions include (but are not limited to) collars, equity swaps, exchange funds and prepaid variable forward sale contracts. Hedging transactions may allow a director, officer or other employee to continue to own Company securities, but without the full risks and rewards of ownership. This may lead to such director, officer or other employee no longer having the same objectives as the Company’s other shareholders.
Reporting Obligation
Global Personnel have an obligation to be alert to situations where persons within the Company may not be observing the laws against insider trading. Liability could be imposed where an executive officer knew or recklessly disregarded facts that another person was likely to engage in illegal conduct and failed to take appropriate steps to prevent such violations. If you have knowledge of facts that suggest a possible violation of securities laws, you should report such information as provided by the Company’s Code of Business Conduct and Ethics.
Annual Compliance Certificate
Directors, officers, and employees must sign an undertaking upon first receipt of this Policy and thereafter agree on an annual basis to continue to comply with this Policy.
4. Definitions
Material. Material information is any information that a reasonable investor would consider important in deciding whether to buy, hold, or sell securities. In short, material information includes any information (positive or negative) that could reasonably be expected to affect the price of the Company’s securities. Employees should assume that information that would affect their consideration of whether to trade, or which might tend to influence the price of the security, is material.
6
March 2025
Examples of information frequently regarded as material include:
This list illustrates the types of occurrences that would ordinarily involve material information but it is not all-inclusive. Information may be material even if it relates to future, speculative or contingent events and even if it is significant only when considered in combination with publicly available information. Courts often resolve close cases in favor of finding the information material. Therefore, you should err on the side of caution. Global Personnel should keep in mind that the SEC’s rules and regulations provide that the mere fact that a person is aware of material, non-public information is a bar to trading. It is no excuse that such person’s reasons for trading were not based on the information. If there is any reasonable question about whether information is material, you should treat that information as being material.
Non-Public Information. Information is considered non-public unless it has been adequately disclosed to the public and sufficient time has passed for the securities markets to digest the information. Examples of effective disclosure include the Company’s public filings with the SEC and the issuance of Company press releases. The information disseminated must be some form of “official” announcement. In other words, the fact that rumors, speculation, or statements attributed to unidentified sources are public is insufficient even when the information is accurate. As discussed above, any person in possession of material, non-public information should refrain from trading activity for two full trading days following the release of the information by the Company.
Security or Securities. The term “security” or “securities” is defined very broadly by the securities laws and includes stock (common and preferred), stock options, warrants, bonds, notes, debentures, convertible instruments, put or call options (i.e., exchange-traded options), or other similar instruments.
Trade or Trading. The term “trade” or “trading” means broadly any purchase, sale or other transaction to acquire, transfer or dispose of securities, including gifts, sales of stock acquired upon the exercise of options and trades made under an employee benefit plan such as a 401(k) plan.
5. Potential Criminal And Civil Liability And/Or Disciplinary Action
Individual Responsibility. Each Insider is individually responsible for complying with the securities laws and this Policy, regardless of whether the Company has prohibited trading by that Insider or any other Insiders. Trading in securities during the window periods and outside of any suspension periods should not be considered a “safe harbor.” We remind you that, whether or not during a window period, you may not trade securities while aware of material, non-public information.
Controlling Persons. The securities laws provide that, in addition to sanctions against an individual who trades illegally, penalties may be assessed against what are known as “controlling persons” with respect to the violator. The term “controlling person” is not defined, but includes employers (i.e., the Company), its directors, officers and managerial and supervisory personnel. The concept is broader than what would normally be encompassed by a reporting chain. Individuals may be considered “controlling persons” with respect to any other individual whose behavior they have the power to influence.
7
March 2025
Liability can be imposed only if two conditions are met. First, it must be shown that the “controlling person” knew or recklessly disregarded the fact that a violation was likely. Second, it must be shown that the “controlling person” failed to take appropriate steps to prevent the violation from occurring. For this reason, the Company’s supervisory personnel are directed to take appropriate steps to ensure that those they supervise, understand and comply with the requirements set forth in this Policy.
6. Twenty-Twenty Hindsight
If your securities transactions become the subject of scrutiny, they are likely to be viewed after the fact with the benefit of hindsight. Thus, you are strongly encouraged to be conservative when making judgments as to whether you are in possession of material, non-public information. As a practical matter, before engaging in any transaction, you should carefully consider how enforcement authorities and others might view the transaction in hindsight.
7. Other Related Laws and Policies
Securities trading and other activities may be subject to other restrictions and obligations under Section 16 of the Securities Exchange Act of 1934, as amended, Rule 144 under the Securities Act of 1933, as amended, and the Company’s Corporate Communications Policy.
8. Interpretation/Compliance
Any questions concerning this Policy or its applicability to specific circumstances or transactions, including decisions on whether information is material or has been adequately disclosed to the public, should be directed to the Legal Department.
8
March 2025
EXHIBIT 21.1
Subsidiaries of Global Indemnity Group, LLC
Name |
State/Country of Domicile |
Belmont Holdings GX, Inc. |
Delaware |
Belmont SGX, LLC |
Delaware |
Collectibles Insurance Services, LLC |
Pennsylvania |
Diamond State Insurance Company |
Indiana |
Global Indemnity Group Services, LLC |
Pennsylvania |
Global Indemnity Investments, Inc. |
Delaware |
Global Indemnity Services Limited |
Ireland |
J.H. Ferguson & Associates, LLC |
Pennsylvania |
Kaleidoscope Insurance Technologies, Inc. |
Delaware |
Liberty Insurance Adjustment Agency, Inc. |
Delaware |
Penn Independent Corporation |
Pennsylvania |
Penn-America Insurance Company |
Pennsylvania |
Penn-America Insurance Services, LLC |
Pennsylvania |
Penn-America Underwriters, LLC |
Delaware |
Penn-Patriot Insurance Company |
Virginia |
Penn-Star Insurance Company |
Pennsylvania |
United National Insurance Company |
Pennsylvania |
Exhibit 23.1
Consent of Independent Registered Public Accounting Firm
We consent to the incorporation by reference in the following Registration Statements:
of our reports dated March 11, 2025, with respect to the consolidated financial statements and schedules of Global Indemnity Group, LLC and the effectiveness of internal control over financial reporting of Global Indemnity Group, LLC included in this Annual Report (Form 10-K) of Global Indemnity Group, LLC for the year ended December 31, 2024.
/s/ Ernst & Young LLP
Philadelphia, Pennsylvania
March 11, 2025
Exhibit 31.1
CERTIFICATION PURSUANT TO
RULE 13a-14(a)/15d-14(a),
AS ADOPTED PURSUANT TO SECTION 302
OF THE SARBANES-OXLEY ACT OF 2002
I, Joseph W. Brown, certify that:
1. I have reviewed this Annual Report on Form 10-K for the year ended December 31, 2024 of Global Indemnity Group, LLC (the “Company”);
5. The Company’s other certifying officers and I have disclosed, based on our most recent evaluation of internal control over financial reporting, to the Company’s auditors and the audit committee of the Company’s board of directors (or persons performing the equivalent functions):
Dated: March 11, 2025
/s/ Joseph W. Brown
Joseph W. Brown
Chief Executive Officer
Exhibit 31.2
CERTIFICATION PURSUANT TO
RULE 13a-14(a)/15d-14(a),
AS ADOPTED PURSUANT TO SECTION 302
OF THE SARBANES-OXLEY ACT OF 2002
I, Brian J. Riley, certify that:
1. I have reviewed this Annual Report on Form 10-K for the year ended December 31, 2024 of Global Indemnity Group, LLC (the “Company”);
5. The Company’s other certifying officers and I have disclosed, based on our most recent evaluation of internal control over financial reporting, to the Company’s auditors and the audit committee of the Company’s board of directors (or persons performing the equivalent functions):
Dated: March 11, 2025
/s/ Brian J. Riley
Brian J. Riley
Chief Financial Officer
Exhibit 32.1
CERTIFICATION PURSUANT TO
18 U.S.C. SECTION 1350,
AS ADOPTED PURSUANT TO SECTION 906
OF THE SARBANES-OXLEY ACT OF 2002
Pursuant to Rule 13a-14(b) of the Securities Exchange Act of 1934 (the “Exchange Act”) and 18 U.S.C. Section 1350, the undersigned officer of Global Indemnity Group, LLC (the “Company”) hereby certifies that the Company’s Annual Report on Form 10-K for the year ended December 31, 2024 (the “Report”) fully complies with the requirements of Section 13(a) or 15(d) of the Exchange Act and that the information contained in the Report fairly presents, in all material respects, the financial condition and results of operations of the Company.
Dated: March 11, 2025
/s/ Joseph W. Brown
Joseph W. Brown
Chief Executive Officer
Exhibit 32.2
CERTIFICATION PURSUANT TO
18 U.S.C. SECTION 1350,
AS ADOPTED PURSUANT TO SECTION 906
OF THE SARBANES-OXLEY ACT OF 2002
Pursuant to Rule 13a-14(b) of the Securities Exchange Act of 1934 (the “Exchange Act”) and 18 U.S.C. Section 1350, the undersigned officer of Global Indemnity Group, LLC (the “Company”) hereby certifies that the Company’s Annual Report on Form 10-K for the year ended December 31, 2024 (the “Report”) fully complies with the requirements of Section 13(a) or 15(d) of the Exchange Act and that the information contained in the Report fairly presents, in all material respects, the financial condition and results of operations of the Company.
Dated: March 11, 2025
/s/ Brian J. Riley
Brian J. Riley
Chief Financial Officer