UNITED STATES
SECURITIES AND EXCHANGE COMMISSION
WASHINGTON, D.C. 20549
FORM 8-K
CURRENT REPORT
Pursuant to Section 13 or 15(d) of the Securities Exchange Act of 1934
Date of Report (Date of earliest event reported): March 04, 2025 |
AST SpaceMobile, Inc.
(Exact name of Registrant as Specified in Its Charter)
Delaware |
001-39040 |
84-2027232 |
||
(State or Other Jurisdiction |
(Commission File Number) |
(IRS Employer |
||
|
|
|
|
|
|
Midland Intl. Air & Space Port 2901 Enterprise Lane |
|
|||
Midland, Texas |
|
79706 |
||
(Address of Principal Executive Offices) |
|
(Zip Code) |
||
Registrant’s Telephone Number, Including Area Code: (432) 276-3966 |
Not Applicable |
(Former Name or Former Address, if Changed Since Last Report)
Check the appropriate box below if the Form 8-K filing is intended to simultaneously satisfy the filing obligation of the registrant under any of the following provisions:
Securities registered pursuant to Section 12(b) of the Act:
|
|
Trading |
|
|
Class A common stock, par value $0.0001 per share |
|
ASTS |
|
The Nasdaq Stock Market LLC |
Indicate by check mark whether the registrant is an emerging growth company as defined in Rule 405 of the Securities Act of 1933 (§ 230.405 of this chapter) or Rule 12b-2 of the Securities Exchange Act of 1934 (§ 240.12b-2 of this chapter).
Emerging growth company ☐
If an emerging growth company, indicate by check mark if the registrant has elected not to use the extended transition period for complying with any new or revised financial accounting standards provided pursuant to Section 13(a) of the Exchange Act. ☐
Item 2.02. Results of Operations and Financial Condition.
On March 3, 2025, AST SpaceMobile, Inc. (“AST SpaceMobile” or the “Company”) issued a press release announcing financial results for the three and twelve months ended December 31, 2024. A copy of the press release is attached hereto as Exhibit 99.1.
The information included in this Item 2.02 and in Exhibit 99.1 shall not be deemed “filed” for purposes of Section 18 of the Securities Exchange Act of 1934 (“Exchange Act”) or otherwise subject to the liabilities of that section, nor shall it be deemed incorporated by reference in any filing under the Securities Act of 1933 or the Exchange Act, except as expressly set forth by specific reference in such a filing.
Item 7.01. Regulation FD Disclosure.
AST SpaceMobile is also furnishing a Fourth Quarter 2024 Business Update, dated March 4, 2025 (the “Presentation”), attached as Exhibit 99.2 to this Current Report on Form 8-K, which may be referred to on the Company’s year end 2024 conference call to be held on March 4, 2025. The Presentation will also be available on the Company’s website at www.ast-science.com.
The information included in this Item 7.01 and in Exhibit 99.2 shall not be deemed “filed” for purposes of Section 18 of the Exchange Act or otherwise subject to the liabilities of that section, nor shall it be deemed incorporated by reference in any filing under the Securities Act of 1933 or the Exchange Act, except as expressly set forth by specific reference in such a filing.
Item 9.01. Financial Statements and Exhibits.
Exhibit No. |
Description |
104 |
Cover Page Interactive Data File (embedded within the Inline XBRL document). |
SIGNATURES
Pursuant to the requirements of the Securities Exchange Act of 1934, the registrant has duly caused this report to be signed on its behalf by the undersigned thereunto duly authorized.
|
|
|
AST SpaceMobile, Inc. |
|
|
|
|
Date: |
March 4, 2025 |
By: |
/s/ Andrew M. Johnson |
|
|
|
Name: Andrew M. Johnson |
PRESS RELEASE |
EXHIBIT 99.1 |

AST SpaceMobile Provides Business Update and Fourth Quarter and Full Year 2024 Results
MIDLAND, Texas, March 3, 2025 – AST SpaceMobile, Inc. (“AST SpaceMobile”) (NASDAQ: ASTS), the company building the first and only space-based cellular broadband network accessible directly by everyday smartphones, and designed for both commercial and government applications, is providing its business update and results for the fourth quarter and full year ended December 31, 2024.
"2024 was a milestone year for AST SpaceMobile, and we enter 2025 even better positioned to lead the emerging direct-to-device satellite communications industry that we invented," said Abel Avellan, Founder, Chairman and CEO of AST SpaceMobile. "The many pieces of our plan are rapidly coming into place. We advanced our customer ecosystem, formalized definitive commercial agreements, and expanded our U.S. Government capabilities. Finally, we completed a carefully structured financing transaction with minimal dilution to current shareholders, enabling us to accelerate our manufacturing efforts and start 2025 stronger than ever."
“With nearly $1.0 billion in cash on our balance sheet pro forma for the recent offering of convertible notes, an alliance of industry leading partners, and our proprietary technology, we are well-positioned for continued success,” added Avellan. “We are laser-focused on building and deploying satellites and expanding our commercial agreements during 2025, moving toward commercial-scale revenues. Our vision has never been clearer, and we believe we have the resources and capabilities to execute our plans.”
Business Update
Fourth Quarter and Full Year 2024 Financial Highlights
(1) See reconciliation of Adjusted operating expenses to Total operating expenses, Adjusted engineering services costs to Engineering services costs and Adjusted general and administrative costs to General and administrative costs in the tables accompanying this press release.
Non-GAAP Financial Measures
We refer to certain non-GAAP financial measures in this press release, including Adjusted operating expenses, Adjusted engineering services costs and Adjusted general and administrative costs. We believe these non-GAAP financial measures are useful measures across time in evaluating our operating performance as we use these measures to manage the business, including in preparing our annual operating budget and financial projections. These non-GAAP financial measures have no standardized meaning prescribed by U.S. GAAP, and therefore have limits in their usefulness to investors. Because of the non-standardized definitions, these measures may not be comparable to the calculation of similar measures of other companies and are presented solely to provide investors with useful information to more fully understand how management assesses performance. These measures are not, and should not be viewed as, a substitute for their most directly comparable GAAP measures. Reconciliation of non-GAAP financial measures and the most directly comparable GAAP financial measures are included in the tables accompanying this press release.
Conference Call Information
AST SpaceMobile will hold a quarterly business update conference call at 5:00 p.m. (Eastern Time) on Tuesday, March 4, 2025. The call will be accessible via a live webcast on the Events page of AST SpaceMobile’s Investor Relations website at https://ast-science.com/investors/. An archive of the webcast will be available shortly after the call.
About AST SpaceMobile
AST SpaceMobile is building the first and only global cellular broadband network in space to operate directly with standard, unmodified mobile devices based on our extensive IP and patent portfolio, and designed for both commercial and government applications. Our engineers and space scientists are on a mission to eliminate the connectivity gaps faced by today’s five billion mobile subscribers and finally bring broadband to the billions who remain unconnected.
For more information, follow AST SpaceMobile on YouTube, X (Formerly Twitter), LinkedIn and Facebook. Watch this video for an overview of the SpaceMobile mission.
Forward-Looking Statements
This communication contains “forward-looking statements” that are not historical facts, and involve risks and uncertainties that could cause actual results of AST SpaceMobile to differ materially from those expected and projected. These forward-looking statements can be identified by the use of forward-looking terminology, including the words “believes,” “estimates,” “anticipates,” “expects,” “intends,” “plans,” “may,” “will,” “would,” “potential,” “projects,” “predicts,” “continue,” or “should,” or, in each case, their negative or other variations or comparable terminology. These forward-looking statements involve significant risks and uncertainties that could cause the actual results to differ materially from the expected results. Most of these factors are outside AST SpaceMobile’s control and are difficult to predict.
Factors that could cause such differences include, but are not limited to: (i) expectations regarding AST SpaceMobile’s strategies and future financial performance, including AST’s future business plans or objectives, expected functionality of the SpaceMobile Service, anticipated timing of the launch of the Block 2 BlueBird satellites, anticipated demand and acceptance of mobile satellite services, prospective performance and commercial opportunities and competitors, the timing of obtaining regulatory approvals, ability to finance its research and development activities, commercial partnership acquisition and retention, products and services, pricing, marketing plans, operating expenses, market trends, revenues, liquidity, cash flows and uses of cash, capital expenditures, and AST SpaceMobile’s ability to invest in growth initiatives; (ii) the negotiation of definitive agreements with mobile network operators relating to the SpaceMobile Service that would supersede preliminary agreements and memoranda of understanding and the ability to enter into commercial agreements with other parties or government entities; (iii) the ability of AST SpaceMobile to grow and manage growth profitably and retain its key employees and AST SpaceMobile’s responses to actions of its competitors and its ability to effectively compete; (iv) changes in applicable laws or regulations; (v) the possibility that AST SpaceMobile may be adversely affected by other economic, business, and/or competitive factors; (vi) the outcome of any legal proceedings that may be instituted against AST SpaceMobile; and (vii) other risks and uncertainties indicated in the Company’s filings with the Securities and Exchange Commission (SEC), including those in the Risk Factors section of AST SpaceMobile’s Form 10-K to be filed with the SEC on March 3, 2025.
AST SpaceMobile cautions that the foregoing list of factors is not exclusive. AST SpaceMobile cautions readers not to place undue reliance upon any forward-looking statements, which speak only as of the date made. For information identifying important factors that could cause actual results to differ materially from those anticipated in the forward-looking statements, please refer to the Risk Factors in AST SpaceMobile’s Form 10-K to be filed with the SEC on March 3, 2025. AST SpaceMobile’s securities filings can be accessed on the EDGAR section of the SEC’s website at www.sec.gov. Except as expressly required by applicable securities law, AST SpaceMobile disclaims any intention or obligation to update or revise any forward-looking statements whether as a result of new information, future events or otherwise.
Investor Contact:
Scott Wisniewski
investors@ast-science.com
Media Contact:
Allison
Eva Murphy Ryan
917-547-7289
ASTSpaceMobile@allisonpr.com
Fourth Quarter and Fiscal Year 2024 Financial Results
AST SPACEMOBILE, INC.
CONSOLIDATED BALANCE SHEETS
(Dollars in thousands, except share data)
|
|
December 31, |
|
|||||
|
|
2024 |
|
|
2023 |
|
||
ASSETS |
|
|
|
|
|
|
||
Current assets: |
|
|
|
|
|
|
||
Cash and cash equivalents |
|
$ |
564,988 |
|
|
$ |
85,622 |
|
Restricted cash |
|
|
2,546 |
|
|
|
2,475 |
|
Prepaid expenses |
|
|
7,887 |
|
|
|
4,591 |
|
Other current assets |
|
|
24,825 |
|
|
|
14,194 |
|
Total current assets |
|
|
600,246 |
|
|
|
106,882 |
|
|
|
|
|
|
|
|
||
Non-current assets: |
|
|
|
|
|
|
||
Property and equipment, net |
|
|
337,669 |
|
|
|
238,478 |
|
Operating lease right-of-use assets, net |
|
|
14,014 |
|
|
|
13,221 |
|
Other non-current assets |
|
|
2,632 |
|
|
|
2,311 |
|
TOTAL ASSETS |
|
$ |
954,561 |
|
|
$ |
360,892 |
|
|
|
|
|
|
|
|
||
LIABILITIES AND STOCKHOLDERS' EQUITY |
|
|
|
|
|
|
||
Current liabilities: |
|
|
|
|
|
|
||
Accounts payable |
|
$ |
17,004 |
|
|
$ |
20,575 |
|
Accrued expenses and other current liabilities |
|
|
12,195 |
|
|
|
23,926 |
|
Contract liabilities |
|
|
41,968 |
|
|
|
- |
|
Current operating lease liabilities |
|
|
1,856 |
|
|
|
1,468 |
|
Current portion of long-term debt, net |
|
|
2,919 |
|
|
|
252 |
|
Total current liabilities |
|
|
75,942 |
|
|
|
46,221 |
|
|
|
|
|
|
|
|
||
Non-current liabilities: |
|
|
|
|
|
|
||
Warrant liabilities |
|
|
41,248 |
|
|
|
29,960 |
|
Non-current operating lease liabilities |
|
|
12,652 |
|
|
|
11,900 |
|
Long-term debt, net |
|
|
155,573 |
|
|
|
59,252 |
|
Total liabilities |
|
|
285,415 |
|
|
|
147,333 |
|
|
|
|
|
|
|
|
||
Commitments and contingencies |
|
|
|
|
|
|
||
|
|
|
|
|
|
|
||
Stockholders' Equity: |
|
|
|
|
|
|
||
Class A Common Stock, $.0001 par value, 800,000,000 shares authorized, 208,173,198 and 90,161,309 shares issued and outstanding as of December 31, 2024 and 2023, respectively. |
|
|
20 |
|
|
|
9 |
|
Class B Common Stock, $.0001 par value, 200,000,000 shares authorized, 11,227,292 and 50,041,757 shares issued and outstanding as of December 31, 2024 and 2023, respectively. |
|
|
4 |
|
|
|
5 |
|
Class C Common Stock, $.0001 par value, 125,000,000 shares authorized, 78,163,078 shares issued and outstanding as of December 31, 2024 and 2023. |
|
|
8 |
|
|
|
8 |
|
Additional paid-in capital |
|
|
969,004 |
|
|
|
288,404 |
|
Accumulated other comprehensive (loss) income |
|
|
(176 |
) |
|
|
227 |
|
Accumulated deficit |
|
|
(489,745 |
) |
|
|
(189,662 |
) |
Noncontrolling interest |
|
|
190,031 |
|
|
|
114,568 |
|
Total stockholders' equity |
|
|
669,146 |
|
|
|
213,559 |
|
|
|
|
|
|
|
|
||
TOTAL LIABILITIES AND STOCKHOLDERS' EQUITY |
|
$ |
954,561 |
|
|
$ |
360,892 |
|
AST SPACEMOBILE, INC.
CONSOLIDATED STATEMENTS OF OPERATIONS
(Dollars in thousands, except share and per share data)
|
|
Year Ended December 31, |
|
|
|||||||||
|
|
2024 |
|
|
2023 |
|
|
2022 |
|
|
|||
|
|
|
|
|
|
|
|
|
|
|
|||
Revenues |
|
$ |
4,418 |
|
|
$ |
- |
|
|
$ |
13,825 |
|
|
|
|
|
|
|
|
|
|
|
|
|
|||
Operating expenses: |
|
|
|
|
|
|
|
|
|
|
|||
Costs to fulfill Nano contracts (exclusive of items shown separately below) |
|
|
- |
|
|
|
- |
|
|
|
6,714 |
|
|
Engineering services costs |
|
|
93,491 |
|
|
|
78,811 |
|
|
|
54,212 |
|
|
General and administrative costs |
|
|
61,566 |
|
|
|
41,601 |
|
|
|
48,332 |
|
|
Research and development costs |
|
|
28,783 |
|
|
|
47,486 |
|
|
|
45,620 |
|
|
Depreciation and amortization |
|
|
63,340 |
|
|
|
54,469 |
|
|
|
4,711 |
|
|
Total operating expenses |
|
|
247,180 |
|
|
|
222,367 |
|
|
|
159,589 |
|
|
|
|
|
|
|
|
|
|
|
|
|
|||
Other income (expense): |
|
|
|
|
|
|
|
|
|
|
|||
(Loss) gain on remeasurement of warrant liabilities |
|
|
(268,627 |
) |
|
|
8,986 |
|
|
|
19,114 |
|
|
Interest expense |
|
|
(18,681 |
) |
|
|
(4,511 |
) |
|
|
(216 |
) |
|
Interest income |
|
|
14,164 |
|
|
|
7,186 |
|
|
|
2,849 |
|
|
Other income (expense), net |
|
|
1,867 |
|
|
|
(10,290 |
) |
|
|
21,521 |
|
|
Loss on extinguishment of debt |
|
|
(10,963 |
) |
|
|
- |
|
|
|
- |
|
|
Total other (expense) income, net |
|
|
(282,240 |
) |
|
|
1,371 |
|
|
|
43,268 |
|
|
|
|
|
|
|
|
|
|
|
|
|
|||
Loss before income tax expense |
|
|
(525,002 |
) |
|
|
(220,996 |
) |
|
|
(102,496 |
) |
|
Income tax expense |
|
|
(1,328 |
) |
|
|
(1,681 |
) |
|
|
(617 |
) |
|
Net loss before allocation to noncontrolling interest |
|
|
(526,330 |
) |
|
|
(222,677 |
) |
|
|
(103,113 |
) |
|
|
|
|
|
|
|
|
|
|
|
|
|||
Net loss attributable to noncontrolling interest |
|
|
(226,247 |
) |
|
|
(135,116 |
) |
|
|
(71,473 |
) |
|
Net loss attributable to common stockholders |
|
$ |
(300,083 |
) |
|
$ |
(87,561 |
) |
|
$ |
(31,640 |
) |
|
Net loss per share attributable to holders of Class A Common Stock |
|
|
|
|
|
|
|
|
|
|
|||
Basic and diluted |
|
$ |
(1.94 |
) |
|
$ |
(1.07 |
) |
|
$ |
(0.58 |
) |
|
Weighted-average shares of Class A Common Stock outstanding |
|
|
|
|
|
|
|
|
|
|
|||
Basic and diluted |
|
|
154,501,344 |
|
|
|
81,824,122 |
|
|
|
54,437,073 |
|
|
AST SPACEMOBILE, INC.
CONSOLIDATED STATEMENTS OF COMPREHENSIVE INCOME (LOSS)
(Dollars in thousands)
|
|
Year Ended December 31, |
|
|||||||||
|
|
2024 |
|
|
2023 |
|
|
2022 |
|
|||
|
|
|
|
|
|
|
|
|
|
|||
Net income loss before allocation to noncontrolling interest |
|
$ |
(526,330 |
) |
|
$ |
(222,677 |
) |
|
$ |
(103,113 |
) |
Other comprehensive loss |
|
|
|
|
|
|
|
|
|
|||
Foreign currency translation adjustments |
|
|
(586 |
) |
|
|
(6 |
) |
|
|
(295 |
) |
Total other comprehensive loss |
|
|
(586 |
) |
|
|
(6 |
) |
|
|
(295 |
) |
Total comprehensive loss before allocation to noncontrolling interest |
|
|
(526,916 |
) |
|
|
(222,683 |
) |
|
|
(103,408 |
) |
Comprehensive loss attributable to noncontrolling interest |
|
|
(226,430 |
) |
|
|
(135,120 |
) |
|
|
(71,704 |
) |
Comprehensive loss attributable to common stockholders |
|
$ |
(300,486 |
) |
|
$ |
(87,563 |
) |
|
$ |
(31,704 |
) |
AST SPACEMOBILE, INC.
CONSOLIDATED STATEMENTS OF OPERATIONS (UNAUDITED)
(Dollars in thousands, except share and per share data)
|
|
For the Three Months Ended December 31, |
|
|||||||||
|
|
2024 |
|
|
2023 |
|
|
2022 |
|
|||
|
|
|
|
|
|
|
|
|
|
|||
Revenues |
|
$ |
1,918 |
|
|
$ |
- |
|
|
$ |
- |
|
|
|
|
|
|
|
|
|
|
|
|||
Operating expenses: |
|
|
|
|
|
|
|
|
|
|||
Engineering services costs |
|
|
30,945 |
|
|
|
19,992 |
|
|
|
16,004 |
|
General and administrative costs |
|
|
15,889 |
|
|
|
10,528 |
|
|
|
10,698 |
|
Research and development costs |
|
|
5,348 |
|
|
|
10,766 |
|
|
|
14,651 |
|
Depreciation and amortization |
|
|
8,460 |
|
|
|
19,592 |
|
|
|
1,254 |
|
Total operating expenses |
|
|
60,642 |
|
|
|
60,878 |
|
|
|
42,607 |
|
|
|
|
|
|
|
|
|
|
|
|||
Other income (expense): |
|
|
|
|
|
|
|
|
|
|||
Gain (loss) on remeasurement of warrant liabilities |
|
|
16,212 |
|
|
|
(12,468 |
) |
|
|
17,445 |
|
Interest expense |
|
|
(3,949 |
) |
|
|
(3,024 |
) |
|
|
(53 |
) |
Interest income |
|
|
5,277 |
|
|
|
1,389 |
|
|
|
1,665 |
|
Other income (expense), net |
|
|
206 |
|
|
|
(55 |
) |
|
|
(1,669 |
) |
Loss on extinguishment of debt |
|
|
(10,963 |
) |
|
|
- |
|
|
|
- |
|
Total other (expense) income, net |
|
|
6,783 |
|
|
|
(14,158 |
) |
|
|
17,388 |
|
|
|
|
|
|
|
|
|
|
|
|||
Loss before income tax expense |
|
|
(51,941 |
) |
|
|
(75,036 |
) |
|
|
(25,219 |
) |
Income tax (expense) benefit |
|
|
(156 |
) |
|
|
(2,088 |
) |
|
|
130 |
|
Net loss before allocation to noncontrolling interest |
|
|
(52,097 |
) |
|
|
(77,124 |
) |
|
|
(25,089 |
) |
|
|
|
|
|
|
|
|
|
|
|||
Net loss attributable to noncontrolling interest |
|
|
(16,239 |
) |
|
|
(45,198 |
) |
|
|
(16,860 |
) |
Net loss attributable to common stockholders |
|
$ |
(35,858 |
) |
|
$ |
(31,926 |
) |
|
$ |
(8,229 |
) |
Net loss per share attributable to holders of Class A Common Stock |
|
|
|
|
|
|
|
|
|
|||
Basic and diluted |
|
$ |
(0.18 |
) |
|
$ |
(0.35 |
) |
|
$ |
(0.14 |
) |
Weighted-average shares of Class A Common Stock outstanding |
|
|
|
|
|
|
|
|
|
|||
Basic and diluted |
|
|
199,219,379 |
|
|
|
90,008,459 |
|
|
|
60,799,275 |
|
AST SPACEMOBILE, INC.
CONSOLIDATED STATEMENTS OF COMPREHENSIVE INCOME (LOSS) (UNAUDITED)
(Dollars in thousands)
|
|
For the Three Months Ended December 31, |
|
|||||||||
|
|
2024 |
|
|
2023 |
|
|
2022 |
|
|||
|
|
|
|
|
|
|
|
|
|
|||
Net income loss before allocation to noncontrolling interest |
|
$ |
(51,941 |
) |
|
$ |
(77,124 |
) |
|
$ |
(25,089 |
) |
Other comprehensive loss |
|
|
|
|
|
|
|
|
|
|||
Foreign currency translation adjustments |
|
|
190 |
|
|
|
520 |
|
|
|
1,570 |
|
Total other comprehensive loss |
|
|
190 |
|
|
|
520 |
|
|
|
1,570 |
|
Total comprehensive loss before allocation to noncontrolling interest |
|
|
(51,751 |
) |
|
|
(76,604 |
) |
|
|
(23,519 |
) |
Comprehensive loss attributable to noncontrolling interest |
|
|
(16,486 |
) |
|
|
(44,894 |
) |
|
|
(15,789 |
) |
Comprehensive loss attributable to common stockholders |
|
$ |
(35,265 |
) |
|
$ |
(31,710 |
) |
|
$ |
(7,730 |
) |
AST SPACEMOBILE, INC.
CONSOLIDATED STATEMENTS OF CASH FLOWS
(Dollars in thousands)
|
Years Ended December 31, |
|
|||||||||
|
2024 |
|
|
2023 |
|
|
2022 |
|
|||
|
|
|
|
|
|
|
|
|
|||
Cash flows from operating activities: |
|
|
|
|
|
|
|
|
|||
Net loss before allocation to noncontrolling interest |
$ |
(526,330 |
) |
|
$ |
(222,677 |
) |
|
$ |
(103,113 |
) |
Adjustments to reconcile net loss before noncontrolling interest to cash |
|
|
|
|
|
|
|
|
|||
Gain on sale of Nano |
|
- |
|
|
|
- |
|
|
|
(24,542 |
) |
Depreciation and amortization |
|
63,340 |
|
|
|
54,469 |
|
|
|
4,711 |
|
Amortization of debt issuance costs |
|
3,734 |
|
|
|
1,155 |
|
|
|
- |
|
Write off of unamortized debt issuance costs |
|
5,483 |
|
|
|
- |
|
|
|
- |
|
Loss on disposal/sale of property and equipment |
|
2,221 |
|
|
|
110 |
|
|
|
305 |
|
Loss (gain) on remeasurement of warrant liabilities |
|
268,627 |
|
|
|
(8,986 |
) |
|
|
(19,114 |
) |
Stock-based compensation |
|
32,039 |
|
|
|
13,289 |
|
|
|
9,391 |
|
Paid-in-kind ("PIK") interest expense |
|
2,959 |
|
|
|
- |
|
|
|
- |
|
Issuance of common stock for commitment shares |
|
- |
|
|
|
- |
|
|
|
332 |
|
Changes in operating assets and liabilities: |
|
|
|
|
|
|
|
|
|||
Accounts receivable |
|
- |
|
|
|
- |
|
|
|
(1,993 |
) |
Inventory |
|
- |
|
|
|
- |
|
|
|
(2,461 |
) |
Prepaid expenses and other current assets |
|
(14,016 |
) |
|
|
12,082 |
|
|
|
(24,588 |
) |
Accounts payable and accrued expenses |
|
(6,257 |
) |
|
|
(149 |
) |
|
|
18,438 |
|
Operating lease right-of-use assets and operating lease liabilities |
|
349 |
|
|
|
48 |
|
|
|
40 |
|
Contract liabilities |
|
41,968 |
|
|
|
- |
|
|
|
2,395 |
|
Other assets and liabilities |
|
(260 |
) |
|
|
1,717 |
|
|
|
(16,265 |
) |
Net cash used in operating activities |
|
(126,143 |
) |
|
|
(148,942 |
) |
|
|
(156,464 |
) |
|
|
|
|
|
|
|
|
|
|||
Cash flows from investing activities: |
|
|
|
|
|
|
|
|
|||
Purchase of property and equipment |
|
(174,127 |
) |
|
|
(118,807 |
) |
|
|
(57,284 |
) |
Proceeds from sale of Nano, net of cash deconsolidated and transaction costs |
|
- |
|
|
|
- |
|
|
|
25,932 |
|
Net cash used in investing activities |
|
(174,127 |
) |
|
|
(118,807 |
) |
|
|
(31,352 |
) |
|
|
|
|
|
|
|
|
|
|||
Cash flows from financing activities: |
|
|
|
|
|
|
|
|
|||
Proceeds from debt |
|
145,000 |
|
|
|
63,500 |
|
|
|
230 |
|
Repayments of debt |
|
(48,752 |
) |
|
|
(242 |
) |
|
|
- |
|
Payment for debt issuance costs |
|
(9,435 |
) |
|
|
(9,653 |
) |
|
|
- |
|
Proceeds from issuance of common stock |
|
551,947 |
|
|
|
64,639 |
|
|
|
104,770 |
|
Payments for third party equity issuance costs |
|
(12,151 |
) |
|
|
(872 |
) |
|
|
(2,747 |
) |
Proceeds from warrant exercises |
|
153,618 |
|
|
|
- |
|
|
|
14 |
|
Issuance of equity under employee stock plan |
|
4,941 |
|
|
|
225 |
|
|
|
73 |
|
Employee taxes paid for stock-based compensation awards |
|
(5,201 |
) |
|
|
(865 |
) |
|
|
- |
|
Net cash provided by financing activities |
|
779,967 |
|
|
|
116,732 |
|
|
|
102,340 |
|
|
|
|
|
|
|
|
|
|
|||
Effect of exchange rate changes on cash, cash equivalents and restricted cash |
|
(260 |
) |
|
|
(142 |
) |
|
|
195 |
|
|
|
|
|
|
|
|
|
|
|||
Net increase (decrease) in cash, cash equivalents and restricted cash |
|
479,437 |
|
|
|
(151,159 |
) |
|
|
(85,281 |
) |
Cash, cash equivalents and restricted cash, beginning of period |
|
88,097 |
|
|
|
239,256 |
|
|
|
324,537 |
|
Cash, cash equivalents and restricted cash, end of period |
$ |
567,534 |
|
|
$ |
88,097 |
|
|
$ |
239,256 |
|
|
|
|
|
|
|
|
|
|
|||
Supplemental disclosure of cash flow information: |
|
|
|
|
|
|
|
|
|||
Non-cash activities: |
|
|
|
|
|
|
|
|
|||
Right-of-use assets obtained in exchange for operating lease liabilities |
$ |
2,238 |
|
|
$ |
6,739 |
|
|
$ |
1,129 |
|
Non-cash investing and financing activities: |
|
|
|
|
|
|
|
|
|||
Purchases of property and equipment in accounts payable and accrued expenses |
$ |
9,309 |
|
|
$ |
18,409 |
|
|
$ |
4,926 |
|
PIK interest paid through issuance of PIK notes |
|
2,959 |
|
|
|
- |
|
|
|
- |
|
Settlement of warrant liabilities by issuing shares |
|
257,337 |
|
|
|
- |
|
|
|
- |
|
Cash paid during the fiscal year for: |
|
|
|
|
|
|
|
|
|||
Interest |
$ |
11,988 |
|
|
$ |
3,243 |
|
|
$ |
224 |
|
Income taxes, net |
|
1,669 |
|
|
|
492 |
|
|
|
684 |
|
AST SPACEMOBILE, INC.
RECONCILIATION OF GAAP REPORTED TO NON-GAAP ADJUSTED MEASURES (UNAUDITED)
(Dollars in thousands)
|
|
For the Three Months Ended December 31, 2024 |
|
|||||||||
|
|
GAAP Reported |
|
|
Stock-Based Compensation Expense |
|
|
Adjusted |
|
|||
|
|
|
|
|
|
|
|
|
|
|||
Engineering services costs |
|
$ |
30,945 |
|
|
$ |
(8,347 |
) |
|
$ |
22,598 |
|
General and administrative costs |
|
|
15,889 |
|
|
$ |
(3,075 |
) |
|
|
12,814 |
|
Research and development costs |
|
|
5,348 |
|
|
|
|
|
|
5,348 |
|
|
Depreciation and amortization |
|
|
8,460 |
|
|
|
|
|
|
8,460 |
|
|
Total operating expenses |
|
$ |
60,642 |
|
|
$ |
(11,422 |
) |
|
$ |
49,220 |
|
Less: Depreciation and amortization |
|
|
|
|
|
|
|
|
(8,460 |
) |
||
Adjusted operating expenses |
|
|
|
|
|
|
|
$ |
40,760 |
|
||
|
|
For the Three Months Ended September 30, 2024 |
|
|||||||||
|
|
GAAP Reported |
|
|
Stock-Based Compensation Expense |
|
|
Adjusted |
|
|||
Engineering services costs |
|
$ |
21,828 |
|
|
$ |
(3,431 |
) |
|
$ |
18,397 |
|
General and administrative costs |
|
|
15,551 |
|
|
|
(3,379 |
) |
|
|
12,172 |
|
Research and development costs |
|
|
14,724 |
|
|
|
- |
|
|
|
14,724 |
|
Depreciation and amortization |
|
|
14,543 |
|
|
|
- |
|
|
|
14,543 |
|
Total operating expenses |
|
$ |
66,646 |
|
|
$ |
(6,810 |
) |
|
$ |
59,836 |
|
Less: Depreciation and amortization |
|
|
|
|
|
|
|
|
(14,543 |
) |
||
Adjusted operating expenses |
|
|
|
|
|
|
|
$ |
45,293 |
|
||
Adjusted operating expenses, Adjusted engineering services costs and Adjusted general and administrative costs are alternative financial measures used by management to evaluate our operating performance as a supplement to our most directly comparable U.S. GAAP financial measure. We define Adjusted operating expense as Total operating expenses adjusted to exclude amounts of stock-based compensation expense and depreciation and amortization expense. We define Adjusted engineering services costs and Adjusted general and administrative costs as engineering services costs and general and administrative costs adjusted to exclude stock-based compensation expenses.
We believe Adjusted operating expenses, Adjusted engineering services costs and Adjusted general and administrative costs are useful measures across time in evaluating our operating performance as we use these measures to manage the business, including in preparing our annual operating budget and financial projections. Adjusted operating expenses, Adjusted engineering services costs, and Adjusted general and administrative costs are non-GAAP financial measures that have no standardized meaning prescribed by U.S. GAAP, and therefore have limits in their usefulness to investors. Because of the non-standardized definitions, these measures may not be comparable to the calculation of similar measures of other companies and are presented solely to provide investors with useful information to more fully understand how management assesses performance. These measures are not, and should not be viewed as, a substitute for their most directly comparable GAAP measure of Total operating expenses, Engineering services costs and General and administrative costs.
Transforming howthe world connects Business Update – Fourth Quarter 2024 March 4, 2025 NASDAQ: ASTS ast-science.com

ast-science.com Forward Looking Statements This communication contains “forward-looking statements” that are not historical facts, and involve risks and uncertainties that could cause actual results of AST SpaceMobile to differ materially from those expected and projected. These forward-looking statements can be identified by the use of forward-looking terminology, including the words “believes,” “estimates,” “anticipates,” “expects,” “intends,” “plans,” “may,” “will,” “would,” “potential,” “projects,” “predicts,” “continue,” or “should,” or, in each case, their negative or other variations or comparable terminology. These forward-looking statements involve significant risks and uncertainties that could cause the actual results to differ materially from the expected results. Most of these factors are outside AST SpaceMobile’s control and are difficult to predict. Factors that could cause such differences include, but are not limited to: (i) expectations regarding AST SpaceMobile’s strategies and future financial performance, including AST’s future business plans or objectives, expected functionality of the SpaceMobile Service, anticipated timing of the launch of the Block 2 BlueBird satellites, anticipated demand and acceptance of mobile satellite services, prospective performance and commercial opportunities and competitors, the timing of obtaining regulatory approvals, ability to finance its research and development activities, commercial partnership acquisition and retention, products and services, pricing, marketing plans, operating expenses, market trends, revenues, liquidity, cash flows and uses of cash, capital expenditures, and AST SpaceMobile’s ability to invest in growth initiatives; (ii) the negotiation of definitive agreements with mobile network operators relating to the SpaceMobile Service that would supersede preliminary agreements and memoranda of understanding and the ability to enter into commercial agreements with other parties or government entities; (iii) the ability of AST SpaceMobile to grow and manage growth profitably and retain its key employees and AST SpaceMobile’s responses to actions of its competitors and its ability to effectively compete; (iv) changes in applicable laws or regulations; (v) the possibility that AST SpaceMobile may be adversely affected by other economic, business, and/or competitive factors; (vi) the outcome of any legal proceedings that may be instituted against AST SpaceMobile; and (vii) other risks and uncertainties indicated in the Company’s filings with the Securities and Exchange Commission (SEC), including those in the Risk Factors section of AST SpaceMobile’s Form 10-K to be filed with the SEC on March 3, 2025. AST SpaceMobile cautions that the foregoing list of factors is not exclusive. AST SpaceMobile cautions readers not to place undue reliance upon any forward-looking statements, which speak only as of the date made. For information identifying important factors that could cause actual results to differ materially from those anticipated in the forward-looking statements, please refer to the Risk Factors in AST SpaceMobile’s Form 10-K to be filed with the SEC on March 3, 2025. AST SpaceMobile’s securities filings can be accessed on the EDGAR section of the SEC’s website at www.sec.gov. Except as expressly required by applicable securities law, AST SpaceMobile disclaims any intention or obligation to update or revise any forward-looking statements whether as a result of new information, future events or otherwise. Use of Non-GAAP Financial Measures Adjusted operating expense is an alternative financial measure used by management to evaluate our operating performance as a supplement to our most directly comparable U.S. GAAP financial measure. We define Adjusted operating expense as total operating expenses adjusted to exclude amounts of stock-based compensation expense and depreciation and amortization expense. We believe Adjusted operating expenses is a useful measure across time in evaluating the Company's operating performance as we use Adjusted operating expenses to manage the business, including in preparing our annual operating budget and financial projections. Adjusted operating expense is a non-GAAP financial measure that has no standardized meaning prescribed by U.S. GAAP, and therefore has limits in its usefulness to investors. Because of the non-standardized definition, it may not be comparable to the calculation of similar measures of other companies and are presented solely to provide investors with useful information to more fully understand how management assesses performance. This measure is not, and should not be viewed as, a substitute for its most directly comparable GAAP measure of total operating expenses. Industry and Market Data This presentation includes market data and other statistical information from sources believed to be reliable, including independent industry publications, governmental publications or other published independent sources. Although AST SpaceMobile believes these sources are reliable, we have not independently verified the information and cannot guarantee its accuracy and completeness. Trademarks and Trade Names AST SpaceMobile owns or has rights to various trademarks, service marks and trade names that they use in connection with the operation of their respective businesses. This presentation also contains trademarks, service marks and trade names of third parties, which are the property of their respective owners. The use or display of third parties’ trademarks, service marks, trade names or products in this presentation is not intended to, and does not imply, a relationship with AST SpaceMobile, or an endorsement or sponsorship by or of AST SpaceMobile. Solely for convenience, the trademarks, service marks and trade names referred to in this presentation may appear without the ®, TM or SM symbols, but such references are not intended to indicate, in any way, that AST SpaceMobile will not assert, to the fullest extent under applicable law, their rights or the right of the applicable licensor to these trademarks, service marks and trade names.
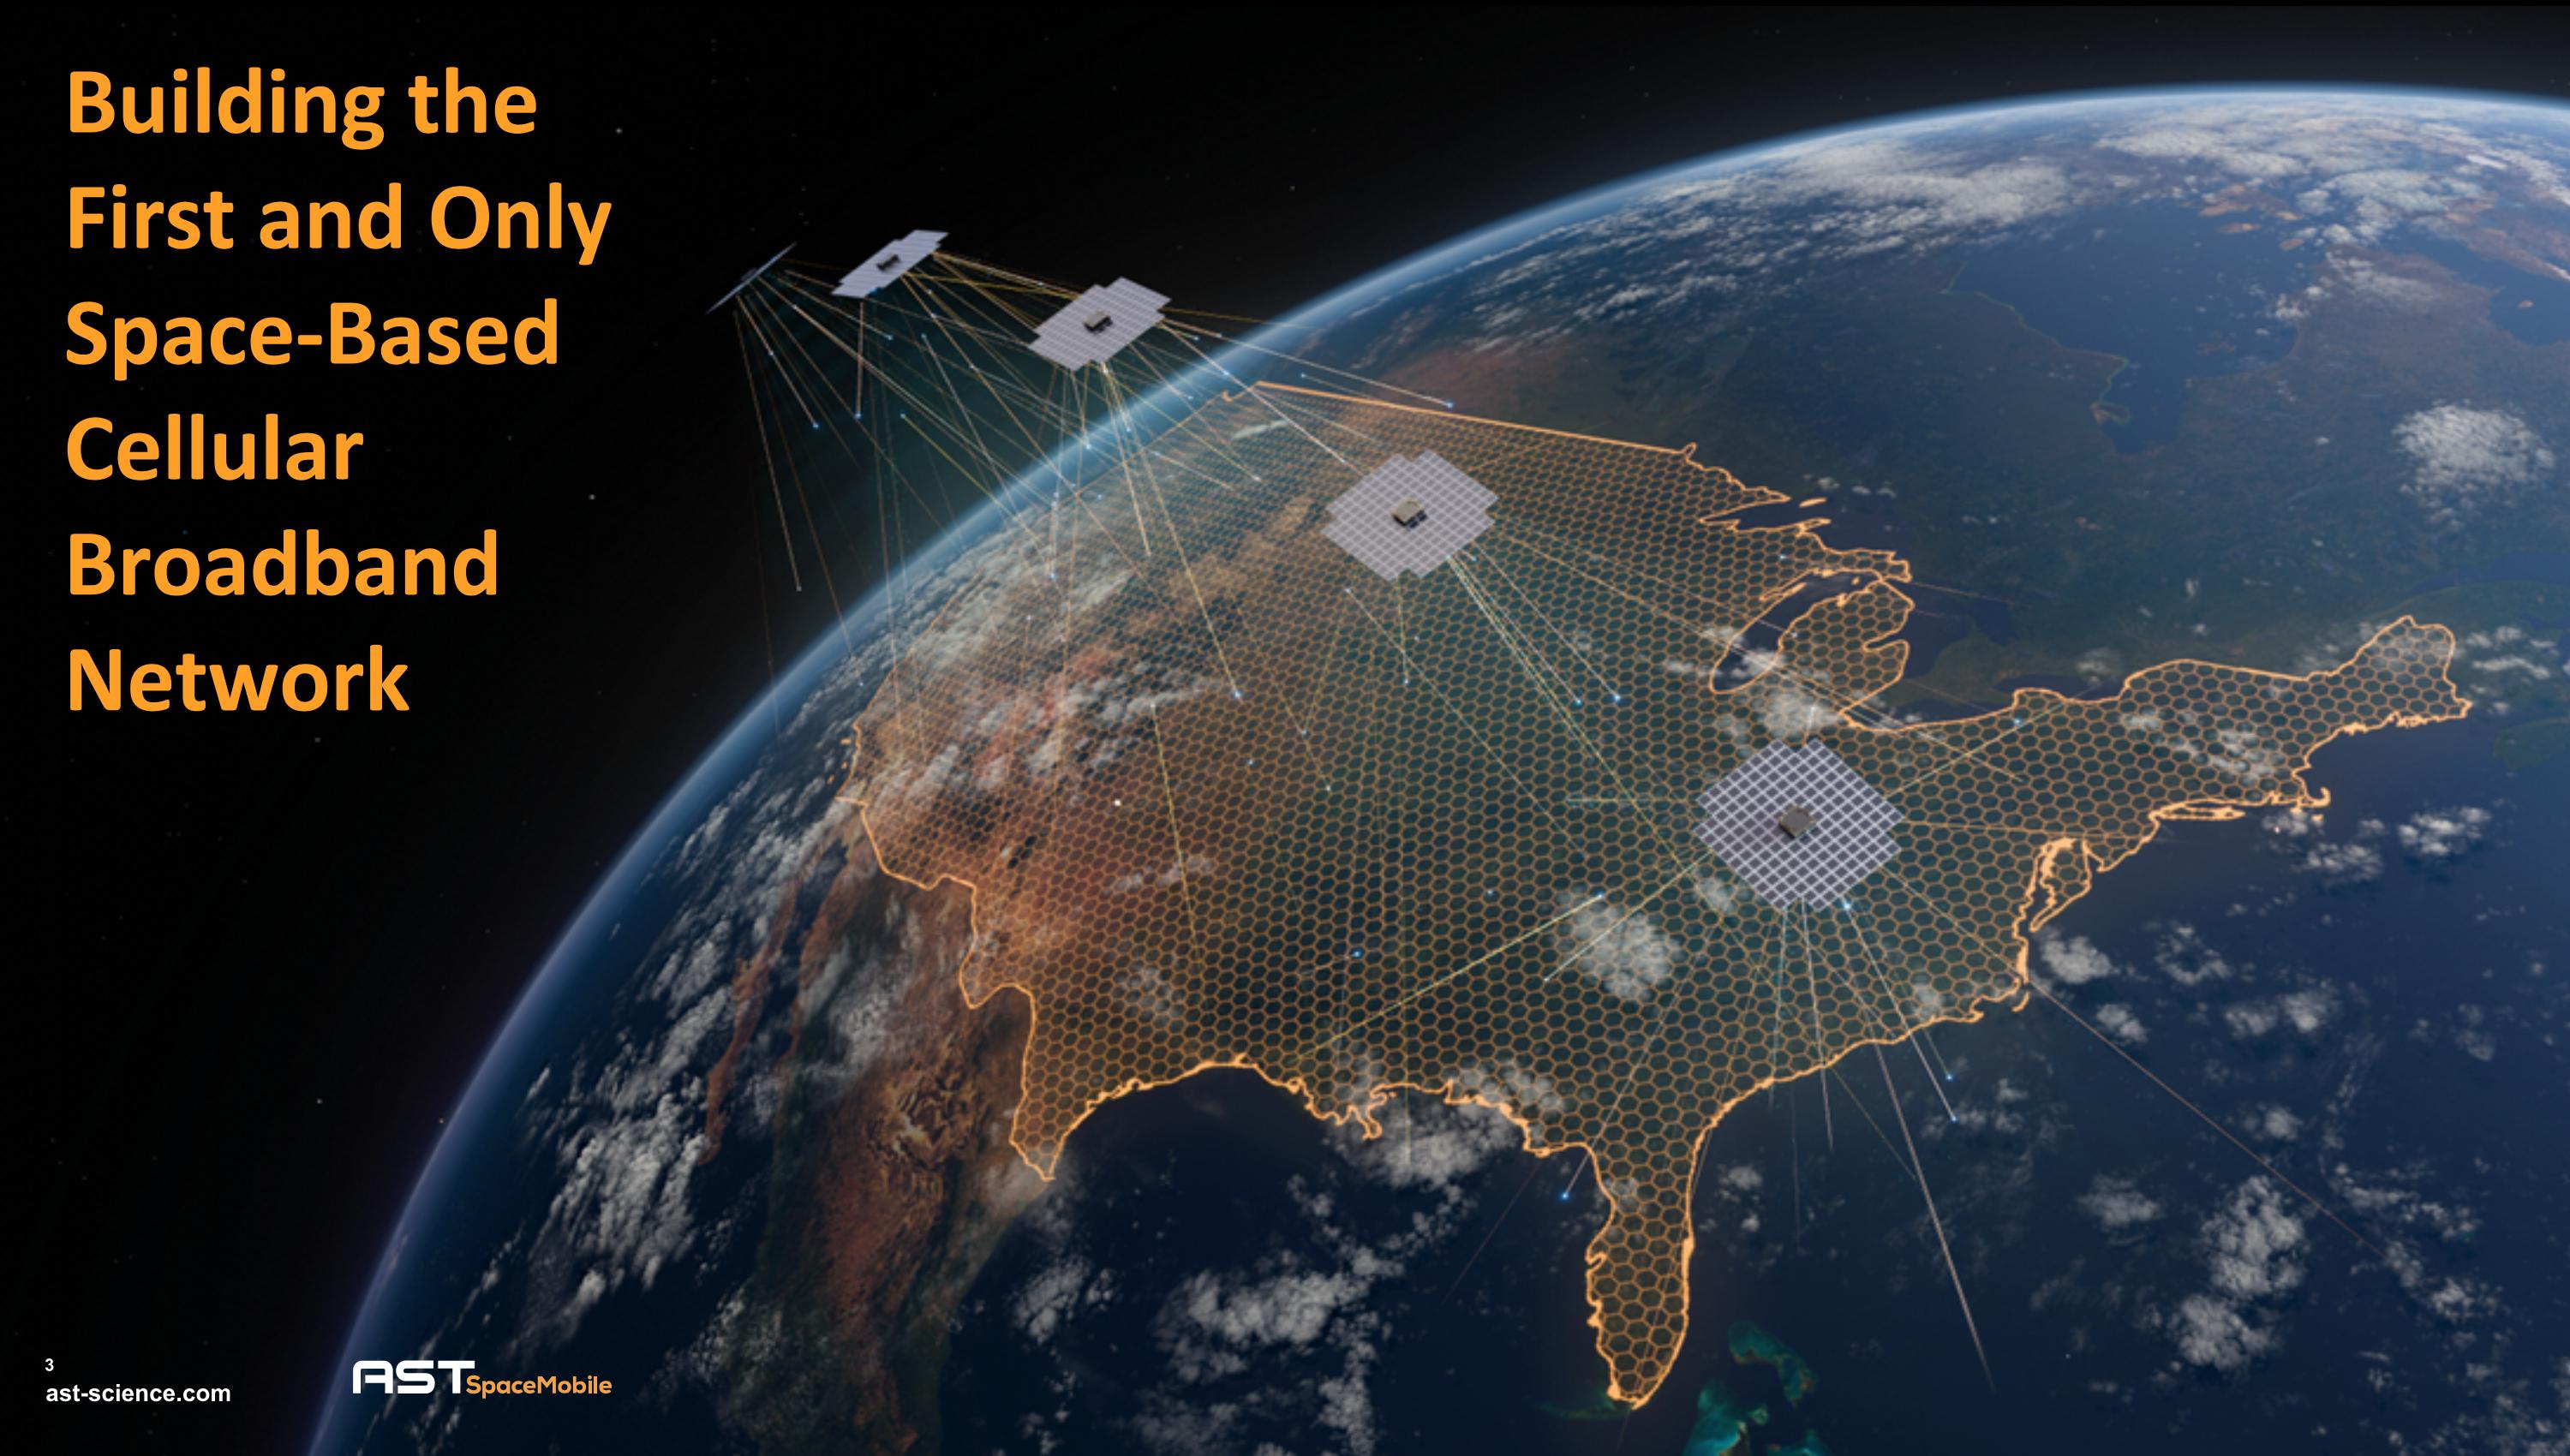
Building the First and Only Space-Based Cellular Broadband Network ast-science.com 3
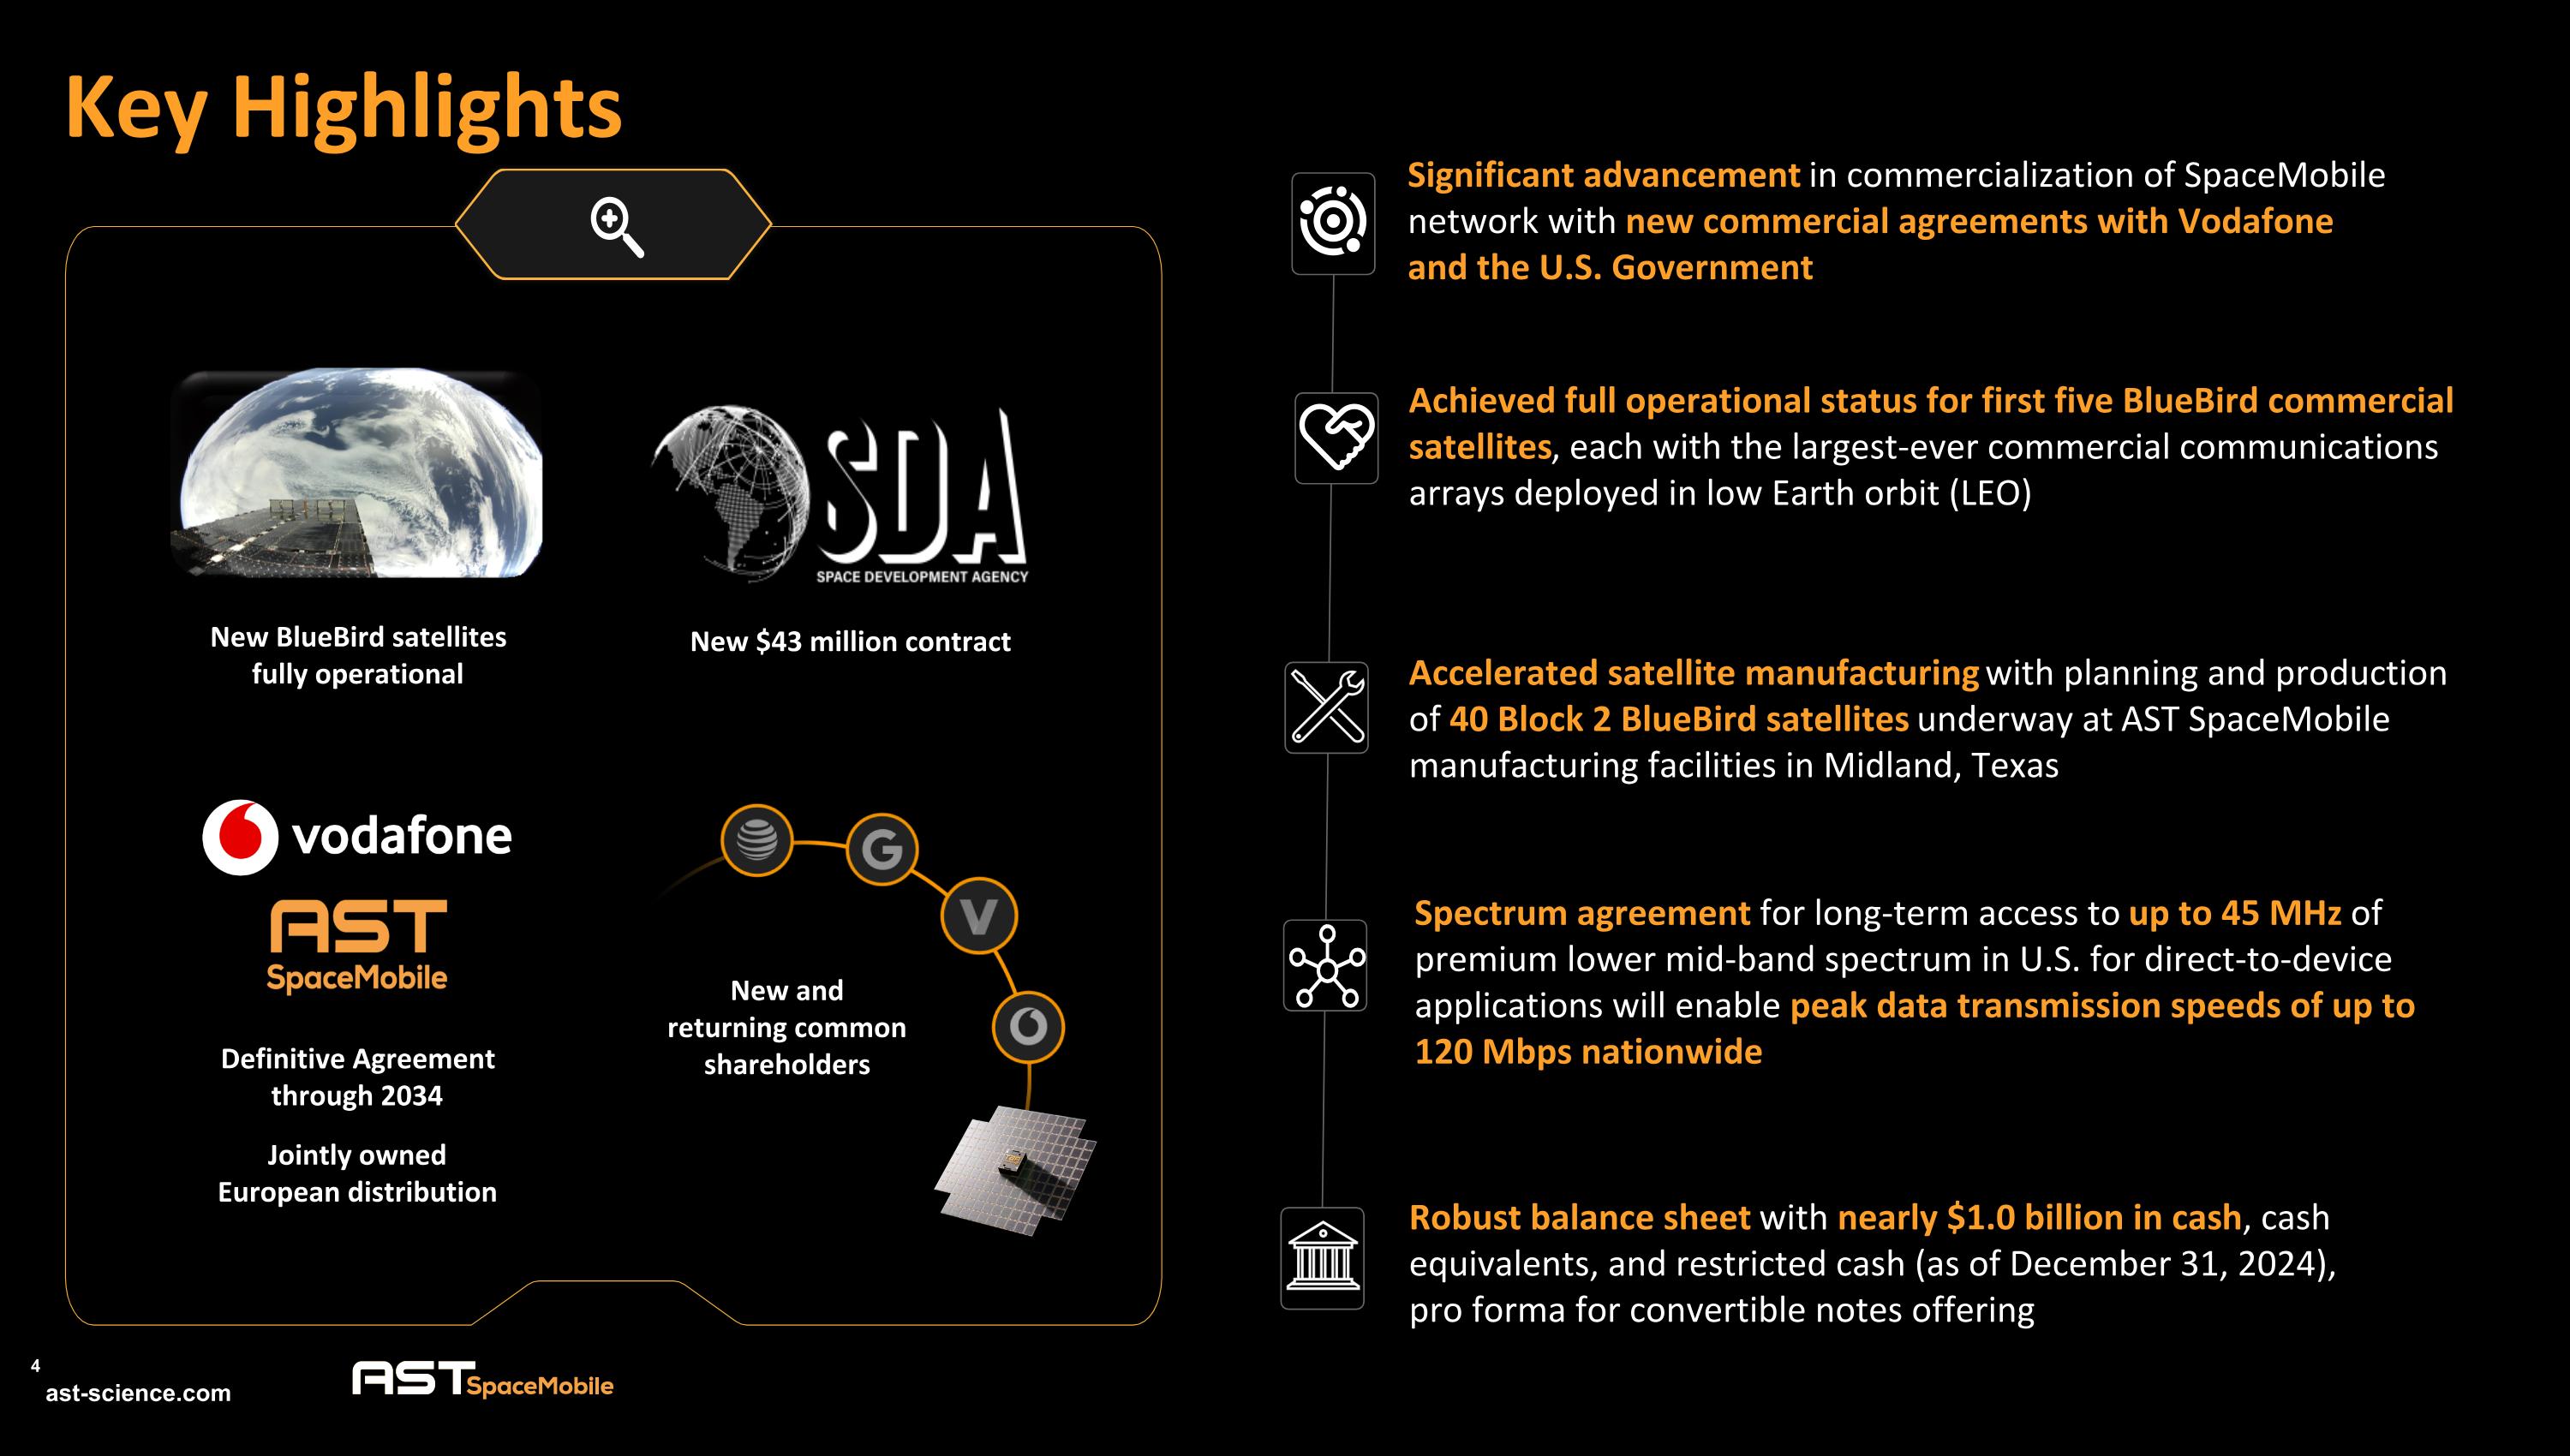
Key Highlights 4 New $43 million contract Significant advancement in commercialization of SpaceMobile network with new commercial agreements with Vodafone and the U.S. Government Achieved full operational status for first five BlueBird commercial satellites, each with the largest-ever commercial communications arrays deployed in low Earth orbit (LEO) Accelerated satellite manufacturing with planning and production of 40 Block 2 BlueBird satellites underway at AST SpaceMobile manufacturing facilities in Midland, Texas Spectrum agreement for long-term access to up to 45 MHz of premium lower mid-band spectrum in U.S. for direct-to-device applications will enable peak data transmission speeds of up to 120 Mbps nationwide Robust balance sheet with nearly $1.0 billion in cash, cash equivalents, and restricted cash (as of December 31, 2024), pro forma for convertible notes offering New and returning common shareholders New BlueBird satellites fully operational Definitive Agreement through 2034 Jointly owned European distribution

POTENTIAL COVERAGE STRATEGIC INVESTORS SELECT MNO PARTNERS 5 Vodafone definitive commercial agreement through 2034 establishes framework to offer SpaceMobile service across Europe and Africa Secured $43 million revenue contract with U.S. Space Development Agency through a prime contractor to support critical government missions Plans to form jointly owned Vodafone European distribution entity to accelerate commercialization strategies across European continent Agreements with ~50 mobile network operators globally, which have nearly 3.0 billion existing subscribers globally Note: When operational, SpaceMobile Service will be available to MNOs on a wholesale basis, with existing relationships spanning nearly all large countries (excluding China, Russia). Significant Advancement In Commercialization Of SpaceMobile Network

Successfully conducted capability demonstrations of two-way video call transmission with AT&T, Verizon, and Vodafone using unmodified smartphones in premium low-band wireless spectrum 6 Received FCC grant of Special Temporary Authority (STA) with AT&T and Verizon in the U.S. to facilitate initial services, targeting approximately 100% nationwide coverage from space with over 5,600 coverage cells Preparing to test service with AT&T and Verizon in the U.S., Vodafone in the UK and Turkey, and Rakuten in Japan USA Achieved Full Operational Status for First Five BlueBird Commercial Satellites

Exercised option for additional orbital launches, with contracted launch capacity now for ~60 satellites during 2025 and 2026 Completed bring-up and initial validation of novel ASIC, supporting up to 10,000 MHz in processing bandwidth per satellite with peak data transmission speeds of up to 120 Mbps Global manufacturing expansion to ~194,000 sq ft in Midland, TX, ~59,000 sq ft in Barcelona, Spain, and soon, ~85,000 sq ft in Homestead, Florida 7 Planning and production of 40 Block 2 BlueBird satellites underway at manufacturing facilities in Midland, Texas BARCELONA PHASED ARRAY ASSEMBLY Accelerated procurement of components and materials needed to complete fully assembled microns and phased array for over 50 satellites in total MIDLAND Accelerated Satellite Production and Manufacturing
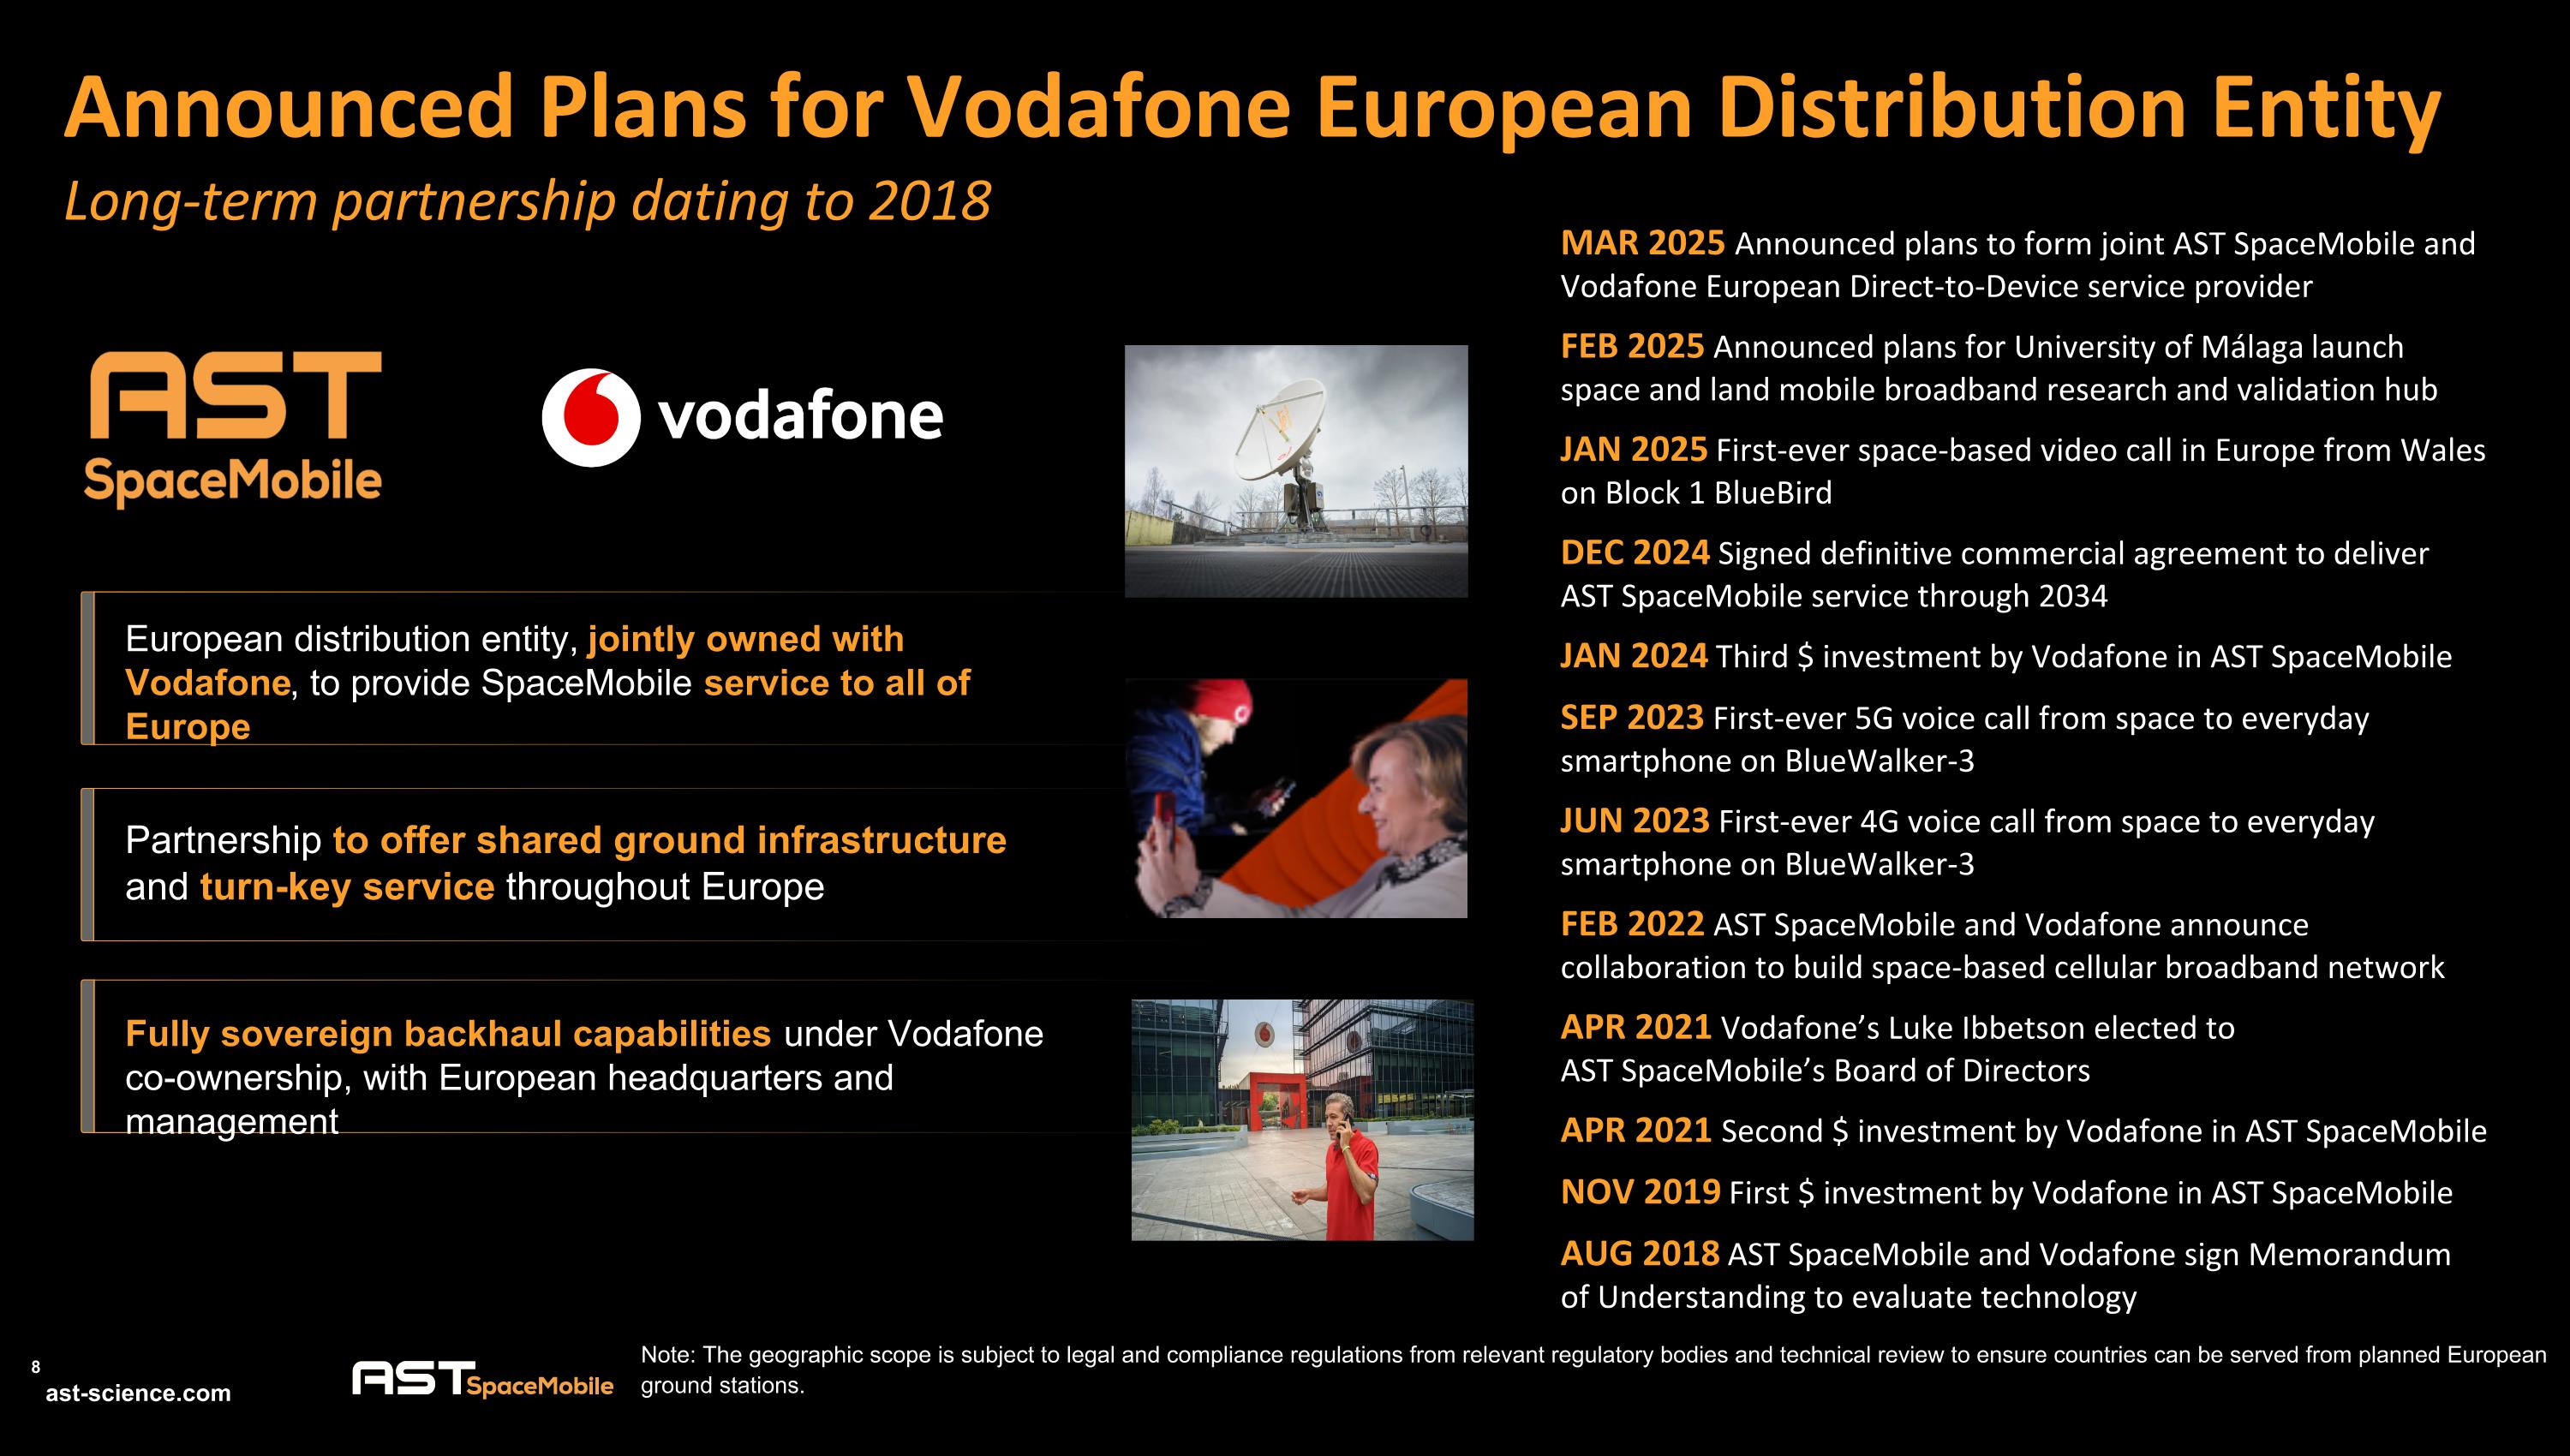
MAR 2025 Announced plans to form joint AST SpaceMobile and Vodafone European Direct-to-Device service provider FEB 2025 Announced plans for University of Málaga launch space and land mobile broadband research and validation hub JAN 2025 First-ever space-based video call in Europe from Wales on Block 1 BlueBird DEC 2024 Signed definitive commercial agreement to deliver AST SpaceMobile service through 2034 JAN 2024 Third $ investment by Vodafone in AST SpaceMobile SEP 2023 First-ever 5G voice call from space to everyday smartphone on BlueWalker-3 JUN 2023 First-ever 4G voice call from space to everyday smartphone on BlueWalker-3 FEB 2022 AST SpaceMobile and Vodafone announce collaboration to build space-based cellular broadband network APR 2021 Vodafone’s Luke Ibbetson elected to AST SpaceMobile’s Board of Directors APR 2021 Second $ investment by Vodafone in AST SpaceMobile NOV 2019 First $ investment by Vodafone in AST SpaceMobile AUG 2018 AST SpaceMobile and Vodafone sign Memorandum of Understanding to evaluate technology 8 European distribution entity, jointly owned with Vodafone, to provide SpaceMobile service to all of Europe Partnership to offer shared ground infrastructure and turn-key service throughout Europe Fully sovereign backhaul capabilities under Vodafone co-ownership, with European headquarters and management Note: The geographic scope is subject to legal and compliance regulations from relevant regulatory bodies and technical review to ensure countries can be served from planned European ground stations. Announced Plans for Vodafone European Distribution Entity Long-term partnership dating to 2018
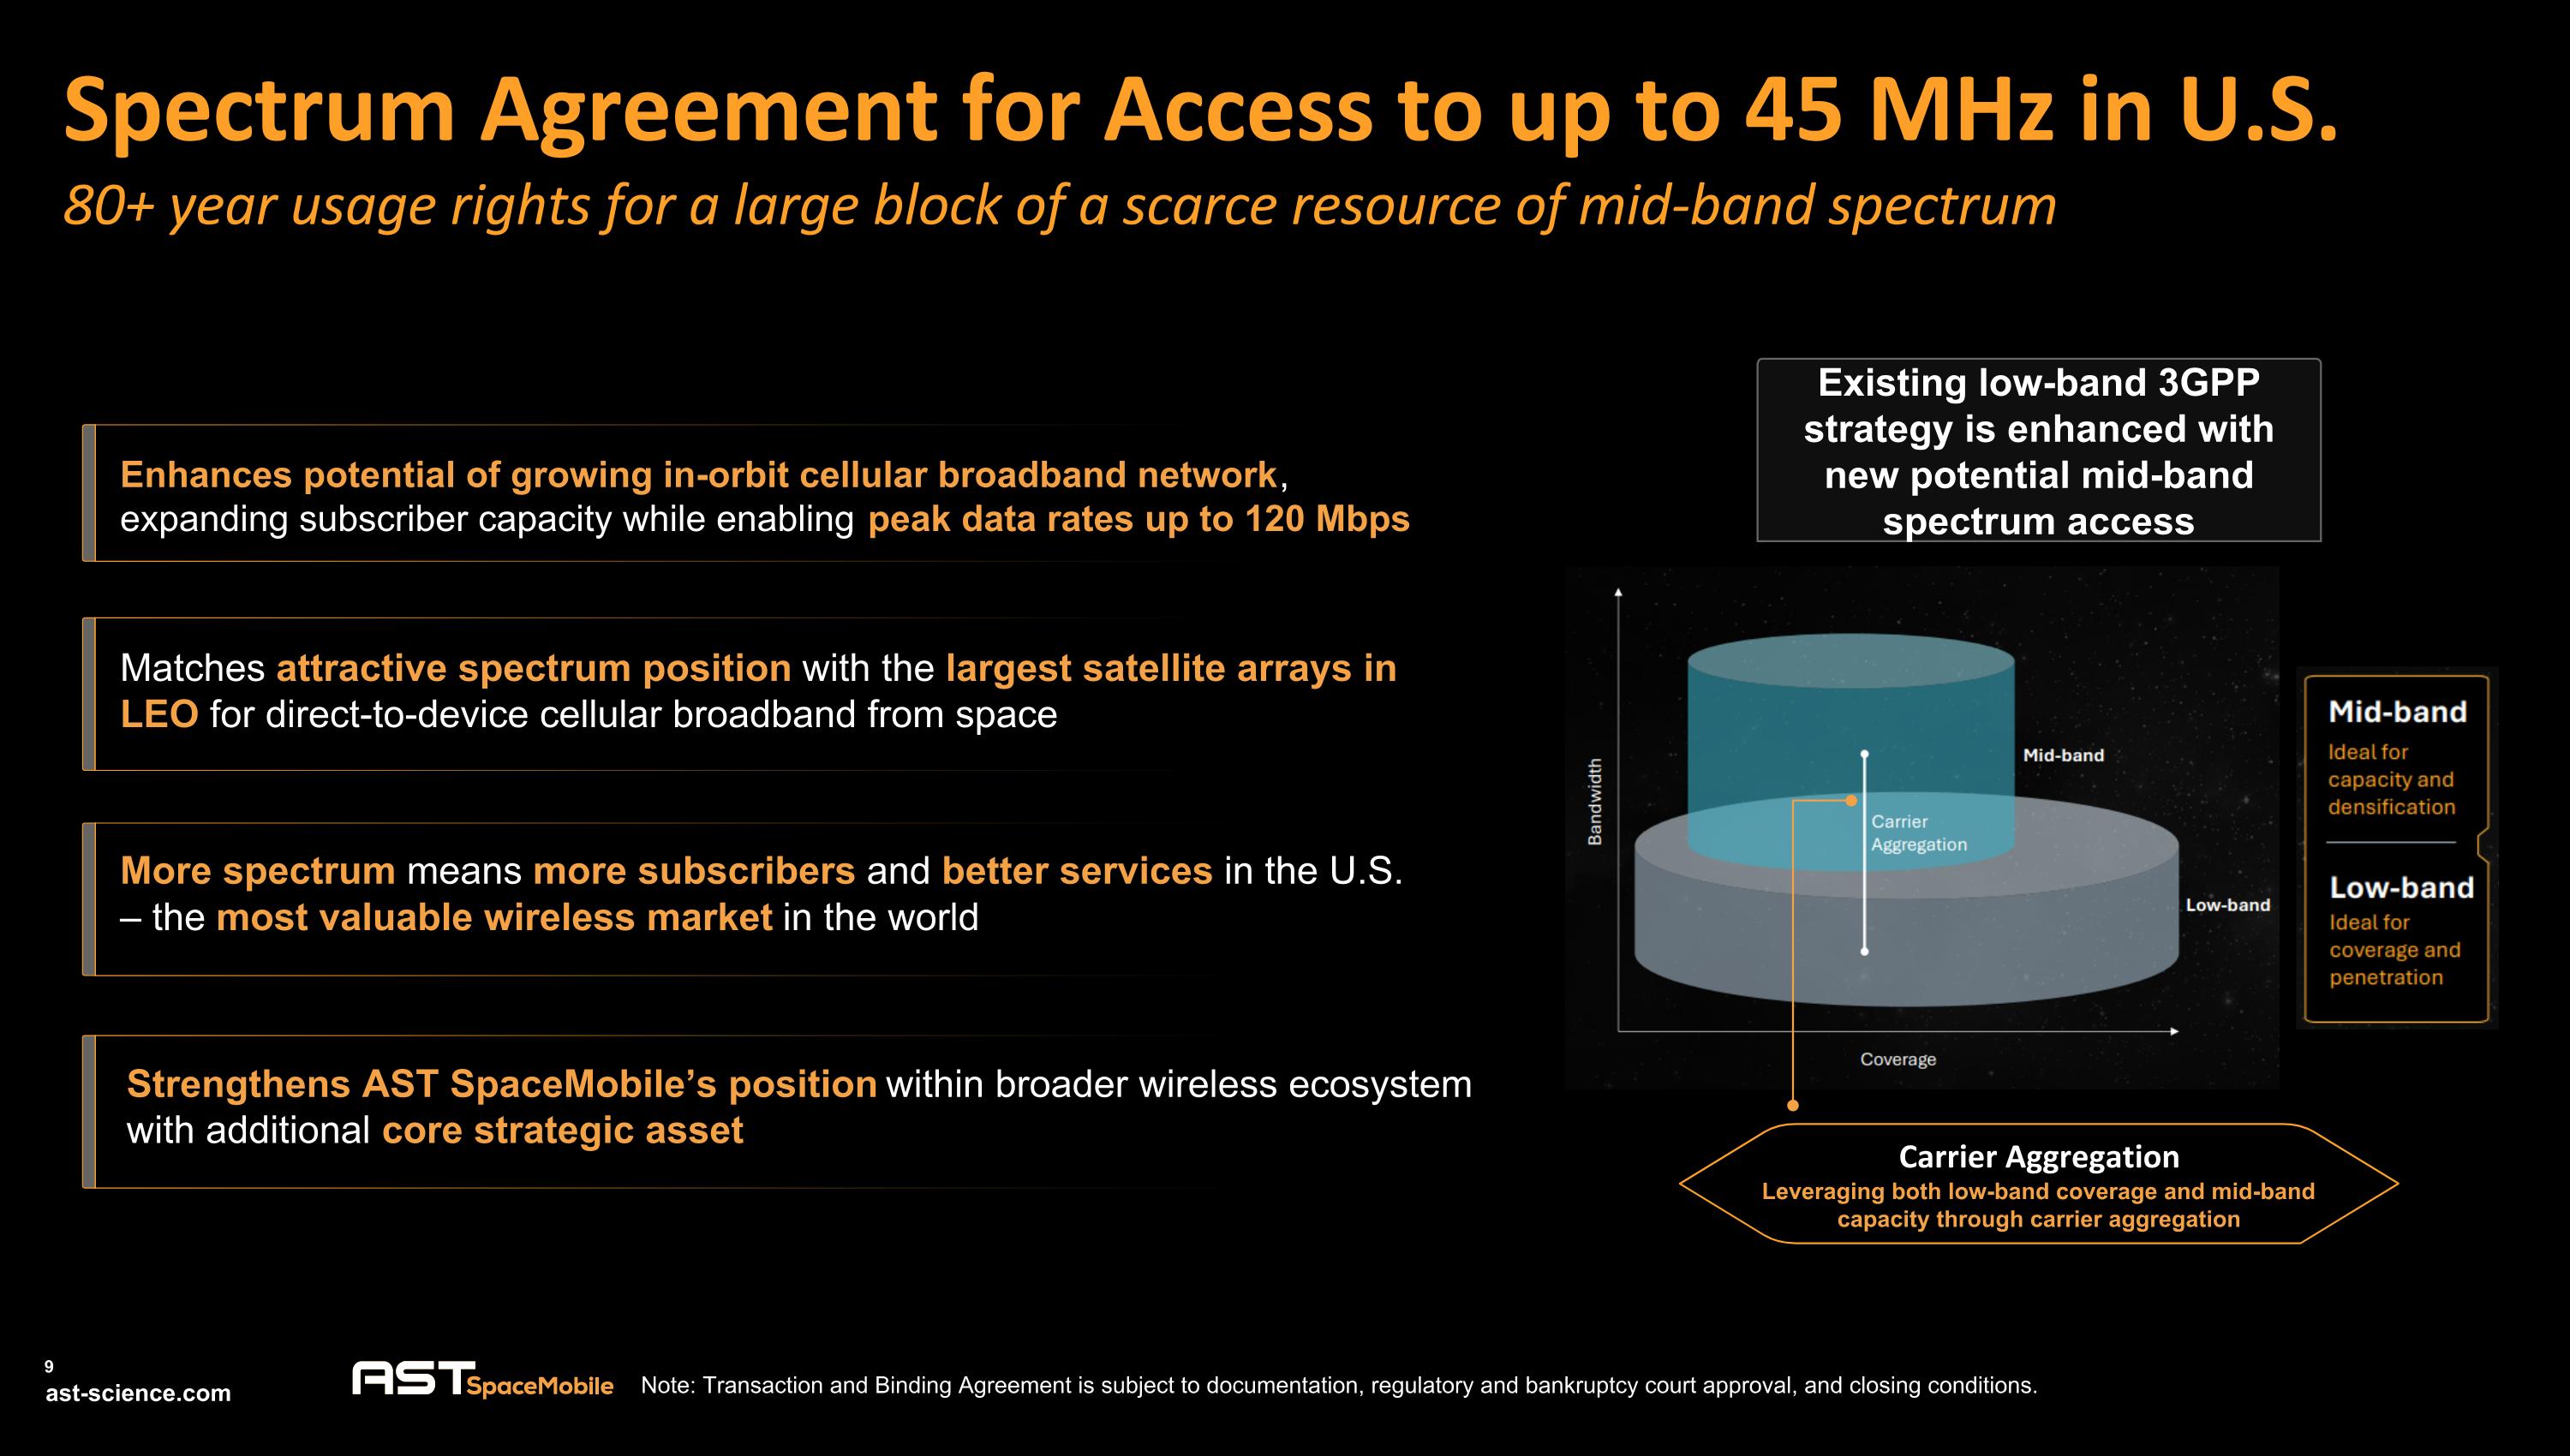
Existing low-band 3GPP strategy is enhanced with new potential mid-band spectrum access Spectrum Agreement for Access to up to 45 MHz in U.S. 80+ year usage rights for a large block of a scarce resource of mid-band spectrum 9 Enhances potential of growing in-orbit cellular broadband network, expanding subscriber capacity while enabling peak data rates up to 120 Mbps More spectrum means more subscribers and better services in the U.S. – the most valuable wireless market in the world Strengthens AST SpaceMobile’s position within broader wireless ecosystem with additional core strategic asset Matches attractive spectrum position with the largest satellite arrays in LEO for direct-to-device cellular broadband from space Carrier Aggregation Leveraging both low-band coverage and mid-band capacity through carrier aggregation Note: Transaction and Binding Agreement is subject to documentation, regulatory and bankruptcy court approval, and closing conditions.

Adj. Operating Expenses 1 Liquidity 3,4 $M $M Non-GAAP. See appendix for a reconciliation. Adjusted operating expenses is equal to total operating expense adjusted to exclude depreciation and amortization and stock based-compensation expense. Depreciation and amortization for the three months ended December 31, 2024 and September 30, 2024 was $8.5 million and $14.5 million, respectively. Stock-based compensation for the three months ended December 31, 2024 and September 30, 2024 consisted of $8.3 million and $3.4 million of engineering services costs and $3.1 million and $3.4 million of general and administrative costs, respectively. Gross property and equipment as of December 31, 2024, September 30, 2024 and December 31, 2023 was $460.0 million, $374.0 million, and $299.7 million, respectively. Accumulated depreciation and amortization as of December 31, 2024, September 30, 2024 and December 31, 2023 was $122.4 million, $113.9 million, and $61.2 million, respectively. Cash Position as of December 31, 2024 and September 30, 2024 includes $2.5 million of restricted cash. Pro forma additional net proceeds since December 31, 2024 comprised of $401.8 million from issuance of 2032 Convertible Notes and $10.4 million from 2024 ATM Equity Program. Capital Expenditures 2 $M ASIC $567.5 Operating and Capital Metrics
Appendix ast-science.com 11
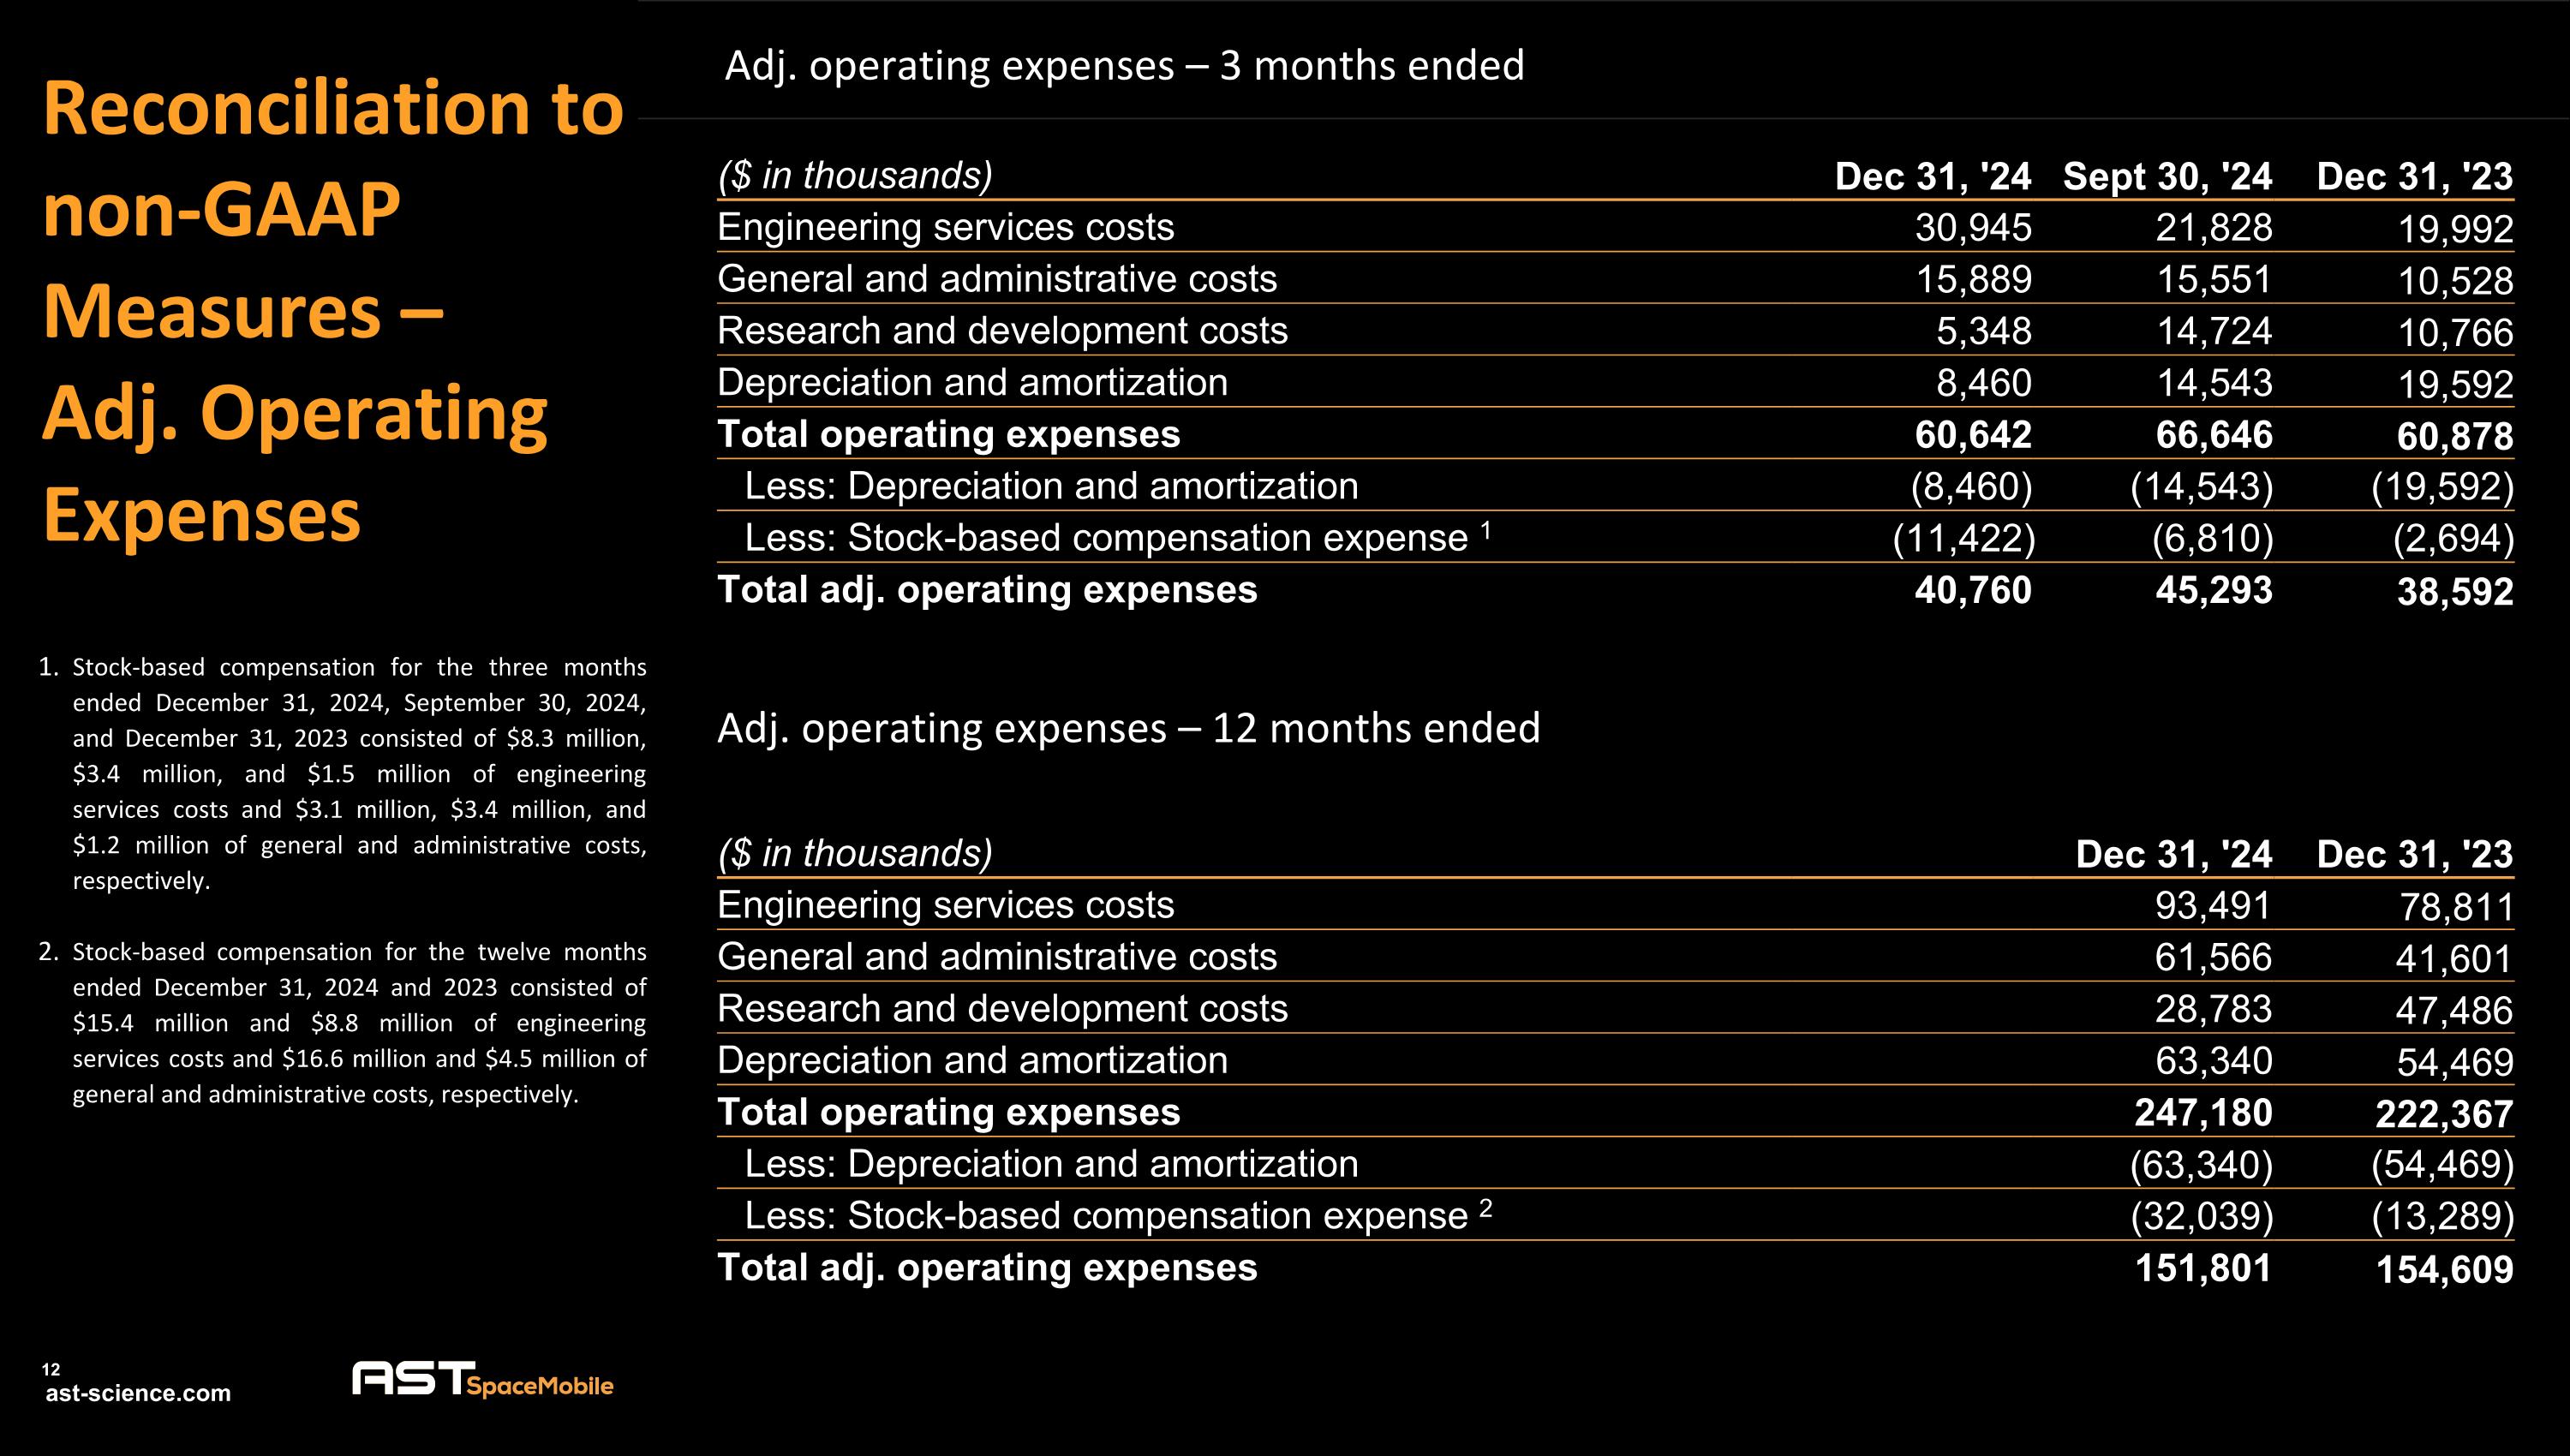
Reconciliation to non-GAAP Measures –Adj. Operating Expenses Adj. operating expenses – 12 months ended ($ in thousands) Dec 31, '24 Sept 30, '24 Dec 31, '23 Engineering services costs 30,945 21,828 19,992 General and administrative costs 15,889 15,551 10,528 Research and development costs 5,348 14,724 10,766 Depreciation and amortization 8,460 14,543 19,592 Total operating expenses 60,642 66,646 60,878 Less: Depreciation and amortization (8,460) (14,543) (19,592) Less: Stock-based compensation expense 1 (11,422) (6,810) (2,694) Total adj. operating expenses 40,760 45,293 38,592 Stock-based compensation for the three months ended December 31, 2024, September 30, 2024, and December 31, 2023 consisted of $8.3 million, $3.4 million, and $1.5 million of engineering services costs and $3.1 million, $3.4 million, and $1.2 million of general and administrative costs, respectively. Stock-based compensation for the twelve months ended December 31, 2024 and 2023 consisted of $15.4 million and $8.8 million of engineering services costs and $16.6 million and $4.5 million of general and administrative costs, respectively. Adj. operating expenses – 3 months ended ($ in thousands) Dec 31, '24 Dec 31, '23 Engineering services costs 93,491 78,811 General and administrative costs 61,566 41,601 Research and development costs 28,783 47,486 Depreciation and amortization 63,340 54,469 Total operating expenses 247,180 222,367 Less: Depreciation and amortization (63,340) (54,469) Less: Stock-based compensation expense 2 (32,039) (13,289) Total adj. operating expenses 151,801 154,609
