UNITED STATES
SECURITIES AND EXCHANGE COMMISSION
Washington, D.C. 20549
FORM 6-K
REPORT OF FOREIGN PRIVATE ISSUER
PURSUANT TO RULE 13a-16 OR 15d-16
UNDER THE SECURITIES EXCHANGE ACT OF 1934
For the month of February 2025
Commission File Number: 001-40451
DLocal Limited
(Exact name of registrant as specified in its charter)
Dr. Luis Bonavita 1294
Montevideo
Uruguay 11300
+1 (424) 392-7437
(Address of principal executive office)
Indicate by check mark whether the registrant files or will file annual reports under cover of Form 20-F or Form 40-F:
Form 20-F ☒ Form 40-F ☐
Indicate by check mark if the registrant is submitting the Form 6-K in paper as permitted by Regulation S-T Rule 101(b)(1):
Yes ☐ No ☒
Indicate by check mark if the registrant is submitting the Form 6-K in paper as permitted by Regulation S-T Rule 101(b)(7):
Yes ☐ No ☒
TABLE OF CONTENTS
EXHIBIT
|
|
|
99.1 |
|
|
|
||
99.2 |
|
|
|
||
99.3 |
|
Annual Report 2024 - dLocal Financial Results Full Year and 4th Quarter of 2024 |
|
||
99.4 |
|
|
SIGNATURE
Pursuant to the requirements of the Securities Exchange Act of 1934, the registrant has duly caused this report to be signed on its behalf by the undersigned, thereunto duly authorized.
|
DLocal Limited |
|
|
|
|
|
|
|
By: |
/s/ Mark Ortiz |
|
|
Name: |
Mark Ortiz |
|
|
Title: |
Chief Financial Officer |
|
Date: February, 27 2025
Exhibit 99.1

dLocal Reports 2024 Fourth Quarter Financial Results
Full Year 2024 results
US$25.6 billion Total Payment Volume, up 45% year-over-year
Revenue of US$746 million, up 15% year-over-year
113% Net Revenue Retention Rate
Gross Profit of US$295 million, up 6% year-over-year
Adjusted EBITDA of US$189 million, down 7% year-over-year
Fourth Quarter 2024
US$7.7 billion Total Payment Volume, up 51% year-over-year and 18% quarter-over-quarter
Revenue of US$204 million, up 9% year-over-year and 10% quarter-over-quarter
106% Net Revenue Retention Rate
Gross Profit of US$84 million, up 20% year-over-year and 7% quarter-over-quarter
Adjusted EBITDA of US$57 million, up 16% year-over-year and 9% quarter-over-quarter
dLocal reports in US dollars and in accordance with IFRS as issued by the IASB
Montevideo, Uruguay, February 27, 2025 — DLocal Limited (“dLocal”, “we”, “us”, and “our”) (NASDAQ:DLO), a technology - first payments platform today announced its financial results for the fourth quarter ended December 31, 2024..
As we walk through a review of our performance over the past quarter and year, and as we have repeatedly mentioned, we think of five pillars underpinning dLocal's investment thesis:
Our FY 2024 results affirm the investment thesis, highlighted by a record TPV of $26 billion, a strong TPV growth of 45% year-over-year, driven by a shift towards newer, more attractive markets, while core markets rebounded from Q3 softness. Additionally, revenue and gross profits reached record highs of $746 million and $295 million, respectively, with an adjusted EBITDA to GP margins closing the year at 64%, showing consistent improvement throughout the year. Furthermore, Net Income to FCF of Own funds3 conversion exited the year at a rate above 100%.
These strong 2024 results should be seen in the context of a weak first quarter followed by progressively stronger quarter-over-quarter performance, and the continuation of an investment cycle aimed at achieving greater scalability for our business.
Building on last quarter's positive trend, our TPV grew over 50% year-over-year, despite a strong Q4 2023 comparison. Quarter-over-quarter, TPV growth accelerated to nearly 20%, driven by commerce seasonality, and strength in remittances and ride-hailing. In constant currency3, given general weakness in Emerging Markets currencies, those growth rates are even more impressive, about 30 points higher year-over-year.
Revenues surpassed the milestone of over $200 million in Q4, representing a 9% year-over-year growth. In constant currencies4, revenue growth for the period would have been around 40% year-over-year.
Our growth continues to reinforce our position as a trusted partner for global companies seeking to do business across emerging markets, with performance coming from a well diversified list of countries, with notable contributions from Argentina, Egypt, Other LatAm and Other Africa and Asia markets. As a result of our expansion into more frontier markets, we also continue to see solid growth in our cross-border volumes.
In terms of profitability, we reached a record gross profit of $84 million, with a net take rate at 1.1%, reflecting the market dynamic where higher volumes drive lower take rates, increase in the payouts share, and the depreciation of emerging market currencies. To offset this, we are driving cost efficiencies through processor and broker renegotiations and improvements in our hedging strategy. We also continue our push into higher take rate markets and verticals, which over the long term, should partially offset the take rate compression.
Exhibit 99.1
Despite the ongoing step up in investments in our engineering team, operational capabilities, and license portfolio to support our long-term growth ambitions, our Adjusted EBITDA hit a record $57 million in the quarter, with an adjusted EBITDA over gross profit margin improving quarter-over-quarter to 68%.
Cash generation was also solid, as we continue to increase free cash available to deploy behind our capital allocation strategy. This sustained cash generation increases our flexibility when thinking through M&A, buybacks or re-investing in a disciplined manner back into the business.
In 2024, we added 9 licenses and registrations, including the UK FCA's Authorised Payment Institution license, which enhances our competitive edge and demonstrates our commitment to compliant practices and regulatory oversight.
To sum up, Q4 marked the successful end to 2024 in terms of consistent TPV growth, controlled take rate decline, and balance of investment for future growth with a healthy margin and free cash profile.
Looking ahead to our 2025 guidance5, we expect a strong TPV growth of 35% - 45% year-over-year, with a revenue growth of 25% - 35% year-over-year that shows this sustained momentum of our top line. We see gross profit growth of 20% - 25% year-over-year, and Adjusted EBITDA growth between 20% and 30% year-over-year.
Considering those assumptions, we should expect a net take rate compression while delivering high TPV growth even at our scale. Over the midterm, we will work to maintain strong TPV while recognizing that given the extremely strong levels of TPV retention we deliver, our larger merchants will continue to attain lower pricing tiers. We will strive to offset this effect through growth in higher take rate new verticals, natural mix shift towards higher take rate frontier markets, and new revenue streams through product launches.
This guidance highlights that our combination of revenue growth, margin structure and free cash generation is not that common. There are not that many companies today who are as profitable as we are, growing revenues at the pace we are growing, and consistently generating free cash.
As known, our business thrives in fast-growing, dynamic markets with massive opportunities in digital payments across emerging markets, driven by strong demand and long-term growth trends. However, these markets also bring volatility from macroeconomic shifts, regulatory changes, and currency fluctuations. While we are confident in our long-term high-growth potential, providing mid-term guidance may not accurately reflect the predictability over a multi-year timeframe. For this reason, we have made the decision to discontinue mid-term guidance. We will continue to focus on delivering strong operational execution so as to hit the annual targets we disclose.
Looking ahead to 2025, we are confident in our ability to sustain momentum. Our investments in technology, product innovation, and market expansion position us well for growth. Despite the volatility of emerging markets, our disciplined scaling, local expertise, and commitment to delivering value to merchants will differentiate us. Our strategy focuses on capturing the potential of digital payments in high-growth regions, driving operational efficiencies, and reinforcing market leadership. We are excited about the opportunities ahead and committed to executing with the same rigor and discipline that have defined our success.
1 Source: Euromonitor International: Reaching the emerging middle class beyond BRIC; 2 Source: S&P Global Market Intelligence. 3 Please see Reconciliation of TPV and Revenue constant currency measures to reported results of Q4 2024 Earnings Presentation; 4 Please see Reconciliation of TPV and Revenue constant currency measures to reported results of Q4 2024 Earnings Presentation; 5 please see Full year 2025 outlook on slide 23 of Q4 2024 Earnings Presentation.
Fourth quarter 2024 financial highlights
Exhibit 99.1
1Please see Reconciliation of TPV and Revenue constant currency measures to reported results of Q4 2024 Earnings Presentation.
The following table summarizes our key performance metrics:
|
Three months ended December 31 |
Twelve months ended December 31 |
||||
|
2024 |
2023 |
% change |
2024 |
2023 |
% change |
Key Performance metrics |
(In millions of US$ except for %) |
|||||
TPV |
7,714 |
5,111 |
51% |
25,575 |
17,677 |
45% |
Revenue |
204.5 |
188.0 |
9% |
746.0 |
650.4 |
15% |
Gross Profit |
83.7 |
69.7 |
20% |
294.7 |
276.9 |
6% |
Gross Profit margin |
41% |
37% |
4p.p |
40% |
43% |
-3p.p |
Adjusted EBITDA |
56.9 |
49.2 |
16% |
188.7 |
202.3 |
-7% |
Adjusted EBITDA margin |
28% |
26% |
2p.p |
25% |
31% |
-6p.p |
Adjusted EBITDA/Gross Profit |
68% |
71% |
-3p.p |
64% |
73% |
-9p.p |
Profit |
29.7 |
28.5 |
4% |
120.5 |
149.1 |
-19% |
Profit margin |
15% |
15% |
-1p.p |
16% |
23% |
-7p.p |
Exhibit 99.1
Fourth quarter 2024 business highlights
Exhibit 99.1
The tables below present the breakdown of dLocal’s TPV by product and type of flow:
In millions of US$ except for % |
Three months ended December 31 |
Twelve months ended December 31 |
||||||
|
2024 |
% share |
2023 |
% share |
2024 |
% share |
2023 |
% share |
Pay-ins |
5,340 |
69% |
3,701 |
72% |
17,902 |
70% |
12,823 |
73% |
Pay-outs |
2,373 |
31% |
1,410 |
28% |
7,673 |
30% |
4,855 |
27% |
Total TPV |
7,714 |
100% |
5,111 |
100% |
25,575 |
100% |
17,677 |
100% |
In millions of US$ except for % |
Three months ended December 31 |
Twelve months ended December 31 |
||||||
|
2024 |
% share |
2023 |
% share |
2024 |
% share |
2023 |
% share |
Cross-border |
3,740 |
48% |
2,235 |
44% |
11,902 |
47% |
8,670 |
49% |
Local-to-local |
3,974 |
52% |
2,876 |
56% |
13,673 |
53% |
9,007 |
51% |
Total TPV |
7,714 |
100% |
5,111 |
100% |
25,575 |
100% |
17,677 |
100% |
The tables below present the breakdown of dLocal’s revenue by geography:
In millions of US$ except for % |
Three months ended December 31 |
Twelve months ended December 31 |
||||||
|
2024 |
% share |
2023 |
% share |
2024 |
% share |
2023 |
% share |
Latin America |
152.9 |
75% |
131.5 |
70% |
562.2 |
75% |
492.7 |
76% |
Brazil |
33.7 |
16% |
50.2 |
27% |
152.0 |
20% |
159.0 |
24% |
Argentina |
25.1 |
12% |
10.5 |
6% |
85.5 |
11% |
75.1 |
12% |
Mexico |
40.5 |
20% |
35.6 |
19% |
149.2 |
20% |
116.8 |
18% |
Chile |
13.5 |
7% |
14.9 |
8% |
51.2 |
7% |
55.7 |
9% |
Other LatAm |
40.1 |
20% |
20.3 |
11% |
124.4 |
17% |
86.1 |
13% |
|
|
|
|
|
|
|
|
|
Africa & Asia |
51.6 |
25% |
56.5 |
30% |
183.8 |
25% |
157.7 |
24% |
Nigeria |
2.9 |
1% |
28.4 |
15% |
13.3 |
2% |
84.0 |
13% |
Egypt |
21.4 |
10% |
18.4 |
10% |
94.0 |
13% |
36.7 |
6% |
Other Africa & Asia |
27.4 |
13% |
9.7 |
5% |
76.5 |
10% |
37.0 |
6% |
|
|
|
|
|
|
|
|
|
Total Revenue |
204.5 |
100% |
188.0 |
100% |
746.0 |
100% |
650.4 |
100% |
Exhibit 99.1
The tables below present the breakdown of dLocal’s gross profit by geography:
In millions of US$ except for % |
Three months ended December 31 |
Twelve months ended December 31 |
||||||
|
2024 |
% share |
2023 |
% share |
2024 |
% share |
2023 |
% share |
Latin America |
56.4 |
67% |
54.7 |
79% |
214.2 |
73% |
228.7 |
83% |
Brazil |
14.8 |
18% |
25.5 |
37% |
67.3 |
23% |
78.8 |
28% |
Argentina |
9.2 |
11% |
4.0 |
6% |
28.7 |
10% |
48.7 |
18% |
Mexico |
10.9 |
13% |
9.3 |
13% |
42.5 |
14% |
34.7 |
13% |
Chile |
9.2 |
11% |
9.1 |
13% |
33.1 |
11% |
34.0 |
12% |
Other LatAm |
12.4 |
15% |
7.0 |
10% |
42.6 |
14% |
32.6 |
12% |
|
|
|
|
|
|
|
|
|
Africa & Asia |
27.3 |
33% |
15.0 |
21% |
80.5 |
27% |
48.1 |
17% |
Nigeria |
2.4 |
3% |
1.5 |
2% |
6.6 |
2% |
5.8 |
2% |
Egypt |
16.0 |
19% |
9.6 |
14% |
48.4 |
16% |
26.1 |
9% |
Other Africa & Asia |
8.9 |
11% |
3.9 |
6% |
25.5 |
9% |
16.2 |
6% |
|
|
|
|
|
|
|
|
|
Total Gross Profit |
83.7 |
100% |
69.7 |
100% |
294.7 |
100% |
276.9 |
100% |
Exhibit 99.1
Special note regarding Adjusted EBITDA and Adjusted EBITDA Margin
dLocal has only one operating segment. dLocal measures its operating segment’s performance by Revenues, Adjusted EBITDA and Adjusted EBITDA Margin, and uses these metrics to make decisions about allocating resources.
Adjusted EBITDA as used by dLocal is defined as the profit from operations before financing and taxation for the year or period, as applicable, before depreciation of property, plant and equipment, amortization of right-of-use assets and intangible assets, and further excluding the finance income and costs, impairment gains/(losses) on financial assets, transaction costs, share-based payment non-cash charges,other operating gain/loss,other non-recurring costs, and inflation adjustment. dLocal defines Adjusted EBITDA Margin as the Adjusted EBITDA divided by consolidated revenues.
Although Adjusted EBITDA and Adjusted EBITDA Margin may be commonly viewed as non-IFRS measures in other contexts, pursuant to IFRS 8, (“Operating Segments”), Adjusted EBITDA and Adjusted EBITDA Margin are treated by dLocal as IFRS measures based on the manner in which dLocal utilizes these measures. Nevertheless, dLocal’s Adjusted EBITDA and Adjusted EBITDA Margin metrics should not be viewed in isolation or as a substitute for net income for the periods presented under IFRS. dLocal also believes that its Adjusted EBITDA and Adjusted EBITDA Margin metrics are useful metrics used by analysts and investors, although these measures are not explicitly defined under IFRS. Additionally, the way dLocal calculates operating segment’s performance measures may be different from the calculations used by other entities, including competitors, and therefore, dLocal’s performance measures may not be comparable to those of other entities. Finally, dLocal is unable to present a quantitative reconciliation of forward-looking guidance for Adjusted EBITDA because dLocal cannot reliably predict certain of their necessary components, such as impairment gains/(losses) on financial assets, transaction costs, and inflation adjustment.
The table below presents a reconciliation of dLocal’s Adjusted EBITDA to net income:
$ in thousands |
Three months ended December 31 |
Twelve months ended December 31 |
||
|
2024 |
2023 |
2024 |
2023 |
Profit for the period |
29,701 |
28,481 |
120,469 |
149,086 |
Income tax expense |
11,090 |
7,476 |
30,550 |
29,428 |
Depreciation and amortization |
4,888 |
3,604 |
17,177 |
12,225 |
Finance income and costs, net |
1,085 |
(996) |
(17,174) |
(11,394) |
Share-based payment non-cash charges |
6,339 |
4,850 |
23,780 |
11,922 |
Other operating loss¹ |
1,307 |
- |
5,257 |
- |
Impairment loss / (gain) on financial assets |
533 |
(657) |
440 |
(3,136) |
Inflation adjustment |
392 |
6,040 |
6,655 |
12,537 |
Other non-recurring costs² |
1,571 |
434 |
1,571 |
1,663 |
Adjusted EBITDA |
56,906 |
49,232 |
188,725 |
202,332 |
Note: 1 The company wrote-off certain amounts related to merchants/processors off-boarded by dLocal. 2 Other non-recurring costs consist of costs not directly associated with our core business activities, including costs associated with addressing the allegations made by a short-seller report and certain class action and other legal and regulatory expenses (which include fees from counsel, global expert services and a forensic accounting advisory firm) in 2023 and 2024.
Exhibit 99.1
Special note regarding Adjusted Net Income
Adjusted Net Income is a non-IFRS financial measure. As used by dLocal, Adjusted Net Income is defined as the profit for the period (net income) excluding impairment gains/(losses) on financial assets, transaction costs, share-based payment non-cash charges, and other operating (gain)/loss, in line with our Adjusted EBITDA calculation (see detailed methodology for Adjusted EBITDA on page 13). It further excludes the accounting non-cash charges related to the fair value gain from the Argentine dollar-linked bonds, the exchange difference loss from the intercompany loan denominated in USD that we granted to our Argentine subsidiary to purchase the bonds, and the hedging cost associated with the Argentina treasury notes. In addition, it excludes the inflation adjustment based on IFRS rules for hyperinflationary economies. We believe Adjusted Net Income is a useful measure for understanding our results of operations while excluding certain non-cash effects such as currency devaluation, inflation, and hedging costs. Our calculation for Adjusted Net Income may differ from similarly-titled measures presented by other companies and should not be considered in isolation or as a replacement for our measure of profit for the period as presented in accordance with IFRS.
The table below presents a reconciliation of dLocal’s Adjusted net income:
$ in thousands |
Three months ended December 31 |
Twelve months ended December 31 |
||
|
2024 |
2023 |
2024 |
2023 |
Net income as reported |
29,701 |
28,481 |
120,469 |
149,086 |
Inflation adjustment |
392 |
6,040 |
6,655 |
12,537 |
Loan - exchange difference |
2,332 |
51,858 |
22,602 |
81,024 |
Argentina Treasury Notes Hedging Costs |
5,536 |
- |
9,808 |
- |
Fair value loss / (gain) of financial assets at FVTPL |
(5,115) |
(50,754) |
(38,609) |
(78,640) |
Impairment loss / (gain) on financial assets |
533 |
(657) |
440 |
(3,135) |
Share-based payment non-cash charges |
6,339 |
4,850 |
23,780 |
11,922 |
Other operating loss¹ |
1,307 |
- |
5,257 |
- |
Other non-recurring costs³ |
1,571 |
434 |
1,571 |
1,663 |
Tax effect on adjustments |
(1,310) |
386 |
(899) |
834 |
Adjusted net income |
45,828 |
40,638 |
155,616 |
175,291 |
Unaudited quarterly results.
Note: 1 The company wrote-off certain amounts related to merchants/processors off-boarded by dLocal. 2 In Q4 2024, income tax was impacted by an income tax settlement related to previous periods, as disclosed in the Note 12 - Income Tax. 3 Other non-recurring costs consist of costs not directly associated with our core business activities, including costs associated with addressing the allegations made by a short-seller report and certain class action and other legal and regulatory expenses (which include fees from counsel, global expert services and a forensic accounting advisory firm) in 2023 and 2024.
Exhibit 99.1
Earnings per share
We calculate basic earnings per share by dividing the profit attributable to owners of the group by the weighted average number of common shares outstanding during the three-month and twelve-month periods ended December 31, 2024 and 2023.
Our diluted earnings per share is calculated by dividing the profit attributable to owners of the group of dLocal by the weighted average number of common shares outstanding during the period plus the weighted average number of common shares that would be issued on conversion of all dilutive potential common shares into common shares.
The following table presents the information used as a basis for the calculation of our earnings per share:
|
Three months ended December 31 |
Twelve months ended December 31 |
||
|
2024 |
2023 |
2024 |
2023 |
Profit attributable to common shareholders (USD) |
29,682,000 |
28,515,000 |
120,416,000 |
148,964,000 |
Weighted average number of common shares |
280,443,489 |
290,657,015 |
290,014,019 |
291,982,305 |
Adjustments for calculation of diluted earnings per share |
14,417,466 |
5,008,261 |
15,122,271 |
10,976,123 |
Weighted average number of common shares for calculating diluted earnings per share |
294,860,956 |
295,665,276 |
305,136,290 |
302,958,428 |
Basic earnings per share |
0.11 |
0.10 |
0.42 |
0.51 |
Diluted earnings per share |
0.10 |
0.10 |
0.39 |
0.49 |
This press release does not contain sufficient information to constitute an interim financial report as defined in International Accounting Standards 34, “Interim Financial Reporting” nor a financial statement as defined by International Accounting Standards 1 “Presentation of Financial Statements”. The quarterly financial information in this press release has not been audited, whereas the annual results for the year ended December 31, 2024 and 2023 are audited.
Exhibit 99.1
Conference call and webcast
dLocal’s management team will host a conference call and audio webcast on February 27, 2025 at 5:00 p.m. Eastern Time. Please click here to pre-register for the conference call and obtain your dial in number and passcode.
The live conference call can be accessed via audio webcast at the investor relations section of dLocal’s website, at https://investor.dlocal.com/. An archive of the webcast will be available for a year following the conclusion of the conference call. The investor presentation will also be filed on EDGAR at www.sec.gov.
About dLocal
dLocal powers local payments in emerging markets, connecting global enterprise merchants with billions of emerging market consumers in more than 40 countries across Africa, Asia, and Latin America. Through the “One dLocal” platform (one direct API, one platform, and one contract), global companies can accept payments, send pay-outs and settle funds globally without the need to manage separate pay-in and pay-out processors, set up numerous local entities, and integrate multiple acquirers and payment methods in each market.
Exhibit 99.1
Definition of selected operational metrics
“API” means application programming interface, which is a general term for programming techniques that are available for software developers when they integrate with a particular service or application. In the payments industry, APIs are usually provided by any party participating in the money flow (such as payment gateways, processors, and service providers) to facilitate the money transfer process.
“Cross-border” means a payment transaction whereby dLocal is collecting in one currency and settling into a different currency and/or in a different geography.
“Local payment methods” refers to any payment method that is processed in the country where the end user of the merchant sending or receiving payments is located, which include credit and debit cards, cash payments, bank transfers, mobile money, and digital wallets.
“Local-to-local” means a payment transaction whereby dLocal is collecting and settling in the same currency.
“Net Revenue Retention Rate” or “NRR” is a U.S. dollar-based measure of retention and growth of dLocal’s merchants. NRR is calculated for a period or year by dividing the Current Period/Year Revenue by the Prior Period/Year Revenue. The Prior Period/Year Revenue is the revenue billed by us to all our customers in the prior period. The Current Period/Year Revenue is the revenue billed by us in the current period to the same customers included in the Prior Period/Year Revenue. Current Period/Year Revenue includes revenues from any upselling and cross-selling across products, geographies, and payment methods to such merchant customers, and is net of any contractions or attrition, in respect of such merchant customers, and excludes revenue from new customers on-boarded in the preceding twelve months. As most of dLocal revenues come from existing merchants, the NRR rate is a key metric used by management, and we believe it is useful for investors in order to assess our retention of existing customers and growth in revenues from our existing customer base.
“Pay-in” means a payment transaction whereby dLocal’s merchant customers receive payment from their customers.
“Pay-out” means a payment transaction whereby dLocal disburses money in local currency to the business partners or customers of dLocal’s merchant customers.
“Revenue from New Merchants” means the revenue billed by us to merchant customers that we did not bill revenues in the same quarter (or period) of the prior year.
“Revenue from Existing Merchants” means the revenue billed by us in the last twelve months to the merchant customers that we billed revenue in the same quarter (or period) of the prior year.
“TPV” dLocal presents total payment volume, or TPV, which is an operating metric of the aggregate value of all payments successfully processed through dLocal’s payments platform. Because revenue depends significantly on the total value of transactions processed through the dLocal platform, management believes that TPV is an indicator of the success of dLocal’s global merchants, the satisfaction of their end users, and the scale and growth of dLocal’s business.
Rounding: We have made rounding adjustments to some of the figures included in this interim report. Accordingly, numerical figures shown as totals in some tables may not be an arithmetic aggregation of the figures that preceded them.
Exhibit 99.1
Forward-looking statements
This press release contains certain forward-looking statements. These forward-looking statements convey dLocal’s current expectations or forecasts of future events, including guidance in respect of total payment volume, revenue, gross profit and Adjusted EBITDA. Forward-looking statements regarding dLocal and amounts stated as guidance are based on current management expectations and involve known and unknown risks, uncertainties and other factors that may cause dLocal’s actual results, performance or achievements to be materially different from any future results, performances or achievements expressed or implied by the forward-looking statements. Certain of these risks and uncertainties are described in the “Risk Factors,” “Forward-Looking Statements” and “Cautionary Statement Regarding Forward-Looking Statements” sections of dLocal’s filings with the U.S. Securities and Exchange Commission. Unless required by law, dLocal undertakes no obligation to publicly update or revise any forward-looking statements to reflect circumstances or events after the date hereof. In addition, dLocal is unable to present a quantitative reconciliation of forward-looking guidance for Adjusted EBITDA, because dLocal cannot reliably predict certain of their necessary components, such as impairment gains/(losses) on financial assets, transaction costs, and inflation adjustment.
Exhibit 99.1
dLocal Limited
Certain financial information
Consolidated Condensed Interim Statements of Comprehensive Income for the three-month and twelve-month periods ended December 31, 2024 and 2023
(All amounts in thousands of U.S. Dollars except share data or as otherwise indicated)
|
Three months ended December 31 |
Twelve months ended December 31 |
||
|
2024 |
2023 |
2024 |
2023 |
Continuing operations |
|
|
|
|
Revenues |
204,491 |
188,005 |
745,974 |
650,351 |
Cost of services |
(120,780) |
(118,286) |
(451,301) |
(373,492) |
Gross profit |
83,711 |
69,719 |
294,673 |
276,859 |
|
|
|
|
|
Technology and development expenses |
(6,822) |
(4,024) |
(25,625) |
(12,650) |
Sales and marketing expenses |
(5,598) |
(4,710) |
(21,626) |
(17,120) |
General and administrative expenses |
(27,183) |
(20,641) |
(101,225) |
(70,568) |
Impairment (loss)/gain on financial assets |
(533) |
657 |
(440) |
3,136 |
Other operating (loss)/gain |
(1,307) |
- |
(5,257) |
- |
Operating profit |
42,268 |
41,001 |
140,500 |
179,657 |
Finance income |
12,036 |
57,913 |
66,875 |
128,228 |
Finance costs |
(13,121) |
(56,917) |
(49,701) |
(116,834) |
Inflation adjustment |
(392) |
(6,040) |
(6,655) |
(12,537) |
Other results |
(1,477) |
(5,044) |
10,519 |
(1,143) |
Profit before income tax |
40,791 |
35,957 |
151,019 |
178,514 |
Income tax expense |
(11,090) |
(7,476) |
(30,550) |
(29,428) |
Profit for the period |
29,701 |
28,481 |
120,469 |
149,086 |
|
|
|
|
|
Profit attributable to: |
|
|
|
|
Owners of the Group |
29,682 |
28,515 |
120,416 |
148,964 |
Non-controlling interest |
19 |
(34) |
53 |
122 |
Profit for the period |
29,701 |
28,481 |
120,469 |
149,086 |
|
|
|
|
|
Earnings per share (in USD) |
|
|
|
|
Basic Earnings per share |
0.11 |
0.10 |
0.42 |
0.51 |
Diluted Earnings per share |
0.10 |
0.10 |
0.39 |
0.49 |
|
|
|
|
|
Other comprehensive income |
|
|
|
|
Items that may be reclassified to profit or loss: |
|
|
|
|
Exchange difference on translation on foreign operations |
(4,417) |
(9,054) |
(11,188) |
(7,713) |
Other comprehensive income for the period, net of tax |
(4,417) |
(9,054) |
(11,188) |
(7,713) |
Total comprehensive income for the period, net of tax |
25,284 |
19,427 |
109,281 |
141,373 |
|
|
|
|
|
Total comprehensive income for the period |
|
|
|
|
Owners of the Group |
25,311 |
19,463 |
109,290 |
141,255 |
Non-controlling interest |
(27) |
(36) |
(9) |
118 |
Total comprehensive income for the period |
25,284 |
19,427 |
109,281 |
141,373 |
Exhibit 99.1
dLocal Limited
Certain financial information
Consolidated Condensed Interim Statements of Financial Position as of December 31, 2024 and December 31, 2023
(All amounts in thousands of U.S. dollars)
|
December 31, 2024 |
December 31, 2023 |
ASSETS |
|
|
Current Assets |
|
|
Cash and cash equivalents |
425,172 |
536,160 |
Financial assets at fair value through profit or loss |
129,319 |
102,677 |
Trade and other receivables |
496,713 |
363,374 |
Derivative financial instruments |
2,874 |
2,040 |
Other assets |
18,805 |
11,782 |
Total Current Assets |
1,072,883 |
1,016,033 |
|
|
|
Non-Current Assets |
|
|
Financial assets at fair value through profit or loss |
- |
1,710 |
Trade and other receivables |
18,044 |
- |
Deferred tax assets |
5,367 |
2,217 |
Property, plant and equipment |
3,377 |
2,917 |
Right-of-use assets |
3,645 |
3,689 |
Intangible assets |
63,318 |
57,887 |
Other assets |
4,695 |
- |
Total Non-Current Assets |
98,446 |
68,420 |
TOTAL ASSETS |
1,171,329 |
1,084,453 |
|
|
|
LIABILITIES |
|
|
Current Liabilities |
|
|
Trade and other payables |
597,787 |
602,493 |
Lease liabilities |
1,137 |
626 |
Tax liabilities |
21,515 |
20,800 |
Derivative financial instruments |
6,227 |
948 |
Financial liabilities |
50,455 |
- |
Provisions |
500 |
362 |
Total Current Liabilities |
677,621 |
625,229 |
|
|
|
Non-Current Liabilities |
|
|
Deferred tax liabilities |
1,858 |
753 |
Lease liabilities |
2,863 |
3,331 |
Total Non-Current Liabilities |
4,721 |
4,084 |
TOTAL LIABILITIES |
682,342 |
629,313 |
|
|
|
EQUITY |
|
|
Share Capital |
570 |
591 |
Share Premium |
186,769 |
173,001 |
Treasury Shares |
(200,980) |
(99,936) |
Capital Reserve |
33,438 |
21,575 |
Other Reserves |
(20,934) |
(9,808) |
Retained earnings |
490,024 |
369,608 |
Total Equity Attributable to owners of the Group |
488,887 |
455,031 |
Non-controlling interest |
100 |
109 |
TOTAL EQUITY |
488,987 |
455,140 |
TOTAL EQUITY AND LIABILITIES |
1,171,329 |
1,084,453 |
Exhibit 99.1
dLocal Limited
Certain interim financial information
Consolidated Statements of Cash flows for the three-month and twelve-month periods ended December 31, 2024 and 2023
(All amounts in thousands of U.S. dollars)
|
Three months ended December 31 |
Twelve months ended December 31 |
||
|
2024 |
2023 |
2024 |
2023 |
Cash flows from operating activities |
|
|
|
|
Profit before income tax |
40,791 |
35,957 |
151,019 |
178,514 |
Adjustments: |
|
|
|
|
Interest Income from financial instruments |
(6,921) |
(7,159) |
(28,266) |
(49,588) |
Interest charges for lease liabilities |
370 |
110 |
501 |
578 |
Other interests charges |
739 |
2,503 |
3,758 |
5,623 |
Finance expense related to derivative financial instruments |
(627) |
5,497 |
19,462 |
28,013 |
Net exchange differences |
5,914 |
50,100 |
24,787 |
82,620 |
Fair value loss/(gain) on financial assets at FVPL |
(3,922) |
(50,754) |
(37,416) |
(78,640) |
Amortization of Intangible assets |
4,364 |
3,251 |
15,511 |
10,816 |
Depreciation and disposals of PP&E and right-of-use |
652 |
353 |
1,884 |
1,409 |
Share-based payment expense, net of forfeitures |
6,339 |
4,850 |
23,780 |
11,922 |
Other operating gain |
786 |
- |
4,736 |
- |
Net Impairment loss/(gain) on financial assets |
533 |
2,796 |
440 |
318 |
Inflation adjustment and other financial results |
(5,704) |
9,041 |
(17,063) |
9,041 |
|
43,313 |
56,546 |
163,133 |
200,626 |
Changes in working capital |
|
|
|
|
Increase in Trade and other receivables |
(109,487) |
(51,154) |
(162,645) |
(123,246) |
Decrease / (Increase) in Other assets |
4,128 |
13,258 |
5,427 |
45,007 |
Increase / (Decrease) in Trade and Other payables |
(70,700) |
52,654 |
(6,957) |
194,619 |
Increase / (Decrease) in Tax Liabilities |
(3,835) |
(6,591) |
(3,184) |
(10,967) |
Increase / (Decrease) in Provisions |
222 |
(275) |
138 |
(1,111) |
Cash (used) / generated from operating activities |
(136,359) |
64,438 |
(4,088) |
304,928 |
Income tax paid |
(4,773) |
(2,996) |
(28,696) |
(11,475) |
Net cash (used) / generated from operating activities |
(141,132) |
61,442 |
(32,784) |
293,453 |
|
|
|
|
|
Cash flows from investing activities |
|
|
|
|
Acquisitions of Property, plant and equipment |
(427) |
21 |
(1,705) |
(965) |
Additions of Intangible assets |
(5,699) |
(4,758) |
(20,942) |
(17,260) |
Acquisition of financial assets at FVPL |
(14,852) |
(15,847) |
(121,468) |
(117,517) |
Collections of financial assets at FVPL |
- |
3,721 |
108,097 |
1,487 |
Interest collected from financial instruments |
6,921 |
7,159 |
28,266 |
49,588 |
Payments for investments in other assets at FVPL |
(10,000) |
- |
(10,000) |
- |
Net cash (used in) / generated investing activities |
(24,057) |
(9,704) |
(17,752) |
(84,667) |
|
|
|
|
|
Cash flows from financing activities |
|
|
|
|
Repurchase of shares |
- |
- |
(101,067) |
(97,929) |
Share-options exercise paid |
358 |
- |
1,853 |
153 |
Interest payments on lease liability |
(370) |
(110) |
(501) |
(578) |
Principal payments on lease liability |
(112) |
(315) |
(552) |
(1,103) |
Finance expense paid related to derivative financial instruments |
(8) |
(7,640) |
(15,017) |
(28,443) |
Net proceeds from financial liabilities |
33,653 |
- |
50,428 |
- |
Interest payments on financial liabilities |
(1,633) |
- |
(2,281) |
- |
Other finance expense paid |
(327) |
(2,851) |
(1,450) |
(5,971) |
Net cash used in by financing activities |
31,561 |
(10,916) |
(68,587) |
(133,871) |
Net increase in cash flow |
(133,628) |
40,822 |
(119,123) |
74,915 |
|
|
|
|
|
Cash and cash equivalents at the beginning of the period |
560,533 |
498,165 |
536,160 |
468,092 |
Net (decrease)/increase in cash flow |
(133,628) |
40,822 |
(119,123) |
74,915 |
Effects of exchange rate changes on inflation and cash and cash equivalents |
(1,732) |
(2,827) |
8,135 |
(6,847) |
Cash and cash equivalents at the end of the period |
425,172 |
536,160 |
425,172 |
536,160 |
Exhibit 99.1
Investor Relations Contact:
investor@dlocal.com
Media Contact:
media@dlocal.com

Exhibit 99.2
DLocal Limited Consolidated Financial Statements as of December 31, 2024 and 2023, and for the three years ended December 31, 2024,
with the Report of the Independent Registered Public Accounting Firm

Report of Independent Registered Public Accounting Firm
To the Board of Directors and Shareholders of DLocal Limited
Opinions on the Financial Statements
We have audited the accompanying consolidated statements of financial position of DLocal Limited and its subsidiaries (the “Company”) as of December 31, 2024 and 2023, and the related consolidated statements of income and comprehensive income, changes in equity and cash flows for each of the three years in the period ended December 31, 2024, including the related notes (collectively referred to as the “consolidated financial statements”). In our opinion, the consolidated financial statements referred to above present fairly, in all material respects, the financial position of the Company as of December 31, 2024 and 2023, and the results of its operations and its cash flows for each of the three years in the period ended December 31, 2024 in conformity with IFRS Accounting Standards as issued by the International Accounting Standards Board.
Basis for Opinion
These consolidated financial statements are the responsibility of the Company’s management. Our responsibility is to express an opinion on the Company’s consolidated financial statements based on our audits. We are a public accounting firm registered with the Public Company Accounting Oversight Board (United States) (PCAOB) and are required to be independent with respect to the Company in accordance with the U.S. federal securities laws and the applicable rules and regulations of the Securities and Exchange Commission and the PCAOB.
We conducted our audits of these consolidated financial statements in accordance with the standards of the PCAOB. Those standards require that we plan and perform the audits to obtain reasonable assurance about whether the consolidated financial statements are free of material misstatement, whether due to error or fraud.
Our audits included performing procedures to assess the risks of material misstatement of the consolidated financial statements, whether due to error or fraud, and performing procedures that respond to those risks. Such procedures included examining, on a test basis, evidence regarding the amounts and disclosures in the consolidated financial statements. Our audits also included evaluating the accounting principles used and significant estimates made by management, as well as evaluating the overall presentation of the consolidated financial statements. We believe that our audits provide a reasonable basis for our opinion.
Critical Audit Matters
The critical audit matter communicated below is a matter arising from the current period audit of the consolidated financial statements that was communicated or required to be communicated to the audit committee and that (i) relates to accounts or disclosures that are material to the consolidated financial statements and (ii) involved our especially challenging, subjective, or complex judgments. The communication of critical audit matters does not alter in any way our opinion on the consolidated financial statements, taken as a whole, and we are not, by communicating the critical audit matter below, providing a separate opinion on the critical audit matter or on the accounts or disclosures to which it relates.
Audit of Transaction revenues
As described in Notes 2.15 and 6 to the consolidated financial statements, the Company’s transaction revenues were $739.9 million for the year ended December 31, 2024 representing 99.19% of the Company’s total consolidated revenues. These revenues are generated mainly by processing fees and foreign exchange service fees, defined either as percentage of the transaction value or a fixed amount per transaction depending on each agreement.
2
The principal considerations for our determination that performing procedures relating to the audit of transaction revenues is a critical audit matter are (i) the complexity of the Company’s processes for setting the transaction revenues with their merchants mostly defined individually, which in turn led to (ii) a significant effort in performing procedures and evaluating audit evidence related to such processes; and (iii) the involvement of professionals with specialized skills and knowledge.
Addressing the matter involved performing procedures and evaluating audit evidence in connection with forming our overall opinion on the consolidated financial statements. These procedures included testing the effectiveness of controls relating to the transaction revenue recognition process, including controls over management’s processes for calculating and recording transaction revenues. These procedures also included among others: (i) performing detailed testing of transactions recognized as transaction revenues by agreeing the amounts recognized to source documents; and (ii) testing the mathematical accuracy of transactions recognized as transaction revenues. Professionals with specialized skills and knowledge were involved in the testing of the effectiveness of controls relating to management’s processes for calculating and recording transaction revenues.
/s/ Price Waterhouse & Co. S.R.L.
/s/ Mario Angel Julio (Partner)
Autonomous City of Buenos Aires, Argentina
February 27, 2025
We have served as the Company’s auditor since 2020.
3
DLocal Limited
Consolidated Statements of Income and Comprehensive Income
Years ended December 31, 2024, 2023 and 2022
(All amounts in thousands of U.S. Dollars except share data or as otherwise indicated)
|
|
Notes |
|
For the Year Ended December 31, |
|
|||||||||
|
|
|
|
2024 |
|
|
2023 |
|
|
2022 |
|
|||
Continuing operations |
|
|
|
|
|
|
|
|
|
|
|
|||
Revenues |
|
6 |
|
|
745,974 |
|
|
|
650,351 |
|
|
|
418,925 |
|
Cost of services |
|
6 |
|
|
(451,301 |
) |
|
|
(373,492 |
) |
|
|
(216,758 |
) |
Gross profit |
|
|
|
|
294,673 |
|
|
|
276,859 |
|
|
|
202,167 |
|
|
|
|
|
|
|
|
|
|
|
|
|
|||
Technology and development expenses |
|
7 |
|
|
(25,625 |
) |
|
|
(12,650 |
) |
|
|
(6,348 |
) |
Sales and marketing expenses |
|
8 |
|
|
(21,626 |
) |
|
|
(17,120 |
) |
|
|
(13,335 |
) |
General and administrative expenses |
|
8 |
|
|
(101,225 |
) |
|
|
(70,568 |
) |
|
|
(48,343 |
) |
Impairment (loss)/gain on financial assets |
|
16 |
|
|
(440 |
) |
|
|
3,136 |
|
|
|
(5,534 |
) |
Other operating loss |
|
|
|
|
(5,257 |
) |
|
|
— |
|
|
|
(697 |
) |
Operating profit |
|
|
|
|
140,500 |
|
|
|
179,657 |
|
|
|
127,910 |
|
Finance income |
|
11 |
|
|
66,875 |
|
|
|
128,228 |
|
|
|
18,078 |
|
Finance costs |
|
11 |
|
|
(49,701 |
) |
|
|
(116,834 |
) |
|
|
(24,668 |
) |
Inflation adjustment |
|
11 |
|
|
(6,655 |
) |
|
|
(12,537 |
) |
|
|
(1,037 |
) |
Other results |
|
|
|
|
10,519 |
|
|
|
(1,143 |
) |
|
|
(7,627 |
) |
Profit before income tax |
|
|
|
|
151,019 |
|
|
|
178,514 |
|
|
|
120,283 |
|
Income tax expense |
|
12 |
|
|
(30,550 |
) |
|
|
(29,428 |
) |
|
|
(11,586 |
) |
Profit for the year |
|
|
|
|
120,469 |
|
|
|
149,086 |
|
|
|
108,697 |
|
Profit attributable to: |
|
|
|
|
|
|
|
|
|
|
|
|||
Owners of the Group |
|
|
|
|
120,416 |
|
|
|
148,964 |
|
|
|
108,683 |
|
Non-controlling interest |
|
|
|
|
53 |
|
|
|
122 |
|
|
|
14 |
|
Profit for the year |
|
|
|
|
120,469 |
|
|
|
149,086 |
|
|
|
108,697 |
|
Earnings per share |
|
|
|
|
|
|
|
|
|
|
|
|||
Basic Earnings per share |
|
13 |
|
|
0.42 |
|
|
|
0.51 |
|
|
|
0.37 |
|
Diluted Earnings per share |
|
13 |
|
|
0.39 |
|
|
|
0.49 |
|
|
|
0.35 |
|
Other comprehensive Income |
|
|
|
|
|
|
|
|
|
|
|
|||
Items that are or may be reclassified subsequently to profit or loss: |
|
|
|
|
|
|
|
|
|
|
|
|||
Exchange difference on translation on foreign operations |
|
|
|
|
(11,188 |
) |
|
|
(7,713 |
) |
|
|
20 |
|
Other comprehensive income for the year, net of tax |
|
|
|
|
(11,188 |
) |
|
|
(7,713 |
) |
|
|
20 |
|
Total comprehensive income for the year |
|
|
|
|
109,281 |
|
|
|
141,373 |
|
|
|
108,717 |
|
Total comprehensive income for the year is attributable to: |
|
|
|
|
|
|
|
|
|
|
|
|||
Owners of the Group |
|
|
|
|
109,290 |
|
|
|
141,255 |
|
|
|
108,708 |
|
Non-controlling interest |
|
|
|
|
(9 |
) |
|
|
118 |
|
|
|
9 |
|
Total comprehensive income for the year |
|
|
|
|
109,281 |
|
|
|
141,373 |
|
|
|
108,717 |
|
The accompanying notes are an integral part of these consolidated financial statements.
DLocal Limited
Consolidated Statements of Financial Position
At December 31, 2024 and 2023
(All amounts in thousands of U.S. Dollars)
|
|
Notes |
|
December 31, 2024 |
|
|
December 31, 2023 |
|
||
ASSETS |
|
|
|
|
|
|
|
|
||
Current Assets |
|
|
|
|
|
|
|
|
||
Cash and cash equivalents |
|
14 |
|
|
425,172 |
|
|
|
536,160 |
|
Financial assets at fair value through profit or loss |
|
15 |
|
|
129,319 |
|
|
|
102,677 |
|
Trade and other receivables |
|
16 |
|
|
496,713 |
|
|
|
363,374 |
|
Derivative financial instruments |
|
24 |
|
|
2,874 |
|
|
|
2,040 |
|
Other assets |
|
17 |
|
|
18,805 |
|
|
|
11,782 |
|
Total Current Assets |
|
|
|
|
1,072,883 |
|
|
|
1,016,033 |
|
Non-Current Assets |
|
|
|
|
|
|
|
|
||
Financial assets at fair value through profit or loss |
|
15 |
|
|
— |
|
|
|
1,710 |
|
Trade and other receivables |
|
16 |
|
|
18,044 |
|
|
|
— |
|
Deferred tax assets |
|
12 |
|
|
5,367 |
|
|
|
2,217 |
|
Property, plant and equipment |
|
18 |
|
|
3,377 |
|
|
|
2,917 |
|
Right-of-use assets |
|
19 |
|
|
3,645 |
|
|
|
3,689 |
|
Intangible assets |
|
20 |
|
|
63,318 |
|
|
|
57,887 |
|
Other assets |
|
17 |
|
|
4,695 |
|
|
|
— |
|
Total Non-Current Assets |
|
|
|
|
98,446 |
|
|
|
68,420 |
|
TOTAL ASSETS |
|
|
|
|
1,171,329 |
|
|
|
1,084,453 |
|
LIABILITIES |
|
|
|
|
|
|
|
|
||
Current Liabilities |
|
|
|
|
|
|
|
|
||
Trade and other payables |
|
21 |
|
|
597,787 |
|
|
|
602,493 |
|
Lease liabilities |
|
19 |
|
|
1,137 |
|
|
|
626 |
|
Tax liabilities |
|
23 |
|
|
21,515 |
|
|
|
20,800 |
|
Derivative financial instruments |
|
24 |
|
|
6,227 |
|
|
|
948 |
|
Financial liabilities |
|
22 |
|
|
50,455 |
|
|
|
— |
|
Provisions |
|
25 |
|
|
500 |
|
|
|
362 |
|
Total Current Liabilities |
|
|
|
|
677,621 |
|
|
|
625,229 |
|
Non-Current Liabilities |
|
|
|
|
|
|
|
|
||
Deferred tax liabilities |
|
12 |
|
|
1,858 |
|
|
|
753 |
|
Lease liabilities |
|
19 |
|
|
2,863 |
|
|
|
3,331 |
|
Total Non-Current Liabilities |
|
|
|
|
4,721 |
|
|
|
4,084 |
|
TOTAL LIABILITIES |
|
|
|
|
682,342 |
|
|
|
629,313 |
|
EQUITY |
|
|
|
|
|
|
|
|
||
Share Capital |
|
13 |
|
|
570 |
|
|
|
591 |
|
Share Premium |
|
13 |
|
|
186,769 |
|
|
|
173,001 |
|
Treasury Shares |
|
13 |
|
|
(200,980 |
) |
|
|
(99,936 |
) |
Capital Reserve |
|
13 |
|
|
33,438 |
|
|
|
21,575 |
|
Other Reserves |
|
13 |
|
|
(20,934 |
) |
|
|
(9,808 |
) |
Retained earnings |
|
13 |
|
|
490,024 |
|
|
|
369,608 |
|
Total Equity Attributable to owners of the Group |
|
|
|
|
488,887 |
|
|
|
455,031 |
|
Non-controlling interest |
|
|
|
|
100 |
|
|
|
109 |
|
TOTAL EQUITY |
|
|
|
|
488,987 |
|
|
|
455,140 |
|
TOTAL EQUITY AND LIABILITIES |
|
|
|
|
1,171,329 |
|
|
|
1,084,453 |
|
The accompanying notes are an integral part of these consolidated financial statements.
DLocal Limited
Consolidated Statements of Changes in Equity
Years ended December 31, 2024, 2023 and 2022
(All amounts in thousands of U.S. Dollars)
|
|
Notes |
|
Share |
|
|
Share |
|
|
Treasury Shares |
|
|
Capital |
|
|
Other Reserves |
|
|
Retained |
|
|
Total |
|
|
Non- |
|
|
Total |
|
|||||||||
Balance as of January 1st, 2024 |
|
|
|
|
591 |
|
|
|
173,001 |
|
|
|
(99,936 |
) |
|
|
21,575 |
|
|
|
(9,808 |
) |
|
|
369,608 |
|
|
|
455,031 |
|
|
|
109 |
|
|
|
455,140 |
|
Comprehensive Income for the year |
|
|
|
|
|
|
|
|
|
|
|
|
|
|
|
|
|
|
|
|
|
|
|
|
|
|
|
|
|
|||||||||
Profit of the year |
|
|
|
|
— |
|
|
|
— |
|
|
|
— |
|
|
|
— |
|
|
|
— |
|
|
|
120,416 |
|
|
|
120,416 |
|
|
|
53 |
|
|
|
120,469 |
|
Exchange difference on translation on foreign |
|
|
|
|
— |
|
|
|
— |
|
|
|
— |
|
|
|
— |
|
|
|
(11,126 |
) |
|
|
— |
|
|
|
(11,126 |
) |
|
|
(62 |
) |
|
|
(11,188 |
) |
Total Comprehensive Income for the year |
|
|
|
|
— |
|
|
|
— |
|
|
|
— |
|
|
|
— |
|
|
|
(11,126 |
) |
|
|
120,416 |
|
|
|
109,290 |
|
|
|
(9 |
) |
|
|
109,281 |
|
Transactions with Group owners in their |
|
|
|
|
|
|
|
|
|
|
|
|
|
|
|
|
|
|
|
|
|
|
|
|
|
|
|
|
|
|||||||||
Share-options exercise |
|
13 |
|
|
2 |
|
|
|
13,768 |
|
|
|
— |
|
|
|
(11,917 |
) |
|
|
— |
|
|
|
— |
|
|
|
1,853 |
|
|
|
— |
|
|
|
1,853 |
|
Share-based payments net of forfeitures |
|
9 |
|
|
— |
|
|
|
— |
|
|
|
— |
|
|
|
23,780 |
|
|
|
— |
|
|
|
— |
|
|
|
23,780 |
|
|
|
— |
|
|
|
23,780 |
|
Repurchase of shares |
|
13 |
|
|
(23 |
) |
|
|
— |
|
|
|
(101,044 |
) |
|
|
— |
|
|
|
— |
|
|
|
— |
|
|
|
(101,067 |
) |
|
|
— |
|
|
|
(101,067 |
) |
Transactions with Group owners in their |
|
|
|
|
(21 |
) |
|
|
13,768 |
|
|
|
(101,044 |
) |
|
|
11,863 |
|
|
|
— |
|
|
|
— |
|
|
|
(75,434 |
) |
|
|
— |
|
|
|
(75,434 |
) |
Balance as of December 31st, 2024 |
|
|
|
|
570 |
|
|
|
186,769 |
|
|
|
(200,980 |
) |
|
|
33,438 |
|
|
|
(20,934 |
) |
|
|
490,024 |
|
|
|
488,887 |
|
|
|
100 |
|
|
|
488,987 |
|
Balance as of January 1st, 2023 |
|
|
|
|
592 |
|
|
|
166,328 |
|
|
|
(2,021 |
) |
|
|
16,185 |
|
|
|
(1,448 |
) |
|
|
219,993 |
|
|
|
399,629 |
|
|
|
(9 |
) |
|
|
399,620 |
|
Comprehensive Income for the year |
|
|
|
|
|
|
|
|
|
|
|
|
|
|
|
|
|
|
|
|
|
|
|
|
|
|
|
|
|
|||||||||
Profit of the year |
|
|
|
|
— |
|
|
|
— |
|
|
|
— |
|
|
|
— |
|
|
|
— |
|
|
|
148,964 |
|
|
|
148,964 |
|
|
|
122 |
|
|
|
149,086 |
|
Exchange difference on translation on foreign |
|
|
|
|
— |
|
|
|
— |
|
|
|
— |
|
|
|
— |
|
|
|
(8,360 |
) |
|
|
651 |
|
|
|
(7,709 |
) |
|
|
(4 |
) |
|
|
(7,713 |
) |
Total Comprehensive Income for the year |
|
|
|
|
— |
|
|
|
— |
|
|
|
— |
|
|
|
— |
|
|
|
(8,360 |
) |
|
|
149,615 |
|
|
|
141,255 |
|
|
|
118 |
|
|
|
141,373 |
|
Transactions with Group owners in their |
|
|
|
|
|
|
|
|
|
|
|
|
|
|
|
|
|
|
|
|
|
|
|
|
|
|
|
|
|
|||||||||
Share-options exercise |
|
13 |
|
|
— |
|
|
|
5,051 |
|
|
|
— |
|
|
|
(4,898 |
) |
|
|
— |
|
|
|
— |
|
|
|
153 |
|
|
|
— |
|
|
|
153 |
|
Warrant Exercise |
|
9 |
|
|
13 |
|
|
|
1,622 |
|
|
|
— |
|
|
|
(1,634 |
) |
|
|
— |
|
|
|
— |
|
|
|
1 |
|
|
|
— |
|
|
|
1 |
|
Share-based payments net of forfeitures |
|
9 |
|
|
— |
|
|
|
— |
|
|
|
— |
|
|
|
11,922 |
|
|
|
— |
|
|
|
— |
|
|
|
11,922 |
|
|
|
— |
|
|
|
11,922 |
|
Repurchase of shares |
|
13 |
|
|
(14 |
) |
|
|
— |
|
|
|
(97,915 |
) |
|
|
— |
|
|
|
— |
|
|
|
— |
|
|
|
(97,929 |
) |
|
|
— |
|
|
|
(97,929 |
) |
Transactions with Group owners in their |
|
|
|
|
(1 |
) |
|
|
6,673 |
|
|
|
(97,915 |
) |
|
|
5,390 |
|
|
|
— |
|
|
|
— |
|
|
|
(85,853 |
) |
|
|
— |
|
|
|
(85,853 |
) |
Balance as of December 31st, 2023 |
|
|
|
|
591 |
|
|
|
173,001 |
|
|
|
(99,936 |
) |
|
|
21,575 |
|
|
|
(9,808 |
) |
|
|
369,608 |
|
|
|
455,031 |
|
|
|
109 |
|
|
|
455,140 |
|
Balance as of January 1st, 2022 |
|
|
|
|
590 |
|
|
|
157,151 |
|
|
|
— |
|
|
|
12,741 |
|
|
|
(30 |
) |
|
|
109,867 |
|
|
|
280,319 |
|
|
|
(18 |
) |
|
|
280,301 |
|
Comprehensive Income for the year |
|
|
|
|
|
|
|
|
|
|
|
|
|
|
|
|
|
|
|
|
|
|
|
|
|
|
|
|
|
|||||||||
Profit of the year |
|
|
|
|
— |
|
|
|
— |
|
|
|
— |
|
|
|
— |
|
|
|
— |
|
|
|
108,683 |
|
|
|
108,683 |
|
|
|
14 |
|
|
|
108,697 |
|
Exchange difference on translation on foreign |
|
|
|
|
— |
|
|
|
— |
|
|
|
— |
|
|
|
— |
|
|
|
(1,418 |
) |
|
|
1,443 |
|
|
|
25 |
|
|
|
(5 |
) |
|
|
20 |
|
Total Comprehensive Income for the year |
|
|
|
|
— |
|
|
|
— |
|
|
|
— |
|
|
|
— |
|
|
|
(1,418 |
) |
|
|
110,126 |
|
|
|
108,708 |
|
|
|
9 |
|
|
|
108,717 |
|
Transactions with Group owners in their |
|
|
|
|
|
|
|
|
|
|
|
|
|
|
|
|
|
|
|
|
|
|
|
|
|
|
|
|
|
|||||||||
Share-options exercise |
|
13 |
|
|
2 |
|
|
|
9,177 |
|
|
|
— |
|
|
|
(5,240 |
) |
|
|
— |
|
|
|
— |
|
|
|
3,939 |
|
|
|
— |
|
|
|
3,939 |
|
Forfeitures of share-based payment |
|
9 |
|
|
— |
|
|
|
— |
|
|
|
— |
|
|
|
(896 |
) |
|
|
— |
|
|
|
— |
|
|
|
(896 |
) |
|
|
— |
|
|
|
(896 |
) |
Share-based payments |
|
9 |
|
|
— |
|
|
|
— |
|
|
|
— |
|
|
|
9,580 |
|
|
|
— |
|
|
|
— |
|
|
|
9,580 |
|
|
|
— |
|
|
|
9,580 |
|
Repurchase of shares |
|
13 |
|
|
— |
|
|
|
— |
|
|
|
(2,021 |
) |
|
|
— |
|
|
|
— |
|
|
|
— |
|
|
|
(2,021 |
) |
|
|
— |
|
|
|
(2,021 |
) |
Transactions with Group owners in their |
|
|
|
|
2 |
|
|
|
9,177 |
|
|
|
(2,021 |
) |
|
|
3,444 |
|
|
|
— |
|
|
|
— |
|
|
|
10,602 |
|
|
|
— |
|
|
|
10,602 |
|
Balance as of December 31st, 2022 |
|
|
|
|
592 |
|
|
|
166,328 |
|
|
|
(2,021 |
) |
|
|
16,185 |
|
|
|
(1,448 |
) |
|
|
219,993 |
|
|
|
399,629 |
|
|
|
(9 |
) |
|
|
399,620 |
|
The accompanying notes are an integral part of these consolidated financial statements.
DLocal Limited
Consolidated Statements of Cash Flows
Years ended December 31, 2024, 2023 and 2022
(All amounts in thousands of U.S. Dollars)
|
|
Notes |
|
2024 |
|
2023 |
|
2022 |
Cash flows from operating activities |
|
|
|
|
|
|
|
|
Profit before income tax |
|
|
|
151,019 |
|
178,514 |
|
120,283 |
Adjustments: |
|
|
|
|
|
|
|
|
Interest income from financial instruments |
|
11 |
|
(28,266) |
|
(49,588) |
|
(18,114) |
Interest charges for lease liabilities |
|
11 |
|
501 |
|
578 |
|
177 |
Other interests charges |
|
|
|
3,758 |
|
5,623 |
|
3,851 |
Finance expense related to derivative financial instruments |
|
|
|
19,462 |
|
28,013 |
|
17,074 |
Amortization of Intangible assets |
|
10 |
|
15,511 |
|
10,816 |
|
6,891 |
Depreciation and disposals of Property, plant and equipment and right-of-use |
|
10 |
|
1,884 |
|
1,409 |
|
1,256 |
Revenue reduction related to prepaid assets |
|
|
|
— |
|
— |
|
567 |
Share-based payment expense, net of forfeitures |
|
9 |
|
23,780 |
|
11,922 |
|
8,684 |
Net exchange differences |
|
|
|
24,787 |
|
82,620 |
|
1,877 |
Fair value loss/(gain) on financial assets at FVPL |
|
11 |
|
(37,416) |
|
(78,640) |
|
36 |
Other operating gain |
|
|
|
4,736 |
|
— |
|
— |
Net Impairment loss/(gain) on financial assets |
|
16 |
|
440 |
|
318 |
|
(42) |
Inflation adjustment and other financial results |
|
|
|
(17,063) |
|
9,041 |
|
— |
|
|
|
|
163,133 |
|
200,626 |
|
142,540 |
Changes in working capital |
|
|
|
|
|
|
|
|
Increase in Trade and other receivables |
|
16 |
|
(162,645) |
|
(123,246) |
|
(49,438) |
Decrease / (Increase) in Other assets |
|
17 |
|
5,427 |
|
45,007 |
|
(56,015) |
Increase / (Decrease) in Trade and Other payables |
|
21 |
|
(6,957) |
|
194,619 |
|
130,714 |
Increase / (Decrease) in Tax Liabilities |
|
23 |
|
(3,184) |
|
(10,967) |
|
(4,245) |
Increase / (Decrease) in Provisions |
|
25 |
|
138 |
|
(1,111) |
|
(237) |
Cash (used) / generated from operating activities |
|
|
|
(4,088) |
|
304,928 |
|
163,319 |
Income tax paid |
|
|
|
(28,696) |
|
(11,475) |
|
(8,868) |
Net cash (used) / generated from operating activities |
|
|
|
(32,784) |
|
293,453 |
|
154,451 |
Cash flows from investing activities |
|
|
|
|
|
|
|
|
Acquisitions of Property, plant and equipment |
|
18 |
|
(1,705) |
|
(965) |
|
(987) |
Additions of Intangible assets |
|
20 |
|
(20,942) |
|
(17,260) |
|
(11,365) |
Acquisitions of financial asset at FVPL |
|
|
|
(121,468) |
|
(117,517) |
|
— |
Collections of financial assets at FVPL |
|
|
|
108,097 |
|
1,487 |
|
(327) |
Interest collected from financial instruments |
|
|
|
28,266 |
|
49,588 |
|
17,649 |
Contingent Consideration Liability Paid |
|
|
|
— |
|
— |
|
(665) |
Payments for investments in other assets at FVPL |
|
17 |
|
(10,000) |
|
— |
|
— |
Net cash (used in) / generated investing activities |
|
|
|
(17,752) |
|
(84,667) |
|
4,305 |
Cash flows from financing activities |
|
|
|
|
|
|
|
|
Repurchase of shares |
|
13 |
|
(101,067) |
|
(97,929) |
|
(2,021) |
Share-options exercise paid |
|
13 |
|
1,853 |
|
153 |
|
3,939 |
Net proceeds from financial liabilities |
|
22 |
|
50,428 |
|
— |
|
14,782 |
Repayment of borrowings |
|
|
|
— |
|
— |
|
(19,967) |
Interest payments on financial liabilities |
|
|
|
(2,281) |
|
— |
|
(1,600) |
Interest payments on lease liability |
|
|
|
(501) |
|
(578) |
|
(177) |
Principal payments on lease liability |
|
|
|
(552) |
|
(1,103) |
|
(386) |
Finance expense paid related to derivative financial instruments |
|
|
|
(15,017) |
|
(28,443) |
|
(19,646) |
Other finance expense paid |
|
|
|
(1,450) |
|
(5,971) |
|
(2,251) |
Net cash used in by financing activities |
|
|
|
(68,587) |
|
(133,871) |
|
(27,327) |
Net increase in cash flow |
|
|
|
(119,123) |
|
74,915 |
|
131,429 |
Cash and cash equivalents at the beginning of the year |
|
|
|
536,160 |
|
468,092 |
|
336,197 |
Effects of exchange rate changes on inflation and cash and cash equivalents |
|
|
|
8,135 |
|
(6,847) |
|
466 |
Cash and cash equivalents at the end of the year |
|
|
|
425,172 |
|
536,160 |
|
468,092 |
The accompanying notes are an integral part of these consolidated financial statements.
DLocal Limited
Notes to the Consolidated Financial Statements
At December 31, 2024
(All amounts in thousands of U.S. Dollars except share data or as otherwise indicated)
1.1 General information
DLocal Limited (“dLocal” or the “Company”) was established on October 5, 2016 as a limited liability holding company in Malta (together with its subsidiaries as the “Group”.) On April 14, 2021, the Group was reorganized under dLocal and domiciled and incorporated in the Cayman Islands. The Company holds a controlling financial interest in the Group.
The Group processes payment transactions, enabling merchants generally located in developed economies (mainly United States, Europe and China) to receive payments (“pay-ins”) from customers in emerging markets and to facilitate payments (“pay-outs”) to customers in emerging markets. As of the date these Consolidated Financial Statements were issued, the Group continued to focus on its geographic expansion, increasing the total number of in-network countries.
The Group processes local payments in emerging markets through its network of acquirers and payments processors. Through its partnership with financial institutions, the Group expatriates/repatriates funds to/from developed economies where the merchant customers elect settlement in their preferred currency (mainly U.S. Dollar and Euro). These consolidated financial statements include dLocal’s subsidiaries and details of the structure are included under Note 4.
The Group is licensed and regulated in the EU as an Electronic Money Issuer, or EMI, and Payment Institution, or PI, and registered as a Money Service Business with the Financial Crimes Enforcement Network of the U.S. Department of the Treasury, or FinCEN, and operates and may be licensed, as applicable, in many countries in emerging markets, primarily in the Americas, Asia and Africa. In December 2024, the Group achieved a significant advancement by obtaining a license in the United Kingdom as an Authorized Payment Institution (API), further enhancing its global regulatory framework.
In addition, the Group is subject to laws aimed at preventing money laundering, corruption, and the financing of terrorism. This regulatory landscape is constantly evolving, as evidenced by the implementation of the Fifth Anti-Money Laundering Directive (Directive (EU) 2018/843, “MLD5”) and the proposed amendments to the Fourth Anti-Money Laundering Directive (MLD4).
These Consolidated Financial Statements as of December 31, 2024, were approved by dLocal’s Board of Directors on February 27, 2025.
2.1. Basis of preparation
These Consolidated Financial Statements have been prepared in accordance with IFRS Accounting Standards (“IFRS”) and interpretations issued by the IFRS Interpretations Committee (“IFRIC”) applicable to companies reporting under IFRS, and comply with IFRS as issued by the International Accounting Standards Board (“IASB”). The Consolidated Financial Statements are presented in thousands of U.S. Dollars, except for share data or as otherwise indicated, which is the functional currency of DLocal Limited.
The Consolidated Financial Statements have been prepared on a historical cost basis, except for certain financial assets measured at fair value as explained in Note 2.5: Financial instruments-initial recognition and measurement, and for Financial Statements of the Group’s operations in Argentina, which were adjusted to reflect the hyperinflationary nature of Argentina’s economic as detailed in Note 2.3: Foreign currencies.
The preparation of these Consolidated Financial Statements requires the use of certain critical accounting estimates. It also requires management to exercise its judgment in the process of applying dLocal’s accounting policies. Areas involving a higher degree of judgment or complexity, or where assumptions and estimates are significant to the Consolidated Financial Statements, are disclosed in Note 3: Accounting estimates and judgments.
2.2. Basis of consolidation
The consolidated financial statements comprise the consolidated financial position of the Group as of December 31, 2024 and 2023 and the consolidated statements of income and comprehensive income, consolidated statements of cash flows and consolidated statements of changes in equity for each of the years ended December 31, 2024, 2023 and 2022.
Subsidiaries
The Group consolidates all entities in which it holds a controlling financial interest. Control is achieved when the Group is exposed to, or has rights to, variable returns from its involvement with the entity and has the ability to affect those returns through its power to direct the activities of the entity. Inter-company transactions, balances, income and expenses on transactions between Group companies are eliminated.
Entities over which dLocal holds a controlling financial interest are referred to as subsidiaries. Subsidiaries are fully consolidated from the date dLocal obtains its controlling financial interest and are deconsolidated when dLocal loses control over the subsidiary. Subsidiaries included in the consolidated Group accounts are described in Note 4: Consolidation of subsidiaries.
Changes in the ownership interest of a subsidiary where the Group maintains control are accounted for within shareholders’ equity.
2.3. Foreign currencies
i) Functional and presentation currency
Items included in the Financial Statements of each of the Group’s entities are measured using the currency of the primary economic environment in which the entity operates (‘the functional currency’). The Consolidated Financial Statements are presented in U.S. Dollar, which is dLocal’s functional and presentation currency.
ii) Transactions and balances
Foreign currency transactions are translated into dLocal’s functional currency using the exchange rates at the dates of the transactions. Foreign exchange gains and losses resulting from the settlement of such transactions, and from the translation of monetary assets and liabilities denominated in foreign currencies at year end exchange rates, are generally recognized in profit or loss.
The Group has adopted a policy to present gains and losses stemming from foreign exchange transactions within various financial statement line items based on the nature of the item that generated the exchange difference. For example, gains or losses stemming from trade payables and pay-in and pay-out transactions are recognized within Cost of Services, whereas exchange differences arising from loans, including intra-group loans, are presented within Finance costs. This policy is applied consistently each reporting period.

Non-monetary items that are measured at fair value in a foreign currency are translated using the exchange rates at the date when the fair value was determined. Translation differences on assets and liabilities carried at fair value are reported as part of the fair value gain or loss. For example, translation differences on non-monetary assets and liabilities such as equities held at fair value through profit or loss are recognized in profit or loss as part of the fair value gain or loss, and translation differences on non-monetary assets such as equities classified as at fair value through other comprehensive income are recognized in other comprehensive income.
Foreign exchange gains and losses resulting from the measurement at period end exchange rates of monetary assets denominated in foreign currencies and measured at fair value through other comprehensive income are recognized in the Consolidated Statement of Comprehensive Income.
iii) Argentina operations
The Group operates in Argentina, which has been classified as a hyperinflationary economy in accordance with IAS 29, Financial Reporting in Hyperinflationary Economies. This determination is based on cumulative inflation exceeding 100% over the last three years and other qualitative factors.
As required by IAS 29, the financial statements of the Group’s operations in Argentina have been adjusted to reflect the effects of inflation. Non-monetary items in the Statement of Financial Position were restated using a general price index from their date of initial recognition to December 31, 2024. The price index for 2024 was 1.4 (3.1 and 1.9 for 2023 and 2022, respectively), as published by the Argentine Federation of Professional Councils of Economic Sciences (FACPCE) and the National Institute of Statistics.
Inflation adjustments were also applied to items in the Statement of Comprehensive Income, which were restated to reflect the current unit of measurement as of the reporting date. After these adjustments, the results of operations were translated into U.S. Dollars at the closing exchange rate for the reporting period.
This approach ensures compliance with IAS 29 and provides a more accurate reflection of the Group’s financial position and performance in Argentina under hyperinflationary conditions.
iv) Group companies
The results and financial position of foreign operations of non-hyperinflationary economies with a functional currency that differs from the presentation currency are translated into the presentation currency as follows:
• Assets and liabilities for each item presented on the statement of financial position are translated at the closing rate as of the end of the reporting period;
• Income and expenses are translated at average exchange rates; and
• All resulting exchange differences are recognized in other comprehensive income.
The results and financial position of foreign operations whose functional currency is the currency of a hyperinflationary economy are translated into the presentation currency as follows:
• All amounts (i.e., assets, liabilities, equity items, income and expenses) are translated at the closing rate at the date of the most recent statement of financial position.
On consolidation, exchange differences arising from the translation of foreign entities are recognized in other comprehensive income. When a foreign operation is sold or any borrowings forming part of the net investment are repaid, the associated exchange differences are reclassified to profit or loss as part of the gain or loss on sale.
2.4. Cash and cash equivalents
Cash and cash equivalents include cash on hand, deposits held at call with banks and other short-term, highly liquid financial instruments with original maturities of three months or less. dLocal classifies a financial instrument as a cash equivalent when the following conditions are met:
10
Cash equivalents are measured at amortized cost and/or fair value through profit or loss depending on its nature (refer to note 31), and are presented within current asserts due to their short-term mature.
2.5. Financial instruments - initial recognition and subsequent measurement
i) Financial assets
Initial recognition and measurement
Financial assets are initially recognized at fair value and subsequently held at amortized cost, fair value through other comprehensive income (“OCI”), or fair value through profit or loss (“FVPL”).
Upon initial recognition, financial assets are classified depending on the asset’s contractual cash flow characteristics and the Group’s business model for managing such cash flows. The Group initially measures a financial asset at its fair value, or if a financial asset will not be held at fair value through profit or loss, fair value plus directly attributable transaction costs. Except for trade receivables that do not contain a significant financing component, or financial assets where the Group has applied IFRS 15’s practical expedient, financial assets are generally recognized at fair value plus directly attributable transaction costs and are held at amortized cost . Trade receivables that do not contain a significant financing component or for which the Group has applied IFRS 15’s practical expedient are measured at the transaction price stemming from the customer contract as required by IFRS 15, Revenue from Contracts with Customers.
To be classified and measured at amortized cost or fair value through OCI, a financial asset must give rise to cash flows that are solely payments of principal and interest (“SPPI”) on the outstanding principal balance. This assessment is referred to as the SPPI test and is performed on an instrument-by-instrument basis. Financial assets with cash flows that are not SPPI are classified and measured at fair value through profit or loss, irrespective of the Group’s business model for managing such cash flows.
The Group’s business model determines whether financial assets are managed to collect the asset’s contractual cash flows, to be sold, or both. In cases where the Group intends to collect a financial asset’s contractual cash flows, the asset will be recognized and measured, initially and subsequently, at amortized cost. If a financial assets cash flows are held with the objective of collecting the contractual cash flows and/or selling the asset, then the financial asset is initially and subsequently recognized at fair value through OCI.
Financial assets as of December 31, 2024 and 2023 include cash and cash equivalents, other assets, trade and other receivables, derivative financial instruments and investments in quoted and unquoted debt securities.
Subsequent measurement
Financial assets are subsequently measured based on their classification, which include (i) amortized cost; (ii) fair value through OCI; and (iii) fair value through profit or loss. Cumulative gains and losses may be recycled for debt investments held at fair value through OCI, but not equity investments.
Financial assets at amortized cost
Financial assets held at amortized cost are subject to impairment testing and subsequently measured using the effective interest method.
The Group’s financial assets at amortized cost for 2024 and 2023 include cash and cash equivalents, other assets, and trade and other receivables which correspond to uncollateralized gross amounts due from acquirers, processors, merchants and preferred suppliers for services performed .
Financial assets at fair value through profit or loss
Financial assets held at fair value through profit or loss are initially and subsequently measured at fair value, with gains or losses recognized in profit or loss. This category of financial assets includes debt investments, such as treasury bonds held for trading, debt securities that do not qualify for measurement at amortized cost or fair value through other comprehensive income, and debt investments for which the Company has not elected to recognize remeasurement gains and losses through OCI.
The Group’s financial assets at fair value through profit or loss as of December 31, 2024 and 2023 include derivative financial instruments, investment in quoted debt securities and treasury bonds.
11
Financial assets at fair value through OCI
The Group did not hold any financial assets within this category as of December 31, 2024 or 2023.
Financial assets designated at fair value through OCI (debt instruments)
The Group did not hold any financial assets within this category as of December 31, 2024 or 2023.
Derecognition
A financial asset or, where applicable, a part of a financial asset or part of a group of similar financial assets, is derecognized when:
• The rights to receive the asset’s cash flows expire; or
• The Group transfers its rights to receive cash flows from the asset or assumes an obligation to pay all cash flows received to a third party under a “pass-through” arrangement; and
• The Group (a) transfers virtually all risks and benefits of the asset, or (b) neither transfers nor retains virtually all the risks and benefits of the asset, but transfers control over the asset.
When the Group transfers its rights to receive a financial asset’s cash flows but does not transfer or retain substantially all the risks and benefits, the financial asset is recognized to the extent of the Group’s continuing involvement. In such cases, the Group also recognizes an associated liability. In such cases, the transferred financial asset and associated liability is measured in a manner that reflects the Group’s retained rights and obligations. No financial assets and liabilities meeting these conditions were recognized as of December 31, 2024 or 2023.
Guarantees over transferred assets represent a form of continuing involvement. Such assets are measured at an amount equal to the lower of the original carrying amount of the financial asset and the maximum amount the Group could be required to pay under the terms of the guarantee.
ii) Impairment of financial assets
The Group recognizes an allowance for expected credit losses (“ECLs”) for all debt instruments not held at fair value through profit or loss.
ECLs are measured based on the difference between the cash flows the Group is contractually entitled to less cash flows that the Group expects to receive, discounted at the instrument’s original effective interest rate. The expected cash flows include cash flows resulting from the sale of collateral held or other credit enhancements integral to the instrument’s contractual terms.
The Group applies a simplified approach for trade and other receivables when calculating ECLs. Specifically, the Group recognizes a loss allowance equal to the lifetime ECLs based on the segmentation of trade receivables. The Group uses its historical loss experience, adjusted to reflect current, reasonable and bearable forecasts of future economic conditions, when measuring ECLs.
iii) Financial liabilities
Initial recognition and measurement
Financial liabilities are initially classified at fair value through profit or loss, amortized cost or as derivatives designated as hedging instruments in an effective hedging relationship.
Financial liabilities held at amortized cost are initially recognized net of transaction costs that are directly attributable to the issuance of the liability.
The Group’s financial liabilities as of December 31, 2024 and 2023 include trade and other payables, lease liabilities, derivative financial instruments, contingent consideration liability, borrowings and bank overdraft.
12
Subsequent measurement
The subsequent measurement of financial liabilities depends on their classification, as described below:
Financial liabilities at fair value through profit or loss
Financial liabilities held at fair value through profit or loss include financial liabilities that are held-for-trading or designated to be held at fair value through profit or loss when initially recognized. Financial liabilities are classified as held-for-trading if incurred solely in connection with a near term repurchase of a financial asset that has been sold, including derivative financial instruments that are not designated as hedging instruments in hedge relationships.
Gains and losses on held-for-trading liabilities are recognized in the statement of comprehensive income.
The Group’s financial liabilities at fair value through profit or loss as of December 31, 2024 and 2023 include derivative financial instruments.
Financial liabilities at amortized cost
Financial liabilities held at amortized cost include interest-bearing borrowings, trade and other payables incurred in exchange for purchased goods or services, and lease liabilities. Financial liabilities related to interest-bearing borrowings are recognized at an amount equal to the net issuance proceeds received less directly attributable issuance costs. Trade and other payables are generally unsecured and due within 30 days. As a result, their book value approximates fair value and such amounts are presented within current liabilities unless due 12 months after the applicable reporting date.
Any original issuance discount or premium is amortized through Finance Costs using the Effective Interest Rate (“EIR”) method. If, at settlement, the carrying amount of a financial liability exceeds its carrying amount, a settlement gain or loss equal to this difference is recognized through profit or loss.
Derecognition
A financial liability is derecognized when the obligation is discharged, cancelled or expires. When an existing financial liability is replaced by another financial liability from the same lender on substantially different terms, or if the terms of an existing liability are substantially modified, such an exchange or modification is treated as the derecognition of the original liability and the recognition of a new liability. The difference in the respective carrying amounts is recognized in the statement of comprehensive income.
iv) Derivative financial instruments
Derivative financial instruments are initially recognized at fair value on the date on which a derivative contract is entered and are subsequently remeasured at fair value. Derivatives are carried as financial assets when the fair value is positive and as financial liabilities when the fair value is negative.
The Group operates in several foreign currencies and is exposed to foreign currency risk. From time to time, the Group uses derivative financial instruments, such as delivery and non-deliverable forward currency contracts to hedge or reduce exposure to foreign currency risks. The Group has elected to separate the spot element from the forward element of certain derivative financial instruments and designated as the hedging instrument only the change in the fair value of the spot element. The change in the fair value of the spot element of such derivatives is presented in the Costs of services line item. The change in the fair value of the forward element of such derivatives is presented in the Finance costs line item. For information about derivative financial instruments see Note 24: Derivative financial instruments.
v) Fair value of financial instruments
The Group measures financial assets held at fair value through profit or loss at fair value as of each reporting date.
Fair value is the price that would be received to sell an asset or paid to transfer a liability in an orderly transaction between market participants at the measurement date. The fair value measurement is based on the presumption that the transaction to sell the asset or transfer the liability takes place either:
• In the principal market for the asset or liability; or • In the absence of a principal market, in the most advantageous market for the asset or liability.
13
The principal or the most advantageous market must be accessible by the Group.
The fair value of an asset or a liability is measured using the assumptions that market participants would use when pricing the asset or liability, assuming that market participants act in their economic best interest. The Group uses valuation techniques that are appropriate in the circumstances and for which sufficient data are available to measure fair value, maximizing the use of relevant observable inputs and minimizing the use of unobservable inputs.
All assets and liabilities for which fair value is measured or disclosed in the financial statements are categorized within the fair value hierarchy, described as follows, based on the lowest level input that is significant to the fair value measurement as a whole:
• Level 1 - quoted (unadjusted) prices in active markets for identical assets or liabilities;
• Level 2 - inputs other than quoted prices included in Level 1 that are observable for the asset or liability, either directly or indirectly.
• Level 3 - techniques using inputs that have a significant effect on the recorded fair value that are not based on observable market data.
The Group uses observable market data to the extent possible. For assets and liabilities that are recognized at fair value on a recurring basis, the Group determines whether transfers have occurred between levels in the fair value hierarchy by re-assessing categorization (based on the lowest level input that is significant to the fair value measurement as a whole) at the end of each reporting period.
vi) Financial instruments-offsetting
Financial assets and liabilities are presented net in the consolidated statement of financial position if, and only if, there is an existing and enforceable legal right to offset the amounts recognized and an intention to offset or to realize the asset and settle the liability simultaneously.
The Group presents trade payables to merchants net of trade receivables from fees and trade receivables from processing entities net of fees considering that there is an enforceable legal right to offset and the Group expects to cancel such obligations on a net basis. For further detail refer to Note 27: Offsetting financial assets and financial liabilities.
2.6. Current and deferred income tax
Current and deferred income tax are recognized in profit or loss except to the extent that it relates to items recognized directly in equity or in other comprehensive income.
Current income tax
Tax assets and liabilities for the current year are calculated based on the expected recoverable amount or the amount payable to the tax authorities on the taxable income or loss for the period, using tax rates enacted or substantively enacted at the reporting date in the countries where dLocal operates and generates taxable income.
Current income tax related to items recognized directly in equity are recognized in equity. dLocal periodically evaluates the tax positions involving interpretation of tax regulations and establishes provisions when appropriate.
The Group offsets current tax assets and current tax liabilities against the same tax authority when it has a legally enforceable right to set off current tax assets against current tax liabilities.
Deferred income tax
Deferred income tax is recognized in respect of temporary differences between the carrying amounts of assets and liabilities for financial reporting purposes and the amounts used for taxation purposes.
Deferred income tax assets and liabilities are recognized for all temporary taxable differences, except in the following situations:
14
Deferred income tax is measured at the tax rates that are expected to be applied to temporary differences when they reverse, using tax rates enacted or substantively enacted at the reporting date and tax loss carryforwards, to the extent that it is probable that taxable profit will be available against which they can be offset.
The carrying amount of deferred income tax assets is reviewed at each reporting date to assess whether it is probable that sufficient taxable profit will be available to allow all or part of the deferred tax assets to be utilized. Unrecognized deferred tax assets are reassessed, at each reporting date, and are recognized to the extent that it has become probable that future taxable profits will be available to allow their utilization.
2.7. Property, plant and equipment
Property, plant and equipment (“PP&E) are stated at historical cost, net of accumulated depreciation and impairment losses, if any, unless pertaining to the Group‘s Argentine operations which have been adjusted pursuant to IAS 29 as detailed in Note 2.3: Foreign currencies. Historical cost includes material expenditures that can be measured reliably and are directly attributable to the acquisition of the property, plant or equipment. Repairs, maintenance and all other expenditures are charged to profit or loss during the period in which they are incurred.
Subsequent costs are included in the asset’s carrying amount or recognized as a separate asset, as appropriate, when it is probable that future economic benefits associated with these costs will be realized by dLocal and such benefits can be reliably measured. All other repair and maintenance expense are charged to the statement of comprehensive income during the year in which they are incurred.
Residual values and useful lives are reviewed at the end of each reporting period and adjusted on a prospective basis, if appropriate. Depreciation is calculated on a straight-line basis over the estimated useful lives of the asset as follows:
Computer Equipment |
3 years |
Building Improvements |
10 years |
An item of property, plant and equipment is derecognized upon disposition or when future economic benefits are expected from its use or disposal.
Any gain or loss on disposal (calculated as the difference between the net disposal proceeds with the carrying amount of the asset) is recognized within “Other results” in the statement of comprehensive income when an asset is derecognized.
An asset’s carrying amount is immediately written down to its recoverable amount when the asset’s carrying amount is greater than its estimated recoverable amount. For further information see Note 2.9: Impairment of non-financial assets.
2.8. Intangible assets
Acquired intangible assets are initially recognized at cost and subsequently amortized on a straight-line basis over their useful economic lives, generally up to three years.
The Group’s business relies heavily on digital products and services used to facilitate commercial relationships between international merchants and their emerging market customers. dLocal is constantly developing future product releases, enhancements and upgrades to existing software, as well as maintenance-oriented updates. Internal costs incurred to develop software for which a future economic benefit is likely to arise are capitalized and amortized over their useful life.
Software maintenance costs are recognized as an expense as incurred. Development costs that are directly attributable to the design and testing of the Group’s identifiable and unique software products are recognized as an intangible asset. Costs that are directly attributable to internally developed software are capitalized and recognized as part of the intangible asset, which principally includes salaries and wages of Group software engineers and third-party professional service costs. The Group limits its capitalization of costs to the software or product’s development phase if it can demonstrate the following:
• The technological feasibility of completing the intangible asset so that it will be available for use or sale;
• The intention to complete the intangible asset and use or sell it; • The ability to use or sell the intangible asset;
15
• How the intangible asset will generate probable future economic benefits;
• The availability of adequate technical, financial and other resources to complete the development and to use or sell the intangible asset;
• The ability to measure reliably the expenditure attributable to the intangible asset during its development.
Development costs that do not meet these capitalization criteria are expensed as incurred.
Capitalized developed software intangible assets are amortized on a straight-line basis over the asset’s remaining useful life. Amortization cost is presented within “Cost of services” or “General and administrative” cost in the Statement of Comprehensive Income, depending on the nature of the capitalized cost. The remaining useful life of each asset is evaluated at the end of each reporting period or when facts and circumstances warrant an interim re-assessment. The Group believes the remaining useful lives are reasonable in light of the future usage of the assets.
2.9. Impairment of non-financial assets
A non-financial asset’s ability to generate future economic benefits is considered when assessing whether the asset is impaired. Specifically, the Group considers the future economic benefits from making its service attractive for new or existing merchants in addition to benefits arising from the reduction of costs through the elimination of unnecessary activities.
An assessment is made at each reporting date to determine whether there is an indication that an asset may be impaired, or to determine whether previously recognized impairment losses are recoverable. If any indication of an impairment exists, the Group estimates the asset’s recoverable amount. The recoverable amount is determined for an individual asset unless the asset does not generate cash inflows that are largely independent of cash flows generated from other assets or groups of assets.
In determining fair value less costs of disposal, recent market transactions are considered. If no such transactions can be identified, an appropriate valuation model is used. These calculations are corroborated by valuation multiples or other available fair value indicators.
In assessing value in use, the estimated future cash flows are discounted to their present value using a pre-tax discount rate that reflects current market assessments of the time value of money and the risks specific to the asset.
2.10. Provisions
Provisions are recognized when the Group has a present legal or constructive obligation resulting from past events, it is probable that an outflow of resources will be required to settle the obligation, and the amount can be reliably estimated. Provisions are not recognized for future operating losses.
Where there are a number of similar obligations, the likelihood that an outflow will be required in settlement is determined by considering the class of obligations as a whole. A provision is recognized even if the likelihood of an outflow with respect to any one item included in the same class of obligations may be small.
Provisions for contingencies related to lawsuits or other legal claims are recognized when it is probable an outflow of funds will be necessary to settle the contingency/obligation, and the outflow is reasonably estimable.
The likelihood of loss includes an evaluation of available evidence, the hierarchy of laws, available case law, recent court decisions and their importance in the legal system, as well as the opinion of outside legal counsel. Provisions are reviewed and adjusted to reflect changes in circumstances as necessary.
Provisions are measured at the present value of management’s best estimate of the outflow necessary to settle the present obligation at the end of each reporting period. The present value of the obligation is derived using a pre-tax rate discount rate that reflects current market information and risks specific to the applicable obligation. Increases in provisions resulting from the passage of time are recognized through “Finance cost”. Provisions are disclosed in the statement of financial position based on their nature.
2.11. Share-based payments and warrants contracts
2.11.1. Share-based payments
Certain key employees have been awarded share-based compensation (“Participants”) pursuant to the the "DLocal Limited amended and restated 2020 Global Share Incentive Plan" discussed in Note 1.2, which consists of the “Share Option Award Agreements”, “Restricted Stock Unit Agreements” and “Performance Share Unit Agreements” (together referred to as the “Agreements”.
16
For all plans, management commits to grant shares of dLocal to the defined participants.
Under these Agreements, certain employees and members of dLocal’s executive management team were granted share options, restricted stock units (“RSU”) or ordinary shares that are subject to service-based vesting conditions. PSUs vest in a manner similar to the service conditions of the RSUs, however, vesting is also contingent upon achievement of performance targets (non-market performance conditions) as determined by the Board. The holders of the Options, RSUs or PSUs shall have no right to vote or right to receive dividends or any other rights as a shareholder of the Company in respect of any Shares purchasable upon the exercise of any part of an Option, RSU or PSU nor shall they be deemed to be a class of shareholders or creditors of the Company, until the Participant exercises the Option.
The Group is under no obligation to cash-settle any of the equity awards issued. The awards have been classified within shareholders’ equity.
The cost of share-based compensation is measured using the fair value at the grant date. The cost is expensed together with a corresponding increase in equity over the service period or on the grant date when the grant relates to past services.
The total amount to be expensed is determined by reference to the fair value of the tranche shares granted at the grant date, which is also based on:
The total expense is recognized over the vesting period, which is the period over which all of the specified vesting conditions are to be satisfied. At the end of each period, the entity revises its estimates of the number of shares that are expected to vest based on the non-market vesting conditions. The Company recognizes the impact of the revision to original estimates, if any, in profit or loss, with a corresponding adjustment to equity.
When the shares are vested, the Group transfers the corresponding number of shares to the participant. The shares received by the participants, net of any directly attributable transaction costs (including withholding taxes) are credited directly to equity.
The significant judgments, estimates and assumptions regarding share-based payments and activity relating to share-based payments are discussed further in Note 3.2.
2.11.2. Warrants contracts
In 2019, the Group issued a warrant (the “Warrant”) that provided a merchant (the “Merchant”) with the right to acquire up to 17,345,000 ordinary shares while simultaneously executing an agreement to provide services to the Group. The Warrant is exercisable through January 24, 2026 at a purchase price per share equal to (1) U.S. Dollars 0.57 or (2) upon any reorganization (including any change of control) of the Group, the lesser of (i) U.S. Dollars 0.57 and (ii) sixty percent ( 60 %) of the price per share paid in or implied by such transaction.
At the Group’s option, the Warrant may be settled in cash or net settled with Ordinary Class A Shares. If the Group elects to share settle the contract, it must deliver Ordinary Class A shares determined by dividing (i) the product of the number of Ordinary Class A shares underlying the Warrant multiplied by the intrinsic value of the Warrant at the time of exercise, by (ii) the fair value per Ordinary Class A share at the time of exercise.
If exercised, the Merchant’s beneficial ownership will be limited to 4.999 % of the Group’s outstanding ordinary shares unless the Merchant waives this limit upon providing 61 days’ notice.
The Group determined the Warrant is (i) a payment to a customer related to a revenue contract that is within the scope of IFRS 15, and (ii) an equity-settled share-based payment that falls within the scope of IFRS 2. Accordingly, the fair value of the Warrant was accounted for as a reduction in revenue upon commencement of the service agreement.
17
On November 15, 2023, the warrant holder exercised its net issuance right, resulting in the net issuance of 6,334,134 shares at a Fair Market Value of $18.098 per share. The Fair Market Value was calculated based on the average price over the five business days preceding the exercise date.
As of December 31, 2024, a total of 8,672,500 warrants remained outstanding, all with an average exercise price of $0.57 per share. These warrants are fully vested and exercisable. No warrants expired during the reporting period.
All outstanding warrants will expire on January 1, 2026.
2.12. Leases and right of use assets
IFRS 16, Leases, applies to all leases with the exception of licenses of intellectual property rights held by licensing agreements within the scope of IAS 38, Intangible Assets and service concession arrangements.
When the Group is the lessee, it is required to recognize both:
▪ A lease liability, measured at the present value of remaining cash flows on the lease; and
▪ A right-of-use (“ROU”) asset, measured at the amount of the initial measurement of the lease liability, plus any lease payments made prior to commencement date, initial direct costs, and estimated costs of restoring the underlying asset to the condition required by the lease, less any lease incentives received.
The lease agreement can be extended for 1-month terms following the expiration of the base lease term unless the Company elects to terminate the agreement.
The net present value of lease liabilities generally include the following:
• fixed payments (including in-substance fixed payments), less any lease incentives receivable;
• variable lease payment based on an index or a rate, initially measured using the index or rate as of the commencement date;
• amounts expected to be payable by the Group under residual value guarantees;
• amounts required to be paid upon exercise price of a purchase option if the Group is reasonably certain to exercise that option; and
• penalties resulting from the termination of a lease if the lease term assumes the Group will exercise its termination option.
If renewals are reasonably certain of being exercised, payments required under such renewal terms are included in the measurement of the lease liability.
The lease liability will subsequently increase for the accrual of interest, resulting in a constant rate of return throughout the life of the lease, and reduce when payments are made. The ROU asset will amortize to the income statement over the life of the lease.
The lease liability is remeasured when there is a change in one of the following:
▪ Future lease payments arising from a change in an index or rate;
▪ The Group’s estimate of the amount expected to be payable under a residual value guarantee; or
▪ The Group’s assessment of whether it will exercise a purchase, extension or termination option.
When the lease liability is remeasured, a corresponding adjustment is made to the carrying amount of the ROU asset or is recorded in the Statement of Comprehensive Income if the carrying amount of the ROU asset has been reduced to nil. On the balance sheet, the ROU assets are included within property, plant and equipment and the lease liabilities are in separated lines.
Short-term Leases
The Group applies the recognition exemption in IFRS 16 for leases with a term not exceeding 12 months. For these leases, the lease payments are recognized as an expense on a straight line basis over the lease term unless another systematic basis is more appropriate.
The Group has executed lease contracts of one year or less in the following countries: Malta, Israel, Brazil, China, Chile, Colombia, India, Singapore, and Argentina. In those locations, the Group utilizes co-working facilities that are subject to short-term contractual arrangements. Several suitable alternatives exist in each location. This provides maximum flexibility to increase, reduce or terminate these arrangements based on changes in the Group’s operating plans while minimizing relocation and buildout costs. These locations do not require company-specific infrastructure, and the cost of returning the leased asset is insignificant.
18
Upon expiration of each contract, the Group reassesses whether to extend or terminate the agreement based on the level of local activity, market trends and strategic plans for each location.
Lease payments are discounted using the interest rate implicit in the lease. If that rate cannot be readily determined, which is generally the case for the Group leases, the incremental borrowing rate is used. The incremental borrowing rate represents the cost to borrow the funds necessary to acquire an asset of similar value in a similar economic environment with similar terms, security and conditions.
To determine the incremental borrowing rate, the Group:
• uses recent third-party financing received by the individual lessee where possible, adjusted to reflect changes in financing conditions since the applicable third party financing was received; or
• derives the incremental borrowing rate using the risk-free interest rate, adjusted for credit risk for leases held by the Group, which does not have recent third-party financing, and makes adjustments specific to the lease.
The Group does not have any restrictions or covenants imposed by the lessor on its property leases which restrict its businesses
2.13. Equity
Common shares are presented within shareholders’ equity. Incremental costs directly attributable to the issuance of new ordinary shares or options to acquire common shares are recognized as a reduction of shareholders’ equity, net of tax, from issuance proceeds.
The calculation of basic and diluted earnings per share is based on the profit attributable to equity holders of the Group parent and the basic and weighted average number of shares excluding treasury shares held. When calculating the diluted earnings per share, the weighted average number of shares in issue is adjusted for the effects of all expected dilutive potential ordinary shares held in respect of the Group.
The Group presents common shares it has repurchased as its own shares, which are initial recognized as the cost to repurchase such shares and presented as a reduction from shareholders’ equity.
2.14. Treasury shares
The Group has adopted a voluntary change in the accounting policy regarding the classification of treasury shares to better reflect the Group’s equity structure. Previously, treasury shares were recognized under the share premium in the equity. As part of the new policy, and in connection with the repurchase of shares mentioned in Note 13.c, the Group has decided to classify treasury shares separately in the equity position.
Treasury shares are recorded at cost, which includes the purchase price and any directly attributable costs of acquisition. The cost of treasury shares is presented as a deduction from equity, specifically within the “Treasury Shares” reserve. No gain or loss is recognized in the income statement on the purchase, sale, issue, or cancellation of the company’s own equity instrument.
2.15. Revenue
dLocal provides payment processing services to merchants as follows:
19
dLocal earns revenues from fees charged to merchants in connection with payment processing services for cross-border and local payment transactions in emerging markets. These fees are primarily generated on a per approved transaction basis as either a fixed fee per transaction or fixed percentage per transaction.
dLocal also earns foreign exchange fees on cross-border transactions defined as transactions in which the merchant and its customer are in different countries and dLocal converts currencies and transfers funds between countries, as required by the merchant. Foreign exchange fees are usually determined based on a percentage or a fixed fee.
dLocal’s service offering comprises a single performance obligation to complete payments via its platform for merchants and their customers. It should be highlighted that dLocal does not engage nor provide services to its merchants end-users.
Revenues from contracts with customers are recognized as control of services is transferred to the customer at an amount that reflects the consideration to which the Group expects to be entitled in exchange for those services in the ordinary course of Group’s activities.
The Group applies the following five steps:
dLocal performs two types of transactions:
dLocal’s contracts with merchants are usually open-ended and can be terminated by either party without a termination penalty after the notice period has lapsed. dLocal’s contracts are, therefore, defined at the transaction level and do not extend beyond the service already provided.
Revenue from contracts with merchants comprises:
Transaction revenues
The Group recognizes fees charged to merchants as transaction revenue and fees incurred in processing payments as cost of services. Fees earned from merchants are presented as gross revenue due to the following considerations which indicate the Group controls the payment processing services and acts as the Principal:
20
Transaction revenues are recognized as revenue at a point in time when an authorized payment transaction is processed.
Transaction revenues are those that are directly related to the volume of payments processes in dollars or in quantity of transactions.
Transaction revenues are comprised by:
Other revenues
Other revenues are comprised of initial setup fees, minimum monthly fees, maintenance fees and transfer fees the Group is entitled to from its merchant customers. Other revenues are recognized at a point in time when the performance obligation is satisfied.
2.16. New standards and interpretations
The Group has not early adopted any standard, interpretation or amendment that has been issued but is not yet effective. A number of new or amended standards became applicable for the current reporting period. The Group did not change its accounting policies or make retrospective adjustments as a result of new accounting standards made applicable on January 1, 2024.
New accounting pronouncements
Certain new accounting standards and amendments to accounting standards have been published that are not yet effective for December 31, 2024, reporting periods and have not been early adopted by the Group. The group assessment of the impact of these new standards and amendments is evidenced below:
In August 2023, the IASB amended IAS 21 to help entities to determine whether a currency is exchangeable into another currency, and which spot exchange rate to use when it is not. Although the Group operates in certain countries for which lack of exchangeability would be observed, it does not expect this amendment to have a material impact on its operations or financial statements.
On 30 May 2024, the IASB issued targeted amendments to IFRS 9 and IFRS 7 to respond to recent questions arising in practice, and to include new requirements not only for financial institutions but also for corporate entities. These amendments:
21
The Group does not expect these amendments to have a material impact on its operations or financial statements.
IFRS 18 will replace IAS 1 Presentation of financial statements, introducing new requirements that will help to achieve comparability of the financial performance of similar entities and provide more relevant information and transparency to users. Even though IFRS 18 will not impact the recognition or measurement of items in the financial statements, its impacts on presentation and disclosure are expected to be pervasive, particularly those related to the statement of financial performance and providing management-defined performance measures within the financial statements.
Management is currently assessing the detailed implications of applying the new standard on the group’s consolidated financial statements. From the high-level preliminary assessment performed, the following potential impacts have been identified:
22
The group will apply the new standard from its mandatory effective date of 1 January 2027. Retrospective application is required, and so the comparative information for the financial year ending 31 December 2026 will be restated in accordance with IFRS 18.
Issued in May 2024, IFRS 19 allows for certain eligible subsidiaries of parent entities that report under IFRS Accounting Standards to apply reduced disclosure requirements. The Group does not expect this standard to have an impact on its operations or financial statements.
23
The preparation of financial statements requires the use of accounting estimates which, by definition, will seldom equal the actual results. Management also needs to exercise judgment in applying the group’s accounting policies.
This note provides an overview of the areas that involve a higher degree of judgment or complexity, and of items which are more likely to be materially adjusted due to estimates and assumptions turning out to be wrong. Detailed information about each of these estimates and judgments is included in other notes together with information about the basis of calculation for each affected line item in the financial statements.
3.1. Provisions
Where applicable, the Group recognizes a provision for contingent claims related to civil matters and potential labor matters. Such provisions include an assessment of the probability that a past event has given rise to a present obligation, as well as an analysis of labor lawsuits and claims, including available evidence and jurisprudence, the hierarchy of laws and recent court decisions. The Group applies its professional judgment while considering the opinion of its legal advisors.
Provisions are reviewed and adjusted to consider changes in circumstances such as the applicable limitation period, inspection findings and additional exposures identified based on new issues or court decisions.
3.2. Share-based payment transactions
Estimating fair value for share-based payment transactions requires determination of the most appropriate valuation model, which depends on the terms and conditions of the grant. The estimate also requires determination of the most appropriate inputs to the valuation model, including the expected life of share option or appreciation right.
Making estimates requires management to exercise significant judgment. It is at least reasonably possible that the estimate of the effect of certain conditions could change in the near term due to one or more future confirming events. Situations or sets of circumstances existing at the date of these consolidated financial statements, which management considered in formulating its estimates, may be subject to revisions based on new information or evolving conditions. For more information, see Note 29.
4. Consolidation of subsidiaries
dLocal Limited is the Group parent and acts as a holding company for all subsidiaries. dLocal main activity is the processing of cross-border and local payments, enabling international merchants to access end customers in emerging markets. Its principal sources of revenue include dividends from subsidiaries and profit-sharing payments from subsidiary partnerships.
The Consolidated Financial Statements of the Group include the following subsidiaries, each of which serves different vertical and/or provides a specific service according to the needs of the Group:
|
|
|
|
|
|
Ownership interest held by the group |
|
Ownership interest held by non-controlling interests |
||
Entity name |
|
Country of incorporation |
|
Principal activities |
|
2024 |
2023 |
|
2024 |
2023 |
Dlocal Group Limited |
|
Malta |
|
Holding Company |
|
100% |
100% |
|
— |
— |
Dlocal Limited |
|
Malta |
|
Payments provider |
|
99.999% |
99.999% |
|
0.001% |
0.001% |
Dlocal Markets Limited |
|
Malta |
|
Holding Company |
|
100% |
100% |
|
— |
— |
Dlocal Hold Ops Limited |
|
Cayman Islands |
|
Holding Company |
|
100% |
100% |
|
— |
— |
Dlocal LLP (1) |
|
United Kingdom |
|
Payments provider |
|
100% |
99.999% |
|
— |
0.001% |
Dlocal Corp LLP (1) |
|
United Kingdom |
|
Payments provider |
|
100% |
99.999% |
|
— |
0.001% |
Dlocal OpCo UK LTD |
|
United Kingdom |
|
Payments & Service provider |
|
100% |
100% |
|
— |
— |
Dlocal Technologies S.A. |
|
Uruguay |
|
Service provider |
|
100% |
100% |
|
— |
— |
Dlocal Uruguay S.A. |
|
Uruguay |
|
Collection entity |
|
100% |
100% |
|
— |
— |
Dlocal PTE Limited |
|
Singapore |
|
Holding Company & Service provider |
|
100% |
100% |
|
— |
— |
Dlocal Argentina S.A. |
|
Argentina |
|
Collection entity & Service provider |
|
100% |
100% |
|
— |
— |
Demerge Arg. S.A. |
|
Argentina |
|
Service provider |
|
100% |
100% |
|
— |
— |
Dlocal Services Arg S.A. |
|
Argentina |
|
Collection entity |
|
100% |
100% |
|
— |
— |
Demerge Services Arg S.A. |
|
Argentina |
|
Collection entity |
|
100% |
100% |
|
— |
— |
DLocal Bangladesh Limited |
|
Bangladesh |
|
Collection entity |
|
100% |
100% |
|
— |
— |
Demerge Bolivia S.R.L. |
|
Bolivia |
|
Collection entity |
|
100% |
100% |
|
— |
— |
Dlocal Brasil Holding Financeira |
|
Brazil |
|
Holding Company |
|
100% |
100% |
|
— |
— |
Dlocal Brasil Instituição de Pagamento S.A. |
|
Brazil |
|
Collection entity |
|
100% |
100% |
|
— |
— |
Demerge Brasil Facilitadora de Pagamentos Ltda. |
|
Brazil |
|
Collection entity |
|
100% |
100% |
|
— |
— |
Webpay Brasil Pagamentos Ltda. |
|
Brazil |
|
Collection entity |
|
100% |
100% |
|
— |
— |
Demerge Cameroun SARL |
|
Cameroon |
|
Collection entity |
|
100% |
100% |
|
— |
— |
Dlocal Chile SPA |
|
Chile |
|
Collection entity |
|
100% |
100% |
|
— |
— |
Demerge Chile SPA |
|
Chile |
|
Collection entity |
|
100% |
100% |
|
— |
— |
Pagos y Servicios Limitada (1) |
|
Chile |
|
Collection entity |
|
100% |
99% |
|
— |
1% |
FCA Chile 2 Spa |
|
Chile |
|
Collection entity |
|
100% |
100% |
|
— |
— |
Dlocal Colombia S.A.S. |
|
Colombia |
|
Collection entity & Service provider |
|
100% |
100% |
|
— |
— |
Demerge Colombia S.A.S. |
|
Colombia |
|
Collection entity |
|
100% |
100% |
|
— |
— |
Kupa Colombia S.A.S. |
|
Colombia |
|
Collection entity |
|
100% |
100% |
|
— |
— |
Dlocal Costa Rica SRL |
|
Costa Rica |
|
Collection entity |
|
100% |
100% |
|
— |
— |
Demerege Ecuador S.A. |
|
Ecuador |
|
Collection entity |
|
100% |
100% |
|
— |
— |
Dlocal Egypt LLC |
|
Egypt |
|
Collection entity |
|
100% |
100% |
|
— |
— |
Dlocal El Salvador S.A de C.V. |
|
El Salvador |
|
Collection entity |
|
100% |
100% |
|
— |
— |
dLocal Ghana Limited Company |
|
Ghana |
|
Collection entity |
|
70% |
70% |
|
30% |
30% |
Demerge Guatemala S.A. |
|
Guatemala |
|
Collection entity |
|
100% |
100% |
|
— |
— |
Dlocal Honduras S.A. |
|
Honduras |
|
Collection entity |
|
100% |
100% |
|
— |
— |
Depansum Solutions Private Limited |
|
India |
|
Collection entity |
|
100% |
100% |
|
— |
— |
Dlocal India Pvt Limited |
|
India |
|
Collection entity |
|
100% |
100% |
|
— |
— |
Guisol Solutions Private Limited |
|
India |
|
Collection entity |
|
100% |
100% |
|
— |
— |
PT Dlocal Solutions Indonesia |
|
Indonesia |
|
Collection entity |
|
100% |
100% |
|
— |
— |
Dlocal Israel Limited |
|
Israel |
|
Service provider |
|
100% |
100% |
|
— |
— |
Dlocal SARL |
|
Ivory Coast |
|
Collection entity |
|
100% |
100% |
|
— |
— |
Demerge Japan Ltd |
|
Japan |
|
Collection entity |
|
100% |
100% |
|
— |
— |
Dlocal Payments Kenya Limited |
|
Kenya |
|
Collection entity |
|
100% |
100% |
|
— |
— |
Depansum Malaysia SDN. BHD. |
|
Malaysia |
|
Collection entity |
|
100% |
100% |
|
— |
— |
Demerge Mexico S.A. de C.V. (1) |
|
Mexico |
|
Collection entity |
|
100% |
99.9% |
|
— |
0.1% |
Dlocal Mexico S.A. de C.V. (1) |
|
Mexico |
|
Collection entity |
|
100% |
99.9% |
|
— |
0.1% |
Dlocal Technologies Mexico S.A. de C.V. |
|
Mexico |
|
Collection entity |
|
100% |
100% |
|
— |
— |
DLocal Morocco SARL AU |
|
Morocco |
|
Collection entity |
|
98.5% |
98.5% |
|
1.5% |
1.5% |
Demerge Nigeria Limited |
|
Nigeria |
|
Collection entity & Service provider |
|
100% |
100% |
|
— |
— |
Dlocal Panama S.A. |
|
Panama |
|
Collection entity |
|
100% |
100% |
|
— |
— |
Dlocal Paraguay S.A. |
|
Paraguay |
|
Collection entity |
|
100% |
100% |
|
— |
— |
Demerge Peru S.A.C. |
|
Peru |
|
Collection entity |
|
100% |
100% |
|
— |
— |
Depansum Perú S.A.C. |
|
Peru |
|
Collection entity |
|
100% |
100% |
|
— |
— |
Dlocal Payments Philippines Incorporated |
|
Philippines |
|
Collection entity |
|
100% |
100% |
|
— |
— |
Demerge República Dominicana SAS (1) |
|
Dominican Republic |
|
Collection entity |
|
100% |
99.99% |
|
— |
0.01% |
Dlocal Rwanda Ltd. |
|
Rwanda |
|
Collection entity |
|
100% |
100% |
|
— |
— |
Depansum PTY Limited |
|
South Africa |
|
Collection entity |
|
100% |
100% |
|
— |
— |
DLP South Africa PTY Ltd. |
|
South Africa |
|
Collection entity |
|
100% |
100% |
|
— |
— |
Dlocal Tanzania LTD |
|
Tanzania |
|
Collection entity |
|
100% |
100% |
|
— |
— |
Demerge (Thailand) Co. LTD (3) |
|
Thailand |
|
Collection entity |
|
49% |
49% |
|
51% |
51% |
Dlocal Uganda LTD |
|
Uganda |
|
Collection entity |
|
100% |
100% |
|
— |
— |
Dlocal Payment Services L.L.C. |
|
United Arab Emirates |
|
Collection entity |
|
100% |
100% |
|
— |
— |
Dlocal US LLC |
|
United States of America |
|
Service provider |
|
100% |
100% |
|
— |
— |
Dlocal Holding Uruguay S.A. |
|
Uruguay |
|
Holding Company |
|
100% |
100% |
|
— |
— |
Demerge Uruguay S.A. |
|
Uruguay |
|
Service provider |
|
100% |
100% |
|
— |
— |
Dlocal Services Uruguay S.A. |
|
Uruguay |
|
Collection entity |
|
100% |
100% |
|
— |
— |
Dlocal Vietnam Company Limited |
|
Vietnam |
|
Collection entity |
|
100% |
100% |
|
— |
— |
Depansum Arg S.A. |
|
Argentina |
|
Collection entity |
|
100% |
100% |
|
— |
— |
Demerge España SL |
|
Spain |
|
Service provider |
|
100% |
100% |
|
— |
— |
26
Demerge Senegal SAURL |
|
Senegal |
|
Collection entity |
|
100% |
100% |
|
— |
— |
PT Dlocal Services Gateway |
|
Indonesia |
|
Collection entity |
|
100% |
100% |
|
— |
— |
PT Dlocal Payment Solutions |
|
Indonesia |
|
Collection entity |
|
85% |
85% |
|
15% |
15% |
Depansum Limited |
|
Kenya |
|
Collection entity |
|
99% |
99% |
|
1% |
1% |
Dlocal Developments Arg S.A. |
|
Argentina |
|
Finance entity |
|
100% |
100% |
|
— |
— |
Dlocal Payments Private Limited |
|
India |
|
Collection entity |
|
100% |
100% |
|
— |
— |
Zubisokan Nigeria Limited |
|
Nigeria |
|
Collection entity |
|
100% |
100% |
|
— |
— |
Kupa IMTO Nigeria Limited |
|
Nigeria |
|
Collection entity |
|
100% |
100% |
|
— |
— |
Dlocal Arabia Financial Technology Company |
|
Saudi Arabia |
|
Collection entity |
|
100% |
100% |
|
— |
— |
Dlocal Opco Ireland Ltd |
|
Ireland |
|
Payments provider |
|
100% |
100% |
|
— |
— |
Dlocal Solutions Private Limited |
|
India |
|
Collection entity |
|
100% |
100% |
|
— |
— |
Dlocal Nicaragua S.A. (2) |
|
Nicaragua |
|
Collection entity |
|
100% |
— |
|
— |
— |
Dlocal Malaysia Sdn. Bhd. (2) |
|
Malaysia |
|
Collection entity |
|
100% |
— |
|
— |
— |
CRI Demerge Costa Rica SRL (2) |
|
Costa Rica |
|
Collection entity |
|
100% |
— |
|
— |
— |
Demerge Singapore PTE Ltd (2) |
|
Singapore |
|
Collection entity |
|
100% |
— |
|
— |
— |
Olmerix S.A. (2) |
|
Uruguay |
|
Finance entity |
|
100% |
— |
|
— |
— |
Shanghai Demerge Consulting Co. Ltd (2) |
|
China |
|
Service provider |
|
100% |
— |
|
— |
— |
Dlocal Pakistan (Private) Limited (2) |
|
Pakistan |
|
Collection entity |
|
100% |
— |
|
— |
— |
Dlocal Solutions Inc (2) |
|
Philippines |
|
Collection entity |
|
99.99999% |
— |
|
0.00001% |
— |
dLocal (DIFC) Limited (2) |
|
United Arab Emirates |
|
Collection entity |
|
100% |
— |
|
— |
— |
|
|
|
|
|
|
|
|
|
|
|
(1) The Group has assessed and concluded that the changes in non-controlling interest for certain subsidiaries during 2024 do not constitute a business combination according to IFRS 3.
(2) New subsidiaries incorporated or acquired during 2024, under which the Group controls, according to IFRS 10. The Group has determined that the acquisition or incorporation of these subsidiaries during 2024 do not constitute a business combination according to IFRS 3.
(3) Although dLocal is the owner of 49% of Demerge (Thailand) Co. LTD, the Group controls its operations and has de facto control according to the guidelines in IFRS 10.
27
The Group operates as a single operating segment, “payment processing”. Operating segments are defined as components of an enterprise for which separate financial information is regularly evaluated by the chief operating decision maker (“CODM”) who is the Group’s Executive Team represented by executive officers and directors holders of ordinary shares of the immediate parent of the Company. The Group has determined that its Executive Team is the chief operating decision maker as they determine the allocation of resources and assess performance.
The Executive Team evaluates the Group’s financial information and resources, and assesses the financial performance of these resources based on consolidated Revenue, Adjusted EBITDA and Adjusted EBITDA margin as further described below.
Adjusted EBITDA and Adjusted EBITDA Margin
The Executive Team assesses the financial performance of the Group’s sole segment by Revenues, Adjusted EBITDA and Adjusted EBITDA Margin. Adjusted EBITDA is defined as the consolidated profit from operations before financing and taxation for the applicable reporting period before depreciation of PP&E, amortization of right-of-use assets and intangible assets. It also excludes adjustments applied to subsidiaries operating hyperinflationary environments, other operating losses, impairment gain/loss on financial assets, other non-recurring costs and share-based payment non-cash charges. The Group defines Adjusted EBITDA Margin as the Adjusted EBITDA divided by Revenue.
The Group reconciles its Adjusted EBITDA and Adjusted EBITDA Margin to profit for the year as presented in the Consolidated Statement of Comprehensive Income as follows:
|
|
Note |
December 31, 2024 |
|
|
December 31, 2023 |
|
|
December 31, 2022 |
|
|||
Profit for the year (i) |
|
|
|
120,469 |
|
|
|
149,086 |
|
|
|
108,697 |
|
Income tax expense |
|
12 |
|
30,550 |
|
|
|
29,428 |
|
|
|
11,586 |
|
Inflation adjustment |
|
11 |
|
6,655 |
|
|
|
12,537 |
|
|
|
1,037 |
|
Finance income |
|
11 |
|
(66,875 |
) |
|
|
(128,228 |
) |
|
|
(18,078 |
) |
Finance costs |
|
11 |
|
49,701 |
|
|
|
116,834 |
|
|
|
24,668 |
|
Other operating loss |
|
|
|
5,257 |
|
|
|
— |
|
|
|
697 |
|
Impairment (gain) / loss on financial assets (ii) |
|
16, 17 |
|
440 |
|
|
|
(3,136 |
) |
|
|
5,534 |
|
Depreciation and amortization |
|
10 |
|
17,177 |
|
|
|
12,225 |
|
|
|
8,147 |
|
Secondary offering expenses (iii) |
|
|
|
— |
|
|
|
— |
|
|
|
89 |
|
Other non-recurring costs (iv) |
|
|
|
1,571 |
|
|
|
1,663 |
|
|
|
2,014 |
|
Share-based payment non-cash charges, net of forfeitures |
|
13 |
|
23,780 |
|
|
|
11,922 |
|
|
|
8,684 |
|
Adjusted EBITDA |
|
|
|
188,725 |
|
|
|
202,331 |
|
|
|
153,075 |
|
|
|
|
|
|
|
|
|
|
|
|
|||
Revenues |
|
6 |
|
745,974 |
|
|
|
650,351 |
|
|
|
418,925 |
|
Adjusted EBITDA |
|
|
|
188,725 |
|
|
|
202,331 |
|
|
|
153,075 |
|
Adjusted EBITDA Margin |
|
|
|
25.3 |
% |
|
|
31.1 |
% |
|
|
36.5 |
% |
Profit Margin |
|
|
|
16.1 |
% |
|
|
22.9 |
% |
|
|
25.9 |
% |
The Group’s revenue, results and assets for this one reportable segment can be determined by reference to the consolidated statement of income and of comprehensive income and consolidated balance sheet. Disaggregated information is only reviewed at the revenue level with no corresponding detail at any margin or profitability levels.
As required by IFRS 8: Operating Segments, below are presented applicable entity-wide disclosures related to dLocal’s revenues.
Disaggregated Revenue by region
The Group derives its revenues from delivering services to international merchants (mainly in the United States, Europe, and China), enabling them to receive payments and facilitate payments in emerging markets. The Group has operations in more than 40 countries, where its merchant customers operate.
The following table presents the Group’s revenue by region based on the country in which the end users of our merchant customers executed their payments. This presentation does not imply that revenue is generated, sourced, or subject to taxation in the respective country. Revenue recognition is based on IFRS principles and reflects the contractual relationships between the Group, its merchants, and its operating companies. For financial reporting purposes, regions are disclosed separately only if payments from/to merchant customers in a given region represented at least 10% of Total Revenues during the preceding four quarters.
|
|
2024 |
|
|
2023 |
|
|
2022 |
|
|||
LatAm |
|
|
562,183 |
|
|
|
492,681 |
|
|
|
345,360 |
|
Brazil |
|
|
151,959 |
|
|
|
158,997 |
|
|
|
84,025 |
|
Argentina |
|
|
85,454 |
|
|
|
75,128 |
|
|
|
77,577 |
|
Mexico |
|
|
149,249 |
|
|
|
116,835 |
|
|
|
68,000 |
|
Chile |
|
|
51,166 |
|
|
|
55,666 |
|
|
|
52,464 |
|
Other countries |
|
|
124,355 |
|
|
|
86,055 |
|
|
|
63,294 |
|
Non-LatAm |
|
|
183,791 |
|
|
|
157,670 |
|
|
|
73,565 |
|
Nigeria |
|
|
13,310 |
|
|
|
83,969 |
|
|
|
33,805 |
|
Egypt |
|
|
93,951 |
|
|
|
36,662 |
|
|
|
6,979 |
|
Other countries |
|
|
76,530 |
|
|
|
37,039 |
|
|
|
32,781 |
|
Total |
|
|
745,974 |
|
|
|
650,351 |
|
|
|
418,925 |
|
During the years ended December 31, 2024, 2023 and 2022, the Group had no revenues from customers domiciled in the Cayman Islands. The Group’s revenues are derived from payment processing services provided to merchants, regardless of the geographic location of their customers. As previously stated, dLocal does not engage with or provide services directly to the end-users of its merchants.
Revenue with large customers
During the year ended December 31, 2024, the Group’s revenue from its top 10 merchants represented 62% of its total revenue (60% and 50% of revenue in the years ended December 31, 2023 and 2022, respectively). In 2024 two merchants (one in 2023 and none in 2022) individually accounted for more than 10 % of the Group’s total revenue.
Non-current assets by country
The Company does not have any non-current assets located in the Cayman Islands.
Material non-current assets are the Intangible Assets described in Note 20 to these Consolidated Financial Statements and are located in Malta.
29
dLocal derives revenue by processing payments for international merchants who operate in selected emerging markets.
The breakdown of revenue from contracts with customers per type of service is as follows:
|
|
2024 |
|
|
2023 |
|
|
2022 |
|
|||
Transaction revenues (i) |
|
|
739,919 |
|
|
|
637,053 |
|
|
|
415,444 |
|
Other revenues (ii) |
|
|
6,055 |
|
|
|
13,298 |
|
|
|
3,481 |
|
Revenues from payment processing |
|
|
745,974 |
|
|
|
650,351 |
|
|
|
418,925 |
|
Cost of services |
|
|
(451,301 |
) |
|
|
(373,492 |
) |
|
|
(216,758 |
) |
Gross profit |
|
|
294,673 |
|
|
|
276,859 |
|
|
|
202,167 |
|
Transaction revenues are recognized at a point in time when the payment transaction, or in the case of chargeback and refunds, its reversal, has been processed. Other revenues are recognized as revenue at a point in time when the respective performance obligation is satisfied. The Group did not recognize revenues over time during the year ended December 31, 2024, 2023 and 2022.
Cost of services are comprised of the following:
|
|
2024 |
|
|
2023 |
|
|
2022 |
|
|||
Processing costs (i) |
|
|
427,127 |
|
|
|
356,295 |
|
|
|
206,223 |
|
Hosting expenses (ii) |
|
|
7,723 |
|
|
|
6,235 |
|
|
|
4,331 |
|
Amortization of intangible assets (iii) |
|
|
13,413 |
|
|
|
8,710 |
|
|
|
4,793 |
|
Salary and wages (iv) |
|
|
3,038 |
|
|
|
2,252 |
|
|
|
1,411 |
|
Total |
|
|
451,301 |
|
|
|
373,492 |
|
|
|
216,758 |
|
Technology and development expenses consist of the following:
|
|
2024 |
|
|
2023 |
|
|
2022 |
|
|||
Salaries and wages (i) |
|
|
12,626 |
|
|
|
5,805 |
|
|
|
2,969 |
|
Software licenses (ii) |
|
|
5,723 |
|
|
|
3,213 |
|
|
|
1,294 |
|
Infrastructure expenses (iii) |
|
|
4,871 |
|
|
|
2,279 |
|
|
|
1,496 |
|
Information and technology security expenses (iv) |
|
|
336 |
|
|
|
442 |
|
|
|
298 |
|
Other technology expenses |
|
|
2,069 |
|
|
|
911 |
|
|
|
291 |
|
Total |
|
|
25,625 |
|
|
|
12,650 |
|
|
|
6,348 |
|
Sales and marketing expenses and General and administrative expense are comprised of the following:
Sales and marketing expenses |
|
2024 |
|
|
2023 |
|
|
2022 |
|
|||
Salaries and wages (i) |
|
|
18,130 |
|
|
|
13,344 |
|
|
|
10,800 |
|
Marketing expenses (ii) |
|
|
3,496 |
|
|
|
3,776 |
|
|
|
2,535 |
|
Total |
|
|
21,626 |
|
|
|
17,120 |
|
|
|
13,335 |
|
General and administrative expenses |
|
2024 |
|
|
2023 |
|
|
2022 |
|
|||
Salaries and wages (iii) |
|
|
54,931 |
|
|
|
36,727 |
|
|
|
24,697 |
|
Third-party services (iv) |
|
|
22,600 |
|
|
|
18,500 |
|
|
|
12,431 |
|
Other operating expenses (v) |
|
|
23,694 |
|
|
|
15,341 |
|
|
|
11,215 |
|
Total |
|
|
101,225 |
|
|
|
70,568 |
|
|
|
48,343 |
|
Employee benefits costs were comprised of the following:
|
|
2024 |
|
|
2023 |
|
|
2022 |
|
|||
Salaries, wages and contractor fees (i) |
|
|
84,754 |
|
|
|
62,900 |
|
|
|
42,550 |
|
Share-based payments (ii) |
|
|
23,780 |
|
|
|
11,922 |
|
|
|
8,684 |
|
Total |
|
|
108,534 |
|
|
|
74,822 |
|
|
|
51,234 |
|
Amortization and depreciation expenses are composed of the following:
|
|
2024 |
|
|
2023 |
|
|
2022 |
|
|||
Amortization of intangible assets (Note 20) |
|
|
15,511 |
|
|
|
10,816 |
|
|
|
6,891 |
|
Right-of-use asset amortization (Note 19) |
|
|
421 |
|
|
|
627 |
|
|
|
518 |
|
Depreciation of Property, plant & equipment (Note 18) |
|
|
1,245 |
|
|
|
782 |
|
|
|
738 |
|
Total |
|
|
17,177 |
|
|
|
12,225 |
|
|
|
8,147 |
|
For further information related to amortization of intangible assets refer to Note 20: Intangible Assets.
Other results consist of the following categories:
|
|
2024 |
|
|
2023 |
|
|
2022 |
|
|||
Interest Income from Financial Instruments (i) |
|
|
28,266 |
|
|
|
49,588 |
|
|
|
18,114 |
|
Fair value gains / (losses) of financial assets at FVPL (i) |
|
|
38,609 |
|
|
|
78,640 |
|
|
|
(36 |
) |
Finance income |
|
|
66,875 |
|
|
|
128,228 |
|
|
|
18,078 |
|
|
|
|
|
|
|
|
|
|
|
|||
|
|
2024 |
|
|
2023 |
|
|
2022 |
|
|||
Finance expense related to derivative financial instruments (ii) |
|
|
(19,462 |
) |
|
|
(28,013 |
) |
|
|
(18,763 |
) |
Other finance expenses (iii) |
|
|
(29,738 |
) |
|
|
(88,243 |
) |
|
|
(5,728 |
) |
Interest charges for lease liabilities (iv) |
|
|
(501 |
) |
|
|
(578 |
) |
|
|
(177 |
) |
Finance costs |
|
|
(49,701 |
) |
|
|
(116,834 |
) |
|
|
(24,668 |
) |
Inflation adjustment (v) |
|
|
(6,655 |
) |
|
|
(12,537 |
) |
|
|
(1,037 |
) |
Total |
|
|
10,519 |
|
|
|
(1,143 |
) |
|
|
(7,627 |
) |
12. Income Tax
In October 2021, members of the Organization for Economic Cooperation and Development (OECD) inclusive framework released the statement on a Two-Pillar solution to address the tax challenges arising from the digitalization of the economy. On 23 May 2023, the International Accounting Standards Board (IAS) issued “International Tax Reform – Pillar Two Model Rules – Amendments to IAS 12” which clarify that IAS 12 applies to income taxes arising from tax law enacted or substantively enacted to implement the Pillar Two model rules published by the OECD, including tax law that implements Qualified Domestic Minimum Top-up Taxes. The Group has adopted these amendments. However, these amendments are not yet applicable for the current reporting year, as the Group's consolidated revenue has remained below the €750 million threshold, which is assessed based on the average revenue over the last four reporting periods.
The income tax charge recognized in profit and losses included the following:
Current Income Tax |
|
2024 |
|
|
2023 |
|
|
2022 |
|
|||
Current Income Tax on profits for the year |
|
|
(32,595 |
) |
|
|
(31,924 |
) |
|
|
(11,682 |
) |
Total Current Income Tax expense |
|
|
(32,595 |
) |
|
|
(31,924 |
) |
|
|
(11,682 |
) |
|
|
|
|
|
|
|
|
|
|
|||
Deferred income tax |
|
2024 |
|
|
2023 |
|
|
2022 |
|
|||
Increase/(Decrease) in deferred income tax assets |
|
|
3,150 |
|
|
|
1,757 |
|
|
|
229 |
|
(Decrease)/Increase in deferred income tax liabilities |
|
|
(1,105 |
) |
|
|
739 |
|
|
|
(133 |
) |
Total Deferred income tax benefit / (expense) |
|
|
2,045 |
|
|
|
2,496 |
|
|
|
96 |
|
Income Tax expense |
|
|
(30,550 |
) |
|
|
(29,428 |
) |
|
|
(11,586 |
) |
Deferred Tax Assets
The balance comprises temporary differences attributable to:
|
|
2024 |
|
|
2023 |
|
|
2022 |
|
|||
Tax Losses |
|
|
793 |
|
|
|
233 |
|
|
|
348 |
|
Accrued Liabilities |
|
|
3,196 |
|
|
|
773 |
|
|
|
99 |
|
Exchange differences |
|
|
333 |
|
|
|
89 |
|
|
|
— |
|
Other |
|
|
1,045 |
|
|
|
1,193 |
|
|
|
51 |
|
Total |
|
|
5,367 |
|
|
|
2,288 |
|
|
|
498 |
|
The recognized tax loss carry-forwards have a maximum expiration of 5 years.
Movements:
|
|
Tax losses |
|
|
Accrued liabilities |
|
|
|
Exchange differences |
|
|
Other |
|
|
Total |
|
||||||
At January 1, 2024 |
|
|
233 |
|
|
|
773 |
|
|
|
|
89 |
|
|
|
1,193 |
|
|
|
2,288 |
|
|
(Charged) / Credited to profit & loss |
|
|
560 |
|
|
|
2,423 |
|
|
— |
|
|
244 |
|
|
|
(148 |
) |
|
|
3,079 |
|
At December 31, 2024 |
|
|
793 |
|
|
|
3,196 |
|
|
|
|
333 |
|
|
|
1,045 |
|
|
|
5,367 |
|
|
|
|
|
|
|
|
|
|
|
|
|
|
|
|
|
|
|
||||||
|
|
Tax losses |
|
|
Accrued liabilities |
|
|
|
Exchange differences |
|
|
Other |
|
|
Total |
|
||||||
At January 1, 2023 |
|
|
348 |
|
|
|
99 |
|
|
|
|
— |
|
|
|
51 |
|
|
|
498 |
|
|
Credited / (Charged) to profit & loss |
|
|
(115 |
) |
|
|
674 |
|
|
|
|
89 |
|
|
|
1,142 |
|
|
|
1,790 |
|
|
At December 31, 2023 |
|
|
233 |
|
|
|
773 |
|
|
|
|
89 |
|
|
|
1,193 |
|
|
|
2,288 |
|
|
Deferred Tax Liabilities
The balance of Deferred Tax Liabilities is comprised of temporary differences attributable to:
|
|
2024 |
|
|
2023 |
|
|
2022 |
|
|||
Accrued receivables |
|
|
795 |
|
|
|
353 |
|
|
|
946 |
|
Other |
|
|
1,063 |
|
|
|
471 |
|
|
|
206 |
|
Total |
|
|
1,858 |
|
|
|
824 |
|
|
|
1,152 |
|
Movements:
|
|
Accrued |
|
|
Other |
|
|
Total |
|
|||
At January 1, 2024 |
|
|
353 |
|
|
|
471 |
|
|
|
824 |
|
Credited / (charged) to profit & loss |
|
|
442 |
|
|
|
592 |
|
|
|
1,034 |
|
At December 31, 2024 |
|
|
795 |
|
|
|
1,063 |
|
|
|
1,858 |
|
|
|
|
|
|
|
|
|
|
|
|||
At January 1, 2023 |
|
|
946 |
|
|
|
206 |
|
|
|
1,152 |
|
Credited / (charged) to profit & loss |
|
|
(593 |
) |
|
|
265 |
|
|
|
(328 |
) |
At December 31, 2023 |
|
|
353 |
|
|
|
471 |
|
|
|
824 |
|
As of December 31, 2024 and 2023, no deferred tax liability has been recognized on investments in the Group subsidiaries. The Group has concluded it has the ability and intention to control the timing of any distribution from its subsidiaries and that it is probable there will be no reversal in the foreseeable future in a way that would result in a charge to taxable profit.
Reconciliation of effective tax rate
The tax on the Group’s profit before tax differs from the theoretical amount that would arise using the weighted average tax rate applicable to the profits of the consolidated entities. The income tax provision is determined based on the income tax rates in effect in each country where the Group operates. The following is a reconciliation of the income tax expense to the profit (loss) for the year, considering the applicable statutory tax rates in the jurisdictions where the Group has taxable operations. These rates range from 0% in jurisdictions such as the Cayman Islands to 35% in Argentina and Colombia. Other key tax rates include 5% in Malta, 21% in the United States, 25% in Ecuador, Panama, the United Kingdom and Uruguay, 30% in Kenya, Mexico, and Nigeria. In the remaining countries, tax rates range from 10% to 35%.
The Group’s effective Income Tax rate in 2024 was 20.2% (16.5% and 9.6% in the years ended December 31, 2023 and 2022, respectively). For 2024 and 2023, the Group applied for fiscal consolidation in Malta resulting in a domestic rate of 5%. The reconciliation between the effective Income Tax rate and the statutory rate in Malta of 5% in 2024, 2023 and 2022 was as follows:
|
|
2024 |
|
|
2023 |
|
|
2022 |
|
|||
Profit before Income Tax |
|
|
151,019 |
|
|
|
178,514 |
|
|
|
120,283 |
|
Tax at the domestic rates applicable to profit before income tax in the respective jurisdiction |
|
|
(7,551 |
) |
|
|
(8,926 |
) |
|
|
(6,014 |
) |
Permanent differences: |
|
|
|
|
|
|
|
|
|
|||
Tax effect of non-taxable income |
|
|
897 |
|
|
|
822 |
|
|
|
555 |
|
Effects from entities taxes with different rates |
|
|
(14,565 |
) |
|
|
(15,930 |
) |
|
|
(5,440 |
) |
Other permanent differences (1) |
|
|
(9,331 |
) |
|
|
(5,394 |
) |
|
|
(687 |
) |
Total |
|
|
(30,550 |
) |
|
|
(29,428 |
) |
|
|
(11,586 |
) |
(1) During the year ended December 31, 2024, other permanent differences included non-deductible expenses, the effect of income taxes accrued in subsidiaries (due to higher income tax rates) and the effect of hyperinflation adjustment in Argentinian subsidiaries.
The Company recorded income tax expenses of USD 4,543 related to a claim from the Uruguayan Tax Authority concerning income taxes on foreign activities and transactions under the Free Zone regime held in 2022. Despite having strong arguments for its position, during the last quarter of 2024, the Company chose to settle with local tax authorities to resolve the matter. The Company and its external tax advisors are confident that there is no significant risk related to prior or subsequent periods.
37
At the date of these consolidated financial statements, the total authorized share capital of the Group was USD 3,000,000, divided into 1,500,000,000 shares par value USD 0.002 each, of which:
• 1,000,000,000 shares are designated as Class A common shares; and
• 250,000,000 shares are designated as Class B common shares.
The remaining 250,000,000 authorized but unissued shares are presently undesignated and may be issued by our board of directors as common shares of any class or as shares with preferred, deferred or other special rights or restrictions.
The rights of the holders of Class A Common Shares and Class B Common Shares are identical, except with respect to voting, conversion and transfer restrictions applicable to the Class B Common Shares. Each Class A Common Share is entitled to one vote while Class B Common Shares are entitled to five votes each. Each Class B Common Share is convertible into one Class A Common Share automatically upon transfer, subject to certain exceptions. Holders of Class A Common Shares and Class B Common Shares vote together as a single class on all matters unless otherwise required by law.
Authorized shares, as well as issued and fully paid-up shares, are presented below:
|
|
2024 |
|
2023 |
||||
|
|
Amount |
|
USD |
|
Amount |
|
USD |
Issued and Fully Paid Up Shares of USD 0.002 each |
|
|
|
|
|
|
|
|
Class A Common Shares |
|
151,420,944 |
|
302 |
|
161,937,473 |
|
323 |
Class B Common Shares |
|
134,054,192 |
|
268 |
|
134,054,192 |
|
268 |
|
|
285,475,136 |
|
570 |
|
295,991,665 |
|
591 |
Share Capital evolution |
|
|
|
|
|
|
|
|
Share Capital as of January 1 |
|
295,991,665 |
|
591 |
|
296,029,870 |
|
592 |
i) Issue of common shares at USD 0.002 |
|
1,067,176 |
|
2 |
|
663,897 |
|
— |
ii) Warrant exercise (See note 2.11.2) |
|
— |
|
— |
|
6,334,134 |
|
13 |
iii) Repurchase of shares |
|
(11,583,705) |
|
(23) |
|
(7,036,236) |
|
(14) |
Share capital as of December 31 |
|
285,475,136 |
|
570 |
|
295,991,665 |
|
591 |
(b) Share Premium
As of December 31, 2024 and 2023, dLocal issued 1,067,176 and 663,897 new Class A Common Shares receiving total proceeds of USD 1,853 and 153, respectively, related to the exercise of share-options.
(c) Treasury Shares
On May 13, 2024, the Board of Directors of Dlocal approved a share buyback program. The Company is authorized, but not obligated to purchase up to $200 million of its Class A common shares from May 15, 2024, to May 31, 2025.
As of December 31, 2024 the Company has repurchased 11,583,705 shares at an average price of USD 8.72 per share, amounting to a total consideration of USD 101,067. The repurchased shares are held as treasury shares and are accounted for at cost.
(d) Capital reserve
The Capital Reserve corresponds to reserves related to share-based payment plans, as described in Note 13: Share-Based Payments and Warrants of the Annual Financial Statements for the year ended December 31, 2024. As of December 31, 2024, the net effect of share-based payments amounts to USD 11,863 comprising USD 23,780 in share-based expenses and USD 11,917 related to the exercise and vesting of share-based plans.
(e) Other Reserves
The reserves for the Group relate to cumulative translation adjustment representing differences on conversion of assets and liabilities at the reporting date.
(f) Earnings per share
The Group calculates basic and diluted earnings per share as discussed in Note 2.13: Equity. The calculations performed to derive basic and diluted EPS during the years ended December 31, 2024, 2023 and 2022 are as follows:
|
|
2024 |
|
2023 |
|
2022 |
Profit attributable to common shareholders (U.S. Dollars) |
|
120,416,000 |
|
148,964,000 |
|
108,682,969 |
Weighted average number of common shares |
|
290,014,019 |
|
291,982,305 |
|
295,623,702 |
Adjustments for calculation of diluted earnings per share(1) |
|
15,122,271 |
|
10,976,123 |
|
17,514,944 |
Weighted average number of common shares for calculating diluted earnings per share |
|
305,136,290 |
|
302,958,428 |
|
313,138,646 |
Basic earnings per share |
|
0.42 |
|
0.51 |
|
0.37 |
Diluted earnings per share |
|
0.39 |
|
0.49 |
|
0.35 |
(1) As of December 31, 2024, reflects to the dilutive effect of i) 8,129,577 average shares related to share-based payment warrants (8,560,918 and 14,865,332, respectively for the years ended December 31, 2023 and December 31, 2022); and ii) 6,992,694 average shares related to share-based payment plans with employees (2,415,205 and 2,649,612, respectively for the years ended December 31, 2023 and December 31, 2022).
39
As of December 31, cash and cash equivalents was as follow:
|
|
2024 |
|
|
2023 |
|
||
Own Balances |
|
|
189,029 |
|
|
|
222,808 |
|
Merchant Clients Funds |
|
|
236,143 |
|
|
|
313,352 |
|
Total |
|
|
425,172 |
|
|
|
536,160 |
|
The Group reported cash on hand, demand deposits and other short term liquid financial instruments of USD 425,172 as of December 31, 2024, (USD 536,160 on December 31, 2023).
Own Balances represent the Group’s cash and cash equivalents, while Merchant Clients Funds includes freely available funds collected from merchant customers, that can be invested in secure, liquid low-risk assets until transferred to the merchant. As of December 31, 2024 , Merchant Clients Funds includes USD 128,725 pending to transfer to Own Balances (USD 59,900 as of December 31, 2023).
Financial assets at fair value through profit or loss include the following:
Instrument |
|
Reference |
|
Maturity date |
|
Interest rate (%) |
|
Linked with |
|
2024 |
|
2023 |
Argentina Treasury Bonds |
|
TV24 |
|
Apr-24 |
|
0.40% |
|
Dollar linked |
|
— |
|
94,667 |
Argentina Treasury Bonds |
|
TDG24 |
|
Aug-24 |
|
0%/3.25% |
|
U.S. Dollar/CER index* |
|
— |
|
8,059 |
Argentina Treasury Bonds |
|
TDE25 |
|
Jan-25 |
|
0%/3.25% |
|
U.S. Dollar/CER index* |
|
2,149 |
|
1,661 |
Argentina Treasury Bonds |
|
TV25 |
|
Mar-25 |
|
0.50% |
|
Dollar linked |
|
9,130 |
|
— |
Argentina Treasury Bonds |
|
TZV25 |
|
Jun-25 |
|
— |
|
Dollar linked |
|
61,136 |
|
— |
Argentina Treasury Notes |
|
S31E5 |
(i) |
Jan-25 |
|
5.50% |
|
— |
|
29,918 |
|
— |
Argentina Treasury Notes |
|
S29G5 |
(i) |
Aug-25 |
|
3.88% |
|
— |
|
5,875 |
|
— |
Argentina Treasury Notes |
|
S30J5 |
(i) |
Jun-25 |
|
3.90% |
|
— |
|
5,676 |
|
— |
Argentina Treasury Notes |
|
S31L5 |
(i) |
Jul-25 |
|
3.98% |
|
— |
|
583 |
|
— |
Other Money Market Funds |
|
LFT |
|
Jan-25 |
|
Selic + 0.08% |
|
— |
|
14,852 |
|
— |
|
|
|
|
|
|
|
|
|
|
129,319 |
|
104,387 |
*Stabilization Reference Coefficient adjusted by inflation
(i) As of December 31, 2024 the Group held a total of nominal value USD 42,052 as security for the borrowings detailed in Note 22.
(b) Amounts recognized in profit or loss
Information about the Group’s impact on profit or loss of bonds is discussed in Note 11: Other Results
Information about the Group’s exposure to price risk is discussed in Note 30: Financial risk management.
Trade and Other Receivables of the Group are composed of the following:
Current |
|
2024 |
|
|
2023 |
|
||
Trade receivables |
|
|
457,312 |
|
|
|
319,921 |
|
Loss allowance |
|
|
(148 |
) |
|
|
(459 |
) |
Trade receivables net |
|
|
457,164 |
|
|
|
319,462 |
|
Advances and other receivables |
|
|
39,549 |
|
|
|
43,912 |
|
Total Current Trade and Other Receivables |
|
|
496,713 |
|
|
|
363,374 |
|
|
|
|
|
|
|
|
||
Non current |
|
|
|
|
|
|
||
Advances and other receivables |
|
|
18,044 |
|
|
|
— |
|
Total Non Current Trade and Other Receivables |
|
|
18,044 |
|
|
|
— |
|
Trade Receivables represent uncollateralized amounts due from acquirers, processors, merchants and preferred suppliers for services performed that will be collected in less than one year. As a result, they are classified as current. No financial assets are past due. All Trade and other receivables have been assigned in “normal” credit risk rating which applies to financial assets for which a significant increase in credit risk has not occurred since initial recognition.
Advances and other receivables include payments made in advance as well as tax credits.
For further information refer to Note 30: Financial risk management - Impairment of financial assets.
Loss allowance and impairment losses
The following table presents the evolution of the Group’s loss allowance:
|
|
2024 |
|
|
2023 |
|
||
As of January 1 |
|
|
(459 |
) |
|
|
(280 |
) |
Decrease/(increase) in loss allowance for trade receivables |
|
|
(440 |
) |
|
|
(318 |
) |
Write-off |
|
|
751 |
|
|
|
139 |
|
As of December 31 |
|
|
(148 |
) |
|
|
(459 |
) |
Net impairment (loss) for trade receivables |
|
|
(440 |
) |
|
|
(318 |
) |
Initial recognition and subsequent measurement the Group applies the simplified approach to determine expected credit losses on trade receivables.
To measure the expected credit losses, trade and other receivables have been grouped based on shared credit risk characteristics and the days past due.
The expected loss rates are based on the payment profiles of debtors over a period of 48 months before year end and the corresponding historical credit losses experienced within this period. The historical loss rate is adjusted to reflect current and forward-looking information on credit risk ratings of the countries in which the Group sells its services which affects the ability of the debtors to settle the receivables. On that basis, the average expected credit loss rate was determined at 0.1% for December 31, 2024 (0.2% on December 31, 2023).
Other assets are composed of the following:
Current |
|
2024 |
|
|
2023 |
|
||
Money held in escrow and guarantees due to: (i) |
|
|
6,966 |
|
|
|
11,635 |
|
-Banks requirements |
|
|
3,869 |
|
|
|
3,000 |
|
-Processors and others requirements |
|
|
2,974 |
|
|
|
5,072 |
|
-Credit card requirements |
|
|
123 |
|
|
|
3,563 |
|
Rental guarantees |
|
|
220 |
|
|
|
147 |
|
Other financial asset measure as FVPL (ii)(iii) |
|
|
11,619 |
|
|
|
— |
|
Total current Other Assets |
|
|
18,805 |
|
|
|
11,782 |
|
Non Current |
|
|
|
|
|
|
||
Other financial asset measure as FVPL (ii) |
|
|
4,695 |
|
|
|
— |
|
Total Non Current Other Assets |
|
|
4,695 |
|
|
|
— |
|
|
|
|
|
|
|
|
||
Property, Plant and Equipment of the Group correspond to computer equipment and building improvements that are stated at cost less accumulated depreciation.
|
|
2024 |
|
2023 |
||||||||
|
|
Computer |
|
Building improvements |
|
Total |
|
Computer |
|
Building improvements |
|
Total |
Cost |
|
3,775 |
|
1,257 |
|
5,032 |
|
2,810 |
|
1,257 |
|
4,067 |
Accumulated depreciation |
|
(1,771) |
|
(344) |
|
(2,115) |
|
(1,115) |
|
(218) |
|
(1,333) |
Opening book value, January 1 |
|
2,004 |
|
913 |
|
2,917 |
|
1,695 |
|
1,039 |
|
2,734 |
Additions |
|
2,779 |
|
— |
|
2,779 |
|
1,088 |
|
— |
|
1,088 |
Disposals |
|
(1,074) |
|
— |
|
(1,074) |
|
(123) |
|
— |
|
(123) |
Depreciation of the year |
|
(1,119) |
|
(126) |
|
(1,245) |
|
(656) |
|
(126) |
|
(782) |
Total as of December 31 |
|
2,590 |
|
787 |
|
3,377 |
|
2,004 |
|
913 |
|
2,917 |
Cost |
|
5,480 |
|
1,257 |
|
6,737 |
|
3,775 |
|
1,257 |
|
5,032 |
Accumulated depreciation |
|
(2,890) |
|
(470) |
|
(3,360) |
|
(1,771) |
|
(344) |
|
(2,115) |
The Group did not impair Property, Plant and Equipment during 2024 and 2023, nor did it reverse any previously recognized impairment losses. Additionally, the Group did not have commitments to purchase any property, plant and equipment at year end.
For further details on accounting policies refer to Note 2.7: Property, plant and equipment.
The Group’s lease contracts refer to the use of explicitly defined office facilities in different countries, where it obtains substantially all of the economic benefits and has the right to direct the use of such offices.
|
|
2024 |
|
|
2023 |
|
||
Right-of-use assets |
|
|
|
|
|
|
||
Offices |
|
|
3,645 |
|
|
|
3,689 |
|
|
|
|
3,645 |
|
|
|
3,689 |
|
|
|
|
|
|
|
|
||
|
|
2024 |
|
|
2023 |
|
||
Lease liabilities |
|
|
|
|
|
|
||
Current |
|
|
1,137 |
|
|
|
626 |
|
Non-current |
|
|
2,863 |
|
|
|
3,331 |
|
|
|
|
4,000 |
|
|
|
3,957 |
|
During 2024 no new leases were recognized (USD 339 in 2023).
The Consolidated Statements of Comprehensive Income shows the following amounts relating to leases:
|
|
2024 |
|
|
2023 |
|
||
Amortization of right-of-use assets |
|
|
|
|
|
|
||
Offices |
|
|
421 |
|
|
|
627 |
|
|
|
|
421 |
|
|
|
627 |
|
Interest charges for lease liabilities (included within Finance Costs line |
|
|
501 |
|
|
|
578 |
|
Leases expense for short-term leases (included within General and |
|
|
823 |
|
|
|
457 |
|
The principal cash outflow for leases during 2024 was USD 552 (USD 1,103 in 2023).
Intangible assets of the Group correspond to acquired software, capitalized expenses related to internally generated software and acquired merchant agreements, and are stated at cost less accumulated amortization.
|
|
2024 |
|
2023 |
||||||||
At January 1, |
|
Internally generated software |
|
Acquired intangible assets |
|
Total |
|
Internally generated software |
|
Acquired intangible assets |
|
Total |
Cost |
|
40,446 |
|
39,901 |
|
80,347 |
|
23,752 |
|
39,335 |
|
63,087 |
Accumulated amortization |
|
(16,683) |
|
(5,777) |
|
(22,460) |
|
(7,973) |
|
(3,671) |
|
(11,644) |
Opening book value as of January 1 |
|
23,763 |
|
34,124 |
|
57,887 |
|
15,779 |
|
35,664 |
|
51,443 |
Additions (i) |
|
19,809 |
|
1,133 |
|
20,942 |
|
16,694 |
|
566 |
|
17,260 |
Amortization of the year |
|
(13,413) |
|
(2,098) |
|
(15,511) |
|
(8,710) |
|
(2,106) |
|
(10,816) |
Total as of December 31 |
|
30,159 |
|
33,159 |
|
63,318 |
|
23,763 |
|
34,124 |
|
57,887 |
Cost |
|
60,255 |
|
41,034 |
|
101,289 |
|
40,446 |
|
39,901 |
|
80,347 |
Accumulated amortization |
|
(30,096) |
|
(7,875) |
|
(37,971) |
|
(16,683) |
|
(5,777) |
|
(22,460) |
At December 31, 2024 and 2023 no indicator of impairment related to intangible assets existed, so the Group did not perform an impairment test. Refer Note 2.8: Intangible assets and Note 2.9: Impairment of non-financial assets for further detail related to the Group’s accounting policies related to the accounting for intangible assets.
Trade and Other Payables are composed of the following:
|
|
2024 |
|
|
2023 |
|
||
Trade Payables |
|
|
562,749 |
|
|
|
572,394 |
|
Accrued Liabilities |
|
|
9,895 |
|
|
|
10,192 |
|
Other Payables |
|
|
25,143 |
|
|
|
19,907 |
|
Total |
|
|
597,787 |
|
|
|
602,493 |
|
Trade and other payables are classified as current liabilities as the payment is due within one year or less. Moreover, the carrying amounts are considered to be the same as fair values, due to their short – term nature.
Trade Payables correspond to liabilities owed to Merchants, either related to pay-in transactions processed or payout transactions pending at their request. Accrued Liabilities primarily consist of obligations to legal and tax advisors, as well as auditors. Other Payables include general administrative expenses and other obligations.
Financial liabilities breakdown is as follows:
|
|
2024 |
|
2023 |
Borrowings (i) (ii) |
|
39,768 |
|
— |
Bank overdraft (iii) |
|
10,687 |
|
— |
Total Finance Liability (iv) |
|
50,455 |
|
— |
(i) As of December 31, 2024, dLocal entered into borrowing agreements in Argentinean Pesos (AR$) with a financial institution in Argentina to grant advances to merchants. The amount and interest rate of the borrowing is agreed on a daily basis. The interest expense for the twelve-month year ended December 31, 2024 amounts USD 2,308 thousands. In addition, Argentina Treasury Notes for a nominal value of USD 42,052 were held as security for this borrowing. See note 15 for additional information.
(ii) In December 2024, dLocal Colombia S.A.S, entered into a loan agreement with Citibank Colombia S.A. in a total of COP 14,000,000 (USD 3,177), which will mature on March 01, 2025. With total payment, principal and interest due at the maturity date.
(iii) As of December 31, 2024, it is mainly related to an overdraft balance with a financial institution in Uruguayan Pesos (UYU) in Uruguay to fund advances to merchants. This overdraft facility is a short term liability with an annually interest rate of 11%.
(iv) Financial liabilities are presented net of cash payments, have a high turnover, the amounts are large, and the maturity period is three months or less.
Tax liabilities includes the following:
|
|
2024 |
|
|
2023 |
|
||
Income tax payable |
|
|
19,682 |
|
|
|
20,280 |
|
Other tax liabilities |
|
|
1,833 |
|
|
|
520 |
|
Income tax perception |
|
|
843 |
|
|
|
159 |
|
Digital services withholding VAT |
|
|
990 |
|
|
|
341 |
|
Other Taxes |
|
|
— |
|
|
|
20 |
|
Total |
|
|
21,515 |
|
|
|
20,800 |
|
The Group’s operations are in various foreign currencies and consequently are exposed to foreign currency risk. As a consequence, the Group uses derivative instruments, delivery and non-delivery currency forward contracts and future contracts, to reduce the volatility of earnings and cash flows, caused by the exchange rate variation in which dLocal is exposed on the conversion of local currency into the settlement currency (usually US dollars). All outstanding derivatives are recognized in the Group’s consolidated balance sheets at fair value and the impacts are recognized on profit or loss, as shown on the tables below.
The Group uses foreign exchange forward contracts to manage some of its transaction exposures. The spot element of foreign exchange forward contracts is designated as hedging instruments in fair value hedges and are entered into for periods consistent with foreign currency exposure of the underlying transactions, generally from one to 12 months.
Transaction |
|
Type Contract |
|
Notional amount in USD as of December 31, 2024 |
|
|
Outstanding balance as of December 31, 2024 - Derivative financial assets / (liabilities)" |
|
|
Outstanding notional amount as of December 31, 2023 |
|
|
Outstanding balance as of December 31, 2023 - Derivative financial assets / (liabilities) |
|
||||
Assets |
|
|
|
|
|
|
|
|
|
|
|
|
|
|
||||
Buy EUR |
|
|
|
|
|
|
|
|
|
|
|
|
|
|
||||
US Dollar |
|
Futures Contract |
|
|
— |
|
|
|
— |
|
|
|
29,114 |
|
|
|
480 |
|
Buy USD |
|
|
|
|
|
|
|
|
|
|
|
|
|
|
||||
Mexican Peso |
|
Futures Contract |
|
|
9,780 |
|
|
|
287 |
|
|
|
— |
|
|
|
— |
|
South African Rand |
|
Futures Contract |
|
|
13,870 |
|
|
|
727 |
|
|
|
— |
|
|
|
— |
|
Mexican Peso |
|
Forward |
|
|
9,899 |
|
|
|
256 |
|
|
|
— |
|
|
|
— |
|
Moroccan Dirham |
|
Forward |
|
|
4,482 |
|
|
|
35 |
|
|
|
— |
|
|
|
— |
|
South African Rand |
|
Forward |
|
|
26,961 |
|
|
|
749 |
|
|
|
— |
|
|
|
— |
|
Brazilian Real |
|
Non-delivery forwards |
|
|
17,682 |
|
|
|
378 |
|
|
|
|
|
|
|
||
Indian Rupee |
|
Non-delivery forwards |
|
|
176 |
|
|
|
1 |
|
|
|
— |
|
|
|
— |
|
Argentine Peso |
|
Non-delivery forwards |
|
|
— |
|
|
|
— |
|
|
|
3,400 |
|
|
|
7 |
|
Egyptian Pound |
|
Non-delivery forwards |
|
|
— |
|
|
|
— |
|
|
|
20,865 |
|
|
|
1,479 |
|
Sell EUR |
|
|
|
|
|
|
|
|
|
|
|
|
|
|
||||
US Dollar |
|
Futures Contract |
|
|
(18,065 |
) |
|
|
152 |
|
|
|
— |
|
|
|
— |
|
Sell USD |
|
|
|
|
|
|
|
|
|
|
|
|
|
|
||||
South African Rand |
|
Forward |
|
|
— |
|
|
|
— |
|
|
|
(2,345 |
) |
|
|
12 |
|
Argentine Peso |
|
Futures Contract |
|
|
(1,000 |
) |
|
|
252 |
|
|
|
— |
|
|
|
— |
|
Brazilian Real |
|
Non-delivery forwards |
|
|
(7,707 |
) |
|
|
37 |
|
|
|
— |
|
|
|
— |
|
Peruvian Sol |
|
Non-delivery forwards |
|
|
— |
|
|
|
— |
|
|
|
(1,252 |
) |
|
|
62 |
|
Total |
|
|
|
|
|
|
|
2,874 |
|
|
|
|
|
|
2,040 |
|
||
|
|
|
|
|
|
|
|
|
|
|
|
|
|
|
||||
Liabilities |
|
|
|
|
|
|
|
|
|
|
|
|
|
|
||||
Buy EUR |
|
|
|
|
|
|
|
|
|
|
|
|
|
|
||||
Moroccan Dirham |
|
Forward |
|
|
— |
|
|
|
— |
|
|
|
1,490 |
|
|
|
(51 |
) |
US Dollar |
|
Forward |
|
|
3,383 |
|
|
|
(13 |
) |
|
|
— |
|
|
|
— |
|
US Dollar |
|
Futures Contract |
|
|
39,223 |
|
|
|
(547 |
) |
|
|
— |
|
|
|
— |
|
Buy USD |
|
|
|
|
|
|
|
|
|
|
|
|
|
|
||||
Chilean Peso |
|
Forward |
|
|
15,979 |
|
|
|
(29 |
) |
|
|
— |
|
|
|
— |
|
United Arab Emirates Dirham |
|
Forward |
|
|
133 |
|
|
|
(0 |
) |
|
|
— |
|
|
|
— |
|
South African Rand |
|
Forward |
|
|
— |
|
|
|
— |
|
|
|
8,128 |
|
|
|
(230 |
) |
Saudi Riyal |
|
Forward |
|
|
6,755 |
|
|
|
(11 |
) |
|
|
— |
|
|
|
— |
|
Moroccan Dirham |
|
Forward |
|
|
— |
|
|
|
— |
|
|
|
6,263 |
|
|
|
(240 |
) |
Uruguayan peso |
|
Forward |
|
|
5,392 |
|
|
|
(71 |
) |
|
|
— |
|
|
|
— |
|
Argentine Peso |
|
Futures Contract |
|
|
1,900 |
|
|
|
(232 |
) |
|
|
— |
|
|
|
— |
|
Brazilian Reais |
|
Non-delivery forwards |
|
|
— |
|
|
|
— |
|
|
|
3,715 |
|
|
|
(30 |
) |
Chilean Peso |
|
Non-delivery forwards |
|
|
— |
|
|
|
— |
|
|
|
19,874 |
|
|
|
(174 |
) |
Uruguayan Peso |
|
Non-delivery forwards |
|
|
— |
|
|
|
— |
|
|
|
2,552 |
|
|
|
(48 |
) |
Indian Rupee |
|
Non-delivery forwards |
|
|
— |
|
|
|
— |
|
|
|
2,397 |
|
|
|
(7 |
) |
Peruvian Sol |
|
Non-delivery forwards |
|
|
— |
|
|
|
— |
|
|
|
1,200 |
|
|
|
(67 |
) |
Vietnamese Dong |
|
Non-delivery forwards |
|
|
6,334 |
|
|
|
(7 |
) |
|
|
4,054 |
|
|
|
(32 |
) |
Argentine Peso |
|
Non-delivery forwards |
|
|
37,200 |
|
|
|
(4,968 |
) |
|
|
— |
|
|
|
— |
|
Nigerian Naira |
|
Non-delivery forwards |
|
|
2,000 |
|
|
|
(33 |
) |
|
|
— |
|
|
|
— |
|
Egyptian Pound |
|
Non-delivery forwards |
|
|
8,965 |
|
|
|
(96 |
) |
|
|
— |
|
|
|
— |
|
Sell EUR |
|
|
|
|
|
|
|
|
|
|
|
|
|
|
||||
Moroccan Dirham |
|
Forward |
|
|
— |
|
|
|
— |
|
|
|
(3,274 |
) |
|
|
(28 |
) |
US Dollar |
|
Non-delivery forwards |
|
|
— |
|
|
|
— |
|
|
|
(6,323 |
) |
|
|
(40 |
) |
Sell USD |
|
|
|
|
|
|
|
|
|
|
|
|
|
|
||||
Indian Rupee |
|
Non-delivery forwards |
|
|
— |
|
|
|
— |
|
|
|
(950 |
) |
|
|
(1 |
) |
South African Rand |
|
Forward |
|
|
(6,654 |
) |
|
|
(104 |
) |
|
|
— |
|
|
|
— |
|
South African Rand |
|
Futures Contract |
|
|
(6,662 |
) |
|
|
(116 |
) |
|
|
— |
|
|
|
— |
|
Total |
|
|
|
|
|
|
|
(6,227 |
) |
|
|
|
|
|
(948 |
) |
||
|
|
|
|
|
|
2024 |
|
2023 |
|
2022 |
Net gain on foreign currency forwards recognized in ‘Costs of Services’ (Note 6) |
|
|
|
|
|
13,461 |
|
17,433 |
|
14,559 |
Net loss on foreign currency forwards recognized in ‘Finance Costs’ (Note 11) |
|
|
|
|
|
(19,462) |
|
(28,013) |
|
(18,763) |
(i) Classification of derivatives
51
Derivatives are financial instruments entered into only for economic hedging purposes and not contracted as speculative investments. However, where derivatives do not meet the hedge accounting criteria, they are classified as ‘held for trading’ for accounting purposes and are accounted for at fair value through profit or loss. The full fair value of hedging derivatives is classified as a non-current asset or liability when the remaining maturity of the hedged item is more than 12 months, otherwise they are classified as a current asset or liability. Derivatives held for trading are classified as a current asset or liability.
52
The Group has been associated with civil and labor lawsuits that present potential loss risk. Provisions for losses arising from these lawsuits and potential labor contingencies are recognized when management, based on assessments by the Group’s legal advisors, determines that an outflow of resources is more likely than not required to settle the obligation and that a reliable estimate of the amount can be made.
As of December 31, 2024, the total amount recognized for existing contingencies classified as probable by the Group, as evaluated by its legal advisors, is USD 500 thousands. This amount includes provisions for labor contractor claims and civil claims.
Movements in Labor provisions are set out below:
|
|
2024 |
|
|
2023 |
|
||
Carrying amount as of January 1 |
|
|
362 |
|
|
|
1,473 |
|
Reversal |
|
|
(92 |
) |
|
|
(1,150 |
) |
Interest charges |
|
|
11 |
|
|
|
39 |
|
Additions |
|
|
219 |
|
|
|
— |
|
Carrying amount as of December 31 |
|
|
500 |
|
|
|
362 |
|
(c) Other legal matters
On February 23 and February 28, 2023, respectively, the Company was named, along with several of its senior executives and/or directors, as defendants in certain putative class action lawsuits filed in the Supreme Court of the State of New York, New York County, asserting claims under Sections 11, 12, and 15 of the Securities Act of 1933, based in significant part on the short-seller report. These matters, Zappia et al. v. DLocal Limited et al., Index No. 151778/2023 (Sup. Ct. N.Y. Cty.), and Hunt et al. v. DLocal Limited et al., Index No. 651058/2023 (Sup. Ct. N.Y. Cty.), or the Zappia and Hunt Actions, allege, among other things, that the registration statement for the Company’s June 2021 initial public offering reflected certain material misstatements or omissions.
On March 3, 2023, plaintiffs in the two actions filed a stipulation and proposed order consolidating the cases and appointing putative lead counsel. The parties also agreed to a schedule for plaintiffs’ filing of an amended complaint and a subsequent briefing schedule for a motion to dismiss the amended complaint.
On May 12, 2023, plaintiffs in the Zappia and Hunt Actions jointly filed a consolidated amended complaint. On July 11, 2023, the Company filed a motion to dismiss the complaint. Plaintiffs filed their opposition brief on August 15, 2023, and the Company filed a reply in further support of its motion to dismiss on September 22, 2023. The Company’s motion to dismiss is now fully briefed, and, on February 29, 2024, the court presided over oral argument on the motion. The court has not yet issued a decision on the motion, and no other proceedings are currently ongoing or scheduled.
The Company has also been named, along with several of its senior executives and/or directors, in a putative class action lawsuit filed in the U.S. District Court for the Eastern District of New York, asserting claims under Sections 11 and 15 of the Securities Act and Sections 10(b) and 20(a) of the Securities Exchange Act of 1934, as well as Rule 10b-5 promulgated thereunder. This lawsuit, captioned Laurenzi v. dLocal Ltd., et al., 1:23-cv-07501 (E.D.N.Y.) (Laurenzi Action), was initiated on October 6, 2023. On January 4, 2024, the Court appointed a Lead Plaintiff. On March 18, 2024, Lead Plaintiff filed an amended class action complaint. The amended complaint alleges misstatements and omissions in the registration statement for the Company’s June 2021 initial public offering and in various public filings and press releases during the period of June 2, 2021 through June 5, 2023. Pursuant to a schedule agreed upon with Lead Plaintiff’s counsel, the Company filed on April 30, 2024, a letter, as required by court rules, requesting a pre-motion conference regarding an anticipated motion to dismiss the Laurenzi Action in full. Lead Plaintiff responded to that letter on May 14, 2024. On June 10, 2024, the court held the requested preliminary conference and set a schedule for briefing on the Company’s motion to dismiss. The Company served its opening brief on August 9, 2024, Lead Plaintiff served an opposition on October 11, 2024 ,and the Company served its reply on November 8, 2024. The court has not yet indicated whether it will hear oral argument on the Company’s motion, and no other proceedings are currently ongoing or scheduled.
Due to the preliminary posture of the above-described lawsuits as of the date of issuance of these consolidated financial statements, the Company’s management and its legal advisors are unable to evaluate the likelihood of an adverse outcome or estimate a range of potential losses and no provision for contingencies have been recorded for the aforementioned matters. DLocal Limited intends to defend itself vigorously in these actions. As of the date of issuance of the Company’s consolidated financial statements there were no further updates in this regard.
Argentina is subject to extensive foreign exchange regulations, which were revised as recently as December 2023. We regularly consult with our legal advisors in Argentina regarding the applicability of these regulations to our operations. Additionally, in 2023, certain administrative and judicial inquiries were initiated concerning our Argentinian subsidiary, dLocal Argentina S.A. These inquiries do not seek penalties at this stage. Based on consultations with our legal advisors, we believe our activities comply with applicable laws and regulations, including foreign exchange and tax regulations. As of the date of this filing, no new developments have emerged in 2024 regarding these matters.
54
As of December 31, 2024 and 2023, the Group had no outstanding contingent assets or liabilities, except for the labor contingencies detailed in Note 25: Provisions.
As of December 31, 2024 the Group had USD 6,966 (USD 11,635 as of December 31, 2023) of its own funds and investments held in escrow and guarantees required by processors, credit cards and merchants, included within the line item “Other assets”.
When certain criteria are met, financial assets and liabilities are offset and presented on a net basis in the Consolidated Statement of Financial Position. Amounts presented in the Consolidated Statement of Financial Position are offset when the Group currently has a legally enforceable right to offset the recognized amounts, and the Group intends to settle the asset and liability on a net basis or has the ability to realize the asset and settle the liability simultaneously.
The following table presents the recognized financial instruments that are offset as at December 31, 2024 and 2023:
|
|
Effects of offsetting on the Consolidated |
|
|||||||||
|
|
Statements of Financial Position |
|
|||||||||
|
|
|
|
|
Gross amounts |
|
|
Net amounts |
|
|||
2024 |
|
Gross amounts |
|
|
set off |
|
|
presented |
|
|||
Financial assets |
|
USD |
|
|
USD |
|
|
USD |
|
|||
Cash and cash equivalents |
|
|
425,172 |
|
|
|
— |
|
|
|
425,172 |
|
Financial assets at FVPL |
|
|
129,319 |
|
|
|
— |
|
|
|
129,319 |
|
Trade and other receivables |
|
|
504,529 |
|
|
|
(7,816 |
) |
|
|
496,713 |
|
Derivative financial instruments |
|
|
2,874 |
|
|
|
— |
|
|
|
2,874 |
|
Other assets |
|
|
18,805 |
|
|
|
— |
|
|
|
18,805 |
|
Total |
|
|
1,080,699 |
|
|
|
(7,816 |
) |
|
|
1,072,883 |
|
Financial liabilities |
|
|
|
|
|
|
|
|
|
|||
Trade and other payables |
|
|
614,762 |
|
|
|
(16,975 |
) |
|
|
597,787 |
|
Lease Liabilities |
|
|
4,000 |
|
|
|
— |
|
|
|
4,000 |
|
Derivative financial instruments |
|
|
6,227 |
|
|
|
— |
|
|
|
6,227 |
|
Financial liabilities |
|
|
50,455 |
|
|
|
— |
|
|
|
50,455 |
|
Total |
|
|
675,444 |
|
|
|
(16,975 |
) |
|
|
658,469 |
|
|
|
|
|
|
|
|
|
|
|
|||
|
|
|
|
|
Gross amounts |
|
|
Net amounts |
|
|||
2023 |
|
Gross amounts |
|
|
set off |
|
|
presented |
|
|||
Financial assets |
|
USD |
|
|
USD |
|
|
USD |
|
|||
Cash and cash equivalents |
|
|
536,160 |
|
|
|
— |
|
|
|
536,160 |
|
Financial assets at FVPL |
|
|
104,387 |
|
|
|
— |
|
|
|
104,387 |
|
Trade and other receivables |
|
|
385,237 |
|
|
|
(21,863 |
) |
|
|
363,374 |
|
Derivative financial instruments |
|
|
2,040 |
|
|
|
— |
|
|
|
2,040 |
|
Other assets |
|
|
11,782 |
|
|
|
— |
|
|
|
11,782 |
|
Total |
|
|
1,039,606 |
|
|
|
(21,863 |
) |
|
|
1,017,743 |
|
Financial liabilities |
|
|
|
|
|
|
|
|
|
|||
Trade and other payables |
|
|
624,356 |
|
|
|
(21,863 |
) |
|
|
602,493 |
|
Lease Liabilities |
|
|
3,957 |
|
|
|
— |
|
|
|
3,957 |
|
Derivative financial instruments |
|
|
948 |
|
|
|
— |
|
|
|
948 |
|
Total |
|
|
629,261 |
|
|
|
(21,863 |
) |
|
|
607,398 |
|
The gross amount of assets and liabilities that have been offset and presented above primarily relate to trade receivables resulting from fees earned from merchants that are offset against liabilities to merchants. The Group determined these balances meet the IFRS 7 offsetting requirements since an enforceable legal right to offset the balances exists, and the Group intends to settle such transactions on a net basis. No arrangements with merchants that provide the Group with the right to offset exist where the offsetting criteria have not been met.
In June 2023, Dlocal Argentina S.A. entered into a loan agreement with Dlocal Group for a total amount of USD 100,000, which currently matures in August 2025. In August 2024, Dlocal Argentina S.A. partially repaid the intra-group loan by transferring approximately USD 69,100 worth of Argentine government bonds, as detailed in note 1.2 (b) and note 16, to the subsidiary in Malta. In October 2024, Dlocal Argentina S.A. made an additional repayment of USD 5,000, reducing the outstanding loan balance. Since both subsidiaries are fully consolidated, the outstanding balances have been eliminated. The primary impact on the consolidated financial statements relates to foreign exchange losses incurred by Dlocal Argentina S.A. For further detail refer to Note 11: Other Results.
Key Management compensation
The Group’s Executive Team and Director compensation was as follows:
|
|
2024 |
|
|
2023 |
|
|
2022 |
|
|||
Short-term employee benefits – Salaries and wages |
|
|
3,529 |
|
|
|
2,177 |
|
|
|
1,767 |
|
Long-term employee benefits – Share-based payment |
|
|
16,222 |
|
|
|
6,822 |
|
|
|
3,351 |
|
|
|
|
19,751 |
|
|
|
8,999 |
|
|
|
5,118 |
|
The following transactions occurred with related parties:
|
|
2024 |
|
|
2023 |
|
|
2022 |
|
|||
Transactions with merchants – Revenues |
|
|
271 |
|
|
|
1,494 |
|
|
|
1,158 |
|
Transactions with preferred suppliers (Collection entities) – Costs |
|
|
(911 |
) |
|
|
(53 |
) |
|
|
(621 |
) |
Transactions with other related parties – Financial expenses (item (a)) (1) |
|
|
(22,602 |
) |
|
|
(81,024 |
) |
|
|
— |
|
(1) Foreign exchange losses not eliminated on the consolidated financial statements, refer to the note 11.
The following balances are outstanding at the end of the reporting year in relation to transactions with related parties:
|
|
2024 |
|
|
2023 |
|
|
||
Balances with merchants – trade receivables |
|
|
— |
|
|
|
406 |
|
|
Balances with preferred suppliers (Collection entities) – trade payables |
|
|
(429 |
) |
|
|
(19 |
) |
|
Balances with preferred suppliers (Collection entities) – trade receivables |
|
|
6,853 |
|
|
|
— |
|
|
All transactions with related parties were made on normal commercial terms and conditions and at market rates. Outstanding balances are unsecured and are repayable in cash.
Set out below are summaries of RSUs, PSUs and stock option for 2024 and 2023:
|
|
2024 |
|
|
2023 |
|
||||||||||
|
|
Average |
|
|
|
|
|
Average |
|
|
|
|
||||
|
|
exercise price |
|
|
Number of |
|
|
exercise price |
|
|
Number of |
|
||||
|
|
(U.S. Dollars) |
|
|
options and RSUs and PSUs |
|
|
(U.S. Dollars) |
|
|
options and RSUs |
|
||||
At the beginning of the year |
|
|
6.86 |
|
|
|
6,962,302 |
|
|
|
8.30 |
|
|
|
3,534,561 |
|
Granted during the year |
|
|
1.76 |
|
|
|
2,446,559 |
|
|
|
5.53 |
|
|
|
4,340,239 |
|
Exercised during the year |
|
|
0.50 |
|
|
|
(1,067,176 |
) |
|
|
2.25 |
|
|
|
(663,897 |
) |
Cancelled during the year |
|
|
0.00 |
|
|
|
(4,158 |
) |
|
|
— |
|
|
|
— |
|
Forfeited during the year |
|
|
13.96 |
|
|
|
(829,686 |
) |
|
|
14.06 |
|
|
|
(248,601 |
) |
At the end of the year |
|
|
5.32 |
|
|
|
7,507,841 |
|
|
|
6.86 |
|
|
|
6,962,302 |
|
Vested and exercisable at the end of the year |
|
|
8.73 |
|
|
|
1,167,552 |
|
|
|
7.03 |
|
|
|
704,006 |
|
No options expired during the periods covered in the above table.
As of December 31, 2024, the Group has 180,000 PSUs (2023 - 200,000), 4,546,071 RSUs (2023 - 3,397,042), and 2,781,770 Stock Options (2023 - 3,365,260) outstanding.
As of December 31, 2024, total compensation expense of the plans was USD 23,780 (2023 - USD 11,922).
Fair value of shares granted
dLocal estimates share-based payment transactions and warrant agreements using the most appropriate valuation model and underlying assumptions, which depend on the terms and conditions of the grant and the information available at the grant date.
The Group uses certain methodologies to estimate fair value of the options and warrants granted which include the following:
These estimates also require determination of the most appropriate inputs to the valuation models including assumptions regarding the expected life of a share option and warrants and expected volatility of the price of the Group’s shares.The expected price volatility is based on the historic volatility (based on the remaining life of the options), adjusted for any expected changes to future volatility based on publicly available information.
The Group’s activities may expose it to a variety of financial risks, including credit risk, market risk (including foreign exchange risk, cash flow or fair value interest rate risk, and equity price risk), liquidity risk and fraud risk. The Group’s overall risk management program focuses on the unpredictability of financial markets and seeks to minimize potential adverse effects on the Group’s financial performance.
The Board of Directors (the “Board”) has overall responsibility for the establishment and oversight of the Group’s risk management objectives and policies.
The Group’s risk management policies are established to identify and analyze the risks faced by the Group, to set appropriate risk limits and controls, and to monitor risks and adherence to limits. Risk management policies and systems are reviewed regularly to reflect changes in market conditions and the Group’s activities. The overall objective of the Board is to set policies that seek to reduce risk as much as possible without unduly affecting the Group’s competitiveness and flexibility. Further details of these policies are set out below.
Credit risk is the risk that a merchant or a counterparty will not meet its obligations under a financial instrument or customer contract, leading to a financial loss. Credit risk arises from the group’s exposures to third parties, including cash and cash equivalents and financial instruments and from its operating activities, primarily related to trade and other receivables.
The carrying amount of financial assets represents the Group’s maximum credit exposure:
|
|
2024 |
|
|
2023 |
|
||
Cash and Cash Equivalents |
|
|
425,172 |
|
|
|
536,160 |
|
Financial Assets at Fair Value through Profit or Loss |
|
|
129,319 |
|
|
|
104,387 |
|
Trade and Other Receivables |
|
|
496,713 |
|
|
|
363,374 |
|
Derivative Financial Instrument |
|
|
2,874 |
|
|
|
2,040 |
|
Other Assets |
|
|
18,805 |
|
|
|
11,782 |
|
|
|
|
1,072,883 |
|
|
|
1,017,743 |
|
The table below discloses the external credit risk ratings for the Group’s current Trade and Other Receivables, based on the geographical regions in which the Trade and Other Receivables are held:
|
|
2024 |
|
|
2023 |
|
||||||||||
Risk rating |
|
Expected loss rate |
|
|
Amounts |
|
|
Expected loss rate |
|
|
Amounts |
|
||||
A |
|
|
0.02 |
% |
|
|
24,896 |
|
|
|
0.05 |
% |
|
|
42,618 |
|
AA |
|
|
0.01 |
% |
|
|
935 |
|
|
|
0.03 |
% |
|
|
392 |
|
AAA |
|
|
0.00 |
% |
|
|
14,846 |
|
|
|
0.00 |
% |
|
|
7,319 |
|
B |
|
|
0.05 |
% |
|
|
32,167 |
|
|
|
0.13 |
% |
|
|
24,345 |
|
BB |
|
|
0.04 |
% |
|
|
182,475 |
|
|
|
0.10 |
% |
|
|
172,833 |
|
BBB |
|
|
0.03 |
% |
|
|
161,433 |
|
|
|
0.08 |
% |
|
|
89,047 |
|
C |
|
|
0.08 |
% |
|
|
2,072 |
|
|
|
0.21 |
% |
|
|
279 |
|
CC |
|
|
0.07 |
% |
|
|
64,920 |
|
|
|
0.18 |
% |
|
|
11,251 |
|
CCC |
|
|
0.06 |
% |
|
|
12,969 |
|
|
|
0.16 |
% |
|
|
15,290 |
|
|
|
|
|
|
|
496,713 |
|
|
|
|
|
|
363,374 |
|
||
Financial Assets at Fair Value through profit or loss and cash and cash equivalents
Credit risk from balances with financial institutions and other third parties are managed in accordance with the Group’s policy. Financial assets consist of debt securities and other financial instruments with financial institutions that expose the Group to an acceptable level of credit risk.
Trade and Other Receivables
The Company serves high-quality merchant processors, thereby mitigating credit risk. The Group is not exposed to significant concentrations of credit risk based on customers, industries, sectors and/or geographic regions.
The Group applies the IFRS 9’s simplified approach to measuring expected credit losses, which uses a lifetime expected loss allowance model for all trade and other receivables. To measure expected credit losses, trade and other receivables were grouped based on shared credit risk characteristics and tenor. Historical loss experience was also considered and has been adjusted to reflect information about current conditions and reasonable and bearable forecasts of future economic conditions.
The Group’s expected loss rates are based on the payment profiles of its merchant customers, the country where the receivable balance was originated, and historical credit losses experienced. Historical loss rates are adjusted to reflect current and forward-looking information on macroeconomic factors affecting the ability of the Group’s merchant customers to settle the receivables. The Group has identified the credit rating of the countries in which it sells its services to be the most relevant factor, and adjusts the historical loss rates based on expected changes in credit ratings.
Market risk is the risk that the fair value or future cash flows of a financial instrument will fluctuate because of changes in market prices. For the Group, market risk may comprise interest rate risk and foreign currency risk and other price risk.
The objective of market risk management is to manage and control market risk exposures within acceptable parameters, while optimizing the return.
Interest Rate Risk
Interest rate risk arises from the possibility of the Group incurring losses due to fluctuations in interest rates, and by extension, future cash flows, of a financial instrument. The Group’s cash flows are not exposed to interest rate risk since there are no financial instruments held are subject to variable interest rates.
Other price risk
The primary goal of the Group’s investment in debt securities is to hold such investments for short and long-term strategic purposes. Certain investments are designated as at FVPL because their performance is actively monitored and they are managed on a fair value basis.
Sensitivity analysis - Other price risk
The Group’s investments in debt securities are mainly listed on the Argentinian Stock Exchange (Bolsas y Mercados Argentinos - BYMA). For the investments classified as FVPL, the impact of a 10%, increase in the market price at the reporting date on profit or loss would have been an increase of USD 12,931 after tax. An equal change in the opposite direction would have decreased profit or loss by USD 12,931 after tax.
Foreign Currency Risk
The Group has significant operations internationally that are denominated in foreign currencies, primarily on emerging markets, subjecting the Group to foreign currency risk, which may impact the financial results. The Group transact business in various foreign companies and have significant international revenues and costs. The Group cash flows, results of operations and certain of our intercompany balances that are exposed to foreign exchange rate fluctuations may differ from expectations and it may record gain or losses due to foreign currency fluctuations.
As of December 31, 2024 and 2023 the Group is exposed to foreign currency risk on monetary amounts denominated in a currency other than the functional currency of the respective subsidiaries, which is mainly comprised by cash and cash equivalents, trade receivables and trade payables in the service providers in Latin America, Asia and Africa. The following table presents the top five currencies net balances:
60
2024 |
|
|
|
|
|
(Gain)/loss |
||||||
Account |
|
Currency |
|
Amount |
|
% increase |
|
Amount |
|
% decrease |
|
Amount |
Total net (assets)/liabilities |
|
Argentine peso |
|
19,213 |
|
10% |
|
(1,921) |
|
-10% |
|
1,921 |
|
|
Brazilian real |
|
34,509 |
|
10% |
|
(3,451) |
|
-10% |
|
3,451 |
|
|
Colombian peso |
|
19,761 |
|
10% |
|
(1,976) |
|
-10% |
|
1,976 |
|
|
Mexican peso |
|
47,423 |
|
10% |
|
(4,742) |
|
-10% |
|
4,742 |
|
|
Nigerian naira |
|
(23,939) |
|
10% |
|
2,394 |
|
-10% |
|
(2,394) |
|
|
Total |
|
96,967 |
|
|
|
(9,696) |
|
|
|
9,696 |
2023 |
|
|
|
|
|
(Gain)/loss |
||||||
Account |
|
Currency |
|
Amount |
|
% increase |
|
Amount |
|
% decrease |
|
Amount |
Total net (assets)/liabilities |
|
Mexican peso |
|
39,825 |
|
10% |
|
(3,983) |
|
-10% |
|
3,983 |
|
|
Brazilian real |
|
29,145 |
|
10% |
|
(2,915) |
|
-10% |
|
2,915 |
|
|
Argentine peso |
|
12,769 |
|
10% |
|
(1,276) |
|
-10% |
|
1,276 |
|
|
Saudi riyal |
|
10,966 |
|
10% |
|
(1,097) |
|
-10% |
|
1,097 |
|
|
South African rand |
|
9,107 |
|
10% |
|
(911) |
|
-10% |
|
911 |
|
|
Total |
|
101,813 |
|
|
|
(10,182) |
|
|
|
10,182 |
Exposure is presented in thousands of U.S. Dollars. As discussed in Note 24: Derivative financial instruments, the Company entered into foreign currency exchange forward contracts to mitigate this risk and reduce the economic and financial statement impact.
Liquidity risk is the risk that the Group encounters difficulty in meeting the obligations associated with its financial liabilities that are settled by delivering cash or another financial asset. The Group’s approach to managing liquidity is to ensure, as far as possible, that it will always have sufficient liquidity to meet its liabilities when due, under both normal and stressed conditions, without incurring unacceptable losses or risking damage to the Group’s reputation.
The Group invests surplus cash in interest-bearing financial investments, choosing instruments with appropriate maturity or enough liquidity to provide adequate margin as determined by the forecasts.
Exposure to Liquidity Risk
The tables below classify the Group’s financial liabilities based on their contractual maturities.
Amounts disclosed reflect contractual undiscounted cash flows. Balances due within 12 months equal their carrying balances as the impact of discounting is not significant.
Contractual maturities of financial liabilities 31 December, 2024 |
|
Less than 6 |
|
|
6-12 months |
|
|
Between 1 and |
|
|
More than 2 years |
|
|
Total |
|
|
Carrying |
|
||||||
Non-derivatives |
|
|
|
|
|
|
|
|
|
|
|
|
|
|
|
|
|
|
||||||
Trade and other payables |
|
|
597,787 |
|
|
|
— |
|
|
|
— |
|
|
|
— |
|
|
|
597,787 |
|
|
|
597,787 |
|
Financial Liabilities |
|
|
50,455 |
|
|
|
— |
|
|
|
— |
|
|
|
— |
|
|
|
50,455 |
|
|
|
50,455 |
|
Leases liabilities |
|
|
408 |
|
|
|
410 |
|
|
|
825 |
|
|
|
3,033 |
|
|
|
4,676 |
|
|
|
4,000 |
|
Total non-derivatives |
|
|
648,650 |
|
|
|
410 |
|
|
|
825 |
|
|
|
3,033 |
|
|
|
652,918 |
|
|
|
652,242 |
|
Derivatives |
|
|
|
|
|
|
|
|
|
|
|
|
|
|
|
|
|
|
||||||
Derivative financial instruments |
|
|
6,227 |
|
|
|
— |
|
|
|
— |
|
|
|
— |
|
|
|
6,227 |
|
|
|
6,227 |
|
Total derivatives |
|
|
6,227 |
|
|
|
— |
|
|
|
— |
|
|
|
— |
|
|
|
6,227 |
|
|
|
6,227 |
|
Contractual maturities of financial liabilities 31 December, 2023 |
|
Less than 6 |
|
|
6-12 months |
|
|
Between 1 and |
|
|
More than 2 years |
|
|
Total |
|
|
Carrying |
|
||||||
Non-derivatives |
|
|
|
|
|
|
|
|
|
|
|
|
|
|
|
|
|
|
||||||
Trade and other payables |
|
|
602,493 |
|
|
|
— |
|
|
|
— |
|
|
|
— |
|
|
|
602,493 |
|
|
|
602,493 |
|
Leases liabilities |
|
|
217 |
|
|
|
409 |
|
|
|
584 |
|
|
|
3,017 |
|
|
|
4,227 |
|
|
|
3,957 |
|
Total non-derivatives |
|
|
602,710 |
|
|
|
409 |
|
|
|
584 |
|
|
|
3,017 |
|
|
|
606,720 |
|
|
|
606,450 |
|
Derivatives |
|
|
|
|
|
|
|
|
|
|
|
|
|
|
|
|
|
|
||||||
Derivative financial instruments |
|
|
948 |
|
|
|
— |
|
|
|
— |
|
|
|
— |
|
|
|
948 |
|
|
|
948 |
|
Total derivatives |
|
|
948 |
|
|
|
— |
|
|
|
— |
|
|
|
— |
|
|
|
948 |
|
|
|
948 |
|
61
The Group’s transactions are susceptible to a fraudulent or improper sale and processes are used to mitigate fraud risk. Such processes rely on ‘dLocal Defense’, a local data-driven prevention program designed to maximize fraud detection and minimize false positives. This process reviews and validates transactions at the time of authorization using external tools that are reviewed on a periodic basis.
In addition, the Group has implemented an additional process to prevent fraud through chargebacks and disputes.
The Board’s policy is to maintain a strong capital base to maintain investor, creditor and market confidence, and to sustain future development of the business. The Board’s objectives are to safeguard the Group’s ability to continue as a going concern, to continue to provide returns to the Group’s shareholders, and benefit other stakeholder groups, and to maintain an optimal capital structure to reduce the Group’s cost of capital. To maintain or adjust the capital structure, the Group may adjust the amount of dividends paid to shareholders, return capital to shareholders, issue new shares or sell assets to reduce the Group’s borrowings. The Board monitors returns on capital as well as the level of dividends distributed to ordinary shareholders.
The Group monitors capital using the Net Cash/Debt. Net Cash is composed as follow:
|
|
2024 |
|
|
2023 |
|
||
Cash and cash equivalents |
|
|
425,172 |
|
|
|
536,160 |
|
Financial assets at fair value through profit or loss |
|
|
129,319 |
|
|
|
102,677 |
|
Financial liabilities |
|
|
(50,455 |
) |
|
|
— |
|
Lease liabilities |
|
|
(4,000 |
) |
|
|
(3,957 |
) |
Net Derivative financial instrument |
|
|
(3,353 |
) |
|
|
(948 |
) |
Net cash |
|
|
496,683 |
|
|
|
633,932 |
|
Cash and liquid investments |
|
|
554,491 |
|
|
|
638,837 |
|
Gross debt |
|
|
(57,808 |
) |
|
|
(4,905 |
) |
Net cash |
|
|
496,683 |
|
|
|
633,932 |
|
Additionally, as part of the requirements for maintaining its financial institution license, DLocal Limited, the Group’s licensee subsidiary, is subject to a minimum capital requirement. As of December 31, 2024 and 2023, such capital requirements were fulfilled.
62
The following tables show financial instruments recognized at fair value for the years ended December 31, 2024 and 2023. Fair values have been determined based on:
The table also includes financial instruments measured at amortized cost. The Group determined the book value of such instruments approximates their fair value.
December 31, 2024 |
|
FVPL |
|
|
Amortized |
|
|
Total |
|
|
Level 1 |
|
|
Level 2 |
|
|||||
Assets |
|
|
|
|
|
|
|
|
|
|
|
|
|
|
|
|||||
Cash and Cash Equivalents |
|
|
53,490 |
|
|
|
371,682 |
|
|
|
425,172 |
|
|
|
53,490 |
|
|
|
— |
|
Cash and Demand deposit |
|
|
— |
|
|
|
371,682 |
|
|
|
371,682 |
|
|
|
— |
|
|
|
— |
|
Money Market Fund and Others |
|
|
53,490 |
|
|
|
— |
|
|
|
53,490 |
|
|
|
53,490 |
|
|
|
— |
|
Financial Assets at Fair Value through Profit or Loss |
|
|
129,319 |
|
|
|
— |
|
|
|
129,319 |
|
|
|
129,319 |
|
|
|
— |
|
Other Assets |
|
|
16,314 |
|
|
|
7,186 |
|
|
|
23,500 |
|
|
|
— |
|
|
|
16,314 |
|
Trade and Other Receivables |
|
|
— |
|
|
|
514,757 |
|
|
|
514,757 |
|
|
|
— |
|
|
|
— |
|
Derivative financial instruments (1) |
|
|
2,874 |
|
|
|
— |
|
|
|
2,874 |
|
|
|
— |
|
|
|
2,874 |
|
|
|
|
201,997 |
|
|
|
893,625 |
|
|
|
1,095,622 |
|
|
|
182,809 |
|
|
|
19,188 |
|
December 31, 2024 |
|
FVPL |
|
|
Amortized |
|
|
Total |
|
|
Level 1 |
|
|
Level 2 |
|
|||||
Liabilities |
|
|
|
|
|
|
|
|
|
|
|
|
|
|
|
|||||
Trade and Other Payables |
|
|
— |
|
|
|
(597,787 |
) |
|
|
(597,787 |
) |
|
|
— |
|
|
|
— |
|
Derivative financial instruments (1) |
|
|
(6,227 |
) |
|
|
— |
|
|
|
(6,227 |
) |
|
|
— |
|
|
|
(6,227 |
) |
Finance liability |
|
|
— |
|
|
|
(50,455 |
) |
|
|
(50,455 |
) |
|
|
— |
|
|
|
— |
|
Lease Liabilities |
|
|
— |
|
|
|
(4,000 |
) |
|
|
(4,000 |
) |
|
|
— |
|
|
|
— |
|
|
|
|
(6,227 |
) |
|
|
(652,242 |
) |
|
|
(658,469 |
) |
|
|
— |
|
|
|
(6,227 |
) |
December 31, 2023 |
|
FVPL |
|
|
Amortized |
|
|
Total |
|
|
Level 1 |
|
|
Level 2 |
|
|||||
Assets |
|
|
|
|
|
|
|
|
|
|
|
|
|
|
|
|||||
Cash and Cash Equivalents |
|
|
— |
|
|
|
536,160 |
|
|
|
536,160 |
|
|
|
— |
|
|
|
— |
|
Financial Assets at Fair Value through Profit or Loss |
|
|
104,387 |
|
|
|
— |
|
|
|
104,387 |
|
|
|
104,387 |
|
|
|
— |
|
Other Assets |
|
|
— |
|
|
|
11,782 |
|
|
|
11,782 |
|
|
|
— |
|
|
|
— |
|
Trade and Other Receivables |
|
|
— |
|
|
|
363,374 |
|
|
|
363,374 |
|
|
|
— |
|
|
|
— |
|
Derivative financial instruments (1) |
|
|
2,040 |
|
|
|
— |
|
|
|
2,040 |
|
|
|
— |
|
|
|
2,040 |
|
|
|
|
106,427 |
|
|
|
911,316 |
|
|
|
1,017,743 |
|
|
|
104,387 |
|
|
|
2,040 |
|
December 31, 2023 |
|
FVPL |
|
|
Amortized |
|
|
Total |
|
|
Level 1 |
|
|
Level 2 |
|
|||||
Liabilities |
|
|
|
|
|
|
|
|
|
|
|
|
|
|
|
|||||
Trade and Other Payables |
|
|
— |
|
|
|
(602,493 |
) |
|
|
(602,493 |
) |
|
|
— |
|
|
|
— |
|
Derivative financial instruments (1) |
|
|
(948 |
) |
|
|
— |
|
|
|
(948 |
) |
|
|
— |
|
|
|
(948 |
) |
Lease Liabilities |
|
|
— |
|
|
|
(3,957 |
) |
|
|
(3,957 |
) |
|
|
— |
|
|
|
— |
|
|
|
|
(948 |
) |
|
|
(606,450 |
) |
|
|
(607,398 |
) |
|
|
— |
|
|
|
(948 |
) |
(1) The most frequently applied valuation techniques include forward pricing models. The models incorporate various inputs including: foreign exchange spot, interest rates curves of the respective currencies and the terms of the contract.
There was no transfer of items between Level 2 and Level 3, acquisitions, disposals or gains or losses recognized in profit for the period related to Level 3 instruments occurred. Consequently, as of December 31, 2024 and 2023, the Group did not recognize any financial assets under Level 3.
Exhibit 99.3

Exhibit 99.3

Exhibit 99.3

Exhibit 99.3

Exhibit 99.3

Exhibit 99.3

Exhibit 99.3

Exhibit 99.3

Exhibit 99.3

Exhibit 99.3

Exhibit 99.3

Exhibit 99.3

Exhibit 99.3

Exhibit 99.3
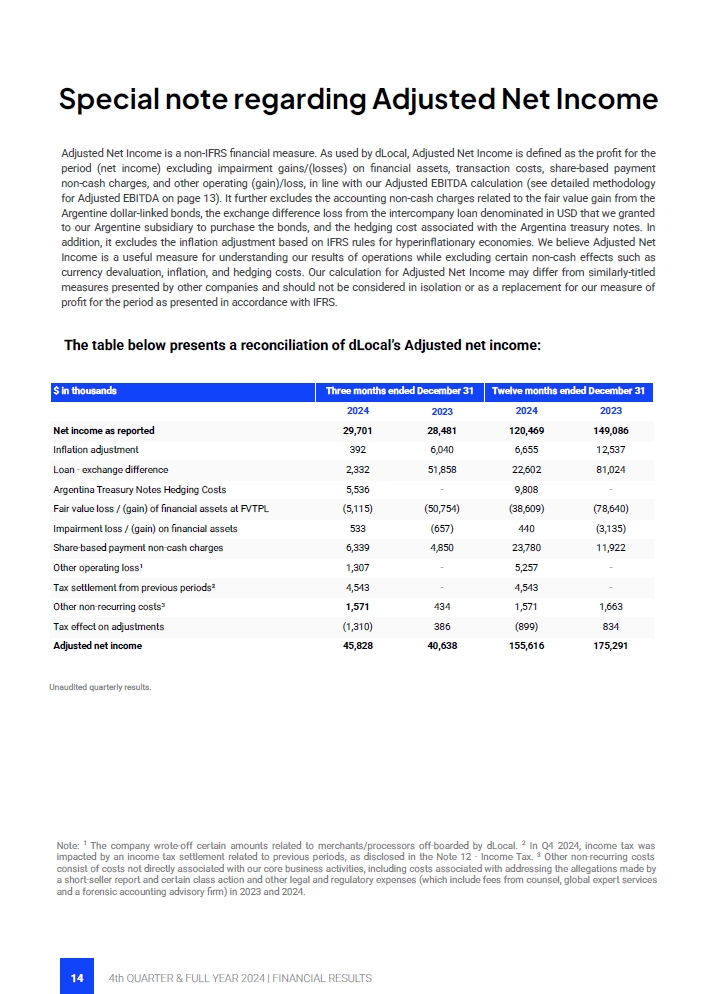
Exhibit 99.3

Exhibit 99.3

Exhibit 99.3

Exhibit 99.3

Exhibit 99.3
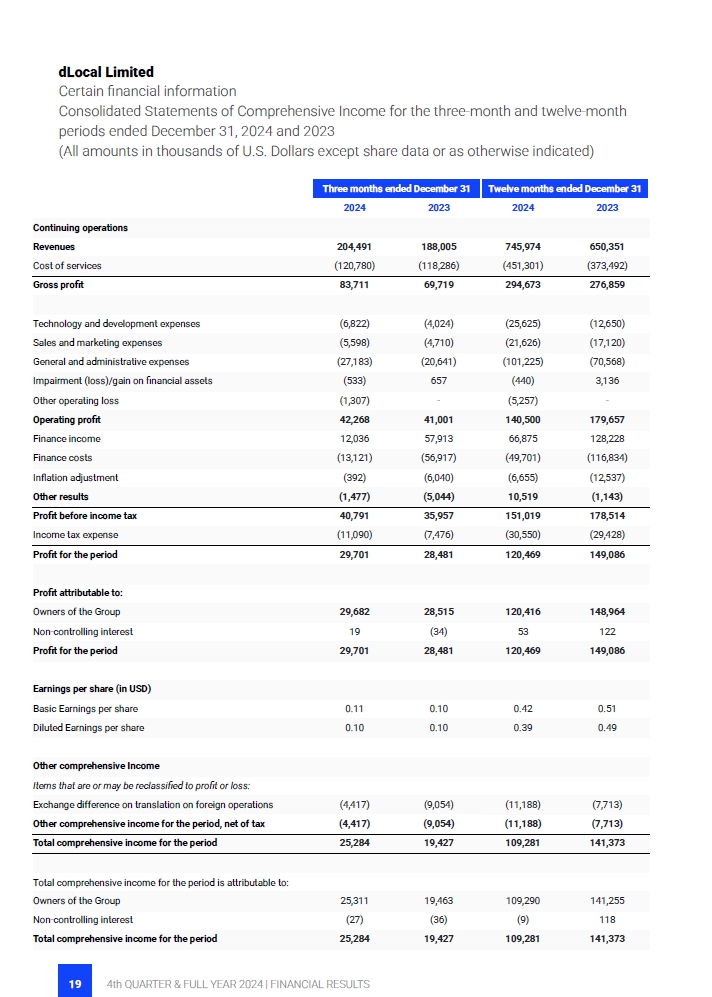
Exhibit 99.3
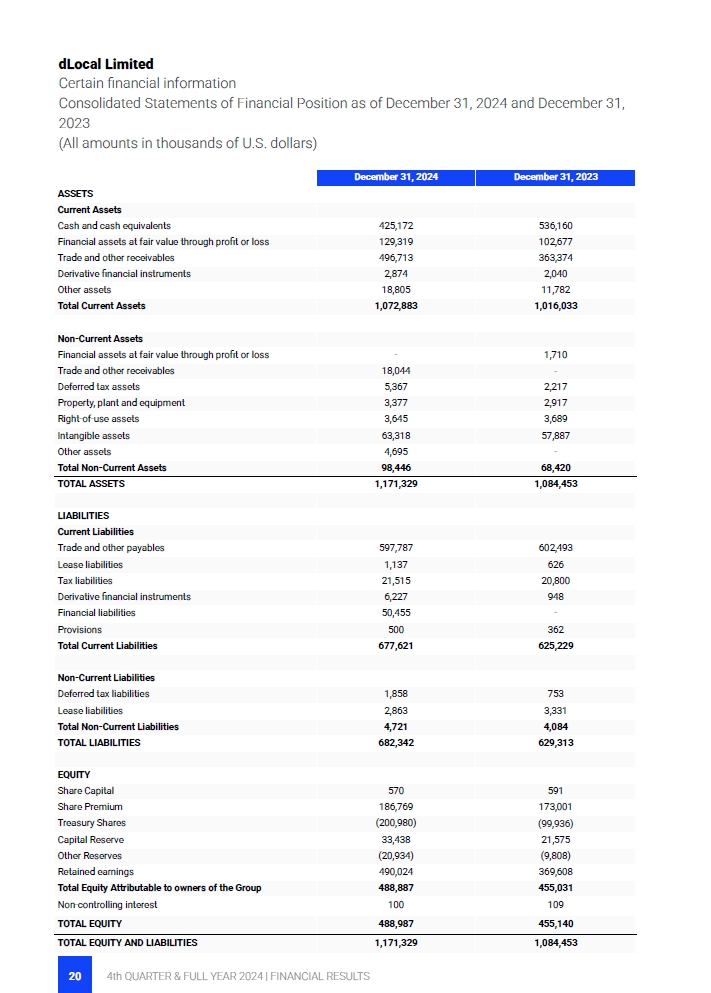
Exhibit 99.3

Exhibit 99.3

Exhibit 99.3

Exhibit 99.4

Exhibit 99.4

Exhibit 99.4

Exhibit 99.4

Exhibit 99.4

Exhibit 99.4

Exhibit 99.4
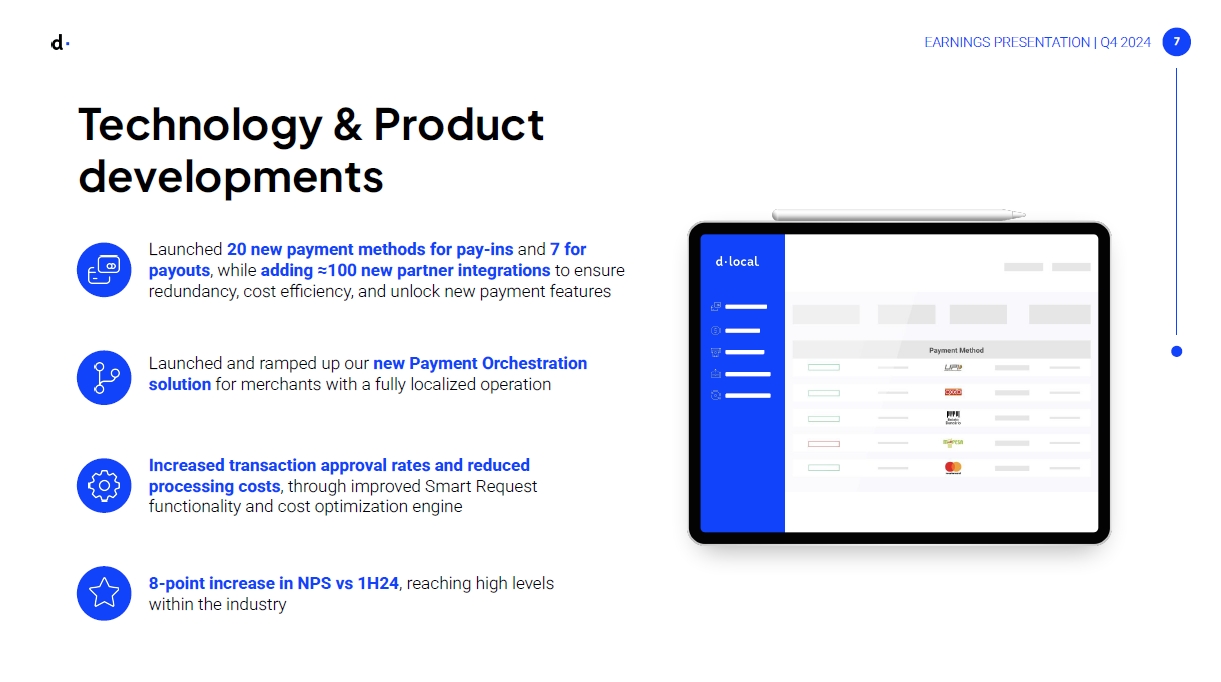
Exhibit 99.4

Exhibit 99.4

Exhibit 99.4

Exhibit 99.4

Exhibit 99.4
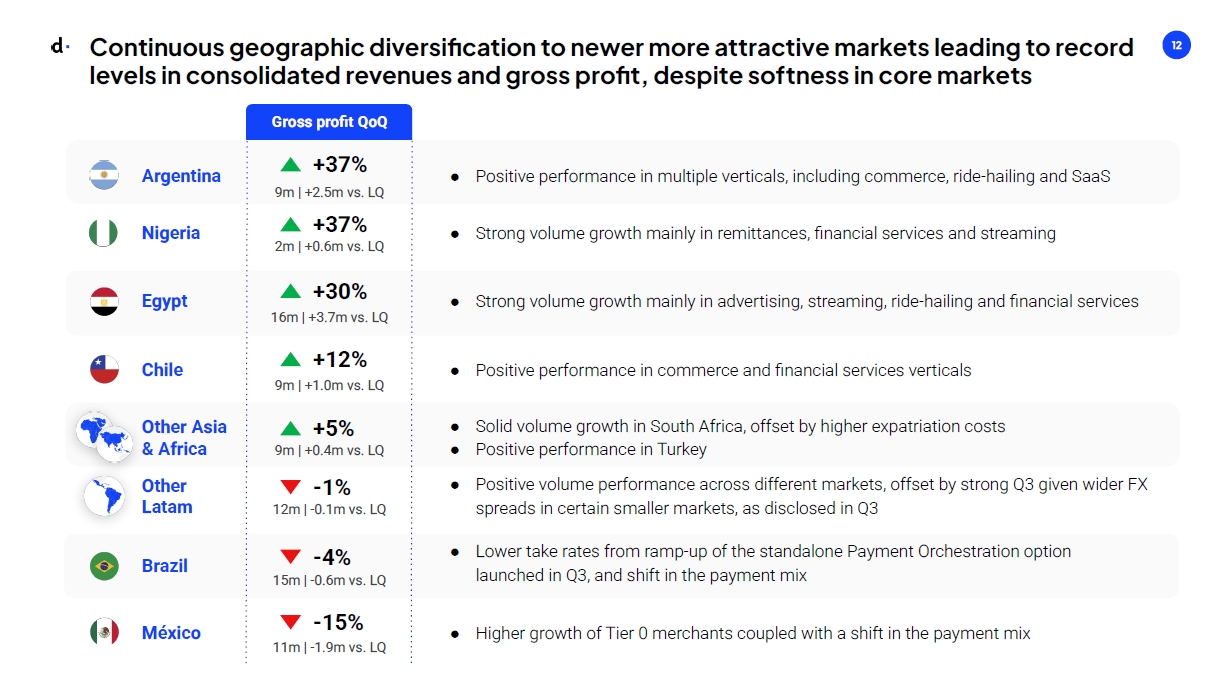
Exhibit 99.4

Exhibit 99.4

Exhibit 99.4

Exhibit 99.4

Exhibit 99.4
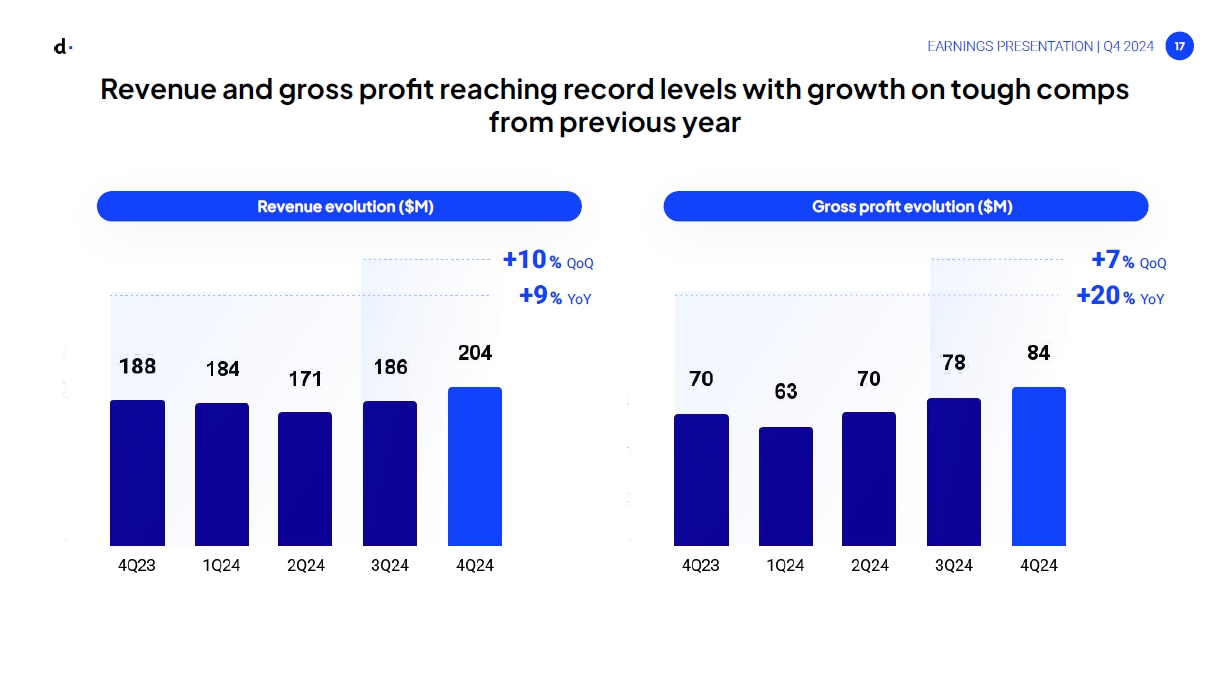
Exhibit 99.4
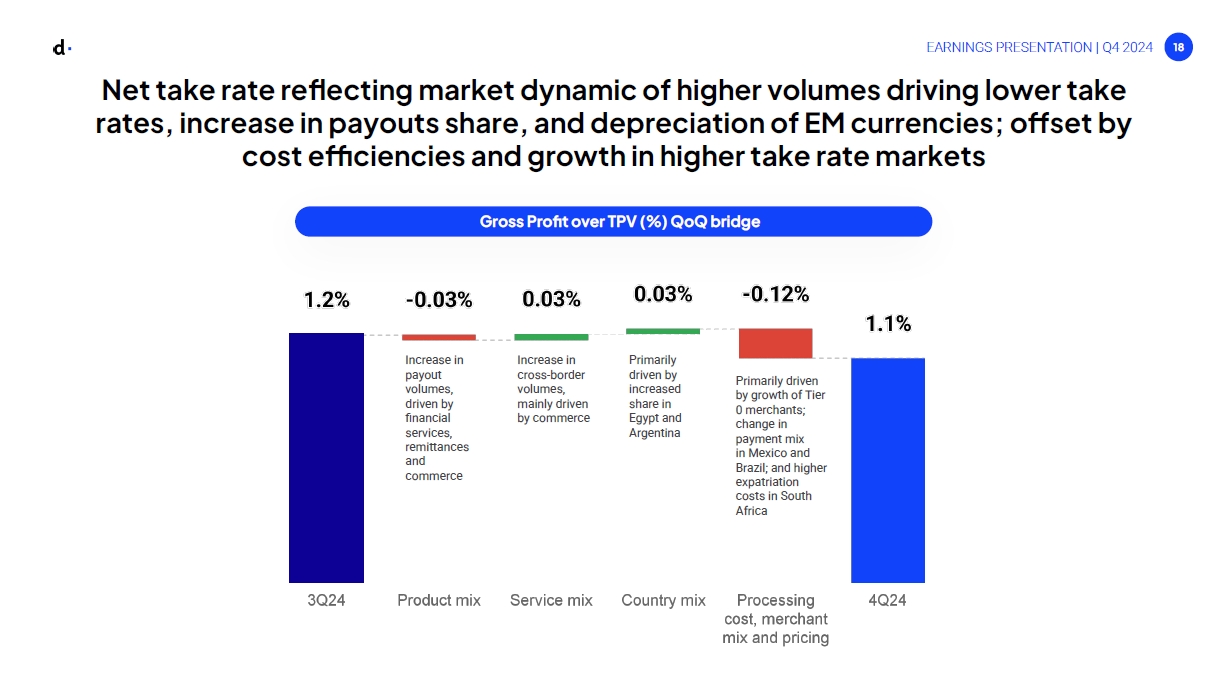
Exhibit 99.4

Exhibit 99.4

Exhibit 99.4

Exhibit 99.4

Exhibit 99.4

Exhibit 99.4

Exhibit 99.4

Exhibit 99.4

Exhibit 99.4

Exhibit 99.4

Exhibit 99.4

Exhibit 99.4

Exhibit 99.4

Exhibit 99.4

Exhibit 99.4

Exhibit 99.4

Exhibit 99.4

Exhibit 99.4
