UNITED STATES
SECURITIES AND EXCHANGE COMMISSION
Washington, D.C. 20549
FORM 10-K
☒ |
ANNUAL REPORT PURSUANT TO SECTION 13 OR 15(d) OF THE SECURITIES EXCHANGE ACT OF 1934 |
For the fiscal year ended December 31, 2024
or
☐ |
TRANSITION REPORT PURSUANT TO SECTION 13 OR 15(d) OF THE SECURITIES EXCHANGE ACT OF 1934 |
For the transition period from _________ to _________
Commission file number: 001-12933
AUTOLIV, INC.
(Exact name of registrant as specified in its charter)
Delaware |
51-0378542 |
|
(State or other jurisdiction of incorporation or organization) |
(I.R.S. Employer Identification No.) |
Klarabergsviadukten 70, Section D5, |
|
Box 70381, |
SE-107 24 |
Stockholm, Sweden |
(Zip Code) |
(Address of principal executive offices) |
|
+46 8 587 20 600
(Registrant’s telephone number, including area code)
Securities registered pursuant to Section 12(b) of the Act:
Title of each class: |
|
Trading Symbol(s): |
|
Name of each exchange on which registered: |
Common Stock (par value $1.00 per share) |
|
ALV |
|
New York Stock Exchange |
Indicate by check mark if the registrant is a well-known seasoned issuer, as defined in Rule 405 of the Securities Act. Yes ☒ No ☐
Indicate by check mark if the registrant is not required to file reports pursuant to Section 13 or Section 15(d) of the Act. Yes ☐ No ☒
Indicate by check mark whether the registrant (1) has filed all reports required to be filed by Section 13 or 15(d) of the Securities Exchange Act of 1934 during the preceding 12 months (or for such shorter period that the registrant was required to file such reports); and (2) has been subject to such filing requirements for the past 90 days. Yes: ☒ No: ☐
Indicate by check mark whether the registrant has submitted electronically every Interactive Data File required to be submitted pursuant to Rule 405 of Regulation S-T (§ 232.405 of this chapter) during the preceding 12 months (or for such shorter period that the registrant was required to submit such files). Yes: ☒ No: ☐
Indicate by check mark whether the registrant is a large accelerated filer, an accelerated filer, a non-accelerated filer, smaller reporting company or an emerging growth company. See the definitions of “large accelerated filer,” “accelerated filer,” “smaller reporting company” and “emerging growth company” in Rule 12b-2 of the Exchange Act.
Large accelerated filer |
|
☒ |
|
Accelerated filer |
|
☐ |
Non-accelerated filer |
|
☐ |
|
Smaller reporting company |
|
☐ |
Emerging growth company |
|
☐ |
|
|
|
|
If an emerging growth company, indicate by check mark if the registrant has elected not to use the extended transition period for complying with any new or revised financial accounting standards pursuant to Section 13(a) of the Exchange Act. ☐
Indicate by check mark whether the registrant has filed a report on and attestation to its management’s assessment of the effectiveness of its internal control over financial reporting under Section 404(b) of the Sarbanes-Oxley Act (15 U.S.C. 7262 (b)) by the registered public accounting firm that prepared or issued its audit report. ☒
If securities are registered pursuant to Section 12(b) of the Act, indicate by check mark whether the financial statements of the registrant included in the filing reflect the correction of an error to previously issued financial statements. ☐
Indicate by check mark whether any of those error corrections are restatements that required a recovery analysis of incentive-based compensation received by any of the registrant’s executive officers during the relevant recovery period pursuant to §240.10D-1(b). ☐
Indicate by check mark whether the registrant is a shell company (as defined in Rule 12b-2 of the Act). Yes: ☐ No: ☒
The aggregate market value of the voting and non-voting common equity of Autoliv, Inc. held by non-affiliates as of the last business day of the second fiscal quarter of 2024 amounted to $8,568 million.
Number of shares of Common Stock outstanding as of February 12, 2025: 77,714,402.
Auditor Firm Id: 1433 Auditor Name: Ernst & Young AB Auditor Location: Stockholm, Sweden Portions of the registrant’s definitive Proxy Statement for the annual stockholders’ meeting to be held on May 8, 2025, to be dated on or around March 25, 2025 (the “2025 Proxy Statement”), are incorporated by reference into Part III of this Annual Report on Form 10-K.
DOCUMENTS INCORPORATED BY REFERENCE
The 2025 Proxy Statement will be filed with the U.S. Securities and Exchange Commission within 120 days after December 31, 2024.
AUTOLIV, INC.
Index
|
|
|
|
Item 1. |
|
3 |
|
Item 1A. |
|
10 |
|
Item 1B. |
|
22 |
|
Item 1C. |
|
23 |
|
Item 2. |
|
25 |
|
Item 3. |
|
28 |
|
Item 4. |
|
28 |
|
|
|
|
|
|
|
|
|
Item 5. |
|
29 |
|
Item 6. |
|
[Reserved] |
|
Item 7. |
|
Management’s Discussion and Analysis of Financial Condition and Results of Operations |
31 |
Item 7A. |
|
51 |
|
Item 8. |
|
53 |
|
Item 9. |
|
Changes in and Disagreements with Accountants on Accounting and Financial Disclosure |
87 |
Item 9A. |
|
87 |
|
Item 9B. |
|
88 |
|
|
|
|
|
|
|
|
|
Item 10. |
|
89 |
|
Item 11. |
|
89 |
|
Item 12. |
|
Security Ownership of Certain Beneficial Owners and Management and Related Stockholder Matters |
89 |
Item 13. |
|
Certain Relationships and Related Transactions, and Director Independence |
89 |
Item 14. |
|
89 |
|
|
|
|
|
|
|
|
|
Item 15. |
|
90 |
|
1
NOTE ABOUT FORWARD-LOOKING STATEMENTS
This Annual Report on Form 10-K contains statements that are not historical facts but rather forward-looking statements within the meaning of the Private Securities Litigation Reform Act of 1995. Such forward-looking statements include those that address activities, events or developments that Autoliv, Inc. (“Autoliv,” the “Company” or “we”) or its management believes or anticipates may occur in the future. All forward-looking statements are based upon our current expectations, various assumptions and/or data available from third parties. Our expectations and assumptions are expressed in good faith and we believe there is a reasonable basis for them. However, there can be no assurance that such forward-looking statements will materialize or prove to be correct as forward-looking statements are inherently subject to known and unknown risks, uncertainties and other factors which may cause actual future results, performance or achievements to differ materially from the future results, performance or achievements expressed in or implied by such forward-looking statements.
In some cases, you can identify these statements by forward-looking words such as “estimates,” “expects,” “anticipates,” “projects,” “plans,” “intends,” “believes,” “may,” “likely,” “might,” “would,” “should,” “could,” or the negative of these terms and other comparable terminology, although not all forward-looking statements contain such words.
Because these forward-looking statements involve risks and uncertainties, the outcome could differ materially from those set out in the forward-looking statements for a variety of reasons, including without limitation: general economic conditions, including inflation; changes in light vehicle production; fluctuation in vehicle production schedules for which the Company is a supplier; global supply chain disruptions, including port, transportation, and distribution delays or interruptions; supply chain disruptions, and component shortages specific to the automotive industry or the Company; geopolitical instability, including the ongoing war between Russia and Ukraine and the hostilities in the Middle East; changes in general industry and market conditions or regional growth or decline; changes in and the successful execution of our capacity alignment, restructuring, cost reduction, and efficiency initiatives and the market reaction thereto; loss of business from increased competition; higher raw material, fuel, and energy costs; changes in consumer and customer preferences for end products; customer losses; changes in regulatory conditions; customer bankruptcies, consolidations or restructuring or divestiture of customer brands; unfavorable fluctuations in currencies or interest rates among the various jurisdictions in which we operate; market acceptance of our new products; costs or difficulties related to the integration of any new or acquired businesses and technologies; continued uncertainty in pricing and other negotiations with customers; successful integration of acquisitions and operations of joint ventures; successful implementation of strategic partnerships and collaborations; our ability to be awarded new business; product liability, warranty and recall claims and investigations and other litigation, civil judgments or financial penalties and customer reactions thereto; higher expenses for our pension and other postretirement benefits, including higher funding needs for our pension plans; work stoppages or other labor issues; possible adverse results of pending or future litigation or infringement claims, and the availability of insurance with respect to such matters; our ability to protect our intellectual property rights; negative impacts of antitrust investigations or other governmental investigations and associated litigation relating to the conduct of our business; tax assessments by governmental authorities and changes in our effective tax rate; dependence on key personnel; legislative or regulatory changes impacting or limiting our business, including changes in trade policy and tariffs; our ability to meet our sustainability targets, goals and commitments; political conditions; dependence on and relationships with customers and suppliers; the conditions necessary to hit our financial targets; and other risks and uncertainties identified in Item 1A -“Risk Factors” of this Annual Report on Form 10-K, Item 1A, and Item 7 - “Management’s Discussion and Analysis of Financial Condition and Results of Operations” in this Annual Report.
For any forward-looking statements contained in this or any other document, we claim the protection of the safe harbor for forward-looking statements contained in the Private Securities Litigation Reform Act of 1995, and we assume no obligation to update publicly or revise any forward-looking statements in light of new information or future events, except as required by law.
2
PART I
Item 1. Business
General
Autoliv, Inc. (“Autoliv”, the “Company” or “we”) is a Delaware corporation with its principal executive offices in Stockholm, Sweden where it currently employs approximately 110 people. The Company functions as a holding corporation and owns two principal subsidiaries, Autoliv AB and Autoliv ASP, Inc. The Company's fiscal year ends on December 31.
The Company is a leading developer, manufacturer, and supplier of passive safety systems to the automotive industry with a broad range of product offerings.
Passive safety systems are primarily meant to improve safety for occupants in a vehicle. Passive safety systems include modules and components for frontal-impact airbag protection systems, side-impact airbag protection systems, pedestrian protection systems, steering wheels, inflator technologies, battery cut-off switches and seatbelts.
To expand its product offerings, the Company has formed Mobility Safety Solutions. By combining its core competence and industry experience, the Company also develops and manufactures mobility safety solutions such as pedestrian protection, battery cut-off switches, connected safety services, and safety solutions for riders of powered two-wheelers.
The Company has 62 production facilities in 23 countries and its customers include the world’s largest car manufacturers. The Company’s sales in 2024 were $10.4 billion, approximately 68% of which consisted of airbag and steering wheel products and approximately 32% of which consisted of seatbelt products. The Company's business is conducted in the following geographical regions: The Americas, Europe, China, and Asia, excluding China.
On December 31, 2024, the Company had approximately 65,200 personnel worldwide, with 9% being temporary personnel.
Additional information required by this Item 1 regarding developments in the Company’s business during 2024 is contained under Item 7 in this Annual Report.
Reportable Segment
The Company has one reportable segment based on the way the Company evaluates its financial performance and manages its operations. The Company's business is comprised of passive safety products –principally airbags (including steering wheels and inflators) and seatbelts. For more information regarding the Company’s segment reporting, see Note 1, Basis of Presentation, to the Consolidated Financial Statements in this Annual Report.
Products, Market, and Competition
Products
Providing life-saving solutions is a key priority as the world population grows and develops. However, population expansion in growth markets and the rise of megacities creates new complexities. To meet this challenge, the Company develops safety solutions for both mobility and society that work in real life situations. The Company's passive safety systems such as seatbelts and airbags substantially mitigate human consequences of traffic accidents.
The airbag module is designed to inflate extremely rapidly and then quickly deflate during a collision or impact. It consists of the container, an airbag cushion, and an inflator. The purpose of the airbag is to provide the occupants a cushioning and restraint during a crash event to prevent any impact or impact-caused injuries between the occupant and the interior of the vehicle.
Seatbelts can reduce the overall risk of serious injuries in frontal crashes by as much as 60% due to advanced seatbelt technologies such as pretensioners and load limiters.
The Company also manufactures steering wheels that are crafted to ensure they meet safety requirements and are functional as well as stylish.
Market and Competition
Consumer research clearly shows that consumers want safe vehicles, and several significant trends are likely to positively influence overall safety content per vehicle. These include:
1) Society becoming increasingly focused on Vision Zero and its goal of reducing traffic fatalities and their associated costs;
2) Demographic trends of increased urbanization, aging driver populations, and increased safety focus in growth markets;
3) Evolving government regulations and test rating systems to improve the safety of vehicles in various markets, such as the updated European New Car Assessment Program (Euro NCAP), China NCAP, and USNCAP; and
4) The trend towards more electrical vehicles may lead to roomier interiors that may require more advanced passive safety systems, as well as products to cut the electrical power in case of an accident.
The automotive passive safety market is driven by two primary factors: light vehicle production (LVP) and content per vehicle (CPV).
3
The first growth driver, LVP, has increased at an average annual growth rate of around 1.8% since the start of Autoliv in 1997 despite persistent headwinds in Europe and North America. According to S&P Global, LVP is forecasted to grow to close to 91 million by 2027 from almost 87 million in 2024, due to growing demand and export in medium- and low-income markets.
Unlike LVP, where Autoliv can only aim to be on the best-selling platforms, Autoliv can influence CPV more directly by continuously developing and introducing new technologies with higher value-added features. Over the long term, this increases average safety CPV and has caused the Company's markets to grow faster than the LVP.
Since 1997, the Company’s sales compound annual growth rate (CAGR) for passive safety has been around 5% compared to the market rate of around 2.7% which includes an LVP growth of around 1.8%. The Company's outperformance is a result of a steady flow of new passive safety technologies, strong focus on quality and a superior global footprint both in products and engineering. This has enabled Autoliv to increase its global market share in passive safety from 27% in 1997 to around 44% in 2024.
In high-income markets (Western Europe, North America, Japan, and South Korea) the average CPV is around $340. CPV growth in these regions mainly comes from new safety systems such as active seatbelts, knee airbags, and front-center airbags along with improved protection for pedestrians and rear-seat occupants like bag-in-belt or more advanced seatbelts.
In medium- and low-income markets (all markets other than the high-income markets above), the Company sees great opportunities for CPV growth from more airbags and advanced seatbelt products. Average CPV in these markets is around $200 or almost $140 less than in the high-income markets.
As a result of higher installation rates of airbags, more advanced seatbelt products, and more complex steering wheels, CPV is expected to increase at a similar pace in both high-income and medium- and low-income markets over the next three years.
In the next three years, almost all LVP growth is expected to come in medium- and low-income regions with lower CPV, leading to a dilution of the average global CPV. Despite this negative regional LVP mix effect, the annual passive safety market (seatbelts and airbags, including steering wheels), is expected to grow from around $23 billion in 2024 to more than $25 billion over the next three years, based on the current macro-economic outlook and the Company's internal market intelligence and estimates.
In seatbelts, Autoliv has reached a global market share of around 45%, primarily due to being the technology leader with several important innovations such as pretensioners and active seatbelts. The Company's strong market position is also a reflection of its superior global footprint. Seatbelts are the primary life-saving safety product globally and are also an important requirement in low-end vehicles in the medium- and low-income markets. This provides the Company with an excellent opportunity to benefit from the expected growth in this segment of the market.
The market for airbags and steering wheels, where Autoliv has a global market share of around 44%, is expected to grow mainly as result of higher installation rates of inflatable curtains, side airbags, knee airbags, center airbags as well as the trend towards higher-value steering wheels with leather and additional features.
The Company's ability to consistently outperform market growth is rooted in a steady flow of new safety technologies, a strong focus on quality, and a superior production and engineering footprint.
The Company's competitors
Autoliv is the clear market leader in passive safety components and systems for the automotive industry with an estimated global market share of around 44%.
ZF AG, one of the Company's largest competitors, is a global leader in drive-line and chassis technology as well as in passive safety technologies and is one of the largest global automotive suppliers.
Another large competitor is Joyson Safety Systems (JSS), a subsidiary of Ningbo Joyson Electronic Corp. JSS is the result of the merger between Key Safety Systems (KSS) and Takata Corporation after KSS acquired Takata in 2018.
In Japan, Brazil, South Korea, and China, there are a number of local suppliers that have close ties with the domestic vehicle manufacturers. For example, Toyota uses “keiretsu” (in-house) suppliers Tokai Rika for seatbelts and Toyoda Gosei for airbags and steering wheels. These suppliers generally receive most of the Toyota business in Japan, in the same way, Mobis, a major supplier to Hyundai/Kia in South Korea, generally receives a significant part of their business. Also BYD Auto., Ltd. (BYD) has a high degree of vertical integration, with a large proportion of in-house sourcing of products and systems. This includes passive safety systems, which is supplied by its subsidiary FinDreams Technology. Autoliv supplies components, especially inflators, to FinDreams Technology.
Other competitors include Nihon Plast and Ashimori in Japan, Yanfeng and Jinheng in China, Samsong in South Korea, and Chris Cintos de Seguranca in South America. Collectively, these competitors account for the majority of the remaining market share in passive safety.
Additional information concerning the Company's products, markets and competition is included in the “Risks and Risk Management” section under Item 7 of this Annual Report.
4
Manufacturing and Production
See “Item 2. Properties” for a description of Autoliv’s principal properties. The component factories manufacture inflators, propellant, initiators, textile cushions, webbing, pressed steel parts, springs, and over molded steel parts used in seatbelt and airbag assembly and steering wheels. The assembly factories source components from a number of parties, including Autoliv’s own component factories, and assemble complete restraint systems for “just-in-time” delivery to customers. The products manufactured by Autoliv’s consolidated subsidiaries in 2024 consisted of 142 million complete seatbelt systems (of which 98 million were fitted with pretensioners), 132 million side airbags (including curtain airbags and front center airbags), 60 million frontal airbags and 21 million steering wheels.
Autoliv’s “just-in-time” delivery system is designed to accommodate the specific requirements of each customer for low levels of inventory and rapid stock delivery service. “Just-in-time” deliveries require final assembly or, at least, distribution centers in geographic areas close to customers to facilitate rapid delivery. The fact that the major automobile manufacturers are continually expanding their production activities into more countries and require the same or similar safety systems as those produced in Europe, Japan, or the U.S. increases the importance for suppliers to have assembly capacity in several countries. Consolidation among the Company's customers also supports this trend.
Autoliv’s assembly operations generally are not constrained by capacity considerations unless there is a disruption in the supply of raw materials and components. When dramatic shifts in LVP occur, Autoliv can generally adjust capacity in response to any changes in demand within a few days by adding or removing work shifts and within a few months by adding or removing standardized production and assembly lines. Most of Autoliv’s assembly factories can make sufficient space available to accommodate additional production lines to satisfy foreseeable increases in capacity. As a result, Autoliv can usually adjust its manufacturing capacity faster than its customers can adjust their capacity as a result of fluctuations in the general demand for vehicles or in the demand for a specific vehicle model, provided that customers promptly notify Autoliv when they become aware of such changes in demand. However, these types of adjustments can be costly and can impact Autoliv's operating margin.
When significant volatility in LVP occurs, as we saw in 2022 and 2023 due to supply disruptions, or when there is a shift in regional LVP, the capacity adjustments can take more time and be more costly. During 2024 the volatility of LVP continued to improve, although it is still more volatile than prior to the COVID-19 pandemic. Additionally, when there is significant demand for a given product due to a major recall of a competitor’s product, like certain of the Company's customers have experienced, capacity adjustments may take time.
The Company could experience disruption in its supply or delivery chain, which could cause one or more of its customers to halt or delay production. For more information, see Item 1A – “Risk Factors” in this Annual Report.
Quality Management
Autoliv believes that superior quality is a prerequisite to being considered a leading global supplier of automotive safety systems and is key to the Company's financial performance, because quality excellence is critical for winning new orders, preventing recalls, and maintaining low scrap rates. Autoliv has for many years emphasized a “zero-defect” proactive quality policy and continues to strive to improve its working methods. Autoliv’s products are expected to always meet performance expectations and be delivered to its customers at the right times and in the right amounts. The Company believes its continued quality improvements further enhance the Company's reputation among its customers, employees, and governmental authorities.
Although quality has always been paramount in the automotive industry, especially for safety products, automobile manufacturers have become increasingly focused on quality with even less tolerance for any deviations. This intensified focus on quality is partially due to an increase in the number of vehicle recalls for a variety of reasons (not just safety), including a few high-profile vehicle recalls. This trend is likely to continue as automobile manufacturers introduce even stricter quality requirements and regulating agencies and other authorities increase the level of scrutiny given to vehicle safety issues. The Company has not been immune to the recalls that have been impacting the automotive industry.
The Company continues to drive its quality initiative called “Q5,” which was initiated in 2010. It is an integral part of the Company's strategy of shaping a proactive quality culture of zero defects. It is called “Q5” because it addresses quality in five dimensions: products, customers, growth, behavior, and suppliers. The goal of Q5 is to firmly tie together quality with value within all of the Company's processes and for all of its employees, thereby leading to the best value for its customers. Since 2010, the Company has continually focused on this quality initiative to provide additional skills training to more employees and suppliers. These activities have significantly improved the Company's quality performance.
In the Company's pursuit of quality excellence, the Company developed a chain of four “defense lines” to deal with potential quality issues. The defense lines are: 1) robust product designs, 2) flawless components from suppliers and the Company's own in-house component companies, 3) manufacturing flawless products with a system for verifying that the Company's products conform with specifications, and 4) an advanced traceability system in the event of a recall.
The Company's pursuit of quality excellence extends from the earliest phases of product development to the proper disposal of a product following many years of use in a vehicle. Autoliv’s comprehensive Autoliv Product Development System (“APS”) includes several key check points during the process of developing new products that are designed to ensure that such products are well-built and have no hidden defects. Through this process, the Company works closely with its suppliers and customers to set clear standards that help to ensure robust component design and lowest cost for function in order to proactively prevent problems and ensure the Company delivers only the best designs to the market.
5
The APS, based on the goals of improving quality and efficiency, is at the core of Autoliv’s manufacturing philosophy. APS integrates essential quality elements, such as mistake proofing, statistical process control and operator involvement, into the manufacturing processes so all Autoliv associates are aware of and understand the critical connection between themselves and the Company's lifesaving products. This “zero-defect” principle extends beyond Autoliv to the entire supplier base. All of the Company's suppliers must accept the strict quality standards in the global Autoliv Supplier Manual, which defines the Company's quality requirements and focuses on preventing bad parts from being produced by its suppliers and helps eliminate defective intermediate products in the Company's assembly lines as early as possible. In addition, Autoliv’s One Product One Process (“1P1P”) initiative is its strategy for developing and managing standardization of both core products and customer-specific features, leading not only to improved quality, but also greater cost efficiency and more efficient supply chain management.
IATF 16949:2016 is one of the automotive industry’s most widely used international standards for quality management. All Autoliv facilities that ship products to OEMs are regularly certified according to the International Automotive Task Force (IATF) standards.
Environmental and Safety Regulations
For information on how environmental and safety regulations impact the Company's business, see “Risk Factors – ‘Our business may be adversely affected by laws or regulations, including environmental, occupational health and safety, and other governmental regulations’, “Global climate change could negatively affect our business”, “Our goals, targets, and ambitions related to sustainability and emissions reduction, and our public statements and disclosures regarding them, expose us to numerous risks” and “Our business may be adversely affected by changes in automotive safety regulations or concerns that drive further regulation of the automobile safety market”” in Item 1A and “Risks and Risk Management” in Item 7 of this Annual Report.
Climate change
The Company is committed to operating its business in an environmentally sustainable manner, meaning developing and producing products in a resource efficient way while limiting the Company's environmental impact in the most material areas of greenhouse gas emissions, energy use, waste, and water. With particular emphasis on climate action, the Company actively engages with its customers, suppliers, and others to drive sustainable mobility.
In June 2021, the Company launched an updated climate strategy including new long-term climate ambitions:
These industry-leading climate ambitions are aligned with a 1.5°C trajectory and should position the Company as the supplier of choice for the most climate-focused customers, helping to ensure the Company's competitiveness now and in the future. In addition to these ambitions, the Company adopted Science Based Targets (SBTs) for 2030 covering its own operations as well as the supply chain. The targets were approved in January 2022 and are available at the SBTi website.
For more information about how climate change impacts the Company's business, see "Risk factors – Global climate change could negatively affect our business” in Item 1A of this Annual Report.
Raw Materials
Direct material cost represents approximately 55% of the Company's net sales in 2024. The Company mainly purchases manufactured components and raw materials for its operations. The Company takes several actions to manage the raw material fluctuations, such as competitive sourcing and looking for alternative materials. The Company is also taking necessary actions to gradually implement raw materials with a lower carbon emission footprint.
For information on the sources and availability of raw materials, see "Operational Risks - Component costs" in Item 7 and “Risk Factors – Changes in the source, cost, availability of, and regulations pertaining to raw materials and components may adversely affect our profit margins” in Item 1A of this Annual Report.
Intellectual Property
The Company has developed a considerable amount of proprietary technology related to automotive safety systems and relies on many patents to protect such technology. The Company's intellectual property plays an important role in maintaining its competitive position in a number of the markets the Company serves. For information on the Company's use of intellectual property and its importance to the Company, see “Risk Factors – If our patents are declared invalid or our technology infringes on the proprietary rights of others, our ability to compete may be impaired” in Item 1A of this Annual Report.
6
Backlog
The Company has frame contracts with automobile manufacturers and such contracts are typically entered into up to three years before the start of production of the relevant car model or platform and provide for a term covering the life of such car model or platform including service parts after a vehicle model is no longer produced. These contracts, however, do not typically provide minimum quantities, firm prices, or exclusivity but instead permit the automobile manufacturer to resource the relevant products at given intervals (or at any time) from other suppliers. We sometimes refer to this backlog as our order intake or order book. For more information about order intake see “Risk Factors – The cyclical nature of automotive sales and production can adversely affect our business. Our business is directly related to LVP in the global market and by our customers, and automotive sales and LVP are the most important drivers for our sales” in Item 1A of this Annual Report.
Dependence on Customers
In 2024, the Company's top five customers represented around 44% of its consolidated net sales and the Company's top ten customers represented around 71% of its consolidated net sales. This reflects the concentration of manufacturers in the automotive industry. The company's five largest customers accounted for around 41%, and the ten largest customers for around 59% of global LVP in 2024. A delivery contract is typically for the lifetime of a vehicle model, which is normally between five and seven years depending on customer platform sourcing preferences and strategies.
For information on the Company's dependence on customers, see “Risk Factors – Our business could be materially and adversely affected if we lost any of our largest customers or if they were unable to pay their invoices” in Item 1A of this Annual Report, and “Dependence on Customers” under the section “Strategic Risks” in Item 7 of this Annual Report, and Note 20 “Segment Information” to the Consolidated Financial Statements
Customer sales trends
Asian vehicle producers have steadily become increasingly important, mainly driven by growth with Japanese and Chinese OEMs. As a group they represented around 46% of the Company's consolidated net sales in 2024, of which Japanese OEMs accounts for almost two thirds. This is a result of the Company's stronger market position based on its local presence in Japan. The Chinese OEMs as a group accounted for around 7% of the Company's consolidated net sales in 2024, with Geely representing more than 2% of the Company's consolidated net sales. European based brands accounted for 30% of the Company's consolidated net sales in 2024. The U.S. based OEMs (including Chrysler and new EV manufactures) accounted for 21% of the Company's global sales in 2024. Globally one of the Company's strongest growing customers from 2023 to 2024 was Geely followed by Mercedes and Renault.
Research, Development and Engineering, net (R,D&E)
No single customer project accounted for more than 3% of Autoliv’s total R,D&E, net spending during 2024. To support Autoliv’s product portfolio, additional expertise is brought in-house via technology partnerships and licensing agreements.
During 2024, gross expenditures for R,D&E amounted to $612 million compared to $618 million in 2023. Of these amounts, $214 million in 2024 and $193 million in 2023 were related to customer-funded engineering projects and crash tests reimbursed by the customers. Net of this income, R,D&E expenditures in 2024 was $398 million compared to $425 million in 2023. Of the R,D&E, net expense in 2024, 86% was for projects and programs where the Company has customer orders, typically related to vehicle models in development. The remaining 14% was mainly for new innovations, products and standardizations that will yield benefits over time.
Regulatory Costs
The fitting of seatbelts in most types of motor vehicles is mandatory in almost all countries and many countries have strict laws regarding the use of seatbelts while in vehicles. In addition, most developed countries require that seats in intercity buses and commercial vehicles be fitted with seatbelts. In the U.S., federal legislation requires frontal airbags on the driver-side and the passenger-side of all new passenger cars, sport utility vehicles, pickup trucks, and vans.
For information concerning the material effects on the Company's business relating to its compliance with government safety regulations, see “Risk Factors – ‘Our business may be adversely affected by laws or regulations, including environmental, occupational health and safety, and other governmental regulations’ and ‘Our business may be adversely affected by changes in automotive safety regulations or concerns that drive further regulation of the automobile safety market’” in Item 1A of this Annual Report and in Item 7 under the section “Risks and Risk Management” of this Annual Report.
7
Human Capital Management
The Company's drive for excellence is what makes Autoliv the world’s leading supplier of automotive safety systems. From the earliest stages of product development to sales and design to the final delivery of the finished product, Autoliv's employees are driven by the Company's mission to Save More Lives.
The successful execution of the Company's strategies relies on its ability to shape a quality and performance-oriented culture, and to adapt quickly to sudden shifts in its circumstances, such as supply chain disruptions and geopolitical instability. As the Company moves forward its workforce (employees plus temporary personnel) strives to respond with agility to new possibilities to grow and improve the Company's business whilst delivering with excellence to its customers. The Company builds a winning team by focusing on creating a work environment that attracts, retains, and engages its employees.
The table below shows the Company's total workforce as of December 31, 2024, and 2023.
|
|
2024 |
|
|
2023 |
|
||
Total workforce |
|
|
65,200 |
|
|
|
70,300 |
|
Whereof: |
|
|
|
|
|
|
||
Direct workforce in manufacturing |
|
|
48,000 |
|
|
|
52,400 |
|
Indirect workforce |
|
|
17,200 |
|
|
|
17,800 |
|
Temporary workforce |
|
|
9 |
% |
|
|
11 |
% |
Talent Attraction, Development, and Retention
The Company believes that attraction, development, and retention of talent is essential to its success, especially in today's environment. The Company offers an inclusive work environment where its employees are challenged and achieve great things together. The Company seeks individuals who hold varied experiences and viewpoints to create a workplace that allows each employee to do their best work and drive the Company's collective success. The Company's workforce reflects the diversity of the countries and cultures in which it operates.
30% of the Company’s workforce is located in the Americas, 19% in Asia (excluding China), 14% in China, and 37% in Europe (including South Africa, Tunisia and Turkey).
Supporting the development of the employees is essential in a highly competitive and rapidly changing environment. An important cornerstone of each employee’s growth is the ongoing dialogue between the team member and manager, which is summarized during an annual Performance and Development Dialogue (PDD). During the year, 99% of targeted employees conducted a PDD with their managers. To provide opportunities for professional and personal growth of the employees, the Company has a multitude of development channels, including technical and specialist career paths, international assignments, and other such programs.
The Company provides market-based competitive compensation through its salary, annual incentive, and long-term incentive programs and benefits packages that promote employee well-being across all aspects of their lives.
Health and Safety
The Company is committed to providing a zero-injury work environment that promotes the health, safety, and welfare of its employees. Autoliv’s production facilities implement the Company's health and safety management system, which drives continuous improvement in health and safety, supported by the Company's leadership. Execution of the system is monitored through internal and external ISO 45001 occupational health and safety management system audits. At the end of 2024, 66% of the Company's production facilities were certified to the ISO 45001 standard.
8
Labor Relations
The Company offers fair terms and conditions of employment. The Company's overall purpose, Code of Conduct, talent development strategies, and employment policies support the principles in the United Nations Universal Declaration of Human Rights, and the International Labor Organization’s Fundamental Principles and Labor Standards.
The Company considers its relationship with its employees to be good. While there have been a small number of minor labor disputes historically, such disputes have not had a significant or lasting impact on the Company's relationship with its employees, and customer perception of its employee practices or its business results. Around 60 percent of the Company’s workforce outside the United States is covered by a collective bargaining agreement.
Major unions in Europe to which some of the Company's employees belong include: IG Metall in Germany; Unite the union in the United Kingdom; Confédération Générale des Travailleurs (CGT), Confédération Française Démocratique du Travail (CFDT), Confédération Française de l’Encadrement Confédération Générale des cadres (CFE-CGC), Force Ouvrière (FO), Confédération Française des Travailleurs Chrétiens (CFTC), Solidaires, Unitaires, Démocratiques (SUD) and Conféderation Autonome du Travail (CAT) in France; Union General de Trabajadores (UGT), Union Sindical Obrera (USO), Comisiones Obereras (CCOO) and Confederacion General de Trabajadores (CGT) in Spain; IF Metall, Unionen, Sveriges Ingenjörer and Ledarna in Sweden; Industriaal- ja Metallitöötajate Ametiühingute Liit (IMTAL) in Estonia; Vasas Szakszervezeti Szövetség (Hungarian Metallworkers‘ Federation) in Hungary; Samorzadny NiezalezĪny Zwiazek Zawodowy Pracownikow and Zakladowa Organizacja Związkowa NSZZ Solidarnosc in Poland; National Union of Metal Workers South Africa (NUMSA) in South Africa; Union Générale des Travailleurs Tunisiens (UGTT) and Union des travailleurs Tunisiens (UTT) in Tunisia, and Türk Metal Sendikasi in Turkey.
In addition, the Company’s employees in other regions are represented by the following unions: Unifor in Canada; Sindicato de Jornaleros y Obreros Industriales y de la Industria Maquiladora de H.Matamoros, Tamaulipas (CTM); Sindicato Nacional de Trabajadores de la Industria Metalúrgica y Similares, Federación Valle de Toluca (CTM); Sindicato Nacional “Nueva Cultura Laboral” de trabajadores de la fabricación, manufactura, ensamble de autopartes mecánicas y eléctricas y componentes de la Industria Automotriz, C.R.O.C.; Sindicato Nacional de Trabajadores de la Industria Arnesera, Eléctrica, Automotriz y Aeronáutica de la República Mexicana; “Nueva Cultura Laboral” “de trabajadores de la fabricación, manufactura, ensamble de autopartes mecánicas y eléctricas y componentes de la industria Automotriz (CROC); Sindicato Nacional de Trabajadores de la Industria de Autopartes en General y/o Similares, Conexos y sus Servicios de la República Mexicana, in Mexico; Sindicato Industrial de Trabajadores de la Transformación, Construcción, Automotriz, Agropecuaria, Plásticos y de la Industria en General, del Comercio y Servicios, Similares, anexos y conexos del Estado de Querétaro “Ángel Castillo Resendiz”; Sindicato dos Metalúrgicos de Taubaté e Região in Brazil; Autoliv India Employees Association, Bangalore & Mysore in India; Korean Metal Workers Union (FKTU) in South Korea; Autoliv Japan Roudou Kumiai in Japan, and All-China Federation of Trade Unions in China.
In many European countries, Canada, Mexico, Brazil and South Korea, wages, salaries and general working conditions are negotiated with local unions and/or are subject to centrally negotiated collective bargaining agreements. The terms of the Company's various agreements with unions typically range between one to three years. Some of the Company's subsidiaries in Europe, Canada, Mexico, Brazil and South Korea must negotiate with the applicable local unions with respect to important changes in operations, working and employment conditions. Twice a year, members of the Company’s management conduct a meeting with the European Works Council (EWC) to provide employee representatives with important information about the Company and a forum for the exchange of ideas and opinions. In many Asia Pacific countries, the central or regional governments provide guidance each year for salary adjustments or statutory minimum wage for workers. The Company's employees may join associations in accordance with local legislation and rules, although the level of unionization varies significantly throughout its operations.
Available Information
The Company files or furnishes with the United States Securities and Exchange Commission (the “SEC”) periodic reports and amendments thereto, which include annual reports on Form 10-K, quarterly reports on Form 10-Q, current reports on Form 8-K, proxy statements, and other information. Such reports, amendments, proxy statements, and other information are made available free of charge on the Company's corporate website at www.autoliv.com and are available as soon as reasonably practicable after they are electronically filed with the SEC. The Company's Corporate Governance Guidelines, committee charters, code of conduct, and other documents governing the Company are also available on its corporate website at www.autoliv.com. The SEC maintains an internet site that contains reports, proxy statements and other information at www.sec.gov. Hard copies of the above-mentioned documents can be obtained free of charge by contacting the Company at: Autoliv, Inc., P.O. Box 70381, SE-107 24, Stockholm, Sweden.
9
Item 1A. Risk Factors
Our business, financial condition, operating results and cash flows may be impacted by a number of factors. A discussion of the risks associated with these material risk factors is included below.
RISKS RELATED TO OUR INDUSTRY
The cyclical nature of automotive sales and production can adversely affect our business. Our business is directly related to LVP in the global market and by our customers, and automotive sales and LVP are the most important drivers for our sales
Automotive sales and production are highly cyclical and can be affected by general or regional economic or industry conditions, the level of consumer demand, recalls and other safety issues, labor relations issues, technological changes, fuel prices and availability, vehicle safety regulations and other regulatory requirements, governmental initiatives, trade agreements, political volatility (especially in energy producing countries and growth markets), changes in interest rate levels and credit availability, and other factors. Some regions around the world may at various times be more particularly impacted by these factors than other regions. Economic declines that result in a significant reduction in automotive sales and production by our customers have in the past had, and may in the future have, a material adverse effect on our business, results of operations, and financial condition. Our sales are also affected by the inventory levels of our customers, which we cannot predict. Customers may choose to increase or reduce inventory levels at any time, and new inventory levels may not align with historical trends. These fluctuations can add variability to our production schedules and order intake, potentially impacting our revenues and financial condition. Uncertainty regarding inventory levels may be further impacted by consumer financing programs initiated or terminated by our customers or governments, as such changes can influence the timing of sales. Changes in automotive sales and LVP and/or customers’ inventory levels will have an impact on our financial targets, earnings guidance, and estimates. In addition, we base our growth projections in part on business awards, or order intake, made by our customers. However, actual production orders from our customers may not approximate the awarded business or our estimated order intake. Any significant reduction in automotive sales and/or LVP by our customers, whether due to general economic conditions or any other factors relevant to sales or LVP, could have a material adverse effect on our business, results of operations, and financial condition.
Growth rates in safety content per vehicle, which can be impacted by changes in consumer trends, political decisions, crash test ratings and safety regulations could affect our results in the future
The Company estimates that the average global content of passive safety systems per light vehicle in 2024 was unchanged around $260. Vehicles produced in different markets may have various passive safety content values. For example, in high-income markets, light vehicles have an average passive safety content values of around $340 per vehicle, whereas in growth markets such as China and India the average passive safety content per vehicle is approximately $200 and $120, respectively. Due to the concentration of the majority of the growth in global LVP over time in growth markets, our operating results may be impacted if the passive safety content per vehicle remains low and if the penetration of automotive safety systems does not increase in these regions. As passive safety content per vehicle is also an indicator of our sales development, should these trends continue, the average value of passive safety systems per vehicle could decline.
We operate in a highly competitive market
The market for passive safety systems is highly competitive. We compete with a number of other companies that produce and sell similar products. Among other factors, our products compete on the basis of price, quality, manufacturing and distribution capability, design and performance, technological innovation, delivery, and service. Some of our competitors are subsidiaries (or divisions, units or similar) of companies that are larger and have greater financial and other resources than us. Some of our competitors may also have a “preferred status” as a result of special relationships or ownership interests with certain customers. Our ability to compete successfully depends, in large part, on our success in continuing to innovate and manufacture products that have commercial success with our customer and end-consumers, differentiating our products from those of our competitors, continuing to deliver quality products in the time frames required by our customers, and maintaining best-cost production. We continue to invest in technology and innovation which we believe will be critical to our long-term growth. Our ability to maintain and improve existing products, while successfully developing and introducing distinctive new and enhanced products that anticipate changing customer and consumer preferences and capitalize upon emerging technologies will be a significant factor in our ability to remain competitive. We may not be able to effectively implement new technology-driven products and services or be successful in marketing such products and services. In addition, our implementation of certain new technologies, such as those related to artificial intelligence, automation and algorithms, may have unintended consequences due to any limitations or failure to use them effectively. If we are unsuccessful or are less successful than our competitors in predicting the course of market development, developing innovative products, processes, and/or use of materials or adapting to new technologies or evolving regulatory, industry or customer requirements, we may be placed at a competitive disadvantage. For example, our customers are increasingly focused on developing electric vehicles. If we fail to be awarded business on electric vehicle models, or these electric vehicles are not successful commercially, it will harm our future business prospects. Our competitive environment continues to change, including increased competition from entrants outside the traditional automotive industry, creating uncertainty about the future competitive landscape. Given the competitive nature of our business, the number of awards we are awarded relative to our peers may decrease over time and our past order intake is not an indicator of future levels or order intake. Additionally, OEMs rigorously evaluate our performance and products against those of our competitors on the basis of product quality, reliability and cost-effectiveness. If one or more of our OEM customers determine that they could achieve overall better financial results by incorporating a competitor’s new or existing product, it could affect our ability to be competitive and may decrease our current market share. The inability to compete successfully could have a material adverse effect on our business, results of operations, and financial condition.
10
The discontinuation, lack of commercial success, or loss of business with respect to a particular vehicle model for which we are a significant supplier could reduce our sales and harm our business
A number of our customer contracts generally require us to supply a customer’s annual requirements for a particular vehicle model and assembly facilities, rather than for manufacturing a specific quantity of products. Such contracts range from one year to the life of the model, which is generally four to seven years. These contracts are often subject to renegotiation, sometimes as frequently as annually, which may affect product pricing, and generally may be terminated by our customers at any time. Therefore, the discontinuation of, the loss of business with respect to, or a lack of commercial success of a particular vehicle model or brand for which we are a significant supplier could reduce our sales and harm our business prospects, operating results, cash flows, or financial condition.
We are working to expand our product offerings beyond light passenger vehicles to include other mobility safety solutions. If we are not successful in expanding our product offerings or if it takes longer or costs are more than expected, it could harm our business
The Company is working to expand its product offerings to focus on mobility safety solutions. Because mobility safety product offerings are currently in the development stages, it is difficult for us to anticipate the level of sales they may generate. The expansion of our product offering will require us to invest time and resources to develop innovative products, such as wearables and two-wheeler passive safety products, that keep pace with continuing changes in industry standards and to reach new customers who have rapidly changing preferences. Our product offerings might not receive customer acceptance if customer preferences shift to other products, and our future success depends in part on our ability to anticipate and respond to these changes. If we are not successful in expanding our product offerings or if it takes longer or costs are more than expected, it could negatively impact our financial results, competitive position, and future business prospects.
RISKS RELATED TO OUR BUSINESS
We may incur material losses and costs as a result of product liability, warranty, and recall claims that may be brought against us or our customers
We face risks related to product liability claims, warranty claims, and recalls in the event that any of our products actually or allegedly are defective, fail to perform as expected, or the use of our products results, or is alleged to result, in bodily injury and/or property damage. We may not be able to anticipate all of the possible performance or reliability problems that could arise with our products after they are released to the market. Additionally, increasing regulation and reporting requirements regarding potentially defective products, particularly in the U.S., may increase the possibility that we become involved in additional product liability or recall investigations or claims. See – “Our business may be adversely affected by changes in automotive safety regulations or concerns that drive further regulation of the automobile safety market”. Although we currently carry product liability and product recall insurance in excess of our self-insured amounts, no assurance can be made that such insurance will provide adequate coverage against potential claims, such insurance is available or will continue to be available in the appropriate markets, or that we will be able to obtain such insurance on acceptable terms in the future. The cost of such insurance has risen in recent years and our self-insured amounts have risen as well. Although we have invested and will continue to invest in our engineering, design, and quality infrastructure, we cannot give any assurance that our products will not suffer from defects or other deficiencies or that we will not experience material warranty claims or product recalls. In the future, we could experience material warranty or product liability losses and incur significant costs to process and defend these claims. A successful claim brought against us in excess of available insurance coverage, if any, or a requirement to participate in any product recall, could have a material adverse effect on our operating results, cash flows, or financial condition. Future recalls could result in costs not covered by insurance in excess of our self-insurance, further government inquiries, litigation, reputational harm, and could divert management’s attention away from other matters. The main variables affecting the costs of a recall are the number of vehicles ultimately determined to be affected by the issue, the cost per vehicle associated with a recall, the determination of proportionate responsibility among the customer, the Company, and any relevant sub-suppliers, and actual insurance recoveries. Every vehicle manufacturer has its own practices regarding product recalls and other product liability actions relating to its suppliers, and the performance and remedial requirements vary between jurisdictions. Due to recall activity in the automotive industry over the past decade, some vehicle manufactures have become even more sensitive to product recall risks. Government regulators have also become more focused on potential recall risks as demonstrated by the US National Highway Traffic Safety Administration (“NHTSA”) investigation of the ARC inflators. If NHTSA proceeds with any recalls of ARC inflators, such a recall could have a material impact on our results of operations. As suppliers become more integrally involved in the vehicle design process and assume more of the vehicle assembly functions, vehicle manufacturers are increasingly looking to their suppliers for contribution when faced with recalls and product liability claims. Product recalls in our industry, even when they do not involve our products, can harm the reputations of our customers, competitors, and us, particularly if those recalls cause consumers to question the safety or reliability of products similar to those we produce. In addition, with global platforms and procedures, vehicle manufacturers are increasingly evaluating our quality performance on a global basis; any one or more quality, warranty or other recall issue(s) (including issues affecting few units and/or having a small financial impact) may cause a vehicle manufacturer to implement measures which may have a severe impact on our operations, such as a global, temporary or prolonged suspension of new orders. In addition, as our products more frequently use global designs and are based on or utilize the same or similar parts, components or solutions, there is a risk that the number of vehicles affected globally by a failure or defect will increase significantly with a corresponding increase in our costs. A warranty, recall or product liability claim brought against us in excess of our available insurance may have a material adverse effect on our business. Vehicle manufacturers are also increasingly requiring their outside suppliers to guarantee or warrant their products and bear the costs of repair and replacement of such products under new vehicle warranties. A vehicle manufacturer may attempt to hold us responsible for some or the entire repair or replacement costs of defective products under new vehicle warranties when the product supplied did not perform as represented. Accordingly, the future costs of warranty claims by our customers may be material. However, the final amounts determined to be due related to these matters could differ materially from our recorded warranty estimates and our business prospects, operating results, cash flows or financial condition may be materially impacted as a result. In addition, as we adopt new technology, we face an inherent risk of exposure to the claims of others that we have allegedly violated their intellectual property rights. We cannot assure that we will not experience any material warranty, product liability or intellectual property claim losses in the future or that we will not incur significant costs to defend such claims.
11
See “If our patents are declared invalid or our technology infringes on the proprietary rights of others, our ability to compete may be impaired”.
Escalating pricing pressures from our customers may adversely affect our business
The automotive industry continues to experience aggressive pricing pressure from customers. This trend is partly attributable to the major automobile manufacturers’ strong purchasing power. As with other automotive component manufacturers, we are often expected to quote fixed prices or are forced to accept prices with annual price reduction commitments for long-term sales arrangements or discounted reimbursements for engineering work. Price reductions have impacted our sales and profit margins and are expected to continue to do so in the future. While we have recently received inflation related pricing concessions from most of our customers, there is no guarantee that this will occur in the future. Our future profitability will depend upon, among other things, our ability to continuously reduce our cost per unit and maintain our cost structure, enabling us to remain cost-competitive. Our profitability is also influenced by our success in designing and marketing technological improvements in automotive safety systems, which helps us offset price reductions by our customers. If we are unable to offset continued price reductions through improved operating efficiencies and reduced expenditures, these price reductions may have a material adverse effect on our business prospects, operating results, cash flows or financial condition.
We could experience disruption in our supply or delivery chain, which could cause one or more of our customers to halt or delay production
We, as with other component manufactures in the automotive industry, ship our products to customer vehicle assembly facilities throughout the world on a “just-in-time” basis for our customers to maintain low inventory levels. Our suppliers (external suppliers as well as our own production sites) use a similar method in providing raw materials to us. However, this “just-in-time” method makes the logistics supply chain in our industry very complex and vulnerable to disruption. Disruptions in our supply chain may result for many reasons, including closures of one of our own or one of our suppliers’ facilities or critical manufacturing lines due to strikes or other labor disputes, mechanical failures, electrical outages, fires, explosions, critical pollution levels, critical health and safety and other working conditions issues (including epidemics and pandemics), natural disasters, war, political upheaval, as well as logistical complications due to labor disruptions, weather or natural disasters, acts of terrorism or violence (such as the disruptions in shipping in the Red Sea), mechanical failures, and legislation or regulation regarding the transport of hazardous goods. Inflation and pricing pressures have also negatively impacted companies in our supply chain. Additionally, we may experience disruptions if there are newly imposed trade restrictions or delays in customs processing, including if we are unable to obtain government authorization to export or import certain materials, including materials that may be viewed as dangerous such as the propellant used for our inflators. As we continue to expand in growth markets, the risk of such disruptions is heightened. The unavailability of even a single small subcomponent necessary to manufacture one of our products, for whatever reason, could force us to cease production of that product, possibly for a prolonged period. Similarly, a potential quality issue could force us to halt deliveries while we validate the products. Even when products are ready to be shipped, or have been shipped, delays may arise before they reach our customer. Also, similar difficulties for other suppliers may force our customers to halt production, which may in turn impact our sales shipments to such customers. When we fail to timely deliver, we may have to absorb our own costs for identifying and resolving the ultimate problem as well as expeditiously producing and shipping replacement components or products. Generally, we must also carry the costs associated with “catching up,” such as overtime and premium freight. If we are the cause of a customer being forced to halt production, the customer may seek to recoup all of its losses and expenses from us. These losses and expenses could be very significant and may include consequential losses such as lost profits. Where a customer halts production because of another supplier failing to deliver on time, we may not be fully compensated, if at all. Thus, any such supply chain disruptions could severely impact our operations and/or those of our customers and force us to halt production for prolonged periods of time which could expose us to material claims for compensation and have a material adverse effect on our business prospects, operating results, or financial condition.
Adverse developments affecting our suppliers could harm our profitability
Any significant disruption in our supplier relationships, particularly relationships with single-source suppliers, could harm our profitability. Furthermore, some of our suppliers may not be able to sufficiently manage the currency commodity cost volatility and/or sharply changing volumes while still performing as we expect. For example, recalls or field actions from our customers can stress the capacity of our supply chain and may inhibit our ability to timely deliver order volumes. We may incur costs as we try to make contingency plans to manage the risks for delivery delays, production delays, production issues or delivery of non-conforming products by our suppliers.
Changes in the source, cost, availability of and regulations pertaining to raw materials and components may adversely affect our profit margins
Our business uses a broad range of raw materials and components in the manufacture of our products, nearly all of which are generally available from a number of qualified suppliers. Our industry may be affected from time to time by limited supplies or price fluctuations of certain key components and materials. Strong worldwide demand for certain raw materials has had a significant impact on prices and short-term availability in recent years. Such price increases have and could materially increase our operating costs and materially and adversely affect our profit margin, as direct material costs amounted to approximately 55% of our net sales in 2024, of which approximately half is the raw material cost portion. Inflation is currently high world-wide and may continue for some time, which could lead to fluctuations in interest rates. Commercial negotiations with our customers and suppliers may not always offset all of the adverse impact of higher raw material, energy, labor, logistics, and commodity costs, including those resulting from tariffs and trade restrictions (including retaliatory tariffs) due to the change in administration in the U.S. Commercial negotiations with our customers and suppliers may not be successful in the future. Even where we are able to pass price increases along to our customer, there may be (i) a lapse of time before we are able to do so such that we must absorb the cost increase, and (ii) a negative impact on our relationships with such customers and suppliers which may limit our success in securing future awards from customers and securing acceptable supplies from suppliers. In addition, no assurances can be given that the magnitude and duration of such cost increases or any future cost increases could not have a larger adverse impact on our profitability and consolidated financial position than currently anticipated. Furthermore, if costs for raw materials go down, the price for our products may decrease as well as the price is indexed to the cost of raw materials. Additionally, various government regulators require companies that manufacture products containing certain minerals and their derivatives that are known as “conflict minerals”, originating from the Democratic Republic of Congo or adjoining countries to perform due diligence and report the source of such materials. There are significant resources associated with complying with these requirements, including diligence efforts to determine the sources of conflict minerals used in our products and potential changes to our processes or supplies as a consequence of such diligence efforts.
12
As there may be only a limited number of suppliers able to offer certified “conflict free” conflict minerals, there can be no assurance that we will be able to obtain necessary conflict free minerals from such suppliers in sufficient quantities or at competitive prices. We may face reputational challenges if we determine that certain of our products contain minerals not determined to be conflict free or if we are unable to sufficiently verify the origins for all minerals used in our products through the procedures we may implement. Furthermore, our customers are also increasingly requiring us to track sustainable sources of certain raw materials, which also requires additional diligence efforts and there can be no assurance that we will be able to obtain these materials in a cost-efficient and sustainable manner. Accordingly, these rules and customer requirements may adversely affect our business prospects, operating results, cash flows, or financial condition.
Our business could be materially and adversely affected if we lost any of our largest customers or if they were unable to pay their invoices
We are dependent on a few large customers with strong purchasing power. This is the result of customer consolidation in the last few decades. In 2024, our top five customers represented around 44% of our consolidated sales, and our largest customer contract accounted for around 4% of our consolidated sales. Although business with any given customer is typically split into several contracts (either on the basis of one contract per vehicle model or on a broader platform basis), the loss of business from any of our major customers (whether by lower overall demand for vehicles, cancellation of existing contracts or the failure to award us new business) could have a material adverse effect on our business, results of operations, and financial condition. Similarly, further consolidation of our customers in the future could make us more reliant upon a smaller group of customers for a significant portion of our consolidated sales and negatively impact our bargaining power when contracting with such customers. Customers may put us on a “new business hold,” which would limit our ability to quote or be awarded all or part of their future vehicle contracts if quality or other issues arise in the vehicles for which we were a supplier. This could have a significant negative impact on our order intake. Such new business holds range in length and scope and are generally accompanied by a certain set of remedial conditions that must be met before we are eligible to bid for new business. Meeting any such conditions within the prescribed timeframe may require additional Company resources. A failure to satisfy any such conditions may have a material adverse impact on our financial results in the long term. There is a risk that one or more of our major customers may be unable to pay our invoices as they become due or that a customer will simply refuse to make such payments given its financial difficulties. If a major customer enters into bankruptcy proceedings or similar proceedings whereby contractual commitments are subject to stay of execution and the possibility of legal or other modification, or if a major customer otherwise successfully procures protection against us legally enforcing its obligations, it is likely, absent special relief such as having a “preferred status”, that we will be forced to record a substantial loss. Additional information concerning our major customers is included in Note 20, Segment Information, of the Consolidated Financial Statements in this Annual Report.
Our inability to effectively manage the timing, quality and costs of new program launches could adversely affect our financial performance
To compete effectively in the automotive supply industry, we must be able to launch new products to meet our customers’ timing, performance, and quality standards. At times, we face an uneven number of launches and some launches, for various reasons, may have shortened launch lead times. We cannot provide assurance that we will be able to install and certify the equipment needed to produce products for new programs in time for the start of production, or that the transitioning of our manufacturing facilities and resources to full production for such new programs will not impact production rates or other operational efficiency measures at our facilities. In addition, we cannot provide assurance that our customers will execute on schedule the launch of their new product programs, for which we might supply products. Additionally, as a Tier 1 supplier, we must effectively coordinate the activities of numerous suppliers in order to launch programs successfully. Given the complexity of new program launches, especially involving new and innovative technologies, we may experience difficulties managing product quality, timeliness and associated costs. In addition, new program launches require a significant ramp up of costs; however, the sales related to these new programs generally are dependent upon the timing and success of the introduction of new vehicles by the Company’s customers. Our inability to effectively manage the timing, quality and costs of these new program launches could adversely affect our business prospects, operating results, cash flows, or financial condition.
Changes in our product mix may impact our financial performance
We sell products that have varying profit margins. Our financial performance can be impacted depending on the mix of products we sell during a given period. Our earnings guidance, estimates, and financial targets assume a certain product sales mix as well as a geographic sales mix as many of the growth markets have a lower content per vehicle. If actual results vary significantly from this projected product and geographic mix of sales, our operating results and financial condition could be negatively impacted.
13
We are involved from time to time in legal proceedings and our business may suffer as a result of adverse outcomes of current or future legal proceedings
We are, from time to time, involved in litigation, regulatory proceedings, and commercial or contractual disputes that may be significant. These matters may include, without limitation, disputes with our suppliers and customers, intellectual property claims, shareholder litigation, government investigations, class action lawsuits, personal injury claims, product liability claims, environmental issues, antitrust, customs and VAT disputes, and employment and tax issues. In such matters, government agencies or private parties may seek to recover from us very large, indeterminate amounts in penalties or monetary damages (including, in some cases, treble or punitive damages) or seek to limit our operations in some way. The possibility exists that claims may be asserted against us and their magnitude may remain unknown for long periods of time. These types of lawsuits could require a significant amount of management’s time and attention and a substantial legal liability or adverse regulatory outcome and the substantial expenses to defend the litigation or regulatory proceedings may have a material adverse effect on our customer relationships, business prospects, reputation, operating results, cash flows, and financial condition. No assurances can be given that such proceedings and claims will not have a material adverse impact on our profitability and consolidated financial position or that our established reserves or our available insurance will mitigate such impact.
We are and may be in the future subject to civil antitrust litigation that could negatively impact our business
The Company was previously the subject of an investigation by the European Commission (“EC”) regarding possible anti-competitive behavior among certain suppliers to the automotive vehicle industry that was resolved in 2019. The Company is subject to civil antitrust lawsuits in the UK and Germany filed by certain customers with respect to allegations over a decade ago and may be subject to such civil antitrust lawsuits in the future in countries that permit such civil claims, including lawsuits or other actions by our customers. The trial associated with the lawsuit in the UK recently concluded and a ruling in the proceeding is expected imminently. These types of lawsuits require significant management time and attention and could result in significant expenses. Any unfavorable outcomes of such lawsuits could have a material adverse impact on our customer relationships, business prospects, reputation, operating results, cash flows, or financial condition, and our insurance may not mitigate such impact. See Note 18, Contingent Liabilities, to the Consolidated Financial Statements in this Annual Report.
Work stoppages, slow-downs or other labor issues at our customers’ facilities or at our facilities could adversely affect our operations
Because the automotive industry relies heavily on “just-in-time” delivery of components during the assembly and manufacture of vehicles, a work stoppage or slow-down at one or more of the Company’s facilities could have a material adverse effect on our business. Similarly, if any of our customers were to experience a work stoppage or slow-down, that customer may halt or limit the purchase of our products. Similarly, a work stoppage or slow-down at another supplier could interrupt production at one of our customers’ facilities which would have the same effect. While labor contract negotiations at our facilities historically have rarely resulted in work stoppages, no assurances can be given that we will be able to negotiate acceptable contracts with these unions or that our failure to do so will not result in work stoppages. A work stoppage or other labor disruption at one or more of our facilities or our customers’ facilities could cause us to shut down production facilities supplying these products, which could have a material adverse effect on our business, results of operations, and financial condition.
Our ability to operate our company effectively could be impaired if we fail to attract and retain executive officers and other key personnel
Our ability to operate our business and implement our strategies effectively depends, in part, on the efforts of our executive officers and other key employees. In addition, our future success will depend on, among other factors, our ability to attract, develop, and retain other qualified personnel, particularly engineers and other employees with software and technical expertise. The loss of the services of any of our executive officers or other key employees or the failure to attract, develop, or retain other qualified personnel could have a material adverse effect on our business.
Restructuring, efficiency, and strategic initiatives and capacity alignments are complex and difficult and at any time additional restructuring steps may be necessary, possibly on short notice and at significant cost
Our restructuring, efficiency, and strategic initiatives and capacity alignments include efforts to adjust our manufacturing capacity, direct and indirect labor workforce, and cost structure to meet current and projected operational and market requirements, including plant closures, transfer of sourcing to best cost countries, consolidation of our supplier base, and standardization of products to reduce our overhead costs and consolidate our operational centers. The successful implementation of our restructuring activities and capacity alignments will involve sourcing, logistics, technology, and employment arrangements. Because these restructuring, efficiency, and strategic initiatives and capacity alignments can be complex, there may be difficulties or delays in the implementation of any such initiatives and capacity alignments or they may not be immediately effective, resulting in an adverse material impact on our performance. In addition, there is a risk that inflation, high-turnover rates, and increased competition may reduce the efficiencies now available in best-cost countries to levels that no longer allow for cost-beneficial restructuring opportunities. Therefore, there can be no assurances that any future restructurings or capacity alignments will be completed as planned or achieve the desired results. See Note 12, Restructuring, to the Consolidated Financial Statements in this Annual Report.
14
A prolonged recession and/or a downturn in our industry could result in us having insufficient funds to continue our operations and external financing may not be available to us or available only on materially different terms than what has historically been available
Our ability to generate cash from our operations is highly dependent on automotive sales and LVP, the global economy, and the economies of our important markets. If LVP were to remain on low levels for an extended period of time, we would experience a significantly negative cash flow. Similarly, if cash losses for customer defaults rise sharply, we would experience a negative cash flow. Such negative cash flow could result in our having insufficient funds to continue our operations unless we can procure external financing, which may not be possible. Our access to debt, securitization, or derivative markets around the world at competitive rates or in sufficient amounts could be affected by credit rating downgrades, market volatility, market disruption, regulatory requirements, or other factors. Our ability to obtain unsecured funding at a reasonable cost is dependent on our credit ratings or our perceived creditworthiness. Our current credit rating could be lowered as a result of us experiencing significant negative cash flows, increasing our indebtedness and leverage, or a dire financial outlook, which may affect our ability to procure financing. We may also for the same, or other reasons, find it difficult to secure new long-term credit facilities, at reasonable terms, when our principal credit facility expires in 2029. Further, even our existing unutilized credit facilities may not be available to us as agreed, or only at additional cost, if participating banks are unable to raise the necessary funds, where, for instance, financial markets are not functioning as expected or one or more banks in our principal credit facility syndicate were to default. As a result, we cannot assure you that we will continue to have sufficient liquidity to meet our operating needs. In the event that we do not have sufficient external financing, we may be required to seek additional capital, sell assets, reduce or cut back our operating activities or otherwise alter our business strategy. Information concerning our credit facilities and other financings is included in Item 7 in this Annual Report in the section headed “Treasury Activities” and in Note 14, Debt and Credit Agreements, to the Consolidated Financial Statements in this Annual Report.
Our indebtedness may harm our financial condition and results of operations
As of December 31, 2024, we have outstanding debt of $1.9 billion. We may incur additional debt for a variety of reasons. Although our significant credit facilities and debt agreements do not have any financial covenants, our level of indebtedness will have several important effects on our future operations, including, without limitation: a portion of our cash flows from operations will be dedicated to the payment of any interest or could be used for amortization required with respect to outstanding indebtedness; increases in our outstanding indebtedness and leverage will increase our vulnerability to adverse changes in general economic and industry conditions, as well as to competitive pressure; depending on the levels of our outstanding debt, our ability to obtain additional financing for working capital, acquisitions, capital expenditures, general corporate and other purposes may be limited; and potential future tightening of the availability of capital both from financial institutions and the debt markets may have an adverse effect on our ability to access additional capital.
Governmental restrictions may impact our business adversely
Some of our customers are (or may be) owned by a governmental entity, receive various forms of governmental aid or support, or are subject to governmental influence in other forms, which may impact us as a supplier to these customers. As a result, they may be required to partner with local entities or procure components from local suppliers to achieve a specific local content or be subject to other restrictions regarding localized content or ownership. The nature and form of any such restrictions or protections, whatever their basis, is very difficult to predict as is their potential impact. However, they are likely to be based on political rather than economical or operational considerations and may materially impact our business.
Impairment charges relating to our assets, goodwill and other intangible assets could adversely affect our financial performance
We periodically review the carrying value of our assets, goodwill and other intangible assets for impairment indicators. If one or more of our customers’ facilities cease production or decrease their production volumes, the assets we carry related to our facilities serving such customers may decrease in value because we may no longer be able to utilize or realize them as intended. Where such decreases are significant, such impairments may have a material adverse impact on our financial results. We monitor the various factors that impact the valuation of our goodwill and other intangible assets, including expected future cash flow levels, global economic conditions, market price for our stock, and trends with our customers. Impairment of goodwill and other identifiable intangible assets may result from, among other things, deterioration in our performance and especially the cash flow performance of these goodwill assets, adverse market conditions and adverse changes in applicable laws or regulations. If there are changes in these circumstances or the other variables associated with the estimates, judgments and assumptions relating to the valuation of goodwill, when assessing the valuation of our goodwill items, we may determine that it is appropriate to write down a portion of our goodwill or intangible assets and record related non-cash impairment charges. In the event that we determine that we are required to write-down a portion of our goodwill items and other intangible assets and thereby record related non-cash impairment charges, our financial condition and operating results would be adversely affected.
15
We face risks related to our defined benefit pension plans and employee benefit plans, including the need for additional funding as well as higher costs and liabilities
Our defined benefit pension plans and employee benefit plans may require additional funding or give rise to higher related costs and liabilities which, in some circumstances, could reach material amounts and negatively affect our operating results. We are required to make certain year-end assumptions regarding our pension plans. Our pension obligations are dependent on several factors, including factors outside our control such as changes in interest rates, the market performance of the diversified investments underlying the pension plans, actuarial data and adjustments and an increase in the minimum funding requirements or other regulatory changes governing the plans. Adverse equity market conditions and volatility in the credit market may have an unfavorable impact on the value of our pension assets and our future estimated pension liabilities. Internal factors such as an adjustment to the level of benefits provided under the plans may also lead to an increase in our pension liability. If these or other internal and external risks were to occur, alone or in combination, our required contributions to the plans and the costs and net liabilities associated with the plans could increase substantially and have a material effect on our business. Information concerning our benefit plans is included in Note 19, Retirement Plans, of the Consolidated Financial Statements in this Annual Report.
We may not be able to, or we may decide not to, pay dividends or repurchase shares at a level anticipated by our shareholders, which could reduce shareholder returns
The extent to which we pay dividends on our common stock and repurchase our common stock in the future is at the discretion of our Board of Directors and depends upon a number of factors, including our earnings, financial condition, cash and capital needs, indebtedness and leverage, and general economic or business conditions. No assurance can be given that we will be able to or will choose to pay any dividends or repurchase any shares in the foreseeable future.
Cybersecurity incidents or other damage to our technology infrastructure could disrupt business operations, result in the loss of critical and confidential information, and adversely impact our reputation and operating results
We rely extensively on information technology (“IT”) networks and systems, our global data centers and services provided over the internet to process, transmit and store electronic information, and to manage or support a variety of business processes or activities across our facilities worldwide. In addition, a greater number of our employees are working remotely which may increase cybersecurity vulnerabilities and risk to our IT networks and systems. The secure operation of our IT networks and systems and the proper processing and maintenance of this information are critical to our business operations. We have been, and likely will continue to be, subject to cyber-attacks. Although we seek to deploy comprehensive security measures to prevent, detect, address and mitigate these threats, there has been an increased level of activity, and an associated level of sophistication, in cyber-attacks against large multinational companies. Threat actors, including nation state attackers, could also use artificial intelligence for malicious purposes, increasing the frequency and complexity of their attacks. The ever-evolving threats mean we and our third-party service providers and vendors must continually evaluate and adapt our respective systems and processes and overall security environment, as well as those of any companies we acquire. There is no guarantee that these measures will be fully implemented, complied with, or effective in safeguarding against all data security breaches, system compromises or misuses of data. Our security measures may be breached due to human or technological error, employee malfeasance, system malfunctions or attacks from uncoordinated individuals or sophisticated and targeted measures known as advanced persistent threats, directed at the Company, its products, its customers, its third-party service providers, and/or other entities with whom we do business. Because techniques used to obtain unauthorized access or to sabotage systems change frequently and generally are not recognized until they are launched against a target, we may be unable to anticipate these techniques or to implement adequate preventative measures. Disruptions and attacks on our IT systems or the systems of third parties storing our data or employee malfeasance or human or technological error could result in the misappropriation, loss, destruction or corruption of our critical data and confidential or proprietary information, personal information of our employees, the leakage of our or our customers’ confidential information, improper use of our systems and networks, production downtimes and both internal and external supply shortages, which could have a material adverse effect on our results of operations. It may also result in the theft of intellectual property or other misappropriation of assets, or otherwise compromise our confidential or proprietary information and materially disrupt our operations. The potential consequences of a material cybersecurity incident include reputational damage, damaged customer relationships, loss of revenue, lower order intake in the future, theft of intellectual property, litigation with third parties, diminution in the value of our investment in research, development and engineering, diversion of the attention of management away from the operation of our business and increased cybersecurity protection and remediation costs, legal claims and liability, regulatory scrutiny, sanctions, fines or penalties (which may not be covered by our insurance policies), negative publicity, release of sensitive and/or confidential information, increases in operating expenses, or lost revenues which in turn could adversely affect our competitiveness and results of operations. To the extent that any disruption or security breach results in a misappropriation, loss, destruction or corruption of our customer’s information, it could affect our relationships with our customers, create significant expense for us to investigate and remediate damage, lead to claims against the Company and ultimately harm our business, strategy, result of operations, or financial condition. In addition, we may be required to incur significant costs to protect against damage caused by these disruptions or security breaches in the future. In the event that our systems are breached or attacked, we may also suffer an outage, failure, or unavailability of data or information technology systems, and interruptions to our business operations while such breach or attacked is being remedied; this may impact data or systems operated by us or by third-party service providers. In addition, as the regulatory environment related to information security, data collection and use, and privacy becomes increasingly rigorous, with new and constantly changing requirements applicable to our business, compliance with those requirements could result in additional costs. Furthermore, our technology systems are vulnerable to damage or interruption from natural disasters, power loss and telecommunication failures. We continuously seek to maintain a robust program of information security and controls, however, any future significant compromise or breach of our data security, whether external or internal, or misuse of customer, associate, supplier or Company data, could result in significant costs, lost sales, fines, lawsuits, and damage to our reputation.
16
Third parties that maintain certain of our confidential and proprietary information could experience a cybersecurity incident
We rely on third parties to provide or maintain some of our IT systems, data centers and related services and do not exercise direct control over these systems. Despite the implementation of security measures at third party locations, these IT systems, data centers and cloud services are also vulnerable to security breaches or other disruptions. Additionally, we and certain of our third-party vendors, collect and store personal information in connection with human resources operations and other aspects of our business. While we obtain assurances that any third parties to whom we provide data will protect this information and, where we deem appropriate, monitor the protections they employ, there remains a risk that the confidentiality of data held by us or by third parties may be compromised, exposing us to liability for such breach.
Global climate change could negatively affect our business
Increased public awareness and concern regarding global climate change may result in more regional and/or national requirements to reduce or mitigate the effects of greenhouse gas emissions. In addition, our shareholders and customers also expect us to reduce our greenhouse gas emissions. There continues to be a lack of consistent climate legislation, which creates economic and regulatory uncertainty. Any future regulations aimed at mitigating climate change may negatively impact the prices of raw materials and energy, as well as the demand for certain of our customer’s products which could in turn impact demand for our products and impact our results of operations. The costs of compliance and any changes to our operations mandated by new or amended laws, may be significant. We may also face unexpected delays in obtaining permits and approvals required by such laws in connection with our manufacturing facilities, which would hinder our operation of these facilities. Furthermore, any violations of these laws may result in substantial fines and penalties, remediation costs, third party damages, or a suspension or cessation of our operations. We also face physical and transition risks from climate change. The manifestations of climate change, such as extreme weather conditions or more frequent extreme weather events, including wildfires, flooding, water stress and extreme heat, could disrupt our operations, damage our facilities, disrupt our supply chain, including our customers or suppliers, impact the availability and cost of materials needed for manufacturing or increase insurance and other operating costs. As a result, severe weather or a natural disaster that results in a prolonged disruption to our operations, or the operations of our customers or suppliers, could have a material adverse effect on our operating results, cash flows or financial condition.
Our goals, targets and ambitions related to sustainability and emissions reduction, and our public statements and disclosures regarding them, expose us to numerous risks
We have developed, and will continue to develop and set, goals, targets, ambitions and other objectives related to sustainability matters, including our net-zero emission targets both for ourselves and our supply chain. Some of these are based on our internal scenario analysis, which may not prove to be accurate and carries inherent uncertainties. Statements related to these goals, targets, ambitions and objectives reflect our current plans and do not constitute a guarantee that they will be achieved. Our efforts to research, establish, accomplish, and accurately report on these goals, targets, and objectives expose us to numerous operational, reputational, financial, legal, and other risks. Additionally, greenhouse gas emissions, particular emissions that come from individuals and entities up and down the value chain (otherwise known as Scope 3 emissions), are very difficult to estimate and our estimates may be materially different than actual emissions. Additionally, accepted methodologies or regulatory requirements for estimating emissions, particularly Scope 3 emissions, continue to evolve. The manner in which we estimate and disclose Scope 3 emissions may differ from other companies and may be different than future regulatory requirements, and currently, we do not include downstream Scope 3 emissions in our targets and ambitions. If future governmental regulations require us to modify the basis of our Scope 3 emissions disclosure, our historically disclosed Scope 3 emissions may change materially. Our ability to achieve any stated goal, target, ambition or objective, including with respect to emissions reduction, is subject to numerous factors and conditions, some of which are outside of our control.
Our business may face increased scrutiny from investors and other stakeholders related to our sustainability activities, including the goals, targets, and objectives that we announce, and our methodologies and timelines for pursuing them. If our sustainability practices do not meet investor or other stakeholder expectations and standards, which continue to evolve, our reputation, our ability to attract or retain employees, and our attractiveness as an investment or business partner could be negatively affected. Similarly, our failure or perceived failure to pursue or fulfill our sustainability-focused goals, targets, ambitions and objectives, to comply with ethical, environmental, or other standards, regulations, or expectations, or to satisfy various reporting standards with respect to these matters, within the timelines we announce, or at all, could adversely affect our business or reputation, as well as expose us to government enforcement actions and private litigation.
RISKS RELATED TO INTERNATIONAL OPERATIONS
Our business is exposed to risks inherent in international operations
We currently conduct operations in various countries and jurisdictions, including locating certain of our manufacturing and distribution facilities internationally, which subjects us to the legal, political, regulatory and social requirements and economic conditions in these jurisdictions. Some of these countries are considered growth markets and emerging markets. International sales and operations, especially in growth markets, subject us to certain risks inherent in doing business abroad, including: exposure to local economic conditions; unexpected changes in laws, regulations, trade, or monetary or fiscal policy, including interest rates, foreign currency exchange rates, and changes in inflation rates; foreign tax consequences; inability to collect, or delays in collecting, value-added taxes and/or other receivables associated with remittances and other payments by subsidiaries; exposure to local political turmoil and challenging labor conditions; changes in general economic and political conditions in countries where we operate, particularly in emerging markets; expropriation and nationalization; enforcing legal agreements or collecting receivables through foreign legal systems; wage inflation; currency controls, including lack of liquidity in foreign currency due to governmental restrictions, trade protection policies and currency controls, which may create difficulty in repatriating profits or making other remittances; compliance with the requirements of an increasing body of applicable anti-bribery laws; reduced intellectual property protection in various markets; investment restrictions or requirements; and the imposition of product tariffs and the burden of complying with a wide variety of international and U.S. export laws. The Company is subject to taxation in the U.S. and numerous foreign jurisdictions. The Organization for Economic Co-operation and Development (“OECD”) continues its base erosion and profit shifting (“BEPS”) project begun in 2015 with new proposals for a global minimum tax, further development of a coordinated set of rules for taxation and the allocation of taxing rights between jurisdictions. These proposals, if adopted by countries in which we operate, could result in changes to tax policies, including transfer pricing policies, which could ultimately impact our tax liabilities.
17
Changes in tax laws or policies by the U.S. or foreign jurisdictions could result in a higher effective tax rate on our worldwide earnings, and any such change could have a material adverse effect on our business prospects, cash flows, operating results and financial condition.
Our international operations also depend upon favorable trade relations between the countries where we manufacture and sell products and those foreign countries in which our customers and suppliers have operations. The current U.S. presidential administration has created uncertainty about the future relationship between the U.S. and certain of its trading partners, including with respect to the trade policies and agreements, treaties, government regulations and tariffs that could apply to trade between the U.S. and other nations. For example, the U.S. administration has indicated that it intends to impose tariffs on imports from Mexico, Canada, and the European Union. In February 2025, additional tariffs have been applied to imports from China and China responded with retaliatory tariffs on the import of American goods. Changes in national policy, other governmental action related to tariffs or international trade agreements, changes in social, political regulatory, and economic conditions or in laws and policies governing foreign trade, manufacturing, development and investment in the territories and countries where the Company currently manufactures and sells products, and any resulting negative sentiments towards the Company as a result of such changes could depress economic activity and restrict our access to suppliers or customers and have a material adverse effect on our cash flows, operating results and financial condition.
Increasing our manufacturing footprint in the growth markets and our business relationships with automotive manufacturers in these markets are particularly important elements of our strategy. As a result, our exposure to the risks described above may be greater in the future, and our exposure to risks associated with developing countries, such as the risk of political upheaval and reliability of local infrastructure, may increase. It could also impact importing certain foreign-produced vehicles into the U.S. Changes in national policy or continued uncertainty could depress economic activity and restrict our access to suppliers or customers and have a material adverse effect on our cash flows, operating results and financial condition. Additionally, such trade restrictions or material increases in tariffs could impact our targets, earnings guidance, and estimates. The ultimate impact of any tariffs, including any related responses, are uncertain and will depend on various factors, including if any tariffs are ultimately implemented, the timing of implementation, and the amount, scope, and nature of the tariffs. Any or all of these actions could adversely affect our business, financial condition and cash flows. Increasing our manufacturing footprint in the growth markets and our business relationships with automotive manufacturers in these markets are particularly important elements of our strategy. As a result, our exposure to the risks described above may be greater in the future, and our exposure to risks associated with developing countries, such as the risk of political upheaval and reliability of local infrastructure, may increase. It could also impact importing certain foreign-produced vehicles into the U.S. Changes in national policy or continued uncertainty could depress economic activity and restrict our access to suppliers or customers and have a material adverse effect on our cash flows, operating results and financial condition.
Unfavorable global economic conditions and geopolitical events could adversely affect our business, results of operations and financial condition
The macro-economic uncertainty has been exacerbated by the war in Ukraine and the war in Israel/Gaza, and disruptions to shipping in the Red Sea. Although the length and impact of the ongoing war/conflicts is highly unpredictable, it exacerbated volatility in commodity prices, energy prices, inflationary pressures, credit markets, foreign exchange rates and supply chain disruptions. Furthermore, governments in the United States, United Kingdom, Canada, and European Union have each imposed export controls on certain products and financial and economic sanctions on certain industry sectors and parties in Russia. Existing or additional sanctions could further adversely affect the global economy and further disrupt the global supply chain. Inflation is also currently high world-wide and may continue for an unforeseen time, which could lead to fluctuations in interest rates.
Due in part to the negative impact of the war in Ukraine, we have experienced exacerbated increases in raw materials and increased costs for transportation, energy, and commodities. Although we have negotiated and continue to negotiate with our customers with respect to these additional costs, commercial negotiations with our customers may not be successful or may not offset all of the adverse impact of higher transportation, energy and commodity costs. Additionally, even if we are successful with respect to negotiations with customers relating to cost increases, there may be delay before we recover any increased costs. These may have a material negative impact on our business, results of operations, and financial condition.
Significant changes in the United States Mexico Canada Agreement (USMCA) could adversely affect our financial performance
The U.S., Mexico and Canada entered into the USMCA, a successor to the North American Free Trade Agreement (NAFTA), effective as of July 1, 2020. The USMCA changed the automotive rules of origin that dictate what percentage of an automobile must be built from parts that originated from countries in the NAFTA region. The rules require that at least 75% of parts be made in North America and that 40-45% of an automobile must be made by workers earning at least $16 an hour. Reflective of the automotive industry, our vehicle parts manufacturing facilities in the U.S., Mexico and Canada are highly dependent on duty-free trade amongst the U.S., Mexico, and Canada. The USMCA will undergo a joint review in 2026. If the USMCA is earlier terminated, or otherwise substantially amended, it could have a material adverse impact on our financial performance. The imposition of customs duties on imports into the U.S., Mexico or Canada could negatively impact our financial performance.
18
Our foreign operations may subject us to risks relating to laws governing international relations
Due to our global operations, we are subject to many laws governing international relations (including, but not limited to, the Foreign Corrupt Practices Act, and other anti-bribery regulations in foreign jurisdictions where we do business), which prohibit improper payments to government officials and restrict where and how we can do business, what information or products we can supply to certain countries and what information we can provide to authorities in governmental authorities. We also export components and products that are subject to certain trade-related U.S. laws, including the U.S. Export Administration Act and various economic sanctions programs administered by the U.S. Treasury’s Office of Foreign Assets Control. Although we have procedures and policies in place that should mitigate the risk of violating these laws, there is no guarantee that they will be sufficiently effective. If and when we acquire new businesses, we may not be able to ensure that the pre-existing controls and procedures meant to prevent violations of these laws were effective, and violations may occur if we are unable to timely implement corrective and effective controls and procedures when integrating newly acquired businesses. Any allegations of noncompliance with these laws could harm our reputation, divert management attention and result in significant expenses, and could therefore materially harm our business prospects, operating results and financial condition.
Our business in Asia is subject to aggressive competition and is sensitive to economic, market, and political conditions
We operate in the automotive supply market throughout Asia including the highly competitive markets in China, South Korea, and India. In each of these markets we face competition from both international and smaller domestic manufacturers. Due to the significance of the Asian markets for our profit and growth, we are exposed to risks in China, South Korea, and India. We anticipate that additional competitors, both international and domestic, may seek to enter the Chinese, South Korean, and/or Indian markets resulting in increased competition. Increased competition may result in lower sales volumes, price reductions, reduced margins and our inability to gain or hold market share. There have been periods of increased market volatility and moderation in the levels of economic growth in China, which resulted in periods of lower automotive production growth rates in China than those previously experienced. Our business in Asia is sensitive to economic and market conditions that drive automotive sales volumes in China, South Korea, and India and may be impacted if there are reductions in vehicle demand in those markets. There are also trade and political tensions between China and other countries in the western world. If we are unable to maintain our position in the Asian markets, the pace of growth slows, or vehicle sales in these markets decrease, our business prospects, operating results and financial condition could be materially adversely affected.
Global integration may result in additional risks
Because of our efforts to manage costs by integrating our operations globally, we face the additional risk that, should any of the other risks discussed herein materialize, the negative effects could be more pronounced. For example, while supply delays of a component have typically only affected a few customer vehicle models, such a delay could now affect several vehicle models of several customers in several geographic areas. Similarly, any recall or warranty issue we face due to a product defect or failure is now more likely to involve a larger number of units in several geographic areas.
Our business faces exchange rate risks
As a result of our global presence, a significant portion of our revenues and expenses are denominated in currencies other than the U.S. dollar. We are therefore subject to foreign currency risks and foreign exchange exposure. Such risks and exposures include: transaction exposure, which arises because the cost of a product originates in one currency and the product is sold in another currency; revaluation effects, which arise from valuation of assets denominated in other currencies than the reporting currency of each unit; translation exposure in the income statement, which arises when the income statements of non-U.S. subsidiaries are translated into U.S. dollars; translation exposure in the balance sheet, which arises when the balance sheets of non-U.S. subsidiaries are translated into U.S. dollars; and changes in the reported U.S. dollar amounts of cash flows. We cannot predict exchange rate volatility or the extent of its impact on our future financial results. We typically denominate foreign transactions in foreign currencies to achieve a natural hedge. However, a natural hedge cannot be achieved for all our currency flows; therefore, a net transaction exposure remains within the group. The net exposure can be significant and creates a transaction exposure risk for the Company. The Company does not hedge translation exposure. However, we do engage in foreign exchange rate hedging from time to time related to foreign currency transactions. For additional information, see Part II, Item 7A. Quantitative and Qualitative Disclosures about Market Risk - Currency risks.
RISKS RELATED TO ACQUISITIONS
We face risks in connection with acquisitions, joint ventures, partnerships, and other strategic transactions
Our growth has been enhanced through strategic transactions, including acquisitions of businesses, products and technologies, partnerships, strategic alliances, and joint development agreements that we believe will complement our business. We regularly evaluate acquisition opportunities, frequently engage in acquisition discussions, conduct due diligence activities in connection with possible acquisitions, and, where appropriate, engage in acquisition negotiations. We may not be able to successfully identify suitable acquisition and joint venture candidates or complete transactions on acceptable terms, integrate acquired operations into our existing operations or expand into new markets. Our failure to identify suitable strategic transactions may restrict our ability to grow our business. These strategic transactions also involve numerous additional risks to us and our investors, including: risks related to retaining acquired management and employees; difficulties in integrating acquired technologies, products, operations, services and personnel with our existing businesses; diversion of our management’s attention from other business concerns; assumption of contingent liabilities; potential adverse financial impacts, including from the amortization of expenses related to intangible assets and from potential impairment of goodwill; incurrence of indebtedness; and potential damage to existing customer relationships or lack of customer acceptance or inability to attract new customers as a result of these transactions. In the future, we may pursue acquisitions of businesses or products that are complementary to our business but for which we have historically had little or no direct experience. These transactions can involve significant challenges and risks as well as significant time and resources that may divert management’s attention from other business activities. If we fail to adequately manage these risks, the acquisitions and other strategic transactions may not result in revenue growth, operational synergies or service or technology enhancements, which could adversely affect our financial condition.
19
RISKS RELATED TO INTELLECTUAL PROPERTY
If our patents are declared invalid or our technology infringes on the proprietary rights of others, our ability to compete may be impaired
We have developed a considerable amount of proprietary technology related to automotive safety systems and rely on a number of patents to protect such technology. Our intellectual property plays an important role in maintaining our competitive position in a number of the markets we serve. At present, we hold more than 6,600 patents and patent applications covering a large number of innovations and product ideas, mainly in the fields of seatbelt and airbag technologies. In addition to our in-house research and development efforts, we seek to acquire rights to new intellectual property through corporate acquisitions, asset acquisitions, licensing and joint venture arrangements. Our patents and licenses expire on various dates during the period from 2025 to 2044. We do not expect the expiration of any single patent or license to have a material adverse effect on our business, operating results and financial condition. Developments or assertions by or against us relating to intellectual property rights could negatively impact our business. We primarily protect our innovations with patents and vigorously protect and defend our patents, trademarks and know-how against infringement and unauthorized use. If we are not able to protect our intellectual property and our proprietary rights and technology, we could lose those rights and incur substantial costs policing and defending those rights. We also generate license revenue from these patents, which we may lose if we do not adequately protect our intellectual property and proprietary rights. Our means of protecting our intellectual property, proprietary rights and technology may not be adequate, and our competitors may independently develop technologies that are similar or superior to our proprietary technologies, duplicate our technologies, or design around the patents we own or license. In addition, the laws of some foreign countries do not protect our proprietary rights to as great an extent as the laws of the U.S. and we may encounter significant problems in protecting and defending our intellectual property rights in certain foreign jurisdictions. This could make it difficult for us to stop the infringement of our patents or misappropriation of our other intellectual property rights. Proceedings to enforce our patent rights in foreign jurisdictions could result in substantial costs and divert our efforts and attention from other aspects of our business. Accordingly, our efforts to protect our intellectual property rights in such countries may be inadequate.
We may not be able to protect our proprietary technology and intellectual property rights, which could result in the loss of our rights or increased costs
Although we believe that our products and technology do not infringe the proprietary rights of others, third parties may assert infringement claims against us in the future. Additionally, we license proprietary technology, from third parties, which is covered by patents, and we cannot be certain that any such patents will not be challenged, invalidated, or circumvented. Such licenses may also be non-exclusive, meaning our competition may also be able to access such technology. Further, we expect to continue to expand our products and services and expand into new businesses, including through developing new products, acquisitions, joint ventures and joint development agreements, which could increase our exposure to patent and other intellectual property claims from competitors and other parties. If claims alleging patent, copyright or trademark infringement are brought against us and are successfully prosecuted against us, they could result in substantial costs. If a successful claim is made against us and we fail to develop non-infringing technology, our business, operating results and financial condition could be materially adversely affected. In addition, certain of our products utilize components that are developed by third parties and licensed to us. If claims alleging patent, copyright or trademark infringement are brought against such licensors and successfully prosecuted, they could result in substantial costs, and we may not be able to replace the functions provided by these licensors. Alternate sources for the technology currently licensed to us may not be available in a timely manner, may not provide the same functions as currently provided or may be more expensive than products currently used. We may develop proprietary information through our in-house research and development efforts, consulting arrangements or research collaborations with other entities or organizations. We may seek to protect this proprietary information by entering into confidentiality agreements or consulting, services or employment agreements that contain non-disclosure and non-use provisions with our employees, consultants, scientific advisors and other third parties. However, we may fail to enter into the necessary agreements, and even if entered into, these agreements may be breached or may otherwise fail to prevent disclosure, third-party infringement or misappropriation of our proprietary information.
We may not be able to respond quickly enough to changes in technology and technological risks and to develop our intellectual property into commercially viable products
Changes in legislative, regulatory, or industry requirements or in competitive technologies may render certain of our products obsolete or less attractive to our customers. We currently license certain proprietary technology to third parties and, if such technology becomes obsolete or less attractive, those licensees could terminate our license agreements, which could adversely affect our results of operations. Our ability to anticipate changes in technology and regulatory standards and to successfully develop and introduce new and enhanced products on a timely basis will be a significant factor in our ability to remain competitive. We cannot provide assurance that we will be able to achieve the technological advances that may be necessary for us to remain competitive or that certain of our products will not become obsolete. We are also subject to the risks generally associated with new product introductions and applications, including lack of market acceptance, delays in product development and failure of products to operate properly. As part of our business strategy, we may from time to time seek to acquire businesses or assets that provide us with additional intellectual property. We may experience problems integrating acquired technologies into our existing technologies and products, and such acquired intellectual property may be subject to known or contingent liabilities such as infringement claims.
Some of our products and technologies may use “open source” software, which may restrict how we use or distribute our products or require that we release the source code of certain products subject to those licenses
Some of our products and technologies may incorporate software licensed under so-called “open source” licenses. In addition to risks related to license requirements, usage of open source software can lead to greater risks than use of third-party commercial software, as open source licensors generally do not provide warranties or controls on origin of the software. Additionally, open source licenses typically require that source code subject to the license be made available to the public and that any modifications or derivative works to open source software continue to be licensed under open source licenses. These open source licenses typically mandate that proprietary software, when combined in specific ways with open source software, become subject to the open source license.
20
If we combine our proprietary software in such ways with open source software, we could be required to release the source code of our proprietary software. We take steps to ensure that our proprietary software is not combined with, and does not incorporate, open source software in ways that would require our proprietary software to be subject to an open source license. However, few courts have interpreted open source licenses; therefore, the way these licenses may be interpreted and enforced is subject to some uncertainty.
RISKS RELATED TO GOVERNMENT REGULATIONS AND TAXES
Our business may be adversely affected by laws or regulations, including environmental, occupational health and safety, and other governmental regulations
We are subject to various federal, state, local and foreign laws and regulations, including those related to the requirements of environmental, occupational health and safety, financial, and other matters. We cannot predict the substance or impact of pending or future legislation or regulations, or the application thereof. The introduction of new laws or regulations or changes in existing laws or regulations, or the interpretations thereof, could increase the costs of doing business for us or our customers or suppliers or restrict our actions and adversely affect our business prospects, operating results, cash flows or financial condition. Our operations are subject to environmental and safety laws and regulations governing, among other things, emissions to air, discharges to waters and the generation, handling, storage, transportation, treatment and disposal of waste and other materials. The operation of automotive parts manufacturing facilities entails risks in these areas, and we cannot assure that we will not incur material costs or liabilities as a result. Additionally, environmental laws, regulations, and permits and the enforcement thereof change frequently and have tended to become increasingly stringent over time, which may necessitate substantial capital expenditures or operating costs or may require changes of production processes. Although we have no known pending material environmental issues, there is no assurance that we will not be adversely impacted by any environmental costs, liabilities, or claims in the future either under present laws and regulations or those that may be adopted or imposed in the future. Our costs, liabilities, and obligations relating to environmental matters may have a material adverse effect on our business, operating results, cash flows, or financial condition. Our facilities in the U.S. are subject to regulation by the Occupational Safety and Health Administration (“OSHA”), which regulates the protection of the health and safety of workers. In addition, the OSHA hazard communication standard requires that we maintain information about hazardous materials used or produced in our operations and that we provide this information to employees, state and local governmental authorities and residents. We are also subject to occupational safety regulations in other countries. Our failure to comply with government occupational safety regulations, including OSHA requirements, or general industry standards relating to employee health and safety, keep adequate records or monitor occupational exposure to regulated substances could expose us to liability, enforcement, and fines and penalties, and could have a material adverse effect on our business, operating results, cash flows, or financial condition. Although we employ safety procedures in the design and operation of our facilities, there is a risk that an accident or injury to one of our employees could occur in one of our facilities. Any accident or injury to our employees could result in litigation, manufacturing delays and harm to our reputation, which could negatively affect our business, operating results, and financial condition.
Our business may be adversely affected by changes in automotive safety regulations or concerns that drive further regulation of the automobile safety market
Government vehicle safety regulations are a key driver in our business. Historically, these regulations have imposed ever more stringent safety regulations for vehicles. Safety regulations have a positive impact on driver awareness and acceptance of automotive safety products and technology. These more stringent safety regulations often require vehicles to have more safety content per vehicle and more advanced safety products, which has thus been a driver of growth in our business. However, these regulations are subject to change based on a number of factors that are not within our control, including new scientific or medical data, adverse publicity regarding the industry recalls and safety risks of airbags or seatbelts (for instance, to children and small adults), domestic and foreign political developments or considerations, and litigation relating to our products and our competitors’ products. Changes in government regulations in response to these and other considerations could have a severe impact on our business. Although we believe that over time safety will continue to be a regulatory priority, if government priorities shift and we are unable to adapt to changing regulations, our business may suffer material adverse effects. The regulatory obligation of complying with safety regulations could increase as federal and local regulators impose more stringent compliance and reporting requirements in response to product recalls and safety issues in our industry. We are subject to existing stringent requirements under the National Traffic and Motor Vehicle Safety Act of 1966 (the “Vehicle Safety Act”), including a duty to report, subject to strict timing requirements, safety defects with our products. The Vehicle Safety Act imposes potentially significant civil penalties for violations including the failure to comply with such reporting actions. We are also subject to the existing U.S. Transportation Recall Enhancement, Accountability and Documentation (“TREAD”) Act, which requires equipment manufacturers, such as Autoliv, to comply with “Early Warning” requirements by reporting certain information to NHTSA such as: information related to defects or reports of injury related to our products. TREAD imposes criminal liability for violating such requirements if a defect subsequently causes death or bodily injury. In addition, the Vehicle Safety Act authorizes NHTSA to require a manufacturer to recall and repair vehicles that contain safety defects or fail to comply with U.S. federal motor vehicle safety standards. Sales into foreign countries may be subject to similar regulations. Due to the record recall of airbag inflators of one of our competitors, NHTSA has become more active in requesting information from suppliers and vehicle manufactures regarding potential product defects.
Negative or unexpected tax developments could adversely affect our effective tax rate, operating results and financial condition
Changes in, or changes in the application of, U.S. or foreign tax laws, regulations or accounting principles with respect to matters such as tax base, tax rates, transfer pricing, dividends and restrictions on certain forms of tax relief or limitations on favorable tax treatment could affect the calculation of our income taxes and other tax liabilities, our effective tax rate, and the carrying value of our deferred tax assets. Our annual tax rate is based on our income and the tax laws in the jurisdictions in which we operate. Because of our global operations we face uncertainties and judgments in the application of complex tax regulations in a multitude of jurisdictions. Significant judgment and estimation are required in determining our effective tax rate and in evaluating our tax positions, in many cases where the ultimate tax determination is uncertain.
21
Although we believe that our tax estimates are reasonable, the final determination of our tax liability may be different from what is reflected in our historical income tax provisions and accruals. We are regularly examined by tax authorities around the world and in a number of jurisdictions, we are currently under examination, which inherently creates uncertainty. Although we periodically assess the likelihood of adverse outcomes, negative or unexpected results from one or more of such reviews and audits, including any related interest or penalties imposed by governmental authorities, could increase our effective tax rate and adversely impact our operating results, cash flows or financial condition. The effective tax rates used for interim reporting are based on our projected full-year geographic earnings mix and take into account projected tax costs on intercompany dividends from lower tier subsidiaries. Changes in currency exchange rates, earnings mix among taxing jurisdictions, or the ability of our subsidiaries to pay dividends could impact our reported effective tax rates, or cause fluctuations in the tax rate from quarter to quarter. Certain anti-trust judgments or settlements may not be tax deductible, which could have a material negative impact to our annual tax rate. A number of other factors may also increase our effective tax rate, which could have an adverse impact on our profitability and operating results. Due to our numerous foreign operations, our tax rate may be impacted by our global mix of earnings if our pre-tax income is lower than anticipated in countries with lower statutory tax rates and/or is higher than anticipated in countries with higher statutory tax rates. Based on U.S. regulatory rules, we do not record current or deferred tax liabilities on permanent investments in our foreign subsidiaries. See Note 5, Income Taxes, to the Consolidated Financial Statements in this Annual Report.
We may not be able to fully realize our deferred tax assets
We currently carry deferred tax assets, net of valuation allowances, resulting from deductible temporary differences and tax loss carry-forwards, both of which will reduce taxable income in the future. However, deferred tax assets may only be realized against taxable income. The amount of our deferred tax assets could be reduced, from time to time, due to adverse changes in our operations or in estimates of future taxable income from operations during the carry-forward period as a result of a deterioration in market conditions or other circumstances. Any such reduction would adversely affect our income in the period of the adjustment. Additional information on our deferred tax assets is included in Note 5, Income Taxes, to the Consolidated Financial Statements in this Annual Report.
Item 1B. Unresolved Staff Comments Autoliv maintains a cybersecurity program designed to identify, assess, manage, mitigate, and respond to cybersecurity threats as an integrated part of the Company’s overall operations.
Not applicable.
22
Item 1C. Cybersecurity
The objective is to provide protection against cybersecurity threats to our employees, operations, data, and products.
Cybersecurity risk management and strategy
Cybersecurity risk management for the Company is undertaken both through dedicated cybersecurity risk management processes and within the Company’s overall Enterprise Risk Management program, which is overseen by the Audit and Risk Committee of the Company’s Board of Directors.
Autoliv has established an Enterprise Risk Management framework aligned to the ISO 31000:2019 to ensure that the context, principles, and processes for risk management are embedded and integrated with the operations of the company. All risks across the Autoliv risk universe, including cybersecurity, are assessed with bottom-up risk assessments and subsequently are aggregated and reported to the Audit and Risk Committee of the Company’s Board of Directors.
Autoliv utilizes the National Institute of Standards and Technology (“NIST”) Cybersecurity Framework in combination with other corresponding and partially mandated frameworks to guide cybersecurity risk management. This approach includes the identification, assessment, response, and management of risks arising from cybersecurity threats that may result in material adverse effects on the confidentiality, integrity, and availability of our business, data and information systems. The Company contracts with third parties to assess Autoliv’s cybersecurity program relative to its peers, utilizing the NIST framework as a baseline. Furthermore, Autoliv is pursuing, under TISAX (Trusted Information Security Assessment Exchange), an assessment and exchange mechanism for information security in the automotive industry, as well as compliance with road vehicle cybersecurity requirements as applicable to the supply chain under ISO 21434.
Frequent testing/auditing activities, bottom-up cybersecurity risk assessments, vulnerability scanning, monitoring of external threat intelligence and supplier risk sources, and 24/7 incident monitoring are executed by the cybersecurity function to inform our understanding of the cybersecurity risk landscape, including solutions from third-party service providers, and what areas of enhancement to prioritize. Further input is gained from regular maturity assessments executed by third parties as well as TISAX assessments executed by external audit bodies.
Autoliv combines expertise from our internal cybersecurity function with additional specialist capacities from external consultants and partners as may be from time to time. Separately, because we understand the risks associated with engaging third party vendors, such as service providers, consultants and partners, in our cybersecurity risk management processes, we conduct security assessments pre-engagement and monitor their work to mitigate any identified risks.
Autoliv has not experienced any cybersecurity incidents that have materially affected or are reasonably likely to materially affect the Company. Despite our efforts, there can be no assurance that our cybersecurity risk management processes and measures described will be fully implemented, complied with or effective in protecting our systems and information. We face risks from cybersecurity threats that, if realized, are reasonably likely to materially affect our business strategy, result of operations or financial condition. For a full discussion of these cybersecurity risks, please see our Risk Factors in Item 1A.
Board and management governance
Management's Role
The Chief Information Security Officer (CISO) is responsible for overseeing the Company’s cybersecurity practices. Our CISO joined Autoliv in 2015. He has 30 years of information technology experience, including seven years as CISO. The CISO reports directly to the CFO but, in line with the corporate governance model, the CISO’s activities are formally governed through a management board, the “Digitalization and IT Management Board” (“DITM Board”) comprised of the Chief Information Officer (CIO) and certain members of Autoliv’s Executive Management Team (“EMT”) representing engineering, supply chain management, operations and manufacturing, quality and project management, finance, information technology, and divisional teams. The DITM Board meets at least quarterly with cybersecurity as a standing agenda item.
In addition to the standing DITM Board meetings, the CISO, when needs arise, meets with the full EMT typically at least semi-annually to report on, or discuss, specific cybersecurity-related topics.
The Cybersecurity function in Autoliv reports to the CISO. The cybersecurity function includes team members in all of the Company’s divisions including technical security architects and incident response team members. The core team is supported by the broader organization with security coordinators in each plant and tech center and additional functional security experts as deemed relevant, such as in supply chain management and engineering. The function has the responsibility to operate day-to-day activities (e.g., testing, incident monitoring and response, vulnerability scanning and awareness training) as well as to drive prioritized improvements (as identified through the risk management processes), together with other relevant Autoliv functions and stakeholders. The security operations center (“SOC”), part of the Cybersecurity function, monitors Autoliv for cyber incidents 24/7. A documented incident response process and numerous documented playbooks provide the SOC guidance on how to respond for each type of incident, including categorization and principles for escalation.
23
Incidents are escalated in the organization according to defined criteria to engage a level of authority that is deemed appropriate, such as the Corporate Crisis Management Team if necessary.
Board of Directors Oversight
Our Board, in coordination with the Audit and Risk Committee, oversees the Company’s Enterprise Risk Management process, including the management of risks arising from cybersecurity threats. Our Board has delegated the primary responsibility to oversee cybersecurity matters to the Audit and Risk Committee. Both the Board and the Audit and Risk Committee periodically review the measures we have implemented to identify and mitigate cybersecurity risks.
The Audit and Risk Committee receives information from the CISO and other members of management on at least a quarterly basis which is supplemented by a more extensive briefing from the CISO and management on at least a semi-annual basis on cybersecurity matters, including updates on cybersecurity training programs and the results of external assessments, as applicable. The CISO provides at least an annual briefing to the Board of Directors on these same topics.
The routine reporting to the Audit and Risk Committee and the Board includes as appropriate the highlights from the full spectrum of work done within the Company’s cybersecurity program. The briefings by the CISO to the Audit and Risk Committee and Board also include the review of certifications and cybersecurity maturity assessments by management and third parties.
24
Item 2. Properties
Autoliv’s principal executive offices are located at Klarabergsviadukten 70, Section D5, SE-111 64, Stockholm, Sweden. Autoliv’s various businesses operate in a number of production facilities and offices. Autoliv believes that its properties are adequately maintained and suitable for their intended use and that the Company’s production facilities have adequate capacity for the Company’s current and foreseeable needs. All of Autoliv’s production facilities and offices are owned or leased by operating (either subsidiary or joint venture) companies.
AUTOLIV MANUFACTURING FACILITIES |
||||||
|
|
|
|
|
|
|
Country/Company |
|
Location of Facility |
|
Items produced at Facility |
|
Owned/Leased |
Brazil |
|
|
|
|
|
|
Autoliv do Brasil Ltda. |
|
Taubaté |
|
Seatbelts, airbags, steering wheels and seatbelt webbing |
|
Owned |
|
|
Nova Goiana |
|
Seatbelts and steering wheels |
|
Leased |
|
|
|
|
|
|
|
Canada |
|
|
|
|
|
|
Autoliv Canada, Inc. |
|
Tilbury |
|
Airbag cushions |
|
Owned |
VOA Canada, Inc. |
|
Collingwood |
|
Seatbelt webbing |
|
Owned |
|
|
|
|
|
|
|
China |
|
|
|
|
|
|
Autoliv (Baoding) Vehicle Safety Systems Co., Ltd |
|
Baoding |
|
Airbags and steering wheels |
|
Leased |
Autoliv (Changchun) Vehicle Safety Systems Co., Ltd. |
|
Changchun |
|
Airbags and seatbelts |
|
Owned |
Autoliv (China) Steering Wheel Co., Ltd. |
|
Fengxian/Shanghai |
|
Steering wheels |
|
Owned |
Autoliv (Guangzhou) Vehicle Safety Systems Co., Ltd. |
|
Guangzhou |
|
Airbags and seatbelts |
|
Owned |
Autoliv (Nanjing) Vehicle Safety Systems Co., Ltd. |
|
Nanjing |
|
Seatbelts |
|
Owned |
Autoliv Shenda (Nanjing) Automotive Components Co., Ltd. |
|
Nanjing |
|
Seatbelt webbing |
|
Owned |
Autoliv (Shanghai) Vehicle Safety Systems Co., Ltd. |
|
Shanghai |
|
Airbags |
|
Owned |
Autoliv Shenda (Tai Cang) Automotive Safety Systems Co., Ltd. |
|
Shanghai |
|
Seatbelt webbing |
|
Owned |
Autoliv (Jiangsu) Automotive Safety Components Co., Ltd. |
|
Jintan |
|
Propellant, Airbag initiators and Airbag inflators |
|
Owned |
Autoliv (China) Automotive Safety Systems Co., Ltd. |
|
Nantong |
|
Airbag cushions |
|
Owned |
Mei-An Autoliv Co., Ltd. |
|
Taipei |
|
Seatbelts and airbags |
|
Leased |
|
|
|
|
|
|
|
Estonia |
|
|
|
|
|
|
AS Norma |
|
Tallinn |
|
Seatbelts and belt components |
|
Owned |
|
|
|
|
|
|
|
France |
|
|
|
|
|
|
Autoliv France SNC |
|
Gournay-en-Bray |
|
Airbags |
|
Owned |
Autoliv Isodelta SAS |
|
Chiré-en-Montreuil |
|
Steering wheels and covers |
|
Owned |
Livbag SAS |
|
Pont-de-Buis |
|
Airbag inflators |
|
Owned |
N.C.S. Pyrotechnie et Technologies SAS |
|
Survilliers |
|
Airbag initiators and seatbelt micro gas generators |
|
Owned |
|
|
|
|
|
|
|
Hungary |
|
|
|
|
|
|
Autoliv Kft. |
|
Sopronkövesd |
|
Seatbelts |
|
Owned |
|
|
|
|
|
|
|
India |
|
|
|
|
|
|
Autoliv India Private Ltd. |
|
Bangalore |
|
Seatbelts, airbags |
|
Owned |
|
|
Mysore |
|
Seatbelt webbing and Airbag Cushions |
|
Owned |
|
|
Badli |
|
Airbags and steering wheels |
|
Leased |
|
|
Pune |
|
Airbag and Airbag cushions |
|
Leased |
|
|
Chennai |
|
Airbag inflators |
|
Owned |
|
|
|
|
|
|
|
Indonesia |
|
|
|
|
|
|
P.T. Autoliv Indonesia |
|
Jakarta |
|
Seatbelts, airbags and steering wheels |
|
Owned |
|
|
|
|
|
|
|
Japan |
|
|
|
|
|
|
Autoliv Japan Ltd. |
|
Chubu |
|
Airbags and steering wheels |
|
Owned |
|
|
Hiroshima |
|
Airbags |
|
Owned |
|
|
Tsukuba |
|
Airbags, seatbelts and steering wheels |
|
Owned |
|
|
|
|
|
|
|
25
Malaysia |
|
|
|
|
|
|
Autoliv-Hirotako Sdn Bhd |
|
Kuala Lumpur |
|
Seatbelts, airbags and steering wheels |
|
Owned |
|
|
|
|
|
|
|
Mexico |
|
|
|
|
|
|
Autoliv Mexico East S.A. de C.V. |
|
Matamoros |
|
Steering wheels |
|
Owned |
Autoliv Mexico S.A. de C.V. |
|
Lerma |
|
Seatbelts |
|
Owned |
Autoliv Safety Technology de Mexico S.A. de C.V. |
|
Tijuana |
|
Seatbelts |
|
Leased |
Autoliv Steering Wheels Mexico S. de R.L. de C.V. |
|
Querétaro |
|
Airbag cushions |
|
Leased |
Autoliv Steering Wheels Mexico S. de R.L. de C.V. |
|
Querétaro |
|
Airbags |
|
Leased |
Autoliv Mexico S.A. de C.V. |
|
Aguascalientes |
|
Steering wheels |
|
Owned |
|
|
|
|
|
|
|
Philippines |
|
|
|
|
|
|
Autoliv Cebu Safety Manufacturing, Inc. |
|
Cebu |
|
Steering wheels |
|
Owned |
|
|
|
|
|
|
|
Poland |
|
|
|
|
|
|
Autoliv Poland Sp. zo.o. |
|
Olawa |
|
Airbag cushions |
|
Owned |
|
|
Jelcz-Laskowice |
|
Airbags |
|
Owned |
|
|
|
|
|
|
|
Romania |
|
|
|
|
|
|
Autoliv Romania S.R.L. |
|
Brasov |
|
Seatbelts, seatbelt webbing, seatbelt components, airbag inflators, steering wheels |
|
Owned |
|
|
Lugoj |
|
Airbag cushions and airbags |
|
Owned |
|
|
Resita |
|
Airbag cushions |
|
Owned |
|
|
Sfantu Georghe |
|
Steering wheels |
|
Owned |
|
|
Onesti |
|
Steering wheels |
|
Leased |
|
|
Rovinari |
|
Seatbelts |
|
Owned |
|
|
|
|
|
|
|
South Africa |
|
|
|
|
|
|
Autoliv Southern Africa (Pty) Ltd. |
|
Krügersdorp |
|
Seatbelts and airbags |
|
Owned |
|
|
|
|
|
|
|
South Korea |
|
|
|
|
|
|
Autoliv Corporation |
|
Hwasung |
|
Airbags and steering wheels |
|
Owned |
|
|
|
|
|
|
|
Spain |
|
|
|
|
|
|
Autoliv BKI S.A.U. |
|
Valencia |
|
Airbags |
|
Owned |
|
|
|
|
|
|
|
Sweden |
|
|
|
|
|
|
Autoliv Sverige AB |
|
Vårgårda |
|
Airbag inflators |
|
Owned |
|
|
|
|
|
|
|
Thailand |
|
|
|
|
|
|
Autoliv Thailand Ltd. |
|
Chonburi |
|
Seatbelts, Airbag cushions and Steering wheels |
|
Owned |
|
|
Chonburi |
|
Seatbelt components |
|
Leased |
|
|
|
|
|
|
|
Tunisia |
|
|
|
|
|
|
STE ASW3 Nadour |
|
El Fahs |
|
Steering wheels |
|
Owned & Leased |
STE ASW3 Nadour |
|
Nadhour |
|
Steering wheels |
|
Owned |
|
|
|
|
|
|
|
Turkey |
|
|
|
|
|
|
Autoliv Cankor Otomotiv Emniyet Sistemleri Sanayi Ve Ticaret A.S. |
|
Gebze-Kocaeli |
|
Seatbelts |
|
Owned |
Autoliv Cankor Otomotiv Emniyet Sistemleri Sanayi Ve Ticaret A.S. Gebze-Subesi |
|
Gebze-Kocaeli |
|
Airbags, Steering wheels and Seatbelt components |
|
Leased |
|
|
|
|
|
|
|
United Kingdom |
|
|
|
|
|
|
Airbags International Ltd |
|
Congleton |
|
Airbag cushions |
|
Owned |
|
|
|
|
|
|
|
USA |
|
|
|
|
|
|
Autoliv ASP, Inc. |
|
Brigham City |
|
Airbag inflators |
|
Owned |
|
|
Ogden |
|
Airbags |
|
Owned |
|
|
Ogden |
|
Airbags and service parts |
|
Leased |
|
|
Promontory |
|
Propellant |
|
Owned |
|
|
Tremonton |
|
Airbag initiators and seatbelt micro gas generators |
|
Owned |
26
AUTOLIV TECHNICAL CENTERS AND CRASH TEST TRACKS |
||||
|
|
|
|
|
Country/Company |
|
Location |
|
Product(s) supported |
China |
|
|
|
|
Autoliv (Shanghai) Vehicle Safety System Technical Center Co., Ltd. |
|
Shanghai |
|
Inflators and pyrotechnics customer applications, airbags, steering wheels and seatbelts customer applications and platform development with full-scale test laboratory |
|
|
|
|
|
France |
|
|
|
|
Autoliv France SNC |
|
Gournay-en-Bray |
|
Airbags and seatbelts customer applications and platform development with full-scale test laboratory |
Livbag SAS |
|
Pont-de-Buis |
|
Inflator and pyrotechnic development |
|
|
|
|
|
Germany |
|
|
|
|
Autoliv B.V. & Co. KG |
|
Dachau |
|
Customer applications and platform development, airbags with full-scale test laboratory |
|
|
|
|
|
India |
|
|
|
|
Autoliv India Private Ltd. |
|
Bangalore |
|
Airbags and seatbelts with sled testing |
|
|
|
|
|
Japan |
|
|
|
|
Autoliv Japan Ltd. |
|
Tsukuba |
|
Airbags and seatbelts customer applications and platform development with sled test laboratory |
|
|
|
|
|
Mexico |
|
|
|
|
Autoliv Steering Wheels Mexico S. de R.L. de C.V. |
|
Queretaro |
|
Technical center airbag |
|
|
|
|
|
Poland |
|
|
|
|
Autoliv Poland Sp. zo.o. |
|
Jelcz |
|
Airbags applications and platform development |
|
|
|
|
|
Romania |
|
|
|
|
Autoliv Romania S.R.L. |
|
Brasov |
|
Seatbelts with sled test laboratory |
|
|
|
|
|
South Korea |
|
|
|
|
Autoliv Corporation |
|
Seoul |
|
Airbags and seatbelts customer applications and platform development with sled test laboratory |
|
|
|
|
|
Sweden |
|
|
|
|
Autoliv Development AB |
|
Vårgårda |
|
Research center |
Autoliv Sverige AB |
|
Vårgårda |
|
Airbags customer applications, inflator and special safety products development with full-scale test laboratory |
|
|
|
|
|
USA |
|
|
|
|
Autoliv ASP, Inc. |
|
Auburn Hills |
|
Airbags, steering wheels, and seatbelts customer applications and platform development with sled test laboratory |
|
|
Ogden |
|
Airbags, inflators and pyrotechnics customer applications and platform development |
27
Item 3. Legal Proceedings
In the ordinary course of its business, the Company is subject to legal proceedings brought by or against the Company and its subsidiaries.
See Note 18, Contingent Liabilities, to the Consolidated Financial Statements in this Annual Report for a summary of certain ongoing legal proceedings. Such information is incorporated into this Part I, Item 3 – “Legal Proceedings” by reference.
Item 4. Mine Safety Disclosures Item 5.
Not applicable.
28
PART II
Market for Registrant’s Common Equity, Related Stockholder Matters and Issuer Purchases of Equity Securities
Shareholder information
The primary exchange market for Autoliv’s securities is the New York Stock Exchange (NYSE) where Autoliv’s common stock trades under the symbol “ALV”. Autoliv’s Swedish Depositary Receipts (SDRs) are traded on NASDAQ Stockholm under the symbol “ALIV SDB”. Options in SDRs trade on Nasdaq Stockholm under the name “Autoliv SDB”. Options in Autoliv shares are traded on NASDAQ OMX PHLX and on NYSE Amex Options under the symbol “ALV”.
Stock Performance Graph
The graph and table below show the cumulative total shareholder return for our common stock since December 31, 2019. The graph compares our performance to that of the Standard & Poor’s 500 Stock Index (S&P 500) and the Dow Jones US Auto Parts Index.
The comparison assumes $100 was invested at the closing price of our common stock on the NYSE on December 31, 2019. Each of the returns shown assumes that all dividends paid were reinvested.
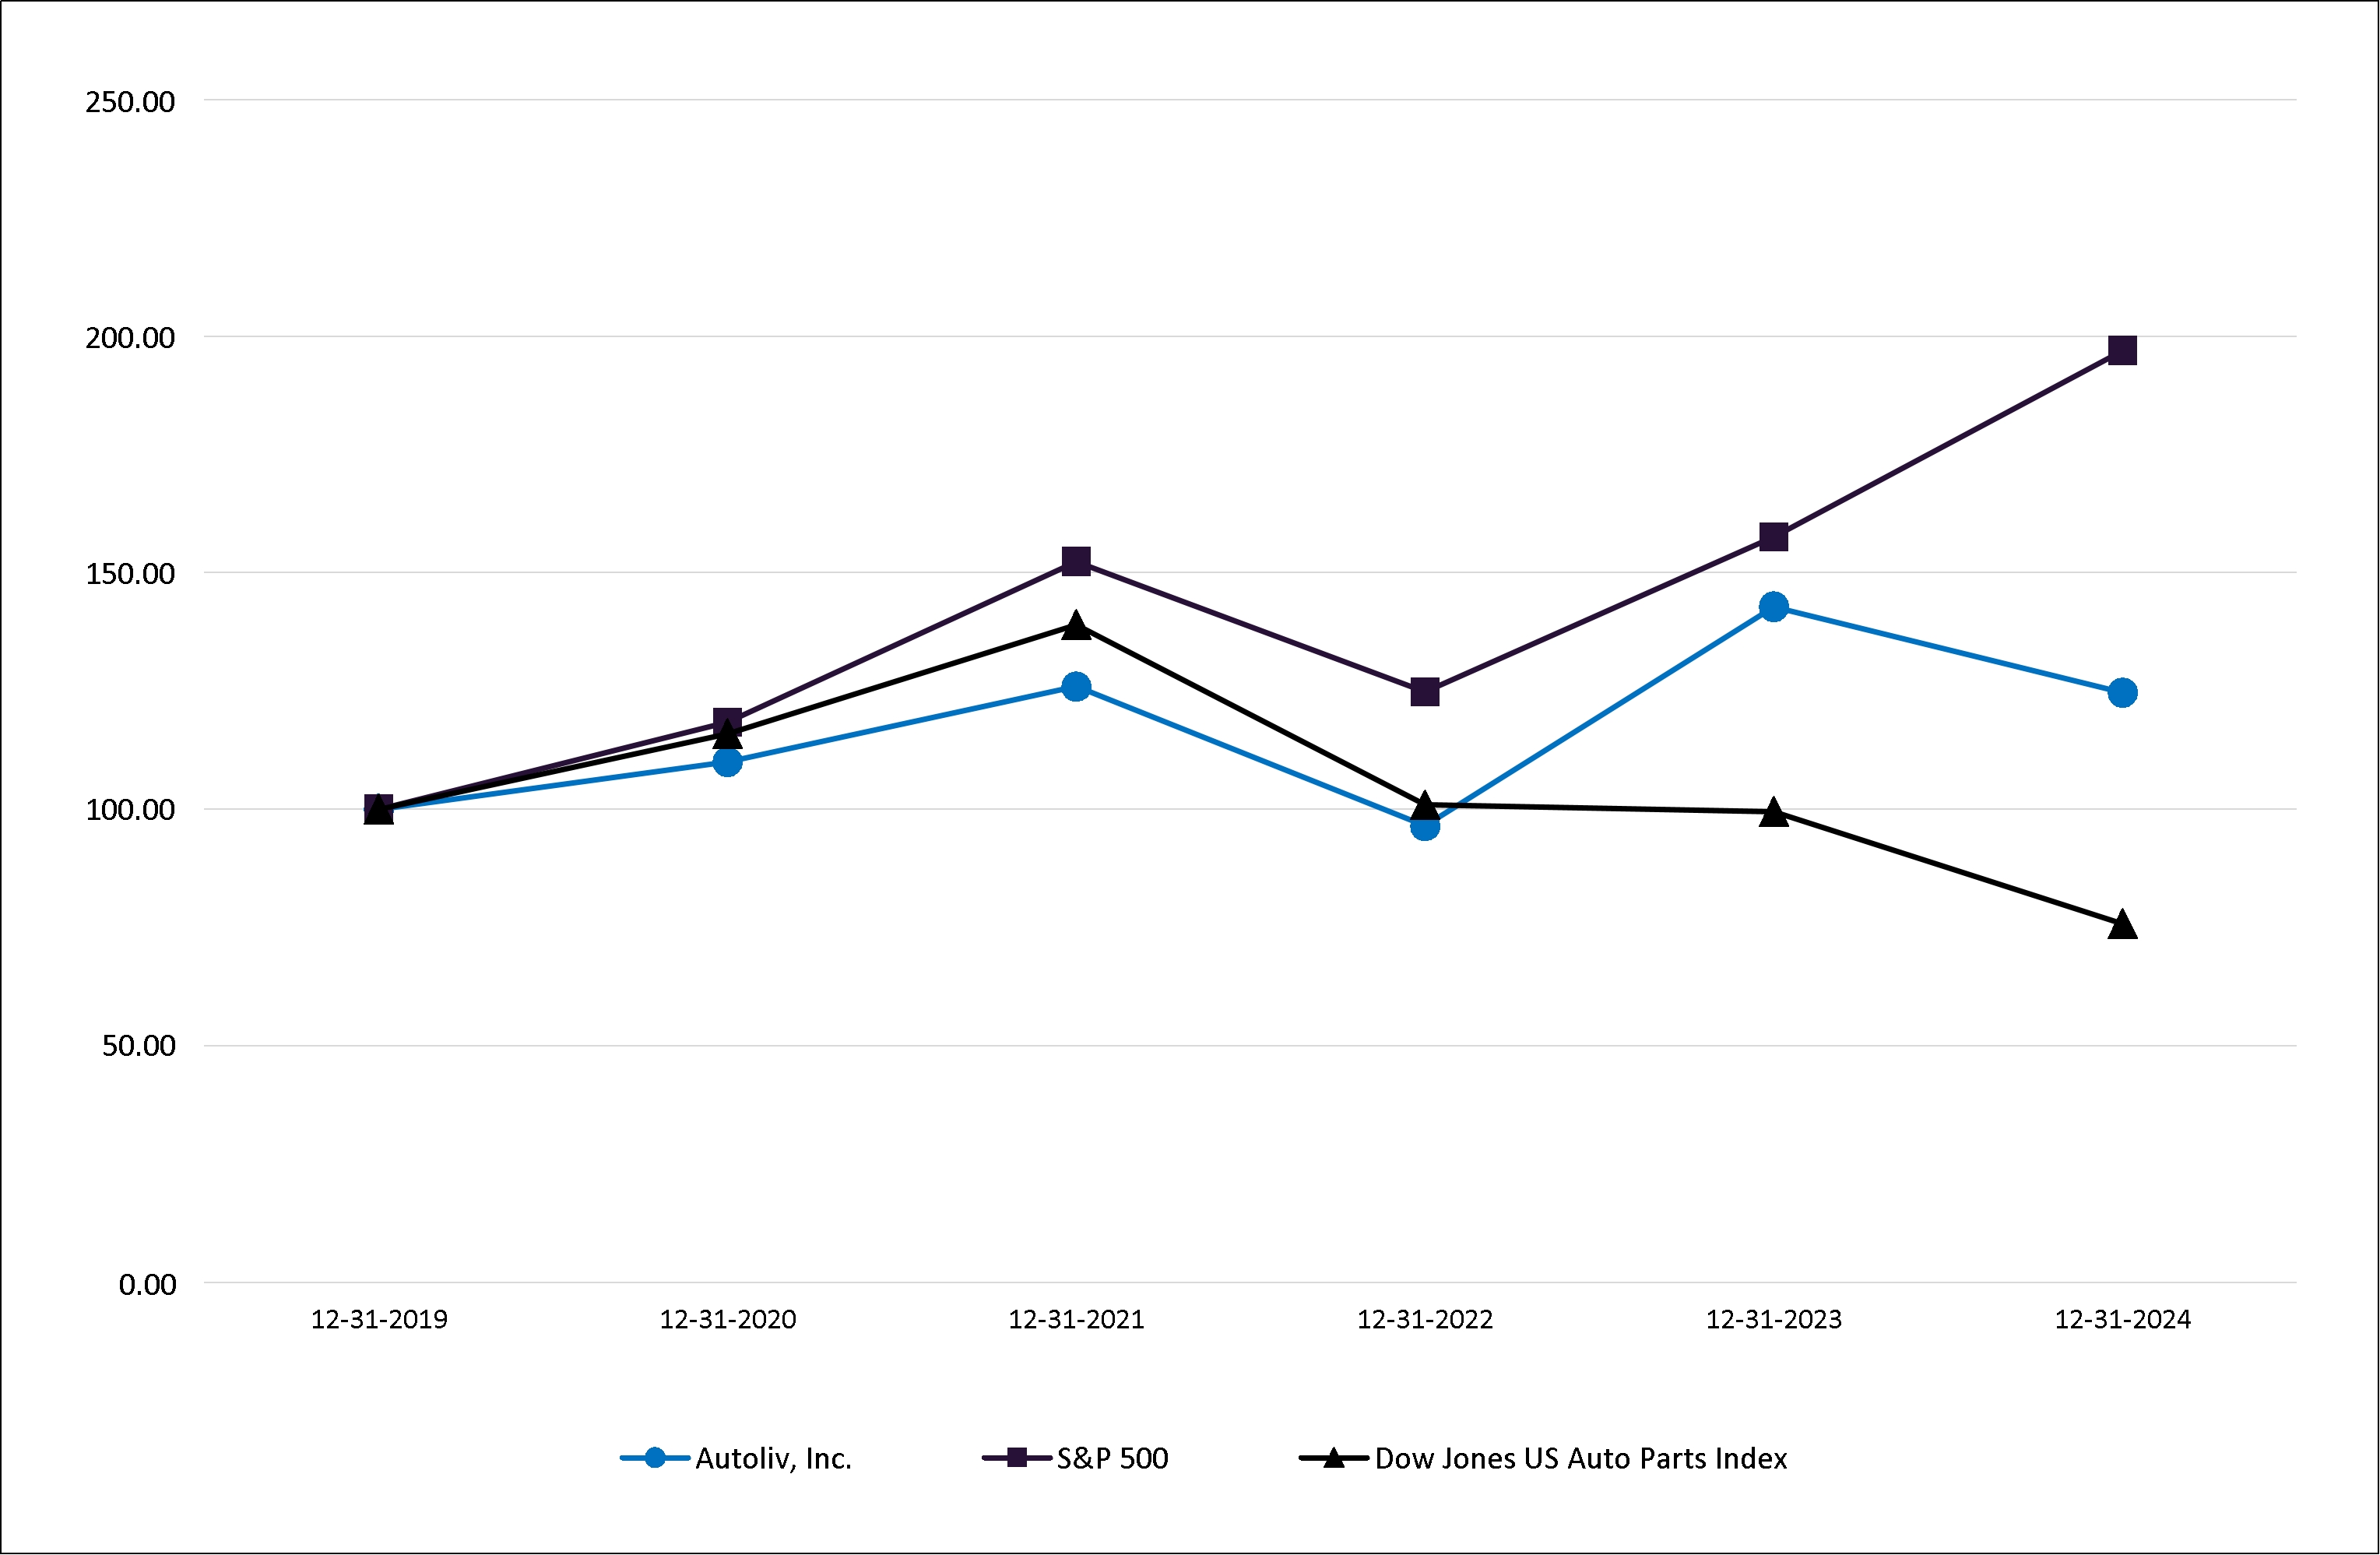
(USD) |
12/31/2019 |
|
12/31/2020 |
|
12/31/2021 |
|
12/31/2022 |
|
12/31/2023 |
|
12/31/2024 |
|
||||||
Autoliv, Inc. |
$ |
100.00 |
|
$ |
109.99 |
|
$ |
125.95 |
|
$ |
96.47 |
|
$ |
142.82 |
|
$ |
124.65 |
|
S&P 500 |
|
100.00 |
|
|
118.40 |
|
|
152.39 |
|
|
124.79 |
|
|
157.59 |
|
|
197.02 |
|
Dow Jones US Auto Parts Index |
|
100.00 |
|
|
116.02 |
|
|
139.01 |
|
|
100.92 |
|
|
99.55 |
|
|
75.85 |
|
29
Number of shares
As of December 31, 2024, the number of shares of common stock outstanding, net of treasury shares, was 77.7 million, compared to 82.6 million as of December 31, 2023. The Company repurchased and immediately retired approximately 5.1 million shares during 2024.
During 2024, the weighted average number of shares outstanding (excluding dilution and treasury shares) decreased to 80.2 million from 85.0 million in 2023. Assuming dilution, the weighted average number of shares outstanding for the full year 2024 decreased to 80.4 million from 85.2 million in 2023.
Stock options (if exercised) and granted Restricted Stock Units (RSUs) and Performance Shares (PSs) could increase the number of shares outstanding as of December 31, 2024 by 0.5 million shares in the aggregate. Combined, this would add 0.6% to the number of shares outstanding as of December 31, 2024.
On December 31, 2024, the Company had 2.7 million treasury shares compared to 4.9 million as of December 31, 2023. During 2024, the Company also retired 2.0 million shares that had been held in treasury.
Shareholders
As of February 13, 2025, there were 1,196 holders of record of our common stock. Many stockholders choose to own shares through brokerage accounts and other intermediaries rather than as holders of record (excluding individual participants in securities positions listing) so the actual number of stockholders is unknown but significantly higher.
Dividends
Autoliv has a history of paying quarterly cash dividends. Declared dividends are announced in press releases and published on Autoliv’s corporate website. The Board of Directors revisits dividends on a quarterly basis. There can be no assurance that the Board of Directors will declare dividends in the future. See Autoliv’s corporate website for additional details regarding historical dividends.
Stock incentive plan
Autoliv employees participate in the Autoliv, Inc. 1997 Stock Incentive Plan, as amended (the “Stock Incentive Plan”) and receive Autoliv stock-based awards from time to time. Additional information regarding the securities authorized for issuance under the Stock Incentive Plan is included in Item 12 of this Annual Report.
Autoliv has adopted a Stock Ownership Policy for Executives requiring the Company’s Chief Executive Officer (CEO) to accumulate and hold the number of Autoliv shares having a value of twice his annual base salary. For other executives, the minimum requirement is, over time, a holding equal to each executive’s annual base salary.
Stock repurchase program
The table in Exhibit 26 provides information with respect to total common stock repurchases made by the Company during the three months period ended December 31, 2024 on NYSE.
|
|
New York Stock Exchange (NYSE) |
|
|
|
|
|
|
|
|||||||
Period |
|
Total Number of Shares Purchased (1) |
|
|
Average Price Paid per Share (USD) (2) |
|
|
Total Number of Shares Purchased as Part of Publicly Announced Plans or Programs (3) |
|
|
Aggregate Maximum Number of Shares that Yet May Be Purchased Under the Plans or Programs (3) |
|
||||
October 1-31, 2024 |
|
|
225,991 |
|
|
$ |
95.57 |
|
|
|
9,346,800 |
|
|
|
7,653,200 |
|
November 1-30, 2024 |
|
|
549,111 |
|
|
$ |
98.27 |
|
|
|
9,895,911 |
|
|
|
7,104,089 |
|
December 1-31, 2024 |
|
|
268,851 |
|
|
$ |
98.34 |
|
|
|
10,164,762 |
|
|
|
6,835,238 |
|
(1) The repurchases are being executed from time to time, subject to general business and market conditions and other investment opportunities, through open market purchases or privately negotiated transactions, including through Rule 10b5-1 plans. For accounting purposes, shares repurchased under our stock repurchase programs are recorded based upon the settlement date of the applicable trade. |
(2) The average price paid per share in U.S. dollars exclude brokerage commissions and other costs of execution. |
(3) In November 2021, the Board of Directors approved a stock repurchase program that authorizes the Company to repurchase up to $1.5 billion or up to 17 million shares, whichever comes first, between January 2022 and the end of 2024. On November 11, 2024, the Company announced that the Board of Directors approved the extension of this stock repurchase program through the end of 2025. As of December 31, 2024, the Company may purchase up to $0.5 billion or up to 6.8 million common shares pursuant to the existing program. |
Item 6. [RESERVED]
30
Item 7. Management’s Discussion and Analysis of Financial Condition and Results of Operations
IMPORTANT TRENDS
The discussions and analysis in this section are focused on the Company’s results of operations for the year ended December 31, 2024 compared to the year ended December 31, 2023. Discussions of the Company's results of operations for the year ended December 31, 2023 compared to the year ended December 31, 2022 can be found in Part II, Item 7. Management's Discussion and Analysis of Financial Condition and Results of Operations in the Company's Form 10-K for the year ended December 31, 2023, which was filed with the United States Securities and Exchange Commission on February 20, 2024.
Autoliv, Inc. (the “Company”) provides automotive safety systems to the automotive industry with a broad range of product offerings, primarily passive safety systems. In the year ended December 31, 2024, a number of factors influenced the Company’s results of operations, including:
|
2024 |
|
|
2023 |
|
|
||||||||||
YEARS ENDED DEC. 31 (DOLLARS IN MILLIONS, EXCEPT EPS) |
Reported1) |
|
|
change |
|
|
Reported1) |
|
|
change |
|
|
||||
Global light vehicle production (in thousands) |
|
86,708 |
|
|
|
(1.2 |
) |
% |
|
87,772 |
|
|
|
10 |
|
% |
Consolidated net sales |
$ |
10,390 |
|
|
|
(0.8 |
) |
% |
$ |
10,475 |
|
|
|
18 |
|
% |
Operating income |
|
979 |
|
|
|
42 |
|
% |
|
690 |
|
|
|
4.7 |
|
% |
Operating margin, % |
|
9.4 |
|
|
|
2.8 |
|
pp |
|
6.6 |
|
|
|
(0.9 |
) |
pp |
Net income attributable to controlling interest |
|
646 |
|
|
|
33 |
|
% |
|
488 |
|
|
|
15 |
|
% |
Earnings per share - diluted2) |
|
8.04 |
|
|
|
40 |
|
% |
|
5.72 |
|
|
|
18 |
|
% |
Net cash provided by operating activities |
|
1,059 |
|
|
|
7.8 |
|
% |
|
982 |
|
|
|
38 |
|
% |
Return on capital employed, % |
|
25.0 |
|
|
|
7.3 |
|
pp |
|
17.7 |
|
|
|
0.2 |
|
pp |
1) Reported figures impacted by costs for capacity alignments and antitrust related matters. See section Items affecting comparability and Note 12 to the Consolidated Financial Statements included herein.
2) Net of treasury shares.
CUSTOMER CALL-OFF VOLATILITY
2024 saw global LVP decline by around 1.2% (according to S&P Global January 2025). Our sales to customers are based on production schedule order quantities and delivery dates that are communicated to us by our customers, which we refer to as “call-off” plans. We saw an improvement in call-off volatility in 2024, especially in the second half year. This improvement supported our improvement in operating efficiency and productivity, including a significant reduction in direct workforce. However, customer call-off volatility remained higher than pre-pandemic levels, and low customer demand visibility and changes to customer call-offs with short notice still had a negative impact on our production efficiency and profitability. Geopolitical uncertainties could continue to create a challenging operating environment. We also see a likelihood that there could be new or increased tariffs or other related trade restrictions imposed in 2025 that may impact our operations. We continue to closely monitor the situation and are prepared to remain agile in responding to any such developments.
INFLATION
Cost pressures from labor, in our own operations and related to our suppliers' labor costs, had a negative impact on our profitability in 2024. Most of the inflationary cost pressure was offset by customer price and other compensations. Changes in raw material costs had a limited impact on our profitability in 2024. The Company expects only limited raw material price changes in 2025. We also expect continued cost pressure from inflation relating mainly to labor, including increased labor costs for our suppliers, especially in Europe and the Americas. The Company continues to execute on productivity and cost reduction activities to offset these cost pressures, and we continue to seek inflation compensation from our customers. The Company believes price adjustments will gradually offset the cost inflation, with limited positive effects in the first quarter and gradual improvement as the year progresses.
31
GROWTH IMPACTED BY LIGHT VEHICLE PRODUCTION AND SAFETY CONTENT PER VEHICLE
The most important driver for Autoliv’s sales is the LVP. In 2024, global LVP declined by 1.2%.
Light Vehicle Production1) |
|
|
|
|
|
|
|
|
|
|
|
|
|
|
|
|
||||||||
|
|
2024 |
|
|
2023 |
|
|
Change 2024 vs 2023 |
|
|||||||||||||||
|
|
(000´) |
|
|
% global |
|
|
(000´) |
|
|
% global |
|
|
(000´) |
|
|
% |
|
||||||
Americas |
|
|
16,990 |
|
|
|
20 |
% |
|
|
17,283 |
|
|
|
20 |
% |
|
|
(293 |
) |
|
|
(1.7 |
)% |
|
North America |
|
14,042 |
|
|
|
16 |
% |
|
|
14,386 |
|
|
|
16 |
% |
|
|
(344 |
) |
|
|
(2.4 |
)% |
|
South America |
|
2,948 |
|
|
|
3.4 |
% |
|
|
2,897 |
|
|
|
3.3 |
% |
|
|
51 |
|
|
|
1.8 |
% |
Europe |
|
|
16,982 |
|
|
|
20 |
% |
|
|
17,816 |
|
|
|
20 |
% |
|
|
(834 |
) |
|
|
(4.7 |
)% |
Asia |
|
|
50,545 |
|
|
|
58 |
% |
|
|
50,410 |
|
|
|
57 |
% |
|
|
136 |
|
|
|
0.3 |
% |
|
China |
|
29,241 |
|
|
|
34 |
% |
|
|
28,069 |
|
|
|
32 |
% |
|
|
1,172 |
|
|
|
4.2 |
% |
|
Japan |
|
7,730 |
|
|
|
8.9 |
% |
|
|
8,472 |
|
|
|
9.7 |
% |
|
|
(742 |
) |
|
|
(8.8 |
)% |
|
South Korea |
|
4,073 |
|
|
|
4.7 |
% |
|
|
4,169 |
|
|
|
4.7 |
% |
|
|
(96 |
) |
|
|
(2.3 |
)% |
|
India |
|
5,613 |
|
|
|
6.5 |
% |
|
|
5,393 |
|
|
|
6.1 |
% |
|
|
220 |
|
|
|
4.1 |
% |
|
Other Asia |
|
3,888 |
|
|
|
4.5 |
% |
|
|
4,306 |
|
|
|
4.9 |
% |
|
|
(418 |
) |
|
|
(9.7 |
)% |
Other |
|
|
2,191 |
|
|
|
2.5 |
% |
|
|
2,263 |
|
|
|
2.6 |
% |
|
|
(72 |
) |
|
|
(3.2 |
)% |
Global Total |
|
86,708 |
|
|
|
|
|
|
87,772 |
|
|
|
|
|
|
(1,063 |
) |
|
|
(1.2 |
)% |
|||
1) Source: S&P Global, January 2025 |
|
|||||||||||||||||||||||
The increase in LVP in China of 4.2% was significantly more than what was expected in the beginning of the year, driven mainly by a multitude of successful launches of new models by domestic Chinese OEMs, especially BYD. The LVP decline of 4.7% in Europe was impacted by affordability issues and technology uncertainties. The LVP decline in North America LVP was mainly driven by vehicle inventory corrections. Japan declined by 8.8% impacted by model homologation issues.
The different LVP growth rates for different regions in 2024 was dilutive to global safety content per vehicle (CPV), as LVP in several high CPV regions declined while LVP increased in some lower CPV regions. The highest CPV region is North America, and its share of global LVP declined by 0.2pp to 16.2%. The second highest CPV region is Europe, and its share of global LVP declined by 0.7pp, to 19.6%. The lowest major CPV region is India, which saw its share of LVP increase from 6.1% to 6.5%. CPV in China is below the global average, and China’s share of global LVP increased from 32.0% to 33.7%. Japan’s share decreased to 8.9% from 9.7%. Additional dilution to global CPV came from the difference in growth within China, where lower CPV models and segments grew strongly while higher CPV models and segments growth was limited or negative. LVP growth for Domestic Chinese OEMs with typically lower CPV was 18% compared to global OEMs with typically higher CPV saw LVP decline by 9.5%. Combined with the regional growth differences, we estimate this shift in LVP mix contributed negatively to our sales growth by between 2 to 3 pp. The Company estimates that its market share decreased from around 45% in 2023 to around 44% in 2024. The main reasons for this change are the difference in regional LVP growth outlined above and that component sales, which is growing fast, especially to BYD, is not part of market share calculation.
Despite macro-economic uncertainties in parts of the world, we expect light vehicle markets to grow both in the medium and long term, driven by pent-up end user demand and a growing GDP/capita.
Due to more stringent crash test rating requirements, by institutes such as Euro NCAP, increased government regulations and increasing consumer demand for more safety in emerging markets, the Company sees vehicle manufacturers installing more airbags and more advanced seatbelt systems in vehicles. This generally takes place when new models are introduced. The safety standards of vehicles are increasing in China, India, and other growth markets, partially due to new government regulations and crash test rating programs. This is supporting higher installation rates of airbags and more advanced seatbelts, impacting CPV positively. Commercial customer recoveries compensating for increased labor costs also added to CPV in 2024, partly offset by negative effects from continued productivity related pricing pressure from vehicle manufacturers. CPV increased in Japan, Europe and India, was unchanged in North America while it decreased in China due to the changes in LVP mix outlined above. The changes in regional and model mix diluted global CPV by 2 to 3pp leading to a global CPV that was unchanged compared to 2023. Together with the positive pricing and the execution of the Company's strong order book, this supported an organic growth (Non-U.S. GAAP measure) of around 1.6pp above growth in global LVP. The average global safety CPV (airbags, pedestrian safety, seatbelts, and steering wheels) amounted to around $260 in 2024.
The Company believes that the more stringent crash rating requirements and consumer demand for more safety should enable the global automotive safety market to grow around 1-2 percentage points per year faster than the global LVP in the medium and long term. This excludes the impact from cost inflation related price increases.
The past years’ high order intake share has resulted in the Company's sales development outperforming the underlying LVP significantly. In the past 5 years, the Company's organic sales development outpaced global LVP between around 2 and 9 percentage points every year. During 2024, growth was positively affected through recent launches of several new models, including Subaru Forester, Hyundai Santa Fe, Nissan Kicks, Dacia Duster, Toyota Landcruiser, Zeekr 7z and Toyota 4Runner.
The Company estimates that the sales to Electric Vehicles (not including PHEVs) amounted to around $1.4 billion in 2024.
32
GLOBAL FOOTPRINT WELL ADAPTED TO THE GEOGRAPHIC TREND SHIFT IN AUTOMOTIVE PRODUCTION
The Company's regional sales mix continues to be balanced with 28% of sales in Europe, 33% in the Americas and 19% in Asia, excluding China in 2024, compared to 27%, 34% and 19%, respectively, in 2023. The Company's sales in the important Chinese market was 19% of total sales in 2024 compared to 20% in 2023.
The balanced regional sales mix has been achieved through timely investments and strengthening of technical and support capabilities in growth markets.
ORDER INTAKE ADDING TO AN ALREADY STRONG CUSTOMER BASE
The Company's order intake in 2024, with high win rates for new platforms with both new and traditional OEMs as well as for both EV and ICE platforms, added to the Company's already strong base, which includes supplying products to more than 1,300 vehicle models and around 100 car brands. The order intake in 2024 supports the Company's ability to defend its around 45% sales market share in the near and medium term. For several years, the automotive industry face some key trends that impacts the industry, notably changes in technologies as well as geographic growth differences with the emergence of new automakers are particularly visible in China. Autoliv have therefore increasingly focused resources on developing new products and to strengthen our position with new automakers to capture the growth opportunities that comes with these changes. This includes long term development agreements with several new automakers in China in recent years as well as increased investments in capacity and capabilities in India. The order intake from new automakers, mainly in China and North America, accounted for nearly 1/3 of our total order intake in 2024. We won multiple awards supporting new market- and industry trends like foldable steering wheels for self-driving vehicles including new types of driver airbags that deploys from the dashboard or ceiling The 2024 order intake included high win rates with new automakers. In China, the Company estimates that around 60% of order intake in 2024 was with domestic Chinese OEMs, which supports our expectation that domestic OEMS in China will continue to increase its share of the Company's sales in China in 2025. New order intake is defined as the sales value of awards for future business, received within that year. The lifetime value is calculated using detailed assumptions of price and volumes over the years of production and the exchange rates prevailing at the time of receiving the order.
The lead time from order intake to start of production is typically 1-3 years. During this period the products are engineered into the vehicle to provide the expected protection for occupants in case of a crash and to meet legal and regulatory requirements, as well as other requirements from the vehicle manufacturer. This investment in new products is the main factor of RD&E expenses, net. Additionally, the Company has to build up production capacity, in the form of new lines, to meet future product launches.
In 2024, OEMs sourcing of new business was at the lowest level since 2018 for the industry, as OEMs are reconsidering certain future product offerings due to geopolitical and technological uncertainties. The Company's order intake share for 2024 continued on a high level. Even so, the low level of OEM sourcing activity in 2024 resulted in a lower order intake in 2024 for the Company. The estimated life-time sales for all orders booked in 2024 is around $7.4 billion, compared to around $11.8 billion in 2023. As sourcing of several large platforms were pushed into 2025, we expect a rebound of OEM sourcing activity and Autoliv order intake in 2025.
STRATEGIC INITIATIVES AND STRUCTURAL IMPROVEMENTS
2024 light vehicle market was impacted by a technological and geopolitical uncertainties with continued high customer call-off volatility and inflationary pressure on costs for labor. In response, Autoliv management continued to implement strict cost control measures, as well as initiating significant structural cost reduction measures. In June 2023, the Company communicated a cost reduction framework which included the intent to reduce our indirect headcount by up to 2,000, and to improve direct labor productivity equivalent to up to a 6,000 direct workforce reduction. Based on the intended indirect workforce reductions, the Company estimates that the annual cost reductions will amount to around $135 million in total annual savings when fully implemented, with around $50 million in savings recorded in 2024, which is expected to increase to around $100 million in 2025 and the remaining amount in 2026 and 2027.
At the end of 2024, around 1,400 of the planned indirect reductions were completed. We also saw positive results on direct labor efficiency in 2024, especially in the second half year.
The provision, net of reversals, for restructuring activities in 2024 amounted to $18 million compared to $(210) million in 2023. As of December 31, 2024, the Company had $151 million reserved in its balance sheet related to restructuring compared to $213 million last year. For more information, see Note 12, Restructuring, to the Consolidated Financial Statements included herein.
In addition to the structural improvements outlined above, the Company continues to implement the strategic initiatives to improve the efficiency of its value chain from end to end, not least through the Autoliv Production System and increased digitalization and automation. With several hundred projects in implementation or undergoing development, the Company has a high pace in the planning and implementation of the strategic initiatives and structural improvements. These initiatives are key drivers to the Company's targets and building the foundation to continue to create shareholder value.
33
IMPROVED EFFICIENCIES THROUGH OPERATIONAL EXCELLENCE
Pricing pressure is an inherent part of the automotive supplier business. Price reductions are generally higher on newer products with strong volume growth compared to older products, where both the possibilities to re-design the product to reduce costs and market growth are less. Price reductions can also depend on the business cycle and raw material price development. For the five-year period 2017-2021, the Company estimates the average reduction of product prices on existing programs to have been in the range of around 2-4% annually. In 2022, the pricing environment changed to some extent due to high raw material price and cost increases, which led to renegotiations with customers regarding commercial terms. These discussions resulted in a net positive price development, gradually implemented throughout the year. This was also the case in 2023, and for 2024 as well, albeit at a lower level.
A key strategy for Autoliv to be and to remain cost competitive is to reduce labor costs, through continuously implementing productivity improvement programs, optimizing the Company's production footprint, and instituting restructuring and capacity alignment activities as well as other actions to address the Company's cost structure.
The Company's productivity improvement target is to achieve at least 5% savings per year. To meet this target, Autoliv has developed a set of strategies to reduce costs in manufacturing:
The Company's historic experience is that the continuous improvement strategies have enabled productivity improvement at or above its target of 5%. However, the Company had not achieved its 5% productivity target since the COVID-19 pandemic in 2020, due to the related decline in LVP in 2020 and the high volatility in customer call-offs in 2021, 2022 and 2023 driven by the industry wide supply chain instability, especially for semiconductors. In 2024, however, the Company achieved its 5% productivity target, as gradual improvement in customer call -off volatility enabled an improved operational efficiency.
The Company foresees opportunities for further productivity on organic sales growth and increased call-off stability when global supply chains have stabilized at pre-pandemic levels, but also from increasing use of automation in its assembly for lean manufacturing processes. Additionally, automated cells typically perform the manufacturing process with reduced variability. This results in greater control and consistency of product quality.
FOCUS ON QUALITY
The number of vehicle recalls in the automotive industry continues on a relatively high level. The Company expects overall recall numbers to remain high for years to come and, although the Company strives for the highest quality in its processes, it cannot be ruled out that the Company may also be adversely impacted by a future recall.
Quality has been and always will be the Company's number one priority, and the Company continues to sharpen its focus in this area. The Company now holds a global market share in passive safety of around 44%, while the Company has been involved in around 2% of recalls in the industry in the past ten years. This indicates that the Company is delivering on its quality strategy. For more information see product warranty and recalls in Note 13, Product Related Liabilities, to the Consolidated Financial Statements in this Annual Report.
CHANGES IN COMPETITIVE AND CUSTOMER LANDSCAPE
The Company has not noted any significant changes in the competitive landscape in 2024. We consider Joyson Safety Systems, a part of Ningbo Joyson Electronic Corp., and ZF LIFETEC, a part of ZF Friedrichshafen AG, to be global competitors to Autoliv. In addition, there are several smaller regional and product specific competitors, especially in China.
The customer landscape is gradually changing, with a multitude of new OEMs emerging in recent years. This is especially prominent within electric vehicles and in China. In China, domestic OEMs have gained significant market shares and as a group now has larger market share than global OEMs have in China. Autoliv's sales to domestic OEMs in China has grown rapidly. In 2022, this group accounted for 22% of Autoliv's sales in China, and in 2024 their share of Autoliv sales in China was 37%. The fastest growing OEM in China in recent years is BYD. BYD has a uniquely high degree of vertical integration, with a large proportion of in-house sourcing of products and systems. This includes passive safety systems, which is supplied by its subsidiary FinDreams Technology. Autoliv supplies components, especially inflators, to FinDreams Technology. In 2024, the institutional alliance between Renault, Nissan, and Mitsubishi ended.
34
CAPITAL STRUCTURE
The Company’s net debt stood at $1,554 million on December 31, 2024. This was an increase of $187 million compared to December 31, 2023. Total interest-bearing debt at December 31, 2024 amounted to $1,909 million, an increase of $47 million compared to December 31, 2023.
Cash flow from operations was $1,059 million in 2024 and $982 million in 2023. Capital expenditures, net amounted to $563 million in 2024 and $569 million in 2023. During 2024 and 2023 the Company paid dividends of $219 million and $225 million, respectively.
It is the Company’s policy to maintain a financial leverage commensurate with a “strong investment grade credit rating”. The long-term target is to have a leverage ratio (see section Non-U.S. GAAP Performance Measures) of around 1.0x and to be within the range of 0.5x to 1.5x. At December 31, 2024, the current leverage ratio is 1.2x. The Company monitors its capital structure and the financial markets closely and intends to maintain a high level of financial flexibility while being shareholder friendly.
As part of the adjustment of the capital structure, the Company historically has repurchased shares of its common stock. During 2024 and 2023, the Company repurchased and retired 5.1 million and 3.7 million shares, respectively, under the new stock repurchase program approved by the Board of Directors in November 2021. This stock repurchase program authorizes the Company to repurchase up to $1.5 billion or up to 17 million shares (whichever comes first) between January 2022 and the end of 2024. In November 2024, the Board of Directors approved the extension of this stock repurchase program through the end of 2025.
In 2024, the Company retired an additional 2 million shares held in Treasury stock. After the retirements, the Company continues to hold around 2.7 million shares of common stock in treasury.
OUTLOOK FOR 2025
In addition to the assumptions noted below, the Company's guidance for 2025 is mainly based on our customer call-offs, the achievement of our targeted cost compensation effects and no material changes to tariffs or trade restrictions.
Full year 2025 Guidance |
|
Organic sales growth |
Around 2% |
Adjusted operating margin1) |
Around 10-10.5% |
Operating cash flow2) |
Around $1.2 billion |
Capital expenditures, net, % of sales |
Around 5% |
1) Excluding effects from capacity alignments, antitrust related matters and other discrete items. 2) Excluding unusual items. |
|
Full year 2025 Assumptions |
|
LVP growth |
Around 0.5% negative |
Foreign currency impact on net sales |
Around 2% negative |
Tax rate3) |
Around 28% |
3) Excluding unusual tax items. |
|
The forward-looking non-U.S. GAAP financial measures above are provided on a non-U.S. GAAP basis. Autoliv has not provided a U.S. GAAP reconciliation of these measures because items that impact these measures, such as costs related to capacity alignments and antitrust matters, cannot be reasonably predicted or determined. As a result, such reconciliation is not available without unreasonable efforts and Autoliv is unable to determine the probable significance of the unavailable information.
SIGNIFICANT LEGAL MATTERS
See Item 3. Legal Proceedings and Note 18 Contingent Liabilities to the Consolidated Financial Statements in this Annual Report.
35
RESULTS OF OPERATIONS
Consolidated net sales in 2024 decreased by 0.8% compared to 2023. Excluding negative currency translation effects of 1.2%, the organic sales increased (Non-U.S. GAAP measure, see reconciliation table below) by 0.4% compared to the global LVP decrease of 1.2% (according to S&P Global, Jan 2025). The 1.6pp outperformance was mainly driven by new product launches, and to a lesser extent higher prices, partly offset by negative customer and model mix.
Sales by Product
|
|
Years ended December 31, |
|
|
|
|
|
Components of change in net sales |
|
|||||||||||
|
|
2024 |
|
|
2023 |
|
|
Reported |
|
|
Currency |
|
|
Organic 3) |
|
|||||
Airbags, Steering Wheels and Other2) |
|
$ |
7,023 |
|
|
$ |
7,055 |
|
|
|
(0.5 |
)% |
|
|
(1.2 |
)% |
|
|
0.7 |
% |
Seatbelt products and Other2) |
|
|
3,367 |
|
|
|
3,420 |
|
|
|
(1.6 |
)% |
|
|
(1.3 |
)% |
|
|
(0.2 |
)% |
Total |
|
$ |
10,390 |
|
|
$ |
10,475 |
|
|
|
(0.8 |
)% |
|
|
(1.2 |
)% |
|
|
0.4 |
% |
1) Effects from currency translations.
2) Including Corporate and Other sales.
Airbags, Steering Wheels and Other
Sales grew organically (Non-U.S. GAAP measure, see reconciliation table above) by 0.7% in 2024. The largest contributor to the increase was steering wheels, followed by center airbags, side airbags, inflatable curtains and inflators, partly offset by decreases for passenger airbags, knee airbags and driver airbags.
Seatbelt Products and Other
Sales for Seatbelt Products and Other declined organically (Non-U.S. GAAP measure, see reconciliation table above) by 0.2% in the period. Sales decreased organically in China and Europe, while it increased in Asia excluding China and the Americas.
Sales by Region
|
|
Years ended December 31, |
|
|
|
|
|
Components of change in net sales |
|
|||||||||||
|
|
2024 |
|
|
2023 |
|
|
Reported |
|
|
Currency |
|
|
Organic 3) |
|
|||||
Americas |
|
$ |
3,424 |
|
|
$ |
3,526 |
|
|
|
(2.9 |
)% |
|
|
(1.2 |
)% |
|
|
(1.7 |
)% |
Europe |
|
|
2,946 |
|
|
|
2,877 |
|
|
|
2.4 |
% |
|
|
1.0 |
% |
|
|
1.4 |
% |
China |
|
|
2,010 |
|
|
|
2,105 |
|
|
|
(4.5 |
)% |
|
|
(1.3 |
)% |
|
|
(3.2 |
)% |
Asia excl. China |
|
|
2,010 |
|
|
|
1,968 |
|
|
|
2.2 |
% |
|
|
(4.4 |
)% |
|
|
6.6 |
% |
Total |
|
$ |
10,390 |
|
|
$ |
10,475 |
|
|
|
(0.8 |
)% |
|
|
(1.2 |
)% |
|
|
0.4 |
% |
1) Effects from currency translations.
Autoliv’s global sales increased organically (Non-U.S. GAAP measure, see reconciliation table above) by 0.4% in 2024 compared to 2023, which was around 1.6 percentage points better than global LVP (according to S&P Global, January 2025).
Our organic sales growth (Non-U.S. GAAP measure) outperformed LVP growth by 11 percentage points in Asia excluding China supported by strong outgrowth in India, Japan and South Korea. We outperformed by 6.1 percentage points in Europe due mainly to product launches and to a smaller extent higher prices, while it was in line with LVP growth in Americas. Our sales growth underperformed LVP growth by 7.4 percentage points in China. LVP growth in China was tilted to domestic OEMs with typically lower safety content. Domestic OEM LVP in China grew by 18% while LVP declined by 9.5% for global OEMs in China in 2024. Autoliv's sales to domestic OEMs increased by 24% in 2024.
2024 Organic Growth (Non-U.S. GAAP measure)
|
|
Americas |
|
Europe |
|
China |
|
Asia excl. China |
|
Global |
Autoliv |
|
(1.7)% |
|
1.4% |
|
(3.2)% |
|
6.6% |
|
0.4% |
Main growth drivers |
|
Toyota, Honda, VW |
|
Renault, Mercedes, Ford |
|
Geely, Chery, Changan |
|
Hyundai, Suzuki, Tata |
|
Geely, Mercedes, Renault |
Main decline drivers |
|
Stellantis, EV OEM, Nissan |
|
Stellantis, Volvo, Fisker |
|
GM, Honda, EV OEM |
|
Nissan, Mazda, Renault |
|
Stellantis, EV OEM, GM |
36
Condensed Statement of Income
|
Years ended December 31, |
|
|
|
|
||||||
(Dollars in millions, except per share data) |
2024 |
|
|
2023 |
|
|
Change |
|
|||
Net Sales |
$ |
10,390 |
|
|
$ |
10,475 |
|
|
|
(0.8 |
)% |
Gross profit |
|
1,927 |
|
|
|
1,822 |
|
|
|
5.8 |
% |
% of sales |
|
18.5 |
% |
|
|
17.4 |
% |
|
|
1.2 |
pp |
S, G&A |
|
(530 |
) |
|
|
(500 |
) |
|
|
6.0 |
% |
% of sales |
|
(5.1 |
)% |
|
|
(4.8 |
)% |
|
|
(0.3 |
)pp |
R, D&E, net |
|
(398 |
) |
|
|
(425 |
) |
|
|
(6.3 |
)% |
% of sales |
|
(3.8 |
)% |
|
|
(4.1 |
)% |
|
|
0.2 |
pp |
Other income (expense), net |
|
(19 |
) |
|
|
(207 |
) |
|
|
(91 |
)% |
Operating income |
|
979 |
|
|
|
690 |
|
|
|
42 |
% |
% of sales |
|
9.4 |
% |
|
|
6.6 |
% |
|
|
2.8 |
pp |
Adjusted operating income1) |
|
1,007 |
|
|
|
920 |
|
|
|
9 |
% |
% of sales |
|
9.7 |
% |
|
|
8.8 |
% |
|
|
0.9 |
pp |
Financial and non-operating items, net |
|
(105 |
) |
|
|
(77 |
) |
|
|
35 |
% |
Income before taxes |
|
875 |
|
|
|
612 |
|
|
|
43 |
% |
Income taxes |
|
(227 |
) |
|
|
(123 |
) |
|
|
84 |
% |
Tax rate |
|
26.0 |
% |
|
|
20.1 |
% |
|
|
5.9 |
pp |
Net income |
|
648 |
|
|
|
489 |
|
|
|
32 |
% |
Earnings per share, diluted2) |
|
8.04 |
|
|
|
5.72 |
|
|
|
40 |
% |
Adjusted earnings per share, diluted1,2) |
|
8.32 |
|
|
|
8.19 |
|
|
|
2 |
% |
1) Assuming dilution and net of treasury shares.
2) Non-U.S. GAAP Measure.
Gross Profit
In 2024, gross profit increased by $106 million and the gross margin increased by 1.2pp compared to 2023. The improvement was mostly due to that better customer call-off accuracy supported an improved operational efficiency with around $82 million in lower costs for labor, premium freight and waste and scrap. The gross profit increase was also, to a lesser extent, supported by positive effects from lower material costs. The main offsetting factor to the improvement were negative effects of lower sales.
Operating Income
Operating income increased in 2024 by $290 million, mainly due to lower capacity alignment accruals as outlined below, and the increase in gross profit, as outlined above.
Selling, General and Administrative (S,G&A) expenses increased in 2024 by $30 million. The main reason for the cost increase was higher costs for personnel, due to high wage inflation. S,G&A costs in relation to sales increased from 4.8% to 5.1%.
Research, Development & Engineering (R,D&E) expenses, net decreased in 2024 by $27 million, Higher engineering income explained almost the entire improvement. R,D&E, net, in relation to sales decreased from 4.1% to 3.8%. The Company consider a level of around 4% to be representative for its business scope.
Other income (expense), net was an expense of $19 million in 2024 compared to an expense of $207 million in 2023. Almost all of the $188 million in lower expense was due to lower capacity alignment accruals in 2024 compared to 2023. The high level of capacity alignment accrual in 2023 relate to a structural efficiency program aiming at reducing indirect headcount by up to 2,000. No significant further accruals are expected for this program.
Financial and Non-operating Items, net
Costs for Financial and non-operating items, net, costs increased by $27 million in 2024 compared to previous year, mainly due to $14 million in increased interest expense as the result of higher debt and higher interest rates, and $13 million in increased expenses for Other non-operating items.
Income Taxes
The tax rate for 2024 was 26.0%, compared to 20.1% in 2023. Discrete tax items, net, decreased the tax rate in 2023 by 17.3pp, mainly related to a net deferred tax asset recognized in the fourth quarter of 2023 due to the transfer of certain assets and operations as part of restructuring activities. Discrete tax items, net, decreased the tax rate in 2024 by 4.8pp. In addition, country mix impacted the 2024 tax rate favorably by 6.1pp compared to the prior year. The Company considers a tax rate in the range of 25%-30% to be within normal parameters.
37
Net Income and Earnings Per Share
Net income in 2024 increased by $159 million compared to 2023. Earnings per share, diluted increased by $2.32 compared to a year earlier, where the main drivers were $2.83 from higher operating income and $0.45 from lower number of outstanding shares, diluted, partly offset by $0.76 from higher taxes and $0.21 from higher financial and non-operating items, net.
The weighted average number of shares outstanding assuming dilution in 2024 was 80.4 million compared to 85.2 million in 2023.
NON-GAAP PERFORMANCE MEASURES
In this annual report, the Company sometimes refers to non-GAAP measures that the Company and securities analysts use in measuring Autoliv’s performance.
The Company believes that these measures assist management and investors in analyzing trends in the Company’s business for the reasons given below. Investors should not consider these non-GAAP measures as substitutes for, but rather as additions to, financial reporting measures prepared in accordance with GAAP.
These non-GAAP measures have been identified, as applicable, in each section of this annual report with tabular presentations provided below, reconciling them to GAAP.
It should be noted that these measures, as defined, may not be comparable to similarly titled measures used by other companies.
Organic Sales
The Company analyzes its sales trends and performance as changes in “organic sales growth” or “organic sales decline”, because the Company currently generates approximately three quarters of net sales in currencies other than the reporting currency (i.e. U.S. dollars) and currency rates have proven to be rather volatile. Organic sales present the increase or decrease in the overall U.S. dollar net sales on a comparable basis, allowing separate discussions of the impact of acquisitions/divestitures and exchange rates.
See tabular reconciliations above, that present changes in “organic sales growth” as reconciled to the change in total GAAP net sales.
Net debt
The Company, from time to time enters into “debt-related derivatives” (DRDs) as a part of its debt management and as part of efficiently managing the Company’s overall cost of funds. Creditors and credit rating agencies use net debt adjusted for DRDs in their analyses of the Company’s debt, therefore we provide this non-U.S. GAAP measure. DRDs are fair value adjustments to the carrying value of the underlying debt. Also included in the DRDs is the unamortized fair value adjustment related to a discontinued fair value hedge that will be amortized over the remaining life of the debt. By adjusting for DRDs, the total financial liability of net debt is disclosed without grossing debt up with currency or interest fair values.
Reconciliation of GAAP measure "Total debt" to non-GAAP measure “Net debt”
DECEMBER 31 (Dollars in millions) |
|
2024 |
|
|
2023 |
|
||
Short-term debt |
|
$ |
387 |
|
|
$ |
538 |
|
Long-term debt |
|
|
1,522 |
|
|
|
1,324 |
|
Total debt |
|
|
1,909 |
|
|
|
1,862 |
|
Cash and cash equivalents |
|
|
(330 |
) |
|
|
(498 |
) |
Debt issuance cost/Debt-related derivatives, net |
|
|
(24 |
) |
|
|
3 |
|
Net debt |
|
$ |
1,554 |
|
|
$ |
1,367 |
|
Adjusted operating income, adjusted operating margin and adjusted diluted Earnings per share (EPS)
Adjusted operating margin and adjusted diluted EPS are non-GAAP measures the Company uses to evaluate its business, because the Company believes it assists investors and analysts in comparing the Company's performance across reporting periods on a consistent basis by excluding items that are non-operational or non-recurring in nature (such as costs related to capacity alignments, costs related to antitrust matters and for diluted EPS unusual tax items) and that the Company does not believe are indicative of its core operating performance and underlying business trends. Adjusted operating margin and adjusted diluted EPS, as shown in the table below, should be considered in addition to, but not as a substitute for, other measures of financial performance reported in accordance with GAAP, including operating margin and diluted EPS.
Reconciliation of GAAP measure "Operating income" to Non-GAAP measure "Adjusted Operating income"
(Dollars in millions) |
|
2024 |
|
|
2023 |
|
Operating income (GAAP) |
$ |
979 |
|
$ |
690 |
|
Non-GAAP adjustments: |
|
|
|
|
||
Less: Capacity alignments |
|
19 |
|
|
218 |
|
Less: The Andrews litigation settlement |
- |
|
|
8 |
|
|
Less: Antitrust related items |
|
8 |
|
|
4 |
|
Total non-GAAP adjustments to operating income |
|
27 |
|
|
230 |
|
Adjusted Operating income (Non-GAAP) |
$ |
1,007 |
|
$ |
920 |
|
38
Reconciliation of GAAP measure "Operating margin" to Non-GAAP measure "Adjusted Operating margin"
|
|
2024 |
|
|
2023 |
|
Operating margin (GAAP) |
|
9.4 |
% |
|
6.6 |
% |
Non-GAAP adjustments: |
|
|
|
|
||
Less: Capacity alignments |
|
0.2 |
% |
|
2.1 |
% |
Less: The Andrews litigation settlement |
- |
|
|
0.1 |
% |
|
Less: Antitrust related items |
|
0.1 |
% |
|
0.0 |
% |
Total non-GAAP adjustments to operating margin |
|
0.3 |
% |
|
2.2 |
% |
Adjusted Operating margin (Non-GAAP) |
|
9.7 |
% |
|
8.8 |
% |
Reconciliation of GAAP measure "Earnings per share - diluted" to Non-GAAP measure "Adjusted Earnings per share - diluted"
|
|
2024 |
|
|
2023 |
|
Earnings per share - diluted (GAAP) |
$ |
8.04 |
|
$ |
5.72 |
|
Non-GAAP adjustments: |
|
|
|
|
||
Less: Capacity alignments |
|
0.24 |
|
|
2.56 |
|
Less: The Andrews litigation settlement |
- |
|
|
0.09 |
|
|
Less: Antitrust related items |
|
0.10 |
|
|
0.05 |
|
Less: Tax on non-GAAP adjustments |
|
(0.06 |
) |
|
(0.24 |
) |
Total non-GAAP adjustments to Earnings per share - diluted |
|
0.28 |
|
|
2.46 |
|
Adjusted Earnings per share - diluted (Non-GAAP) |
$ |
8.32 |
|
$ |
8.19 |
|
|
|
|
|
|
||
Weighted average number of shares outstanding - diluted (in millions) |
|
80.4 |
|
|
85.2 |
|
The following tables reconcile Income before income taxes, Net income, Net income attributable to controlling interest, Capital employed, which are inputs utilized to calculate Return On Capital Employed (“ROCE”), adjusted ROCE, Return On Total Equity (“ROE”) and adjusted ROE. The Company believes this presentation may be useful to investors and industry analysts who utilize these adjusted non-U.S. GAAP measures in their ROCE and ROE calculations to exclude certain items for comparison purposes across periods. Autoliv’s management uses the ROCE, adjusted ROCE, ROE and adjusted ROE measures for purposes of comparing its financial performance with the financial performance of other companies in the industry and providing useful information regarding the factors and trends affecting the Company’s business.
The Company believes ROCE and adjusted ROCE are useful indicators of long-term performance both absolute and relative to the Company's peers as it allows for a comparison of the profitability of the Company’s capital employed in its business relative to that of its peers. The Company’s management believes that ROE is a useful indicator of how well management creates value for its shareholders through its operating activities and its capital management.
With respect to the Andrews litigation settlement, the Company has treated this specific settlement as a non-recurring charge because of the unique nature of the lawsuit, including the facts and legal issues involved.
Accordingly, the tables below reconcile from U.S. GAAP to the equivalent non-U.S. GAAP measure.
Reconciliation of GAAP measure "Income before income taxes" to Non-GAAP measure "Adjusted Income before income taxes"
(Dollars in millions) |
|
2024 |
|
|
2023 |
|
Income before income taxes (GAAP) |
$ |
875 |
|
$ |
612 |
|
Non-GAAP adjustments: |
|
|
|
|
||
Less: Capacity alignments |
|
19 |
|
|
218 |
|
Less: The Andrews litigation settlement |
- |
|
|
8 |
|
|
Less: Antitrust related items |
|
8 |
|
|
4 |
|
Total non-GAAP adjustments to Income before income taxes |
|
27 |
|
|
230 |
|
Adjusted Income before income taxes (Non-GAAP) |
$ |
902 |
|
$ |
842 |
|
39
Reconciliation of GAAP measure "Net income" to Non-GAAP measure "Adjusted Net income"
(Dollars in millions) |
|
2024 |
|
|
2023 |
|
Net income (GAAP) |
$ |
648 |
|
$ |
489 |
|
Non-GAAP adjustments: |
|
|
|
|
||
Less: Capacity alignments |
|
19 |
|
|
218 |
|
Less: The Andrews litigation settlement |
- |
|
|
8 |
|
|
Less: Antitrust related items |
|
8 |
|
|
4 |
|
Less: Tax on non-GAAP adjustments |
|
(5 |
) |
|
(20 |
) |
Total non-GAAP adjustments to Net income |
|
22 |
|
|
210 |
|
Adjusted Net income (Non-GAAP) |
$ |
670 |
|
$ |
699 |
|
Reconciliation of GAAP measure "Net income attributable to controlling interest" to Non-GAAP measure "Adjusted Net income attributable to controlling interest"
(Dollars in millions) |
|
2024 |
|
|
2023 |
|
Net income attributable to controlling interest (GAAP) |
$ |
646 |
|
$ |
488 |
|
Non-GAAP adjustments: |
|
|
|
|
||
Less: Capacity alignments |
|
19 |
|
|
218 |
|
Less: The Andrews litigation settlement |
|
0 |
|
|
8 |
|
Less: Antitrust related items |
|
8 |
|
|
4 |
|
Less: Tax on non-GAAP adjustments |
|
(5 |
) |
|
(20 |
) |
Total non-GAAP adjustments to Net income attributable to controlling interest |
|
22 |
|
|
210 |
|
Adjusted Net income attributable to controlling interest (Non-GAAP) |
$ |
668 |
|
$ |
697 |
|
Reconciliation of GAAP measure "Return on Capital Employed" to Non-GAAP measure "Adjusted Return on Capital Employed"
|
|
|
|
|
2024 |
|
|
2023 |
|
Return on capital employed1) (GAAP) |
|
|
|
|
25.0 |
% |
|
17.7 |
% |
Non-GAAP adjustments: |
|
|
|
|
|
|
|
||
Less: Capacity alignments |
|
|
|
|
0.4 |
% |
|
5.1 |
% |
Less: The Andrews litigation settlement |
|
|
|
- |
|
|
0.2 |
% |
|
Less: Antitrust related items |
|
|
|
|
0.2 |
% |
|
0.1 |
% |
Total non-GAAP adjustments to Return on capital employed1) |
|
|
|
|
0.6 |
% |
|
5.3 |
% |
Adjusted Return on capital employed1) (Non-GAAP) |
|
|
|
|
25.6 |
% |
|
23.1 |
% |
|
|
|
|
|
|
|
|
||
Adjustment on Return on capital employed1) (in millions) |
|
|
|
$ |
27 |
|
$ |
230 |
|
1) The average capital employed amount is calculated as an average of the opening balance amount and the closing balance amounts for each quarter included in the period. |
|
||||||||
Reconciliation of GAAP measure "Return on Total Equity" to Non-GAAP measure "Adjusted Return on Total Equity"
|
|
|
|
|
2024 |
|
|
2023 |
|
Return on total equity1) (GAAP) |
|
|
|
|
27.2 |
% |
|
19.0 |
% |
Non-GAAP adjustments: |
|
|
|
|
|
|
|
||
Less: Capacity alignments |
|
|
|
|
0.7 |
% |
|
7.5 |
% |
Less: The Andrews litigation settlement |
|
|
|
- |
|
|
0.3 |
% |
|
Less: Antitrust related items |
|
|
|
|
0.3 |
% |
|
0.1 |
% |
Less: Tax on non-GAAP adjustments |
|
|
|
|
(0.2 |
%) |
|
(0.7 |
%) |
Total non-GAAP adjustments to Return on total equity1) |
|
|
|
|
0.8 |
% |
|
7.2 |
% |
Adjusted Return on total equity1) (Non-GAAP) |
|
|
|
|
28.0 |
% |
|
26.2 |
% |
|
|
|
|
|
|
|
|
||
Adjustment on Return on capital employed1) (in millions) |
|
|
|
$ |
22 |
|
$ |
210 |
|
1) The average total equity amount is calculated as an average of the opening balance amount and the closing balance amounts for each quarter included in the period. |
|
||||||||
40
LIQUIDITY, CAPITAL RESOURCES, AND FINANCIAL POSITION
|
|
Years ended December 31 |
|
|||||
(DOLLARS IN MILLIONS) |
|
2024 |
|
|
2023 |
|
||
Net cash provided by operating activities |
|
$ |
1,059 |
|
|
$ |
982 |
|
Net cash used in investing activities |
|
|
(563 |
) |
|
|
(569 |
) |
Net cash used in financing activities |
|
|
(680 |
) |
|
|
(490 |
) |
Effect of exchange rate changes on cash and cash equivalents |
|
|
16 |
|
|
|
(20 |
) |
Decrease in cash and cash equivalents |
|
|
(168 |
) |
|
|
(96 |
) |
Cash and cash equivalents at beginning of year |
|
|
498 |
|
|
|
594 |
|
Cash and cash equivalents at end of year |
|
$ |
330 |
|
|
$ |
498 |
|
NET CASH PROVIDED BY OPERATING ACTIVITIES
Cash flow from operations, together with available financial resources and credit facilities, is expected to be sufficient to fund the Company’s anticipated working capital requirements, capital expenditures and future dividend payments.
Net cash provided by operating activities was $1,059 million in 2024 compared to $982 million in 2023. The increase of $77 million in 2024 was mainly due to $159 million in higher net income. The improvement was also a supported by continued reduction of working capital, although on a smaller scale compared to the 2023 reduction. The improvement of operating assets and liabilities, net in both 2023 and 2024 was mainly a result of improved customer call-off accuracy enabling more precise planning and use of resources as well as a multi-year working capital efficiency program aiming at improving working capital by $800 million. At the end of 2024, the Company estimates that around $700 million improvement in working capital has been achieved since the start of the program. The remaining around $100 million in the program is targeted to be achieved mainly in inventories and is dependent on a continued improvement in customer call-off accuracy in the years to come.
Receivables outstanding in relation to sales was 19% at December 31, 2024, compared to 20% at December 31, 2023. Factoring agreements did not have any material impact on receivables outstanding for 2024 or 2023.
Inventory outstanding in relation to sales was 9% at December 31, 2024, compared to 9% at December 31, 2023.
Payables outstanding in relation to sales was 17% at December 31, 2024 compared to 18% at December 31, 2023.
NET CASH USED IN INVESTING ACTIVITIES
In 2024 and 2023, net cash used in investing activities amounted to $563 million and $569 million, respectively. The Company's investing activities primarily consist of investments in property, plant and equipment. Net cash generated by operating activities continued to sufficiently cover capital expenditures for property, plant and equipment.
In relation to net sales, capital expenditures, net was 5.4% compared to 5.4% in previous year. The 5.4% level is slightly above what the Company expects for the longer term, due to investments in capacity, mainly in Asia, and in footprint optimization, mainly in Europe and Japan.
Depreciation and amortization totaled $387 million in 2024 compared to $378 million in 2023.
During the years 2024 and 2023, a majority of the Company's investments were for production capacity to support new product launches and automation projects for improved efficiency.
NET CASH USED IN FINANCING ACTIVITIES
Net cash used in financing activities amounted to $680 million and $490 million for the years 2024 and 2023, respectively. The increase of $190 million in cash used in financial activities was mainly the result of $200 million additional repurchased shares in 2024 as compared to 2023.
The Company's net issuance of short-term and long-term debt was $94 million in 2024 and $87 million in 2023.
In 2024, the Company paid cash dividends of $219 million. In 2023, the Company paid dividends of $225 million. The Company's dividend approach has been the same for several years.
The Company repurchased shares to an amount of $552 million and $352 million in 2024 and 2023, respectively. The Company intends to continue to repurchase shares in accordance with the current authorization until the end of 2025.
INCOME TAXES
The Company has reserves for taxes that may become payable in future periods as a result of tax audits. At any given time, the Company is undergoing tax audits covering multiple years in several tax jurisdictions. Ultimate outcomes are uncertain but could, in future periods, have a significant impact on the Company’s cash flows. See discussions of income taxes under Significant Accounting Policies in this section, Note 2, Summary of Significant Accounting Policies, and Note 5, Income Taxes, to the Consolidated Financial Statements included herein.
41
PENSION ARRANGEMENTS
The Company has defined benefit pension plans covering nearly half of the U.S. employees. As of December 31, 2021, the main U.S defined benefit plan was frozen for further benefits. Many of the Company’s non-U.S. employees are also covered by pension arrangements.
At December 31, 2024, the Company’s net pension liability (i.e. the actual funded status) for its U.S. and non-U.S. plans was $153 million compared to $159 million at December 31, 2023.
The plans had a total net unamortized actuarial loss before tax of $36 million recorded in Accumulated Other Comprehensive (Loss) Income in the Consolidated Balance Sheets at December 31, 2024, compared to $34 million at December 31, 2023. The amortization of the actuarial loss is expected to be $22 million in 2025.
Total pension expense associated with the defined benefit plans was $34 million in 2024 and $21 million in 2023, and is expected to be $21 million in 2025. The increase in 2024 pension expense was due to the negative impact from curtailment and settlement losses in mainly Americas.
The Company contributed $29 million to its defined benefit plans in 2024 and $11 million in 2023. The Company expects to contribute $15 million to these plans in 2025 and is currently projecting a yearly funding at approximately the same level in the subsequent years.
For further information about retirement plans see Note 19, Retirement Plans, to the Consolidated Financial Statements included herein.
EQUITY
During 2024, total equity decreased by $285 million to $2,285 million as of December 31, 2024. The change was mainly due to dividends paid to shareholders of $219 million, share repurchases of $558 million, negative foreign exchange effects of $161 million, partly offset by $648 million from net income.
TREASURY ACTIVITES
DEBT AND CREDIT ARRANGEMENTS
The Company's total debt as of December 31, 2024 and 2023 was $1,909 million and $1,862 million, respectively. The Company had a net debt position (see section Non-U.S. GAAP Performance Measures) at December 31, 2024 and 2023 of $1,554 million and $1,367 million, respectively.
In July 2024, the Company entered into a $125 million bilateral revolving credit facility (Bilateral RCF) with substantially the same terms as the revolving credit facility (RCF) with the 11 banks (see below). In May 2022, the Company refinanced its existing RCF of $1,100 million. The facility was syndicated among 11 banks and matures May 2029. The Company pays a commitment fee on the undrawn amount of 0.10%, representing 35% of the applicable margin, which is 0.275% (given the Company’s ratings of "BBB+" from Fitch and “Baa1” from Moody’s). Borrowings under the facility are unsecured. On December 31, 2024, the Company’s unutilized long-term credit facilities were $1,225 million, represented by the RCF and the Bilateral RCF. These facilities are not subject to any financial covenants nor is any other substantial financing of Autoliv.
In February 2024, the Company priced and issued a 5.5-year green bond for a total of €500 million in the Eurobond market. The bond carries a coupon of 3.625% and matures in August 2029.
In March 2023, the Company priced and issued a 5-year green bond for a total of €500 million in the Eurobond market. The bond carries a coupon of 4.25% and matures in March 2028.
In June 2020, the Company utilized its SEK 3,000 million facility with Swedish Export Credit Corporation which was signed in May 2020. The SEK 3,000 million loan mature in May 2025 carrying a floating interest rate of 3M STIBOR +1.85%.
In 2014, the Company issued and sold long-term debt securities in a U.S. Private Placement pursuant to a Note Purchase and Guaranty Agreement dated April 23, 2014, by and among Autoliv ASP Inc., the Company and the purchasers listed therein. As of December 31, 2024, $470 million remains outstanding with $285 million maturing in April 2026 and $185 million maturing in April 2029.
The Company has a €3,000 million Euro Medium Term Note Program in place for being able to issue notes to be traded on the Global Exchange Market of Euronext Dublin. At December 31, 2023, €1,000 million had been issued under this program.
At December 31, 2024 Autoliv’s long-term credit rating from S&P Global Ratings was BBB, from Moody’s Baa1, and from Fitch BBB+. All ratings with stable outlook. As of February 7, 2025, S&P Global Ratings withdrew the ratings for Autoliv on the Company’s request. The company aims to maintain a strong investment grade credit rating.
For additional information about the Company's debt and credit arrangements, see Note 14, Debt and Credit Agreements, to the Consolidated Financial Statements included herein.
42
FACTORING
During 2024 and 2023, the Company sold receivables and discounted notes related to selected customers. These factoring arrangements increase cash while reducing accounts receivable and customer risks. At December 31, 2024, the Company had received $211 million for sold receivables without recourse and discounted notes with a discount cost of $3 million during the year, compared to $209 million at December 31, 2023 with a discount cost of $3 million recorded in Other non-operating items, net.
NUMBER OF SHARES
At December 31, 2024, 77.7 million shares were outstanding (net of 2.7 million treasury shares), a 6.0% decrease from 82.6 million one year earlier.
The number of shares outstanding is expected to increase by 0.5 million when all RSUs and PSs vest and if all SOs to key employees are exercised, see Note 17, Stock Incentive Plans, to the Consolidated Financial Statements included herein.
During 2024 the Company repurchased and retired approximately 5.1 million shares equal to $552 million. In addition, the Company also retired 2,000,000 treasury shares in December 2024. In 2023, the Company repurchased and retired approximately 3.7 million shares equal to $352 million. During 2022, Autoliv repurchased and retired approximately 1.4 million shares, equal to $115 million. In 2022, the Company also retired 10 million shares of common stock that had been repurchased under a prior stock repurchase program and since held in treasury. Under the current stock repurchase program authorized by the Board to repurchase up to $1.5 billion, or 17 million common shares (whichever comes first), between January 2022 and the end of 2024. In November 2024, the Board of Directors approved the extension of the current stock repurchase program through the end of 2025.
Contractual Obligations and Commitments
Contractual obligations include debt, sponsored defined benefit plans, lease and purchase obligations that are enforceable and legally binding on the Company.
For material contractual debt obligations as of December 31, 2024, see Note 14, Debt and Credit Agreements, to the Consolidated Financial Statements included herein.
Operating lease obligations represent the payment obligations (undiscounted cash flows) under leases classified as operating leases. Capital lease obligations are not material. See Note 3, Leases, to the Consolidated Financial Statements included herein.
There are no unconditional purchase obligations other than short-term obligations related to inventory, services, tooling, and property, plant and equipment purchased in the ordinary course of business. Purchase agreements with suppliers entered into in the ordinary course of business do not generally include fixed quantities. Quantities and delivery dates are established in “call off plans” accessible electronically for all customers and suppliers involved. Communicated “call off plans” for production material from suppliers are normally reflected in equivalent commitments from Autoliv customers.
The Company sponsors defined benefit plans that cover a significant portion of the Company's U.S. employees and certain non-U.S. employees. The pension plans in the U.S. are funded in conformity with the minimum funding requirements of the Pension Protection Act of 2006. Funding for the Company's pension plans in other countries is based upon plan provisions, actuarial recommendations and/or statutory requirements. Due to volatility associated with future changes in interest rates and plan asset returns, the Company cannot predict with reasonable reliability the timing and amounts of future funding requirements. The Company may elect to make contributions in excess of the minimum funding requirements for the U.S. plans in response to investment performance and changes in interest rates, or when the Company believes that it is financially advantageous to do so and based on other capital requirements. See Note 19, Retirement Plans, to the Consolidated Financial Statements included herein.
COMMITMENTS
The Company has entered into a number of unrecognized unconditional purchase agreements relating to Solar Farms in US and China during 2024, of which none is individually significant for disclosure. Together these agreements have an aggregated termination fee (discounted) of approximately $51 million as of December 31, 2024.
These Solar Farm agreements have a contract period ranging from 20-25 years. The future payments (undiscounted) relating to these unrecognized unconditional purchase agreements are in total $62 million to be paid over the following years: 1-3 years: $6 million; 4-5 years: $4 million and; more than 5 years: $52 million.
Risks and Risk Management
The Company is exposed to several categories of risks. They can broadly be categorized as operational risks, strategic risks and financial risks. Some of the major risks in each category are described below. There are also other risks that could have a material effect on the Company’s results and financial position, and the description below is not complete but should be read in conjunction with the discussion of risks described in Item 1A above, which contains a description of the Company's material risks.
As described below, the Company has taken several mitigating actions, applied numerous strategies, adopted policies, and introduced control and reporting systems to reduce and mitigate these risks. In addition, the Company from time to time identifies and evaluates emerging or changing risks to the Company in order to ensure that identified risks and related risk management are updated in this fast-moving environment.
43
Operational Risks
LIGHT VEHICLE PRODUCTION
Around 30% of Autoliv’s costs are fixed; therefore, short-term earnings are dependent on sales volumes and highly dependent on capacity utilization in the Company’s plants.
Global LVP is an indicator of the Company’s sales development. Ultimately, however, sales are determined by the production levels for the individual vehicle models for which Autoliv is a supplier (see Dependence on Customers). The Company’s sales are split over several hundred contracts covering more than 1,300 vehicle models. This moderates the effect of changes in vehicle demand of individual countries and regions as well as production issues. The risk of fluctuating sales has also been mitigated by Autoliv’s rapid expansion in Asia and other growth markets, which has reduced the Company’s former high dependence on sales in Europe to a diversified mix with Europe, the Americas and Asia each accounting for approximately 28%, 33% and 39%, respectively, of the Company's 2024 total sales.
It is the Company’s strategy to reduce the risks associated with fluctuating LVP by using temporary personnel in direct production, when appropriate. During 2024 and 2023, the level of temporary personnel in relation to total personnel in direct production decreased to 11% from 13%. To reduce the potential impact of unusual fluctuations in the production of vehicle models supplied by the Company such as during the financial crisis in 2008-2009 and the COVID-19 pandemic in 2020-2021 – it is also necessary for the Company to be prepared to quickly adapt the level of permanent employees as well as fixed cost production capacity.
PRICING PRESSURE
Pricing pressure from customers is an inherent part of the automotive components business. The historical extent of price reductions varies from year to year and takes the form of one time give backs, reductions in direct sales prices and/or discounted reimbursements for engineering work.
In response, Autoliv is continuously engaged in efforts to reduce costs and to provide customers added value by developing new products. Generally, the speed by which these cost-reduction programs generate results will, to a large extent, determine the future profitability of the Company. The various cost-reduction programs are, to a considerable extent, interrelated. This interrelationship makes it difficult to isolate the impact of costs on any single program, therefore, the Company monitors key measures such as costs in relation to sales and productivity.
In 2024, due to cost pressures from labor and other items the Company engaged in extensive negotiations with its customers regarding compensations.
COMPONENT COSTS AND RAW MATERIAL PRICES
The cost of direct materials was approximately 55% of sales in 2024 (55% in 2023).
The main raw materials being used as input material for the Company's operations are steel, textiles, plastic and non-ferrous metals.
The Company still sees effects coming from import tariffs and trade barriers across borders. These barriers are impacting the raw material market and creating pricing and availability uncertainties. There is also volatility in the sea freight rates driven by geopolitical events.
In 2024, raw material inflation was limited. Cost inflation remained significant and related primarily to labor. The Company took actions, including pricing discussions with customers and suppliers, competitive sourcing and exploring alternative materials.
LEGAL
The Company is involved from time to time in regulatory, commercial, and contractual legal proceedings that may be significant, and the Company’s business may suffer as a result of adverse outcomes of current or future legal proceedings. These claims may include, without limitation, commercial or contractual disputes, including disputes with the Company’s suppliers and customers, intellectual property matters, alleged violations of laws, rules or regulations, governmental investigations, personal injury claims, product liability claims, environmental issues, tax and customs matters, and employment matters.
A substantial legal liability or adverse regulatory outcome and the substantial cost to defend the litigation or regulatory proceedings may have an adverse effect on the Company’s business, operating results, financial condition, cash flows and reputation.
No assurances can be given that such proceedings and claims will not have a material adverse impact on the Company’s profitability and consolidated financial position, or that reserves or insurance will mitigate such impact. See Note 18, Contingent Liabilities, to the Consolidated Financial Statements included herein and Item 3 – Legal Proceedings.
44
PRODUCT WARRANTY AND RECALLS
If our products are alleged to fail to perform as expected or are defective, the Company may be exposed to various claims for damages and compensation. Such claims may result in costs and other losses to the Company even where the relevant product is eventually found to have functioned properly. If a product (actually or allegedly) fails to perform as expected or is defective, we may face warranty and recall claims. If such actual or alleged failure or defect results, or is alleged to result, in bodily injury and/or property damage, we may also face product liability and other claims. The Company may experience material warranty, recall, product or other liability claims or losses in the future, and the Company may incur significant cost to defend against such claims. The Company may be required to participate in a recall involving its products. Each vehicle manufacturer has its own practices regarding product recalls and other product liability actions relating to its suppliers. Government safety regulators also have policies and practices with respect to recalls. As suppliers become more integrally involved in the vehicle design process and assume more of the vehicle assembly functions, vehicle manufacturers are increasingly looking to their suppliers for contribution when faced with recalls and product liability claims. In addition, with global platforms and procedures, vehicle manufacturers are increasingly evaluating our quality performance on a global basis. Any one or more quality, warranty or other recall issue(s), including the ones affecting few units and/or having a small financial impact, may cause a vehicle manufacturer to implement measures which may have a severe impact on the Company’s operations, such as a temporary or prolonged suspension of new orders or the Company’s ability to bid for new business.
In addition, over time, there is a risk that the number of vehicles affected by a failure or defect will increase significantly (as would the Company’s costs), since our products often use global designs and are increasingly based on or utilize the same or similar parts, components, or solutions.
Although quality has always been a central focus in the automotive industry, especially for safety products, our customers and regulators have become increasingly attentive to quality with even less tolerance for any deviations, which has resulted in an increase in the number of automotive recalls. This trend is likely to continue as automobile manufacturers introduce even stricter quality requirements and regulating agencies and other authorities increase the level of scrutiny given to vehicle safety issues. A warranty recall or a product liability claim brought against the Company in excess of the Company’s insurance may have a material adverse effect on its business and/or financial results. Vehicle manufacturers are also increasingly requiring their external suppliers to guarantee or warrant their products and bear the costs of repair and replacement of such products under new vehicle warranties. A vehicle manufacturer may attempt to hold the Company responsible for some or all of the repair or replacement costs of defective products under new vehicle warranties when the product supplied did not perform as represented. Additionally, a customer may not allow us to bid for expiring or new business until certain remedial steps have been taken. Accordingly, the future costs of warranty claims by the Company’s customers may be material.
The Company’s warranty reserves are based upon management’s best estimates of amounts necessary to settle future and existing claims. Management regularly evaluates the appropriateness of these reserves and adjusts them when we believe it is appropriate to do so. However, the final amounts determined to be due could differ materially from the Company’s recorded estimates. We believe our established reserves are adequate to cover potential warranty settlements typically seen in our business.
The Company’s strategy is to follow a stringent procedure when developing new products and technologies and to apply a proactive “zero-defect” quality policy (see section Quality Management). In addition, the Company maintains a program of insurance, which includes commercial insurance, self-insurance, or a combination of both approaches, for potential recall and product liability claims in amounts and on terms that it believes are reasonable and prudent based on our prior claims experience. However, such insurance may not be sufficient to cover every possible claim that can arise in the Company’s businesses, now or in the future, or may not always will be available should the Company, now or in the future, wish to extend, renew, increase or otherwise adjust such insurance. In recent years, the cost of recall and product liability insurance as well as the Company’s level of self-insurance and deductibles has increased. Management’s decision regarding what insurance to procure is also impacted by the cost for such insurance. As a result, the Company may face material losses in excess of the insurance coverage procured. A substantial recall or liability in excess of coverage levels could therefore have a material adverse effect on the Company.
ENVIRONMENTAL
Most of the Company’s manufacturing processes consist of the assembly of components. As a result, the environmental impact from the Company’s plants is generally modest. While the Company’s businesses from time to time are subject to environmental investigations, there are no material environmental-related cases pending against the Company. Therefore, Autoliv does not incur (or expect to incur) any material costs or capital expenditures associated with maintaining facilities compliant with U.S. or non-U.S. environmental requirements. To reduce environmental risk, the Company has implemented an environmental management system in all plants globally and has adopted an environmental policy (see corporate website www.autoliv.com).
Autoliv is subject to a number of environmental and occupational health and safety laws and regulations. Such requirements are complex and are generally becoming more stringent over time. There can be no assurance that these requirements will not change in the future, or that the Company will at all times be in compliance with all such requirements and regulations, despite its intention to be. The Company may also find itself subject, possibly due to changes in legislation or other regulation, to environmental liabilities based on the activities of its predecessor entities or of businesses acquired. Such liability could be based on activities which are not related to the Company’s current activities.
45
TRADE
Autoliv is subject to various international trade regulations and regimes and changes in these regimes could lead to increased compliance costs and costs of raw materials and other components. In addition, political conditions leading to trade conflicts and the imposition of tariffs or other trade barriers between countries in which the Company does business could increase its costs of doing business.
Strategic Risks
REGULATIONS
In addition to vehicle production, the Company’s market is driven by the safety content per vehicle, which is affected by new regulations and new vehicle rating programs, in addition to consumer demand for new safety technologies.
The most important regulations are the seatbelt installation laws that exist in all vehicle-producing countries. Many countries also have strict enforcement laws on the wearing of seatbelts. Another significant vehicle safety regulation is the U.S. federal law that, since 1997, requires frontal airbags for both the driver and the front-seat passenger in all new vehicles sold in the U.S.
In 2007, the U.S. adopted new regulations for head impact and enhanced thorax protection in side impact crashes, which now have been fully phased-in. China introduced a vehicle rating program in 2006 and during the past 18 years this China NCAP, together with the additional Chinese rating program, CIASI, from 2017, drive Chinese vehicle safety performance and safety content with regards to crashworthiness and occupant protection. Latin America introduced a basic rating program in 2010 followed by ASEAN NCAP in Southeast Asia in 2011, and Global NCAP is rating vehicles sold in significant emerging markets. Several countries, e.g., Malaysia and Thailand, are increasingly adopting the UN Regulations regarding vehicle safety under the UN 1958 agreement, and Malaysia started a world first motorcycle safety rating program in 2021.
The United States upgraded its vehicle rating program, US NCAP, in 2011 and again in 2024. Europe upgraded the Euro NCAP rating system during 2018, and is now completing a new upgrade, intended to be fully implemented by 2025. Japan and South Korea are continuously upgrading their respective vehicle rating programs, JNCAP and KNCAP respectively. India requires frontal airbags for the driver from July 2019, and passenger airbags from 2021 for all new passenger vehicles (M1), moreover has announced that side airbags shall become mandatory in 2023. In addition, India's Bharat NCAP went into effect in 2023 and was updated in 2024.
Vehicles with automated driving systems (ADS) are expected to provide additional opportunities through integration of protective safety systems with ADAS technologies, as well as new vehicle interior layouts and seating configurations. This development is likely to become subject to legal requirements.
There are also other plans for improved automotive safety through new or changed regulations, both in these countries and others that could affect the Company’s market. However, there can be no assurance that changes in regulations will not adversely affect the demand for the Company’s products or, at least, result in a slower increase in the demand for them.
DEPENDENCE ON CUSTOMERS
As a result of this highly consolidated market, the Company is dependent on a relatively small number of customers with strong purchasing power. In 2024, the Company's five largest customers accounted for around 41% of global LVP and the ten largest accounted for around 62% of global LVP. In 2024, the Company’s five largest customers accounted for around 44% of consolidated sales and the ten largest customers accounted for around 71% of consolidated sales. The Company's largest customer contract accounted for around 4% of consolidated sales in 2024.
Customer |
|
% of Autoliv sales |
|
|
% of Global LVP1) |
|
||
VW |
|
|
9.2 |
% |
|
|
10.0 |
% |
Toyota |
|
|
9.1 |
% |
|
|
12.1 |
% |
Stellantis |
|
|
9.1 |
% |
|
|
5.9 |
% |
Honda |
|
|
8.7 |
% |
|
|
4.4 |
% |
Hyundai |
|
|
7.6 |
% |
|
|
8.4 |
% |
Ford |
|
|
6.8 |
% |
|
|
4.1 |
% |
General Motors |
|
|
5.6 |
% |
|
|
4.7 |
% |
Nissan |
|
|
5.4 |
% |
|
|
4.7 |
% |
Mercedes |
|
|
5.2 |
% |
|
|
2.7 |
% |
Major EV maker |
|
|
4.5 |
% |
|
|
2.0 |
% |
1) Source: S&P Global January 2025
Although business with every major customer is split into at least several contracts (usually one contract per vehicle platform) and although the customer base has become more balanced and diversified as a result of the Company's significant expansion in China and other rapidly-growing markets, the loss of all business from a major customer (whether by a cancellation of existing contracts or not awarding Autoliv new business), the consolidation of one or more major customers or a bankruptcy of a major customer could have a material adverse effect on the Company. In addition, a quality issue, shortcomings in the Company's service to a customer or uncompetitive prices or products could result in the customer not awarding the Company new business, which will gradually have a negative impact on the Company's sales when current contracts start to expire.
See also Note 20, Segment Information, to the Consolidated Financial Statements included herein.
46
CUSTOMER PAYMENT RISK
Another risk related to the Company's customers is the risk that one or more of its customers will be unable to pay their invoices that become due. The Company seeks to limit this customer payment risk by invoicing its major customers through their local subsidiaries in each country, even for global contracts. By invoicing this way, the Company attempts to avoid having the receivables with a multinational customer group exposed to the risk that a bankruptcy or similar event in one country would put all receivables with such customer group at risk. In each country, the Company also monitors invoices becoming overdue.
Even so, if a major customer is unable to fulfill its payment obligations, it is likely that the Company would be forced to record a substantial loss on such receivables.
DEPENDENCE ON SUPPLIERS
The Company relies on internal and/or external suppliers in order to meet its delivery commitments to the customers. In some cases, suppliers are dictated by the customers. The Company's supply chain organization continually reviews sourcing risks and actively works on mitigating related supply chain risks.
The Company’s ambition is to maintain an optimal number of suppliers in all significant component technologies.
NEW COMPETITION
Increased competition may result in price reductions, reduced margins and the Company's inability to gain or hold market share. OEMs rigorously evaluate suppliers on the basis of product quality, price, reliability and delivery as well as engineering capabilities, technical expertise, product innovation, financial viability, application of lean principles, operational flexibility, customer service, and overall management. To maintain the Company's competitiveness and position as a market leader, it is important to focus on all these aspects of supplier evaluation and selection.
Although the market for occupant restraint systems has undergone a significant consolidation during the past ten years, the passive safety market remains very competitive. It cannot be excluded that additional competitors, both global and local, will seek to enter the market or grow beyond their current Keiretsu group or traditional customer base. Particularly in China, South Korea, and Japan there are numerous domestic competitors often supplying just one OEM group.
PATENTS AND PROPRIETARY TECHNOLOGY
The Company’s strategy is to protect its innovations with patents, and to vigorously protect and defend its patents, trademarks, and know-how against infringement and unauthorized use. At the end of 2024, the Company held more than 6,600 patents and patents applications. These patents expire on various dates during the period from 2025 to 2044 The expiration of any single patent is not expected to have a material adverse effect on the Company’s financial results.
Although the Company believes that its products and technology do not infringe upon the proprietary rights of others, there can be no assurance that third parties will not assert infringement claims against the Company in the future. Also, there can be no assurance that any patent now owned by the Company will afford protection against competitors that develop similar technology. As the Company continues to expand its products and expand into new businesses, it will increase its exposure to intellectual property claims.
Financial Risks
The Company is exposed to financial risks through its operations. To reduce the financial risks and to take advantage of economies of scale, the Company has a central treasury department supporting operations and management. The treasury department handles external financial transactions and functions as the Company’s in-house bank for its subsidiaries.
The Board of Directors monitors compliance with the financial risk policy on an on-going basis. For information about specific financial risks, see Item 7A – Quantitative and Qualitative Disclosures about Market Risk.
47
Significant Accounting Policies and Critical Accounting Estimates
NEW ACCOUNTING STANDARDS
The Company has considered all applicable recently issued accounting standards. The Company has summarized in Note 2, Summary of Significant Accounting Policies, to the Consolidated Financial Statements each of the recently issued accounting standards and stated the impact or whether management is continuing to assess the impact.
CRITICAL ACCOUNTING ESTIMATES
The Company’s significant accounting policies are disclosed in Note 2, Summary of Significant Accounting Policies, to the Consolidated Financial Statements included herein. The application of accounting policies necessarily requires judgments and the use of estimates by a Company’s management. Actual results could differ from these estimates. By their nature, these judgments are subject to an inherent degree of uncertainty. These judgments are based on the Company's historical experience, terms of existing contracts, and management’s evaluation of trends in the industry, information provided by the Company's customers and information available from other outside sources, as appropriate. The Company considers an accounting estimate to be critical if:
The Company has summarized its critical accounting policies requiring judgment below. These might change over time based on the current facts and circumstances.
REVENUE RECOGNITION
In accordance with ASC 606, Revenue from Contracts with Customers, revenue is measured based on consideration specified in a contract with a customer, adjusted for any variable consideration (i.e., price concessions) and estimated at contract inception. The Company recognizes revenue when it satisfies a performance obligation by transferring control over a product to a customer. The estimated amount of variable consideration that will be received or paid by the Company is based on historical experience and trends, management's understanding of the status of negotiations with customers and including pricing strategies. Negotiations with customers is an ongoing process and the recognition of variable considerations is impacted by the outcome and timing of these negations. Estimating variable consideration to be received or paid related to price concessions requires significant judgments by management that affect the amount of revenue recorded in the financial statements due to the unique facts and circumstances in each of the customer agreements and the on-going commercial negotiations with the customers. For the year-end 2024 the company recognized an accrual amounting to $185 million net for variable considerations to be received or paid for variable considerations versus $173 million the year before.
In addition, from time to time, the Company may make payments to customers in connection with ongoing and future business. These payments to customers are generally recognized as a reduction to revenue at the time of the commitment to make these payments unless the payment concession can be clearly linked to the future business award. If the payments are capitalized, the amounts are amortized to revenue as the related goods are transferred. In the year-end 2024 and 2023 respectively the capitalized amount has been insignificant.
CONTINGENT LIABILITIES
Various claims, lawsuits and proceedings are pending or threatened against the Company or its subsidiaries, covering a range of matters that arise in the ordinary course of its business activities with respect to commercial, product liability or other matters.
The Company diligently defends itself in such matters and, in addition, carries insurance coverage to the extent reasonably available against insurable risks.
The Company records liabilities for claims, lawsuits and proceedings when they are probable and it is possible to reasonably estimate the cost of such liabilities. Legal costs expected to be incurred in connection with a loss contingency are expensed as such costs are incurred.
A loss contingency is accrued by a charge to income if it is probable that an asset has been impaired or a liability has been incurred and the amount of the loss can be reasonably estimated. In determining whether a loss should be accrued management evaluates, among other factors, the degree of probability of an unfavorable outcome and the ability to make a reasonable estimate of the amount of loss. Changes in these factors could materially impact the Company's consolidated financial statements.
The company continuously assesses the relevant facts and circumstances for on-going litigation matters in its determination of whether it is probable that an asset has been impaired or a liability has been incurred. The Company also considers its historical experience of similar matters using significant judgement to make its estimates. For the years ended December 31, 2024 and 2023 management's estimation process has been consistent and there have not been any material changes to the contingent liabilities recorded during 2024.
For further information, see Note 18 Contingent Liabilities describing the significant on-going claims and lawsuits the company is involved in.
48
RECALL PROVISIONS AND WARRANTY OBLIGATIONS
The Company records liabilities for product recalls when probable claims are identified and when it is possible to reasonably estimate costs. Recall costs are costs incurred when the customer decides to formally recall a product due to a known or suspected safety concern. Product recall costs are estimated based on the expected cost of replacing the product and the customer´s cost of carrying out the recall, which is affected by the number of vehicles subject to recall and the cost of labor and materials to remove and replace the defective product. The Company maintains a program of insurance, which may include commercial insurance, self-insurance, or a combination of both approaches, for potential recall and product liability claims in amounts and on terms that it believes are reasonable and prudent based on our prior claims experience. The Company’s insurance policies generally include coverage of the costs of a recall, although costs related to replacement parts are generally not covered. Actual costs incurred could differ from the amounts estimated, requiring adjustments to these reserves in future periods. It is possible that changes in our assumptions or future product recall issues could materially affect our financial position, results of operations or cash flows.
Estimating warranty obligations requires the Company to forecast the resolution of existing claims and expected future claims on products sold. The Company bases the estimate on historical trends of units sold and payment amounts, combined with our current understanding of the status of existing claims and discussions with our customers. These estimates are re-evaluated on an ongoing basis. Actual warranty obligations could differ from the amounts estimated requiring adjustments to existing reserves in future periods. Due to the uncertainty and potential volatility of the factors contributing to developing these estimates, changes in our assumptions could materially affect our results of operations.
The provision recorded for product liabilities for the years ended December 31, 2024 and 2023 were $65 million and $96 million respectively. The Company continuously assesses the relevant facts and circumstances for on-going product recall matters and considers its historical experience of similar matters using significant judgement to make its estimates, which are generally supported by external counsel expertise. For the years ended December 31, 2024 and 2023 respectively management’s estimation process has been consistent and the ultimate outcome for settled product recall matters during the years ended December 31, 2024 and 2023 as compared to management estimations have been favorable. The reversal of the reserve in 2024 was related to certain recall issues that were settled with a favorable outcome.
For further information, see Note 13 Product Related Liabilities and Note 18 Contingent Liabilities.
DEFINED BENEFIT PENSION PLANS
The Company has defined benefit pension plans in thirteen countries. The most significant plans exist in the U.S. These U.S. plans represent approximately 50% of the Company’s total pension benefit obligation. See Note 19, Retirement Plans to the Consolidated Financial Statements included herein.
The Company, in consultation with its actuarial advisors, determines certain key assumptions to be used in calculating the projected benefit obligation and annual pension expense. For the U.S. plans, the assumptions used for calculating the 2024 pension expense were a discount rate of 5.13% and an expected long-term rate of return on plan assets of 6.21%.
The assumptions used in calculating the U.S. benefit obligations disclosed, as of December 31, 2024 were a discount rate of 5.60%. The discount rate for the U.S. plans has been set based on the rates of return of high-quality fixed-income investments currently available at the measurement date and are expected to be available during the period the benefits will be paid. The expected rate of long-term return on plan assets are determined based on several factors and must consider long-term expectations and reflect the financial environment in the respective local markets. At December 31, 2024, 30% of the U.S. plan assets were invested in equities, which is close to the target of 32%.
The table below illustrates the sensitivity of the U.S. net periodic benefit cost and projected U.S. benefit obligation to a 1pp change in the discount rate and decrease in return on plan assets for the U.S. plans (in millions). The use of actuarial assumptions is an area of management’s estimate.
Assumption |
|
Change |
|
2024 net |
|
|
2024 projected |
|
||
Discount rate |
|
1pp increase |
|
$ |
1 |
|
|
$ |
(14 |
) |
Discount rate |
|
1pp decrease |
|
|
(1 |
) |
|
|
16 |
|
Return on plan assets |
|
1pp decrease |
|
|
2 |
|
|
n/a |
|
|
49
INCOME TAXES
Significant judgment is required in determining the worldwide provision for income taxes. In the ordinary course of a global business, there are many transactions for which the ultimate tax outcome is uncertain. Many of these uncertainties arise because of intercompany transactions. The measurement of current and deferred tax liabilities and assets is based on provisions of enacted tax laws. Deferred tax assets are reduced by the amount of any tax benefits that are not expected to be realized. A valuation allowance is recognized if, based on the weight of all available evidence, it is more likely than not that some portion, or all, of the deferred tax asset will not be realized. Evaluation of the realizability of deferred tax assets is subject to significant judgment requiring careful consideration of all facts and circumstances, including key factors such as projected future profitability including tax planning strategies, interpretation of applicable tax laws and on-going or anticipated tax audits. Deferred net tax assets amounted to $394 million for the year 2024 including a valuation allowance of $126 million. For 2023 the deferred net tax assets amounted to $394 million including a valuation allowance of $129 million.
The Company evaluates its uncertain tax positions based on enacted tax laws and consideration of all facts and circumstances, including key factors such as interpretation of applicable tax laws, on-going tax audits or anticipated tax controversies. The unrecognized tax benefits amounted to $35 million and $83 million respectively for the year 2024 and 2023. The change mainly relates to expiration of statutes of limitations.
See also the discussion of reserves for uncertain tax positions, and the determination of valuation allowances on the Company's deferred tax assets in Note 5, Income Taxes, to the Consolidated Financial Statements.
50
Item 7A. Quantitative and Qualitative Disclosures about Market Risk
The Company is exposed to several markets risks in the ordinary course of business including risks related to currencies, interest rates, financing, capital structure, credit ratings and impairment. See also Note 2, Summary of Significant Accounting Policies to the Consolidated Financial Statements included with this Annual Report for information about how these risks are quantified.
CURRENCY RISKS
1. Transaction Exposure and Revaluation effects
Transaction exposure arises because the cost of a product originates in one currency and the product is sold in another currency. Revaluation effects come from valuation of assets and liabilities denominated in other currencies than the reporting currency of each unit.
The Company's net transaction exposure in 2024 was approximately $2.4 billion. The four largest net exposures are U.S. dollars (sell) against the Mexican Peso, Romanian Lei (buy) against the Euro, U.S. dollars (buy) against Korean Won and U.S. dollars (buy) against Japanese Yen. Together these currencies accounted for approximately 50% of the Company’s net currency transaction exposure.
Since the Company can only effectively hedge these currency flows in the short term, periodic hedging would only reduce the impact of fluctuations temporarily. Over time, periodic hedging would postpone but not reduce the impact of fluctuations. In addition, the net exposure is limited to only around one quarter of net sales and is made up of around 45 different currency pairs with exposures of more than $1 million each. The Company generally does not hedge these flows.
2. Translation Exposure in the Income Statement and Balance Sheet
Another effect of exchange rate fluctuations arises when the income statements of non-U.S. subsidiaries are translated into U.S. dollars. Outside the U.S., the Company’s most significant currency is the Euro. The Company estimates that 27% of its consolidated net sales will be denominated in Euro or other European currencies during 2025, while 18% of its consolidated net sales are estimated to be denominated in U.S. dollars.
The Company estimates that a 1% increase in the value of the U.S. dollar versus European currencies will decrease reported U.S. dollar annual net sales in 2025 by $28 million, while operating income for 2025 will decline by $3 million, assuming reported corporate average margin.
The Company’s policy is not to hedge this type of translation exposure.
A translation exposure also arises when the balance sheets of non-U.S. subsidiaries are translated into U.S. dollars. The policy of the Company is to finance major subsidiaries in the country’s local currency and to minimize the amounts held by subsidiaries in foreign currency accounts.
Consequently, changes in currency rates relating to funding and foreign currency accounts normally have a small impact on the Company’s income. In 2024 and 2023, the impact from the Company’s currency exposure were not material.
INTEREST RATE RISK
Interest rate risk refers to the risk that interest rate changes will affect the Company’s borrowing costs. The Company's interest rate risk policy states that the average interest rate fixing period should be minimum 1 year and maximum 5 years.
At December 31, 2024, the average interest rate fixing period for the Company’s outstanding debt was 2.8 years, and at December 31, 2023, the average interest rate fixing period for the Company’s outstanding debt was 2.1 years.
Given the Company’s current capital structure, we estimate that a one-percentage point interest rate increase would increase net interest expense by approximately $0.7 million on an annual basis. This is based on the capital structure at the end of 2024 when the gross fixed-rate debt was $1,522 million while the Company had a net debt position of $1,554 million (see section Non-U.S. GAAP Performance Measures). Thus, a change in the interest rate environment would not have a notable impact on the Company’s interest expense. As of December 31, 2024, the Company had $330 million in cash and cash equivalents of which the majority were subject to a floating interest rate. Taking the cash and cash equivalents of $330 million (which is primarily subject to floating interest rates) minus the portion of debt carrying floating interest rates, we estimated that a one-percentage point interest rate increase would increase net interest expense by approximately $0.7 million on an annual basis.
Fixed interest rate debt can be achieved both by issuing fixed rate notes and through interest rate swaps. The most notable debt carrying fixed interest rates is the €500 million bond issued in 2023, the €500 million bond issued in 2024, and the U.S. private placement notes totaling $470 million. See Note 14 to the Consolidated Financial Statements included herein.
51
FINANCING RISK
Financing risk refers to the risk that it will be difficult and/or expensive to finance new or existing debt to meet the financing needs of the Autoliv Group.
The management of the financing risk ensures access to funding in a cost-efficient way by diversification of funding sources and debt maturities.
Autoliv has diversified its long-term funding sources by issuing notes in the USPP and Eurobond markets, and by signing a long-term credit agreement with 12 banks. The Company also has a lending facility with the Swedish Export Credit Corporation.
The Company has a Euro Medium Term Note Program in place for being able to issue notes to be listed at Euronext Dublin. The Company also has established programs for short-term issuance of commercial papers in the Swedish and US markets and short-term credit agreements, e.g., bank overdrafts and money market loans.
To ensure diversification of debt maturities no more than 20% of the Autoliv Group’s total debt may mature the next 12 months, unless such maturities (in excess of 20%) are covered by unutilized committed credit facilities with maturity in excess of 12 months. Per December 31, 2024, 20% corresponding to $387 million of the Autoliv Group’s total debt had maturity less than 12 months. This amount was fully covered by unutilized committed credit facilities with maturity in excess of 12 months.
CAPITAL STRUCTURE AND CREDIT RATING
The overall objective relating to Autoliv’s target capital structure and credit rating is to provide the Company with sufficient flexibility to manage the inherent risks and cyclicality in Autoliv’s business and allow the Company to realize strategic opportunities and fund growth initiatives while creating shareholder value.
Autoliv is committed to maintain a “strong investment grade credit rating." As of December 31, 2024, the Company had a long-term credit rating from S&P Global Ratings of BBB, from Moody’s of Baa1 and from Fitch of BBB+. As of February 7, 2025, S&P Global Ratings withdrew the ratings for Autoliv on the company’s request.
The amount of interest-bearing debt held impacts the future financial flexibility as well as the credit rating. Management uses the non-GAAP measure “Leverage Ratio” to analyze the amount of debt the Company can incur under its debt policy. Management believes that this policy also provides guidance to credit and equity investors regarding the extent to which the Company would be prepared to leverage its operations. Autoliv’s long-term target for the leverage ratio (sum of net debt plus pension liabilities divided by EBITDA) is 1.0x with the aim to operate within the range of 0.5x to 1.5x. At December 31, 2024, the leverage ratio (non-GAAP measure, see calculation table below) was 1.2x. For details and calculation of leverage ratio, refer to the table below.
CALCULATION OF NON-GAAP MEASURE LEVERAGE RATIO
|
|
December 31, |
|
|||||
|
|
2024 |
|
|
2023 |
|
||
Net debt1) |
|
$ |
1,554 |
|
|
$ |
1,367 |
|
Pension liabilities |
|
|
153 |
|
|
|
159 |
|
Debt per the Policy |
|
|
1,708 |
|
|
|
1,527 |
|
|
|
|
|
|
|
|
||
Net income2) |
|
|
648 |
|
|
|
489 |
|
Income taxes2) |
|
|
227 |
|
|
|
123 |
|
Interest expense, net2,3) |
|
|
95 |
|
|
|
80 |
|
Other non-operating items, net2) |
|
|
16 |
|
|
|
3 |
|
Income from equity method investments2) |
|
|
(7 |
) |
|
|
(5 |
) |
Depreciation and amortization of intangibles2) |
|
|
387 |
|
|
|
378 |
|
Capacity alignments costs and antitrust related matters2) |
|
|
27 |
|
|
|
230 |
|
EBITDA per the Policy (Adjusted EBITDA) |
|
$ |
1,394 |
|
|
$ |
1,297 |
|
Leverage ratio |
|
|
1.2 |
|
|
|
1.2 |
|
1) Net debt is short- and long-term debt and debt-related derivatives less cash and cash equivalents (non-GAAP measure).
2) Latest 12 months.
3) Interest expense, net is interest expense including cost for extinguishment of debt, if any, less interest income.
52
CREDIT RISK IN FINANCIAL MARKETS
Credit risk refers to the risk of a financial counterparty being unable to fulfill an agreed-upon obligation.
In the Company’s financial operations, credit risk arises when cash is deposited with banks and when entering into forward exchange agreements, swap contracts or other financial instruments.
The policy of the Company is to work with banks that have a high credit rating and that participate in Autoliv’s financing.
To further reduce credit risk, deposits and financial instruments can only be entered into with core banks up to a calculated risk amount of $250 million per bank for banks rated A- or above and up to $50 million for banks rated BBB+. In addition, deposits can be made in U.S. and Swedish government short-term notes and certain AAA rated money market funds, as approved by the Company’s Board of Directors. At December 31, 2024, the Company held $31 million in AAA rated money market funds.
IMPAIRMENT RISK
Impairment risk refers to the risk that the Company will write down a material amount of its goodwill of close to $1.4 billion as of December 31, 2024. This risk is assessed at least annually in the fourth quarter each year when the Company performs its impairment testing.
It has been concluded that presently the Company's goodwill is not “at risk”. However, there can be no assurance that goodwill will not be impaired due to future significant declines in LVP, due to the Company's technologies or products becoming obsolete or for any other reason. The Company could also acquire companies where goodwill could turn out to be less resilient to deteriorations in external conditions.
See also discussion under Goodwill and Intangible Assets in Note 2, Summary of Significant Accounting Policies, and Note 10, Goodwill and Intangible Assets, to the Consolidated Financial Statements included herein.
Item 8. Financial Statements and Supplementary Data
The Consolidated Balance Sheets of Autoliv as of December 31, 2024 and 2023 and the Consolidated Statements of Income, Comprehensive Income, Cash Flows and Total Equity for each of the three years in the period ended December 31, 2024, the Notes to the Consolidated Financial Statements, and the Reports of the Independent Registered Public Accounting Firm are included below.
All of the schedules specified under Regulation S-X to be provided by Autoliv have been omitted either because they are not applicable, are not required or the information required is included in the financial statements or notes thereto.
53
Report of Independent Registered Public Accounting Firm
To the Shareholders and the Board of Directors of Autoliv, Inc.
Opinion on the Financial Statements
We have audited the accompanying consolidated balance sheets of Autoliv, Inc. (the Company) as of December 31, 2024 and 2023, the related consolidated statements of income, comprehensive income, total equity and cash flows for each of the three years in the period ended December 31, 2024, and the related notes (collectively referred to as the “consolidated financial statements”). In our opinion, the consolidated financial statements present fairly, in all material respects, the financial position of the Company at December 31, 2024 and 2023, and the results of its operations and its cash flows for each of the three years in the period ended December 31, 2024, in conformity with U.S. generally accepted accounting principles.
We also have audited, in accordance with the standards of the Public Company Accounting Oversight Board (United States) (PCAOB), the Company's internal control over financial reporting as of December 31, 2024, based on criteria established in Internal Control-Integrated Framework issued by the Committee of Sponsoring Organizations of the Treadway Commission (2013 framework) and our report dated February 20, 2025 expressed an unqualified opinion thereon.
Basis for Opinion
These financial statements are the responsibility of the Company's management. Our responsibility is to express an opinion on the Company’s financial statements based on our audits. We are a public accounting firm registered with the PCAOB and are required to be independent with respect to the Company in accordance with the U.S. federal securities laws and the applicable rules and regulations of the Securities and Exchange Commission and the PCAOB.
We conducted our audits in accordance with the standards of the PCAOB. Those standards require that we plan and perform the audit to obtain reasonable assurance about whether the financial statements are free of material misstatement, whether due to error or fraud. Our audits included performing procedures to assess the risks of material misstatement of the financial statements, whether due to error or fraud, and performing procedures that respond to those risks. Such procedures included examining, on a test basis, evidence regarding the amounts and disclosures in the financial statements. Our audits also included evaluating the accounting principles used and significant estimates made by management, as well as evaluating the overall presentation of the financial statements. We believe that our audits provide a reasonable basis for our opinion.
Critical Audit Matters
The critical audit matters communicated below are matters arising from the current period audit of the financial statements that were communicated or required to be communicated to the audit committee and that: (1) relate to accounts or disclosures that are material to the financial statements and (2) involved our especially challenging, subjective, or complex judgments. The communication of critical audit matters does not alter in any way our opinion on the consolidated financial statements, taken as a whole, and we are not, by communicating the critical audit matters below, providing separate opinions on the critical audit matters or on the accounts or disclosures to which they relate.
|
|
Revenue recognition |
Description of the |
|
As discussed in Note 2 to the consolidated financial statements, the Company measures revenue based on consideration specified in a contract with a customer, adjusted for any variable consideration (i.e. price concessions). Revenue is recognized based on the agreed-upon price at the time of shipment, and sales incentives, allowances and certain customer payments are recognized as a reduction to revenue at the time of the commitment to provide such incentives or make such payments.
Auditing revenue recorded for customer contracts containing variable consideration, that are subject to on-going commercial negotiations for price concessions, was complex and judgmental due to the difficulty in evaluating the sufficiency of evidence available to assess the existence of and likely outcome of on-going commercial negotiations.
|
How We |
|
We obtained an understanding, evaluated the design, and tested the operating effectiveness of internal controls over management’s review of customer contracts containing variable consideration. This included testing controls over management’s process to identify and evaluate the accounting of customer contracts that contain sales incentives, allowances, and customer payments that impact revenue recognition.
Our audit procedures to assess the Company’s identification of and accounting for contracts containing variable consideration that are subject to on-going commercial negotiations for price concessions, included, among others, interviewing and obtaining written representations from executives, within the Company, responsible for such negotiations with customers and testing a sample of payments and credit memos issued to customers. Our procedures also included inspecting a sample of customer agreements, and other related supporting documentation, evaluating the terms therein and assessing the appropriateness of the accounting treatment. |
54
|
|
Product recall liabilities |
Description of the |
|
As discussed in Notes 2, 13 and 18 to the consolidated financial statements, the Company is exposed to product liability claims in the event its products fail to perform as represented and such failure results, or is alleged to result, in bodily injury, and/or property damage or other loss. The Company records liabilities for product recalls when probable claims are identified and when it is possible to reasonably estimate costs. Provisions for product recalls are estimated based on the expected cost of replacing the product and the customer’s cost of carrying out the recall, which is affected by the number of vehicles subject to recall and the cost of labor and materials to remove and replace the defective product. Auditing product recall liabilities was complex due to the uncertainty inherent in identifying product recalls, as well as the assumptions and estimates management uses to calculate the provisions for product recalls. These significant assumptions and estimates include the nature, likelihood, timing, and anticipated cost of known and potential claims.
|
How We |
|
We obtained an understanding, evaluated the design, and tested the operating effectiveness of internal controls over the Company’s product recall liabilities process. This included testing controls over management’s process to identify product recalls and determine the assumptions and estimates used to record product recall liabilities. To audit product recall liabilities, our audit procedures included, among others, obtaining and reviewing source documentation, used by the Company to estimate the liability and assessing the reasonableness of assumptions used by performing independent calculations and sensitivity analyses to identify contrary evidence. We evaluated the Company’s ability to estimate the product recall liabilities by performing retrospective reviews of management’s estimates and comparing actual results to previous estimates and judgments made by management. We also obtained letters from the Company’s internal and external legal counsel addressing material claims against the Company, if any, and examined relevant third-party automotive safety regulatory information to identify potential unrecorded product recall liabilities. |
/s/ Ernst & Young AB |
|
We have served as the Company's auditor since 1984.
Stockholm, Sweden |
February 20, 2025 |
55
Report of Independent Registered Public Accounting Firm
To the Shareholders and the Board of Directors of Autoliv, Inc.
Opinion on Internal Control over Financial Reporting
We have audited Autoliv, Inc.’s internal control over financial reporting as of December 31, 2024, based on criteria established in Internal Control—Integrated Framework issued by the Committee of Sponsoring Organizations of the Treadway Commission (2013 framework) (the COSO criteria). In our opinion, Autoliv, Inc. (the Company) maintained, in all material respects, effective internal control over financial reporting as of December 31, 2024, based on the COSO criteria.
We also have audited, in accordance with the standards of the Public Company Accounting Oversight Board (United States) (PCAOB), the consolidated balance sheets of the Company as of December 31, 2024 and 2023, the related consolidated statements of income, comprehensive income, total equity and cash flows for each of the three years in the period ended December 31, 2024, and the related notes and our report dated February 20, 2025 expressed an unqualified opinion thereon.
Basis for Opinion
The Company’s management is responsible for maintaining effective internal control over financial reporting and for its assessment of the effectiveness of internal control over financial reporting included in the accompanying Management’s Report on Internal Control over Financial Reporting. Our responsibility is to express an opinion on the Company’s internal control over financial reporting based on our audit. We are a public accounting firm registered with the PCAOB and are required to be independent with respect to the Company in accordance with the U.S. federal securities laws and the applicable rules and regulations of the Securities and Exchange Commission and the PCAOB.
We conducted our audit in accordance with the standards of the PCAOB. Those standards require that we plan and perform the audit to obtain reasonable assurance about whether effective internal control over financial reporting was maintained in all material respects.
Our audit included obtaining an understanding of internal control over financial reporting, assessing the risk that a material weakness exists, testing and evaluating the design and operating effectiveness of internal control based on the assessed risk, and performing such other procedures as we considered necessary in the circumstances. We believe that our audit provides a reasonable basis for our opinion.
Definition and Limitations of Internal Control Over Financial Reporting
A company’s internal control over financial reporting is a process designed to provide reasonable assurance regarding the reliability of financial reporting and the preparation of financial statements for external purposes in accordance with generally accepted accounting principles. A company’s internal control over financial reporting includes those policies and procedures that (1) pertain to the maintenance of records that, in reasonable detail, accurately and fairly reflect the transactions and dispositions of the assets of the company; (2) provide reasonable assurance that transactions are recorded as necessary to permit preparation of financial statements in accordance with generally accepted accounting principles, and that receipts and expenditures of the company are being made only in accordance with authorizations of management and directors of the company; and (3) provide reasonable assurance regarding prevention or timely detection of unauthorized acquisition, use, or disposition of the company’s assets that could have a material effect on the financial statements.
Because of its inherent limitations, internal control over financial reporting may not prevent or detect misstatements. Also, projections of any evaluation of effectiveness to future periods are subject to the risk that controls may become inadequate because of changes in conditions, or that the degree of compliance with the policies or procedures may deteriorate.
/s/ Ernst & Young AB
|
Stockholm, Sweden |
|
|
February 20, 2025 |
|
|
56
Consolidated Statements of Income
|
|
|
|
Years ended December 31, |
|
|||||||||
(DOLLARS AND SHARES IN MILLIONS, EXCEPT PER SHARE DATA) |
|
|
|
2024 |
|
|
2023 |
|
|
2022 |
|
|||
Net sales |
|
Note 20 |
|
$ |
10,390 |
|
|
$ |
10,475 |
|
|
$ |
8,842 |
|
Cost of sales |
|
|
|
|
(8,463 |
) |
|
|
(8,654 |
) |
|
|
(7,446 |
) |
Gross profit |
|
|
|
|
1,927 |
|
|
|
1,822 |
|
|
|
1,396 |
|
Selling, general and administrative expenses |
|
|
|
|
(530 |
) |
|
|
(500 |
) |
|
|
(440 |
) |
Research, development and engineering expenses, net |
|
Note 2 |
|
|
(398 |
) |
|
|
(425 |
) |
|
|
(390 |
) |
Other income (expense), net |
|
Notes 12, 18 |
|
|
(19 |
) |
|
|
(207 |
) |
|
|
93 |
|
Operating income |
|
|
|
|
979 |
|
|
|
690 |
|
|
|
659 |
|
Income from equity method investment |
|
Note 8 |
|
|
7 |
|
|
|
5 |
|
|
|
3 |
|
Interest income |
|
|
|
|
13 |
|
|
|
13 |
|
|
|
6 |
|
Interest expense |
|
Note 14 |
|
|
(108 |
) |
|
|
(93 |
) |
|
|
(60 |
) |
Other non-operating items, net |
|
|
|
|
(16 |
) |
|
|
(3 |
) |
|
|
(5 |
) |
Income before income taxes |
|
|
|
|
875 |
|
|
|
612 |
|
|
|
603 |
|
Income tax expense |
|
Note 5 |
|
|
(227 |
) |
|
|
(123 |
) |
|
|
(178 |
) |
Net income |
|
|
|
|
648 |
|
|
|
489 |
|
|
|
425 |
|
Less: Net income attributable to non-controlling interest |
|
|
|
|
1 |
|
|
|
1 |
|
|
|
2 |
|
Net income attributable to controlling interest |
|
|
|
$ |
646 |
|
|
$ |
488 |
|
|
$ |
423 |
|
|
|
|
|
|
|
|
|
|
|
|
|
|||
Earnings per share - basic |
|
|
|
$ |
8.06 |
|
|
$ |
5.74 |
|
|
$ |
4.86 |
|
Earnings per share - diluted |
|
|
|
$ |
8.04 |
|
|
$ |
5.72 |
|
|
$ |
4.85 |
|
|
|
|
|
|
|
|
|
|
|
|
|
|||
Weighted average number of shares outstanding, net of |
|
|
|
|
80.2 |
|
|
|
85.0 |
|
|
|
87.1 |
|
Weighted average number of shares outstanding, assuming |
|
|
|
|
80.4 |
|
|
|
85.2 |
|
|
|
87.2 |
|
|
|
|
|
|
|
|
|
|
|
|
|
|||
Cash dividend per share - declared |
|
|
|
$ |
2.74 |
|
|
$ |
2.66 |
|
|
$ |
2.58 |
|
Cash dividend per share - paid |
|
|
|
$ |
2.74 |
|
|
$ |
2.66 |
|
|
$ |
2.58 |
|
See Notes to the Consolidated Financial Statements.
57
Consolidated Statements of Comprehensive Income
|
|
Years ended December 31, |
|
|||||||||
(DOLLARS IN MILLIONS) |
|
2024 |
|
|
2023 |
|
|
2022 |
|
|||
Net income |
|
$ |
648 |
|
|
$ |
489 |
|
|
$ |
425 |
|
Other comprehensive income (loss)before tax: |
|
|
|
|
|
|
|
|
|
|||
Change in cumulative translation adjustments |
|
|
(161 |
) |
|
|
20 |
|
|
|
(136 |
) |
Net change in unrealized components of defined benefit plans |
|
|
(4 |
) |
|
|
7 |
|
|
|
29 |
|
Other comprehensive income (loss), before tax |
|
|
(165 |
) |
|
|
27 |
|
|
|
(107 |
) |
Tax effect allocated to other comprehensive income (loss) |
|
|
1 |
|
|
|
(1 |
) |
|
|
(9 |
) |
Other comprehensive income (loss), net of tax |
|
|
(164 |
) |
|
|
25 |
|
|
|
(116 |
) |
Comprehensive income |
|
|
484 |
|
|
|
514 |
|
|
|
309 |
|
Less: Comprehensive income attributable to non-controlling interest |
|
|
1 |
|
|
|
1 |
|
|
|
0 |
|
Comprehensive income attributable to controlling interest |
|
$ |
483 |
|
|
$ |
513 |
|
|
$ |
309 |
|
See Notes to the Consolidated Financial Statements.
58
Consolidated Balance Sheets
|
|
|
|
At December 31, |
|
|||||
(DOLLARS AND SHARES IN MILLIONS) |
|
|
|
2024 |
|
|
2023 |
|
||
Assets |
|
|
|
|
|
|
|
|
||
Cash and cash equivalents |
|
|
|
$ |
330 |
|
|
$ |
498 |
|
Receivables, net |
|
Note 6 |
|
|
1,993 |
|
|
|
2,198 |
|
Inventories, net |
|
Note 7 |
|
|
921 |
|
|
|
1,012 |
|
Income tax receivable |
|
|
|
|
38 |
|
|
|
60 |
|
Prepaid expenses and accrued income |
|
|
|
|
167 |
|
|
|
173 |
|
Other current assets |
|
Note 13, 18 |
|
|
34 |
|
|
|
33 |
|
Total current assets |
|
|
|
|
3,483 |
|
|
|
3,974 |
|
Property, plant and equipment, net |
|
Note 9 |
|
|
2,239 |
|
|
|
2,192 |
|
Operating lease right-of-use assets |
|
Note 3 |
|
|
158 |
|
|
|
176 |
|
Goodwill and intangible assets, net |
|
Note 10 |
|
|
1,375 |
|
|
|
1,385 |
|
Other non-current assets |
|
Note 8, 18 |
|
|
548 |
|
|
|
606 |
|
Total non-current assets |
|
|
|
|
4,320 |
|
|
|
4,358 |
|
Total assets |
|
|
|
|
7,804 |
|
|
|
8,332 |
|
Liabilities and equity |
|
|
|
|
|
|
|
|
||
Short-term debt |
|
Note 14 |
|
|
387 |
|
|
|
538 |
|
Accounts payable |
|
|
|
|
1,799 |
|
|
|
1,978 |
|
Accrued expenses |
|
Notes 12, 13 |
|
|
1,056 |
|
|
|
1,135 |
|
Income tax payable |
|
|
|
|
120 |
|
|
|
122 |
|
Operating lease liabilities, current |
|
Note 3 |
|
|
41 |
|
|
|
39 |
|
Other current liabilities |
|
|
|
|
231 |
|
|
|
223 |
|
Total current liabilities |
|
|
|
|
3,633 |
|
|
|
4,035 |
|
Long-term debt |
|
Note 14 |
|
|
1,522 |
|
|
|
1,324 |
|
Pension liability |
|
Note 19 |
|
|
153 |
|
|
|
159 |
|
Operating lease liabilities, non-current |
|
Note 3 |
|
|
118 |
|
|
|
135 |
|
Other non-current liabilities |
|
|
|
|
92 |
|
|
|
109 |
|
Total non-current liabilities |
|
|
|
|
1,885 |
|
|
|
1,728 |
|
Commitments and contingencies |
|
Note 18 |
|
|
|
|
|
|
||
Common stock1) |
|
|
|
|
80 |
|
|
|
88 |
|
Additional paid-in capital |
|
|
|
|
910 |
|
|
|
1,044 |
|
Retained earnings |
|
|
|
|
2,105 |
|
|
|
2,289 |
|
Accumulated other comprehensive loss |
|
Note 15 |
|
|
(659 |
) |
|
|
(496 |
) |
Treasury stock (2.7 and 4.9 million shares, respectively) |
|
|
|
|
(160 |
) |
|
|
(368 |
) |
Total controlling interest’s equity |
|
|
|
|
2,276 |
|
|
|
2,557 |
|
Non-controlling interest |
|
|
|
|
10 |
|
|
|
13 |
|
Total equity |
|
|
|
|
2,285 |
|
|
|
2,570 |
|
Total liabilities and equity |
|
|
|
$ |
7,804 |
|
|
$ |
8,332 |
|
1) Number of shares: 350 million authorized for both years, 80.4 and 87.5 million issued, and 77.7 and 82.6 million outstanding, net of treasury shares, for 2024 and 2023, respectively.
See Notes to the Consolidated Financial Statements.
59
Consolidated Statements of Cash Flows
|
|
Years ended December 31, |
|
|||||||||
(DOLLARS IN MILLIONS) |
|
2024 |
|
|
2023 |
|
|
2022 |
|
|||
Operating activities |
|
|
|
|
|
|
|
|
|
|||
Net income |
|
$ |
648 |
|
|
$ |
489 |
|
|
$ |
425 |
|
Adjustments to reconcile net income to cash provided by operating activities: |
|
|
|
|
|
|
|
|
|
|||
Depreciation and amortization |
|
|
387 |
|
|
|
378 |
|
|
|
363 |
|
Gain on divestiture of property |
|
|
(4 |
) |
|
|
— |
|
|
|
(80 |
) |
Deferred income taxes |
|
|
(30 |
) |
|
|
(109 |
) |
|
|
(40 |
) |
Undistributed earnings from equity method investments, net of dividends |
|
|
(1 |
) |
|
|
(1 |
) |
|
|
(1 |
) |
Other, net |
|
|
7 |
|
|
|
(10 |
) |
|
|
(13 |
) |
Net change in operating assets and liabilities: |
|
|
|
|
|
|
|
|
|
|||
Receivables and other assets, gross |
|
|
114 |
|
|
|
(213 |
) |
|
|
(297 |
) |
Inventories, gross |
|
|
28 |
|
|
|
(22 |
) |
|
|
(243 |
) |
Accounts payable and accrued expenses |
|
|
(95 |
) |
|
|
426 |
|
|
|
596 |
|
Income taxes |
|
|
6 |
|
|
|
43 |
|
|
|
2 |
|
Net cash provided by operating activities |
|
|
1,059 |
|
|
|
982 |
|
|
|
713 |
|
Investing activities |
|
|
|
|
|
|
|
|
|
|||
Expenditures for property, plant and equipment |
|
|
(579 |
) |
|
|
(573 |
) |
|
|
(585 |
) |
Proceeds from sale of property, plant and equipment |
|
|
17 |
|
|
|
4 |
|
|
|
101 |
|
Net cash used in investing activities |
|
|
(563 |
) |
|
|
(569 |
) |
|
|
(485 |
) |
Financing activities |
|
|
|
|
|
|
|
|
|
|||
Net (decrease) increase in other short-term debt |
|
|
(126 |
) |
|
|
61 |
|
|
|
167 |
|
Proceeds from long-term debt |
|
|
526 |
|
|
|
559 |
|
|
|
— |
|
Repayment of long-term debt |
|
|
(306 |
) |
|
|
(533 |
) |
|
|
(357 |
) |
Dividends paid |
|
|
(219 |
) |
|
|
(225 |
) |
|
|
(224 |
) |
Stock repurchases |
|
|
(552 |
) |
|
|
(352 |
) |
|
|
(115 |
) |
Common stock options exercised |
|
|
1 |
|
|
|
1 |
|
|
|
0 |
|
Dividends paid to non-controlling interest |
|
|
(5 |
) |
|
|
(1 |
) |
|
|
(2 |
) |
Net cash used in financing activities |
|
|
(680 |
) |
|
|
(490 |
) |
|
|
(531 |
) |
Effect of exchange rate changes on cash and cash equivalents |
|
|
16 |
|
|
|
(20 |
) |
|
|
(73 |
) |
Decrease in cash and cash equivalents |
|
|
(168 |
) |
|
|
(96 |
) |
|
|
(375 |
) |
Cash and cash equivalents at beginning of year |
|
|
498 |
|
|
|
594 |
|
|
|
969 |
|
Cash and cash equivalents at end of year |
|
$ |
330 |
|
|
$ |
498 |
|
|
$ |
594 |
|
See Notes to the Consolidated Financial Statements.
60
Consolidated Statements of Total Equity
|
|
|
|
|
|
|
|
|
|
|
|
|
|
Accumulated |
|
|
|
|
|
|
|
|
|
|
|
|
|
|||||||||
|
|
|
|
|
|
|
|
Additional |
|
|
|
|
|
other com- |
|
|
|
|
|
Total parent |
|
|
Non- |
|
|
|
|
|||||||||
(DOLLARS AND SHARES |
|
Number of |
|
|
Common |
|
|
paid in |
|
|
Retained |
|
|
prehensive |
|
|
Treasury |
|
|
shareholders’ |
|
|
controlling |
|
|
Total |
|
|||||||||
IN MILLIONS) |
|
shares |
|
|
stock |
|
|
capital |
|
|
earnings |
|
|
(loss) income1) |
|
|
stock |
|
|
equity |
|
|
interest |
|
|
equity |
|
|||||||||
Balance at December 31, 2021 |
|
|
103 |
|
|
$ |
103 |
|
|
$ |
1,329 |
|
|
$ |
2,742 |
|
|
$ |
(408 |
) |
|
$ |
(1,133 |
) |
|
$ |
2,633 |
|
|
$ |
15 |
|
|
$ |
2,648 |
|
Comprehensive Income: |
|
|
|
|
|
|
|
|
|
|
|
|
|
|
|
|
|
|
|
|
|
|
|
|
|
|
|
|||||||||
Net income |
|
|
|
|
|
|
|
|
|
|
|
423 |
|
|
|
|
|
|
|
|
|
423 |
|
|
|
2 |
|
|
|
425 |
|
|||||
Foreign currency translation |
|
|
|
|
|
|
|
|
|
|
|
|
|
|
(134 |
) |
|
|
|
|
|
(134 |
) |
|
|
(1 |
) |
|
|
(136 |
) |
|||||
Pension liability |
|
|
|
|
|
|
|
|
|
|
|
|
|
|
20 |
|
|
|
|
|
|
20 |
|
|
|
|
|
|
20 |
|
||||||
Total Comprehensive Income |
|
|
|
|
|
|
|
|
|
|
|
|
|
|
|
|
|
|
|
|
309 |
|
|
|
0 |
|
|
|
309 |
|
||||||
Retired and repurchased shares |
|
|
(11 |
) |
|
|
(11 |
) |
|
|
(216 |
) |
|
|
(631 |
) |
|
|
|
|
|
744 |
|
|
|
(115 |
) |
|
|
|
|
|
(115 |
) |
||
Stock-based compensation |
|
|
|
|
|
|
|
|
|
|
|
|
|
|
|
|
|
10 |
|
|
|
10 |
|
|
|
|
|
|
10 |
|
||||||
Cash dividends declared |
|
|
|
|
|
|
|
|
|
|
|
(225 |
) |
|
|
|
|
|
|
|
|
(225 |
) |
|
|
|
|
|
(225 |
) |
||||||
Dividends paid to non-controlling |
|
|
|
|
|
|
|
|
|
|
|
|
|
|
|
|
|
|
|
|
|
|
|
(2 |
) |
|
|
(2 |
) |
|||||||
Balance at December 31, 2022 |
|
|
91 |
|
|
$ |
91 |
|
|
$ |
1,113 |
|
|
$ |
2,310 |
|
|
$ |
(522 |
) |
|
$ |
(379 |
) |
|
$ |
2,613 |
|
|
$ |
13 |
|
|
$ |
2,626 |
|
Comprehensive Income: |
|
|
|
|
|
|
|
|
|
|
|
|
|
|
|
|
|
|
|
|
|
|
|
|
|
|
|
|||||||||
Net income |
|
|
|
|
|
|
|
|
|
|
|
488 |
|
|
|
|
|
|
|
|
|
488 |
|
|
|
1 |
|
|
|
489 |
|
|||||
Foreign currency translation |
|
|
|
|
|
|
|
|
|
|
|
|
|
|
20 |
|
|
|
|
|
|
20 |
|
|
|
(0 |
) |
|
|
20 |
|
|||||
Pension liability |
|
|
|
|
|
|
|
|
|
|
|
|
|
|
6 |
|
|
|
|
|
|
6 |
|
|
|
|
|
|
6 |
|
||||||
Total Comprehensive Income |
|
|
|
|
|
|
|
|
|
|
|
|
|
|
|
|
|
|
|
|
513 |
|
|
|
1 |
|
|
|
514 |
|
||||||
Retired and repurchased shares |
|
|
(4 |
) |
|
|
(4 |
) |
|
|
(70 |
) |
|
|
(282 |
) |
|
|
|
|
|
|
|
|
(356 |
) |
|
|
|
|
|
(356 |
) |
|||
Stock-based compensation |
|
|
|
|
|
|
|
|
|
|
|
|
|
|
|
|
|
11 |
|
|
|
11 |
|
|
|
|
|
|
11 |
|
||||||
Cash dividends declared |
|
|
|
|
|
|
|
|
|
|
|
(225 |
) |
|
|
|
|
|
|
|
|
(225 |
) |
|
|
|
|
|
(225 |
) |
||||||
Dividends paid to non-controlling |
|
|
|
|
|
|
|
|
|
|
|
|
|
|
|
|
|
|
|
|
|
|
|
(1 |
) |
|
|
(1 |
) |
|||||||
Balance at December 31, 2023 |
|
|
88 |
|
|
$ |
88 |
|
|
$ |
1,044 |
|
|
$ |
2,289 |
|
|
$ |
(496 |
) |
|
$ |
(368 |
) |
|
$ |
2,557 |
|
|
$ |
13 |
|
|
$ |
2,570 |
|
Comprehensive Income: |
|
|
|
|
|
|
|
|
|
|
|
|
|
|
|
|
|
|
|
|
|
|
|
|
|
|
|
|||||||||
Net income |
|
|
|
|
|
|
|
|
|
|
|
646 |
|
|
|
|
|
|
|
|
|
646 |
|
|
|
1 |
|
|
|
648 |
|
|||||
Foreign currency translation |
|
|
|
|
|
|
|
|
|
|
|
|
|
|
(161 |
) |
|
|
|
|
|
(161 |
) |
|
|
(0 |
) |
|
|
(161 |
) |
|||||
Pension liability |
|
|
|
|
|
|
|
|
|
|
|
|
|
|
(3 |
) |
|
|
|
|
|
(3 |
) |
|
|
|
|
|
(3 |
) |
||||||
Total Comprehensive Income |
|
|
|
|
|
|
|
|
|
|
|
|
|
|
|
|
|
|
|
|
483 |
|
|
|
1 |
|
|
|
484 |
|
||||||
Retired and repurchased shares |
|
|
(7 |
) |
|
|
(7 |
) |
|
|
(134 |
) |
|
|
(612 |
) |
|
|
|
|
|
194 |
|
|
|
(558 |
) |
|
|
|
|
|
(558 |
) |
||
Stock-based compensation |
|
|
|
|
|
|
|
|
|
|
|
|
|
|
|
|
|
13 |
|
|
|
13 |
|
|
|
|
|
|
13 |
|
||||||
Cash dividends declared |
|
|
|
|
|
|
|
|
|
|
|
(219 |
) |
|
|
|
|
|
|
|
|
(219 |
) |
|
|
|
|
|
(219 |
) |
||||||
Dividends paid to non-controlling |
|
|
|
|
|
|
|
|
|
|
|
|
|
|
|
|
|
|
|
|
|
|
|
(5 |
) |
|
|
(5 |
) |
|||||||
Balance at December 31, 2024 |
|
|
80 |
|
|
$ |
80 |
|
|
$ |
910 |
|
|
$ |
2,105 |
|
|
$ |
(659 |
) |
|
$ |
(160 |
) |
|
$ |
2,276 |
|
|
$ |
10 |
|
|
$ |
2,285 |
|
1) See Note 15 for further details – includes tax effects where applicable.
See Notes to the Consolidated Financial Statements.
61
Notes to the Consolidated Financial Statements
(DOLLARS IN MILLIONS, EXCEPT PER SHARE DATA)
1. Basis of Presentation
NATURE OF OPERATIONS
Through its operating subsidiaries, the Company is a leading developer, manufacturer and supplier of passive safety systems to the automotive industry with a broad range of product offerings.
Passive safety systems are primarily meant to improve safety for occupants in a vehicle. Passive safety systems include modules and components for frontal-impact airbag protection systems, side-impact airbag protection systems, seatbelts, steering wheels and inflator technologies.
The Company also develops and manufactures mobility safety solutions such as pedestrian protection, battery cut-off switches, connected safety services, and safety solutions for riders of powered two wheelers.
PRINCIPLES OF CONSOLIDATION
The consolidated financial statements have been prepared in accordance with United States (U.S.) Generally Accepted Accounting Principles (GAAP) and include Autoliv, Inc. and all companies over which Autoliv, Inc. directly or indirectly exercises control, which as a general rule means that the Company owns more than 50% of the voting rights.
Consolidation is also required when the Company has both the power to direct the activities of a variable interest entity (VIE) and the obligation to absorb losses or the right to receive benefits from the VIE that could be significant to the VIE.
All intercompany accounts and transactions within the Company have been eliminated from the consolidated financial statements.
Investments in affiliated companies in which the Company exercises significant influence over the operations and financial policies, but does not control, are reported using the equity method of accounting. Generally, the Company owns between 20-50% of such investments.
SEGMENT REPORTING
In accordance with ASC 280, Segment Reporting, the operating segments are determined based on the information provided to the Chief Operating Decision Maker (CODM) on a regular basis and used for the purpose of assessing performance and allocating resources within the Company. The CEO is deemed to be the CODM of Autoliv since he is the person who makes all major decisions on how to allocate the resources and assess the performance of the Company for both strategic and operational initiatives.
ASC 280 indicates that a component is an operating segment if it meets the following criteria:
The Company as a whole has met the definition of an operating segment as it engages in business activities from which it may earn revenues and incur expenses, the consolidated operating results are regularly reviewed by the CEO/CODM to allocate resources and assess performance, and discrete financial information is available. Additionally, as Autoliv supplies customers on a global basis it also manages the business on a global basis. Therefore, based on the above analysis, the Company has concluded that the Company is the single operating and reportable segment under ASC 280, Segment Reporting. For more information on the Company's segment, see Note 20.
RECLASSIFICATIONS AND ROUNDINGS
Certain prior-year amounts have been reclassified to conform to current year presentation.
Certain amounts in the consolidated financial statements and associated notes may not reconcile due to rounding. All percentages have been calculated using unrounded amounts.
62
2. Summary of Significant Accounting Policies
USE OF ESTIMATES
The preparation of consolidated financial statements in conformity with U.S. GAAP requires management to make estimates and assumptions that affect the reported amounts of assets and liabilities, disclosures of contingent assets and liabilities at the date of the consolidated financial statements, and the reported amounts of net sales and expenses during the reporting period. The accounting estimates that require management’s most significant judgments include the estimation of variable consideration for the Company's contracts with customers, valuation of stock-based compensation payments, assessment of recoverability of goodwill and intangible assets, estimation of pension benefit obligations based on actuarial assumptions, estimation of accruals for warranty and recalls, restructuring charges, uncertain tax positions, valuation allowances and legal proceedings. Actual results could differ from those estimates.
REVENUE RECOGNITION
In accordance with ASC 606, Revenue from Contracts with Customers, revenue is measured based on consideration specified in a contract with a customer, adjusted for any variable consideration (i.e., price concessions) and estimated at contract inception. The estimated amount of variable consideration that will be received or paid by the Company is based on historical experience and trends, management's understanding of the status of negotiations with customers and anticipated future pricing strategies. The Company recognizes revenue when it satisfies a performance obligation by transferring control over a product to a customer. Revenue is recorded to the agreed-upon price at the time of shipment, and sales incentives, allowances and certain payments to customers are recognized as a reduction to revenue at the time of the commitment to provide such incentives or make these payments are made by the Company.
In addition, from time to time, the Company may make payments to or receive additional consideration from customers in connection with ongoing and future business. These payments to or cash receipts from customers are generally recognized to revenue at the time of the commitment unless the payments to customers can be clearly linked to the future business. If the payments to customers are capitalized, the amounts are amortized to revenue as the related goods are transferred.
Taxes assessed by a governmental authority that are both imposed on and concurrent with a specific revenue-producing transaction and collected by the Company from a customer, are excluded from revenue.
Shipping and handling costs associated with outbound freight before control of a product has transferred to a customer are accounted for as a fulfillment cost and are included in cost of sales.
Nature of goods and services
The Company generates revenue from the sale of parts, which includes airbag and seatbelt products and components, to original equipment manufacturers (“OEMs”).
The Company accounts for individual products separately if they are distinct (i.e., if a product is separately identifiable from other items and if a customer can benefit from it on its own or with other resources that are readily available to the customer). The consideration for each of the products, including any price concessions, is based on their stand-alone selling prices. The stand-alone selling prices are determined based on the cost-plus margin approach.
The Company recognizes revenue for parts primarily at a point in time. For parts with revenue recognized at a point in time, the Company recognizes revenue upon shipment to the customers and transfer of title and risk of loss under standard commercial terms (typically FOB shipping point).
There are certain contracts where the criteria to recognize revenue over time have been met (e.g., there is no alternative use to the Company and the Company has an enforceable right to payment). In such cases, at period end, the Company recognizes revenue and a related asset and associated cost of goods sold and reduction in inventory. However, the financial impact of these contracts is immaterial considering the very short production cycles and limited inventory days on hand. The contract asset balances with customers, included in other current assets, amounted to $20 million as of December 31, 2024 and 2023.
The amount of revenue recognized is based on the purchase order price and adjusted for variable consideration (i.e., price concessions). Customers typically pay for the parts based on customary business practices.
63
RESEARCH, DEVELOPMENT AND ENGINEERING, NET (R,D & E)
Research and development and most engineering expenses are expensed as incurred. These expenses are reported net of expense reimbursements from contracts to perform engineering design and product development fulfillment activities related to the production of parts. For the years 2024, 2023 and 2022 total reimbursements from customers were $213 million, $192 million and $204 million, respectively.
Certain engineering expenses related to long-term supply arrangements are capitalized when defined criteria in accordance with ASC 340-10, such as the existence of a contractual guarantee for reimbursement, are met.
Tooling is generally agreed upon as a separate contract or a separate component of an engineering contract, as a pre-production project. Capitalization of tooling costs is made only when the specific criteria for capitalization of customer funded tooling in accordance with ASC 340-10 is met. As of December 31, 2024 and 2023 the Company had capitalized costs for customer owned tooling as prepaid expenses amounting to $74 million and $79 million, respectively. Tools owned by the Company that fulfills the criteria for capitalization is reported as Property, Plant & Equipment (P,P&E). Depreciation on the Company’s own tooling is recognized in the Consolidated Statements of Income as Cost of sales.
STOCK-BASED COMPENSATION
The compensation costs for all of the Company’s stock-based compensation awards are determined based on the fair value method as defined in ASC 718, Compensation –Stock Compensation. The Company records the compensation expense for awards under the Stock Incentive Plan, including Restricted Stock Units (RSUs), Performance Shares (PSUs) and stock options (SOs), over the respective vesting period. For further details, see Note 17.
INCOME TAXES
Current tax liabilities and assets are recognized for the estimated taxes payable or refundable on the tax returns for the current year. In certain circumstances, payments or refunds may extend beyond twelve months, in such cases amounts would be classified as non-current taxes payable or receivable. Deferred tax liabilities or assets are recognized for the estimated future tax effects attributable to temporary differences and carryforwards that result from events that have been recognized in either the financial statements or the tax returns, but not both. The measurement of current and deferred tax liabilities and assets is based on provisions of enacted tax laws. Deferred tax assets are reduced by the amount of any tax benefits that are not expected to be realized. A valuation allowance is recognized if, based on the weight of all available evidence, it is more likely than not that some portion, or all, of the deferred tax asset will not be realized. Evaluation of the realizability of deferred tax assets is subject to significant judgment requiring careful consideration of all facts and circumstances. The Company classifies deferred tax assets and liabilities as non-current in the Consolidated Balance Sheet. Tax assets and liabilities are not offset unless attributable to the same tax jurisdiction and netting is possible according to law and, as it relates to payables and receivables, expected to take place in the same period.
Tax benefits associated with tax positions taken in the Company’s income tax returns are initially recognized when it is more likely than not that those tax positions will be sustained upon examination by the relevant taxing authorities. The Company’s evaluation of its tax benefits is based on the probability of the tax position being upheld if challenged by the taxing authorities (including through negotiation, appeals, settlement and litigation). Whenever a tax position does not meet the initial recognition criteria, the tax benefit is subsequently recognized if there is a substantive change in the facts and circumstances that cause a change in judgment concerning the sustainability of the tax position upon examination by the relevant taxing authorities. In cases where tax benefits meet the initial recognition criterion, the Company continues, in subsequent periods, to assess its ability to sustain those positions. A previously recognized tax benefit is derecognized when it is no longer more likely than not that the tax position would be sustained upon examination. Liabilities for unrecognized tax benefits are classified as non-current unless the payment of the liability is expected to be made within the next 12 months.
EARNINGS PER SHARE
The Company calculates basic earnings per share (EPS) by dividing net income attributable to controlling interest by the weighted-average number of shares of common stock outstanding for the period (net of treasury shares). The Company’s unvested RSUs and PSUs, of which some include the right to receive non-forfeitable dividend equivalents, are considered participating securities. The diluted EPS reflects the potential dilution that could occur if common stock was issued for awards under the Stock Incentive Plan and is calculated using the treasury stock method. The treasury stock method assumes that the Company uses the proceeds from the exercise of stock option awards to repurchase ordinary shares at the average market price during the period. For unvested restricted stock, assumed proceeds under the treasury stock method will include unamortized compensation cost and windfall tax benefits or shortfalls. For further details, see Notes 17 and 21.
CASH EQUIVALENTS
The Company considers all highly liquid investment instruments purchased with a maturity of three months or less to be cash equivalents.
64
RECEIVABLES AND ALLOWANCE FOR EXPECTED CREDIT LOSSES
Receivables are recorded at the invoice amount, which represents the fair value of the consideration received or receivable.
In addition to individually assess overdue customer balances for expected credit losses, the Company also calculates an allowance that reflects the expected credit losses on receivables considering both historical experience as well as forward looking assumptions. The method calculates the expected credit loss for a group of customers by using the customer groups’ average short-term default rates based on officially published credit ratings and the Company’s historical experience. These default rates are considered the Company’s best estimate of the customer’s ability to pay. The Company regularly reassess the customer groups and the applied customer group’s default rates by using its best judgment when considering changes in customer’s credit ratings, customer’s historical payments and loss experience, current market and economic conditions and the Company’s expectations of future market and economic conditions.
There can be no assurance that the amount ultimately realized for receivables will not be materially different than that assumed in the calculation of the allowance for expected credit losses.
INVENTORIES
The cost of inventories is computed according to the first-in first-out method (FIFO). Cost includes the cost of materials, direct labor and the applicable share of manufacturing overhead. Inventories are evaluated based on individual or, in some cases, groups of inventory items. Reserves are established to reduce the value of inventories to the lower of cost or net realizable value. Net realizable value is the estimated selling prices in the ordinary course of business, less reasonably predictable costs of completion, disposal and transportation. Excess inventories are quantities of items that exceed anticipated sales or usage for a reasonable period. The Company calculates provisions for excess inventories based on the number of months of inventories on hand compared to anticipated sales or usage. Management uses its judgment to forecast sales or usage and to determine what constitutes a reasonable period. There can be no assurance that the amount ultimately realized for inventories will not be materially different than that assumed in the calculation of the reserves.
PROPERTY, PLANT AND EQUIPMENT
Property, Plant and Equipment is recorded at historical cost. Construction in progress generally involves short-term projects for which capitalized interest is not significant. The Company provides for depreciation of property, plant and equipment computed under the straight-line method over the assets’ estimated useful lives, or in the case of leasehold improvements over the shorter of the useful life or the lease term. Amortization on finance leases is recognized with depreciation expense in the Consolidated Statements of Income over the shorter of the assets’ expected life or the lease contract term. Repairs and maintenance are expensed as incurred.
LEASES
In accordance with ASC 842, Leases, the Company recognizes contracts that is, or contains, a lease when the contract conveys the right to control the use of a physically identified asset for a period of time in exchange for consideration in the balance sheet as a right-of-use asset and lease liability. The Company recognizes a right-of-use asset and a lease liability at lease commencement. The lease liability for both finance and operating leases is measured at the present value of the remaining lease payments, discounted at the Company's incremental borrowing rate (if the implicit interest rate in the lease contract is not readily determinable). The right-of-use asset (ROU) for finance and operating leases is initially measured at the sum of the initial lease liability plus initial direct costs plus prepaid lease payments minus lease incentives received. Lease payments include undiscounted fixed payments plus optional payments that are reasonably certain to be owed. Lease payments do not include variable lease payments other than those that depend on an index or rate. Variable lease payments that depend on an index or a rate are included in the calculation of lease payments and in the measurement of the lease liability.
If the rate implicit in the lease is not readily determinable, the Company uses its incremental borrowing rate as the discount rate. The Company uses its best judgement when determining the incremental borrowing rate, which is the rate of interest that the Company would have to pay to borrow on a collateralized basis over a similar term to the lease payments in a similar currency.
The Company has elected the practical expedient of not separating lease components from non-lease components for all its classes of underlying assets. The Company has also elected to recognize the lease payments for short-term leases in its consolidated statement of income on a straight-line basis over the lease term and recognize the variable lease payments in the period in which the obligation for those payments is incurred.
Finance lease right-of-use assets are presented together with other property, plant and equipment assets and finance lease liabilities are presented together with other current and non-current liabilities in the Consolidated Balance Sheets. Finance leases were not material as of December 31, 2024.
For further details on the Company’s leases, see Note 3.
65
LONG-LIVED ASSET IMPAIRMENT
The Company evaluates the carrying value and useful lives of long-lived assets, other than goodwill and intangible assets, when indications of impairment are evident or it is likely that the useful lives have decreased, in which case the Company depreciates the assets over the remaining useful lives. Impairment testing is primarily done by using the cash flow method based on undiscounted future cash flows. Estimated undiscounted cash flows for a long-lived asset being evaluated for recoverability are compared with the respective carrying amount of that asset. If the estimated undiscounted cash flows exceed the carrying amount of the assets, the carrying amounts of the long-lived asset are considered recoverable and an impairment cannot be recorded. However, if the carrying amount of a group of assets exceeds the undiscounted cash flows, an entity must then measure the long-lived assets’ fair value to determine whether an impairment loss should be recognized, generally using a discounted cash flow model. Generally, the lowest level of cash flows for impairment assessment is customer platform level.
GOODWILL AND INTANGIBLE ASSETS
Goodwill represents the excess of the fair value of consideration transferred over the fair value of net assets of businesses acquired. Goodwill is not amortized but subject to at least an annual review for impairment. Other definite-lived intangible assets, principally related to acquired technology, are amortized over their useful lives which range from 3 to 25 years.
The Company performs its annual impairment testing in the fourth quarter of each year. Impairment testing is required more often than annually if an event or circumstance indicates that an impairment, or decline in value, may have occurred. The Company uses either a qualitative assessment or a quantitative calculation for its impairment testing. The qualitative assessment permits the Company to assess whether it is more than likely than not (i.e., a likelihood of greater than 50%) that goodwill is impaired. If the Company concludes based on the qualitative assessment that it is not more likely than not that the fair value of goodwill is less than its carrying amount, it would not have to quantitatively determine the asset’s fair value. The Company also consider external factors that could affect the significant inputs used to determine fair value.
In 2024, the Company performed a quantitative impairment test by calculating the fair value of its goodwill. The estimated fair market value of goodwill is determined by the discounted cash flow method.
There were no impairments of goodwill from 2022 through 2024.
WARRANTIES AND RECALLS
The Company records liabilities for product recalls when probable claims are identified and when it is possible to reasonably estimate costs. Recall costs are costs incurred when the customer decides to formally recall a product due to a known or suspected safety concern. Product recall costs are estimated based on the expected cost of replacing the product and the customer´s cost of carrying out the recall, which is affected by the number of vehicles subject to recall and the cost of labor and materials to remove and replace the defective product. Insurance receivables, related to recall issues covered by the insurance, are included within other current and non-current assets in the Consolidated Balance Sheets. Provisions for warranty claims are estimated based on prior experience, likely changes in performance of newer products and the mix and volume of products sold. The provisions are recorded on an accrual basis.
RESTRUCTURING PROVISIONS
The Company defines restructuring expense to include costs directly associated with rightsizing, exit or disposal activities. Estimates of restructuring charges are based on information available at the time such charges are recorded. In general, management anticipates that restructuring activities will be completed within a timeframe such that significant changes to the exit plan are not likely. Due to inherent uncertainty involved in estimating restructuring expenses, actual amounts paid for such activities may differ from amounts initially estimated.
PENSION OBLIGATIONS
The Company provides for both defined contribution plans and defined benefit plans. A defined contribution plan generally specifies the periodic amount that the employer must contribute to the plan and how that amount will be allocated to the eligible employees who perform services during the same period. A defined benefit pension plan is one that contains pension benefit formulas, which generally determine the amount of pension benefits that each employee will receive for services performed during a specified period of employment.
The amount recognized as a defined benefit liability is the net total of projected benefit obligation (PBO) minus the fair value of plan assets (if any) (see Note 19).
66
CONTINGENT LIABILITIES
Various claims, lawsuits and proceedings are pending or threatened against the Company or its subsidiaries, covering a range of matters that arise in the ordinary course of its business activities with respect to commercial, product liability or other matters (see Note 13). The Company diligently defends itself in such matters and, in addition, carries insurance coverage to the extent reasonably available against insurable risks. The Company records liabilities for claims, lawsuits and proceedings, when they are probable and it is possible to reasonably estimate the cost of such liabilities. Legal costs expected to be incurred in connection with a loss contingency are expensed as such costs are incurred.
The Company believes, based on currently available information, that the resolution of outstanding matters, other than any antitrust related matters described in Note 18 after taking into account recorded liabilities and available insurance coverage, should not have a material effect on the Company’s financial position or results of operations. However, due to the inherent uncertainty associated with such matters, there can be no assurance that the final outcomes of these matters will not be materially different than currently estimated.
TRANSLATION OF NON-U.S. SUBSIDIARIES
The assets and liabilities of subsidiaries with functional currency other than U.S. dollars are translated into U.S. dollars based on the current exchange rate prevailing at each balance sheet date and any resulting translation adjustments are included in accumulated other comprehensive loss. The assets and liabilities of foreign subsidiaries whose local currency is not their functional currency are remeasured from their local currency to their functional currency and then translated to U.S. dollars. Revenues and expenses are translated into U.S. dollars using the average exchange rates prevailing for each period presented.
RECEIVABLES AND LIABILITIES IN NON-FUNCTIONAL CURRENCIES
Receivables and liabilities not denominated in functional currencies are converted at year-end exchange rates. Net transaction losses, reflected in the Consolidated Statements of Income, amounted to $1 million in 2024, $(30) million in 2023 and $(25) million in 2022, and are recorded in operating income if they relate to operational receivables and liabilities or are recorded in other non-operating items, net if they relate to financial receivables and liabilities.
NEW ACCOUNTING STANDARDS
Changes to U.S. GAAP are established by the Financial Accounting Standards Board (“FASB”) in the form of accounting standards updates (“ASUs”) to the FASB’s Accounting Standards Codification (ASC). The Company considers the applicability and impact of all ASUs. ASUs not listed below were assessed and determined to be either not applicable or are expected to have an immaterial impact on the Company’s consolidated financial statements.
Adoption of New Accounting Standards
In November 2023, the FASB issued ASU 2023-07, Segment Reporting (Topic 280), Improvements to Reportable Segment Disclosures, which improve reportable segment disclosure requirements, primarily through enhanced disclosures about significant segment expenses. The amendments in this update require that a public entity make additional disclosures related to segments if it has them. A public entity that has a single reportable segment would be required to provide all the disclosures required by the amendments in this update and all existing segment disclosures in Topic 280. The amendments in this update is effective for fiscal years beginning after December 15, 2023, and interim periods within fiscal years beginning after December 15, 2024. Early adoption is permitted. The amendments in this update should be applied retrospectively to all prior periods presented in the financial statements. The Company adopted ASU 2023-07 in the fourth quarter of 2024.The adoption of this guidance resulted in incremental disclosures in the Company’s financial statements. See Note 20. Segment Information.
Accounting Standards Issued But Not Yet Adopted
In December 2023, the FASB issued ASU 2023-09, Income Taxes (Topic 740), Improvements to Income Tax Disclosures, to enhance the transparency and decision usefulness of income tax disclosures as well as improve the effectiveness of income tax disclosures. The amendments in this update require that public business entities on an annual basis (1) disclose specific categories in the rate reconciliation and (2) provide additional information for reconciling items that meet a quantitative threshold. The amendments in this update also require that all entities disclose on an annual basis certain detailed information about income taxes paid. The amendments in this update related to the rate reconciliation and income taxes paid disclosures improve the transparency of income tax disclosures by requiring (1) consistent categories and greater disaggregation of information in the rate reconciliation and (2) income taxes paid disaggregated by jurisdiction. The amendments allow investors to better assess, in their capital allocation decisions, how an entity’s worldwide operations and related tax risks and tax planning and operational opportunities affect its income tax rate and prospects for future cash flows. The amendments in this update are effective for annual periods beginning after December 15, 2024. Early adoption is permitted. The amendments in this update should be applied on a prospective basis. Retrospective application is permitted. The Company has concluded that ASU 2023-09 will have a material impact on the income tax disclosures to its financial statements. The Company will adopt the amendments in this update prospectively upon the effective date.
In March 2024, the SEC adopted final rules requiring registrants to disclose climate-related information in their annual reports. The final rules require information about a registrant’s climate-related risks that have materially impacted, or are reasonably likely to have a material impact on, its business strategy, results of operations, or financial condition. In addition, under the final rules, certain disclosures related to severe weather events and other natural conditions will be required in a registrant’s audited financial statements.
67
The new requirements are required on a prospective basis and a phased-in compliance period becomes effective for the Company beginning with its Annual Report on Form 10-K for the year ending December 31, 2025. However, pending the resolution of legal challenges that were subsequently filed against these rules, in April 2024, the SEC stayed the effectiveness of the rules. Therefore, the disclosure requirements of these rules and the timing of their effectiveness is uncertain. The Company is currently assessing the anticipated impact that the rules will have on its financial statements if and when effective and will implement disclosures upon any such effective dates.
In November 2024, the FASB issued ASU 2024-03, Income Statement - Reporting Comprehensive Income - Expense Disaggregation Disclosures (Subtopic 220-40), Disaggregation of Income Statement Expenses, to improve financial reporting by requiring additional information about specific expense categories in the notes to the financial statements at interim and annual reporting periods. The amendments in ASU 2024-03 do not change or remove current expense disclosure requirements. The amendments require that at each interim and annual reporting period an entity should disclose the amounts of (a) purchase of inventory, (b) employee compensation, (c) depreciation and (d) intangible asset amortization included in each relevant expense caption. The amendments in ASU 2024-03 are effective for annual reporting periods beginning after December 1, 2026, and interim reporting periods beginning after December 15, 2027. Early adoption is permitted. The amendments in ASU 2024-03 should be applied either (1) prospectively to financial statements issued for reporting periods after the effective date of ASU 2024-03 or (2) retrospectively to any or all periods presented in the financial statements. The Company is currently assessing the impact that ASU 2024-03 will have on its financial statements and will adopt the amendments in this update prospectively upon the effective date.
3. Leases
The Company has operating leases for offices, manufacturing and research buildings, machinery, cars, data processing and other equipment. The Company’s leases have remaining lease terms of 1-43 years, some of which include options to extend the leases for up to 25 years, and some of which include options to terminate the leases within one year.
As of December 31, 2024, the Company has no additional material operating leases that have not yet commenced.
The following tables provide information about the Company’s operating leases. The Company has not identified any material finance leases as of December 31, 2024; therefore, the finance lease components have not been disclosed in the tables below.
Lease cost |
|
|
|
|
|
|
|
|
|
|||
|
|
|
|
|
|
|
||||||
(Dollars in millions) |
|
2024 |
|
|
2023 |
|
|
2022 |
|
|||
Operating lease cost |
|
$ |
47 |
|
|
$ |
54 |
|
|
$ |
50 |
|
Short-term lease cost |
|
|
6 |
|
|
|
8 |
|
|
|
9 |
|
Variable lease cost |
|
|
6 |
|
|
|
5 |
|
|
|
4 |
|
Sublease income |
|
|
(1 |
) |
|
|
(1 |
) |
|
|
(1 |
) |
Total lease cost |
|
$ |
58 |
|
|
$ |
66 |
|
|
$ |
62 |
|
Other information |
|
|
|
|
|
|
||
|
|
Year ended or as of |
|
|||||
(Dollars in millions) |
|
2024 |
|
|
2023 |
|
||
Cash paid for amounts included in the measurement of operating lease liabilities |
|
$ |
45 |
|
|
$ |
47 |
|
Right-of-use assets obtained in exchange for new operating lease liabilities |
|
|
27 |
|
|
|
70 |
|
Weighted-average remaining lease term - operating leases |
|
8.9 years |
|
|
9.4 years |
|
||
Weighted-average discount rate - operating leases |
|
|
3.3 |
% |
|
|
3.2 |
% |
Maturities of operating lease liabilities (undiscounted cash flows) are as follows: |
|
|
|
|
|
|
|
|
|
(Dollars in millions) |
|
Maturities |
|
|
2025 |
|
$ |
38 |
|
2026 |
|
|
27 |
|
2027 |
|
|
21 |
|
2028 |
|
|
15 |
|
2029 |
|
|
12 |
|
Thereafter |
|
|
72 |
|
Total operating lease payments |
|
|
184 |
|
Less imputed interest |
|
|
(25 |
) |
Total operating lease liabilities |
|
$ |
159 |
|
68
4. Fair Value Measurements
ASSETS AND LIABILITIES MEASURED AT FAIR VALUE ON A RECURRING BASIS
The carrying value of cash and cash equivalents, accounts receivable, accounts payable, other current liabilities and short-term debt approximate their fair value because of the short-term maturity of these instruments.
The Company uses derivative financial instruments, “derivatives”, as part of its debt management to mitigate the market risk that occurs from its exposure to changes in interest and foreign exchange rates. The Company does not enter into derivatives for trading or other speculative purposes. The Company’s use of derivatives is in accordance with the strategies contained in the Company’s overall financial policy. All derivatives are recognized in the consolidated financial statements at fair value. Certain derivatives are from time to time designated either as fair value hedges or cash flow hedges in line with the hedge accounting criteria. For certain other derivatives hedge accounting is not applied either because non-hedge accounting treatment creates the same accounting result or the hedge does not meet the hedge accounting requirements, although entered into applying the same rationale concerning mitigating market risk that occurs from changes in interest and foreign exchange rates.
The degree of judgment utilized in measuring the fair value of the instruments generally correlates to the level of pricing observability. Pricing observability is impacted by several factors, including the type of asset or liability, whether the asset or liability has an established market and the characteristics specific to the transaction. Instruments with readily active quoted prices or for which fair value can be measured from actively quoted prices generally will have a higher degree of pricing observability and a lesser degree of judgment utilized in measuring fair value. Conversely, assets rarely traded or not quoted will generally have less, or no, pricing observability and a higher degree of judgment utilized in measuring fair value.
Under U.S. GAAP, there is a disclosure framework hierarchy associated with the level of pricing observability utilized in measuring assets and liabilities at fair value. The three broad levels defined by the hierarchy are as follows:
Level 1 - Quoted prices are available in active markets for identical assets or liabilities as of the reported date.
Level 2 - Pricing inputs are other than quoted prices in active markets, which are either directly or indirectly observable as of the reported date. The nature of these assets and liabilities includes items for which quoted prices are available but traded less frequently, and items that are fair valued using other financial instruments, the parameters of which can be directly observed.
Level 3 - Assets and liabilities that have little to no pricing observability as of the reported date. These items do not have two-way markets and are measured using management’s best estimate of fair value, where the inputs into the determination of fair value require significant management judgment or estimation.
The Company’s derivatives are all classified as Level 2 of the fair value hierarchy.
The tables below present information about the Company’s financial assets and liabilities measured at fair value on a recurring basis as of December 31, 2024 and December 31, 2023. The carrying value is the same as the fair value as these instruments are recognized in the consolidated financial statements at fair value. Although the Company is party to close-out netting agreements (ISDA agreements) with all derivative counterparties, the fair values in the tables below and in the Consolidated Balance Sheets at December 31, 2024 and December 31, 2023 have been presented on a gross basis. According to the close-out netting agreements, transaction amounts payable to a counterparty on the same date and in the same currency can be netted. The amounts subject to netting agreements that the Company choose not to offset are presented below.
DERIVATIVES DESIGNATED AS HEDGING INSTRUMENTS
There were no derivatives designated as hedging instruments as of December 31, 2024 and December 31, 2023.
69
DERIVATIVES NOT DESIGNATED AS HEDGING INSTRUMENTS
Derivatives not designated as hedging instruments, relate to economic hedges and are marked to market with all amounts recognized in the Consolidated Statements of Income. The derivatives not designated as hedging instruments outstanding at December 31, 2024 and December 31, 2023 were foreign exchange swaps.
For 2024, the Company recognized a gain of $27 million in other non-operating items, net for derivative instruments not designated as hedging instruments. For 2023, the Company recognized a gain of $2 million. For 2022, the Company recognized a gain of $2 million. The realized part of the losses referred to above are reported under financing activities in the statement of cash flows. For 2024, 2023 and 2022, the gains and losses recognized as interest expense were immaterial.
|
|
DECEMBER 31, 2024 |
|
|
DECEMBER 31, 2023 |
|
|
||||||||||||||||||
|
|
|
|
|
Fair Value Measurements |
|
|
|
|
|
Fair Value Measurements |
|
|
||||||||||||
|
|
|
|
|
Derivative asset |
|
|
Derivative liability |
|
|
|
|
|
Derivative asset |
|
|
Derivative liability |
|
|
||||||
|
|
Nominal |
|
|
(Other current |
|
|
(Other current |
|
|
Nominal |
|
|
(Other current |
|
|
(Other current |
|
|
||||||
(Dollars in millions) |
|
volume |
|
|
assets) |
|
|
liabilities) |
|
|
volume |
|
|
assets) |
|
|
liabilities) |
|
|
||||||
DERIVATIVES NOT DESIGNATED |
|
|
|
|
|
|
|
|
|
|
|
|
|
|
|
|
|
|
|
||||||
Foreign exchange swaps, less |
|
$ |
2,916 |
|
1) |
$ |
22 |
|
2) |
$ |
42 |
|
3) |
$ |
1,895 |
|
4) |
$ |
22 |
|
5) |
$ |
12 |
|
6) |
TOTAL DERIVATIVES NOT |
|
$ |
2,916 |
|
|
$ |
22 |
|
|
$ |
42 |
|
|
$ |
1,895 |
|
|
$ |
22 |
|
|
$ |
12 |
|
|
1) Net nominal amount after deducting for offsetting swaps under ISDA agreements is $2,916 million.
2) Net amount after deducting for offsetting swaps under ISDA agreements is $22 million.
3) Net amount after deducting for offsetting swaps under ISDA agreements is $42 million.
4) Net nominal amount after deducting for offsetting swaps under ISDA agreements is $1,895 million.
5) Net amount after deducting for offsetting swaps under ISDA agreements is $22 million.
6) Net amount after deducting for offsetting swaps under ISDA agreements is $12 million.
FAIR VALUE OF DEBT
The fair value of long-term debt is determined either from quoted market prices as provided by participants in the secondary market or for long-term debt without quoted market prices, estimated using a discounted cash flow method based on the Company’s current borrowing rates for similar types of financing. The Company has determined that each of these fair value measurements of debt reside within Level 2 of the fair value hierarchy.
During the first quarter of 2024, the Company issued a second 5.5-year €500 million green Eurobond. During the first quarter of 2023, the Company issued its first 5-year €500 million green Eurobond.
The fair value and carrying value of debt are summarized in the table below.
|
|
DECEMBER 31, 2024 |
|
|
DECEMBER 31, 2023 |
|
||||||||||
(Dollars in millions) |
|
CARRYING |
|
|
FAIR |
|
|
CARRYING |
|
|
FAIR |
|
||||
LONG-TERM DEBT |
|
|
|
|
|
|
|
|
|
|
|
|
||||
Bonds |
|
$ |
1,512 |
|
|
$ |
1,527 |
|
|
$ |
1,023 |
|
|
$ |
1,022 |
|
Loans |
|
|
10 |
|
|
|
10 |
|
|
|
301 |
|
|
|
306 |
|
TOTAL |
|
$ |
1,522 |
|
|
$ |
1,537 |
|
|
$ |
1,324 |
|
|
$ |
1,328 |
|
|
|
|
|
|
|
|
|
|
|
|
|
|
||||
SHORT-TERM DEBT |
|
|
|
|
|
|
|
|
|
|
|
|
||||
Short-term portion of long-term debt |
|
$ |
273 |
|
|
$ |
275 |
|
|
$ |
297 |
|
|
$ |
297 |
|
Overdrafts and other short-term debt |
|
|
114 |
|
|
|
114 |
|
|
|
241 |
|
|
|
241 |
|
TOTAL |
|
$ |
387 |
|
|
$ |
389 |
|
|
$ |
538 |
|
|
$ |
538 |
|
1) Debt as reported in balance sheet.
ASSETS AND LIABILITIES MEASURED AT FAIR VALUE ON A NON-RECURRING BASIS
In addition to assets and liabilities that are measured at fair value on a recurring basis, the Company also has assets and liabilities in its balance sheet that are measured at fair value on a nonrecurring basis including certain long-lived assets, including equity method investments, goodwill and other intangible assets, typically as it relates to impairment.
The Company has determined that the fair value measurements included in each of these assets and liabilities rely primarily on Company-specific inputs and the Company’s assumptions about the use of the assets and settlements of liabilities, as observable inputs are not available. The Company has determined that each of these fair value measurements reside within Level 3 of the fair value hierarchy. To determine the fair value of long-lived assets as of the reporting date, the Company utilizes the projected cash flows expected to be generated by the long-lived assets, then discounts the future cash flows over the expected life of the long-lived assets.
For the period 2022-2024, the Company did not record any material impairment charges on its long-lived assets for its continuing operations.
70
5. Income Taxes
INCOME BEFORE INCOME TAXES (Dollars in millions) |
|
2024 |
|
|
2023 |
|
|
2022 |
|
|||
U.S. |
|
$ |
(51 |
) |
|
$ |
29 |
|
|
$ |
(3 |
) |
Non-U.S. |
|
|
926 |
|
|
|
583 |
|
|
|
606 |
|
Total |
|
$ |
875 |
|
|
$ |
612 |
|
|
$ |
603 |
|
PROVISION FOR INCOME TAXES (Dollars in millions) |
|
2024 |
|
|
2023 |
|
|
2022 |
|
|||
Current |
|
|
|
|
|
|
|
|
|
|||
U.S. federal |
|
$ |
(6 |
) |
|
$ |
19 |
|
|
$ |
32 |
|
Non-U.S. |
|
|
260 |
|
|
|
210 |
|
|
|
181 |
|
U.S. state and local |
|
|
3 |
|
|
|
3 |
|
|
|
5 |
|
|
|
|
|
|
|
|
|
|
|
|||
Deferred |
|
|
|
|
|
|
|
|
|
|||
U.S. federal |
|
|
(11 |
) |
|
|
(7 |
) |
|
|
(20 |
) |
Non-U.S. |
|
|
(16 |
) |
|
|
(101 |
) |
|
|
(17 |
) |
U.S. state and local |
|
|
(3 |
) |
|
|
(1 |
) |
|
|
(3 |
) |
Total income tax expense |
|
$ |
227 |
|
|
$ |
123 |
|
|
$ |
178 |
|
EFFECTIVE INCOME TAX RATE (%) |
|
2024 |
|
|
2023 |
|
|
2022 |
|
|
|||
U.S. federal income tax rate |
|
|
21.0 |
|
% |
|
21.0 |
|
% |
|
21.0 |
|
% |
Non-Deductible Expenses |
|
|
0.9 |
|
|
|
1.8 |
|
|
|
0.5 |
|
|
Foreign tax rate variances |
|
|
2.2 |
|
|
|
4.6 |
|
|
|
3.6 |
|
|
Tax credits |
|
|
(2.1 |
) |
|
|
(3.9 |
) |
|
|
(3.5 |
) |
|
Change in Valuation Allowances |
|
|
0.5 |
|
|
|
11.6 |
|
|
|
(1.7 |
) |
|
Changes in tax reserves |
|
|
(2.1 |
) |
|
|
2.7 |
|
|
|
(0.2 |
) |
|
Provision to Return |
|
|
(1.5 |
) |
|
|
(0.2 |
) |
|
|
0.6 |
|
|
Earnings of equity investments |
|
|
(0.2 |
) |
|
|
(0.2 |
) |
|
|
(0.1 |
) |
|
Withholding taxes |
|
|
5.6 |
|
|
|
5.2 |
|
|
|
4.0 |
|
|
State taxes, net of federal benefit |
|
|
0.0 |
|
|
|
0.3 |
|
|
|
0.4 |
|
|
Tax Audits |
|
|
(0.5 |
) |
|
|
0.0 |
|
|
|
1.0 |
|
|
Other Deferred Tax Adjustments1) |
|
|
0.0 |
|
|
|
(26.7 |
) |
|
|
0.0 |
|
|
U.S. FDII Deduction |
|
|
0.0 |
|
|
|
(0.4 |
) |
|
|
0.0 |
|
|
U.S. GILTI Tax |
|
|
1.9 |
|
|
|
3.4 |
|
|
|
3.4 |
|
|
Impact of Translation Rates |
|
|
0.6 |
|
|
|
1.1 |
|
|
|
0.2 |
|
|
Other, net |
|
|
(0.3 |
) |
|
|
(0.2 |
) |
|
|
0.3 |
|
|
Effective income tax rate |
|
|
26.0 |
|
% |
|
20.1 |
|
% |
|
29.5 |
|
% |
1) Deferred tax asset recognized in 2023 due to the transfer of certain assets and operations as part of the Company's restructuring activities.
Deferred income taxes reflect the net tax effects of temporary differences between the carrying amounts of assets and liabilities for financial reporting purposes and the amounts used for income tax purposes. On December 31, 2024, the Company had net operating loss carryforwards (NOL’s) of approximately $363 million, of which approximately $339 million have no expiration date. The remaining losses expire on various dates through 2033.
Valuation allowances have been established which partially offset the related deferred assets. Such allowances are primarily provided against NOL’s of companies that have perennially incurred losses, as well as the NOL’s of companies that are start-up operations and have not established a pattern of profitability. The Company assesses all available evidence, both positive and negative, to determine the amount of any required valuation allowance. During 2024, the Company recorded valuation allowances against deferred tax assets of tax losses in certain companies and a partial valuation allowance against the deferred tax asset recognized due to the transfer of certain assets and operations as part of the Company’s restructuring activities, on the basis of management’s assessment of the amount of the related deferred tax assets that are not more likely than not to be realized.
The foreign tax rate variance reflects the fact that approximately two-thirds of the Company’s non-U.S. pre-tax income is generated by business operations located in tax jurisdictions where the tax rate is between 20-30%. The tax rate from quarter to quarter and from year to year is also impacted by the mix of earnings and tax rates in various jurisdictions compared to the same periods or prior years.
The Company has reserves for income taxes that may become payable in future periods as a result of tax audits. These reserves represent the Company’s best estimate of the potential liability for tax exposures. Inherent uncertainties exist in estimates of tax exposures due to changes in tax law, both legislated and concluded through the various jurisdictions’ court systems. The Company files income tax returns in the United States federal jurisdiction, and various states and non-U.S. jurisdictions.
71
The Company recognizes tax benefits only for tax positions that are more likely than not to be sustained upon examination by tax authorities. The amount recognized is measured as the largest amount of benefit that is greater than 50 percent likely of being realized upon ultimate settlement. Unrecognized tax benefits are tax benefits claimed in the Company’s tax returns that do not meet these recognition and measurement standards. At any given time, the Company is undergoing tax audits in several tax jurisdictions, covering multiple years. The Company is no longer subject to income tax examination by the U.S. Federal tax authorities for years prior to 2021. With few exceptions, the Company is no longer subject to income tax examination by U.S. state or local tax authorities or by non-U.S. tax authorities for years before 2011. The Company is undergoing tax audits in several non-U.S. jurisdictions and several U.S. state jurisdictions, covering multiple years. As of December 31, 2024, as a result of those tax examinations, the Company is not aware of any proposed income tax adjustments that would have a material impact on the Company’s financial statements, however, other audits could result in additional increases or decreases to the unrecognized tax benefits in some future period or periods. The Company believes that some of these audits will conclude within the next 12 months and that it is reasonably possible the amount of uncertain income tax positions, including interest, may decrease by $10-$15 million due to settlement of audits and expiration of statutes of limitations.
The Company recognizes interest and potential penalties accrued related to unrecognized tax benefits in tax expense. As of December 31, 2023, the Company had recorded $64 million for unrecognized tax benefits, including $14 million of accrued interest and penalties. During 2024, the Company recorded a net increase of $3 million to income tax reserves for unrecognized tax benefits related to tax positions taken in current year. Also, during 2024, the Company recorded a net decrease of $21 million to income tax reserves for unrecognized tax benefits due to settlement of audits and expiration of statutes of limitations.
The Company had $11 million accrued for the payment of interest and penalties as of December 31, 2024. Of the total unrecognized tax benefits of $43 million recorded at December 31, 2024, $13 million is classified as current income tax payable, and $30 million is classified as non-current tax payable included in Other Non-Current Liabilities on the Consolidated Balance Sheets. Substantially all of these reserves would impact the effective tax rate if released into income.
The following table summarizes the activity related to the Company’s unrecognized tax benefits.
UNRECOGNIZED TAX BENEFITS (Dollars in millions) |
|
2024 |
|
|
2023 |
|
|
2022 |
|
|||
Unrecognized tax benefits at beginning of year |
|
$ |
83 |
|
|
$ |
67 |
|
|
$ |
65 |
|
Increases as a result of tax positions taken during a prior period |
|
|
0 |
|
|
|
8 |
|
|
|
0 |
|
Increases as a result of tax positions taken during the current period |
|
|
4 |
|
|
|
7 |
|
|
|
7 |
|
Decreases as a result of tax positions taken during a prior period |
|
|
(6 |
) |
|
|
0 |
|
|
|
0 |
|
Decreases relating to settlements with taxing authorities |
|
|
(6 |
) |
|
|
0 |
|
|
|
(4 |
) |
Decreases resulting from the lapse of the applicable statute of limitations |
|
|
(39 |
) |
|
|
0 |
|
|
|
0 |
|
Translation Difference |
|
|
(1 |
) |
|
|
1 |
|
|
|
(1 |
) |
Total unrecognized tax benefits at end of year |
|
$ |
35 |
|
|
$ |
83 |
|
|
$ |
67 |
|
The tax effect of temporary differences and carryforwards that comprise significant portions of deferred tax assets and liabilities were as follows.
DEFERRED TAXES(Dollars in millions) |
|
December 31, |
|
|||||||||
|
|
2024 |
|
|
2023 |
|
|
2022 |
|
|||
Assets |
|
|
|
|
|
|
|
|
|
|||
Provisions |
|
$ |
112 |
|
|
$ |
126 |
|
|
$ |
99 |
|
Costs capitalized for tax |
|
|
85 |
|
|
|
57 |
|
|
|
43 |
|
Other Deferred Tax Asset1) |
|
|
158 |
|
|
|
160 |
|
|
|
— |
|
Property, plant and equipment |
|
|
30 |
|
|
|
11 |
|
|
|
12 |
|
Retirement Plans |
|
|
39 |
|
|
|
40 |
|
|
|
42 |
|
Tax receivables, principally NOL’s |
|
|
99 |
|
|
|
133 |
|
|
|
123 |
|
Deferred tax assets before allowances |
|
|
523 |
|
|
|
527 |
|
|
|
319 |
|
Valuation allowances |
|
|
(126 |
) |
|
|
(129 |
) |
|
|
(46 |
) |
Total |
|
|
397 |
|
|
|
398 |
|
|
|
273 |
|
|
|
|
|
|
|
|
|
|
|
|||
Liabilities |
|
|
|
|
|
|
|
|
|
|||
Distribution taxes |
|
|
(3 |
) |
|
|
(3 |
) |
|
|
(3 |
) |
Other |
|
|
0 |
|
|
|
(1 |
) |
|
|
(2 |
) |
Total |
|
|
(3 |
) |
|
|
(4 |
) |
|
|
(5 |
) |
Net deferred tax asset |
|
$ |
394 |
|
|
$ |
394 |
|
|
$ |
268 |
|
1) Deferred tax asset recognized in 2023 due to the transfer of certain assets and operations as part of the Company’s restructuring activities,
and is partially offset by the increased valuation allowances.
72
The following table summarizes the activity related to the Company’s valuation allowances (dollars in millions):
VALUATION ALLOWANCES AGAINST DEFERRED TAX ASSETS (Dollars in millions) |
|
December 31, |
|
|||||||||
|
|
2024 |
|
|
2023 |
|
|
2022 |
|
|||
Allowances at beginning of year |
|
$ |
129 |
|
|
$ |
46 |
|
|
$ |
59 |
|
Benefits reserved current year |
|
|
11 |
|
|
|
81 |
|
|
|
14 |
|
Benefits recognized current year1) |
|
|
(6 |
) |
|
|
(2 |
) |
|
|
(27 |
) |
Translation difference |
|
|
(8 |
) |
|
|
4 |
|
|
|
0 |
|
Allowances at end of year |
|
$ |
126 |
|
|
$ |
129 |
|
|
$ |
46 |
|
1) Benefits reserved in 2023 include the partial reserve against deferred tax assets recognized in 2023 due to the transfer of certain assets and operations as part of the Company's restructuring activities. In January 2025 the OECD released Administrative Guidance on Article 9.1 of the Global Anti-Base Erosion Model Rules which amends the Pillar Two Framework. Jurisdictions that have adopted the Framework may implement and administer their domestic laws consistent with the Model Rules and guidance. The Guidance eliminates the tax basis in certain deferred tax assets and tax credit carryforwards for purposes of global minimum tax established under the Framework. The Company is analyzing the latest Guidance and will recognize any impact in the first quarter of 2025.
6. Receivables
(Dollars in millions) |
|
December 31, |
|
|||||||||
|
|
2024 |
|
|
2023 |
|
|
2022 |
|
|||
Receivables |
|
$ |
2,003 |
|
|
$ |
2,206 |
|
|
$ |
1,916 |
|
Allowance for credit losses at beginning of year |
|
|
(8 |
) |
|
|
(10 |
) |
|
|
(8 |
) |
Reversal of (addition to) allowance |
|
|
(2 |
) |
|
|
(2 |
) |
|
|
(4 |
) |
Write-off against allowance |
|
|
0 |
|
|
|
3 |
|
|
|
2 |
|
Translation difference |
|
|
0 |
|
|
|
(0 |
) |
|
|
0 |
|
Allowance for credit losses at end of year |
|
|
(10 |
) |
|
|
(8 |
) |
|
|
(10 |
) |
Total receivables, net of allowance |
|
$ |
1,993 |
|
|
$ |
2,198 |
|
|
$ |
1,907 |
|
7. Inventories
(Dollars in millions) |
|
December 31, |
|
|||||||||
|
|
2024 |
|
|
2023 |
|
|
2022 |
|
|||
Raw material |
|
$ |
418 |
|
|
$ |
457 |
|
|
$ |
445 |
|
Work in progress |
|
|
295 |
|
|
|
347 |
|
|
|
350 |
|
Finished products |
|
|
290 |
|
|
|
296 |
|
|
|
265 |
|
Inventories gross |
|
|
1,003 |
|
|
|
1,100 |
|
|
|
1,060 |
|
Inventory reserve at beginning of year |
|
|
(89 |
) |
|
|
(91 |
) |
|
|
(91 |
) |
Change in reserve, net |
|
|
1 |
|
|
|
3 |
|
|
|
(6 |
) |
Translation difference |
|
|
5 |
|
|
|
(0 |
) |
|
|
5 |
|
Inventory reserve at end of year |
|
|
(82 |
) |
|
|
(89 |
) |
|
|
(91 |
) |
Total inventories, net of reserve |
|
$ |
921 |
|
|
$ |
1,012 |
|
|
$ |
969 |
|
8. Other Non-Current Assets
(Dollars in millions) |
|
December 31, |
|
|||||
|
|
2024 |
|
|
2023 |
|
||
Equity method investments |
|
$ |
13 |
|
|
$ |
11 |
|
Deferred tax assets |
|
|
412 |
|
|
|
433 |
|
Income tax receivables |
|
|
19 |
|
|
|
22 |
|
Insurance receivables |
|
|
44 |
|
|
|
75 |
|
Other non-current assets |
|
|
60 |
|
|
|
66 |
|
Total other non-current assets |
|
$ |
548 |
|
|
$ |
606 |
|
As of December 31, 2024 and 2023, the Company had one equity method investment. The Company owns 49% of Autoliv-Hirotako Safety Sdn, Bhd (parent and subsidiaries) in Malaysia which it currently does not control, but in which it exercises significant influence over operations and financial position.
73
9. Property, Plant and Equipment
(Dollars in millions) |
|
December 31, |
|
|
|
|||||
|
|
2024 |
|
|
2023 |
|
|
Estimated life |
||
Land and land improvements |
|
$ |
127 |
|
|
$ |
136 |
|
|
n/a to 15 |
Buildings |
|
|
1,038 |
|
|
|
1,065 |
|
|
20-40 |
Machinery and equipment |
|
|
4,539 |
|
|
|
4,545 |
|
|
3-12 |
Construction in progress |
|
|
629 |
|
|
|
548 |
|
|
n/a |
Property, plant and equipment |
|
|
6,334 |
|
|
|
6,294 |
|
|
|
Less accumulated depreciation |
|
|
(4,095 |
) |
|
|
(4,102 |
) |
|
|
Net of depreciation |
|
$ |
2,239 |
|
|
$ |
2,192 |
|
|
|
DEPRECIATION INCLUDED IN (Dollars in millions) |
|
2024 |
|
|
2023 |
|
|
2022 |
|
|||
Cost of sales |
|
$ |
347 |
|
|
$ |
340 |
|
|
$ |
329 |
|
Selling, general and administrative expenses |
|
|
13 |
|
|
|
12 |
|
|
|
11 |
|
Research, development and engineering expenses, net |
|
|
26 |
|
|
|
24 |
|
|
|
20 |
|
Total |
|
$ |
385 |
|
|
$ |
376 |
|
|
$ |
360 |
|
No significant fixed asset impairments related to the Company’s operations were recognized during 2024, 2023 or 2022.
The net book value of machinery and equipment and buildings and land under finance lease contracts recorded at December 31, 2024 and December 31, 2023 were immaterial. The amortization expense related to finance leases is included with depreciation expenses disclosed in the table above.
10. Goodwill and Intangible Assets
|
|
December31, |
|
|||||
GOODWILL (Dollars in millions) |
|
2024 |
|
|
2023 |
|
||
Carrying amount at beginning of year |
|
$ |
1,378 |
|
|
$ |
1,375 |
|
Translation differences |
|
|
(10 |
) |
|
|
2 |
|
Carrying amount at end of year |
|
$ |
1,368 |
|
|
$ |
1,378 |
|
Approximately $1.2 billion of the Company’s goodwill is associated with the 1997 merger of Autoliv AB and the Automotive Safety Products Division of Morton International, Inc. No goodwill impairment charges were recognized during 2024, 2023 or 2022.
|
|
December 31, |
|
|||||
AMORTIZABLE INTANGIBLES (Dollars in millions) |
|
2024 |
|
|
2023 |
|
||
Gross carrying amount |
|
$ |
386 |
|
|
$ |
391 |
|
Accumulated amortization |
|
|
(379 |
) |
|
|
(384 |
) |
Carrying value |
|
$ |
7 |
|
|
$ |
7 |
|
At December 31, 2024, intangible assets subject to amortization mainly relate to acquired technology. No significant impairments of intangible assets were recognized during 2024, 2023 or 2022.
Amortization expense related to intangible assets was $2 million, $2 million and $3 million in 2024, 2023 and 2022, respectively. Estimated future amortization expense is immaterial for all future periods.
11. Supplier Finance Program Obligations
The Company has an agreement with an external payment service provider to facilitate the payments to certain suppliers. The outstanding obligations confirmed towards the external payment service provider are recorded in Accounts Payable in the Consolidated Balance Sheet until payment has been effected. The Company has undertaken to make sure the payment is effected on the original invoice maturity date. The average payment terms during 2024 was 117 days.
The roll-forward of the Company's outstanding obligations confirmed as valid under its supplier finance program for the year ended December 31, 2024 is as follows (dollars in millions):
|
|
As of December 31, |
|
|||||
(Dollars in millions) |
|
2024 |
|
|
2023 |
|
||
Confirmed obligations outstanding at beginning of the period |
|
$ |
345 |
|
|
$ |
314 |
|
Invoices confirmed during the period |
|
|
1,536 |
|
|
|
1,436 |
|
Confirmed invoices paid during the period |
|
|
(1,546 |
) |
|
|
(1,405 |
) |
Confirmed obligations outstanding at end of the period |
|
$ |
335 |
|
|
$ |
345 |
|
|
|
|||||||
74
12. Restructuring
Restructuring provisions are made on a case-by-case basis and primarily include severance costs incurred in connection with employee reductions and plant consolidations. Restructuring costs other than employee related costs are immaterial for all periods presented and are included in the table below. The Company expects to finance restructuring programs over the next several years through cash generated from its ongoing operations or through cash available under its existing credit facilities. The Company does not expect that the execution of these programs will have an adverse impact on its liquidity position. The changes in the employee-related reserves in the table below have been charged against Other income (expense), net in the Consolidated Statements of Income. The restructuring reserve balance is included within Accrued expenses in the Consolidated Balance Sheet.
|
|
December 31, |
|
|||||||||
(Dollars in millions) |
|
2024 |
|
|
2023 |
|
|
2022 |
|
|||
Reserve at beginning of the period |
|
$ |
213 |
|
|
$ |
32 |
|
|
$ |
88 |
|
Provision - charge |
|
|
20 |
|
|
|
212 |
|
|
|
17 |
|
Provision - reversal |
|
|
(2 |
) |
|
|
(1 |
) |
|
|
(4 |
) |
Cash payments |
|
|
(69 |
) |
|
|
(35 |
) |
|
|
(64 |
) |
Translation difference |
|
|
(11 |
) |
|
|
7 |
|
|
|
(5 |
) |
Reserve at end of the period |
|
$ |
151 |
|
|
$ |
213 |
|
|
$ |
32 |
|
Of the restructuring charges in 2024 of $20 million, mainly related to the global structural cost reduction program activities initiated in 2023 in Europe. The cash payments of $69 million in 2024, mainly related to restructuring activities in Europe. As of December 31, 2024, the majority of the restructuring reserve balance is attributed to global structural cost reduction program activities initiated in 2023 in Europe. The Company does not expect to recognize additional material restructuring charges during 2025 related to on-going restructuring programs.
The restructuring charges in 2023 of $212 million related to the global structural cost reduction program activities initiated in 2023, primarily in Europe. Cash payments of $35 million in 2023 mainly related to restructuring activities in Europe.
The restructuring charges in 2022 of $17 million mainly related to footprint optimization activities in Asia and Europe. Cash payments of $64 million in 2022 were related to the structural efficiency program initiated in 2020, footprint optimization activities initiated in Europe in 2020 and in Asia in 2022.
13. Product Related Liabilities
Autoliv is exposed to product liability and warranty claims in the event that the Company’s products fail to perform as represented and such failure results, or is alleged to result, in bodily injury, and/or property damage or other loss. The Company has reserves for product risks. Such reserves are related to product performance issues including recall, product liability and warranty issues. The reserve for product related liabilities is included in accrued expenses on the Consolidated Balance Sheet. For further information, see Note 18.
The Company records liabilities for product related risks when probable claims are identified and when it is possible to reasonably estimate costs. Changes in reserve for warranty claims are estimated based on prior experience, likely changes in performance of newer products, and the mix and volume of the products sold. The changes in reserve are recorded on an accrual basis.
In 2024, the additions to the reserve mainly related to warranty related issues. The reversal of the reserve was related to certain recall issues that were settled with a favorable outcome. Cash payments were evenly related to warranty and recall related issues. None of these matters were individually material during 2024.
In 2023, the change in reserve and cash payments mainly related to the Andrews litigation settlement with the reserve partly offset by reversal of recall related issues. In 2022, the changes in reserve and cash payments mainly related to warranty related issues. None of which were individually material.
A majority of the Company’s recall related issues as of December 31, 2024 are covered by insurance. Insurance receivables are included within other current and non-current assets on the Consolidated Balance Sheet. As of December 31, 2024, the Company had total insurance receivables related to recall issues of $54 million ($81 million as of December 31, 2023).
The table below summarizes the change in the balance sheet position of the product related liabilities (dollars in millions).
|
|
December 31, |
|
|||||||||
(Dollars in millions) |
|
2024 |
|
|
2023 |
|
|
2022 |
|
|||
Reserve at beginning of the year |
|
$ |
96 |
|
|
$ |
145 |
|
|
$ |
144 |
|
Addition to reserve |
|
|
16 |
|
|
|
28 |
|
|
|
21 |
|
Reversal of preexisting reserve |
|
|
(16 |
) |
|
|
(3 |
) |
|
|
(1 |
) |
Cash payments |
|
|
(30 |
) |
|
|
(74 |
) |
|
|
(17 |
) |
Translation difference |
|
|
(2 |
) |
|
|
0 |
|
|
|
(2 |
) |
Reserve at end of the year |
|
$ |
65 |
|
|
$ |
96 |
|
|
$ |
145 |
|
75
14. Debt and Credit Agreements
SHORT-TERM DEBT
As of December 31, 2024 and 2023, total short-term debt was $387 million and 538 million, respectively. As of December 31, 2024, short-term debt consisted mainly of a $273 million Swedish Export Credit Corporation loan, and $90 million commercial papers.
The Company’s subsidiaries have credit agreements, principally in the form of overdraft facilities with several local banks. Total available short-term facilities as of December 31, 2024, excluding commercial paper facilities as described below, amounted to $428 million, of which approximately $24 million was utilized. The weighted average interest rate on total short-term debt outstanding at December 31, 2024 and 2023, excluding the short-term portion of long-term debt, was 5% and 6%, respectively.
LONG-TERM DEBT
As of December 31, 2024 and 2023, total long-term debt was 1,522 million and 1,324 million, respectively.
In February 2024, the Company priced and issued a 5.5-year green bond for a total of €500 million in the Eurobond market. The bond carries a coupon of 3.625% and matures in August 2029.
In March 2023, the Company priced and issued a 5-year green bond for a total of €500 million in the Eurobond market. The bond carries a coupon of 4.25% and matures in March 2028.
In June 2020, the Company utilized its SEK 3,000 million facility with Swedish Export Credit Corporation which was signed in May 2020. The SEK 3,000 million facility matures in 2025 and carries a floating interest rate of 3M STIBOR +1.85%.
In 2014, the Company issued long-term debt securities in a U.S. Private Placement. As of December 31, 2024, the total long-term debt outstanding from the 2014 issuance of $470 million consist of $285 million aggregate principal amount of 12-year senior notes with an interest rate of 4.24%, and $185 million aggregate principal amount of 15-year senior notes with an interest rate of 4.44%.
CREDIT FACILITIES
In July 2024, the Company entered into an $125 million bilateral revolving credit facility (Bilateral RCF) with substantially the same terms as the RCF with the 11 banks (see below). As of December 31, 2024 this facility was not utilized.
In May 2022, the Company refinanced its existing revolving credit facility (RCF) of $1,100 million. The facility was syndicated among 11 banks and matures in May 2029. The Company pays a commitment fee on the undrawn amount of 0.10%, representing 35% of the applicable margin, which is 0.275% (given the Company’s ratings of “BBB+ from Fitch and “Baa1” from Moody’s). Borrowings under the facility are unsecured. As of December 31, 2024 this facility was not utilized.
The Company has a €3,000 million Euro Medium Term Note Program in place for being able to issue notes to be traded on the Global Exchange Market of Euronext Dublin. At December 31, 2024, €1,000 million had been issued under this program (see long-term debt above).
The Company has a $1.0 billion US commercial paper program and a SEK 7 billion (approx. $636 million) Swedish commercial paper program. At December 31, 2024 the amount outstanding under these programs were $90 million and SEK 0 million, respectively.
The Company is not subject to any financial covenants, i.e., performance related restrictions, in any of its significant long-term borrowings or commitments.
CREDIT RISK
In the Company’s financial operations, credit risk arises in connection with cash deposits with banks and when entering into forward exchange agreements, swap contracts or other financial instruments. In order to reduce this risk, deposits and financial instruments are only entered with a limited number of banks up to a calculated risk amount of $250 million per bank for banks rated A- or above and up to $50 million for banks rated BBB+. The policy of the Company is to work with banks that have a strong credit rating and that participate in the Company’s financing. In addition to this, deposits of up to an aggregate amount of $2 billion can be placed in U.S. and Swedish government paper and in certain AAA rated money market funds. As of December 31, 2024, the Company had placed $31 million in money market funds.
The table below shows debt maturity as cash flow. For a description of hedging instruments used as part of debt management, see the Financial Instruments section of Note 2 and Note 4.
DEBT PROFILE
|
|
|
|
|
|
|
|
|
|
|
|
|
|
|
|
|
|
|
|
Total |
|
|
|
|
|
||||||||
PRINCIPAL AMOUNT BY EXPECTED MATURITY |
|
2025 |
|
|
2026 |
|
|
2027 |
|
|
2028 |
|
|
2029 |
|
|
Thereafter |
|
|
long- |
|
|
Total |
|
|
||||||||
Bonds |
|
$ |
— |
|
|
$ |
285 |
|
|
$ |
— |
|
|
$ |
521 |
|
|
$ |
706 |
|
|
$ |
— |
|
|
$ |
1,512 |
|
|
$ |
1,512 |
|
|
Loans |
|
|
273 |
|
|
|
— |
|
|
|
10 |
|
|
|
|
|
|
— |
|
|
|
— |
|
|
|
10 |
|
|
|
283 |
|
|
|
Commercial papers |
|
|
90 |
|
|
|
— |
|
|
|
— |
|
|
|
— |
|
|
|
— |
|
|
|
— |
|
|
|
— |
|
|
|
90 |
|
|
Other short-term debt |
|
|
24 |
|
|
|
— |
|
|
|
— |
|
|
|
— |
|
|
|
— |
|
|
|
— |
|
|
|
— |
|
|
|
24 |
|
|
Total principal amount |
|
$ |
387 |
|
|
$ |
285 |
|
|
$ |
10 |
|
|
$ |
521 |
|
|
$ |
706 |
|
|
$ |
— |
|
|
$ |
1,522 |
|
|
$ |
1,909 |
|
|
76
15. Shareholders’ Equity
The number of shares outstanding as of December 31, 2024 was 77,712,479. During 2024, the Company has repurchased and retired 5,052,938 shares. In addition, the Company also retired 2,000,000 shares from Treasury stock in December 2024.
DIVIDENDS |
|
2024 |
|
|
2023 |
|
|
2022 |
|
|||
Cash dividend paid per share |
|
$ |
2.74 |
|
|
$ |
2.66 |
|
|
$ |
2.58 |
|
Cash dividend declared per share |
|
$ |
2.74 |
|
|
$ |
2.66 |
|
|
$ |
2.58 |
|
|
|
|||||||||||
OTHER COMPREHENSIVE LOSS / ENDING BALANCE1) (Dollars in millions) |
|
2024 |
|
|
2023 |
|
||
Cumulative translation adjustments |
|
$ |
(629 |
) |
|
$ |
(466 |
) |
Net pension liability |
|
|
(31 |
) |
|
|
(30 |
) |
Total (ending balance) |
|
$ |
(659 |
) |
|
$ |
(496 |
) |
|
|
|
|
|
|
|
||
Deferred taxes on the pension liability |
|
$ |
10 |
|
|
$ |
10 |
|
1) The components of Other Comprehensive Loss are net of any related income tax effects.
Cumulative translation gains of $1 million and $12 million related to liquidated entities during 2024 and 2023 have been recycled and reported as part of the net change of cumulative translation adjustment in the Comprehensive income statement and Equity statement.
SHARE REPURCHASE PROGRAM
In November 2021, the Board of Directors approved a new stock repurchase program that authorizes the Company to repurchase up to $1.5 billion or up to 17 million shares (whichever comes first) between January 2022 and the end of 2024. In November 2024, the Board of Directors approved the extension of this stock repurchase program through the end of 2025.
During 2024 the Company repurchased and retired 5,052,938 shares for approximately $552 million. During 2023 the Company repurchased and retired 3,671,252 shares for approximately $352 million. During 2022 the Company repurchased and retired 1,440,572 shares for approximately $115 million. In total, the Company has repurchased 10,164,762 shares under the new stock repurchase program as of December 31, 2024.
16. Supplemental Cash Flow Information
Payments for interest and income taxes were as follows:
(Dollars in millions) |
|
2024 |
|
|
2023 |
|
|
2022 |
|
|||
Interest |
|
$ |
104 |
|
|
$ |
80 |
|
|
$ |
64 |
|
Income taxes |
|
|
207 |
|
|
|
192 |
|
|
|
215 |
|
17. Stock Incentive Plan
The Company maintains the Autoliv, Inc. 1997 Stock Incentive Plan, as amended (the “Stock Incentive Plan”), pursuant to which it has granted to eligible employees and non-employee directors stock options (SOs), restricted stock units (RSUs) and performance shares (PSUs).
The fair value of the RSUs and PSUs is calculated as the grant date fair value of the shares expected to be issued. The RSUs and PSUs granted in 2024, 2023 and 2022 entitle the grantee to receive dividend equivalents in the form of additional RSUs and PSUs subject to the same vesting conditions as the underlying RSUs and PSUs. For the grants made during 2024, 2023 and 2022, the fair value of a RSU and a PSU was calculated by using the closing stock price on the grant date and, with respect to a PSU, assumed target performance. The grant date fair value for the RSUs and PSUs granted during 2024 was approximately $7 million and approximately $8 million, respectively.
Pursuant to the Company’s non-employee director compensation policy effective May 1, 2024, the Company’s non-employee directors receive an annual RSU grant having a grant date value equal to $152,500 and the Chairman of the Board of Directors also receives an additional annual RSU grant having a grant date value equal to $90,000. All RSUs granted to non-employee directors vest in one installment on the earlier of the next AGM or the first anniversary of the grant date, in each case subject to the grantee’s continued service as a non-employee director on the vesting date with limited exceptions. The RSUs granted to the Company’s non-employee directors entitle the grantee to receive dividend equivalents in the form of additional RSUs subject to the same vesting conditions as the underlying RSUs. The grant date fair value for the RSUs granted in 2024 to the Company’s non-employee directors was approximately $2 million.
77
The source of the shares issued upon vesting of awards is generally from treasury shares. The Stock Incentive Plan provides for the issuance of up to 9,585,055 common shares for awards. At December 31, 2024, 7,156,026 of these shares have been issued for awards and 2,429,029 shares remain available for future grants.
In 2015 and earlier, stock awards were granted in the form of SOs and RSUs. All SOs were granted for 10-year terms, had an exercise price equal to the fair market value per share of common stock at the date of grant, and became exercisable after one year of continued employment following the grant date. The average grant date fair values of SOs were calculated using the Black-Scholes valuation model. The Company used historical exercise data for determining the expected life assumption. Expected volatility was based on historical and implied volatility. All outstanding SOs as of December 31, 2024 have since been exercised or expired.
The Company recorded approximately $16 million, $14 million and $4 million stock-based compensation expense related to RSUs and PSUs for 2024, 2023 and 2022, respectively. The total compensation cost related to non-vested awards not yet recognized is $17 million for RSUs and PSs and the weighted average period over which this cost is expected to be recognized is approximately 1.7 years. There are no remaining unrecognized compensation costs associated with SOs.
Information on the number of RSUs, PSUs and SOs related to the Stock Incentive Plan during the period of 2022 to 2024 is as follows.
RSUs |
|
2024 |
|
|
2023 |
|
|
2022 |
|
|||
Weighted average fair value at grant date |
|
$ |
112.16 |
|
|
$ |
91.81 |
|
|
$ |
87.56 |
|
|
|
|
|
|
|
|
|
|
|
|||
Outstanding at beginning of year |
|
|
189,966 |
|
|
|
200,764 |
|
|
|
218,268 |
|
Granted |
|
|
64,601 |
|
|
|
96,243 |
|
|
|
85,985 |
|
Shares issued |
|
|
(75,068 |
) |
|
|
(94,055 |
) |
|
|
(84,848 |
) |
Cancelled/Forfeited/Expired |
|
|
(5,352 |
) |
|
|
(12,986 |
) |
|
|
(18,641 |
) |
Outstanding at end of year |
|
|
174,147 |
|
|
|
189,966 |
|
|
|
200,764 |
|
The aggregate intrinsic value for RSUs outstanding at December 31, 2024 was approximately $16 million.
PSUs |
|
2024 |
|
|
2023 |
|
|
2022 |
|
|||
Weighted average fair value at grant date |
|
$ |
109.41 |
|
|
$ |
91.80 |
|
|
$ |
88.05 |
|
|
|
|
|
|
|
|
|
|
|
|||
Outstanding at beginning of year |
|
|
111,881 |
|
|
|
101,828 |
|
|
|
179,311 |
|
Change in performance conditions |
|
|
147,022 |
|
|
|
18,211 |
|
|
|
(69,924 |
) |
Granted |
|
|
79,712 |
|
|
|
93,962 |
|
|
|
82,914 |
|
Shares issued |
|
|
(49,509 |
) |
|
|
(26,331 |
) |
|
|
(64,397 |
) |
Cancelled/Forfeited/Expired |
|
|
(9,801 |
) |
|
|
(75,789 |
) |
|
|
(26,076 |
) |
Outstanding at end of year |
|
|
279,305 |
|
|
|
111,881 |
|
|
|
101,828 |
|
The PSUs granted include assumptions regarding the ultimate number of shares that will be issued based on the probability of achievement of the performance conditions. Changes in those assumptions result in changes in the estimated shares to be issued which is reflected in the “Change in performance conditions” line above.
SOs |
|
Number |
|
|
Weighted |
|
||
Outstanding at December 31, 2021 |
|
|
49,875 |
|
|
|
68.71 |
|
Exercised |
|
|
(8,614 |
) |
|
|
59.28 |
|
Cancelled/Forfeited/Expired |
|
|
(10,150 |
) |
|
|
70.40 |
|
Outstanding at December 31, 2022 |
|
|
31,111 |
|
|
|
70.77 |
|
Exercised |
|
|
(15,537 |
) |
|
|
65.12 |
|
Cancelled/Forfeited/Expired |
|
|
(485 |
) |
|
|
58.63 |
|
Outstanding at December 31, 2023 |
|
|
15,089 |
|
|
|
76.97 |
|
Exercised |
|
|
(10,777 |
) |
|
|
76.53 |
|
Cancelled/Forfeited/Expired |
|
|
(915 |
) |
|
|
69.41 |
|
Outstanding at December 31, 2024 |
|
|
3,397 |
|
|
|
80.40 |
|
|
|
|
|
|
|
|
||
OPTIONS EXERCISABLE |
|
|
|
|
|
|
||
At December 31, 2022 |
|
|
31,111 |
|
|
$ |
70.77 |
|
At December 31, 2023 |
|
|
15,089 |
|
|
|
76.97 |
|
At December 31, 2024 |
|
|
3,397 |
|
|
|
80.40 |
|
78
The following summarizes information about SOs outstanding and exercisable at December 31, 2024:
EXERCISE PRICE |
|
Number |
|
|
Remaining |
|
|
Weighted |
|
|||
$80.40 |
|
|
3,397 |
|
|
|
0.13 |
|
|
|
80.40 |
|
|
|
|
3,397 |
|
|
|
0.13 |
|
|
|
80.40 |
|
The total aggregate intrinsic value, which is the difference between the exercise price and $92.98 (closing price per share at December 31, 2024), for all “in the money” SOs, both outstanding and exercisable as of December 31, 2024, was immaterial.
18. Contingent Liabilities
LEGAL PROCEEDINGS
Various claims, lawsuits and proceedings are pending or threatened against the Company or its subsidiaries, covering a range of matters that arise in the ordinary course of its business activities with respect to commercial, product liability and other matters. Litigation is subject to many uncertainties, and the outcome of any litigation cannot be assured. After discussions with counsel, and with the exception of losses resulting from the antitrust proceedings described below, it is the opinion of management that the various legal proceedings and investigations to which the Company currently is a party will not have a material adverse impact on the consolidated financial position of Autoliv, but the Company cannot provide assurance that Autoliv will not experience material litigation, product liability or other losses in the future.
ANTITRUST MATTERS
Authorities in several jurisdictions have conducted broad, and in some cases, long-running investigations of suspected anti-competitive behavior among parts suppliers in the global automotive vehicle industry. These investigations included, but are not limited to, the products that the Company sells. In addition to concluded matters, authorities of other countries, with significant light vehicle manufacturing or sales may initiate similar investigations. As a result of the outcome of the European Commission investigation of anti-competitive behavior among suppliers of occupant safety systems that the Company resolved in 2019 (the "EC investigation"), the Company is subject to multiple subsequent civil disputes with non-governmental third parties stemming from the same facts and circumstances underlying the EC investigation. The Company is involved in civil litigation in the UK and Germany with respect to alleged anti-competitive behavior that occurred over a decade ago.
The trial associated with the lawsuit in the UK recently concluded and a ruling in the proceeding is expected imminently. The Company believes the allegations in the UK are unfounded. An unfavorable outcome could have a material adverse impact on our customer relationships, business prospects, reputation, operating results, cash flows or financial condition, and our insurance would likely not mitigate such impact. The Company cannot predict the ultimate outcome of such dispute and is unable to estimate the loss or a range of loss, or predict the reporting periods in which any such loss may be recorded.
On October 31, 2024, BMW filed a complaint against the Company in Germany claiming damages of €63 million plus interest (for a total claim of approximately €95 million) related to the conduct at issue in the EC investigation (the "BMW Complaint"). BMW is one of two European OEMs for which the Company pled guilty in 2017 in relation to the EC investigation. The Company has a period of six months to respond to the complaint and is currently assessing the viability of the complaint. The Company has determined pursuant to ASC 450 that a loss is reasonably possible with respect to the BMW Complaint. However, the Company continues to evaluate this matter, no accrual has been made, and the estimated range of potential loss is between €0 and €95 million. The Company cannot predict the ultimate outcome of the BMW Complaint.
This dispute could result in significant expenses as well as an unfavorable outcome that could have a material adverse impact on our customer relationships, business prospects, reputation, operating results, cash flows or financial condition, and our insurance would likely not mitigate such impact. The Company cannot predict the duration, scope, or ultimate outcome of any such disputes.
79
PRODUCT WARRANTY, RECALLS AND INTELLECTUAL PROPERTY
Autoliv is exposed to various claims for damages and compensation if its products fail to perform as expected. Such claims can be made, and result in costs and other losses to the Company, even where the product is eventually found to have functioned properly. Where a product (actually or allegedly) fails to perform as expected or is defective, the Company may face warranty and recall claims. Where such (actual or alleged) failure or defect results, or is alleged to result, in bodily injury and/or property damage, the Company may also face product liability and other claims. There can be no assurance that the Company will not experience material warranty, recall or product (or other) liability claims or losses in the future, or that the Company will not incur significant costs to defend against such claims. The Company may be required to participate in a recall involving its products. Each vehicle manufacturer has its own practices regarding product recalls and other product liability actions relating to its suppliers. As suppliers become more integrally involved in the vehicle design process and assume more of the vehicle assembly functions, vehicle manufacturers are increasingly looking to their suppliers for contribution when faced with recalls and product liability claims. Government safety regulators may also play a role in warranty and recall practices. Recall decisions regarding the Company’s products may require a significant amount of judgment by us, our customers and safety regulators and are influenced by a variety of factors. Once a recall has been made, the cost of a recall is also subject to a significant amount of judgment and discussions between the Company and its customers. A warranty, recall or product-liability claim brought against the Company in excess of its insurance may have a material adverse effect on the Company’s business. Vehicle manufacturers are also increasingly requiring their outside suppliers to guarantee or warrant their products and bear the costs of repair and replacement of such products under new vehicle warranties. A vehicle manufacturer may attempt to hold the Company responsible for some, or all, of the repair or replacement costs of products when the product supplied did not perform as represented by us or expected by the customer in either a warranty or a recall situation. Accordingly, the future costs of warranty or recall claims by the customers may be material. However, the Company believes its established reserves are adequate. Autoliv’s warranty reserves are based upon the Company’s best estimates of amounts necessary to settle future and existing claims. The Company regularly evaluates the adequacy of these reserves, and adjusts them when appropriate. However, the final amounts actually due related to these matters could differ materially from the Company’s recorded estimates.
In addition, as vehicle manufacturers increasingly use global platforms and procedures, quality performance evaluations are also conducted on a global basis. Any one or more quality, warranty or other recall issue(s) (including those affecting few units and/or having a small financial impact) may cause a vehicle manufacturer to implement measures such as a temporary or prolonged suspension of new orders, which may have a material impact on the Company’s results of operations.
The Company maintains a program of insurance, which may include commercial insurance, self-insurance, or a combination of both approaches, for potential recall and product liability claims in amounts and on terms that it believes are reasonable and prudent based on our prior claims experience. The Company’s insurance policies generally include coverage of the costs of a recall, although costs related to replacement parts are generally not covered. In addition, a number of the agreements entered into by the Company, including the Spin-off Agreements, require Autoliv to indemnify the other parties for certain claims. Autoliv cannot assure that the level of coverage will be sufficient to cover every possible claim that can arise in our businesses or with respect to other obligations, now or in the future, or that such coverage always will be available should we, now or in the future, wish to extend, increase or otherwise adjust our insurance.
As noted in Note 13 above, as of December 31, 2024, the Company has accrued $65 million for total product related liabilities. The majority of the total product liability accrual as of December 31, 2024, relates to recalls, which are generally covered by insurance. Insurance receivables for such recall related liabilities total $54 million as of December 31, 2024.
Product Liability:
Autoliv and some of its subsidiaries have been named as one of several defendants in a consolidated class action lawsuit in a multi-district litigation (In Re: ARC Airbag Inflators Products Liability Litigation MDL, No. 3051) in the Northern District of Georgia. The plaintiffs in the multi-district litigation (the "ARC Inflator Class Action") brought claims for fraud, breach of warranty, and violations of consumer protection and trade practices stemming from ARC inflators included in airbag modules that Autoliv or its subsidiaries allegedly supplied after Autoliv acquired certain Delphi assets (the “Delphi Acquisition”) in December 2009. The Company denies these allegations. Autoliv is not aware of any performance issues regarding ARC inflators included with its airbags at the directions of its customers that it shipped following the Delphi Acquisition. The proceedings remain ongoing. The Company has determined pursuant to ASC 450 that a loss is reasonably possible with respect to the ARC Inflator Class Action. However, the Company continues to evaluate this matter, no accrual has been made, and no estimated range of potential loss can be determined at this time. The Company cannot predict the ultimate outcome of the ARC Inflator Class Action.
On September 5, 2023, the National Highway Traffic Safety Administration (“NHTSA”) issued an initial decision to recall approximately 52 million frontal driver and passenger airbag inflators manufactured by ARC and Delphi Automotive Systems because NHTSA determined that the airbag inflators contain a safety defect resulting in field ruptures. Some of the ARC inflators included in the airbag modules that Autoliv or its subsidiaries supplied after the Delphi Acquisition were included in such initial decision. NHTSA has yet to release its final decision. If NHTSA's final decision results in a recall, it is anticipated that such decision will be challenged in US federal court. The Company has determined pursuant to ASC 450 that a loss is reasonably possible with respect to the NHTSA ARC recall. However, the Company continues to evaluate this matter, no accrual has been made, and no estimated range of potential loss can be determined at this time. The Company cannot predict the ultimate outcome of the NHTSA ARC recall.
Specific Recalls:
In the fourth quarter of 2020, the Company was made aware of a potential recall by American Honda Motor Co. and the recall of approximately 449,000 vehicles relating to the malfunction of front seat belt buckles was announced on March 9, 2023 (the “Honda Buckle Recall”). The Company determined pursuant to ASC 450 that a loss with respect to the Honda Buckle Recall is probable and accrued an amount that is reflected in the total product liability accrual in the fourth quarter of 2020, increased the accrual in the fourth quarter of 2021, and reduced the accrual in the fourth quarter of 2023 based on vehicle repair cost data.
80
Following the accrual increase in the third quarter of 2024, the amount by which the product liability accrual exceeds the product liability insurance receivable with respect to the Honda Buckle Recall is approximately $12 million and includes self-insurance retention costs and deductibles. The ultimate loss to the Company of the Honda Buckle Recall could be materially different from the amount the Company has accrued.
Volvo Car USA, LLC (together with its affiliates, “Volvo”) has recalled approximately 762,000 vehicles relating to the malfunction of inflators produced by ZF (the “ZF Inflator Recall”). The recalled ZF inflators were included in airbag modules supplied by the Company only to Volvo. The recall commenced in November 2020 and later expanded in September 2021. Because the Company’s airbags were involved with the ZF Inflator Recall, the Company has determined pursuant to ASC 450 that a loss is reasonably possible with respect to the ZF Inflator Recall. The Company continues to evaluate this matter with Volvo and ZF and no accrual has been made. Although the Company currently estimates a range of $0 to $43 million with respect to this potential loss, the Company anticipates that any losses net of insurance claims and claims against ZF will be immaterial.
Intellectual property:
In its products, the Company utilizes technologies which may be subject to intellectual property rights of third parties. While the Company does seek to procure the necessary rights to utilize intellectual property rights associated with its products, it may fail to do so. Where the Company so fails, the Company may be exposed to material claims from the owners of such rights. Where the Company has sold products which infringe upon such rights, its customers may be entitled to be indemnified by the Company for the claims they suffer as a result thereof. Such claims could be material.
The table in Note 13 above summarizes the change in the balance sheet position of the product related liabilities for the fiscal year ended December 31, 2024.
19. Retirement Plans
DEFINED CONTRIBUTION PLANS
Many of the Company’s employees are covered by government sponsored pension and welfare programs. Under the terms of these programs, the Company makes periodic payments to various government agencies. In addition, in some countries the Company sponsors or participates in certain non-governmental defined contribution plans. Contributions to defined contribution plans for the years ended December 31, 2024, 2023 and 2022 were $25 million, $26 million, and $24 million, respectively.
MULTIEMPLOYER PLANS
The Company participates in a multiemployer plan in Sweden. This ITP-2 plan is funded through Alecta and covers employees born before 1979, for whom it provides a final pay pension benefit based on all service with participating employers. The Company must pay for wage increases in excess of inflation on service earned with previous employers. The plan also provides disability and family benefits and is more than 100% funded. The Company´s contributions to this multiemployer plan for the years ended December 31, 2024, 2023 and 2022 were $4 million, $4 million and $6 million, respectively.
DEFINED BENEFIT PLANS
The Company has a number of defined benefit pension plans, both contributory and non-contributory, in the U.S., France, Germany, India, Japan, Mexico, Philippines, Poland, Sweden, South Korea, Thailand, Turkey and the United Kingdom. There are funded as well as unfunded plan arrangements which provide retirement benefits to both U.S. and non-U.S. participants.
The main plan is the U.S. plan for which the benefits are based on an average of the employee’s earnings and on credited service earned through December 31, 2021. In a prior year, the Company closed participation in the Autoliv ASP, Inc. Pension Plan to exclude those employees hired after December 31, 2003. Within the U.S. there is also a non-qualified restoration plan that provides benefits to employees whose benefits in the primary U.S. plan are restricted by limitations on the compensation that can be considered in calculating their benefits. Effective December 31, 2021, the Autoliv ASP, Inc. Pension Plan is frozen to new accruals and, by extension, the non-qualified restoration plan is also frozen. Settlement accounting has been recognized each quarter in 2024, 2023 and 2022 for the U.S. plans because the lump-sum payments made to plan participants during 2024, 2023 and 2022 exceeded the sum of service cost and interest cost.
For the Company’s non-U.S. defined benefit plans the most significant individual plan is in the U.K. The Company has closed participation in the U.K. defined benefit plan to exclude all employees hired after April 30, 2003 with few members currently accruing benefits.
81
CHANGES IN BENEFIT OBLIGATIONS AND PLAN ASSETS FOR THE YEARS ENDED DECEMBER 31
|
|
U.S. |
|
|
Non-U.S. |
|
||||||||||
(Dollars in millions) |
|
2024 |
|
|
2023 |
|
|
2024 |
|
|
2023 |
|
||||
Benefit obligation at beginning of year |
|
$ |
226 |
|
|
$ |
227 |
|
|
$ |
208 |
|
|
$ |
192 |
|
Service cost |
|
|
— |
|
|
|
— |
|
|
|
10 |
|
|
|
9 |
|
Interest cost |
|
|
11 |
|
|
|
12 |
|
|
|
12 |
|
|
|
10 |
|
Actuarial (gain) loss due to: |
|
|
|
|
|
|
|
|
|
|
|
|
||||
Change in discount rate |
|
|
(7 |
) |
|
|
5 |
|
|
|
(1 |
) |
|
|
(22 |
) |
Experience |
|
|
(1 |
) |
|
|
2 |
|
|
|
6 |
|
|
|
(1 |
) |
Other assumption changes |
|
|
(8 |
) |
|
|
2 |
|
|
|
3 |
|
|
|
24 |
|
Benefits paid |
|
|
(4 |
) |
|
|
(4 |
) |
|
|
(7 |
) |
|
|
(10 |
) |
Plan settlements/curtailments |
|
|
(12 |
) |
|
|
(17 |
) |
|
|
(9 |
) |
|
|
(2 |
) |
Plan amendments |
|
|
— |
|
|
|
— |
|
|
|
— |
|
|
|
1 |
|
Other |
|
|
— |
|
|
|
— |
|
|
|
0 |
|
|
|
0 |
|
Translation difference |
|
|
— |
|
|
|
— |
|
|
|
(17 |
) |
|
|
7 |
|
Benefit obligation at end of year |
|
$ |
205 |
|
|
$ |
226 |
|
|
$ |
205 |
|
|
$ |
208 |
|
|
|
|
|
|
|
|
|
|
|
|
|
|
||||
Fair value of plan assets at beginning of year |
|
$ |
204 |
|
|
$ |
201 |
|
|
$ |
70 |
|
|
$ |
63 |
|
Actual return on plan assets |
|
|
3 |
|
|
|
24 |
|
|
|
(4 |
) |
|
|
3 |
|
Company contributions |
|
|
2 |
|
|
|
0 |
|
|
|
27 |
|
|
|
11 |
|
Benefits paid |
|
|
(4 |
) |
|
|
(4 |
) |
|
|
(7 |
) |
|
|
(10 |
) |
Plan settlements |
|
|
(12 |
) |
|
|
(17 |
) |
|
|
(20 |
) |
|
|
(0 |
) |
Translation difference |
|
|
— |
|
|
|
— |
|
|
|
(2 |
) |
|
|
3 |
|
Fair value of plan assets at end of year |
|
$ |
194 |
|
|
$ |
204 |
|
|
$ |
64 |
|
|
$ |
70 |
|
Pension liability recognized in the balance sheet |
|
$ |
11 |
|
|
$ |
21 |
|
|
$ |
142 |
|
|
$ |
138 |
|
The U.S. plan provides that benefits may be paid in the form of a lump sum, if so elected by the participant. In order to more accurately reflect a market-derived pension obligation, Autoliv adjusts the assumed lump sum interest rate to reflect market conditions as of each December 31. This methodology is consistent with the approach required under the Pension Protection Act of 2006, which provides the rules for determining minimum funding requirements in the U.S.
COMPONENTS OF NET PERIODIC BENEFIT COST ASSOCIATED WITH THE DEFINED BENEFIT RETIREMENT PLANS FOR THE YEARS ENDED DECEMBER 31
|
|
U.S. |
|
|||||||||
(Dollars in millions) |
|
2024 |
|
|
2023 |
|
|
2022 |
|
|||
Service cost |
|
$ |
— |
|
|
$ |
— |
|
|
$ |
— |
|
Interest cost |
|
|
11 |
|
|
|
12 |
|
|
|
12 |
|
Expected return on plan assets |
|
|
(12 |
) |
|
|
(10 |
) |
|
|
(14 |
) |
Amortization of actuarial loss |
|
|
0 |
|
|
|
0 |
|
|
|
0 |
|
Settlement loss |
|
|
1 |
|
|
|
1 |
|
|
|
6 |
|
Net periodic benefit cost |
|
$ |
(0 |
) |
|
$ |
3 |
|
|
$ |
4 |
|
|
|
Non-U.S. |
|
|||||||||
(Dollars in millions) |
|
2024 |
|
|
2023 |
|
|
2022 |
|
|||
Service cost |
|
$ |
10 |
|
|
$ |
9 |
|
|
$ |
9 |
|
Interest cost |
|
|
12 |
|
|
|
10 |
|
|
|
6 |
|
Expected return on plan assets |
|
|
(3 |
) |
|
|
(3 |
) |
|
|
(2 |
) |
Amortization of prior service costs |
|
|
1 |
|
|
|
1 |
|
|
|
1 |
|
Amortization of actuarial loss |
|
|
1 |
|
|
|
1 |
|
|
|
1 |
|
Settlement/curtailment (gain) loss |
|
|
14 |
|
|
|
0 |
|
|
|
(8 |
) |
Net periodic benefit cost |
|
$ |
34 |
|
|
$ |
18 |
|
|
$ |
7 |
|
The service cost and amortization of prior service cost components are reported among other employee compensation costs in the Consolidated Statements of Income. The remaining components, interest cost, expected returns on plan assets, amortization of actuarial loss and settlement/curtailment gains (losses), are reported as Other non-operating items, net in the Consolidated Statements of Income.
Amortization of the net actuarial loss from accumulated other comprehensive income is made over the estimated average remaining lifetime of the plan participants (27 to 31 years) for the U.S. plans, and the estimated average remaining service lives or lifetimes of the plan participants for the non-U.S. plans, the periods varying over a wide range between the different countries depending on the age of the population concerned.
82
COMPONENTS OF ACCUMULATED OTHER COMPREHENSIVE LOSS BEFORE TAX AS OF DECEMBER 31
|
|
U.S. |
|
|
Non-U.S. |
|
||||||||||
(Dollars in millions) |
|
2024 |
|
|
2023 |
|
|
2024 |
|
|
2023 |
|
||||
Net actuarial loss |
|
$ |
7 |
|
|
$ |
15 |
|
|
$ |
29 |
|
|
$ |
19 |
|
Prior service cost |
|
|
— |
|
|
|
— |
|
|
|
3 |
|
|
|
4 |
|
Total accumulated other comprehensive loss |
|
$ |
7 |
|
|
$ |
15 |
|
|
$ |
33 |
|
|
$ |
24 |
|
CHANGES IN ACCUMULATED OTHER COMPREHENSIVE LOSS BEFORE TAX FOR THE YEARS ENDED DECEMBER 31
|
|
U.S. |
|
|
Non-U.S. |
|
||||||||||
(Dollars in millions) |
|
2024 |
|
|
2023 |
|
|
2024 |
|
|
2023 |
|
||||
Total retirement benefit recognized in accumulated |
|
$ |
15 |
|
|
$ |
22 |
|
|
$ |
24 |
|
|
$ |
22 |
|
Net actuarial loss (gain) |
|
|
(7 |
) |
|
|
(6 |
) |
|
|
16 |
|
|
|
2 |
|
Amortization or curtailment recognition of prior service credit (cost) |
|
|
— |
|
|
|
— |
|
|
|
(1 |
) |
|
|
(1 |
) |
Amortization or settlement recognition of net gain (loss) |
|
|
(1 |
) |
|
|
(1 |
) |
|
|
(4 |
) |
|
|
(1 |
) |
Translation difference |
|
|
— |
|
|
|
— |
|
|
|
(2 |
) |
|
|
2 |
|
Total retirement benefit recognized in accumulated |
|
$ |
7 |
|
|
$ |
15 |
|
|
$ |
33 |
|
|
$ |
24 |
|
The accumulated benefit obligation for the U.S. non-contributory defined benefit pension plans was $205 million and $226 million at December 31, 2024 and 2023, respectively. The accumulated benefit obligation for the non-U.S. defined benefit pension plans was $161 million and $173 million at December 31, 2024 and 2023, respectively.
Pension plans for which the accumulated benefit obligation (ABO) is notably in excess of the plan assets reside in the following countries: U.S., Mexico, France, Germany, Japan, South Korea, Sweden, Thailand and Turkey.
PENSION PLANS FOR WHICH ABO EXCEEDS THE FAIR VALUE OF PLAN ASSETS AS OF DECEMBER 31
|
|
U.S. |
|
|
Non-U.S. |
|
||||||||
(Dollars in millions) |
|
2024 |
|
2023 |
|
|
2024 |
|
2023 |
|
||||
Projected Benefit Obligation (PBO) |
|
$ |
205 |
|
$ |
226 |
|
|
$ |
148 |
|
$ |
145 |
|
Accumulated Benefit Obligation (ABO) |
|
|
205 |
|
|
226 |
|
|
|
110 |
|
|
116 |
|
Fair value of plan assets |
|
|
194 |
|
|
204 |
|
|
|
2 |
|
|
2 |
|
The Company, in consultation with its actuarial advisors, determines certain key assumptions to be used in calculating the projected benefit obligation and annual net periodic benefit cost.
ASSUMPTIONS USED TO DETERMINE THE BENEFIT OBLIGATIONS AS OF DECEMBER 31
|
|
U.S. |
|
|
Non-U.S.1) |
|||||||
(% Weighted average / % Weighted average range) |
|
2024 |
|
|
2023 |
|
|
2024 |
|
2023 |
||
Discount rate |
|
|
5.60 |
|
|
|
5.13 |
|
|
1.25-11.00 |
|
1.00-10.25 |
Rate of increases in compensation level |
|
n/a |
|
|
n/a |
|
|
2.25-5.00 |
|
2.25-5.00 |
||
1) The % weighted average ranges in the tables above represent significant non-U.S. plans only.
ASSUMPTIONS USED TO DETERMINE THE NET PERIODIC BENEFIT COST FOR THE YEARS ENDED DECEMBER 31
|
|
U.S. |
|
|||||||||
(% Weighted average) |
|
2024 |
|
|
2023 |
|
|
2022 |
|
|||
Discount rate |
|
|
5.13 |
|
|
|
5.41 |
|
|
|
2.77 |
|
Rate of increases in compensation level |
|
n/a |
|
|
n/a |
|
|
n/a |
|
|||
Expected long-term rate of return on assets |
|
|
6.21 |
|
|
|
5.05 |
|
|
|
5.05 |
|
|
|
Non-U.S.1) |
||||
(% Weighted average range) |
|
2024 |
|
2023 |
|
2022 |
Discount rate |
|
1.00-10.25 |
|
0.75-9.75 |
|
0.25-8.00 |
Rate of increases in compensation level |
|
2.25-5.00 |
|
2.10-5.00 |
|
1.80-5.00 |
Expected long-term rate of return on assets |
|
4.00-4.95 |
|
4.20-4.80 |
|
1.70-2.20 |
1) The % weighted average ranges in the tables above represent significant non-U.S. plans only.
83
The discount rate for the U.S. plans has been set based on the rates of return on high-quality fixed-income investments currently available at the measurement date and expected to be available during the period the benefits will be paid. The expected timing of cash flows from the plan has also been considered in selecting the discount rate. In particular, the yields on bonds rated AA or better on the measurement date have been used to set the discount rate. The discount rate for the U.K. plan has been set based on the weighted average yields on long-term high-grade corporate bonds and is determined by reference to financial markets on the measurement date.
The expected rate of increase in compensation levels and long-term rate of return on plan assets are determined based on a number of factors and must take into account long-term expectations and reflect the financial environment in the respective local market. The expected return on assets for the U.S. and U.K. plans are based on the fair value of the assets as of December 31.
The level of equity exposure is currently targeted at approximately 32% for the primary U.S. plan. The investment objective is to provide an attractive risk-adjusted return that will ensure the payment of benefits while protecting against the risk of substantial investment losses. Correlations among the asset classes are used to identify an asset mix that Autoliv believes will provide the most attractive returns. Long-term return forecasts for each asset class using historical data and other qualitative considerations to adjust for projected economic forecasts are used to set the expected rate of return for the entire portfolio. The Company has assumed a long-term rate of return on the U.S. plan assets of 6.21% for calculating the 2024 expense.
The Company has assumed a long-term rate of return on the non-U.S. plan assets in a range of 4.00-4.95% for 2024. The closed U.K. plan, which has a targeted allocation of almost 100% debt instruments, accounts for approximately 74% of the total non-U.S. plan assets.
Autoliv made contributions to the U.S. plans during 2024 and 2023 amounting to $2 million and $0 million, respectively. Contributions to the U.K plan during 2024 and 2023 amounted to $2 million and $2 million, respectively. The Company's expected contributions to its U.S. pension plans in 2025 and the years thereafter are immaterial. For the U.K. pension plan, which is the most significant non-U.S. plan, the Company expects to contribute $2 million in 2025 and in the years thereafter.
FAIR VALUE OF TOTAL PLAN ASSETS FOR THE YEARS ENDED DECEMBER 31
|
|
U.S. |
|
|
U.S. |
|
|
Non-U.S. |
|
|||||||||
ASSETS CATEGORY (% Weighted average) |
|
Target |
|
|
2024 |
|
2023 |
|
|
2024 |
|
2023 |
|
|||||
Equity securities % |
|
|
32 |
|
|
|
30 |
|
|
31 |
|
|
|
0 |
|
|
0 |
|
Debt instruments % |
|
|
68 |
|
|
|
69 |
|
|
68 |
|
|
|
63 |
|
|
64 |
|
Other assets % |
|
|
— |
|
|
|
1 |
|
|
1 |
|
|
|
37 |
|
|
36 |
|
Total % |
|
|
100 |
|
|
|
100 |
|
|
100 |
|
|
|
100 |
|
|
100 |
|
The following table summarizes the fair value of the Company’s U.S. and non-U.S. defined benefit pension plan assets:
|
|
Fair value measurement at December 31, |
|
|||||
(Dollars in millions) |
|
2024 |
|
|
2023 |
|
||
Assets |
|
|
|
|
|
|
||
Non-U.S. Bonds |
|
|
|
|
|
|
||
Government |
|
$ |
21 |
|
|
$ |
24 |
|
Corporate |
|
|
20 |
|
|
|
21 |
|
Insurance Contracts |
|
|
15 |
|
|
|
17 |
|
Other Investments |
|
|
6 |
|
|
|
10 |
|
Assets at fair value Level 2 |
|
|
62 |
|
|
|
71 |
|
Investments measured at net asset value |
|
|
|
|
|
|
||
Common collective trusts |
|
|
195 |
|
|
|
203 |
|
Total |
|
|
258 |
|
|
$ |
274 |
|
The fair value measurement level within the fair value hierarchy is based on the lowest level of any input that is significant to the fair value measurement. Certain assets that are measured at fair value using the NAV per share (or its equivalent) practical expedient have not been classified in the fair value hierarchy. Plan assets not measured using the NAV are classified as Level 2 in the table above. Plan assets measured using the NAV mainly relate to the U.S. defined benefit pension plans and are separately disclosed as Common collective trusts below the Level 2 assets in the table above.
84
The estimated future benefit payments for the pension benefits reflect expected future service, as appropriate. The amount of benefit payments in a given year may vary from the projected amount, especially for the U.S. plan since historically this plan pays the majority of benefits as a lump sum, where the lump sum amounts vary with market interest rates.
PENSION BENEFITS EXPECTED PAYMENTS (dollars in millions) |
|
U.S. |
|
|
Non-U.S. |
|
||
2025 |
|
$ |
17 |
|
|
$ |
15 |
|
2026 |
|
|
19 |
|
|
|
12 |
|
2027 |
|
|
17 |
|
|
|
14 |
|
2028 |
|
|
19 |
|
|
|
14 |
|
2029 |
|
|
18 |
|
|
|
14 |
|
Years 2030-2034 |
|
|
84 |
|
|
|
85 |
|
POSTRETIREMENT BENEFITS OTHER THAN PENSIONS
The Company currently provides postretirement health care and life insurance benefits to a limited group of U.S. retirees.
In general, the terms of the plans provide that U.S. employees who retire after attaining age 55, with 15 years of service (5 years before December 31, 2006), are reimbursed for qualified medical expenses up to a maximum annual amount. Spouses for certain retirees are also eligible for reimbursement under the plan. Life insurance coverage is available for those who elect coverage under the retiree health plan. During 2014, the plan was amended to move from a self-insured model where employees were charged an estimated premium based on anticipated plan expenses for continued coverage, to a plan where retirees are provided a fixed contribution to a Health Retirement Account (HRA). Retirees can use the HRA funds to purchase insurance through a private exchange. Employees hired on or after January 1, 2004 are not eligible to participate in the plan.
As of December 31, 2024 and 2023, the benefit obligation for postretirement benefit plans other than pensions were $12 million and $13 million, respectively. The liability for postretirement benefits other than pensions is classified as other non-current liabilities in the balance sheet. The components of the net periodic benefit costs associated with these plans were immaterial for the years 2024, 2023 and 2022.
The average discount rate used to determine the U.S. postretirement benefit obligation was 5.73% in 2024 and 5.16% in 2023. The average discount rate used in determining the postretirement benefit cost was 5.16% in 2024, 5.39% in 2023 and 2.91% in 2022.
The accumulated other comprehensive income before tax associated with the postretirement benefit plans other than pensions recognized in the balance sheet as of December 31, 2024 and 2023 were $6 million and $6 million, respectively. The accumulated other comprehensive income consisted only of a net actuarial gain component for the years 2024 and 2023.
The estimated future benefit payments for the postretirement benefits, which reflect expected future service as appropriate, are expected to be immaterial for all the future years.
20. Segment Information
The Company has a single operating and reportable segment which includes Autoliv’s airbag and steering wheels and seatbelt products and components. The determination of a single operating segment is consistent with the consolidated financial information regularly provided to the Company’s chief operating decision maker (“CODM”).
The Company’s CEO, as the CODM, uses consolidated, single-segment financial information for purposes of evaluating performance, making operating decisions and allocating resources.
The Company’s customers consist of all major European, U.S. and Asian automobile manufacturers. Sales to individual customers representing 10% or more of net sales were:
In 2024: No individual customer representing 10% or more.
In 2023: Renault 10% (including Nissan and Mitsubishi) and Stellantis 10%.
In 2022: Renault 11% (including Nissan and Mitsubishi), Stellantis 11% and VW 10%.
NET SALES BY REGION (Dollars in millions) |
|
2024 |
|
|
2023 |
|
|
2022 |
|
|||
China |
|
$ |
2,010 |
|
|
$ |
2,105 |
|
|
$ |
1,883 |
|
Asia, excl. China |
|
|
2,010 |
|
|
|
1,968 |
|
|
|
1,638 |
|
Americas |
|
|
3,424 |
|
|
|
3,526 |
|
|
|
2,967 |
|
Europe |
|
|
2,946 |
|
|
|
2,877 |
|
|
|
2,355 |
|
Total |
|
$ |
10,390 |
|
|
$ |
10,475 |
|
|
$ |
8,842 |
|
The Company has attributed net sales to the geographic area based on the location of the entity selling the final product.
85
External sales in the U.S. amounted to $2,075 million, $2,342 million and $2,029 million in 2024, 2023 and 2022, respectively. Of the external sales, exports from the U.S. to other regions amounted to approximately $292 million, $343 million and $298 million in 2024, 2023 and 2022, respectively.
NET SALES BY PRODUCT (Dollars in millions) |
|
2024 |
|
|
2023 |
|
|
2022 |
|
|||
Airbag, Steering Wheels1) |
|
$ |
7,023 |
|
|
$ |
7,055 |
|
|
$ |
5,807 |
|
Seatbelt Products1) |
|
|
3,367 |
|
|
|
3,420 |
|
|
|
3,035 |
|
Total net sales |
|
$ |
10,390 |
|
|
$ |
10,475 |
|
|
$ |
8,842 |
|
1) Including Corporate and Other sales.
LONG-LIVED ASSETS (Dollars in millions) |
|
2024 |
|
|
2023 |
|
||
China |
|
$ |
621 |
|
|
$ |
592 |
|
Asia, excl China |
|
|
438 |
|
|
|
408 |
|
Americas |
|
|
541 |
|
|
|
570 |
|
Europe |
|
|
797 |
|
|
|
797 |
|
Total |
|
$ |
2,397 |
|
|
$ |
2,367 |
|
Long -lived assets in the table above consists of Property, Plant and Equipment and Operating Lease right-of-use asset. Long-lived assets in the U.S. amounted to $272 million and $261 million for 2024 and 2023, respectively.
The CODM assesses the Company's performance and decides how to allocate resources based on consolidated net income (loss) in the Consolidated Statements of Income, which is assessed to be the segment measure of profit or loss. This measure is used to monitor actual results to evaluate the performance of the segment versus the strategic targets. The segment assets are equal to the assets presented in the Consolidated Balance Sheets.
The significant expenses that are regularly provided to the CODM are disclosed in the Consolidated Statements of Net Income as a part of the consolidated net income and are as follows.
Significant segment expenses / income (Dollars in millions) |
|
2024 |
|
|
2023 |
|
|
2022 |
|
|||
Total direct costs |
|
$ |
(7,050 |
) |
|
$ |
(7,208 |
) |
|
$ |
(6,142 |
) |
Total production overhead costs |
|
|
(1,413 |
) |
|
|
(1,446 |
) |
|
|
(1,304 |
) |
Cost of sales |
|
|
(8,463 |
) |
|
|
(8,654 |
) |
|
|
(7,446 |
) |
|
|
|
|
|
|
|
|
|
|
|||
Research, development and engineering expenses (gross) |
|
|
(612 |
) |
|
|
(618 |
) |
|
|
(595 |
) |
Engineering income |
|
|
214 |
|
|
|
193 |
|
|
|
205 |
|
Research, development and engineering expenses, net |
|
|
(398 |
) |
|
|
(425 |
) |
|
|
(390 |
) |
Our other significant segment items that are regularly provided to the CODM include selling, general and administrative expenses, and other income (expense) which are disclosed as separate line items in the Consolidated Statements of Income. Other expenses consist of Income from equity method investments, Interest income, Interest expense, Other non-operating items, net and Income taxes, which are disclosed as separate line items in the Consolidated Statement of income.
21. Earnings Per Share
The computation of basic and diluted earnings per share were as follows (dollars and shares in millions):
|
|
2024 |
|
|
2023 |
|
|
2022 |
|
|||
Numerator: |
|
|
|
|
|
|
|
|
|
|||
Basic and diluted: |
|
|
|
|
|
|
|
|
|
|||
Net income attributable to common shareholders |
|
$ |
646 |
|
|
$ |
488 |
|
|
$ |
423 |
|
Denominator: |
|
|
|
|
|
|
|
|
|
|||
Basic weighted average common stock |
|
|
80.2 |
|
|
|
85.0 |
|
|
|
87.1 |
|
Added: Weighted average stock options/share awards |
|
|
0.2 |
|
|
|
0.2 |
|
|
|
0.2 |
|
Diluted weighted average common stock |
|
|
80.4 |
|
|
|
85.2 |
|
|
|
87.2 |
|
|
|
|
|
|
|
|
|
|
|
|||
Net earnings per share - basic |
|
$ |
8.06 |
|
|
$ |
5.74 |
|
|
$ |
4.86 |
|
Net earnings per share - diluted |
|
$ |
8.04 |
|
|
$ |
5.72 |
|
|
$ |
4.85 |
|
Anti-dilutive shares outstanding for the years ended December 31, 2024, 2023 and 2022 were immaterial.
22. Subsequent Events
There were no reportable events subsequent to December 31, 2024.
86
Item 9. Changes in and Disagreements with Accountants on Accounting and Financial Disclosure
There have been no changes to and no disagreements with our independent auditors regarding accounting or financial disclosure matters in our two most recent fiscal years.
Item 9A. Controls and Procedures
Evaluation of Disclosure Controls and Procedures
An evaluation has been carried out by the Company’s management, under the supervision and with the participation of the Company’s Chief Executive Officer and Chief Financial Officer, of the effectiveness of the design and operation of our disclosure controls and procedures (as such term is defined in Rules 13a-15(e) and 15d-15(e) under the Securities Exchange Act of 1934, as amended (the “Exchange Act”)) as of the end of the period covered by this report. Based on such evaluation, the Company’s Chief Executive Officer and Chief Financial Officer have concluded that, as of the end of such period, the Company’s disclosure controls and procedures are effective.
Internal Control over Financial Reporting
(a) Management’s Annual Report on Internal Control Over Financial Reporting
Management of the Company is responsible for establishing and maintaining adequate internal control over financial reporting.
Internal control over financial reporting is defined in Rules 13a-15(f) and 15d-15(f) under the Exchange Act as a process designed by, or under the supervision of, the Company’s principal executive and principal financial officers and effected by the Company’s board of directors, management and other personnel to provide reasonable assurance regarding the reliability of financial reporting and the preparation of financial statements for external purposes in accordance with generally accepted accounting principles and includes those policies and procedures that:
Because of its inherent limitations, internal control over financial reporting may not prevent or detect misstatements. Projections of any evaluation of effectiveness to future periods are subject to the risks that controls may become inadequate because of changes in conditions, or that the degree of compliance with the policies or procedures may deteriorate.
Management assessed the effectiveness of Autoliv’s internal control over financial reporting as of December 31, 2024. In making this assessment, we used the criteria set forth by the Committee of Sponsoring Organizations of the Treadway Commission (COSO) in Internal Control – Integrated Framework (2013 framework).
Based on our assessment, we believe that, as of December 31, 2024, the Company’s internal control over financial reporting is effective.
(b) Attestation Report of the Registered Public Accounting Firm
Ernst & Young AB has issued an attestation report on the Company’s internal control over financial reporting, which is included herein as the Report of Independent Registered Public Accounting Firm under Item 8. Financial Statements and Supplementary Data for the year ended December 31, 2024.
(c) Changes in Internal Control over Financial Reporting
There have not been any changes in the Company’s internal control over financial reporting (as such term is defined in Rules 13a-15-(f) and 15d-15(f) under the Exchange Act) during the quarter ended December 31, 2024 that have materially affected, or are reasonably likely to materially affect, the Company’s internal control over financial reporting.
87
Item 9B. Other Information
On November 7, 2024, Mikael Hagström, Vice President, Corporate Controller, adopted a trading plan intended to satisfy Rule 10b5-1(c) to sell 50% of his shares of Autoliv, Inc. common stock he would acquire upon the vesting of restricted stock units and performance stock units in February 2025. These sales are intended to cover vesting taxes and would occur between February 24, 2025 and March 7, 2025.
On November 11, 2024, Jonas Jademyr, Executive Vice President, Quality and Project Management, adopted a trading plan intended to satisfy Rule 10b5-1(c) to sell 50% of his shares of Autoliv, Inc. common stock he would acquire upon the vesting of restricted stock units and performance stock units in February 2025. These sales are intended to cover vesting taxes and would occur between February 24, 2025 and March 7, 2025.
On November 11, 2024, Christian Swahn, Executive Vice President, Supply Chain Management, adopted a trading plan intended to satisfy Rule 10b5-1(c) to sell 50% of his shares of Autoliv, Inc. common stock he would acquire upon the vesting of restricted stock units and performance stock units in February 2025. These sales are intended to cover vesting taxes and would occur between February 24, 2025 and March 7, 2025.
On November 14, 2024, Anthony Nellis, Executive Vice President, Legal Affairs, General Counsel and Secretary, adopted a trading plan intended to satisfy Rule 10b5-1(c) to sell, at a set threshold price, up to 25% of his net shares of Autoliv, Inc. common stock he would acquire upon the vesting of restricted stock units and performance stock units in February 2025 after in-kind tax withholding. Such sales to occur between (i) February 21, 2025 and March 14, 2025, (ii) April 18, 2025 and June 14, 2025, (iii) July 22, 2025 and September 14, 2025, and (iv) October 21, 2025 and December 14, 2025, subject to certain conditions.
On November 16, 2024, Mikael Bratt, President & Chief Executive Officer, adopted a trading plan intended to satisfy Rule 10b5-1(c) to sell 50% of his shares of Autoliv, Inc. common stock he would acquire upon the vesting of performance stock units in February 2025. These sales are intended to cover vesting taxes and would occur between February 24, 2025 and March 7, 2025.
On November 20, 2024, Magnus Jarlegren, President, Autoliv Europe, adopted a trading plan intended to satisfy Rule 10b5-1(c) to sell 50% of his shares of Autoliv, Inc. common stock he would acquire upon the vesting of restricted stock units and performance stock units in February 2025. These sales are intended to cover vesting taxes and would occur between February 24, 2025 and March 7, 2025.
On November 21, 2024, Fabien Dumont, Chief Technology Officer, adopted a trading plan intended to satisfy Rule 10b5-1(c) to sell 36% of his shares of Autoliv, Inc. common stock he would acquire upon the vesting of restricted stock units and performance stock units in February 2025 and March 2025. These sales are intended to cover vesting taxes and would occur between February 24, 2025 and March 7, 2025 and between March 31, 2025 and April 21, 2025. Fabien Dumont terminated the trading plan on February 12, 2025.
88
PART III
Item 10. Directors, Executive Officers and Corporate Governance
The information required by Item 10. regarding executive officers, directors and nominees for election as directors of Autoliv, Autoliv’s Audit Committee, Autoliv’s code of ethics, insider trading policies and procedures, and compliance with Section 16(A) of the Securities Exchange Act is incorporated herein by reference from the information under the captions “Executive Officers of the Company” and “Proposal 1: Election of Directors”, “Committees of the Board” and “Audit and Risk Committee Report”, “Corporate Governance Guidelines and Codes of Conduct”, “Insider Trading Policies and Procedures”,and “Delinquent Section 16(a) Reports”, respectively, in the Company’s 2025 Proxy Statement. Information on Board meeting attendance is provided under the caption “Board Meetings” in the 2025 Proxy Statement and incorporated herein by reference.
Item 11. Executive Compensation
The information required by Item 11. regarding executive compensation for the year ended December 31, 2024 is included under the caption “Compensation Discussion and Analysis” in the 2025 Proxy Statement and is incorporated herein by reference. The information required by the same item regarding Leadership Development and Compensation Committee is included in the sections “Leadership Development and Compensation Committee Interlocks and Insider Participation” and “Leadership Development and Compensation Committee Report” in the 2025 Proxy Statement and is incorporated herein by reference.
Item 12. Security Ownership of Certain Beneficial Owners and Management and Related Stockholder Matters
The information required by Item 12. regarding beneficial ownership of Autoliv’s common stock is included under the caption “Security Ownership of Certain Beneficial Owners and Management” in the 2025 Proxy Statement and is incorporated herein by reference.
Securities Authorized for Issuance Under the Stock Incentive Plan
The following table provides information as of December 31, 2024, about the common stock that may be issued under the Stock Incentive Plan. The Company does not have any equity compensation plans that have not been approved by its stockholders.
Plan Category |
|
(a) Number of |
|
|
(b) Weighted- |
|
|
(c) Number of |
|
|||
Equity compensation plans |
|
|
456,849 |
|
|
$ |
80.40 |
|
|
|
2,429,029 |
|
Equity compensation plans |
|
|
— |
|
|
|
— |
|
|
|
— |
|
Total |
|
|
456,849 |
|
|
$ |
80.40 |
|
|
|
2,429,029 |
|
Information regarding the Company’s policy and procedures concerning related party transactions is included under the caption “Related Person Transactions” in the 2025 Proxy Statement and is incorporated herein by reference. Information regarding director independence can be found under the caption “Board Independence” in the 2025 Proxy Statement and is incorporated herein by reference.
Item 14. Principal Accountant Fees and Services
The information required by Item 9(e) of Schedule 14A regarding principal accounting fees and the information required by Item 14 regarding the pre-approval process of accounting services provided to Autoliv is included under the caption “Proposal 3. Ratification of Appointment of Independent Registered Public Accounting Firm Appointment” in the 2025 Proxy Statement and is incorporated herein by reference.
89
PART IV
Item 15. Exhibit and Financial Statement Schedules
All of the schedules specified under Regulation S-X to be provided by Autoliv have been omitted either because they are not applicable, they are not required, or the information required is included in the financial statements or notes thereto.
|
Exhibit No. |
|
Description |
|
|
|
3.1 |
|
|
|
|
|
3.2 |
|
|
|
|
|
4.1 |
|
|
|
|
|
4.2 |
|
|
|
|
|
4.3 |
|
|
|
|
|
4.4 |
|
|
|
|
|
4.5 |
|
|
|
|
|
4.6 |
|
|
|
|
|
4.7 |
|
|
|
|
|
4.8 |
|
|
|
|
|
4.9 |
|
|
|
|
|
4.10 |
|
|
|
|
|
90
10.1+ |
|
|
|
|
|
10.2+ |
|
|
|
|
|
10.3+ |
|
|
|
|
|
10.4+ |
|
|
|
|
|
10.5 |
|
|
|
|
|
10.6+ |
|
|
|
|
|
10.7+ |
|
|
|
|
|
10.8 |
|
|
|
|
|
10.9+ |
|
|
|
|
|
10.10 |
|
|
|
|
|
10.11+ |
|
|
|
|
|
10.12 |
|
|
|
|
|
10.13+ |
|
|
|
|
|
10.14+ |
|
|
|
|
|
10.15+ |
|
|
|
|
|
10.16+ |
|
|
|
|
|
10.17+ |
|
|
|
|
|
10.18+ |
|
|
|
|
|
10.19+ |
|
|
|
|
|
10.20 |
|
91
|
|
|
10.21+ |
|
|
|
|
|
10.22+ |
|
|
|
|
|
10.23+ |
|
|
|
|
|
10.24+ |
|
|
|
|
|
10.25+ |
|
|
|
|
|
10.26+ |
|
|
|
|
|
10.27+ |
|
|
|
|
|
10.28+ |
|
|
|
|
|
10.29+ |
|
|
|
|
|
10.30 |
|
|
|
|
|
10.31+ |
|
|
|
|
|
19* |
|
|
|
|
|
21* |
|
|
|
|
|
23* |
|
|
|
|
|
31.1* |
|
|
|
|
|
31.2* |
|
|
|
|
|
32.1* |
|
|
|
|
|
32.2* |
|
|
|
|
|
97.1* |
|
|
|
|
|
101.INS* |
|
Inline XBRL Instance Document – The instance document does not appear in the Interactive Date File because its XBRL tags are embedded within the inline XBRL document. |
|
|
|
101.SCH* |
|
Inline XBRL Taxonomy Extension Schema with Embedded Linkbase Document. |
|
|
|
104* |
|
Cover Page Interactive Data File (embedded within the inline XBRL document). |
* Filed herewith.
+ Management contract or compensatory plan.
† Confidential treatment requested as to portions of the exhibit. Confidential materials omitted and filed separately with the Securities and Exchange Commission.
92
SIGNATURES
Pursuant to the requirements of Section 13 or 15(d) of the Securities Exchange Act of 1934, the registrant has duly caused this report to be signed on its behalf by the undersigned, thereunto duly authorized, as of February 20, 2025.
AUTOLIV, INC. |
|
(Registrant) |
|
|
|
By |
/s/ Fredrik Westin |
|
Fredrik Westin |
|
Chief Financial Officer |
Pursuant to the requirements of the Securities Exchange Act of 1934, this report has been signed below by the following persons on behalf of the registrant and in the capacities indicated, as of February 20, 2025.
Title |
|
Name |
|
|
|
|
|
|
Chairman of the Board of Directors |
|
/s/ Jan Carlson |
|
|
Jan Carlson |
|
|
|
Chief Executive Officer and President (Principal Executive Officer) |
|
/s/ Mikael Bratt |
and Director |
|
Mikael Bratt |
|
|
|
Chief Financial Officer |
|
/s/ Fredrik Westin |
(Principal Financial and Principal Accounting Officer) |
|
Fredrik Westin |
|
|
|
|
|
|
Director |
|
/s/ Laurie Brlas |
|
|
Laurie Brlas |
|
|
|
Director |
|
/s/ Hasse Johansson |
|
|
Hasse Johansson |
|
|
|
Director |
|
/s/ Leif Johansson |
|
|
Leif Johansson |
|
|
|
Director |
|
/s/ Adriana Karaboutis |
|
|
Adriana Karaboutis |
|
|
|
Director |
|
/s/ Franz-Josef Kortüm |
|
|
Franz-Josef Kortüm |
|
|
|
Director |
|
/s/ Frédéric Lissalde |
|
|
Frédéric Lissalde |
|
|
|
Director |
|
/s/ Xiaozhi Liu |
|
|
Xiaozhi Liu |
|
|
|
Director |
|
/s/ Gustav Lundgren |
|
|
Gustav Lundgren |
|
|
|
Director |
|
/s/ Martin Lundstedt |
|
|
Martin Lundstedt |
|
|
|
Director |
|
/s/ Thaddeus Senko |
|
|
Thaddeus Senko |
|
|
|
|
|
|
93
Glossary and Definitions
In this report, the following company or industry specific terms and abbreviations are used:
CAPITAL EMPLOYED
Total equity and net debt (net cash).
CAPITAL EXPENDITURES
Investments in property, plant and equipment.
CPV
Content Per Vehicle, i.e. value of the safety products in a vehicle.
EARNINGS PER SHARE
Net income attributable to controlling interest relative to weighted average number of shares (net of treasury shares) assuming dilution and basic, respectively.
EBITDA
Earnings before interest, taxes, depreciation, and amortization
GROSS MARGIN
Gross profit relative to sales.
MEDIUM AND LOW INCOME MARKETS
Includes all markets except North America, Western Europe, Japan and South Korea.
HEADCOUNT
Employees plus temporary personnel.
HIGH INCOME MARKETS
Includes North America, Western Europe, Japan and South Korea.
INVENTORY OUTSTANDING IN RELATION TO SALES
Outstanding inventory relative to annualized fourth quarter sales.
LEVERAGE RATIO
Debt per the Policy (Net debt adjusted for pension liabilities) in relation to EBITDA per the Policy (Adjusted EBITDA) (Earnings Before Interest, Taxes, Depreciation and Amortization, other non-operating items, net, income from equity method investments and capacity alignments), see Item 7 for a calculation of this non-U.S. GAAP measure.
LVP
Light vehicle production of light motor vehicles with a gross weight of up to 3.5 metric tons.
This 10-K includes content supplied by S&P Global; Copyright © Light Vehicle Production Forecast, January 2025. All rights reserved. S&P Global is a global supplier of independent industry information. The permission to use S&P Global copyrighted reports, data and information does not constitute an endorsement or approval by S&P Global of the manner, format, context, content, conclusion, opinion or viewpoint in which S&P Global reports, data and information or its derivations are used or referenced herein.
NET DEBT
Short and long-term debt including debt-related derivatives less cash and cash equivalents, see Non-U.S. GAAP Performance Measures in Item 7 for a reconciliation of this non-U.S. GAAP measure.
94
NUMBER OF EMPLOYEES
Employees with a continuous employment agreement, recalculated to full time equivalent heads.
OEM
Original Equipment Manufacturer referring to customers assembling new vehicles.
OPERATING MARGIN
Operating income relative to sales.
PAYABLES OUTSTANDING IN RELATION TO SALES
Outstanding payables relative to annualized fourth quarter sales.
RECEIVABLES OUTSTANDING IN RELATION TO SALES
Outstanding receivables relative to annualized fourth quarter sales.
RETURN ON CAPITAL EMPLOYED
Operating income and equity in earnings of affiliates, relative to average capital employed.
RETURN ON TOTAL EQUITY
Net income relative to average total equity.
95
Autoliv Standard
Insider Trading Policy Exhibit 19
Autoliv Insider Trading Policy
Table of Contents
1 |
INTRODUCTION |
3 |
2 |
STATEMENT OF POLICY |
3 |
3 |
EXCEPTIONS |
5 |
4 |
PRE-CLEARANCE |
6 |
5 |
BLACK-OUT PERIODS |
6 |
6 |
DEFINITIONS |
7 |
7 |
POTENTIAL CRIMINAL AND CIVIL LIABILITY AND/OR DISCIPLINARY ACTION |
9 |
8 |
REPORTING REQUIREMENTS |
9 |
9 |
ADDITIONAL INFORMATION |
10 |
10 |
THE GENERAL COUNSEL OF AUTOLIV, INC. |
10 |
Page 1 of NUMPAGES 2
Autoliv Standard
Insider Trading Policy Exhibit 19
1 Introduction
Autoliv, Inc. (“Autoliv” or the “Company”), its employees, officers, and non-employee Board members (i.e. directors) are subject to laws in certain jurisdictions in which the Company conducts its business that prohibit trading in the securities of a company on the basis of “inside” information. Anyone violating these laws is subject to personal liability and could face criminal penalties. Autoliv takes seriously its obligation, and that of its directors, officers and employees, to prevent insider trading violations. In light of the severity of the possible sanctions, both to you individually and to us as a company, we have established this Policy to assist all of us in complying with our obligations. Any violation of this or any other Company policy could subject you to disciplinary action, up to and including termination of employment or service, as well as civil liability and criminal penalties.
This Policy is not intended to replace your responsibility to understand and comply with the applicable laws and regulations on insider trading where you work, do business or Trade (defined below) in Autoliv Securities (defined below) and the securities of other companies covered by this Policy in Section 2(c) below.
Additionally, you remain subject to the restrictions imposed by our Communications Policy & Guidelines on the disclosure of information about Autoliv.
If you have any questions about this Policy or you suspect any violations of this Policy, you should immediately notify the Autoliv legal department.
2 Statement of Policy
(a) No Insider (defined below and includes all Autoliv employees), may buy, sell or donate any Autoliv Securities, whether or not issued by the Company, at any time while in possession of material non-public information or inside information (each defined below) relating to Autoliv. As an Insider, you must not (i) try to circumvent this restriction by having others Trade for you, (ii) cause (directly or indirectly) an entity or association in which you (directly or indirectly) have an interest to do such Trades, or (iii) try to Trade on material non-public information by any other means.
(b) It is inappropriate for any Insider to engage in short-term or speculative transactions in Autoliv Securities. Therefore, Insiders may not engage in any of the following transactions:
(i) Short Sales. Short sales of Autoliv Securities indicate that the seller believes that the Autoliv Securities will decline in value, thereby signalling to the market that the seller has no confidence in the Company or its short-term prospects. In addition, short sales may reduce the seller’s incentive to improve the Company’s performance. Accordingly, Insiders are prohibited from engaging in short sale transactions of Autoliv Securities. In addition, Section 16(c) of the Securities Exchange Act of 1934, as amended (the “Exchange Act”), prohibits directors and executive officers from engaging in short sales.
(ii) Publicly Traded Options. An option transaction is a bet on the short-term movement of Autoliv Securities and creates the appearance that the director, officer or other employee is trading based on inside information. Option transactions also may focus the person’s attention on short-term performance at the expense of the Company’s long-term objectives. Accordingly, Insiders are prohibited from engaging in transactions in puts, calls or other derivative securities related to any Autoliv Securities.
(iii) Hedging Transactions. Certain forms of hedging or monetization transactions, such as zero-cost collars and forward sale contracts, allow a director, officer or other employee to lock in much of the value of his or her stock holdings, often in exchange for all or part of the potential for upside appreciation in the stock. These transactions allow the person to continue to own the covered securities but without
Page 2 of NUMPAGES 2
Autoliv Standard
Insider Trading Policy Exhibit 19
the full risks and rewards of ownership. When that occurs, he or she may no longer have the same objectives as the Company’s other stockholders. Therefore, Insiders are prohibited from engaging in hedging transactions (including, but not limited to, prepaid variable forward contracts, equity swaps, collars and exchange funds).
(iv) Margin Accounts and Pledges. Securities held in a margin account may be sold by the broker without the customer’s consent if the customer fails to meet a margin call. Similarly, securities pledged as collateral for a loan may be sold in a foreclosure if the borrower defaults on the loan. Because a margin sale or foreclosure sale may occur at a time when the customer or borrower is aware of material non-public information or inside information or otherwise is not permitted to trade in Autoliv Securities, Insiders are prohibited from holding Autoliv Securities in a margin account or pledging Autoliv Securities as collateral for a loan.
(v) Standing Orders. A standing order leaves the seller with no control over the timing of the transaction. A standing order transaction executed by the broker when the seller is aware of material non-public information or inside information may result in unlawful insider trading. The Company therefore discourages placing standing orders on Autoliv Securities. Standing orders placed with a broker to sell or purchase stock at a specified price should be used only for a very brief period of time (i.e. no longer than one (1) week unless done within a 10b5-1 Plan (defined below)) and should otherwise comply with the restrictions and procedures outlined in this Policy.
(c) No Insider may buy or sell any Securities of another entity, including, without limitation, any company in which an Autoliv entity owns shares, any company which the Company follows in the ordinary course of its business (such as the Company’s customers, vendors or suppliers) and any other entity with which the Company does business, at any time when the Insider has material non-public information or inside information about such entity. In considering whether confidential or proprietary information of a third party is material, Insiders should remember that the threshold for what is considered material may be lower for other companies than it is for Autoliv.
(d) No Insider may disclose (“tip”) material non-public information or inside information relating to Autoliv to any other person, including family and friends, and no Insider may make recommendations, give trading advice or express opinions about Autoliv on the basis of material non-public information or inside information relating to Autoliv.
(e) No Insider may disclose (“tip”) material non-public information or inside information relating to any other entity to any other person, including family and friends, and no Insider may make recommendations, give trading advice or express opinions about any such entity on the basis of material non-public information or inside information about such entity obtained by the Insider by being associated with Autoliv.
(f) No Covered Person (defined below and includes certain individuals subject to “pre-clearance” procedures) may buy, sell or otherwise effect transactions in Autoliv Securities during any of the four “Black-Out Periods” that occur each fiscal year (see Section 5(a)) or, if applicable, any other Special Black-Out Periodimposed by the Company as set forth in Section 5(b). If the last day of employment or service falls in a Black-Out Period or Special Black-Out Period, the Insider may not buy or sell Autoliv Securities until the end of such Black-Out Period or Special Black-Out Period.
(e) Disclosure of material non-public information and inside information is governed by the Company’s Communication Policy & Guidelines and Insiders must adhere to this Policy.
Again, notwithstanding the timing guidelines set forth in this Policy, it is illegal for you to trade while in possession of material non-public information or inside information, including situations in which you are aware of major developments that have not yet been publicly announced. When in doubt about whether particular non-public information is material, presume it is material. If you are unsure whether information is material, you should consult
Page 3 of NUMPAGES 2
Autoliv Standard
Insider Trading Policy Exhibit 19
the Company’s General Counsel before making any decision to disclose such information (other than to persons who need to know it) or to trade in Securities or make any recommendations or express opinions with respect to Securities to which that information relates.
3 Exceptions
(a) 10b5-1 Trading Plans. An exception to the trading restrictions during Black-Out Periods and Special Black-Out Periods described in this Policy may be available for trades made pursuant to a pre-arranged written trading plan that complies with Rule 10b5-1(c) of the Exchange Act (“10b5-1 Plan”). Any 10b5-1 Plan or any modification or termination of any 10b5-1 Plan must be approved in advance by the General Counsel of the Company as provided below.
To comply with this Policy, a 10b5-1 Plan must be entered into at a time when the Covered Person entering into the plan is not aware of material non-public information and is not otherwise subject to a Black-Out Period or Special Black-Out Period, and must comply with all of the requirements of Rule 10b5-1. Once the plan is adopted, the Covered Person must not exercise any subsequent influence over the amount of securities to be traded, the price at which they are to be traded or the date of the trade. The plan must either specify the amount, pricing and timing of transactions in advance, include a formula or algorithm for determining the amount, pricing and timing, or delegate discretion on these matters to an independent third party. If you have any questions regarding the requirements of Rule 10b5-1, the Company’s Genearl Counsel will provide you with a summary of the applicable parameters.
In the case of a Section 16 Insider (as defined below), any Rule 10b5-1 Plan must also include a requirement that the Section 16 Insider’s broker notify the Company before the close of business on the day after the execution of any transaction. No person may have more than one Rule 10b5-1 Plan or overlapping Rule 10b5-1 Plans, except to the extent permitted by Rule 10b5-1, and no person may have more than one single-trade 10b5-1 Plan during any 12-month period.
Modifications to or terminations of Rule 10b5-1 Plans must be carefully considered and generally are discouraged absent compelling circumstances. In all cases, any modification to or termination of a Rule 10b5-1 Plan must also comply with all of the requirements set forth in this Policy, including pre-clearance, occurrence outside of a Black-Out Period or Special Black-Out Period and compliance with any required waiting period under Rule 10b5-1.
Any Rule 10b5-1 Plan (or amendment to any such Rule 10b5-1 Plan) must be submitted for pre-clearance five (5) days prior to the entry into (or amendment of) the Rule 10b5-1 Plan. No further pre-clearance of transactions conducted pursuant to the Rule 10b5-1 Plan will be required. Any plan to terminate a Rule 10b5-1 Plan must be submitted for approval at least two (2) business days prior to the proposed termination. The Company reserves the right to withhold pre-clearance of any Rule 10b5-1 Plan (or amendment thereto or termination thereof) that the Company determines is not consistent with the rules regarding such plans.
Notwithstanding anything to the contrary and any conflicting provisions (or lack thereof), this Policy shall automatically be interpreted at all times to be consistent and require compliance with all requirements under Rule 10b5-1 and related laws, rules and regulations adopted by the SEC regarding “insider trading” (including, without limitation, any required disclosure of new and/or amended Rule 10b5-1 Plans for Section 16 Insiders).
(b) Additional Exceptions. In addition, on a case-by-case basis, the General Counsel may determine that the trading restrictions during Black-Out Periods and Special Black-Out Periods do not apply to the exercise of an employee stock option, or to the exercise of a tax withholding right, pursuant to which a Covered Person elects to satisfy the exercise price and tax withholding requirements either with cash, with other shares of Autoliv common stock held by the Covered Person, or by having Autoliv withhold shares subject to the equity award. This Policy does apply, however, to any sale of Autoliv common stock as part of a broker-assisted cashless exercise of an option or to any other
Page 4 of NUMPAGES 2
Autoliv Standard
Insider Trading Policy Exhibit 19
market sales for the purpose of generating the cash needed to pay the exercise price or tax withholding requirements of an option or other equity award. If the General Counsel seeks such an exception for his or her own trading, then the General Counsel must obtain approval of the CEO.
4 Pre-Clearance
(i) Because Covered Persons are likely to have access to material non-public information on a regular basis, Covered Persons (defined below) must contact the General Counsel of the Company to obtain a “pre-clearance” at any time prior to, directly or indirectly, buying or selling Autoliv Securities (or otherwise making any transfer, pledge, loan or gift), i.e., even when such purchase or sale will not take place during a Black-Out Period or Special Black-Out Period. This pre-clearance requirement also applies to members of the same household and immediate family members (spouse, children, grandchildren, parents, stepparents, grandparents, siblings, in-laws who live in the same household, and family members who are subject to influence or control) of Covered Persons. If you have any question whether you are a “Covered Person” and subject to pre-clearance, please contact the Company’s legal department.
(ii) Certain Insiders may from time to time be involved in specific projects or have tasks in which they receive inside information justifying that they become subject to a “pre-clearance” procedure and/or be asked to refrain from Trading. Those subject to this requirement will be informed by their manager.
(iii) Insiders should trade within two (2) trading days after they receive pre-clearance to trade. If his or her trade is not executed in the two-day preclearance period, he or she will need to seek a new pre-clearance period.
5 Black-Out Periods
(a) All Insiders are subject to four (4) routine Black-Out Periods (defined below) per year, during which Insiders are prohibited from trading in Autoliv Securities.
Beginning of Black-Out Period: Each routine Black-Out Period will begin on the 15th day of the third month of each quarter. If the 15th calendar day falls on a weekend or a NYSE holiday, the Black-Out Period will begin on the prior trading day.
Q1 |
Q2 |
Q3 |
Q4 |
March 15 |
June 15 |
September 15 |
December 15 |
End of Black-Out Period: Each Black-Out Period will end when one (1) full trading day has passed on the NYSE and the Nasdaq Stockholm (“NSTO”) after the Company announces its results for a quarter.
Assuming the NYSE or NSTO is open each day, below is an example of when an Insider can trade:
Autoliv Announces Results on Tuesday |
First Day Insider Could Trade |
Announcement occurs before market opens (both NYSE and NSTO) |
Wednesday |
Announcement occurs while market is open (either NYSE or NSTO) |
Thursday |
Announcement occurs after market closes (Both NYSE and NSTO) |
Thursday |
Certain Insiders will also be subject to Suspension of Trading upon being added to a Logbook prior to the beginning of the applicable Black-Out Period and will already be restricted from Trading in Autoliv Securities.
Page 5 of NUMPAGES 2
Autoliv Standard
Insider Trading Policy Exhibit 19
(b) Special Black-Out Period. From time-to-time, the Company may instruct some of its Insiders to suspend trading in Autoliv Securities because of developments that have not yet been disclosed to the public (which may include pending announcement of a share repurchase plan or any amendments thereto) (a “Special Blackout-Period”). If you have been notified you have been added to a Logbook, you are subject to this Special Black-Out Period. All those affected should not trade in Autoliv Securities while the Special Black-Out Period is in effect, and should not disclose to others that the Company has implemented a Special Black-Out Period for certain individuals. A Special Black-Out Period may be imposed at any time to avoid even the appearance of impropriety; it does not imply that we have determined that there is a legal obligation to do so or that a certain fact is considered Material Information.
6 Definitions
(a) Black-Out Periods. Black-Out Periods include the period of time around the quarterly earnings calendar when all Insiders are prohibited from trading in Autoliv Securities or any Special Black-Out Period. All other periods of the year are considered open for trading in Autoliv Securities provided (i) the Insider is not in possession of material non-public information, and (ii) if a Covered Person has received Pre-Clearance for Trading in Autoliv Securities within a two-day period.
(b) Covered Persons. Covered Persons are Insiders identified by the General Counsel on a quarterly basis who are subject to the “pre-clearance” procedures prior to Trading in Autoliv Securities. All Executive Management Team Members and members of our Board of Directors will always be considered Covered Persons.
(c) Inside Information. Under the Swedish standard, information qualifies as “inside information” if it is non-public information of a precise nature which, if it were made public, would be likely to have a significant effect on the prices of the Autoliv Securities. In practice, this means all facts information that a “reasonable investor” would be “likely to use as part of the basis of his or her investment decisions.” See also Material Information below.
(d) Insiders. Insiders are (i) members of our Board of Directors, our corporate officers, and our employees (including employees of our subsidiaries); (ii) our consultants, contractors and other persons associated with us and our subsidiaries, including distributors, sales agents and joint venture partners, who receive or have access to material non-public information; (iii) members of the same household, immediate family members (spouse, children, grandchildren, parents, stepparents, grandparents, siblings, in-laws who live in the same houshold), and family members who are subject to influence or control of those listed in (i) and (ii); and (iv) any entities that those listed in (i), (ii) and (iii) influence or control, including any corporations, partnerships or trusts. This Policy continues to apply to your transactions in Autoliv Securities even after you have terminated employment; if you are in possession of material non-public information when your employment terminates, the restrictions of this Policy continue to apply until all such information is either public or no longer considered material information.
(e) Logbook. A periodic record of Insiders with specific confidential information maintained by the Autoliv legal department. A person will receive a notice of the creation of a Logbook and a request to complete certain personal information and acknowledge receipt of the notice he or she is in possession of confidential information. Autoliv currently uses the Nasdaq InsiderLog service to create and manage its Logbooks but may use other products and services from time to time.
(f) Material Information. Information is deemed to be material if there is a substantial likelihood that a reasonable investor would consider such information to be important in making a decision to purchase, sell or hold Autoliv Securities. While it is not possible to define all categories of material information, there are various categories of information that are particularly sensitive and, as a general rule, should be considered material. Either positive or negative information may be material. Examples of such information include:
Page 6 of NUMPAGES 2
Autoliv Standard
Insider Trading Policy Exhibit 19
• Unpublished financial results or changes to previously announced results
• Projections of future earnings or losses or financial forecasts of any kind
• News, proposals, plans or agreements, even if preliminary in nature, of pending or proposed mergers, acquisitions, divestitures, recapitalizations, strategic alliances, licensing arrangements, joint ventures, tender offers or purchases or sales of substantial assets
• Impending bankruptcy or financial liquidity problems
• Earnings that are inconsistent with the consensus expectations or projections of the investment community
• Gain or loss of a substantial customer or supplier
• Significant changes in customer production schedules
• Significant disruptions to the Company’s operations
• Changes in dividend policies or other capital plans
• Significant legislative developments affecting the Company
• New product announcements, discoveries or developments of a significant nature
• Pricing changes
• Stock splits
• Repurchase plans
• New equity or debt offerings or other financings
• Significant litigation or governmental actions
• Significant product defects
• Changes in control or other developments regarding senior management
• Changes in earnings estimates
• Changes in analyst recommendations or debt ratings
• Changes in auditors or notification that the Company may no longer rely on an auditor’s audit report
• Changes in critical accounting policies
• Defaults under credit agreements or on senior securities
• Cyber security incidents, breaches or other security information relating to the Company’s business
This list is illustrative only and is not intended to provide a comprehensive list of circumstances that could give rise to material information. Any Covered Person should resolve any question concerning materiality of particular information in favor of materiality, and thus the activities prohibited by this Policy should be avoided until such information has been publicly disclosed or it has been determined that such information is not, or has ceased to be, material. The Securities and Exchange Commission (the "SEC") takes a broad view as to what information is considered material.
(g) Non-public information. Non-public information is information that has not been disseminated in a manner designed to reach investors generally nor is otherwise available to the general public. Non-public information may include information available to a select group of analysts or brokers or institutional investors and information that has been entrusted to the Company on a confidential basis until a public announcement of the information has been made and enough time has elapsed for the market to respond to a public announcement of the information. Non-public information will be deemed to be public after one (1) full trading day has passed on the NYSE following the date when the information is disclosed publicly. See the example above in Section 5 for assistance in determining when you can trade. Information is not necessarily public merely because it has been disclosed to a few members of the public or discussed in the press, which will sometimes report rumors. Information should be presumed to be non-public unless it has been officially released by the Company.
(h) Securities. Securities include common stock, depositary receipts, preferred stock, options to purchase common stock, notes, warrants, convertible debentures and other derivative securities.
(i) Section 16 Insider. Section 16 Insiders are those individuals subject to further reporting requirements under Section 16 of the Exchange Act.
Page 7 of NUMPAGES 2
Autoliv Standard
Insider Trading Policy Exhibit 19
(j) Trading (and similar expressions). Trading includes buying or selling Securities of any company, including any contract or arrangement that has the equivalent effect of buying or selling Securities (including entry or modification of a 10b5-1 Plan). This also includes making elections in the Company’s long-term incentive management systems (currently Shareworks). Any such elections should be made outside of a Black-Out Period or Special Black-Out Period.
7 Potential Criminal and Civil Liability and/or Disciplinary Action
(a) Individual Responsibility. Each person is individually responsible for complying with the securities laws applicable to their region and this Policy, regardless of whether we have prohibited trading by that person or any other Insiders. Any action on the part of the Company or the General Counsel, or any other person who is tasked as the compliance officer for this Policy, does not in any way constitute legal advice or insulate an individual from liability under the applicable laws. Trading in securities outside the Black-Out Periods or Special Black-Out Periods should not be considered a “safe harbor”, although the safest period for trading in Autoliv Securities, assuming the absence of material non-public information or inside information, is generally the first ten trading days following the end of the Black-Out Period. The Black-Out Periods are particularly sensitive for transactions in Autoliv Securities for compliance with applicable securities laws. This is because Insiders will, as any quarter progresses, be increasingly likely to possess material non-public information or inside information about the expected financial results for the quarter.
Each Covered Person will be held responsible for the actions of the members of their same household and immediate family members who are Insiders. Consequently, Covered Persons should make their family members and personal households aware of the need to confer with them before they trade in Autoliv Securities, and should treat all such transactions for purposes of this Policy and applicable securities laws as if the transactions were for the Covered Person’s own account.
In addition to the matters set forth in this Policy, appropriate judgment should be exercised in connection with all securities trading. Also, this Policy is not a substitute for any applicable laws and regulations which may apply in the jurisdictions where you work or do business.
(b) Potential Sanctions.
(i) Criminal Liability for Insider Trading. In the United States and many other countries, the personal consequences to you of illegally trading securities while in possession of material non-public information can be quite severe. Besides requiring disgorgement of profits gained or losses avoided, there are substantial civil and criminal penalties which may be assessed for insider trading.
(ii) Liability for Tipping. Insiders may also be liable for improper transactions by any person (commonly referred to as a "tippee") to whom they have disclosed material non-public information, or to whom they have made recommendations or expressed opinions on the basis of such information about trading securities. The SEC has imposed large penalties even when the disclosing person did not profit from the trading.
(iii) Possible Disciplinary Actions. Any officer or employee who violates this Policy or any applicable laws and regulations, will be subject to disciplinary action, which may include termination of employment.
8 Reporting Requirements
(a) Swedish Reporting Requirements. Board members, Executive Management Team members, and certain other senior executive officers, as well as their closely related parties, are subject to reporting requirements under the EU Market Abuse Regulation.
(b) U.S. Reporting Requirements. Some of the Covered Persons are Section 16 Insiders and are subject to reporting requirements under Section 16 of the Exchange Act (see Section 9).
Page 8 of NUMPAGES 2
Autoliv Standard
Insider Trading Policy Exhibit 19
(c) Assistance by Autoliv Legal Department. To assist relevant Insiders with their filing obligations under (a) and (b) above, the Autoliv legal department will, at the Insider’s request, assist in making filings on behalf of such Insiders with the Swedish Finansinspektionen and the SEC. However, the obligation to ensure that the requisite filings are made rests with the Insider. Insiders subject to reporting requirements under Section 8(a) and (b) above should notify their closely related persons of their status and the obligation to ensure that the requisite filings are made by such persons rests with the closely related person.
(b) Post Transaction Notice. To facilitate public reporting requirements, each Section 16 Insider shall also notify the General Counsel (or his or her designee) of the occurrence of any purchase, sale or other acquisition or disposition of Autoliv Securities as soon as possible following the transaction, but in any event within one business day after the transaction. Such notification may be oral or in writing (including by email) and should include the identity of the Section 16 Insider, the type of transaction, the date of the transaction, the number of shares involved and the purchase or sale price.
9 Additional Information
(a) Section 16 Insiders. Section 16 Insiders must comply with the reporting obligations and limitations on “short-swing” transactions set forth in the federal securities laws. The practical effect of these provisions is that such Insiders who both purchase and sell Autoliv Securities within a six-month period must refund all profits (if any) from the sale to the Company, whether or not they had knowledge of any material non-public information.
Under these provisions, and so long as certain other criteria are met, the receipt of options under the Company’s option plans and the exercise of such options is not subject to these restrictions; however, the sale of any such shares received upon exercise of an option is subject to this six-month rule.
Additionally, Section 16 Insiders may never make a short sale of Autoliv Securities. On request, the Company will provide separate memoranda and other appropriate materials to its Section 16 Insiders regarding compliance with these rules.
(b) Swedish Law. The EU Market Abuse Regulation imposes a prohibition against trading in Autoliv Securities for certain individuals, including the Company’s directors, Executive Management Team members, and certain other senior executive officers, during the 30 day period before announcement of quarterly or annual results. On request, the Company will provide separate memoranda and other appropriate materials regarding compliance with these rules.
(c) Certifications. From time to time on request from the General Counsel, each employee, officer and director may be required to certify his or her understanding of and intent to comply with this Policy. In addition, directors and officers will be expected to make this certification no less frequently than annually.
10 The General Counsel of Autoliv, Inc.
The duties of the General Counsel of Autoliv shall include, but are not limited to:
(i) Determining who is subject to reporting requirements and the 30-day trading prohibition under the EU Market Abuse Regulation, notifying those concerned of their obligations and keeping a list of the relevant persons and their closely related persons and update the list as and when necessary;
(ii) Determining who the Section 16 Insiders are, notifying them and adjusting the list of Covered Persons as and when necessary;
Page 9 of NUMPAGES 2
Autoliv Standard
Insider Trading Policy Exhibit 19
(iii) Determining (in cooperation with the Company’s CEO and CFO) who should be subject to the pre-clearance set forth in Section 4(a), notifying them and adjusting the list of Covered Persons as and when necessary;
(iv) Pre-clearing all transactions in Autoliv Securities by those requiring pre-clearance to determine compliance with this Policy, insider trading laws and other applicable securities laws and regulations;
(v) Assisting relevant Insiders in the preparation and filing of Section 16 reports (Forms 3, 4 and 5) with the SEC and in the preparation and filing of forms to be filed with Finansinspektionen;
(vi) Reminding Insiders periodically of their obligations under this Policy and applicable laws;
(vii) Posting or circulating this Policy (and/or a summary), and providing this Policy and other appropriate materials to new officers, directors and others who have, or may have, access to material non-public information;
(viii) Assisting our Board of Directors in implementation of this Policy; and
(ix) Compliance activities with respect to Rule 144 sales of our stock.
Page 10 of NUMPAGES 2
Exhibit 21
LIST OF SUBSIDIARIES OF AUTOLIV, INC. AS OF DECEMBER 31, 2024.
Brazil
Autoliv do Brasil Ltda.
Canada
Autoliv Canada, Inc.
VOA Canada, Inc.
China
Autoliv (Baoding) Vehicle Safety Systems Co., Ltd.
Autoliv (Changchun) Vehicle Safety Systems Co., Ltd.
Autoliv (China) Steering Wheel Co., Ltd.
Autoliv (China) Automotive Safety Systems Co., Ltd.
Autoliv (Guangzhou) Vehicle Safety Systems Co., Ltd.
Autoliv (Hefei) Vehicle Safety Systems Co., Ltd.
Autoliv (Jiangsu) Automotive Safety Components Co., Ltd.
Autoliv (Nanjing) Vehicle Safety Systems Co., Ltd.
Autoliv (Shanghai) Vehicle Safety Systems Co., Ltd.
Autoliv (Shanghai) Management Co., Ltd.
Autoliv (Shanghai) Vehicle Safety System Technical Center Co., Ltd.
Autoliv Shenda (Tai Cang) Automotive Safety Systems Co., Ltd. (60%)
Autoliv Shenda (Nanjing) Automotive Components Co., Ltd. (60%)
Mei-An Autoliv Co., Ltd. (59%)
Estonia
AS Norma
France
Autoliv France SNC
Autoliv Isodelta SAS
Livbag SAS
N.C.S. Pyrotechnie et Technologies SAS
OEA Europe SARL
Autoliv Holding France SAS (former Franco Suédoise d'Investissement)
Germany
Autoliv Beteiligungsgesellschaft mbH
Autoliv BV & Co. KG
Hungary
Autoliv Kft.
India
Autoliv India Private Ltd.
Autoliv Inflators India Private Ltd
Indonesia
P.T. Autoliv Indonesia
Japan
Autoliv Japan Ltd.
Mexico
Autoliv Mexican Holdings S. de R.L. de C.V.
Autoliv Mexico East S.A. de C.V.
Autoliv Mexico S.A. de C.V.
Autoliv Safety Technology de Mexico S.A. de C.V.
Autoliv Steering Wheels Mexico S. de R.L. de C.V.
The Netherlands
Autoliv Autosicherheitstechnik B.V.
Philippines
Autoliv Cebu Safety Manufacturing, Inc.
Poland
Autoliv Poland Sp. z o.o.
Romania
Autoliv Romania S.R.L.
Russia
OOO Autoliv
South Africa
Autoliv Southern Africa (Pty) Ltd
South Korea
Autoliv Corporation
Spain
Autoliv BKI S.A.U.
Autoliv KLE S.A.U.
Autosafety S.L.
Sweden
Autoliv AB
Autoliv Development AB
Autoliv East Europe AB
Autoliv Sverige AB
Switzerland
Autoliv Switzerland GmBH
Thailand
Autoliv Asia ROH, Ltd.
Autoliv Thailand Ltd.
Tunisia
Autoliv Tunisia SARL (former ASW3)
Turkey
Autoliv Cankor Otomotiv Emniyet Sistemleri Sanayi Ve Ticaret A.S.
United Kingdom
Airbags International Ltd
Autoliv U.K. Holding Ltd
USA
ACap Insurance Inc. (Utah)
Autoliv ASP, Inc. (Indiana)
Autoliv Holding, Inc. (Delaware)
Autoliv Safety Technology, Inc. (Delaware)
OEA, Inc. (Delaware)
All subsidiaries are wholly owned unless otherwise indicated. The names of certain subsidiaries, which considered in the aggregate would not constitute a "significant subsidiary" as such term is defined in the regulations under the federal securities laws, have been omitted from the foregoing list.
Exhibit 23
Consent of Independent Registered Public Accounting Firm
We consent to the incorporation by reference in the following Registration Statements:
of our reports dated February 20, 2025, with respect to the consolidated financial statements of Autoliv, Inc. and the effectiveness of internal control over financial reporting of Autoliv, Inc. included in this Annual Report (Form 10-K) of Autoliv, Inc. for the year ended December 31, 2024.
/s/ Ernst & Young AB
Stockholm, Sweden
February 20, 2025
Exhibit 31.1
CERTIFICATION of
the Chief Executive Officer
Pursuant to Section 302 of the Sarbanes-Oxley Act of 2002
I, Mikael Bratt, certify that:
1. I have reviewed this annual report on Form 10-K of AUTOLIV, INC.;
2. Based on my knowledge, this report does not contain any untrue statement of a material fact or omit to state a material fact necessary to make the statements made, in light of the circumstances under which such statements were made, not misleading with respect to the period covered by this report;
3. Based on my knowledge, the financial statements, and other financial information included in this report, fairly present in all material respects the financial condition, results of operations and cash flows of the registrant as of, and for, the periods presented in this report;
4. The registrant’s other certifying officer and I are responsible for establishing and maintaining disclosure controls and procedures (as defined in Exchange Act Rules 13a-15(e) and 15d-15(e)) and internal control over financial reporting (as defined in Exchange Act Rules 13a -15(f) and 15d-15(f)) for the registrant and have:
a. Designed such disclosure controls and procedures, or caused such disclosure controls and procedures to be designed under our supervision, to ensure that material information relating to the registrant, including its consolidated subsidiaries, is made known to us by others within those entities, particularly during the period in which this report is being prepared;
b. Designed such internal control over financial reporting, or caused such internal control over financial reporting to be designed under our supervision, to provide reasonable assurance regarding the reliability of financial reporting and the preparation of financial statements for external purposes in accordance with generally accepted accounting principles;
c. Evaluated the effectiveness of the registrant’s disclosure controls and procedures and presented in this report our conclusions about the effectiveness of the disclosure controls and procedures, as of the end of the period covered by this report based on such evaluation; and
d. Disclosed in this report any change in the registrant’s internal control over financial reporting that occurred during the registrant’s most recent fiscal quarter (the registrant’s fourth fiscal quarter in the case of an annual report) that has materially affected, or is reasonably likely to materially affect, the registrant’s internal control over financial reporting; and
5. The registrant’s other certifying officer(s) and I have disclosed, based on our most recent evaluation of internal control over financial reporting, to the registrant’s auditors and the audit committee of the registrant’s board of directors (or persons performing the equivalent functions):
a. All significant deficiencies and material weaknesses in the design or operation of internal control over financial reporting which are reasonably likely to adversely affect the registrant’s ability to record, process, summarize and report financial information; and
b. Any fraud, whether or not material, that involves management or other employees who have a significant role in the registrant’s internal control over financial reporting.
Date: February 20, 2025 |
|
|
|
/s/ Mikael Bratt |
|
Mikael Bratt |
|
Chief Executive Officer |
|
Exhibit 31.2
CERTIFICATION of
the Chief Financial Officer
Pursuant to Section 302 of the Sarbanes-Oxley Act of 2002
I, Fredrik Westin, certify that:
1. I have reviewed this annual report on Form 10-K of AUTOLIV, INC.;
2. Based on my knowledge, this report does not contain any untrue statement of a material fact or omit to state a material fact necessary to make the statements made, in light of the circumstances under which such statements were made, not misleading with respect to the period covered by this report;
3. Based on my knowledge, the financial statements, and other financial information included in this report, fairly present in all material respects the financial condition, results of operations and cash flows of the registrant as of, and for, the periods presented in this report;
4. The registrant’s other certifying officer and I are responsible for establishing and maintaining disclosure controls and procedures (as defined in Exchange Act Rules 13a-15(e) and 15d-15(e)) and internal control over financial reporting (as defined in Exchange Act Rules 13a -15(f) and 15d-15(f)) for the registrant and have:
a. Designed such disclosure controls and procedures, or caused such disclosure controls and procedures to be designed under our supervision, to ensure that material information relating to the registrant, including its consolidated subsidiaries, is made known to us by others within those entities, particularly during the period in which this report is being prepared;
b. Designed such internal control over financial reporting, or caused such internal control over financial reporting to be designed under our supervision, to provide reasonable assurance regarding the reliability of financial reporting and the preparation of financial statements for external purposes in accordance with generally accepted accounting principles;
c. Evaluated the effectiveness of the registrant’s disclosure controls and procedures and presented in this report our conclusions about the effectiveness of the disclosure controls and procedures, as of the end of the period covered by this report based on such evaluation; and
d. Disclosed in this report any change in the registrant’s internal control over financial reporting that occurred during the registrant’s most recent fiscal quarter (the registrant’s fourth fiscal quarter in the case of an annual report) that has materially affected, or is reasonably likely to materially affect, the registrant’s internal control over financial reporting; and
5. The registrant’s other certifying officer(s) and I have disclosed, based on our most recent evaluation of internal control over financial reporting, to the registrant’s auditors and the audit committee of the registrant’s board of directors (or persons performing the equivalent functions):
a. All significant deficiencies and material weaknesses in the design or operation of internal control over financial reporting which are reasonably likely to adversely affect the registrant’s ability to record, process, summarize and report financial information; and
b. Any fraud, whether or not material, that involves management or other employees who have a significant role in the registrant’s internal control over financial reporting.
Date: February 20, 2025 |
|
|
|
/s/ Fredrik Westin |
|
Fredrik Westin |
|
Chief Financial Officer |
|
Exhibit 32.1
Certification of Chief Executive Officer
Pursuant to 18 U.S.C Section 1350,
as Adopted Pursuant to
Section 906 of the Sarbanes-Oxley Act of 2002
In connection with the annual report on Form 10-K of Autoliv, Inc. (the “Company”) for the period ended December 31, 2024, filed with the Securities and Exchange Commission on the date hereof (the “Report”), I, Mikael Bratt, Chief Executive Officer of the Company, hereby certify, pursuant to 18 U.S.C. Section 1350, as adopted pursuant to Section 906 of the Sarbanes-Oxley Act of 2002, that, to the best of my knowledge:
1. The Report fully complies with the requirements of Section 13(a) or 15(d) of the Securities Exchange Act of 1934; and
2. The information contained in the Report fairly presents, in all material respects, the financial condition and results of operations of the Company.
|
/s/ Mikael Bratt |
|
Name: Mikael Bratt |
|
Title: Chief Executive Officer |
|
Date: February 20, 2025 |
|
This certification accompanies the Report pursuant to Section 906 of the Sarbanes-Oxley Act of 2002 and shall not, except to the extent required by the Sarbanes-Oxley Act of 2002, be deemed filed by the Company for purposes of Section 18 of the Securities Exchange Act of 1934, as amended.
A signed original of this written statement required by Section 906 of the Sarbanes-Oxley Act of 2002 has been provided to the Company and will be retained by the Company and furnished to the Securities and Exchange Commission or its staff upon request.
Exhibit 32.2
Certification of Chief Financial Officer
Pursuant to 18 U.S.C Section 1350,
as Adopted Pursuant to
Section 906 of the Sarbanes-Oxley Act of 2002
In connection with the annual report on Form 10-K of Autoliv, Inc. (the “Company”) for the period ended December 31, 2024, filed with the Securities and Exchange Commission on the date hereof (the “Report”), I, Fredrik Westin, Chief Financial Officer of the Company, hereby certify, pursuant to 18 U.S.C. Section 1350, as adopted pursuant to Section 906 of the Sarbanes-Oxley Act of 2002, that, to the best of my knowledge:
1. The Report fully complies with the requirements of Section 13(a) or 15(d) of the Securities Exchange Act of 1934; and
2. The information contained in the Report fairly presents, in all material respects, the financial condition and results of operations of the Company.
|
/s/ Fredrik Westin |
|
Name: Fredrik Westin |
|
Title: Chief Financial Officer |
|
Date: February 20, 2025 |
|
This certification accompanies the Report pursuant to Section 906 of the Sarbanes-Oxley Act of 2002 and shall not, except to the extent required by the Sarbanes-Oxley Act of 2002, be deemed filed by the Company for purposes of Section 18 of the Securities Exchange Act of 1934, as amended.
A signed original of this written statement required by Section 906 of the Sarbanes-Oxley Act of 2002 has been provided to the Company and will be retained by the Company and furnished to the Securities and Exchange Commission or its staff upon request.
Exhibit 97.1
Autoliv, Inc. Compensation Recoupment Policy
(As amended on September 14, 2023)
“Accounting Restatement” means any accounting restatement due to the material noncompliance of the Corporation with any financial reporting requirement under the securities laws, including any required accounting restatement to correct an error in previously issued financial statements that is material to the previously issued financial statements (a “Big R” restatement), or that would result in a material misstatement if the error were corrected in the current period or left uncorrected in the current period (a “little r” restatement).
“Board” means the Board of Directors of the Corporation.
“Compensation Committee” means the Leadership Development and Compensation Committee of the Board.
“Corporation” means Autoliv, Inc.
“Covered Employee” means any employee of the Corporation or any of its subsidiaries who was a participant in any equity plan maintained by the Corporation.
“Covered Executive” means the officers identified as executive officers by the Corporation in the Corporation’s filings with the SEC pursuant to Item 401(b) of Regulation S-K and the officers required to file reports under Section 16 of the Exchange Act.
“Determination Date” means the date upon which the Compensation Committee shall have determined that a particular Covered Employee engaged in Harmful Conduct.
Adopted: September 14, 2023
Exhibit 97.1
“Discretionary Policy” has the meaning set forth in Section 4.1 hereof.
“Discretionary Policy Effective Date” has the meaning set forth in Section 1.2 hereof.
“Equity Award” means any stock option or full value award (such as restricted stock units or performance units) with respect to the common stock of the Corporation granted on or after January 1, 2018.
“Erroneously Awarded Compensation” is the amount of Incentive-Based Compensation Received that exceeds the amount of Incentive-Based Compensation that otherwise would have been Received had it been determined based on the restated amounts, computed without regard to any taxes paid. For Incentive-Based Compensation based on stock price or total stockholder return (TSR), where the amount of Erroneously Awarded Compensation is not subject to mathematical recalculation directly from the information in an Accounting Restatement: (i) the amount shall be based on a reasonable estimate of the effect of the Accounting Restatement on the stock price or TSR upon which the Incentive-Based Compensation was Received; and (ii) the Corporation shall maintain documentation of the determination of that reasonable estimate and provide such documentation to the NYSE.
“Financial Reporting Measure” is any measure that is determined and presented in accordance with the accounting principles used in preparing the Corporation’s financial statements, and any measure that is derived wholly or in part from such measure. Stock price and TSR (and any measures that are derived wholly or in part from stock price or TSR) are also Financial Reporting Measures. A Financial Reporting Measure need not be presented within the Corporation’s financial statements or included in a filing with the SEC.
“Harmful Conduct” means (i) any conduct that would constitute “cause” as defined in Equity Award grant agreements; (ii) any violation of the Corporation’s standards of business conduct and ethics, insider trading policy or other published policies; (iii) egregious misconduct including, but not limited to, fraud, criminal activities, falsification of Corporation records, theft, violent acts or threats of violence, or (iv) a violation of law, unethical conduct or inappropriate behavior that causes substantial reputational harm to the Corporation, creates a significant risk that the Corporation will be liable for damages, equitable relief, or other forms of legal liability, or, if it were publicly known, would have a significant likelihood of causing adverse publicity; (v) the commission of act or omission that causes an Covered Employee or the Corporation to be in violation of federal or state securities laws, rules or regulations; or (vi) any misconduct, negligence or dereliction of duty by an Covered Employee that caused or contributed to the need for the restatement or material adjustment of any financial performance measure upon which the payment or his or her Non-Equity Incentive Compensation and/or vesting of his or her Equity Awards are or were based.
“Incentive-Based Compensation” means any compensation that is granted, earned, or vested based wholly or in part upon the attainment of a Financial Reporting Measure. See Appendix A to this Policy for a list of examples of Incentive-Based Compensation.
Adopted: September 14, 2023
Exhibit 97.1
“Mandatory Policy” has the meaning set forth in Section 3.1 hereof.
“Mandatory Policy Effective Date” means October 1, 2023.
“Non-Equity Incentive Compensation” means any variable cash compensation paid to a Covered Employee, wholly or partly based on financial information related to the Corporation or one or more of its subsidiaries since January 1, 2018.
“Other Covered Person” has the meaning set forth in Section 3.8 hereof.
“Policy” means this Autoliv, Inc. Compensation Recoupment Policy (including both the Mandatory Policy and the Discretionary Policy).
“Received” means the Corporation’s fiscal period during which the Financial Reporting Measure specified in the Incentive-Based Compensation award is attained, even if the payment or grant of the Incentive-Based Compensation occurs after the end of that period.
“SEC” means the United States Securities and Exchange Commission.
“Shares” means shares of common stock of the Corporation.
Adopted: September 14, 2023
Exhibit 97.1
Adopted: September 14, 2023
Exhibit 97.1
Adopted: September 14, 2023
Exhibit 97.1
Adopted: September 14, 2023
Exhibit 97.1
(Section 4.1.1 and 4.1.2 collectively referred to herein as the “Discretionary Policy”).
Adopted: September 14, 2023
Exhibit 97.1
Adopted: September 14, 2023
Exhibit 97.1
APPENDIX A
Examples of Incentive-Based Compensation
Examples of compensation that constitutes Incentive-Based Compensation for purposes of the Mandatory Policy include, but are not limited to, the following:
Examples of compensation that does not constitute Incentive-Based Compensation for purposes of the Mandatory Policy include the following:
Adopted: September 14, 2023
Exhibit 97.1
Adopted: September 14, 2023
Exhibit 97.1
APPENDIX B
ACKNOWLEDGEMENT OF AUTOLIV, INC.
COMPENSATION RECOUPMENT POLICY
By my signature below, I acknowledge that I have received and reviewed the Autoliv, Inc. Compensation Recoupment Policy (the “Policy”) and that I am fully bound by, and subject to, all of the terms and conditions of the Policy (as may be amended, restated, supplemented or otherwise modified from time to time). In the event of any inconsistency between the Policy and the terms of any employment agreement to which I am a party, or the terms of any compensation plan, program or agreement under which any compensation has been granted, awarded, earned or paid, the terms of the Policy shall govern. In the event it is determined by the Compensation Committee that any amounts granted, awarded, earned or paid to me must be forfeited or reimbursed to the Corporation, I will promptly take any action necessary to effectuate such forfeiture and/or reimbursement. Any capitalized terms used in this Acknowledgment without definition shall have the meaning set forth in the Policy.
Signature:
Name (printed):
Date:
Adopted: September 14, 2023