UNITED STATES
SECURITIES AND EXCHANGE COMMISSION
WASHINGTON, D.C. 20549
FORM 8-K
CURRENT REPORT
Pursuant to Section 13 or 15(d) of the Securities Exchange Act of 1934
Date of Report (Date of earliest event reported): September 04, 2024 |
Culp, Inc.
(Exact name of Registrant as Specified in Its Charter)
North Carolina |
1-12597 |
56-1001967 |
||
(State or Other Jurisdiction |
(Commission File Number) |
(IRS Employer |
||
|
|
|
|
|
1823 Eastchester Drive |
|
|||
High Point, North Carolina |
|
27265 |
||
(Address of Principal Executive Offices) |
|
(Zip Code) |
||
Registrant’s Telephone Number, Including Area Code: 336 889-5161 |
|
(Former Name or Former Address, if Changed Since Last Report)
Check the appropriate box below if the Form 8-K filing is intended to simultaneously satisfy the filing obligation of the registrant under any of the following provisions:
Securities registered pursuant to Section 12(b) of the Act:
|
|
Trading |
|
|
Common stock, par value $0.05 per share |
|
CULP |
|
The New York Stock Exchange |
Indicate by check mark whether the registrant is an emerging growth company as defined in Rule 405 of the Securities Act of 1933 (§ 230.405 of this chapter) or Rule 12b-2 of the Securities Exchange Act of 1934 (§ 240.12b-2 of this chapter).
Emerging growth company ☐
If an emerging growth company, indicate by check mark if the registrant has elected not to use the extended transition period for complying with any new or revised financial accounting standards provided pursuant to Section 13(a) of the Exchange Act. ☐
This report and the exhibits attached hereto contain “forward-looking statements” within the meaning of the federal securities laws, including the Private Securities Litigation Reform Act of 1995 (Section 27A of the Securities Act of 1933 and Section 21E of the Securities and Exchange Act of 1934). Such statements are inherently subject to risks and uncertainties that may cause actual events and results to differ materially from such statements. Forward-looking statements are statements that include projections, expectations, or beliefs about future events or results or otherwise are not statements of historical fact. Such statements are often but not always characterized by qualifying words such as “expect,” “believe,” “will,” “may,” “should,” “could,” “potential,” “continue,” “target,” “predict”, “seek,” “anticipate,” “estimate,” “intend,” “plan,” “project,” and their derivatives, and include but are not limited to statements about expectations, projections, or trends for our future operations, strategic initiatives and plans, restructuring actions, production levels, new product launches, sales, profit margins, profitability, operating (loss) income, capital expenditures, working capital levels, cost savings (including, without limitation, anticipated cost savings from restructuring actions), income taxes, SG&A or other expenses, pre-tax (loss) income, earnings, cash flow, and other performance or liquidity measures, as well as any statements regarding dividends, share repurchases, liquidity, use of cash and cash requirements, borrowing capacity, investments, potential acquisitions, restructuring and restructuring-related charges, expenses, and/or credits, future economic or industry trends, public health epidemics, or future developments. There can be no assurance that we will realize these expectations or meet our guidance, or that these beliefs will prove correct.
Factors that could influence the matters discussed in such statements include the level of housing starts and sales of existing homes, consumer confidence, trends in disposable income, and general economic conditions. Decreases in these economic indicators could have a negative effect on our business and prospects. Likewise, increases in interest rates, particularly home mortgage rates, and increases in consumer debt or the general rate of inflation, could affect us adversely. The future performance of our business depends in part on our success in conducting and finalizing acquisition negotiations and integrating acquired businesses into our existing operations. Changes in consumer tastes or preferences toward products not produced by us could erode demand for our products. Changes in tariffs or trade policy, including changes in U.S. trade enforcement priorities, or changes in the value of the U.S. dollar versus other currencies, could affect our financial results because a significant portion of our operations are located outside the United States. Strengthening of the U.S. dollar against other currencies could make our products less competitive on the basis of price in markets outside the United States, and strengthening of currencies in Canada and China can have a negative impact on our sales of products produced in those places. In addition, because our foreign operations use the U.S. dollar as their functional currency, changes in the exchange rate between the local currency of those operations and the U.S dollar can affect our reported profits from those foreign operations. Also, economic or political instability in international areas could affect our operations or sources of goods in those areas, as well as demand for our products in international markets. The impact of public health epidemics on employees, customers, suppliers, and the global economy, such as the recent coronavirus pandemic, could also adversely affect our operations and financial performance. In addition, the impact of potential asset impairments, including impairments of property, plant, and equipment, inventory, or intangible assets, as well as the impact of valuation allowances applied against our net deferred income tax assets, could affect our financial results. Increases in freight costs, labor costs, and raw material prices, including increases in market prices for petrochemical products, can also significantly affect the prices we pay for shipping, labor, and raw materials, respectively, and in turn, increase our operating costs and decrease our profitability. Also, our success in diversifying our supply chain with reliable partners to effectively service our global platform could affect our operations and adversely affect our financial results. Finally, the future performance of our business also depends on our ability to successfully restructure our mattress fabric operations and return the segment to profitability. Further information about these factors, as well as other factors that could affect our future operations or financial results and the matters discussed in forward-looking statements, is included in Item 1A “Risk Factors” in our most recent Form 10-K and Form 10-Q reports filed with the Securities and Exchange Commission.
Many of these factors are macroeconomic in nature and are, therefore, beyond our control. Should one or more of these risks or uncertainties materialize, or should underlying assumptions prove incorrect, our actual results, performance or achievements may vary materially from those described in this report and the exhibits attached
2
hereto as anticipated, believed, estimated, expected, intended, planned or projected. The forward-looking statements included in this report and the exhibits attached hereto are made only as of the date of of this report. Unless required by United States federal securities laws, we neither intend nor assume any obligation to update these forward-looking statements for any reason after the date of this report to conform these statements to actual results or to changes in our expectations. A forward-looking statement is neither a prediction nor a guarantee of future events or circumstances, and those future events or circumstances may not occur. Additional risks and uncertainties that we do not presently know about or that we currently consider to be immaterial may also affect our business operations or financial results.
3
Item 2.02 – Results of Operations and Financial Condition
On September 4, 2024, we issued a news release to announce our financial results for our first quarter ended July 28, 2024. A copy of the news release is attached hereto as Exhibit 99.1.
The information set forth in this Item 2.02 of this Current Report, and in Exhibit 99.1, is intended to be “furnished” under Item 2.02 of Form 8-K. Such information shall not be deemed “filed” for the purposes of Section 18 of the Securities Exchange Act of 1934, as amended, nor shall it be deemed incorporated by reference in any filing under the Securities Act of 1933, as amended, except as shall be expressly set forth by specific reference in such filing.
The news release contains adjusted income statement information for the three month periods ending July 28, 2024, and July 30, 2023, respectively, which disclose adjusted loss from operations, a non-U.S. GAAP performance measure that eliminates items which are not expected to occur on a recurring or regular basis. For the three month period ending July 28, 2024, these items include, as applicable for the period presented, restructuring related charges and restructuring expense associated with the gradual discontinuation of the mattress fabrics manufacturing operations in Quebec, Canada, the process of selling the facility located in Quebec, Canada, and the relocation of certain equipment from Quebec, Canada, to Stokesdale, North Carolina; restructuring expense associated with consolidation of the mattress fabrics sewn cover operation in Haiti from two buildings into one building; and restructuring expense associated with the rationalization of the upholstery fabrics finishing operation located in Shanghai, China. For the three month period ending July 30, 2023, these items include, as applicable for the period presented, restructuring related charges and restructuring expense associated with the discontinued production of cut and sewn upholstery kits in Ouanaminthe, Haiti. The company has included this adjusted information in order to show operational performance excluding the effects of items not expected to occur on a recurring or regular basis. Details of these calculations and a reconciliation to information from our U.S. GAAP financial statements are set forth in the news release. Management believes this presentation aids in the comparison of financial results among comparable financial periods. Management uses adjusted income statement information in evaluating the financial performance of our overall operations and business segments. Also, adjusted income statement information is used as a performance measure in our incentive-based executive compensation program. We note, however, that this adjusted income statement information should not be viewed in isolation or as a substitute for loss from operations calculated in accordance with U.S. GAAP.
The news release contains disclosures about our net cash, which is a non-U.S. GAAP liquidity measure that we define as cash and cash equivalents (which we sometimes refer to as “cash”) plus investments that are available to fund operations minus the total amount of outstanding borrowings under our lines of credit or other debt instruments. Details of these calculations and a reconciliation to information from our U.S. GAAP financial statements are set forth in the news release. We believe this non-GAAP measure is useful to investors as it provides a way to compare our cash position across periods on a consistent basis, regardless of the impact of financing activities. Net cash should not be viewed in isolation by investors and should not be used as a substitute for GAAP measures of liquidity.
The news release contains disclosures about free cash flow, a non-U.S. GAAP liquidity measure that we define as net cash (used in) provided by operating activities, less cash capital expenditures and any payments on vendor-financed capital expenditures, plus any proceeds from sale of property, plant, and equipment, plus proceeds from note receivable, plus proceeds from the sale of investments associated with our rabbi trust, less the purchase of investments associated with our rabbi trust, and plus or minus the effects of foreign currency exchange rate changes on cash and cash equivalents, in each case to the extent any such amount is incurred during the period presented. Details of these calculations and a reconciliation to information from our U.S. GAAP financial statements are set forth in the news release. Management believes the disclosure of free cash flow provides useful information to investors because it measures our available cash flow for potential debt repayment, stock repurchases, dividends, additions to cash and investments, or other corporate purposes. We note, however, that not all of the company’s free cash flow is available for discretionary spending, as we may have mandatory debt payments and other cash requirements that must be deducted from our cash available for future use. In operating our business, management uses free cash flow to make decisions about what commitments of cash to make for operations, such as capital expenditures (and possible financing arrangements for these expenditures), purchases of inventory or supplies, SG&A expenditure levels, compensation, and other commitments of cash, while still allowing for adequate cash to meet known future commitments for cash, such as debt repayment, and also for making decisions about dividend payments and share repurchases.
The news release contains disclosures about our Adjusted EBITDA, which is a non-U.S. GAAP performance measure that reflects net (loss) income excluding income tax expense (benefit), net interest income, and restructuring expense or credit and restructuring related charges or credits, as well as depreciation and amortization expense, and stock-based compensation expense. This measure also excludes other non-recurring charges and credits associated with our business, if and to the extent any such amount is incurred during the period presented.
4
Details of these calculations and a reconciliation to information from our U.S. GAAP financial statements are set forth in the news release. We believe presentation of Adjusted EBITDA is useful to investors because earnings before interest income and expense, income taxes, depreciation and amortization, and similar performance measures that exclude certain charges from earnings, are often used by investors and financial analysts in evaluating and comparing companies in our industry. We note, however, that such measures are not defined uniformly by various companies, with differing expenses being excluded from net income to calculate these performance measures. For this reason, Adjusted EBITDA should not be viewed in isolation by investors and should not be used as a substitute for net income (loss) calculated in accordance with GAAP, nor should it be used for direct comparisons with similarly titled performance measures reported by other companies. Use of Adjusted EBITDA as an analytical tool has limitations in that this measure does not reflect all expenses that are necessary to fund and operate our business, including funds required to pay taxes, service our debt, and fund capital expenditures, among others. Management uses Adjusted EBITDA to help it analyze the company’s earnings and operating performance, by excluding the effects of expenses that depend upon capital structure and debt level, tax provisions, and non-cash items such as depreciation, amortization and stock-based compensation expense that do not require immediate uses of cash.
The news release contains disclosures about return on capital employed for both the entire company and for individual business segments. We define return on capital employed as adjusted operating income (loss) (measured on a trailing twelve-month basis) divided by average capital employed (excluding intangible assets related to acquisitions at the divisional level only). Adjusted operating income (loss) excludes certain charges or credits that are not expected to occur on a recurring or regular basis, if applicable for the period presented. Average capital employed is calculated over rolling five fiscal periods, depending on which quarter is being presented. Details of these calculations and a reconciliation to information from our U.S. GAAP financial statements are set forth in the news release. We believe return on capital employed is an accepted measure of earnings efficiency in relation to capital employed, but it is a non-U.S. GAAP performance measure that is not defined or calculated in the same manner by all companies. This measure should not be considered in isolation or as an alternative to net income (loss) or other performance measures, but we believe it provides useful information to investors by comparing the adjusted operating income (loss) we produce to the net asset base used to generate that income (loss). Also, adjusted operating income (loss) on a trailing twelve-months basis does not necessarily indicate results that would be expected for the full fiscal year or for the following twelve months. We note that, particularly for return on capital employed measured at the segment level, not all assets and expenses are allocated to our operating segments, and there are assets and expenses at the corporate (unallocated) level that may provide support to a segment’s operations and yet are not included in the assets and expenses used to calculate that segment’s return on capital. Thus, the average return on capital employed for the company’s segments will generally be different from the company’s overall return on capital employed. Management uses return on capital employed to evaluate the company’s earnings efficiency and the relative performance of its segments.
Item 7.01 Regulation FD Disclosure
On September 4, 2024, we posted a restructuring presentation to our website at https://culpinc.gcs-web.com/ (the "Restructuring Presentation"). A copy of the Restructuring Presentation is furnished as Exhibit 99.2 to this Current Report on Form 8-K and is incorporated into this Item 7.01 by reference. We expect to use the Restructuring Presentation from time to time, in whole or in part, and possibly with modifications, in connection with presentations to investors, analysts, and others.
The information contained in the Restructuring Presentation is summary information that should be considered within the context of the company's filings with the Securities and Exchange Commission ("SEC") and other public announcements the company may make by press release or otherwise from time to time. The Restructuring Presentation speaks only as of the date of this Current Report on Form 8-K. We undertake no duty or obligation to publicly update or revise the information contained in the Restructuring Presentation, including, without limitation, any targets, estimates, goals, or other forward-looking statements, although we may do so from time to time. Any such updating may be made through the filing of other reports or documents with the SEC, through press releases, or through other public disclosure.
The Restructuring Presentation contains statements intended as "forward-looking statements" that are subject to the cautionary statements about forward-looking statements set forth on page 2 of the Restructuring Presentation. By furnishing the information contained in this Current Report on Form 8-K, including Exhibit 99.2, we make no admission as to the materiality of any such information.
The information in this Current Report on Form 8-K, including Exhibit 99.2, is being furnished and shall not be deemed "filed" for purposes of Section 18 of the Securities Exchange Act of 1934, as amended (the "Exchange Act"), or otherwise subject to the liabilities of that Section, nor shall it be deemed incorporated by reference in any filing under the Securities Act of 1933, as amended, or the Exchange Act, except as shall be expressly set forth by specific reference to such filing.
5
Item 9.01 (d) – Exhibits
6
EXHIBIT INDEX
Exhibit Number |
|
Exhibit |
|
|
|
99.1 |
|
|
|
|
|
99.2 |
|
|
|
|
|
104 |
|
Cover Page Interactive Data File (embedded within the Inline XBRL document) |
7
SIGNATURES
Pursuant to the requirements of the Securities Exchange Act of 1934, the Registrant has duly caused this report to be signed on its behalf by the undersigned, hereunto duly authorized.
|
|
CULP, INC. (Registrant) |
|
|
|
|
|
|
|
By: |
/s/ Kenneth R. Bowling |
|
|
|
Chief Financial Officer |
|
|
|
(principal financial officer and principal accounting officer) |
|
|
|
|
Dated September 4, 2024
8
Exhibit 99.1

CULP ANNOUNCES RESULTS FOR FIRST QUARTER FISCAL 2025, HIGHLIGHTED BY
A 14.2% SEQUENTIAL INCREASE IN SALES AND STABLE CASH POSITION;
PROVIDES UPDATE ON RESTRUCTURING AND IMPROVED FINANCIAL OUTLOOK
HIGH POINT, N.C. (September 4, 2024) ─ Culp, Inc. (NYSE: CULP) (together with its consolidated subsidiaries, “CULP”) today reported financial and operating results for the first quarter ended July 28, 2024.
Fiscal 2025 First Quarter Financial Highlights
- up 14.2% compared sequentially to last quarter
- sequentially, upholstery fabrics segment sales up 19.7% and inventory down 4.6%,
mattress fabrics segment sales up 9.0% and inventory down 8.6%
- segment operating income of $1.7 million, up 28.9% year-over-year and 75.6% sequentially
- segment operating margin of 6.0% for the quarter
- Non-GAAP loss from operations of $(4.1) million (see reconciliation table on page 12)
- Operating performance for the quarter affected by manufacturing inefficiencies primarily
related to the significant restructuring activity underway in the mattress fabrics segment
- Stable net cash position of $9.5 million (see reconciliation table on page 8), with only
$560,000 use of cash since end of fiscal 2024 despite significant restructuring activity
Financial Outlook
- Consolidated net sales for second quarter expected to be flat sequentially
- As a result of the restructuring initiatives, currently expect to return to near break-even
adjusted EBITDA (excluding restructuring and related charges) in the second quarter of
fiscal 2025, and to return to positive consolidated adjusted operating income (excluding
restructuring and related charges) in the third quarter of fiscal 2025.
Iv Culp, President and Chief Executive Officer of Culp, Inc., said, “Our sales results for the first quarter reflected strong sequential improvement as compared to the fourth quarter of last fiscal year, with mattress fabrics sales up 9.0% and upholstery fabrics sales up 19.7%. While we continue to experience challenged macro industry conditions, our sequential sales growth was better than expected, and year-over-year consolidated sales were flat despite the overall industry weakness.
"Our upholstery fabrics segment also delivered a significant improvement in operating income, both year-over-year and sequentially, with 6.0% operating margins for the quarter. The strategic actions we have taken in this segment are working, as we have reduced our cost structure while maintaining and enhancing our ability to grow sales. However, as expected, operating performance for our mattress fabrics segment was pressured by manufacturing inefficiencies primarily related to our significant restructuring activity.
-MORE-
CULP Announces Results for First Quarter Fiscal 2025
Page 2
September 4, 2024
While this negatively and disproportionately affected operating performance for the quarter, our use of cash was minimal, with our net cash position only $560,000 lower as compared to the end of fiscal 2024. We are pleased that both segments reduced inventory from the end of fiscal 2024 despite the strong sequential increase in sales.
"We are also encouraged by the progress of our restructuring initiatives. While mattress fabrics operating results are being pressured by these actions in the first half of the fiscal year, especially in the first quarter, we believe we are on schedule to deliver our targeted improvement outcomes, including a return to near break-even adjusted EBITDA in the second quarter and a return to positive consolidated adjusted operating income in the third quarter. The restructuring is a significant undertaking that impacts people, plant consolidations, equipment relocation, and process improvements, but with it, we are successfully lowering our cost structure despite weak demand. We are extremely thankful for our dedicated employees as they execute our plan to return to profitable operating results post-restructuring.
"Looking ahead, we are encouraged by (1) our solid and improving market positions in both businesses; (2) our consistently profitable upholstery fabrics business; (3) expected further improvement in our hospitality fabrics and Read Window businesses; and (4) the steady progress we are making to restructure our mattress fabrics business. We anticipate industry conditions may remain pressured during fiscal 2025, although we also believe there is some stabilizing of industry trends. We expect the strategic actions we are taking will position us for a return to profitability at current demand levels and further growth opportunities as market conditions improve," added Culp.
Restructuring Update
The restructuring plan announced on May 1, 2024, primarily focused on the company's mattress fabrics segment, is progressing as planned. The consolidation of the company's sewn mattress cover operation in Haiti was completed during the first quarter, and the consolidation of the company's North American mattress fabrics operation is well underway (including the phased wind-down and closure of its manufacturing facility in Canada and move of certain knitting and finishing equipment to its facility in North Carolina).
The company still expects to generate $10.0 - $11.0 million in annualized savings and operating improvements after the restructuring initiatives are fully implemented by the end of the calendar year, with most of the restructuring benefit realized during the second half of fiscal 2025.
In addition, based on restructuring activities that have been completed along with updated estimates on those that remain in process, the company now expects to incur total restructuring and restructuring-related costs and charges of $5.1 million in fiscal 2025, of which $3.0 million is now expected to be cash expenditures. The company expects to fund approximately $2.0 million of the cash costs with proceeds from the sale of excess manufacturing equipment and proceeds from a building lease termination in Haiti.
These restructuring and restructuring-related costs and charges exclude any gain on the sale of real estate, the amount and timing of which is currently unknown but which will ultimately reduce the amount of the restructuring charges incurred. The company is actively marketing and showing the real estate, and currently anticipates receiving approximately $9.0 to $10.0 million in cash proceeds (net of all taxes and commissions) from its eventual sale.
First Quarter Fiscal 2025 Results versus First Quarter Fiscal 2024 Results
-MORE-
CULP Announces Results for First Quarter Fiscal 2025
Page 3
September 4, 2024
Business Segment Highlights
Mattress Fabrics Segment (“CHF”)
Upholstery Fabrics Segment (“CUF”)
Balance Sheet, Cash Flow, and Liquidity
-MORE-
CULP Announces Results for First Quarter Fiscal 2025
Page 4
September 4, 2024
Conference Call
Culp, Inc. will hold a conference call to discuss financial results for the fiscal 2025 first quarter on Thursday, September 5, 2024, at 9:00 a.m. Eastern Time. A live webcast of this call can be accessed on the “Upcoming Events” section on the investor relations page of the company’s website, www.culp.com. A replay of the webcast will be available for 30 days under the “Past Events” section on the investor relations page of the company’s website, beginning at 2:00 p.m. Eastern Time on September 5, 2024.
Investor Relations Contact
Ken Bowling, Executive Vice President, Chief Financial Officer, and Treasurer:
(336) 881-5630
krbowling@culp.com
About the Company
Culp, Inc. is one of the largest marketers of mattress fabrics for bedding and upholstery fabrics for residential and commercial furniture in North America. The company markets a variety of fabrics to its global customer base of leading bedding and furniture companies, including fabrics produced at Culp’s manufacturing facilities and fabrics sourced through other suppliers. Culp has manufacturing and sourcing capabilities located in the United States, Canada, China, Haiti, Turkey, and Vietnam.
Forward Looking Statements
This release contains “forward-looking statements” within the meaning of the federal securities laws, including the Private Securities Litigation Reform Act of 1995 (Section 27A of the Securities Act of 1933 and Section 21E of the Securities and Exchange Act of 1934). Such statements are inherently subject to risks and uncertainties that may cause actual events and results to differ materially from such statements. Forward-looking statements are statements that include projections, expectations, or beliefs about future events or results or otherwise are not statements of historical fact. Such statements are often but not always characterized by qualifying words such as “expect,” “believe,” “will,” “may,” “should,” “could,” “potential,” “continue,” “target,” “predict”, “seek,” “anticipate,” “estimate,” “intend,” “plan,” “project,” and their derivatives, and include but are not limited to statements about expectations, projections, or trends for our future operations, strategic initiatives and plans, restructuring actions, production levels, new product launches, sales, profit margins, profitability, operating (loss) income, capital expenditures, working capital levels, cost savings (including, without limitation, anticipated cost savings from restructuring actions), income taxes, SG&A or other expenses, pre-tax (loss) income, earnings, cash flow, and other performance or liquidity measures, as well as any statements regarding dividends, share repurchases, liquidity, use of cash and cash requirements, borrowing capacity, investments, potential acquisitions, restructuring and restructuring-related charges, expenses, and/or
-MORE-
CULP Announces Results for First Quarter Fiscal 2025
Page 5
September 4, 2024
credits, future economic or industry trends, public health epidemics, or future developments. There can be no assurance that we will realize these expectations or meet our guidance, or that these beliefs will prove correct.
Factors that could influence the matters discussed in such statements include the level of housing starts and sales of existing homes, consumer confidence, trends in disposable income, and general economic conditions. Decreases in these economic indicators could have a negative effect on our business and prospects. Likewise, increases in interest rates, particularly home mortgage rates, and increases in consumer debt or the general rate of inflation, could affect us adversely. The future performance of our business depends in part on our success in conducting and finalizing acquisition negotiations and integrating acquired businesses into our existing operations. Changes in consumer tastes or preferences toward products not produced by us could erode demand for our products. Changes in tariffs or trade policy, including changes in U.S. trade enforcement priorities, or changes in the value of the U.S. dollar versus other currencies, could affect our financial results because a significant portion of our operations are located outside the United States. Strengthening of the U.S. dollar against other currencies could make our products less competitive on the basis of price in markets outside the United States, and strengthening of currencies in Canada and China can have a negative impact on our sales of products produced in those places. In addition, because our foreign operations use the U.S. dollar as their functional currency, changes in the exchange rate between the local currency of those operations and the U.S dollar can affect our reported profits from those foreign operations. Also, economic or political instability in international areas could affect our operations or sources of goods in those areas, as well as demand for our products in international markets. The impact of public health epidemics on employees, customers, suppliers, and the global economy, such as the recent coronavirus pandemic, could also adversely affect our operations and financial performance. In addition, the impact of potential asset impairments, including impairments of property, plant, and equipment, inventory, or intangible assets, as well as the impact of valuation allowances applied against our net deferred income tax assets, could affect our financial results. Increases in freight costs, labor costs, and raw material prices, including increases in market prices for petrochemical products, can also significantly affect the prices we pay for shipping, labor, and raw materials, respectively, and in turn, increase our operating costs and decrease our profitability. Also, our success in diversifying our supply chain with reliable partners to effectively service our global platform could affect our operations and adversely affect our financial results. Finally, the future performance of our business also depends on our ability to successfully restructure our mattress fabric operations and return the segment to profitability. Further information about these factors, as well as other factors that could affect our future operations or financial results and the matters discussed in forward-looking statements, is included in Item 1A “Risk Factors” in our most recent Form 10-K and Form 10-Q reports filed with the Securities and Exchange Commission.
Many of these factors are macroeconomic in nature and are, therefore, beyond our control. Should one or more of these risks or uncertainties materialize, or should underlying assumptions prove incorrect, our actual results, performance or achievements may vary materially from those described in this release as anticipated, believed, estimated, expected, intended, planned or projected. The forward-looking statements included in this release are made only as of the date of this report. Unless required by United States federal securities laws, we neither intend nor assume any obligation to update these forward-looking statements for any reason after the date of this release to conform these statements to actual results or to changes in our expectations. A forward-looking statement is neither a prediction nor a guarantee of future events or circumstances, and those future events or circumstances may not occur. Additional risks and uncertainties that we do not presently know about or that we currently consider to be immaterial may also affect our business operations or financial results.
-MORE-
CULP Announces Results for First Quarter Fiscal 2025
Page 6
September 4, 2024
CULP, INC.
CONSOLIDATED STATEMENTS OF NET LOSS
FOR THE THREE MONTHS ENDED JULY 28, 2024, AND JULY 30, 2023
Unaudited
(Amounts in Thousands, Except for Per Share Data)
|
|
THREE MONTHS ENDED |
|
|||||||||||||||||
|
|
Amount |
|
|
|
|
|
Percent of Sales |
|
|||||||||||
|
|
(1) |
|
|
(1) |
|
|
|
|
|
|
|
|
|
|
|||||
|
|
July 28, |
|
|
July 30, |
|
|
% Over |
|
|
July 28, |
|
|
July 30, |
|
|||||
|
|
2024 |
|
|
2023 |
|
|
(Under) |
|
|
2024 |
|
|
2023 |
|
|||||
Net sales |
|
$ |
56,537 |
|
|
$ |
56,662 |
|
|
|
(0.2 |
)% |
|
|
100.0 |
% |
|
|
100.0 |
% |
Cost of sales (1) |
|
|
(51,461 |
) |
|
|
(49,577 |
) |
|
|
3.8 |
% |
|
|
91.0 |
% |
|
|
87.5 |
% |
Gross profit |
|
|
5,076 |
|
|
|
7,085 |
|
|
|
(28.4 |
)% |
|
|
9.0 |
% |
|
|
12.5 |
% |
Selling, general and administrative |
|
|
(9,296 |
) |
|
|
(9,829 |
) |
|
|
(5.4 |
)% |
|
|
16.4 |
% |
|
|
17.3 |
% |
Restructuring expense (2) (3) |
|
|
(2,631 |
) |
|
|
(338 |
) |
|
|
678.4 |
% |
|
|
4.7 |
% |
|
|
0.6 |
% |
Loss from operations |
|
|
(6,851 |
) |
|
|
(3,082 |
) |
|
|
122.3 |
% |
|
|
(12.1 |
)% |
|
|
(5.4 |
)% |
Interest expense |
|
|
(28 |
) |
|
|
— |
|
|
|
100.0 |
% |
|
|
(0.0 |
)% |
|
|
— |
|
Interest income |
|
|
262 |
|
|
|
345 |
|
|
|
(24.1 |
)% |
|
|
0.5 |
% |
|
|
0.6 |
% |
Other (expense) income |
|
|
(404 |
) |
|
|
96 |
|
|
|
(520.8 |
)% |
|
|
(0.7 |
)% |
|
|
0.2 |
% |
Loss before income taxes |
|
|
(7,021 |
) |
|
|
(2,641 |
) |
|
|
165.8 |
% |
|
|
(12.4 |
)% |
|
|
(4.7 |
)% |
Income tax expense (4) |
|
|
(240 |
) |
|
|
(701 |
) |
|
|
(65.8 |
)% |
|
|
(3.4 |
)% |
|
|
(26.5 |
)% |
Net loss |
|
$ |
(7,261 |
) |
|
$ |
(3,342 |
) |
|
|
117.3 |
% |
|
|
(12.8 |
)% |
|
|
(5.9 |
)% |
|
|
|
|
|
|
|
|
|
|
|
|
|
|
|
|
|||||
Net loss per share - basic |
|
$ |
(0.58 |
) |
|
$ |
(0.27 |
) |
|
|
114.8 |
% |
|
|
|
|
|
|
||
Net loss per share - diluted |
|
$ |
(0.58 |
) |
|
$ |
(0.27 |
) |
|
|
114.8 |
% |
|
|
|
|
|
|
||
Average shares outstanding-basic |
|
|
12,470 |
|
|
|
12,332 |
|
|
|
1.1 |
% |
|
|
|
|
|
|
||
Average shares outstanding-diluted |
|
|
12,470 |
|
|
|
12,332 |
|
|
|
1.1 |
% |
|
|
|
|
|
|
||
Notes
(1) See page 12 for a Reconciliation of Selected Income Statement Information to Adjusted Results for the three months ending July 28, 2024, and July 30, 2023.
(2) During the three-month period ending July 28, 2024, restructuring expense of $2.6 million represents $2.5 million and $132,000, related to the mattress fabrics and upholstery fabrics segments, respectively. The $2.6 million of restructuring expense represents (i) $1.9 million related to the gradual discontinuation of operations and the process of selling the manufacturing facility located in Quebec, Canada, which includes $875,000 of additional depreciation related to the shortening of useful lives of equipment, employee termination benefits of $539,000, lease termination costs of $264,000, impairment charges and losses on the disposal of equipment totaling $95,000, and other associated costs of $90,000; (ii) $470,0000 related to the consolidation of two leased facilities at our mattress cover operation located in Ouanaminthe, Haiti, which includes lease termination costs of $406,000, employee termination benefits of $48,000, and other associated costs of $16,000; (iii) $167,000 of other associated costs related to the relocation of certain equipment from the mattress fabrics manufacturing facility located in Quebec, Canada to the U.S. facility located in Stokesdale, North Carolina; and (iv) $132,000 related to reducing costs within our upholstery fabrics segment which includes employee termination benefits of $102,000 and other associated costs of $30,000.
(3) Restructuring expense of $338,000 for the three-month period ending July 30, 2023, relates to the discontinuation of production of cut and sewn upholstery kits at our facility located in Ouanaminthe, Haiti and represents an impairment charge of $237,000 related mostly to certain machinery and equipment and $101,000 for employee termination benefits.
(4) Percent of sales column for income tax expense is calculated as a percent of loss before income taxes.
-MORE-
CULP Announces Results for First Quarter Fiscal 2025
Page 7
September 4, 2024
CONSOLIDATED BALANCE SHEETS
JULY 28, 2024, JULY 30, 2023, AND APRIL 28, 2024
Unaudited
(Amounts in Thousands)
|
|
Amounts |
|
|
|
|
|
|
|
|
|
|
||||||||
|
|
(Condensed) |
|
|
(Condensed) |
|
|
|
|
|
|
|
|
(Condensed) |
|
|||||
|
|
July 28, |
|
|
July 30, |
|
|
Increase (Decrease) |
|
|
* April 28, |
|
||||||||
|
|
2024 |
|
|
2023 |
|
|
Dollars |
|
|
Percent |
|
|
2024 |
|
|||||
Current assets |
|
|
|
|
|
|
|
|
|
|
|
|
|
|
|
|||||
Cash and cash equivalents |
|
$ |
13,472 |
|
|
$ |
16,812 |
|
|
|
(3,340 |
) |
|
|
(19.9 |
)% |
|
$ |
10,012 |
|
Short-term investments - rabbi trust |
|
|
954 |
|
|
|
791 |
|
|
|
163 |
|
|
|
20.6 |
% |
|
|
903 |
|
Accounts receivable, net |
|
|
21,587 |
|
|
|
22,612 |
|
|
|
(1,025 |
) |
|
|
(4.5 |
)% |
|
|
21,138 |
|
Inventories |
|
|
41,668 |
|
|
|
43,817 |
|
|
|
(2,149 |
) |
|
|
(4.9 |
)% |
|
|
44,843 |
|
Short-term note receivable |
|
|
268 |
|
|
|
252 |
|
|
|
16 |
|
|
|
6.3 |
% |
|
|
264 |
|
Current income taxes receivable |
|
|
532 |
|
|
|
202 |
|
|
|
330 |
|
|
|
163.4 |
% |
|
|
350 |
|
Assets held for sale |
|
|
607 |
|
|
|
— |
|
|
|
607 |
|
|
|
100.0 |
% |
|
|
— |
|
Other current assets |
|
|
3,590 |
|
|
|
3,578 |
|
|
|
12 |
|
|
|
0.3 |
% |
|
|
3,371 |
|
Total current assets |
|
|
82,678 |
|
|
|
88,064 |
|
|
|
(5,386 |
) |
|
|
(6.1 |
)% |
|
|
80,881 |
|
|
|
|
|
|
|
|
|
|
|
|
|
|
|
|
|
|||||
Property, plant & equipment, net |
|
|
30,476 |
|
|
|
34,929 |
|
|
|
(4,453 |
) |
|
|
(12.7 |
)% |
|
|
33,182 |
|
Right of use assets |
|
|
4,483 |
|
|
|
7,466 |
|
|
|
(2,983 |
) |
|
|
(40.0 |
)% |
|
|
6,203 |
|
Intangible assets |
|
|
1,782 |
|
|
|
2,158 |
|
|
|
(376 |
) |
|
|
(17.4 |
)% |
|
|
1,876 |
|
Long-term investments - rabbi trust |
|
|
7,089 |
|
|
|
7,204 |
|
|
|
(115 |
) |
|
|
(1.6 |
)% |
|
|
7,102 |
|
Long-term note receivable |
|
|
1,394 |
|
|
|
1,661 |
|
|
|
(267 |
) |
|
|
(16.1 |
)% |
|
|
1,462 |
|
Deferred income taxes |
|
|
528 |
|
|
|
476 |
|
|
|
52 |
|
|
|
10.9 |
% |
|
|
518 |
|
Other assets |
|
|
709 |
|
|
|
944 |
|
|
|
(235 |
) |
|
|
(24.9 |
)% |
|
|
830 |
|
Total assets |
|
$ |
129,139 |
|
|
$ |
142,902 |
|
|
|
(13,763 |
) |
|
|
(9.6 |
)% |
|
$ |
132,054 |
|
|
|
|
|
|
|
|
|
|
|
|
|
|
|
|
|
|||||
Current liabilities |
|
|
|
|
|
|
|
|
|
|
|
|
|
|
|
|||||
Line of credit - China |
|
|
4,017 |
|
|
|
— |
|
|
|
4,017 |
|
|
|
100.0 |
% |
|
- |
|
|
Accounts payable - trade |
|
|
26,540 |
|
|
|
26,468 |
|
|
|
72 |
|
|
|
0.3 |
% |
|
|
25,607 |
|
Accounts payable - capital expenditures |
|
|
56 |
|
|
|
257 |
|
|
|
(201 |
) |
|
|
(78.2 |
)% |
|
|
343 |
|
Operating lease liability - current |
|
|
1,565 |
|
|
|
2,558 |
|
|
|
(993 |
) |
|
|
(38.8 |
)% |
|
|
2,061 |
|
Deferred compensation - current |
|
|
954 |
|
|
|
791 |
|
|
|
163 |
|
|
|
20.6 |
% |
|
|
903 |
|
Deferred revenue |
|
|
1,600 |
|
|
|
1,026 |
|
|
|
574 |
|
|
|
55.9 |
% |
|
|
1,495 |
|
Accrued expenses |
|
|
6,097 |
|
|
|
6,615 |
|
|
|
(518 |
) |
|
|
(7.8 |
)% |
|
|
6,726 |
|
Accrued restructuring |
|
|
633 |
|
|
|
10 |
|
|
|
623 |
|
|
N.M. |
|
|
|
— |
|
|
Income taxes payable - current |
|
|
759 |
|
|
|
526 |
|
|
|
233 |
|
|
|
44.3 |
% |
|
|
972 |
|
Total current liabilities |
|
|
42,221 |
|
|
|
38,251 |
|
|
|
3,970 |
|
|
|
10.4 |
% |
|
|
38,107 |
|
|
|
|
|
|
|
|
|
|
|
|
|
|
|
|
|
|||||
Operating lease liability - long-term |
|
|
2,219 |
|
|
|
2,994 |
|
|
|
(775 |
) |
|
|
(25.9 |
)% |
|
|
2,422 |
|
Income taxes payable - long-term |
|
|
2,180 |
|
|
|
2,710 |
|
|
|
(530 |
) |
|
|
(19.6 |
)% |
|
|
2,088 |
|
Deferred income taxes |
|
|
6,449 |
|
|
|
5,864 |
|
|
|
585 |
|
|
|
10.0 |
% |
|
|
6,379 |
|
Deferred compensation - long-term |
|
|
6,946 |
|
|
|
6,966 |
|
|
|
(20 |
) |
|
|
(0.3 |
)% |
|
|
6,929 |
|
Total liabilities |
|
|
60,015 |
|
|
|
56,785 |
|
|
|
3,230 |
|
|
|
5.7 |
% |
|
|
55,925 |
|
Shareholders' equity |
|
|
69,124 |
|
|
|
86,117 |
|
|
|
(16,993 |
) |
|
|
(19.7 |
)% |
|
|
76,129 |
|
Total liabilities and shareholders' |
|
$ |
129,139 |
|
|
$ |
142,902 |
|
|
|
(13,763 |
) |
|
|
(9.6 |
)% |
|
$ |
132,054 |
|
Shares outstanding |
|
|
12,470 |
|
|
|
12,344 |
|
|
|
126 |
|
|
|
1.0 |
% |
|
|
12,470 |
|
* Derived from audited financial statements.
-MORE-
CULP Announces Results for First Quarter Fiscal 2025
Page 8
September 4, 2024
CULP, INC.
SUMMARY OF CASH AND DEBT
JULY 28, 2024, JULY 30, 2023, AND APRIL 28, 2024
Unaudited
(Amounts in Thousands)
|
|
Amounts |
|
|
|
|
||||||
|
|
July 28, |
|
|
July 30, |
|
|
April 28, |
|
|||
|
|
2024 |
|
|
2023 |
|
|
2024* |
|
|||
Cash: |
|
|
|
|
|
|
|
|
|
|||
Cash and cash equivalents |
|
$ |
13,472 |
|
|
$ |
16,812 |
|
|
$ |
10,012 |
|
Less Debt: |
|
|
|
|
|
|
|
|
|
|||
Line of credit - China |
|
|
4,017 |
|
|
|
— |
|
|
|
— |
|
Net Cash Position |
|
$ |
9,455 |
|
|
$ |
16,812 |
|
|
$ |
10,012 |
|
|
|
|
|
|
|
|
|
|
|
|||
-MORE-
CULP Announces Results for First Quarter Fiscal 2025
Page 9
September 4, 2024
CULP, INC.
CONSOLIDATED STATEMENTS OF CASH FLOWS
FOR THE THREE MONTHS ENDED JULY 28, 2024, AND JULY 30, 2023
Unaudited
(Amounts in Thousands)
|
|
THREE MONTHS ENDED |
|
|||||
|
|
Amounts |
|
|||||
|
|
July 28, |
|
|
July 30, |
|
||
|
|
2024 |
|
|
2023 |
|
||
Cash flows from operating activities: |
|
|
|
|
|
|
||
Net loss |
|
$ |
(7,261 |
) |
|
$ |
(3,342 |
) |
Adjustments to reconcile net loss to net cash used in |
|
|
|
|
|
|
||
Depreciation |
|
|
1,581 |
|
|
|
1,635 |
|
Non-cash inventory credit |
|
|
(268 |
) |
|
|
(717 |
) |
Amortization |
|
|
99 |
|
|
|
96 |
|
Stock-based compensation |
|
|
176 |
|
|
|
322 |
|
Deferred income taxes |
|
|
60 |
|
|
|
(86 |
) |
Gain on sale of equipment |
|
|
(4 |
) |
|
|
(270 |
) |
Non-cash restructuring expense |
|
|
1,643 |
|
|
|
237 |
|
Foreign currency exchange loss (gain) |
|
|
45 |
|
|
|
(372 |
) |
Changes in assets and liabilities: |
|
|
|
|
|
|
||
Accounts receivable |
|
|
(445 |
) |
|
|
2,112 |
|
Inventories |
|
|
3,458 |
|
|
|
1,792 |
|
Other current assets |
|
|
(221 |
) |
|
|
(526 |
) |
Other assets |
|
|
90 |
|
|
|
(134 |
) |
Accounts payable |
|
|
884 |
|
|
|
(2,353 |
) |
Deferred revenue |
|
|
105 |
|
|
|
(166 |
) |
Accrued restructuring |
|
|
640 |
|
|
|
10 |
|
Accrued expenses and deferred compensation |
|
|
(478 |
) |
|
|
(2,311 |
) |
Income taxes |
|
|
(310 |
) |
|
|
(362 |
) |
Net cash used in operating activities |
|
|
(206 |
) |
|
|
(4,435 |
) |
Cash flows from investing activities: |
|
|
|
|
|
|
||
Capital expenditures |
|
|
(501 |
) |
|
|
(513 |
) |
Proceeds from the sale of equipment |
|
|
37 |
|
|
|
294 |
|
Proceeds from note receivable |
|
|
90 |
|
|
|
60 |
|
Proceeds from the sale of investments (rabbi trust) |
|
|
229 |
|
|
|
780 |
|
Purchase of investments (rabbi trust) |
|
|
(187 |
) |
|
|
(247 |
) |
Net cash (used in) provided by investing activities |
|
|
(332 |
) |
|
|
374 |
|
Cash flows from financing activities: |
|
|
|
|
|
|
||
Proceeds from line of credit - China |
|
|
4,010 |
|
|
|
— |
|
Net cash provided by financing activities |
|
|
4,010 |
|
|
|
— |
|
Effect of foreign currency exchange rate changes on cash and cash equivalents |
|
|
(12 |
) |
|
|
(91 |
) |
Increase (decrease) in cash and cash equivalents |
|
|
3,460 |
|
|
|
(4,152 |
) |
Cash and cash equivalents at beginning of year |
|
|
10,012 |
|
|
|
20,964 |
|
Cash and cash equivalents at end of year |
|
$ |
13,472 |
|
|
$ |
16,812 |
|
Free Cash Flow (1) |
|
$ |
(550 |
) |
|
$ |
(4,152 |
) |
(1) See next page for Reconciliation of Free Cash Flow for the three months ending July 28, 2024, and July 30, 2023.
-MORE-
CULP Announces Results for First Quarter Fiscal 2025
Page 10
September 4, 2024
CULP, INC.
RECONCILIATION OF FREE CASH FLOW
FOR THE THREE MONTHS ENDED JULY 28, 2024, AND JULY 30, 2023
Unaudited
(Amounts in Thousands)
|
|
THREE MONTHS ENDED |
|
|||||
|
|
Amounts |
|
|||||
|
|
July 28, |
|
|
July 30, |
|
||
|
|
2024 |
|
|
2023 |
|
||
A) Net cash used in operating activities |
|
$ |
(206 |
) |
|
$ |
(4,435 |
) |
B) Minus: Capital expenditures |
|
|
(501 |
) |
|
|
(513 |
) |
C) Plus: Proceeds from the sale of equipment |
|
|
37 |
|
|
|
294 |
|
D) Plus: Proceeds from note receivable |
|
|
90 |
|
|
|
60 |
|
E) Plus: Proceeds from the sale of investments (rabbi trust) |
|
|
229 |
|
|
|
780 |
|
F) Minus: Purchase of investments (rabbi trust) |
|
|
(187 |
) |
|
|
(247 |
) |
G) Effects of foreign currency exchange rate changes on cash and cash equivalents |
|
|
(12 |
) |
|
|
(91 |
) |
Free Cash Flow |
|
$ |
(550 |
) |
|
$ |
(4,152 |
) |
-MORE-
CULP Announces Results for First Quarter Fiscal 2025
Page 11
September 4, 2024
CULP, INC.
STATEMENTS OF OPERATIONS BY SEGMENT
FOR THE THREE MONTHS ENDED JULY 28, 2024, AND JULY 30, 2023
Unaudited
(Amounts in Thousands)
|
|
THREE MONTHS ENDED |
|
|||||||||||||||||
|
|
Amounts |
|
|
|
|
|
Percent of Total Sales |
|
|||||||||||
|
|
July 28, |
|
|
July 30, |
|
|
% Over |
|
|
July 28, |
|
|
July 30, |
|
|||||
Net Sales by Segment |
|
2024 |
|
|
2023 |
|
|
(Under) |
|
|
2024 |
|
|
2023 |
|
|||||
Mattress Fabrics |
|
$ |
28,076 |
|
|
$ |
29,222 |
|
|
|
(3.9 |
)% |
|
|
49.7 |
% |
|
|
51.6 |
% |
Upholstery Fabrics |
|
|
28,461 |
|
|
|
27,440 |
|
|
|
3.7 |
% |
|
|
50.3 |
% |
|
|
48.4 |
% |
Net Sales |
|
$ |
56,537 |
|
|
$ |
56,662 |
|
|
|
(0.2 |
)% |
|
|
100.0 |
% |
|
|
100.0 |
% |
|
|
|
|
|
|
|
|
|
|
|
|
|
|
|
|
|||||
Gross (Loss) Profit |
|
|
|
|
|
|
|
|
|
|
Gross Margin |
|
||||||||
Mattress Fabrics |
|
$ |
(326 |
) |
|
$ |
1,994 |
|
|
|
(116.3 |
)% |
|
|
(1.2 |
)% |
|
|
6.8 |
% |
Upholstery Fabrics |
|
|
5,518 |
|
|
|
5,270 |
|
|
|
4.7 |
% |
|
|
19.4 |
% |
|
|
19.2 |
% |
Total Segment Gross Profit |
|
|
5,192 |
|
|
|
7,264 |
|
|
|
(28.5 |
)% |
|
|
9.2 |
% |
|
|
12.8 |
% |
Restructuring Related Charge (1) |
|
|
(116 |
) |
|
|
(179 |
) |
|
|
(35.2 |
)% |
|
|
(0.2 |
)% |
|
|
(0.3 |
)% |
Gross Profit |
|
$ |
5,076 |
|
|
$ |
7,085 |
|
|
|
(28.4 |
)% |
|
|
9.0 |
% |
|
|
12.5 |
% |
|
|
|
|
|
|
|
|
|
|
|
|
|
|
|
|
|||||
Selling, General and Administrative |
|
|
|
|
|
|
|
|
|
|
Percent of Sales |
|
||||||||
Mattress Fabrics |
|
$ |
3,223 |
|
|
$ |
3,393 |
|
|
|
(5.0 |
)% |
|
|
11.5 |
% |
|
|
11.6 |
% |
Upholstery Fabrics |
|
|
3,806 |
|
|
|
3,941 |
|
|
|
(3.4 |
)% |
|
|
13.4 |
% |
|
|
14.4 |
% |
Unallocated Corporate Expenses |
|
|
2,267 |
|
|
|
2,495 |
|
|
|
(9.1 |
)% |
|
|
4.0 |
% |
|
|
4.4 |
% |
Selling, General and Administrative |
|
$ |
9,296 |
|
|
$ |
9,829 |
|
|
|
(5.4 |
)% |
|
|
16.4 |
% |
|
|
17.3 |
% |
|
|
|
|
|
|
|
|
|
|
|
|
|
||||||||
(Loss) Income from Operations |
|
|
|
|
|
|
|
|
|
|
Operating Margin |
|
||||||||
Mattress Fabrics |
|
$ |
(3,549 |
) |
|
$ |
(1,398 |
) |
|
|
153.9 |
% |
|
|
(12.6 |
)% |
|
|
(4.8 |
)% |
Upholstery Fabrics |
|
$ |
1,712 |
|
|
$ |
1,328 |
|
|
|
28.9 |
% |
|
|
6.0 |
% |
|
|
4.8 |
% |
Unallocated Corporate Expenses |
|
$ |
(2,267 |
) |
|
$ |
(2,495 |
) |
|
|
(9.1 |
)% |
|
|
(4.0 |
)% |
|
|
(4.4 |
)% |
Total Segment Loss from |
|
|
(4,104 |
) |
|
|
(2,565 |
) |
|
|
60.0 |
% |
|
|
(7.3 |
)% |
|
|
(4.5 |
)% |
Restructuring Related Charge (1) |
|
|
(116 |
) |
|
|
(179 |
) |
|
|
(35.2 |
)% |
|
|
(0.2 |
)% |
|
|
(0.3 |
)% |
Restructuring Expense (1) |
|
|
(2,631 |
) |
|
|
(338 |
) |
|
|
678.4 |
% |
|
|
(4.7 |
)% |
|
|
(0.6 |
)% |
Loss from Operations |
|
$ |
(6,851 |
) |
|
$ |
(3,082 |
) |
|
|
122.3 |
% |
|
|
(12.1 |
)% |
|
|
(5.4 |
)% |
|
|
|
|
|
|
|
|
|
|
|
|
|
|
|
|
|||||
|
|
|
|
|
|
|
|
|
|
|
|
|
|
|
|
|||||
Return on Capital Employed (ttm) (2) |
|
|
|
|
|
|
|
|
|
|
|
|
|
|
|
|||||
Mattress Fabrics |
|
|
(14.6 |
)% |
|
|
(25.4 |
)% |
|
|
(42.5 |
)% |
|
|
|
|
|
|
||
Upholstery Fabrics |
|
|
70.5 |
% |
|
|
18.2 |
% |
|
|
287.4 |
% |
|
|
|
|
|
|
||
Unallocated Corporate |
|
N.M. |
|
|
N.M. |
|
|
N.M. |
|
|
|
|
|
|
|
|||||
Consolidated |
|
|
(16.3 |
)% |
|
|
(28.6 |
)% |
|
|
(43.0 |
)% |
|
|
|
|
|
|
||
Capital Employed (3) |
|
|
|
|
|
|
|
|
|
|
|
|
|
|
|
|||||
Mattress Fabrics |
|
$ |
56,410 |
|
|
$ |
61,056 |
|
|
|
(7.6 |
)% |
|
|
|
|
|
|
||
Upholstery Fabrics |
|
|
6,906 |
|
|
|
12,357 |
|
|
|
(44.1 |
)% |
|
|
|
|
|
|
||
Unallocated Corporate |
|
|
5,171 |
|
|
|
4,086 |
|
|
|
26.6 |
% |
|
|
|
|
|
|
||
Consolidated |
|
$ |
68,487 |
|
|
$ |
77,499 |
|
|
|
(11.6 |
)% |
|
|
|
|
|
|
||
|
|
|
|
|
|
|
|
|
|
|
|
|
|
|
|
|||||
Depreciation Expense by Segment |
|
|
|
|
|
|
|
|
|
|
|
|
|
|
|
|||||
Mattress Fabrics (4) |
|
$ |
2,297 |
|
|
$ |
1,455 |
|
|
|
57.9 |
% |
|
|
|
|
|
|
||
Upholstery Fabrics |
|
|
159 |
|
|
|
180 |
|
|
|
(11.7 |
)% |
|
|
|
|
|
|
||
Depreciation Expense |
|
$ |
2,456 |
|
|
$ |
1,635 |
|
|
|
50.2 |
% |
|
|
|
|
|
|
||
Notes
(1) See page 12 for a Reconciliation of Selected Income Statement Information to Adjusted Results for the three months ending July 28, 2024, and July 30, 2023.
(2) See pages 14 through 17 for calculation of Return on Capital Employed by Segment for the trailing twelve months ending July 28, 2024, and July 30, 2023, and a reconciliation to information from our U.S. GAAP financial statements.
(3) The capital employed balances are as of July 28, 2024, and July 30, 2023.
(4) During the three-month period ending July 28, 2024, depreciation expense for the mattress fabrics segment included additional depreciation expense related to the shortening of useful lives of equipment associated with the gradual discontinuation of operations regarding our manufacturing facility located in Quebec, Canada. The amount of additional depreciation expense was $875,000 and was classified as restructuring expense.
-MORE-
CULP Announces Results for First Quarter Fiscal 2025
Page 12
September 4, 2024
CULP, INC.
RECONCILIATION OF SELECTED INCOME STATEMENT INFORMATION TO ADJUSTED RESULTS
FOR THREE MONTHS ENDED JULY 28, 2024, AND JULY 30, 2023
Unaudited
(Amounts in Thousands)
|
|
As Reported |
|
|
|
|
|
Adjusted Results |
|
|||
|
|
July 28, |
|
|
|
|
|
July 28, |
|
|||
|
|
2024 |
|
|
Adjustments |
|
|
2024 |
|
|||
|
|
|
|
|
|
|
|
|
|
|||
Net sales |
|
$ |
56,537 |
|
|
|
— |
|
|
$ |
56,537 |
|
Cost of sales (1) |
|
|
(51,461 |
) |
|
|
116 |
|
|
|
(51,345 |
) |
Gross profit |
|
|
5,076 |
|
|
|
116 |
|
|
|
5,192 |
|
Selling, general and administrative |
|
|
(9,296 |
) |
|
|
— |
|
|
|
(9,296 |
) |
Restructuring expense (2) |
|
|
(2,631 |
) |
|
|
2,631 |
|
|
|
— |
|
Loss from operations |
|
$ |
(6,851 |
) |
|
|
2,747 |
|
|
$ |
(4,104 |
) |
Notes
(1) During the three-month period ending July 28, 2024, cost of sales included a restructuring related charge totaling $116,000 for losses on the disposal of obsolete inventory related to the gradual discontinuation of operations at our manufacturing facility located in Quebec, Canada.
(2) During the three-month period ending July 28, 2024, restructuring expense of $2.6 million represents $2.5 million and $132,000, related to the mattress fabrics and upholstery fabrics segments, respectively. The $2.6 million of restructuring expense represents (i) $1.9 million related to the gradual discontinuation of operations and the process of selling the manufacturing facility located in Quebec, Canada, which includes $875,000 of additional depreciation related to the shortening of useful lives of equipment, employee termination benefits of $539,000, lease termination costs of $264,000, impairment charges and losses on the disposal of equipment totaling $95,000, and other associated costs of $90,000; (ii) $470,0000 related to the consolidation of two leased facilities at our mattress cover operation located in Ouanaminthe, Haiti, which includes lease termination costs of $406,000, employee termination benefits of $48,000, and other associated costs of $16,000; (iii) $167,000 of other associated costs related to the relocation of certain equipment from the mattress fabrics manufacturing facility located in Quebec, Canada to the U.S. facility located in Stokesdale, North Carolina; and (iv) $132,000 related to reducing costs within our upholstery fabrics segment which includes employee termination benefits of $102,000 and other associated costs of $30,000.
|
|
As Reported |
|
|
|
|
|
Adjusted Results |
|
|||
|
|
July 30, |
|
|
|
|
|
July 30, |
|
|||
|
|
2023 |
|
|
Adjustments |
|
|
2023 |
|
|||
|
|
|
|
|
|
|
|
|
|
|||
Net sales |
|
$ |
56,662 |
|
|
|
— |
|
|
$ |
56,662 |
|
Cost of sales (1) |
|
|
(49,577 |
) |
|
|
179 |
|
|
|
(49,398 |
) |
Gross profit |
|
|
7,085 |
|
|
|
179 |
|
|
|
7,264 |
|
Selling, general and administrative |
|
|
(9,829 |
) |
|
|
— |
|
|
|
(9,829 |
) |
Restructuring expense (2) |
|
|
(338 |
) |
|
|
338 |
|
|
|
— |
|
Loss from operations |
|
$ |
(3,082 |
) |
|
|
517 |
|
|
$ |
(2,565 |
) |
Notes
(1) During the three-months ended July 30, 2023, cost of sales included a restructuring related charge totaling $179,000 for the markdowns of inventory related to the discontinuation of production of cut and sewn upholstery kits at the company's facility in Ouanaminthe, Haiti.
(2) Restructuring expense of $338,000 for the three-month period ending July 30, 2023, relates to the discontinuation of production of cut and sewn upholstery kits at our facility located in Ouanaminthe, Haiti and represents an impairment charge of $237,000 related mostly to certain machinery and equipment and $101,000 for employee termination benefits.
-MORE-
CULP Announces Results for First Quarter Fiscal 2025
Page 13
September 4, 2024
CULP, INC.
CONSOLIDATED STATEMENTS OF ADJUSTED EBITDA
FOR THE TWELVE MONTHS ENDED JULY 28, 2024, AND JULY 30, 2023
Unaudited
(Amounts in Thousands)
|
|
Quarter |
|
|
Quarter |
|
|
Quarter |
|
|
Quarter |
|
|
Trailing |
|
|||||
|
|
October 29, |
|
|
January 28, |
|
|
April 28, |
|
|
July 28, |
|
|
July 28, |
|
|||||
|
|
2023 |
|
|
2024 |
|
|
2024 |
|
|
2024 |
|
|
2024 |
|
|||||
Net loss |
|
$ |
(2,424 |
) |
|
$ |
(3,188 |
) |
|
$ |
(4,865 |
) |
|
$ |
(7,261 |
) |
|
$ |
(17,738 |
) |
Income tax expense |
|
|
516 |
|
|
|
1,027 |
|
|
|
805 |
|
|
|
240 |
|
|
|
2,588 |
|
Interest income, net |
|
|
(282 |
) |
|
|
(284 |
) |
|
|
(252 |
) |
|
|
(234 |
) |
|
|
(1,052 |
) |
Depreciation expense |
|
|
1,617 |
|
|
|
1,646 |
|
|
|
1,623 |
|
|
|
1,581 |
|
|
|
6,467 |
|
Restructuring (credit) expense |
|
|
144 |
|
|
|
(50 |
) |
|
|
204 |
|
|
|
2,631 |
|
|
|
2,929 |
|
Restructuring related charge (credit) |
|
|
(78 |
) |
|
|
(61 |
) |
|
|
— |
|
|
|
116 |
|
|
|
(23 |
) |
Amortization expense |
|
|
97 |
|
|
|
98 |
|
|
|
99 |
|
|
|
99 |
|
|
|
393 |
|
Stock based compensation |
|
|
163 |
|
|
|
262 |
|
|
|
168 |
|
|
|
176 |
|
|
|
769 |
|
Adjusted EBITDA |
|
$ |
(247 |
) |
|
$ |
(550 |
) |
|
$ |
(2,218 |
) |
|
$ |
(2,652 |
) |
|
$ |
(5,667 |
) |
|
|
|
|
|
|
|
|
|
|
|
|
|
|
|
|
|||||
% Net Sales |
|
|
(0.4 |
)% |
|
|
(0.9 |
)% |
|
|
(4.5 |
)% |
|
|
(4.7 |
)% |
|
|
(2.5 |
)% |
|
|
|
|
|
|
|
|
|
|
|
|
|
|
|
|
|||||
|
|
Quarter |
|
|
Quarter |
|
|
Quarter |
|
|
Quarter |
|
|
Trailing |
|
|||||
|
|
October 30, |
|
|
January 29, |
|
|
April 30, |
|
|
July 30, |
|
|
July 30, |
|
|||||
|
|
2022 |
|
|
2023 |
|
|
2023 |
|
|
2023 |
|
|
2023 |
|
|||||
Net loss (1) |
|
$ |
(12,173 |
) |
|
$ |
(8,968 |
) |
|
$ |
(4,681 |
) |
|
$ |
(3,342 |
) |
|
$ |
(29,164 |
) |
Income tax expense |
|
|
1,150 |
|
|
|
286 |
|
|
|
798 |
|
|
|
701 |
|
|
|
2,935 |
|
Interest income, net |
|
|
(79 |
) |
|
|
(196 |
) |
|
|
(239 |
) |
|
|
(345 |
) |
|
|
(859 |
) |
Depreciation expense |
|
|
1,719 |
|
|
|
1,739 |
|
|
|
1,619 |
|
|
|
1,635 |
|
|
|
6,712 |
|
Restructuring expense |
|
|
615 |
|
|
|
711 |
|
|
|
70 |
|
|
|
338 |
|
|
|
1,734 |
|
Restructuring related charge |
|
|
98 |
|
|
|
— |
|
|
|
— |
|
|
|
179 |
|
|
|
277 |
|
Amortization expense |
|
|
109 |
|
|
|
109 |
|
|
|
115 |
|
|
|
96 |
|
|
|
429 |
|
Stock based compensation |
|
|
313 |
|
|
|
322 |
|
|
|
258 |
|
|
|
322 |
|
|
|
1,215 |
|
Adjusted EBITDA (1) |
|
$ |
(8,248 |
) |
|
$ |
(5,997 |
) |
|
$ |
(2,060 |
) |
|
$ |
(416 |
) |
|
$ |
(16,721 |
) |
|
|
|
|
|
|
|
|
|
|
|
|
|
|
|
|
|||||
% Net Sales |
|
|
(14.1 |
)% |
|
|
(11.4 |
)% |
|
|
(3.4 |
)% |
|
|
(0.7 |
)% |
|
|
(7.3 |
)% |
|
|
|
|
|
|
|
|
|
|
|
|
|
|
|
|
|||||
% Over (Under) |
|
|
(97.0 |
)% |
|
|
(90.8 |
)% |
|
|
7.7 |
% |
|
|
537.5 |
% |
|
|
(66.1 |
)% |
(1) Net loss and adjusted EBITDA for the quarter ended October 30, 2022, and the twelve-month period ending July 30, 2023, includes a non-cash charge totaling $5.2 million, which represents a $2.9 million charge for the write down of inventory to its net realizable value associated with the mattress fabrics segment and $2.3 million related to markdowns of inventory estimated based on the company's policy for aged inventory for both the mattress and upholstery fabrics segments.
-MORE-
CULP Announces Results for First Quarter Fiscal 2025
Page 14
September 4, 2024
CULP, INC.
RETURN ON CAPITAL EMPLOYED BY SEGMENT
FOR THE TWELVE MONTHS ENDED JULY 28, 2024
Unaudited
(Amounts in Thousands)
|
Adjusted Operating |
|
|
|
|
|
|
|
|
|
|
|
|
|
|
|
|
|
|
|
|
|
|
|
|
|
||||||||||||
|
Twelve Months |
|
Average |
|
Return on |
|
|
|
|
|
|
|
|
|
|
|
|
|
|
|
|
|
|
|
|
|
||||||||||||
|
July 28, 2024 (1) |
|
Employed (2) |
|
Employed (3) |
|
|
|
|
|
|
|
|
|
|
|
|
|
|
|
|
|
|
|
|
|
||||||||||||
Mattress Fabrics |
$ |
(8,996 |
) |
$ |
61,649 |
|
|
(14.6 |
)% |
|
|
|
|
|
|
|
|
|
|
|
|
|
|
|
|
|
|
|
|
|||||||||
Upholstery Fabrics |
|
6,170 |
|
|
8,746 |
|
|
70.5 |
% |
|
|
|
|
|
|
|
|
|
|
|
|
|
|
|
|
|
|
|
|
|||||||||
Unallocated Corporate |
|
(9,346 |
) |
|
4,178 |
|
N.M. |
|
|
|
|
|
|
|
|
|
|
|
|
|
|
|
|
|
|
|
|
|
||||||||||
Consolidated |
$ |
(12,172 |
) |
$ |
74,574 |
|
|
(16.3 |
)% |
|
|
|
|
|
|
|
|
|
|
|
|
|
|
|
|
|
|
|
|
|||||||||
|
|
|
|
|
|
|
|
|
|
|
|
|
|
|
|
|
|
|
|
|
|
|
|
|
|
|
||||||||||||
Average Capital Employed |
As of the three Months July 28, 2024 |
|
|
As of the three Months April 28, 2024 |
|
|
As of the three Months January 28, 2024 |
|
||||||||||||||||||||||||||||||
|
Mattress |
|
Upholstery |
|
Unallocated |
|
|
|
|
Mattress |
|
Upholstery |
|
Unallocated |
|
|
|
|
Mattress |
|
Upholstery |
|
Unallocated |
|
|
|
||||||||||||
|
Fabrics |
|
Fabrics |
|
Corporate |
|
Total |
|
|
Fabrics |
|
Fabrics |
|
Corporate |
|
Total |
|
|
Fabrics |
|
Fabrics |
|
Corporate |
|
Total |
|
||||||||||||
Total assets (4) |
$ |
66,713 |
|
|
31,763 |
|
|
30,663 |
|
|
129,139 |
|
|
$ |
72,060 |
|
|
32,629 |
|
|
27,365 |
|
|
132,054 |
|
|
$ |
75,572 |
|
|
38,085 |
|
|
28,341 |
|
|
141,998 |
|
Total liabilities |
|
(10,303 |
) |
|
(24,857 |
) |
|
(24,855 |
) |
|
(60,015 |
) |
|
|
(9,803 |
) |
|
(25,370 |
) |
|
(20,752 |
) |
|
(55,925 |
) |
|
|
(8,234 |
) |
|
(32,201 |
) |
|
(20,767 |
) |
|
(61,202 |
) |
Subtotal |
$ |
56,410 |
|
$ |
6,906 |
|
|
5,808 |
|
$ |
69,124 |
|
|
$ |
62,257 |
|
$ |
7,259 |
|
|
6,613 |
|
$ |
76,129 |
|
|
$ |
67,338 |
|
$ |
5,884 |
|
$ |
7,574 |
|
$ |
80,796 |
|
Cash and cash equivalents |
|
— |
|
|
— |
|
|
(13,472 |
) |
|
(13,472 |
) |
|
|
— |
|
|
— |
|
|
(10,012 |
) |
|
(10,012 |
) |
|
|
— |
|
|
— |
|
|
(12,585 |
) |
|
(12,585 |
) |
Short-term investments - Rabbi Trust |
|
— |
|
|
— |
|
|
(954 |
) |
|
(954 |
) |
|
|
— |
|
|
— |
|
|
(903 |
) |
|
(903 |
) |
|
|
— |
|
|
— |
|
|
(937 |
) |
|
(937 |
) |
Current income taxes receivable |
|
— |
|
|
— |
|
|
(532 |
) |
|
(532 |
) |
|
|
— |
|
|
— |
|
|
(350 |
) |
|
(350 |
) |
|
|
— |
|
|
— |
|
|
(476 |
) |
|
(476 |
) |
Long-term investments - Rabbi Trust |
|
— |
|
|
— |
|
|
(7,089 |
) |
|
(7,089 |
) |
|
|
— |
|
|
— |
|
|
(7,102 |
) |
|
(7,102 |
) |
|
|
— |
|
|
— |
|
|
(7,083 |
) |
|
(7,083 |
) |
Deferred income taxes - non-current |
|
— |
|
|
— |
|
|
(528 |
) |
|
(528 |
) |
|
|
— |
|
|
— |
|
|
(518 |
) |
|
(518 |
) |
|
|
— |
|
|
— |
|
|
(531 |
) |
|
(531 |
) |
Line of credit - China |
|
— |
|
|
— |
|
|
4,017 |
|
|
4,017 |
|
|
|
— |
|
|
— |
|
|
— |
|
|
— |
|
|
|
— |
|
|
— |
|
|
— |
|
|
— |
|
Deferred compensation - current |
|
— |
|
|
— |
|
|
954 |
|
|
954 |
|
|
|
— |
|
|
— |
|
|
903 |
|
|
903 |
|
|
|
— |
|
|
— |
|
|
937 |
|
|
937 |
|
Accrued restructuring |
|
|
|
|
|
633 |
|
|
633 |
|
|
|
— |
|
|
— |
|
|
— |
|
|
— |
|
|
|
— |
|
|
— |
|
|
— |
|
|
— |
|
||
Income taxes payable - current |
|
— |
|
|
— |
|
|
759 |
|
|
759 |
|
|
|
— |
|
|
— |
|
|
972 |
|
|
972 |
|
|
|
— |
|
|
— |
|
|
1,070 |
|
|
1,070 |
|
Income taxes payable - long-term |
|
— |
|
|
— |
|
|
2,180 |
|
|
2,180 |
|
|
|
— |
|
|
— |
|
|
2,088 |
|
|
2,088 |
|
|
|
— |
|
|
— |
|
|
2,072 |
|
|
2,072 |
|
Deferred income taxes - non-current |
|
— |
|
|
— |
|
|
6,449 |
|
|
6,449 |
|
|
|
— |
|
|
— |
|
|
6,379 |
|
|
6,379 |
|
|
|
— |
|
|
— |
|
|
6,177 |
|
|
6,177 |
|
Deferred compensation non-current |
|
— |
|
|
— |
|
|
6,946 |
|
|
6,946 |
|
|
|
— |
|
|
— |
|
|
6,929 |
|
|
6,929 |
|
|
|
— |
|
|
— |
|
|
6,856 |
|
|
6,856 |
|
Total Capital Employed |
$ |
56,410 |
|
$ |
6,906 |
|
$ |
5,171 |
|
$ |
68,487 |
|
|
$ |
62,257 |
|
$ |
7,259 |
|
$ |
4,999 |
|
$ |
74,515 |
|
|
$ |
67,338 |
|
$ |
5,884 |
|
$ |
3,074 |
|
$ |
76,296 |
|
-MORE-
CULP Announces Results for First Quarter Fiscal 2025
Page 15
September 4, 2024
CULP, INC.
RETURN ON CAPITAL EMPLOYED BY SEGMENT - CONTINUED
FOR THE TWELVE MONTHS ENDED JULY 28, 2024
Unaudited
(Amounts in Thousands)
|
As of the three Months October 29, 2023 |
|
|
As of the three Months Ended July 30, 2023 |
|
|
|
|
|
|
||||||||||||||||||||
|
Mattress |
|
Upholstery |
|
Unallocated |
|
|
|
|
Mattress |
|
Upholstery |
|
Unallocated |
|
|
|
|
|
|
|
|
||||||||
|
Fabrics |
|
Fabrics |
|
Corporate |
|
Total |
|
|
Fabrics |
|
Fabrics |
|
Corporate |
|
Total |
|
|
|
|
|
|
||||||||
Total assets (4) |
$ |
75,924 |
|
|
35,082 |
|
|
31,154 |
|
|
142,160 |
|
|
$ |
72,286 |
|
|
37,592 |
|
|
33,024 |
|
|
142,902 |
|
|
|
|
|
|
Total liabilities |
|
(14,739 |
) |
|
(23,758 |
) |
|
(20,035 |
) |
|
(58,532 |
) |
|
|
(11,230 |
) |
|
(25,235 |
) |
|
(20,320 |
) |
|
(56,785 |
) |
|
|
|
|
|
Subtotal |
$ |
61,185 |
|
$ |
11,324 |
|
$ |
11,119 |
|
$ |
83,628 |
|
|
$ |
61,056 |
|
$ |
12,357 |
|
$ |
12,704 |
|
$ |
86,117 |
|
|
|
|
|
|
Cash and cash equivalents |
|
— |
|
|
— |
|
|
(15,214 |
) |
|
(15,214 |
) |
|
|
— |
|
|
— |
|
|
(16,812 |
) |
|
(16,812 |
) |
|
|
|
|
|
Short-term investments - Rabbi Trust |
|
— |
|
|
— |
|
|
(937 |
) |
|
(937 |
) |
|
|
— |
|
|
— |
|
|
(791 |
) |
|
(791 |
) |
|
|
|
|
|
Current income taxes receivable |
|
— |
|
|
— |
|
|
(340 |
) |
|
(340 |
) |
|
|
— |
|
|
— |
|
|
(202 |
) |
|
(202 |
) |
|
|
|
|
|
Long-term investments - Rabbi Trust |
|
— |
|
|
— |
|
|
(6,995 |
) |
|
(6,995 |
) |
|
|
— |
|
|
— |
|
|
(7,204 |
) |
|
(7,204 |
) |
|
|
|
|
|
Deferred income taxes - non-current |
|
— |
|
|
— |
|
|
(472 |
) |
|
(472 |
) |
|
|
— |
|
|
— |
|
|
(476 |
) |
|
(476 |
) |
|
|
|
|
|
Deferred compensation - current |
|
— |
|
|
— |
|
|
937 |
|
|
937 |
|
|
|
— |
|
|
— |
|
|
791 |
|
|
791 |
|
|
|
|
|
|
Accrued restructuring |
|
— |
|
|
— |
|
|
— |
|
|
— |
|
|
|
— |
|
|
— |
|
|
10 |
|
|
10 |
|
|
|
|
|
|
Income taxes payable - current |
|
— |
|
|
— |
|
|
998 |
|
|
998 |
|
|
|
— |
|
|
— |
|
|
526 |
|
|
526 |
|
|
|
|
|
|
Income taxes payable - long-term |
|
— |
|
|
— |
|
|
2,055 |
|
|
2,055 |
|
|
|
— |
|
|
— |
|
|
2,710 |
|
|
2,710 |
|
|
|
|
|
|
Deferred income taxes - non-current |
|
— |
|
|
— |
|
|
5,663 |
|
|
5,663 |
|
|
|
— |
|
|
— |
|
|
5,864 |
|
|
5,864 |
|
|
|
|
|
|
Deferred compensation non-current |
|
— |
|
|
— |
|
|
6,748 |
|
|
6,748 |
|
|
|
— |
|
|
— |
|
|
6,966 |
|
|
6,966 |
|
|
|
|
|
|
Total Capital Employed |
$ |
61,185 |
|
$ |
11,324 |
|
$ |
3,562 |
|
$ |
76,071 |
|
|
$ |
61,056 |
|
$ |
12,357 |
|
$ |
4,086 |
|
$ |
77,499 |
|
|
|
|
|
|
|
|
|
|
|
|
|
|
|
|
|
|
|
|
|
|
|
|
|
|
|
|
|
||||||||
|
Mattress |
|
Upholstery |
|
Unallocated |
|
|
|
|
|
|
|
|
|
|
|
|
|
|
|
|
|
||||||||
|
Fabrics |
|
Fabrics |
|
Corporate |
|
Consolidated |
|
|
|
|
|
|
|
|
|
|
|
|
|
|
|
||||||||
Average Capital Employed (2) |
$ |
61,649 |
|
$ |
8,746 |
|
$ |
4,178 |
|
$ |
74,574 |
|
|
|
|
|
|
|
|
|
|
|
|
|
|
|
||||
Notes
(1) See last page of this presentation for calculation.
(2) Average capital employed was computed using the five quarterly periods ending July 28, 2024, April 28, 2024, January 28, 2024, October 29, 2023, and July 30, 2023.
(3) Return on average capital employed represents the twelve months operating (loss) income as of July 28, 2024, divided by average capital employed. Average capital employed does not include cash and cash equivalents, short-term and long-term investments – Rabbi Trust, income taxes receivable and payable, accrued restructuring, line of credit - China, noncurrent deferred income tax assets and liabilities, and current and non-current deferred compensation.
(4) Intangible assets are included in unallocated corporate for all periods presented and therefore, have no effect on capital employed and return on capital employed for our mattress fabrics and upholstery fabrics segments.
-MORE-
CULP Announces Results for First Quarter Fiscal 2025
Page 16
September 4, 2024
CULP INC.
RETURN ON CAPITAL EMPLOYED BY SEGMENT
FOR THE TWELVE MONTHS ENDED JULY 30, 2023
Unaudited
(Amounts in Thousands)
|
Adjusted Operating |
|
|
|
|
|
|
|
|
|
|
|
|
|
|
|
|
|
|
|
|
|
|
|
|
|
||||||||||||
|
Twelve Months |
|
Average |
|
Return on |
|
|
|
|
|
|
|
|
|
|
|
|
|
|
|
|
|
|
|
|
|
||||||||||||
|
July 30, 2023 (1) |
|
Employed (2) |
|
Employed (3) |
|
|
|
|
|
|
|
|
|
|
|
|
|
|
|
|
|
|
|
|
|
||||||||||||
Mattress Fabrics |
$ |
(17,159 |
) |
$ |
67,685 |
|
|
(25.4 |
)% |
|
|
|
|
|
|
|
|
|
|
|
|
|
|
|
|
|
|
|
|
|||||||||
Upholstery Fabrics |
|
2,781 |
|
|
15,283 |
|
|
18.2 |
% |
|
|
|
|
|
|
|
|
|
|
|
|
|
|
|
|
|
|
|
|
|||||||||
Unallocated Corporate |
|
(10,434 |
) |
|
3,862 |
|
N.M. |
|
|
|
|
|
|
|
|
|
|
|
|
|
|
|
|
|
|
|
|
|
||||||||||
Consolidated |
$ |
(24,812 |
) |
$ |
86,830 |
|
|
(28.6 |
)% |
|
|
|
|
|
|
|
|
|
|
|
|
|
|
|
|
|
|
|
|
|||||||||
|
|
|
|
|
|
|
|
|
|
|
|
|
|
|
|
|
|
|
|
|
|
|
|
|
|
|
||||||||||||
Average Capital Employed |
As of the three Months Ended July 30, 2023 |
|
|
As of the three Months Ended April 30, 2023 |
|
|
As of the three Months Ended January 29, 2023 |
|
||||||||||||||||||||||||||||||
|
Mattress |
|
Upholstery |
|
Unallocated |
|
|
|
|
Mattress |
|
Upholstery |
|
Unallocated |
|
|
|
|
Mattress |
|
Upholstery |
|
Unallocated |
|
|
|
||||||||||||
|
Fabrics |
|
Fabrics |
|
Corporate |
|
Total |
|
|
Fabrics |
|
Fabrics |
|
Corporate |
|
Total |
|
|
Fabrics |
|
Fabrics |
|
Corporate |
|
Total |
|
||||||||||||
Total assets (4) |
$ |
72,286 |
|
|
37,592 |
|
|
33,024 |
|
|
142,902 |
|
|
$ |
75,494 |
|
|
39,127 |
|
|
37,562 |
|
|
152,183 |
|
|
$ |
75,393 |
|
|
39,817 |
|
|
35,388 |
|
|
150,598 |
|
Total liabilities |
|
(11,230 |
) |
|
(25,235 |
) |
|
(20,320 |
) |
|
(56,785 |
) |
|
|
(11,387 |
) |
|
(29,638 |
) |
|
(22,078 |
) |
|
(63,103 |
) |
|
|
(9,511 |
) |
|
(24,367 |
) |
|
(23,216 |
) |
|
(57,094 |
) |
Subtotal |
$ |
61,056 |
|
$ |
12,357 |
|
$ |
12,704 |
|
$ |
86,117 |
|
|
$ |
64,107 |
|
$ |
9,489 |
|
$ |
15,484 |
|
$ |
89,080 |
|
|
$ |
65,882 |
|
$ |
15,450 |
|
$ |
12,172 |
|
$ |
93,504 |
|
Cash and cash equivalents |
|
— |
|
|
— |
|
|
(16,812 |
) |
|
(16,812 |
) |
|
|
— |
|
|
— |
|
|
(20,964 |
) |
|
(20,964 |
) |
|
|
— |
|
|
— |
|
|
(16,725 |
) |
|
(16,725 |
) |
Short-term investments - Rabbi Trust |
|
— |
|
|
— |
|
|
(791 |
) |
|
(791 |
) |
|
|
— |
|
|
— |
|
|
(1,404 |
) |
|
(1,404 |
) |
|
|
— |
|
|
— |
|
|
(2,420 |
) |
|
(2,420 |
) |
Current income taxes receivable |
|
— |
|
|
— |
|
|
(202 |
) |
|
(202 |
) |
|
|
— |
|
|
— |
|
|
— |
|
|
— |
|
|
|
— |
|
|
— |
|
|
(238 |
) |
|
(238 |
) |
Long-term investments - Rabbi Trust |
|
— |
|
|
— |
|
|
(7,204 |
) |
|
(7,204 |
) |
|
|
— |
|
|
— |
|
|
(7,067 |
) |
|
(7,067 |
) |
|
|
— |
|
|
— |
|
|
(7,725 |
) |
|
(7,725 |
) |
Deferred income taxes - non-current |
|
— |
|
|
— |
|
|
(476 |
) |
|
(476 |
) |
|
|
— |
|
|
— |
|
|
(480 |
) |
|
(480 |
) |
|
|
— |
|
|
— |
|
|
(463 |
) |
|
(463 |
) |
Deferred compensation - current |
|
— |
|
|
— |
|
|
791 |
|
|
791 |
|
|
|
— |
|
|
— |
|
|
1,404 |
|
|
1,404 |
|
|
|
— |
|
|
— |
|
|
2,420 |
|
|
2,420 |
|
Accrued restructuring |
|
— |
|
|
— |
|
|
10 |
|
|
10 |
|
|
|
— |
|
|
— |
|
|
— |
|
|
— |
|
|
|
— |
|
|
— |
|
|
— |
|
|
— |
|
Income taxes payable - current |
|
— |
|
|
— |
|
|
526 |
|
|
526 |
|
|
|
— |
|
|
— |
|
|
753 |
|
|
753 |
|
|
|
— |
|
|
— |
|
|
467 |
|
|
467 |
|
Income taxes payable - long-term |
|
— |
|
|
— |
|
|
2,710 |
|
|
2,710 |
|
|
|
— |
|
|
— |
|
|
2,675 |
|
|
2,675 |
|
|
|
— |
|
|
— |
|
|
2,648 |
|
|
2,648 |
|
Deferred income taxes - non-current |
|
— |
|
|
— |
|
|
5,864 |
|
|
5,864 |
|
|
|
— |
|
|
— |
|
|
5,954 |
|
|
5,954 |
|
|
|
— |
|
|
— |
|
|
6,089 |
|
|
6,089 |
|
Deferred compensation - long-term |
|
— |
|
|
— |
|
|
6,966 |
|
|
6,966 |
|
|
|
— |
|
|
— |
|
|
6,842 |
|
|
6,842 |
|
|
|
— |
|
|
— |
|
|
7,590 |
|
|
7,590 |
|
Total Capital Employed |
$ |
61,056 |
|
$ |
12,357 |
|
$ |
4,086 |
|
$ |
77,499 |
|
|
$ |
64,107 |
|
$ |
9,489 |
|
$ |
3,197 |
|
$ |
76,793 |
|
|
$ |
65,882 |
|
$ |
15,450 |
|
$ |
3,815 |
|
$ |
85,147 |
|
-MORE-
CULP Announces Results for First Quarter Fiscal 2025
Page 17
September 4, 2024
CULP INC.
RETURN ON CAPITAL EMPLOYED BY SEGMENT - CONTINUED
FOR THE TWELVE MONTHS ENDED JULY 30, 2023
Unaudited
(Amounts in Thousands)
|
As of the three Months Ended October 30, 2022 |
|
|
As of the three Months Ended July 31, 2022 |
|
|
|
|
|
|
||||||||||||||||||||
|
Mattress |
|
Upholstery |
|
Unallocated |
|
|
|
|
Mattress |
|
Upholstery |
|
Unallocated |
|
|
|
|
|
|
|
|
||||||||
|
Fabrics |
|
Fabrics |
|
Corporate |
|
Total |
|
|
Fabrics |
|
Fabrics |
|
Corporate |
|
Total |
|
|
|
|
|
|
||||||||
Total assets (4) |
$ |
78,366 |
|
|
44,934 |
|
|
38,330 |
|
|
161,630 |
|
|
$ |
90,842 |
|
|
51,053 |
|
|
38,595 |
|
|
180,490 |
|
|
|
|
|
|
Total liabilities |
|
(9,895 |
) |
|
(26,108 |
) |
|
(23,519 |
) |
|
(59,522 |
) |
|
|
(11,934 |
) |
|
(30,762 |
) |
|
(23,799 |
) |
|
(66,495 |
) |
|
|
|
|
|
Subtotal |
$ |
68,471 |
|
$ |
18,826 |
|
$ |
14,811 |
|
$ |
102,108 |
|
|
$ |
78,908 |
|
$ |
20,291 |
|
$ |
14,796 |
|
$ |
113,995 |
|
|
|
|
|
|
Cash and cash equivalents |
|
— |
|
|
— |
|
|
(19,137 |
) |
|
(19,137 |
) |
|
|
— |
|
|
— |
|
|
(18,874 |
) |
|
(18,874 |
) |
|
|
|
|
|
Short-term investments - Rabbi Trust |
|
— |
|
|
— |
|
|
(2,237 |
) |
|
(2,237 |
) |
|
|
|
|
|
|
|
|
|
|
|
|
|
|
||||
Current income taxes receivable |
|
— |
|
|
— |
|
|
(510 |
) |
|
(510 |
) |
|
|
— |
|
|
— |
|
|
(798 |
) |
|
(798 |
) |
|
|
|
|
|
Long-term investments - Rabbi Trust |
|
— |
|
|
— |
|
|
(7,526 |
) |
|
(7,526 |
) |
|
|
— |
|
|
— |
|
|
(9,567 |
) |
|
(9,567 |
) |
|
|
|
|
|
Deferred income taxes - non-current |
|
— |
|
|
— |
|
|
(493 |
) |
|
(493 |
) |
|
|
— |
|
|
— |
|
|
(546 |
) |
|
(546 |
) |
|
|
|
|
|
Deferred compensation - current |
|
— |
|
|
— |
|
|
2,237 |
|
|
2,237 |
|
|
|
— |
|
|
— |
|
|
— |
|
|
— |
|
|
|
|
|
|
Accrued restructuring |
|
— |
|
|
— |
|
|
33 |
|
|
33 |
|
|
|
— |
|
|
— |
|
|
— |
|
|
— |
|
|
|
|
|
|
Income taxes payable - current |
|
— |
|
|
— |
|
|
969 |
|
|
969 |
|
|
|
— |
|
|
— |
|
|
587 |
|
|
587 |
|
|
|
|
|
|
Income taxes payable - long-term |
|
— |
|
|
— |
|
|
2,629 |
|
|
2,629 |
|
|
|
— |
|
|
— |
|
|
3,118 |
|
|
3,118 |
|
|
|
|
|
|
Deferred income taxes - non-current |
|
— |
|
|
— |
|
|
5,700 |
|
|
5,700 |
|
|
|
— |
|
|
— |
|
|
6,007 |
|
|
6,007 |
|
|
|
|
|
|
Deferred compensation - long-term |
|
— |
|
|
— |
|
|
7,486 |
|
|
7,486 |
|
|
|
— |
|
|
— |
|
|
9,528 |
|
|
9,528 |
|
|
|
|
|
|
Total Capital Employed |
$ |
68,471 |
|
$ |
18,826 |
|
$ |
3,962 |
|
$ |
91,259 |
|
|
$ |
78,908 |
|
$ |
20,291 |
|
$ |
4,251 |
|
$ |
103,450 |
|
|
|
|
|
|
|
|
|
|
|
|
|
|
|
|
|
|
|
|
|
|
|
|
|
|
|
|
|
||||||||
|
Mattress |
|
Upholstery |
|
Unallocated |
|
|
|
|
|
|
|
|
|
|
|
|
|
|
|
|
|
||||||||
|
Fabrics |
|
Fabrics |
|
Corporate |
|
Consolidated |
|
|
|
|
|
|
|
|
|
|
|
|
|
|
|
||||||||
Average Capital Employed (2) |
$ |
67,685 |
|
$ |
15,283 |
|
$ |
3,862 |
|
$ |
86,830 |
|
|
|
|
|
|
|
|
|
|
|
|
|
|
|
||||
Notes
(1) See last page of this presentation for calculation.
(2) Average capital employed was computed using the five quarterly periods ending July 30, 2023, April 30, 2023, January 29, 2023, October 30, 2022, and July 31, 2022.
(3) Return on average capital employed represents the last twelve months operating (loss) income as of July 30, 2023, divided by average capital employed. Average capital employed does not include cash and cash equivalents, short-term and long-term investments – Rabbi Trust, accrued restructuring, income taxes receivable and payable, noncurrent deferred income tax assets and liabilities, and current and non-current deferred compensation.
(4) Intangible assets are included in unallocated corporate for all periods presented and therefore, have no effect on capital employed and return on capital employed for our mattress fabrics and upholstery fabrics segments.
CULP Announces Results for First Quarter Fiscal 2025
Page 18
September 4, 2024
CULP INC.
CONSOLIDATED STATEMENTS OF ADJUSTED OPERATING (LOSS) INCOME
FOR THE TWELVE MONTHS ENDED JULY 28, 2024, AND JULY 30, 2023
Unaudited
(Amounts in Thousands)
|
|
Quarter Ended |
|
|
|
|
||||||||||||||
|
|
|
|
|
|
|
|
|
|
|
|
|
|
Trailing 12 |
|
|||||
|
|
|
|
|
|
|
|
|
|
|
|
|
|
Months |
|
|||||
|
|
10/29/2023 |
|
|
01/28/2024 |
|
|
04/28/2024 |
|
|
07/28/2024 |
|
|
07/28/2024 |
|
|||||
Mattress Fabrics |
|
$ |
(936 |
) |
|
$ |
(1,582 |
) |
|
$ |
(2,929 |
) |
|
$ |
(3,549 |
) |
|
$ |
(8,996 |
) |
Upholstery Fabrics |
|
|
1,391 |
|
|
|
2,092 |
|
|
|
975 |
|
|
|
1,712 |
|
|
|
6,170 |
|
Unallocated Corporate |
|
|
(2,628 |
) |
|
|
(2,361 |
) |
|
|
(2,090 |
) |
|
|
(2,267 |
) |
|
|
(9,346 |
) |
Operating loss |
|
$ |
(2,173 |
) |
|
$ |
(1,851 |
) |
|
$ |
(4,044 |
) |
|
$ |
(4,104 |
) |
|
$ |
(12,172 |
) |
|
|
|
|
|
|
|
|
|
|
|
|
|
|
|
|
|||||
|
|
Quarter Ended |
|
|
|
|
||||||||||||||
|
|
|
|
|
|
|
|
|
|
|
|
|
|
Trailing 12 |
|
|||||
|
|
|
|
|
|
|
|
|
|
|
|
|
|
Months |
|
|||||
|
|
10/30/2022 |
|
|
1/29/2023 |
|
|
4/30/2023 |
|
|
7/30/2023 |
|
|
7/30/2023 |
|
|||||
Mattress Fabrics |
|
$ |
(9,002 |
) |
|
$ |
(4,229 |
) |
|
$ |
(2,530 |
) |
|
$ |
(1,398 |
) |
|
$ |
(17,159 |
) |
Upholstery Fabrics |
|
|
262 |
|
|
|
(420 |
) |
|
|
1,611 |
|
|
|
1,328 |
|
|
|
2,781 |
|
Unallocated Corporate |
|
|
(2,478 |
) |
|
|
(2,423 |
) |
|
|
(3,038 |
) |
|
|
(2,495 |
) |
|
|
(10,434 |
) |
Operating loss |
|
$ |
(11,218 |
) |
|
$ |
(7,072 |
) |
|
$ |
(3,957 |
) |
|
$ |
(2,565 |
) |
|
$ |
(24,812 |
) |
|
|
|
|
|
|
|
|
|
|
|
|
|
|
|
|
|||||
|
|
|
|
|
|
|
|
|
|
|
|
|
|
|
|
|||||
% Over (Under) |
|
|
(80.6 |
)% |
|
|
(73.8 |
)% |
|
|
2.2 |
% |
|
|
60.0 |
% |
|
|
(50.9 |
)% |
-END-
Exhibit 99.2

Logo Positioning for the Future Culp Restructuring Plan – September 2024
Forward Looking Statements This presentation contains “forward-looking statements” within the meaning of the federal securities laws, including the Private Securities Litigation Reform Act of 1995 (Section 27A of the Securities Act of 1933 and Section 21E of the Securities and Exchange Act of 1934). Such statements are inherently subject to risks and uncertainties that may cause actual events and results to differ materially from such statements. Forward-looking statements are statements that include projections, expectations, or beliefs about future events or results or otherwise are not statements of historical fact. Such statements are often but not always characterized by qualifying words such as “expect,” “believe,” “will,” “may,” “should,” “could,” “potential,” “continue,” “target,” “predict”, “seek,” “anticipate,” “estimate,” “intend,” “plan,” “project,” and their derivatives, and include but are not limited to statements about expectations, projections, or trends for our future operations, strategic initiatives and plans, restructuring actions, production levels, new product launches, sales, profit margins, profitability, operating (loss) income, capital expenditures, working capital levels, cost savings (including, without limitation, anticipated cost savings from restructuring actions), income taxes, SG&A or other expenses, pre-tax (loss) income, earnings, cash flow, and other performance or liquidity measures, as well as any statements regarding dividends, share repurchases, liquidity, use of cash and cash requirements, borrowing capacity, investments, potential acquisitions, restructuring and restructuring-related charges, expenses, and/or credits, future economic or industry trends, public health epidemics, or future developments. There can be no assurance that we will realize these expectations or meet our guidance, or that these beliefs will prove correct. Factors that could influence the matters discussed in such statements include the level of housing starts and sales of existing homes, consumer confidence, trends in disposable income, and general economic conditions. Decreases in these economic indicators could have a negative effect on our business and prospects. Likewise, increases in interest rates, particularly home mortgage rates, and increases in consumer debt or the general rate of inflation, could affect us adversely. The future performance of our business depends in part on our success in conducting and finalizing acquisition negotiations and integrating acquired businesses into our existing operations. Changes in consumer tastes or preferences toward products not produced by us could erode demand for our products. Changes in tariffs or trade policy, including changes in U.S. trade enforcement priorities, or changes in the value of the U.S. dollar versus other currencies, could affect our financial results because a significant portion of our operations are located outside the United States. Strengthening of the U.S. dollar against other currencies could make our products less competitive on the basis of price in markets outside the United States, and strengthening of currencies in Canada and China can have a negative impact on our sales of products produced in those places. In addition, because our foreign operations use the U.S. dollar as their functional currency, changes in the exchange rate between the local currency of those operations and the U.S dollar can affect our reported profits from those foreign operations. Also, economic or political instability in international areas could affect our operations or sources of goods in those areas, as well as demand for our products in international markets. The impact of public health epidemics on employees, customers, suppliers, and the global economy, such as the recent coronavirus pandemic, could also adversely affect our operations and financial performance. In addition, the impact of potential asset impairments, including impairments of property, plant, and equipment, inventory, or intangible assets, as well as the impact of valuation allowances applied against our net deferred income tax assets, could affect our financial results. Increases in freight costs, labor costs, and raw material prices, including increases in market prices for petrochemical products, can also significantly affect the prices we pay for shipping, labor, and raw materials, respectively, and in turn, increase our operating costs and decrease our profitability. Also, our success in diversifying our supply chain with reliable partners to effectively service our global platform could affect our operations and adversely affect our financial results. Finally, the future performance of our business also depends on our ability to successfully restructure our mattress fabric operations and return the segment to profitability. Further information about these factors, as well as other factors that could affect our future operations or financial results and the matters discussed in forward-looking statements, is included in Item 1A “Risk Factors” in our most recent Form 10-K and Form 10-Q reports filed with the Securities and Exchange Commission. Many of these factors are macroeconomic in nature and are, therefore, beyond our control. Should one or more of these risks or uncertainties materialize, or should underlying assumptions prove incorrect, our actual results, performance or achievements may vary materially from those described in this presentation as anticipated, believed, estimated, expected, intended, planned or projected. The forward-looking statements included in this presentation are made only as of the date of this presentation. Unless required by United States federal securities laws, we neither intend nor assume any obligation to update these forward-looking statements for any reason after the date of this presentation to conform these statements to actual results or to changes in our expectations. A forward-looking statement is neither a prediction nor a guarantee of future events or circumstances, and those future events or circumstances may not occur. Additional risks and uncertainties that we do not presently know about or that we currently consider to be immaterial may also affect our business operations or financial results.
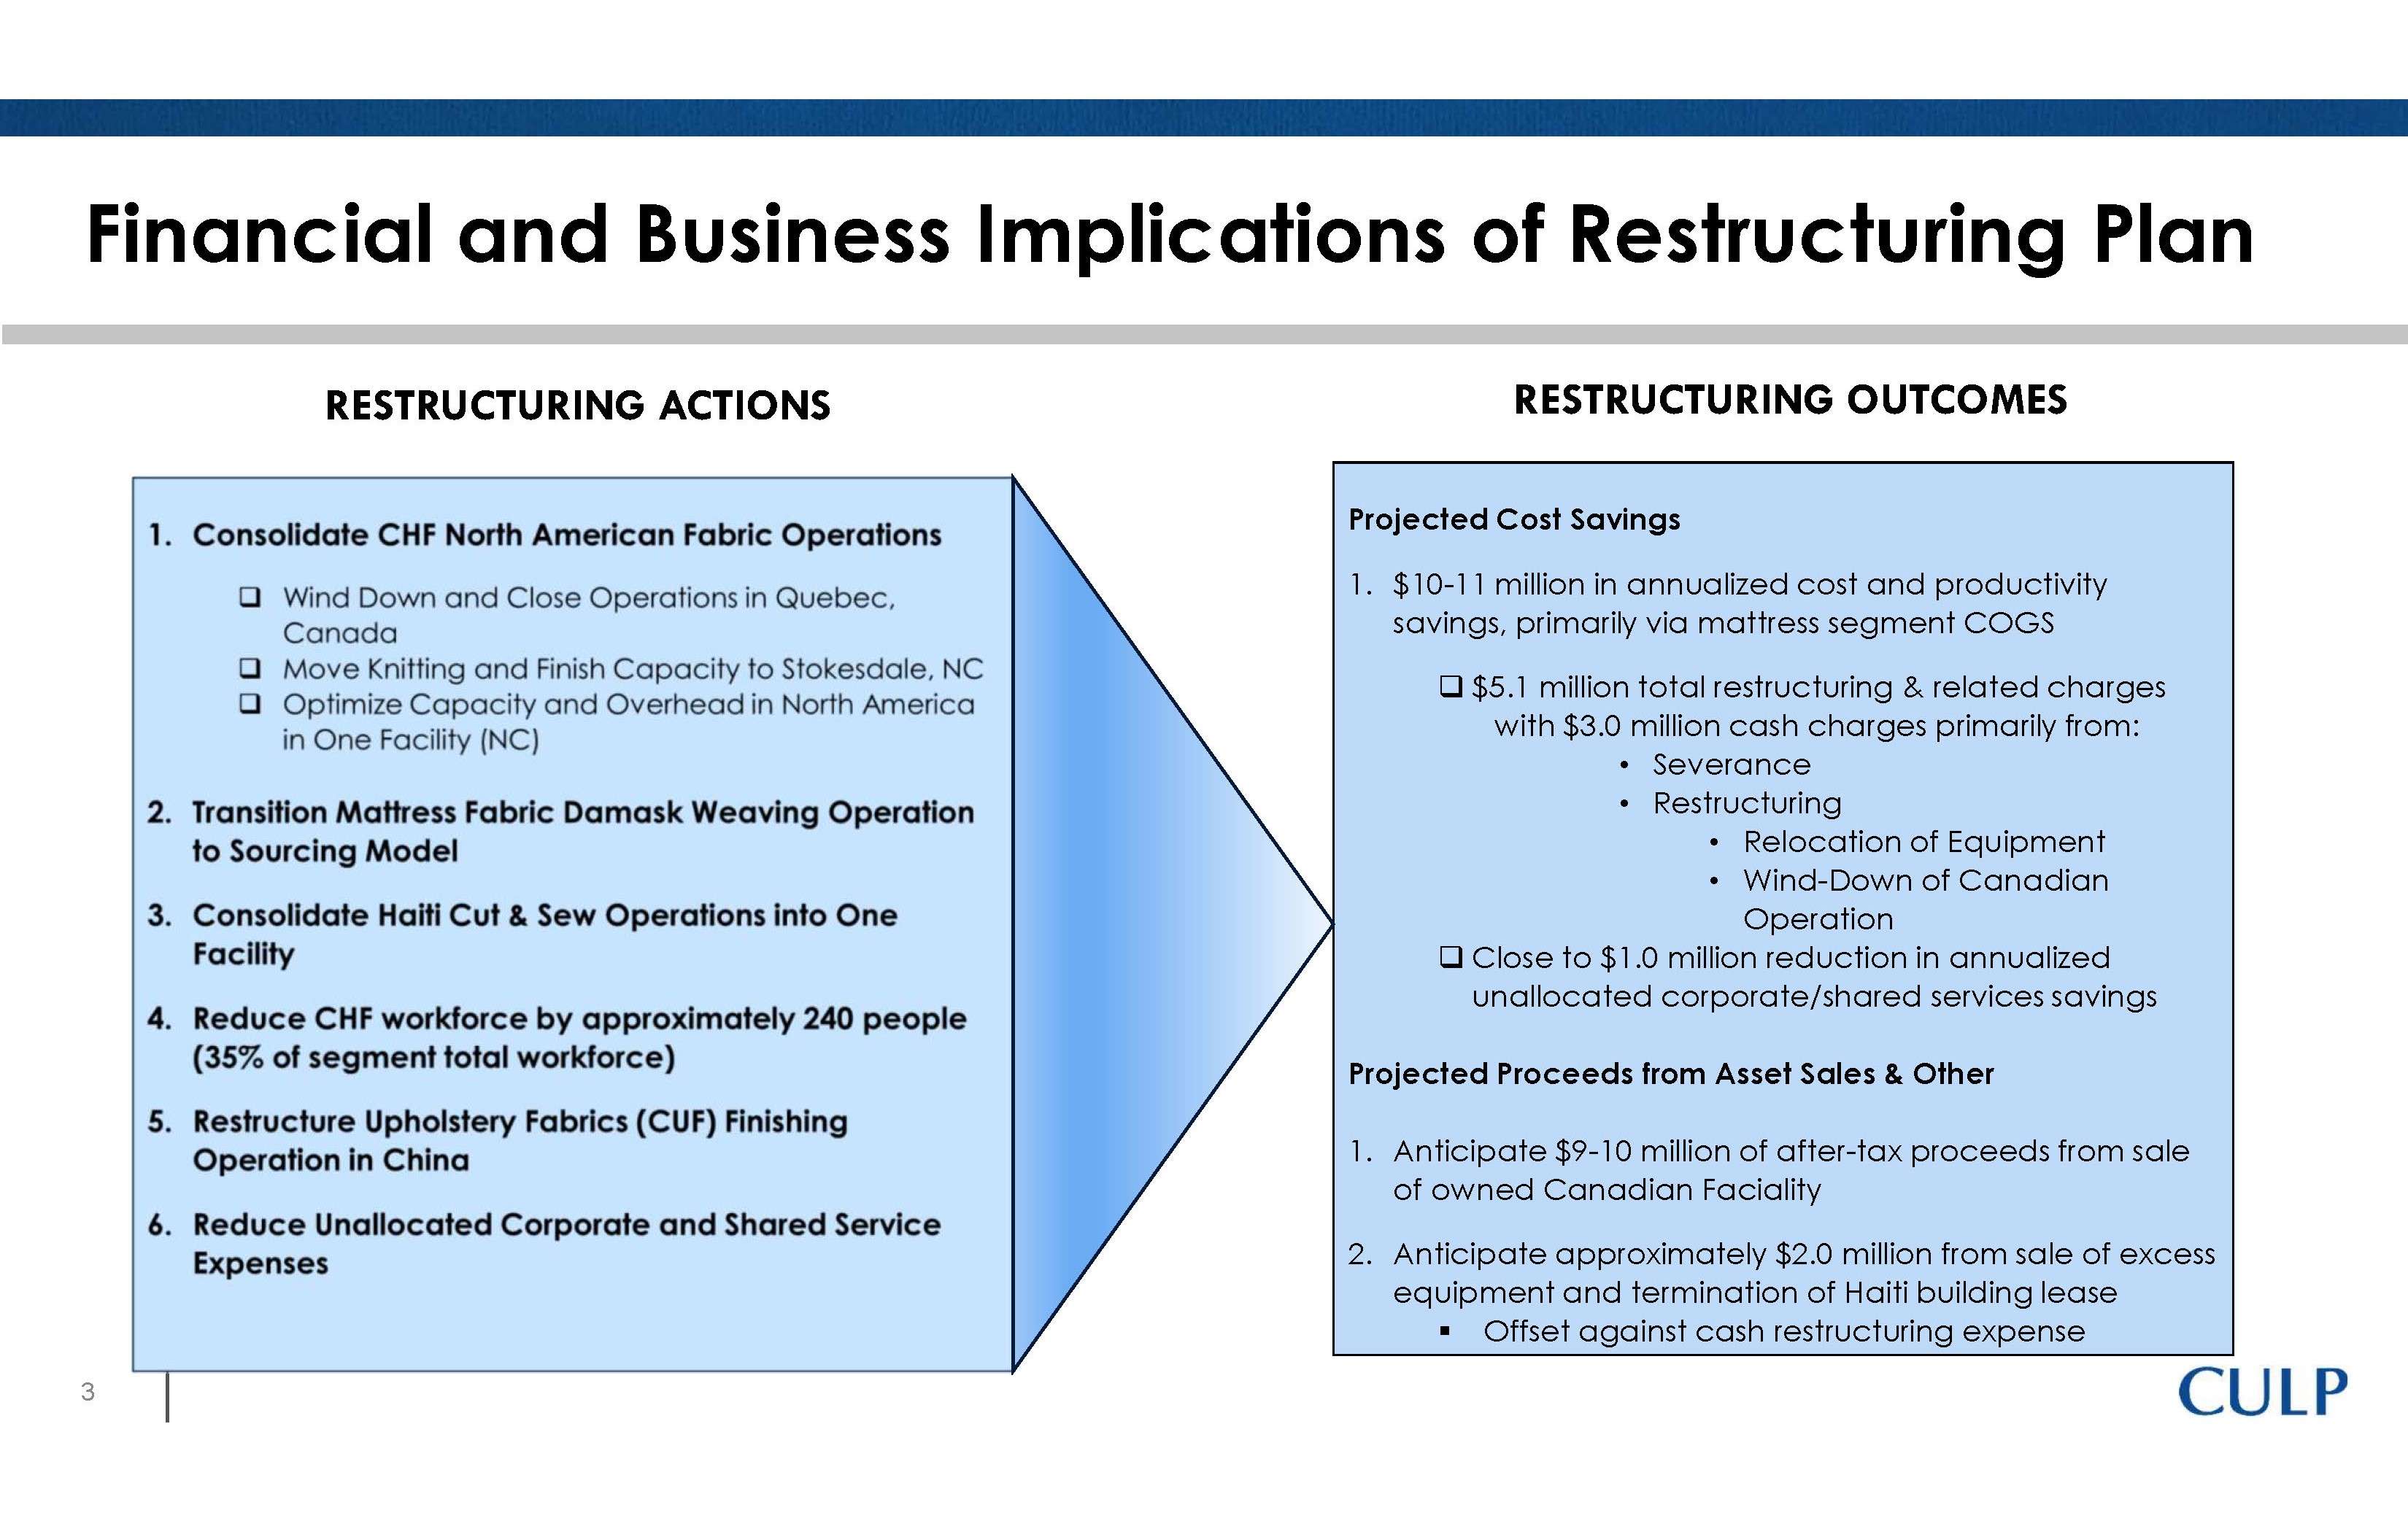
Financial and Business Implications of Restructuring Plan RESTRUCTURING ACTIONS 1. Consolidate CHF North American Fabric Operations Wind Down and Close Operations in Quebec, Canada Move Knitting and Finish Capacity to Stokesdale, NC Optimize Capacity and Overhead in North America in One Facility (NC) 2. Transition Mattress Fabric Damask Weaving Operation to Sourcing Model 3. Consolidate Haiti Cut & Sew Operations into One Facility 4. Reduce CHF workforce by approximately 240 people (35% of segment total workforce) 5. Restructure Upholstery Fabrics (CUF) Finishing Operation in China 6. Reduce Unallocated Corporate and Shared Service Expenses RESTRUCTURING OUTCOMES Projected Cost Savings 1. $10-11 million in annualized cost and productivity savings, primarily via mattress segment COGS $5.1 million total restructuring & related charges with $3.0 million cash charges primarily from: • Severance • Restructuring • Relocation of Equipment • Wind-Down of Canadian Operation Close to $1.0 million reduction in annualized unallocated corporate/shared services savings Projected Proceeds from Asset Sales & Other 1. Anticipate $9-10 million of after-tax proceeds from sale of owned Canadian Faciality 2.
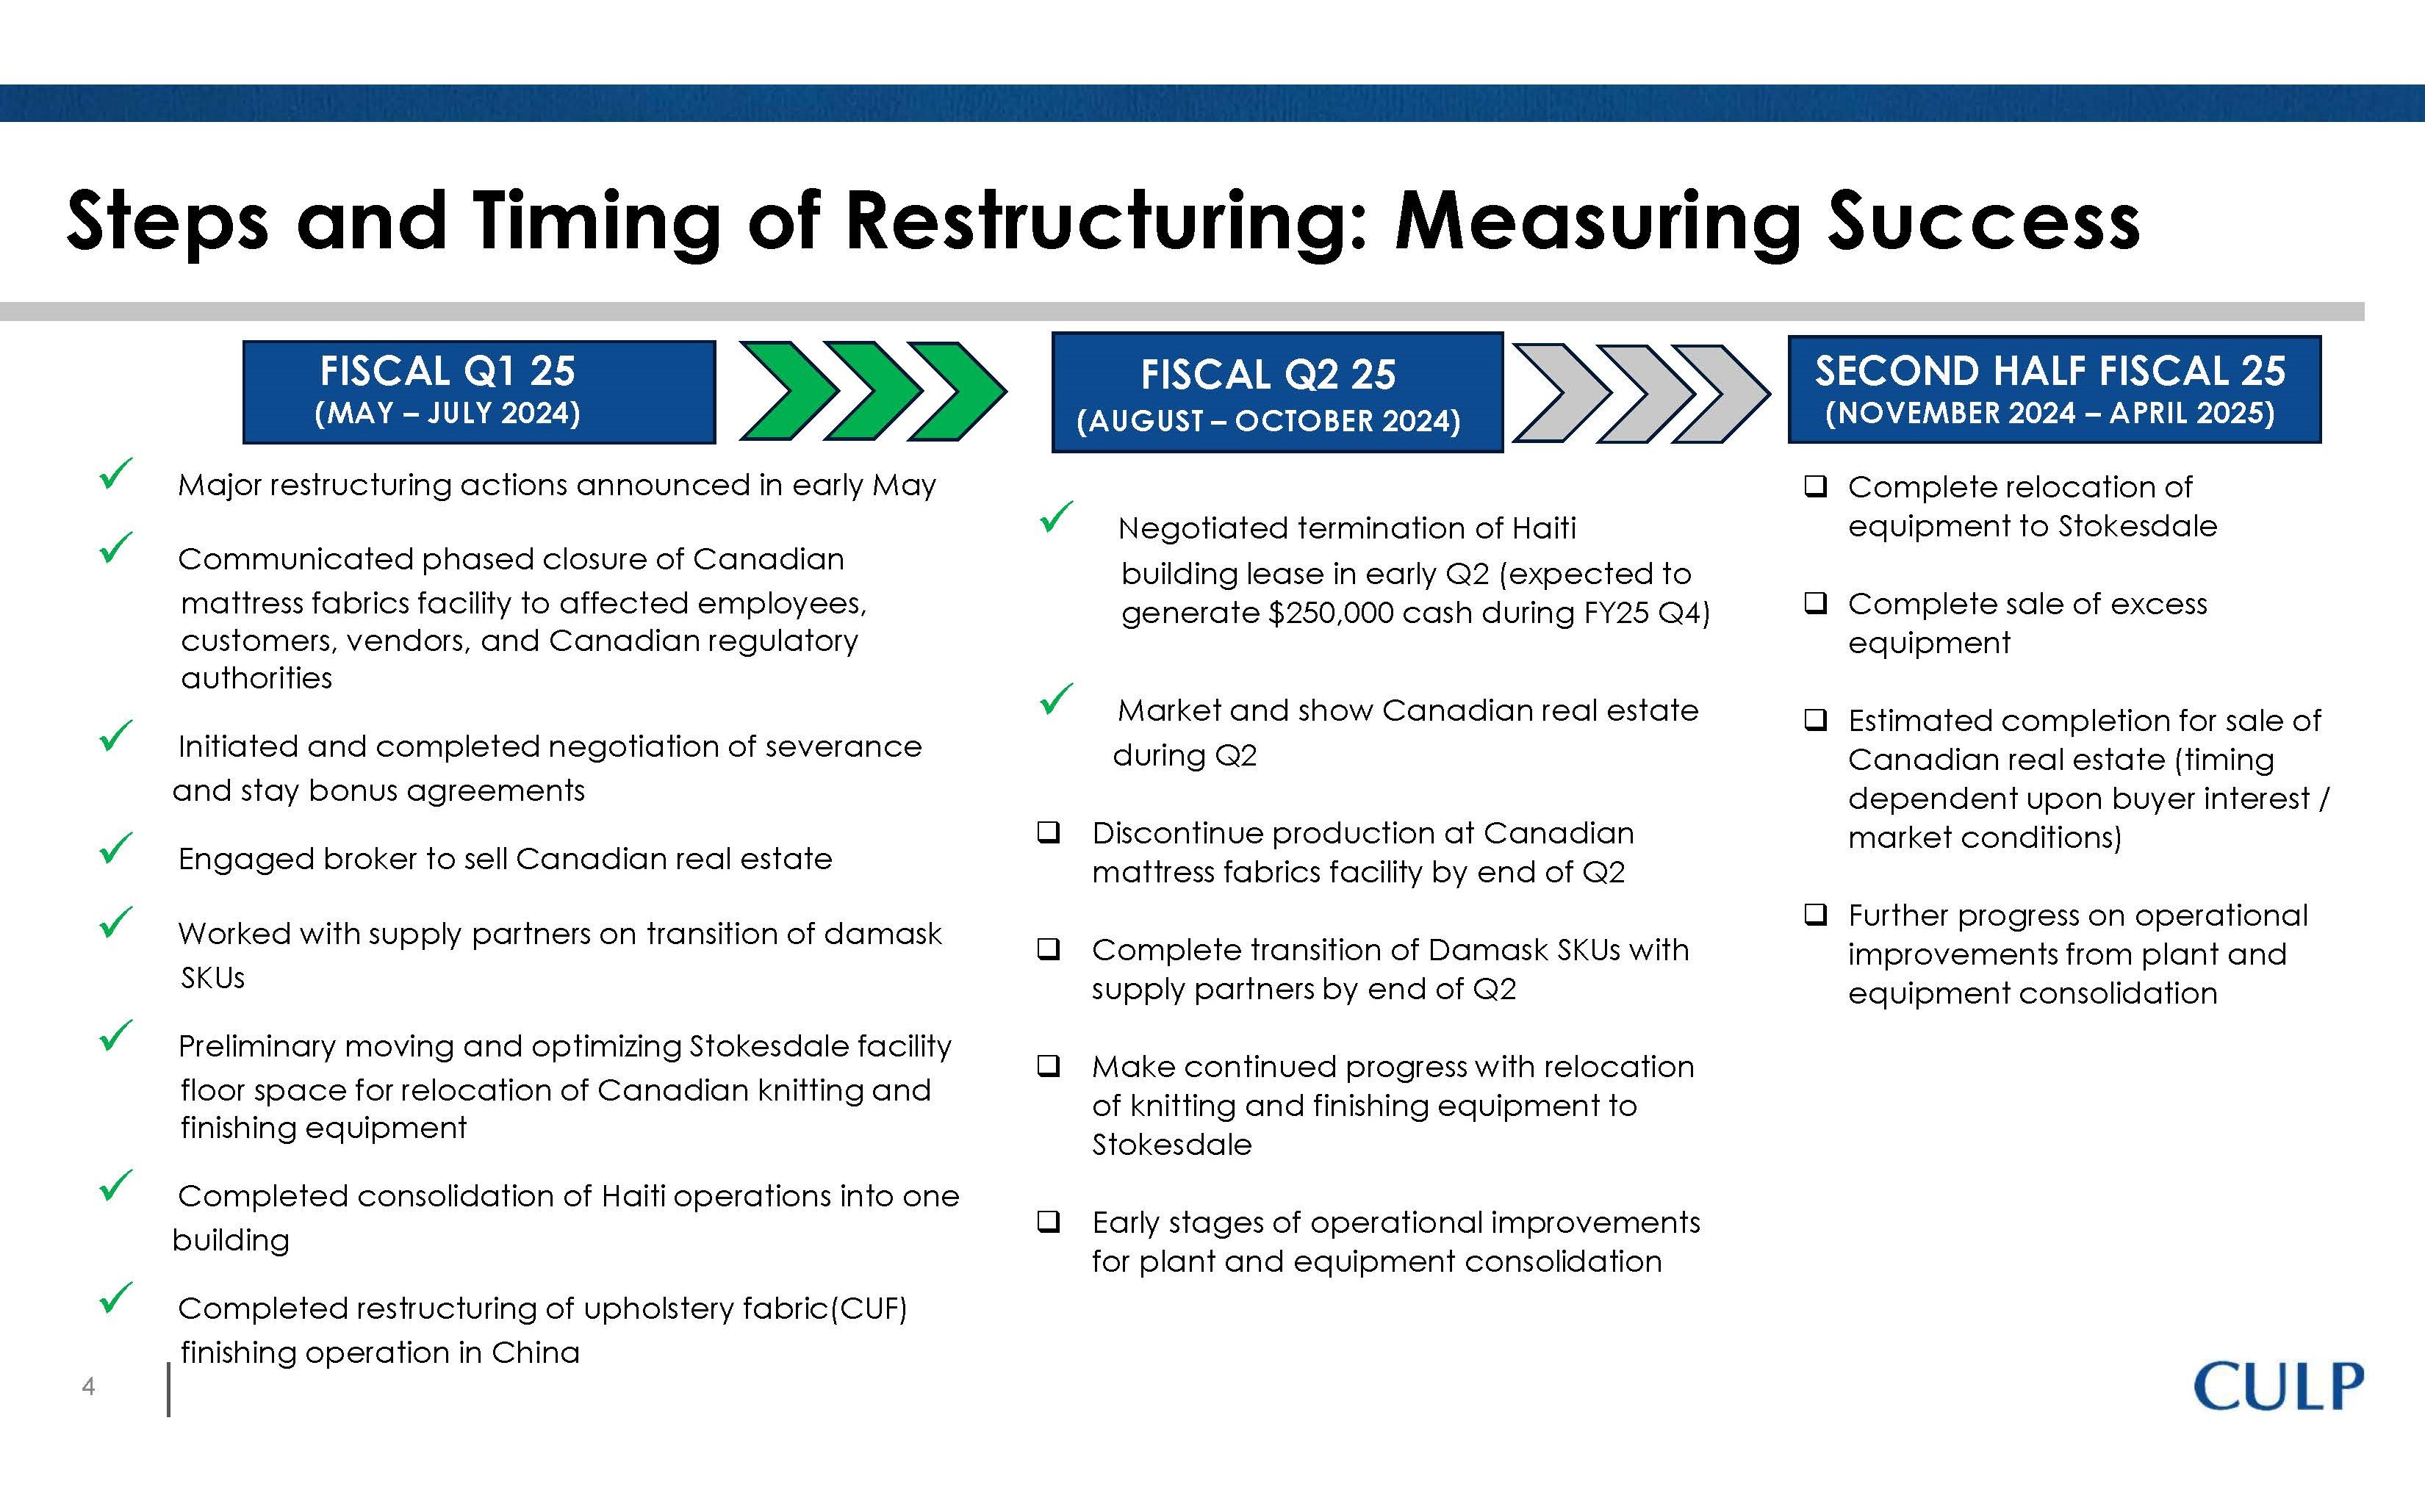
Anticipate approximately $2.0 million from sale of excess equipment and termination of Haiti building lease § Offset against cash restructuring expense 3 CULP Steps and Timing of Restructuring: Measuring Success FISCAL Q1 25 (MAY – JULY 2024) FISCAL Q2 25 (AUGUST – OCTOBER 2024) SECOND HALF FISCAL 25 (NOVEMBER 2024 – APRIL 2025) Major restructuring actions announced in early May Communicated phased closure of Canadian mattress fabrics facility to affected employees, customers, vendors, and Canadian regulatory authorities Initiated and completed negotiation of severance and stay bonus agreements Engaged broker to sell Canadian real estate Worked with supply partners on transition of damask SKUs Preliminary moving and optimizing Stokesdale facility floor space for relocation of Canadian knitting and finishing equipment Completed consolidation of Haiti operations into one building Completed restructuring of upholstery fabric(CUF) finishing operation in China Negotiated termination of Haiti building lease in early Q2 (expected to generate $250,000 cash during FY25 Q4) Market and show Canadian real estate during Q2 Discontinue production at Canadian mattress fabrics facility by end of Q2 Complete transition of Damask SKUs with supply partners by end of Q2 Make continued progress with relocation of knitting and finishing equipment to Stokesdale Early stages of operational improvements for plant and equipment consolidation Complete relocation of equipment to Stokesdale Complete sale of excess equipment Estimated completion for sale of Canadian real estate (timing dependent upon buyer interest / market conditions) Further progress on operational improvements from plant and equipment consolidation Liquidity, Access to Capital are Strengthened Total Liquidity As of 7/28/2024 (in millions) Cash $13.5 ABL Availability 19.2 China Credit Line Availability 0.0 Total Liquidity $32.7 Estimated Proceeds from Canadian Real Estate Sale $10.0 Total Liquidity Including Future Real Estate Sale Proceeds* $42.7 *Hypothetical pro forma assuming sale of Canadian real estate based on estimated net proceeds of $10 million (current estimates are approximately $9.0 to $10.0 million, net of all taxes and commissions).
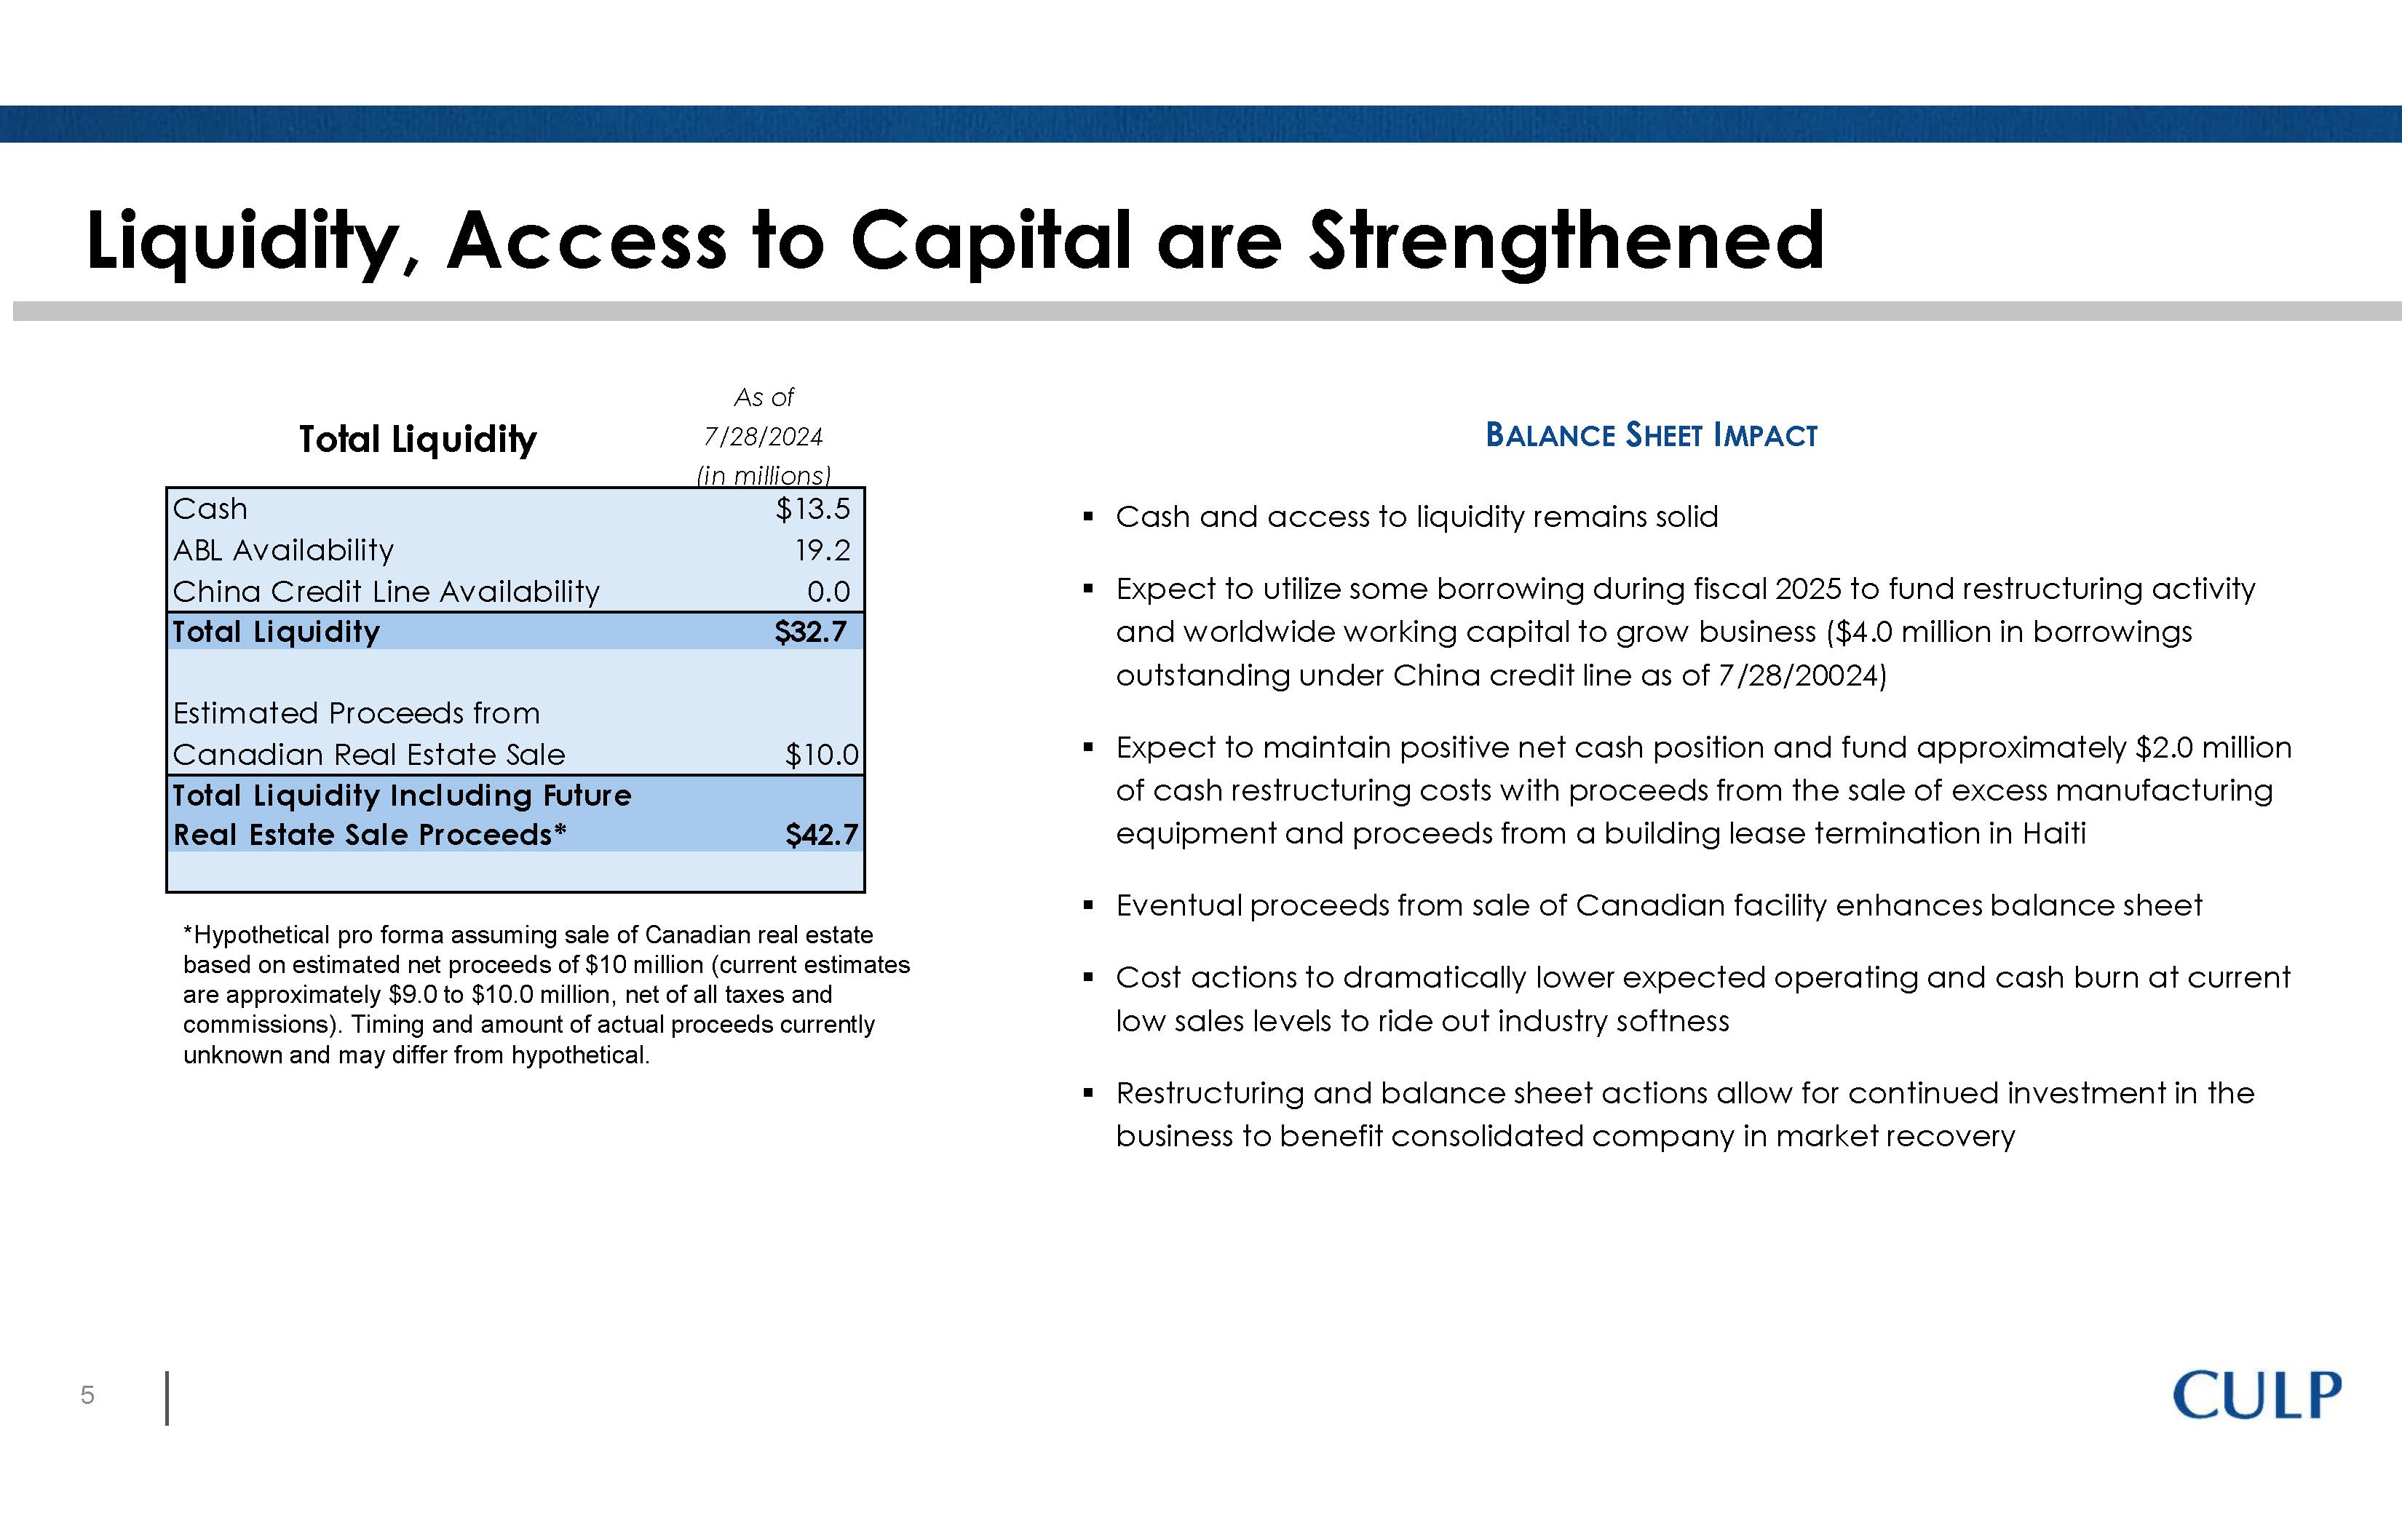
Timing and amount of actual proceeds currently unknown and may differ from hypothetical.
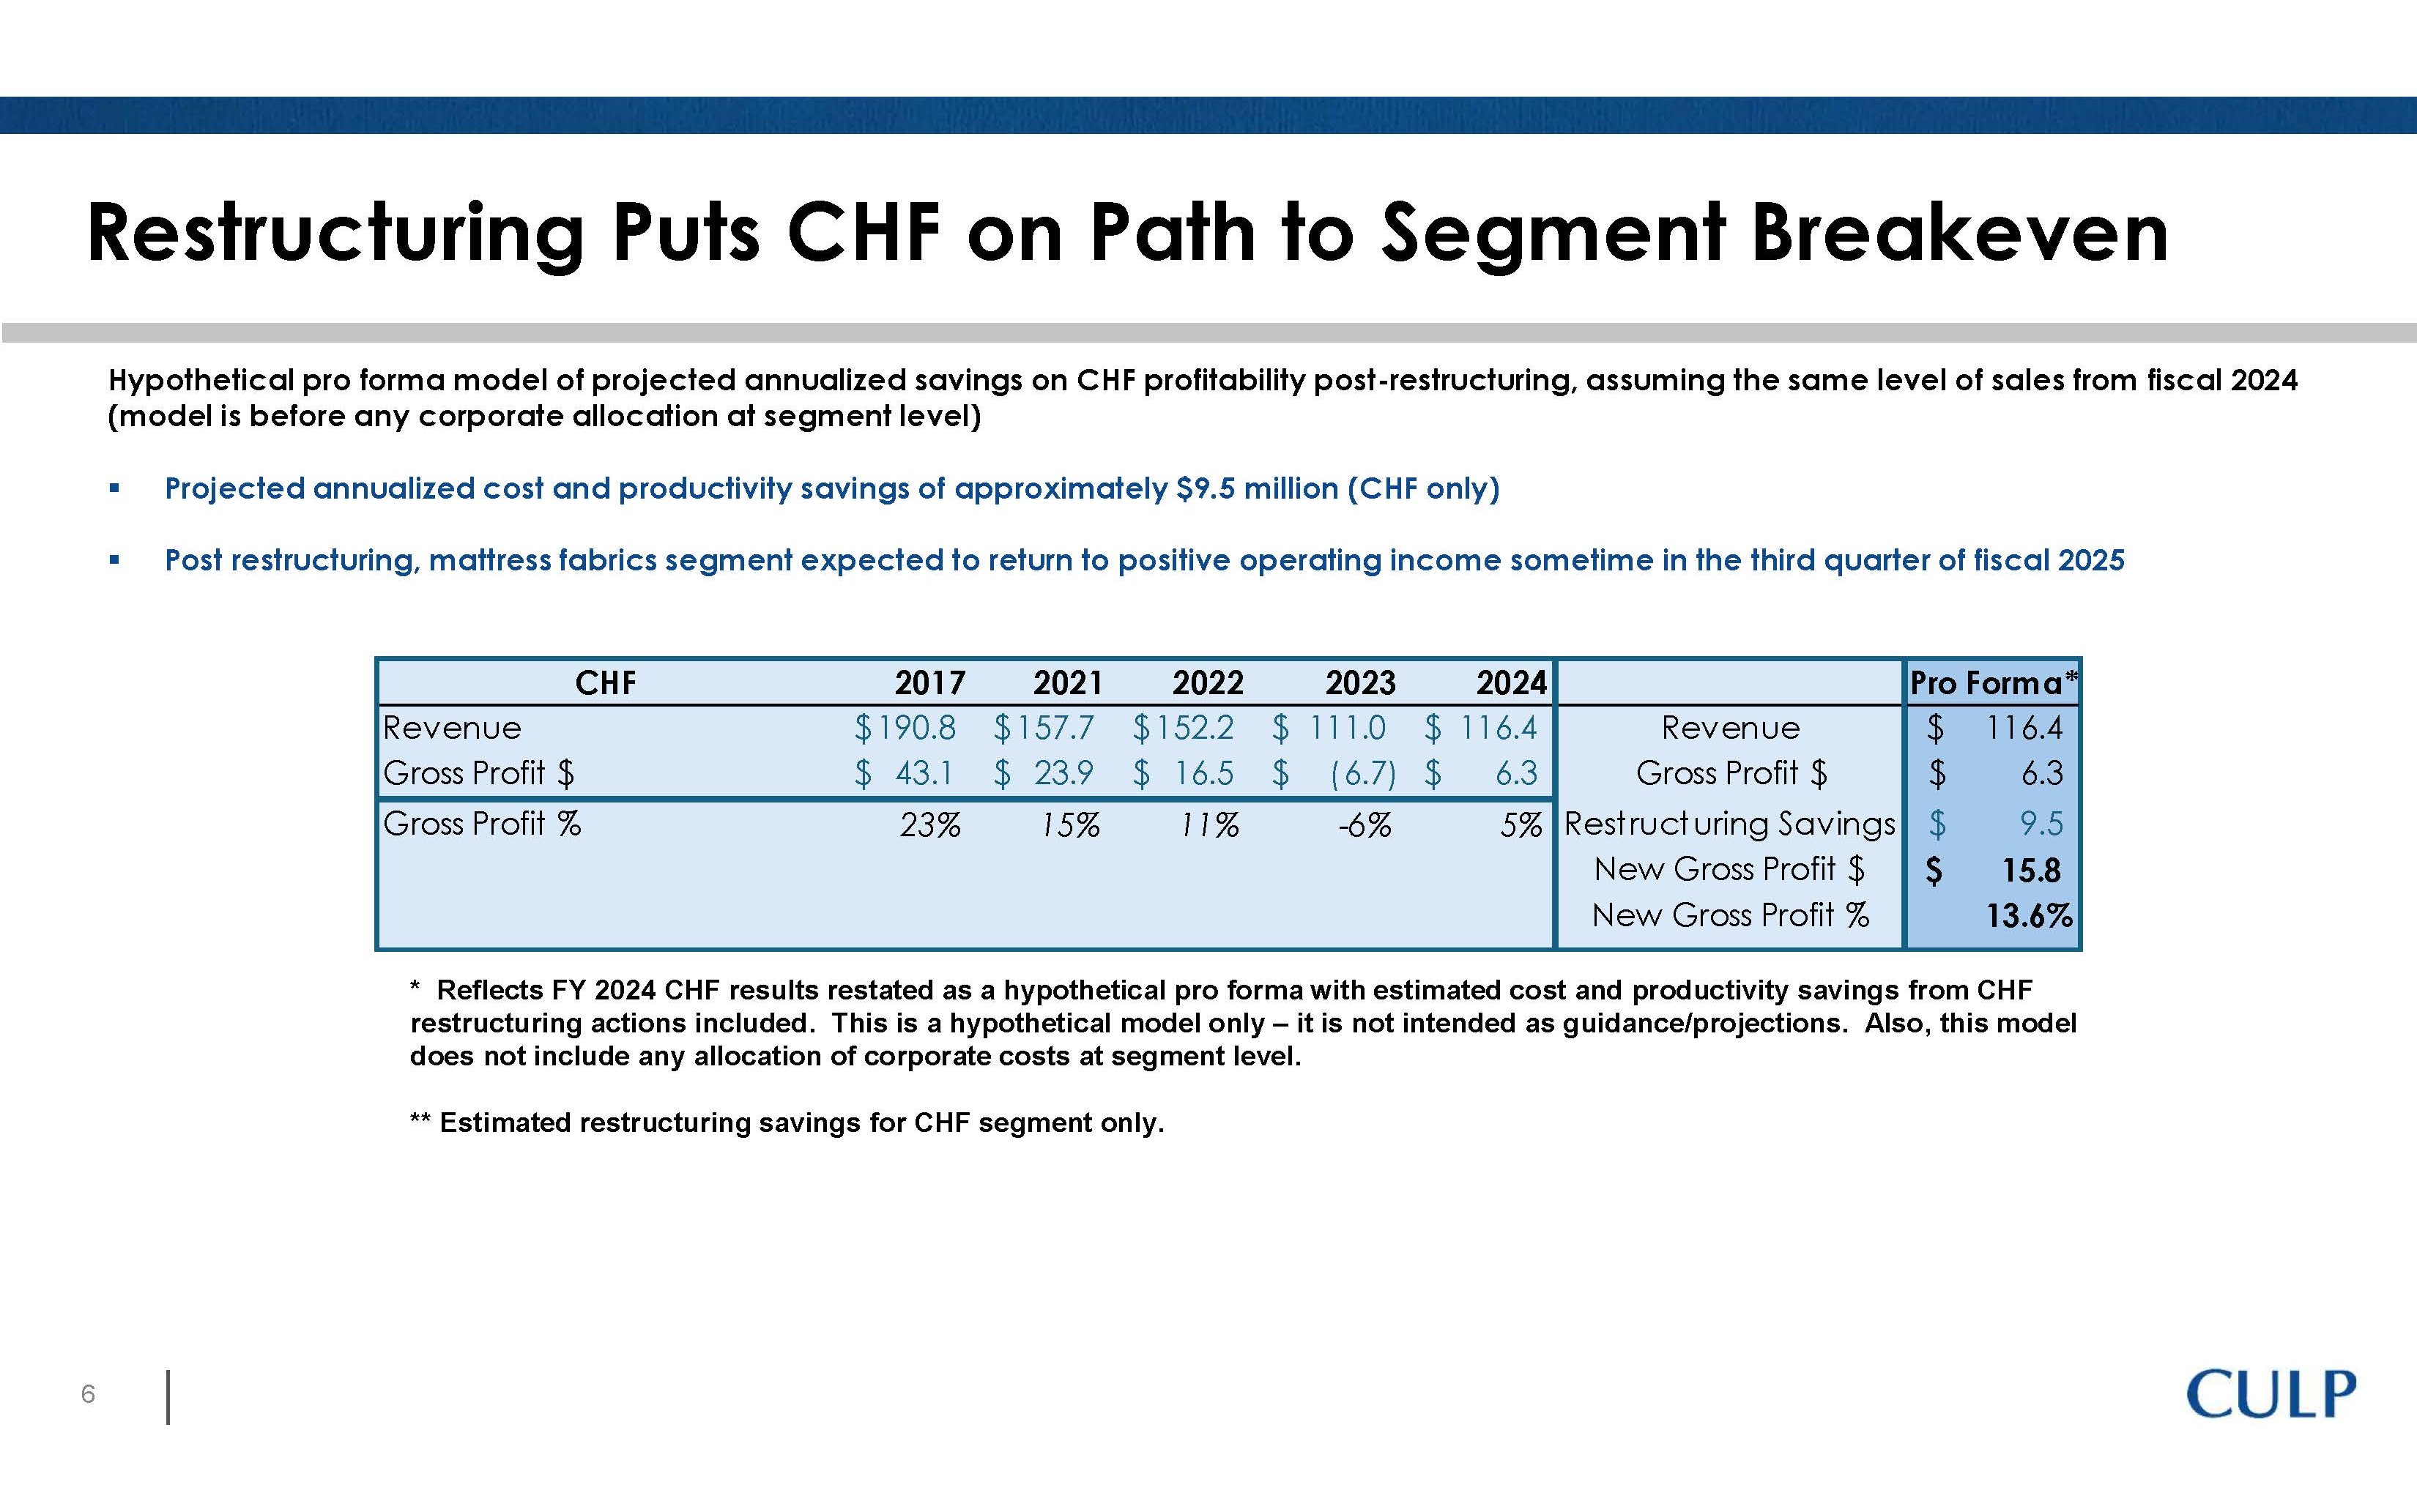
Restructuring Puts CHF on Path to Segment Breakeven Hypothetical pro forma model of projected annualized savings on CHF profitability post-restructuring, assuming the same level of sales from fiscal 2024 (model is before any corporate allocation at segment level) Projected annualized cost and productivity savings of approximately $9.5 million (CHF only) Post restructuring, mattress fabrics segment expected to return to positive operating income sometime in the third quarter of fiscal 2025 CHF 2017 2021 2022 2023 2024 Pro Forma* Revenue $ 190.8 $ 157.7 $ 152.2 $ 111.0 $ 116.4 Gross Profit $ $ 43.1 $ 23.9 $ 16.5 $ (6.7) $ 6.3 Revenue Gross Profit $ $ 116.4 $ 6.3 Gross Profit % 23% 15% 11% -6% 5% Restructuring Savings New Gross Profit $ New Gross Profit % $ 9.5 $ 15.8 13.6% * Reflects FY 2024 CHF results restated as a hypothetical pro forma with estimated cost and productivity savings from CHF restructuring actions included. This is a hypothetical model only – it is not intended as guidance/projections. Also, this model does not include any allocation of corporate costs at segment level. ** Estimated restructuring savings for CHF segment only.
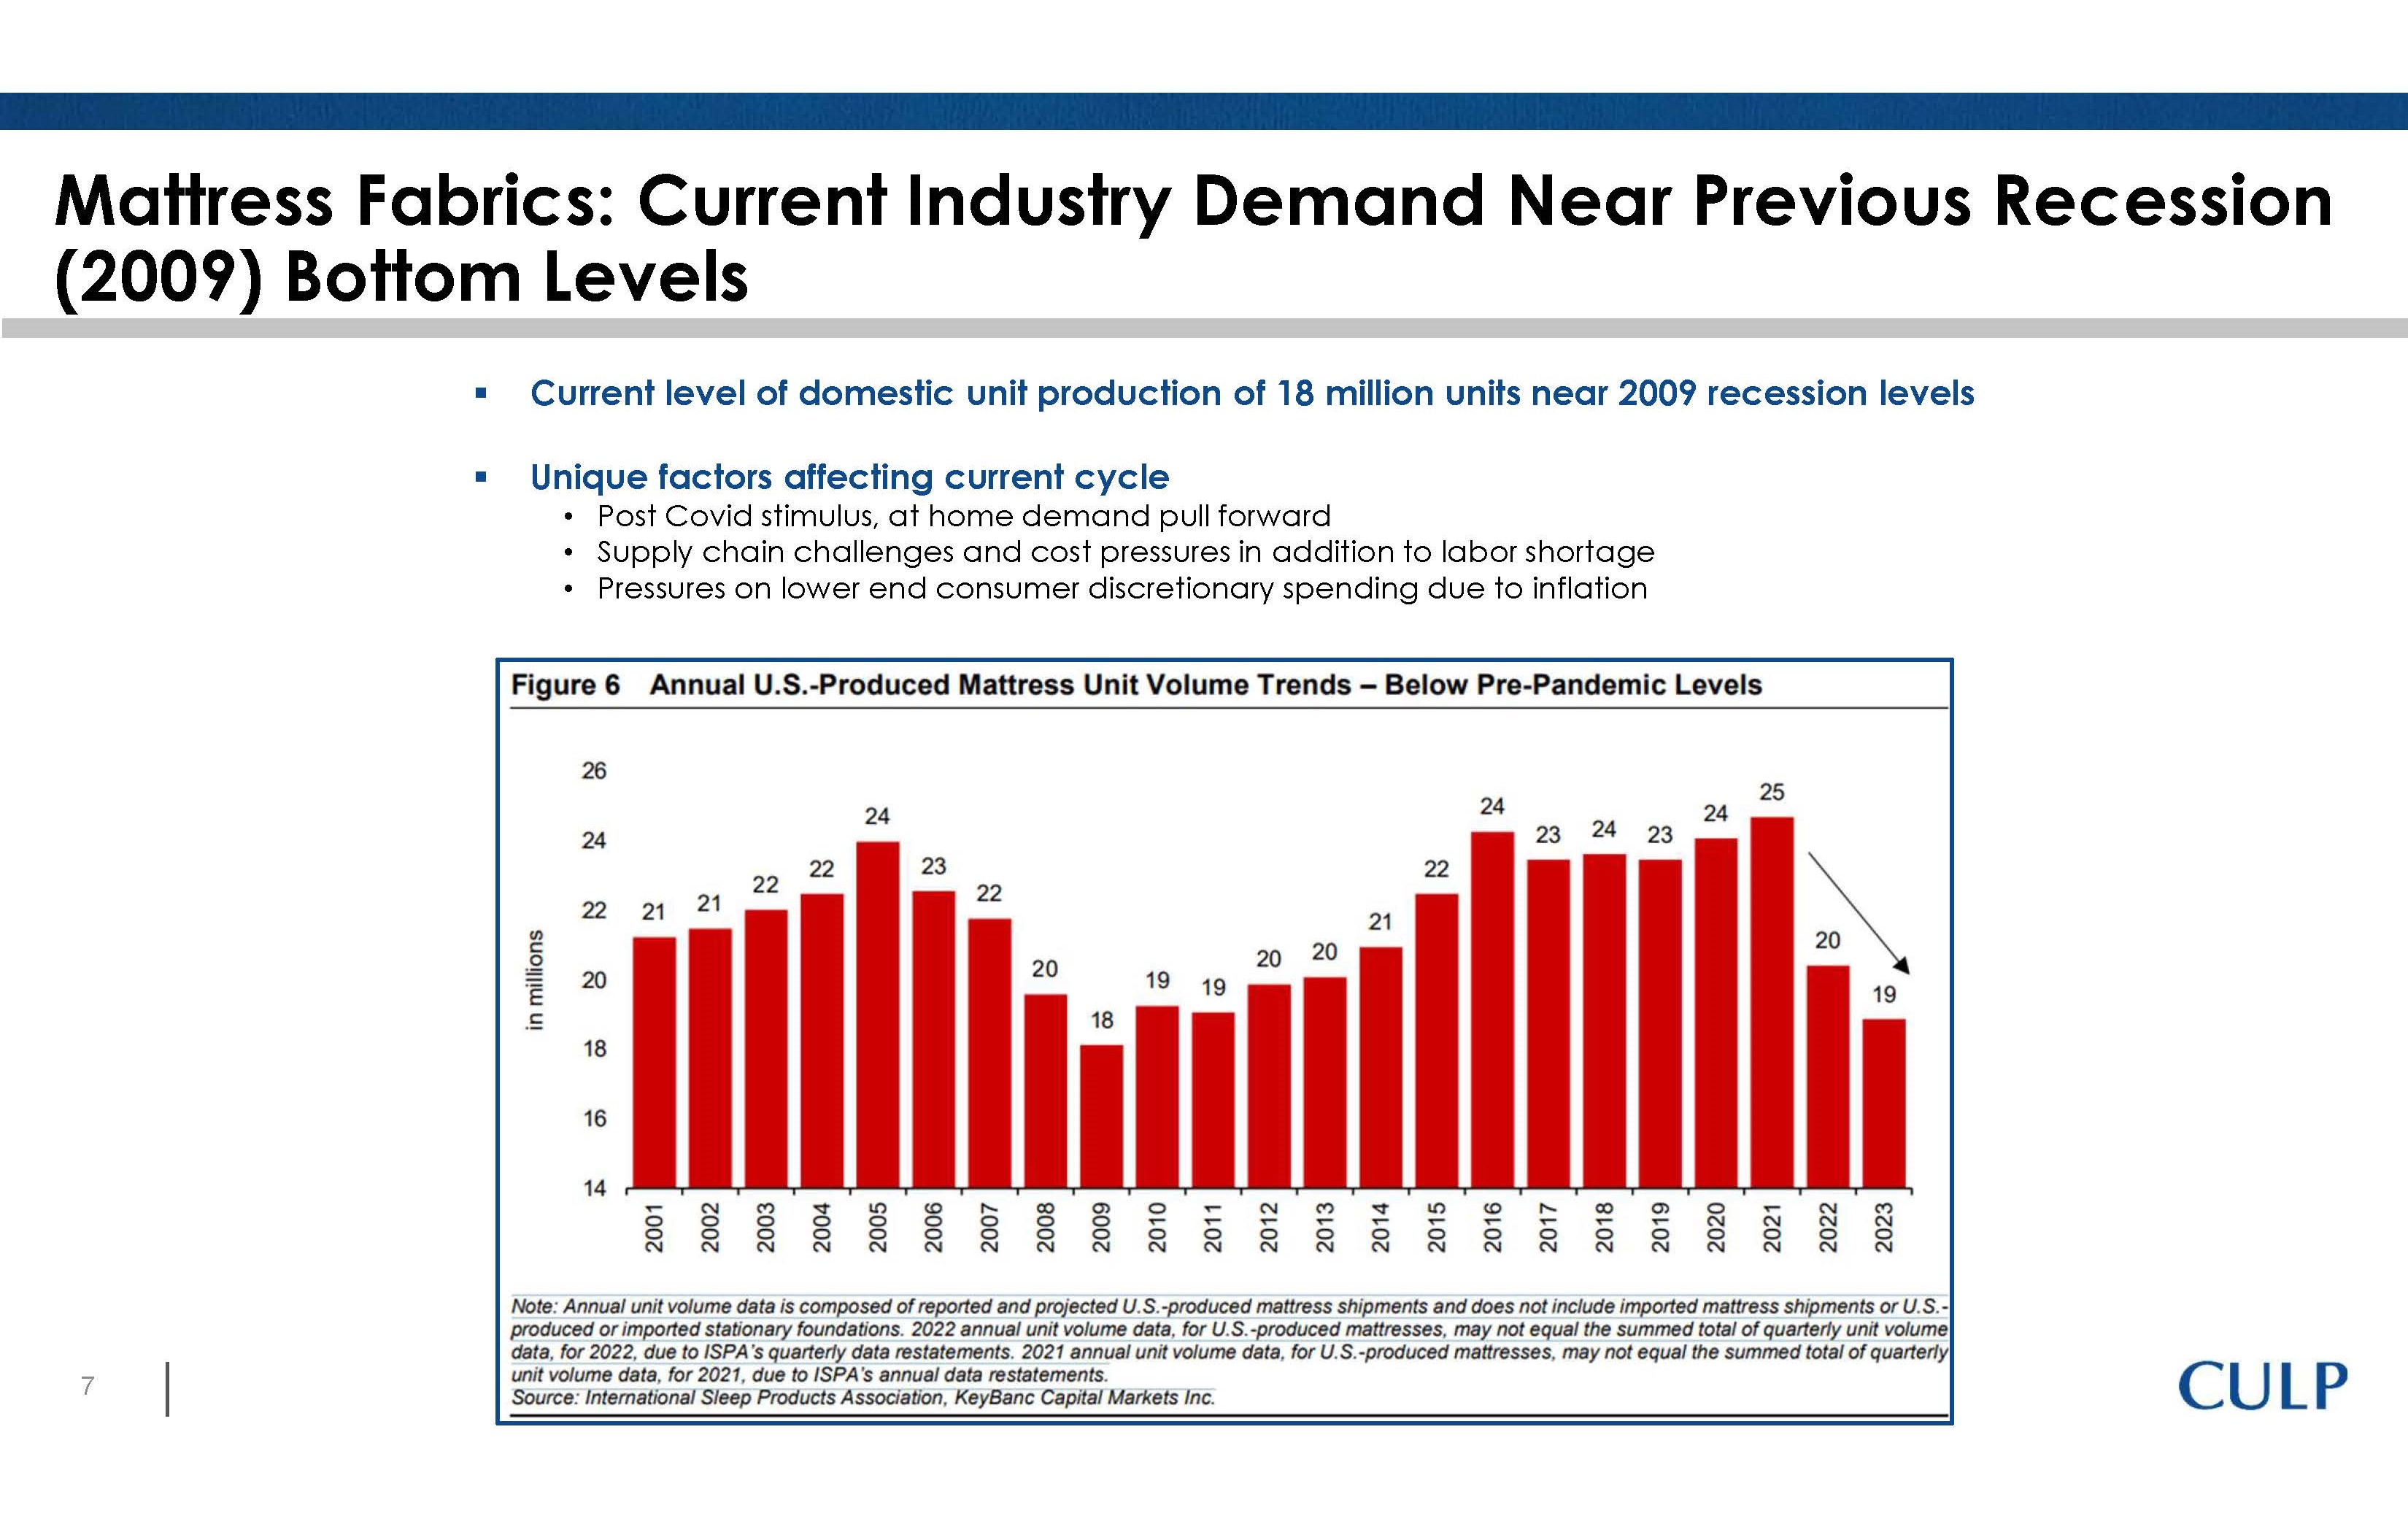
Mattress Fabrics: Current Industry Demand Near Previous Recession (2009) Bottom Levels Current level of domestic unit production of 18 million units near 2009 recession levels Unique factors affecting current cycle Post Covid stimulus, at home demand pull forward Supply chain challenges and cost pressures in addition to labor shortage Pressures on lower end consumer discretionary spending due to inflation Figure 6 Annual U.S. Produced mattress Unit volume trends – Below Pre-Pandemic Levels 26 24 22 20 18 16 14 21 21 22 22 24 23 22 20 18 19 19 20 20 21 22 24 23 24 23 24 25 20 19 2001 2002 2003 2004 2005 2006 2007 2008 2009 2010 2011 2012 2013 2014 2015 2016 2017 2018 2019 2020 2021 2022 2023 note: Annual unit volume date is composed of reported and projected U.S. Produced mattress shipments and does not include imported mattress shipments or U.S.-Produced of imported stationary foundations. 2022 annual unit volume data, for U.S.-produced mattresses, may not equal the summed total of quarterly unit volume data, for 2022, due to ISPA`s quarterly data restatement. 2021 annual unit volume data, for U.S.-Produced mattresses, may not equal the summed total of quarterly unit volume data, for 2021, due to ISPA`s annual data restatements. Source: International Sleep Products Association, KeyBanc Capital Markets Inc.
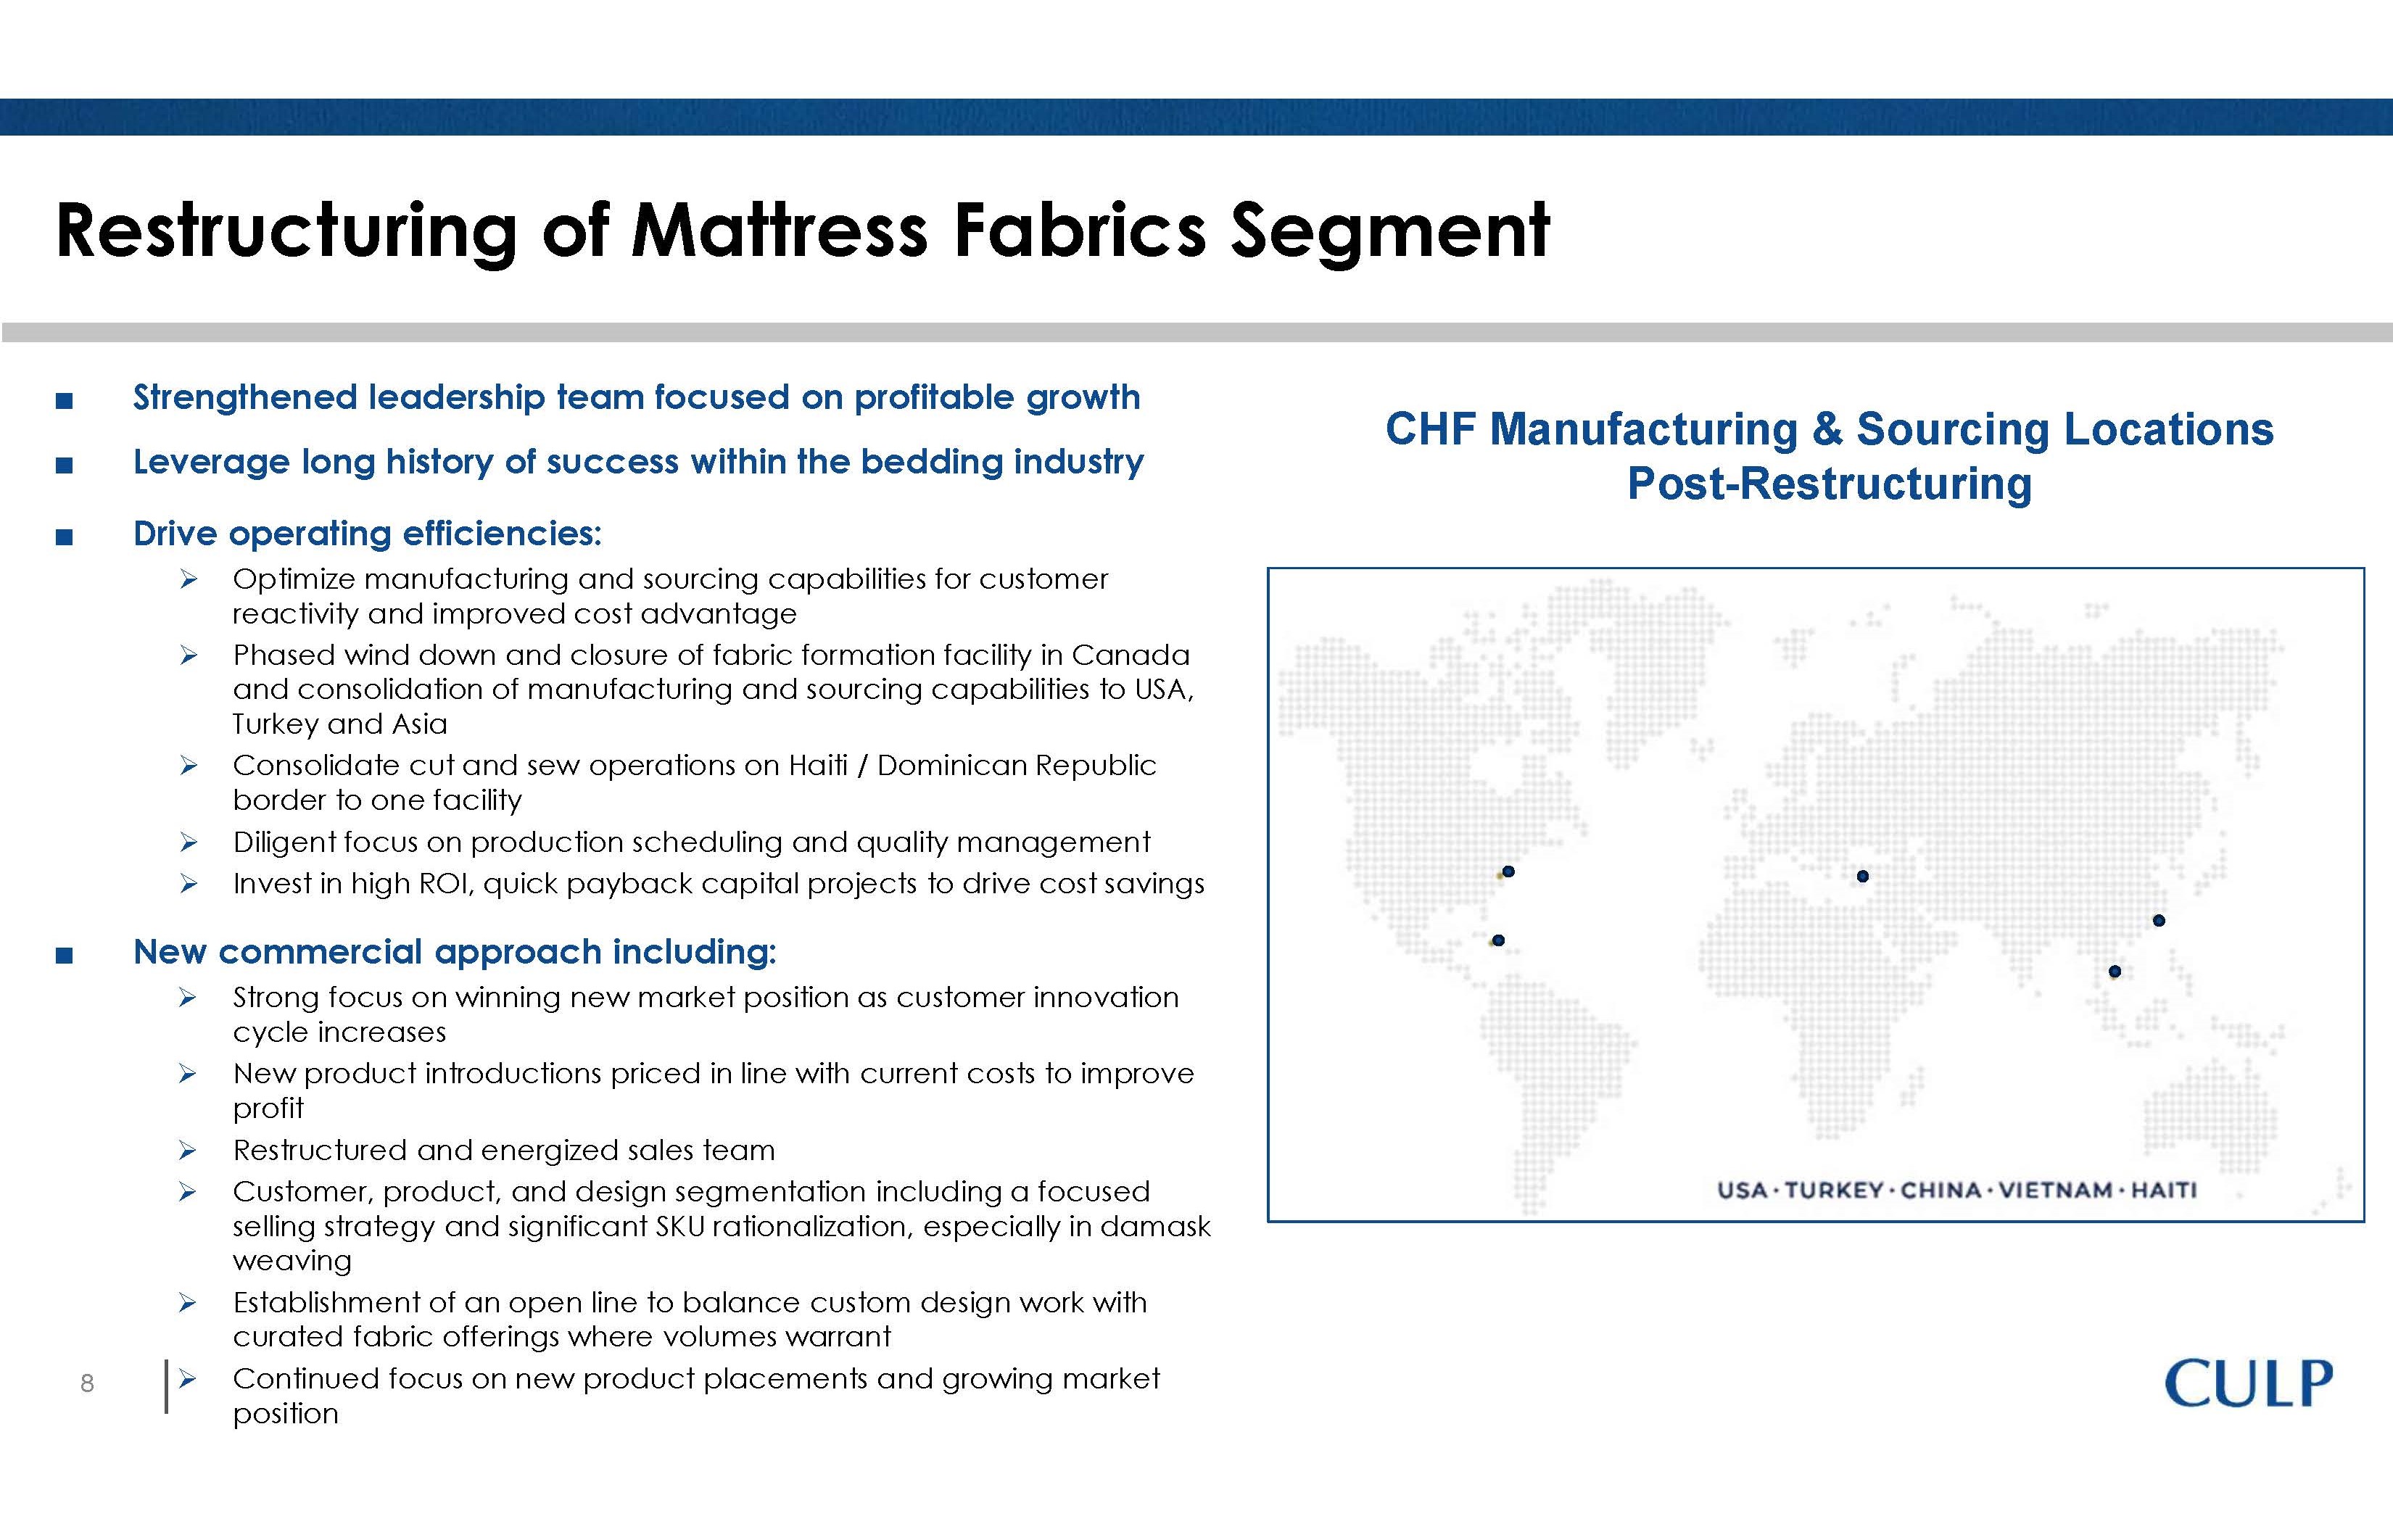
BALANCE SHEET IMPACT § Cash and access to liquidity remains solid § Expect to utilize some borrowing during fiscal 2025 to fund restructuring activity and worldwide working capital to grow business ($4.0 million in borrowings outstanding under China credit line as of 7/28/20024) § Expect to maintain positive net cash position and fund approximately $2.0 million of cash restructuring costs with proceeds from the sale of excess manufacturing equipment and proceeds from a building lease termination in Haiti § Eventual proceeds from sale of Canadian facility enhances balance sheet § Cost actions to dramatically lower expected operating and cash burn at current low sales levels to ride out industry softness § Restructuring and balance sheet actions allow for continued investment in the business to benefit consolidated company in market recovery 5 CULP Restructuring of Mattress Fabrics Segment Strengthened leadership team focused on profitable growth Leverage long history of success within the bedding industry Drive operating efficiencies: Optimize manufacturing and sourcing capabilities for customer reactivity and improved cost advantage Phased wind down and closure of fabric formation facility in Canada and consolidation of manufacturing and sourcing capabilities to USA, Turkey and Asia Consolidate cut and sew operations on Haiti / Dominican Republic border to one facility Diligent focus on production scheduling and quality management Invest in high ROI, quick payback capital projects to drive cost savings New commercial approach including: Strong focus on winning new market position as customer innovation cycle increases New product introductions priced in line with current costs to improve profit Restructured and energized sales team Customer, product, and design segmentation including a focused selling strategy and significant SKU rationalization, especially in damask weaving Establishment of an open line to balance custom design work with curated fabric offerings where volumes warrant Continued focus on new product placements and growing market position CHF Manufacturing & Sourcing Locations Post-Restructuring USA Turkey China Vietnam Haiti Solidly Profitable Upholstery Fabrics Segment With Key Initiatives Underway to Accelerate Performance Leading position in a fragmented market Asset light model to maintain flexibility and product profit performance Growing innovative performance products LiveSmart® performance brand LiveSmart Evolve®, performance plus recycled fibers Nanobionic® wellness-focused technology Growing Hospitality segment Targeting >25% of normalized sales with higher margin Expanding capacity of roller shades within Read Window Products Drive operating efficiencies Cut & Sew platform restructuring completed in both Haiti and Asia Improved Read Window operations Lower inventory markdown expense Accelerating Segment Performance
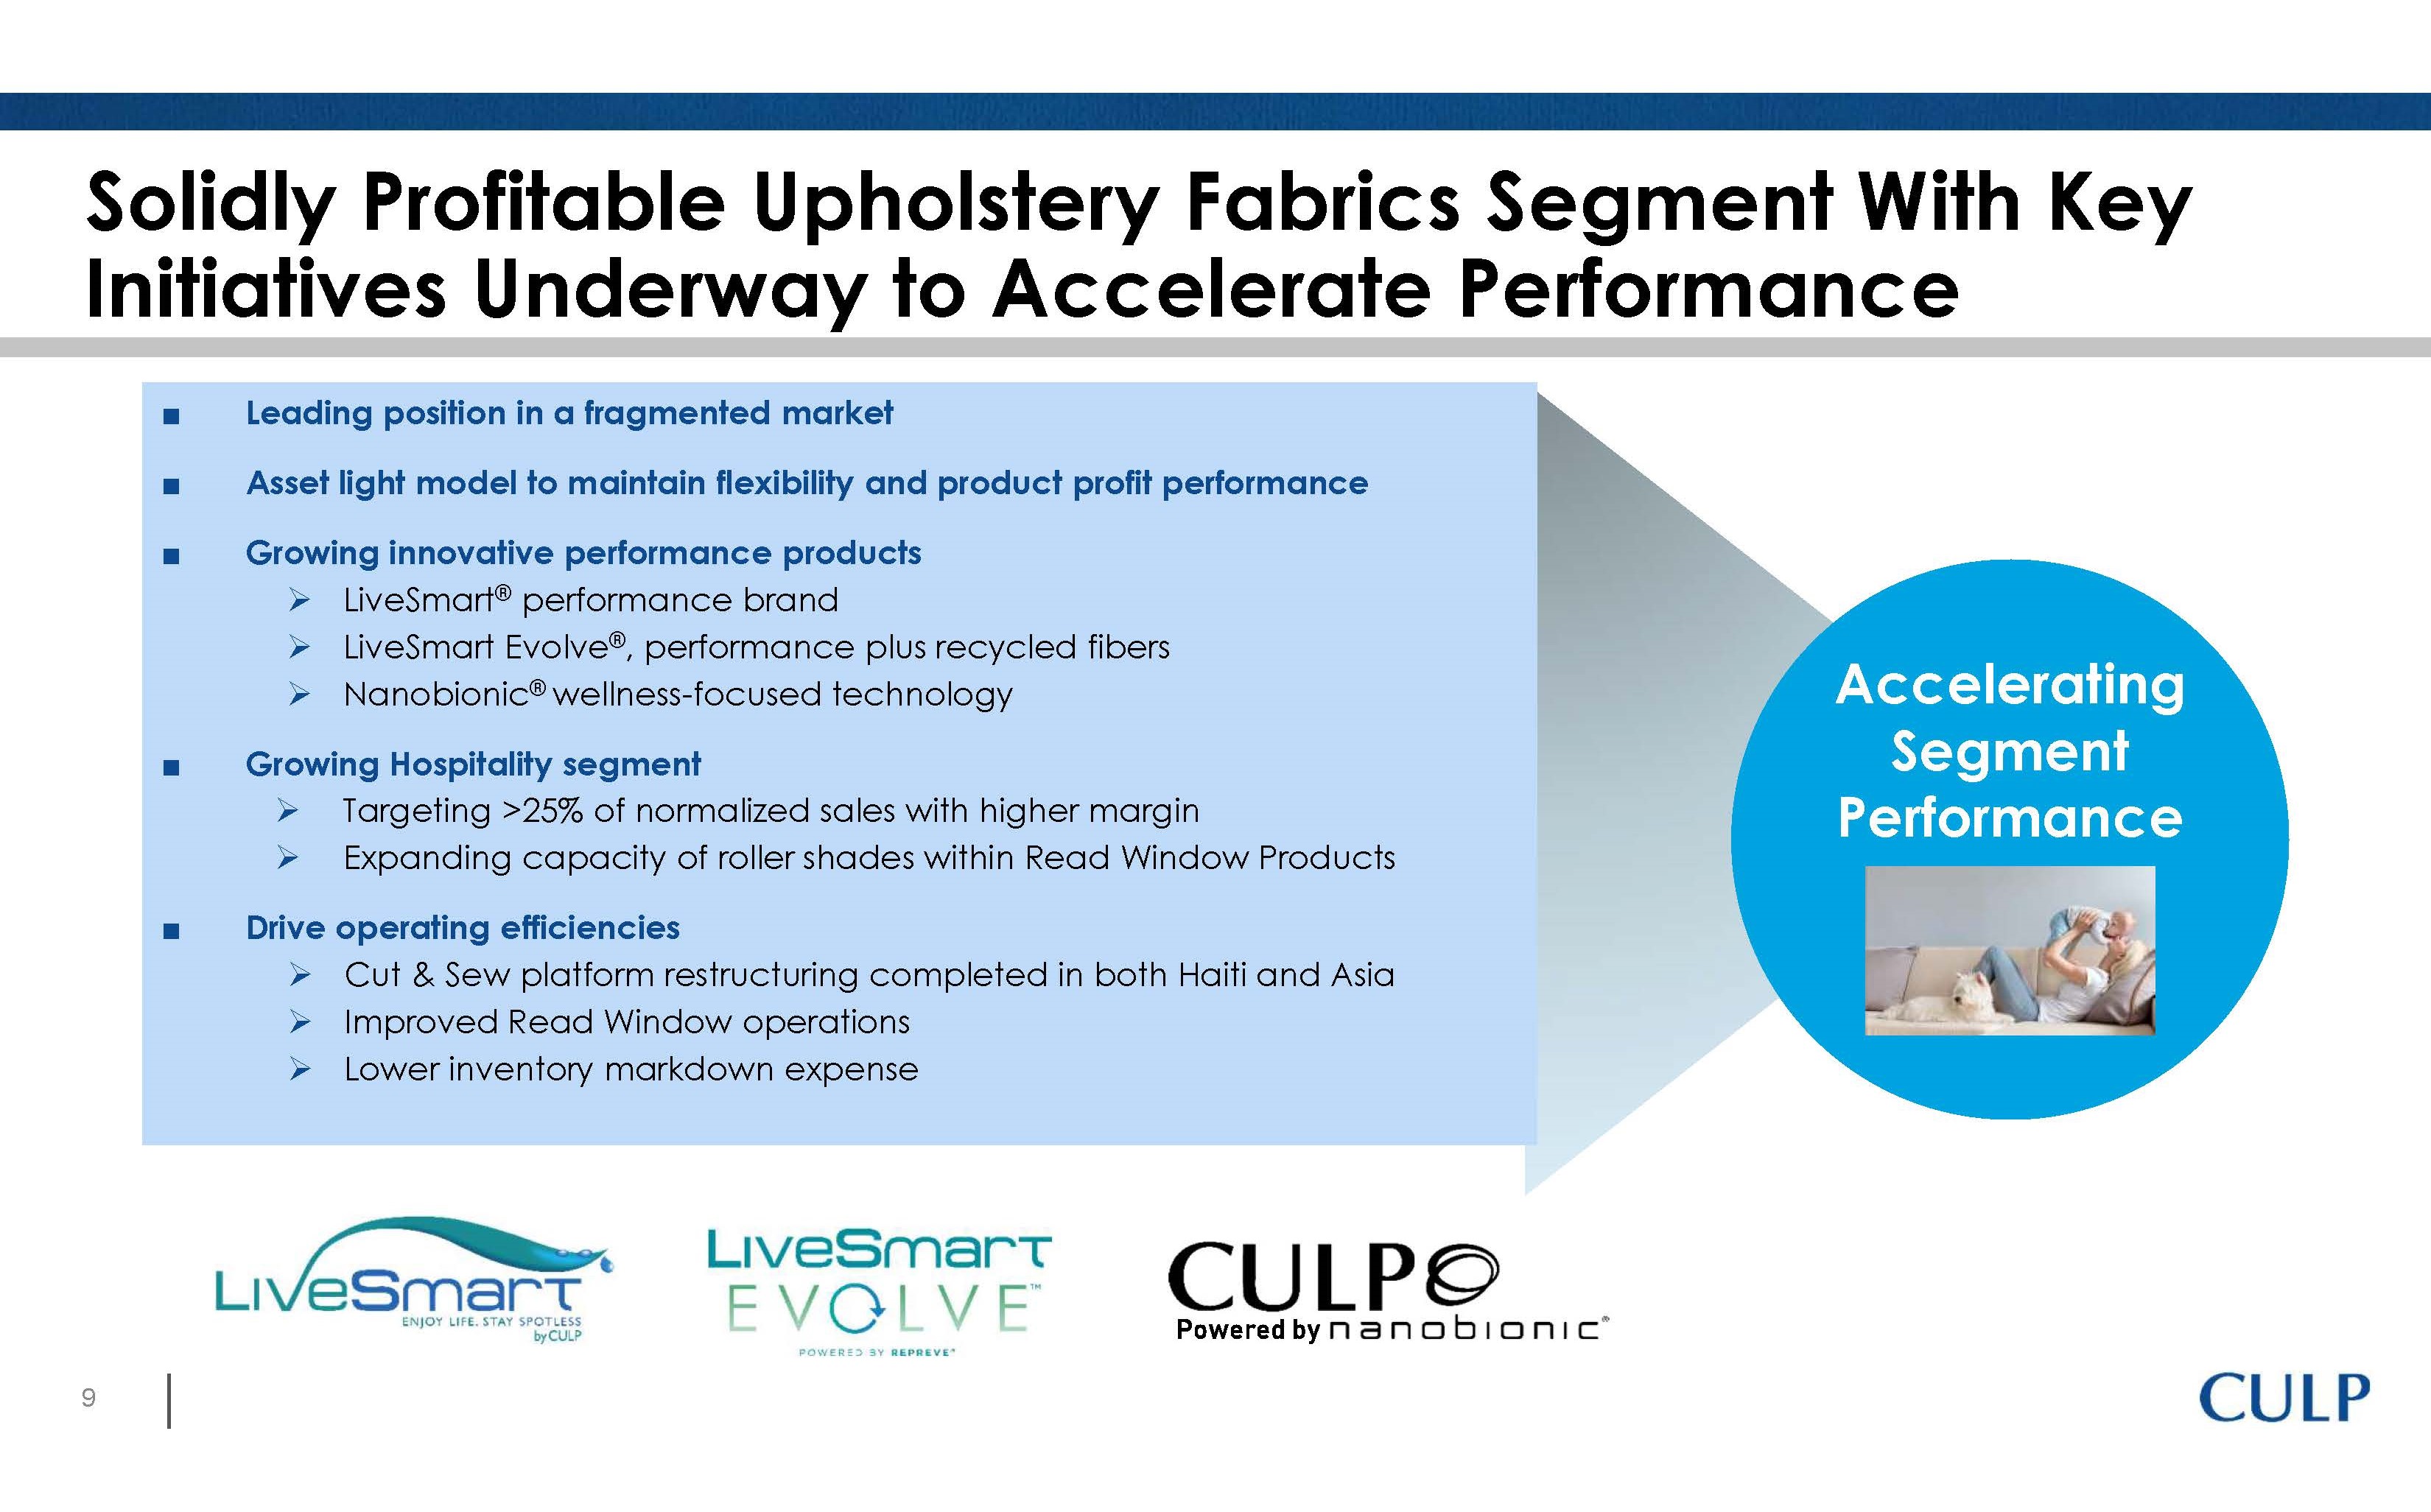
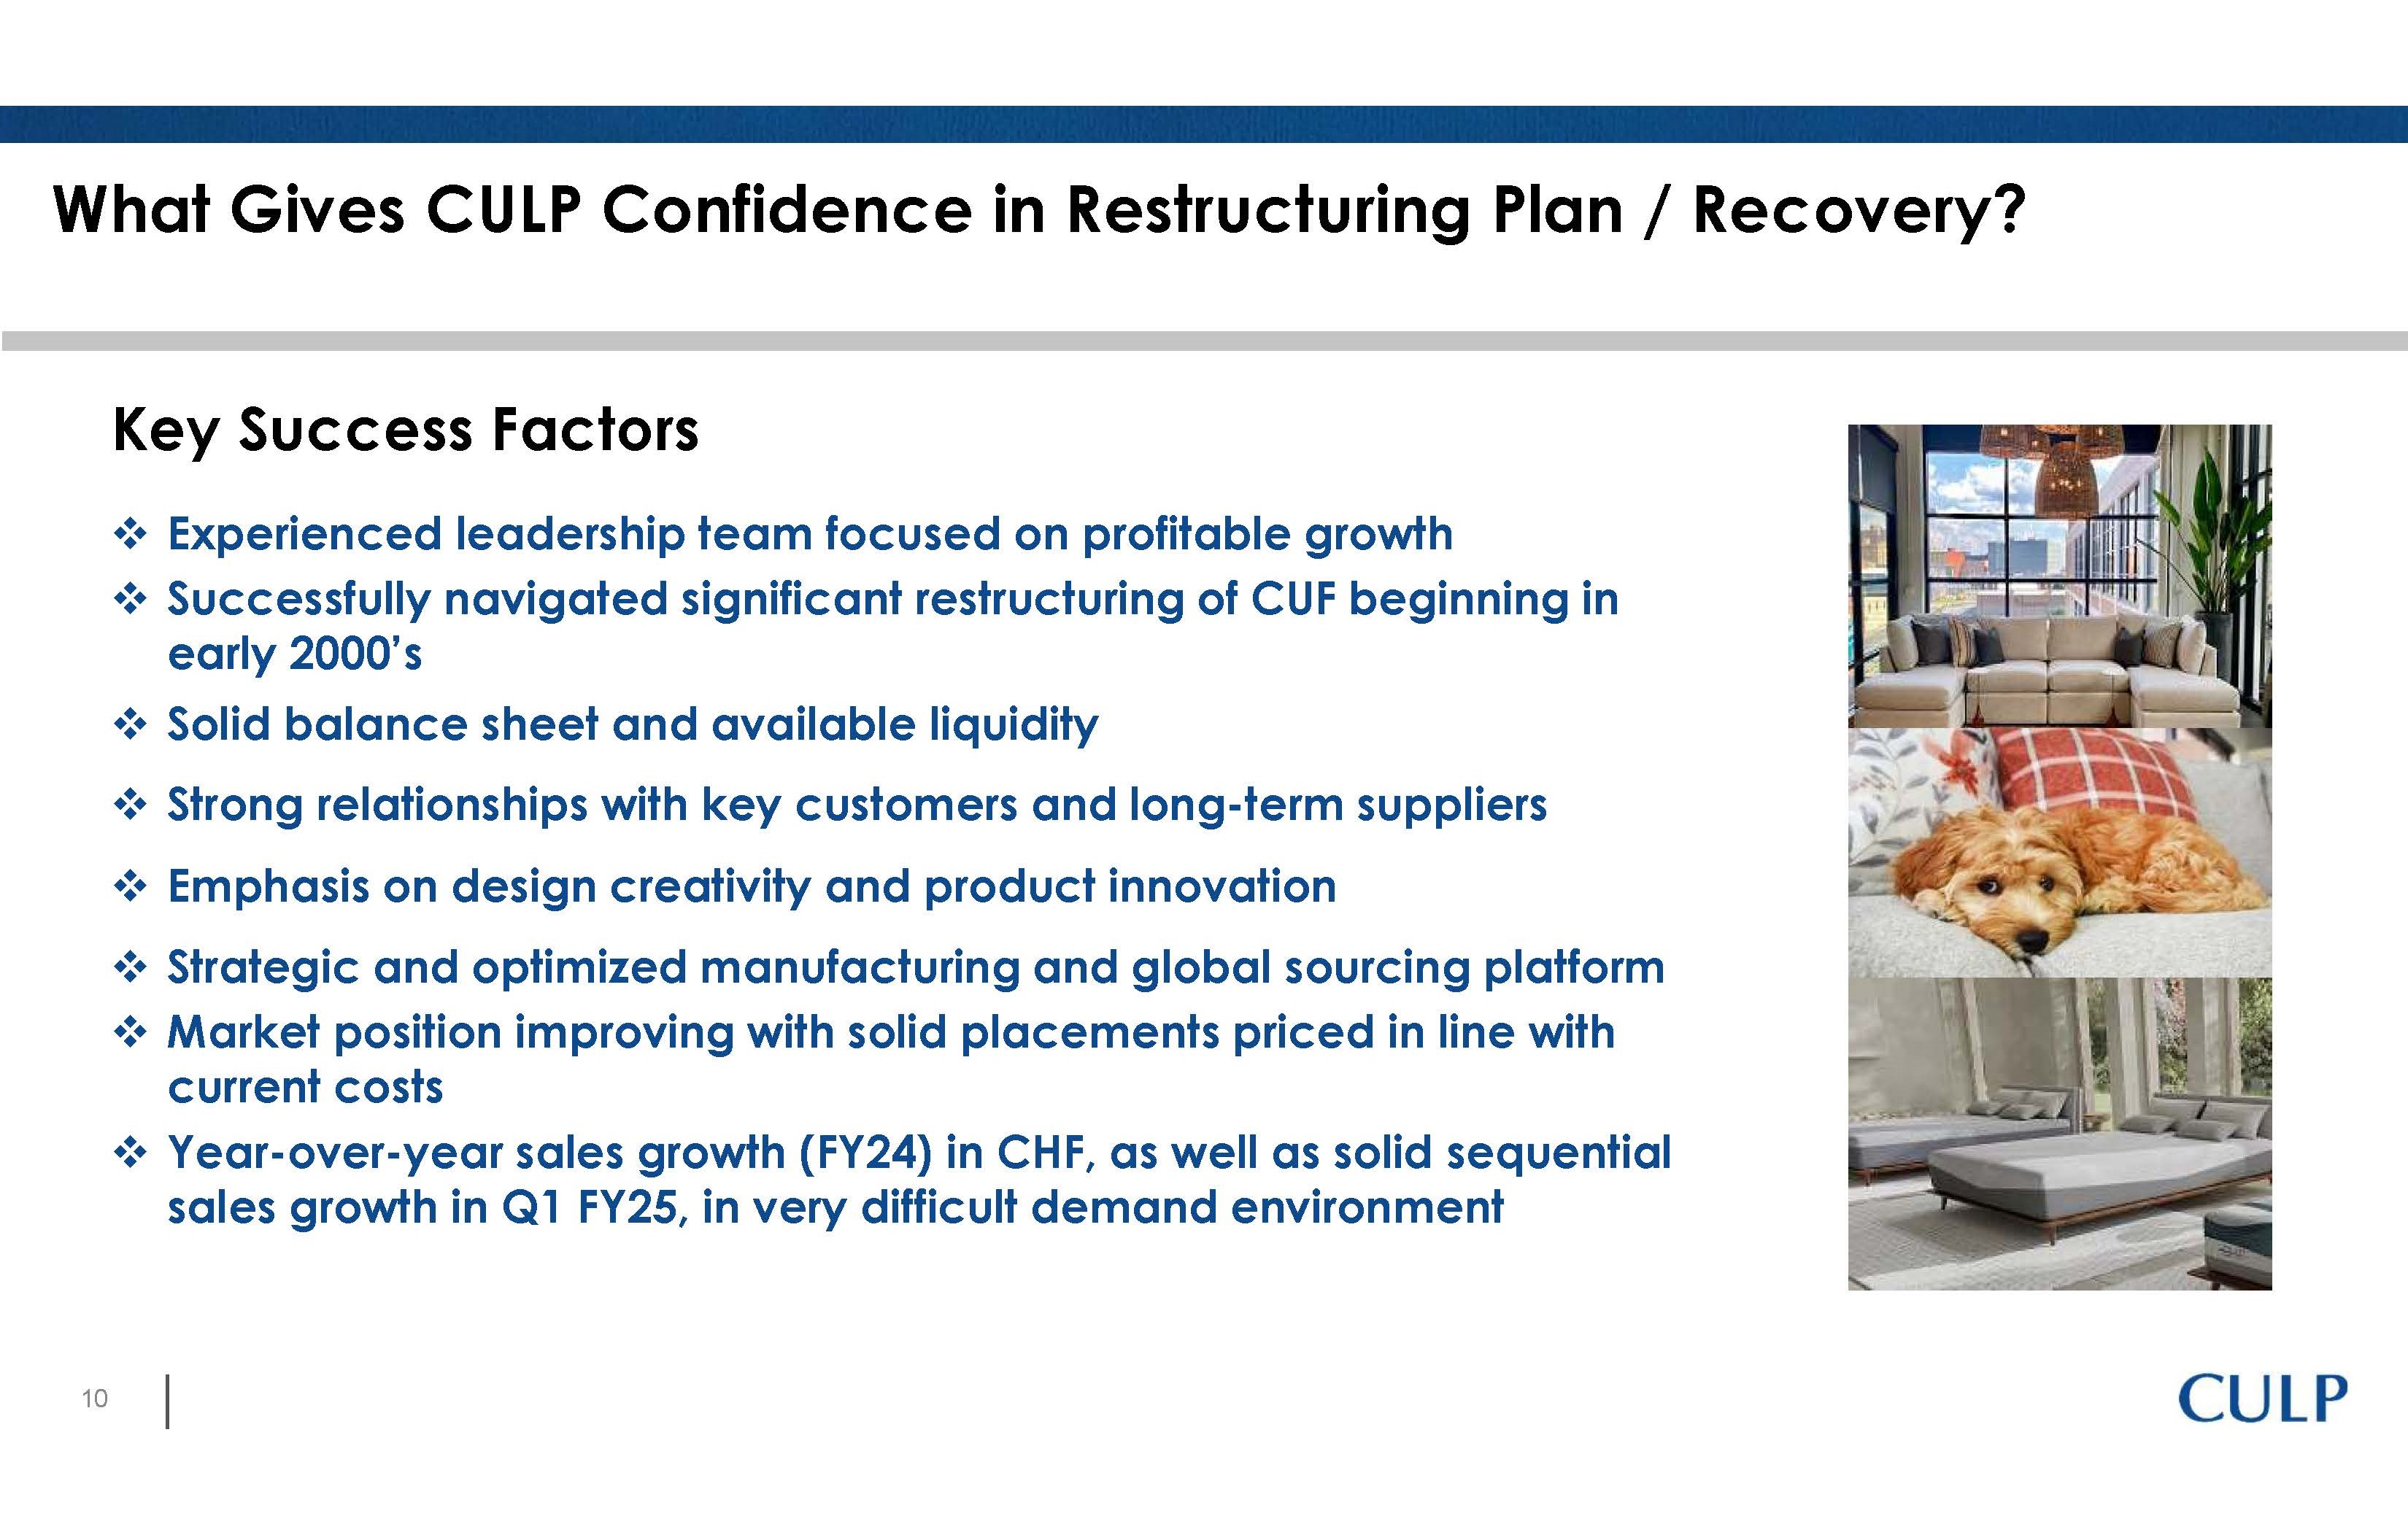
What Gives CULP Confidence in Restructuring Plan / Recovery? Key Success Factors Experienced leadership team focused on profitable growth Successfully navigated significant restructuring of CUF beginning in early 2000’s Solid balance sheet and available liquidity Strong relationships with key customers and long-term suppliers Emphasis on design creativity and product innovation Strategic and optimized manufacturing and global sourcing platform Market position improving with solid placements priced in line with current costs Year-over-year sales growth (FY24) in CHF, as well as solid sequential sales growth in Q1 FY25, in very difficult demand environment