UNITED STATES
SECURITIES AND EXCHANGE COMMISSION
WASHINGTON, D.C. 20549
FORM 8-K
CURRENT REPORT
PURSUANT TO SECTION 13 OR 15(d) OF THE
SECURITIES EXCHANGE ACT OF 1934
Date of Report (Date of earliest event reported): May 1, 2024
CRAWFORD & COMPANY
(Exact Name of Registrant as Specified in Its Charter)
Georgia
(State or Other Jurisdiction of Incorporation)
1-10356 |
|
58-0506554 |
|
||
(Commission File Number) |
|
(IRS Employer Identification No.) |
|
|
|
5335 Triangle Parkway, Peachtree Corners, Georgia |
|
30092 |
|
||
(Address of Principal Executive Offices) |
|
(Zip Code) |
(404) 300-1000
(Registrant's Telephone Number, Including Area Code)
N/A
(Former Name or Former Address, if Changed Since Last Report)
Check the appropriate box below if the Form 8-K filing is intended to simultaneously satisfy the filing obligation of the registrant under any of the following provisions:
☐ Written communications pursuant to Rule 425 under the Securities Act (17 CFR 230.425)
☐ Soliciting material pursuant to Rule 14a-12 under the Exchange Act (17 CFR 240.14a-12)
☐ Pre-commencement communications pursuant to Rule 14d-2(b) under the Exchange Act (17 CFR 240.14d-2(b))
☐ Pre-commencement communications pursuant to Rule 13e-4(c) under the Exchange Act (17 CFR 240.13e-4(c))
Indicate by check mark whether the registrant is an emerging growth company as defined in Rule 405 of the Securities Act of 1933 or Rule 12b-2 of the Securities Act of 1934.
Emerging growth company ☐
If an emerging growth company, indicate by check mark if the registrant has elected not to use the extended transition period for complying with any new or revised financial accounting standards provided pursuant to Section 13(a) of the Exchange Act. ☐
Securities Registered Pursuant to Section 12(b) of the Act:
Title of each class |
Trading Symbol(s) |
Name of each exchange on which registered |
Class A Common Stock — $1.00 Par Value |
CRD-A |
New York Stock Exchange, Inc. |
Class B Common Stock — $1.00 Par Value |
CRD-B |
New York Stock Exchange, Inc. |
Item 2.02. Results of Operations and Financial Condition
On May 1, 2024, Crawford & Company (the "Company") issued a press release containing information about the Company's financial results for the first quarter 2024. A copy of the press release is attached hereto as Exhibit 99.1 and is incorporated herein by this reference.
Item 7.01. Regulation FD Disclosure
The Company has made available on the Company's website at https://ir.crawco.com a presentation designed to enhance the information presented at its quarterly earnings conference call on Thursday, May 2, 2023 at 8:30 a.m. Eastern Time. A copy of the presentation is attached hereto as Exhibit 99.2 and is incorporated herein by this reference.
Item 9.01. Financial Statements and Exhibits
(d) The following exhibits are being filed herewith:
Exhibit No. |
|
Description |
|
|
|
99.1 |
|
|
|
|
|
99.2 |
|
|
|
|
|
104 |
|
Cover Page Interactive Data File (embedded within the Inline XBRL document) |
The information contained in this current report on Form 8-K and in the accompanying exhibits shall not be incorporated by reference into any filing of the Company with the SEC, whether made before or after the date hereof, regardless of any general incorporation by reference language in such filing, unless expressly incorporated by specific reference to such filing. The information, including the exhibits hereto, shall not be deemed to be "filed" for purposes of Section 18 of the Securities Exchange Act of 1934, as amended, or otherwise subject to the liabilities of that section or Sections 11 and 12(a)(2) of the Securities Act of 1933, as amended.
2
SIGNATURE
Pursuant to the requirements of the Securities and Exchange Act of 1934, the Registrant has duly caused this report to be signed on its behalf by the undersigned hereunto duly authorized.
|
CRAWFORD & COMPANY |
||
|
(Registrant) |
||
|
|
|
|
|
By: |
|
/s/ W. BRUCE SWAIN |
|
|
|
W. Bruce Swain |
|
|
|
Executive Vice President - |
|
|
|
Chief Financial Officer |
|
|
|
|
Dated: May 1, 2024 |
|
|
|
3
Exhibit 99.1
|
|
|
|
|
Crawford & Company®
5335 Triangle Parkway
Peachtree Corners, GA 30092
FOR IMMEDIATE RELEASE
CRAWFORD & COMPANY REPORTS 2024 FIRST QUARTER RESULTS
ATLANTA, (May 1, 2024) -- Crawford & Company® (NYSE: CRD-A and CRD-B), is pleased to announce its financial results for the first quarter ended March 31, 2024.
Based in Atlanta, Crawford & Company (NYSE: CRD‐A and CRD‐B) is a leading global provider of claims management and outsourcing solutions to insurance companies and self‐insured entities with an expansive network serving clients in more than 70 countries. The Company’s two classes of stock are substantially identical, except with respect to voting rights for the Class B Common Stock (CRD-B) and protections for the non-voting Class A Common Stock (CRD-A). More information is available on the Company's website.
Mr. Rohit Verma, president and chief executive officer of Crawford & Company, commented, “Our first quarter results came in largely as expected and reflect the continued absence of significant severe weather activity, a trend which began in the back half of 2023 and has persisted through the first quarter of 2024. Despite the difficult comparison created by the absence of catastrophic weather, our non-weather driven businesses delivered strong first quarter results. These included another record revenue quarter from Broadspire and the U.S. GTS service line, and continued progress in our International Operations segment where revenue growth continued in the quarter. The seasonal weather impacted North America Loss Adjusting where revenues remained consistent with the first quarter of last year and Platform Solutions revenues declined as anticipated, directly related to the absence of approximately $30 million in catastrophe revenues which did not repeat in the first quarter of 2024."
GAAP Consolidated Results
First Quarter 2024
Non-GAAP Consolidated Results
First Quarter 2024
Mr. Verma continued, “The strength of our underlying non-weather business provides a solid foundation to balance periodic revenue shifts directly related to the variability of catastrophic weather events. Importantly, our balance sheet remains strong, reflected in our ample liquidity and conservatively managed debt which position us to capitalize on opportunities as we move through 2024. With the strength of our relationships and our brand recognition as a valued partner in the market, we are well positioned to drive growth and long-term strategic success.”
Segment Results for the First Quarter
North America Loss Adjusting
North America Loss Adjusting revenues before reimbursements were $77.4 million in the first quarter of 2024, decreasing (0.3)% from $77.6 million in the first quarter of 2023.
The segment had operating earnings of $4.5 million in the 2024 first quarter, decreasing from $8.1 million in the first quarter of 2023. The operating margin was 5.8% in the 2024 quarter and 10.4% in the 2023 quarter.
International Operations
International Operations revenues before reimbursements were $98.1 million in the first quarter of 2024, up 6.8% from $91.9 million in the same period of 2023. Absent foreign exchange rate decreases of $0.9 million, revenues would have been $97.2 million for the 2024 first quarter.
Operating earnings were $1.7 million in the 2024 first quarter, compared to $3.0 million in the 2023 period. The segment’s operating margin for the 2024 quarter was 1.7% as compared with 3.3% in the 2023 quarter.
Broadspire
Broadspire segment revenues before reimbursements were a new quarterly record of $94.3 million in the 2024 first quarter, increasing 12.2% from $84.1 million in the 2023 first quarter.
Broadspire recorded operating earnings of $12.8 million in the first quarter of 2024, representing an operating margin of 13.6%, increasing from $7.9 million, or 9.4% of revenues, in the 2023 first quarter.
Platform Solutions
Platform Solutions revenues before reimbursements were $31.9 million in the first quarter of 2024, down (49.2)% from $62.8 million in the same period of 2023 as the Networks service line was completing claims related to Hurricane Ian in the 2023 period.
Operating earnings were $1.1 million in the 2024 first quarter, decreasing from the $10.0 million in the 2023 period. The segment’s operating margin for the 2024 quarter was 3.5% as compared with 15.9% in the 2023 quarter.
Unallocated Corporate and Shared Costs and Credits, Net
Unallocated corporate costs were $8.0 million in the first quarter of 2024, compared with $4.1 million in the same period of 2023. The increase in the 2024 first quarter was primarily due to an increase in professional fees, compensation-related costs, and other reserves.
Selling, General, and Administrative Expenses
Selling, general, and administrative expenses (“SG&A”) increased $10.6 million, or 15.9%, in the three months ended March 31, 2024 as compared with the 2023 period. The increase was primarily due to professional fees, IT costs, bad debt expense, and compensation expense, including taxes and benefits.
2
Other Matters
The Company recognized pretax contingent earnout expenses totaling $0.2 million during each of the 2024 and 2023 quarters, related to the fair value adjustment of earnout liabilities arising from recent acquisitions. This adjustment, which is not a component of operating earnings, is based on favorable changes to projections of acquired entities over the respective earnout periods, which span multiple years.
The Company recognized non-service pension costs of $2.5 million in the 2024 first quarter compared with $2.2 million in the comparable 2023 period. Non-service pension costs represent the U.S. and U.K. non-service defined benefit pension costs, which are non-operating in nature as the U.S. plan is frozen and the U.K. plans are closed to new participants.
Balance Sheet and Cash Flow
The Company’s consolidated cash and cash equivalents position as of March 31, 2024, totaled $45.2 million, compared with $58.4 million at December 31, 2023. The Company’s total debt outstanding as of March 31, 2024, totaled $230.2 million, compared with $209.1 million at December 31, 2023.
The Company’s operations used $19.8 million of cash, net during the first three months of 2024, compared with $0.4 million used in 2023. The increase in cash used was due primarily to $11.0 million lower operating earnings and $11.2 million higher incentive compensation payments over the prior year.
The Company made no contributions to its U.S. defined benefit pension plan and $0.6 million in contributions to its U.K. plans for the first quarter of 2024, compared with no contributions to the U.S. plan and $0.5 million to the U.K. plans in 2023.
During the 2024 first quarter, the Company didn't repurchase any shares of CRD-A, but repurchased 85,632 shares of CRD-B at an average per share cost of $8.56. There were no shares repurchased during the 2023 first quarter. The total cost of share repurchases in the 2024 quarter was $0.7 million.
Conference Call
As previously announced, Crawford & Company will host a conference call on May 2, 2024, at 8:30 a.m. Eastern Time to discuss its first quarter 2024 results. The conference call can be accessed live by dialing 1-888-259-6580 and using Conference ID 67309448. A presentation for tomorrow’s call can also be found on the investor relations portion of the Company’s website, https://ir.crawco.com. The call will be recorded and available for replay through June 2, 2024. You may dial 1-877-674-7070 and use passcode 309448# to listen to the replay.
Non-GAAP Presentation
In the normal course of business, our operating segments incur certain out-of-pocket expenses that are thereafter reimbursed by our clients. Under U.S. generally accepted accounting principles (“GAAP”), these out-of-pocket expenses and associated reimbursements are required to be included when reporting expenses and revenues, respectively, in our consolidated results of operations. In the foregoing discussion and analysis of segment results of operations, we do not include a gross up of segment expenses and revenues for these pass-through reimbursed expenses. The amounts of reimbursed expenses and related revenues offset each other in our results of operations with no impact to our net income or operating earnings. A reconciliation of revenues before reimbursements to consolidated revenues determined in accordance with GAAP is self-evident from the face of the accompanying unaudited condensed consolidated statements of operations.
Operating earnings is the primary financial performance measure used by our senior management and chief operating decision maker (“CODM”) to evaluate the financial performance of our Company and operating segments, and make resource allocation and certain compensation decisions. Unlike net income, segment operating earnings is not a standard performance measure found in GAAP. We believe this measure is useful to others in that it allows them to evaluate segment and consolidated operating performance using the same criteria used by our senior management and CODM. Consolidated operating earnings represent segment earnings including certain unallocated corporate and shared costs, but before net corporate interest expense, stock option expense, amortization of acquisition-related intangible assets, contingent earnout adjustments, non-service pension costs, income taxes and net income or loss attributable to noncontrolling interests.
3
Adjusted EBITDA is not a term defined by GAAP and as a result our measure of adjusted EBITDA might not be comparable to similarly titled measures used by other companies. However, adjusted EBITDA is used by management to evaluate, assess and benchmark our operational results. The Company believes that adjusted EBITDA is relevant and useful information widely used by analysts, investors and other interested parties. Adjusted EBITDA is defined as net income attributable to shareholders of the Company with adjustments for depreciation and amortization, net corporate interest expense, contingent earnout adjustments, non-service pension costs, income taxes and stock-based compensation expense.
Unallocated corporate and shared costs and credits include expenses and credits related to our chief executive officer and Board of Directors, certain provisions for bad debt allowances or subsequent recoveries such as those related to bankrupt clients, certain unallocated professional fees and certain self-insurance costs and recoveries that are not allocated to our individual operating segments.
Income taxes, net corporate interest expense, stock option expense, amortization of acquisition-related intangible assets, contingent earnout adjustments, and non-service pension costs are recurring components of our net income, but they are not considered part of our segment operating earnings because they are managed on a corporate-wide basis. Income taxes are calculated for the Company on a consolidated basis based on statutory rates in effect in the various jurisdictions in which we provide services and vary significantly by jurisdiction. Net corporate interest expense results from capital structure decisions made by senior management and the Board of Directors, affecting the Company as a whole. Stock option expense represents the non-cash costs generally related to stock options and employee stock purchase plan expenses which are not allocated to our operating segments. Amortization expense is a non-cash expense for finite-lived customer-relationship and trade name intangible assets acquired in business combinations. Contingent earnout adjustments relate to changes in the fair value of earnouts associated with our recent acquisitions. Non-service pension costs represent the U.S. and U.K. non-service defined benefit pension costs, which are non-operating in nature as the U.S. plan was frozen in 2002 and the U.K. plans are closed to new participants. None of these costs relate directly to the performance of our services or operating activities and, therefore, are excluded from segment operating earnings to better assess the results of each segment's operating activities on a consistent basis.
A significant portion of our operations are international. These international operations subject us to foreign exchange fluctuations. The following table illustrates revenue as a percentage of total revenue for the major currencies of the geographic areas that Crawford does business:
|
|
Three Months Ended |
|
|
|||||||||||
(in thousands) |
|
March 31, |
|
|
March 31, |
|
|
||||||||
Geographic Area |
Currency |
USD equivalent |
|
% of total |
|
|
USD equivalent |
|
% of total |
|
|
||||
U.S. |
USD |
$ |
179,721 |
|
|
59.6 |
% |
|
$ |
199,857 |
|
|
63.2 |
% |
|
U.K. |
GBP |
|
40,255 |
|
|
13.4 |
% |
|
|
33,124 |
|
|
10.5 |
% |
|
Canada |
CAD |
|
23,841 |
|
|
7.9 |
% |
|
|
24,614 |
|
|
7.8 |
% |
|
Australia |
AUD |
|
19,661 |
|
|
6.5 |
% |
|
|
22,994 |
|
|
7.2 |
% |
|
Europe |
EUR |
|
14,885 |
|
|
4.9 |
% |
|
|
14,038 |
|
|
4.4 |
% |
|
Rest of World |
Various |
|
23,291 |
|
|
7.7 |
% |
|
|
21,707 |
|
|
6.9 |
% |
|
Total Revenues, before reimbursements |
$ |
301,654 |
|
|
100.0 |
% |
|
$ |
316,334 |
|
|
100.0 |
% |
|
|
|
|
|
|
|
|
|
|
|
|
|
|
||||
4
Following is a reconciliation of consolidated operating earnings to net income attributable to shareholders of Crawford & Company on a GAAP basis:
|
Three Months Ended |
|
|
||||
(in thousands) |
March 31, 2024 |
|
March 31, 2023 |
|
|
||
Operating earnings: |
|
|
|
|
|
||
North America Loss Adjusting |
$ |
4,479 |
|
$ |
8,065 |
|
|
International Operations |
|
1,690 |
|
|
3,035 |
|
|
Broadspire |
|
12,804 |
|
|
7,927 |
|
|
Platform Solutions |
|
1,115 |
|
|
9,966 |
|
|
Unallocated corporate and shared costs, net |
|
(8,007 |
) |
|
(4,119 |
) |
|
Consolidated operating earnings |
|
12,081 |
|
|
24,874 |
|
|
(Deduct) add: |
|
|
|
|
|
||
Net corporate interest expense |
|
(3,596 |
) |
|
(4,399 |
) |
|
Stock option expense |
|
(167 |
) |
|
(156 |
) |
|
Amortization of intangible assets |
|
(1,868 |
) |
|
(1,899 |
) |
|
Non-service pension costs |
|
(2,473 |
) |
|
(2,171 |
) |
|
Contingent earnout adjustments |
|
(151 |
) |
|
(248 |
) |
|
Income tax provision |
|
(1,047 |
) |
|
(5,271 |
) |
|
Net loss (income) attributable to noncontrolling interests |
|
58 |
|
|
(49 |
) |
|
Net income attributable to shareholders of Crawford & Company |
$ |
2,837 |
|
$ |
10,681 |
|
|
|
|
|
|
|
|
||
Following is a reconciliation of net income attributable to shareholders of Crawford & Company on a GAAP basis to non-GAAP adjusted EBITDA:
|
Three Months Ended |
|
||||
(in thousands) |
March 31, |
|
March 31, |
|
||
Net income attributable to shareholders of Crawford & Company |
$ |
2,837 |
|
$ |
10,681 |
|
Add: |
|
|
|
|
||
Depreciation and amortization |
|
9,299 |
|
|
9,050 |
|
Stock-based compensation |
|
1,218 |
|
|
1,023 |
|
Net corporate interest expense |
|
3,596 |
|
|
4,399 |
|
Non-service pension costs |
|
2,473 |
|
|
2,171 |
|
Contingent earnout adjustments |
|
151 |
|
|
248 |
|
Income tax provision |
|
1,047 |
|
|
5,271 |
|
Non-GAAP adjusted EBITDA |
$ |
20,621 |
|
$ |
32,843 |
|
|
|
|
|
|
||
Following is a reconciliation of operating cash flow to free cash flow for the three months ended March 31, 2024 and 2023:
Three Months Ended |
|
||||||||||
(in thousands) |
March 31, 2024 |
|
|
March 31, 2023 |
|
|
Change |
|
|||
Net Cash Used in Operating Activities |
$ |
(19,803 |
) |
|
$ |
(445 |
) |
|
$ |
(19,358 |
) |
Less: |
|
|
|
|
|
|
|
|
|||
Property & Equipment Purchases, net |
|
(1,541 |
) |
|
|
(1,031 |
) |
|
|
(510 |
) |
Capitalized Software (internal and external costs) |
|
(8,009 |
) |
|
|
(7,610 |
) |
|
|
(399 |
) |
Free Cash Flow |
$ |
(29,353 |
) |
|
$ |
(9,086 |
) |
|
$ |
(20,267 |
) |
|
|
|
|
|
|
|
|
|
|||
Non-GAAP consolidated results for 2024 exclude the non-cash, after-tax adjustments for amortization of intangible assets of $1.6 million, non-service-related pension costs of $1.9 million, and contingent earnout adjustment of $0.2 million. Non-GAAP consolidated results for 2023 exclude a similar adjustment for amortization of intangible assets of $1.4 million, non-service-related pension costs of $1.6 million, and contingent earnout adjustment of $0.2 million.
5
Following are the reconciliations of GAAP Pretax Earnings, Net Income and Earnings Per Share to related non-GAAP Adjusted figures, which reflect each of 2024 and 2023 before amortization of intangible assets, non-service related pension costs and contingent earnout adjustments:
Three Months Ended March 31, 2024 |
|
|||||||||||
(in thousands) |
Pretax earnings |
|
Net income |
|
Diluted earnings per |
|
Diluted earnings per |
|
||||
GAAP |
$ |
3,826 |
|
$ |
2,837 |
|
$ |
0.06 |
|
$ |
0.06 |
|
Adjustments: |
|
|
|
|
|
|
|
|
||||
Amortization of intangible assets |
|
1,868 |
|
|
1,575 |
|
|
0.03 |
|
|
0.03 |
|
Non-service related pension costs |
|
2,473 |
|
|
1,929 |
|
|
0.04 |
|
|
0.04 |
|
Contingent earnout adjustments |
|
151 |
|
|
151 |
|
|
— |
|
|
— |
|
Non-GAAP Adjusted |
$ |
8,318 |
|
$ |
6,492 |
|
$ |
0.13 |
|
$ |
0.13 |
|
|
|
|
|
|
|
|
|
|
||||
Three Months Ended March 31, 2023 |
|
|||||||||||
(in thousands) |
Pretax earnings |
|
Net income |
|
Diluted earnings per |
|
Diluted earnings per |
|
||||
GAAP |
$ |
16,001 |
|
$ |
10,681 |
|
$ |
0.22 |
|
$ |
0.22 |
|
Adjustments: |
|
|
|
|
|
|
|
|
||||
Amortization of intangible assets |
|
1,899 |
|
|
1,424 |
|
|
0.03 |
|
|
0.03 |
|
Non-service related pension costs |
|
2,171 |
|
|
1,613 |
|
|
0.03 |
|
|
0.03 |
|
Contingent earnout adjustments |
|
248 |
|
|
184 |
|
|
- |
|
|
- |
|
Non-GAAP Adjusted |
$ |
20,319 |
|
$ |
13,902 |
|
$ |
0.28 |
|
$ |
0.28 |
|
|
|
|
|
|
|
|
|
|
||||
Following is information regarding the weighted average shares used in the computation of basic and diluted earnings per share:
|
Three Months Ended |
|
||||
(in thousands) |
March 31, 2024 |
|
March 31, 2023 |
|
||
Weighted-Average Shares Used to Compute Basic Earnings Per Share: |
|
|
|
|
||
Class A Common Stock |
|
29,586 |
|
|
28,841 |
|
Class B Common Stock |
|
19,542 |
|
|
19,848 |
|
Weighted-Average Shares Used to Compute Diluted Earnings Per Share: |
|
|
|
|
||
Class A Common Stock |
|
30,279 |
|
|
29,141 |
|
Class B Common Stock |
|
19,542 |
|
|
19,848 |
|
|
|
|
|
|
||
Further information regarding the Company’s operating results for the three months ended March 31, 2024, financial position as of March 31, 2024, and cash flows for the three months ended March 31, 2024 is shown on the attached unaudited condensed consolidated financial statements.
About Crawford & Company
Based in Atlanta, Crawford & Company (NYSE: CRD-A and CRD-B) is a leading provider of claims management and outsourcing solutions to insurance companies and self-insured entities with an expansive network serving clients in more than 70 countries. The Company's two classes of stock are substantially identical, except with respect to voting rights for the Class B Common Stock (CRD-B) and protections for the non-voting Class A Common Stock (CRD-A). More information is available at www.crawco.com.
TAG: Crawford-Financial, Crawford-Investor-News-and-Events
6
FOR FURTHER INFORMATION REGARDING THIS PRESS RELEASE, PLEASE CALL BRUCE SWAIN AT (404) 300-1051.
This press release contains forward-looking statements, including statements about the expected future financial condition, results of operations and earnings outlook of Crawford & Company. Statements, both qualitative and quantitative, that are not historical facts may be “forward-looking statements” as defined in the Private Securities Litigation Reform Act of 1995 and other federal securities laws. Forward-looking statements involve a number of risks and uncertainties that could cause actual results to differ materially from historical experience or Crawford & Company’s present expectations. Accordingly, no one should place undue reliance on forward-looking statements, which speak only as of the date on which they are made. Crawford & Company does not undertake to update forward-looking statements to reflect the impact of circumstances or events that may arise or not arise after the date the forward-looking statements are made. For further information regarding Crawford & Company, including factors that could cause our actual financial condition, results or earnings to differ from those described in any forward-looking statements, please read Crawford & Company’s reports filed with the SEC and available at www.sec.gov and in the Investor Relations section of Crawford & Company’s website at www.crawco.com. |
7
CRAWFORD & COMPANY
CONDENSED CONSOLIDATED STATEMENTS OF OPERATIONS
Unaudited
(In Thousands, Except Per Share Amounts and Percentages)
Three Months Ended March 31, |
|
2024 |
|
|
2023 |
|
|
% Change |
|
|||
|
|
|
|
|
|
|
|
|
|
|||
Revenues: |
|
|
|
|
|
|
|
|
|
|||
Revenues Before Reimbursements |
|
$ |
301,654 |
|
|
$ |
316,334 |
|
|
|
(5 |
)% |
Reimbursements |
|
|
11,419 |
|
|
|
11,604 |
|
|
|
(2 |
)% |
Total Revenues |
|
|
313,073 |
|
|
|
327,938 |
|
|
|
(5 |
)% |
|
|
|
|
|
|
|
|
|
|
|||
Costs and Expenses: |
|
|
|
|
|
|
|
|
|
|||
Costs of Services Provided, Before Reimbursements |
|
|
214,389 |
|
|
|
227,078 |
|
|
|
(6 |
)% |
Reimbursements |
|
|
11,419 |
|
|
|
11,604 |
|
|
|
(2 |
)% |
Total Costs of Services |
|
|
225,808 |
|
|
|
238,682 |
|
|
|
(5 |
)% |
|
|
|
|
|
|
|
|
|
|
|||
Selling, General, and Administrative Expenses |
|
|
77,320 |
|
|
|
66,711 |
|
|
|
16 |
% |
Corporate Interest Expense, Net |
|
|
3,596 |
|
|
|
4,399 |
|
|
|
(18 |
)% |
Total Costs and Expenses |
|
|
306,724 |
|
|
|
309,792 |
|
|
|
(1 |
)% |
|
|
|
|
|
|
|
|
|
|
|||
Other Loss, Net |
|
|
(2,523 |
) |
|
|
(2,145 |
) |
|
|
18 |
% |
|
|
|
|
|
|
|
|
|
|
|||
Income Before Income Taxes |
|
|
3,826 |
|
|
|
16,001 |
|
|
|
(76 |
)% |
Provision for Income Taxes |
|
|
1,047 |
|
|
|
5,271 |
|
|
|
(80 |
)% |
|
|
|
|
|
|
|
|
|
|
|||
Net Income |
|
|
2,779 |
|
|
|
10,730 |
|
|
|
(74 |
)% |
|
|
|
|
|
|
|
|
|
|
|||
Net Loss (Income) Attributable to Noncontrolling Interests |
|
|
58 |
|
|
|
(49 |
) |
|
nm |
|
|
|
|
|
|
|
|
|
|
|
|
|||
Net Income Attributable to Shareholders of Crawford & Company |
|
$ |
2,837 |
|
|
$ |
10,681 |
|
|
|
(73 |
)% |
|
|
|
|
|
|
|
|
|
|
|||
Earnings Per Share - Basic: |
|
|
|
|
|
|
|
|
|
|||
Class A Common Stock |
|
$ |
0.06 |
|
|
$ |
0.22 |
|
|
|
(73 |
)% |
Class B Common Stock |
|
$ |
0.06 |
|
|
$ |
0.22 |
|
|
|
(73 |
)% |
|
|
|
|
|
|
|
|
|
|
|||
Earnings (Loss) Per Share - Diluted: |
|
|
|
|
|
|
|
|
|
|||
Class A Common Stock |
|
$ |
0.06 |
|
|
$ |
0.22 |
|
|
|
(73 |
)% |
Class B Common Stock |
|
$ |
0.06 |
|
|
$ |
0.22 |
|
|
|
(73 |
)% |
|
|
|
|
|
|
|
|
|
|
|||
Cash Dividends Per Share: |
|
|
|
|
|
|
|
|
|
|||
Class A Common Stock |
|
$ |
0.07 |
|
|
$ |
0.06 |
|
|
|
17 |
% |
Class B Common Stock |
|
$ |
0.07 |
|
|
$ |
0.06 |
|
|
|
17 |
% |
8
CRAWFORD & COMPANY
CONDENSED CONSOLIDATED BALANCE SHEETS
As of March 31, 2024 and December 31, 2023
Unaudited
(In Thousands, Except Par Values)
|
|
March 31, |
|
|
December 31, |
|
||
|
|
2024 |
|
|
2023 |
|
||
ASSETS |
|
|
|
|
|
|
||
|
|
|
|
|
|
|
||
Current Assets: |
|
|
|
|
|
|
||
Cash and Cash Equivalents |
|
$ |
45,196 |
|
|
$ |
58,363 |
|
Accounts Receivable, Net |
|
|
125,985 |
|
|
|
131,362 |
|
Unbilled Revenues, at Estimated Billable Amounts |
|
|
127,597 |
|
|
|
116,611 |
|
Income Taxes Receivable |
|
|
2,586 |
|
|
|
4,842 |
|
Prepaid Expenses and Other Current Assets |
|
|
44,460 |
|
|
|
58,168 |
|
Total Current Assets |
|
|
345,824 |
|
|
|
369,346 |
|
|
|
|
|
|
|
|
||
Net Property and Equipment |
|
|
21,597 |
|
|
|
22,742 |
|
|
|
|
|
|
|
|
||
Other Assets: |
|
|
|
|
|
|
||
Operating Lease Right-of-Use Asset, Net |
|
|
86,141 |
|
|
|
88,615 |
|
Goodwill |
|
|
76,621 |
|
|
|
76,724 |
|
Intangible Assets Arising from Business Acquisitions, Net |
|
|
80,341 |
|
|
|
81,786 |
|
Capitalized Software Costs, Net |
|
|
99,942 |
|
|
|
96,770 |
|
Deferred Income Tax Assets |
|
|
26,162 |
|
|
|
26,247 |
|
Other Noncurrent Assets |
|
|
39,649 |
|
|
|
36,969 |
|
Total Other Assets |
|
|
408,856 |
|
|
|
407,111 |
|
|
|
|
|
|
|
|
||
Total Assets |
|
$ |
776,277 |
|
|
$ |
799,199 |
|
|
|
|
|
|
|
|
||
LIABILITIES AND SHAREHOLDERS’ INVESTMENT |
|
|
|
|
|
|
||
|
|
|
|
|
|
|
||
Current Liabilities: |
|
|
|
|
|
|
||
Short-Term Borrowings |
|
$ |
19,354 |
|
|
$ |
14,813 |
|
Accounts Payable |
|
|
45,232 |
|
|
|
45,107 |
|
Accrued Compensation and Related Costs |
|
|
64,256 |
|
|
|
97,842 |
|
Self-Insured Risks |
|
|
20,188 |
|
|
|
33,238 |
|
Income Taxes Payable |
|
|
5,334 |
|
|
|
6,130 |
|
Operating Lease Liability |
|
|
24,438 |
|
|
|
24,351 |
|
Other Accrued Liabilities |
|
|
48,108 |
|
|
|
42,271 |
|
Deferred Revenues |
|
|
37,224 |
|
|
|
35,540 |
|
Total Current Liabilities |
|
|
264,134 |
|
|
|
299,292 |
|
|
|
|
|
|
|
|
||
Noncurrent Liabilities: |
|
|
|
|
|
|
||
Long-Term Debt and Finance Leases, Less Current Installments |
|
|
210,823 |
|
|
|
194,335 |
|
Operating Lease Liability |
|
|
74,295 |
|
|
|
78,029 |
|
Deferred Revenues |
|
|
23,807 |
|
|
|
24,871 |
|
Accrued Pension Liabilities |
|
|
23,440 |
|
|
|
24,006 |
|
Other Noncurrent Liabilities |
|
|
36,540 |
|
|
|
38,835 |
|
Total Noncurrent Liabilities |
|
|
368,905 |
|
|
|
360,076 |
|
|
|
|
|
|
|
|
||
Shareholders’ Investment: |
|
|
|
|
|
|
||
Class A Common Stock, $1.00 Par Value |
|
|
29,628 |
|
|
|
29,525 |
|
Class B Common Stock, $1.00 Par Value |
|
|
19,469 |
|
|
|
19,555 |
|
Additional Paid-in Capital |
|
|
83,104 |
|
|
|
82,589 |
|
Retained Earnings |
|
|
227,311 |
|
|
|
228,564 |
|
Accumulated Other Comprehensive Loss |
|
|
(214,792 |
) |
|
|
(218,615 |
) |
Shareholders’ Investment Attributable to Shareholders of Crawford & Company |
|
|
144,720 |
|
|
|
141,618 |
|
Noncontrolling Interests |
|
|
(1,482 |
) |
|
|
(1,787 |
) |
Total Shareholders’ Investment |
|
|
143,238 |
|
|
|
139,831 |
|
|
|
|
|
|
|
|
||
Total Liabilities and Shareholders’ Investment |
|
$ |
776,277 |
|
|
$ |
799,199 |
|
9
CRAWFORD & COMPANY
SUMMARY RESULTS BY OPERATING SEGMENT WITH DIRECT COMPENSATION AND OTHER EXPENSES
Unaudited
(In Thousands, Except Percentages)
Three Months Ended March 31,
|
|
North America Loss Adjusting |
|
% |
|
International Operations |
|
% |
|
Broadspire |
|
% |
|
Platform Solutions |
|
% |
||||||||||||||||
|
|
2024 |
|
2023 |
|
Change |
|
2024 |
|
2023 |
|
Change |
|
2024 |
|
2023 |
|
Change |
|
2024 |
|
2023 |
|
Change |
||||||||
|
|
|
|
|
|
|
|
|
|
|
|
|
|
|
|
|
|
|
|
|
|
|
|
|
||||||||
Revenues Before Reimbursements |
|
$ |
77,365 |
|
$ |
77,597 |
|
(0.3)% |
|
$ |
98,092 |
|
$ |
91,863 |
|
6.8% |
|
$ |
94,298 |
|
$ |
84,054 |
|
12.2% |
|
$ |
31,899 |
|
$ |
62,820 |
|
(49.2)% |
|
|
|
|
|
|
|
|
|
|
|
|
|
|
|
|
|
|
|
|
|
|
|
|
|
||||||||
Direct Compensation, Fringe Benefits & Non-Employee Labor |
|
|
55,467 |
|
|
54,164 |
|
2.4% |
|
|
64,979 |
|
|
61,421 |
|
5.8% |
|
|
57,257 |
|
|
52,641 |
|
8.8% |
|
|
18,930 |
|
|
40,911 |
|
(53.7)% |
|
|
|
|
|
|
|
|
|
|
|
|
|
|
|
|
|
|
|
|
|
|
|
|
|
||||||||
% of Revenues Before Reimbursements |
|
|
71.7 |
% |
|
69.8 |
% |
|
|
|
66.2 |
% |
|
66.9 |
% |
|
|
|
60.7 |
% |
|
62.6 |
% |
|
|
|
59.3 |
% |
|
65.1 |
% |
|
|
|
|
|
|
|
|
|
|
|
|
|
|
|
|
|
|
|
|
|
|
|
|
|
|
||||||||
Expenses Other than Reimbursements, Direct Compensation, Fringe Benefits & Non-Employee Labor |
|
|
17,419 |
|
|
15,368 |
|
13.3% |
|
|
31,423 |
|
|
27,407 |
|
14.7% |
|
|
24,237 |
|
|
23,486 |
|
3.2% |
|
|
11,854 |
|
|
11,943 |
|
(0.7)% |
|
|
|
|
|
|
|
|
|
|
|
|
|
|
|
|
|
|
|
|
|
|
|
|
|
||||||||
% of Revenues Before Reimbursements |
|
|
22.5 |
% |
|
19.8 |
% |
|
|
|
32.0 |
% |
|
29.8 |
% |
|
|
|
25.7 |
% |
|
27.9 |
% |
|
|
|
37.2 |
% |
|
19.0 |
% |
|
|
|
|
|
|
|
|
|
|
|
|
|
|
|
|
|
|
|
|
|
|
|
|
|
|
||||||||
Total Operating Expenses |
|
|
72,886 |
|
|
69,532 |
|
4.8% |
|
|
96,402 |
|
|
88,828 |
|
8.5% |
|
|
81,494 |
|
|
76,127 |
|
7.1% |
|
|
30,784 |
|
|
52,854 |
|
(41.8)% |
|
|
|
|
|
|
|
|
|
|
|
|
|
|
|
|
|
|
|
|
|
|
|
|
|
||||||||
Operating Earnings (1) |
|
$ |
4,479 |
|
$ |
8,065 |
|
(44.5)% |
|
$ |
1,690 |
|
$ |
3,035 |
|
(44.3)% |
|
$ |
12,804 |
|
$ |
7,927 |
|
61.5% |
|
$ |
1,115 |
|
$ |
9,966 |
|
(88.8)% |
|
|
|
|
|
|
|
|
|
|
|
|
|
|
|
|
|
|
|
|
|
|
|
|
|
||||||||
% of Revenues Before Reimbursements |
|
|
5.8 |
% |
|
10.4 |
% |
|
|
|
1.7 |
% |
|
3.3 |
% |
|
|
|
13.6 |
% |
|
9.4 |
% |
|
|
|
3.5 |
% |
|
15.9 |
% |
|
(1) A non-GAAP financial measurement which represents net income attributable to the applicable reporting segment excluding income taxes, net corporate interest expense, stock option expense, amortization of acquisition-related intangible assets, non-service pension costs, contingent earnout adjustments, and certain unallocated corporate and shared costs and credits. See pages 3 and 4 for additional information about segment operating earnings.
CRAWFORD & COMPANY
CONDENSED CONSOLIDATED STATEMENTS OF CASH FLOWS
Year-to-Date Period Ended March 31, 2024 and March 31, 2023
Unaudited
(In Thousands)
|
|
2024 |
|
|
2023 |
|
||
Cash Flows From Operating Activities: |
|
|
|
|
|
|
||
Net Income |
|
$ |
2,779 |
|
|
$ |
10,730 |
|
Reconciliation of net income to net cash used in operating activities: |
|
|
|
|
|
|
||
Depreciation and amortization |
|
|
9,299 |
|
|
|
9,050 |
|
Stock-based compensation |
|
|
1,218 |
|
|
|
1,023 |
|
(Gain) loss on disposal of property and equipment |
|
|
(81 |
) |
|
|
20 |
|
Contingent earnout adjustments |
|
|
151 |
|
|
|
248 |
|
Changes in operating assets and liabilities: |
|
|
|
|
|
|
||
Accounts receivable, net |
|
|
6,312 |
|
|
|
(17 |
) |
Unbilled revenues, net |
|
|
(9,511 |
) |
|
|
(6,333 |
) |
Accrued or prepaid income taxes |
|
|
942 |
|
|
|
3,895 |
|
Accounts payable and accrued liabilities |
|
|
(25,837 |
) |
|
|
(15,818 |
) |
Deferred revenues |
|
|
116 |
|
|
|
2,841 |
|
Accrued retirement costs |
|
|
(3,546 |
) |
|
|
(2,887 |
) |
Prepaid expenses and other operating activities |
|
|
(1,645 |
) |
|
|
(3,197 |
) |
Net cash used in operating activities |
|
|
(19,803 |
) |
|
|
(445 |
) |
|
|
|
|
|
|
|
||
Cash Flows From Investing Activities: |
|
|
|
|
|
|
||
Acquisitions of property and equipment |
|
|
(1,541 |
) |
|
|
(1,031 |
) |
Capitalization of computer software costs |
|
|
(8,009 |
) |
|
|
(7,610 |
) |
Net cash used in investing activities |
|
|
(9,550 |
) |
|
|
(8,641 |
) |
|
|
|
|
|
|
|
||
Cash Flows From Financing Activities: |
|
|
|
|
|
|
||
Cash dividends paid |
|
|
(3,443 |
) |
|
|
(2,925 |
) |
Repurchases of common stock |
|
|
(733 |
) |
|
— |
|
|
Increases in short-term and revolving credit facility borrowings |
|
|
35,807 |
|
|
|
19,394 |
|
Payments on short-term and revolving credit facility borrowings |
|
|
(14,794 |
) |
|
|
(10,265 |
) |
Payments of contingent consideration on acquisitions |
|
|
(579 |
) |
|
|
(848 |
) |
Other financing activities |
|
|
(185 |
) |
|
|
(169 |
) |
Net cash provided by financing activities |
|
|
16,073 |
|
|
|
5,187 |
|
|
|
|
|
|
|
|
||
Effects of exchange rate changes on cash and cash equivalents |
|
|
394 |
|
|
|
1,195 |
|
Decrease in cash, cash equivalents, and restricted cash(1) |
|
|
(12,886 |
) |
|
|
(2,704 |
) |
Cash, cash equivalents, and restricted cash at beginning of year(1) |
|
|
59,545 |
|
|
|
46,645 |
|
Cash, cash equivalents, and restricted cash at end of period(1) |
|
$ |
46,659 |
|
|
$ |
43,941 |
|
(1) The 2024 amounts include beginning restricted cash of $1,182 at December 31, 2023, and ending restricted cash of $1,463 at March 31, 2024, and the 2023 amounts include beginning restricted cash of $638 at December 31, 2022, and ending restricted cash of $637 at March 31, 2023, which we present as part of "Prepaid expenses and other current assets" on the Balance Sheets.

First Quarter 2024 Financial Results CRD-A & CRD-B (NYSE) ® Crawford & Company
Forward-Looking Statements & Additional Information Q1 2024 FINANCIAL RESULTS Forward-Looking Statements This presentation contains forward-looking statements, including statements about the expected future financial condition, results of operations and earnings outlook of Crawford & Company. Statements, both qualitative and quantitative, that are not statements of historical fact may be "forward-looking statements" as defined in the Private Securities Litigation Reform Act of 1995 and other securities laws. Forward-looking statements involve a number of risks and uncertainties that could cause actual results to differ materially from historical experience or Crawford & Company's present expectations. Accordingly, no one should place undue reliance on forward-looking statements, which speak only as of the date on which they are made. Crawford & Company does not undertake to update forward-looking statements to reflect the impact of circumstances or events that may arise or not arise after the date the forward-looking statements are made. Results for any interim period presented herein are not necessarily indicative of results to be expected for the full year or for any other future period. For further information regarding Crawford & Company, and the risks and uncertainties involved in forward-looking statements, please read Crawford & Company's reports filed with the Securities and Exchange Commission and available at www.sec.gov or in the Investor Relations portion of Crawford & Company's website at https://ir.crawco.com. Crawford's business is dependent, to a significant extent, on case volumes. The Company cannot predict the future trend of case volumes for a number of reasons, including the fact that the frequency and severity of weather-related claims and the occurrence of natural and man-made disasters, which are a significant source of cases and revenue for the Company, are generally not subject to accurate forecasting. Revenues Before Reimbursements ("Revenues") Revenues Before Reimbursements are referred to as "Revenues" in both consolidated and segment charts, bullets and tables throughout this presentation. Segment and Consolidated Operating Earnings Under the Financial Accounting Standards Board's Accounting Standards Codification ("ASC") Topic 280, "Segment Reporting," the Company has defined segment operating earnings as the primary measure used by the Company to evaluate the results of each of its four operating segments. Segment operating earnings represent segment earnings, including the direct and indirect costs of certain administrative functions required to operate our business, but excludes unallocated corporate and shared costs and credits, net corporate interest expense, stock option expense, amortization of acquisition-related intangible assets, contingent earnout adjustments, non-service pension costs, income taxes and net income or loss attributable to noncontrolling interests. Earnings Per Share The Company's two classes of stock are substantially identical, except with respect to voting rights for the Class B Common Stock (CRD-B) and protections for the non-voting Class A Common Stock (CRD-A). More information available on the Company’s website. The two-class method is an earnings allocation method under which earnings per share ("EPS") is calculated for each class of common stock considering both dividends declared and participation rights in undistributed earnings as if all such earnings had been distributed during the period. As a result, the Company may report different EPS for each class of stock due to the two-class method of computing EPS as required by ASC Topic 260 - "Earnings Per Share". Segment Gross Profit Segment gross profit is defined as revenues, less direct costs, which exclude indirect centralized administrative support costs allocated to the business. Indirect expenses consist of centralized administrative support costs, regional and local shared services that are allocated to each segment based on usage. Non-GAAP Financial Information For additional information about certain non-GAAP financial information presented herein, see the Appendix following this presentation.

STRATEGIC UPDATE Rohit Verma President & Chief Executive Officer 3 Q1 2024 FINANCIAL RESULTS
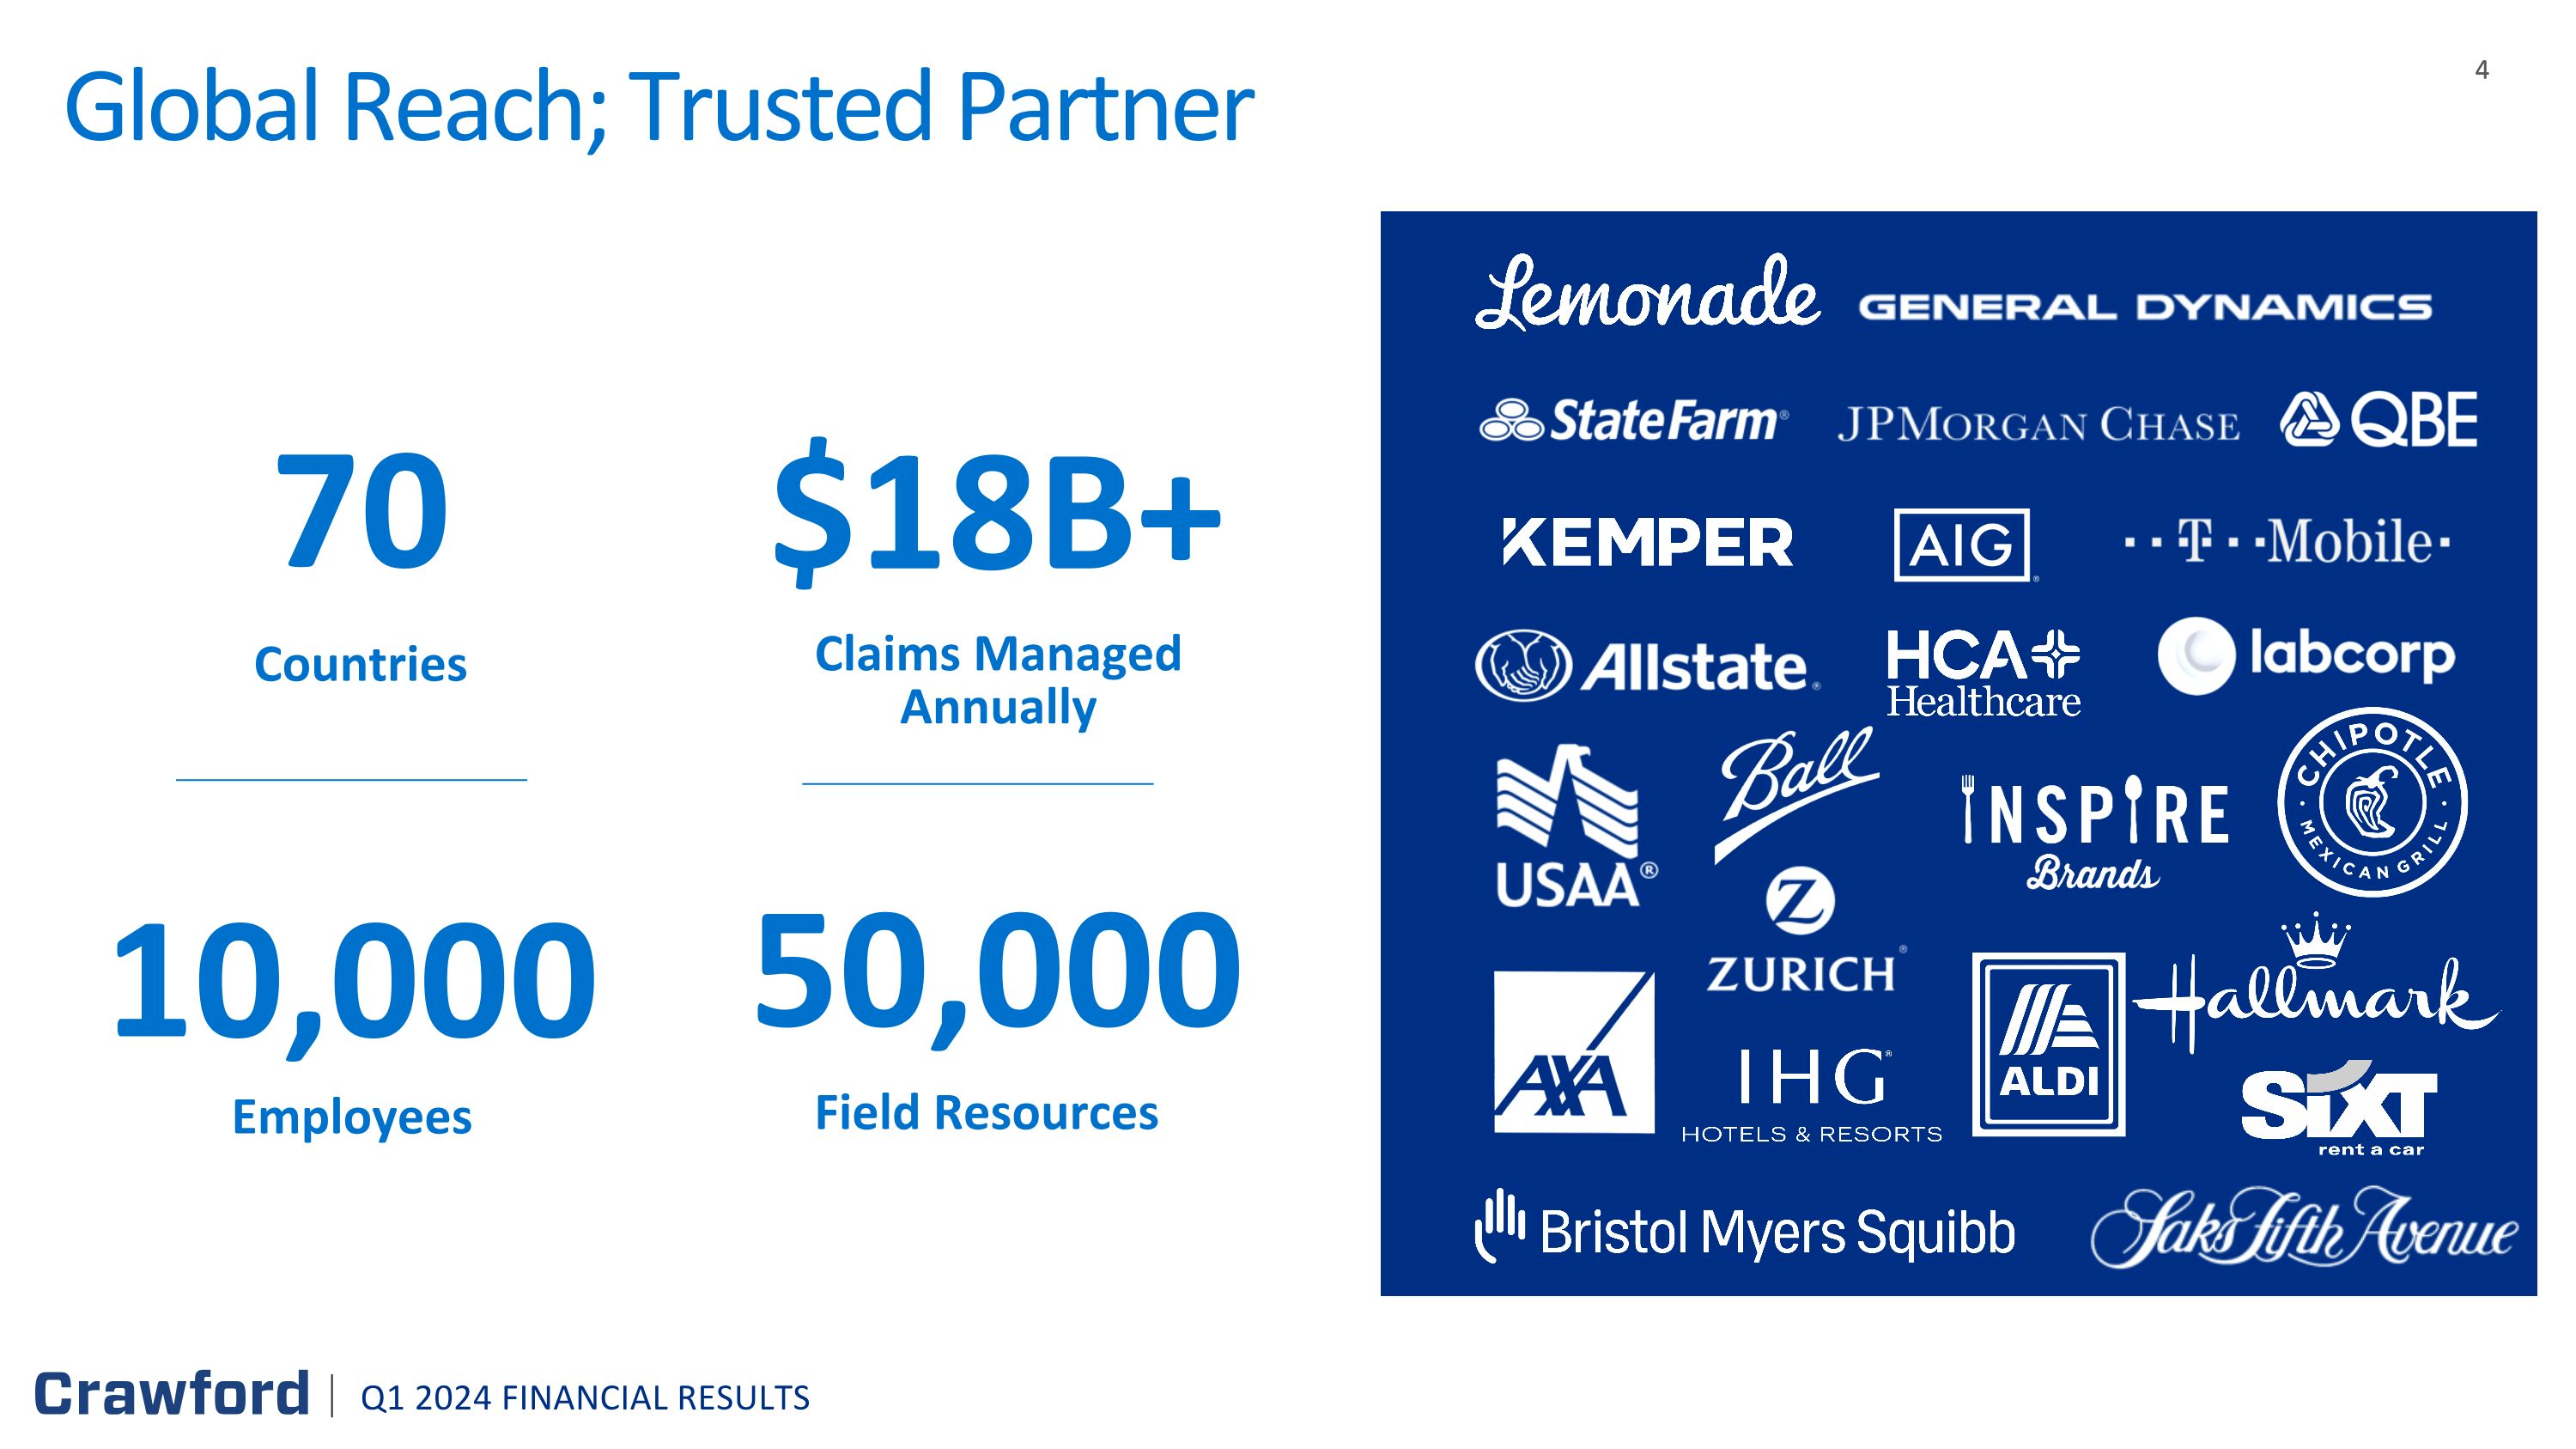
Countries 70 Employees 10,000 50,000 Field Resources $18B+ Claims Managed Annually Global Reach; Trusted Partner Q1 2024 FINANCIAL RESULTS
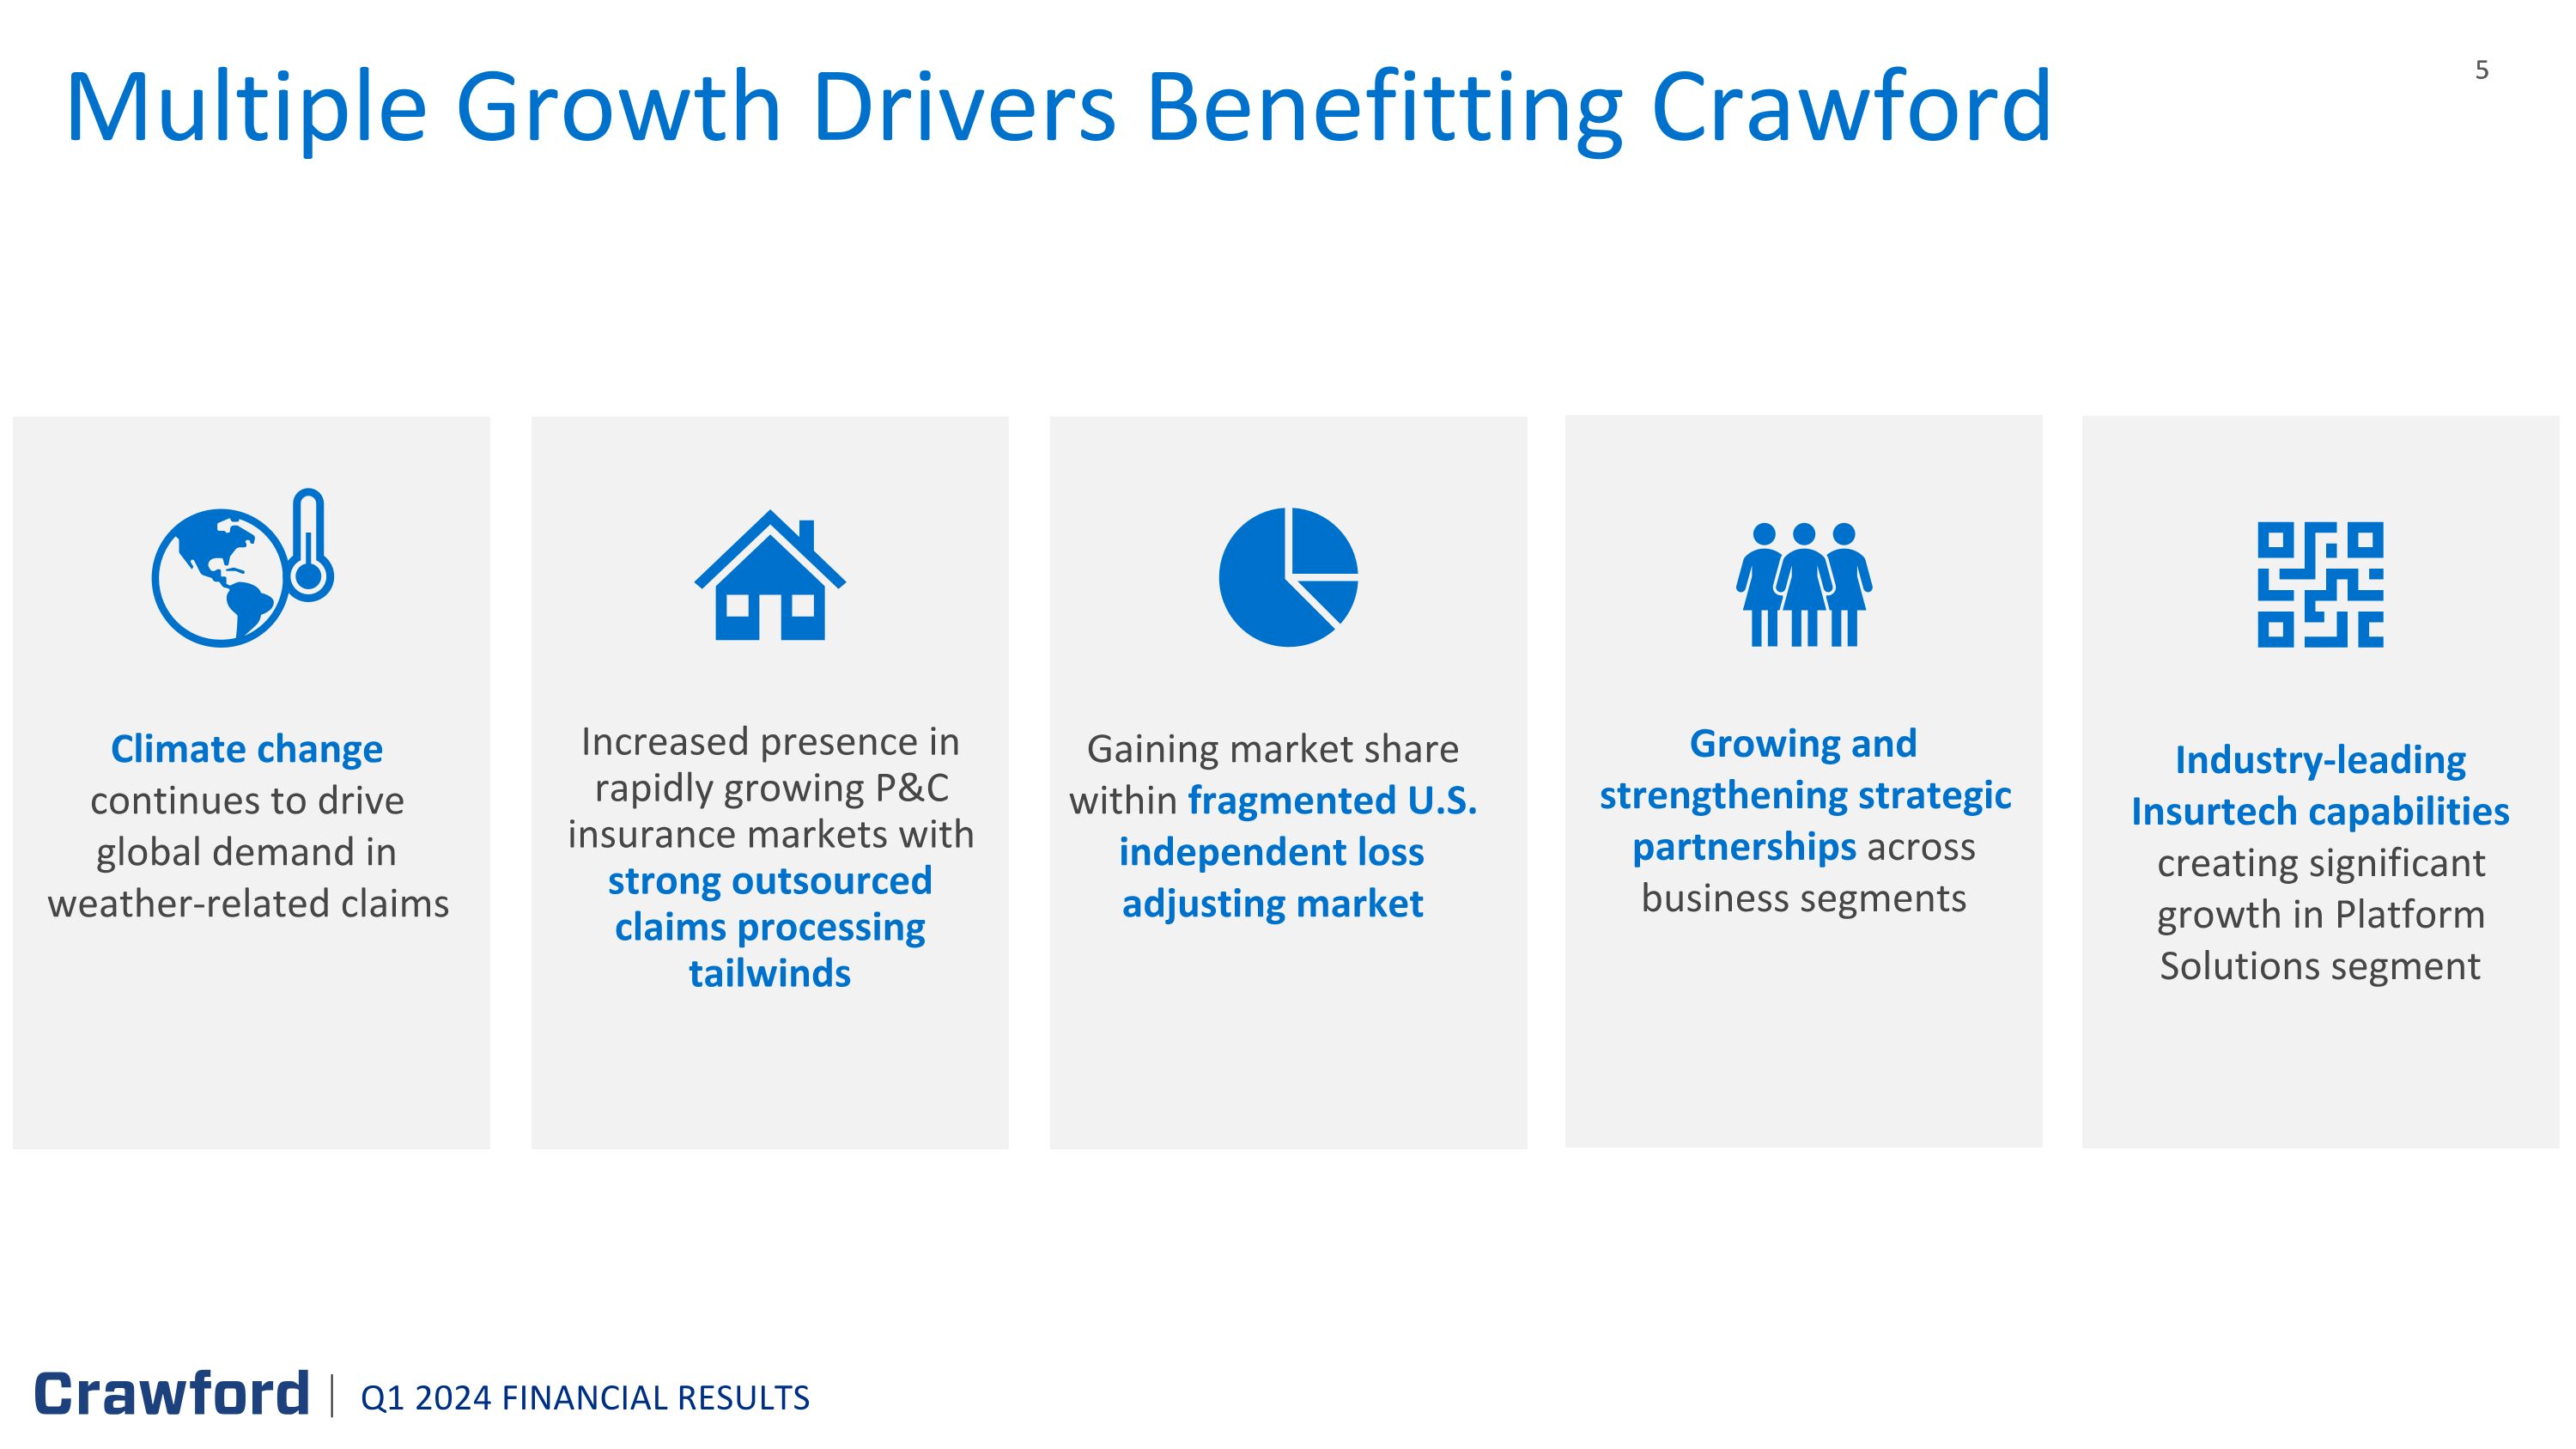
Climate change continues to drive global demand in weather-related claims Gaining market share within fragmented U.S. independent loss adjusting market Industry-leading Insurtech capabilities creating significant growth in Platform Solutions segment Growing and strengthening strategic partnerships across business segments Increased presence in rapidly growing P&C insurance markets with strong outsourced claims processing tailwinds Multiple Growth Drivers Benefitting Crawford Q1 2024 FINANCIAL RESULTS
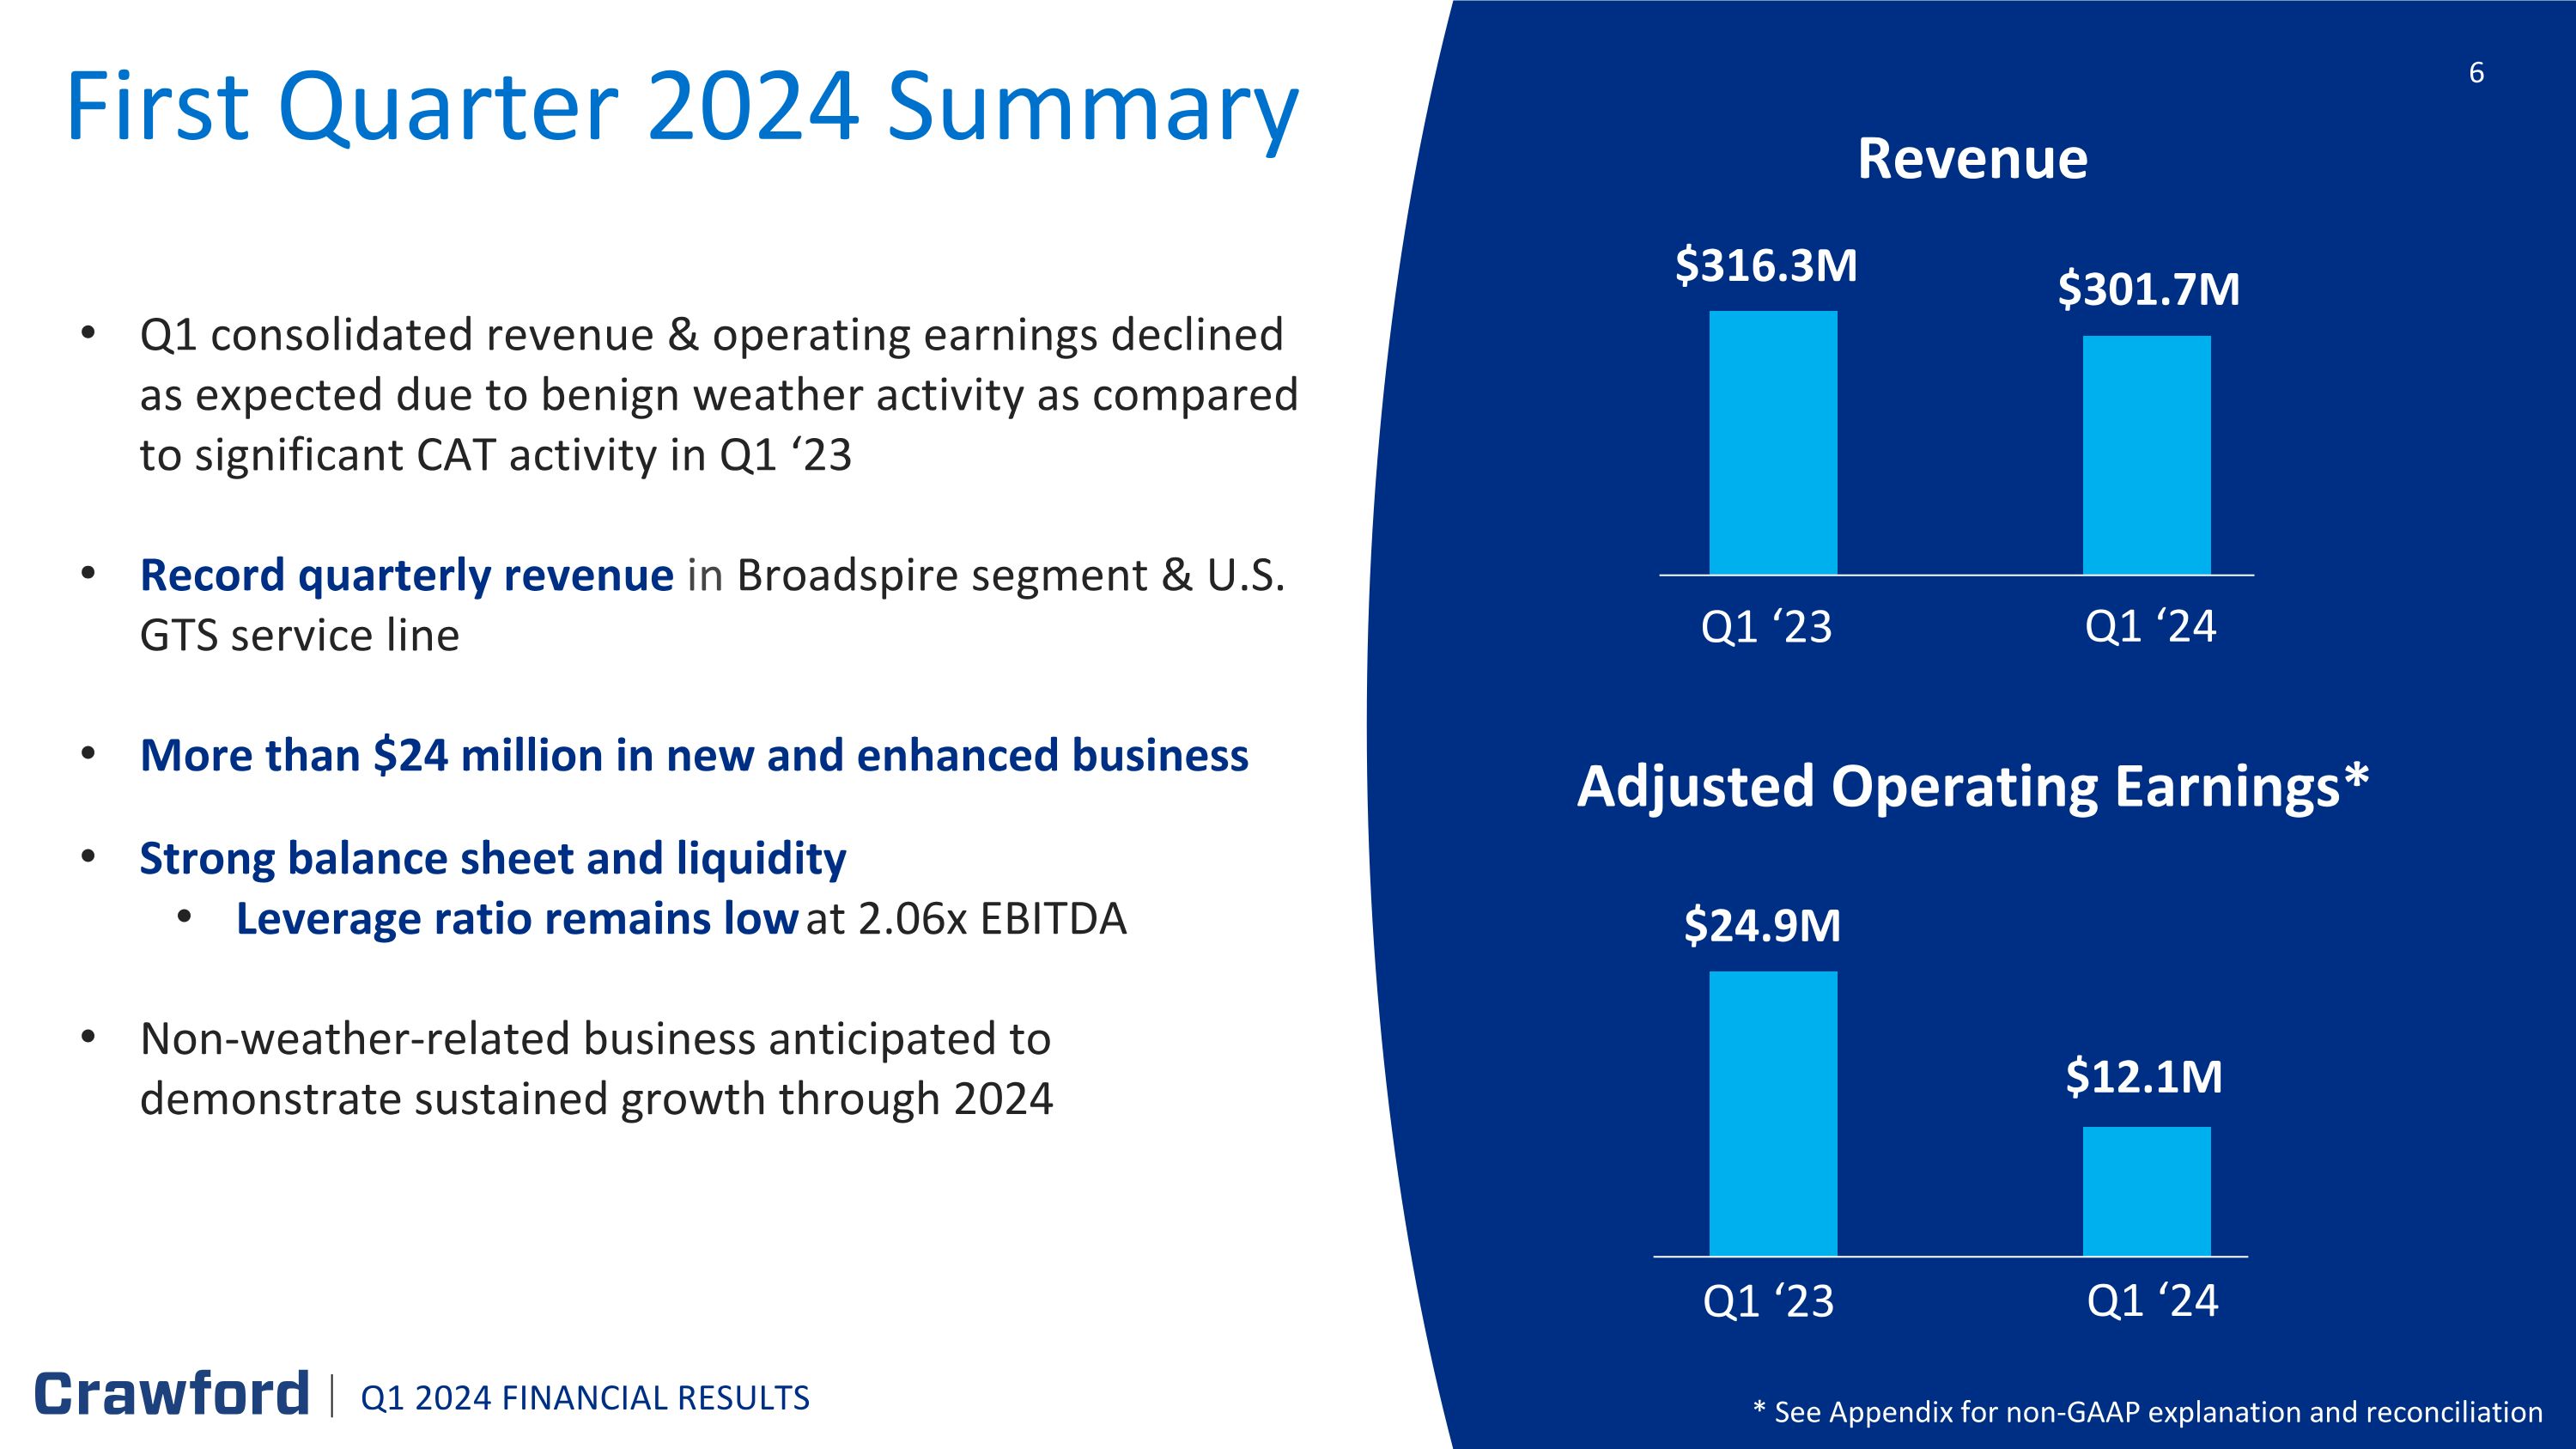
First Quarter 2024 Summary Q1 consolidated revenue & operating earnings declined as expected due to benign weather activity as compared to significant CAT activity in Q1 ‘23 Record quarterly revenue in Broadspire segment & U.S. GTS service line More than $24 million in new and enhanced business Strong balance sheet and liquidity Leverage ratio remains low at 2.06x EBITDA Non-weather-related business anticipated to demonstrate sustained growth through 2024 Revenue Adjusted Operating Earnings* $301.7M $316.3M $24.9M $12.1M 6 * See Appendix for non-GAAP explanation and reconciliation Q1 ‘23 Q1 ‘24 Q1 ‘23 Q1 ‘24 Q1 2024 FINANCIAL RESULTS
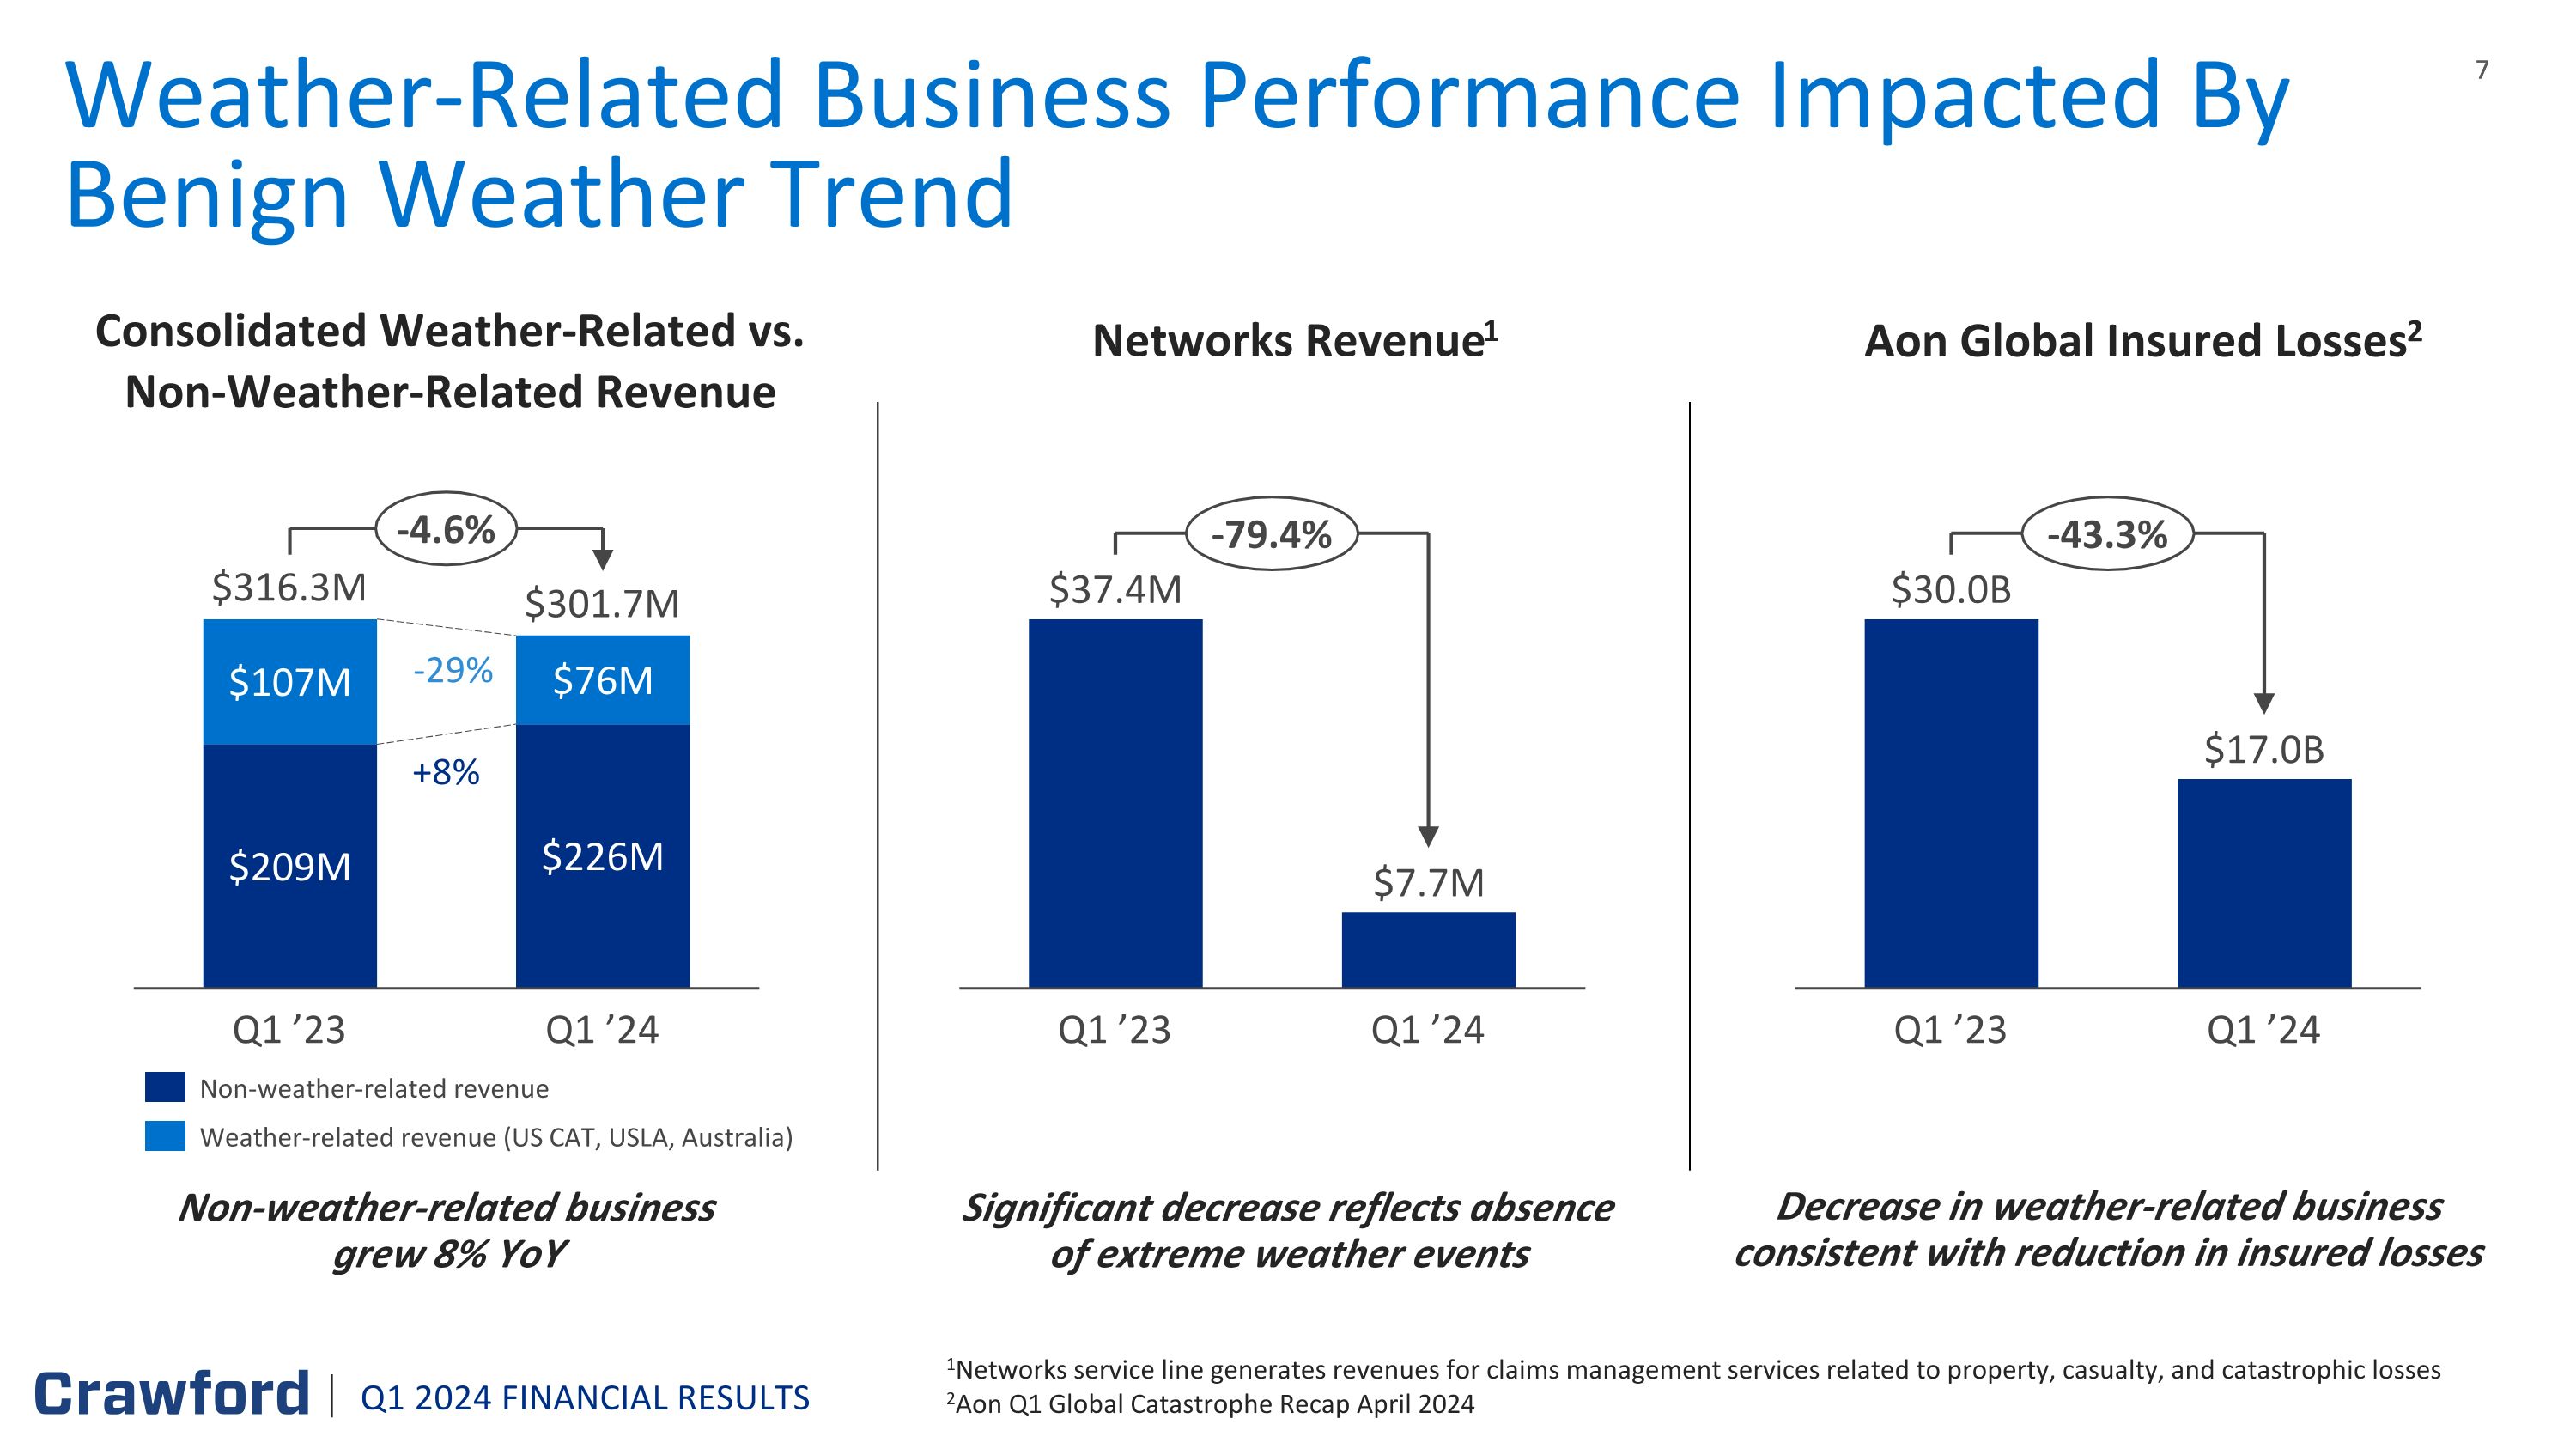
Q1 2024 FINANCIAL RESULTS Weather-Related Business Performance Impacted By Benign Weather Trend 1Networks service line generates revenues for claims management services related to property, casualty, and catastrophic losses 2Aon Q1 Global Catastrophe Recap April 2024 Non-weather-related business grew 8% YoY Significant decrease reflects absence of extreme weather events Decrease in weather-related business consistent with reduction in insured losses Q1 ’23 Q1 ’24 $316.3M $301.7M -4.6% Non-weather-related revenue Weather-related revenue (US CAT, USLA, Australia) Consolidated Weather-Related vs. Non-Weather-Related Revenue Q1 ’23 Q1 ’24 -79.4% Q1 ’23 Q1 ’24 -43.3% -29% +8% Networks Revenue1 Aon Global Insured Losses2
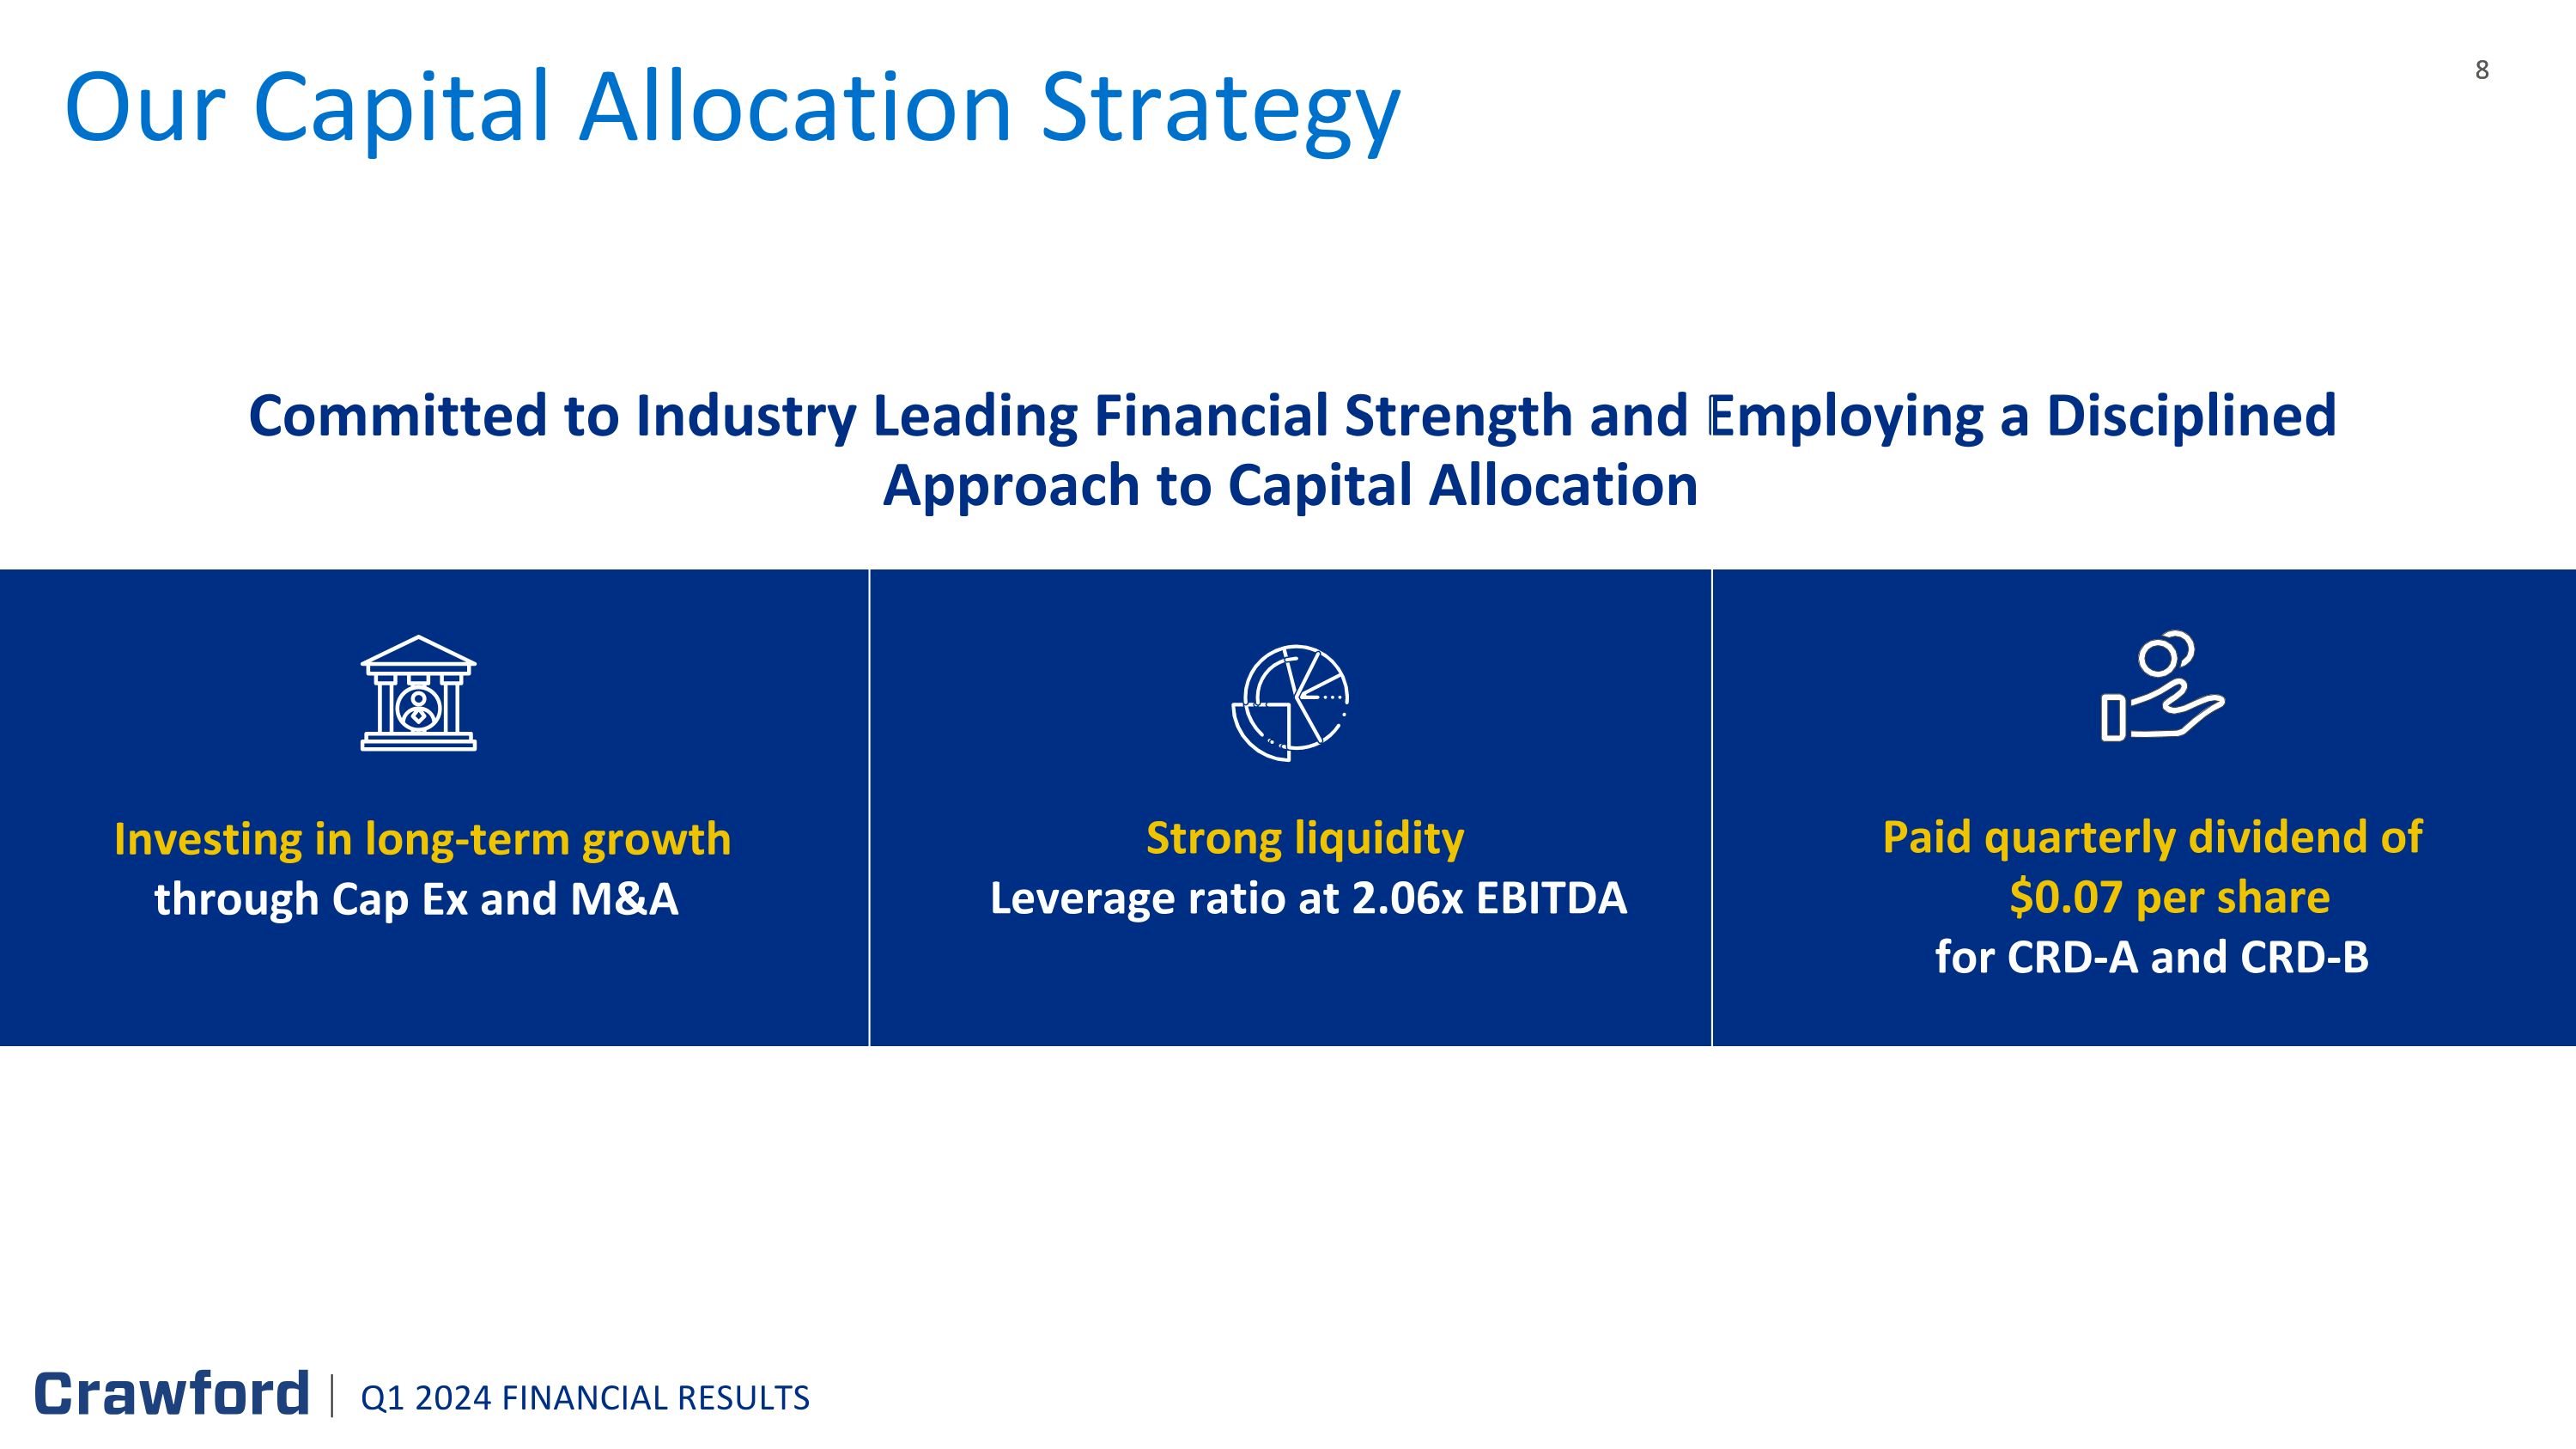
Our Capital Allocation Strategy Committed to Industry Leading Financial Strength and Employing a Disciplined Approach to Capital Allocation Investing in long-term growth through Cap Ex and M&A Strong liquidity Leverage ratio at 2.06x EBITDA Paid quarterly dividend of $0.07 per share for CRD-A and CRD-B Q1 2024 FINANCIAL RESULTS
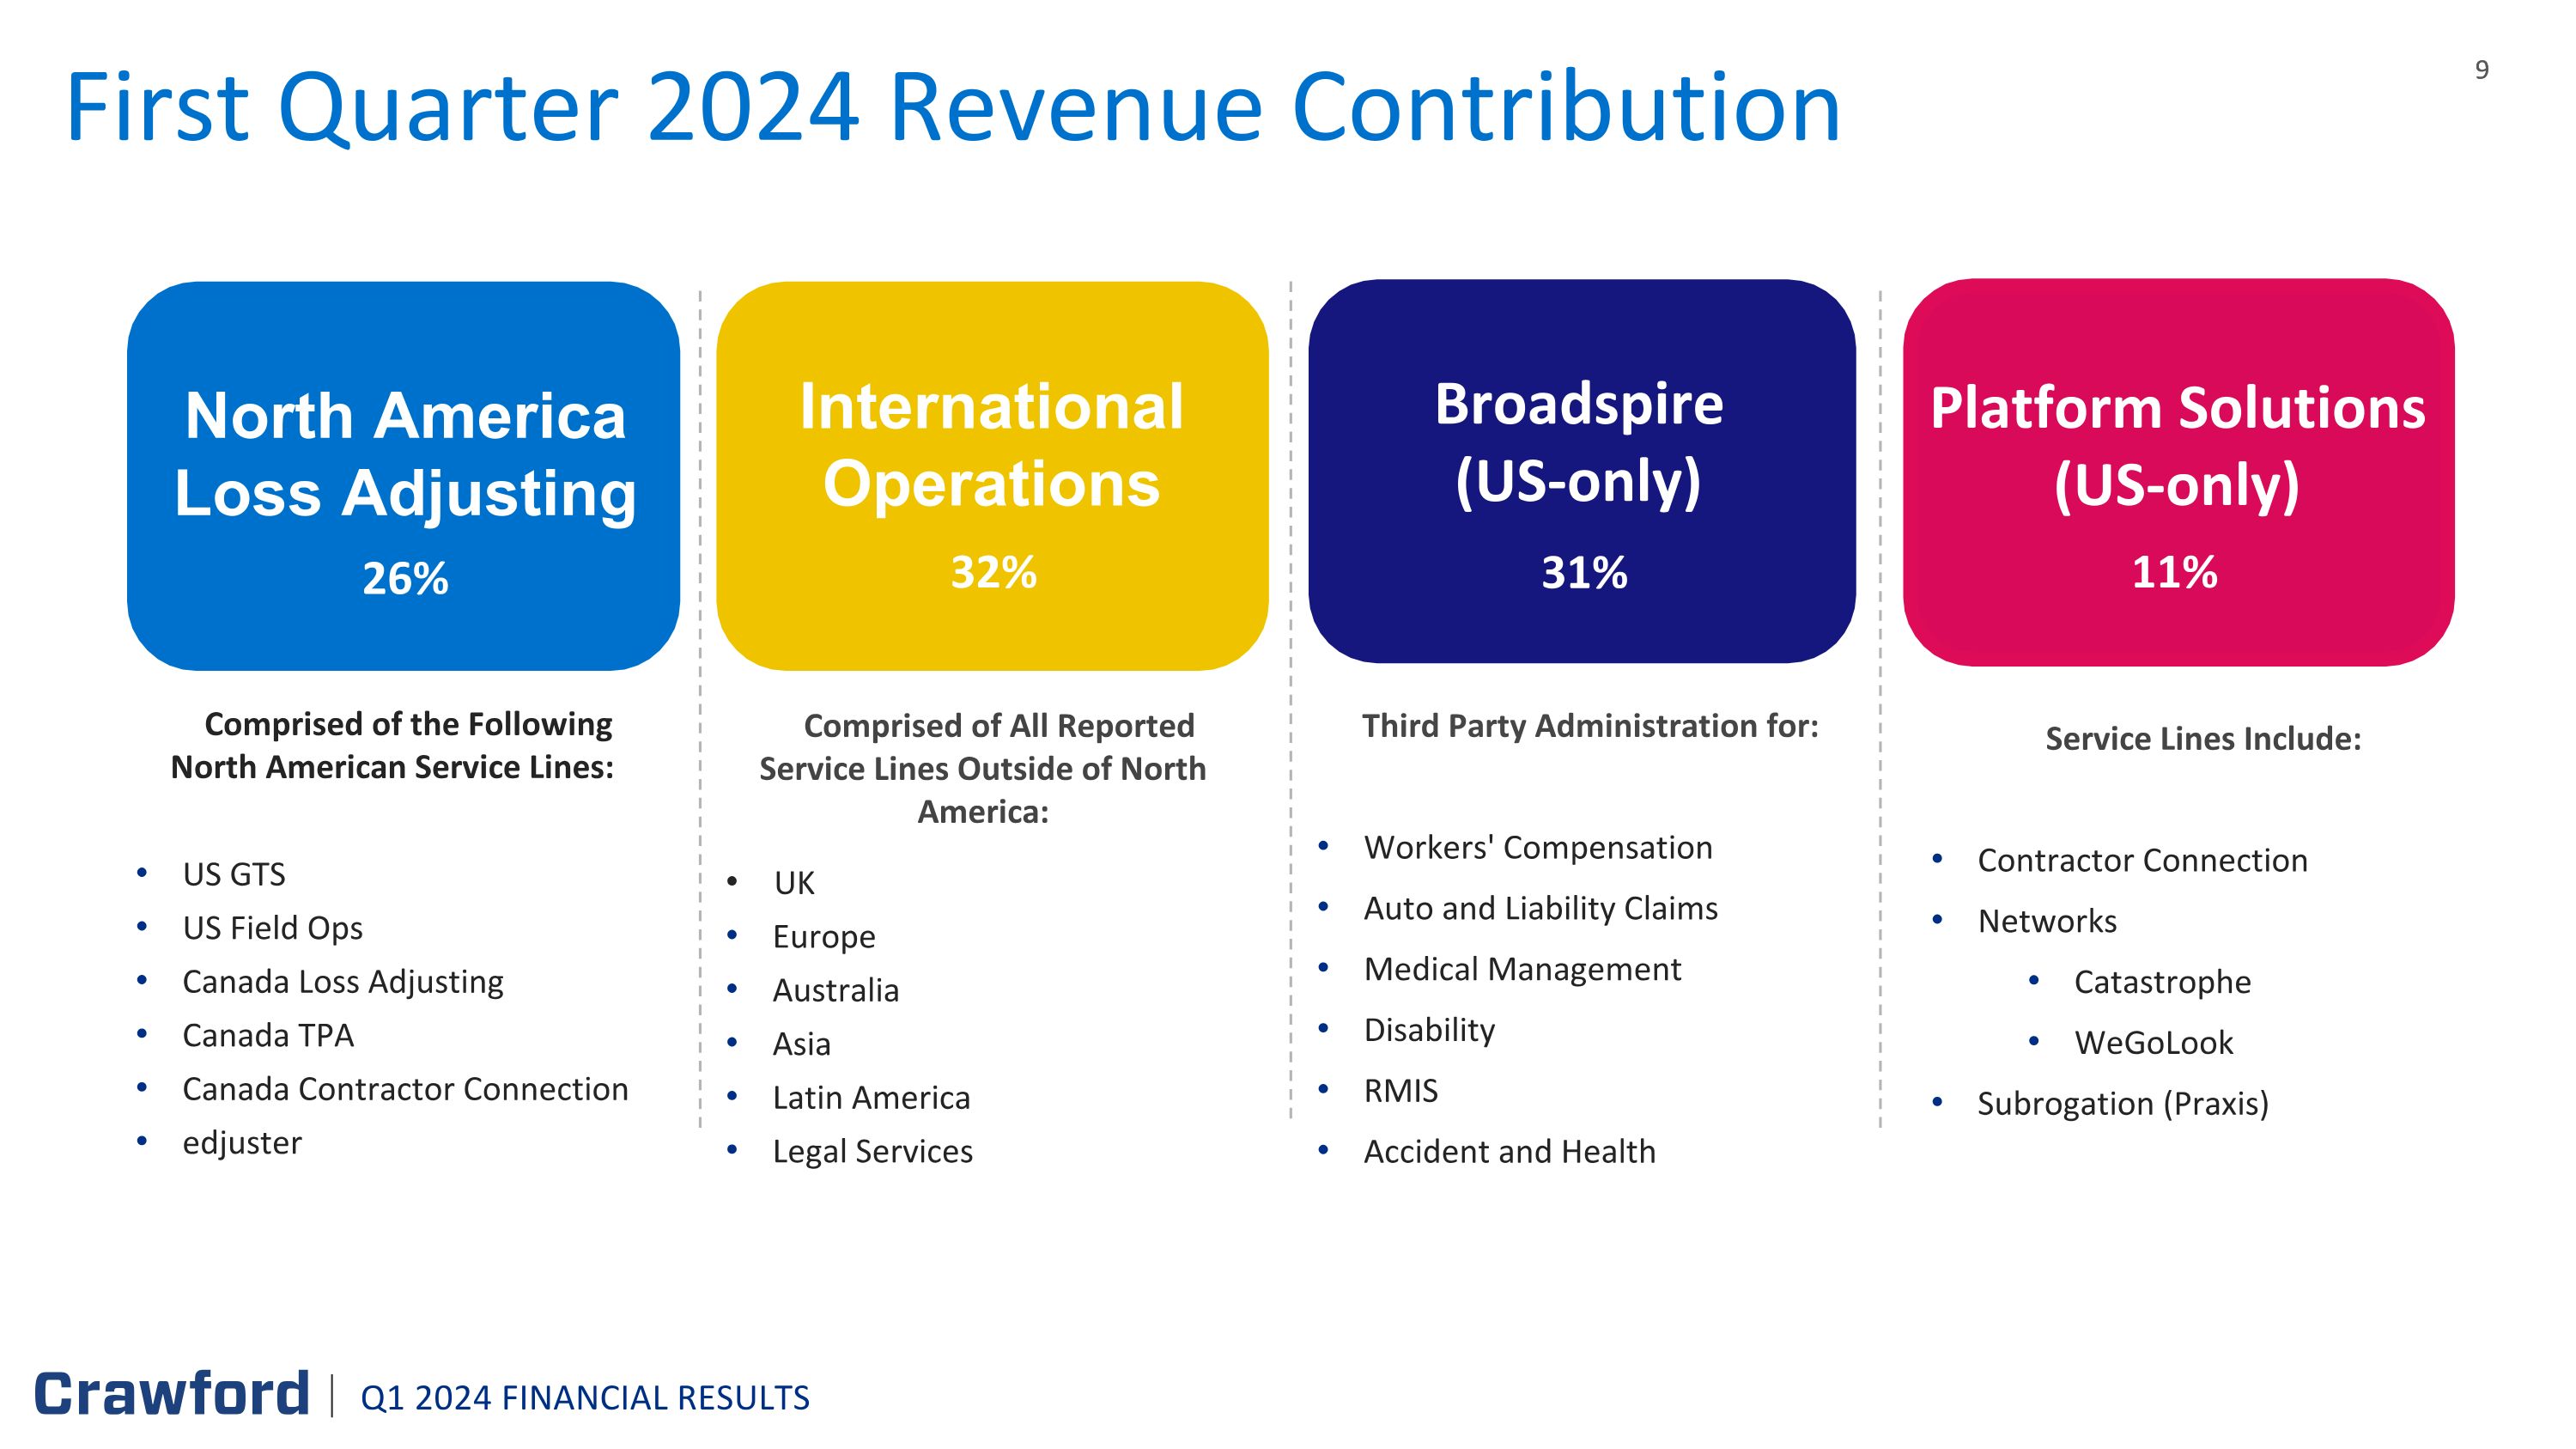
Comprised of All Reported Service Lines Outside of North America: UK Europe Australia Asia Latin America Legal Services International Operations 32% Third Party Administration for: Workers' Compensation Auto and Liability Claims Medical Management Disability RMIS Accident and Health Service Lines Include: Contractor Connection Networks Catastrophe WeGoLook Subrogation (Praxis) Comprised of the Following North American Service Lines: US GTS US Field Ops Canada Loss Adjusting Canada TPA Canada Contractor Connection edjuster North America Loss Adjusting 26% Broadspire (US-only) 31% Platform Solutions (US-only) 11% First Quarter 2024 Revenue Contribution Q1 2024 FINANCIAL RESULTS
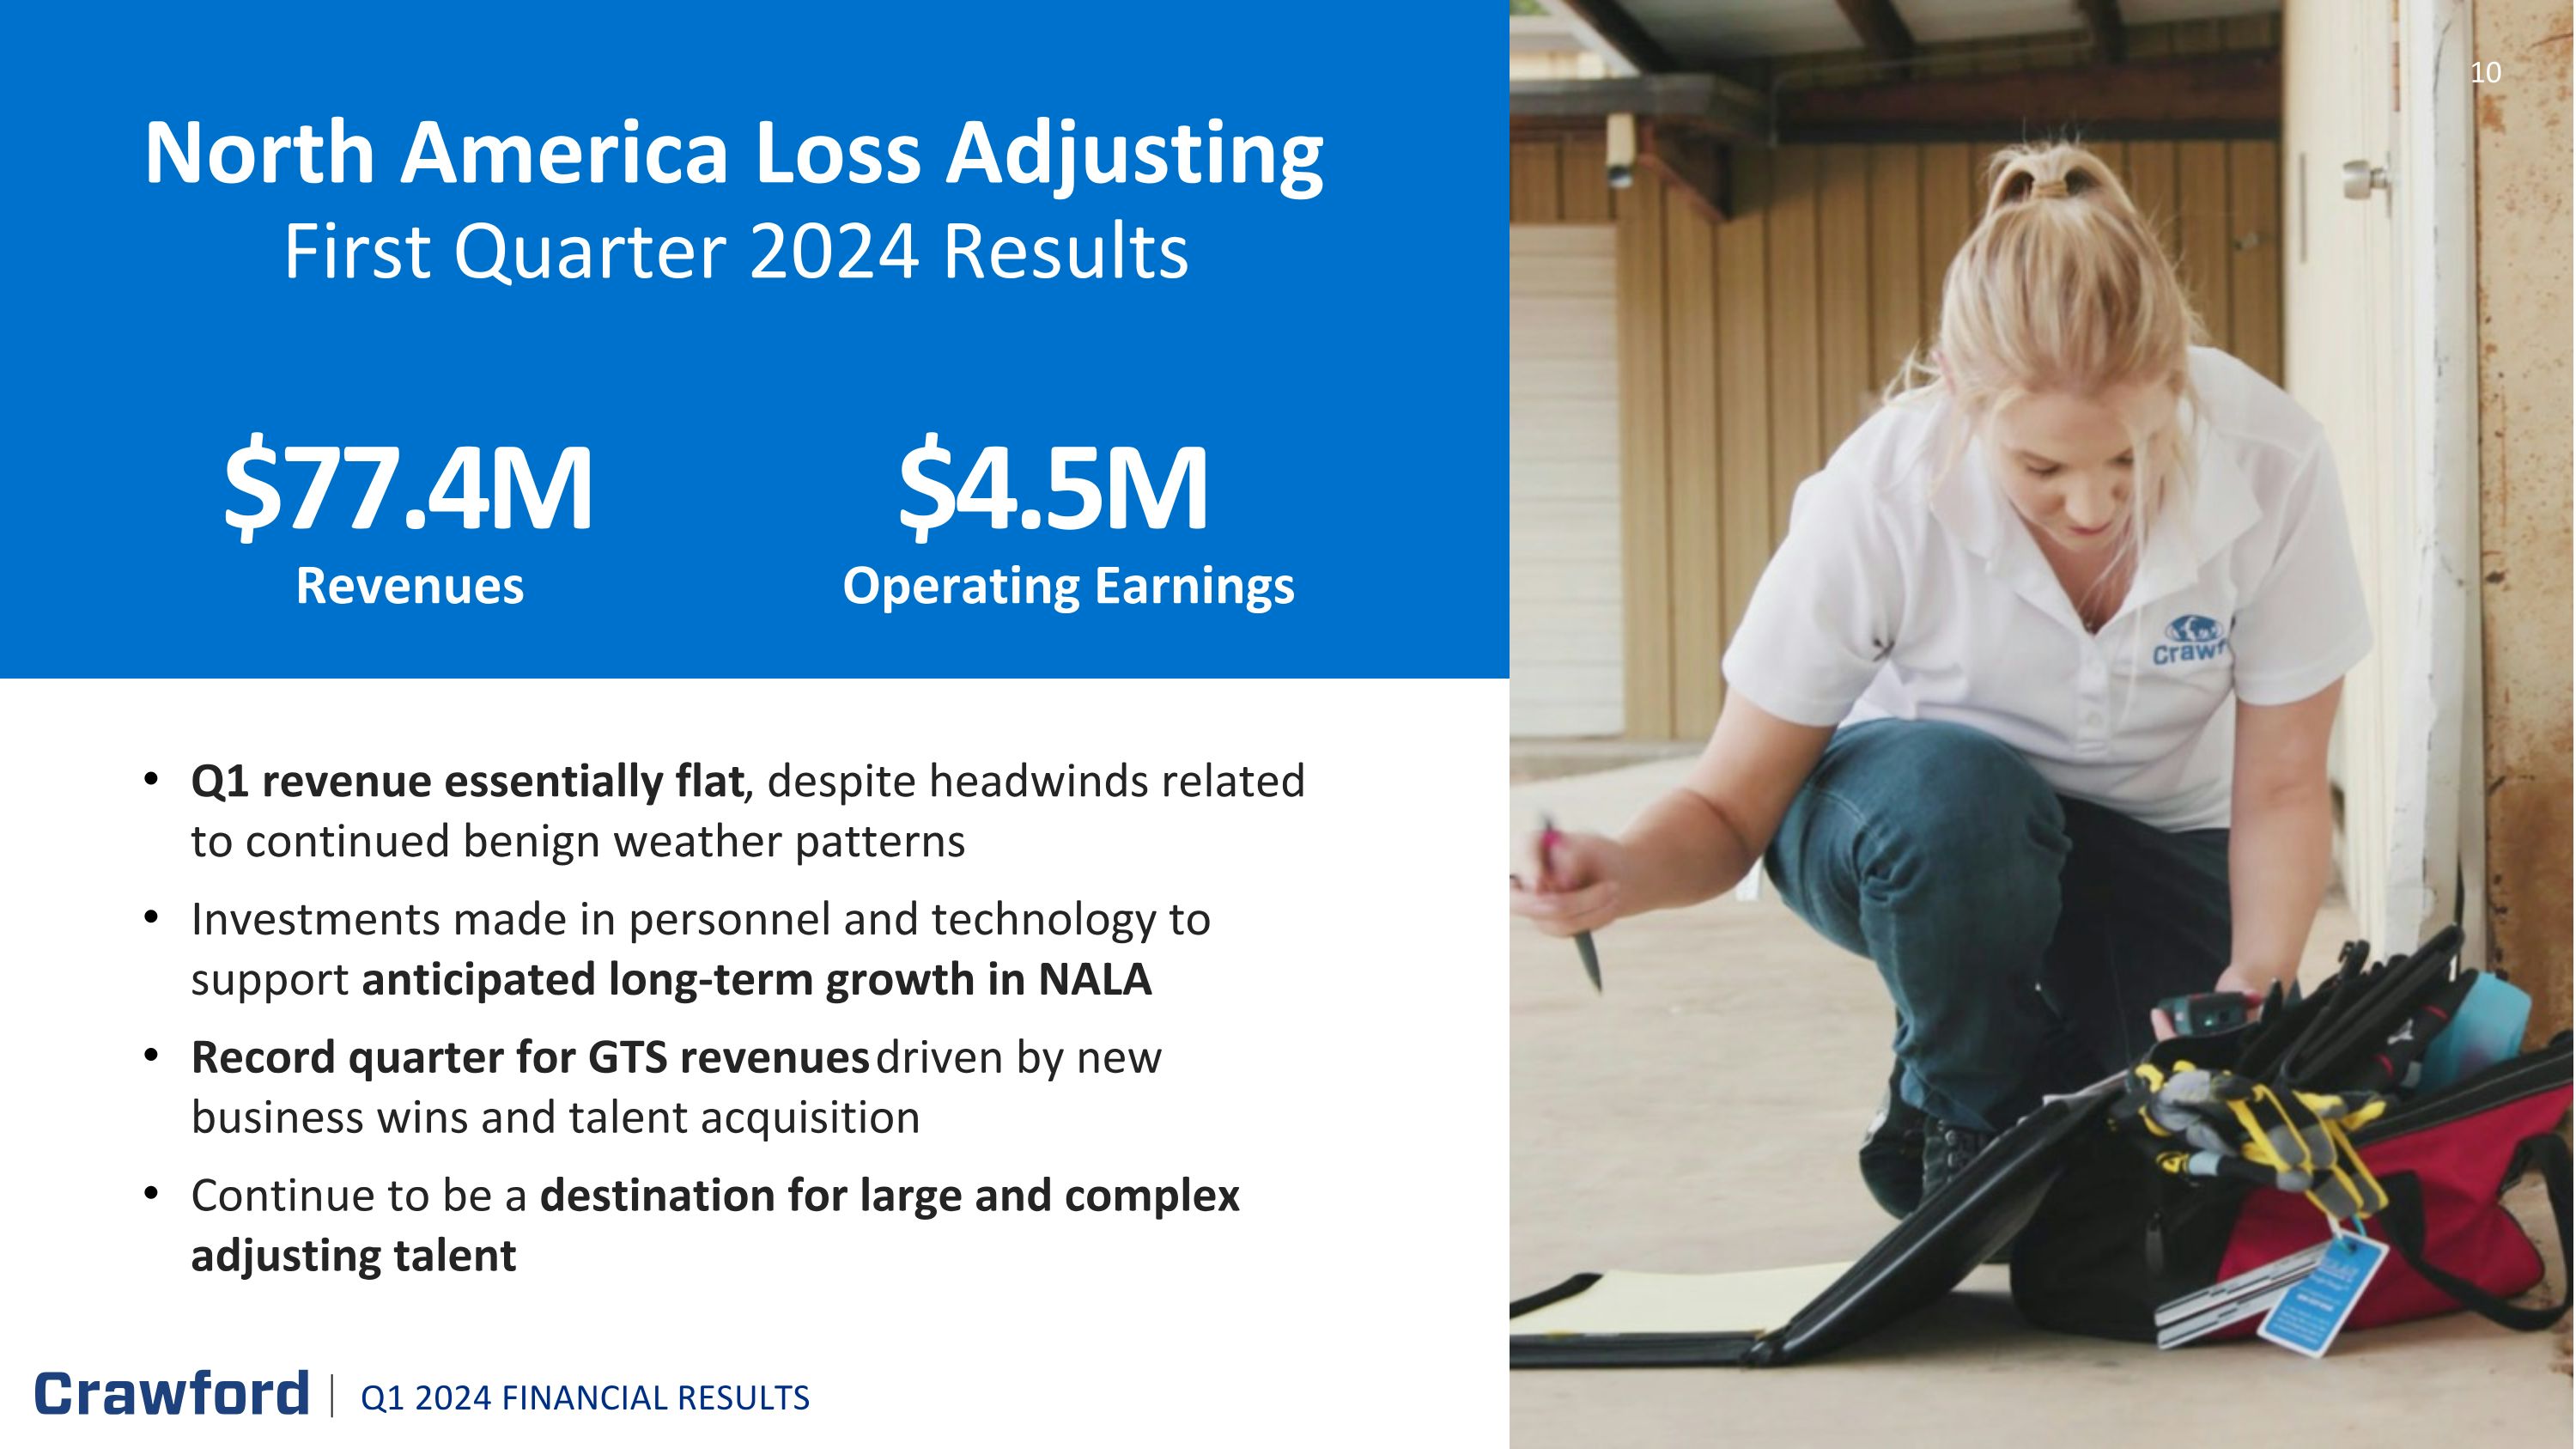
Q1 revenue essentially flat, despite headwinds related to continued benign weather patterns Investments made in personnel and technology to support anticipated long-term growth in NALA Record quarter for GTS revenues driven by new business wins and talent acquisition Continue to be a destination for large and complex adjusting talent North America Loss Adjusting First Quarter 2024 Results Revenues $77.4M Operating Earnings $4.5M 10 Q1 2024 FINANCIAL RESULTS
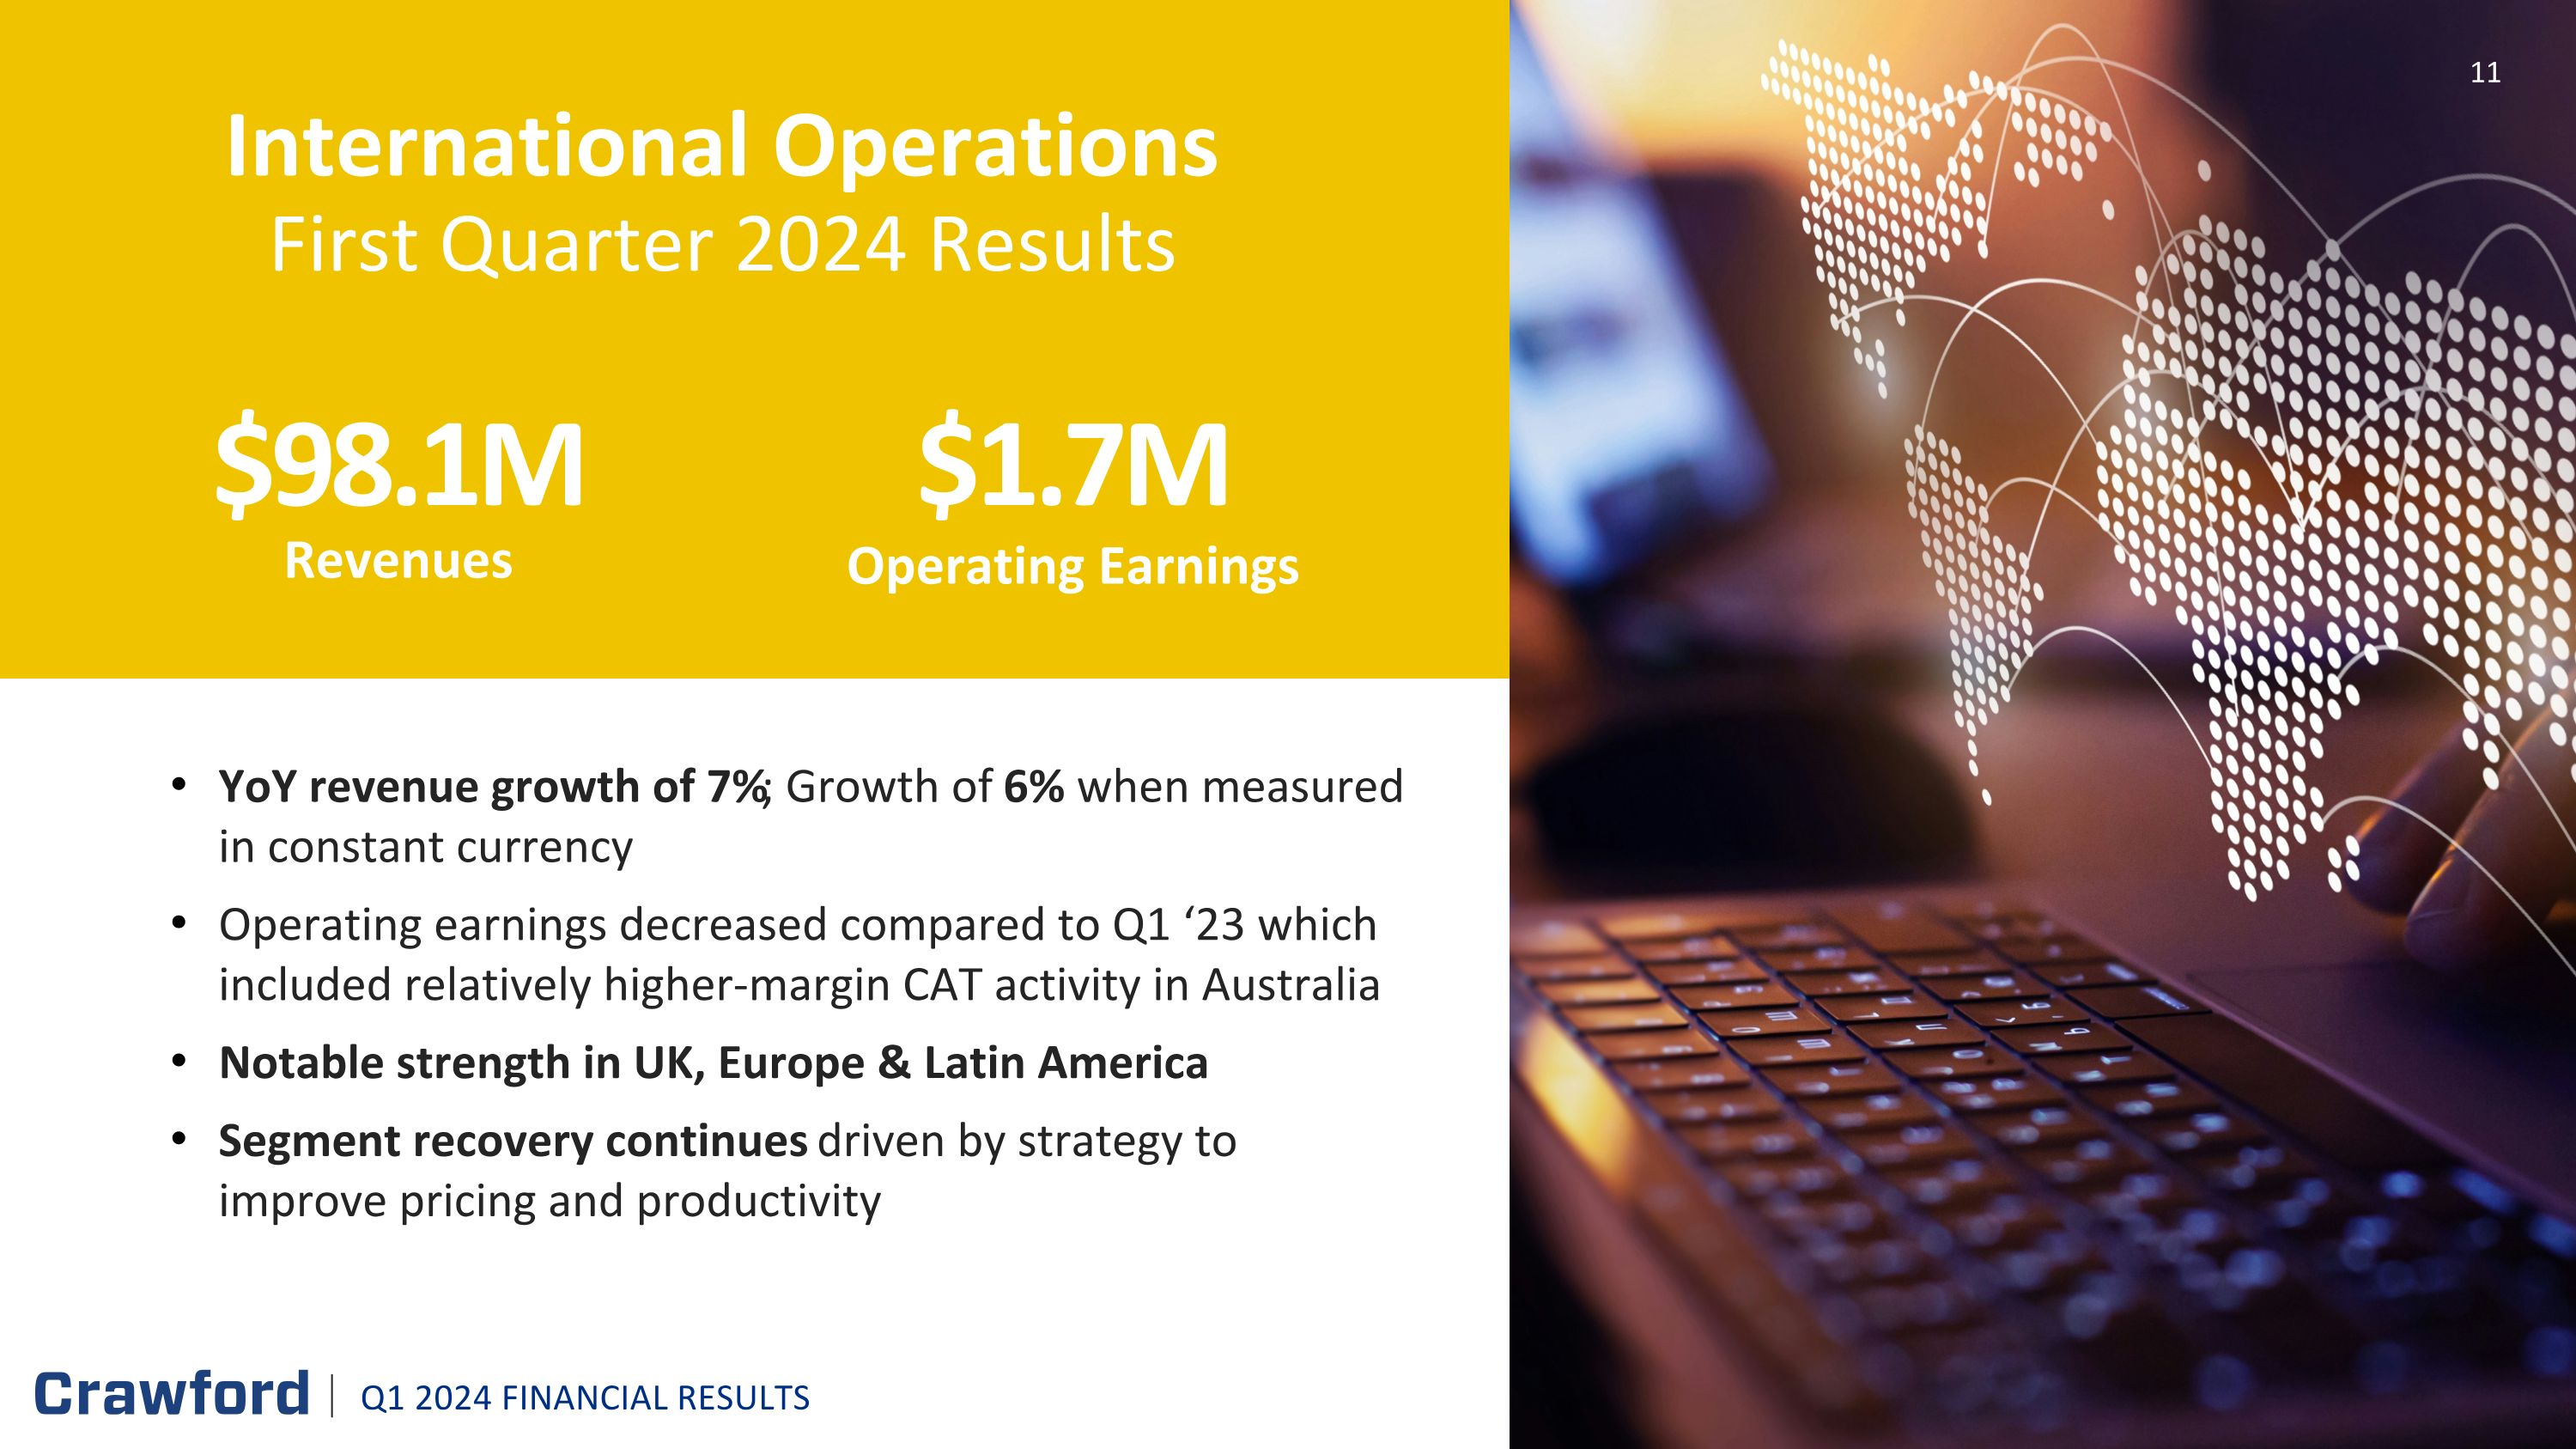
YoY revenue growth of 7%; Growth of 6% when measured in constant currency Operating earnings decreased compared to Q1 ‘23 which included relatively higher-margin CAT activity in Australia Notable strength in UK, Europe & Latin America Segment recovery continues driven by strategy to improve pricing and productivity International Operations First Quarter 2024 Results Revenues $98.1M Operating Earnings $1.7M 11 Q1 2024 FINANCIAL RESULTS
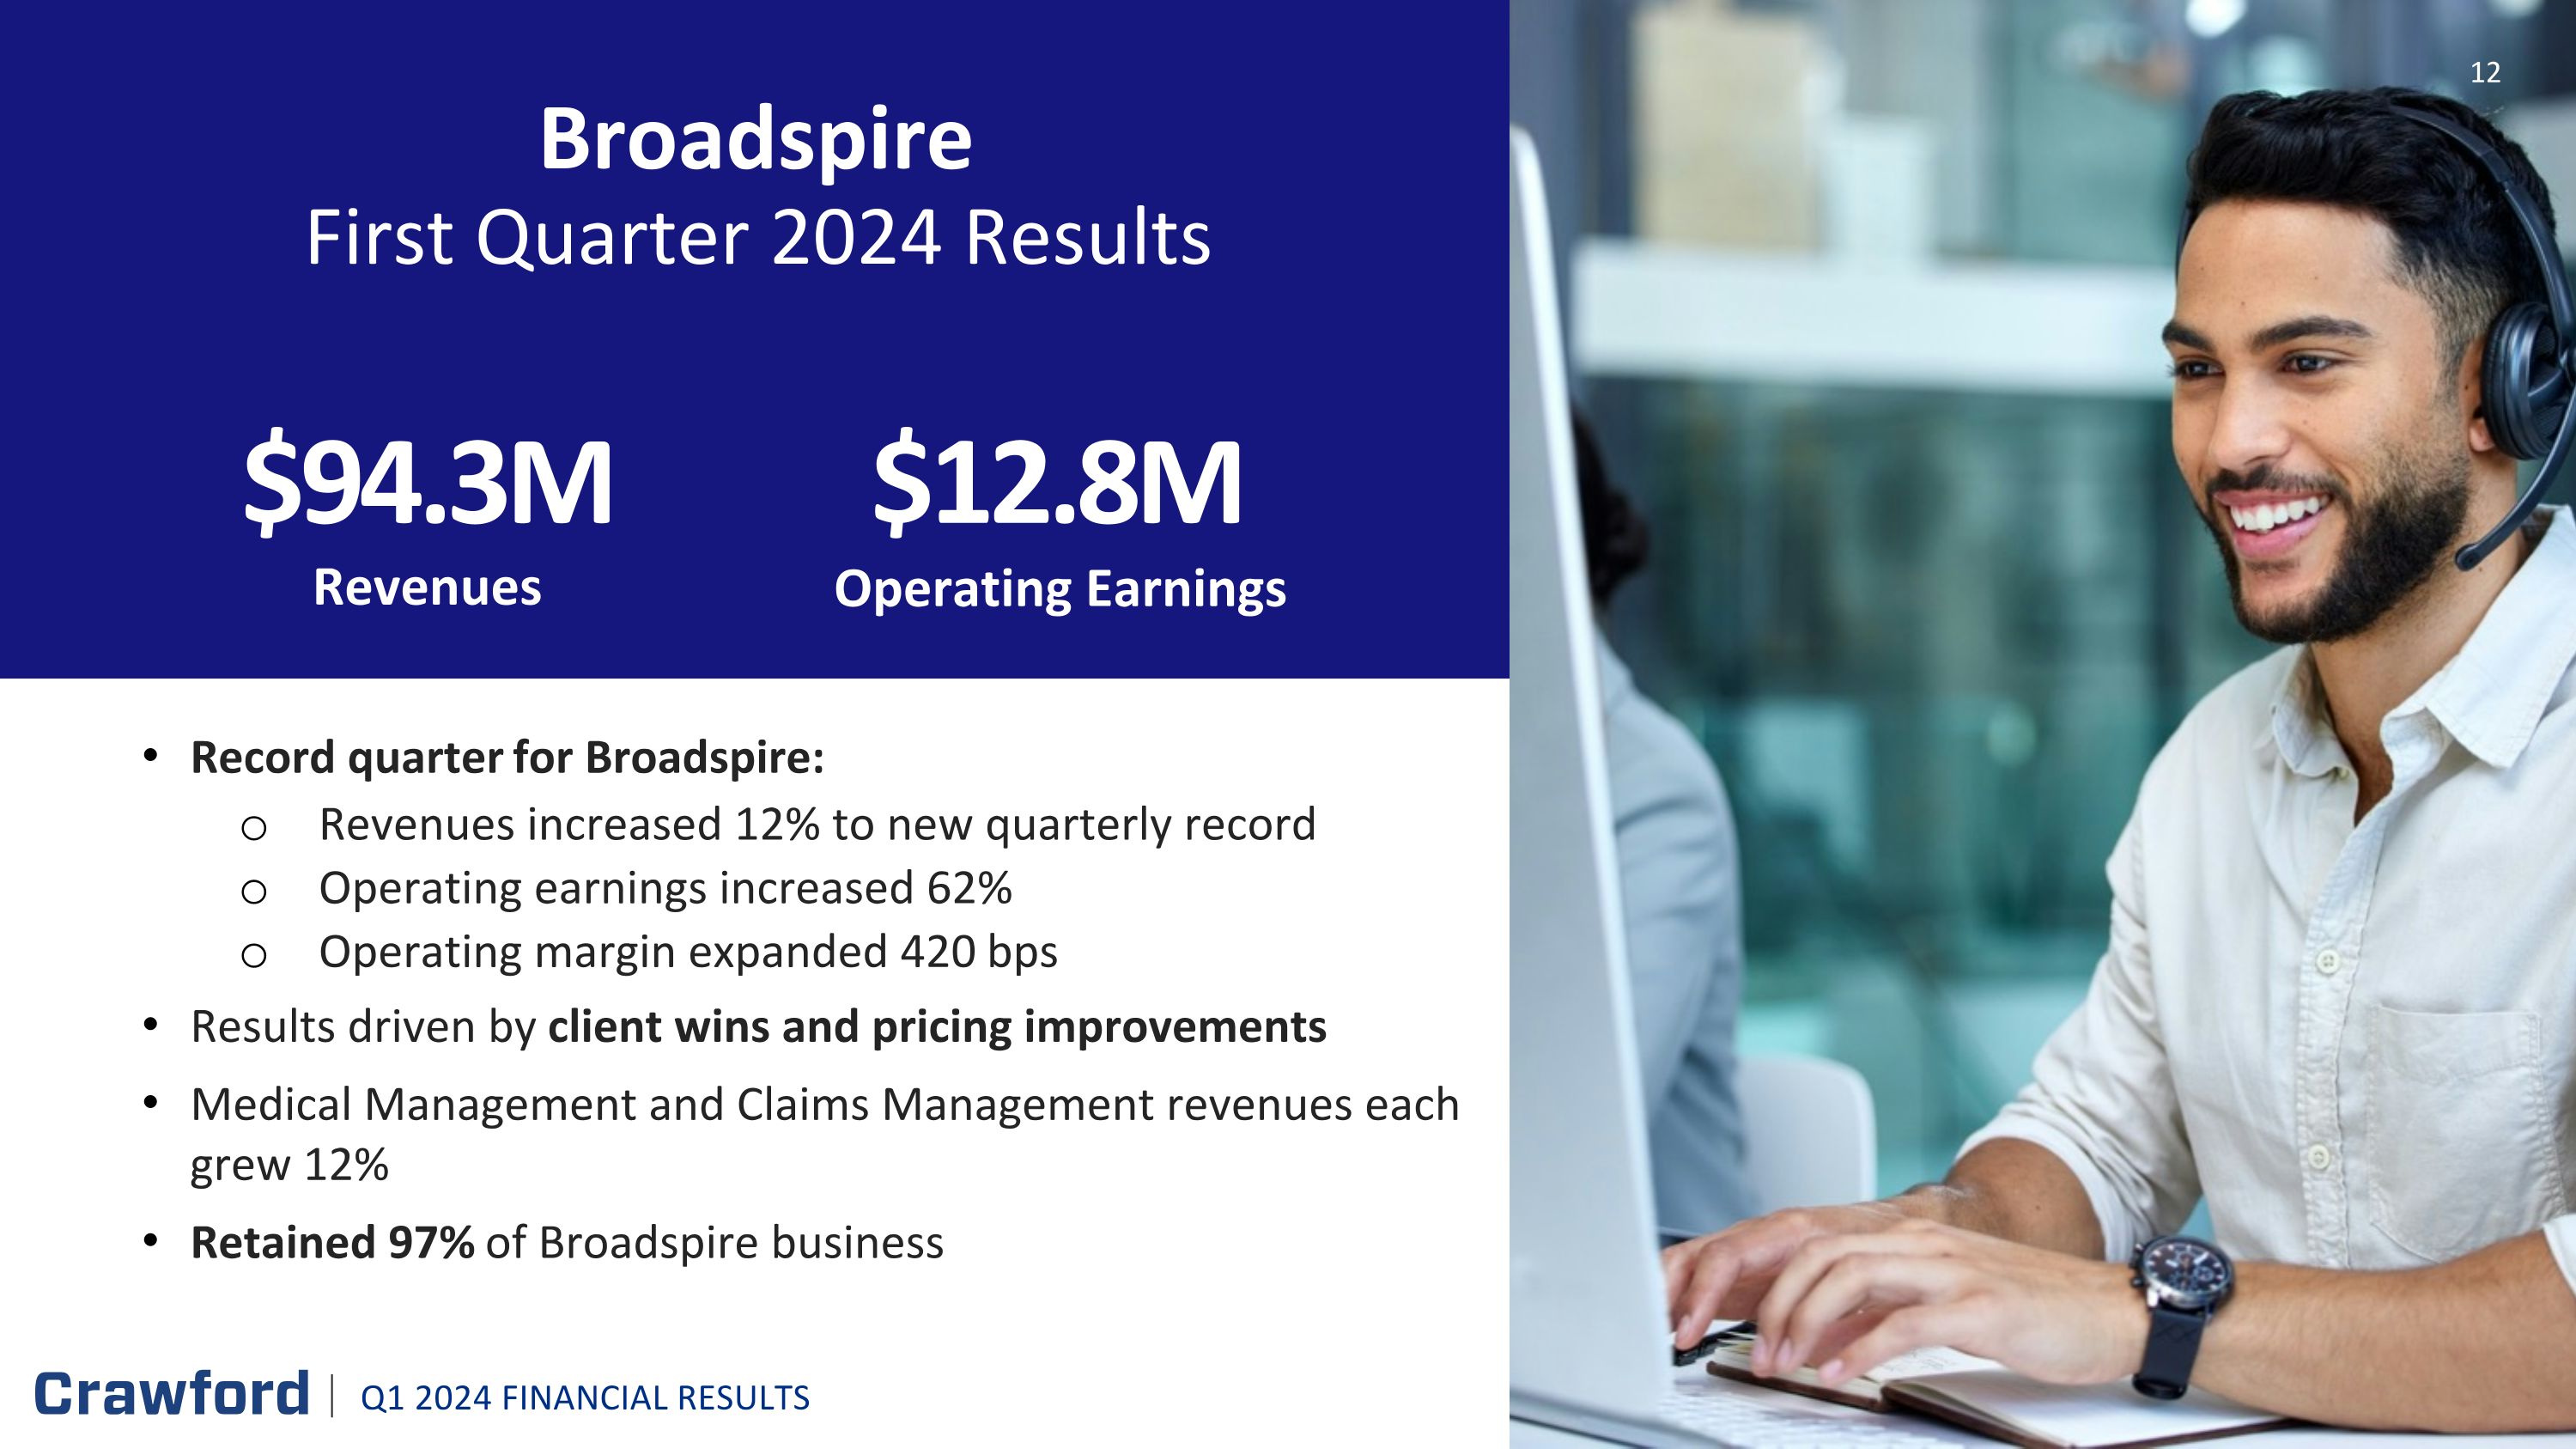
Record quarter for Broadspire: Revenues increased 12% to new quarterly record Operating earnings increased 62% Operating margin expanded 420 bps Results driven by client wins and pricing improvements Medical Management and Claims Management revenues each grew 12% Retained 97% of Broadspire business Broadspire First Quarter 2024 Results Revenues $94.3M $12.8M Operating Earnings 12 Q1 2024 FINANCIAL RESULTS
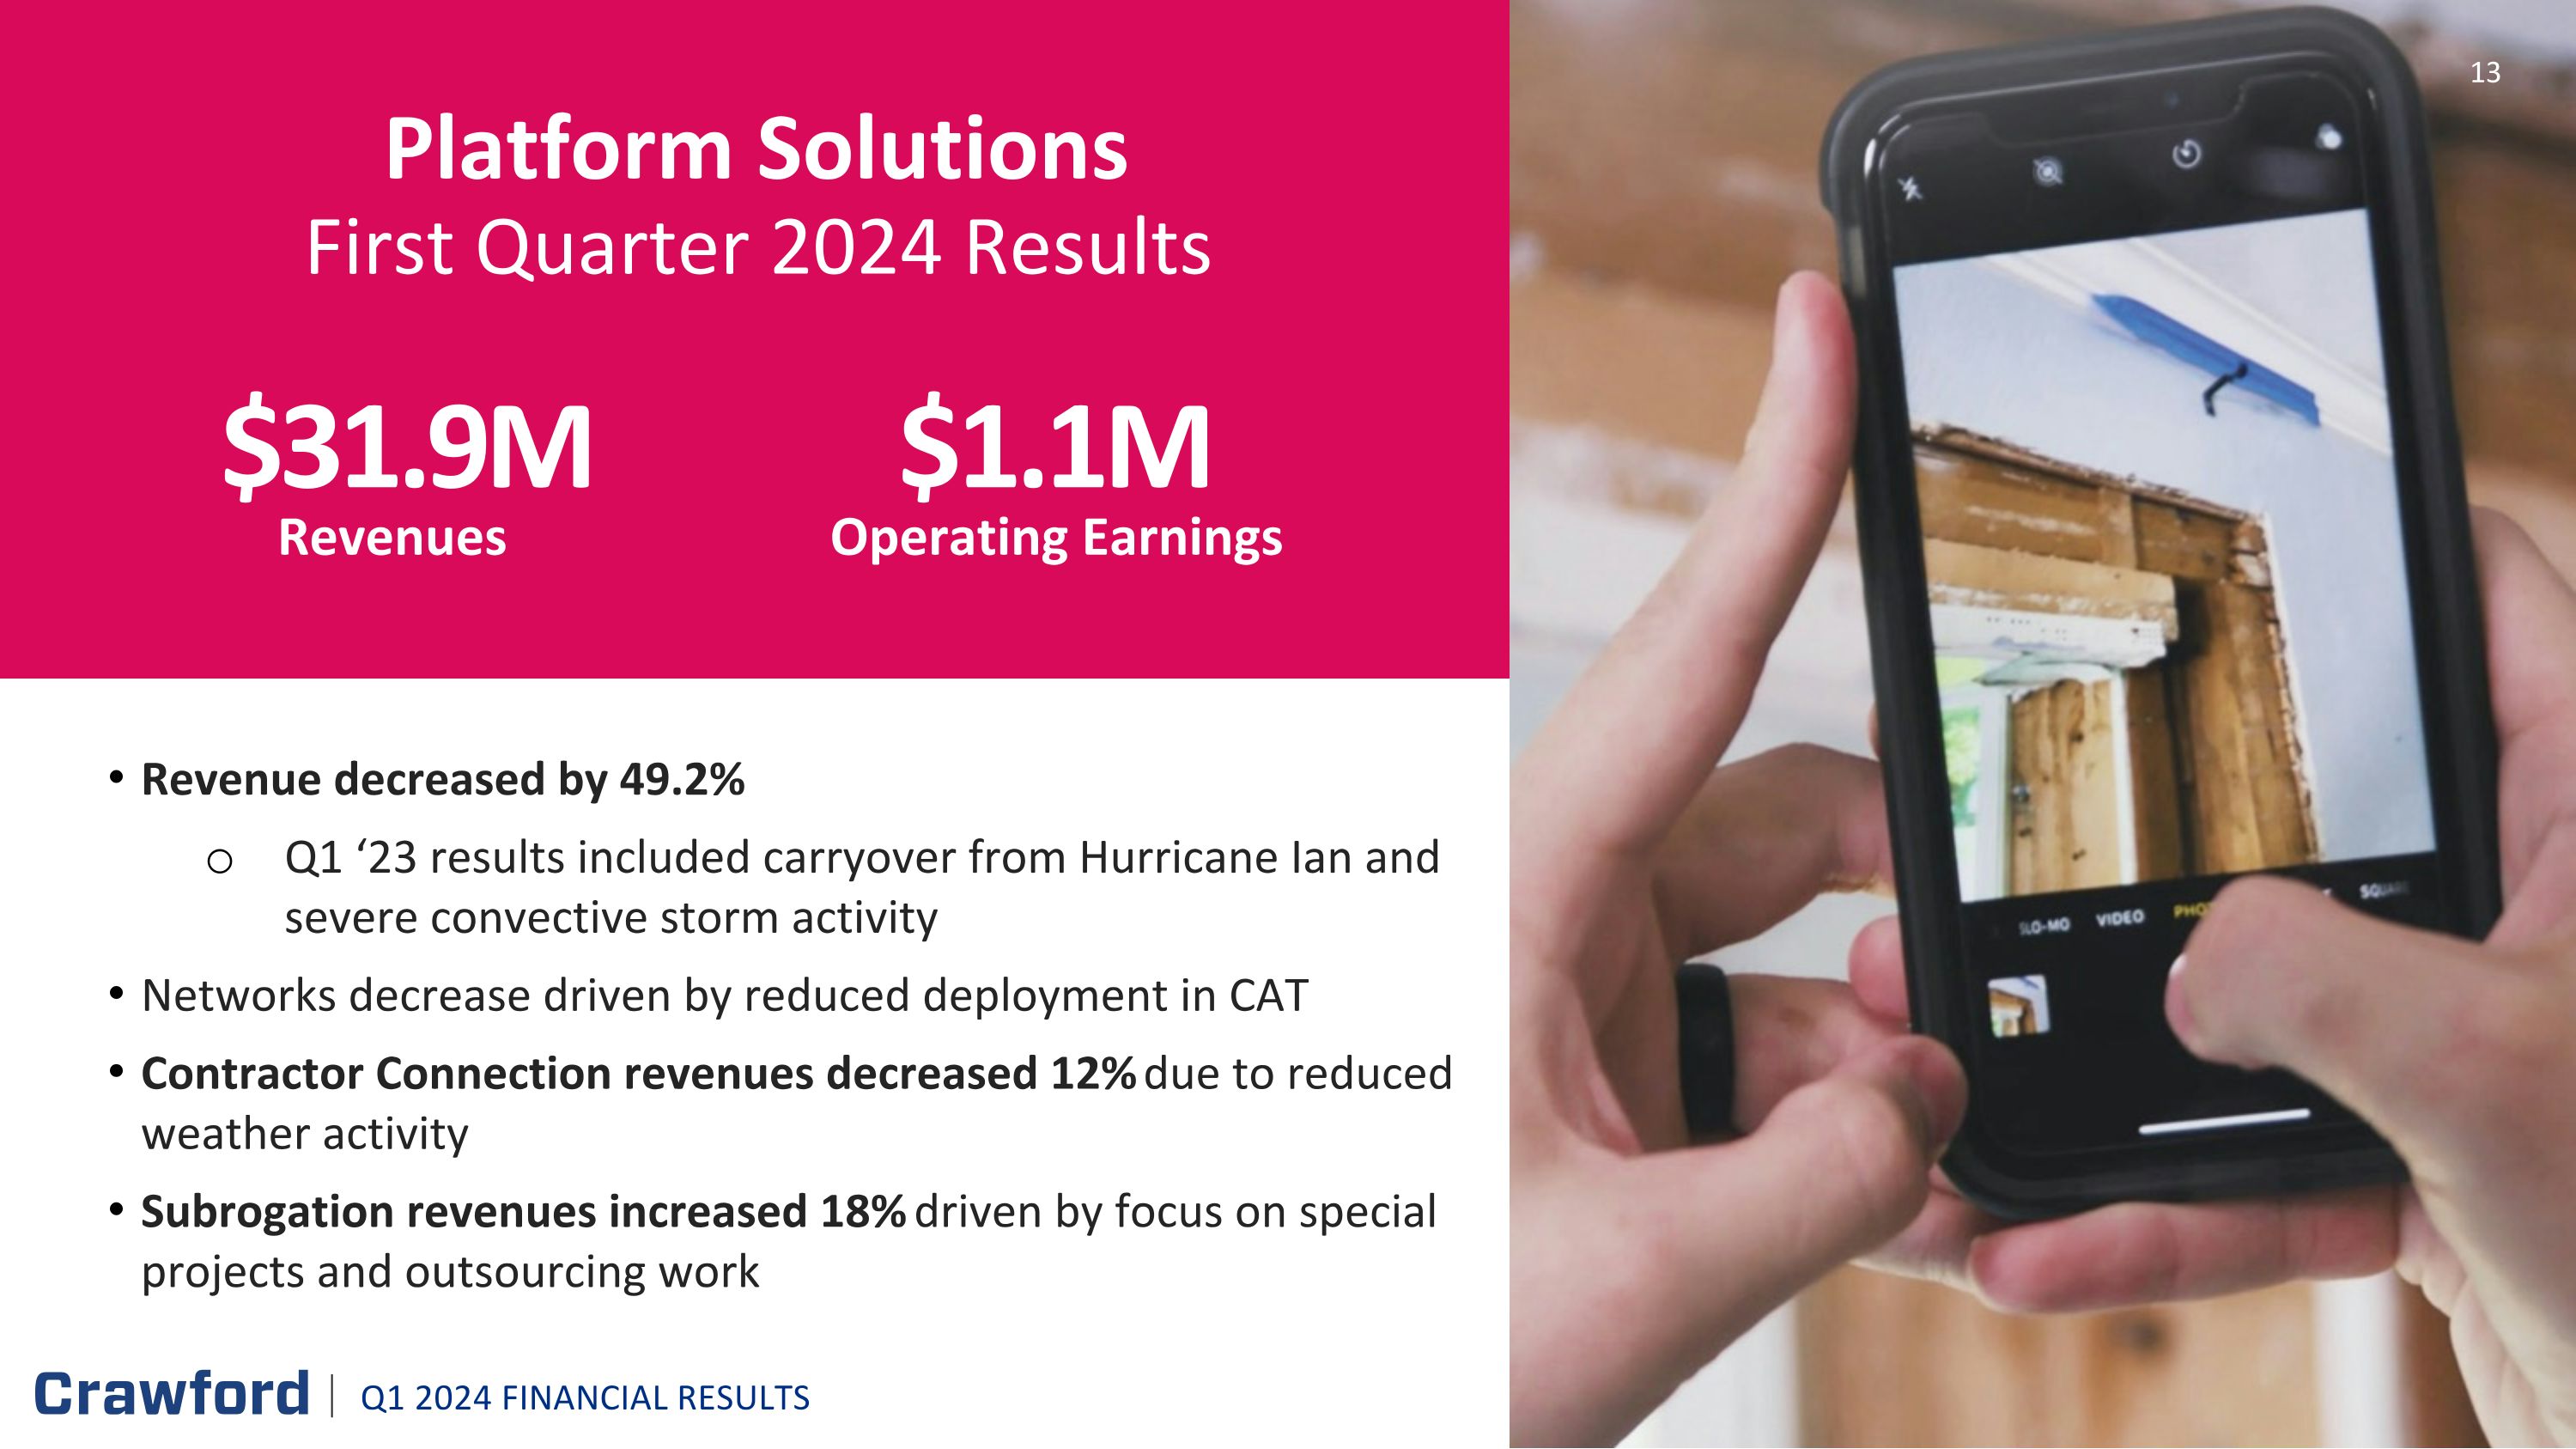
Revenue decreased by 49.2% Q1 ‘23 results included carryover from Hurricane Ian and severe convective storm activity Networks decrease driven by reduced deployment in CAT Contractor Connection revenues decreased 12% due to reduced weather activity Subrogation revenues increased 18% driven by focus on special projects and outsourcing work Platform Solutions First Quarter 2024 Results Revenues $31.9M Operating Earnings $1.1M 13 Q1 2024 FINANCIAL RESULTS

FINANCIAL UPDATE Bruce Swain, Chief Financial Officer Q1 2024 FINANCIAL RESULTS 14
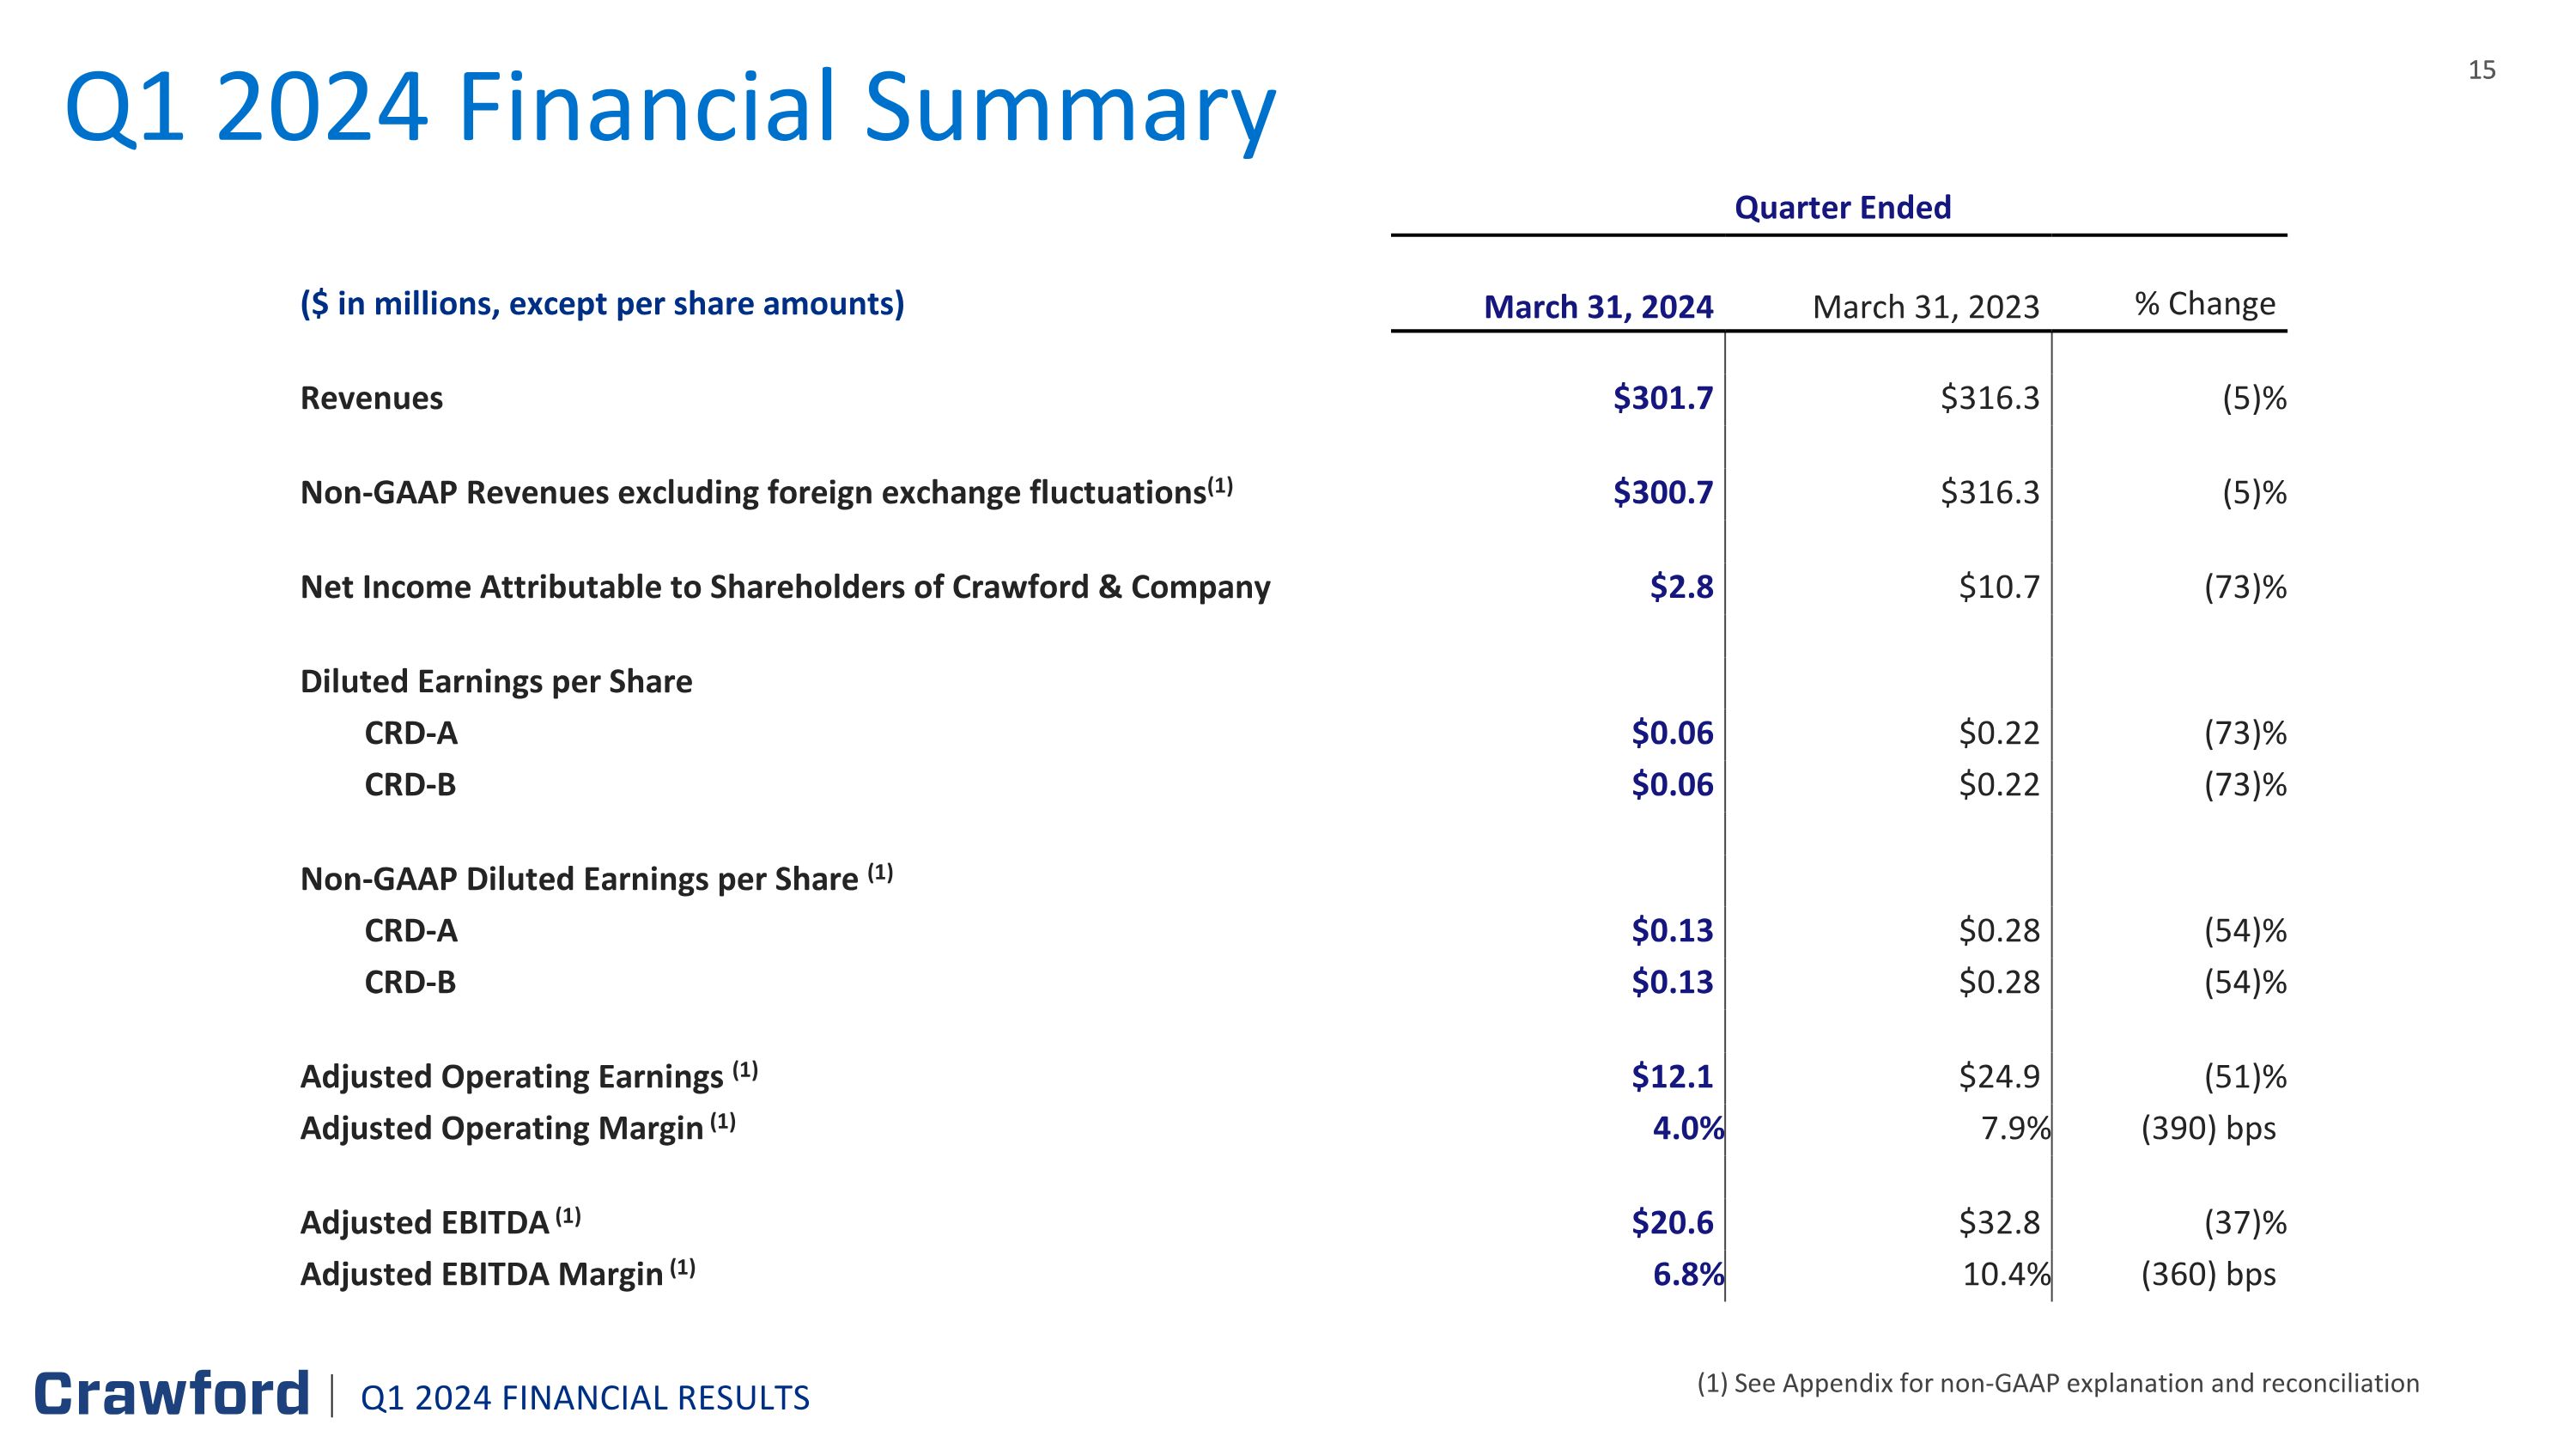
Q1 2024 Financial Summary (1) See Appendix for non-GAAP explanation and reconciliation Quarter Ended ($ in millions, except per share amounts) March 31, 2024 March 31, 2023 % Change Revenues $301.7 $316.3 (5)% Non-GAAP Revenues excluding foreign exchange fluctuations(1) $300.7 $316.3 (5)% Net Income Attributable to Shareholders of Crawford & Company $2.8 $10.7 (73)% Diluted Earnings per Share CRD-A $0.06 $0.22 (73)% CRD-B $0.06 $0.22 (73)% Non-GAAP Diluted Earnings per Share (1) CRD-A $0.13 $0.28 (54)% CRD-B $0.13 $0.28 (54)% Adjusted Operating Earnings (1) $12.1 $24.9 (51)% Adjusted Operating Margin (1) 4.0% 7.9% (390) bps Adjusted EBITDA (1) $20.6 $32.8 (37)% Adjusted EBITDA Margin (1) 6.8% 10.4% (360) bps Q1 2024 FINANCIAL RESULTS
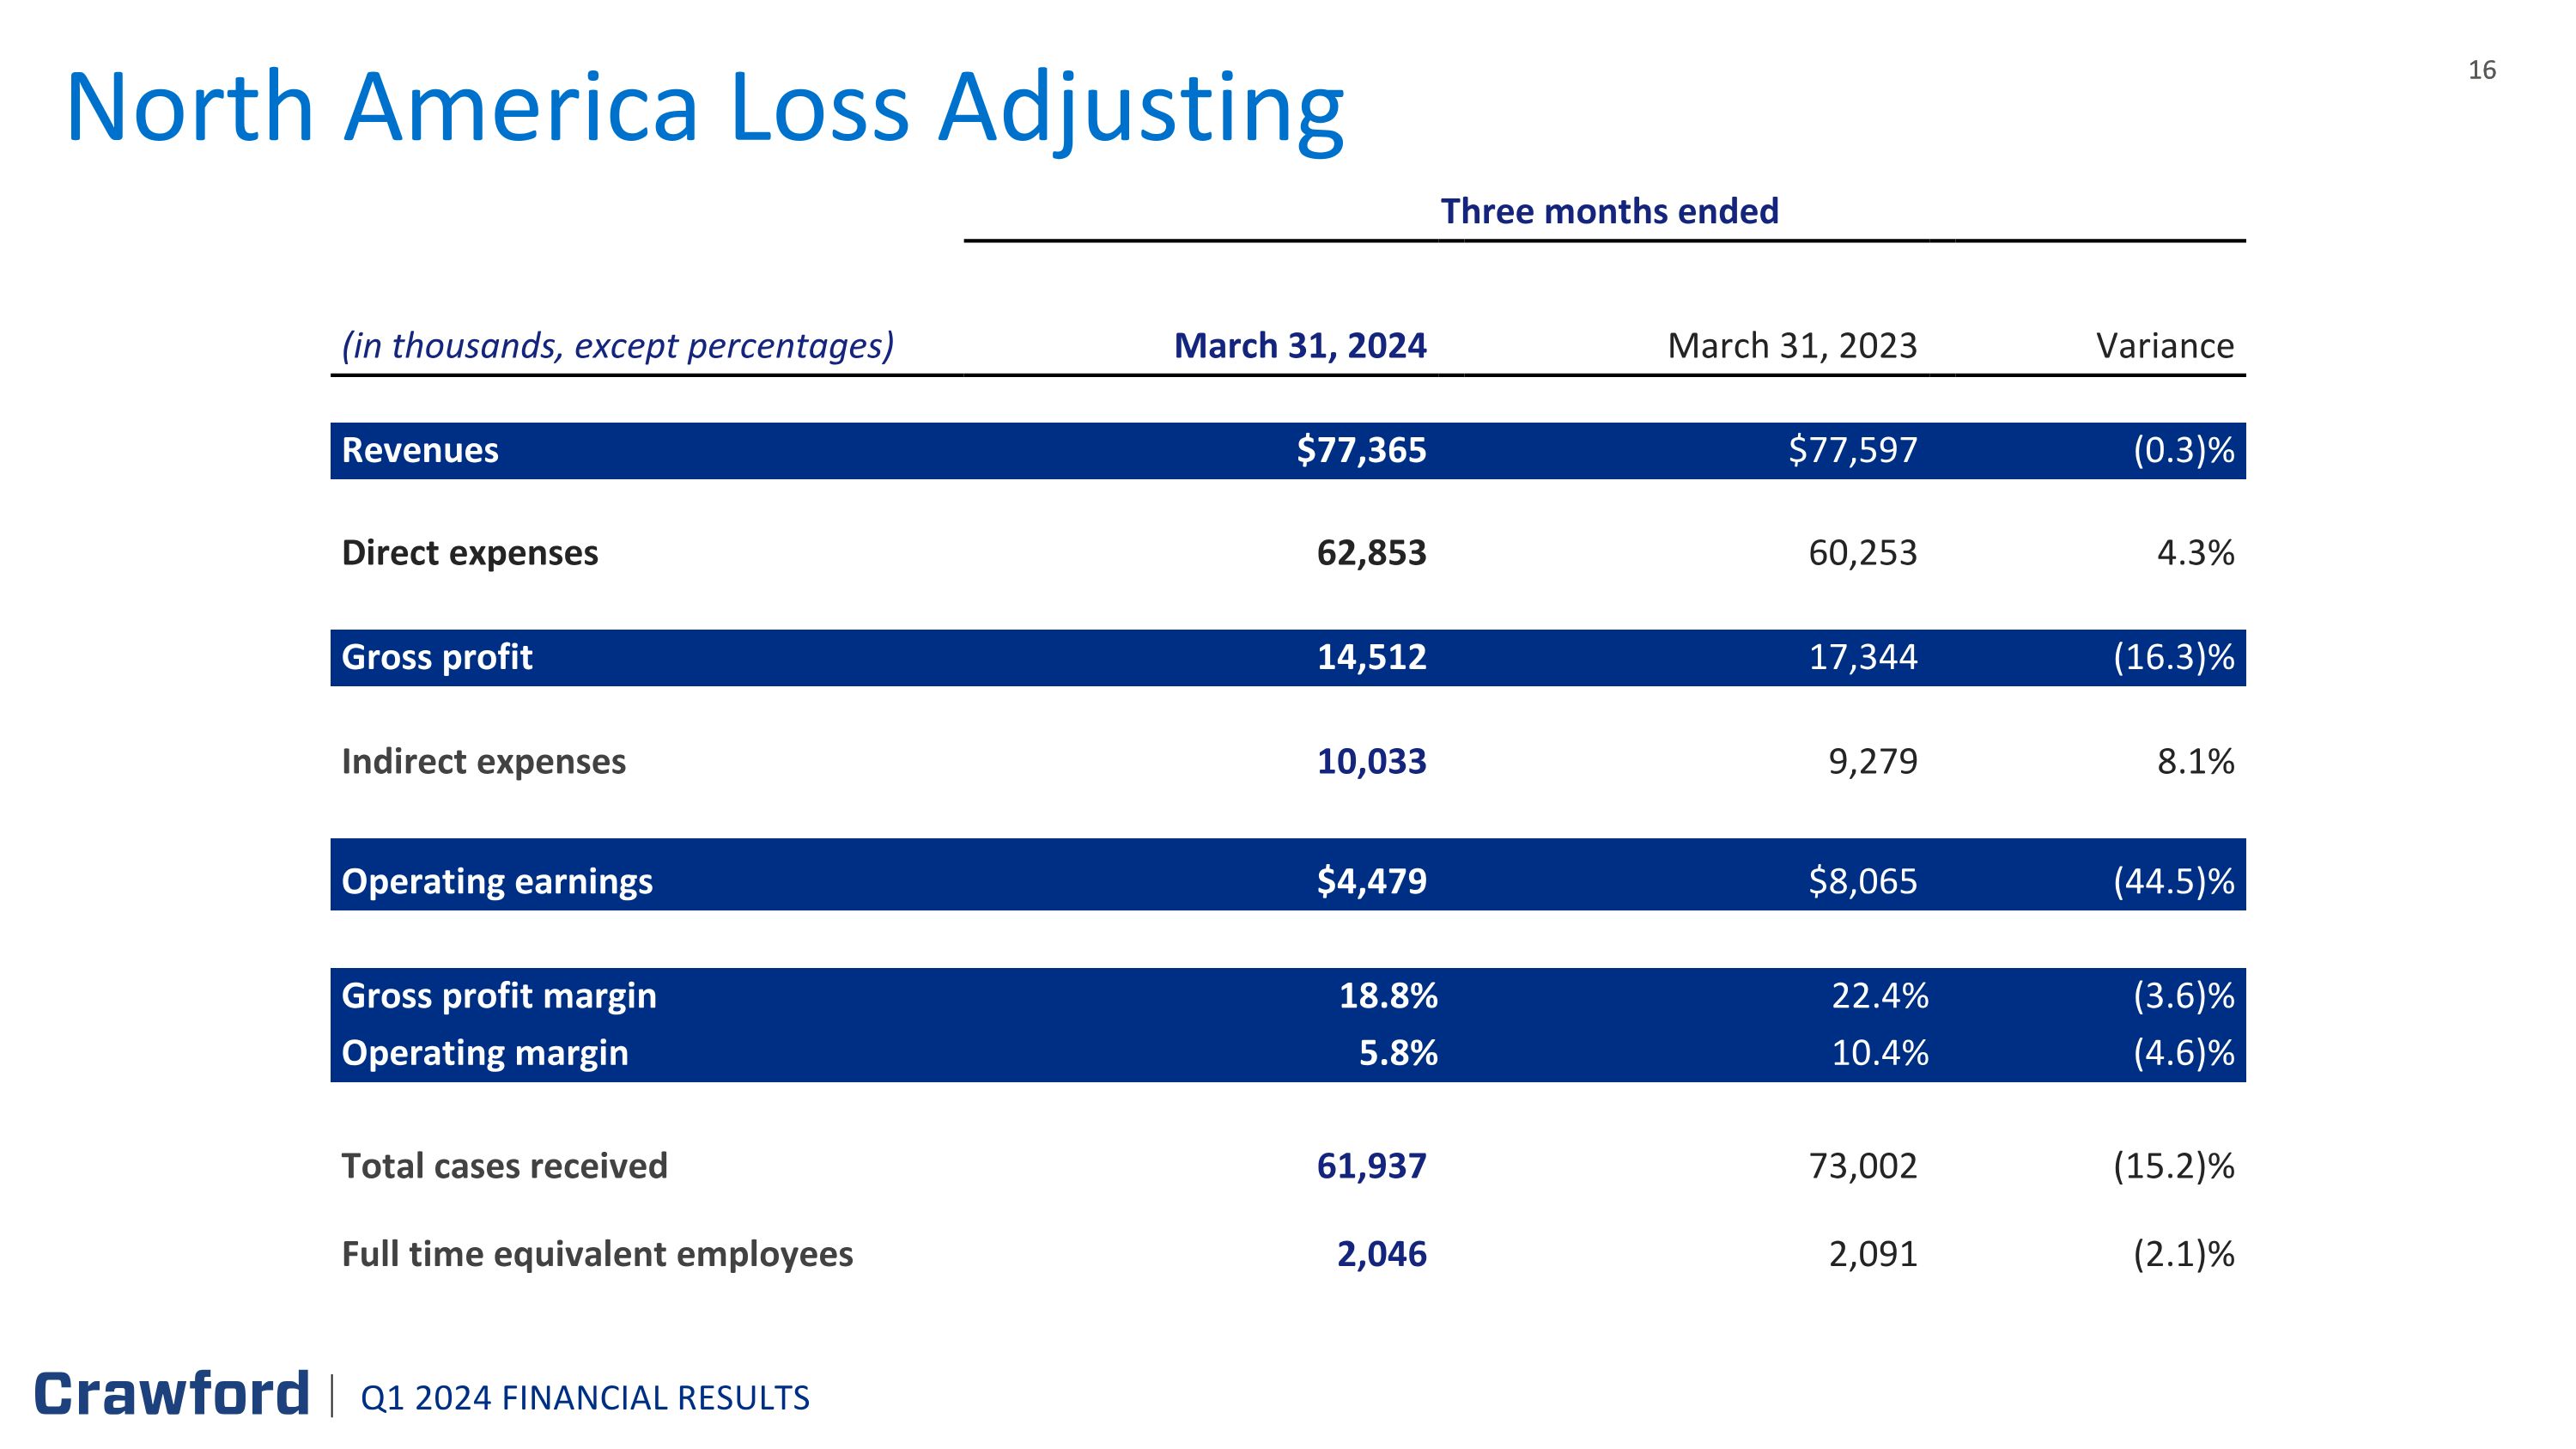
North America Loss Adjusting Three months ended (in thousands, except percentages) March 31, 2024 March 31, 2023 Variance Revenues $77,365 $77,597 (0.3)% Direct expenses 62,853 60,253 4.3% Gross profit 14,512 17,344 (16.3)% Indirect expenses 10,033 9,279 8.1% Operating earnings $4,479 $8,065 (44.5)% Gross profit margin 18.8% 22.4% (3.6)% Operating margin 5.8% 10.4% (4.6)% Total cases received 61,937 73,002 (15.2)% Full time equivalent employees 2,046 2,091 (2.1)% Q1 2024 FINANCIAL RESULTS
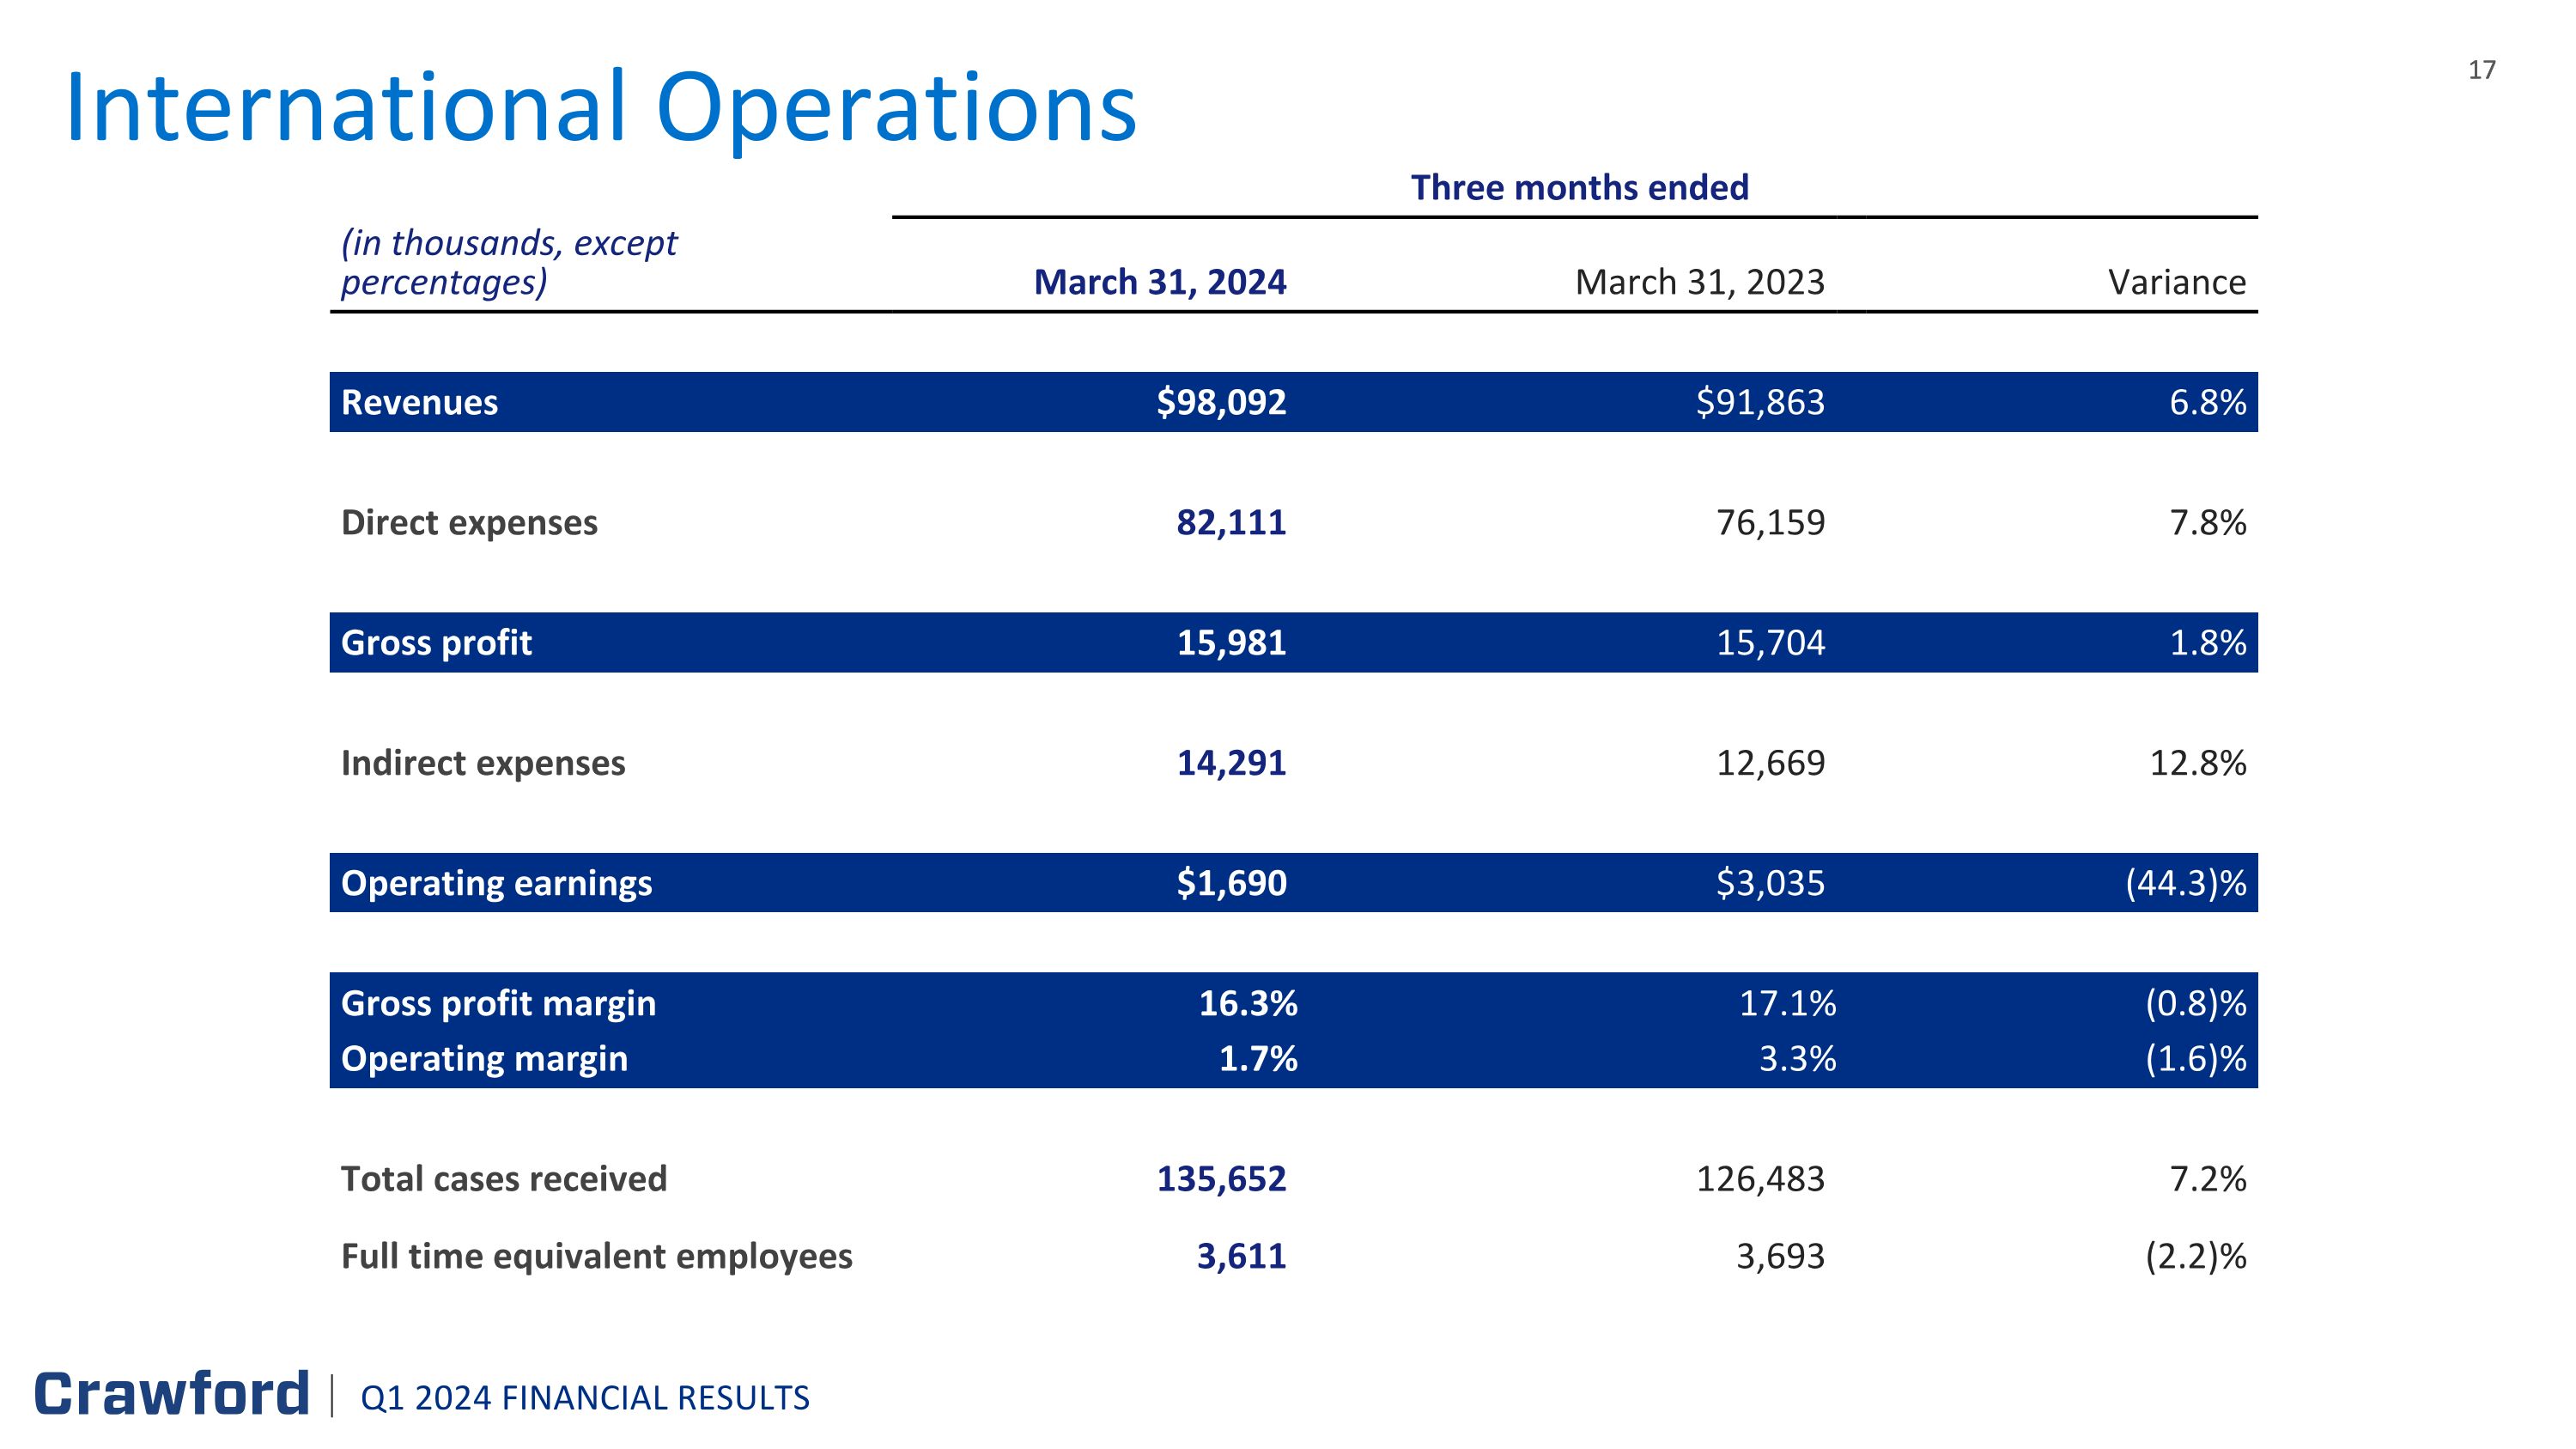
International Operations Three months ended (in thousands, except percentages) March 31, 2024 March 31, 2023 Variance Revenues $98,092 $91,863 6.8% Direct expenses 82,111 76,159 7.8% Gross profit 15,981 15,704 1.8% Indirect expenses 14,291 12,669 12.8% Operating earnings $1,690 $3,035 (44.3)% Gross profit margin 16.3% 17.1% (0.8)% Operating margin 1.7% 3.3% (1.6)% Total cases received 135,652 126,483 7.2% Full time equivalent employees 3,611 3,693 (2.2)% Q1 2024 FINANCIAL RESULTS
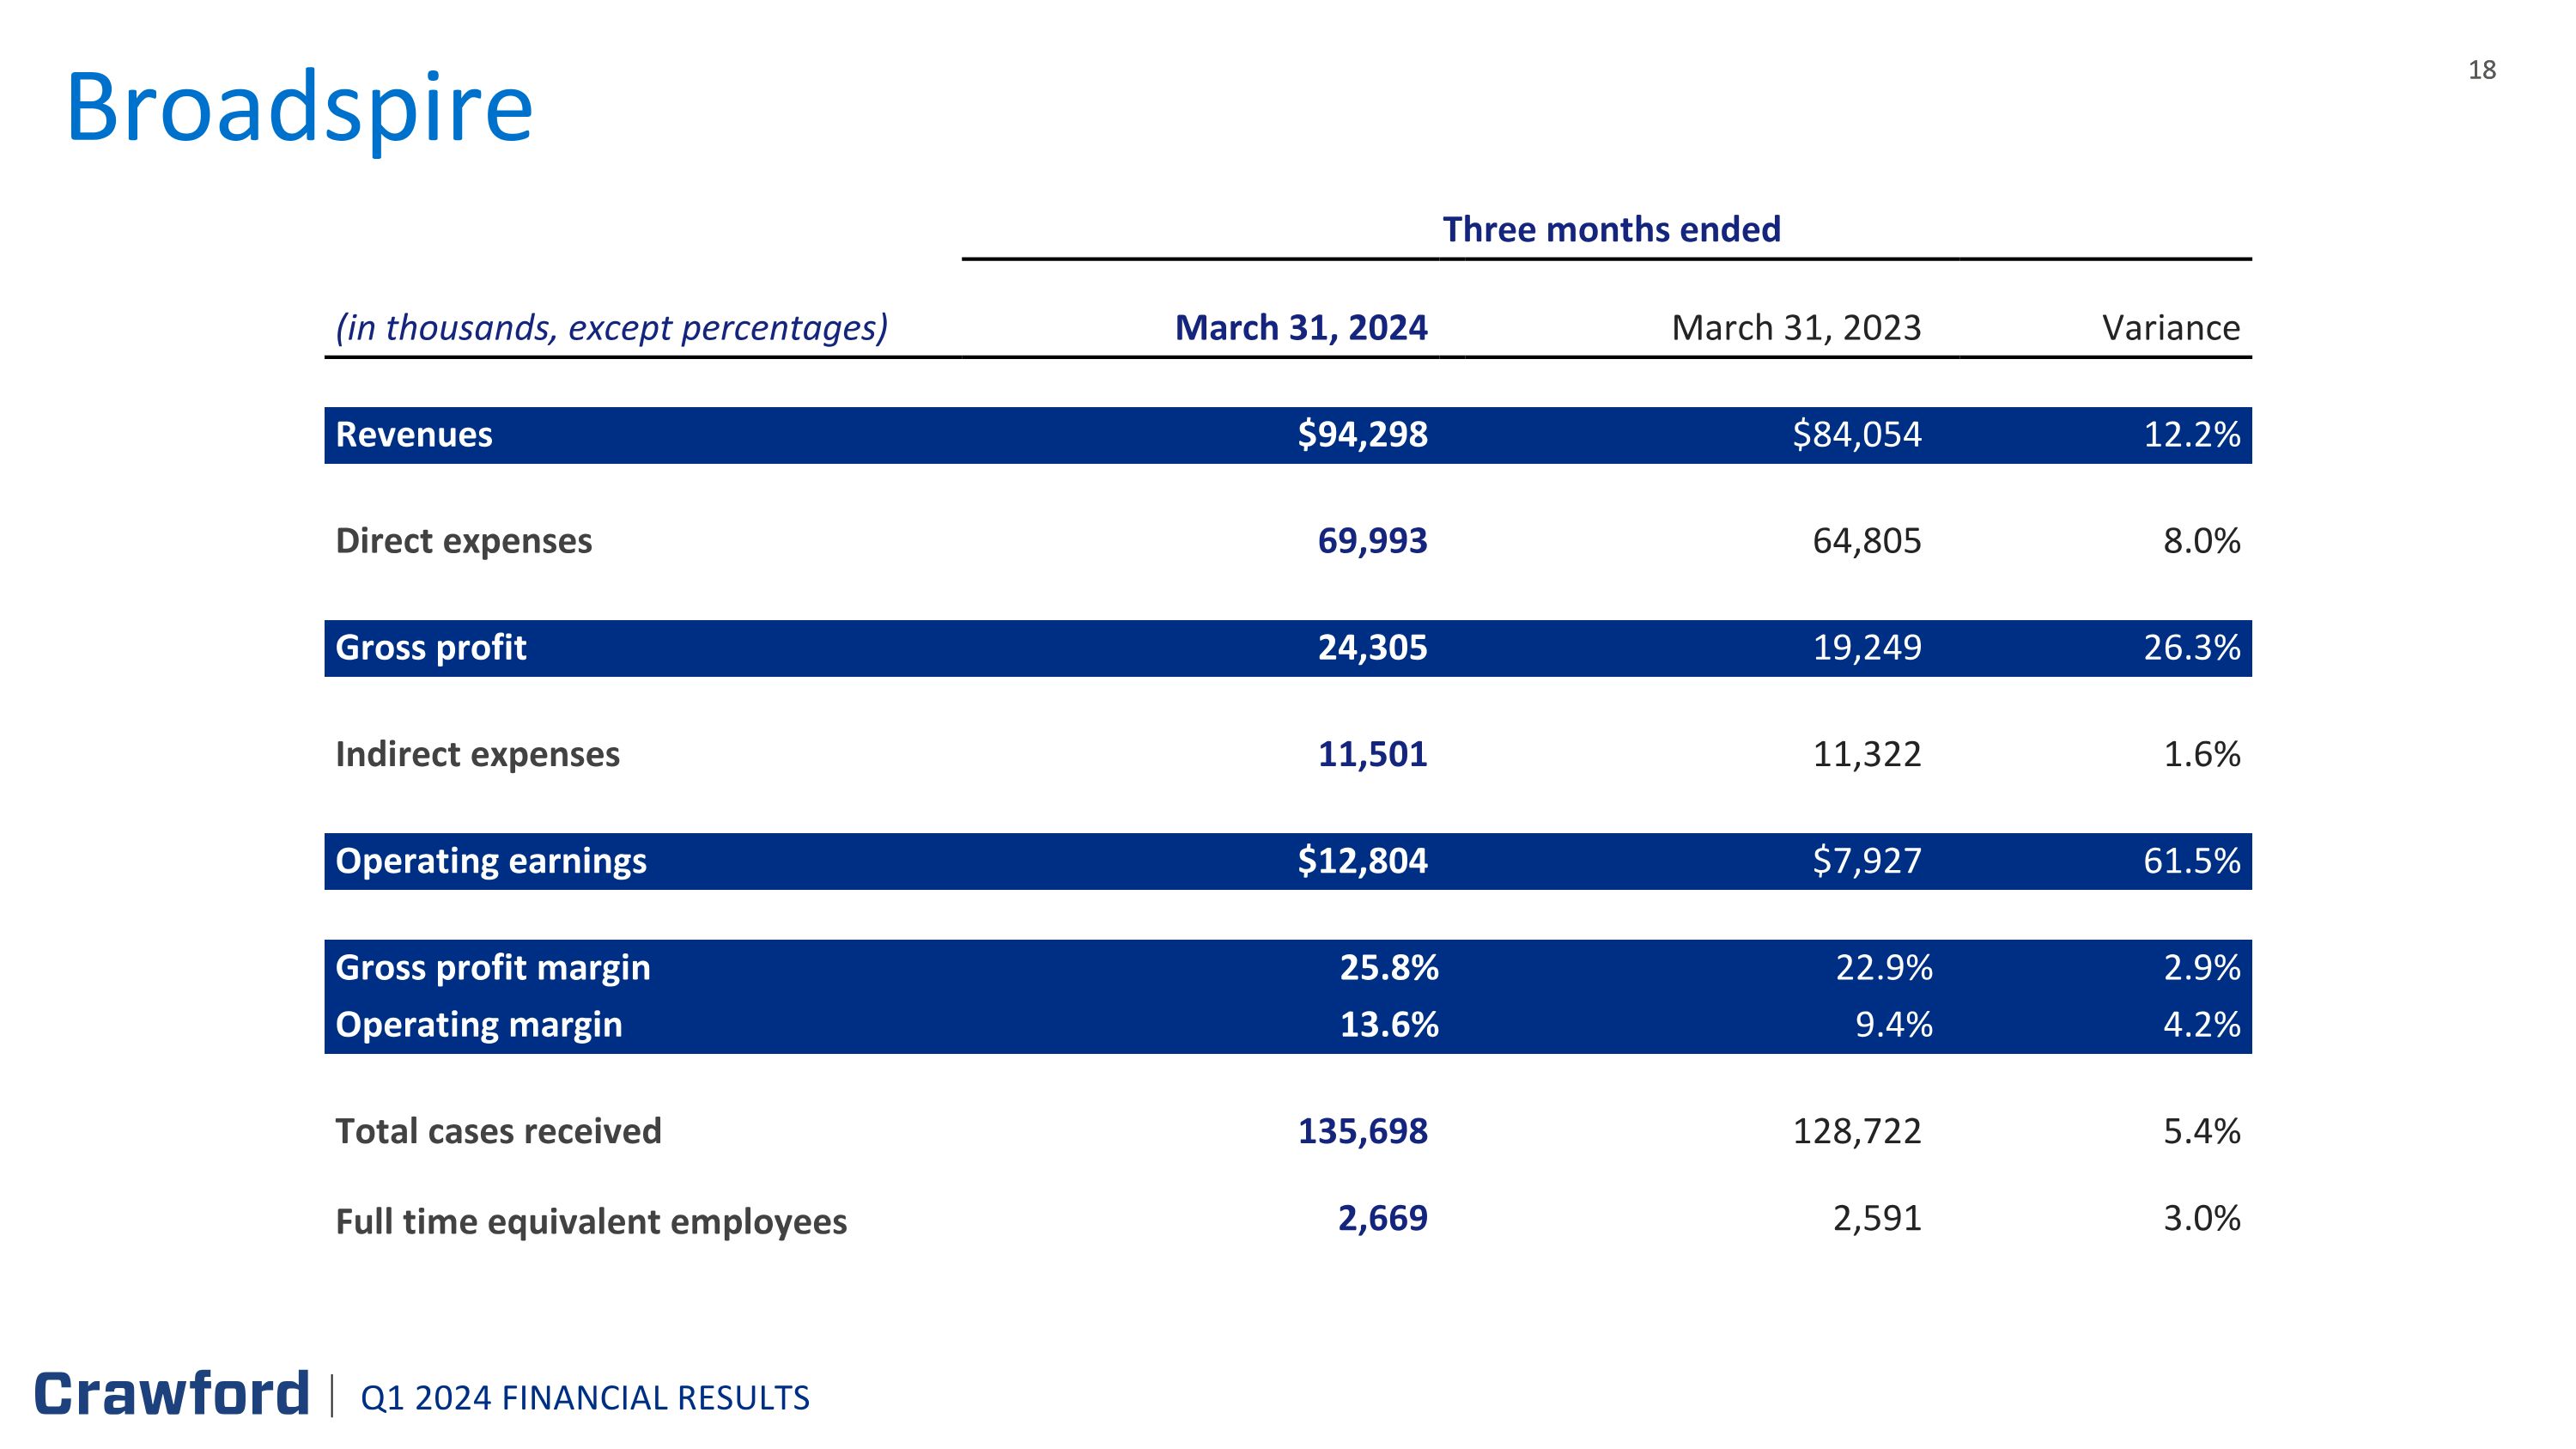
Broadspire Three months ended (in thousands, except percentages) March 31, 2024 March 31, 2023 Variance Revenues $94,298 $84,054 12.2% Direct expenses 69,993 64,805 8.0% Gross profit 24,305 19,249 26.3% Indirect expenses 11,501 11,322 1.6% Operating earnings $12,804 $7,927 61.5% Gross profit margin 25.8% 22.9% 2.9% Operating margin 13.6% 9.4% 4.2% Total cases received 135,698 128,722 5.4% Full time equivalent employees 2,669 2,591 3.0% Q1 2024 FINANCIAL RESULTS
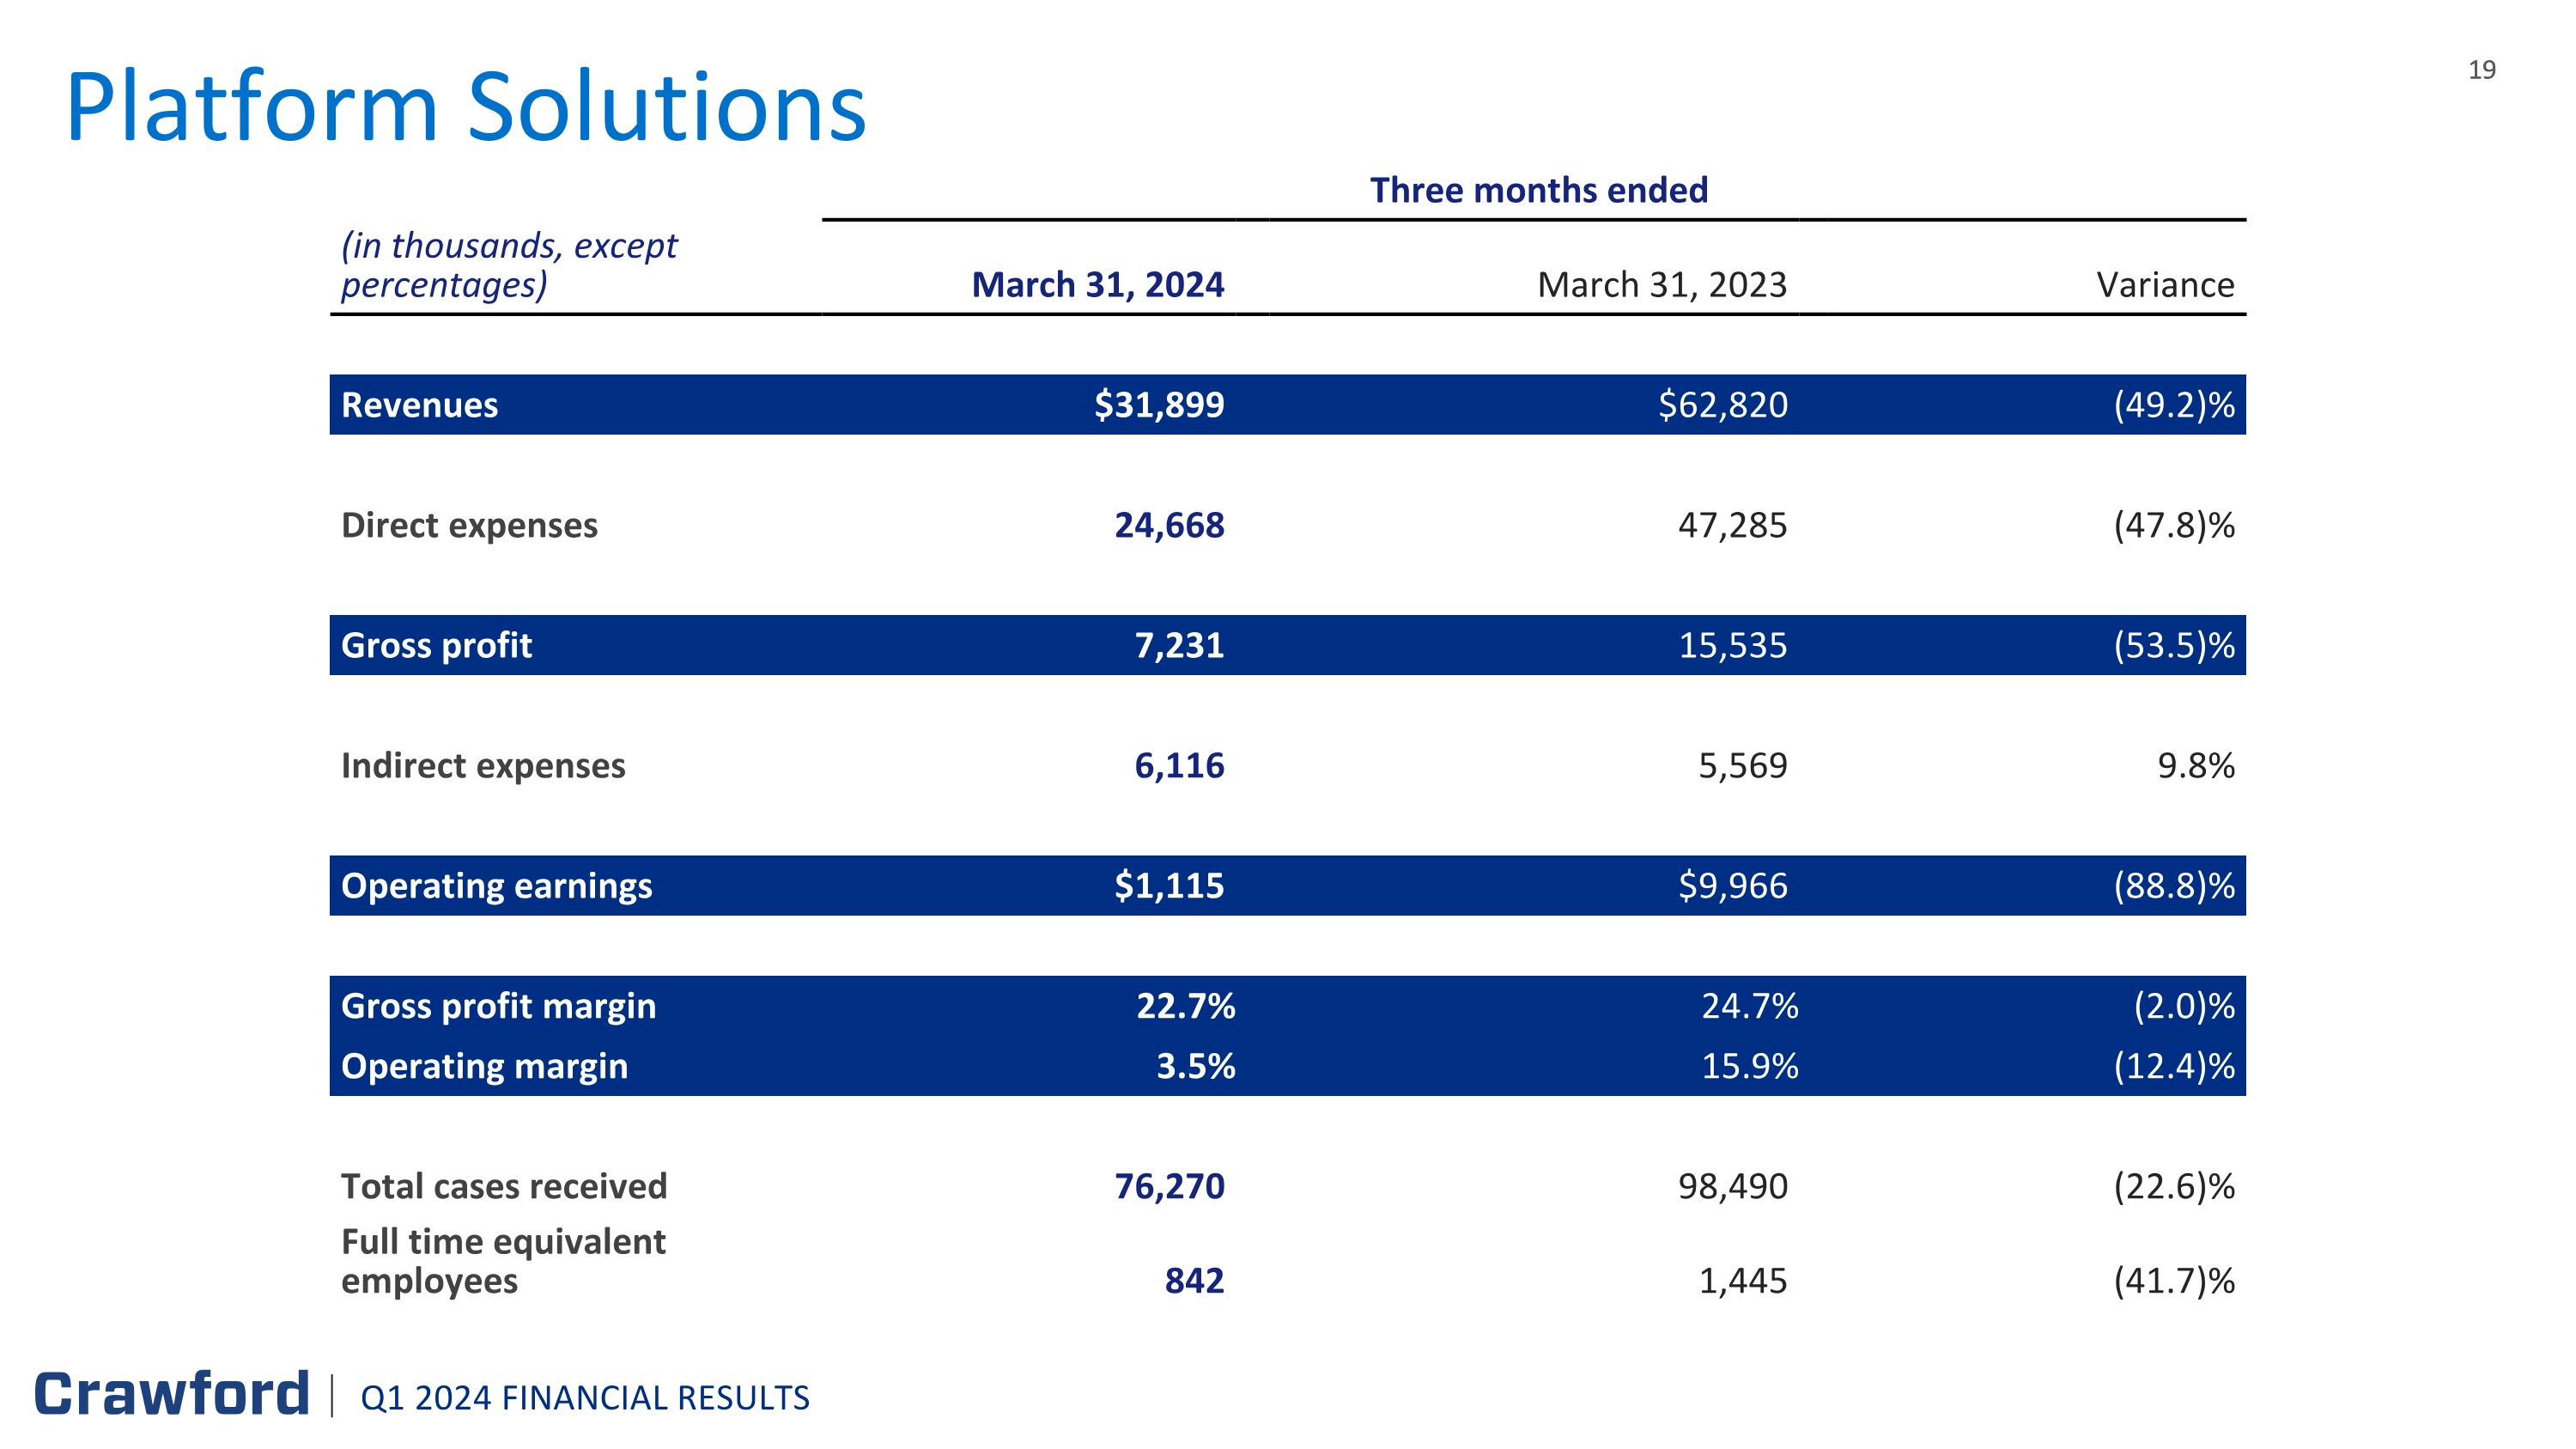
Platform Solutions Three months ended (in thousands, except percentages) March 31, 2024 March 31, 2023 Variance Revenues $31,899 $62,820 (49.2)% Direct expenses 24,668 47,285 (47.8)% Gross profit 7,231 15,535 (53.5)% Indirect expenses 6,116 5,569 9.8% Operating earnings $1,115 $9,966 (88.8)% Gross profit margin 22.7% 24.7% (2.0)% Operating margin 3.5% 15.9% (12.4)% Total cases received 76,270 98,490 (22.6)% Full time equivalent employees 842 1,445 (41.7)% Q1 2024 FINANCIAL RESULTS
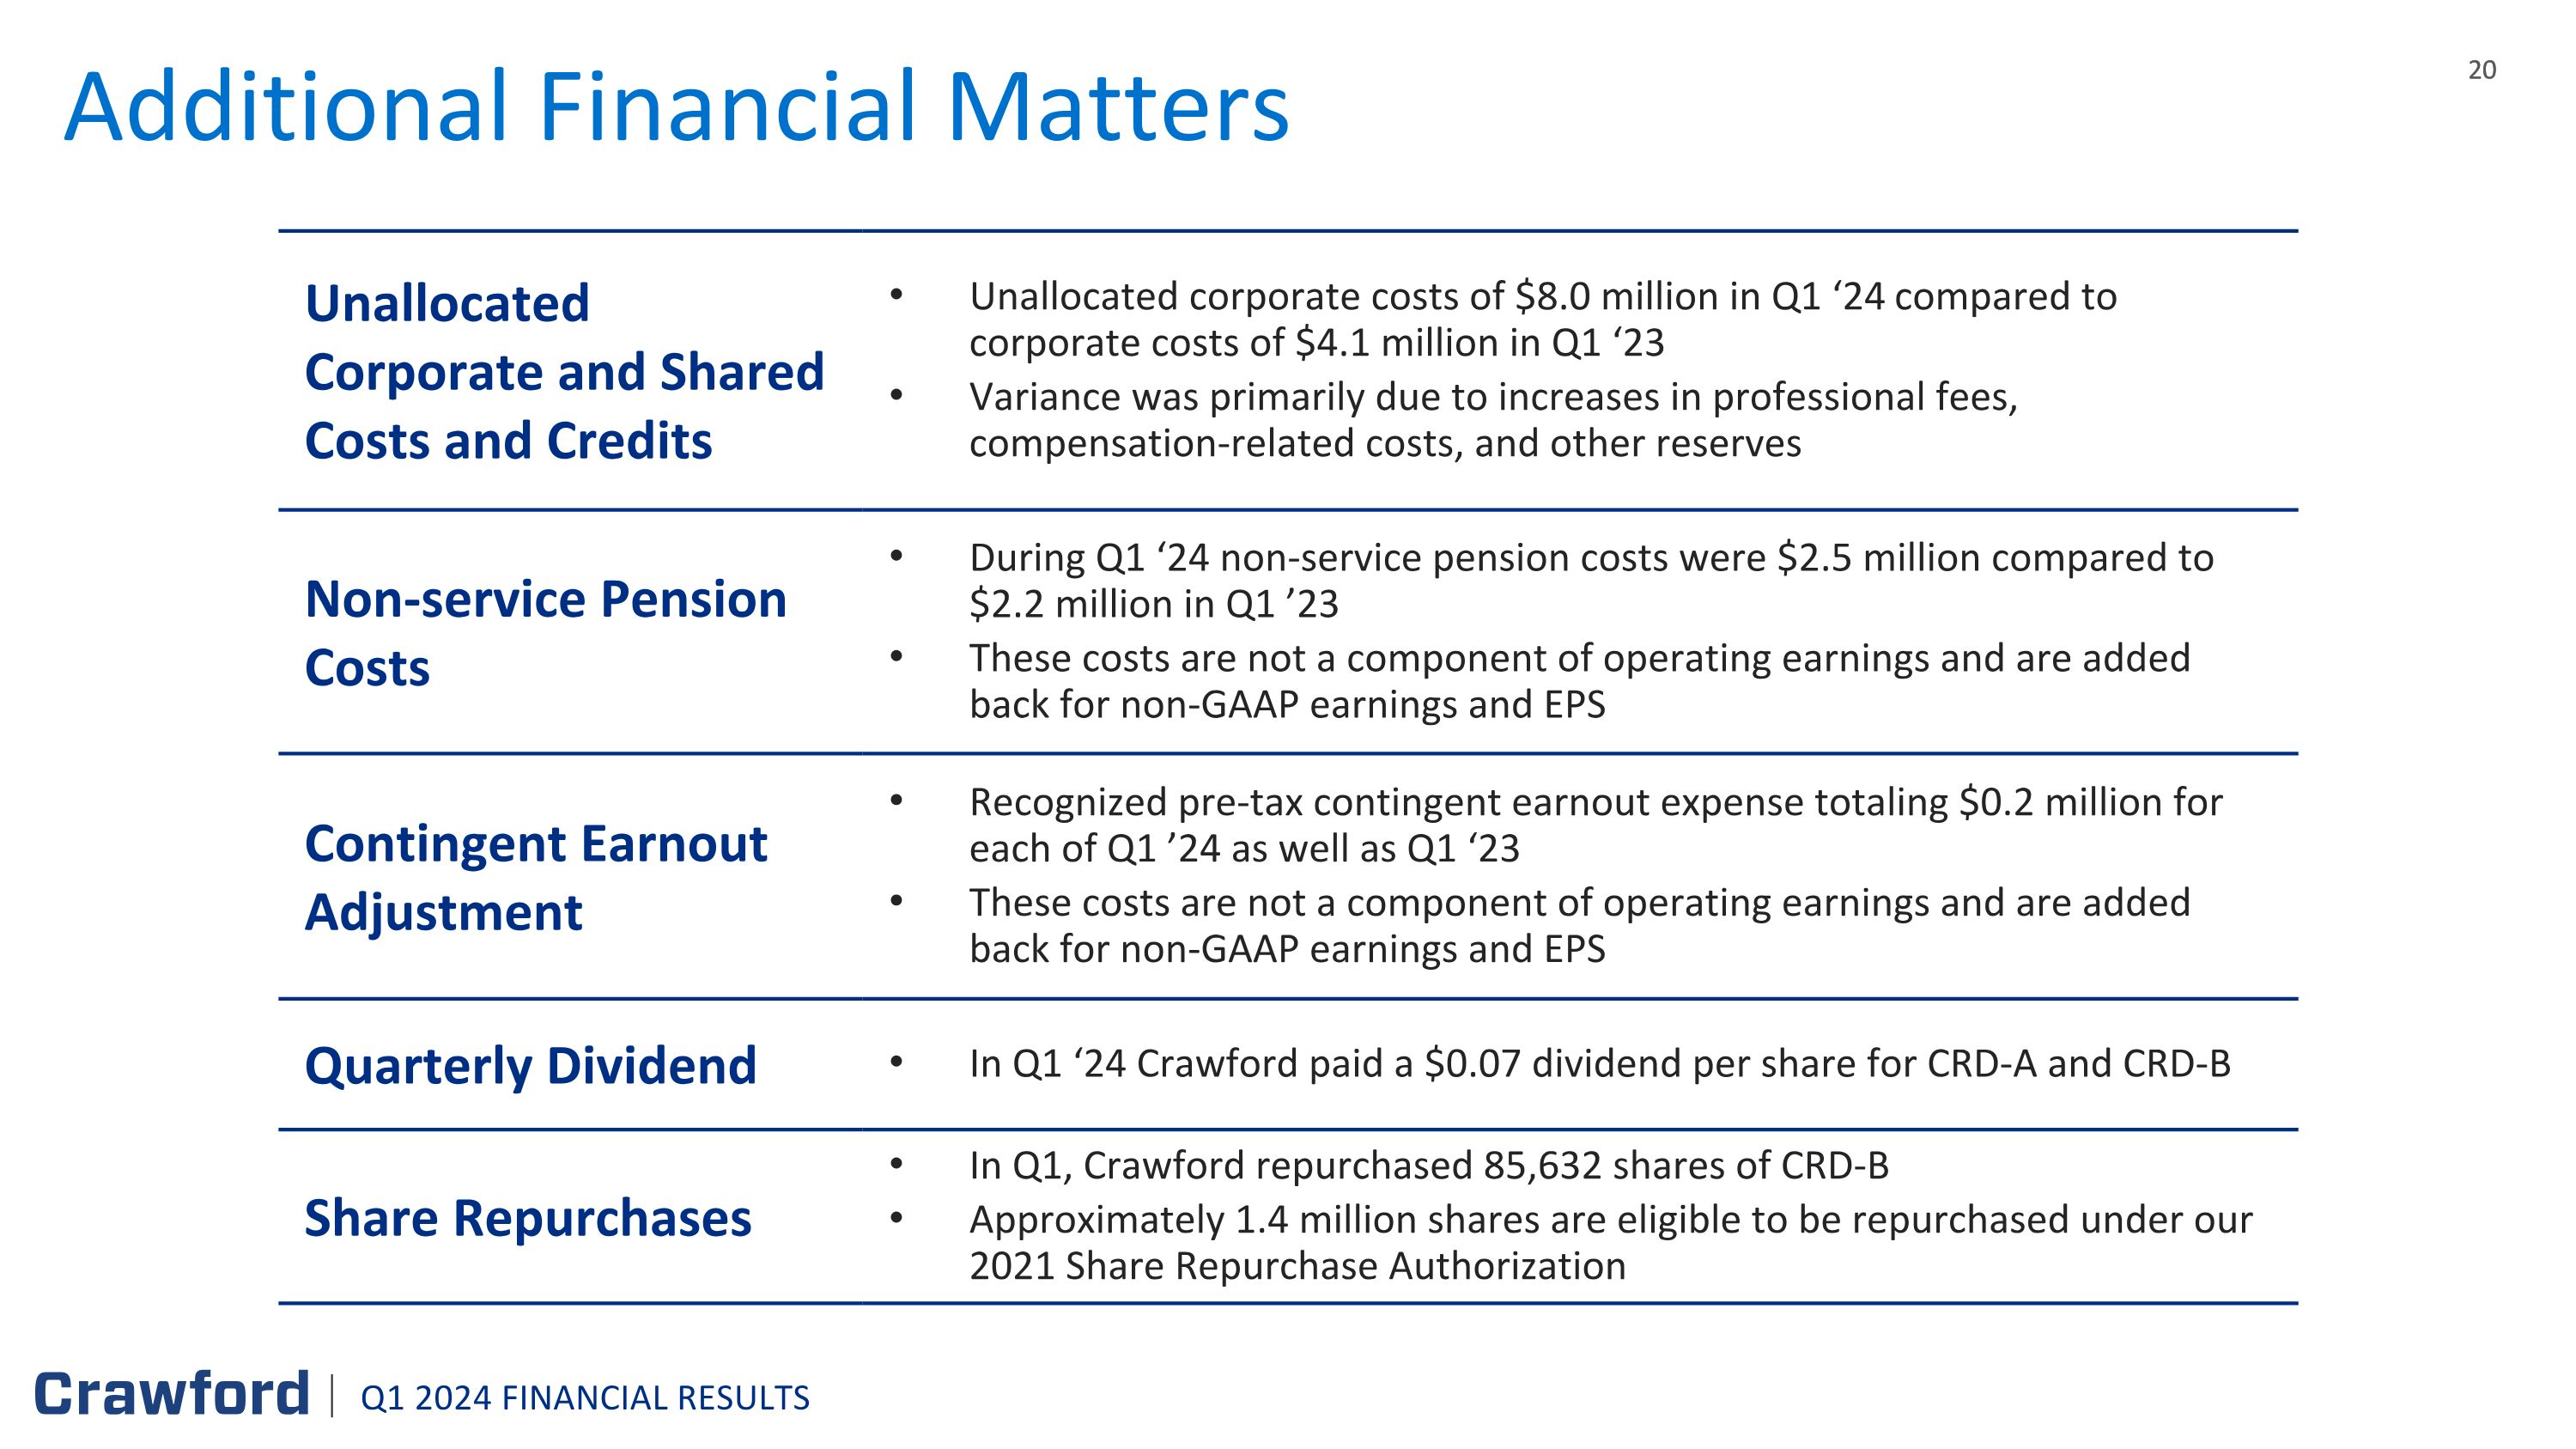
Additional Financial Matters Unallocated Corporate and Shared Costs and Credits Unallocated corporate costs of $8.0 million in Q1 ‘24 compared to corporate costs of $4.1 million in Q1 ‘23 Variance was primarily due to increases in professional fees, compensation-related costs, and other reserves Non-service Pension Costs During Q1 ‘24 non-service pension costs were $2.5 million compared to $2.2 million in Q1 ’23 These costs are not a component of operating earnings and are added back for non-GAAP earnings and EPS Contingent Earnout Adjustment Recognized pre-tax contingent earnout expense totaling $0.2 million for each of Q1 ’24 as well as Q1 ‘23 These costs are not a component of operating earnings and are added back for non-GAAP earnings and EPS Quarterly Dividend In Q1 ‘24 Crawford paid a $0.07 dividend per share for CRD-A and CRD-B Share Repurchases In Q1, Crawford repurchased 85,632 shares of CRD-B Approximately 1.4 million shares are eligible to be repurchased under our 2021 Share Repurchase Authorization Q1 2024 FINANCIAL RESULTS
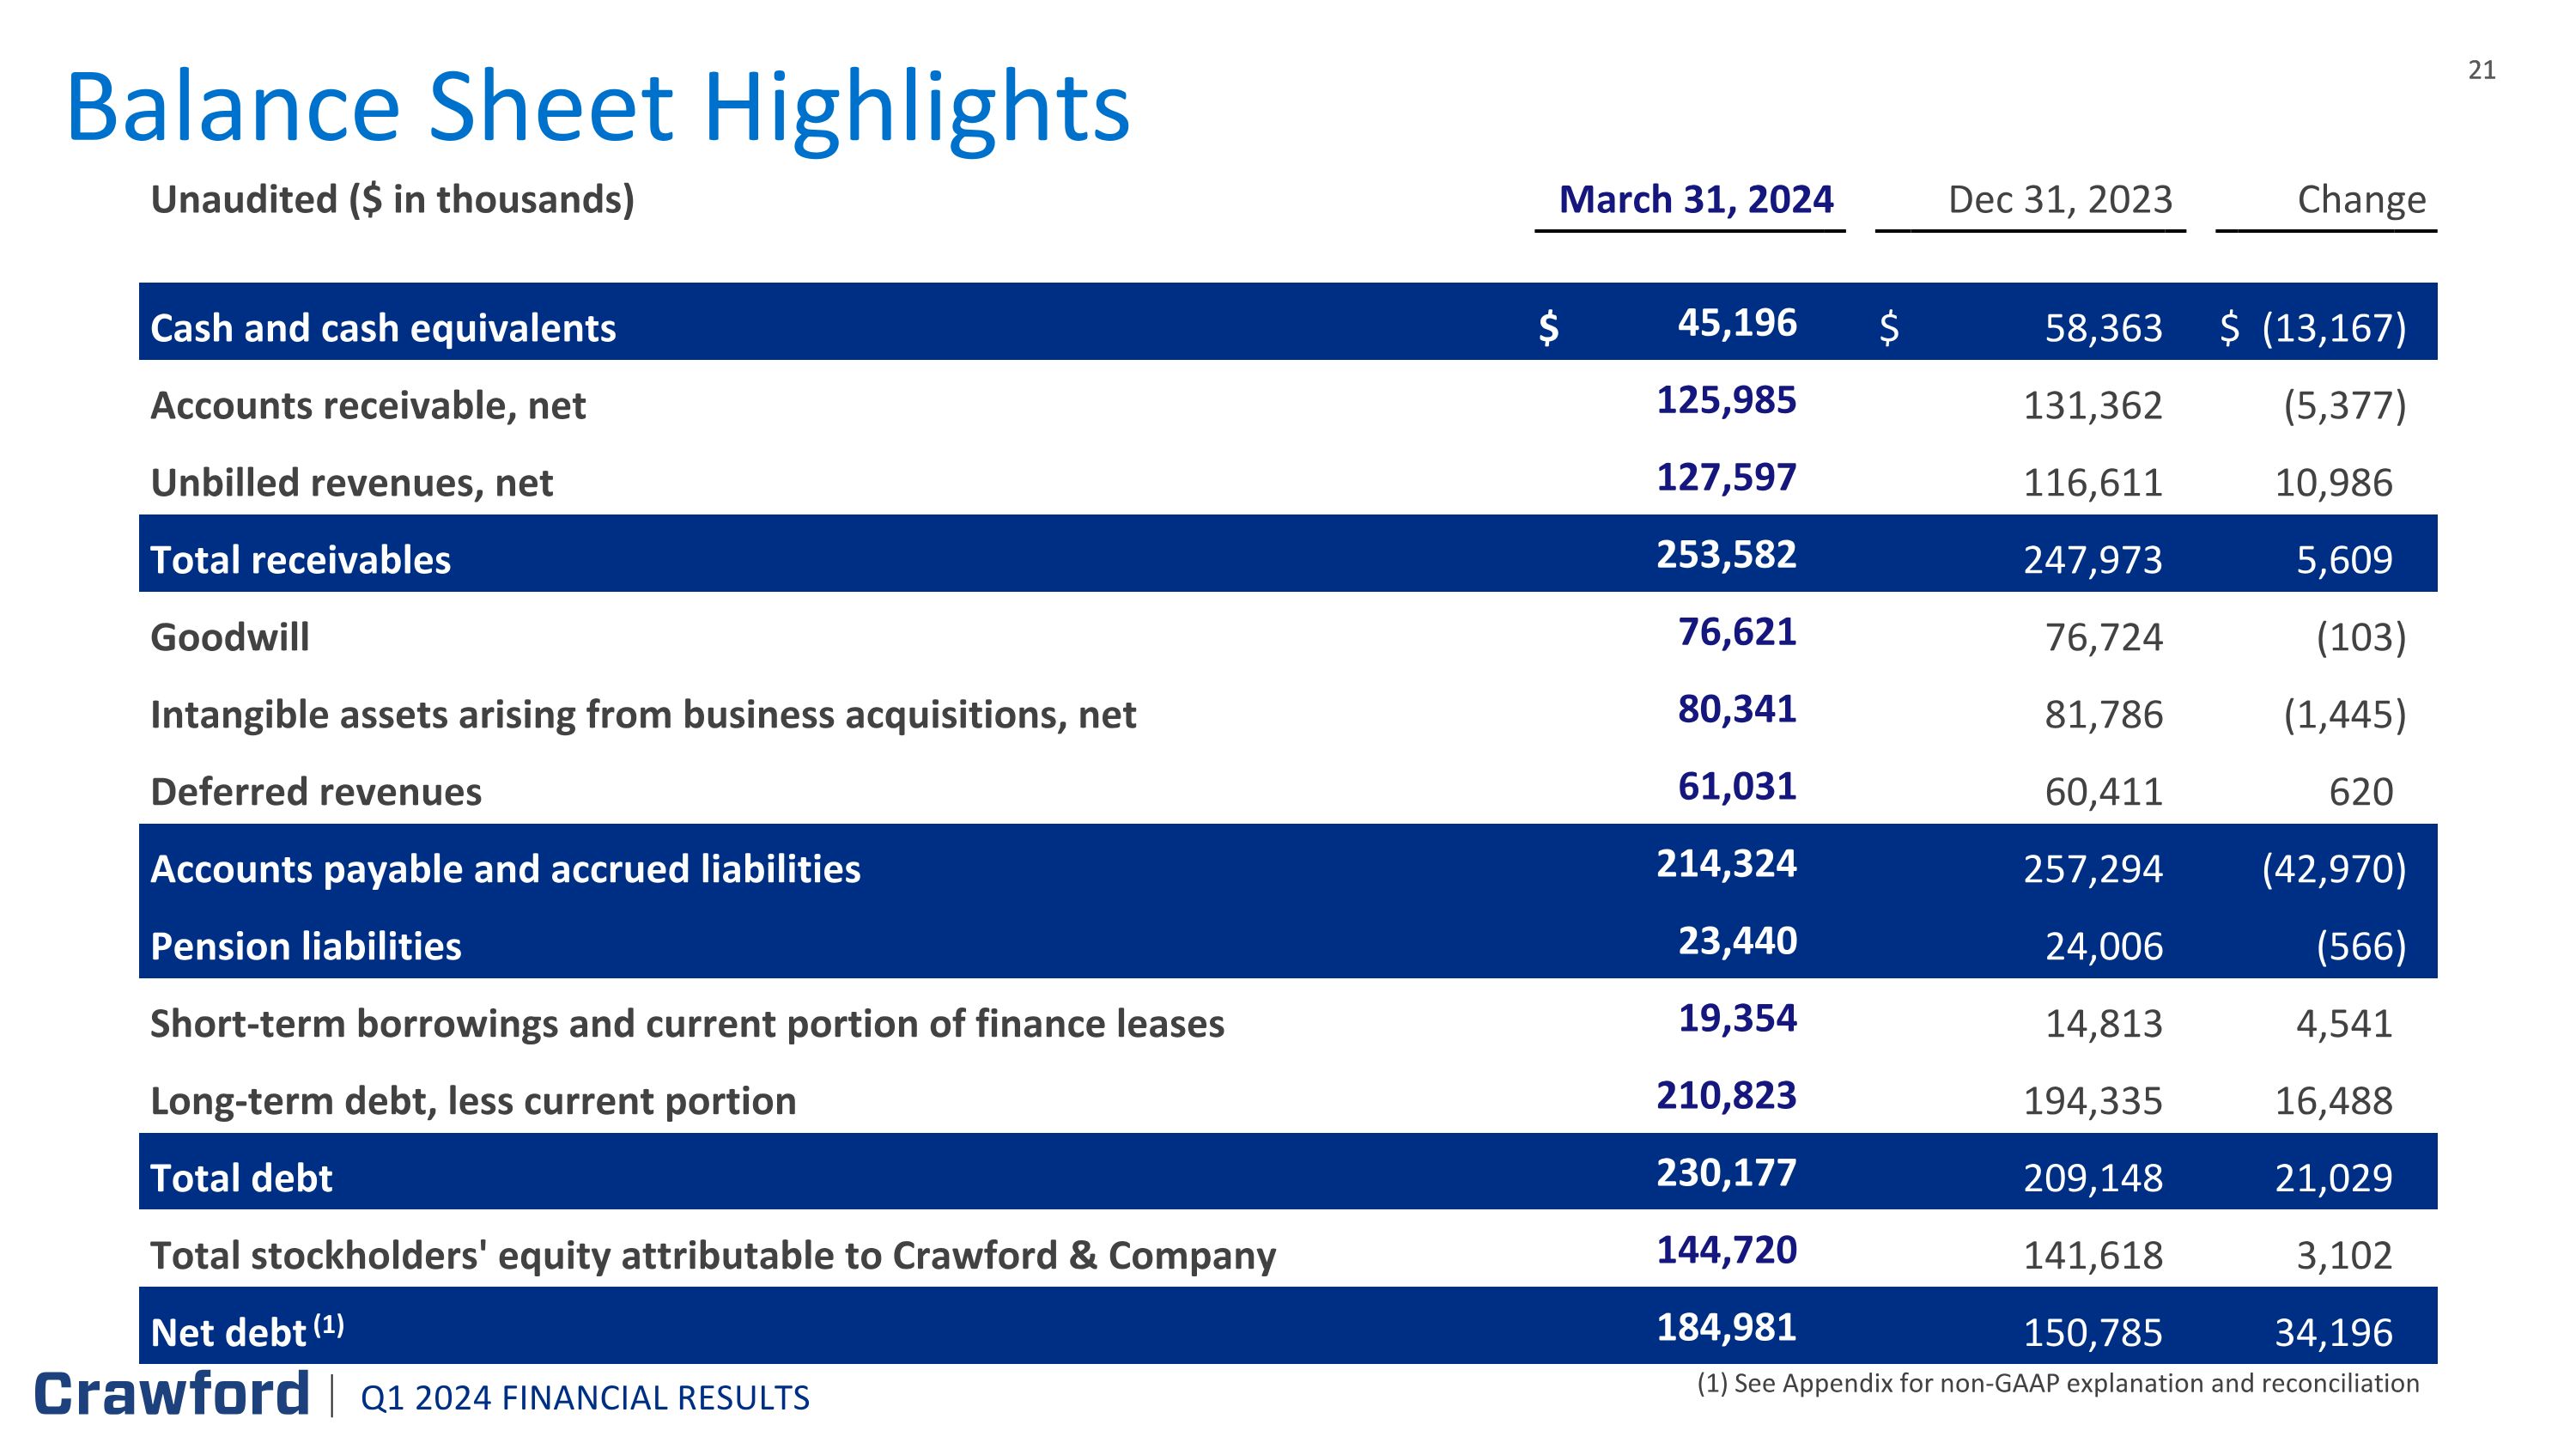
Balance Sheet Highlights (1) See Appendix for non-GAAP explanation and reconciliation Unaudited ($ in thousands) March 31, 2024 December 31, 2019 Dec 31, 2023 December 31, 2018 Change Change Cash and cash equivalents $ 45,196 $ 58,363 $ (13,167 ) Accounts receivable, net 125,985 131,362 (5,377 ) Unbilled revenues, net 127,597 116,611 10,986 Total receivables 253,582 247,973 5,609 Goodwill 76,621 76,724 (103 ) Intangible assets arising from business acquisitions, net 80,341 81,786 (1,445 ) Deferred revenues 61,031 60,411 620 Accounts payable and accrued liabilities 214,324 257,294 (42,970 ) Pension liabilities 23,440 24,006 (566 ) Short-term borrowings and current portion of finance leases 19,354 14,813 4,541 Long-term debt, less current portion 210,823 194,335 16,488 Total debt 230,177 209,148 21,029 Total stockholders' equity attributable to Crawford & Company 144,720 141,618 3,102 Net debt (1) 184,981 150,785 34,196 Q1 2024 FINANCIAL RESULTS
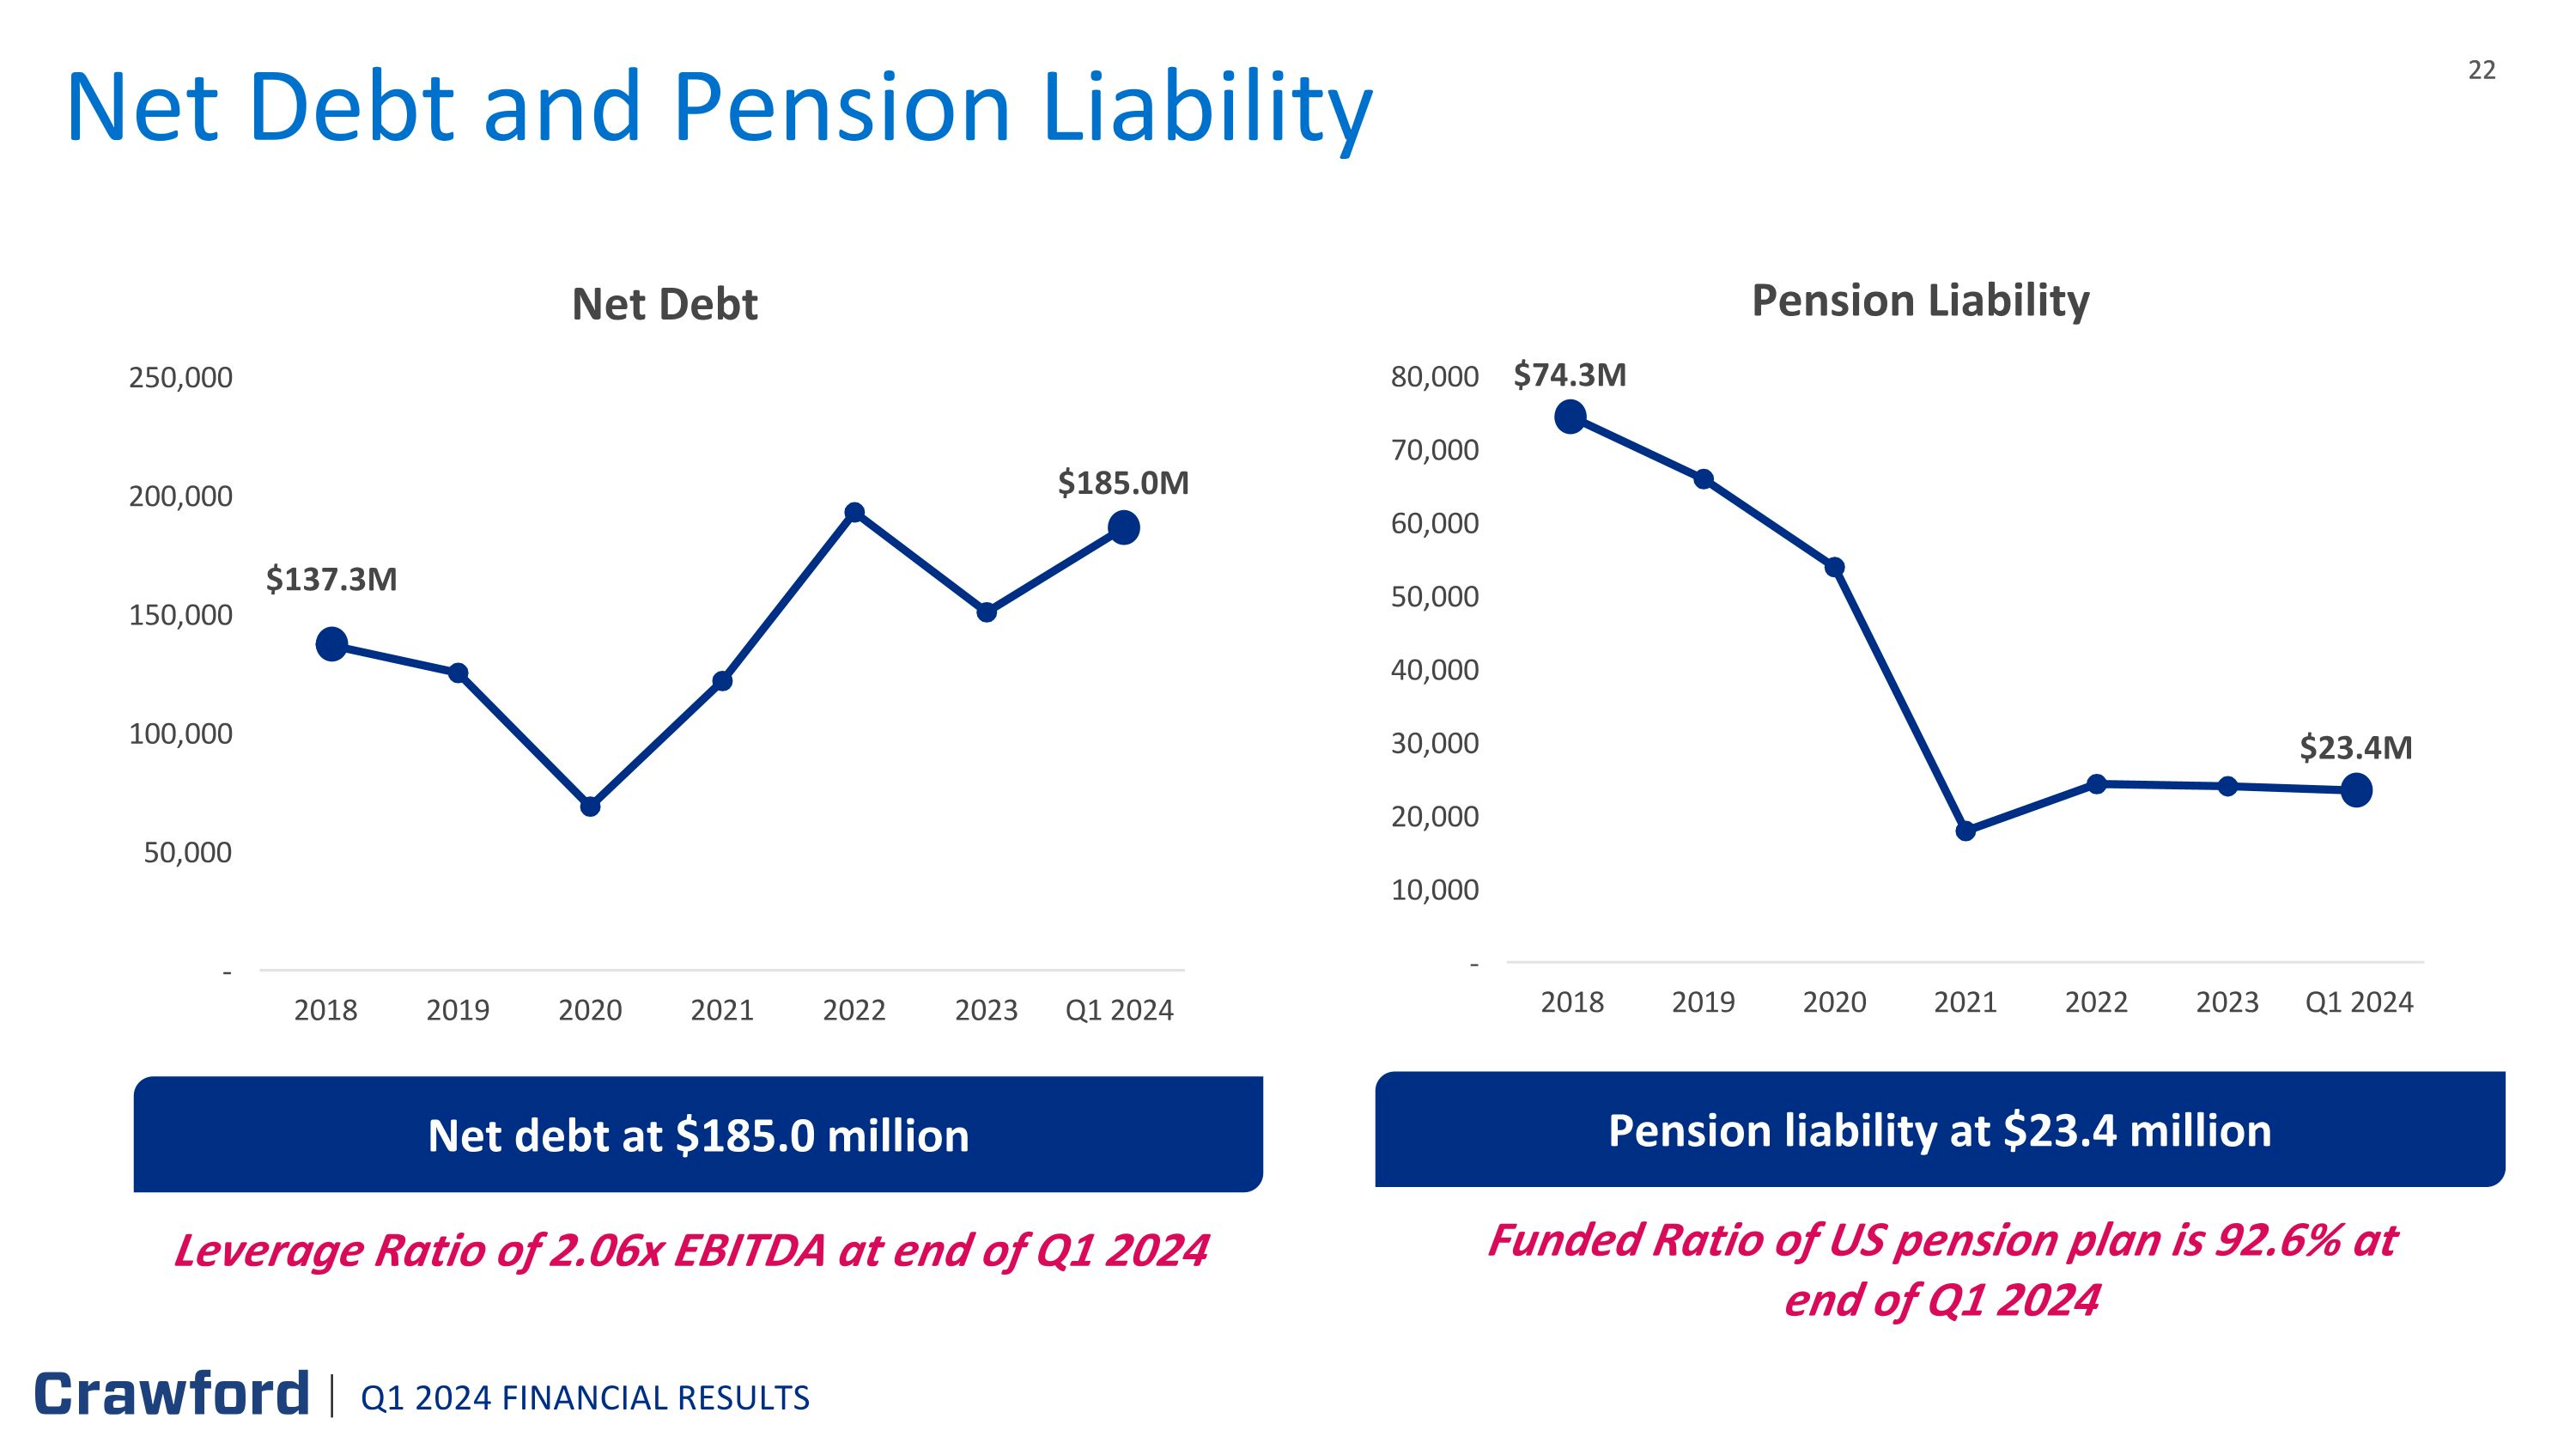
Net Debt and Pension Liability $185.0M Net debt at $185.0 million $137.3M Leverage Ratio of 2.06x EBITDA at end of Q1 2024 $23.4M Pension liability at $23.4 million $74.3M Funded Ratio of US pension plan is 92.6% at end of Q1 2024 Q1 2024 FINANCIAL RESULTS
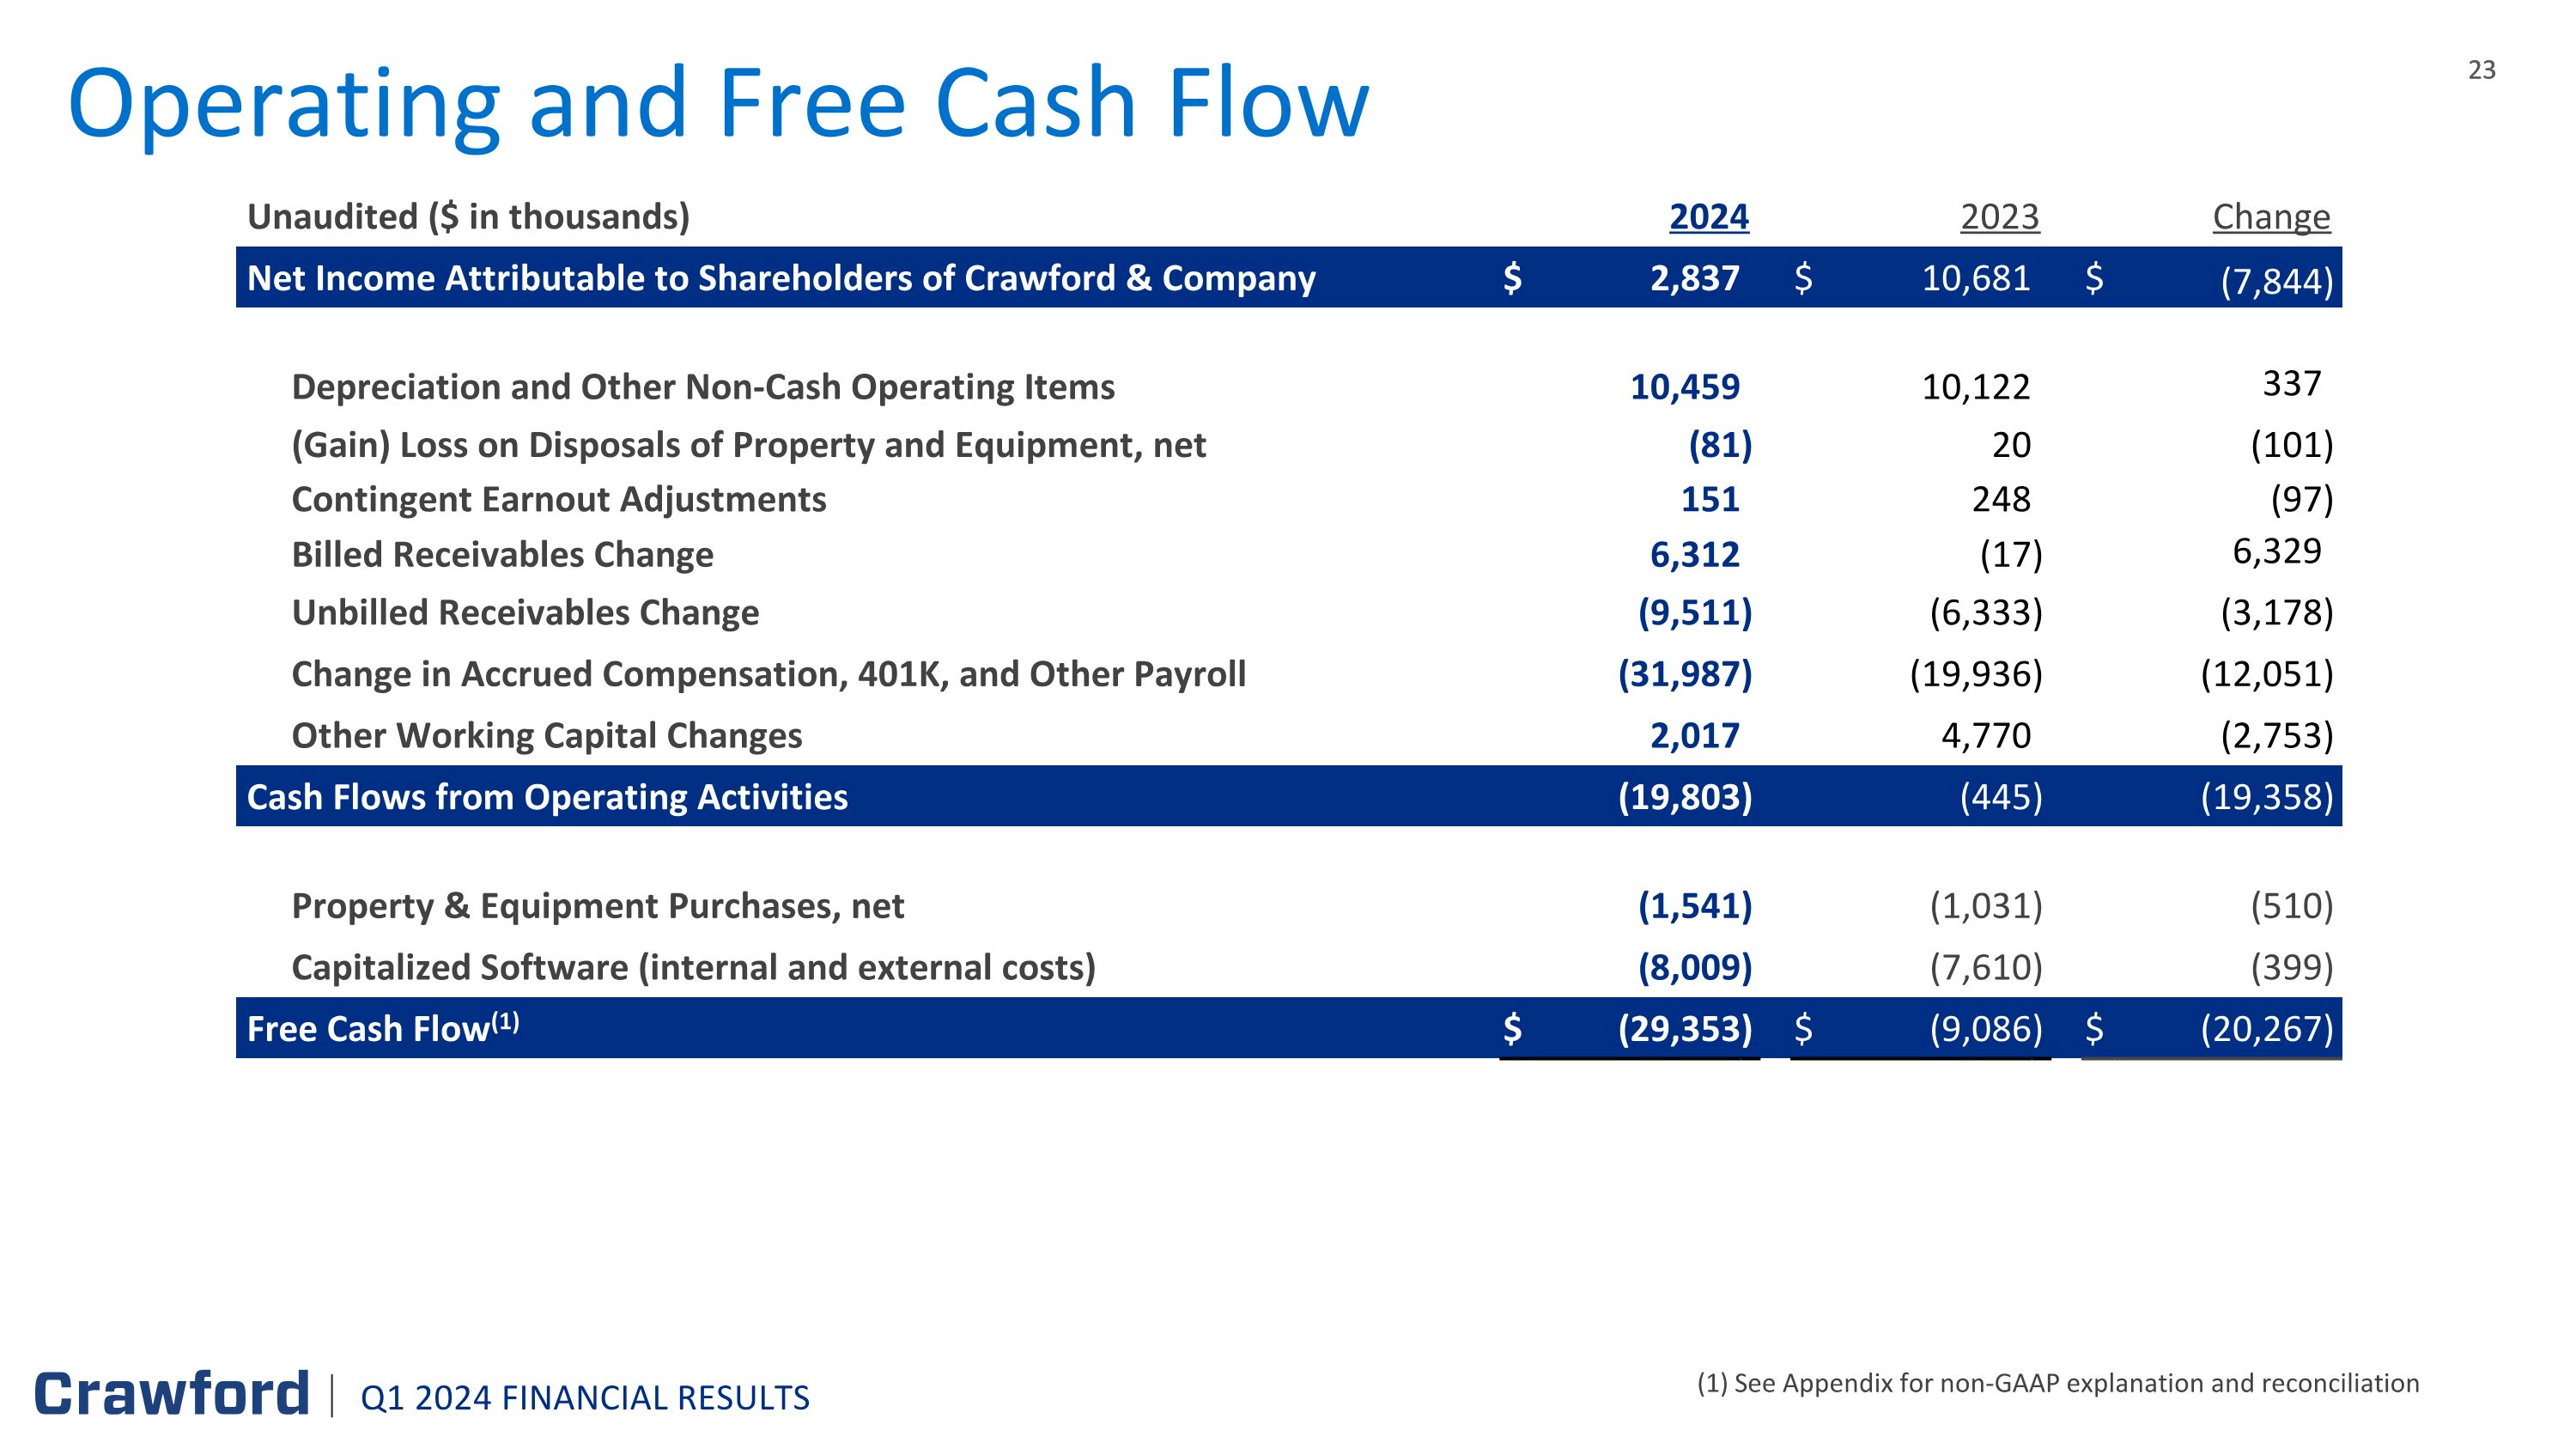
Operating and Free Cash Flow (1) See Appendix for non-GAAP explanation and reconciliation Unaudited ($ in thousands) 2024 2019 2023 2018 Change Change Net Income Attributable to Shareholders of Crawford & Company $ 2,837 $ 10,681 $ (7,844 ) Depreciation and Other Non-Cash Operating Items 10,459 10,122 337 (Gain) Loss on Disposals of Property and Equipment, net (81 ) 20 (101 ) Contingent Earnout Adjustments 151 248 (97 ) Billed Receivables Change 6,312 (17 ) 6,329 Unbilled Receivables Change (9,511 ) (6,333 ) (3,178 ) Change in Accrued Compensation, 401K, and Other Payroll (31,987 ) (19,936 ) (12,051 ) Other Working Capital Changes 2,017 4,770 (2,753 ) Cash Flows from Operating Activities (19,803 ) (445 ) (19,358 ) Property & Equipment Purchases, net (1,541 ) (1,031 ) (510 ) Capitalized Software (internal and external costs) (8,009 ) (7,610 ) (399 ) Free Cash Flow(1) $ (29,353 ) $ (9,086 ) $ (20,267 ) Q1 2024 FINANCIAL RESULTS
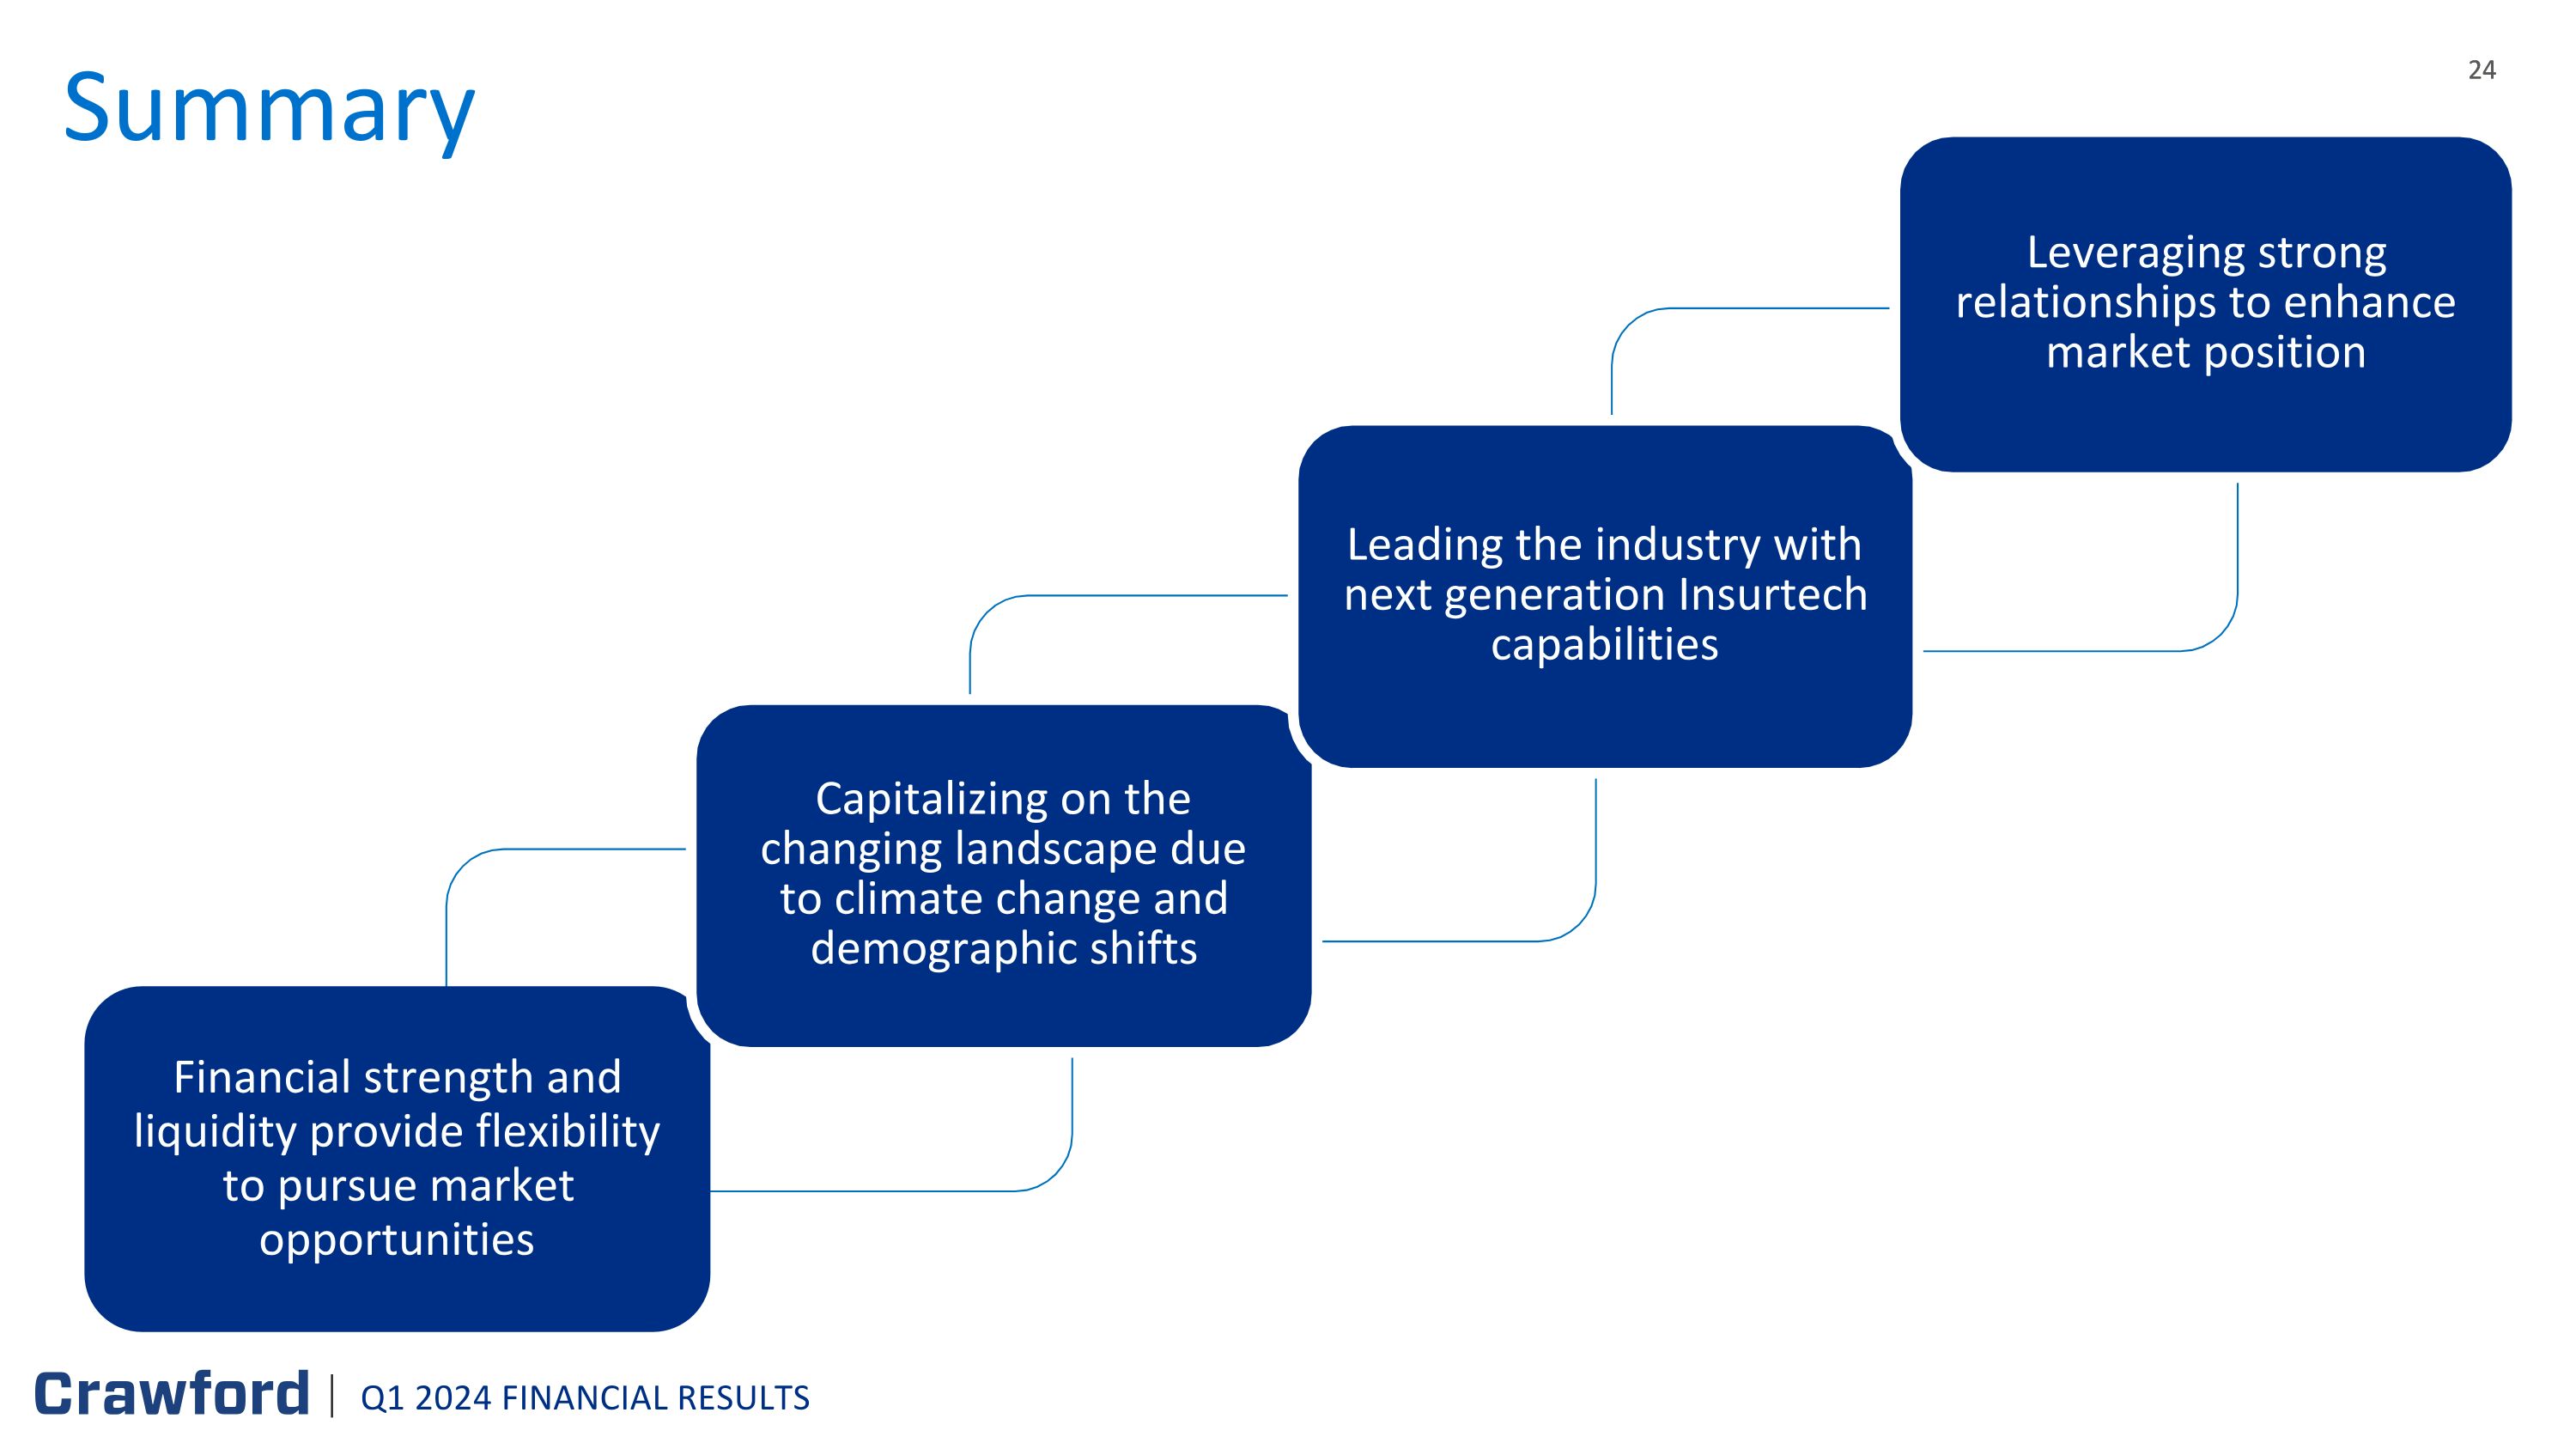
Financial strength and liquidity provide flexibility to pursue market opportunities Capitalizing on the changing landscape due to climate change and demographic shifts Leading the industry with next generation Insurtech capabilities Leveraging strong relationships to enhance market position Summary Q1 2024 FINANCIAL RESULTS

Appendix: Non-GAAP Financial Information Q1 2024 FINANCIAL RESULTS 25
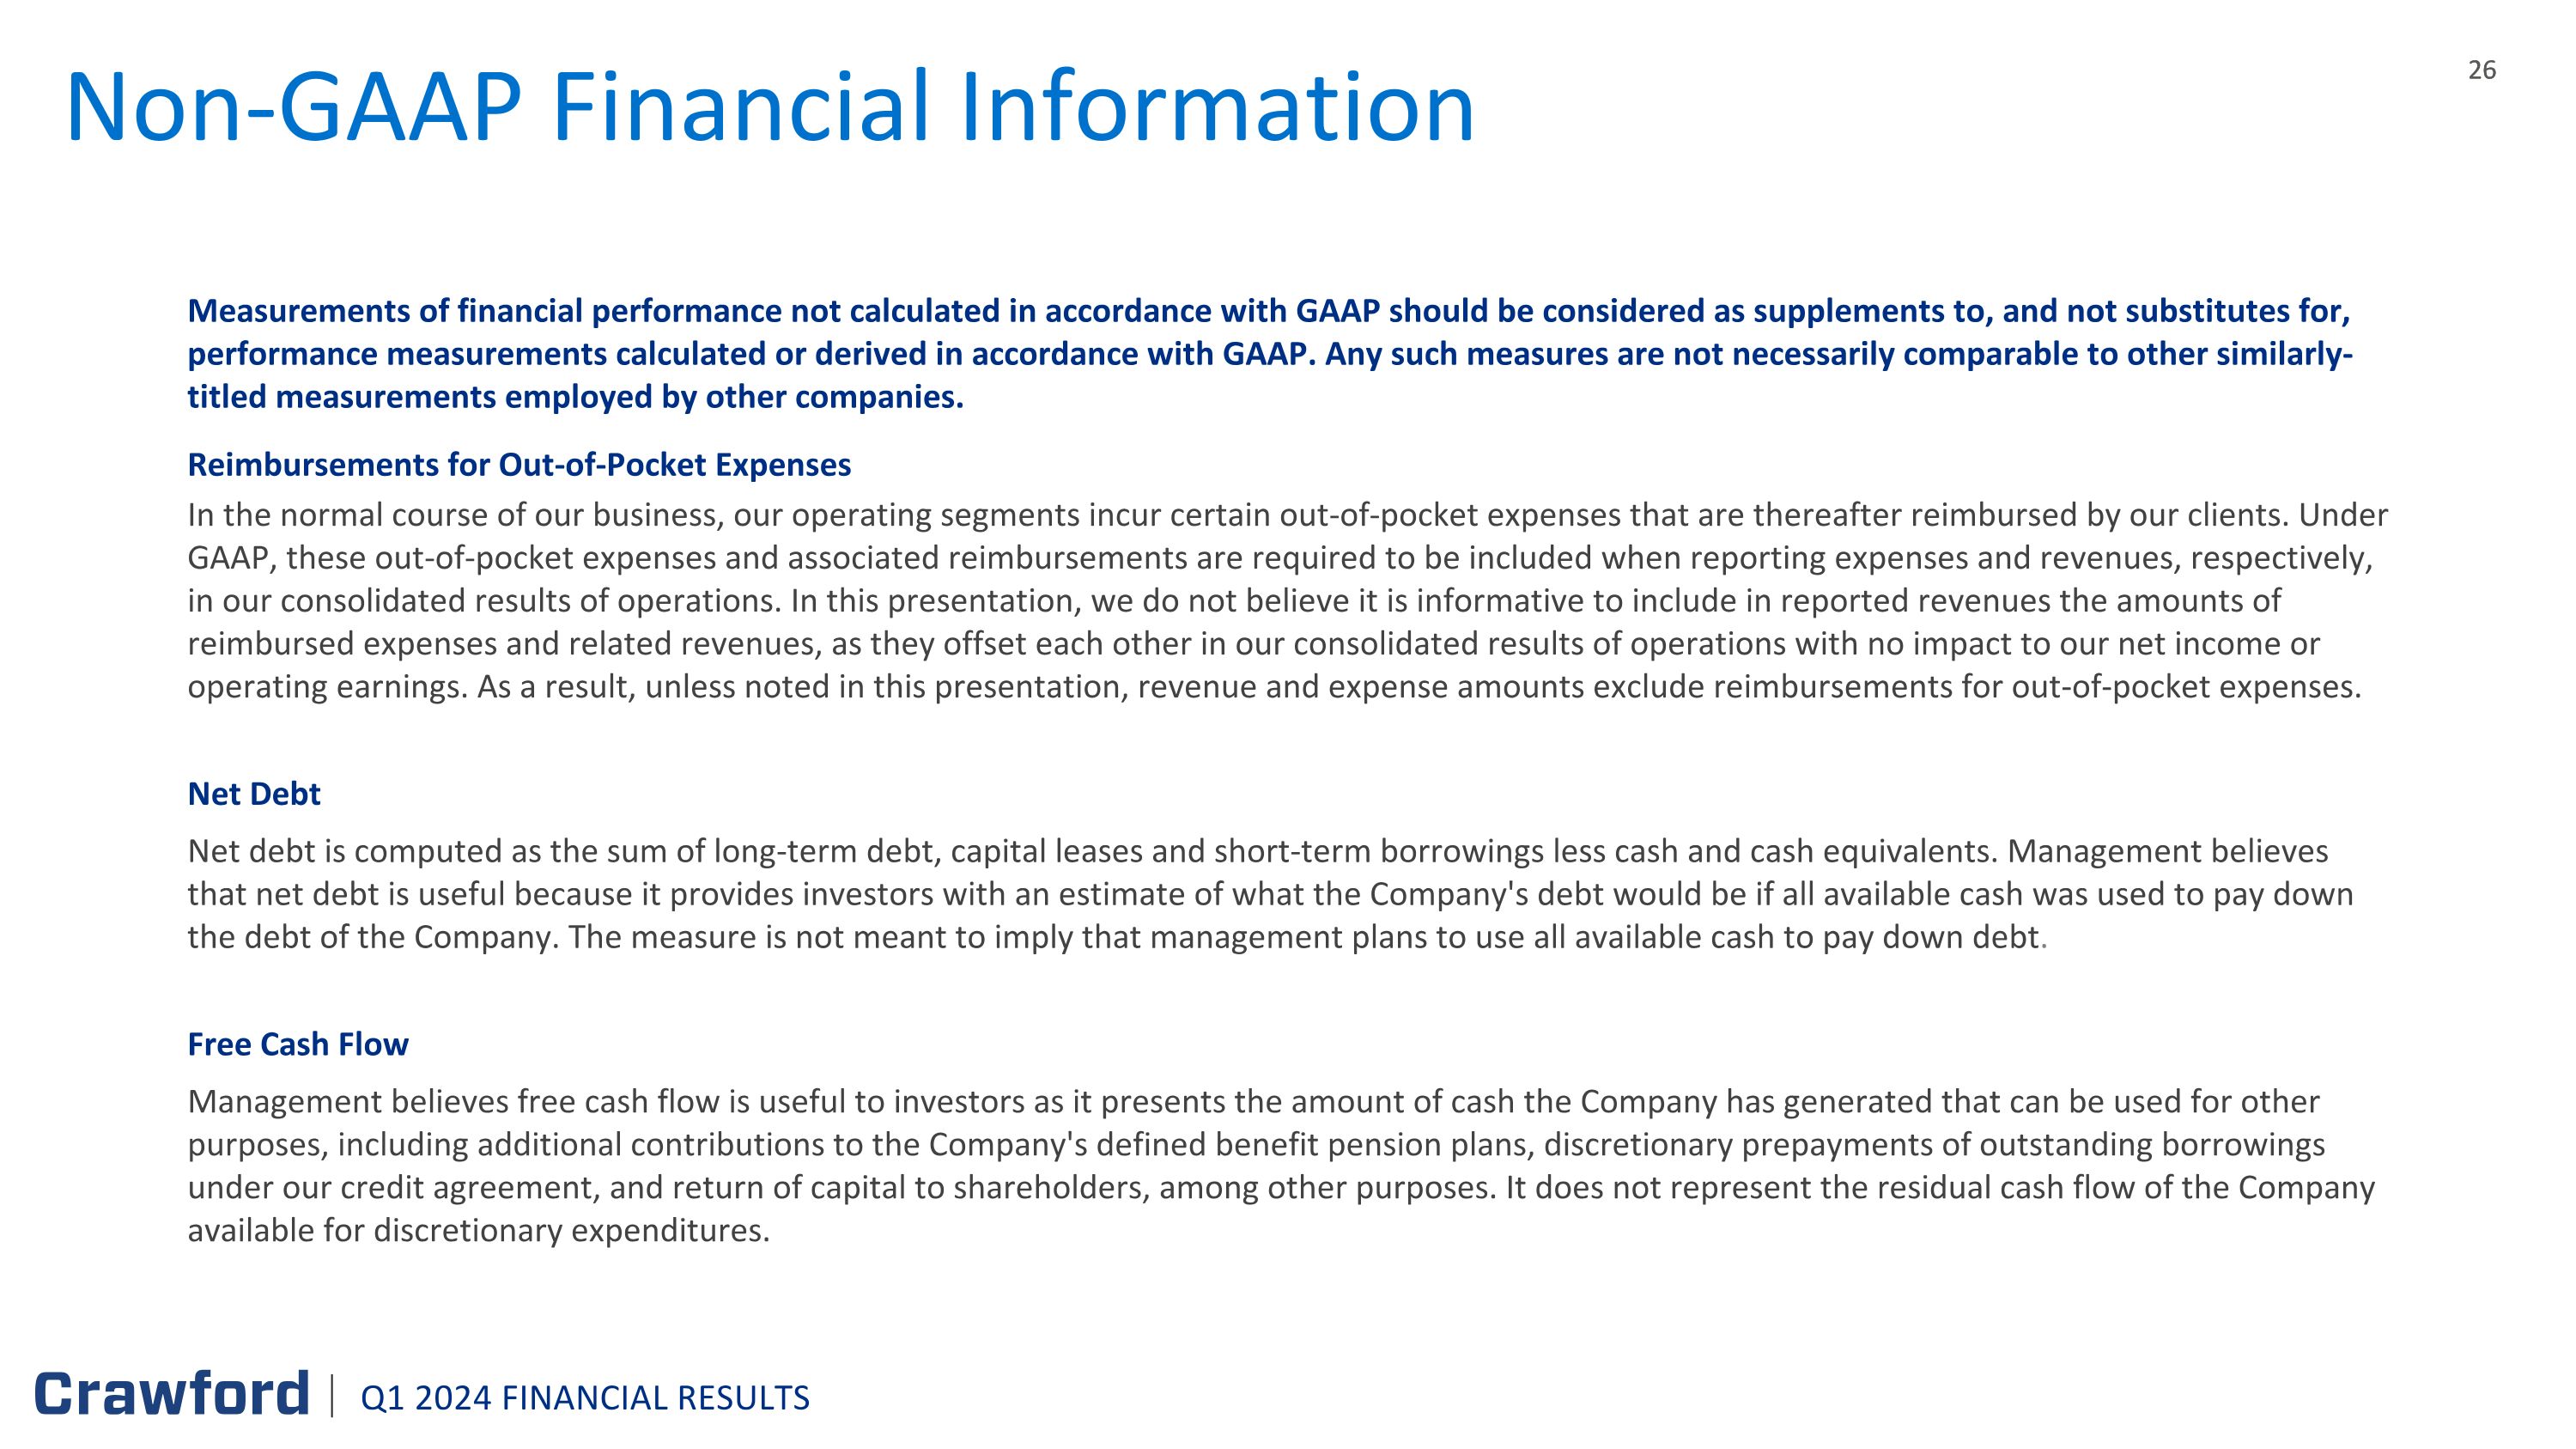
Non-GAAP Financial Information Measurements of financial performance not calculated in accordance with GAAP should be considered as supplements to, and not substitutes for, performance measurements calculated or derived in accordance with GAAP. Any such measures are not necessarily comparable to other similarly-titled measurements employed by other companies. Reimbursements for Out-of-Pocket Expenses In the normal course of our business, our operating segments incur certain out-of-pocket expenses that are thereafter reimbursed by our clients. Under GAAP, these out-of-pocket expenses and associated reimbursements are required to be included when reporting expenses and revenues, respectively, in our consolidated results of operations. In this presentation, we do not believe it is informative to include in reported revenues the amounts of reimbursed expenses and related revenues, as they offset each other in our consolidated results of operations with no impact to our net income or operating earnings. As a result, unless noted in this presentation, revenue and expense amounts exclude reimbursements for out-of-pocket expenses. Net Debt Net debt is computed as the sum of long-term debt, capital leases and short-term borrowings less cash and cash equivalents. Management believes that net debt is useful because it provides investors with an estimate of what the Company's debt would be if all available cash was used to pay down the debt of the Company. The measure is not meant to imply that management plans to use all available cash to pay down debt. Free Cash Flow Management believes free cash flow is useful to investors as it presents the amount of cash the Company has generated that can be used for other purposes, including additional contributions to the Company's defined benefit pension plans, discretionary prepayments of outstanding borrowings under our credit agreement, and return of capital to shareholders, among other purposes. It does not represent the residual cash flow of the Company available for discretionary expenditures. Q1 2024 FINANCIAL RESULTS
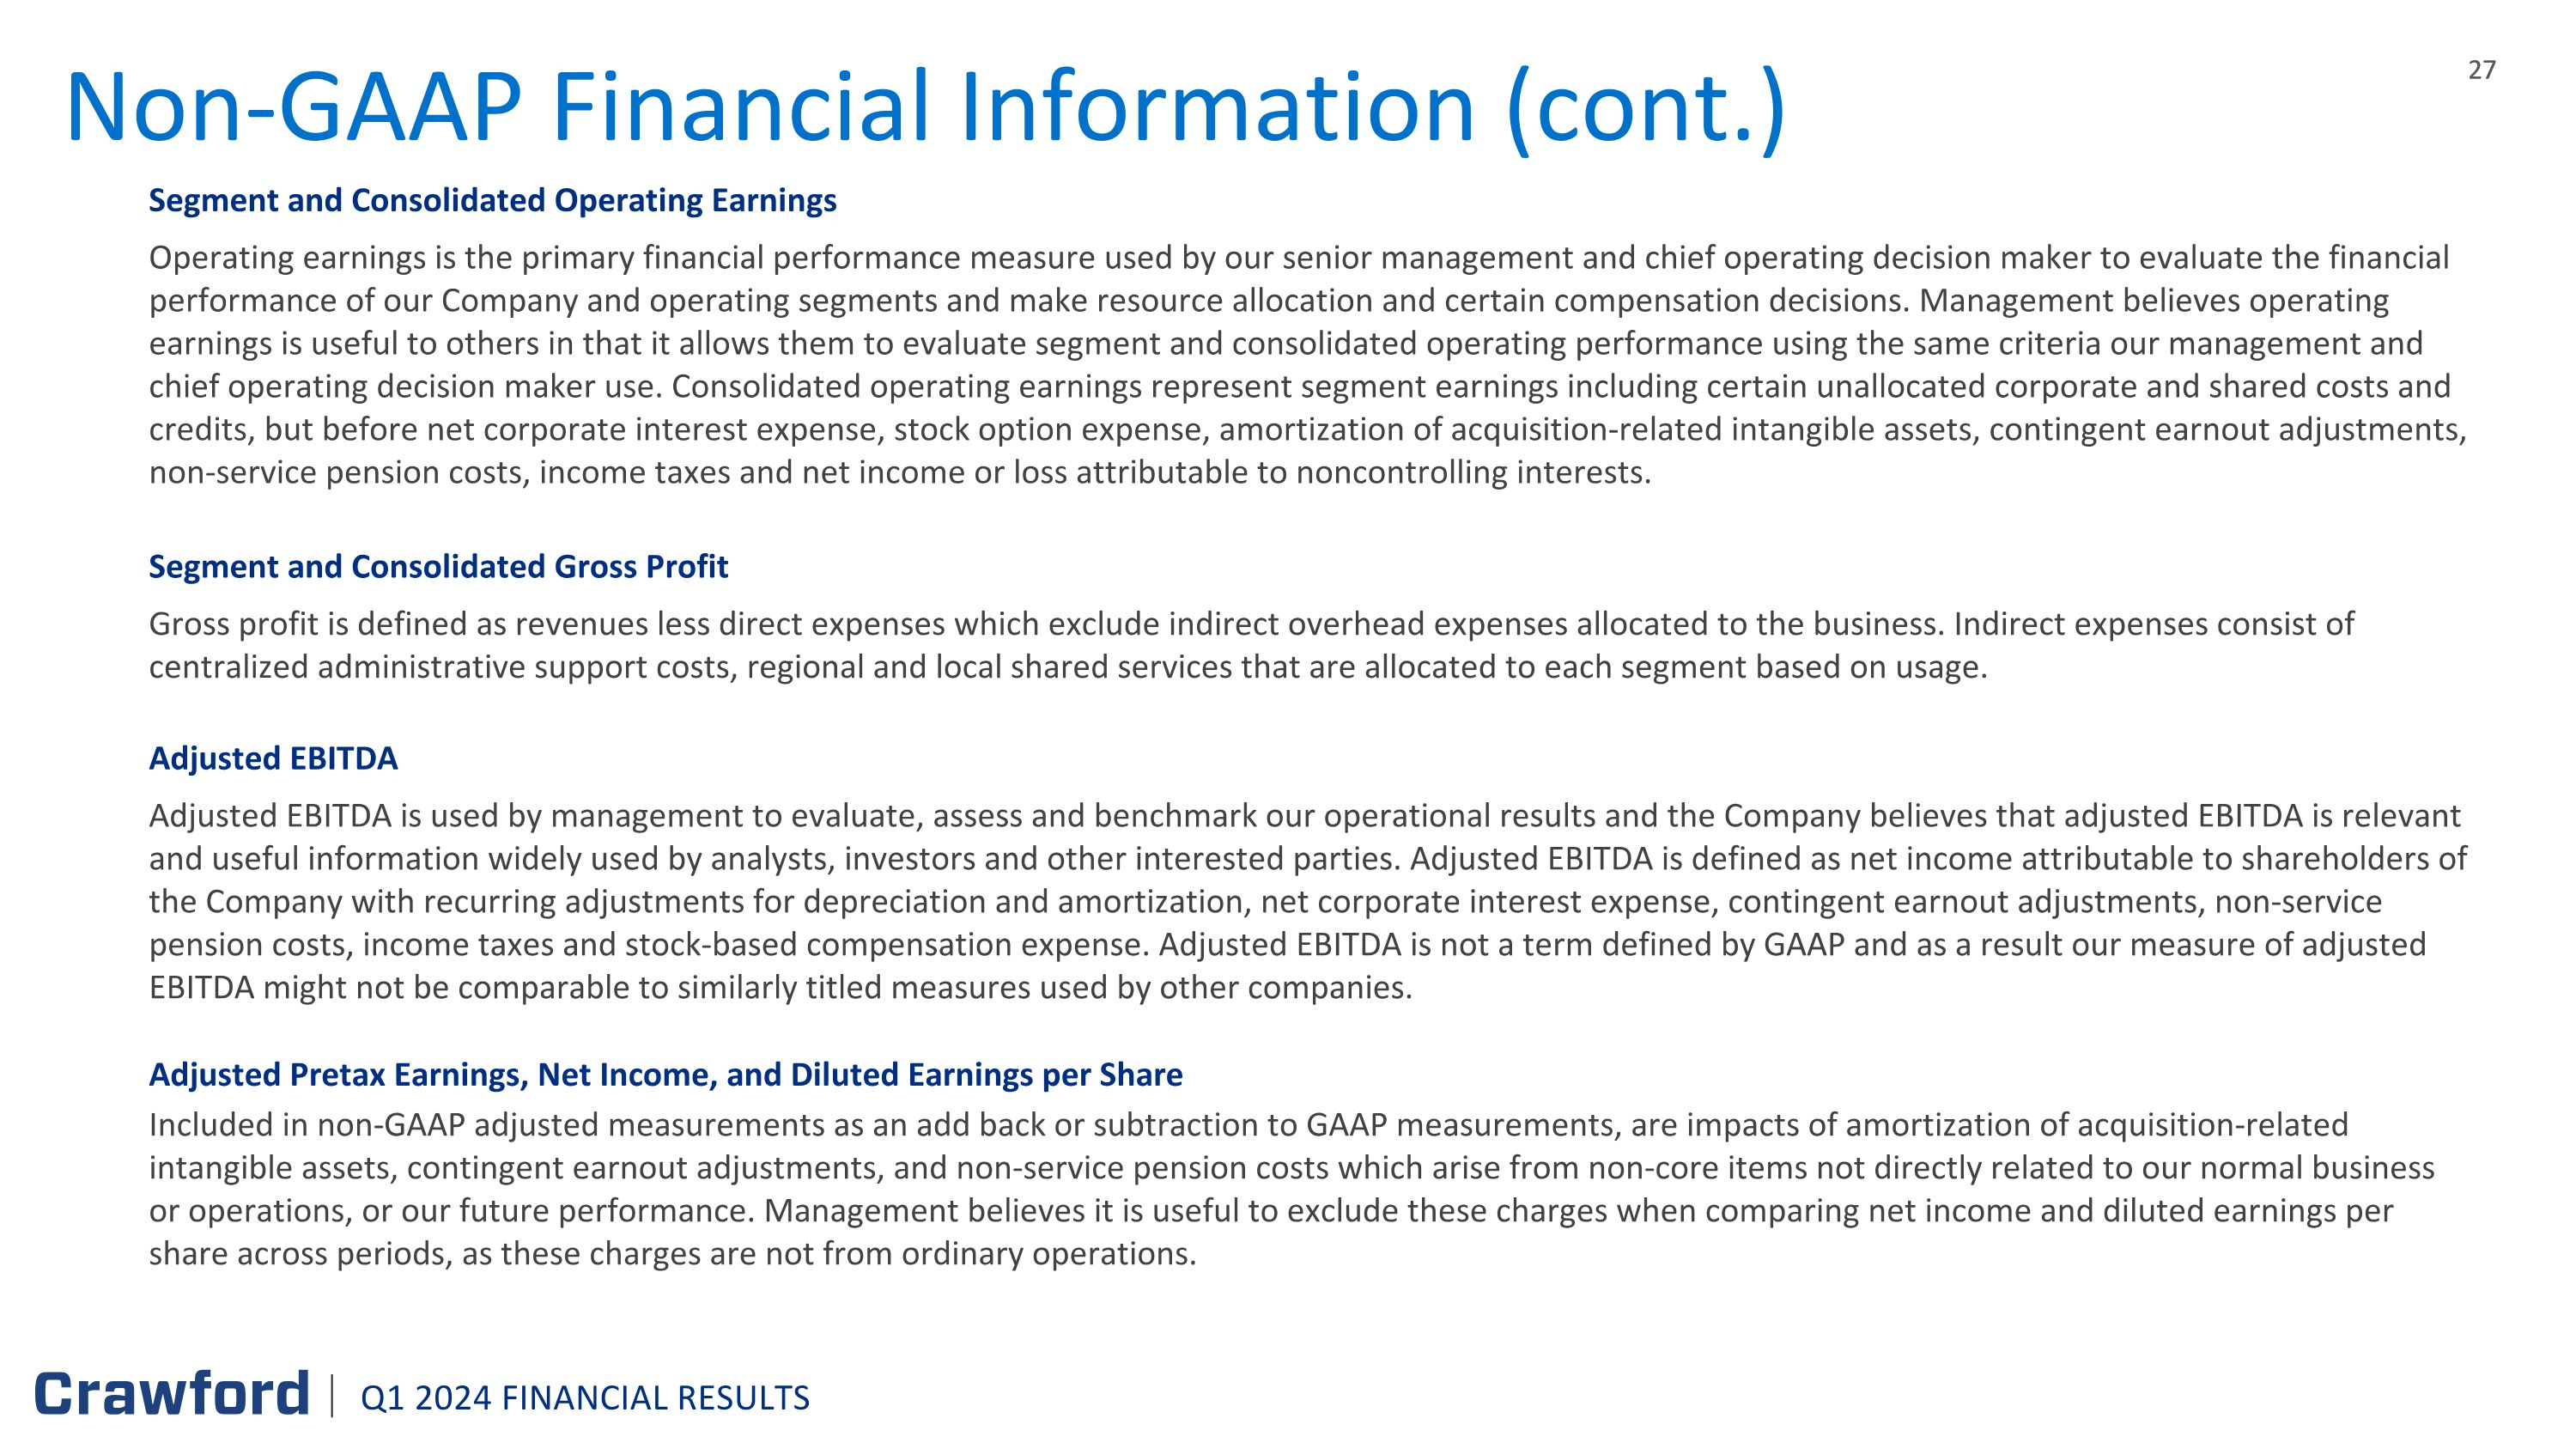
Non-GAAP Financial Information (cont.) Segment and Consolidated Operating Earnings Operating earnings is the primary financial performance measure used by our senior management and chief operating decision maker to evaluate the financial performance of our Company and operating segments and make resource allocation and certain compensation decisions. Management believes operating earnings is useful to others in that it allows them to evaluate segment and consolidated operating performance using the same criteria our management and chief operating decision maker use. Consolidated operating earnings represent segment earnings including certain unallocated corporate and shared costs and credits, but before net corporate interest expense, stock option expense, amortization of acquisition-related intangible assets, contingent earnout adjustments, non-service pension costs, income taxes and net income or loss attributable to noncontrolling interests. Segment and Consolidated Gross Profit Gross profit is defined as revenues less direct expenses which exclude indirect overhead expenses allocated to the business. Indirect expenses consist of centralized administrative support costs, regional and local shared services that are allocated to each segment based on usage. Adjusted EBITDA Adjusted EBITDA is used by management to evaluate, assess and benchmark our operational results and the Company believes that adjusted EBITDA is relevant and useful information widely used by analysts, investors and other interested parties. Adjusted EBITDA is defined as net income attributable to shareholders of the Company with recurring adjustments for depreciation and amortization, net corporate interest expense, contingent earnout adjustments, non-service pension costs, income taxes and stock-based compensation expense. Adjusted EBITDA is not a term defined by GAAP and as a result our measure of adjusted EBITDA might not be comparable to similarly titled measures used by other companies. Adjusted Pretax Earnings, Net Income, and Diluted Earnings per Share Included in non-GAAP adjusted measurements as an add back or subtraction to GAAP measurements, are impacts of amortization of acquisition-related intangible assets, contingent earnout adjustments, and non-service pension costs which arise from non-core items not directly related to our normal business or operations, or our future performance. Management believes it is useful to exclude these charges when comparing net income and diluted earnings per share across periods, as these charges are not from ordinary operations. Q1 2024 FINANCIAL RESULTS
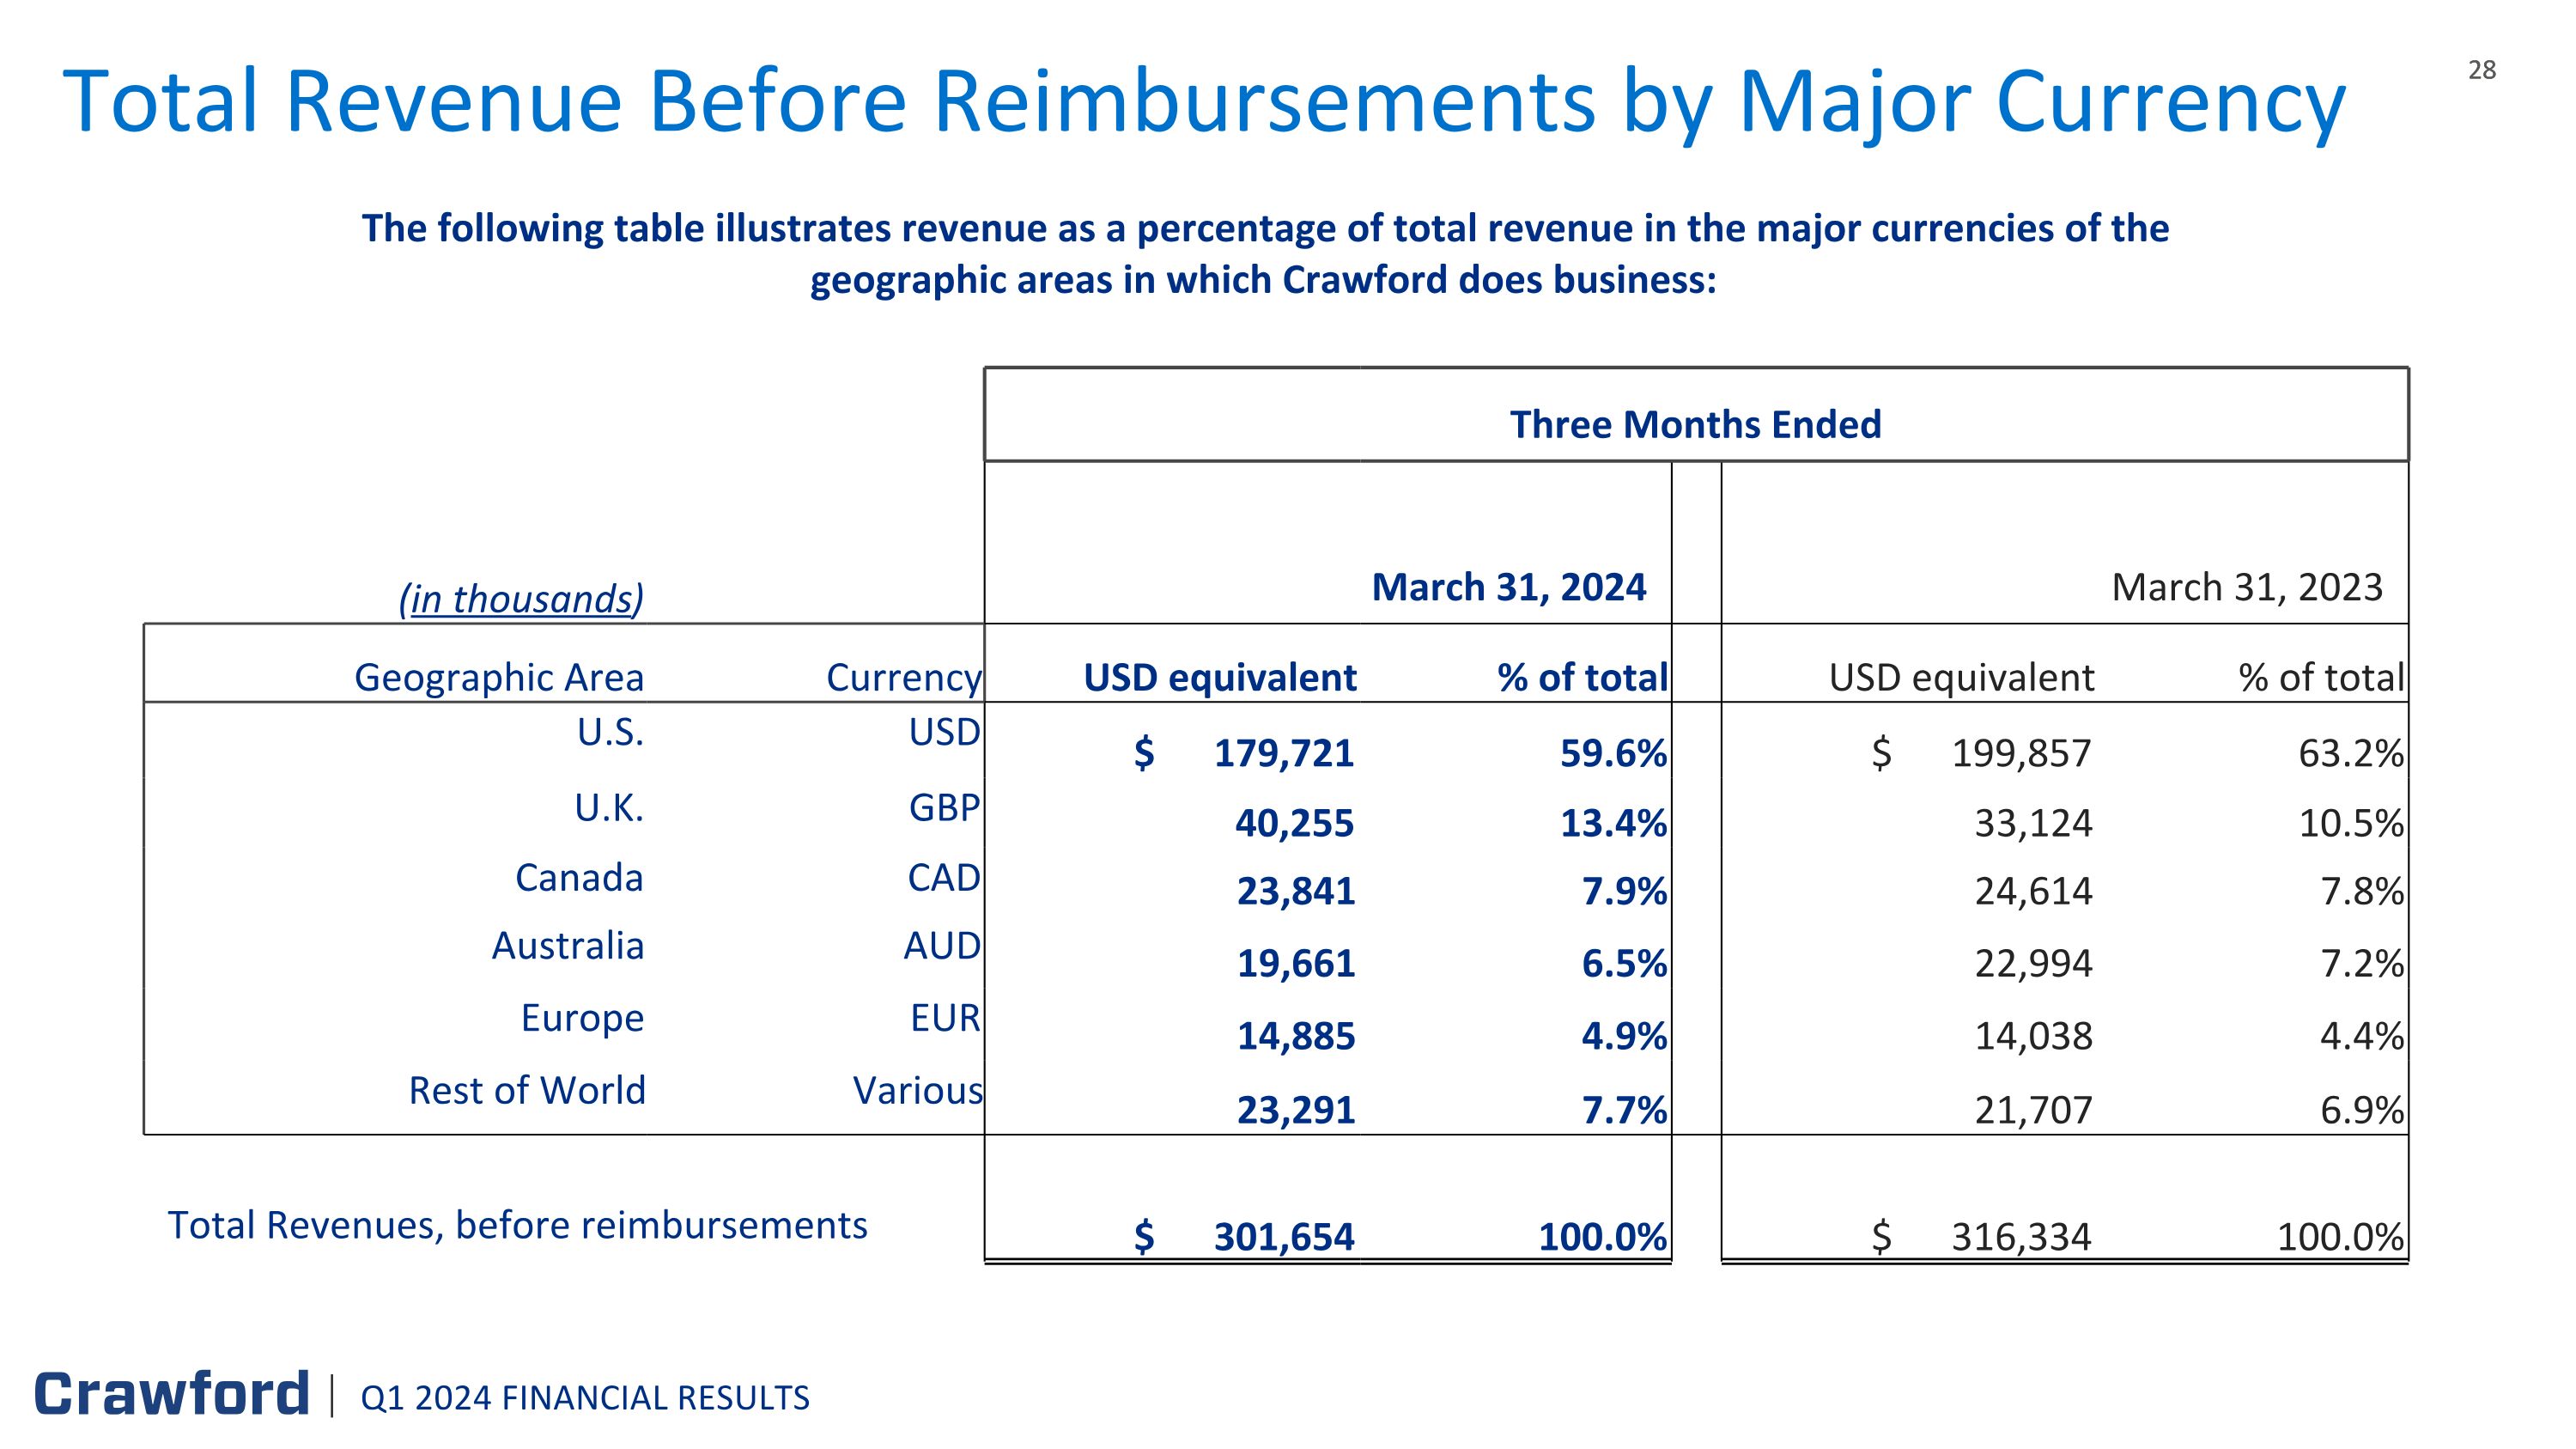
The following table illustrates revenue as a percentage of total revenue in the major currencies of the geographic areas in which Crawford does business: Total Revenue Before Reimbursements by Major Currency Three Months Ended (in thousands) March 31, 2024 March 31, 2023 Geographic Area Currency USD equivalent % of total USD equivalent % of total U.S. USD $ 179,721 59.6% $ 199,857 63.2% U.K. GBP 40,255 13.4% 33,124 10.5% Canada CAD 23,841 7.9% 24,614 7.8% Australia AUD 19,661 6.5% 22,994 7.2% Europe EUR 14,885 4.9% 14,038 4.4% Rest of World Various 23,291 7.7% 21,707 6.9% Total Revenues, before reimbursements $ 301,654 100.0% $ 316,334 100.0% Q1 2024 FINANCIAL RESULTS
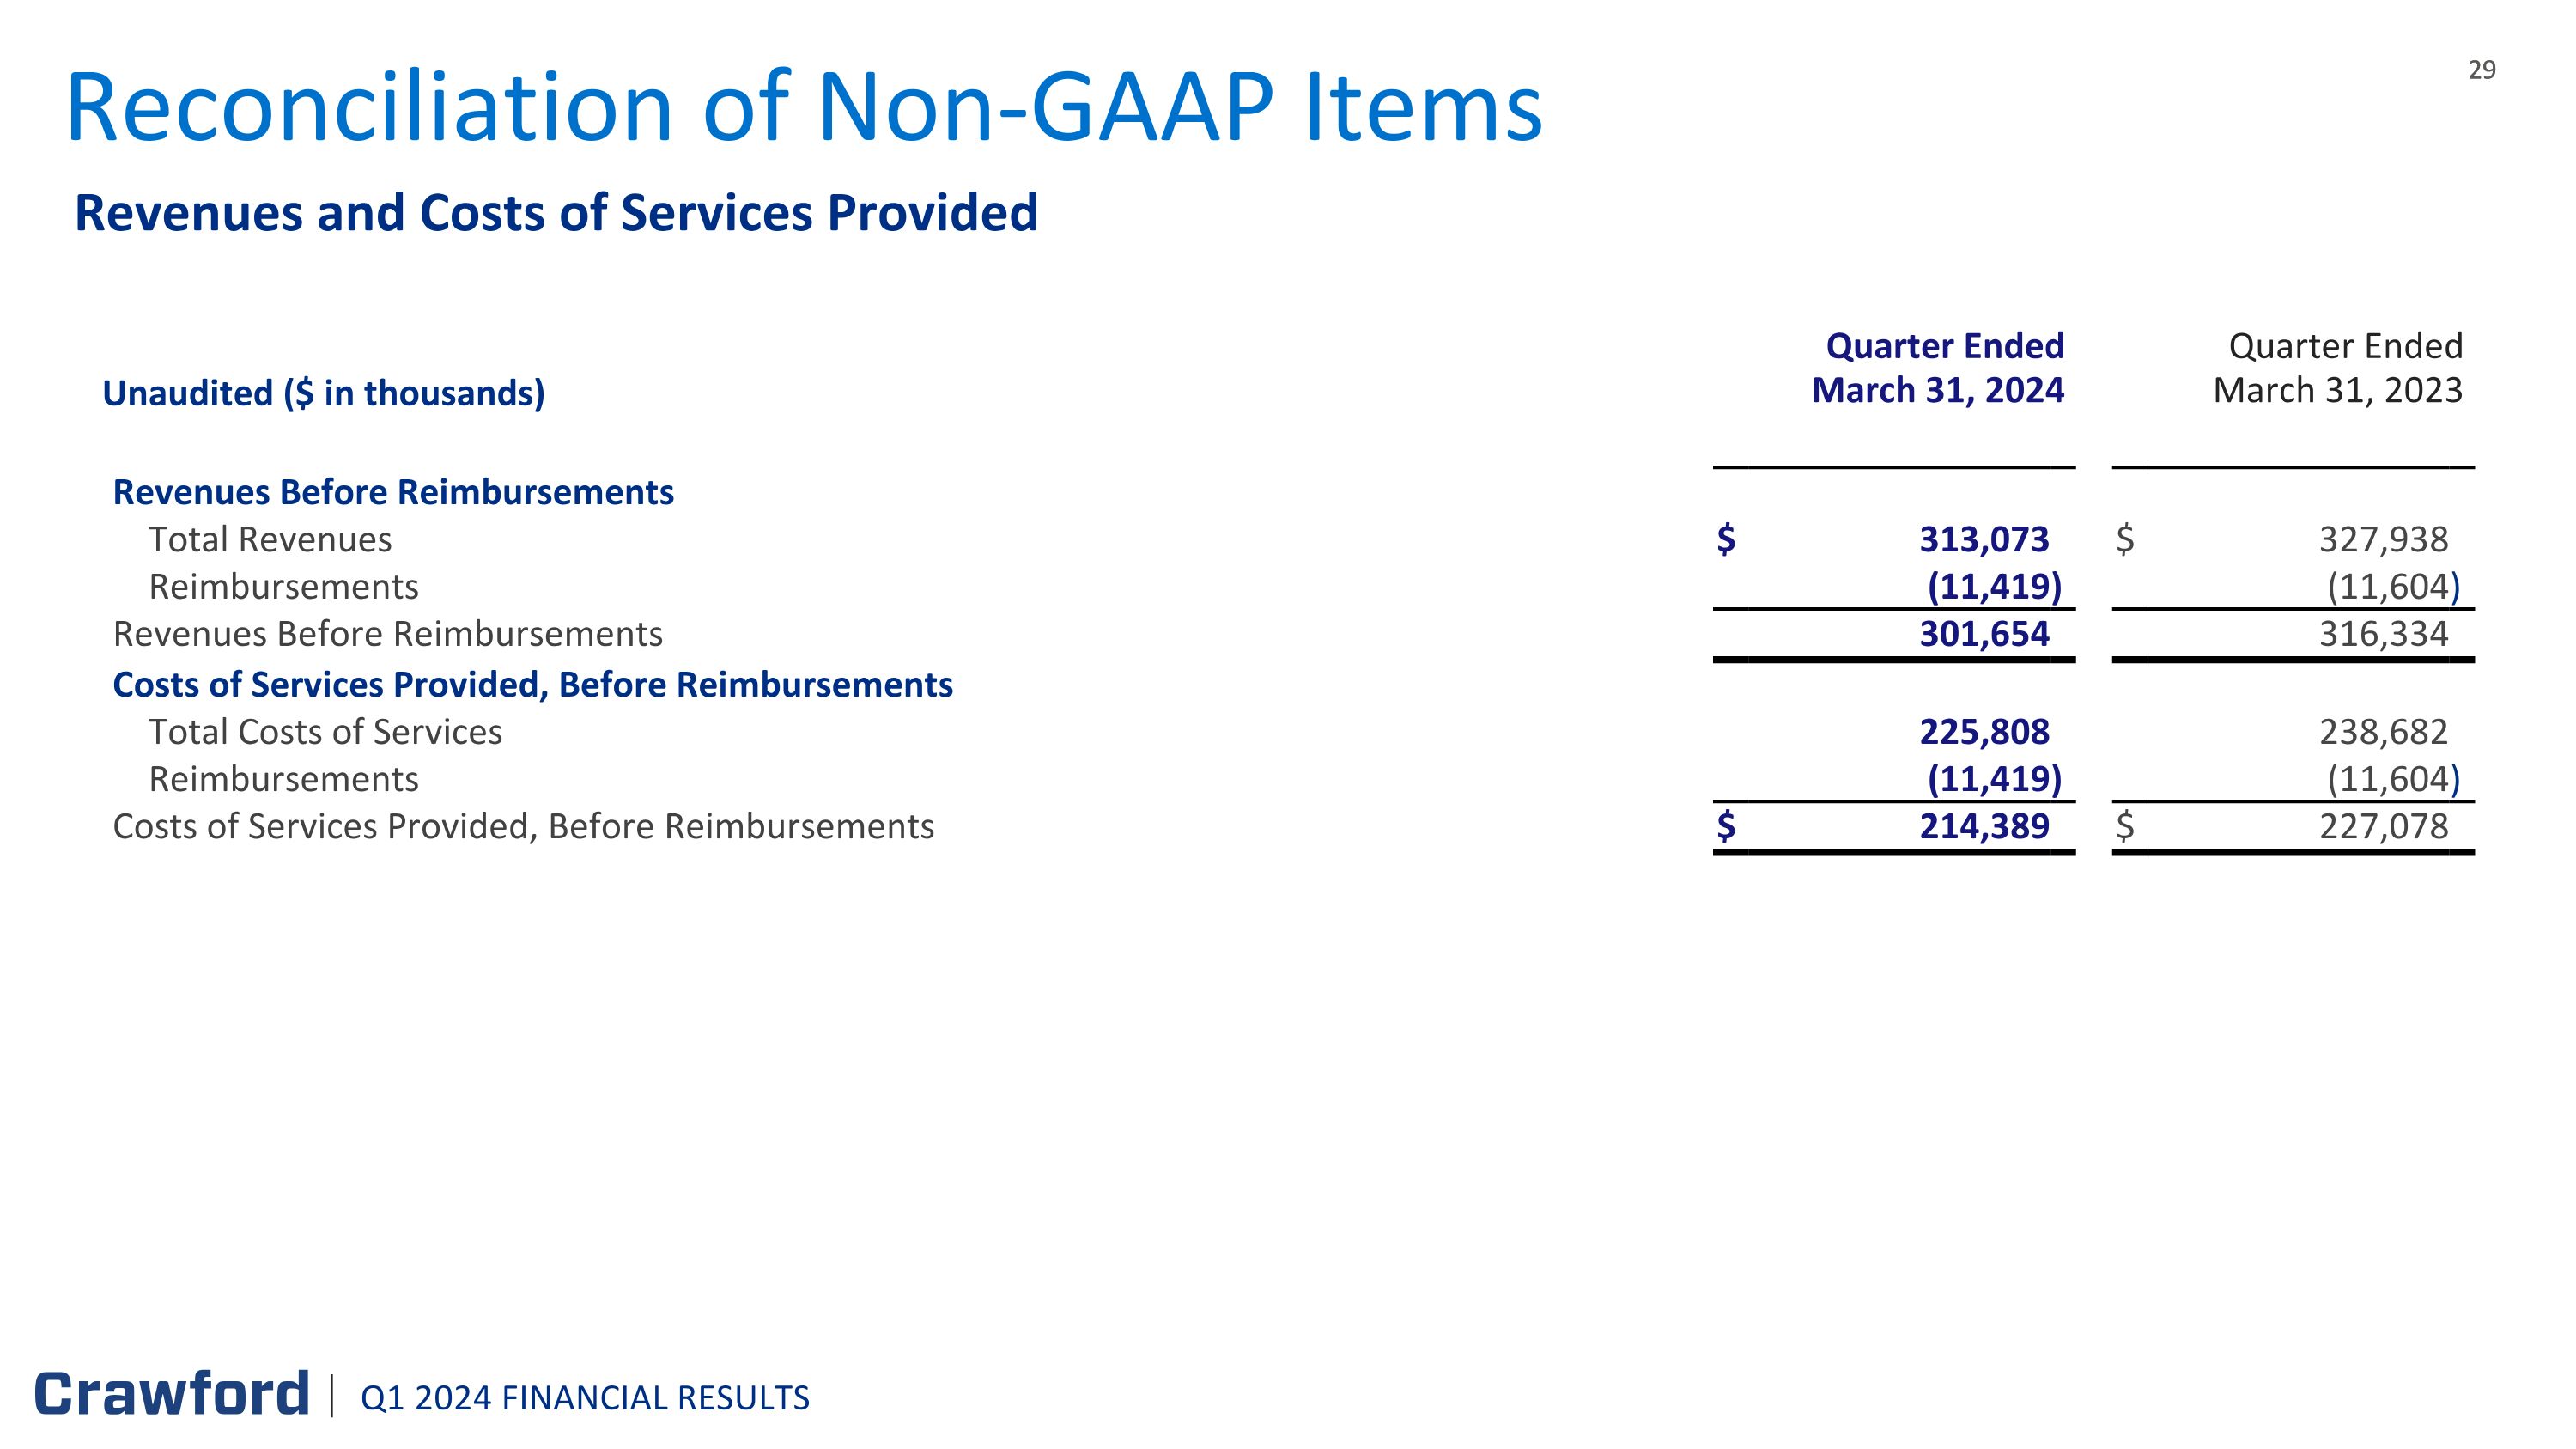
Revenues and Costs of Services Provided Reconciliation of Non-GAAP Items Quarter Ended Quarter Ended Quarter Ended Quarter Ended Unaudited ($ in thousands) March 31, 2024 December 31, March 31, 2023 December 31, 2019 2018 Revenues Before Reimbursements Total Revenues $ 313,073 $ 327,938 Reimbursements (11,419 ) (11,604 ) Revenues Before Reimbursements 301,654 316,334 Costs of Services Provided, Before Reimbursements Total Costs of Services 225,808 238,682 Reimbursements (11,419 ) (11,604 ) Costs of Services Provided, Before Reimbursements $ 214,389 $ 227,078 Q1 2024 FINANCIAL RESULTS
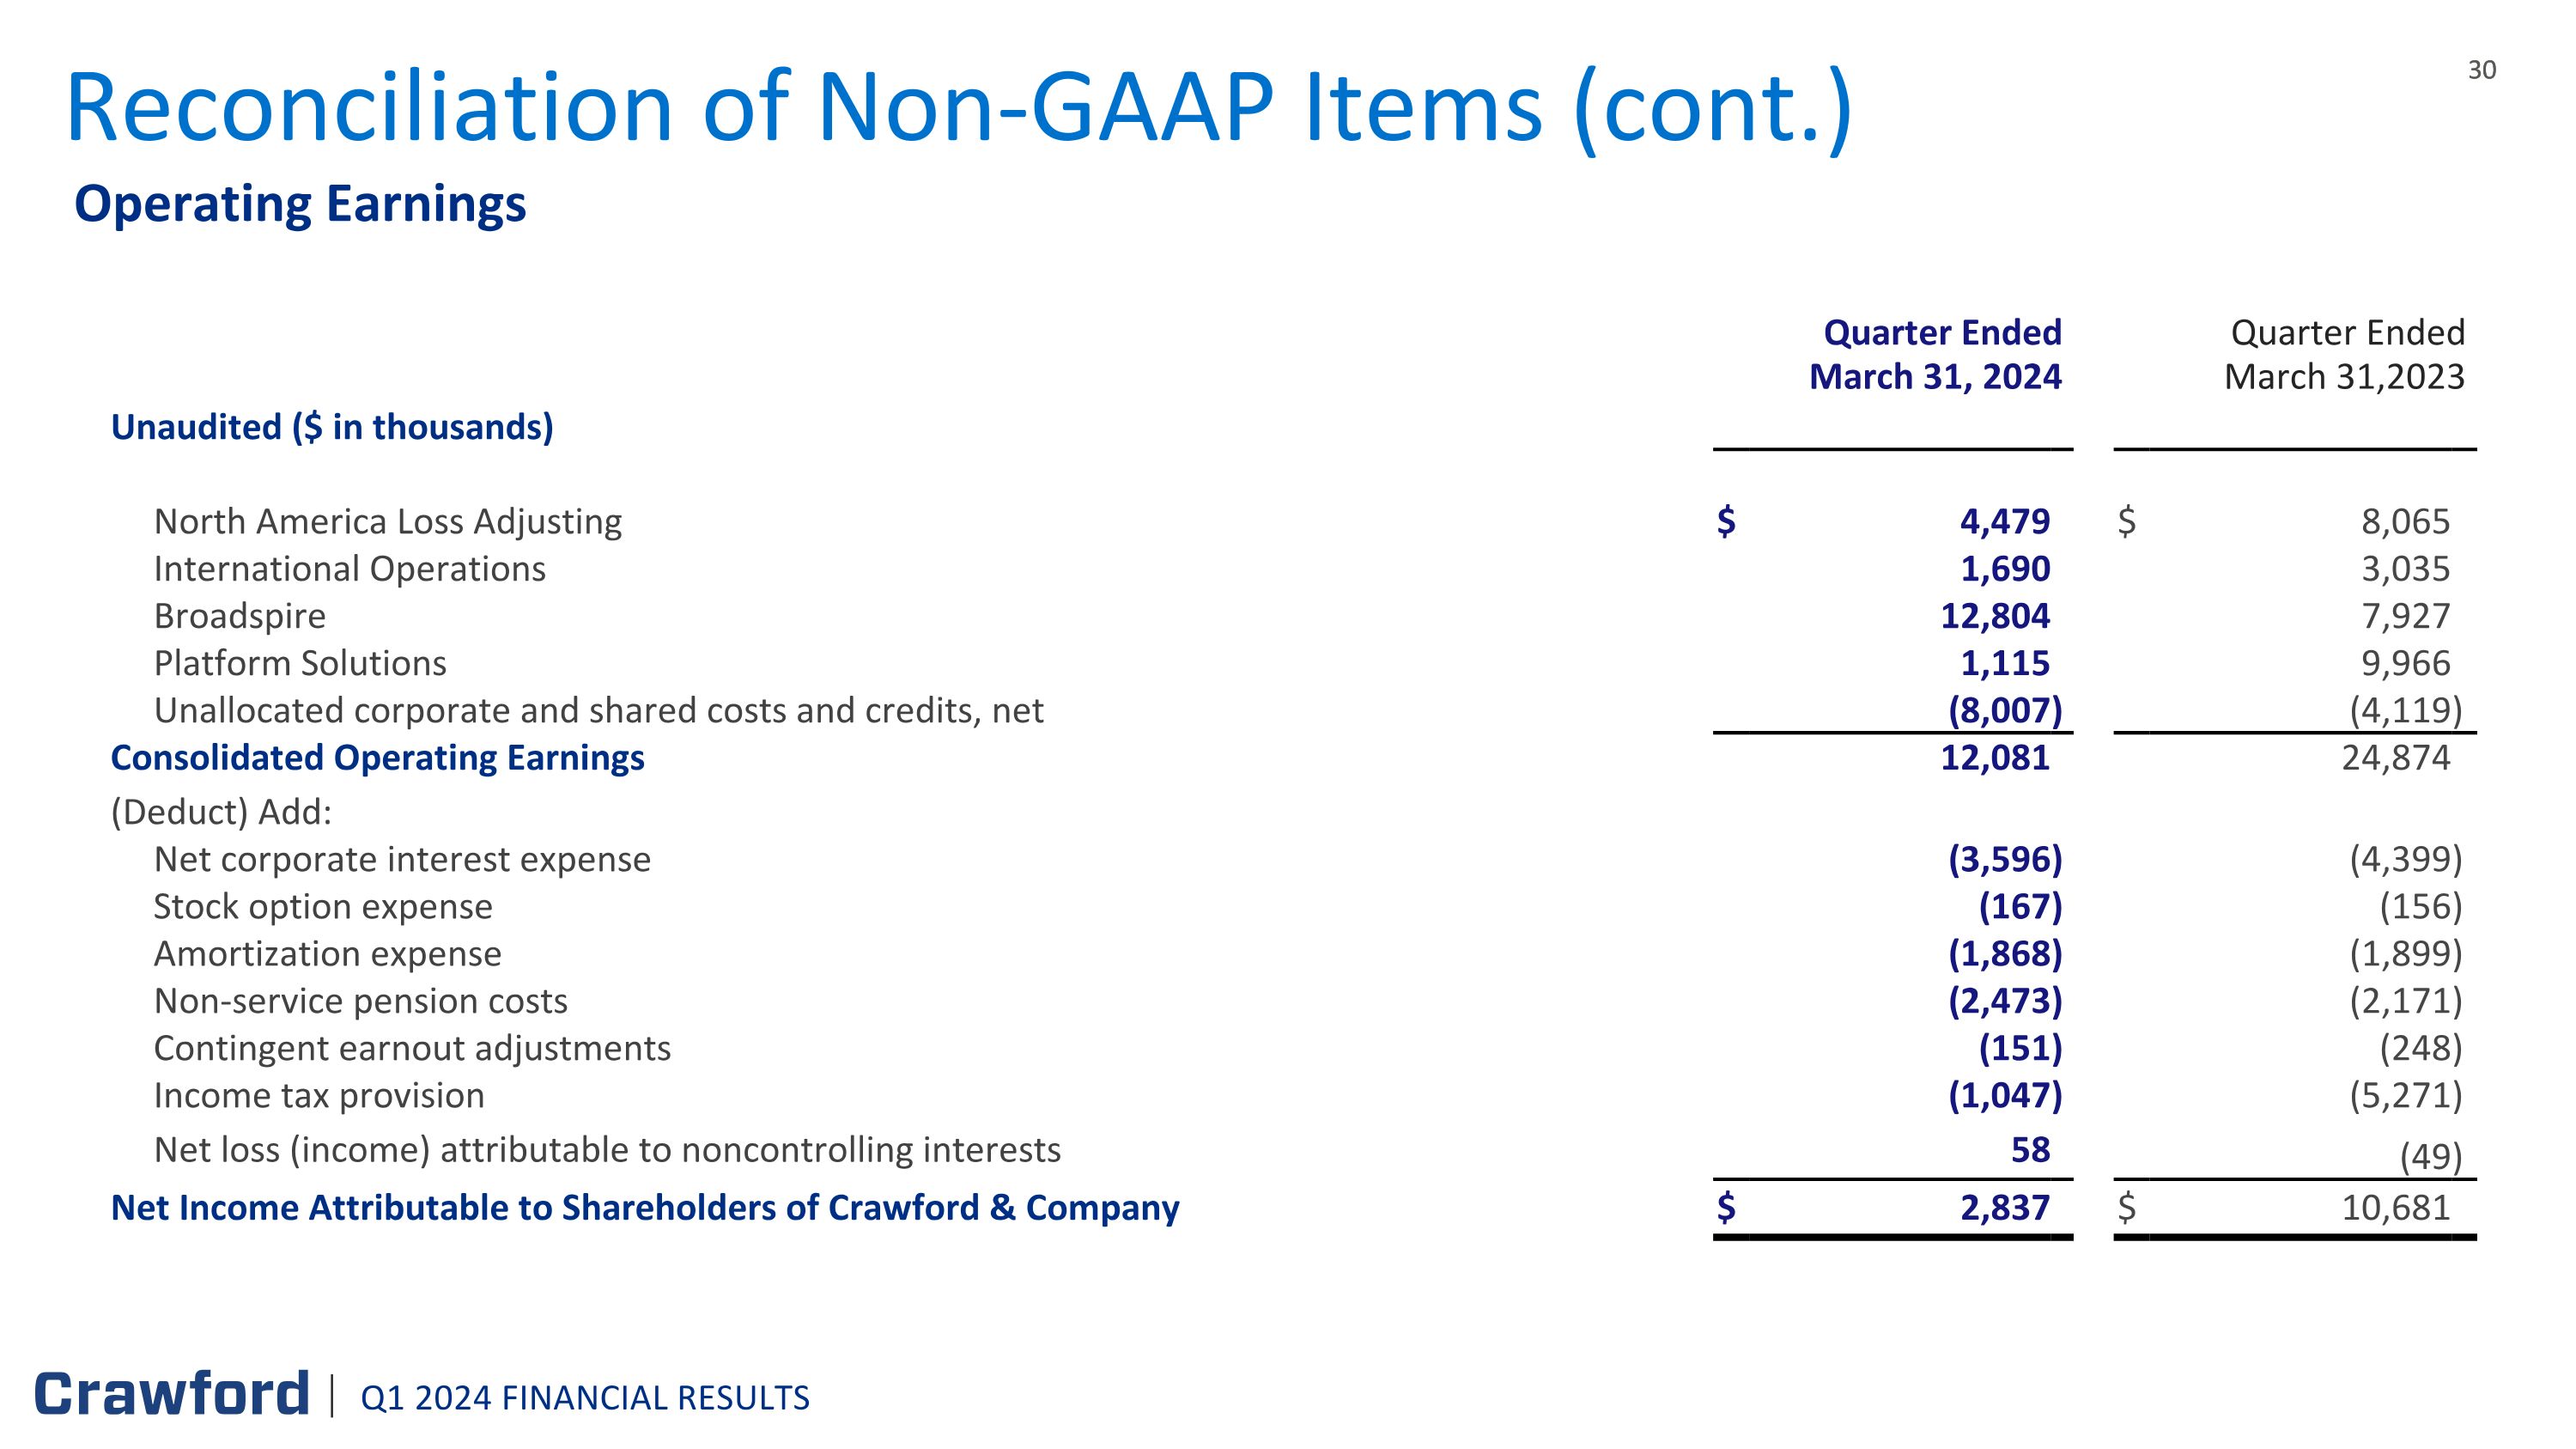
Operating Earnings Reconciliation of Non-GAAP Items (cont.) Quarter Ended Quarter Ended Quarter Ended Quarter Ended March 31, 2024 December 31, March 31,2023 December 31, Unaudited ($ in thousands) 2019 2018 North America Loss Adjusting $ 4,479 $ 8,065 International Operations 1,690 3,035 Broadspire 12,804 7,927 Platform Solutions 1,115 9,966 Unallocated corporate and shared costs and credits, net (8,007 ) (4,119 ) Consolidated Operating Earnings 12,081 24,874 (Deduct) Add: Net corporate interest expense (3,596 ) (4,399 ) Stock option expense (167 ) (156 ) Amortization expense (1,868 ) (1,899 ) Non-service pension costs (2,473 ) (2,171 ) Contingent earnout adjustments (151 ) (248 ) Income tax provision (1,047 ) (5,271 ) Net loss (income) attributable to noncontrolling interests 58 (49 ) Net Income Attributable to Shareholders of Crawford & Company $ 2,837 $ 10,681 Q1 2024 FINANCIAL RESULTS
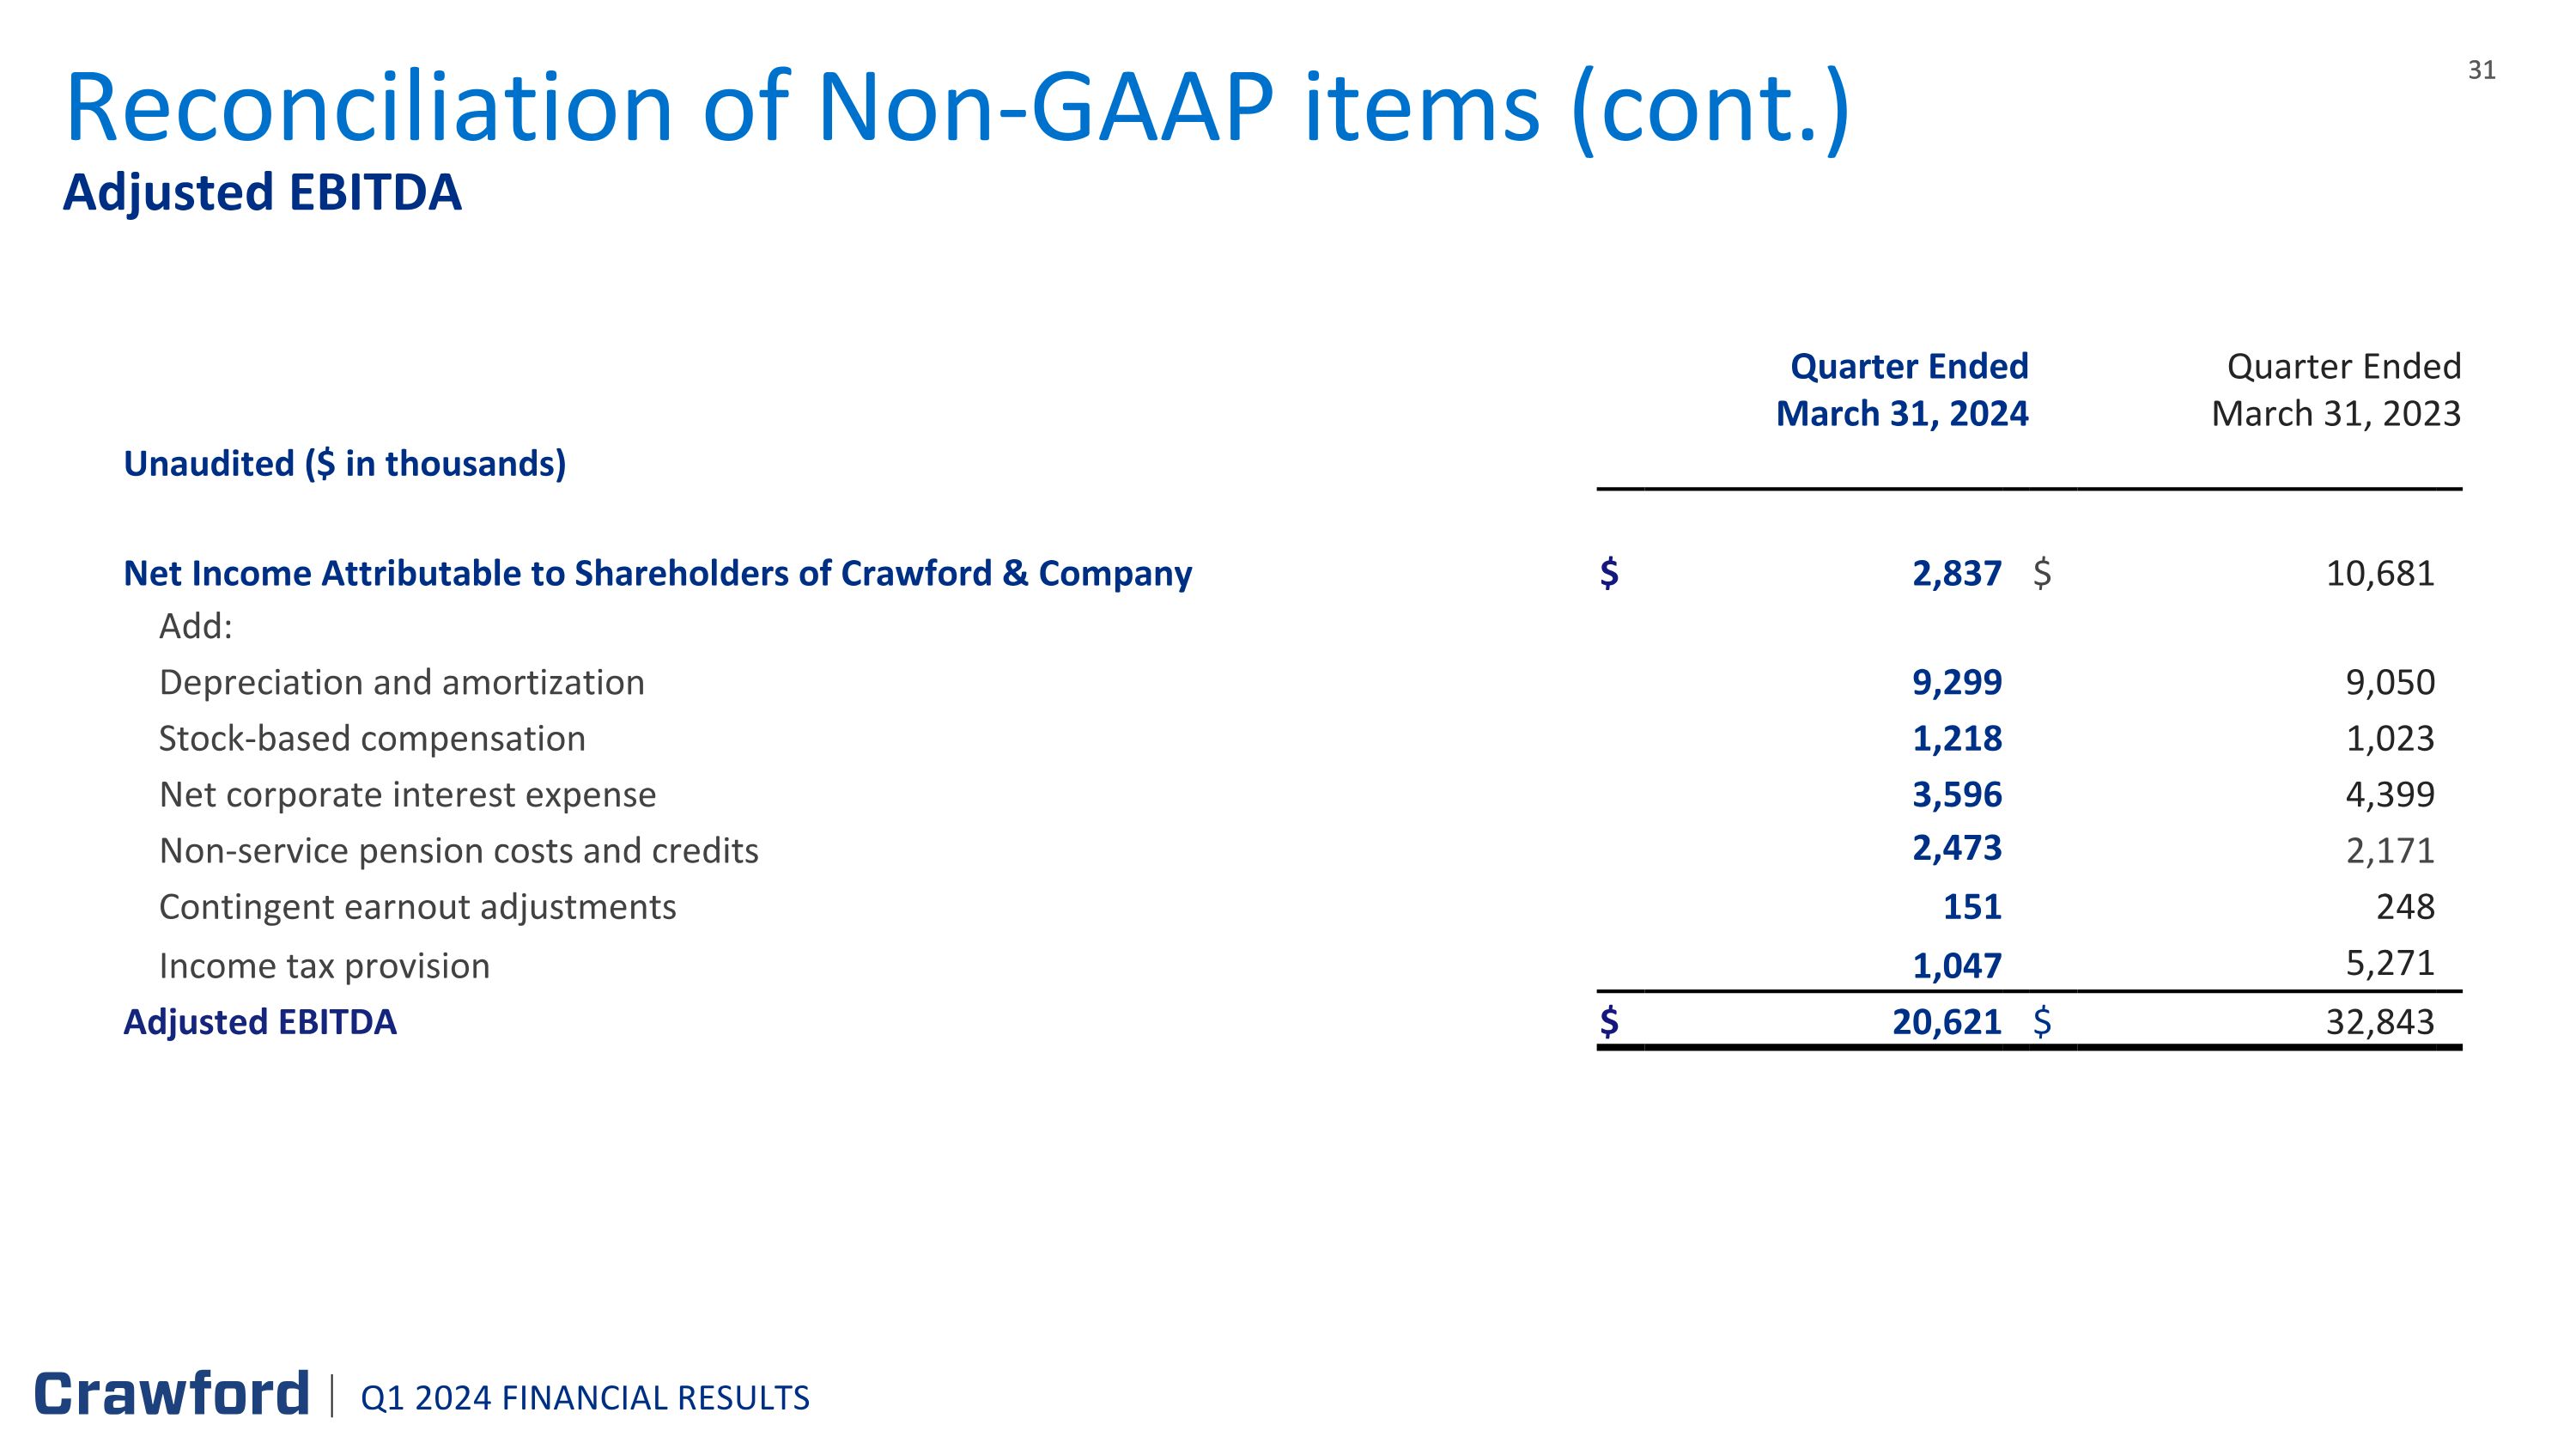
Adjusted EBITDA Reconciliation of Non-GAAP items (cont.) Quarter Ended December 31, Quarter Ended December 31, March 31, 2024 December 31, March 31, 2023 December 31, Unaudited ($ in thousands) 2019 2018 Net Income Attributable to Shareholders of Crawford & Company $ 2,837 $ 10,681 Add: Depreciation and amortization 9,299 9,050 Stock-based compensation 1,218 1,023 Net corporate interest expense 3,596 4,399 Non-service pension costs and credits 2,473 2,171 Contingent earnout adjustments 151 248 Income tax provision 1,047 5,271 Adjusted EBITDA $ 20,621 $ 32,843 Q1 2024 FINANCIAL RESULTS
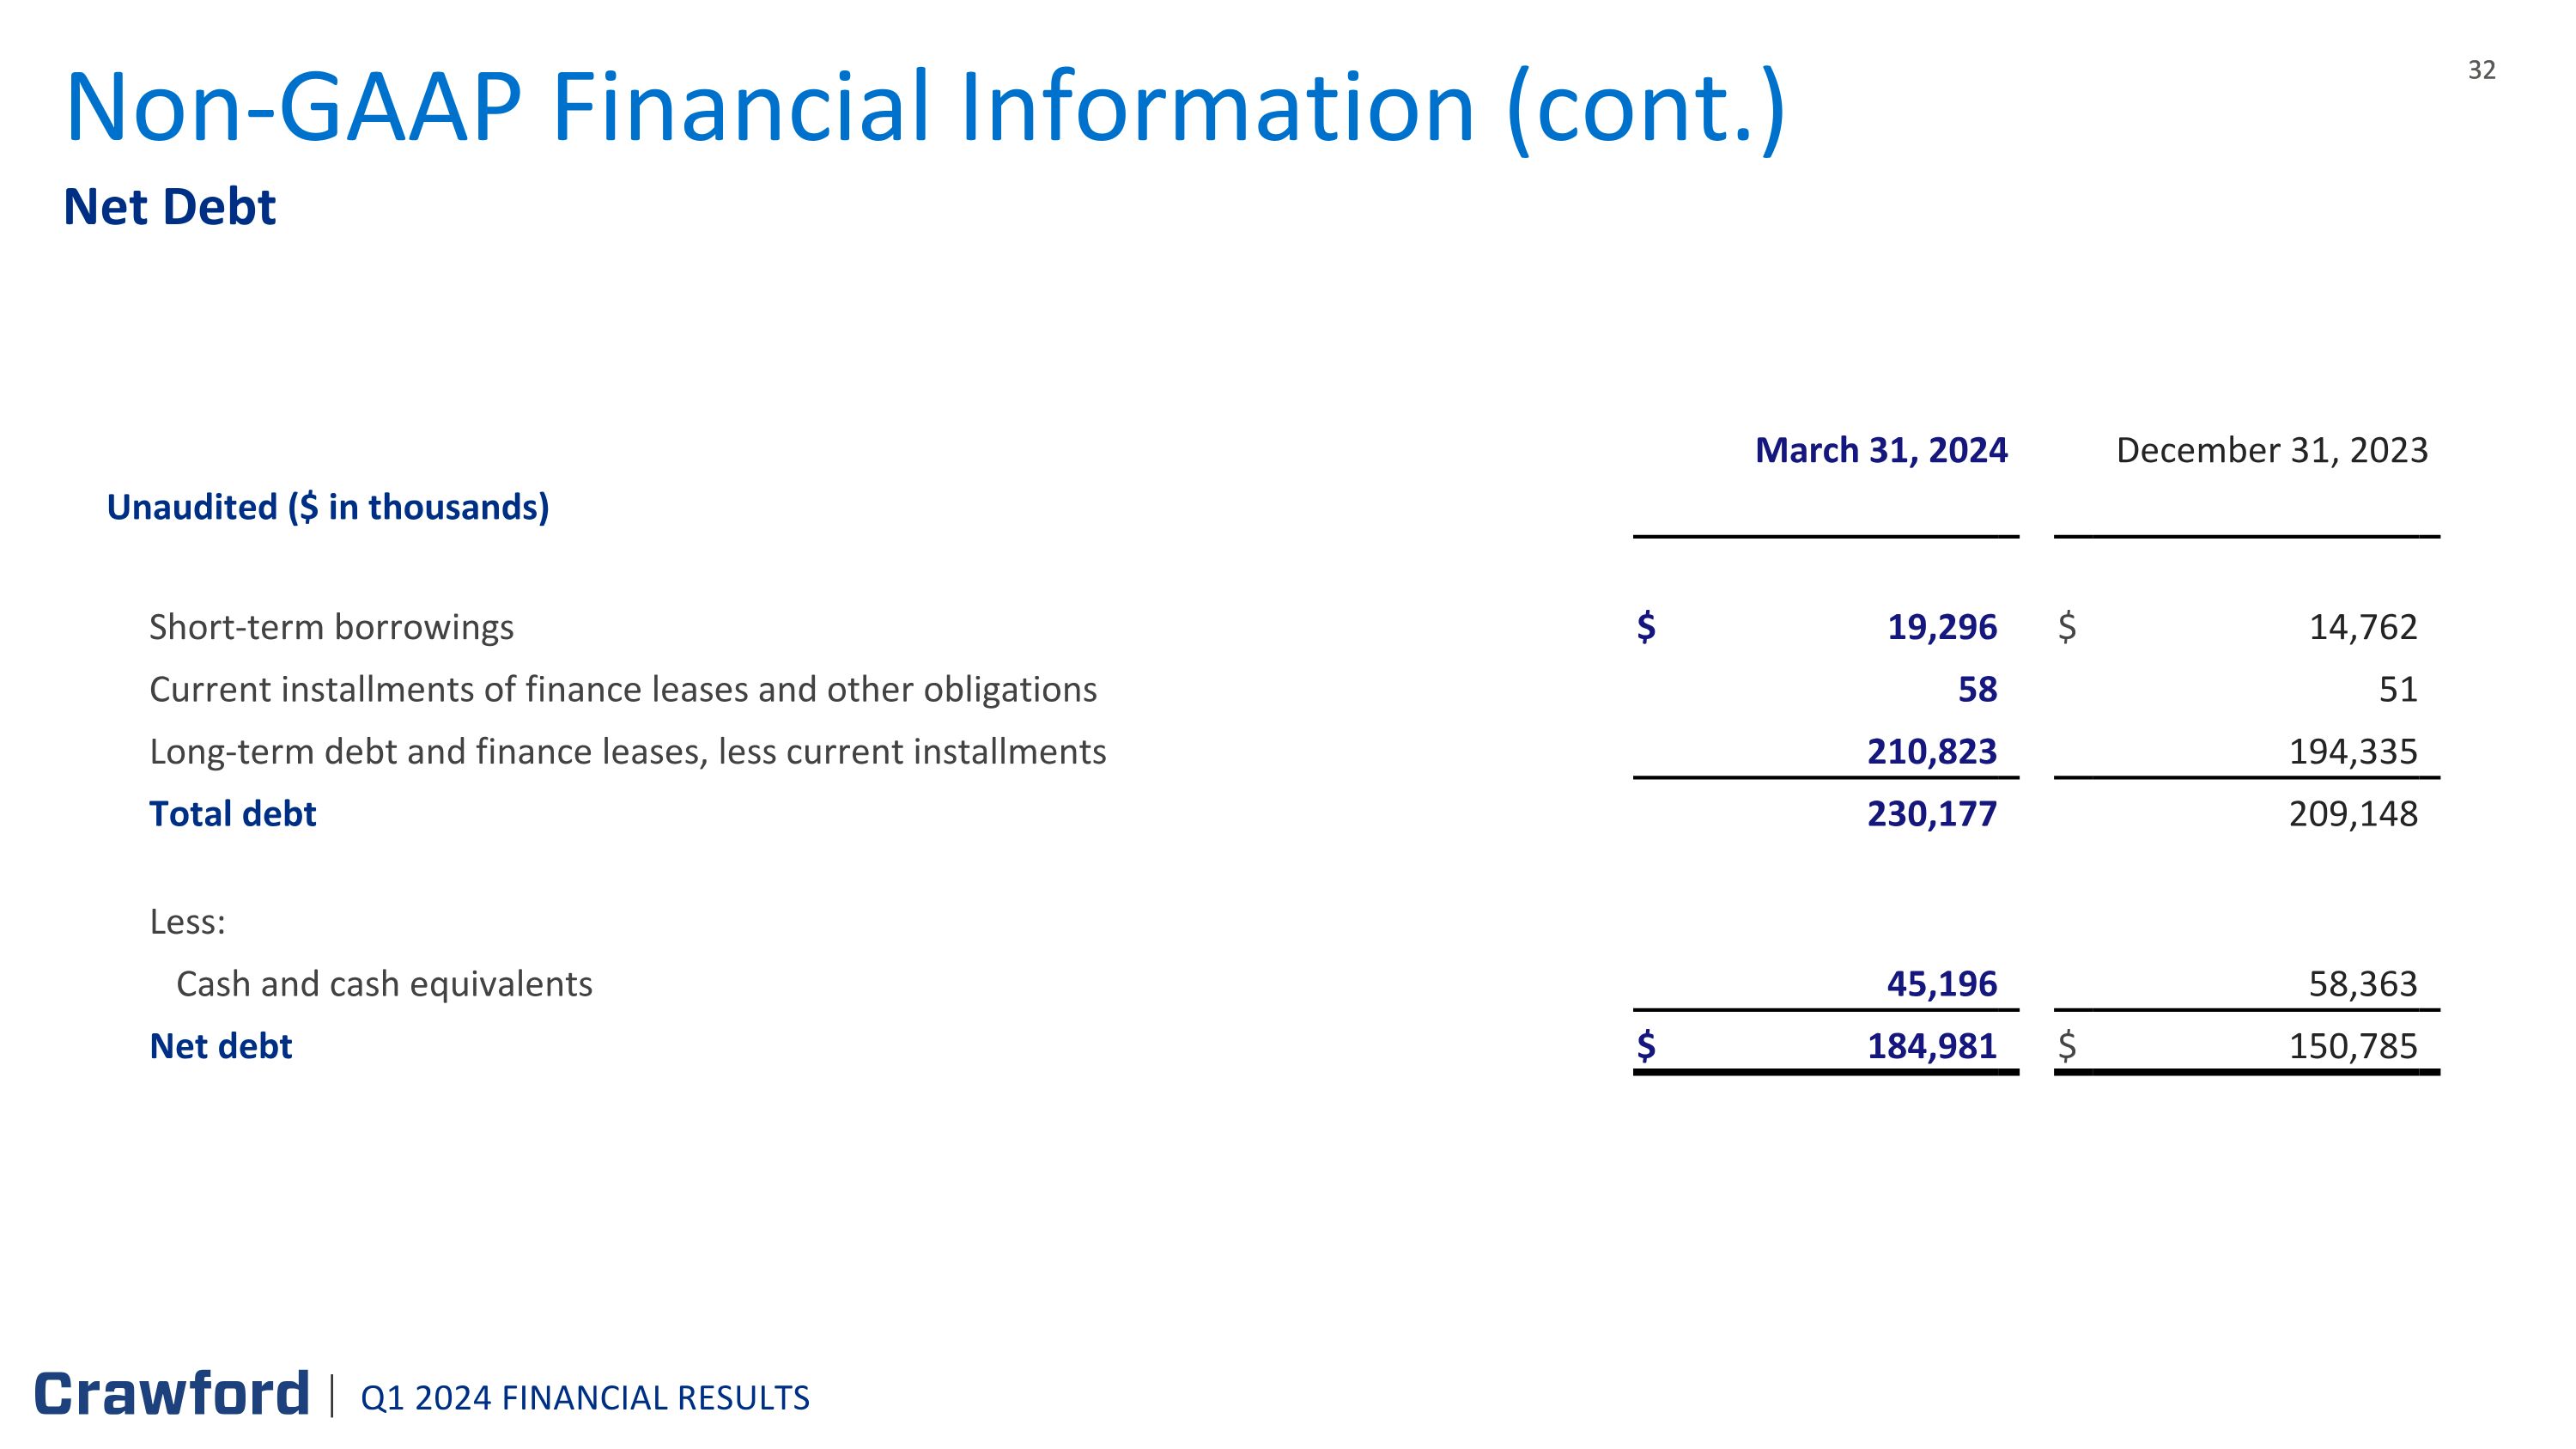
Net Debt Non-GAAP Financial Information (cont.) March 31, 2024 December 31, December 31, 2023 December 31, Unaudited ($ in thousands) 2019 2018 Short-term borrowings $ 19,296 $ 14,762 Current installments of finance leases and other obligations 58 51 Long-term debt and finance leases, less current installments 210,823 194,335 Total debt 230,177 209,148 Less: Cash and cash equivalents 45,196 58,363 Net debt $ 184,981 $ 150,785 Q1 2024 FINANCIAL RESULTS
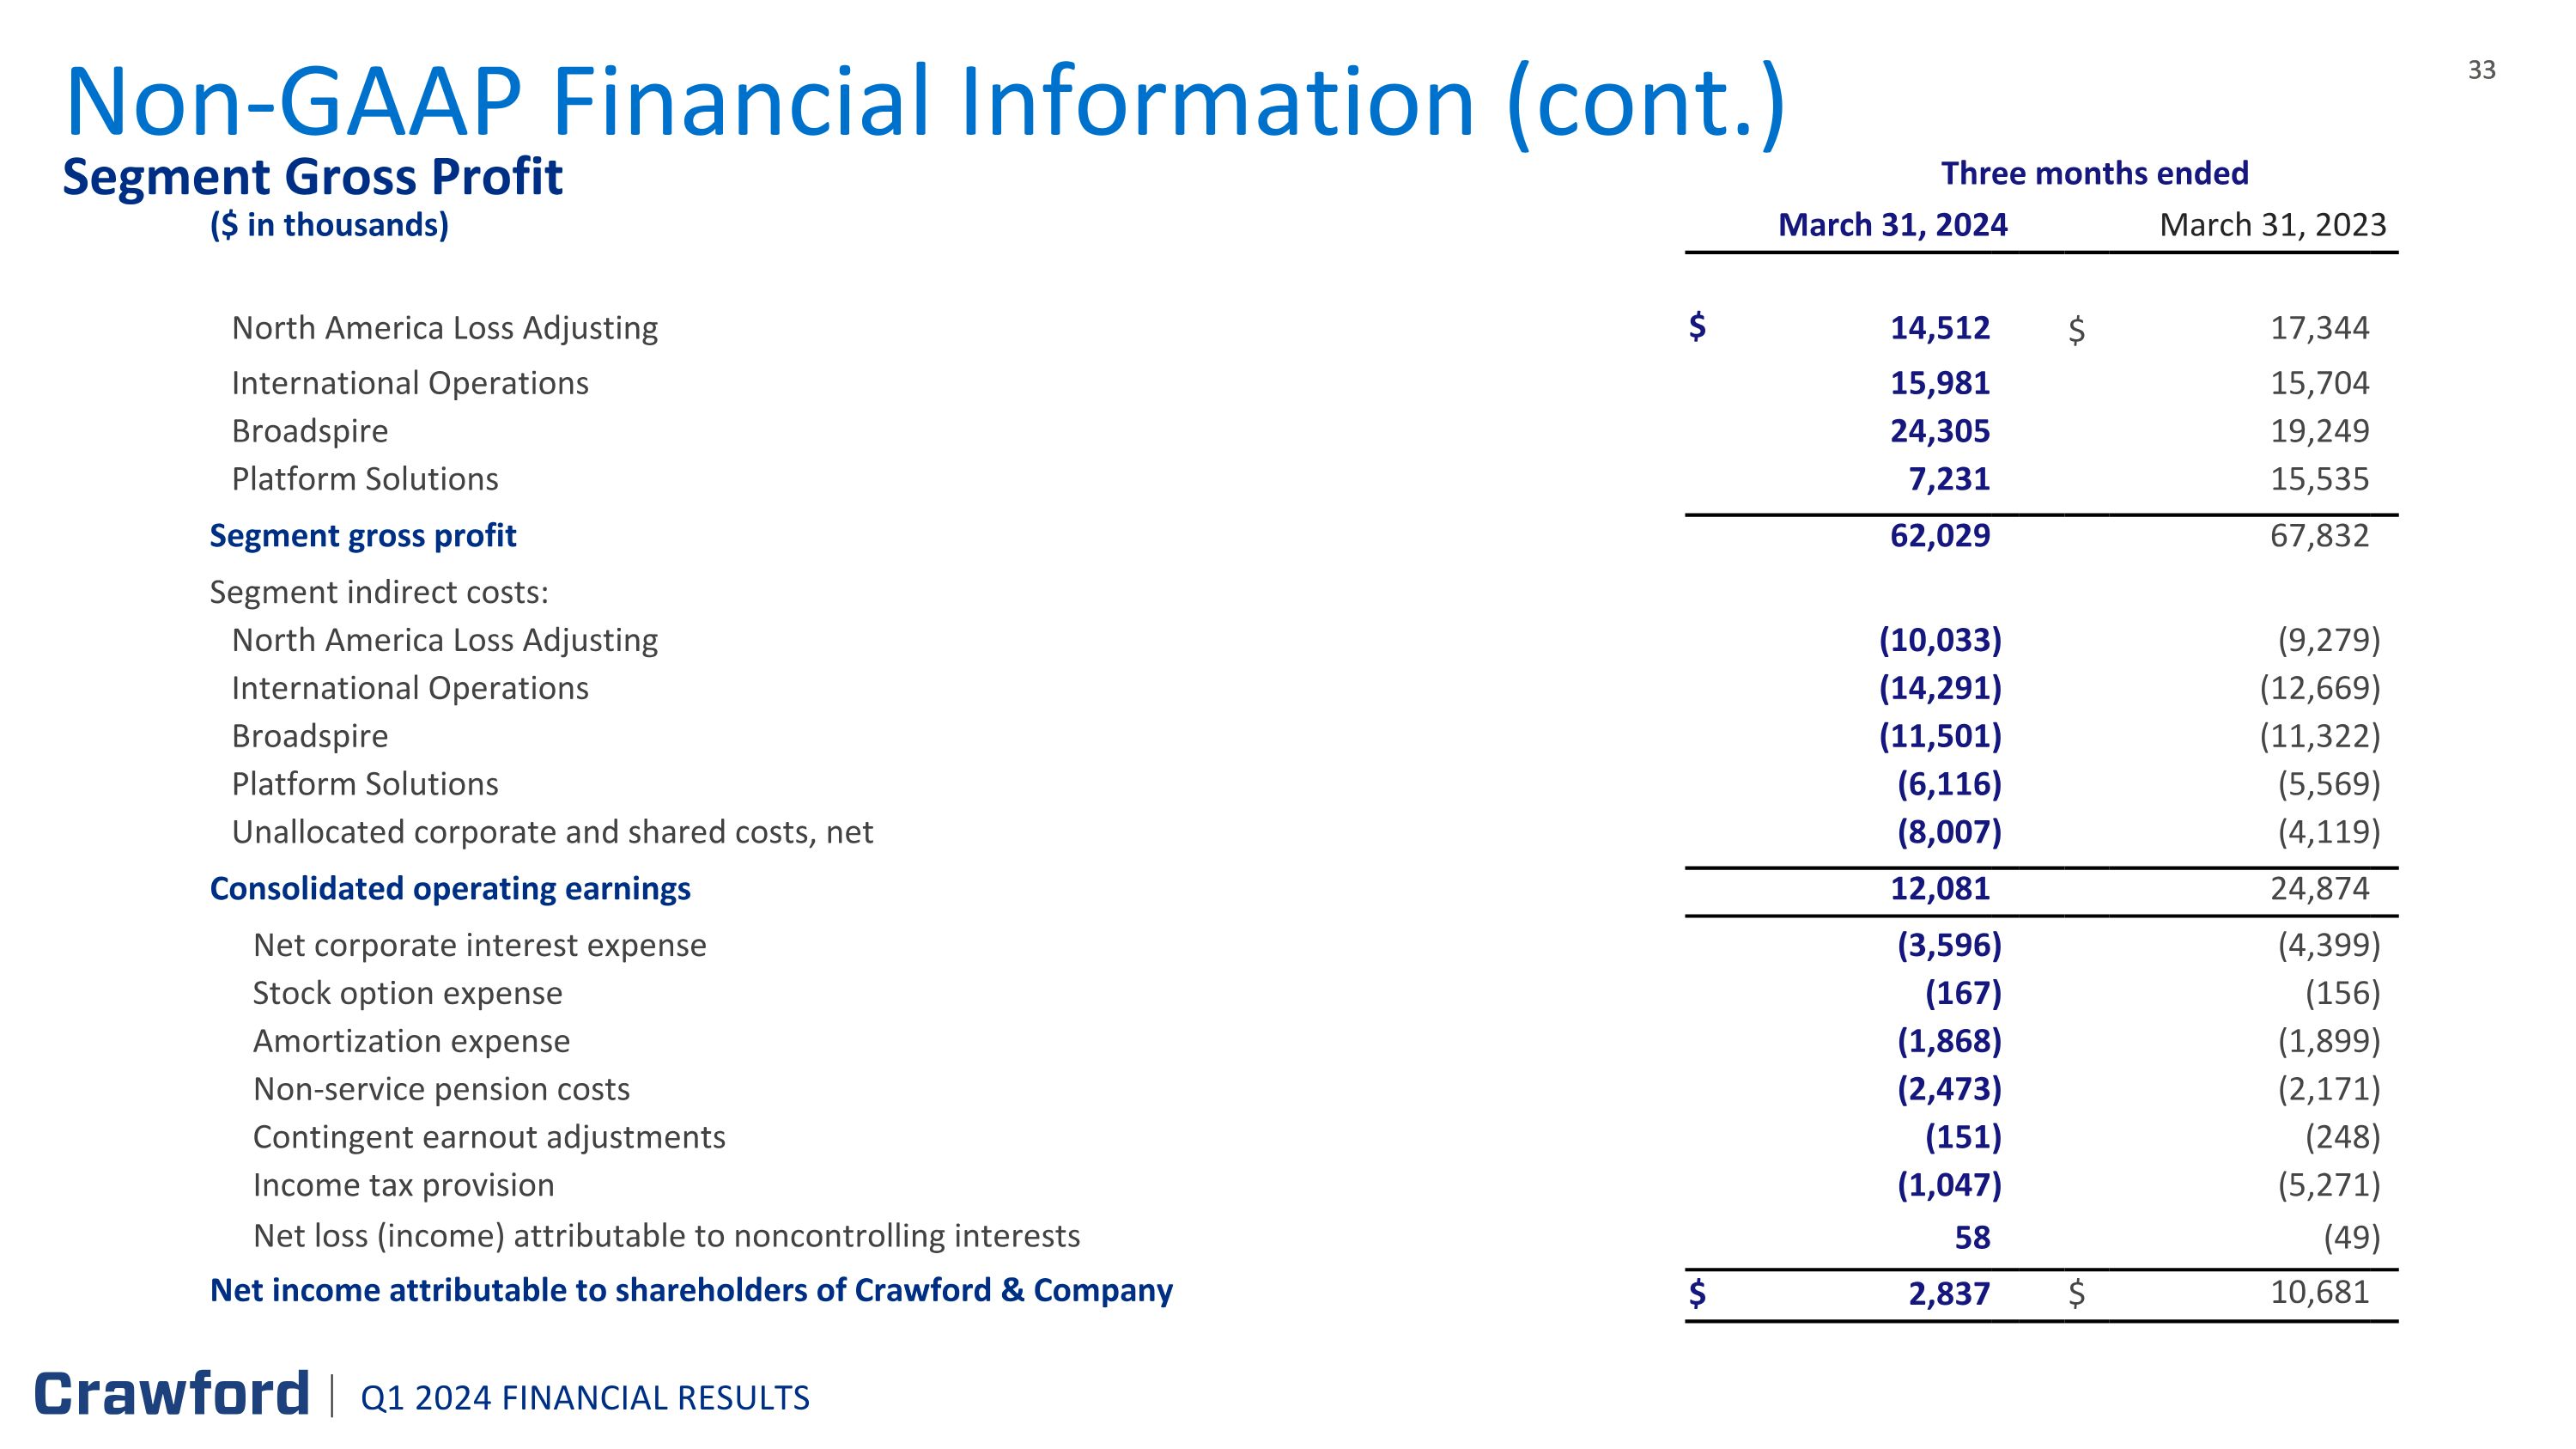
Segment Gross Profit Non-GAAP Financial Information (cont.) Three months ended Three months ended ($ in thousands) March 31, 2024 December 31, 2019 March 31, 2023 December 31, 2018 North America Loss Adjusting $ 14,512 $ 17,344 International Operations 15,981 15,704 Broadspire 24,305 19,249 Platform Solutions 7,231 15,535 Segment gross profit 62,029 67,832 Segment indirect costs: North America Loss Adjusting (10,033 ) (9,279 ) International Operations (14,291 ) (12,669 ) Broadspire (11,501 ) (11,322 ) Platform Solutions (6,116 ) (5,569 ) Unallocated corporate and shared costs, net (8,007 ) (4,119 ) Consolidated operating earnings 12,081 24,874 Net corporate interest expense (3,596 ) (4,399 ) Stock option expense (167 ) (156 ) Amortization expense (1,868 ) (1,899 ) Non-service pension costs (2,473 ) (2,171 ) Contingent earnout adjustments (151 ) (248 ) Income tax provision (1,047 ) (5,271 ) Net loss (income) attributable to noncontrolling interests 58 (49 ) Net income attributable to shareholders of Crawford & Company $ 2,837 $ 10,681 Q1 2024 FINANCIAL RESULTS
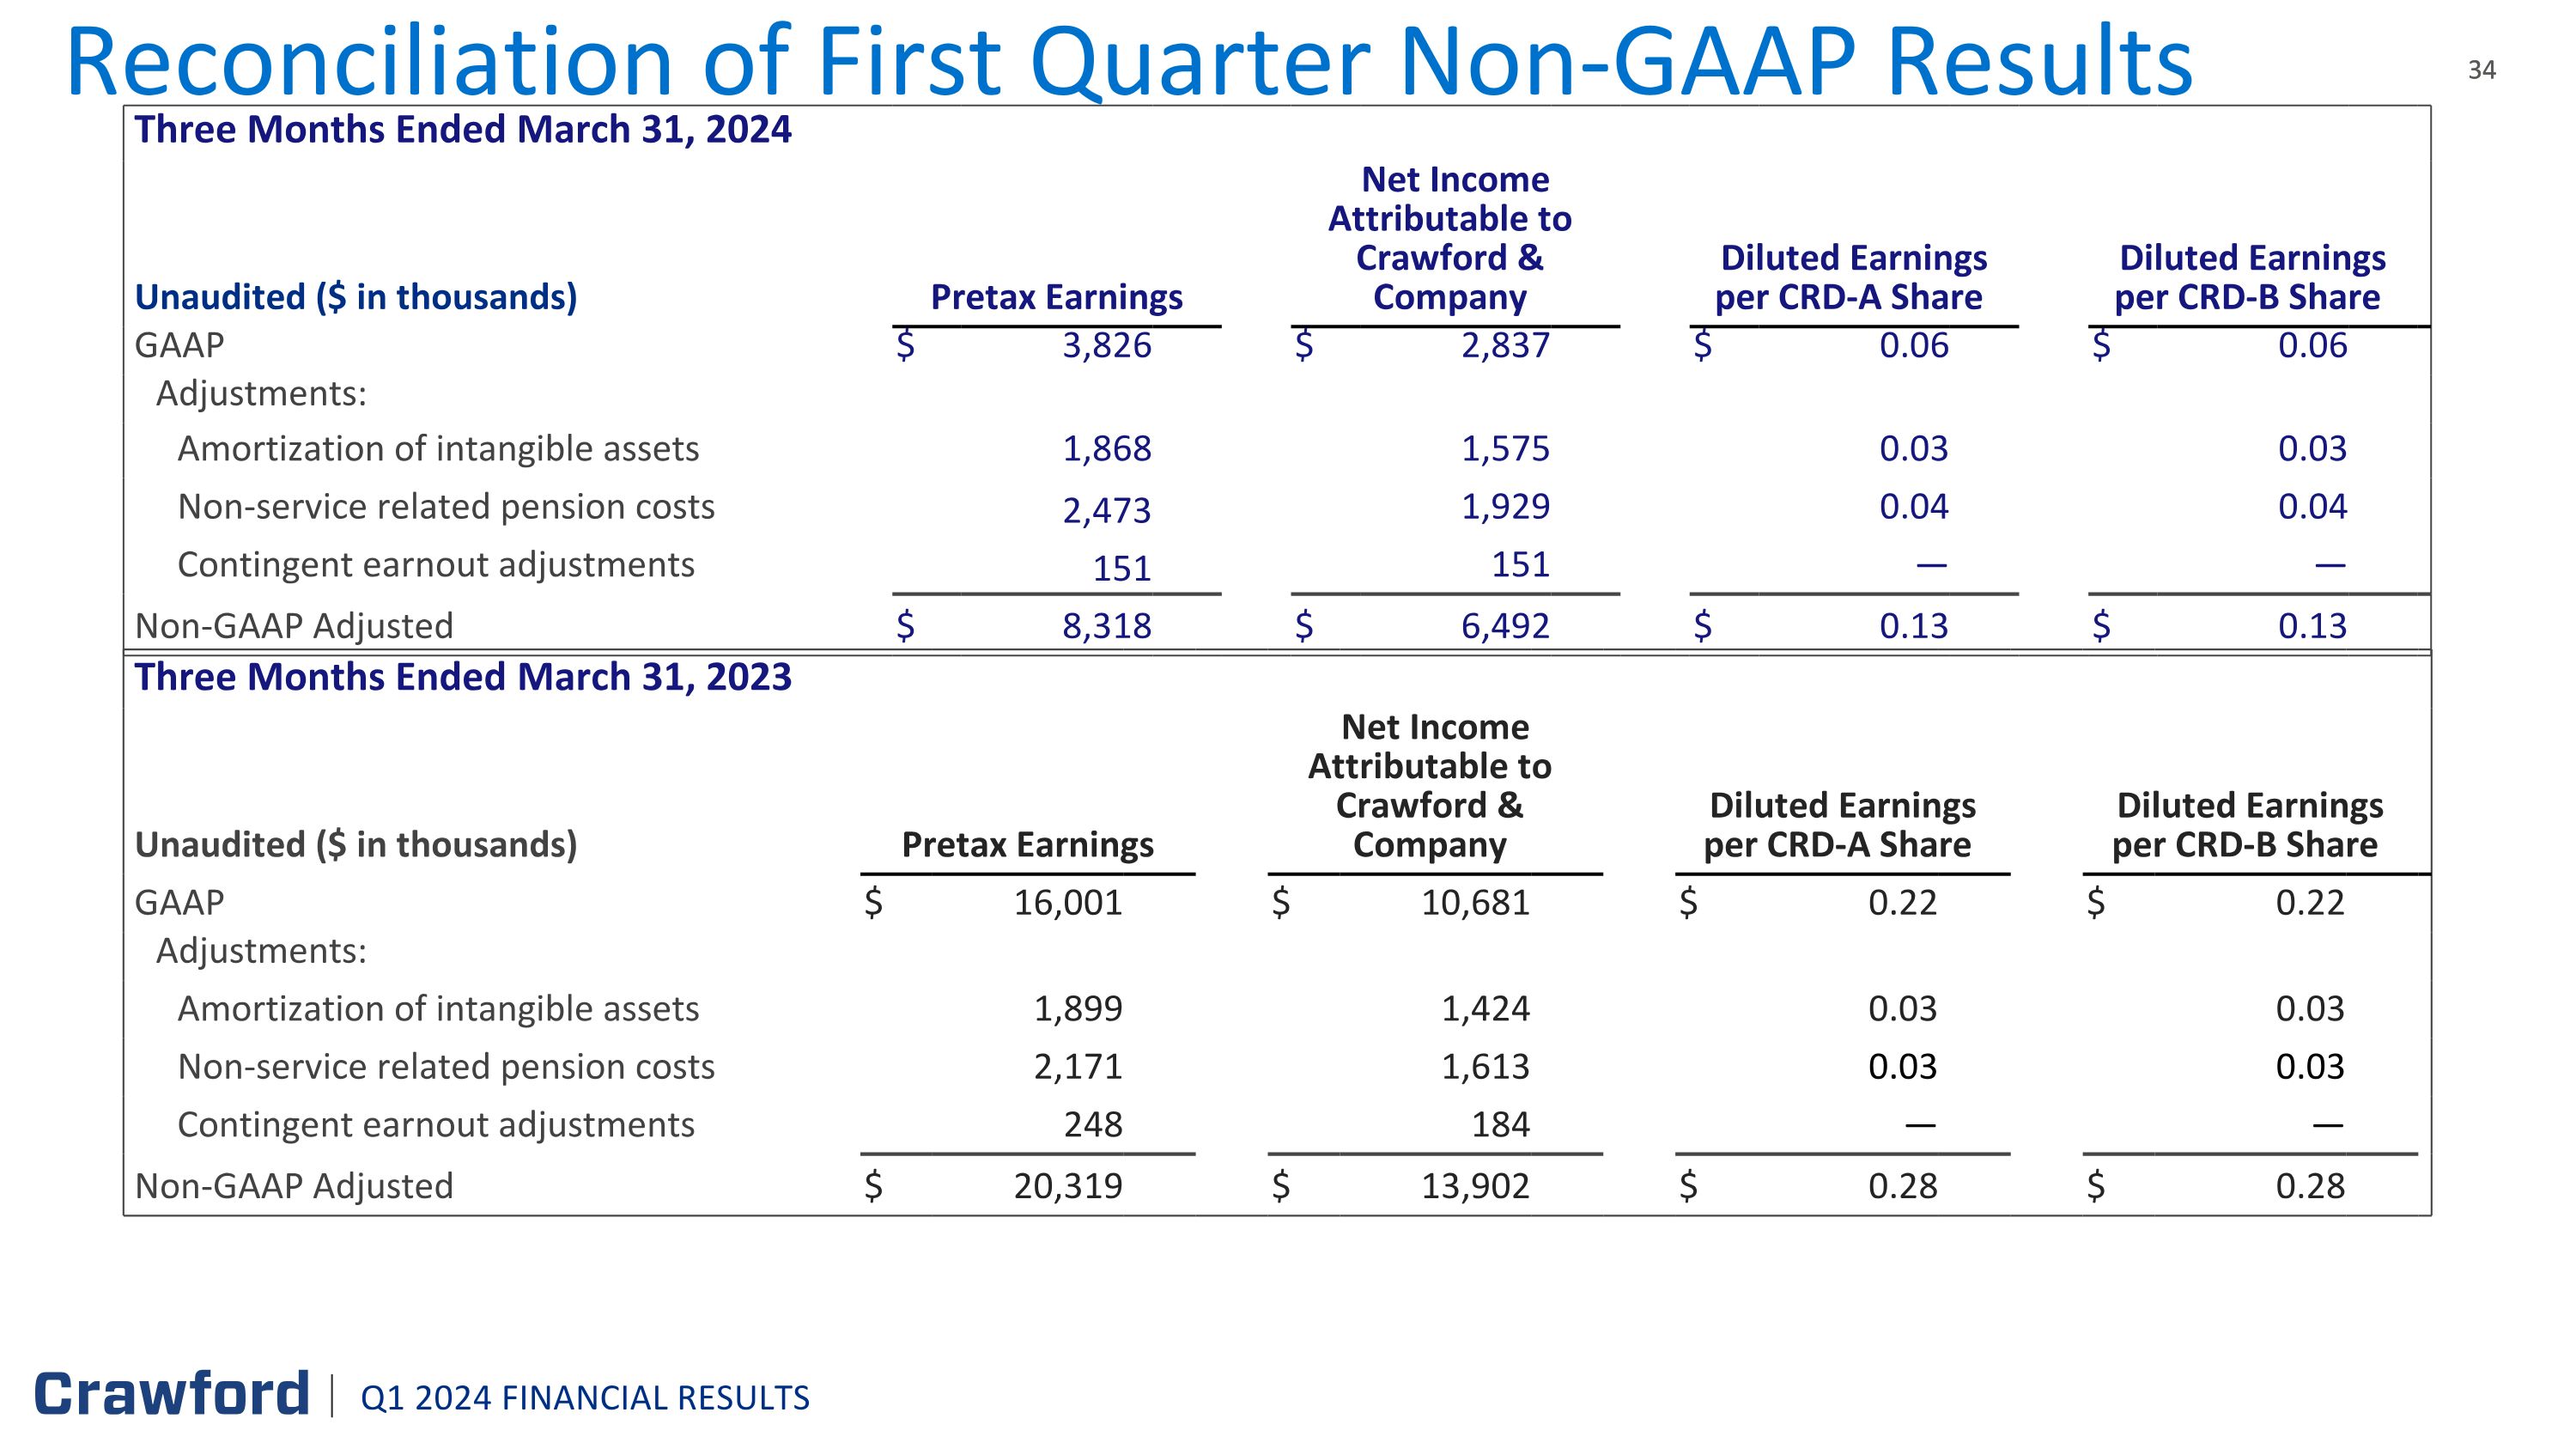
Reconciliation of First Quarter Non-GAAP Results Three Months Ended March 31, 2024 Unaudited ($ in thousands) Pretax Earnings Pretax (Loss) Earnings Net Income Attributable to Crawford & Company Net (Loss) Income Attributable to Crawford & Company Diluted Earnings per CRD-A Share Diluted (Loss) Earnings per CRD-A Share Diluted Earnings per CRD-B Share Diluted (Loss) Earnings per CRD-B Share GAAP $ 3,826 $ 2,837 $ 0.06 $ 0.06 Adjustments: Amortization of intangible assets 1,868 1,575 0.03 0.03 Non-service related pension costs 2,473 1,929 0.04 0.04 Contingent earnout adjustments 151 151 — — Non-GAAP Adjusted $ 8,318 $ 6,492 $ 0.13 $ 0.13 Three Months Ended March 31, 2023 Unaudited ($ in thousands) Pretax Earnings Pretax Earnings Net Income Attributable to Crawford & Company Net Income Attributable to Crawford & Company Diluted Earnings per CRD-A Share Diluted Earnings per CRD-A Share Diluted Earnings per CRD-B Share Diluted Earnings per CRD-B Share GAAP $ 16,001 $ 10,681 $ 0.22 $ 0.22 Adjustments: Amortization of intangible assets 1,899 1,424 0.03 0.03 Non-service related pension costs 2,171 1,613 0.03 0.03 Contingent earnout adjustments 248 184 — — Non-GAAP Adjusted $ 20,319 $ 13,902 $ 0.28 $ 0.28 Q1 2024 FINANCIAL RESULTS