UNITED STATES
SECURITIES AND EXCHANGE COMMISSION
Washington, D.C. 20549
FORM 8-K
CURRENT REPORT
Pursuant to Section 13 or 15(d)
of the Securities Exchange Act of 1934
Date of Report (Date of earliest event reported): April 26, 2024
Autoliv, Inc.
(Exact name of registrant as specified in its charter)
Delaware |
|
001-12933 |
|
51-0378542 |
|
(State or other jurisdiction of incorporation) |
|
(Commission File Number) |
|
(IRS Employer Identification No.) |
Klarabergsviadukten 70, Section B, 7th Floor, |
|
|
Box 70381, Stockholm, Sweden |
|
SE-107 24 |
(Address of principal executive offices) |
|
(Zip code) |
+46 8 587 206 00
(Registrant’s telephone number, including area code)
Not Applicable
(Former name or former address, if changed since last report)
Check the appropriate box below if the Form 8-K filing is intended to simultaneously satisfy the filing obligation of the registrant under any of the following provisions (see General Instruction A.2. below):
☐ |
Written communications pursuant to Rule 425 under the Securities Act (17 CFR 230.425) |
☐ |
Soliciting material pursuant to Rule 14a-12 under the Exchange Act (17 CFR 240.14a-12) |
☐ |
Pre-commencement communications pursuant to Rule 14d-2(b) under the Exchange Act (17 CFR 240.14d-2(b)) |
☐ |
Pre-commencement communications pursuant to Rule 13e-4(c) under the Exchange Act (17 CFR 240.13e-4(c)) |
Securities registered pursuant to Section 12(b) of the Act:
Title of each class |
|
Trading Symbol(s) |
|
Name of each exchange on which registered |
Common Stock (par value $1.00 per share) |
|
ALV |
|
New York Stock Exchange |
Indicate by check mark whether the registrant is an emerging growth company as defined in Rule 405 of the Securities Act of 1933 (§ 230.405 of this chapter) or Rule 12b-2 of the Securities Exchange Act of 1934 (§ 240.12b-2 of this chapter).
Emerging growth company ☐
If an emerging growth company, indicate by check mark if the registrant has elected not to use the extended transition period for complying with any new or revised financial accounting standards provided pursuant to Section 13(a) of the Exchange Act. ☐
Item 2.02 Results of Operations and Financial Condition.
On April 26, 2024, Autoliv, Inc. (the “Company”) issued a press release announcing its financial results for the first quarter of 2024. A copy of the press release is furnished as Exhibit 99.1 to this report and is incorporated herein by reference. This press release contains certain references to financial measures identified as “organic sales,” “adjusted operating income,” “adjusted operating margin,” “trade working capital,” “adjusted earnings per share,” “net debt,” “adjusted EBITDA,” “net cash before financing,” “operating cash flow,” “free cash flow,” “cash conversion,” “leverage ratio,” and “adjusted return on capital employed,” all of which are adjustments from comparable measures calculated and presented in accordance with U.S. generally accepted accounting principles (GAAP). These financial measures, as used herein, differ from financial measures reported under GAAP, and management believes that these financial presentations provide useful supplemental information, which is important to a proper understanding by investors of the Company’s core business results. These presentations should not be viewed as a substitute for results determined in accordance with GAAP, nor are they necessarily comparable to non-GAAP financial measures presented by other companies. For an explanation of the reasons why management uses these figures, see the Company’s Annual Report on Form 10-K for the fiscal year ended December 31, 2023, filed with the SEC on February 20, 2024, and the Press Release regarding its financial results for the first quarter of 2024. A copy of the press release is furnished as Exhibit 99.1 to this report.
Item 7.01 Regulation FD Disclosure.
On April 26, 2024, the Company issued a press release announcing its financial results for the first quarter of 2024. A copy of the press release is furnished as Exhibit 99.1 to this report and is incorporated herein by reference.
The information in Items 2.02 and 7.01 of this Form 8-K and the exhibit attached hereto as Exhibit 99.1 shall not be deemed “filed” for purposes of Section 18 of the Securities Exchange Act of 1934, as amended (the “Exchange Act”), or otherwise subject to the liabilities of that section, nor shall it be deemed incorporated by reference in any filing under the Securities Act of 1933, as amended, or the Exchange Act, except as shall be expressly set forth by specific reference in such a filing.
Item 9.01 Financial Statements and Exhibits.
(d) EXHIBITS
99.1 |
|
|
104 |
|
Cover Page Interactive Data File (embedded within the Inline XBRL document). |
2(4)
EXHIBIT INDEX
Exhibit No. |
|
Description |
|
|
|
99.1 |
|
|
|
|
|
104 |
|
Cover Page Interactive Data File (embedded within the Inline XBRL document). |
3(4)
SIGNATURES
Pursuant to the requirements of the Securities Exchange Act of 1934, the registrant has duly caused this report to be signed on its behalf by the undersigned hereunto duly authorized.
|
AUTOLIV, INC |
||
|
|
|
|
|
By: |
|
/s/ Anthony J. Nellis |
|
Name: |
|
Anthony J. Nellis |
|
Title: |
|
Executive Vice President, Legal Affairs and General Counsel |
Date: April 26, 2024
4(4)
Exhibit 99.1


Financial Report January - March 2024 |
Q1 2024: Broad based improvements
|
Financial highlights Q1 2024 $2,615 million net sales 5% net sales increase 5% organic sales growth* 7.4% operating margin 7.6% adjusted operating margin* $1.52 EPS, 77% increase $1.58 adjusted EPS*, 76% increase |
|
Full year 2024 guidance Around 5% organic sales growth Around 0% FX effect on net sales Around 10.5% adjusted operating margin Around $1.2 billion operating cash flow
|
All change figures in this release compare to the same period of the previous year except when stated otherwise.
Key business developments in the first quarter of 2024
*For non-U.S. GAAP measures see enclosed reconciliation tables. |
Key Figures
(Dollars in millions, except per share data) |
Q1 2024 |
Q1 2023 |
Change |
Net sales |
$2,615 |
$2,493 |
4.9% |
Operating income |
194 |
127 |
52% |
Adjusted operating income1) |
199 |
131 |
51% |
Operating margin |
7.4% |
5.1% |
2.3pp |
Adjusted operating margin1) |
7.6% |
5.3% |
2.3pp |
Earnings per share2) |
1.52 |
0.86 |
77% |
Adjusted earnings per share1,2) |
1.58 |
0.90 |
76% |
Operating cash flow |
$122 |
$(46) |
n/a |
Return on capital employed3) |
19.7% |
13.0% |
6.7pp |
Adjusted return on capital employed1,3) |
20.2% |
13.4% |
6.8pp |
1) Excluding effects from capacity alignments and antitrust related matters. Non-U.S. GAAP measure, see reconciliation table. 2) Assuming dilution when applicable and net of treasury shares. 3) Annualized operating income and income from equity method investments, relative to average capital employed. |
|||
Comments from Mikael Bratt, President & CEO |
|
|
|
|
We delivered record first quarter sales, outperforming global LVP growth by 6pp. We outperformed in all regions, including China despite a negative LVP mix development with domestic Chinese OEMs growing by 17% and global OEMs declining by 5%. It is encouraging that our sales in India grew organically by 27%. |
return on capital employed. I am particularly pleased with our leverage ratio of 1.3x, which declined significantly compared to a year ago, despite returning $0.7 billion to shareholders and investing in footprint optimization and growth. To support future growth, we are currently investing in increased capacity in Vietnam, China and India. We are facing inflationary pressure again this year and we continue to expect compensation for what is in excess of what we can offset through normal productivity measures. The discussions with our customers are progressing according to plan. As we have previously communicated, we expect the seasonality of past years to likely continue in 2024, with a gradual improvement throughout the year, leading to a full year adjusted operating margin* of around 10.5%. Key drivers for the full year margin progression are organic growth, our structural and strategic cost reduction initiatives, and a lower call-off volatility. The 2024 development we expect should set up a solid base towards a continued high level of shareholder returns and our target of around 12% adjusted operating margin*. |
|
|
Sales in India are now larger than in South Korea, accounting for more than 4% of our global sales. We delivered results in line with what we previously communicated, despite LVP being 1pp below what was expected three months ago, and we are on track to deliver on our full year outlook. We expect a record number of product launches in 2024, despite some OEMs changing certain vehicle model launch plans, mainly for EV platforms. Profitability continued to improve significantly, driven mainly by volume growth and cost reductions. Restructuring activities are yielding results with indirect headcount declining by around 1,000, or by more than 5%, in the past 12 months. Our continued focus on balance sheet efficiency is supporting our strong performance for cash flow, cash conversion, and |
|||
1
Financial Report January - March 2024 |
Full year 2024 guidance
Our 2024 guidance is mainly based on our customer call-offs, a full year 2024 global LVP decline of around 1%, the achievement of our targeted cost compensation effects, and a sustained reduction in customer call-off volatility.
|
Full Year Indication |
|
Full Year Indication |
Organic sales growth |
Around 5% |
Tax rate2) |
Around 28% |
FX impact on net sales |
Around 0% |
Operating cash flow3) |
Around $1.2 billion |
Adjusted operating margin1) |
Around 10.5% |
Capex, net, of sales |
Around 5.5% |
1) Excluding effects from capacity alignments, antitrust related matters and other discrete items. 2) Excluding unusual tax items. 3) Excluding unusual items. |
|||
The forward-looking non-U.S. GAAP financial measures above are provided on a non-U.S. GAAP basis. Autoliv has not provided a U.S. GAAP reconciliation of these measures because items that impact these measures, such as costs and gains related to capacity alignments and antitrust matters, cannot be reasonably predicted or determined. As a result, such reconciliation is not available without unreasonable efforts and Autoliv is unable to determine the probable significance of the unavailable information.
Conference call and webcast
The earnings conference call will be held at 2:00 p.m. CET today, April 26, 2024. Information regarding how to participate is available on www.autoliv.com. The presentation slides for the conference call will be available on our website shortly after the publication of this financial report.
2
Financial Report January - March 2024 |
Business and market condition update
Supply Chain
In the first quarter, global light vehicle production declined year-over-year by around 1% (according to S&P Global April 2024). Call-off volatility was lower compared to a year earlier, as supply chains are less strained compared to a year ago. However, volatility did not improve compared to the fourth quarter 2023, and is still higher than pre-pandemic levels, and low customer demand visibility and changes to customer call-offs with short notice still had a negative impact on our production efficiency and profitability in the quarter. We expect call-off volatility in 2024 on average to be lower than it was in 2023 but remain higher than the pre-pandemic level.
Inflation
In Q1 2024, cost pressure from labor and other items had a negative impact on our profitability. Most of the inflationary cost pressure was offset by price increases and other customer compensations in the quarter. Raw material price changes had a negligible impact on our profitability in Q1 2024. We expect the effects of raw material price changes in 2024 to be negligible for the full year. We expect continued cost pressure from inflation relating mainly to labor, especially in Europe and the Americas. We continue to execute on productivity and cost reduction activities to offset these cost pressures, and will continue to seek inflation compensation from our customers.
This report includes content supplied by S&P Global; Copyright © Light Vehicle Production Forecast, January and April 2024. All rights reserved.
3
Financial Report January - March 2024 |
Key Performance Trends
Net Sales Development by region |
Operating and adjusted operating income and margins |
|
|
|
|
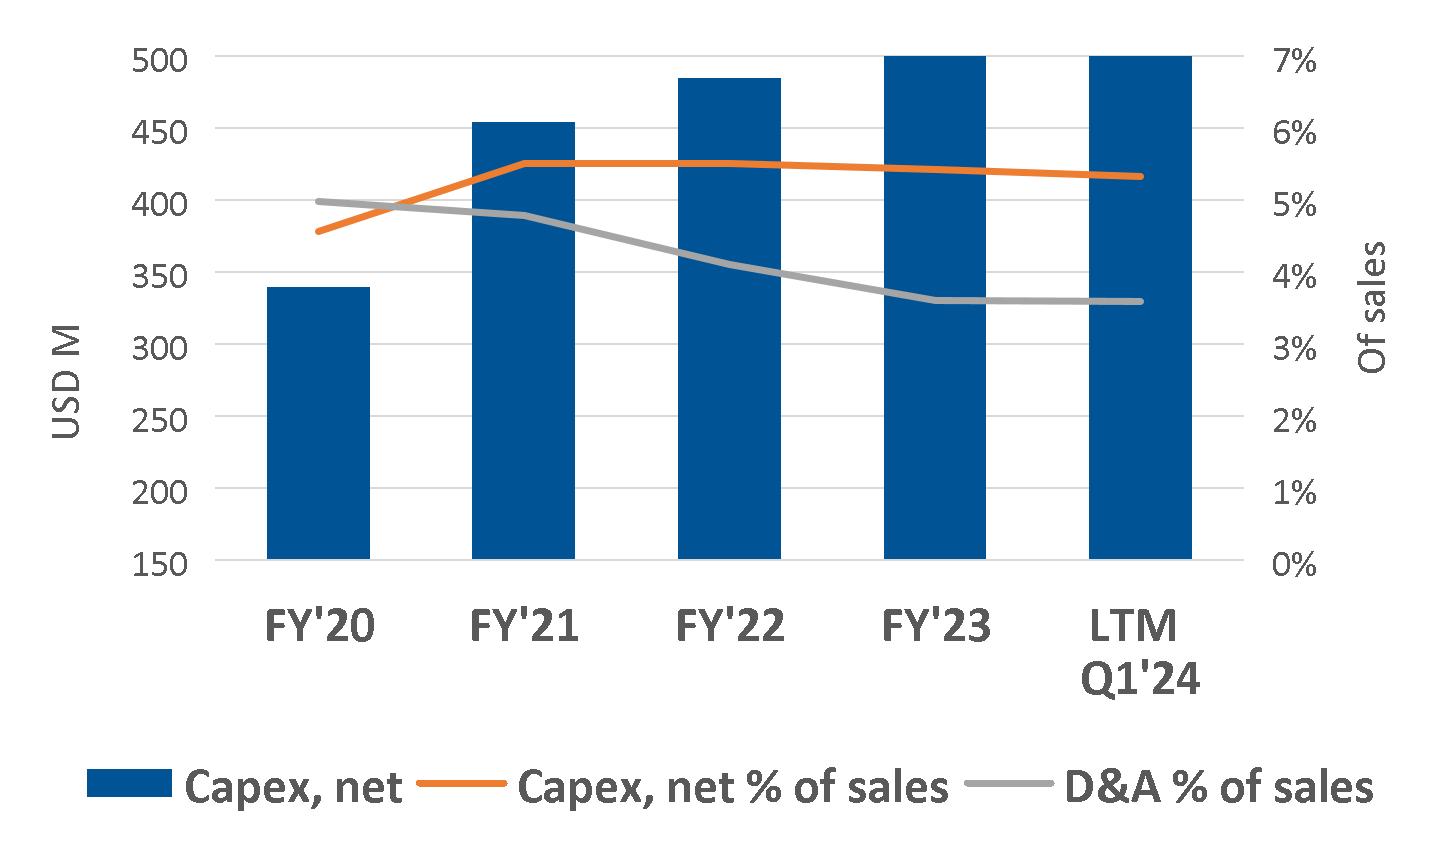
Capex and D&A |
Operating Cash Flow |
|
|
|
|
Return on Capital Employed |
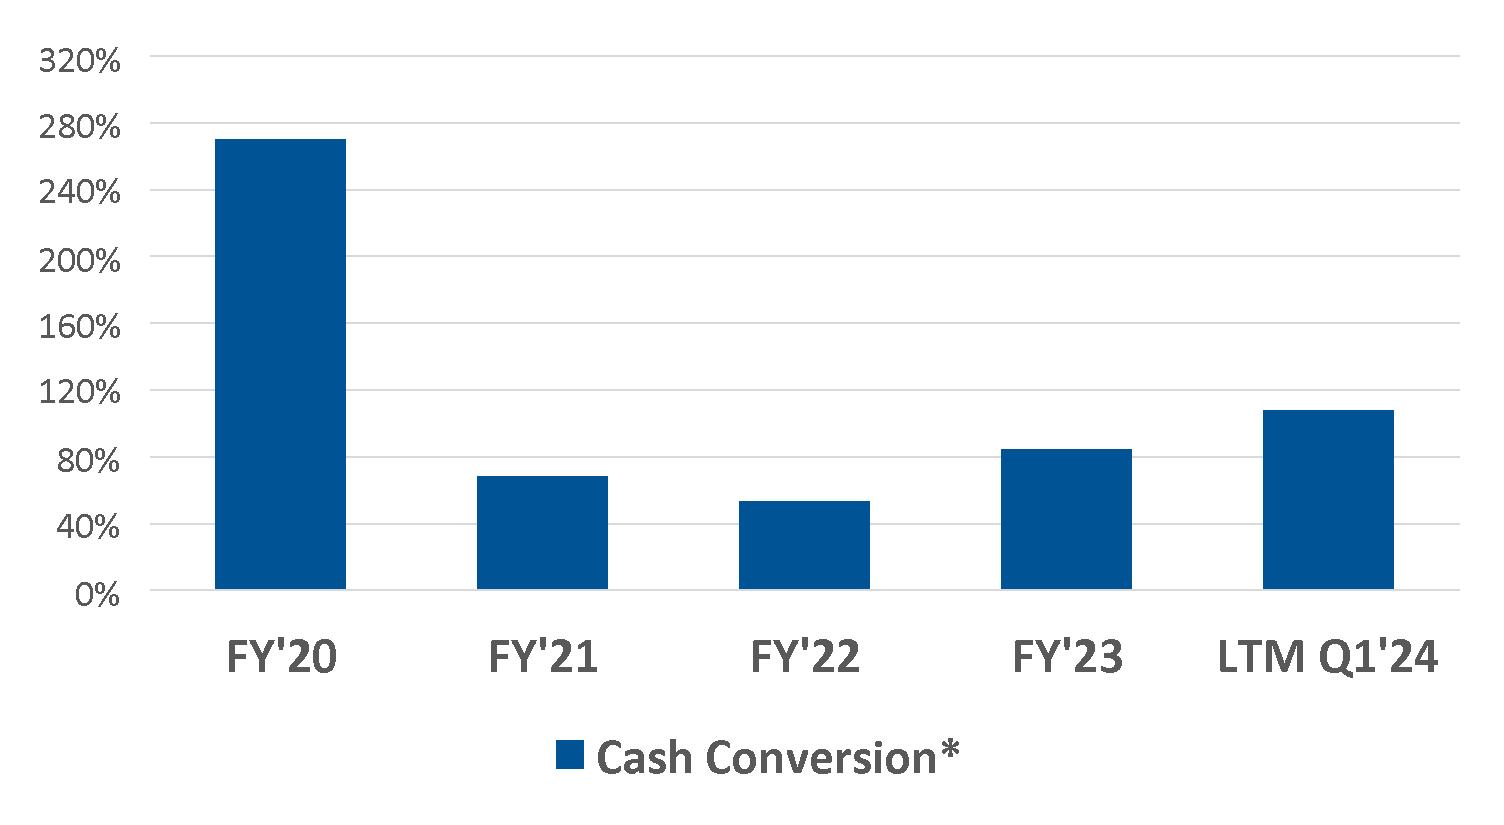
Cash Conversion* |
|
|
|
|
Key definitions ------------------------------------------------------------------------------------------------------------
|
Capex, net: Capital Expenditure, net. D&A: Depreciation and Amortization. Adj. operating income and margin*: Operating income adjusted for capacity alignments, antitrust related matters and for FY 2023 the Andrews litigation settlement. Capacity alignments include non-recurring costs related to our structural efficiency and business cycle management programs. |
|
Cash conversion*: Free cash flow defined as operating cash flow less capital expenditure, net. |
4
Financial Report January - March 2024 |
Consolidated sales development
First quarter 2024
Consolidated sales |
|
First quarter |
Reported change |
Currency |
Organic |
|
(Dollars in millions) |
|
2024 |
2023 |
(U.S. GAAP) |
effects1) |
change* |
Airbags, Steering Wheels and Other2) |
|
$1,781 |
$1,673 |
6.5% |
(0.5)% |
7.0% |
Seatbelt Products and Other2) |
|
834 |
820 |
1.7% |
(0.5)% |
2.2% |
Total |
|
$2,615 |
$2,493 |
4.9% |
(0.5)% |
5.4% |
|
|
|
|
|
|
|
Americas |
|
$893 |
$831 |
7.5% |
2.9% |
4.6% |
Europe |
|
770 |
725 |
6.1% |
2.4% |
3.7% |
China |
|
460 |
453 |
1.7% |
(4.8)% |
6.5% |
Asia excl. China |
|
491 |
483 |
1.7% |
(6.6)% |
8.2% |
Total |
|
$2,615 |
$2,493 |
4.9% |
(0.5)% |
5.4% |
1) Effects from currency translations. 2) Including Corporate sales. |
||||||
|
Sales by product – Airbags, Steering Wheels and Other Sales for all major product categories increased organically* in the quarter. The largest contributor to the increase was steering wheels, followed by inflatable curtains, side airbags, and driver airbags. |
|
Sales by product - Seatbelt Products and Other
Sales for Seatbelt Products and Other increased organically* in the Americas, Asia excluding China and Europe, while it declined in China.
|
|
Sales by region Our global organic sales* increased by 5.4% compared to the global LVP decrease of 0.9% (according to S&P Global, April 2024). The 6.3pp outperformance was mainly driven by new product launches and higher prices carried over from last year. |
|
Our organic sales growth outperformed LVP growth by 15pp in Asia excluding China, by 6.1pp in Europe, by 4.9pp in the Americas, and by 1.4pp in China. LVP growth in China was heavily tilted to domestic OEMs with typically lower safety content. Domestic OEM LVP in China grew by 17% while LVP declined by 5% for global OEMs. |
Q1 2024 organic growth* |
Americas |
Europe |
China |
Asia excl. China |
Global |
Autoliv |
4.6% |
3.7% |
6.5% |
8.2% |
5.4% |
Main growth drivers |
Toyota, Mercedes, Ford |
Mercedes, BMW, Toyota |
Volvo, Chery, BMW |
Hyundai, Tata, Honda |
Mercedes, Toyota, Hyundai |
Main decline drivers |
Stellantis, GM |
Ford, Renault, Volvo |
Honda |
Nissan, Renault, Mazda |
Stellantis, Nissan |
Light vehicle production development
Change compared to the same period last year according to S&P Global
Q1 2024 |
Americas |
Europe |
China |
Asia excl. China |
Global |
LVP (Apr 2024) |
(0.3)% |
(2.4)% |
5.1 % |
(6.9)% |
(0.9)% |
LVP (Jan 2024) |
1.0% |
(4.0)% |
7.1% |
(4.7)% |
0.2% |
5
Financial Report January - March 2024 |
Key launches in the first quarter 2024
BMW 5-Series/i5 Touring |
|
Subaru Forester |
|
Dacia Duster |
|
|
|
|
|
|
|
|
|
|
|
|
|
|
|
|
|
|
|
|
Hyundai Santa Fe |
|
VW ID.7 Tourer |
|
Tata Punch.ev |
|
|
|
|
|
|
|
|
|
|
|
|
|
|
|
|
|
|
|
|
Renault Scenic e-Tech |
|
Tank 700 |
|
Li Auto Mega |
|
|
|
|
|
|
|
|
|
|
|
|
|
|
|
|
Driver/Passenger Airbags |
|
Seatbelts |
|
Side Airbags |
|
|
Head/Inflatable Curtain Airbags |
|
Steering Wheel |
|
Knee Airbag |
|
|
Front Center Airbag |
|
Bag-in-Belt |
|
Pyrotechnical Safety Switch |
|
|
Pedestrian Airbag |
|
Hood Lifter |
|
Available as EV/PHEV |
6
Financial Report January - March 2024 |
Financial development
Selected Income Statement items
Condensed income statement |
First quarter |
||
(Dollars in millions, except per share data) |
2024 |
2023 |
Change |
Net sales |
$2,615 |
$2,493 |
4.9% |
Cost of sales |
(2,172) |
(2,113) |
2.8% |
Gross profit |
443 |
379 |
17% |
S,G&A |
(132) |
(132) |
(0.0)% |
R,D&E, net |
(113) |
(116) |
(3.1)% |
Other income (expense), net |
(4) |
(4) |
11% |
Operating income |
194 |
127 |
52% |
Adjusted operating income1) |
199 |
131 |
51% |
Financial and non-operating items, net |
(20) |
(18) |
10% |
Income before taxes |
174 |
109 |
60% |
Income taxes |
(47) |
(34) |
36% |
Net income |
$127 |
$74 |
70% |
|
|
|
|
Earnings per share2) |
$1.52 |
$0.86 |
77% |
Adjusted earnings per share1,2) |
$1.58 |
$0.90 |
76% |
|
|
|
|
Gross margin |
16.9% |
15.2% |
1.7pp |
S,G&A, in relation to sales |
(5.0)% |
(5.3)% |
0.2pp |
R,D&E, net in relation to sales |
(4.3)% |
(4.7)% |
0.4pp |
Operating margin |
7.4% |
5.1% |
2.3pp |
Adjusted operating margin1) |
7.6% |
5.3% |
2.3pp |
Tax Rate |
27.0% |
31.6% |
(4.6)pp |
|
|
|
|
Other data |
|
|
|
No. of shares at period-end in millions3) |
81.4 |
85.8 |
(5.2)% |
Weighted average no. of shares in millions4) |
82.3 |
86.1 |
(4.4)% |
Weighted average no. of shares in millions, diluted4) |
83.0 |
86.3 |
(3.8)% |
1) Non-U.S. GAAP measure, excluding effects from capacity alignments and antitrust related matters. See reconciliation table. 2) Assuming dilution when applicable and net of treasury shares. 3) Excluding dilution and net of treasury shares. 4) Net of treasury shares. |
|||
|
First quarter 2024 development Gross profit increased by $63 million, and the gross margin increased by 1.7pp compared to the same quarter 2023. The gross profit increase was primarily driven by volume growth, price increases and lower costs for production overhead and premium freight. This was partly offset by wage inflation and adverse FX effects. S,G&A costs were unchanged compared to the prior year, positively impacted by lower costs for professional service which was offset by higher costs for personnel, as wage inflation outpaced the headcount reductions. S,G&A costs in relation to sales decreased from 5.3% to 5.0%. R,D&E, net costs decreased by $4 million compared to the prior year, mainly due to higher engineering income. R,D&E, net, in relation to sales decreased from 4.7% to 4.3%. Other income (expense), net was unchanged at $4 million compared to the same period last year. Operating income increased by $67 million compared to the same period in 2023, mainly due to the increase in gross profit. |
|
Adjusted operating income* increased by $68 million compared to the prior year, mainly due to higher gross profit. Financial and non-operating items, net, was negative $20 million compared to negative $18 million a year earlier. The difference was mainly due to increased interest expense as the result of higher debt and higher interest rates. Income before taxes increased by $65 million compared to the prior year, mainly due to the increase in operating income. Tax rate was 27.0% compared to 31.6% in the same period last year. Discrete tax items, net, decreased the tax rate this quarter by 2.5pp. Discrete tax items, net, increased the tax rate by 0.8pp in the same period last year. Earnings per share, diluted increased by $0.66 compared to a year earlier. The main drivers were $0.52 from higher operating income and $0.10 from lower income taxes. |
7
Financial Report January - March 2024 |
Selected Balance Sheet and Cash Flow items
Selected Balance Sheet items |
First quarter |
||
(Dollars in millions) |
2024 |
2023 |
Change |
Trade working capital1) |
$1,336 |
$1,409 |
(5.2)% |
Trade working capital in relation to sales2) |
12.8% |
14.1% |
(1.4)pp |
- Receivables outstanding in relation to sales3) |
21.0% |
21.1% |
(0.2)pp |
- Inventory outstanding in relation to sales4) |
9.5% |
9.9% |
(0.4)pp |
- Payables outstanding in relation to sales5) |
17.7% |
16.9% |
0.9pp |
Cash & cash equivalents |
569 |
713 |
(20)% |
Gross Debt6) |
2,140 |
2,179 |
(1.8)% |
Net Debt7) |
1,562 |
1,477 |
5.7% |
Capital employed8) |
4,003 |
4,118 |
(2.8)% |
Return on capital employed9) |
19.7% |
13.0% |
6.7pp |
Total equity |
$2,442 |
$2,641 |
(7.5)% |
Return on total equity10) |
20.2% |
11.3% |
8.9pp |
Leverage ratio11) |
1.3 |
1.6 |
(0.4)pp |
1) Outstanding receivables and outstanding inventory less outstanding payables. 2) Outstanding receivables and outstanding inventory less outstanding payables relative to annualized quarterly sales. 3) Outstanding receivables relative to annualized quarterly sales. 4) Outstanding inventory relative to annualized quarterly sales. 5) Outstanding payables relative to annualized quarterly sales. 6) Short- and long-term interest-bearing debt. 7) Short- and long-term debt less cash and cash equivalents and debt-related derivatives. Non-U.S. GAAP measure. See reconciliation table. 8) Total equity and net debt. 9) Annualized operating income and income from equity method investments, relative to average capital employed. 10) Annualized net income relative to average total equity. 11) Net debt adjusted for pension liabilities in relation to EBITDA. Non-U.S. GAAP measure. See reconciliation table. |
|||
Selected Cash Flow items |
First quarter |
||
(Dollars in millions) |
2024 |
2023 |
Change |
Net income |
$127 |
$74 |
70% |
Changes in operating working capital |
(114) |
(202) |
(43)% |
Depreciation and amortization |
96 |
92 |
4.1% |
Other, net |
14 |
(10) |
n/a |
Operating cash flow |
122 |
(46) |
n/a |
Capital expenditure, net |
(140) |
(143) |
(2.2)% |
Free cash flow1) |
$(18) |
$(189) |
(90)% |
Cash conversion2) |
n/a |
n/a |
n/a |
Shareholder returns |
|
|
|
- Dividends paid |
(56) |
(57) |
(1.9)% |
- Share repurchases |
(160) |
(42) |
286% |
Cash dividend paid per share |
$(0.68) |
$(0.66) |
3.5% |
Capital expenditures, net in relation to sales |
5.4% |
5.7% |
(0.4)pp |
1) Operating cash flow less Capital expenditure, net. Non-U.S. GAAP measure. See enclosed reconciliation table. 2) Free cash flow relative to Net income. Non-U.S. GAAP measure. See reconciliation table. |
|||
|
First quarter 2024 development Changes in operating working capital was $114 million negative in the first quarter, compared to $202 million negative in the same period the prior year. The $88 million improvement was mainly driven by smaller negative effects on cash flow from receivables and other assets, partly offset by increased negative effects from payables and accrued expenses. Other, net was $14 million positive in the first quarter, mainly related to deferred income taxes and other. The $10 million negative in Other, net in the same period the prior year mainly related to deferred income taxes. Operating cash flow increased by $168 million to $122 million compared to the same period last year, mainly due to lower increase in working capital and higher net income. Capital expenditure, net decreased by $3 million compared to the same period the previous year. Capital expenditure, net in relation to sales was 5.4% versus 5.7% a year earlier. Free cash flow* improved by $171 million compared to the same period the prior year, mainly due to the improved operating cash flow. |
|
Trade working capital* decreased by $73 million compared to the same period last year, where the main drivers were $172 million in higher accounts payable partly offset by $88 million in higher accounts receivables and $12 million in higher inventories. In relation to sales, trade working capital decreased from 14.1% to 12.8%. Leverage ratio* As of March 31, 2024, the Company had a leverage ratio of 1.3x compared to 1.6x as of March 31, 2023, as the 12 months trailing adjusted EBITDA* increased more than the net debt* increased. Liquidity position As of March 31, 2024, our cash balance was around $0.6 billion, and including committed, unused loan facilities, our liquidity position was around $1.7 billion. Total equity as of March 31, 2024, decreased by $199 million compared to March 31, 2023. This was mainly due to $225 million in dividend payments and stock repurchases including taxes of $476 million, as well as $63 million in negative currency translation effects, partly offset by $541 million from net income. |
8
Financial Report January - March 2024 |
Headcount
|
Mar 31 |
Dec 31 |
Mar 31 |
|
2024 |
2023 |
2023 |
Headcount |
70,100 |
70,300 |
71,300 |
Whereof: Direct headcount in manufacturing |
52,500 |
52,400 |
52,700 |
Indirect headcount |
17,600 |
17,800 |
18,600 |
Temporary personnel |
10% |
11% |
11% |
As of March 31, 2024, total headcount (Full Time Equivalent) decreased by 1,200 compared to a year earlier. The indirect workforce decreased by 1,000, or by 5.4%, mainly reflecting our structural reduction initiatives. The direct workforce decreased by 0.4%, despite sales growing organically by 5% compared to a year earlier. |
|
Compared to December 31, 2023, total headcount (FTE) decreased by 0.2%. Indirect headcount decreased by 200, or by 1.1% while direct headcount increased by 0.1%. |
9
Financial Report January - March 2024 |
Other Items
|
•
On February 1, 2024, Autoliv announced it had priced a 5.5-year bond offering of €500 million in the Eurobond market. The notes were issued as green bonds on February 7, 2024 at a coupon of 3.625%.
•
On March 6, 2024, Autoliv announced the renewal for one year of its €3 billion guaranteed euro medium term note program, originally established on April 11, 2019.
•
In Q1 2024, Autoliv repurchased and retired 1.37 million shares of common stock at an average price of $116.78 per share under the Autoliv 2022-2024 stock purchase program.
|
|
• Following Autoliv's first partnership in 2021 with SSAB on fossil-free steel, we now introduce two additional collaborations for carbon-reduced steel with Arvedi and Thyssenkrupp. The aim is to reduce greenhouse gas emissions in our products by utilizing low-emission steel and increase recycled content in the material.
|
|
Next Report Autoliv intends to publish the quarterly earnings report for the second quarter of 2024 on Friday, July 19, 2024. |
|
Footnotes *Non-U.S. GAAP measure, see enclosed reconciliation tables. |
|
Inquiries: Investors and Analysts Anders Trapp Vice President Investor Relations Tel +46 (0)8 5872 0671 Henrik Kaar Director Investor Relations Tel +46 (0)8 5872 0614
Inquiries: Media Gabriella Etemad Senior Vice President Communications Tel +46 (0)70 612 6424 Autoliv, Inc. is obliged to make this information public pursuant to the EU Market Abuse Regulation. The information was submitted for publication, through the agency of the VP of Investor Relations set out above, at 12.00 CET on April 26, 2024. |
Definitions and SEC Filings Please refer to www.autoliv.com or to our Annual Report for definitions of terms used in this report. Autoliv’s annual report to stockholders, annual report on Form 10-K, quarterly reports on Form 10Q, proxy statements, management certifications, press releases, current reports on Form 8-K and other documents filed with the SEC can be obtained free of charge from Autoliv at the Company’s address. These documents are also available at the SEC’s website www.sec.gov and at Autoliv’s corporate website www.autoliv.com. This report includes content supplied by S&P Global; Copyright © Light Vehicle Production Forecast, January and April 2024. All rights reserved. S&P Global is a global supplier of independent industry information. The permission to use S&P Global copyrighted reports, data and information does not constitute an endorsement or approval by S&P Global of the manner, format, context, content, conclusion, opinion or viewpoint in which S&P Global reports, data and information or its derivations are used or referenced herein. |
10
Financial Report January - March 2024 |
“Safe Harbor Statement”
This report contains statements that are not historical facts but rather forward-looking statements within the meaning of the Private Securities Litigation Reform Act of 1995. Such forward-looking statements include those that address activities, events or developments that Autoliv, Inc. or its management believes or anticipates may occur in the future. All forward-looking statements are based upon our current expectations, various assumptions and/or data available from third parties. Our expectations and assumptions are expressed in good faith and we believe there is a reasonable basis for them. However, there can be no assurance that such forward-looking statements will materialize or prove to be correct as forward-looking statements are inherently subject to known and unknown risks, uncertainties and other factors which may cause actual future results, performance or achievements to differ materially from the future results, performance or achievements expressed in or implied by such forward-looking statements. In some cases, you can identify these statements by forward-looking words such as “estimates”, “expects”, “anticipates”, “projects”, “plans”, “intends”, “believes”, “may”, “likely”, “might”, “would”, “should”, “could”, or the negative of these terms and other comparable terminology, although not all forward-looking statements contain such words. Because these forward-looking statements involve risks and uncertainties, the outcome could differ materially from those set out in the forward-looking statements for a variety of reasons, including without limitation, general economic conditions, including inflation; changes in light vehicle production; fluctuation in vehicle production schedules for which the Company is a supplier; global supply chain disruptions, including port, transportation and distribution delays or interruptions; supply chain disruptions and component shortages specific to the automotive industry or the Company; disruptions and impacts relating to the ongoing war between Russia and Ukraine and the hostilities in the Middle East; changes in general industry and market conditions or regional growth or decline; changes in and the successful execution of our capacity alignment, restructuring, cost reduction and efficiency initiatives and the market reaction thereto; loss of business from increased competition; higher raw material, fuel and energy costs; changes in consumer and customer preferences for end products; |
|
customer losses; changes in regulatory conditions; customer bankruptcies, consolidations, or restructuring or divestiture of customer brands; unfavorable fluctuations in currencies or interest rates among the various jurisdictions in which we operate; market acceptance of our new products; costs or difficulties related to the integration of any new or acquired businesses and technologies; continued uncertainty in pricing and other negotiations with customers; successful integration of acquisitions and operations of joint ventures; successful implementation of strategic partnerships and collaborations; our ability to be awarded new business; product liability, warranty and recall claims and investigations and other litigation, civil judgments or financial penalties and customer reactions thereto; higher expenses for our pension and other postretirement benefits, including higher funding needs for our pension plans; work stoppages or other labor issues; possible adverse results of pending or future litigation or infringement claims and the availability of insurance with respect to such matters; our ability to protect our intellectual property rights; negative impacts of antitrust investigations or other governmental investigations and associated litigation relating to the conduct of our business; tax assessments by governmental authorities and changes in our effective tax rate; dependence on key personnel; legislative or regulatory changes impacting or limiting our business; our ability to meet our sustainability targets, goals and commitments; political conditions; dependence on and relationships with customers and suppliers; the conditions necessary to hit our medium term financial targets; and other risks and uncertainties identified under the headings “Risk Factors” and “Management’s Discussion and Analysis of Financial Condition and Results of Operations” in our Annual Reports and Quarterly Reports on Forms 10-K and 10-Q and any amendments thereto. For any forward-looking statements contained in this or any other document, we claim the protection of the safe harbor for forward-looking statements contained in the Private Securities Litigation Reform Act of 1995, and we assume no obligation to update publicly or revise any forward-looking statements in light of new information or future events, except as required by law. |
11
Financial Report January - March 2024 |
Consolidated Statements of Income
|
First quarter |
Latest 12 |
Full Year |
|
(Dollars in millions, except per share data, unaudited) |
2024 |
2023 |
months |
2023 |
Airbags, Steering Wheels and Other1) |
$1,781 |
$1,673 |
$7,163 |
$7,055 |
Seatbelt products and Other1) |
834 |
820 |
3,434 |
3,420 |
Total net sales |
2,615 |
2,493 |
10,597 |
10,475 |
|
|
|
|
|
Cost of sales |
(2,172) |
(2,113) |
(8,712) |
(8,654) |
Gross profit |
443 |
379 |
1,885 |
1,822 |
|
|
|
|
|
Selling, general & administrative expenses |
(132) |
(132) |
(500) |
(500) |
Research, development & engineering expenses, net |
(113) |
(116) |
(421) |
(425) |
Other income (expense), net |
(4) |
(4) |
(207) |
(207) |
Operating income |
194 |
127 |
756 |
690 |
|
|
|
|
|
Income from equity method investments |
2 |
2 |
5 |
5 |
Interest income |
5 |
2 |
16 |
13 |
Interest expense |
(26) |
(19) |
(99) |
(93) |
Other non-operating items, net |
(1) |
(2) |
(1) |
(3) |
Income before income taxes |
174 |
109 |
677 |
612 |
|
|
|
|
|
Income taxes |
(47) |
(34) |
(136) |
(123) |
Net income |
127 |
74 |
541 |
489 |
|
|
|
|
|
Less: Net income attributable to non-controlling interest |
0 |
0 |
2 |
1 |
Net income attributable to controlling interest |
$126 |
$74 |
$540 |
$488 |
|
|
|
|
|
Earnings per share2) |
$1.52 |
$0.86 |
$6.40 |
$5.72 |
1) Including Corporate sales. 2) Assuming dilution when applicable and net of treasury shares. |
||||
12
Financial Report January - March 2024 |
Consolidated Balance Sheets
|
|
Mar 31 |
Dec 31 |
Sep 30 |
Jun 30 |
Mar 31 |
(Dollars in millions, unaudited) |
|
2024 |
2023 |
2023 |
2023 |
2023 |
Assets |
|
|
|
|
|
|
Cash & cash equivalents |
|
$569 |
$498 |
$475 |
$475 |
$713 |
Receivables, net |
|
2,194 |
2,198 |
2,179 |
2,189 |
2,106 |
Inventories, net |
|
997 |
1,012 |
982 |
947 |
986 |
Prepaid expenses |
|
180 |
173 |
180 |
166 |
166 |
Other current assets |
|
71 |
93 |
63 |
120 |
90 |
Total current assets |
|
4,011 |
3,974 |
3,879 |
3,898 |
4,061 |
|
|
|
|
|
|
|
Property, plant & equipment, net |
|
2,192 |
2,192 |
2,067 |
2,047 |
2,045 |
Operating leases right-of-use assets |
|
177 |
176 |
162 |
149 |
169 |
Goodwill |
|
1,381 |
1,385 |
1,378 |
1,381 |
1,383 |
Investments and other non-current assets |
|
564 |
606 |
500 |
484 |
528 |
Total assets |
|
8,324 |
8,332 |
7,987 |
7,959 |
8,185 |
|
|
|
|
|
|
|
Liabilities and equity |
|
|
|
|
|
|
Short-term debt |
|
310 |
538 |
590 |
481 |
577 |
Accounts payable |
|
1,855 |
1,978 |
1,858 |
1,844 |
1,683 |
Accrued expenses |
|
1,129 |
1,135 |
1,093 |
1,122 |
969 |
Operating lease liabilities - current |
|
41 |
39 |
37 |
35 |
41 |
Other current liabilities |
|
323 |
345 |
274 |
274 |
258 |
Total current liabilities |
|
3,658 |
4,035 |
3,851 |
3,756 |
3,529 |
|
|
|
|
|
|
|
Long-term debt |
|
1,830 |
1,324 |
1,277 |
1,290 |
1,601 |
Pension liability |
|
149 |
159 |
152 |
152 |
159 |
Operating lease liabilities - non-current |
|
134 |
135 |
125 |
113 |
127 |
Other non-current liabilities |
|
111 |
109 |
96 |
91 |
128 |
Total non-current liabilities |
|
2,224 |
1,728 |
1,649 |
1,645 |
2,015 |
|
|
|
|
|
|
|
Total parent shareholders’ equity |
|
2,428 |
2,557 |
2,473 |
2,545 |
2,627 |
Non-controlling interest |
|
13 |
13 |
13 |
13 |
14 |
Total equity |
|
2,442 |
2,570 |
2,486 |
2,557 |
2,641 |
|
|
|
|
|
|
|
Total liabilities and equity |
|
$8,324 |
$8,332 |
$7,987 |
$7,959 |
$8,185 |
13
Financial Report January - March 2024 |
Consolidated Statements of Cash Flow
|
First quarter |
Latest 12 |
Full Year |
|
(Dollars in millions, unaudited) |
2024 |
2023 |
months |
2023 |
Net income |
$127 |
$74 |
$541 |
$489 |
Depreciation and amortization |
96 |
92 |
381 |
378 |
Other, net |
14 |
(10) |
(96) |
(119) |
Changes in operating working capital, net |
(114) |
(202) |
323 |
235 |
Net cash provided by (used in) operating activities |
122 |
(46) |
1,150 |
982 |
|
|
|
|
|
Expenditures for property, plant and equipment |
(140) |
(144) |
(569) |
(572) |
Proceeds from sale of property, plant and equipment |
0 |
0 |
4 |
4 |
Net cash used in investing activities |
(140) |
(143) |
(565) |
(569) |
|
|
|
|
|
Free cash flow1) |
(18) |
(189) |
584 |
414 |
|
|
|
|
|
(Decrease) increase in short term debt |
(227) |
(135) |
(31) |
61 |
Decrease in long-term debt |
- |
- |
(533) |
(533) |
Increase in long-term debt |
534 |
533 |
561 |
559 |
Dividends paid |
(56) |
(57) |
(224) |
(225) |
Share repurchases |
(160) |
(42) |
(471) |
(352) |
Common stock options exercised |
0 |
0 |
1 |
1 |
Dividend paid to non-controlling interests |
- |
- |
(1) |
(1) |
Net cash provided by (used in) financing activities |
92 |
300 |
(698) |
(490) |
|
|
|
|
|
Effect of exchange rate changes on cash |
(3) |
7 |
(30) |
(20) |
Increase (decrease) in cash and cash equivalents |
71 |
119 |
(144) |
(96) |
Cash and cash equivalents at period-start |
498 |
594 |
713 |
594 |
Cash and cash equivalents at period-end |
$569 |
$713 |
$569 |
$498 |
1) Non-U.S. GAAP measure comprised of "Net cash provided by operating activities" and "Net cash used in investing activities". See reconciliation table. |
||||
14
Financial Report January - March 2024 |
RECONCILIATION OF U.S. GAAP TO NON-U.S. GAAP MEASURES
In this report we sometimes refer to non-U.S. GAAP measures that we and securities analysts use in measuring Autoliv's performance. We believe that these measures assist investors and management in analyzing trends in the Company's business for the reasons given below. Investors should not consider these non-U.S. GAAP measures as substitutes, but rather as additions, to financial reporting measures prepared in accordance with U.S. GAAP. It should be noted that these measures, as defined, may not be comparable to similarly titled measures used by other companies.
Components in Sales Increase/Decrease
Since the Company historically generates approximately 75% of sales in currencies other than in the reporting currency (i.e., U.S. dollars) and currency rates have been volatile, we analyze the Company's sales trends and performance as changes in organic sales growth. This presents the increase or decrease in the overall U.S. dollar net sales on a comparable basis, allowing separate discussions of the impact of acquisitions/divestitures and exchange rates. The tables on page 6 present changes in organic sales growth as reconciled to the change in the total U.S. GAAP net sales.
Trade Working Capital
Due to the need to optimize cash generation to create value for shareholders, management focuses on operationally derived trade working capital as defined in the table below. The reconciling items used to derive this measure are, by contrast, managed as part of our overall management of cash and debt, but they are not part of the responsibilities of day-to-day operations management.
|
Mar 31 |
Dec 31 |
Sep 30 |
Jun 30 |
Mar 31 |
(Dollars in millions) |
2024 |
2023 |
2023 |
2023 |
2023 |
Receivables, net |
$2,194 |
$2,198 |
$2,179 |
$2,189 |
$2,106 |
Inventories, net |
997 |
1,012 |
982 |
947 |
986 |
Accounts payable |
(1,855) |
(1,978) |
(1,858) |
(1,844) |
(1,683) |
Trade Working capital |
$1,336 |
$1,232 |
$1,303 |
$1,292 |
$1,409 |
Net Debt
Autoliv from time to time enters into “debt-related derivatives” (DRDs) as a part of its debt management and as part of efficiently managing the Company’s overall cost of funds. Creditors and credit rating agencies use net debt adjusted for DRDs in their analyses of the Company’s debt, therefore we provide this non-U.S. GAAP measure. DRDs are fair value adjustments to the carrying value of the underlying debt. Also included in the DRDs is the unamortized fair value adjustment related to a discontinued fair value hedge that will be amortized over the remaining life of the debt. By adjusting for DRDs, the total financial liability of net debt is disclosed without grossing debt up with currency or interest fair values.
|
Mar 31 |
Dec 31 |
Sep 30 |
Jun 30 |
Mar 31 |
(Dollars in millions) |
2024 |
2023 |
2023 |
2023 |
2023 |
Short-term debt |
$310 |
$538 |
$590 |
$481 |
$577 |
Long-term debt |
1,830 |
1,324 |
1,277 |
1,290 |
1,601 |
Total debt |
2,140 |
1,862 |
1,867 |
1,771 |
2,179 |
Cash & cash equivalents |
(569) |
(498) |
(475) |
(475) |
(713) |
Debt issuance cost/Debt-related derivatives, net |
(9) |
3 |
(17) |
4 |
12 |
Net debt |
$1,562 |
$1,367 |
$1,375 |
$1,299 |
$1,477 |
|
|||||
|
|
Dec 31 |
Dec 31 |
Dec 31 |
Dec 31 |
(Dollars in millions) |
|
2022 |
2021 |
2020 |
2019 |
Short-term debt |
|
$711 |
$346 |
$302 |
$368 |
Long-term debt |
|
1,054 |
1,662 |
2,110 |
1,726 |
Total debt |
|
1,766 |
2,008 |
2,411 |
2,094 |
Cash & cash equivalents |
|
(594) |
(969) |
(1,178) |
(445) |
Debt issuance cost/Debt-related derivatives, net |
|
12 |
13 |
(19) |
0 |
Net debt |
|
$1,184 |
$1,052 |
$1,214 |
$1,650 |
15
Financial Report January - March 2024 |
Leverage ratio
The non-U.S. GAAP measure “net debt” is also used in the non-U.S. GAAP measure “Leverage ratio”. Management uses this measure to analyze the amount of debt the Company can incur under its debt policy. Management believes that this policy also provides guidance to credit and equity investors regarding the extent to which the Company would be prepared to leverage its operations. Autoliv’s policy is to maintain a leverage ratio commensurate with a strong investment grade credit rating. The Company measures its leverage ratio as net debt* adjusted for pension liabilities in relation to adjusted EBITDA*. The long-term target is to maintain a leverage ratio of around 1.0x within a range of 0.5x to 1.5x.
|
Mar 31 |
Dec 31 |
Mar 31 |
(Dollars in millions) |
2024 |
2023 |
2023 |
Net debt1) |
$1,562 |
$1,367 |
$1,477 |
Pension liabilities |
149 |
159 |
159 |
Debt per the Policy |
$1,711 |
$1,527 |
$1,636 |
|
|
|
|
Net income2) |
$541 |
$489 |
$416 |
Income taxes2) |
136 |
123 |
176 |
Interest expense, net2, 3) |
83 |
80 |
60 |
Other non-operating items, net2) |
1 |
3 |
4 |
Income from equity method investments2) |
(5) |
(5) |
(4) |
Depreciation and amortization of intangibles2) |
381 |
378 |
359 |
Adjustments2), 4) |
231 |
230 |
10 |
EBITDA per the Policy (Adjusted EBITDA) |
$1,369 |
$1,297 |
$1,021 |
|
|
|
|
Leverage ratio |
1.3 |
1.2 |
1.6 |
1) Short- and long-term debt less cash and cash equivalents and debt-related derivatives. 2) Latest 12 months. 3) Interest expense including cost for extinguishment of debt, if any, less interest income. 4) Capacity alignments, antitrust related matters and for FY2023 the Andrews litigation settlement. See Items Affecting Comparability below. |
|||
16
Financial Report January - March 2024 |
Free Cash Flow, Net Cash Before Financing and Cash Conversion
Management uses the non-U.S. GAAP measure “free cash flow” to analyze the amount of cash flow being generated by the Company’s operations after capital expenditure, net. This measure indicates the Company’s cash flow generation level that enables strategic value creation options such as dividends or acquisitions. For details on free cash flow, see the reconciliation table below. Management uses the non-U.S. GAAP measure “net cash before financing” to analyze and disclose the cash flow generation available for servicing external stakeholders such as shareholders and debt stakeholders. For details on net cash before financing, see the reconciliation table below. Management uses the non-U.S. GAAP measure “cash conversion” to analyze the proportion of net income that is converted into free cash flow. The measure is a tool to evaluate how efficiently the Company utilizes its resources. For details on cash conversion, see the reconciliation table below.
|
First quarter |
|
Latest 12 |
Full Year |
|
(Dollars in millions) |
2024 |
2023 |
|
months |
2023 |
Net income |
$127 |
$74 |
|
$541 |
$489 |
Changes in operating working capital |
(114) |
(202) |
|
323 |
235 |
Depreciation and amortization |
96 |
92 |
|
381 |
378 |
Other, net |
14 |
(10) |
|
(96) |
(119) |
Operating cash flow |
122 |
(46) |
|
1,150 |
982 |
Capital expenditure, net |
(140) |
(143) |
|
(565) |
(569) |
Free cash flow1) |
$(18) |
$(189) |
|
$584 |
$414 |
Cash conversion2) |
n/a |
n/a |
|
108% |
85% |
1) Operating cash flow less Capital expenditure, net. 2) Free cash flow relative to Net income. |
|||||
|
Full year |
Full year |
Full year |
Full year |
(Dollars in millions) |
2022 |
2021 |
2020 |
2019 |
Net income |
$425 |
$437 |
$188 |
$463 |
Changes in operating assets and liabilities |
58 |
(63) |
277 |
47 |
Depreciation and amortization |
363 |
394 |
371 |
351 |
Gain on divestiture of property |
(80) |
- |
- |
- |
Other, net1) |
(54) |
(15) |
13 |
(220) |
Operating cash flow |
713 |
754 |
849 |
641 |
EC antitrust payment |
- |
- |
- |
(203) |
Operating cash flow excl antitrust |
713 |
754 |
849 |
844 |
Capital expenditure, net |
(485) |
(454) |
(340) |
(476) |
Free cash flow2) |
$228 |
$300 |
$509 |
$165 |
Free cash flow excl antitrust payment3) |
$228 |
$300 |
$509 |
$368 |
Cash conversion4) |
54% |
69% |
270% |
36% |
Cash conversion excl antitrust5) |
54% |
69% |
270% |
79% |
1) Including EC antitrust payment 2019. 2) Operating cash flow less Capital expenditure, net. 3) For 2019, Operating cash flow excluding EC antitrust payment less Capital expenditures, net. 4) Free cash flow relative to Net income. 5) For 2019, Free cash flow excluding EC antitrust payment relative to Net income. |
||||
17
Financial Report January - March 2024 |
Items Affecting Comparability
We believe that comparability between periods is improved through the exclusion of certain items. To assist investors in understanding the operating performance of Autoliv's business, it is useful to consider certain U.S. GAAP measures exclusive of these items.
The following table reconciles Income before income taxes, Net income attributable to controlling interest, Capital employed, which are inputs utilized to calculate Return On Capital Employed (“ROCE”), adjusted ROCE and Return On Total Equity (“ROE”). The Company believes this presentation may be useful to investors and industry analysts who utilize these adjusted non-U.S. GAAP measures in their ROCE and ROE calculations to exclude certain items for comparison purposes across periods. Autoliv’s management uses the ROCE, adjusted ROCE and ROE measures for purposes of comparing its financial performance with the financial performance of other companies in the industry and providing useful information regarding the factors and trends affecting the Company’s business.
As used by the Company, ROCE is annualized operating income and income from equity method investments, relative to average capital employed. Adjusted ROCE is annualized operating income and income from equity method investments, relative to average capital employed as adjusted to exclude certain non-recurring items. The Company believes ROCE and adjusted ROCE are useful indicators of long-term performance both absolute and relative to the Company's peers as it allows for a comparison of the profitability of the Company’s capital employed in its business relative to that of its peers.
ROE is the ratio of annualized income (loss) relative to average total equity for the periods presented. The Company’s management believes that ROE is a useful indicator of how well management creates value for its shareholders through its operating activities and its capital management.
With respect to the Andrews litigation settlement, the Company has treated this specific settlement as a non-recurring charge because of the unique nature of the lawsuit, including the facts and legal issues involved.
Accordingly, the tables below reconcile from U.S. GAAP to the equivalent non-U.S. GAAP measure.
|
First quarter 2024 |
|
First quarter 2023 |
||||
(Dollars in millions, except per share data) |
Reported |
Adjust-ments1) |
Non-U.S. |
|
Reported |
Adjust-ments1) |
Non-U.S. |
Operating income |
$194 |
5 |
$199 |
|
$127 |
4 |
$131 |
Operating margin |
7.4% |
0.2% |
7.6% |
|
5.1% |
0.2% |
5.3% |
Income before taxes |
174 |
5 |
179 |
|
109 |
4 |
113 |
Net income attributable to controlling interest |
126 |
4 |
131 |
|
74 |
3 |
77 |
Return on capital employed2) |
19.7% |
0.5% |
20.2% |
|
13.0% |
0.4% |
13.4% |
Return on total equity3) |
20.2% |
0.7% |
20.9% |
|
11.3% |
0.5% |
11.8% |
Earnings per share4) |
$1.52 |
0.05 |
$1.58 |
|
$0.86 |
0.03 |
$0.90 |
1) Effects from capacity alignments and antitrust related matters. 2) Annualized operating income and income from equity method investments, relative to average capital employed. 3) Annualized income relative to average total equity. 4) Assuming dilution and net of treasury shares. |
|||||||
|
|
|
|
|
|
|
|
18
Financial Report January - March 2024 |
|
Latest 12 months |
|
Full year 2023 |
||||
|
Reported |
Adjust-ments1) |
Non-U.S. |
|
Reported |
Adjust-ments1) |
Non-U.S. |
Operating income |
$756 |
$231 |
$987 |
|
$690 |
230 |
$920 |
Operating margin |
7.1% |
2.2% |
9.3% |
|
6.6% |
2.2% |
8.8% |
1) Costs for capacity alignments, antitrust related matters and the Andrews litigation settlement. |
|||||||
|
|
|
|
|
|
|
|
|
Full year 2022 |
|
Full year 2021 |
||||
|
Reported |
Adjust-ments1) |
Non-U.S. |
|
Reported |
Adjust-ments1) |
Non-U.S. |
Operating income |
$659 |
(61) |
$598 |
|
$675 |
8 |
$683 |
Operating margin |
7.5% |
(0.7)% |
6.8% |
|
8.2% |
0.1% |
8.3% |
1) Costs for capacity alignment and antitrust related matters. |
|||||||
|
|
|
|
|
|
|
|
|
Full year 2020 |
|
Full year 2019 |
||||
(Dollars in millions, except per share data) |
Reported |
Adjust-ments1) |
Non-U.S. |
|
Reported |
Adjust-ments1) |
Non-U.S. |
Operating income |
$382 |
99 |
$482 |
|
$726 |
49 |
$774 |
Operating margin, % |
5.1% |
1.4% |
6.5% |
|
8.5% |
0.6% |
9.1% |
1) Costs for capacity alignments and antitrust related matters. |
|||||||
Items included in non-U.S. GAAP adjustments |
First quarter 2024 |
|
First quarter 2023 |
||
|
Adjustment |
Adjustment |
|
Adjustment |
Adjustment |
Capacity alignments |
$2 |
$0.03 |
|
$3 |
$0.04 |
Antitrust related matters |
3 |
0.03 |
|
1 |
0.01 |
Total adjustments to operating income |
5 |
0.06 |
|
4 |
0.05 |
Tax on non-U.S. GAAP adjustments1) |
(1) |
(0.01) |
|
(1) |
(0.01) |
Total adjustments to net income |
$4 |
$0.05 |
|
$3 |
$0.03 |
|
|
|
|
|
|
Average number of shares outstanding - diluted2) |
|
84.4 |
|
|
86.9 |
|
|
|
|
|
|
Annualized adjustment on return on capital employed |
$20 |
|
|
$17 |
|
Adjustment on return on capital employed |
0.5% |
|
|
0.4% |
|
|
|
|
|
|
|
Annualized adjustment on return on total equity |
$18 |
|
|
$12 |
|
Adjustment on return on total equity |
0.7% |
|
|
0.5% |
|
1) The tax is calculated based on the tax laws in the respective jurisdiction(s) of the adjustment(s). 2) Annualized average number of outstanding shares. |
|||||
19
Financial Report January - March 2024 |
(Dollars in millions, except per share data, unaudited) |
2023 |
2022 |
2021 |
2020 |
2019 |
Sales and Income |
|
|
|
|
|
Net sales |
$10,475 |
$8,842 |
$8,230 |
$7,447 |
$8,548 |
Airbag sales1) |
7,055 |
5,807 |
5,380 |
4,824 |
5,676 |
Seatbelt sales |
3,420 |
3,035 |
2,850 |
2,623 |
2,871 |
Operating income |
690 |
659 |
675 |
382 |
726 |
Net income attributable to controlling interest |
488 |
423 |
435 |
187 |
462 |
Earnings per share – basic |
5.74 |
4.86 |
4.97 |
2.14 |
5.29 |
Earnings per share – assuming dilution2) |
5.72 |
4.85 |
4.96 |
2.14 |
5.29 |
Gross margin3) |
17.4% |
15.8% |
18.4% |
16.7% |
18.5% |
S,G&A in relation to sales |
(4.8)% |
(4.9)% |
(5.3)% |
(5.2)% |
(4.7)% |
R,D&E net in relation to sales |
(4.1)% |
(4.4)% |
(4.7)% |
(5.0)% |
(4.7)% |
Operating margin4) |
6.6% |
7.5% |
8.2% |
5.1% |
8.5% |
Adjusted operating margin5,6) |
8.8% |
6.8% |
8.3% |
6.5% |
9.1% |
Balance Sheet |
|||||
Trade working capital7) |
1,232 |
1,183 |
1,332 |
1,366 |
1,417 |
Trade working capital in relation to sales8) |
11.2% |
12.7% |
15.7% |
13.6% |
16.2% |
Receivables outstanding in relation to sales9) |
20.0% |
20.4% |
20.0% |
18.1% |
18.6% |
Inventory outstanding in relation to sales10) |
9.2% |
10.4% |
9.2% |
7.9% |
8.5% |
Payables outstanding in relation to sales11) |
18.0% |
18.1% |
13.5% |
12.5% |
10.8% |
Total equity |
2,570 |
2,626 |
2,648 |
2,423 |
2,122 |
Total parent shareholders’ equity per share |
30.93 |
30.30 |
30.10 |
27.56 |
24.19 |
Current assets excluding cash |
3,475 |
3,119 |
2,705 |
3,091 |
2,557 |
Property, plant and equipment, net |
2,192 |
1,960 |
1,855 |
1,869 |
1,816 |
Intangible assets (primarily goodwill) |
1,385 |
1,382 |
1,395 |
1,412 |
1,410 |
Capital employed |
3,937 |
3,810 |
3,700 |
3,637 |
3,772 |
Net debt6) |
1,367 |
1,184 |
1,052 |
1,214 |
1,650 |
Total assets |
8,332 |
7,717 |
7,537 |
8,157 |
6,771 |
Long-term debt |
1,324 |
1,054 |
1,662 |
2,110 |
1,726 |
Return on capital employed12) |
17.7% |
17.5% |
18.3% |
10.0% |
20.0% |
Return on total equity13) |
19.0% |
16.3% |
17.1% |
9.0% |
23.0% |
Total equity ratio |
31% |
34% |
35% |
30% |
31% |
Cash flow and other data |
|||||
Operating Cash flow |
982 |
713 |
754 |
849 |
641 |
Depreciation and amortization |
378 |
363 |
394 |
371 |
351 |
Capital expenditures, net |
569 |
485 |
454 |
340 |
476 |
Capital expenditures, net in relation to sales |
5.4% |
5.5% |
5.5% |
4.6% |
5.6% |
Free Cash flow6,14) |
414 |
228 |
300 |
509 |
165 |
Cash conversion6,15) |
85% |
54% |
69% |
270% |
36% |
Direct shareholder return16) |
577 |
339 |
165 |
54 |
217 |
Cash dividends paid per share |
2.66 |
2.58 |
1.88 |
0.62 |
2.48 |
Number of shares outstanding (millions)17) |
82.6 |
86.2 |
87.5 |
87.4 |
87.2 |
Number of employees, December 31 |
62,900 |
61,700 |
55,900 |
61,000 |
58,900 |
1) Including steering wheels, inflators and initiators. 2) Assuming dilution and net of treasury shares. 3) Gross profit relative to sales. 4) Operating income relative to sales. 5) Excluding effects from capacity alignments, antitrust related matters and Andrews litigation settlement. 6) Non-US GAAP measure, for reconciliation see tables above. 7) Outstanding receivables and outstanding inventory less outstanding payables. 8) Outstanding receivables and outstanding inventory less outstanding payables relative to annualized fourth quarter sales. 9) Outstanding receivables relative to annualized fourth quarter sales. 10) Outstanding inventory relative to annualized fourth quarter sales. 11) Outstanding payables relative to annualized fourth quarter sales. 12) Operating income and income from equity method investments, relative to average capital employed. 13) Income relative to average total equity. 14) Operating cash flow less Capital expenditures, net. 15) Free cash flow relative to Net income. 16) Dividends paid and Shares repurchased. 17) At year end, excluding dilution and net of treasury shares. |
|||||
20