UNITED STATES
SECURITIES AND EXCHANGE COMMISSION
Washington, D.C. 20549
FORM 6-K
REPORT OF FOREIGN PRIVATE ISSUER
PURSUANT TO RULE 13a-16 OR 15d-16
UNDER THE SECURITIES EXCHANGE ACT OF 1934
For the month of March 2024
Commission File Number: 001-40451
DLocal Limited
(Exact name of registrant as specified in its charter)
Dr. Luis Bonavita 1294
Montevideo
Uruguay 11300
+1 (424) 392-7437
(Address of principal executive office)
Indicate by check mark whether the registrant files or will file annual reports under cover of Form 20-F or Form 40-F:
Form 20-F ☒ Form 40-F ☐
Indicate by check mark if the registrant is submitting the Form 6-K in paper as permitted by Regulation S-T Rule 101(b)(1):
Yes ☐ No ☒
Indicate by check mark if the registrant is submitting the Form 6-K in paper as permitted by Regulation S-T Rule 101(b)(7):
Yes ☐ No ☒
TABLE OF CONTENTS
EXHIBIT
|
|
|
99.1 |
|
|
|
||
99.2 |
|
Annual Report 2023 - dLocal Financial Results Full Year and 4th Quarter of 2023 |
|
||
99.3 |
|
|
|
||
99.4 |
|
dLocal Appoints Dr. Verónica Raffo as Independent Board Member |
|
|
|
99.5 |
|
|
SIGNATURE
Pursuant to the requirements of the Securities Exchange Act of 1934, the registrant has duly caused this report to be signed on its behalf by the undersigned, thereunto duly authorized.
|
DLocal Limited |
|
|
|
|
|
|
|
By: |
/s/ Diego Cabrera Canay |
|
|
Name: |
Diego Cabrera Canay |
|
|
Title: |
Chief Financial Officer |
|
Date: March 19, 2024
EX-99.1

dLocal Reports 2023 Fourth Quarter and Full year Financial Results
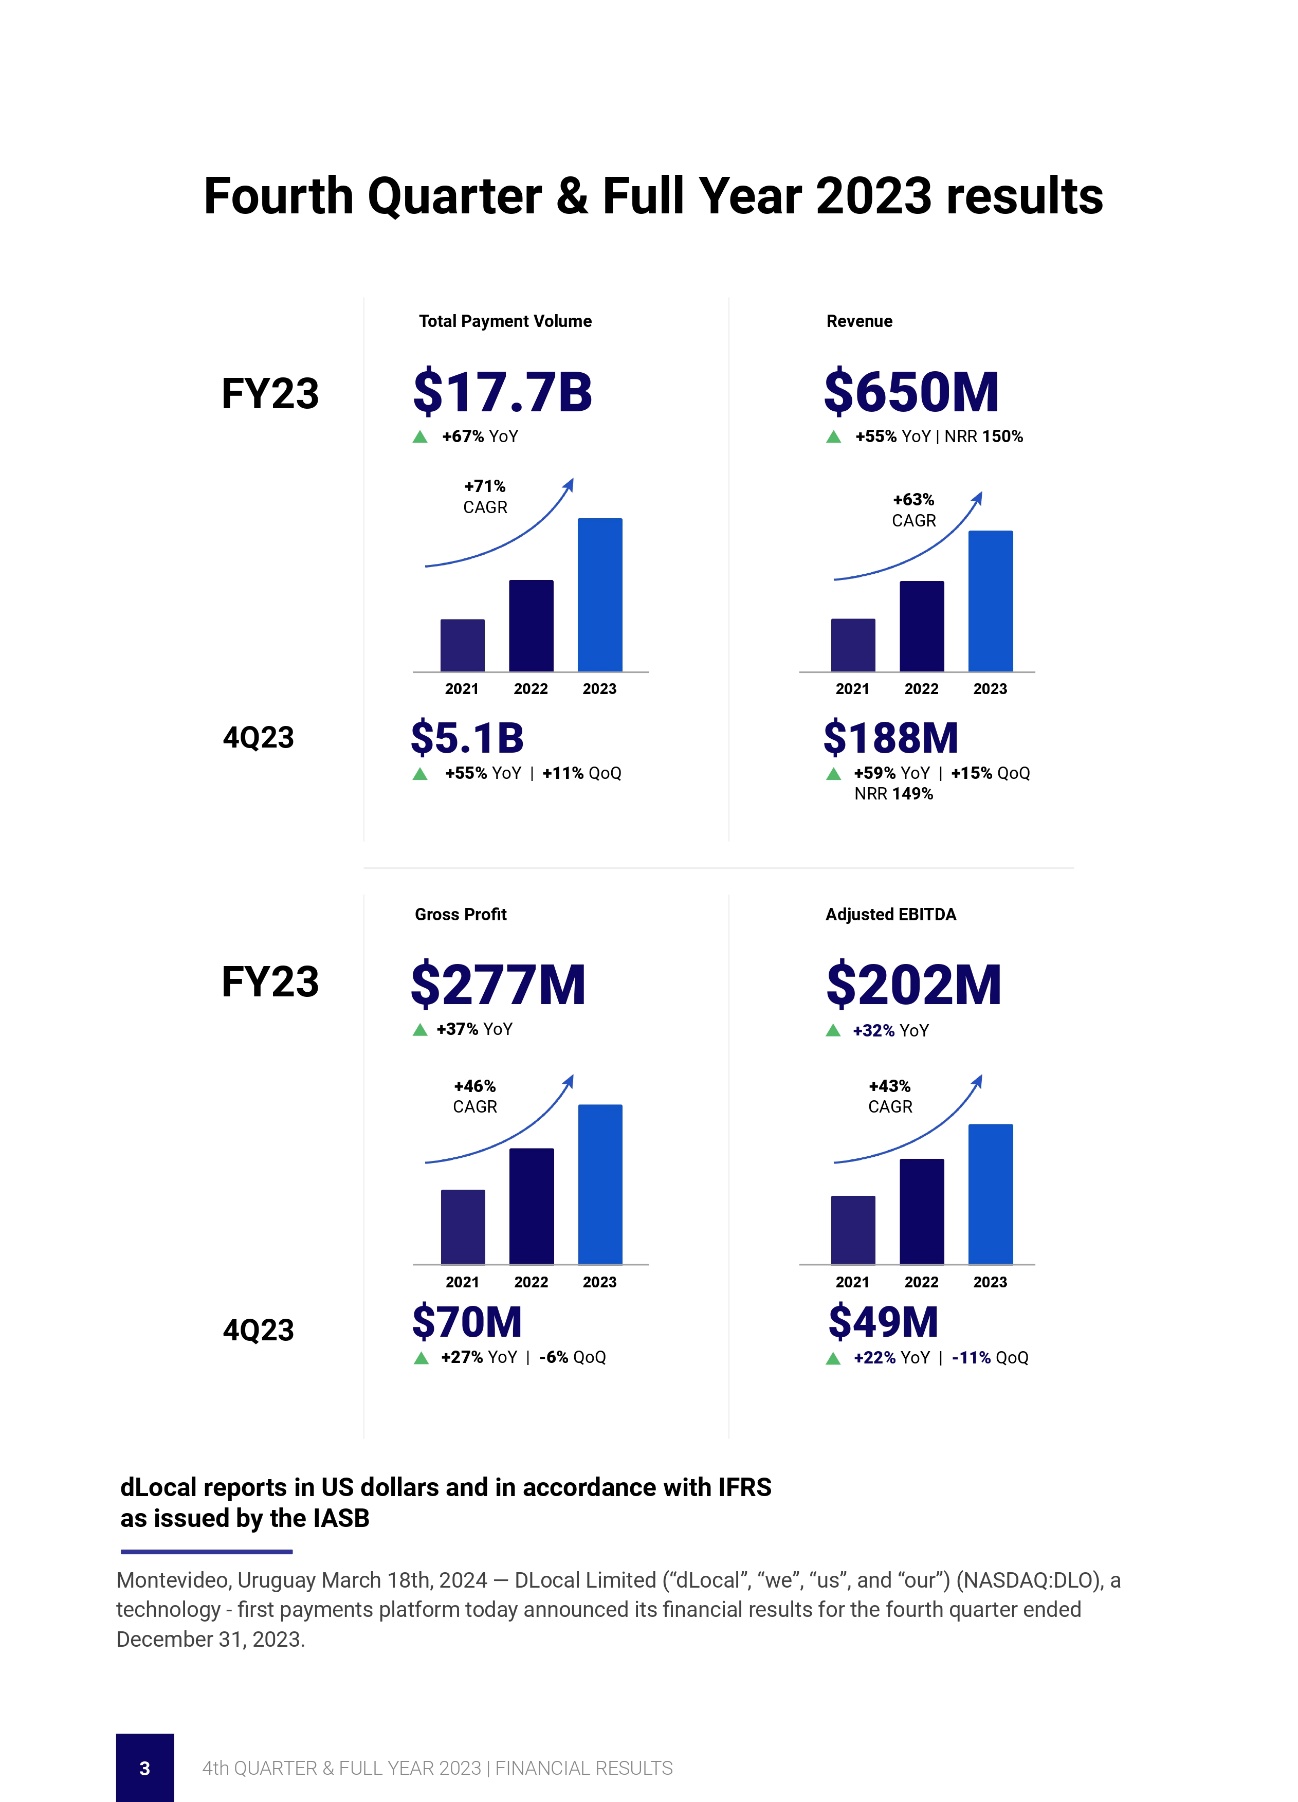
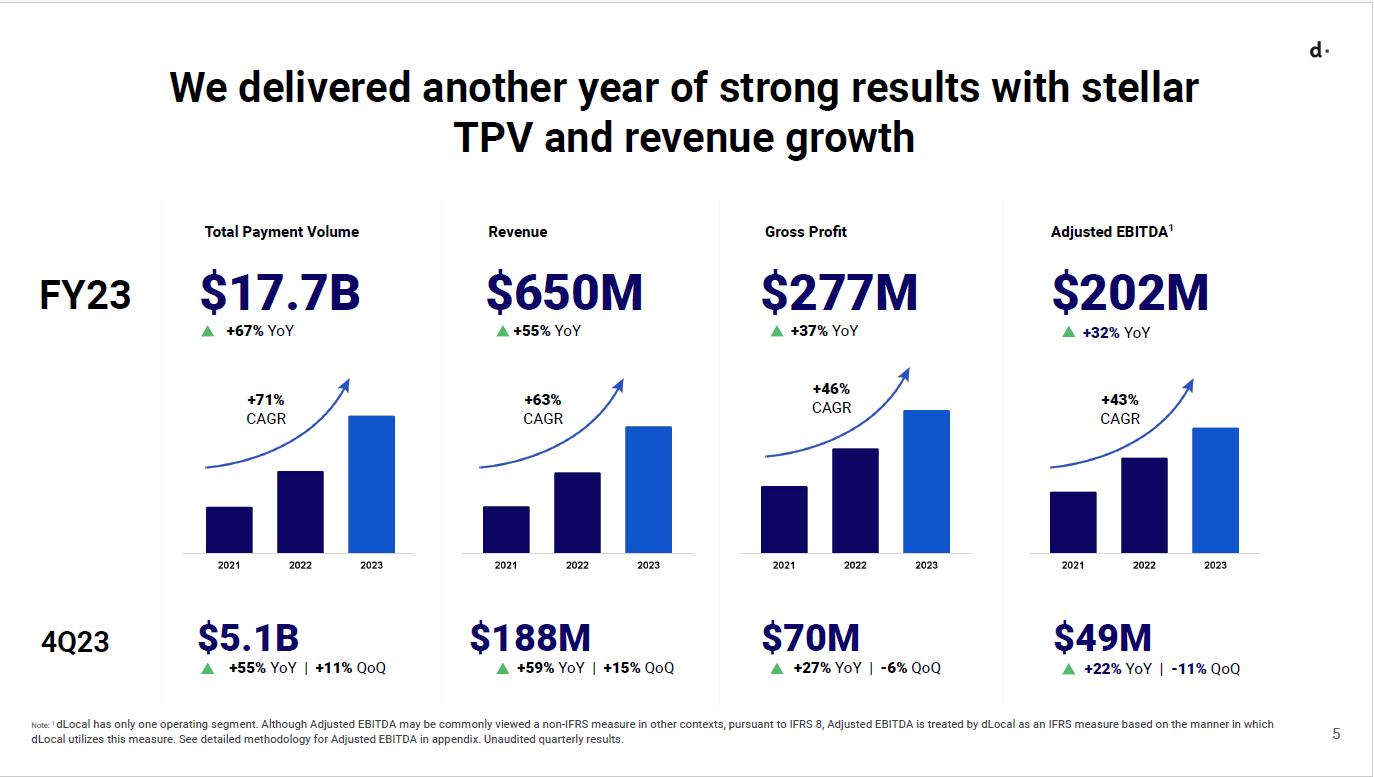
Full Year 2023 results
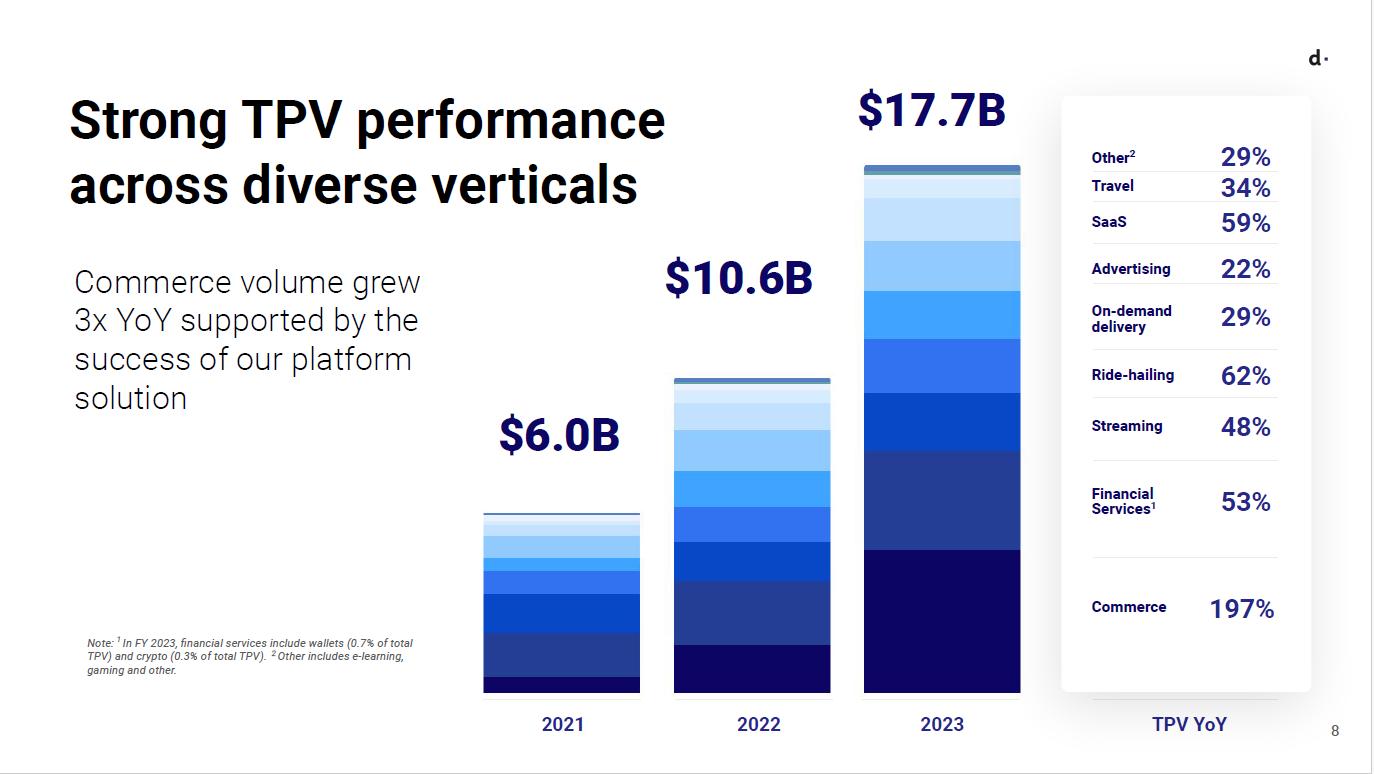
US$17.7 billion Total Payment Volume, up 67% year-over-year
Revenue of US$650 million, up 55% year-over-year
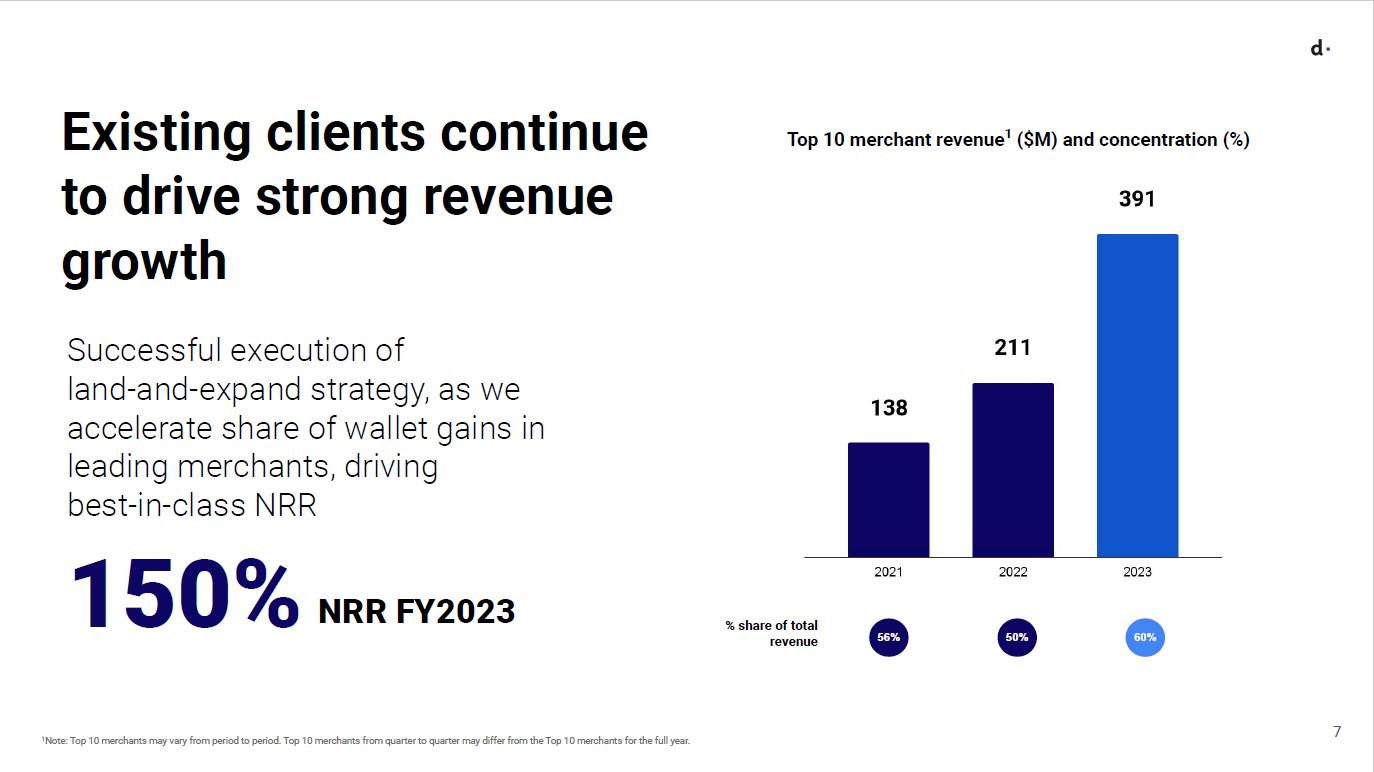
150% Net Revenue Retention Rate
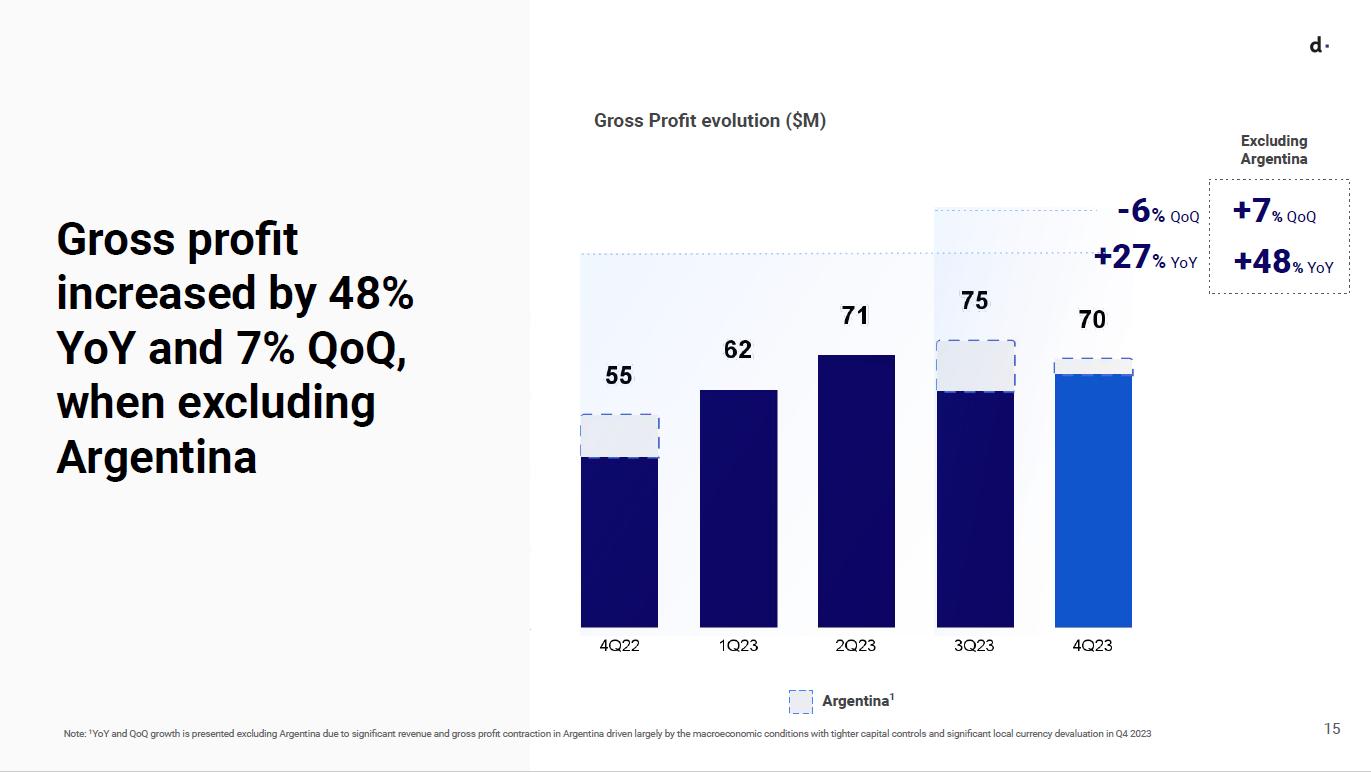
Gross Profit of US$277 million, up 37% year-over-year
Adjusted EBITDA of US$202 million, up 32% year-over-year
Fourth Quarter 2023
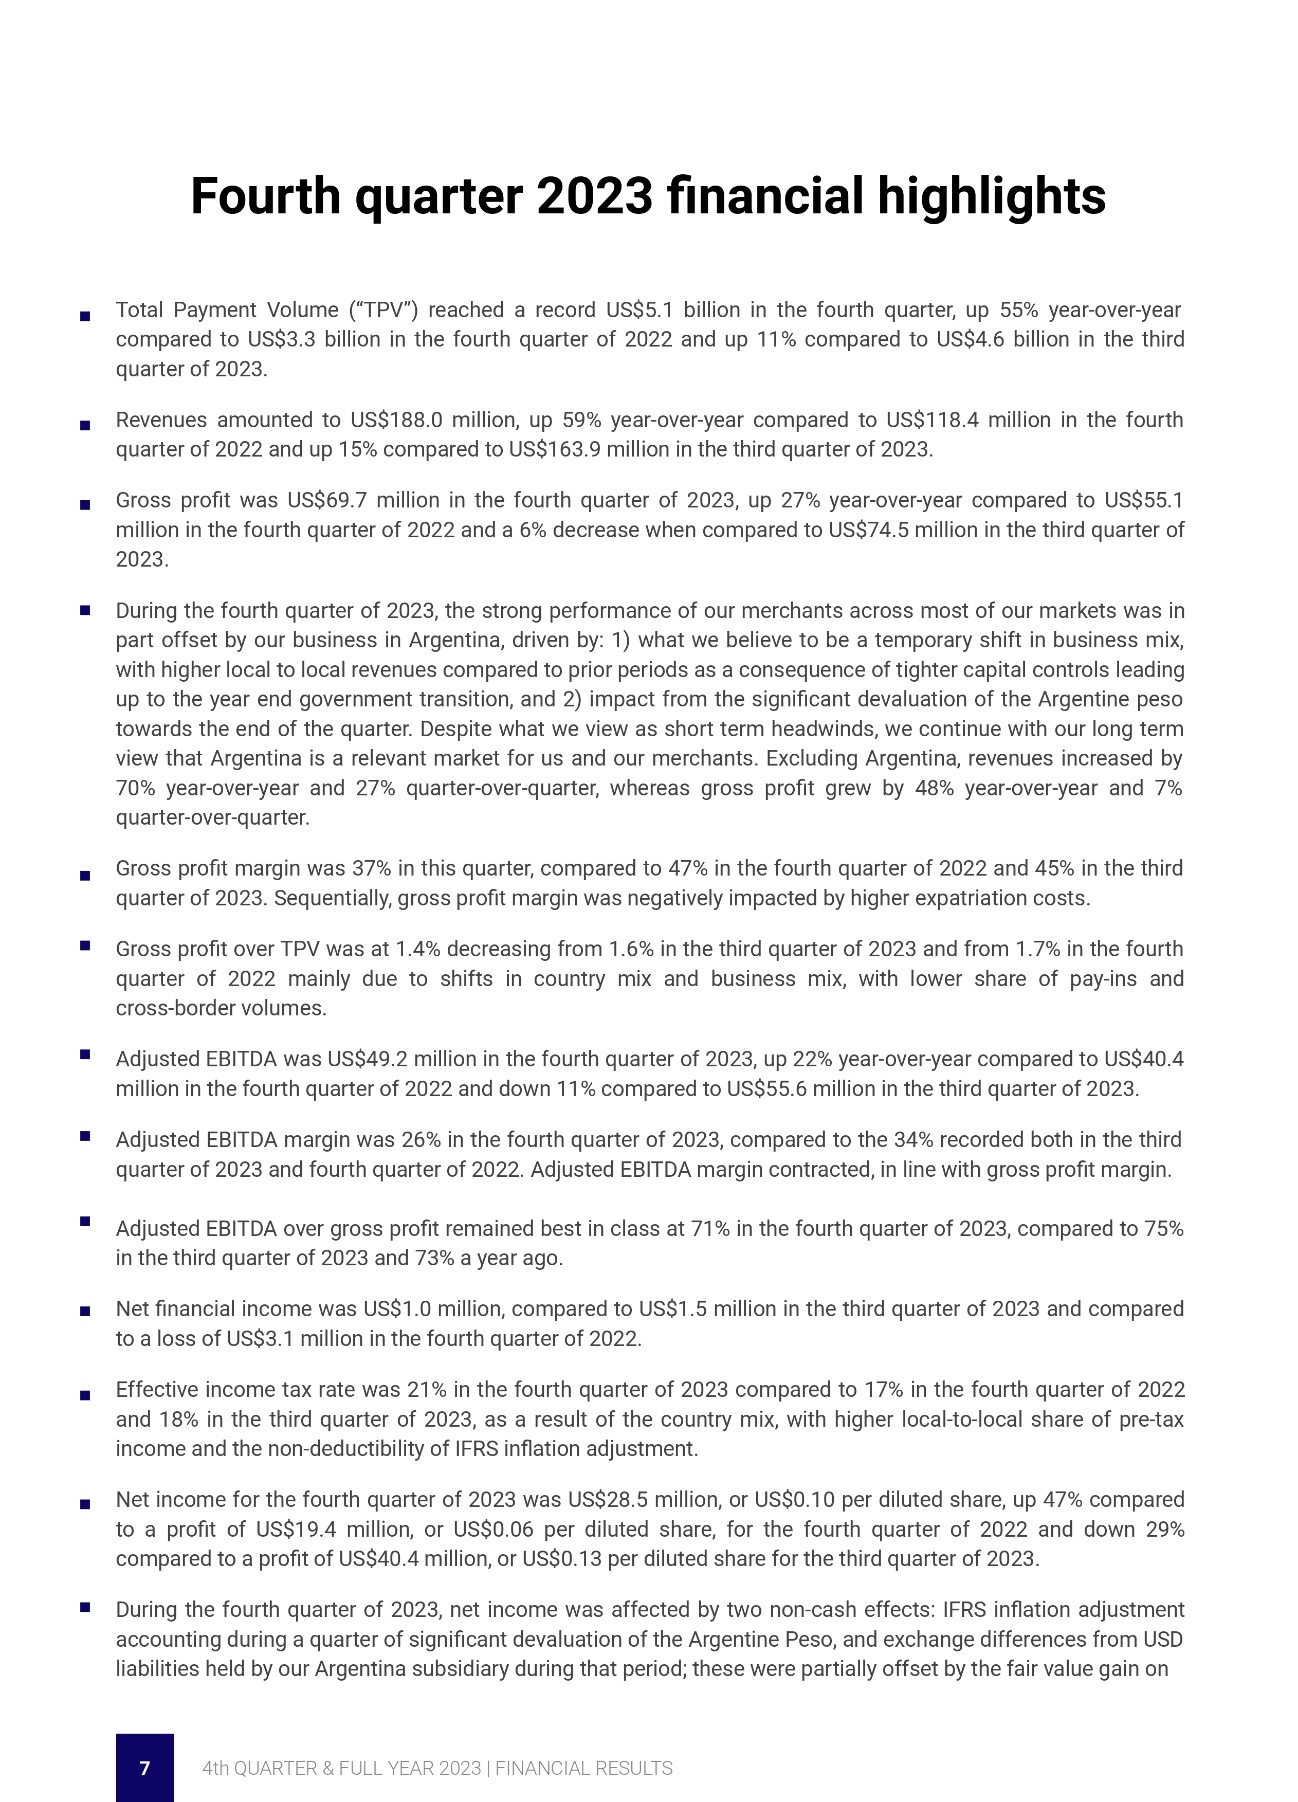
US$5.1 billion Total Payment Volume, up 55% year-over-year and 11% quarter-over-quarter
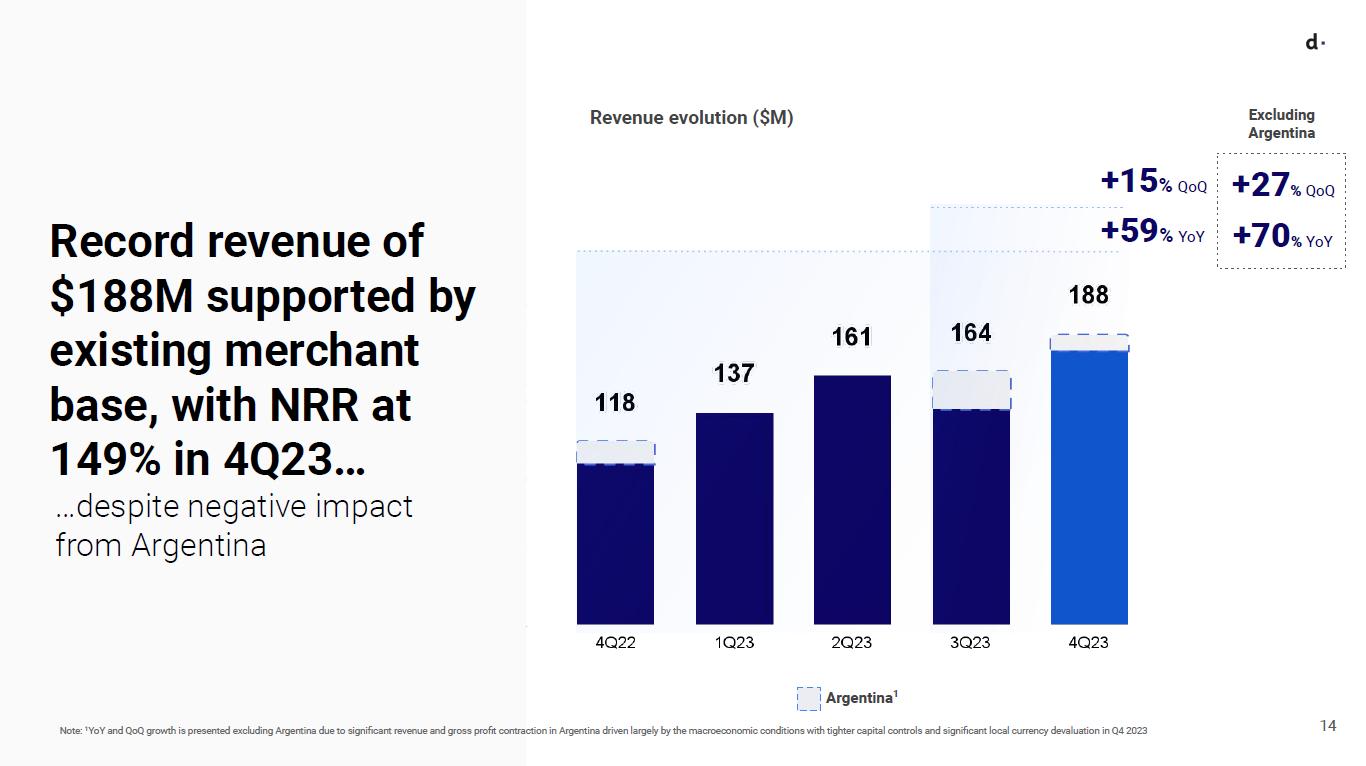
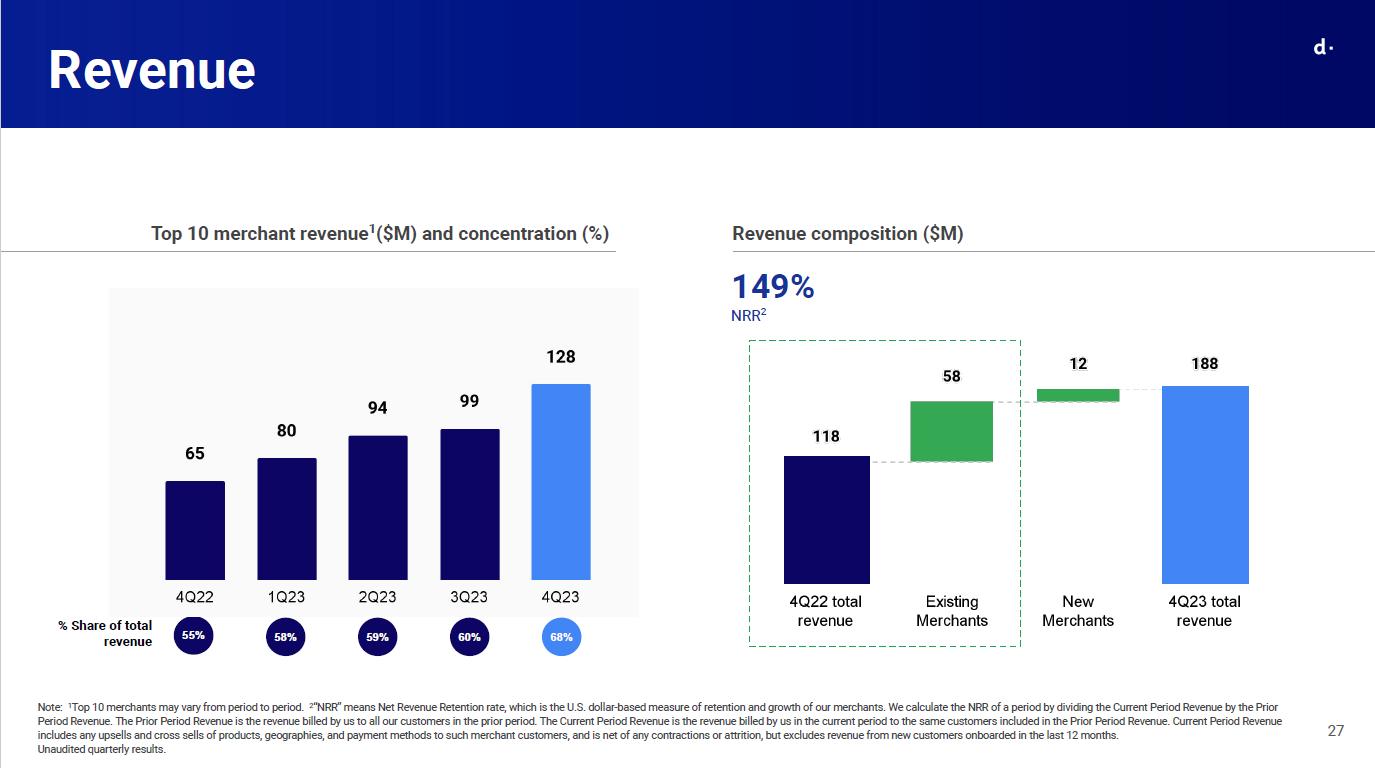
Revenue of US$188 million, up 59% year-over-year and 15% quarter-over-quarter
149% Net Revenue Retention Rate
Gross Profit of US$70 million, up 27% year-over-year and down -6% quarter-over-quarter
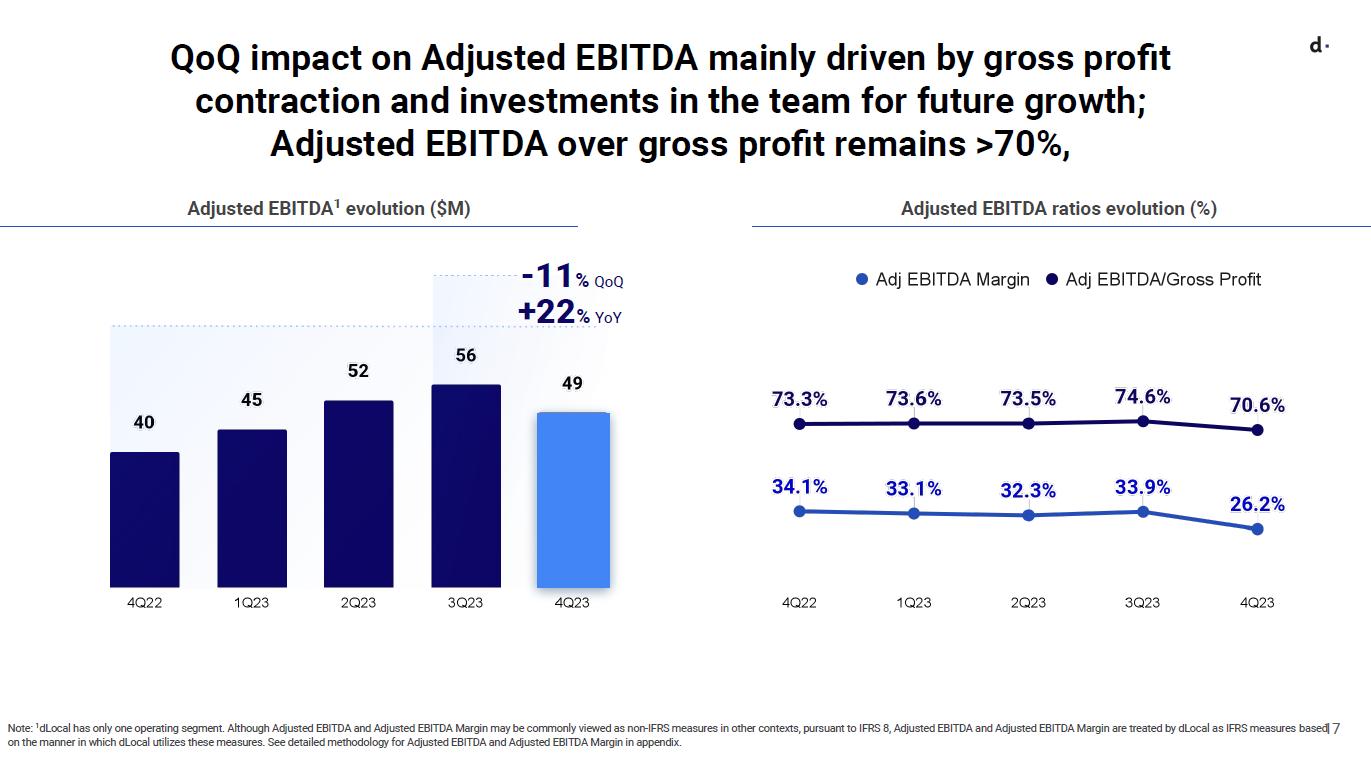
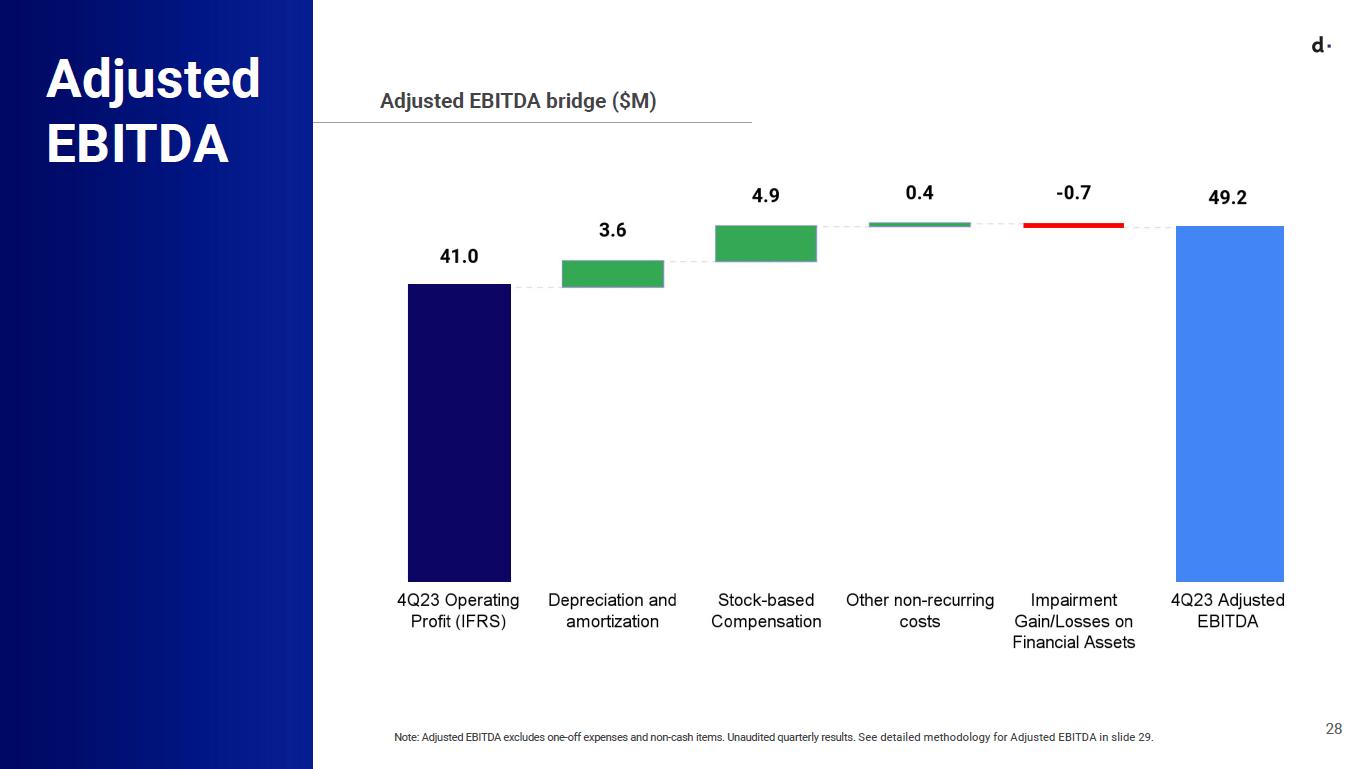
Adjusted EBITDA of US$49 million, up 22% year-over-year and down -11% quarter-over-quarter
dLocal reports in US dollars and in accordance with IFRS as issued by the IASB
Montevideo, Uruguay March 18th, 2024 — DLocal Limited (“dLocal”, “we”, “us”, and “our”) (NASDAQ:DLO), a technology - first payments platform today announced its financial results for the fourth quarter ended December 31, 2023.
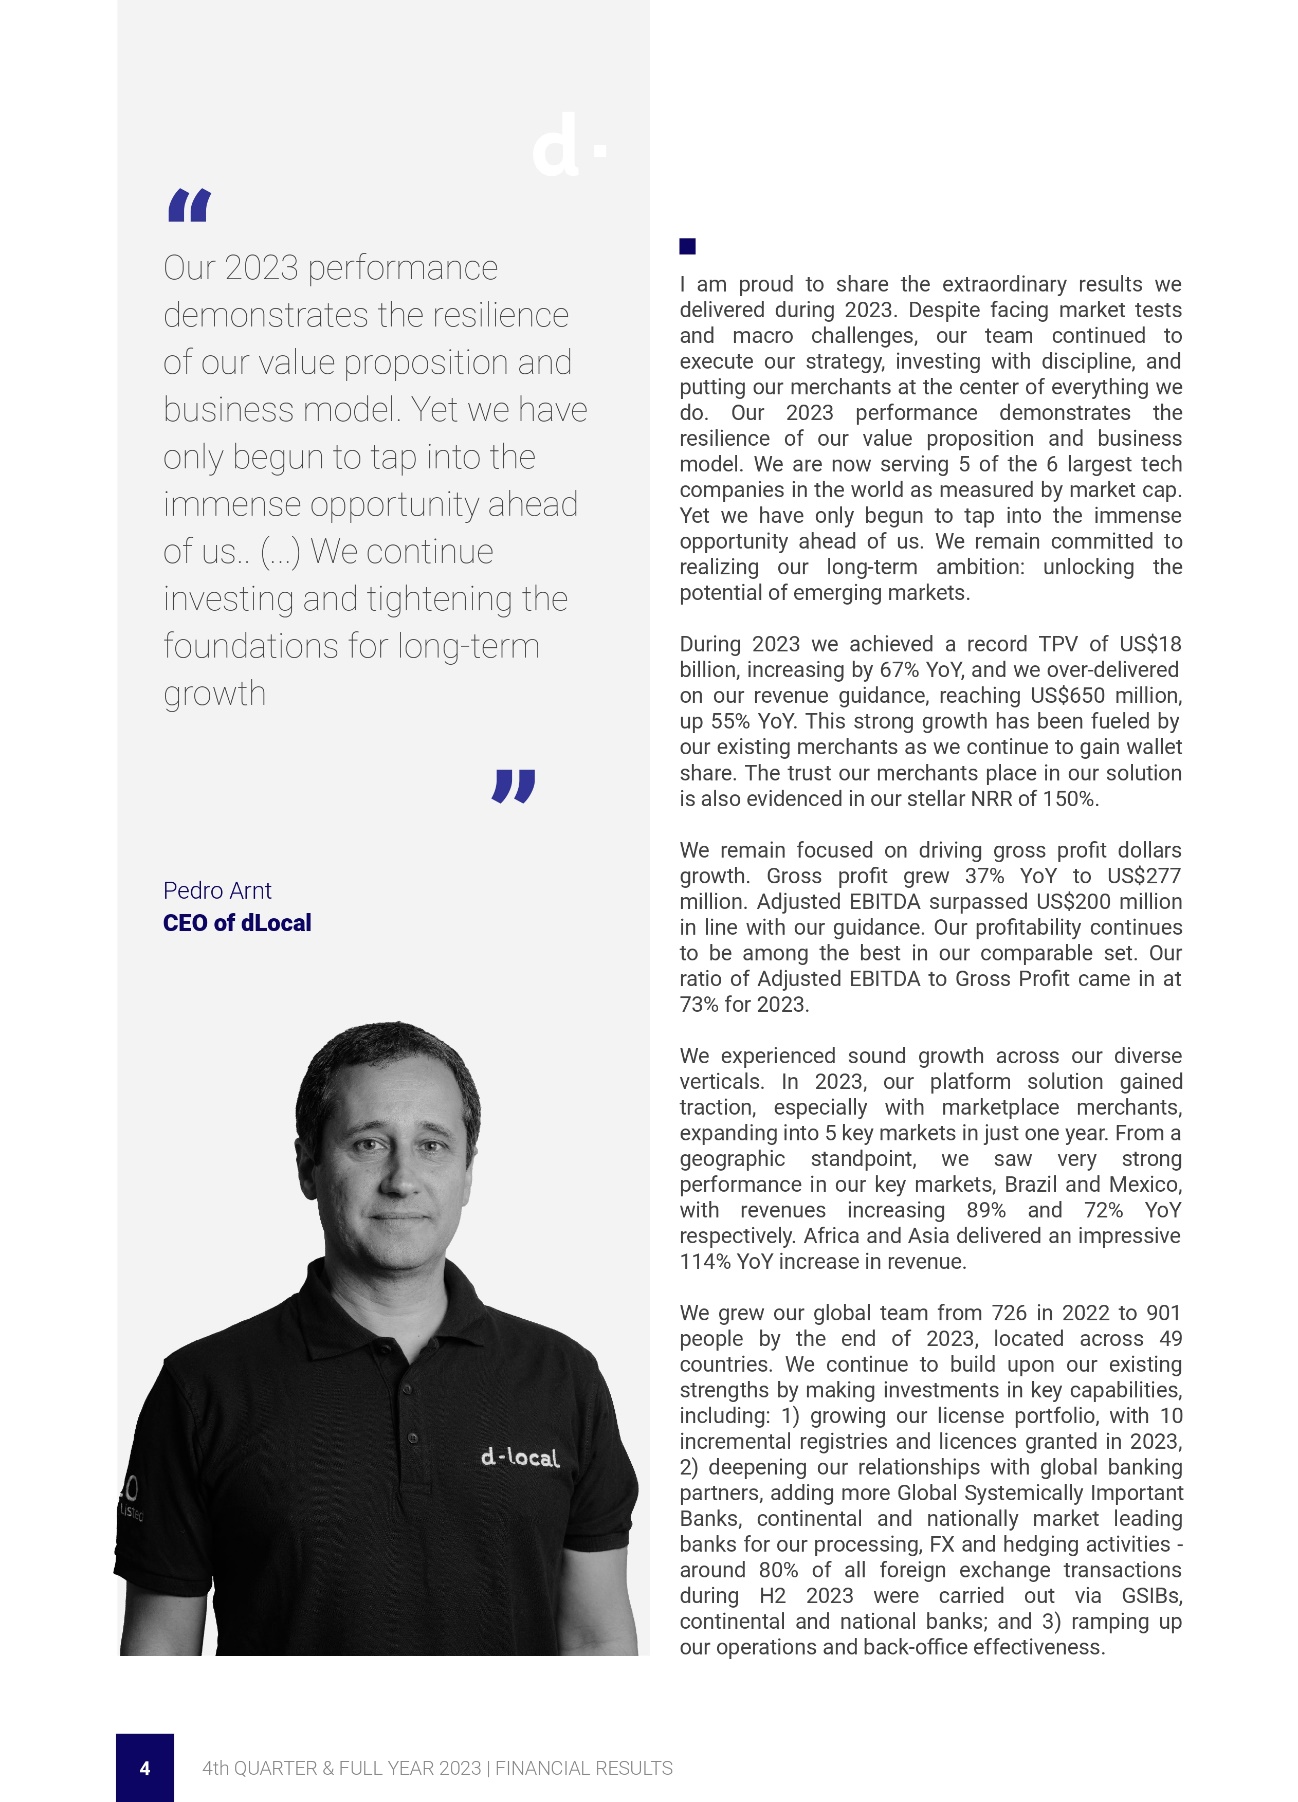
“I am proud to share the extraordinary results we delivered during 2023. Despite facing market tests and macro challenges, our team continued to execute our strategy, investing with discipline, and putting our merchants at the center of everything we do. Our 2023 performance demonstrates the resilience of our value proposition and business model. We are now serving 5 of the 6 largest tech companies in the world as measured by market cap. Yet we have only begun to tap into the immense opportunity ahead of us. We remain committed to realizing our long-term ambition: unlocking the potential of emerging markets.
During 2023 we achieved a record TPV of US$18 billion, increasing by 67% YoY, and we over-delivered on our revenue guidance, reaching US$650 million, up 55% YoY. This strong growth has been fueled by our existing merchants as we continue to gain wallet share. The trust our merchants place in our solution is also evidenced in our stellar NRR of 150%.
We remain focused on driving gross profit dollars growth. Gross profit grew 37% YoY to US$277 million. Adjusted EBITDA surpassed US$200 million in line with our guidance. Our profitability continues to be among the best in our comparable set. Our ratio of Adjusted EBITDA to Gross Profit came in at 73% for 2023.
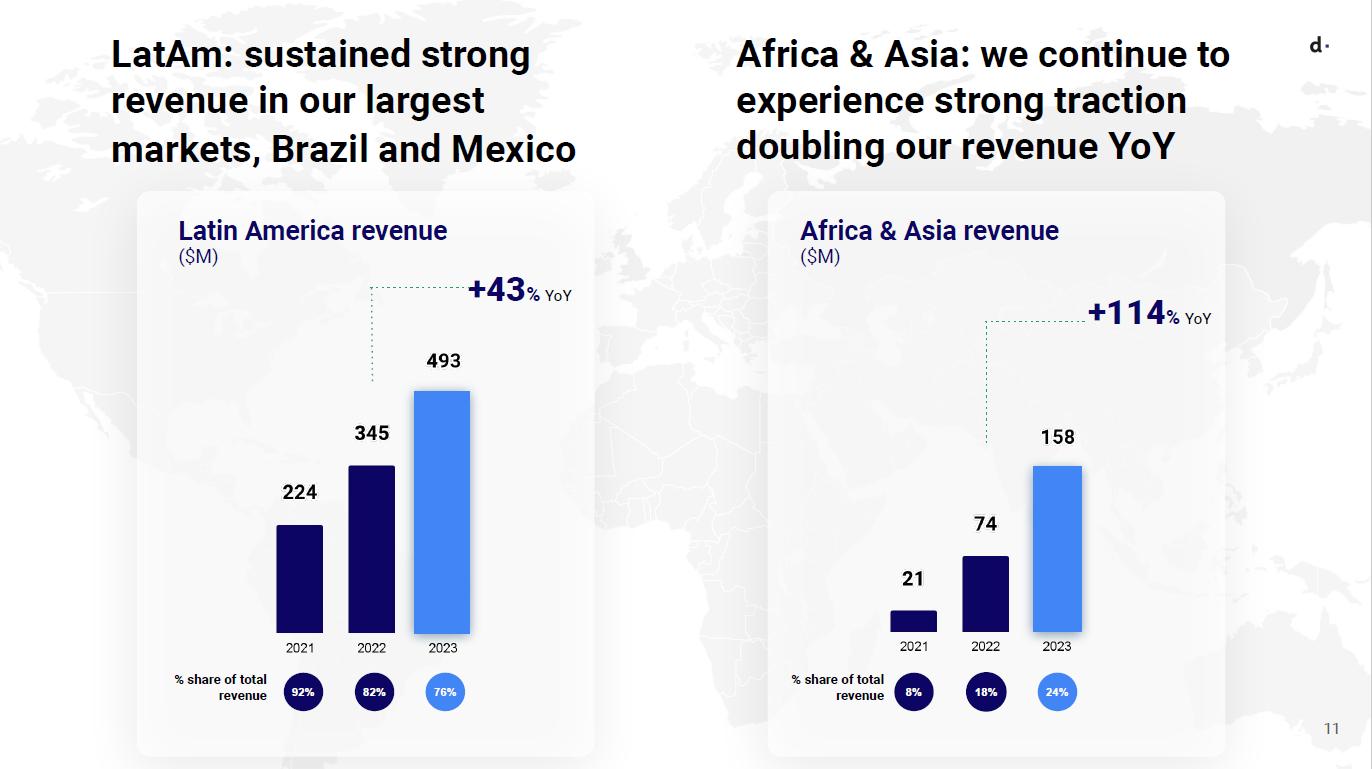
We experienced sound growth across our diverse verticals. In 2023, our platform solution gained traction, especially with marketplace merchants, expanding into 5 key markets in just one year. From a geographic standpoint, we saw very strong performance in our key markets, Brazil and Mexico, with revenues increasing 89% and 72% YoY respectively. Africa and Asia delivered an impressive 114% YoY increase in revenue.
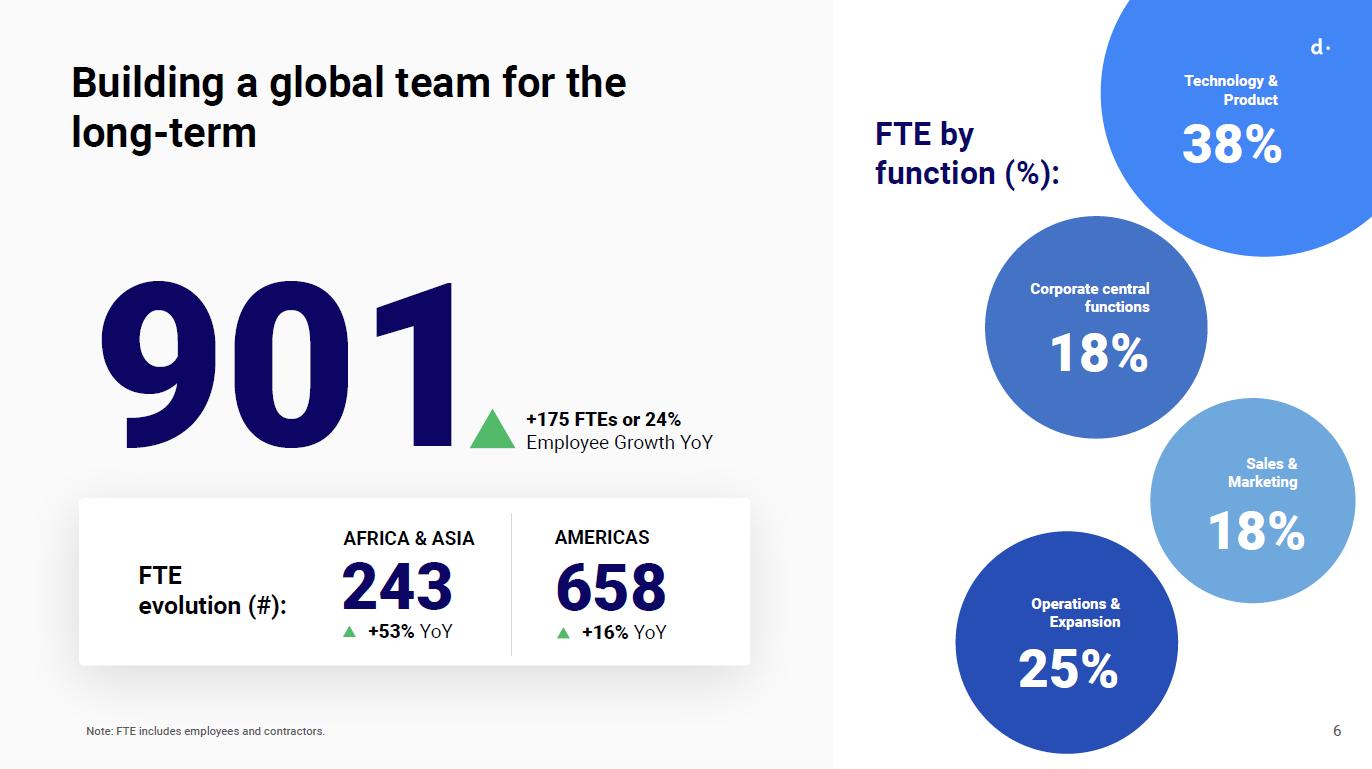
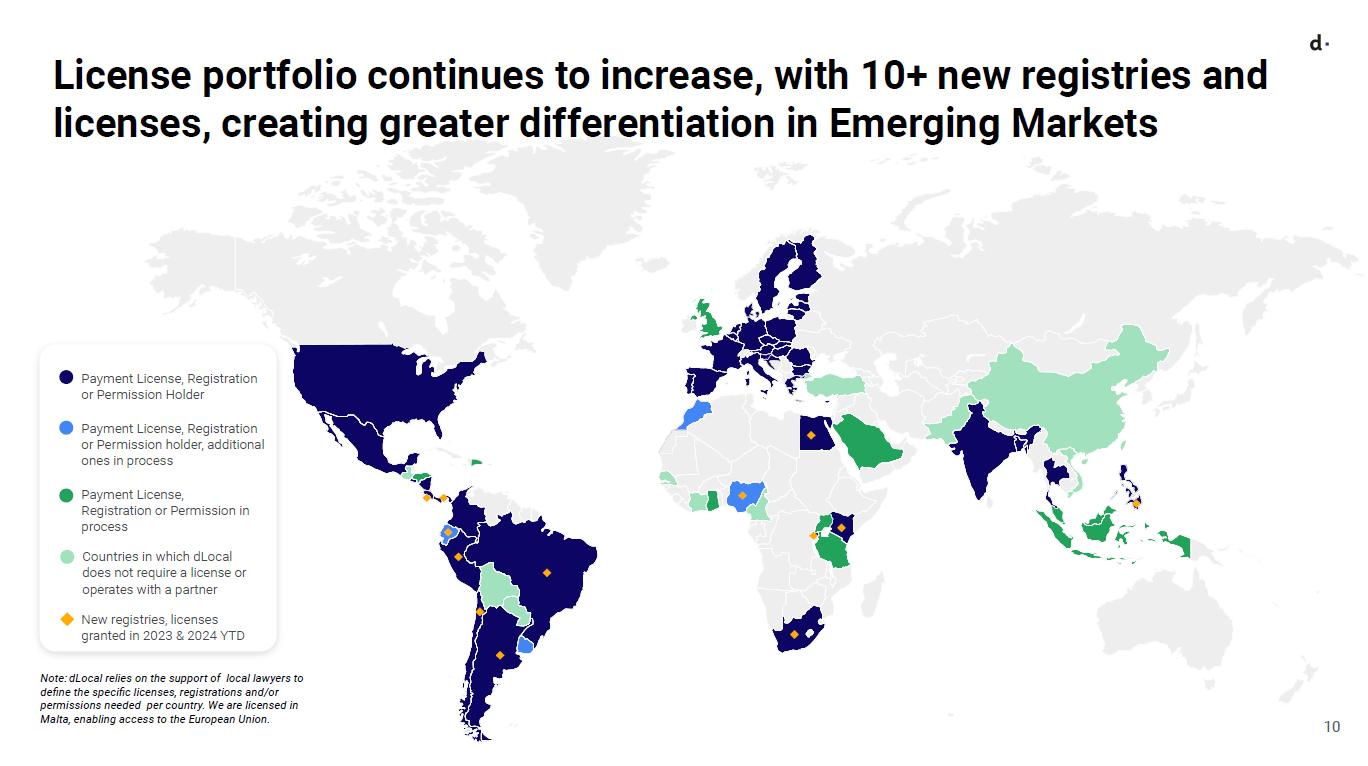
We grew our global team from 726 in 2022 to 901 people by the end of 2023, located across 49 countries. We continue to build upon our existing strengths by making investments in key capabilities, including: 1) growing our license portfolio, with 10 incremental registries and licences granted in 2023, 2) deepening our relationships with global banking partners, adding more Global Systemically Important Banks, continental and nationally market leading banks for our processing, FX and hedging activities - around 80% of all foreign exchange transactions during H2 2023 were carried out via GSIBs, continental and national banks; and 3) ramping up our operations and back-office effectiveness.
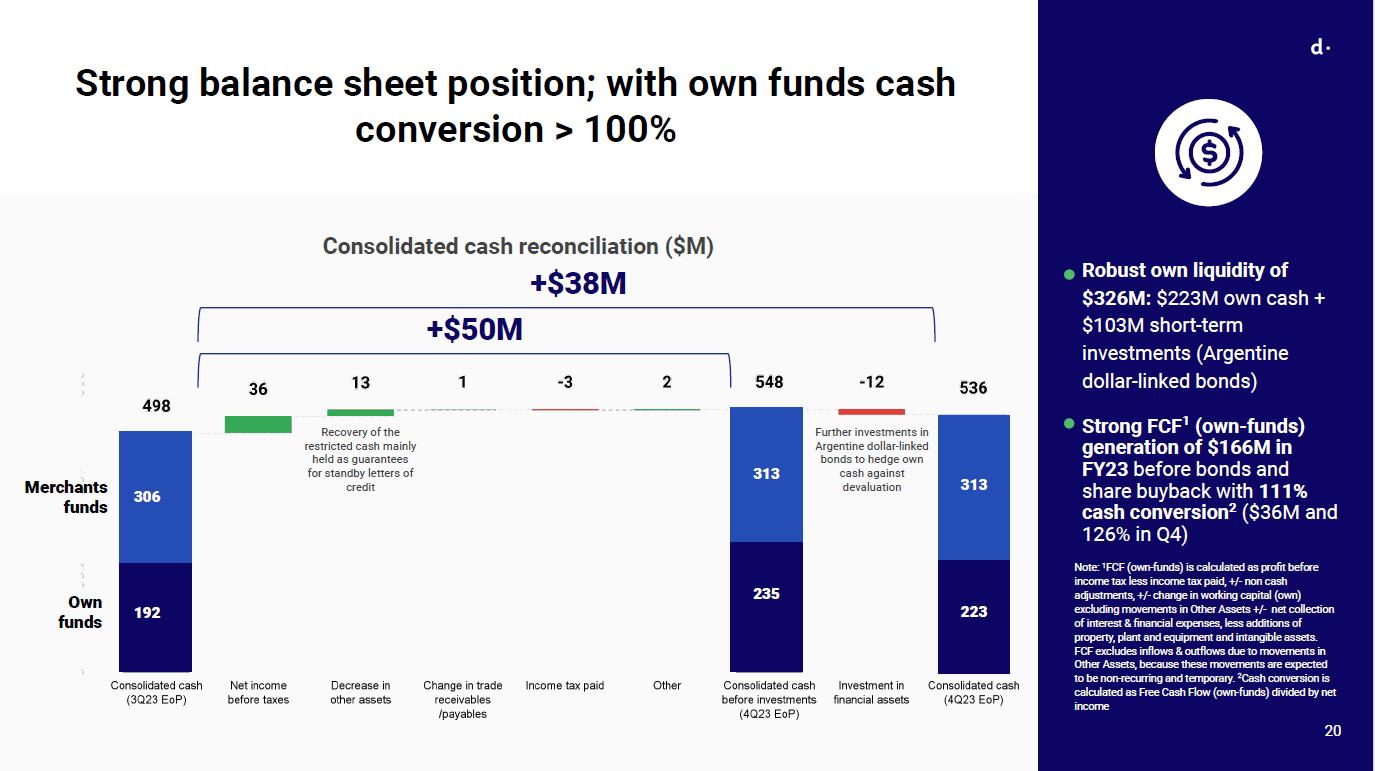
We ended the year with a robust liquidity position, having generated US$166 million of FCF, and reaching US$326 million of funds, including US$223 million of own funds cash balances and US$103 million of short term investments in Argentina dollar-linked bonds. Our strong cash generative business gives us the flexibility to evaluate opportunities to deploy our cash generation, including inorganic growth opportunities or distributing to our shareholders through share repurchases.
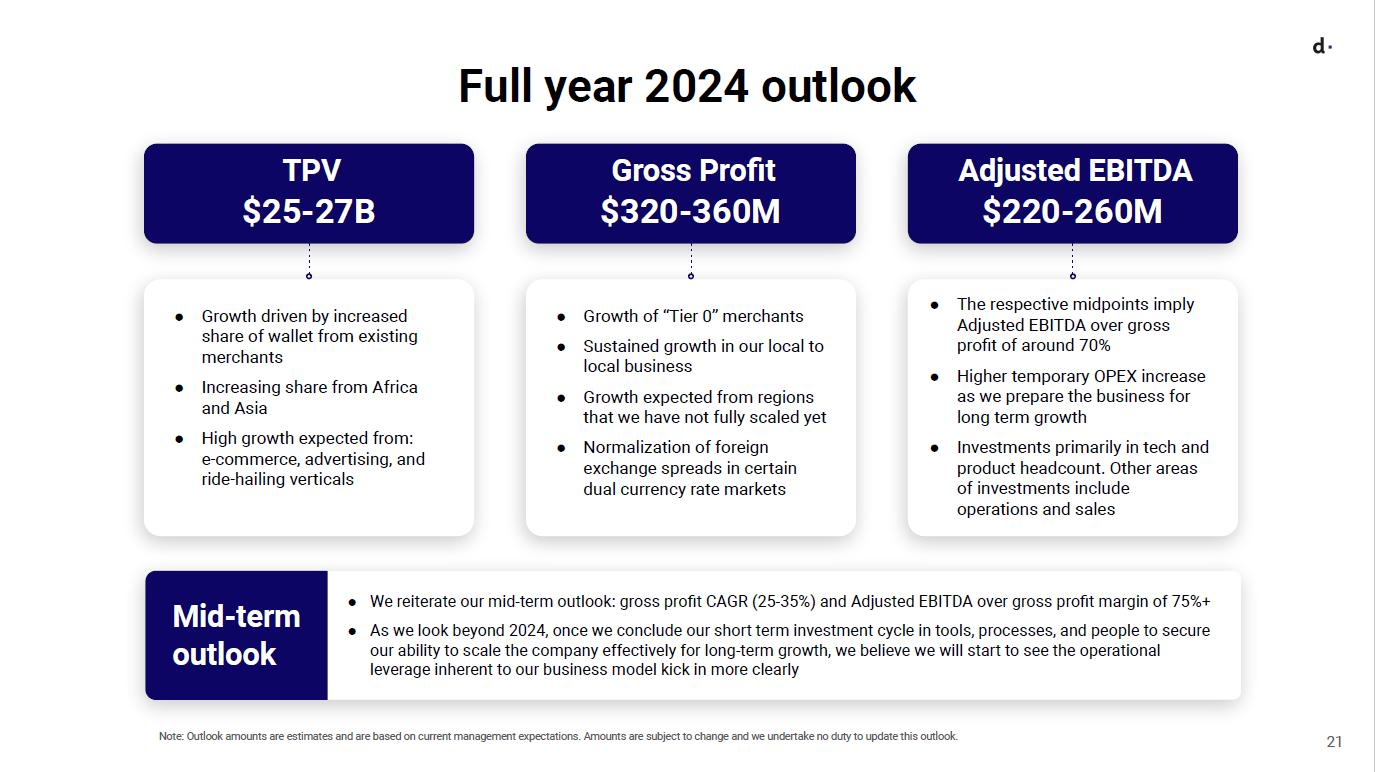
Looking ahead, I am even more excited for what's to come. For 2024 we expect TPV growth of 40% to 50%, surpassing $26B of TPV at the midpoint. We see gross profit between US$320 and US$360m and Adjusted EBITDA between US$220 and US$260m. We are committed to running a financial model that combines robust mid-term gross profit growth with an EBITDA margin that is among the best in our comparables. Therefore, we are re-affirming our mid-term guidance of 25%-35% gross profit CAGR and Adjusted EBITDA to gross profit of 75%+.
EX-99.1
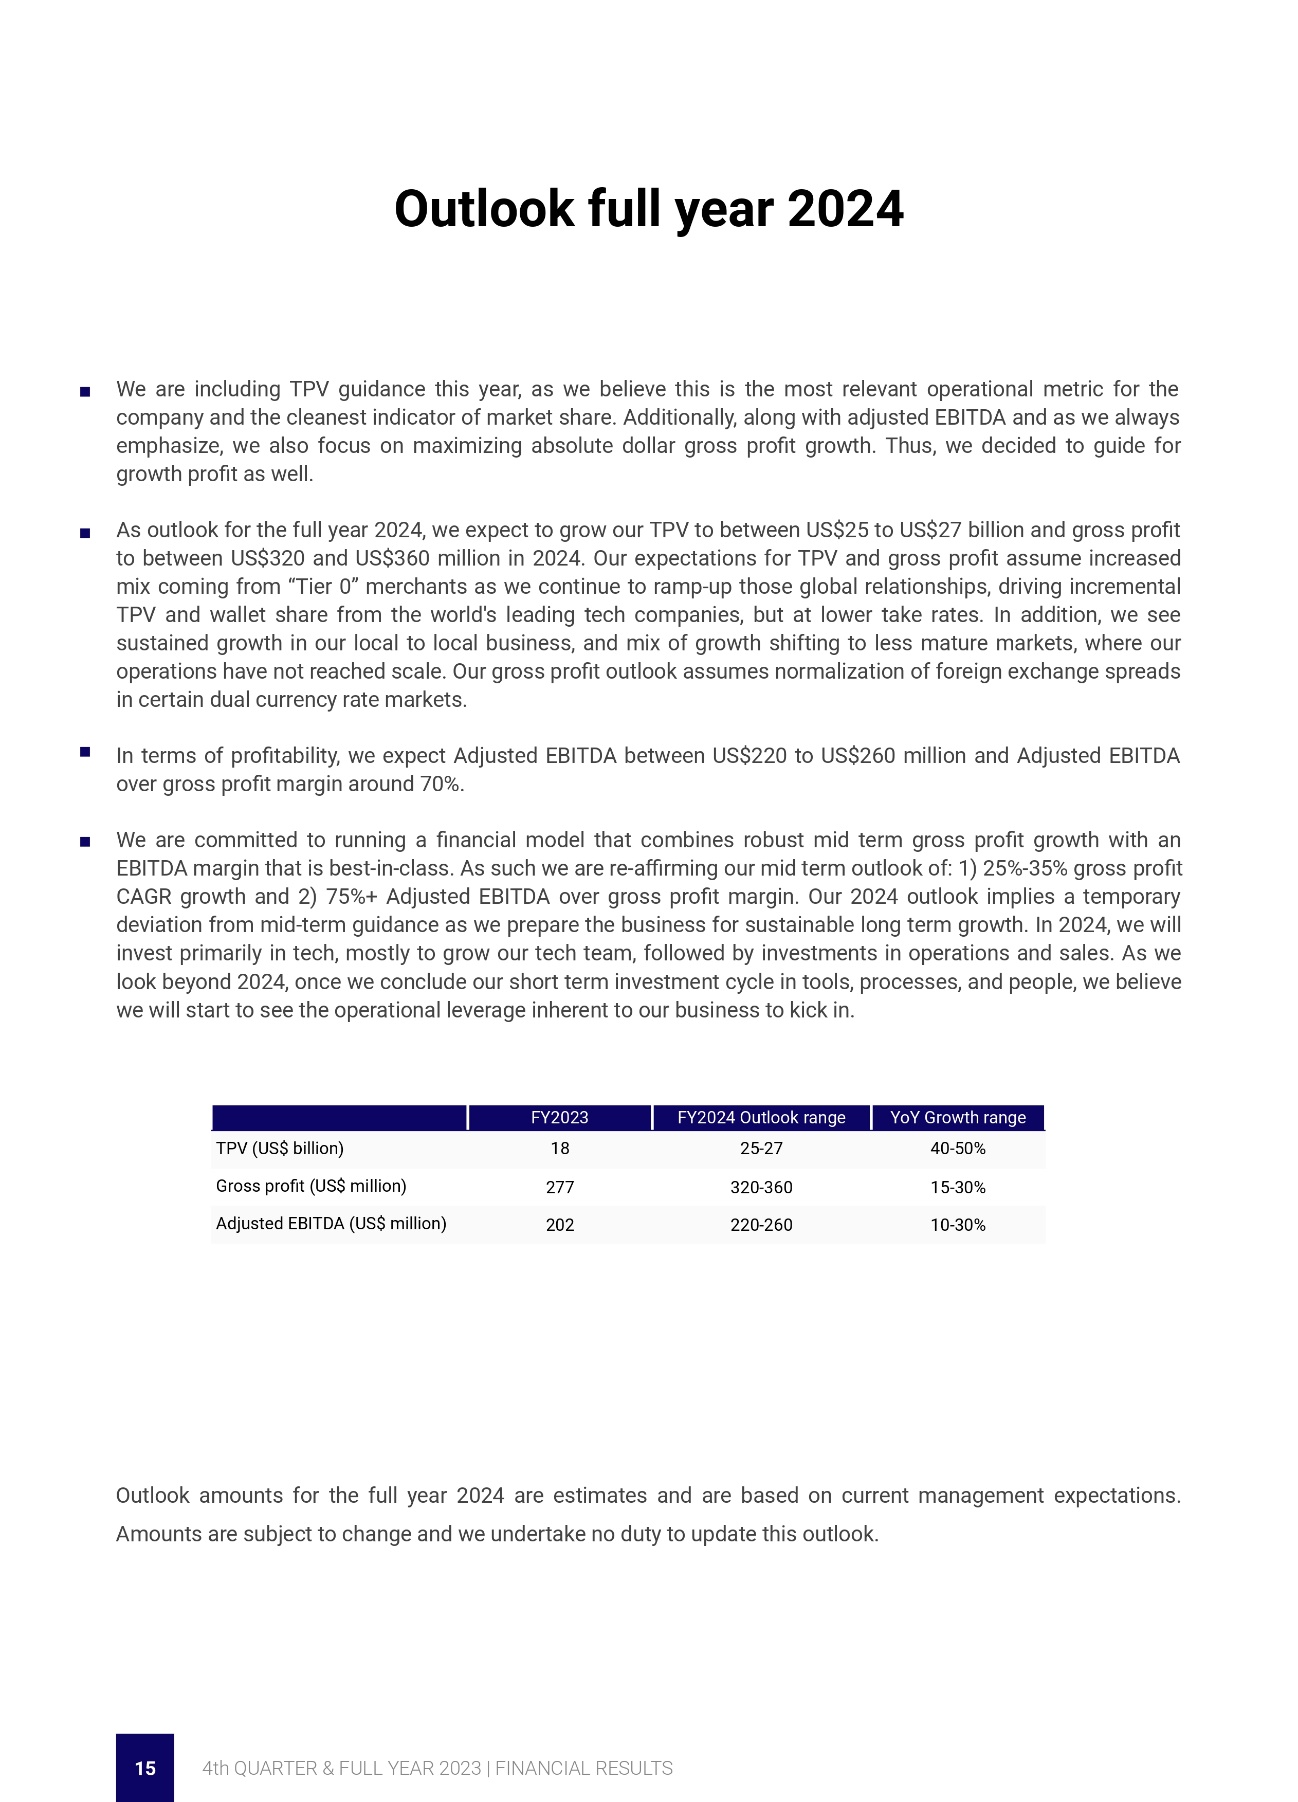
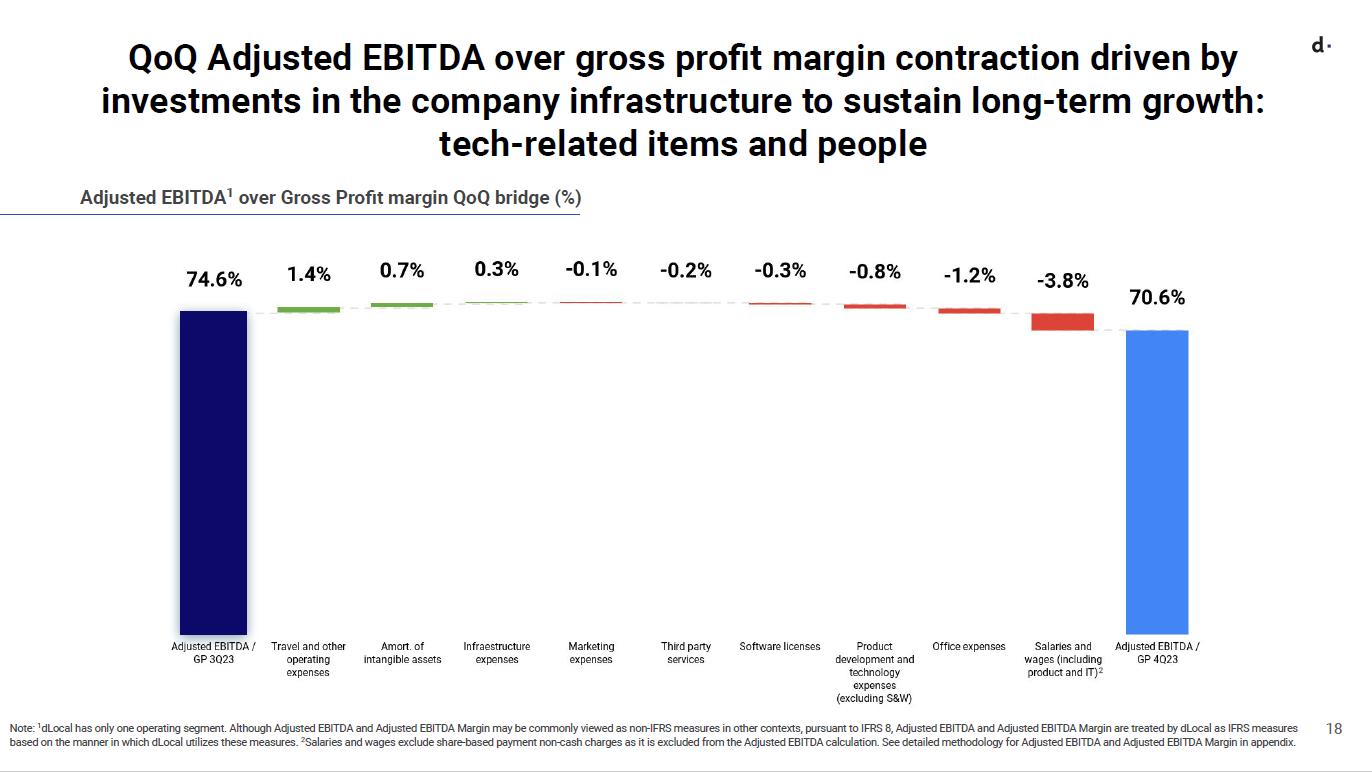
The trajectory towards that mid-term guidance comes in for 2024 at around 70% Adjusted EBITDA over gross profit as we continue investing and tightening the foundations for long-term growth by 1) further strengthening the dLocal team, with particular emphasis on our engineering talent pool; 2) further upgrading back office capabilities and 3) continuing to invest behind our license portfolio throughout emerging markets. The combination of these actions will further widen our moat and continue to position DLO as the go-to payments platform to serve emerging markets. As we look beyond 2024, we believe that as we conclude our short-term investment cycle, we will start to see the operational leverage inherent to our business kick in. We steer our business for decades, not quarters. We continue to have a high conviction in our massive opportunity.
Finally, let me share that after a few months working with Sebastian as co-CEOs, we will continue to collaborate closely and shape dLocal’s bright future but now from different roles. It is truly an honor and a privilege to share that I am taking on the role of CEO, while Sebastian is stepping down from his executive position but remains an active member of the Board and will be fully dedicated to leveraging his vast experience to lead the newly established Commercial, Business Development and M&A Committee as part of the company's Board of Directors. I am sure Seba will continue to be an instrumental piece in DLO’s long term successful story.
In addition, in another step to strengthen our executive team, I am thrilled to reveal that Mark Ortiz will be joining the company as Chief Financial Officer, commencing on April 15. Mark brings a wealth of experience, boasting three decades of senior financial leadership at General Electric. Mark's extensive background includes living, working, and traveling across over 20 markets, aligning seamlessly with our mission to unleash the potential of emerging markets. We extend our gratitude to Diego Cabrera Canay for his invaluable contributions to dLocal.
As we advance as a listed company, we are delighted to announce the appointment of Veronica Raffo as a new independent Board member, effective immediately. Verónica is a partner in FERRERE, a leading law firm in Uruguay, and participates actively in its management and strategic leadership. She has more than 25 years of experience advising high profile global clients in areas of labor law, compliance audits, and corporate governance. Ms Raffo is a member of the “International Bar Association”, a member of the IBA’s Committee on Labor and Industrial Relations, a Director at the Vance Center’s Project for the Advancement of Women Lawyers, and has consistently been recognized amongst the most reputed Uruguayan business leaders by the Corporate Reputation Business Monitor (MERCO). Veronica will replace Mr. Jitendra Gupta who has decided to step down from our Board. We thank Jitendra for his service since our pre-IPO process and the guidance he has offered the company over this time.
Finally, I want to make sure we thank our global team, our valued customers, and our investors for their continued support. They are what allow us to continue pursuing our mission of unlocking the potential of emerging markets.” said Pedro Arnt, CEO of dLocal
Fourth quarter 2023 Financial Highlights
EX-99.1
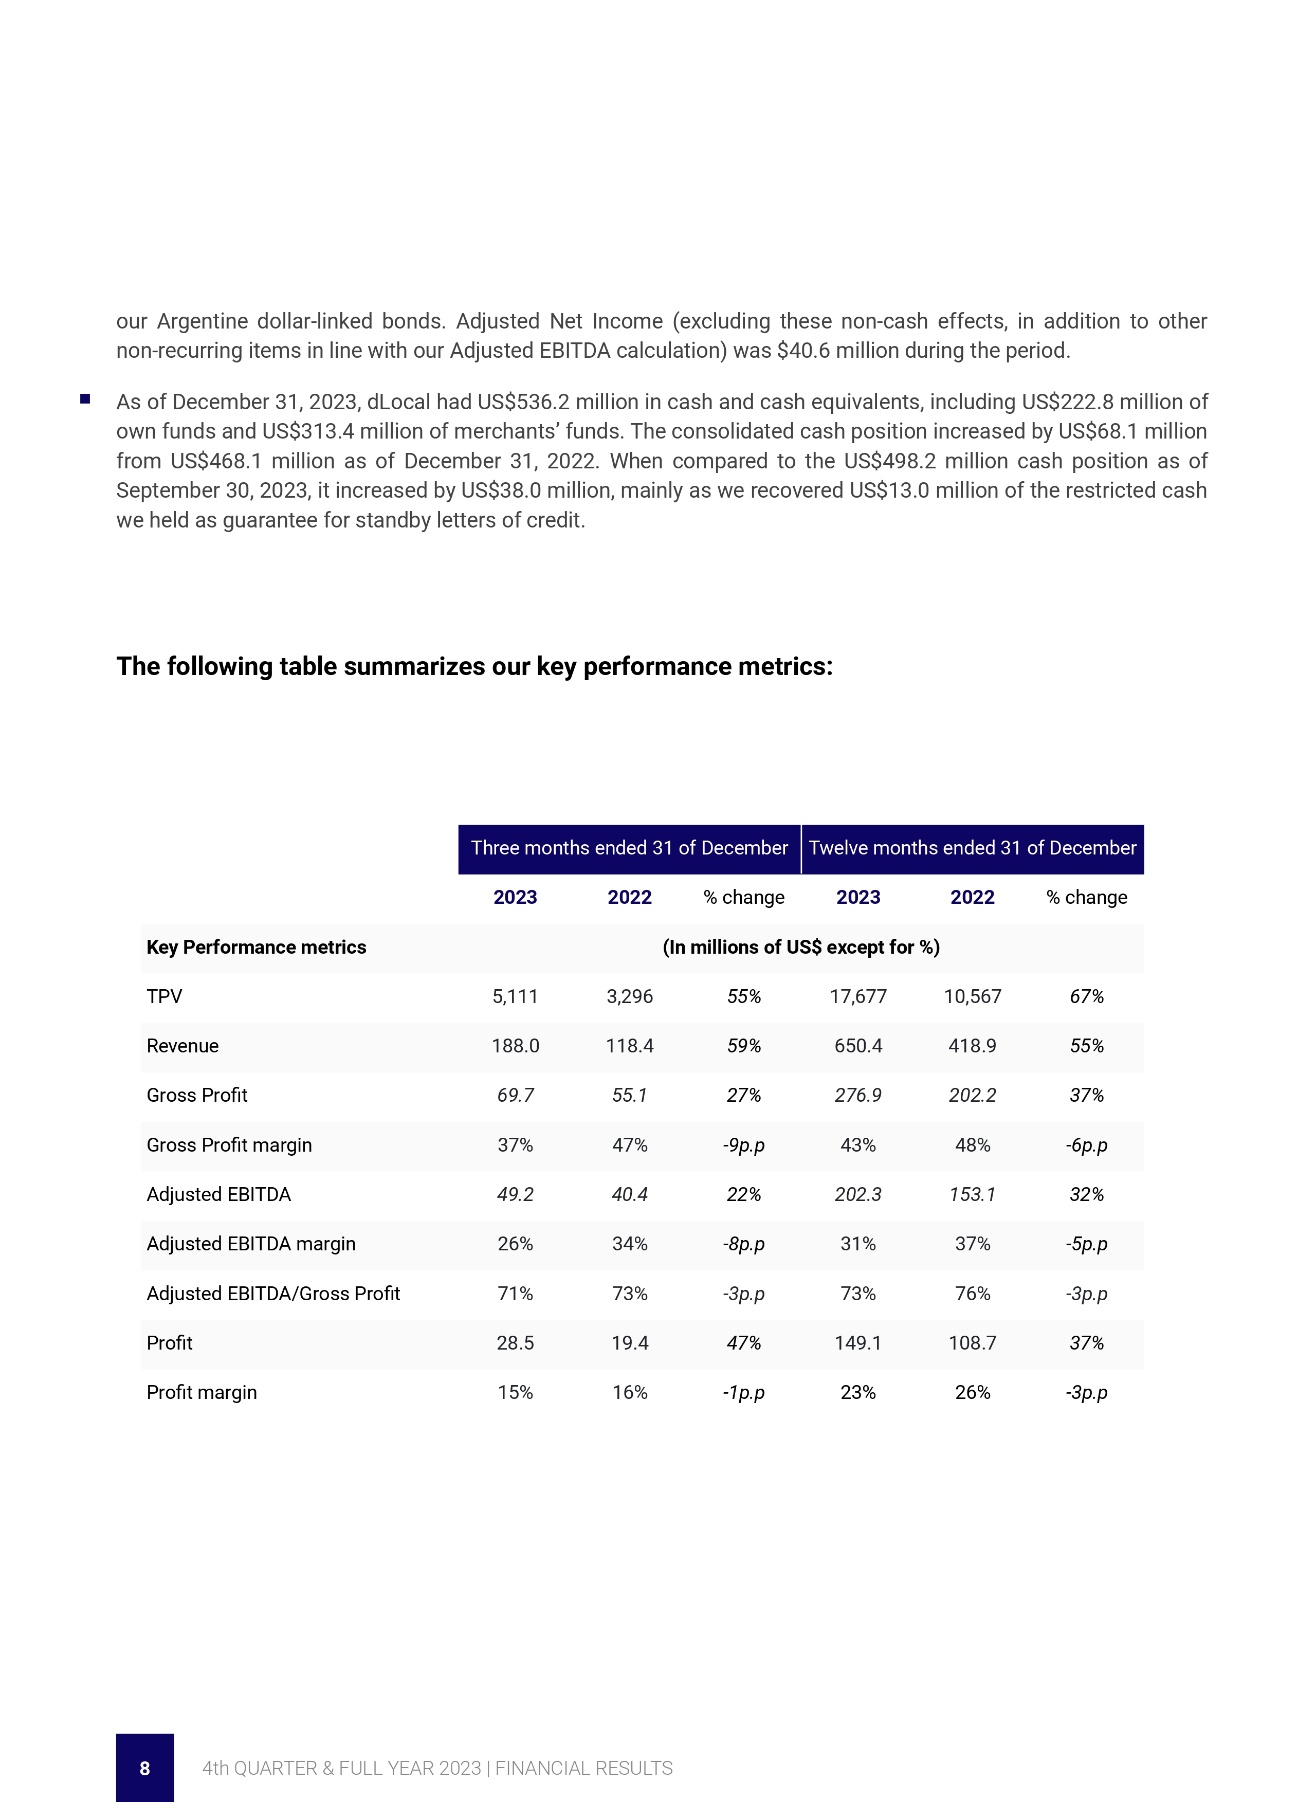
The following table summarizes our key performance metrics:
|
Three months ended 31 of December |
Twelve months ended 31 of December |
||||
|
2023 |
2022 |
% change |
2023 |
2022 |
% change |
Key Performance metrics |
(In millions of US$ except for %) |
|||||
TPV |
5,111 |
3,296 |
55% |
17,677 |
10,567 |
67% |
Revenue |
188.0 |
118.4 |
59% |
650.4 |
418.9 |
55% |
Gross Profit |
69.7 |
55.1 |
27% |
276.9 |
202.2 |
37% |
Gross Profit margin |
37% |
47% |
-9p.p |
43% |
48% |
-6p.p |
Adjusted EBITDA |
49.2 |
40.4 |
22% |
202.3 |
153.1 |
32% |
Adjusted EBITDA margin |
26% |
34% |
-8p.p |
31% |
37% |
-5p.p |
Adjusted EBITDA/Gross Profit |
71% |
73% |
-3p.p |
73% |
76% |
-3p.p |
Profit |
28.5 |
19.4 |
47% |
149.1 |
108.7 |
37% |
Profit margin |
15% |
16% |
-1p.p |
23% |
26% |
-3p.p |
Fourth quarter 2023 Business Highlights
EX-99.1
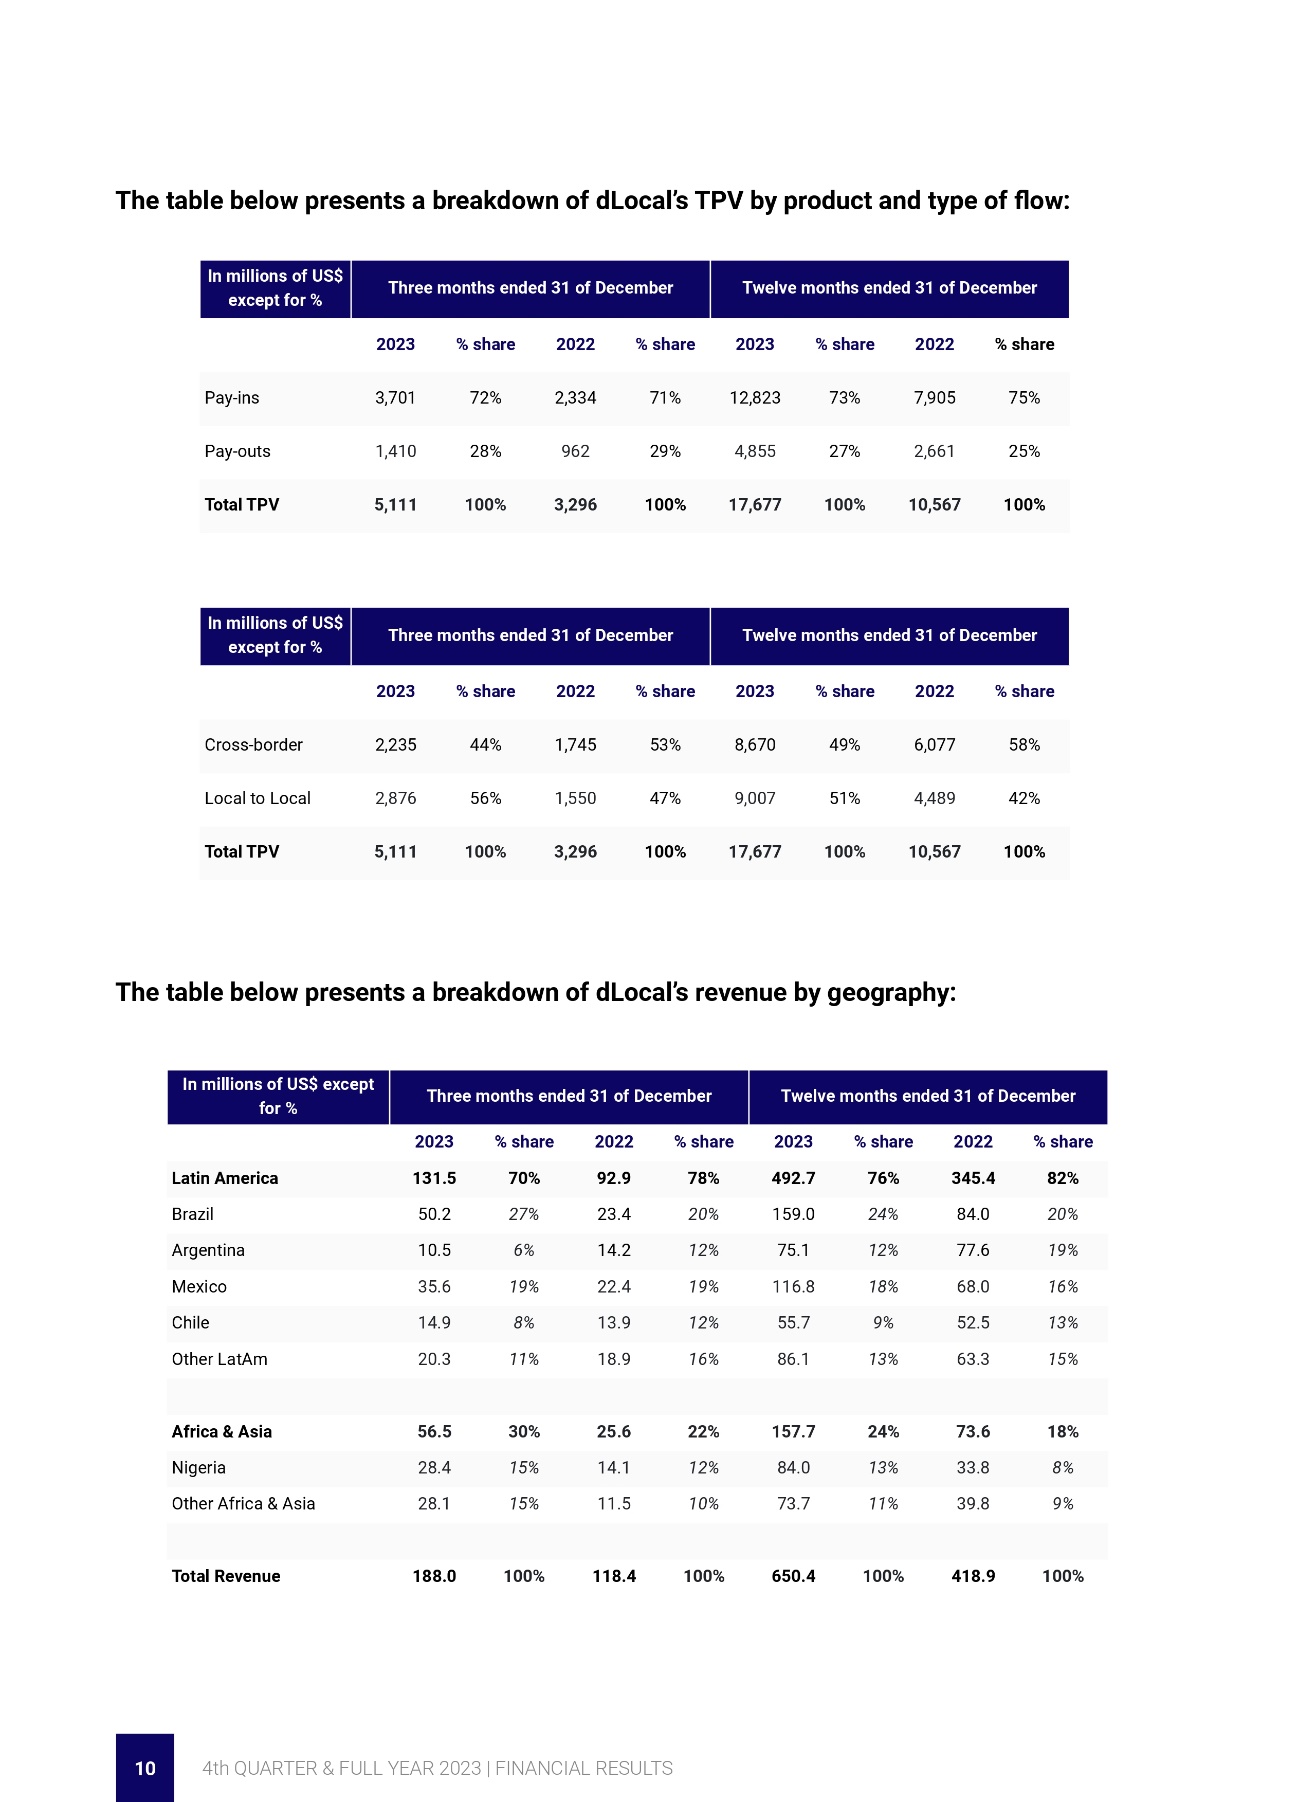
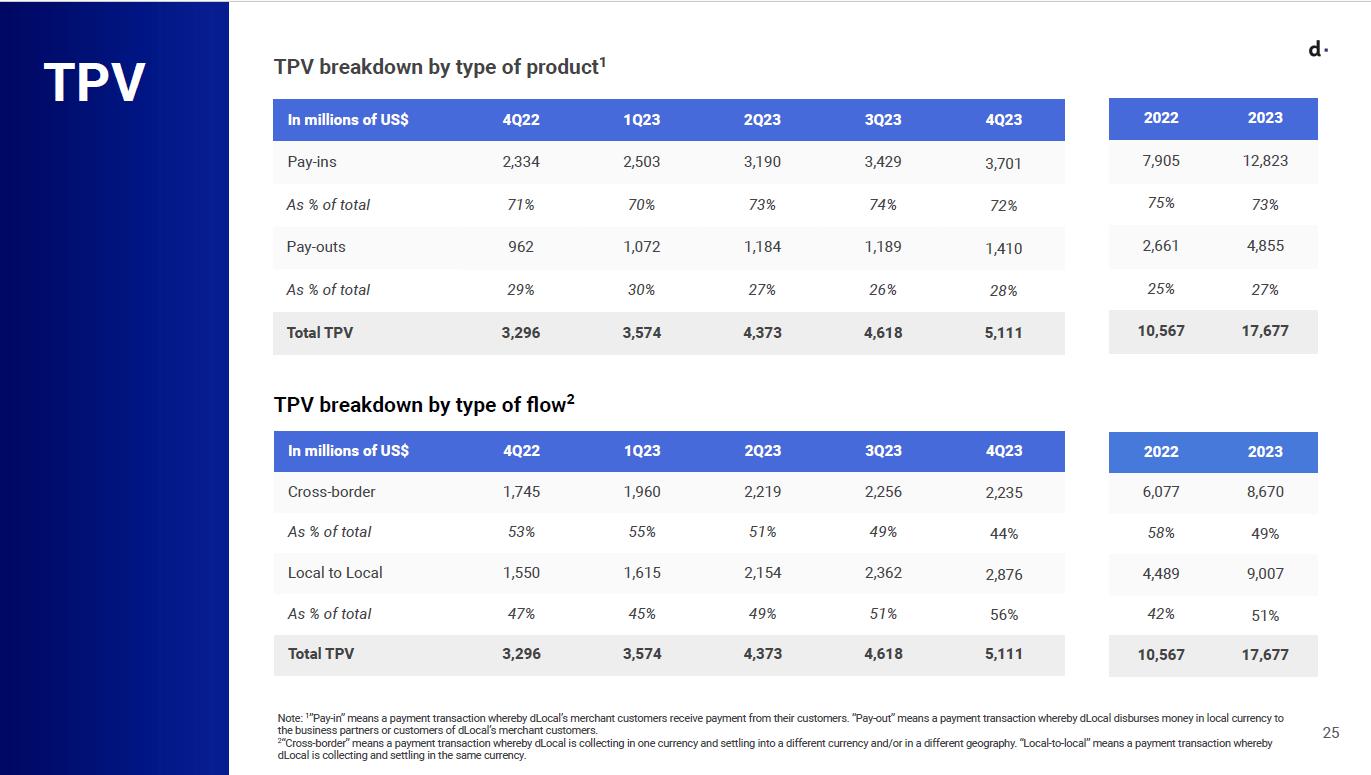
The table below presents a breakdown of dLocal’s TPV by product and type of flow:
In millions of US$ except for % |
Three months ended 31 of December |
Twelve months ended 31 of December |
||||||
|
2023 |
% share |
2022 |
% share |
2023 |
% share |
2022 |
% share |
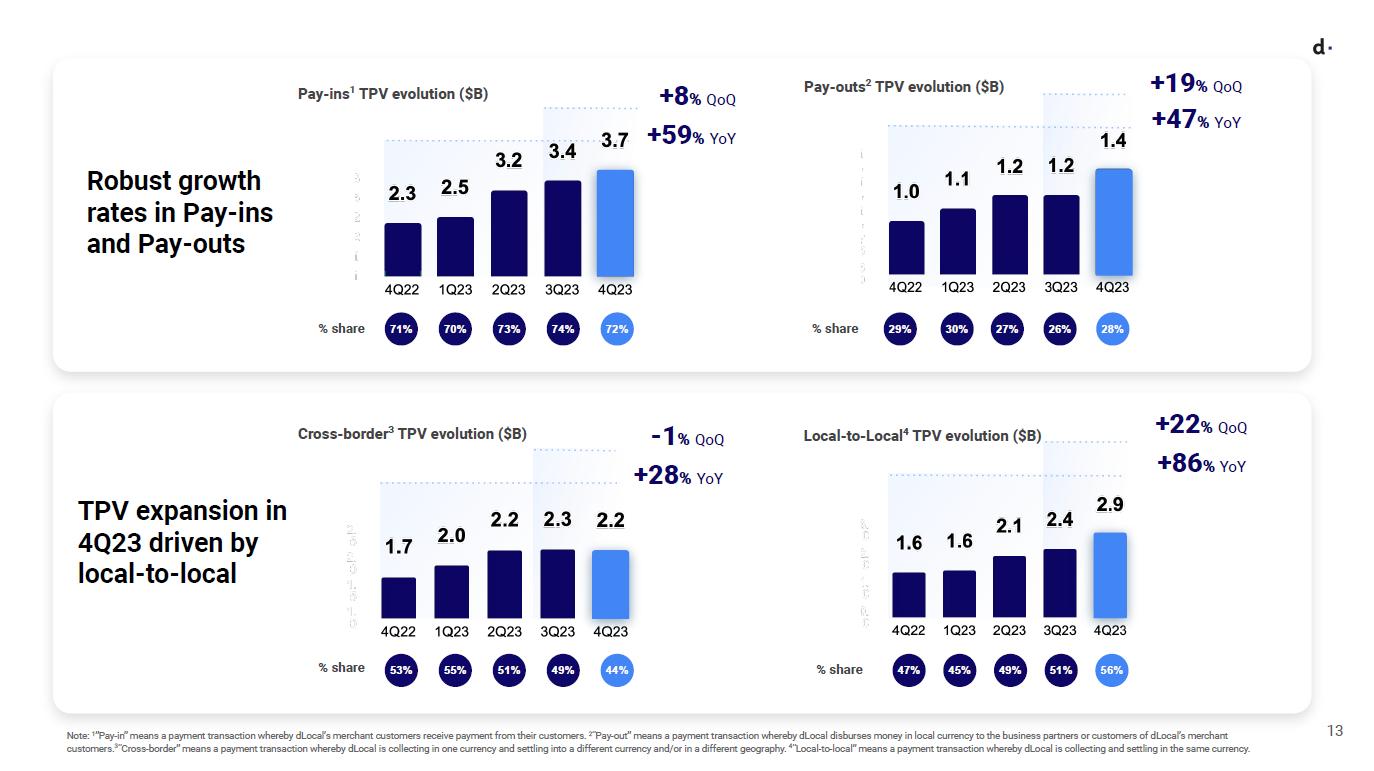
Pay-ins |
3,701 |
72% |
2,334 |
71% |
12,823 |
73% |
7,905 |
75% |
Pay-outs |
1,410 |
28% |
962 |
29% |
4,855 |
27% |
2,661 |
25% |
Total TPV |
5,111 |
100% |
3,296 |
100% |
17,677 |
100% |
10,567 |
100% |
In millions of US$ except for % |
Three months ended 31 of December |
Twelve months ended 31 of December |
||||||
|
2023 |
% share |
2022 |
% share |
2023 |
% share |
2022 |
% share |
Cross-border |
2,235 |
44% |
1,745 |
53% |
8,670 |
49% |
6,077 |
58% |
Local-to-local |
2,876 |
56% |
1,550 |
47% |
9,007 |
51% |
4,489 |
42% |
Total TPV |
5,111 |
100% |
3,296 |
100% |
17,677 |
100% |
10,567 |
100% |
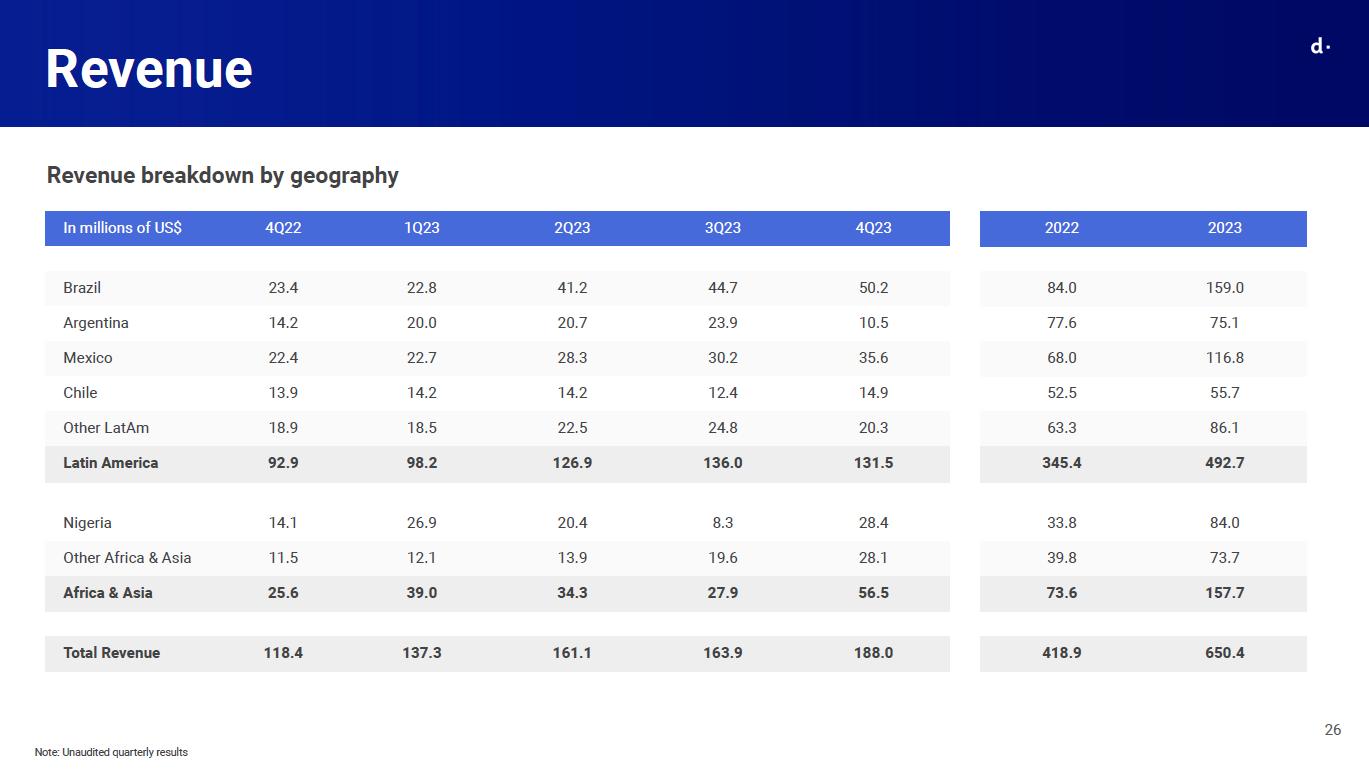
The table below presents a breakdown of dLocal’s revenue by geography:
In millions of US$ except for % |
Three months ended 31 of December |
Twelve months ended 31 of December |
||||||
|
2023 |
% share |
2022 |
% share |
2023 |
% share |
2022 |
% share |
Latin America |
131.5 |
70% |
92.9 |
78% |
492.7 |
76% |
345.4 |
82% |
Brazil |
50.2 |
27% |
23.4 |
20% |
159.0 |
24% |
84.0 |
20% |
Argentina |
10.5 |
6% |
14.2 |
12% |
75.1 |
12% |
77.6 |
19% |
Mexico |
35.6 |
19% |
22.4 |
19% |
116.8 |
18% |
68.0 |
16% |
Chile |
14.9 |
8% |
13.9 |
12% |
55.7 |
9% |
52.5 |
13% |
Other LatAm |
20.3 |
11% |
18.9 |
16% |
86.1 |
13% |
63.3 |
15% |
|
|
|
|
|
|
|
|
|
Africa & Asia |
56.5 |
30% |
25.6 |
22% |
157.7 |
24% |
73.6 |
18% |
Nigeria |
28.4 |
15% |
14.1 |
12% |
84.0 |
13% |
33.8 |
8% |
Other Africa & Asia |
28.1 |
15% |
11.5 |
10% |
73.7 |
11% |
39.8 |
9% |
|
|
|
|
|
|
|
|
|
Total Revenue |
188.0 |
100% |
118.4 |
100% |
650.4 |
100% |
418.9 |
100% |
Special note regarding Adjusted EBITDA and Adjusted EBITDA Margin
EX-99.1
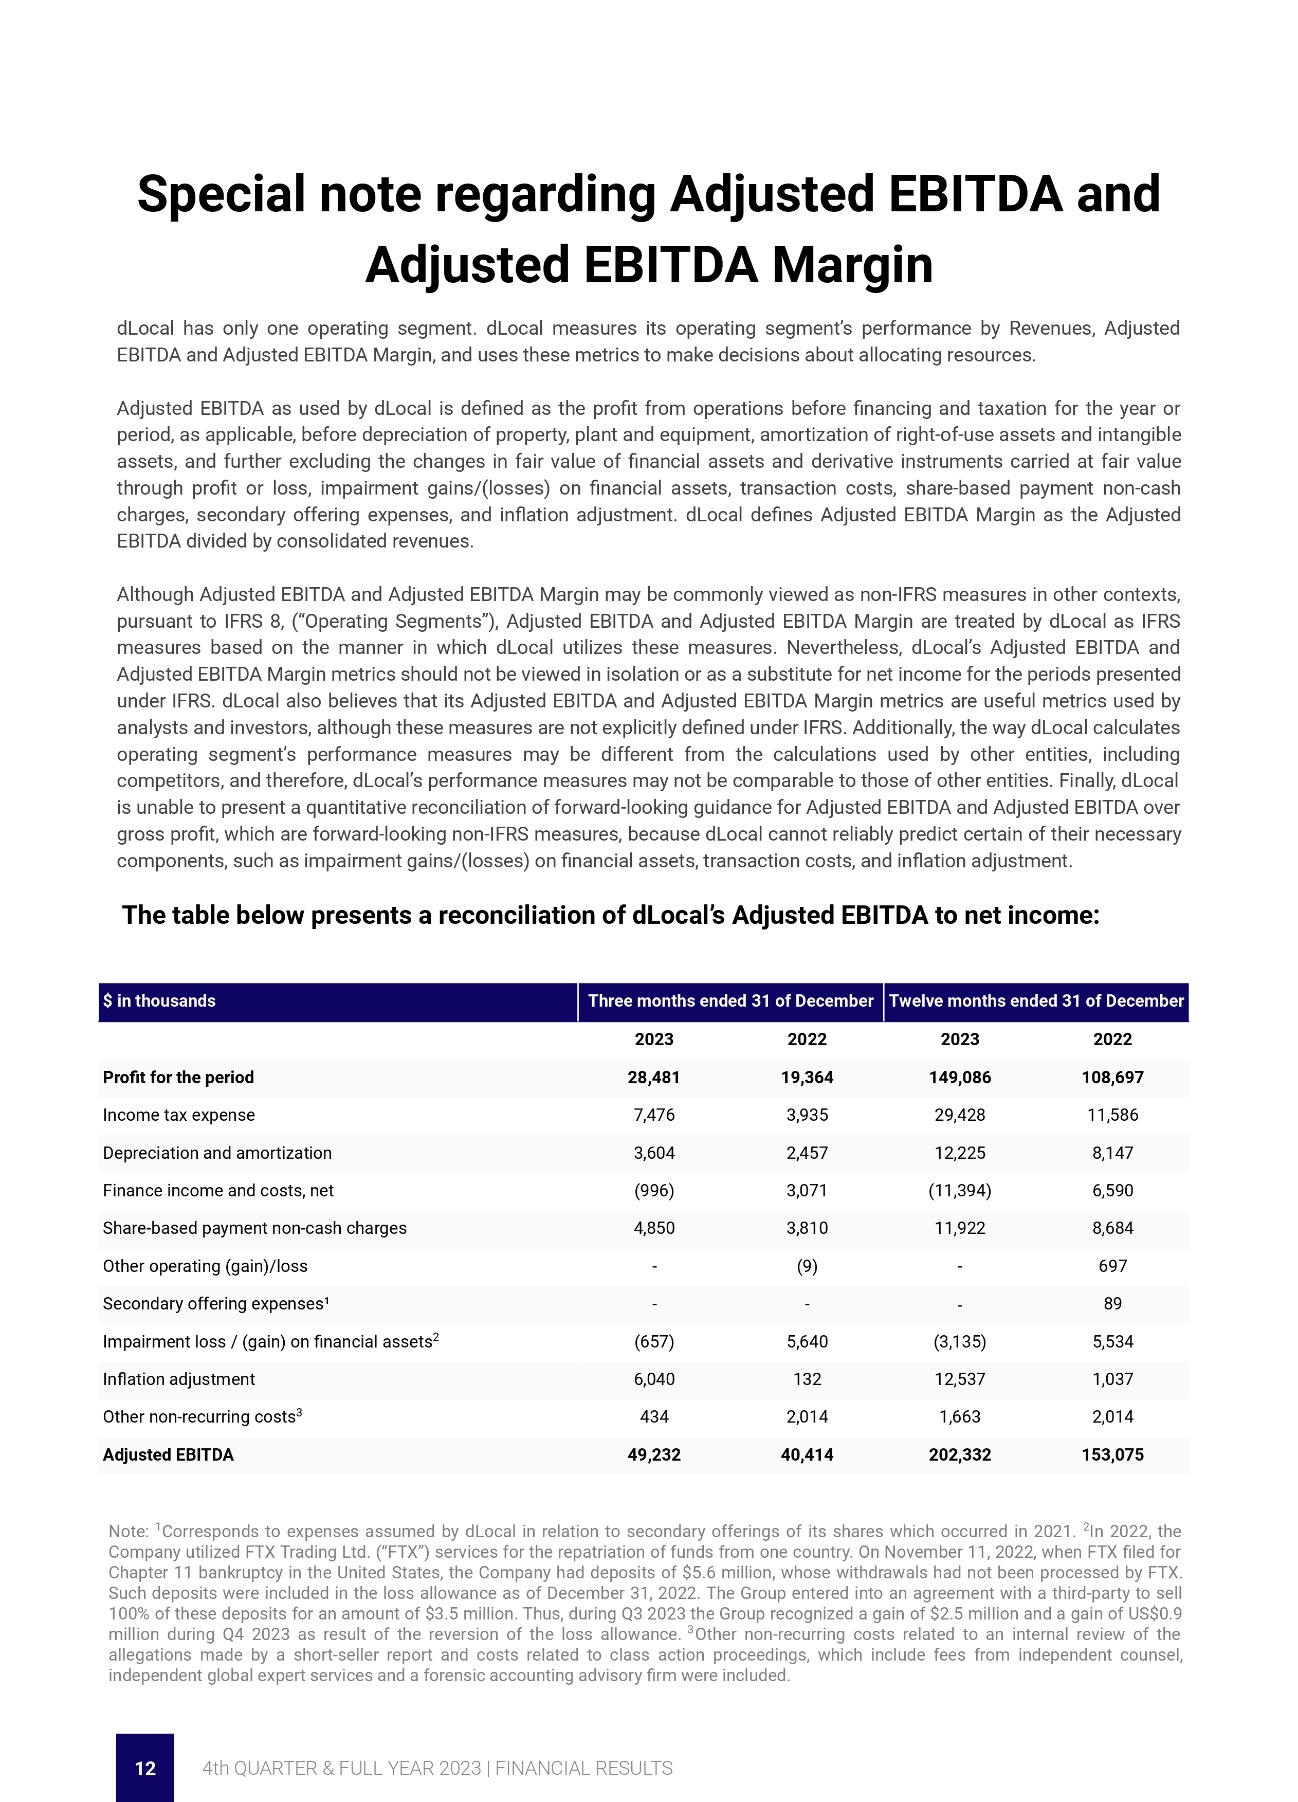
dLocal has only one operating segment. dLocal measures its operating segment’s performance by Revenues, Adjusted EBITDA and Adjusted EBITDA Margin, and uses these metrics to make decisions about allocating resources.
Adjusted EBITDA as used by dLocal is defined as the profit from operations before financing and taxation for the year or period, as applicable, before depreciation of property, plant and equipment, amortization of right-of-use assets and intangible assets, and further excluding the changes in fair value of financial assets and derivative instruments carried at fair value through profit or loss, impairment gains/(losses) on financial assets, transaction costs, share-based payment non-cash charges, secondary offering expenses, and inflation adjustment. dLocal defines Adjusted EBITDA Margin as the Adjusted EBITDA divided by consolidated revenues.
Although Adjusted EBITDA and Adjusted EBITDA Margin may be commonly viewed as non-IFRS measures in other contexts, pursuant to IFRS 8, (“Operating Segments”), Adjusted EBITDA and Adjusted EBITDA Margin are treated by dLocal as IFRS measures based on the manner in which dLocal utilizes these measures. Nevertheless, dLocal’s Adjusted EBITDA and Adjusted EBITDA Margin metrics should not be viewed in isolation or as a substitute for net income for the periods presented under IFRS. dLocal also believes that its Adjusted EBITDA and Adjusted EBITDA Margin metrics are useful metrics used by analysts and investors, although these measures are not explicitly defined under IFRS. Additionally, the way dLocal calculates operating segment’s performance measures may be different from the calculations used by other entities, including competitors, and therefore, dLocal’s performance measures may not be comparable to those of other entities. Finally, dLocal is unable to present a quantitative reconciliation of forward-looking guidance for Adjusted EBITDA and Adjusted EBITDA over gross profit, which are forward-looking non-IFRS measures, because dLocal cannot reliably predict certain of their necessary components, such as impairment gains/(losses) on financial assets, transaction costs, and inflation adjustment.
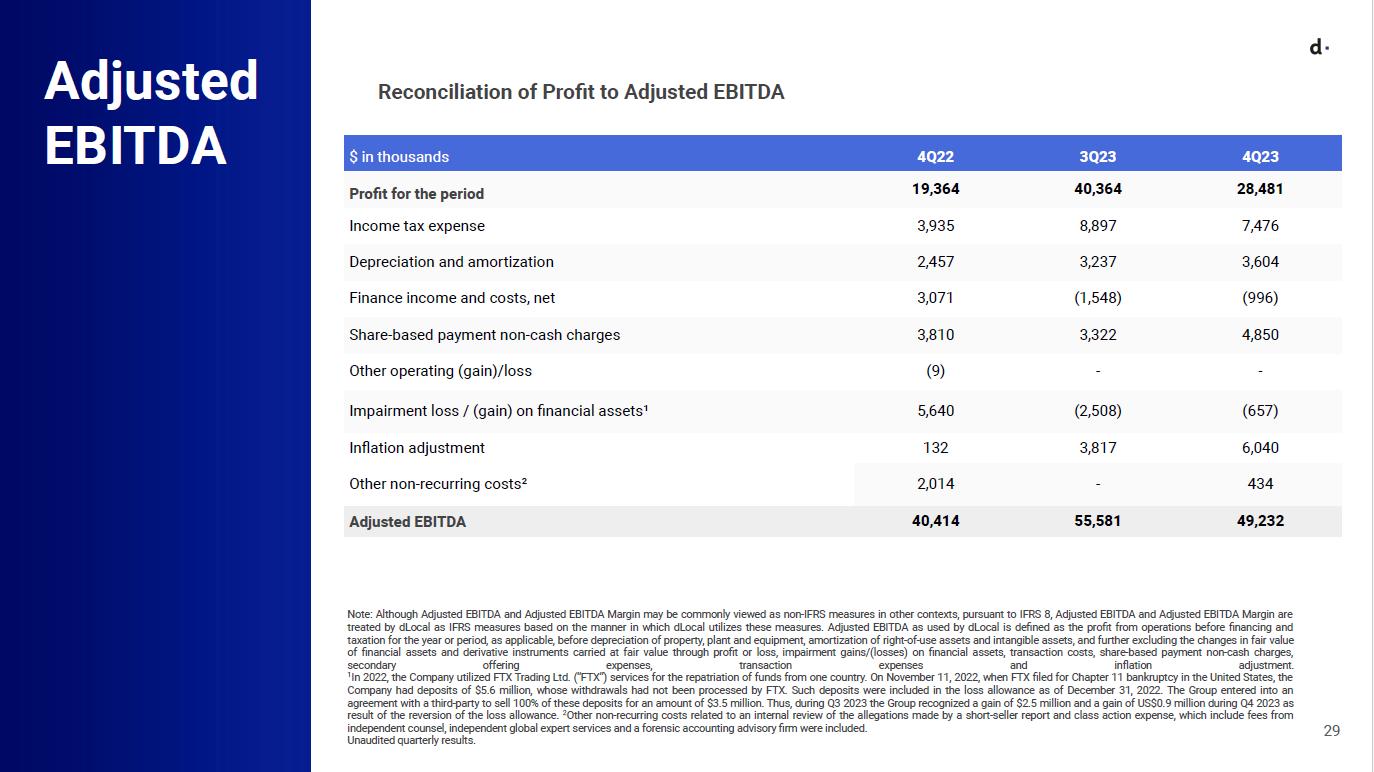
The table below presents a reconciliation of dLocal’s Adjusted EBITDA and Adjusted EBITDA Margin to net income:
$ in thousands |
Three months ended 31 of December |
Twelve months ended 31 of December |
||
|
2023 |
2022 |
2023 |
2022 |
Profit for the period |
28,481 |
19,364 |
149,086 |
108,697 |
Income tax expense |
7,476 |
3,935 |
29,428 |
11,586 |
Depreciation and amortization |
3,604 |
2,457 |
12,225 |
8,147 |
Finance income and costs, net |
(996) |
3,071 |
(11,394) |
6,590 |
Share-based payment non-cash charges |
4,850 |
3,810 |
11,922 |
8,684 |
Other operating (gain)/loss |
- |
(9) |
- |
697 |
Secondary offering expenses¹ |
- |
- |
- |
89 |
Impairment loss / (gain) on financial assets2 |
(657) |
5,640 |
(3,135) |
5,534 |
Inflation adjustment |
6,040 |
132 |
12,537 |
1,037 |
Other non-recurring costs³ |
434 |
2,014 |
1,663 |
2,014 |
Adjusted EBITDA |
49,232 |
40,414 |
202,332 |
153,075 |
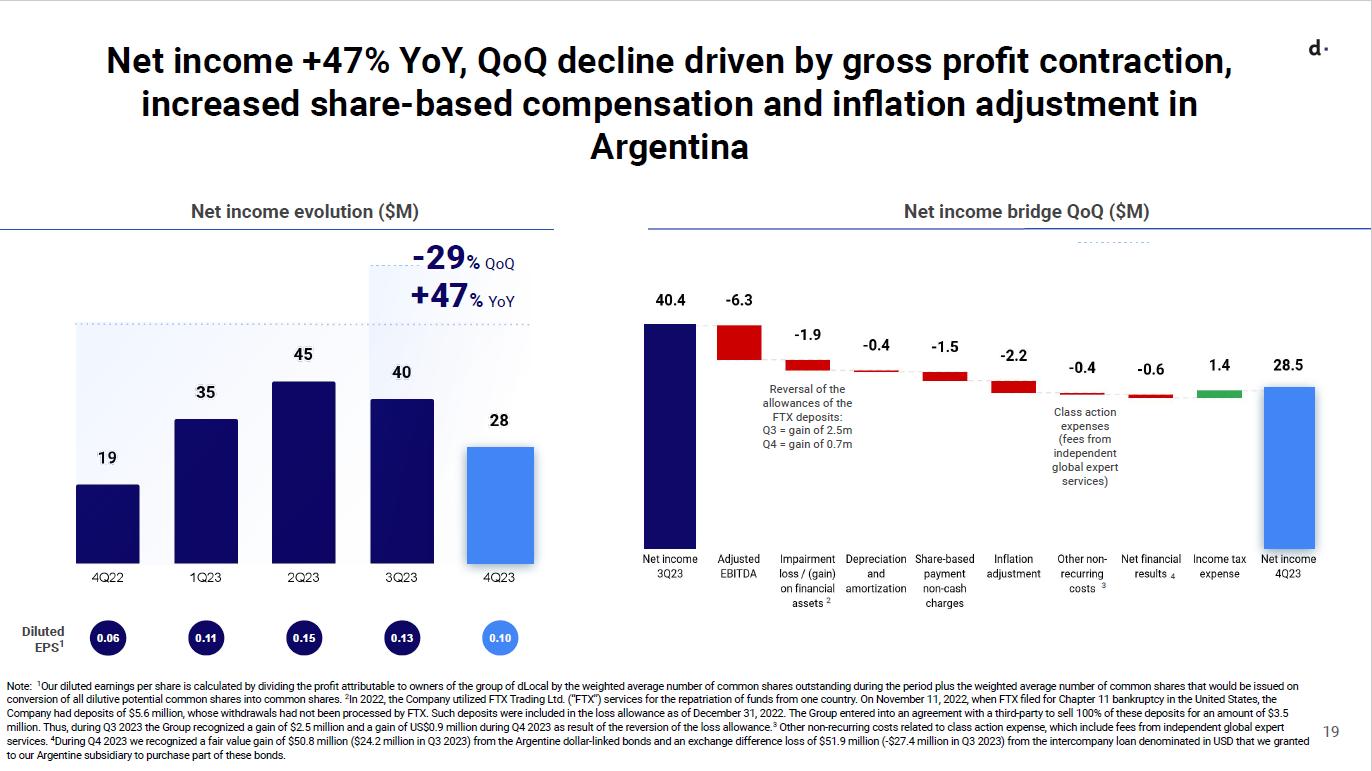
Note: 1Corresponds to expenses assumed by dLocal in relation to secondary offerings of its shares which occurred in 2021. 2In 2022, the Company utilized FTX Trading Ltd. (“FTX”) services for the repatriation of funds from one country. On November 11, 2022, when FTX filed for Chapter 11 bankruptcy in the United States, the Company had deposits of $5.6 million, whose withdrawals had not been processed by FTX. Such deposits were included in the loss allowance as of December 31, 2022. The Group entered into an agreement with a third-party to sell 100% of these deposits for an amount of $3.5 million. Thus, during Q3 2023 the Group recognized a gain of $2.5 million and a gain of US$0.9 million during Q4 2023 as result of the reversion of the loss allowance. 3Other non-recurring costs related to an internal review of the allegations made by a short-seller report and costs related to class action proceedings, which include fees from independent counsel, independent global expert services and a forensic accounting advisory firm were included.
EX-99.1
Special note regarding Adjusted Net Income
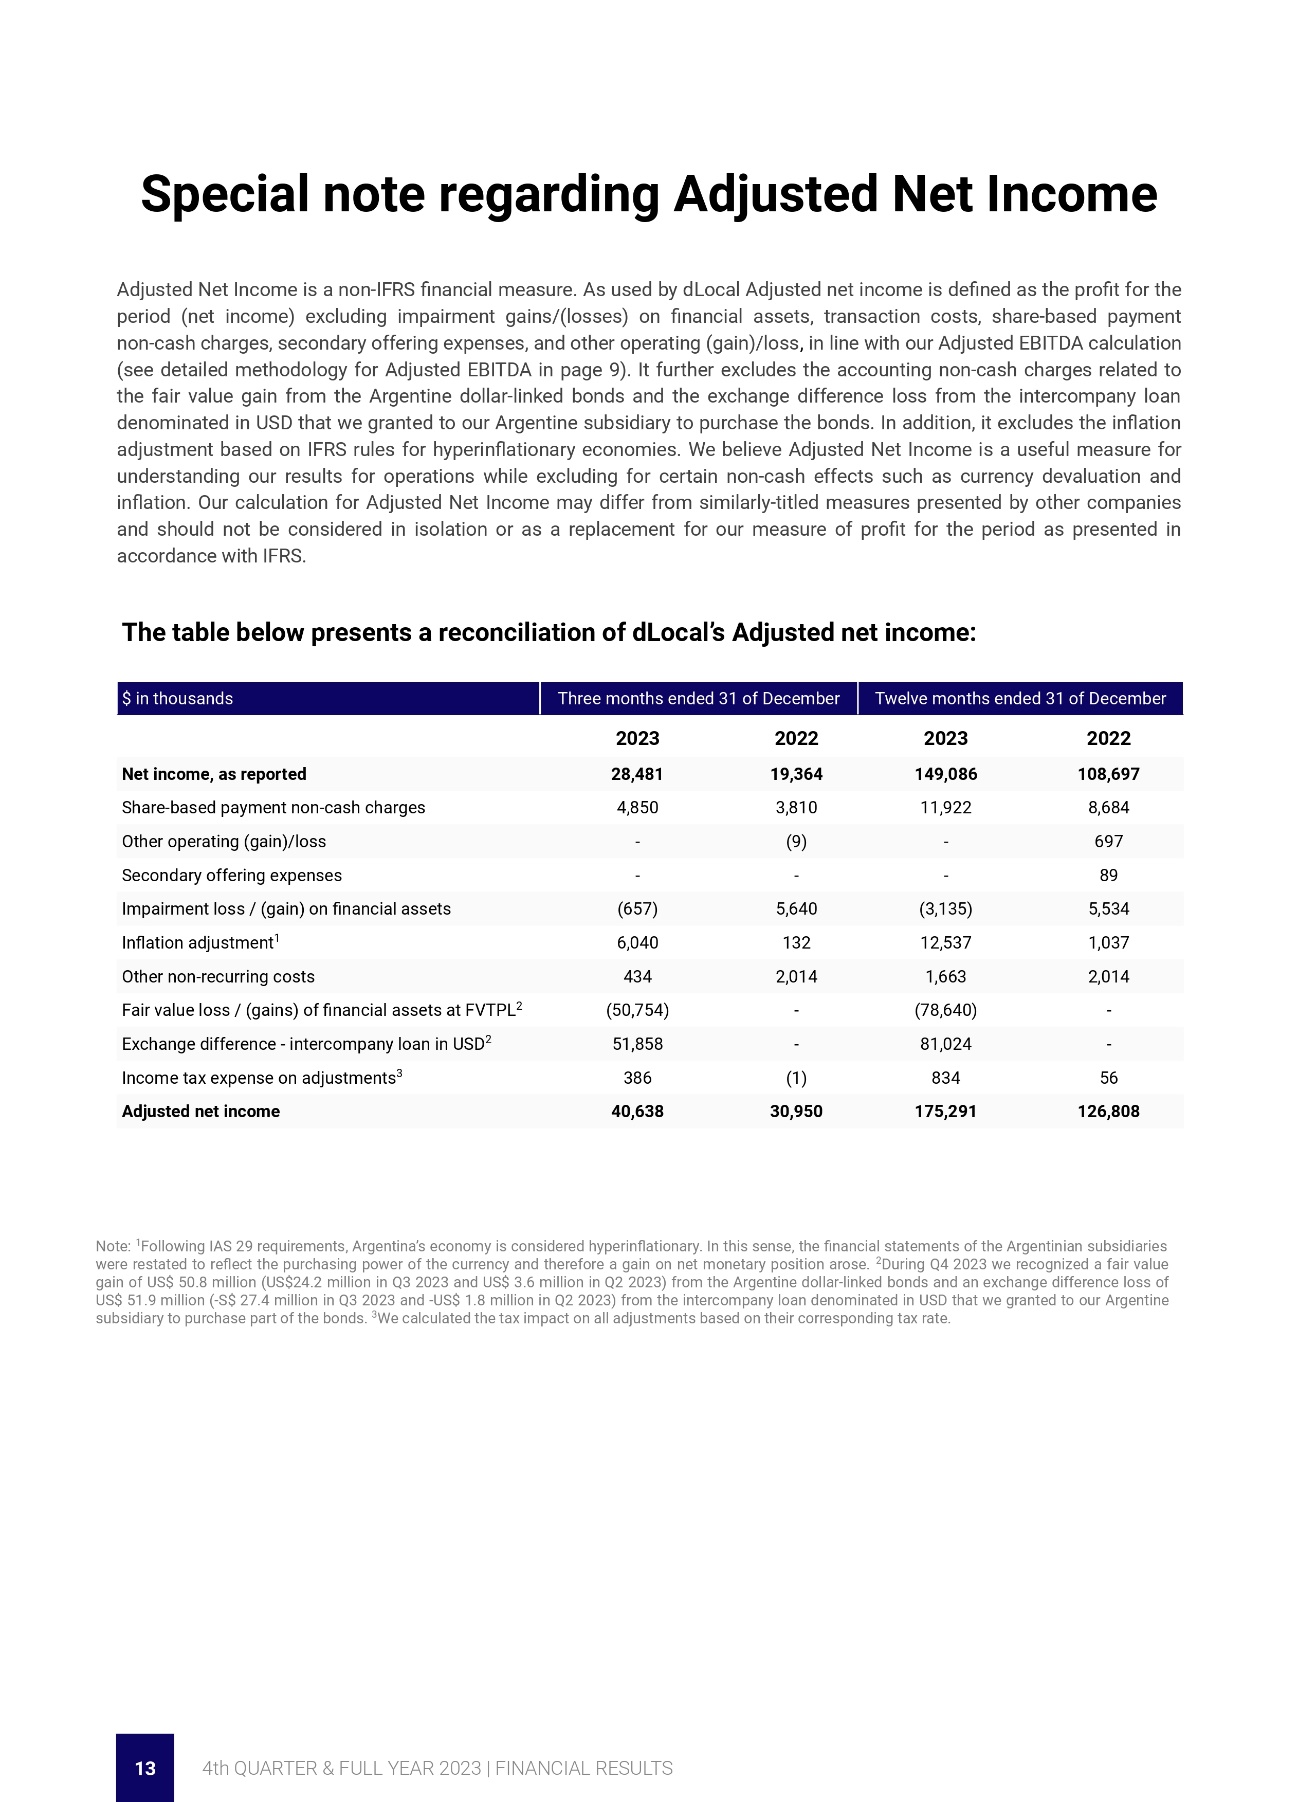
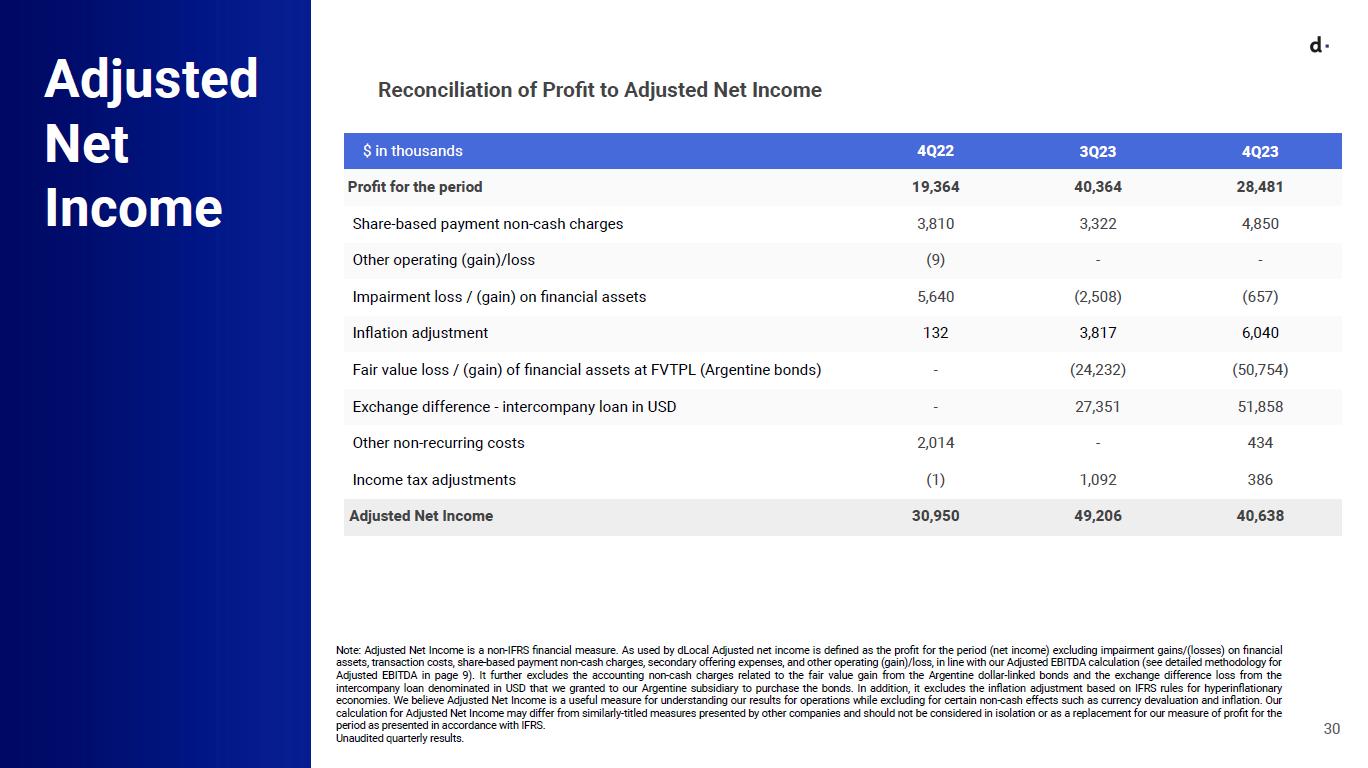
Adjusted Net Income is a non-IFRS financial measure. As used by dLocal Adjusted net income is defined as the profit for the period (net income) excluding impairment gains/(losses) on financial assets, transaction costs, share-based payment non-cash charges, secondary offering expenses, and other operating (gain)/loss, in line with our Adjusted EBITDA calculation (see detailed methodology for Adjusted EBITDA in page 9). It further excludes the accounting non-cash charges related to the fair value gain from the Argentine dollar-linked bonds and the exchange difference loss from the intercompany loan denominated in USD that we granted to our Argentine subsidiary to purchase the bonds. In addition, it excludes the inflation adjustment based on IFRS rules for hyperinflationary economies. We believe Adjusted Net Income is a useful measure for understanding our results for operations while excluding for certain non-cash effects such as currency devaluation and inflation. Our calculation for Adjusted Net Income may differ from similarly-titled measures presented by other companies and should not be considered in isolation or as a replacement for our measure of profit for the period as presented in accordance with IFRS.
The table below presents a reconciliation of dLocal’s Adjusted net income:
$ in thousands |
Three months ended 31 of December |
Twelve months ended 31 of December |
||
|
2023 |
2022 |
2023 |
2022 |
Net income, as reported |
28,481 |
19,364 |
149,086 |
108,697 |
Share-based payment non-cash charges |
4,850 |
3,810 |
11,922 |
8,684 |
Other operating (gain)/loss |
- |
(9) |
- |
697 |
Secondary offering expenses |
- |
- |
- |
89 |
Impairment loss / (gain) on financial assets |
(657) |
5,640 |
(3,135) |
5,534 |
Inflation adjustment1 |
6,040 |
132 |
12,537 |
1,037 |
Other non-recurring costs |
434 |
2,014 |
1,663 |
2,014 |
Fair value loss / (gains) of financial assets at FVTPL2 |
(50,754) |
- |
(78,640) |
- |
Exchange difference - intercompany loan in USD |
51,858 |
- |
81,024 |
- |
Income tax expense on adjustments3 |
386 |
(1) |
834 |
56 |
Adjusted net income |
40,638 |
30,950 |
175,291 |
126,808 |
Note: ¹Following IAS 29 requirements, Argentina’s economy is considered hyperinflationary. In this sense, the financial statements of the Argentinian subsidiaries were restated to reflect the purchasing power of the currency and therefore a gain on net monetary position arose. ²During Q4 2023 we recognized a fair value gain of US$ 50.8 million (US$24.2 million in Q3 2023 and US$ 3.6 million in Q2 2023) from the Argentine dollar-linked bonds and an exchange difference loss of US$ 51.9 million (-S$ 27.4 million in Q3 2023 and -US$ 1.8 million in Q2 2023) from the intercompany loan denominated in USD that we granted to our Argentine subsidiary to purchase part of the bonds. 3We calculated the tax impact on all adjustments based on their corresponding tax rate.
EX-99.1
Earnings per share
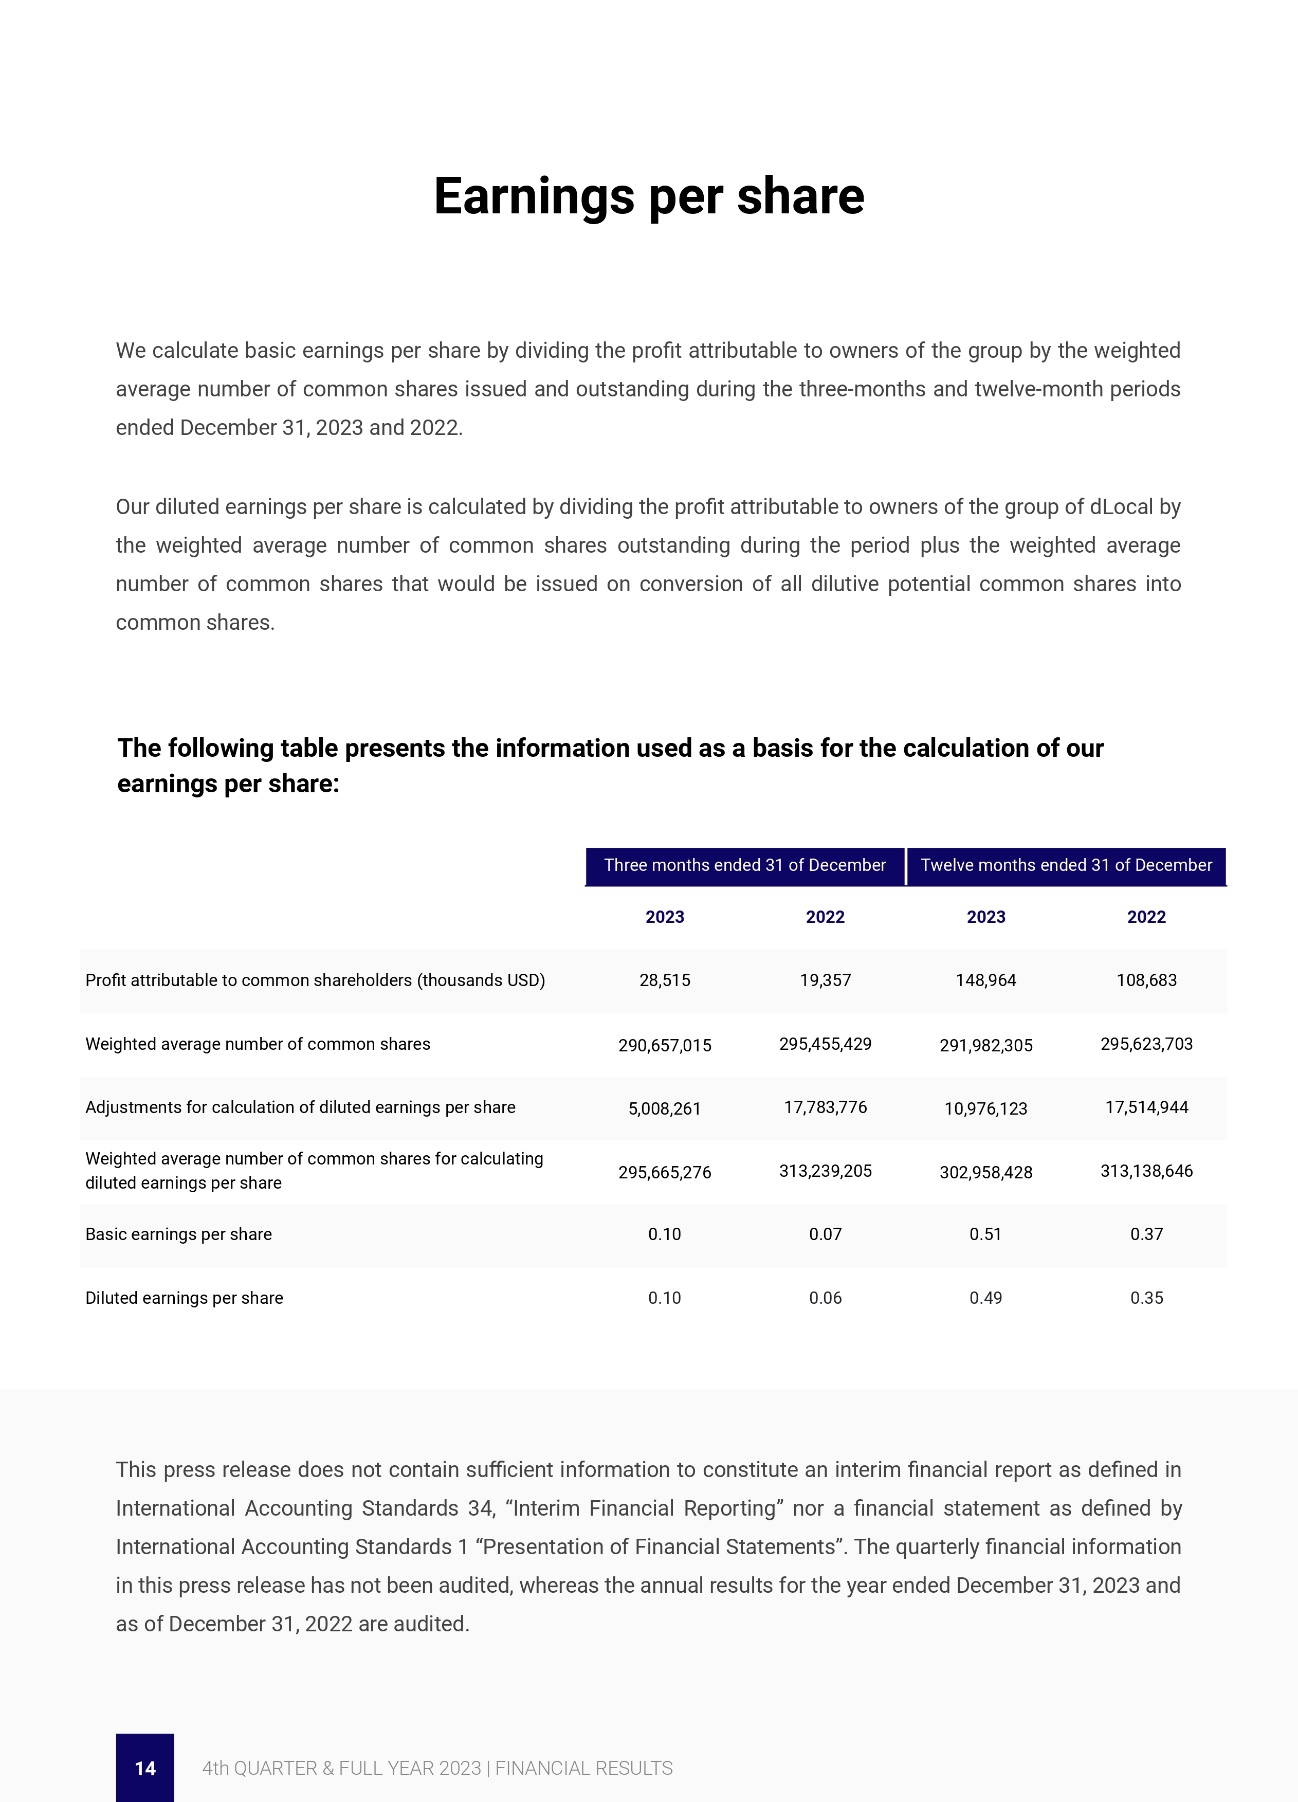
We calculate basic earnings per share by dividing the profit attributable to owners of the group by the weighted average number of common shares issued and outstanding during the three-months and twelve-month periods ended December 31, 2023 and 2022.
Our diluted earnings per share is calculated by dividing the profit attributable to owners of the group of dLocal by the weighted average number of common shares outstanding during the period plus the weighted average number of common shares that would be issued on conversion of all dilutive potential common shares into common shares.
The following table presents the information used as a basis for the calculation of our earnings per share:
|
Three months ended 31 of December |
Twelve months ended 31 of December |
||
|
2023 |
2022 |
2023 |
2022 |
Profit attributable to common shareholders (thousands USD) |
28,515 |
19,357 |
148,964 |
108,683 |
Weighted average number of common shares |
290,657,015 |
295,455,429 |
291,982,305 |
295,623,703 |
Adjustments for calculation of diluted earnings per share |
5,008,261 |
17,783,776 |
10,976,123 |
17,514,944 |
Weighted average number of common shares for calculating diluted earnings per share |
295,665,276 |
313,239,205 |
302,958,428 |
313,138,646 |
Basic earnings per share |
0.10 |
0.07 |
0.51 |
0.37 |
Diluted earnings per share |
0.10 |
0.06 |
0.49 |
0.35 |
This press release does not contain sufficient information to constitute an interim financial report as defined in International Accounting Standards 34, “Interim Financial Reporting” nor a financial statement as defined by International Accounting Standards 1 “Presentation of Financial Statements”. The quarterly financial information in this press release has not been audited, whereas the annual results for the year ended December 31, 2023 and as of December 31, 2022 are audited.
EX-99.1
Outlook full year 2024
|
FY2023 |
FY2024 Outlook range |
YoY Growth range |
TPV (US$ billion) |
18 |
25-27 |
40-50% |
Gross profit (US$ million) |
277 |
320-360 |
15-30% |
Adjusted EBITDA (US$ million) |
202 |
220-260 |
10-30% |
Outlook amounts for the full year 2024 are estimates and are based on current management expectations. Amounts are subject to change and we undertake no duty to update this outlook.
EX-99.1
Conference call and webcast
dLocal’s management team will host a conference call and audio webcast on March 19th, 2024 at 8:30 a.m. Eastern Time. Please click here to pre-register for the conference call and obtain your dial in number and passcode.
The live conference call can be accessed via audio webcast at the investor relations section of dLocal’s website, at https://investor.dlocal.com/. An archive of the webcast will be available for a year following the conclusion of the conference call. The investor presentation will also be filed on EDGAR at www.sec.gov.
About dLocal
dLocal powers local payments in emerging markets, connecting global enterprise merchants with billions of emerging market consumers in more than 40 countries across APAC, the Middle East, Latin America, and Africa. Through the “One dLocal” platform (one direct API, one platform, and one contract), global companies can accept payments, send pay-outs and settle funds globally without the need to manage separate pay-in and pay-out processors, set up numerous local entities, and integrate multiple acquirers and payment methods in each market.
EX-99.1
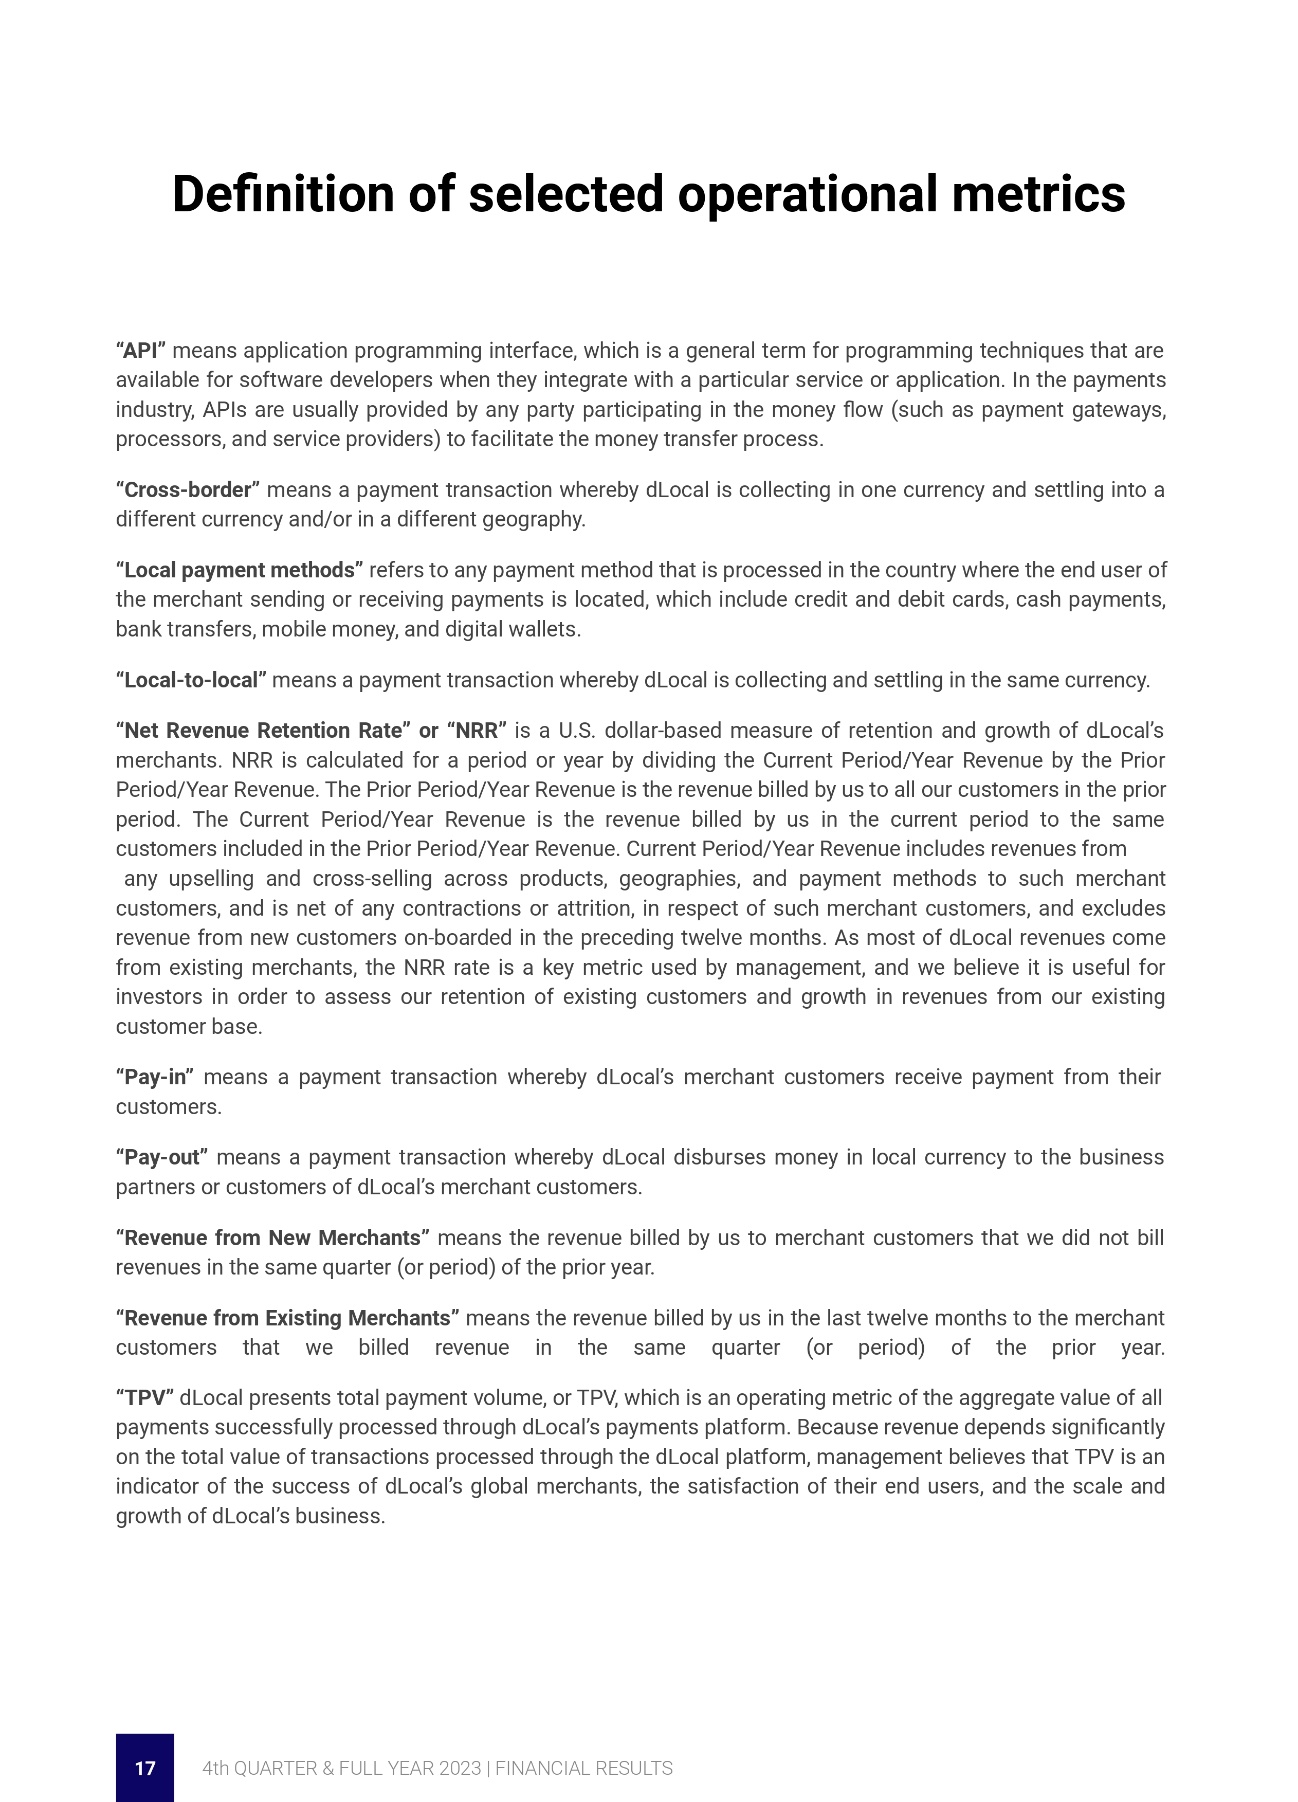
Definition of selected operational metrics
“API” means application programming interface, which is a general term for programming techniques that are available for software developers when they integrate with a particular service or application. In the payments industry, APIs are usually provided by any party participating in the money flow (such as payment gateways, processors, and service providers) to facilitate the money transfer process.
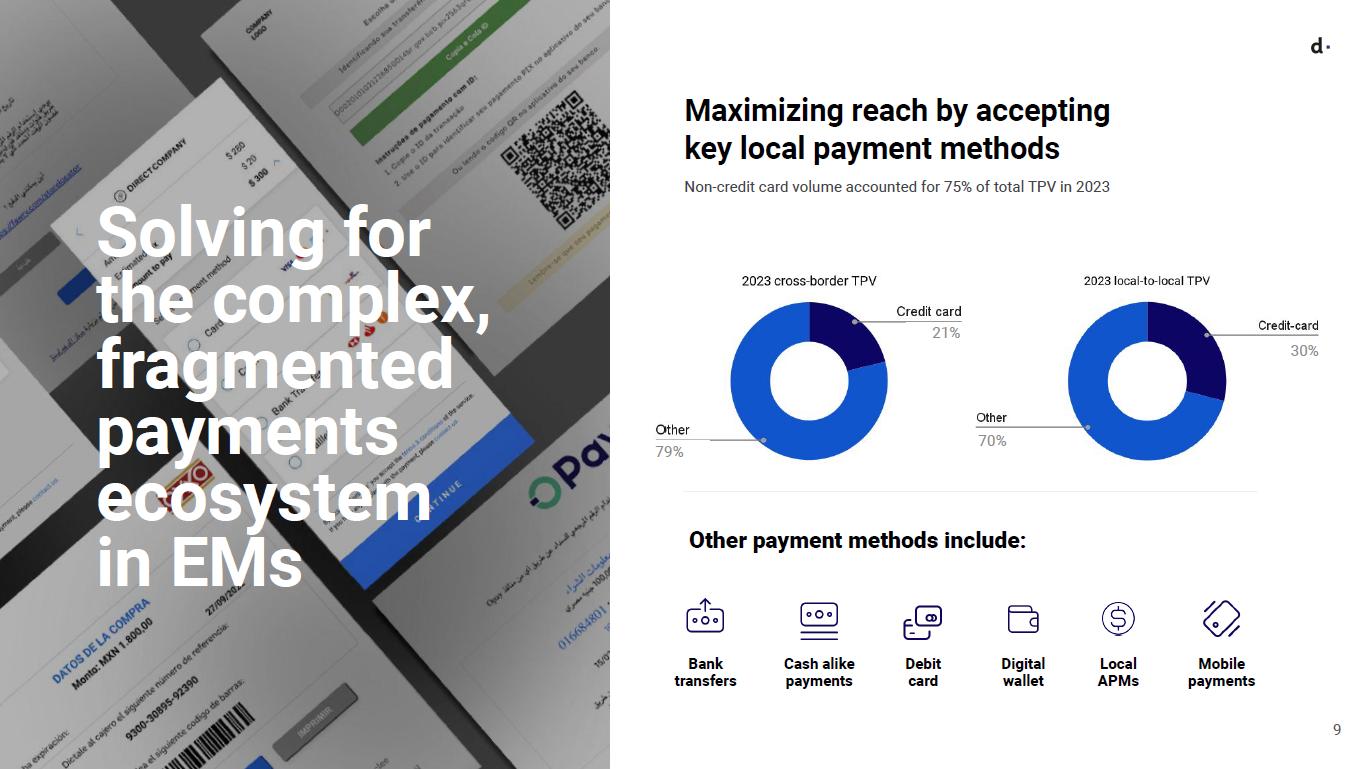
“Cross-border” means a payment transaction whereby dLocal is collecting in one currency and settling into a different currency and/or in a different geography.
“Local payment methods” refers to any payment method that is processed in the country where the end user of the merchant sending or receiving payments is located, which include credit and debit cards, cash payments, bank transfers, mobile money, and digital wallets.
“Local-to-local” means a payment transaction whereby dLocal is collecting and settling in the same currency.
“Net Revenue Retention Rate” or “NRR” is a U.S. dollar-based measure of retention and growth of dLocal’s merchants. NRR is calculated for a period or year by dividing the Current Period/Year Revenue by the Prior Period/Year Revenue. The Prior Period/Year Revenue is the revenue billed by us to all our customers in the prior period. The Current Period/Year Revenue is the revenue billed by us in the current period to the same customers included in the Prior Period/Year Revenue. Current Period/Year Revenue includes revenues from
any upselling and cross-selling across products, geographies, and payment methods to such merchant customers, and is net of any contractions or attrition, in respect of such merchant customers, and excludes revenue from new customers on-boarded in the preceding twelve months. As most of dLocal revenues come from existing merchants, the NRR rate is a key metric used by management, and we believe it is useful for investors in order to assess our retention of existing customers and growth in revenues from our existing customer base.
“Pay-in” means a payment transaction whereby dLocal’s merchant customers receive payment from their customers.
“Pay-out” means a payment transaction whereby dLocal disburses money in local currency to the business partners or customers of dLocal’s merchant customers.
“Revenue from New Merchants” means the revenue billed by us to merchant customers that we did not bill revenues in the same quarter (or period) of the prior year.
“Revenue from Existing Merchants” means the revenue billed by us in the last twelve months to the merchant customers that we billed revenue in the same quarter (or period) of the prior year.
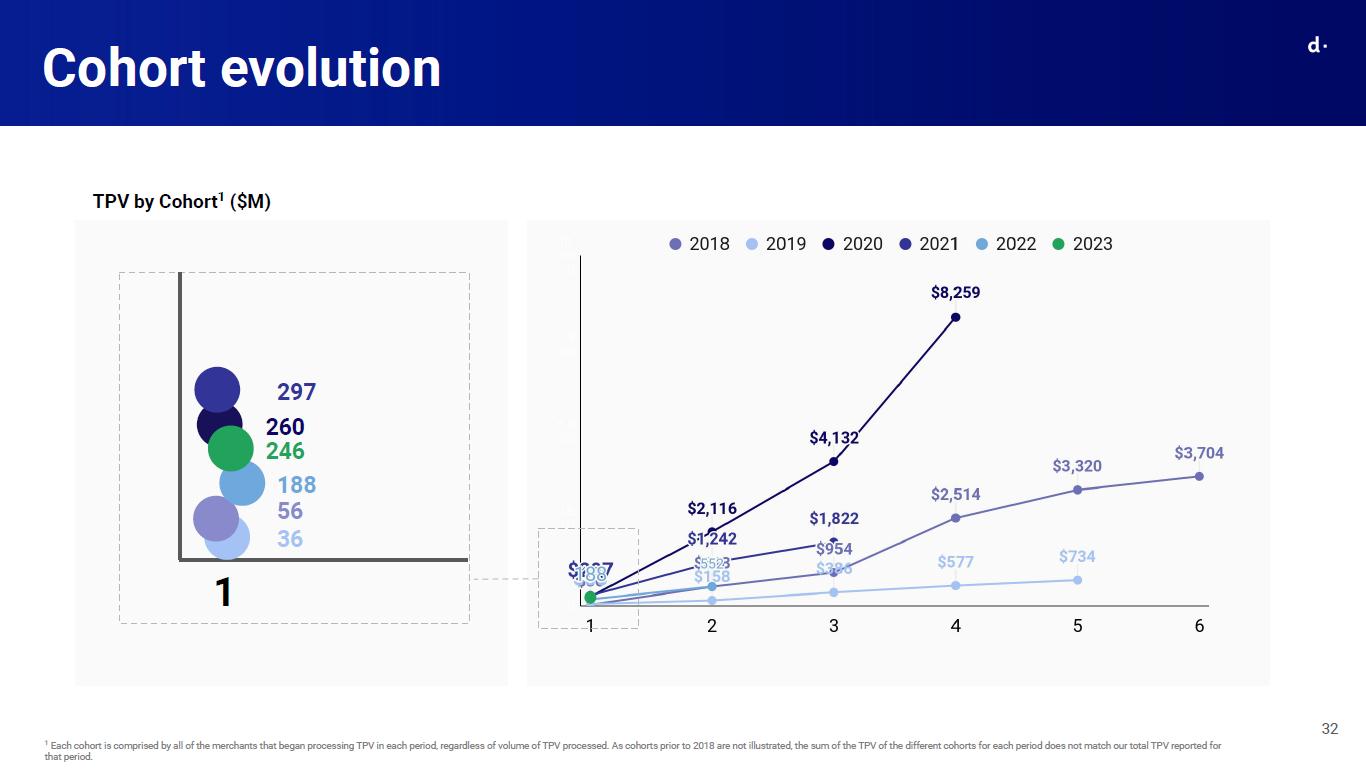
“TPV” dLocal presents total payment volume, or TPV, which is an operating metric of the aggregate value of all payments successfully processed through dLocal’s payments platform. Because revenue depends significantly on the total value of transactions processed through the dLocal platform, management believes that TPV is an indicator of the success of dLocal’s global merchants, the satisfaction of their end users, and the scale and growth of dLocal’s business.
EX-99.1
Forward-looking statements
This press release contains certain forward-looking statements. These forward-looking statements convey dLocal’s current expectations or forecasts of future events, including guidance in respect of total payment volume, gross profit, Adjusted EBITDA, gross profit CAGR and Adjusted EBITDA over gross profit margin. Forward-looking statements regarding dLocal and amounts stated as guidance are based on current management expectations and involve known and unknown risks, uncertainties and other factors that may cause dLocal’s actual results, performance or achievements to be materially different from any future results, performances or achievements expressed or implied by the forward-looking statements. Certain of these risks and uncertainties are described in the “Risk Factors,” “Forward-Looking Statements” and “Cautionary Statement Regarding Forward-Looking Statements” sections of dLocal’s filings with the U.S. Securities and Exchange Commission. Unless required by law, dLocal undertakes no obligation to publicly update or revise any forward-looking statements to reflect circumstances or events after the date hereof. In addition, dLocal is unable to present a quantitative reconciliation of forward-looking guidance for Adjusted EBITDA and Adjusted EBITDA over gross profit, which are forward-looking non-IFRS measures, because dLocal cannot reliably predict certain of their necessary components, such as impairment gains/(losses) on financial assets, transaction costs, and inflation adjustment.
EX-99.1
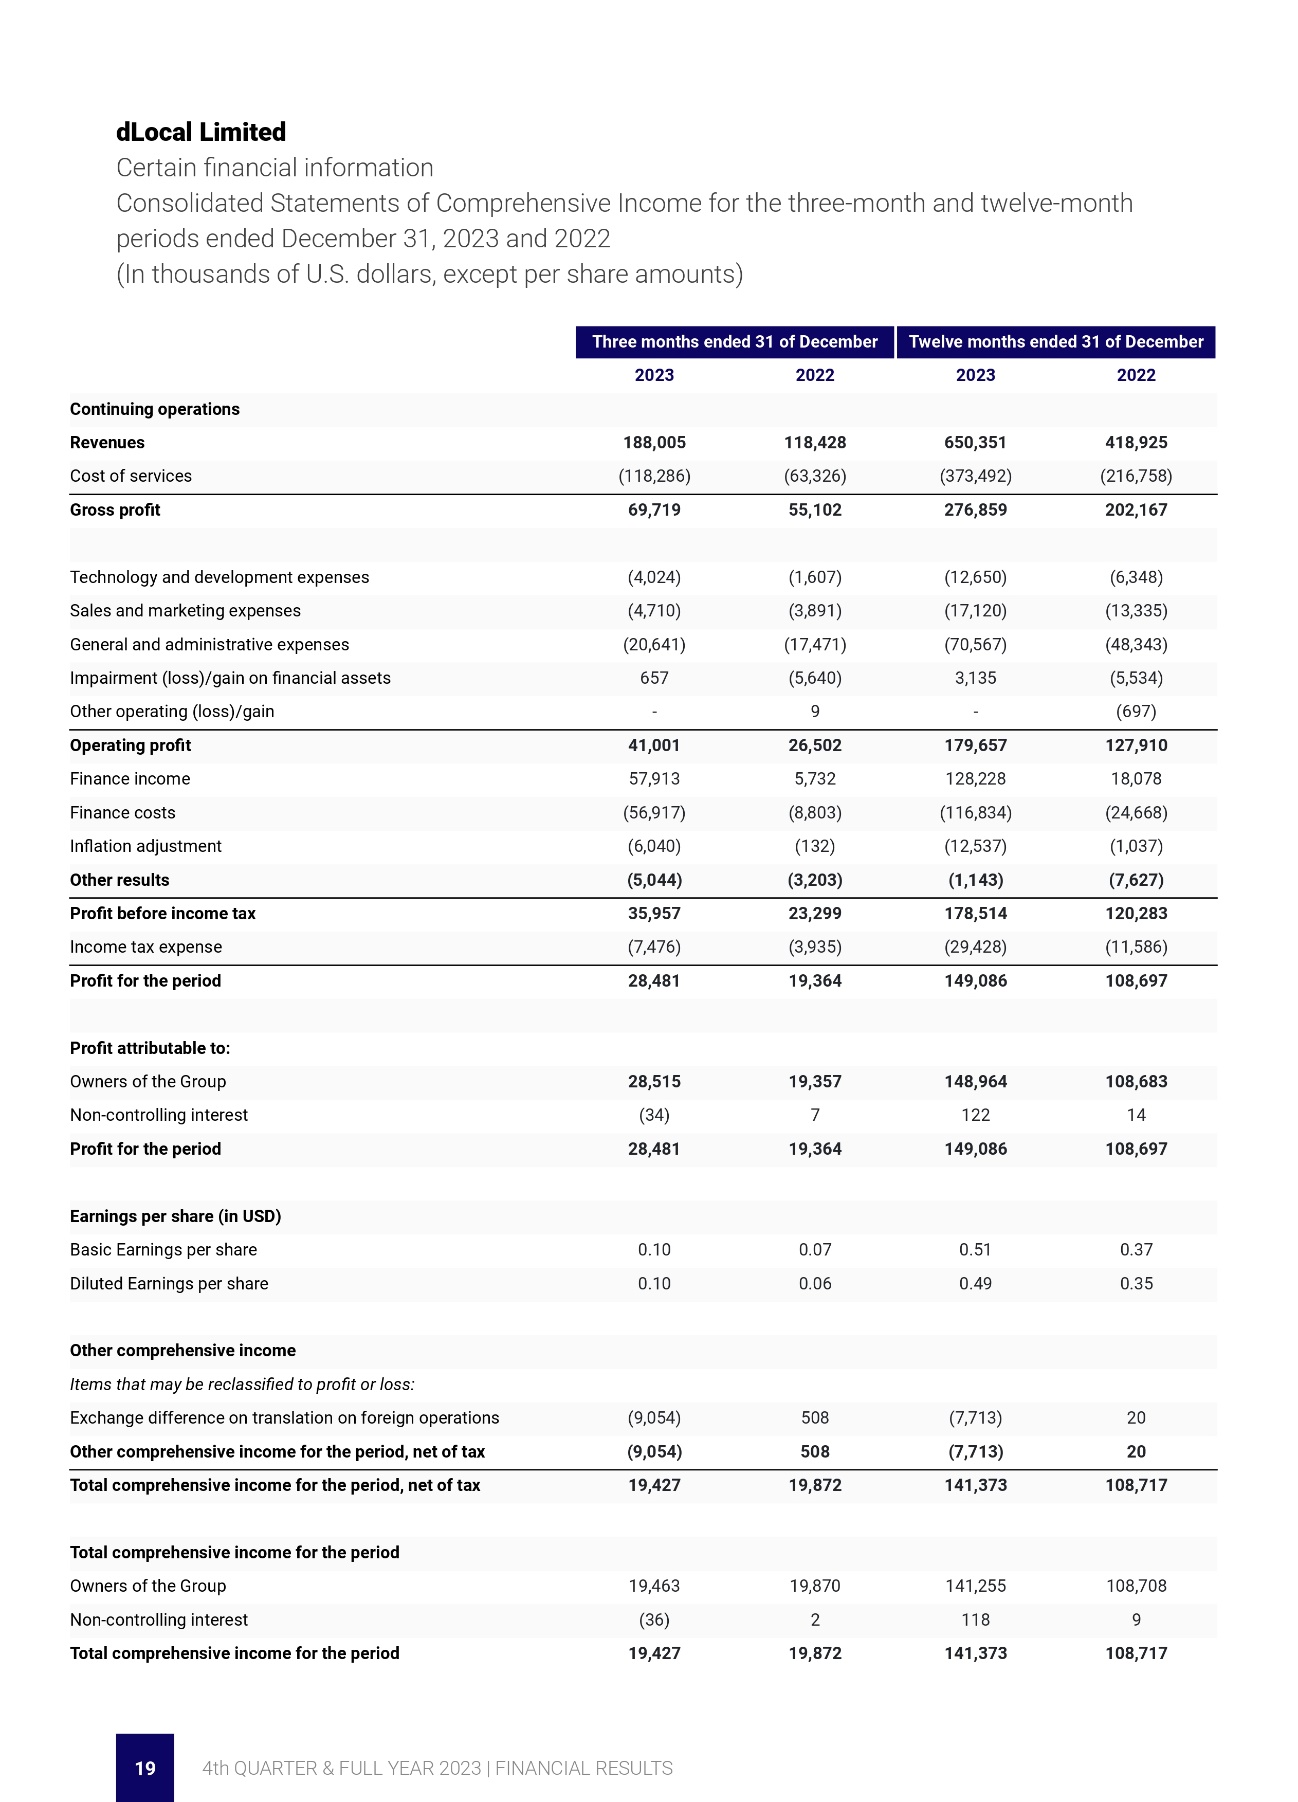
dLocal Limited
Certain financial information
Consolidated Statements of Comprehensive Income for the three-month and twelve-month periods ended December 31, 2023 and 2022
(In thousands of U.S. dollars, except per share amounts)
|
Three months ended 31 of December |
Twelve months ended 31 of December |
||
|
2023 |
2022 |
2023 |
2022 |
Continuing operations |
|
|
|
|
Revenues |
188,005 |
118,428 |
650,351 |
418,925 |
Cost of services |
(118,286) |
(63,326) |
(373,492) |
(216,758) |
Gross profit |
69,719 |
55,102 |
276,859 |
202,167 |
|
|
|
|
|
Technology and development expenses |
(4,024) |
(1,607) |
(12,650) |
(6,348) |
Sales and marketing expenses |
(4,710) |
(3,891) |
(17,120) |
(13,335) |
General and administrative expenses |
(20,641) |
(17,471) |
(70,567) |
(48,343) |
Impairment (loss)/gain on financial assets |
657 |
(5,640) |
3,135 |
(5,534) |
Other operating (loss)/gain |
- |
9 |
- |
(697) |
Operating profit |
41,001 |
26,502 |
179,657 |
127,910 |
Finance income |
57,913 |
5,732 |
128,228 |
18,078 |
Finance costs |
(56,917) |
(8,803) |
(116,834) |
(24,668) |
Inflation adjustment |
(6,040) |
(132) |
(12,537) |
(1,037) |
Other results |
(5,044) |
(3,203) |
(1,143) |
(7,627) |
Profit before income tax |
35,957 |
23,299 |
178,514 |
120,283 |
Income tax expense |
(7,476) |
(3,935) |
(29,428) |
(11,586) |
Profit for the period |
28,481 |
19,364 |
149,086 |
108,697 |
|
|
|
|
|
Profit attributable to: |
|
|
|
|
Owners of the Group |
28,515 |
19,357 |
148,964 |
108,683 |
Non-controlling interest |
(34) |
7 |
122 |
14 |
Profit for the period |
28,481 |
19,364 |
149,086 |
108,697 |
|
|
|
|
|
Earnings per share (in USD) |
|
|
|
|
Basic Earnings per share |
0.10 |
0.07 |
0.51 |
0.37 |
Diluted Earnings per share |
0.10 |
0.06 |
0.49 |
0.35 |
|
|
|
|
|
Other comprehensive income |
|
|
|
|
Items that may be reclassified to profit or loss: |
|
|
|
|
Exchange difference on translation on foreign operations |
(9,054) |
508 |
(7,713) |
20 |
Other comprehensive income for the period, net of tax |
(9,054) |
508 |
(7,713) |
20 |
Total comprehensive income for the period, net of tax |
19,427 |
19,872 |
141,373 |
108,717 |
|
|
|
|
|
Total comprehensive income for the period |
|
|
|
|
Owners of the Group |
19,463 |
19,870 |
141,255 |
108,708 |
Non-controlling interest |
(36) |
2 |
118 |
9 |
Total comprehensive income for the period |
19,427 |
19,872 |
141,373 |
108,717 |
EX-99.1
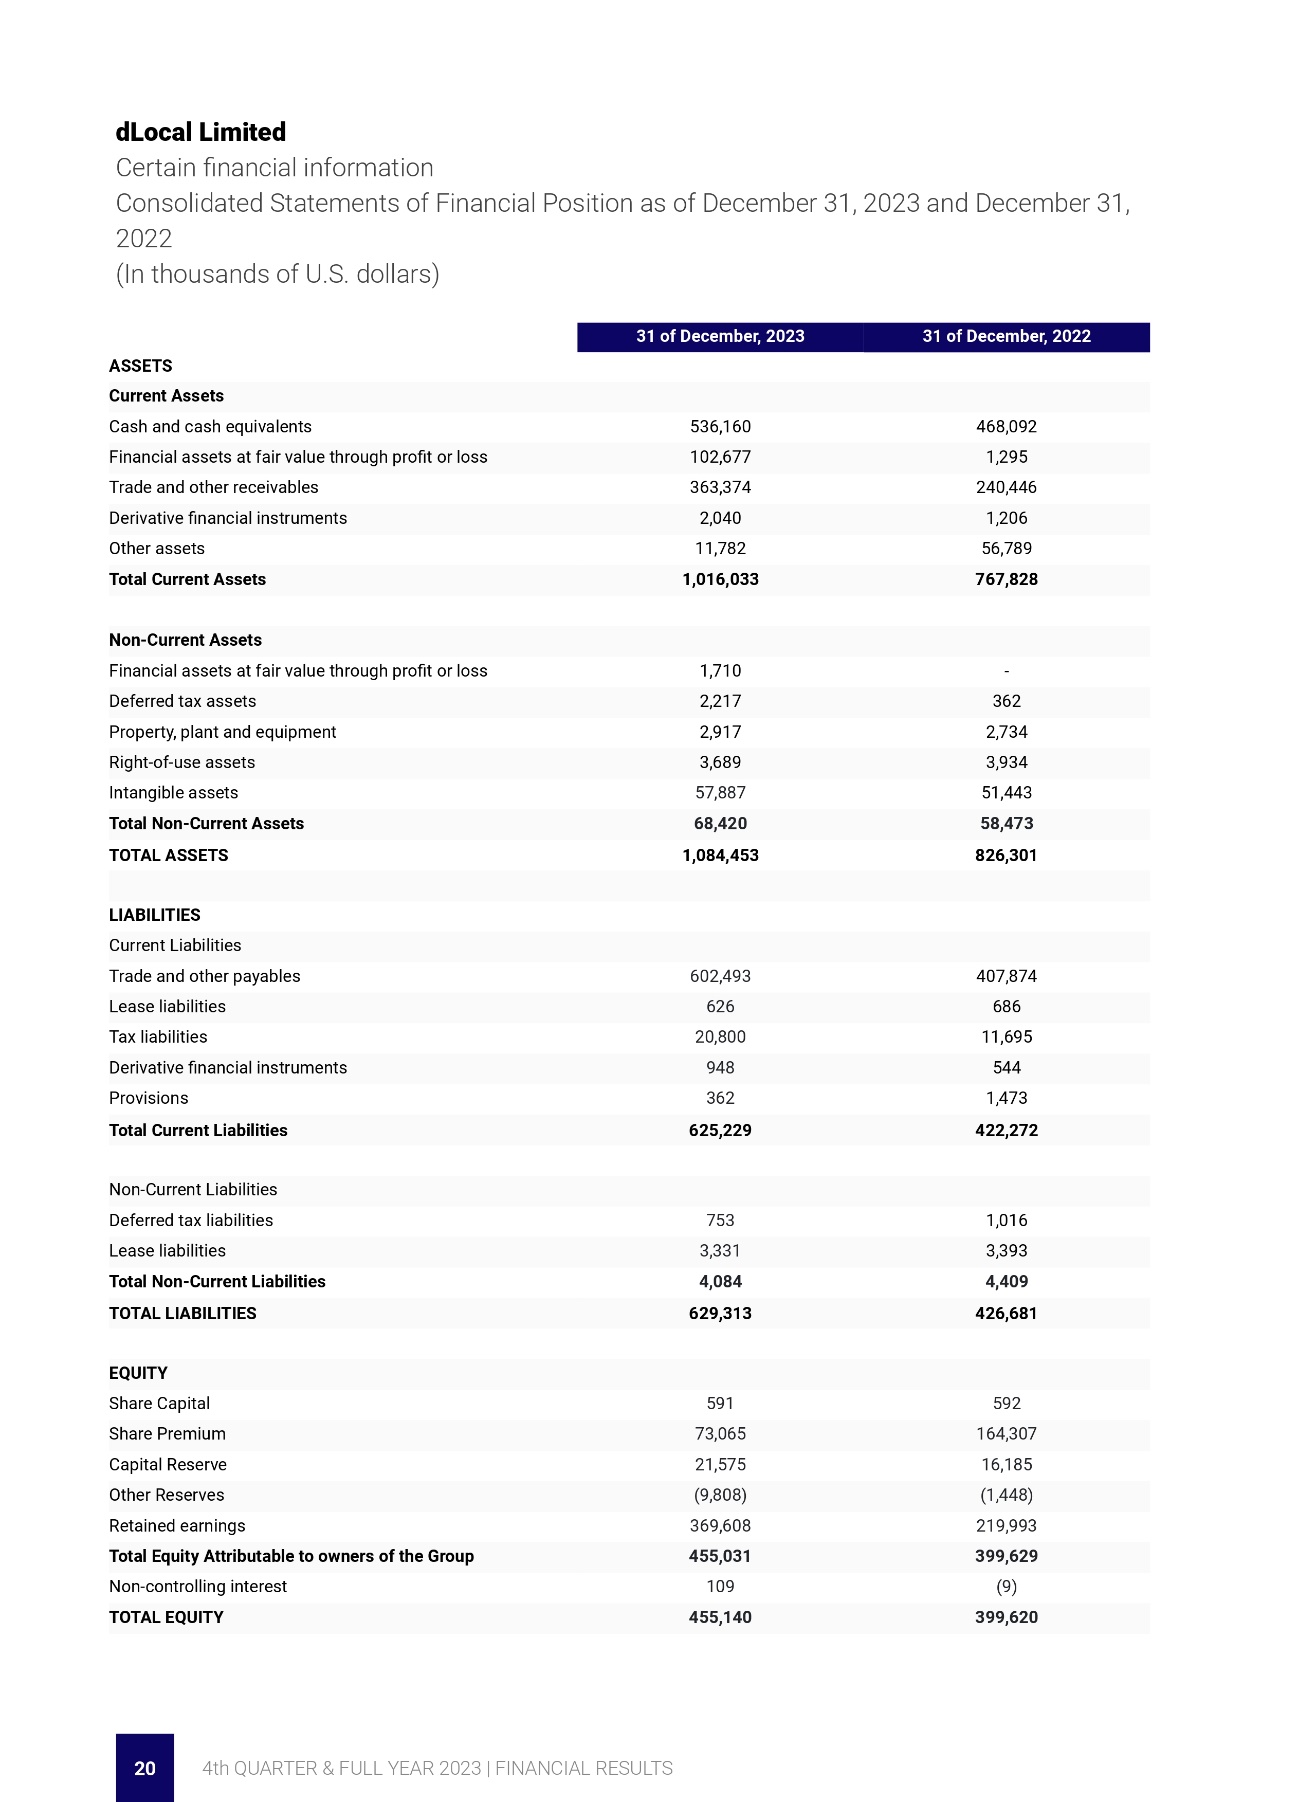
dLocal Limited
Certain financial information
Consolidated Statements of Financial Position as of December 31, 2023 and December 31, 2022
(In thousands of U.S. dollars)
|
31 of December, 2023 |
31 of December, 2022 |
ASSETS |
|
|
Current Assets |
|
|
Cash and cash equivalents |
536,160 |
468,092 |
Financial assets at fair value through profit or loss |
102,677 |
1,295 |
Trade and other receivables |
363,374 |
240,446 |
Derivative financial instruments |
2,040 |
1,206 |
Other assets |
11,782 |
56,789 |
Total Current Assets |
1,016,033 |
767,828 |
|
|
|
Non-Current Assets |
|
|
Financial assets at fair value through profit or loss |
1,710 |
- |
Deferred tax assets |
2,217 |
362 |
Property, plant and equipment |
2,917 |
2,734 |
Right-of-use assets |
3,689 |
3,934 |
Intangible assets |
57,887 |
51,443 |
Total Non-Current Assets |
68,420 |
58,473 |
TOTAL ASSETS |
1,084,453 |
826,301 |
|
|
|
LIABILITIES |
|
|
Current Liabilities |
|
|
Trade and other payables |
602,493 |
407,874 |
Lease liabilities |
626 |
686 |
Tax liabilities |
20,800 |
11,695 |
Derivative financial instruments |
948 |
544 |
Provisions |
362 |
1,473 |
Total Current Liabilities |
625,229 |
422,272 |
|
|
|
Non-Current Liabilities |
|
|
Deferred tax liabilities |
753 |
1,016 |
Lease liabilities |
3,331 |
3,393 |
Total Non-Current Liabilities |
4,084 |
4,409 |
TOTAL LIABILITIES |
629,313 |
426,681 |
|
|
|
EQUITY |
|
|
Share Capital |
591 |
592 |
Share Premium |
73,065 |
164,307 |
Capital Reserve |
21,575 |
16,185 |
Other Reserves |
(9,808) |
(1,448) |
Retained earnings |
369,608 |
219,993 |
Total Equity Attributable to owners of the Group |
455,031 |
399,629 |
Non-controlling interest |
109 |
(9) |
TOTAL EQUITY |
455,140 |
399,620 |
EX-99.1
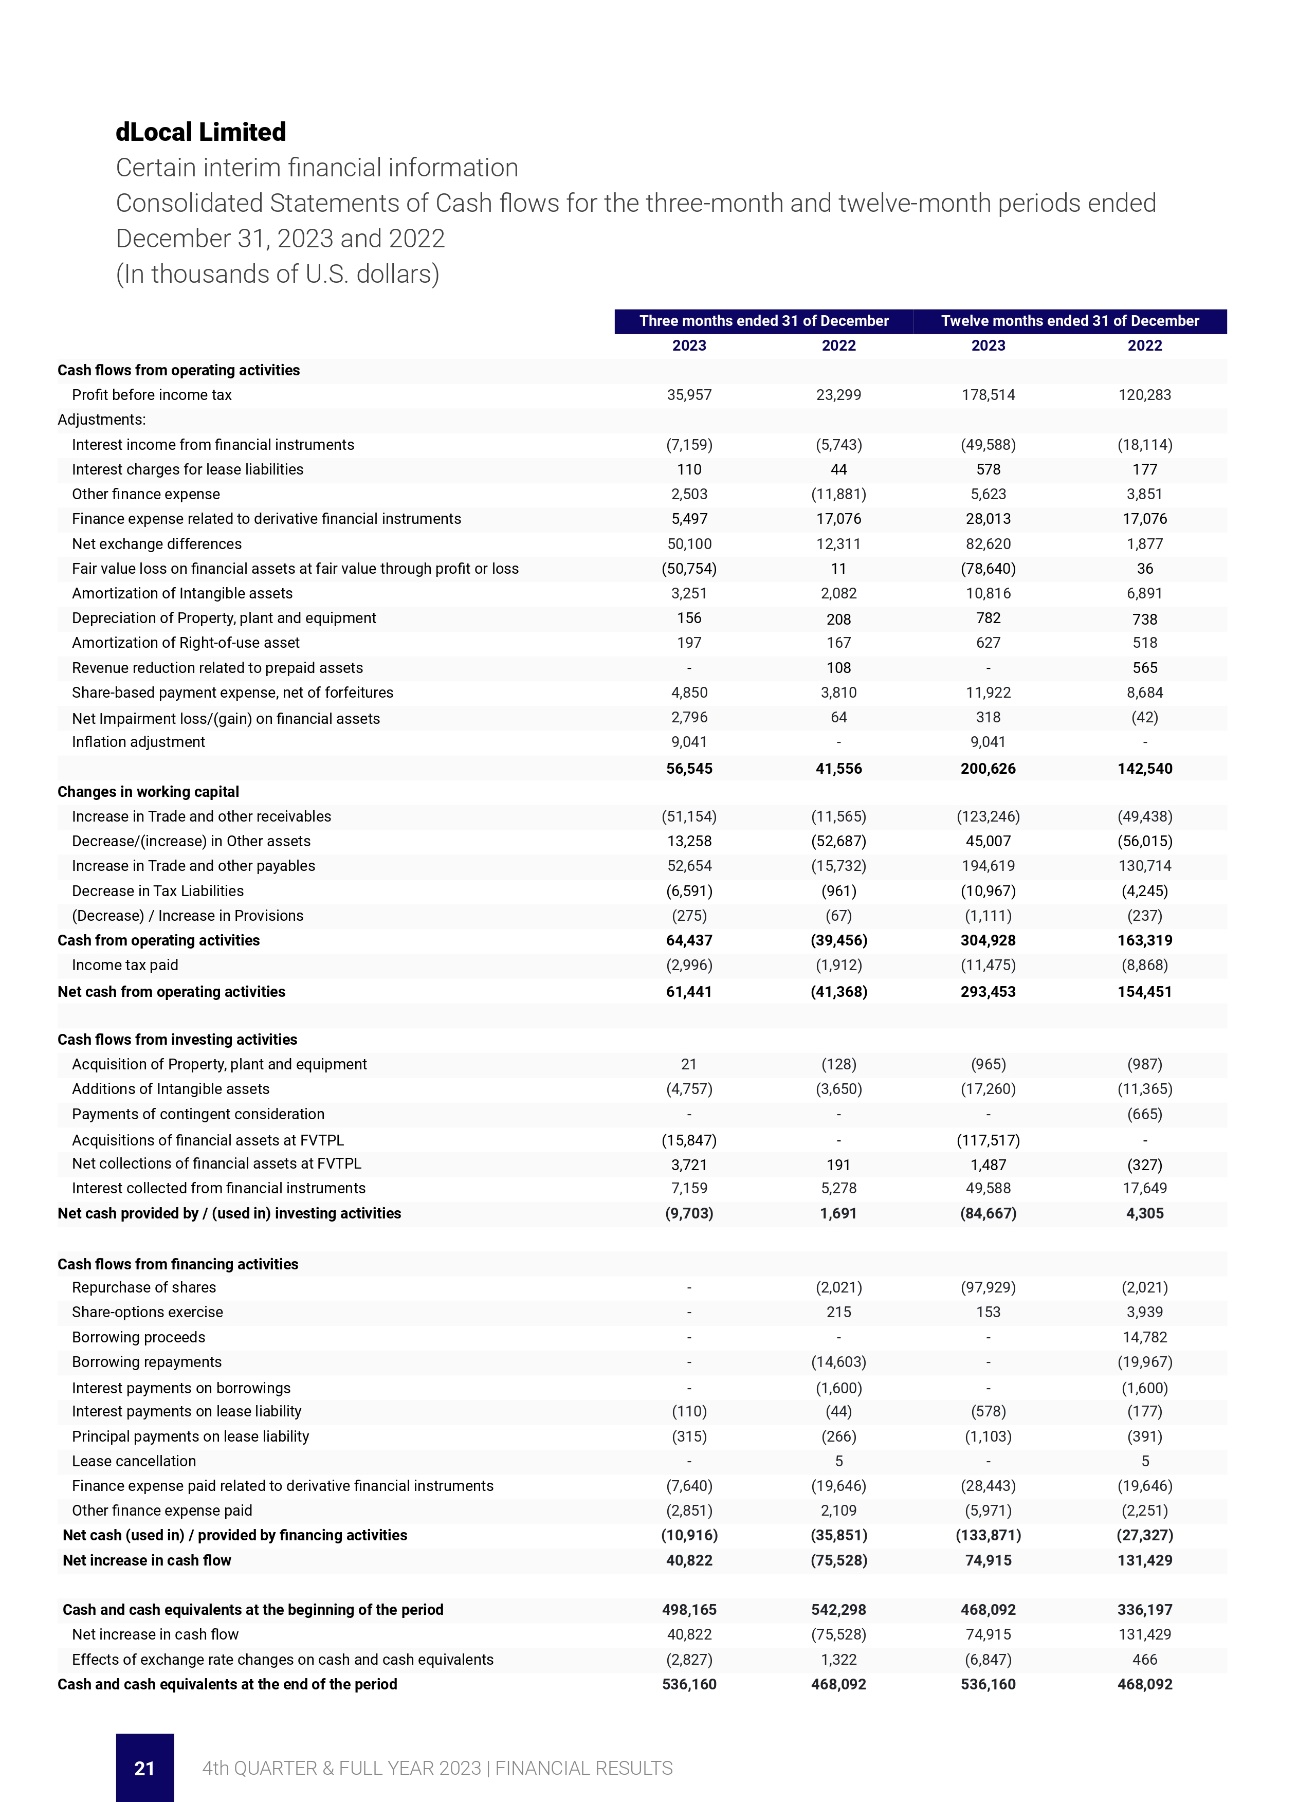
dLocal Limited
Certain interim financial information
Consolidated Statements of Cash flows for the three-month and twelve-month periods ended December 31, 2023 and 2022
(In thousands of U.S. dollars)
|
Three months ended 31 of December |
Twelve months ended 31 of December |
||
|
2023 |
2022 |
2023 |
2022 |
Cash flows from operating activities |
|
|
|
|
Profit before income tax |
35,957 |
23,299 |
178,514 |
120,283 |
Adjustments: |
|
|
|
|
Interest income from financial instruments |
(7,159) |
(5,743) |
(49,588) |
(18,114) |
Interest charges for lease liabilities |
110 |
44 |
578 |
177 |
Other finance expense |
2,503 |
(11,881) |
5,623 |
3,851 |
Finance expense related to derivative financial instruments |
5,497 |
17,076 |
28,013 |
17,076 |
Net exchange differences |
50,100 |
12,311 |
82,620 |
1,877 |
Fair value loss on financial assets at fair value through profit or loss |
(50,754) |
11 |
(78,640) |
36 |
Amortization of Intangible assets |
3,251 |
2,082 |
10,816 |
6,891 |
Depreciation of Property, plant and equipment |
156 |
208 |
782 |
738 |
Amortization of Right-of-use asset |
197 |
167 |
627 |
518 |
Revenue reduction related to prepaid assets |
- |
108 |
- |
565 |
Share-based payment expense, net of forfeitures |
4,850 |
3,810 |
11,922 |
8,684 |
Net Impairment loss/(gain) on financial assets |
2,796 |
64 |
318 |
(42) |
Inflation adjustment |
9,041 |
- |
9,041 |
- |
|
56,545 |
41,556 |
200,626 |
142,540 |
Changes in working capital |
|
|
|
|
Increase in Trade and other receivables |
(51,154) |
(11,565) |
(123,246) |
(49,438) |
Decrease/(increase) in Other assets |
13,258 |
(52,687) |
45,007 |
(56,015) |
Increase in Trade and other payables |
52,654 |
(15,732) |
194,619 |
130,714 |
Decrease in Tax Liabilities |
(6,591) |
(961) |
(10,967) |
(4,245) |
(Decrease) / Increase in Provisions |
(275) |
(67) |
(1,111) |
(237) |
Cash from operating activities |
64,437 |
(39,456) |
304,928 |
163,319 |
Income tax paid |
(2,996) |
(1,912) |
(11,475) |
(8,868) |
Net cash from operating activities |
61,441 |
(41,368) |
293,453 |
154,451 |
|
|
|
|
|
Cash flows from investing activities |
|
|
|
|
Acquisition of Property, plant and equipment |
21 |
(128) |
(965) |
(987) |
Additions of Intangible assets |
(4,757) |
(3,650) |
(17,260) |
(11,365) |
Payments of contingent consideration |
- |
- |
- |
(665) |
Acquisitions of financial assets at FVTPL |
(15,847) |
- |
(117,517) |
- |
Net collections of financial assets at FVTPL |
3,721 |
191 |
1,487 |
(327) |
Interest collected from financial instruments |
7,159 |
5,278 |
49,588 |
17,649 |
Net cash provided by / (used in) investing activities |
(9,703) |
1,691 |
(84,667) |
4,305 |
|
|
|
|
|
Cash flows from financing activities |
|
|
|
|
Repurchase of shares |
- |
(2,021) |
(97,929) |
(2,021) |
Share-options exercise |
- |
215 |
153 |
3,939 |
Borrowing proceeds |
- |
- |
- |
14,782 |
Borrowing repayments |
- |
(14,603) |
- |
(19,967) |
Interest payments on borrowings |
- |
(1,600) |
- |
(1,600) |
Interest payments on lease liability |
(110) |
(44) |
(578) |
(177) |
Principal payments on lease liability |
(315) |
(266) |
(1,103) |
(391) |
Lease cancellation |
- |
5 |
- |
5 |
Finance expense paid related to derivative financial instruments |
(7,640) |
(19,646) |
(28,443) |
(19,646) |
Other finance expense paid |
(2,851) |
2,109 |
(5,971) |
(2,251) |
Net cash (used in) / provided by financing activities |
(10,916) |
(35,851) |
(133,871) |
(27,327) |
Net increase in cash flow |
40,822 |
(75,528) |
74,915 |
131,429 |
|
|
|
|
|
Cash and cash equivalents at the beginning of the period |
498,165 |
542,298 |
468,092 |
336,197 |
Net increase in cash flow |
40,822 |
(75,528) |
74,915 |
131,429 |
Effects of exchange rate changes on cash and cash equivalents |
(2,827) |
1,322 |
(6,847) |
466 |
Cash and cash equivalents at the end of the period |
536,160 |
468,092 |
536,160 |
468,092 |
EX-99.1
Investor Relations Contact:
investor@dlocal.com
Media Contact:
marketing@dlocal.com
EX-99.2
EX-99.2

EX-99.2
EX-99.2
EX-99.2
EX-99.2

EX-99.2
EX-99.2
EX-99.2
EX-99.2
EX-99.2

EX-99.2
EX-99.2
EX-99.2
EX-99.2
EX-99.2
EX-99.2
EX-99.2
EX-99.2
EX-99.2
EX-99.2
EX-99.2

EX-99.2

EX-99.3

EX-99.3

EX-99.3
EX-99.3

EX-99.3
EX-99.3
EX-99.3
EX-99.3
EX-99.3
EX-99.3
EX-99.3
EX-99.3

EX-99.3
EX-99.3
EX-99.3
EX-99.3
EX-99.3
EX-99.3
EX-99.3
EX-99.3
EX-99.3
EX-99.3
EX-99.3

EX-99.3

EX-99.3
EX-99.3
EX-99.3
EX-99.3
EX-99.3
EX-99.3
EX-99.3

EX-99.3
EX-99.4
dLocal Appoints Dr. Verónica Raffo as Independent Board Member
Distinguished lawyer with deep expertise in corporate governance to join the Board of Directors and uphold highest standards of transparency and accountability for the firm.
Montevideo, Uruguay, March 18, 2024 - dLocal (Nasdaq: DLO), the leading cross-border payment platform specializing in high-growth markets, is pleased to announce the appointment of Dr. Verónica Raffo as an independent board member, effective March 18, 2024. Dr. Raffo will join the esteemed ranks of our Audit Committee, bringing with them a wealth of experience and expertise in corporate governance.
Dr. Raffo brings a distinguished track record of accomplishments as a partner in Ferrere, one of the top legal firms in Uruguay and the region. At Ferrere, she participates actively in its management and strategic leadership. She has more than 25 years of experience advising a stellar list of global clients, managing highly complex and sensitive cases with a focus on corporate issues, dispute negotiation, compliance audits and corporate governance.
Dr. Raffo is also an authority in entrepreneurship and gender issues, both in Uruguay and internationally. She is the incoming gold Regional Chair Latin America of YPO (Young Presidents Organization) and she was one of the founders and the President of the Uruguayan Women Entrepreneurs Organization, OMEU. Each year since 2019 she has been recognized as Uruguay’s most highly reputed woman business leader, according to the Corporate Reputation Business Monitor (MERCO). She is an instructor in Board Management at the Graduate School of Business - EPN of Universidad ORT Uruguay. She is a licensed lawyer (Universidad de la República, Uruguay) and holds a diploma in American and International Law from The Center for American and International Law (United States).
Dr. Raffo’s appointment underscores dLocal’s commitment to maintaining the highest standards of transparency, accountability, and regulatory compliance.
As a member of our Audit Committee, Dr. Raffo will play a pivotal role in overseeing financial reporting processes, internal controls, and risk management practices. Her vast knowledge and strategic insights will further strengthen our governance framework, ensuring that dLocal continues to operate with integrity and efficiency.
"We are thrilled to welcome Verónica to our board of directors and Audit Committee," said Pedro Arnt, CEO. "Her extensive experience in corporate governance will be instrumental in guiding our company towards sustained growth and success. We look forward to leveraging her expertise as we navigate the evolving landscape of the fintech industry."
Dr. Raffo expressed her enthusiasm about joining dLocal, stating, "I am honored to join dLocal's board of directors and serve on the Audit Committee. I strongly believe the company’s commitment to transparency and accountability will strengthen its performance even further." Her insights and perspectives will undoubtedly enrich board discussions and enhance shareholder value.
EX-99.4
We extend our warmest welcome to Dr. Verónica Raffo and look forward to her valuable contributions as we continue to chart a course for sustainable growth and success in emerging markets.
At dLocal, we would like to extend our sincere gratitude to Jitendra Gupta, for his contributions, dedication, and wisdom during his tenure as an independent member. His insights have been instrumental in shaping our strategic direction and we wish him all the best in his future endeavors.
About dLocal
dLocal powers local payments in emerging markets, connecting global enterprise merchants with billions of high-growth market consumers across Africa, Asia, and Latin America. Through the "One dLocal" concept (one direct API, one platform, and one contract), global companies can accept payments, send payouts, and settle funds globally without the need to manage separate pay-in and payout processors, set up numerous local entities, integrate multiple acquirers and payment methods in each market.
For more information, visit https://dlocal.com.
Investor Relations Contact:
ir@dlocal.com
Media Contact:
marketing@dlocal.com
EX-99.5
dLocal Appoints Mark Ortiz as New Chief Financial Officer
Former General Electric executive with over three decades of experience to help dLocal with the financial strategy behind the company’s continuing global expansion.
Montevideo, Uruguay, March 18, 2024 - dLocal (Nasdaq: DLO), the leading cross-border payment platform specializing in high-growth markets, announced today that Mark Ortiz has been appointed Chief Financial Officer. Ortiz will report directly to dLocal’s CEO, Pedro Arnt, overseeing dLocal's accounting, financial planning and analysis, financial reporting internal audit, SEC reporting, tax, credit, risk, and treasury functions. Mark’s appointment complements the already exceptional leadership team at dLocal.
Mark joins dLocal during a period of rapid growth as it continues to deliver on its mission to unlock the power of emerging markets. He brings over 30 years of extensive international financial and operational management experience primarily within GE’s umbrella companies. While at GE, Mark held senior positions in various financial areas, culminating in roles as Global FP&A Leader for GE Capital, CFO for the Industrial Finance & Energy Financial Services businesses, and Global Controller for GE Capital’s Real Estate and Equipment Leasing and Lending platforms. During his professional career he lived and worked in over 20 markets, making him the ideal candidate to bolster dLocal’s current emerging markets high-growth expansion strategy.
“I am very impressed with the outstanding results that dLocal achieved in such a short period of time and really excited about the growth potential of the company.” says Mark Ortiz, dLocal’s newly appointed CFO. “I am honored to join dLocal as its next Chief Financial Officer and look forward to continuing to build this great company.”
“Mark's international background includes not only key financial expertise fit to our current requirements, but also working assignments across over 20 markets, making him well suited for the global complexity that dLocal presents, ” says Pedro Arnt, dLocal’s CEO “I trust Mark is the optimal CFO choice to propel us to the next level of growth and reinforce our standing as a frontrunner in payment solutions for emerging markets,” he adds.
In the position of CFO Mark will be tasked with a central role in continuing to deploy dLocal’s investments, aimed at constructing the foundational company building mechanisms that will ensure a sustainable, efficient, and high growth business going forward.
dLocal wants to extend gratitude to the outgoing CFO, Diego Cabrera Canay, for his invaluable contributions to date. Diego played a pivotal role in establishing numerous finance functions at dLocal, prepping it for substantial international expansion and growth, and guiding the company through its public listing process.
About dLocal
dLocal powers local payments in emerging markets, connecting global enterprise merchants with billions of high-growth market consumers across Africa, Asia, and Latin America.
EX-99.5
Through the "One dLocal" concept (one direct API, one platform, and one contract), global companies can accept payments, send payouts, and settle funds globally without the need to manage separate pay-in and payout processors, set up numerous local entities, integrate multiple acquirers and payment methods in each market.
For more information, visit https://dlocal.com.
Investor Relations Contact:
ir@dlocal.com
Media Contact:
marketing@dlocal.com