UNITED STATES
SECURITIES AND EXCHANGE COMMISSION
WASHINGTON, D.C. 20549
FORM 8-K
CURRENT REPORT
Pursuant to Section 13 or 15(d) of the Securities Exchange Act of 1934
Date of Report (Date of earliest event reported): March 18, 2024 |
Myers Industries, Inc.
(Exact name of Registrant as Specified in Its Charter)
Ohio |
001-8524 |
34-0778636 |
||
(State or Other Jurisdiction |
(Commission File Number) |
(IRS Employer |
||
|
|
|
|
|
1293 South Main Street |
|
|||
Akron, Ohio |
|
44301 |
||
(Address of Principal Executive Offices) |
|
(Zip Code) |
||
Registrant’s Telephone Number, Including Area Code: (330) 253-5592 |
|
(Former Name or Former Address, if Changed Since Last Report)
Check the appropriate box below if the Form 8-K filing is intended to simultaneously satisfy the filing obligation of the registrant under any of the following provisions:
Securities registered pursuant to Section 12(b) of the Act:
|
|
Trading |
|
|
Common Stock, without par value |
|
MYE |
|
New York Stock Exchange |
Indicate by check mark whether the registrant is an emerging growth company as defined in Rule 405 of the Securities Act of 1933 (§ 230.405 of this chapter) or Rule 12b-2 of the Securities Exchange Act of 1934 (§ 240.12b-2 of this chapter).
Emerging growth company ☐
If an emerging growth company, indicate by check mark if the registrant has elected not to use the extended transition period for complying with any new or revised financial accounting standards provided pursuant to Section 13(a) of the Exchange Act. ☐
Item 7.01 Regulation FD Disclosure.
On March 18, 2024, Myers Industries, Inc. (the “Company”) issued a press release announcing that it will be hosting an Investor Day in New York City on March 19, 2024, at which Mike McGaugh, President and Chief Executive Officer, Grant Fitz, Executive Vice President and Chief Financial Officer, and certain other Company representatives will be presenting. The full text of the press release issued in connection with the announcement is attached as Exhibit 99.1. A copy of the presentation to be used by the Company at the Investor Day is attached as Exhibit 99.2 hereto.
The press release and the Investor Day presentation are furnished herein, as part of this Item 7.01, as Exhibits 99.1 and 99.2, respectively. Pursuant to General Instruction B.2 of Current Report on Form 8-K, the information in this Item 7.01 and Exhibits 99.1 and 99.2 shall not be deemed to be “filed” for purposes of Section 18 of the Exchange Act, or otherwise subject to the liability of that section. Furthermore, the information in this Item 7.01 and Exhibits 99.1 and 99.2 shall not be deemed to be incorporated by reference into the filings of the Company under the Securities Act, except as may be expressly set forth by specific reference in such filing.
Item 9.01 Financial Statements and Exhibits.
(d) Exhibits.
Exhibit Number |
Description |
99.1 |
|
99.2 |
|
104 |
Cover Page Interactive Data File (embedded within the Inline XBRL document) |
SIGNATURES
Pursuant to the requirements of the Securities Exchange Act of 1934, the registrant has duly caused this report to be signed on its behalf by the undersigned hereunto duly authorized.
|
|
|
Myers Industries, Inc. |
|
|
|
|
Date: |
March 18, 2024 |
By: |
/s/ Grant E. Fitz |
|
|
|
Grant E. Fitz |
Exhibit 99.1

Myers Industries Hosts Investor Day and Unveils its Horizon Two Strategy Outlook
Event outlines Company’s strategy to drive profitable growth and provides outlook through fiscal year 2026
March 18, 2024, Akron, Ohio - Myers Industries, Inc. (NYSE: MYE), a leading manufacturer of a wide range of polymer and metal products and distributor for the tire, wheel, and under-vehicle service industry, will host its 2024 Investor Day event tomorrow morning at the Harvard Club of New York City. The event will be led by Mike McGaugh, Myers Industries’ President and Chief Executive Officer, and will feature presentations from other members of the executive leadership team. Materials supporting the event have been filed as of the time of this press release and are available on Myers' investor relations website.
Mike McGaugh commented, “During this event we will highlight the progress we’ve made in successfully executing Myers Three Horizon Strategy, the foundation we’ve built through Horizon One, and the strategic focus of our Company as we transition to Horizon Two. We will also be reviewing the long-term vision for our Company.”
McGaugh concluded, “Today, we recognize that several of our cyclical end markets are experiencing trough-like levels of demand. As these end markets return to historical demand levels, Myers is well positioned to recover with even stronger margin performance from the foundation established in Horizon One. Our focus in Horizon Two is to continue growing through acquisition and innovation, gaining scale as we move into adjacent markets and technologies with a focus on branded products, and delivering continued improvement in profitability and cash flow generation. We believe our strategy will enable us to deliver strong returns to shareholders through our disciplined approach to capital allocation, which includes the continuation of our dividend program, reinvestments in the business, opportunistic share repurchases, and strategic M&A activity.”
Event Webcast and Replay Details
The Company will host a live webcast of its Investor Day event for investors and analysts on Tuesday, March 19, 2024. The event will begin at 8:30 AM (ET) and is expected to conclude before 12:00 PM (ET). Interested parties may access the webcast using the following online participation registration link: https://app.webinar.net/QpgVLDqlkZd. A complete recording of the Company’s Investor Day presentations will be posted to the Company’s investor relations website following the conclusion of the event. To access the event replay, please visit the Events & Presentations section of the Company’s investor relations website at www.myersindustries.com.
Use of Non-GAAP Financial Measures
The Company uses certain non-GAAP measures in presentation materials referenced in this release. Adjusted operating income (loss), adjusted operating income margin, adjusted earnings before interest, taxes, depreciation and amortization (EBITDA), adjusted EBITDA margin, adjusted net income, adjusted earnings per diluted share (adjusted EPS), and free cash flow are non-GAAP financial measures and are intended to serve as a supplement to results provided in accordance with accounting principles generally accepted in the United States. Myers Industries believes that such information provides an additional measurement and consistent historical comparison of the Company’s performance. A reconciliation of the non-GAAP financial measures to the most directly comparable GAAP measures is available in the presentation materials referenced in this news release.
In addition, certain financial information in the presentation materials referenced in this release regarding the business of Signature Systems, which was acquired by the Company on February 8, 2024, including the historical and pro forma financial information, are subject to and may change based on the audited financial statements of Signature Systems and unaudited pro forma financial information to be provided by the Company pursuant to Item 9.01 of Current Report on Form 8-K.
About Myers Industries
Myers Industries, Inc. is a manufacturer of sustainable plastic and metal products for industrial, agricultural, automotive, commercial, and consumer markets. The Company is also the largest distributor of tools, equipment and supplies for the tire, wheel, and under-vehicle service industry in the United States. Visit www.myersindustries.com to learn more.
Caution on Forward-Looking Statements
Statements in this release and the presentation materials referenced in this release contain “forward-looking statements” within the meaning of the safe harbor provisions of the U.S. Private Securities Litigation Reform Act of 1995, including information regarding the Company’s financial outlook, future plans, objectives, business prospects and anticipated financial performance. Forward-looking statements can be identified by words such as “will,” “believe,” “anticipate,” “expect,” “estimate,” “intend,” “plan,” or variations of these words, or similar expressions. These forward-looking statements are neither historical facts nor assurances of future performance. Instead, they are based only on the Company’s current beliefs, expectations and assumptions regarding the future of our business, future plans and strategies, projections, anticipated events and trends, the economy and other future conditions. Because forward-looking statements relate to the future, these statements inherently involve a wide range of inherent uncertainties, risks and changes in circumstances that are difficult to predict and many of which are outside of our control. The Company’s actual actions, results, and financial condition may differ materially from what is expressed or implied by the forward-looking statements.
Specific factors that could cause such a difference on our business, financial position, results of operations and/or liquidity include, without limitation, raw material availability, increases in raw material costs, or other production costs; risks associated with our strategic growth initiatives or the failure to achieve the anticipated benefits of such initiatives; unanticipated downturn in business relationships with customers or their purchases; competitive pressures on sales and pricing; changes in the markets for the Company’s business segments; changes in trends and demands in the markets in which the Company competes; operational problems at our manufacturing facilities or unexpected failures at those facilities; future economic and financial conditions in the United States and around the world; inability of the Company to meet future capital requirements; claims, litigation and regulatory actions against the Company; changes in laws and regulations affecting the Company; impacts from the novel coronavirus (“COVID-19”) pandemic; and other risks and uncertainties detailed from time to time in the Company’s filings with the SEC, including without limitation, the risk factors disclosed in Item 1A, “Risk Factors,” in the Company’s Annual Report on Form 10-K for the year ended December 31, 2023. Given these factors, as well as other variables that may affect our operating results, readers should not rely on forward-looking statements, assume that past financial performance will be a reliable indicator of future performance, nor use historical trends to anticipate results or trends in future periods. Readers are cautioned not to place undue reliance on these forward-looking statements, which speak only as of the date thereof. The Company expressly disclaims any obligation or intention to provide updates to the forward-looking statements and the estimates and assumptions associated with them.
Contact: Meghan Beringer, Senior Director Investor Relations, 252-536-5651
M-INV
Source: Myers Industries, Inc.
2024 Investor Day Myers is on the Move March 19, 2024
Opening Remarks Meghan Beringer, Senior Director of Investor Relations 2
Statements in this presentation contain “forward-looking statements” within the meaning of the safe harbor provisions of the U.S. Private Securities Litigation Reform Act of 1995, including information regarding the Company’s financial outlook, future plans, objectives, business prospects and anticipated financial performance. Forward-looking statements can be identified by words such as “will,” “believe,” “anticipate,” “expect,” “estimate,” “intend,” “plan,” or variations of these words, or similar expressions. These forward-looking statements are neither historical facts nor assurances of future performance. Instead, they are based only on the Company’s current beliefs, expectations and assumptions regarding the future of our business, future plans and strategies, projections, anticipated events and trends, the economy and other future conditions. Because forward-looking statements relate to the future, these statements inherently involve a wide range of inherent uncertainties, risks and changes in circumstances that are difficult to predict and many of which are outside of our control. The Company’s actual actions, results, and financial condition may differ materially from what is expressed or implied by the forward-looking statements. Specific factors that could cause such a difference on our business, financial position, results of operations and/or liquidity include, without limitation, raw material availability, increases in raw material costs, or other production costs; risks associated with our strategic growth initiatives or the failure to achieve the anticipated benefits of such initiatives; unanticipated downturn in business relationships with customers or their purchases; competitive pressures on sales and pricing; changes in the markets for the Company’s business segments; changes in trends and demands in the markets in which the Company competes; operational problems at our manufacturing facilities or unexpected failures at those facilities; future economic and financial conditions in the United States and around the world; inability of the Company to meet future capital requirements; claims, litigation and regulatory actions against the Company; changes in laws and regulations affecting the Company; impacts from the novel coronavirus (“COVID-19”) pandemic; and other risks and uncertainties detailed from time to time in the Company’s filings with the SEC, including without limitation, the risk factors disclosed in Item 1A, “Risk Factors,” in the Company’s Annual Report on Form 10-K for the year ended December 31, 2023. Given these factors, as well as other variables that may affect our operating results, readers should not rely on forward-looking statements, assume that past financial performance will be a reliable indicator of future performance, nor use historical trends to anticipate results or trends in future periods. Readers are cautioned not to place undue reliance on these forward-looking statements, which speak only as of the date thereof. The Company expressly disclaims any obligation or intention to provide updates to the forward-looking statements and the estimates and assumptions associated with them. The Company uses certain non-GAAP measures in this presentation. Adjusted operating income (loss), adjusted operating income margin, adjusted earnings before interest, taxes, depreciation and amortization (EBITDA), adjusted EBITDA margin, adjusted net income, adjusted earnings per diluted share (adjusted EPS), and free cash flow are non-GAAP financial measures and are intended to serve as a supplement to results provided in accordance with accounting principles generally accepted in the United States. Myers Industries believes that such information provides an additional measurement and consistent historical comparison of the Company’s performance. A reconciliation of the non-GAAP financial measures to the most directly comparable GAAP measures is available in this news release. In addition, certain financial information presented herein regarding the business and financial results of Signature Systems, which was acquired by Myers Industries on February 8, 2024, including historical and proforma financial information, are subject to and may change based on the audited historical financial statements of Signature Systems and unaudited pro forma financial information to be provided by the Company pursuant to Item 9.01 of Current Report on Form 8-K. Safe Harbor Statement & Non-GAAP Measures 3
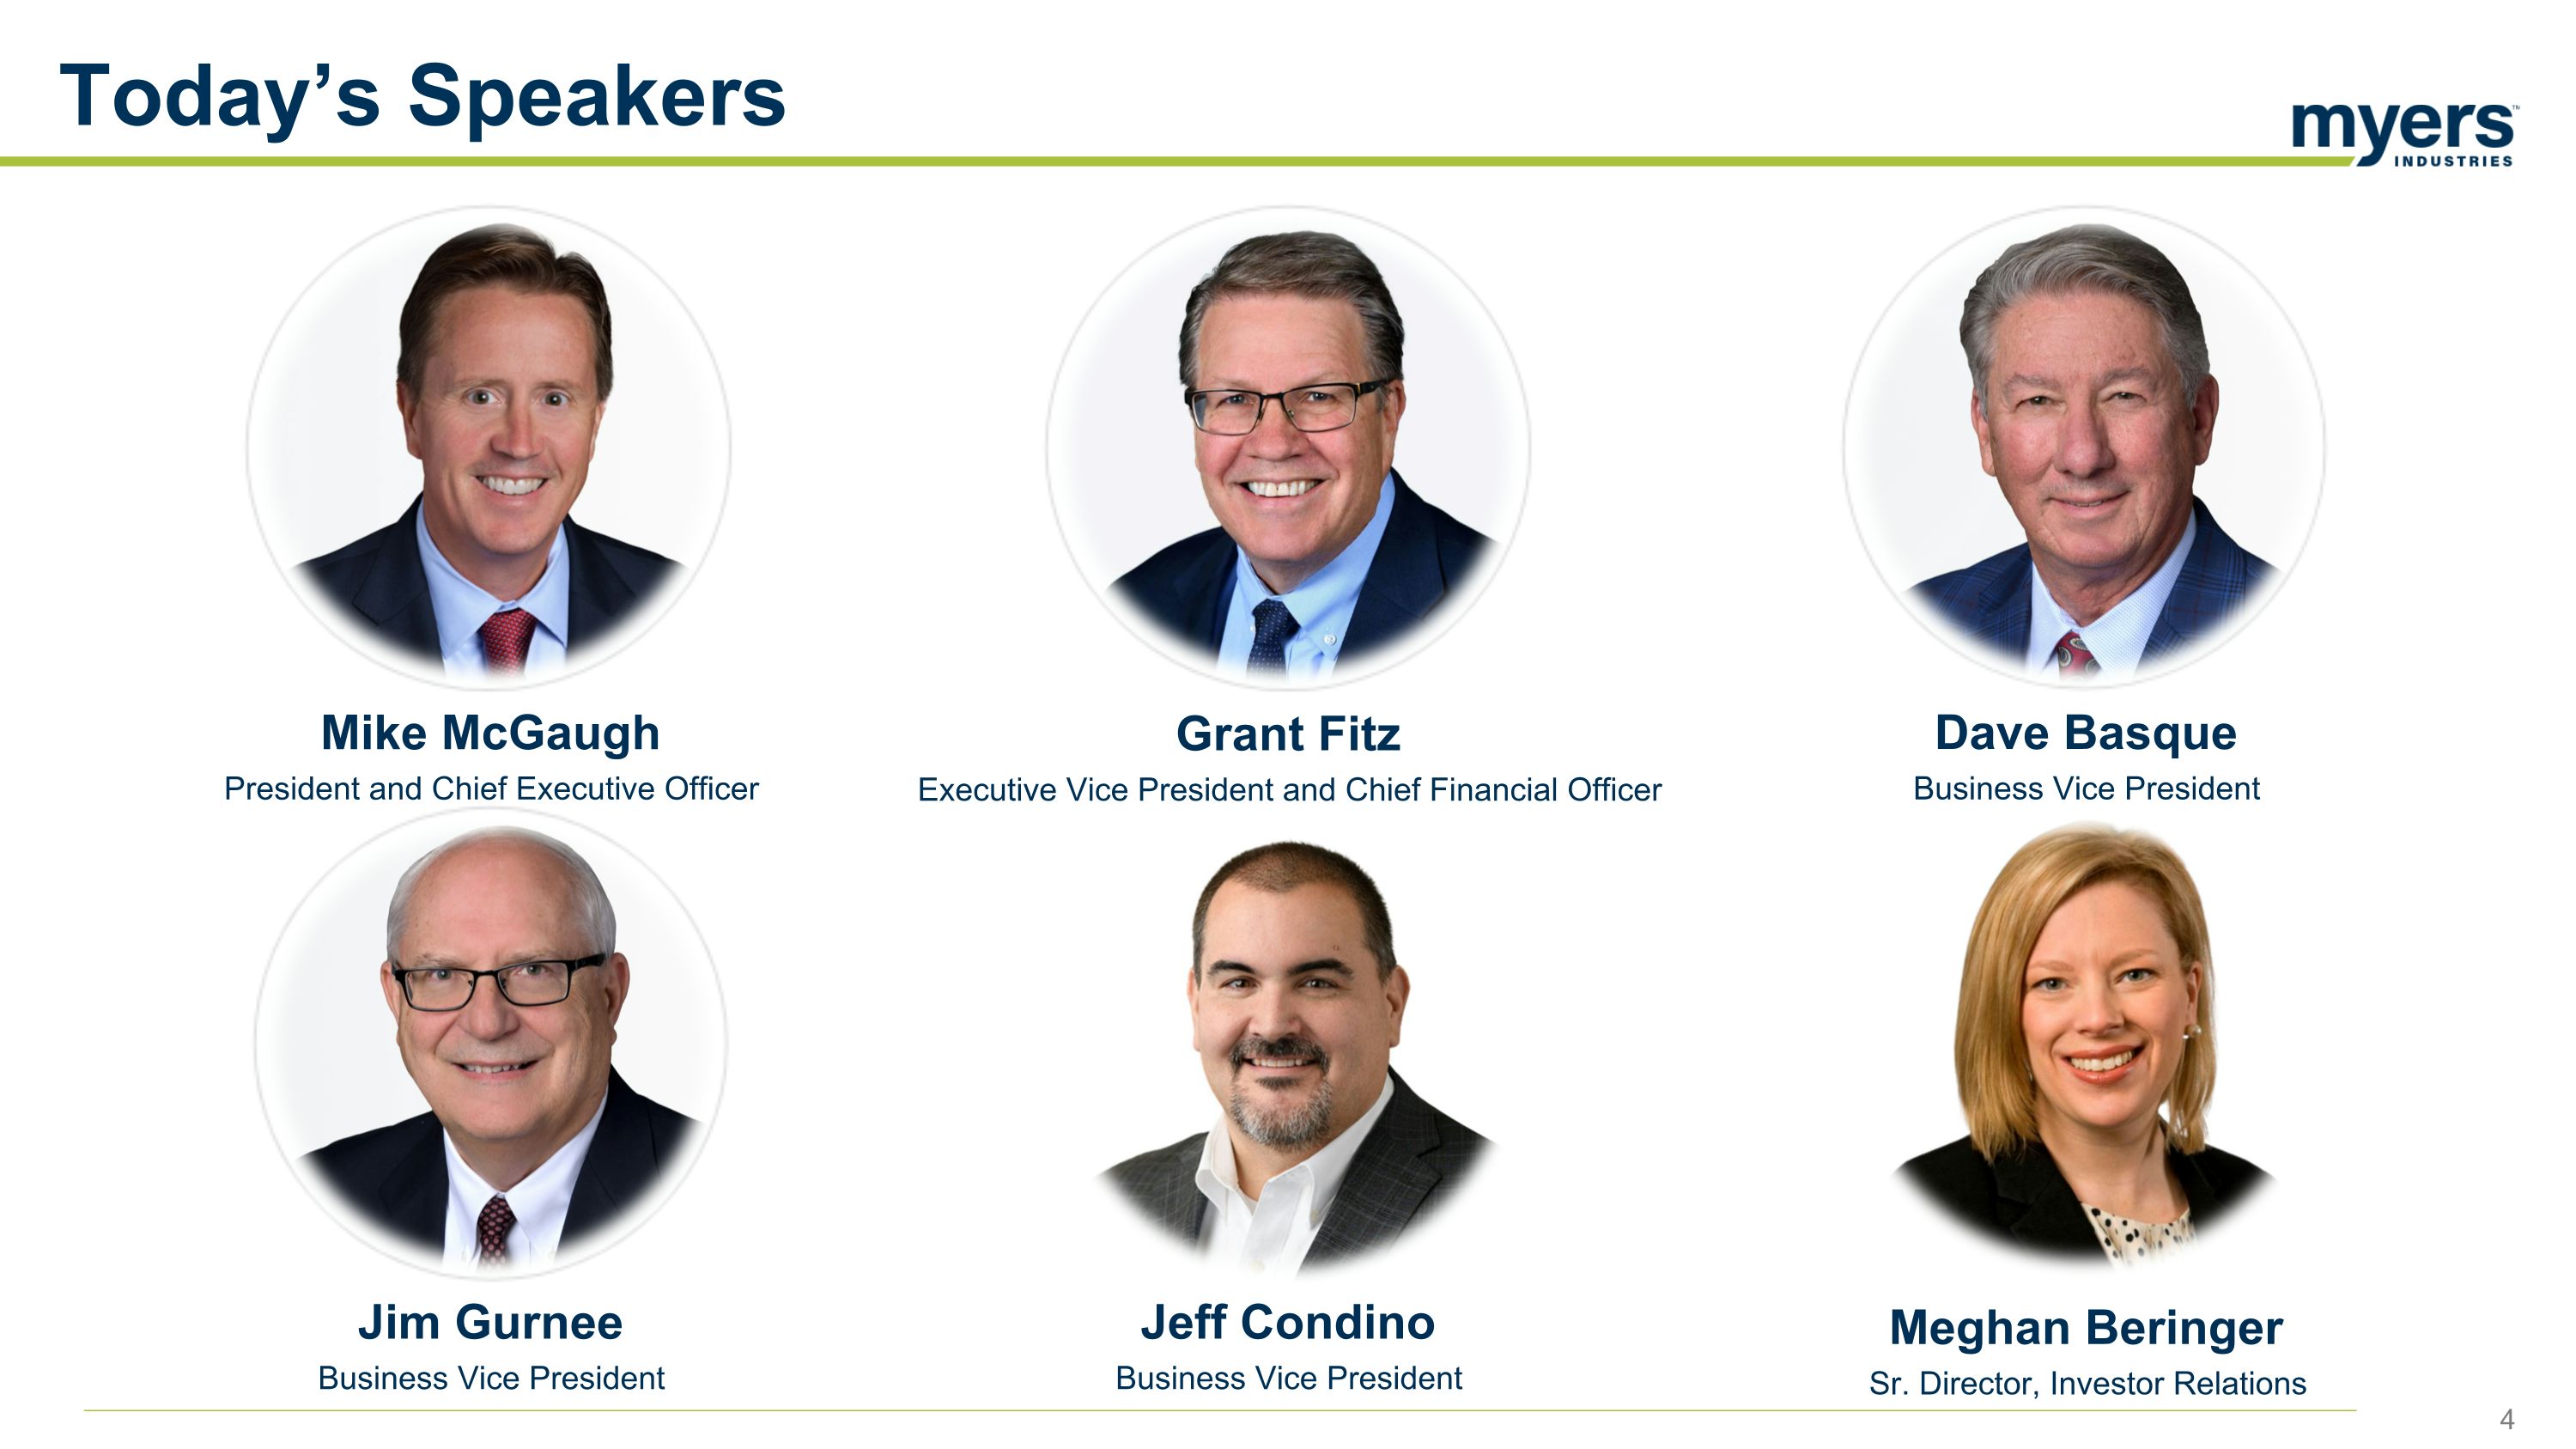
Today’s Speakers Mike McGaugh President and Chief Executive Officer Jim Gurnee Business Vice President Grant Fitz Executive Vice President and Chief Financial Officer Jeff Condino Business Vice President Dave Basque Business Vice President Meghan Beringer Sr. Director, Investor Relations
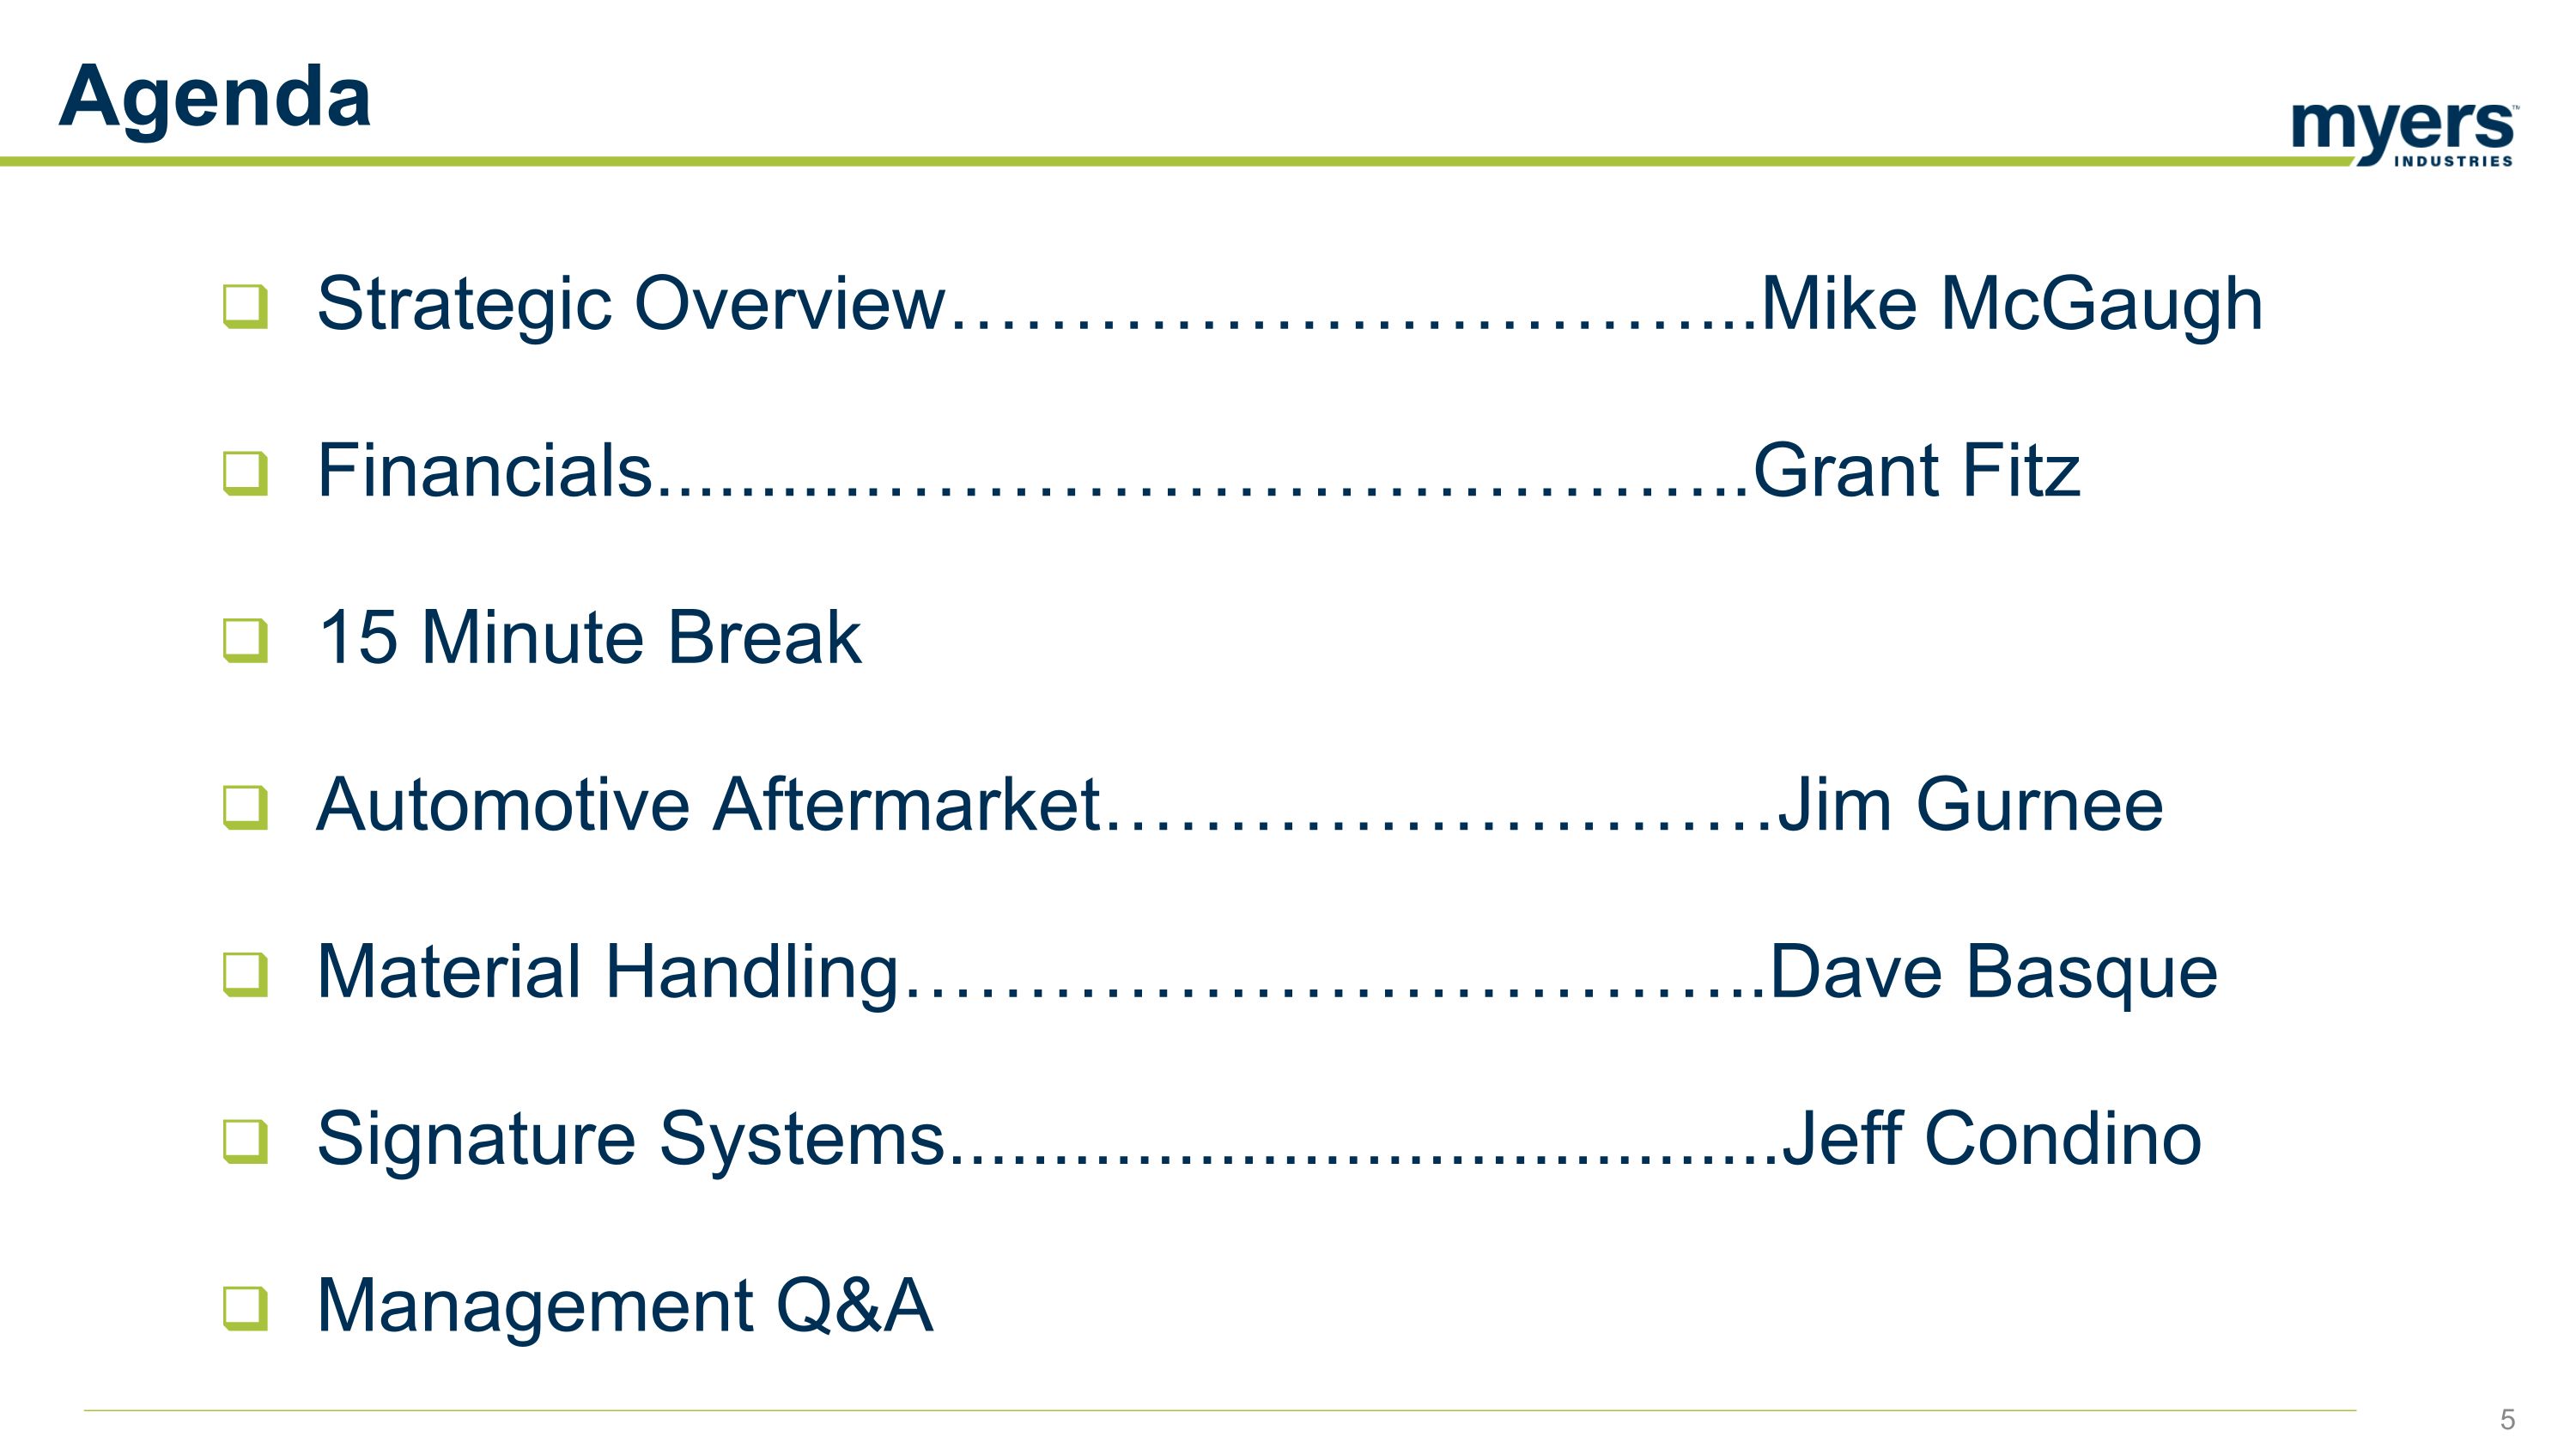
Strategic Overview…………………………...Mike McGaugh Financials...........……………………………..Grant Fitz 15 Minute Break Automotive Aftermarket………………………Jim Gurnee Material Handling……………………………..Dave Basque Signature Systems........................................Jeff Condino Management Q&A Agenda
Strategic Overview Mike McGaugh, President & Chief Executive Officer 6
Today’s Key Messages Consistent execution of Myers’ 3 Horizon Strategy Delivered Horizon One: Built our foundation Executing Horizon Two: A new Myers Repositioning the Company to unlock value
A Look Back at 2023 Some end markets hit cyclical trough or near trough conditions Operational and Commercial Excellence delivered value Myers Business System – making our ‘best practices’ permanent Signature Systems acquisition, a pivot point for Myers One of the strongest years in recent history: Revenue, EBITDA, EPS
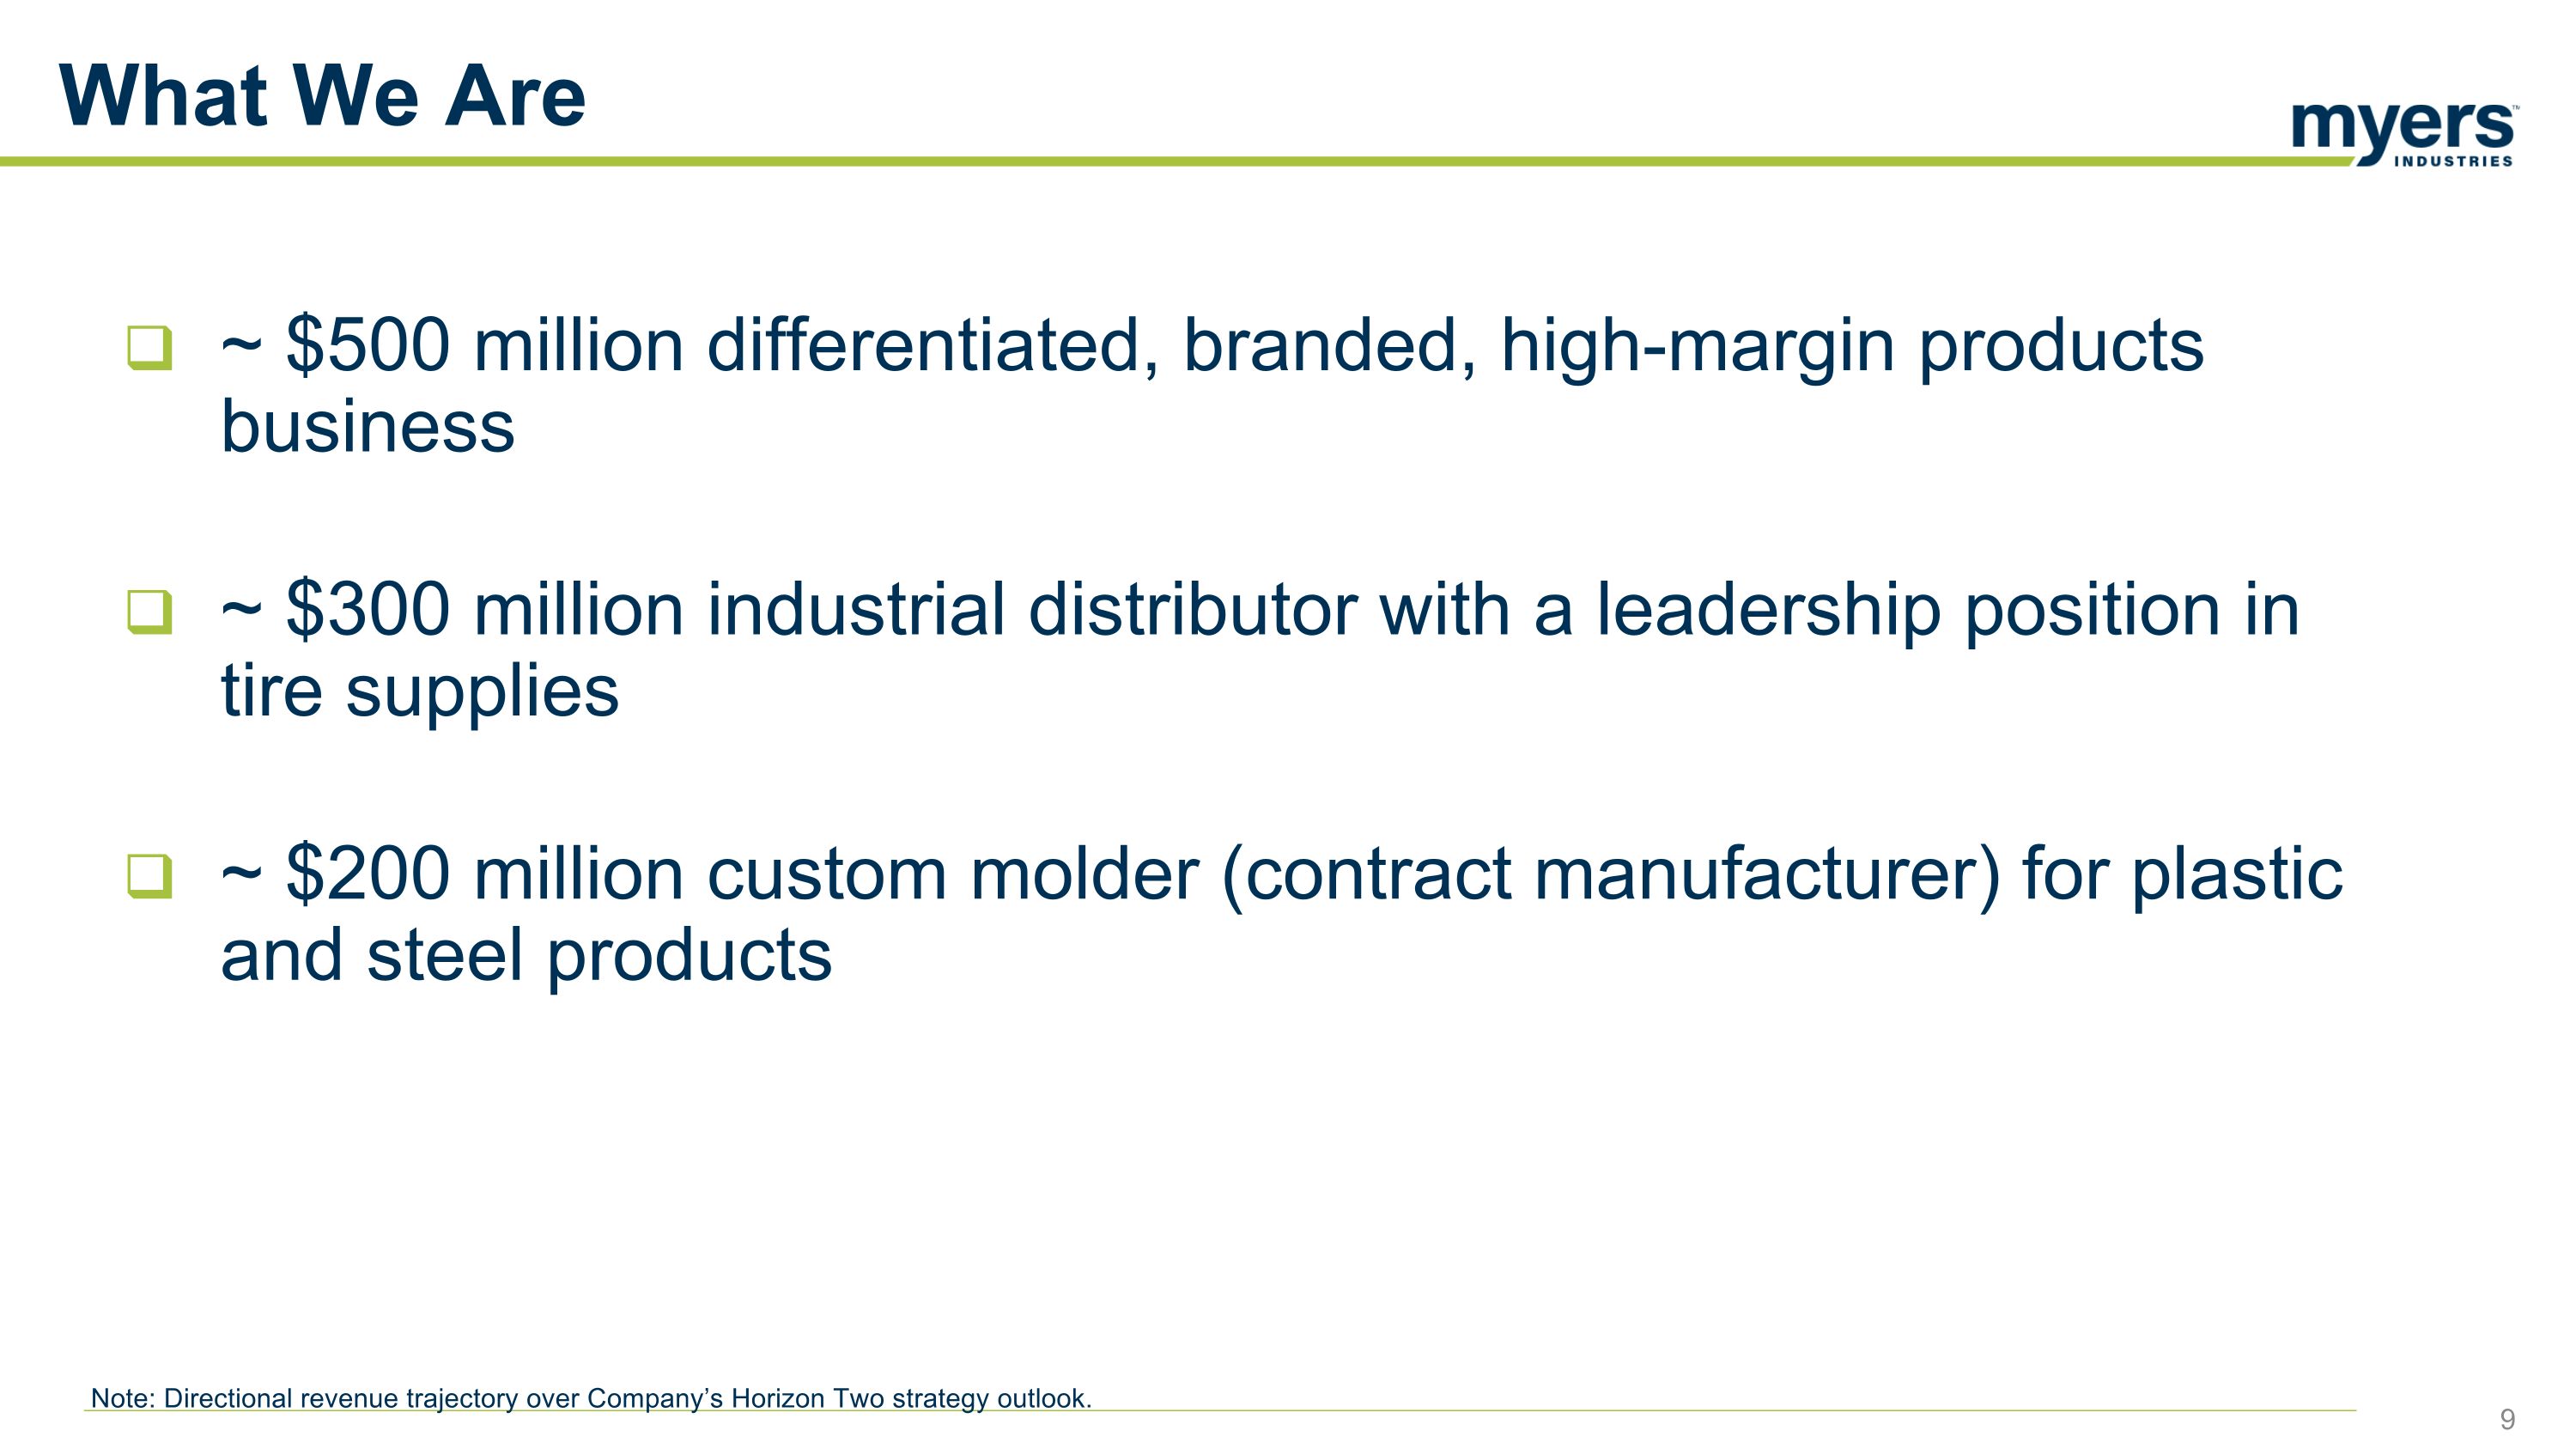
What We Are ~ $500 million differentiated, branded, high-margin products business ~ $300 million industrial distributor with a leadership position in tire supplies ~ $200 million custom molder (contract manufacturer) for plastic and steel products Note: Directional revenue trajectory over Company’s Horizon Two strategy outlook.
Who We Are #1 or #2 position in niche, profitable businesses Branded, differentiated products Large-cap talent at a small-cap company World Class operational and commercial capabilities Cyclical end markets, some currently at ‘trough’ or ‘near trough’ demand levels Addressing cyclicality through ‘Self Help’, M&A, and portfolio moves
Our Areas of Focus Grow branded products Leading brands: #1 or #2 position Reduce private label or contract manufacturing exposure Consistent innovator Acquisitive company
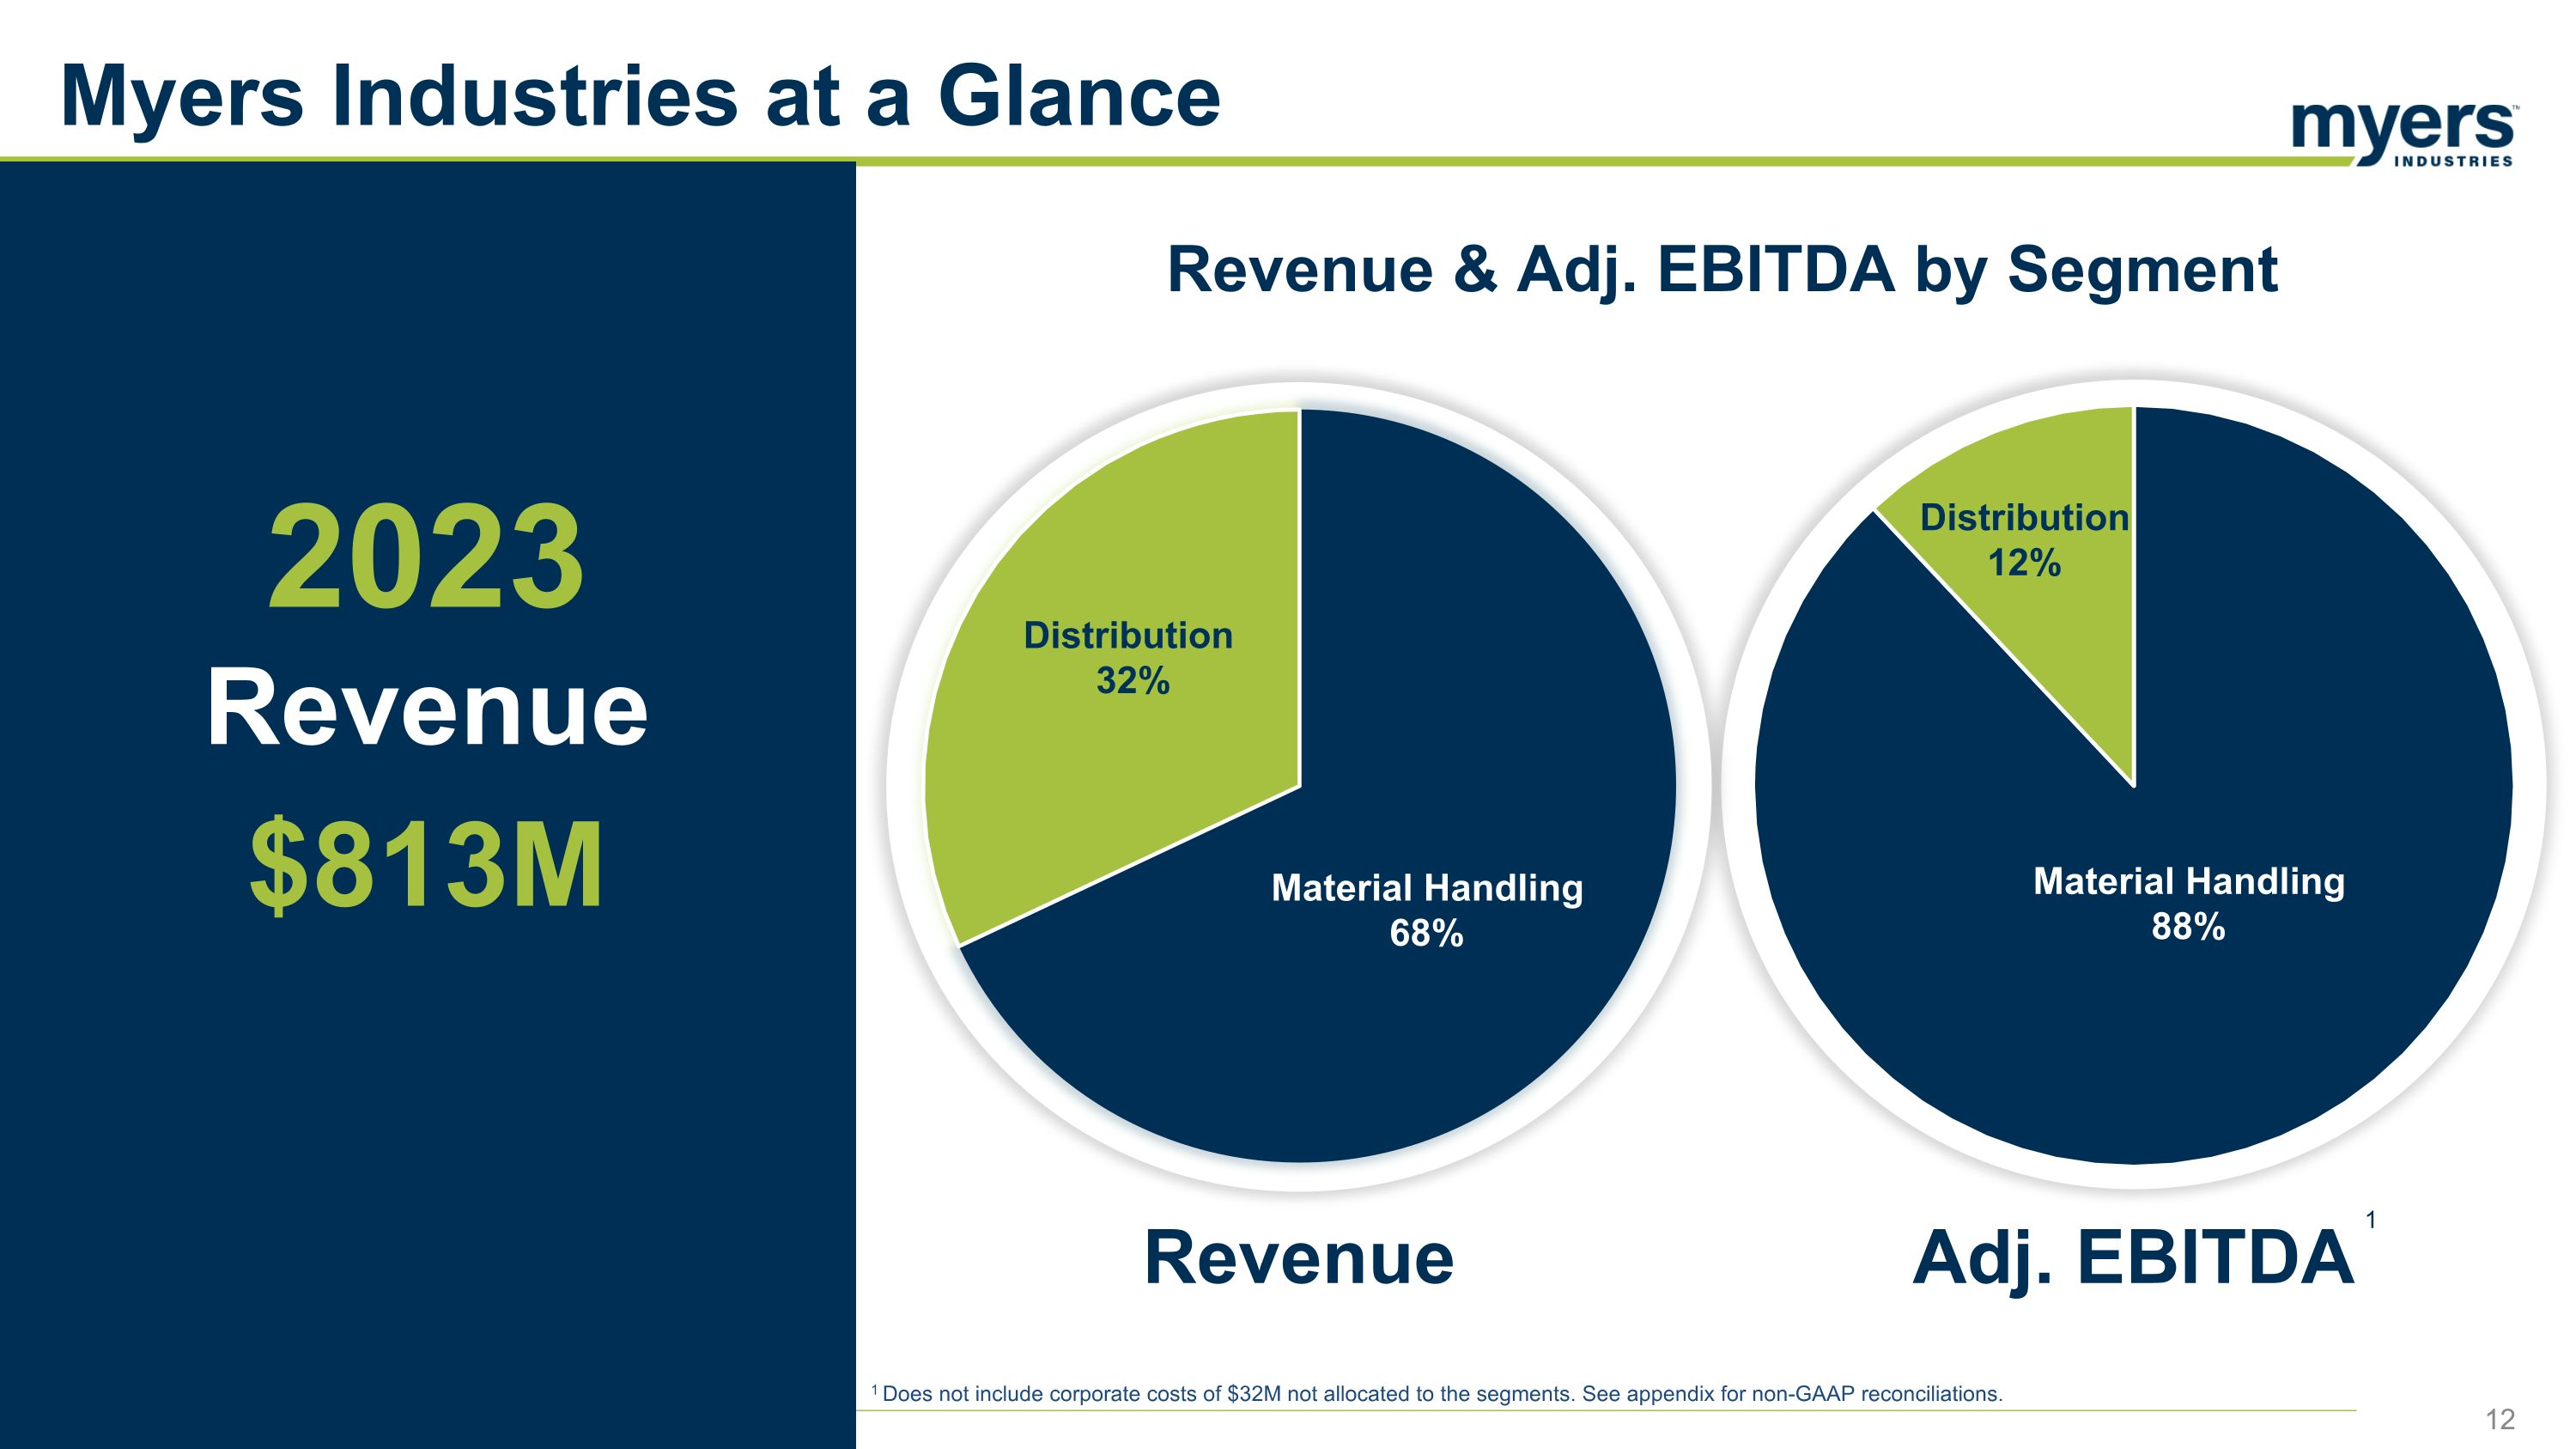
Myers Industries at a Glance $813M 2023 Revenue Revenue & Adj. EBITDA by Segment Revenue Adj. EBITDA 1 Does not include corporate costs of $32M not allocated to the segments. See appendix for non-GAAP reconciliations. 1
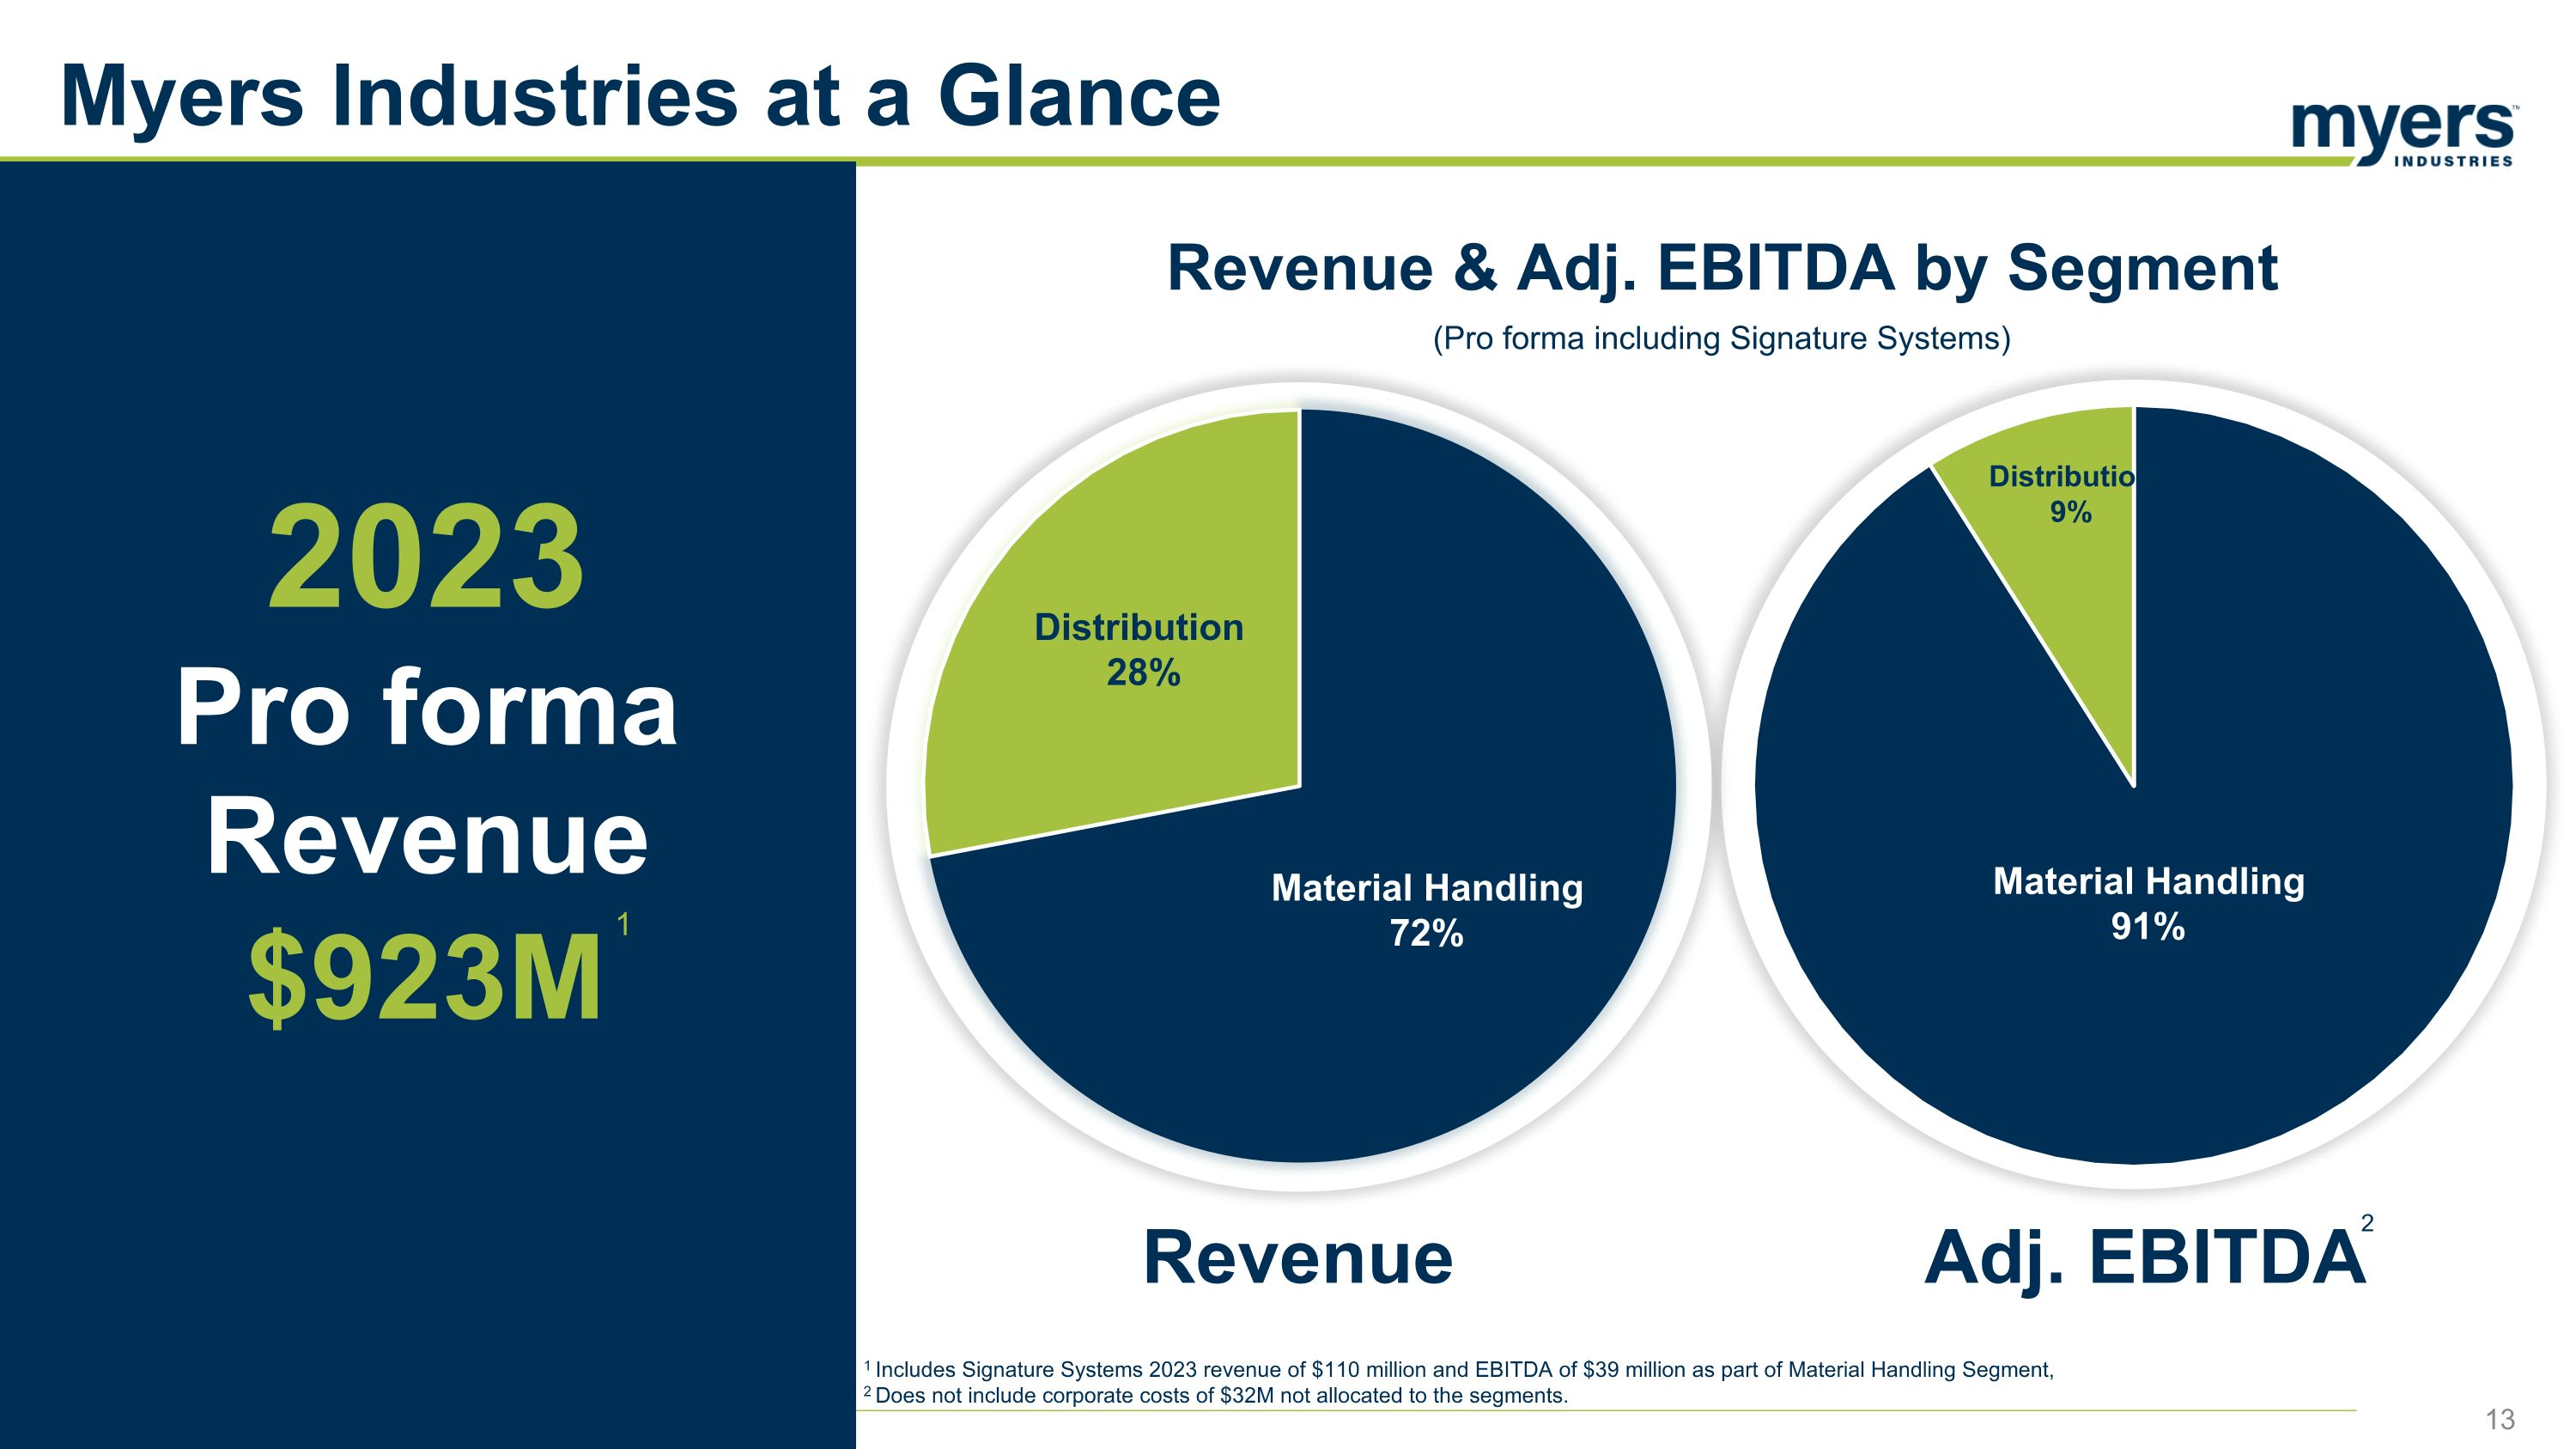
Revenue & Adj. EBITDA by Segment Myers Industries at a Glance $923M 2023 Pro forma Revenue Revenue Adj. EBITDA (Pro forma including Signature Systems) 1 Includes Signature Systems 2023 revenue of $110 million and EBITDA of $39 million as part of Material Handling Segment, 2 Does not include corporate costs of $32M not allocated to the segments. 1 2
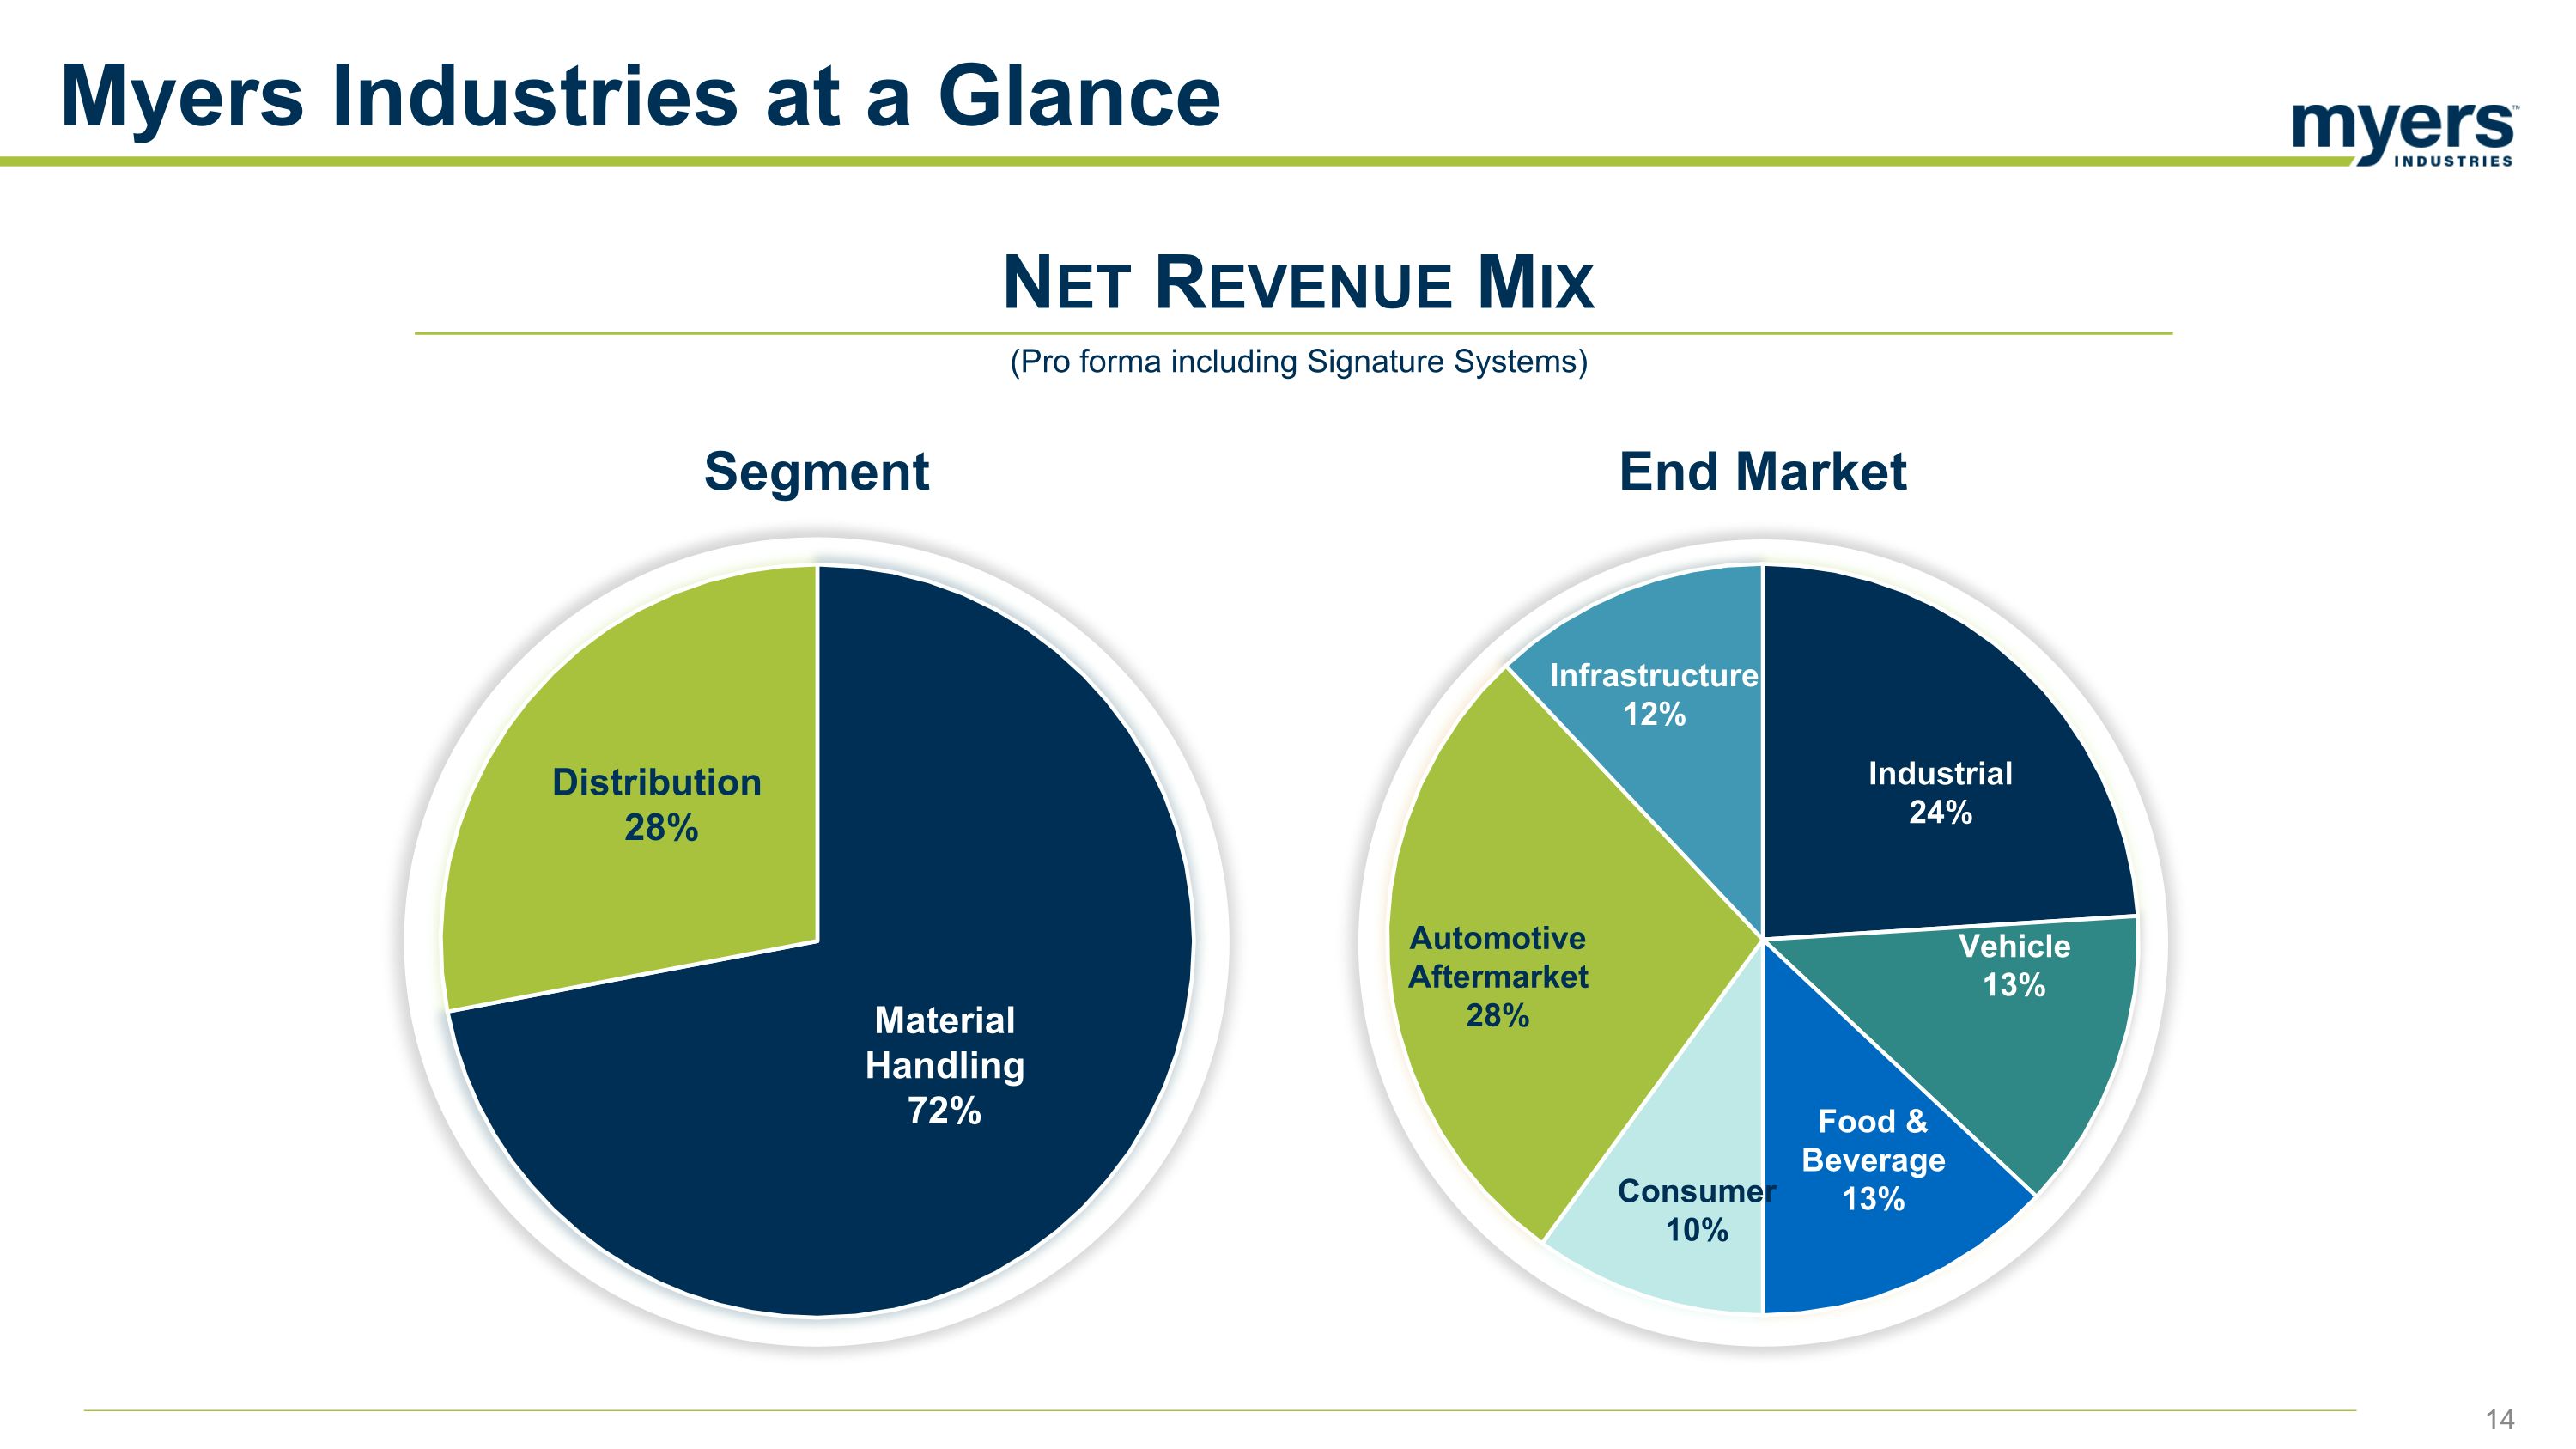
Net Revenue Mix End Market Segment Myers Industries at a Glance (Pro forma including Signature Systems)
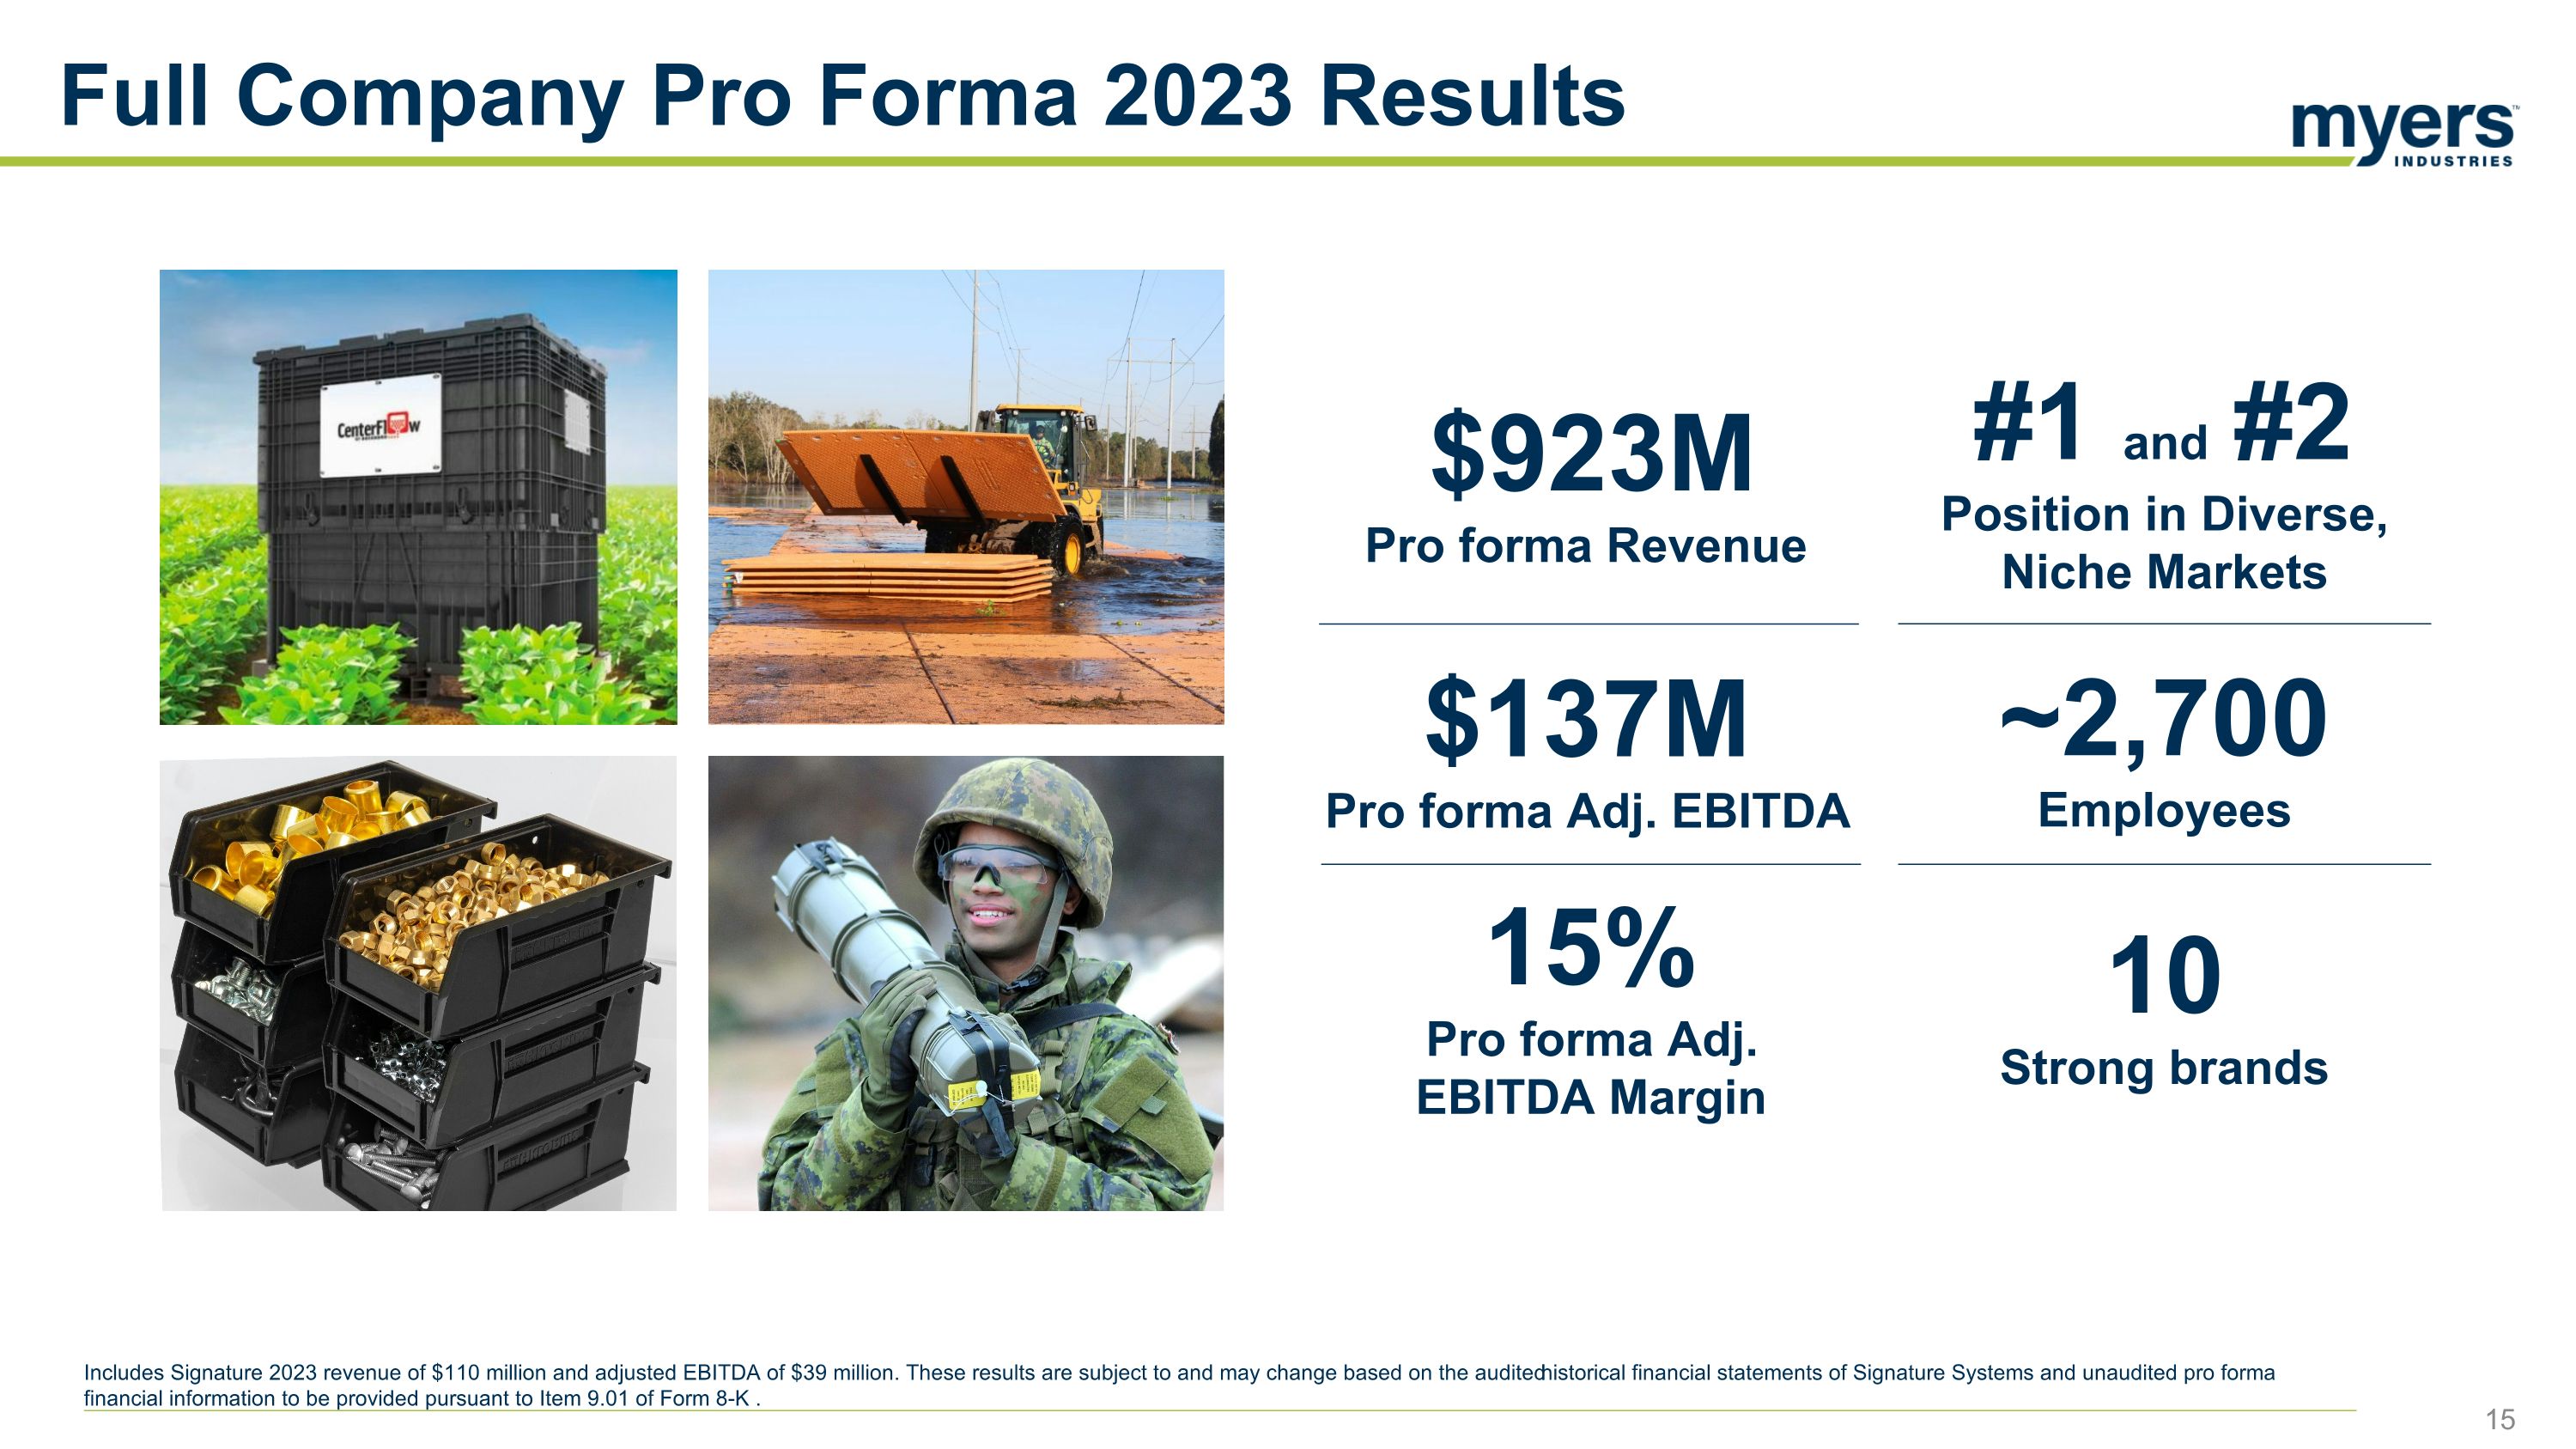
Full Company Pro Forma 2023 Results Includes Signature 2023 revenue of $110 million and adjusted EBITDA of $39 million. These results are subject to and may change based on the audited historical financial statements of Signature Systems and unaudited pro forma financial information to be provided pursuant to Item 9.01 of Form 8-K . 15%Pro forma Adj. EBITDA Margin $923M Pro forma Revenue $137M Pro forma Adj. EBITDA ~2,700 Employees #1 and #2 Position in Diverse, Niche Markets 10 Strong brands
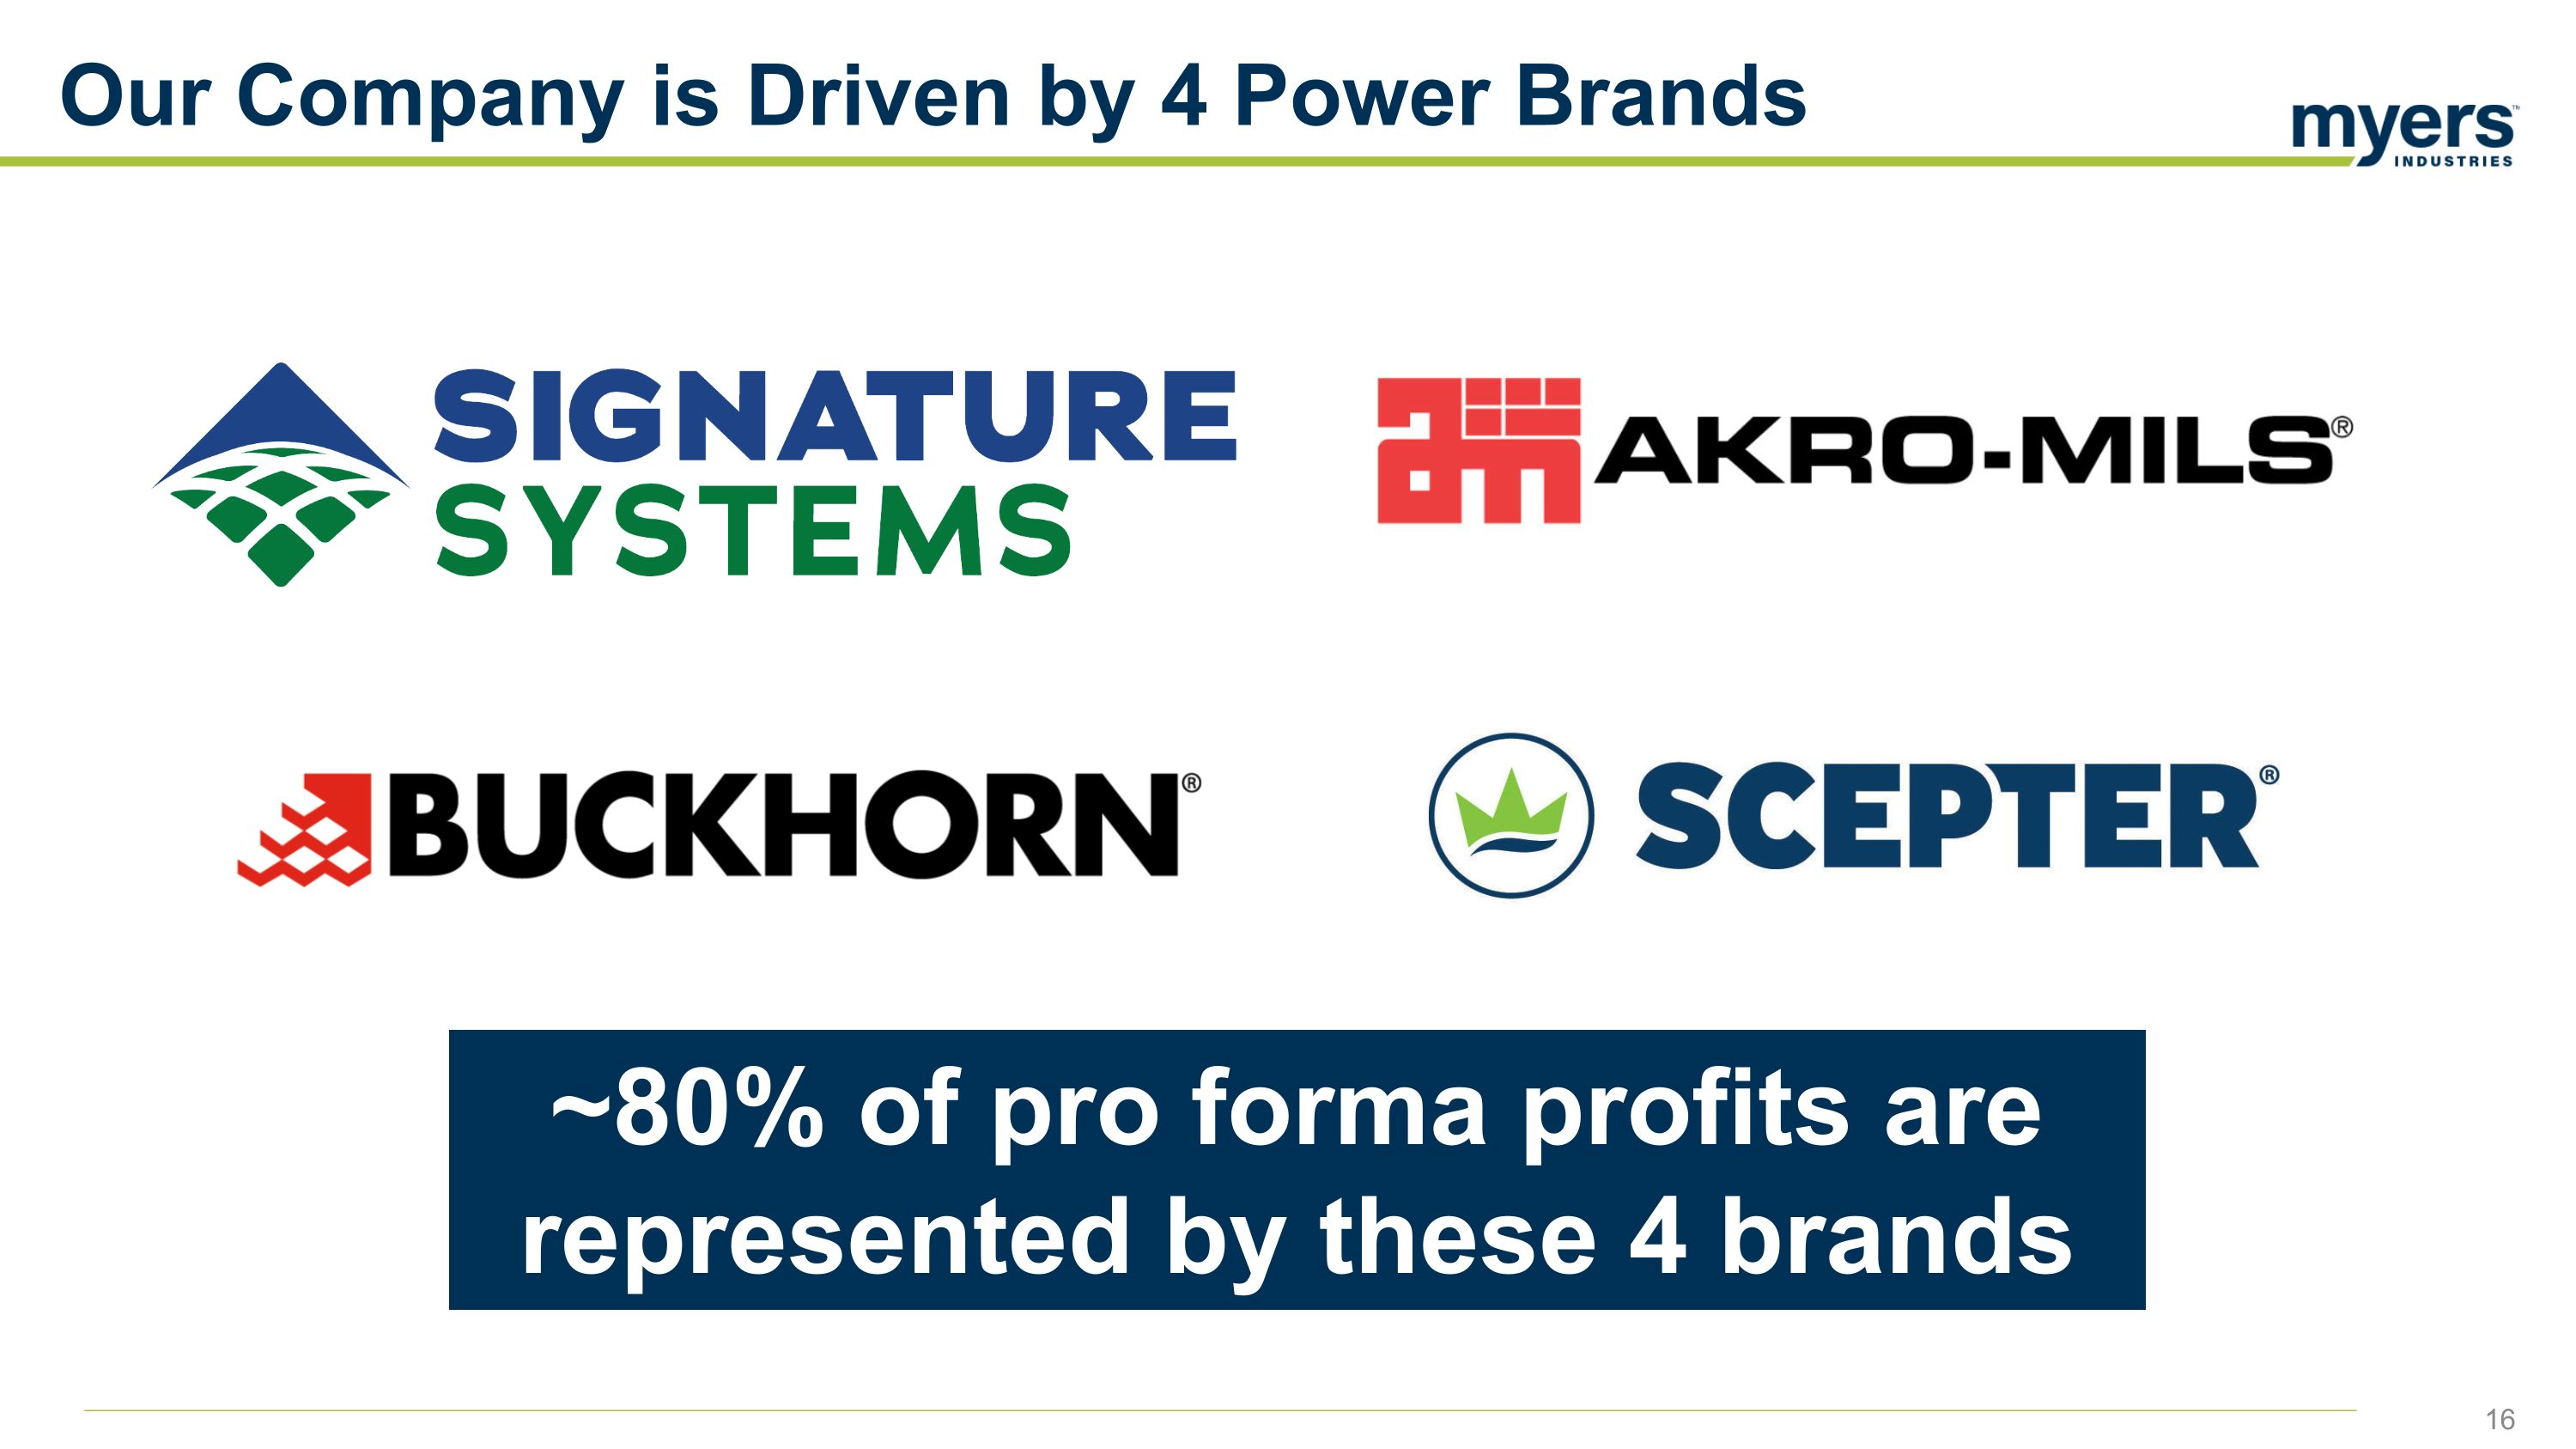
Our Company is Driven by 4 Power Brands ~80% of pro forma profits are represented by these 4 brands
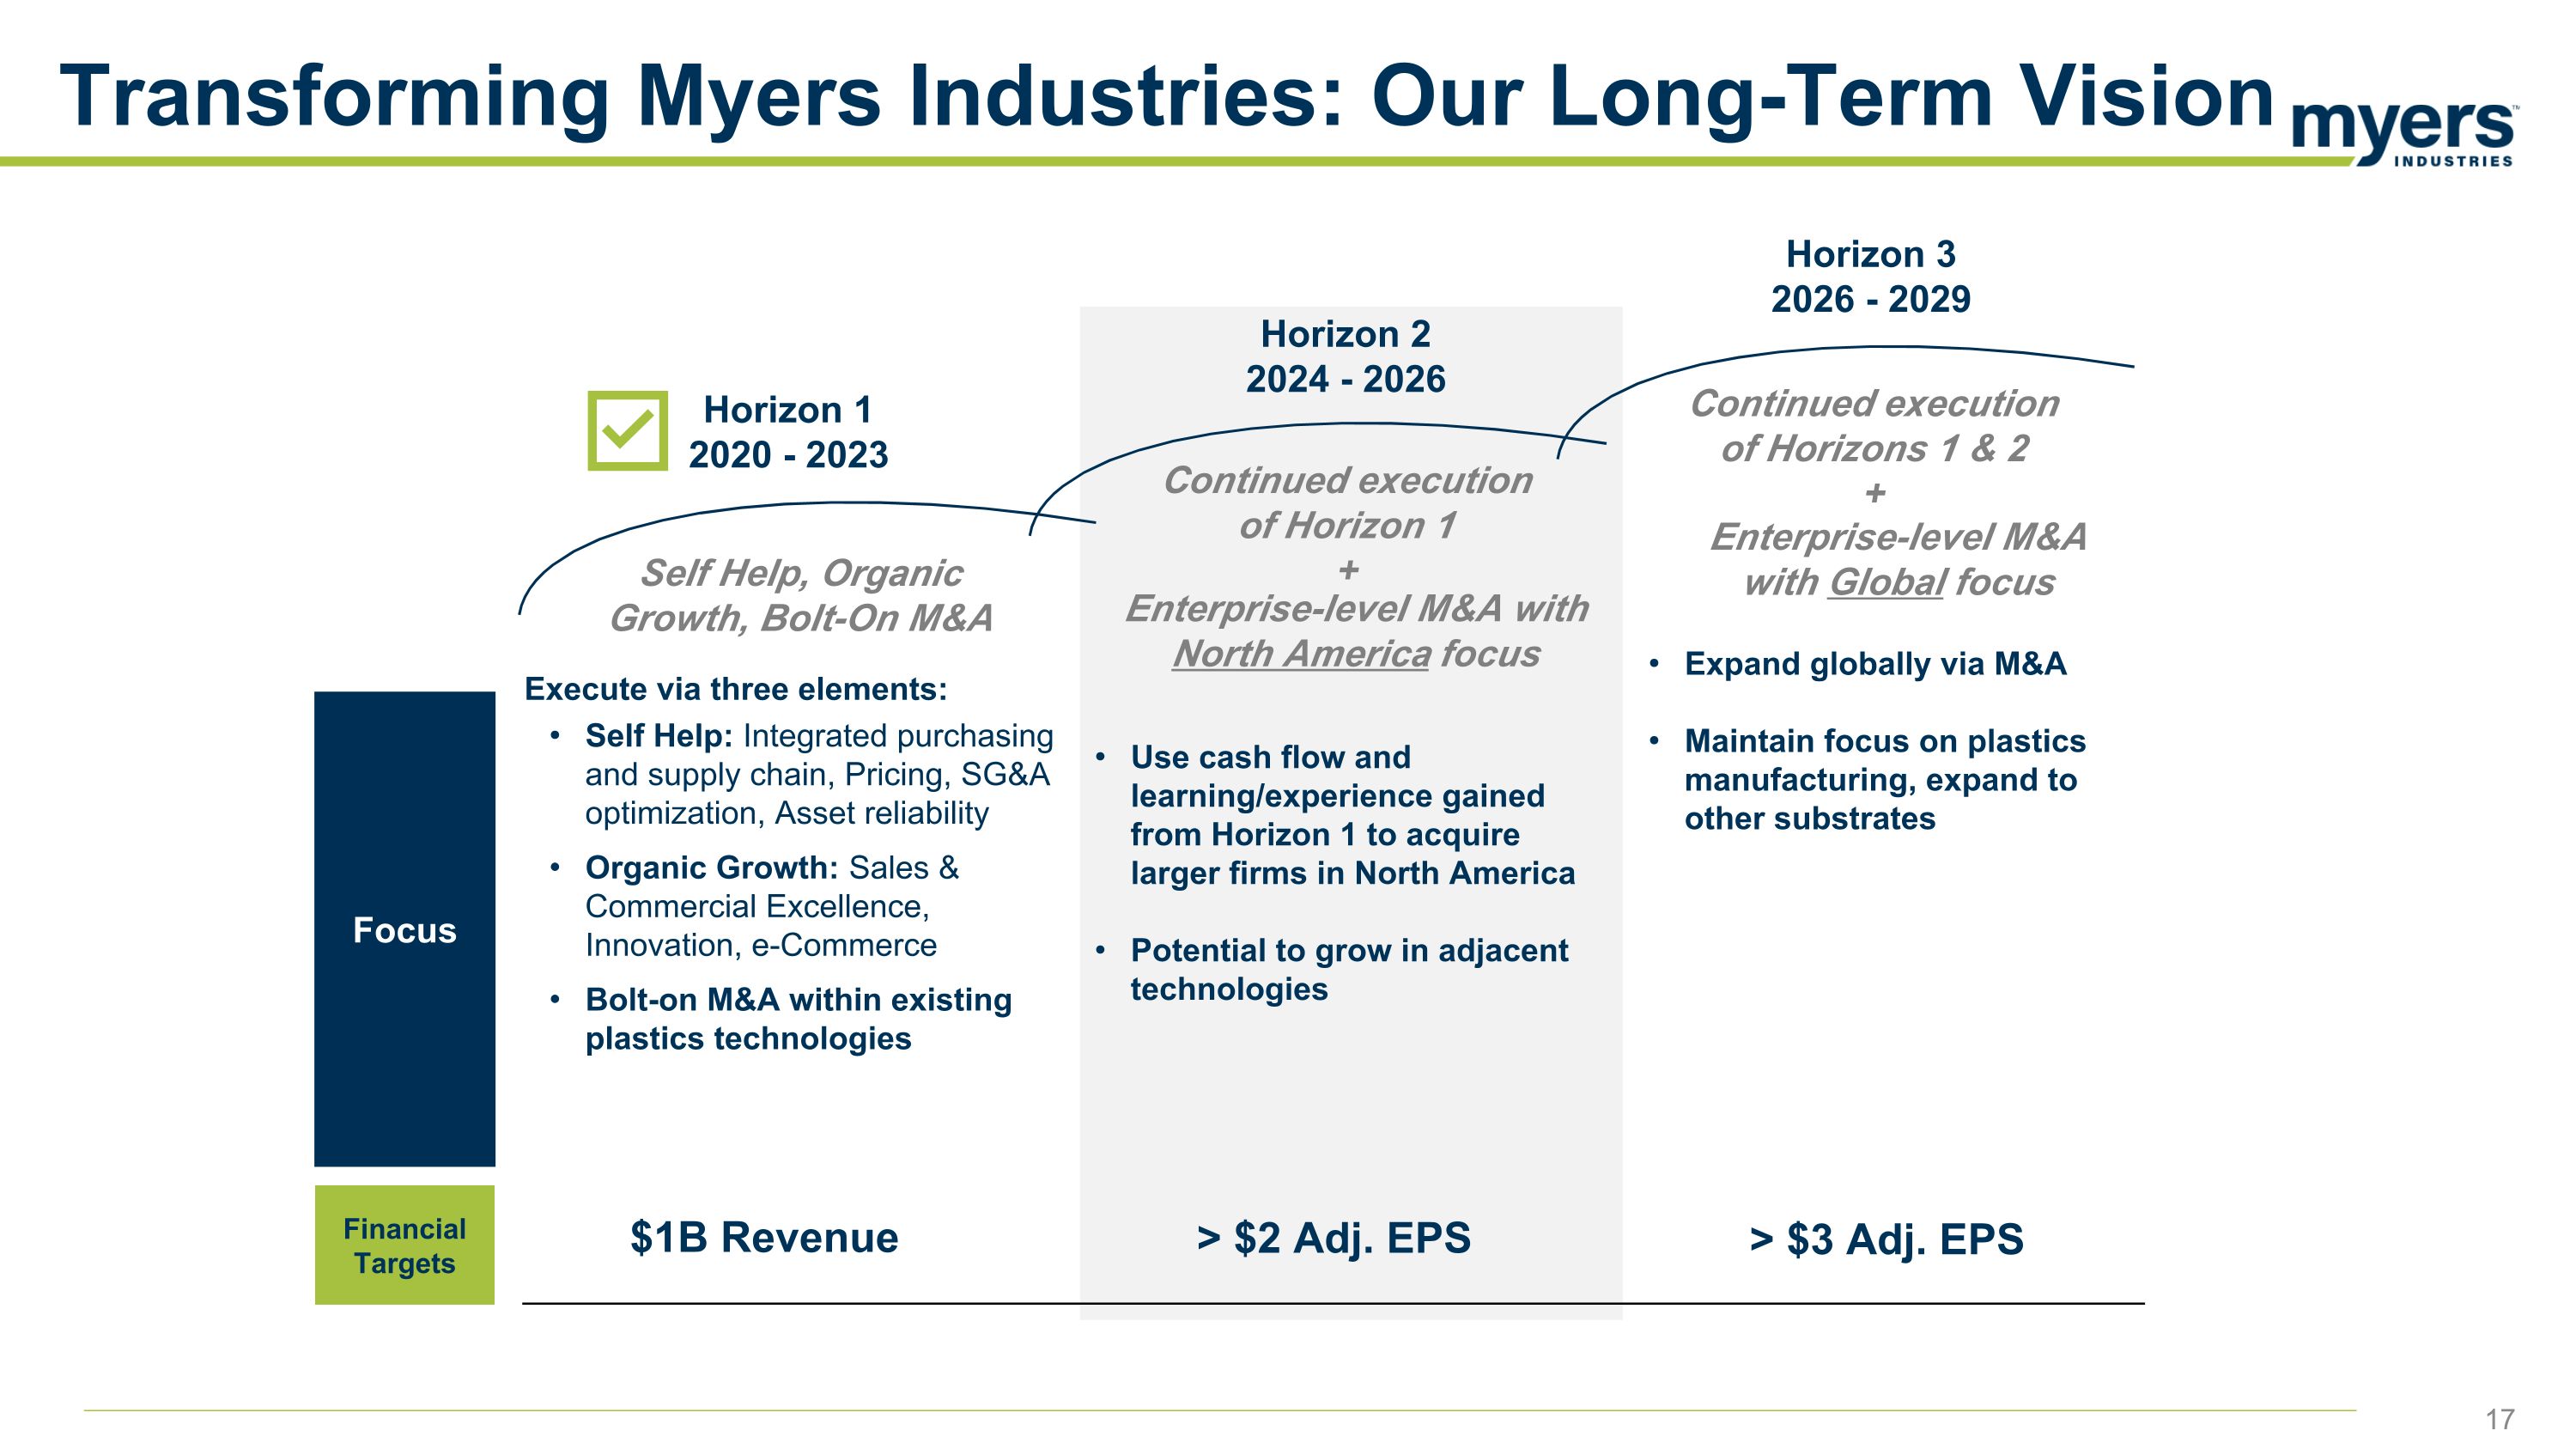
Horizon 1 2020 - 2023 Horizon 2 2024 - 2026 Horizon 3 2026 - 2029 Focus Financial Targets Execute via three elements: Self Help: Integrated purchasing and supply chain, Pricing, SG&A optimization, Asset reliability Organic Growth: Sales & Commercial Excellence, Innovation, e-Commerce Bolt-on M&A within existing plastics technologies $1B Revenue Use cash flow and learning/experience gained from Horizon 1 to acquire larger firms in North America Potential to grow in adjacent technologies Expand globally via M&A Maintain focus on plastics manufacturing, expand to other substrates Self Help, Organic Growth, Bolt-On M&A Enterprise-level M&A with North America focus Enterprise-level M&A with Global focus Continued execution of Horizon 1 + Continued execution of Horizons 1 & 2 + Transforming Myers Industries: Our Long-Term Vision > $2 Adj. EPS > $3 Adj. EPS
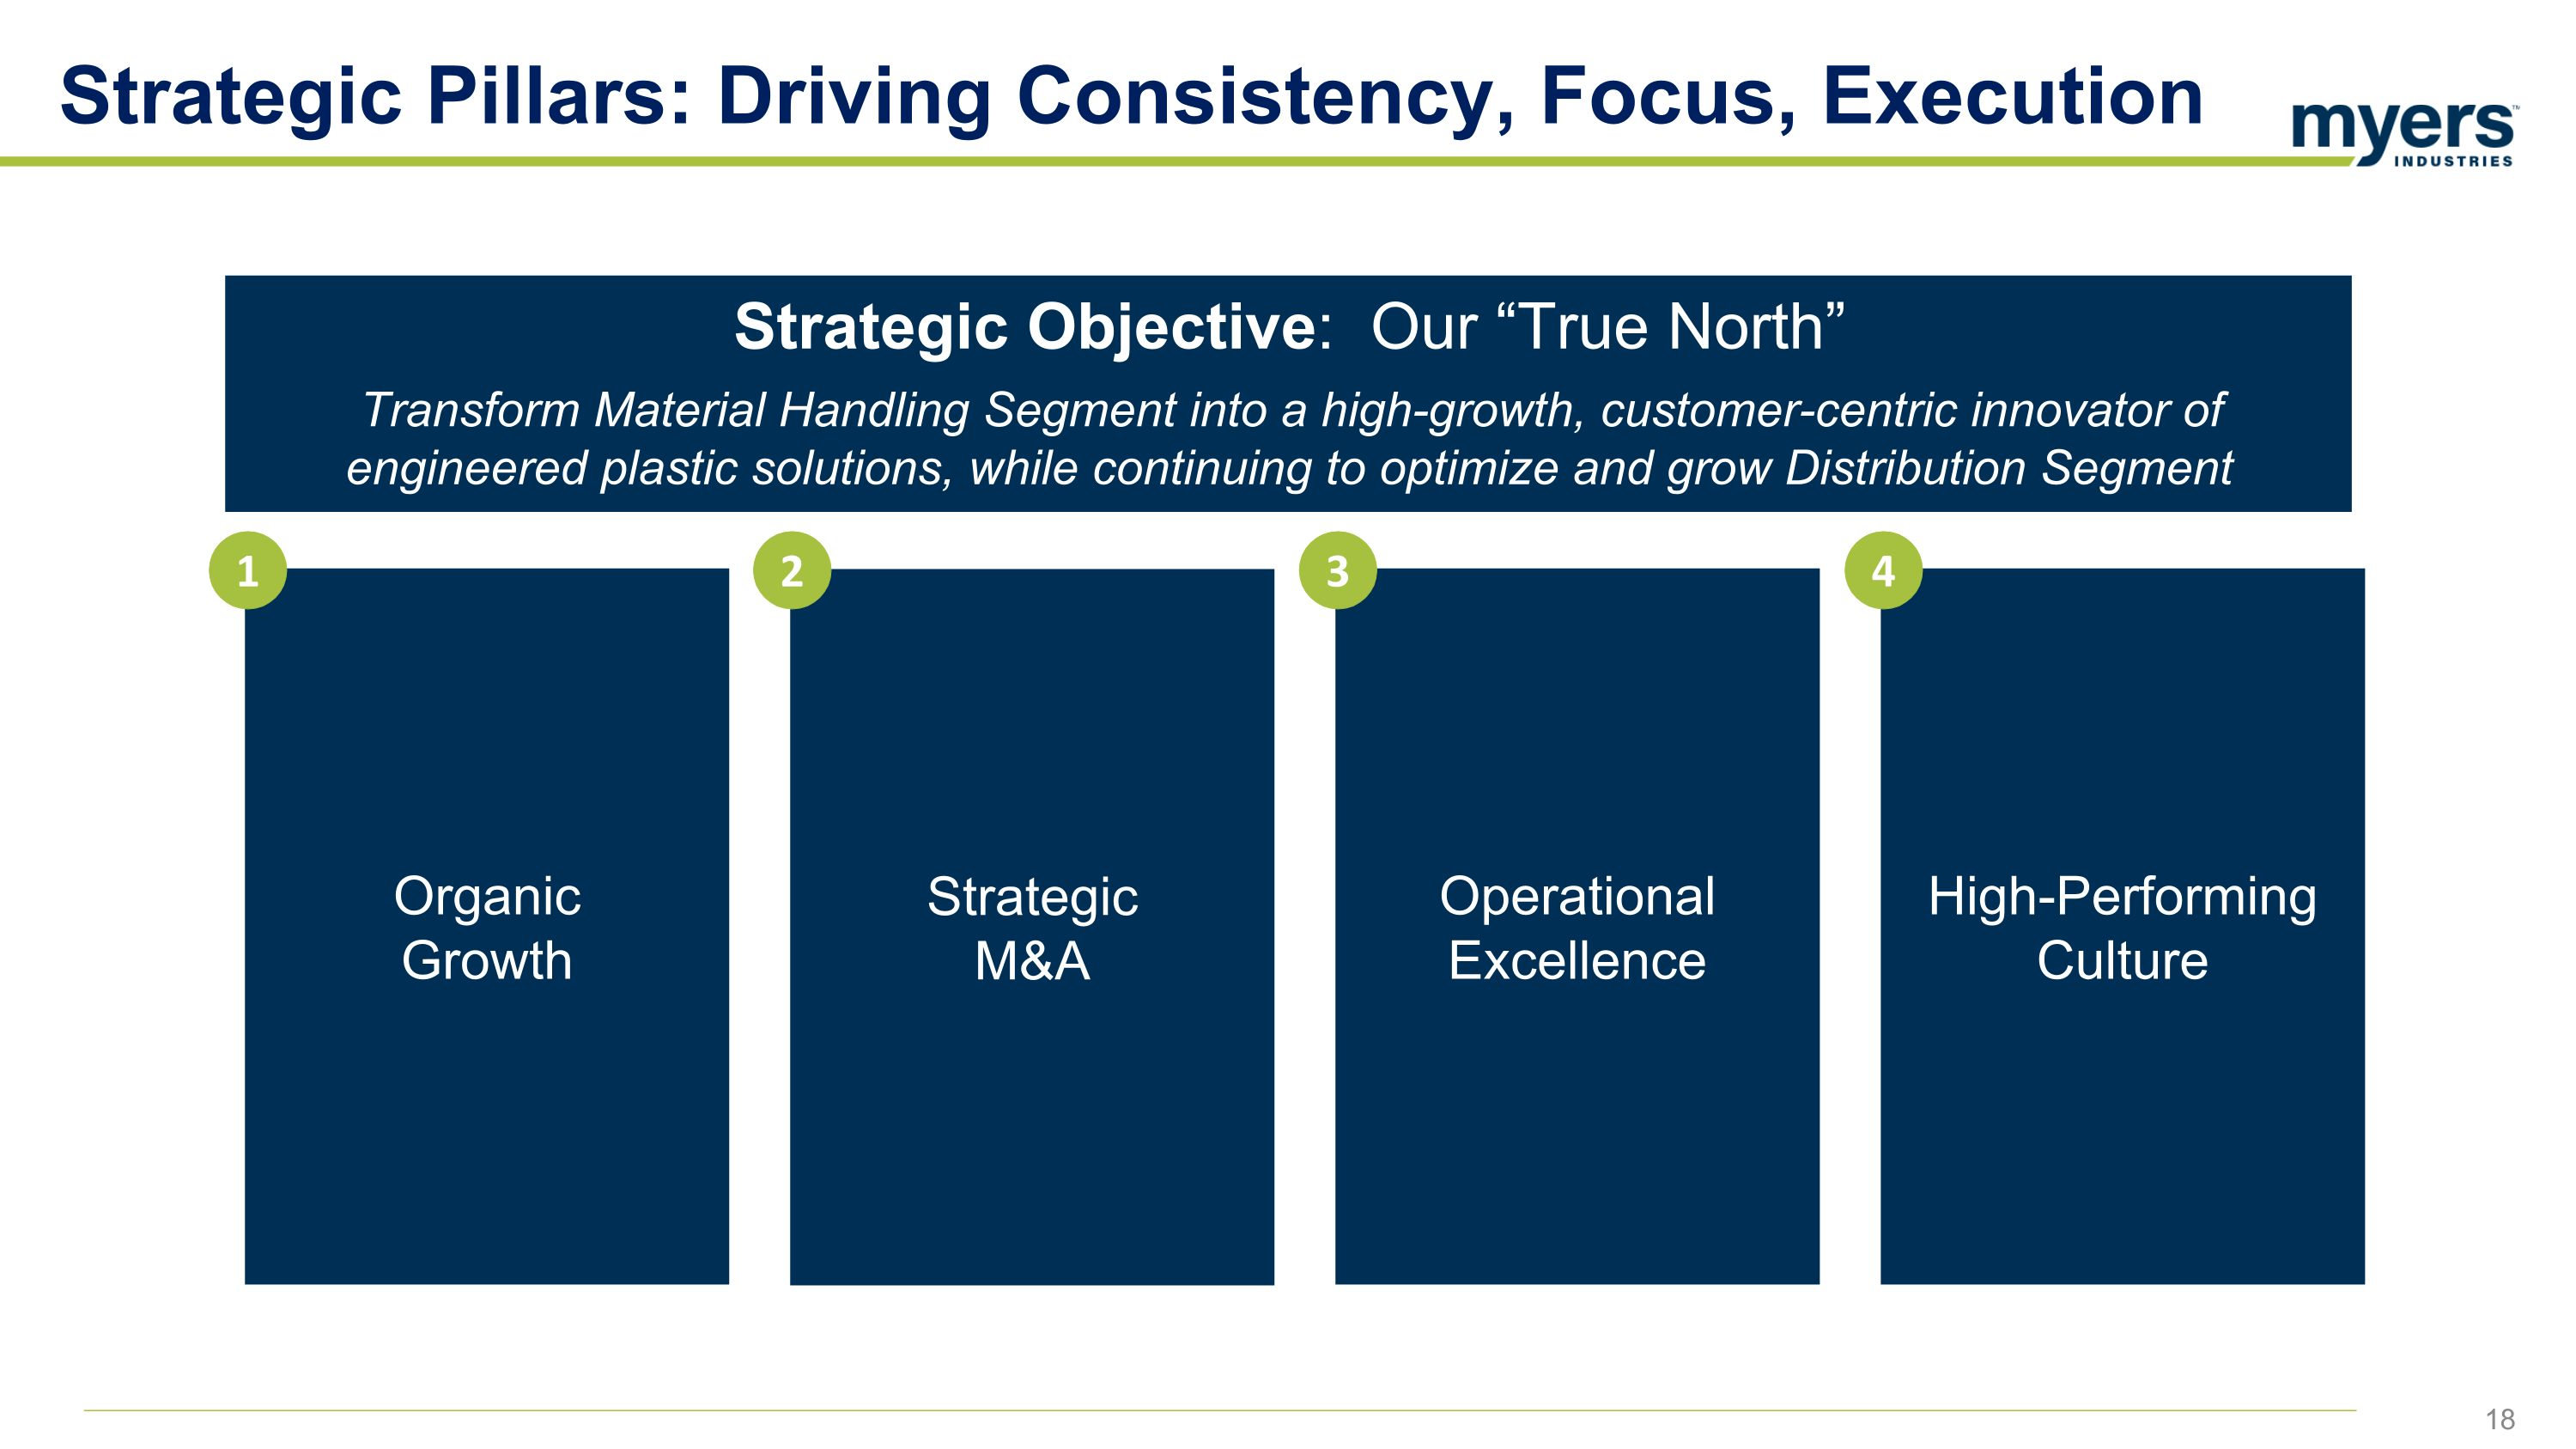
Organic Growth 1 High-Performing Culture 4 Strategic M&A 2 Operational Excellence 3 Strategic Objective: Our “True North” Transform Material Handling Segment into a high-growth, customer-centric innovator of engineered plastic solutions, while continuing to optimize and grow Distribution Segment Strategic Pillars: Driving Consistency, Focus, Execution
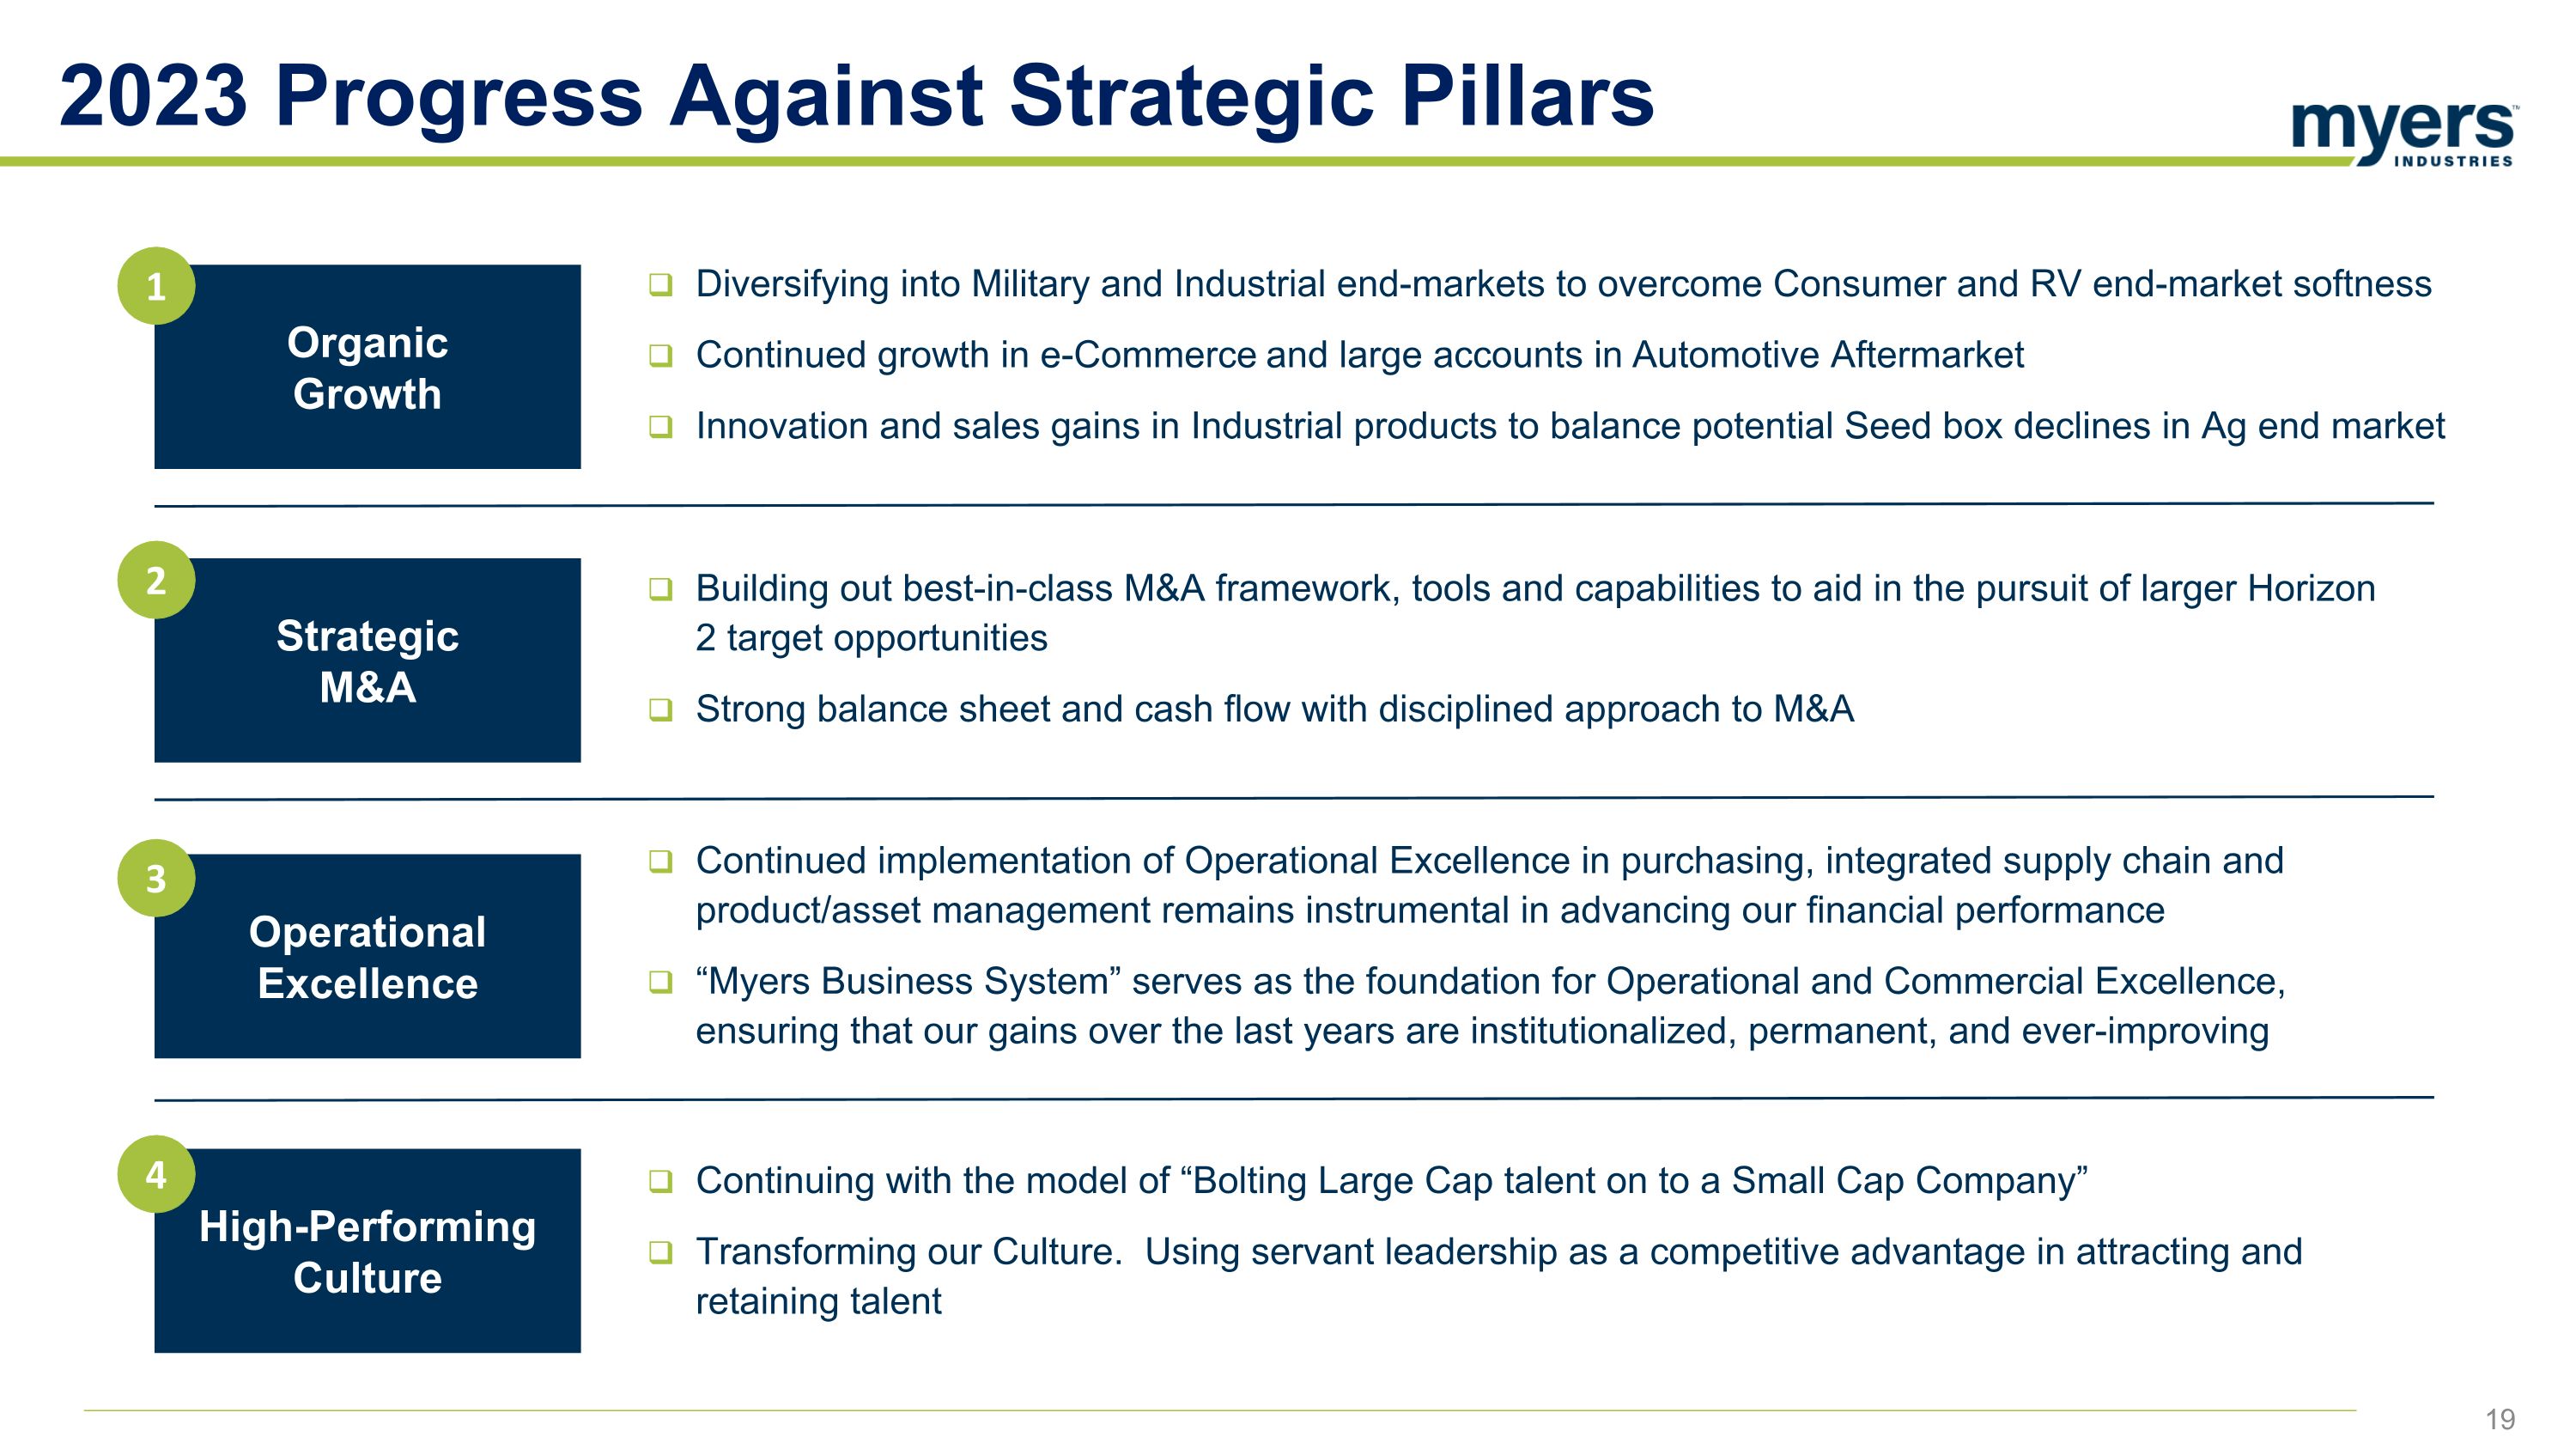
2023 Progress Against Strategic Pillars Building out best-in-class M&A framework, tools and capabilities to aid in the pursuit of larger Horizon 2 target opportunities Strong balance sheet and cash flow with disciplined approach to M&A Strategic M&A 2 Continuing with the model of “Bolting Large Cap talent on to a Small Cap Company” Transforming our Culture. Using servant leadership as a competitive advantage in attracting and retaining talent High-Performing Culture 4 Continued implementation of Operational Excellence in purchasing, integrated supply chain and product/asset management remains instrumental in advancing our financial performance “Myers Business System” serves as the foundation for Operational and Commercial Excellence, ensuring that our gains over the last years are institutionalized, permanent, and ever-improving Operational Excellence 3 Diversifying into Military and Industrial end-markets to overcome Consumer and RV end-market softness Continued growth in e-Commerce and large accounts in Automotive Aftermarket Innovation and sales gains in Industrial products to balance potential Seed box declines in Ag end market Organic Growth 1
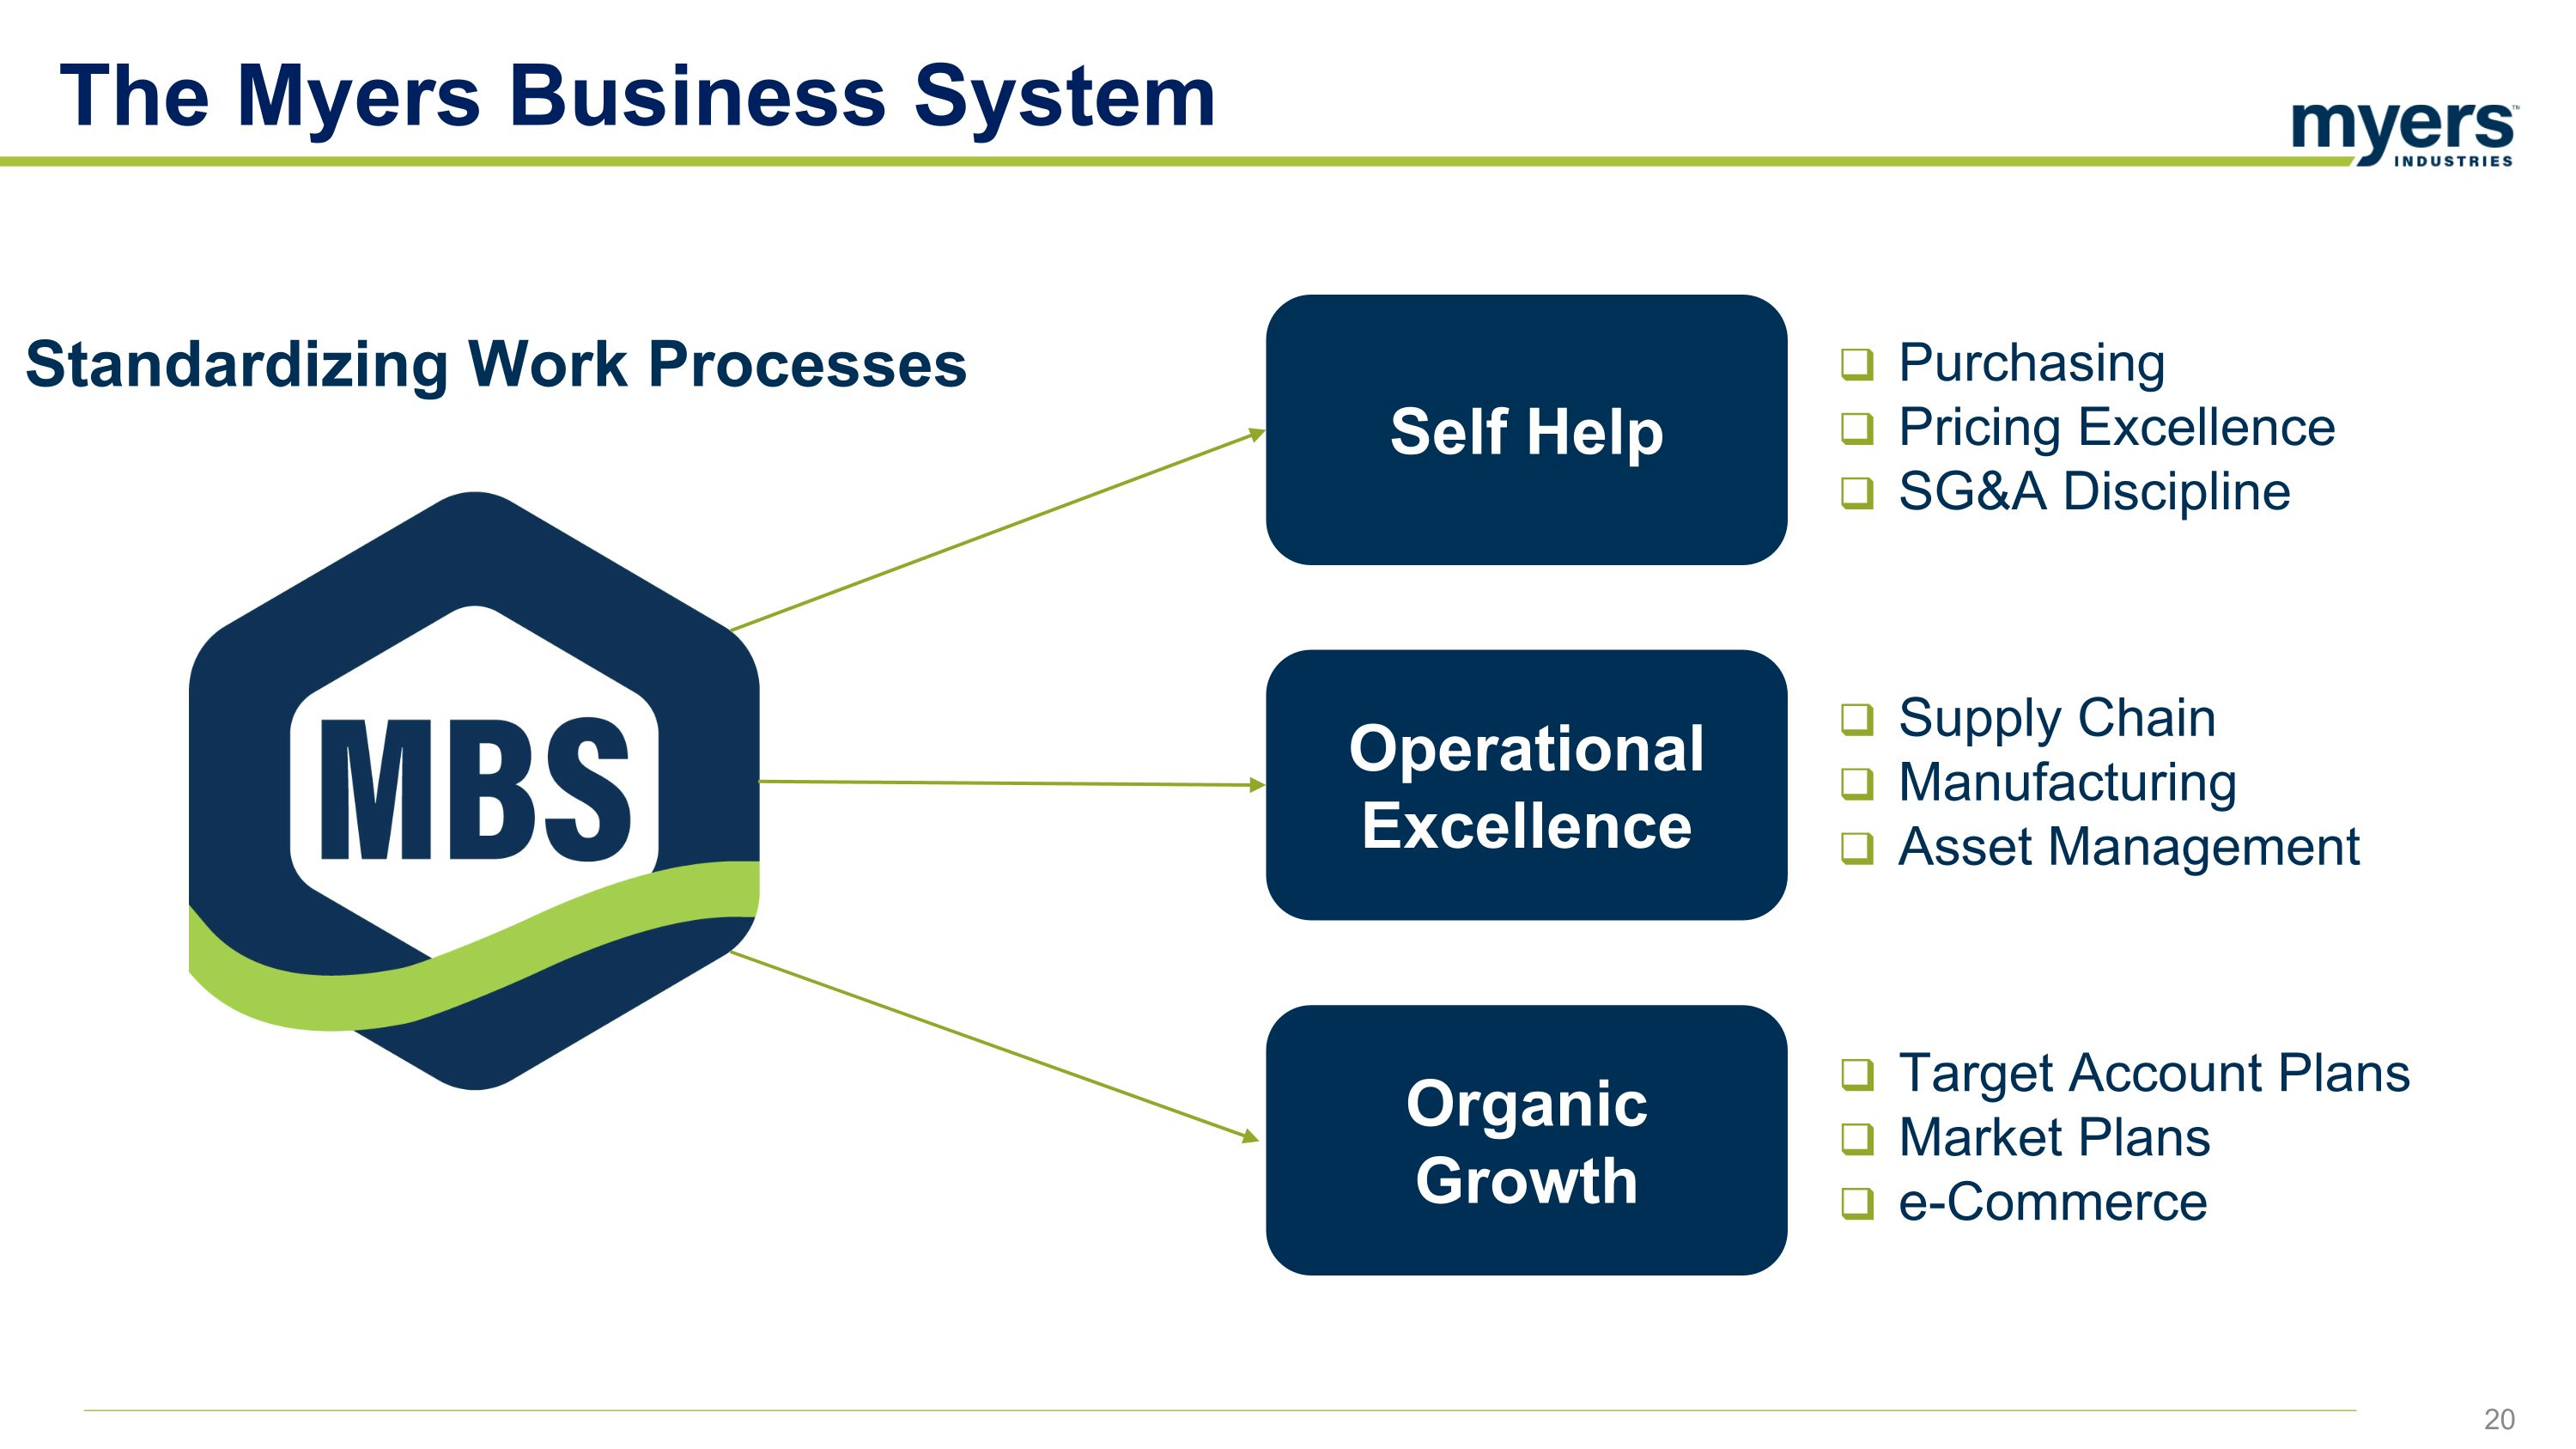
The Myers Business System Purchasing Pricing Excellence SG&A Discipline Supply Chain Manufacturing Asset Management Target Account Plans Market Plans e-Commerce Self Help Operational Excellence Organic Growth Standardizing Work Processes
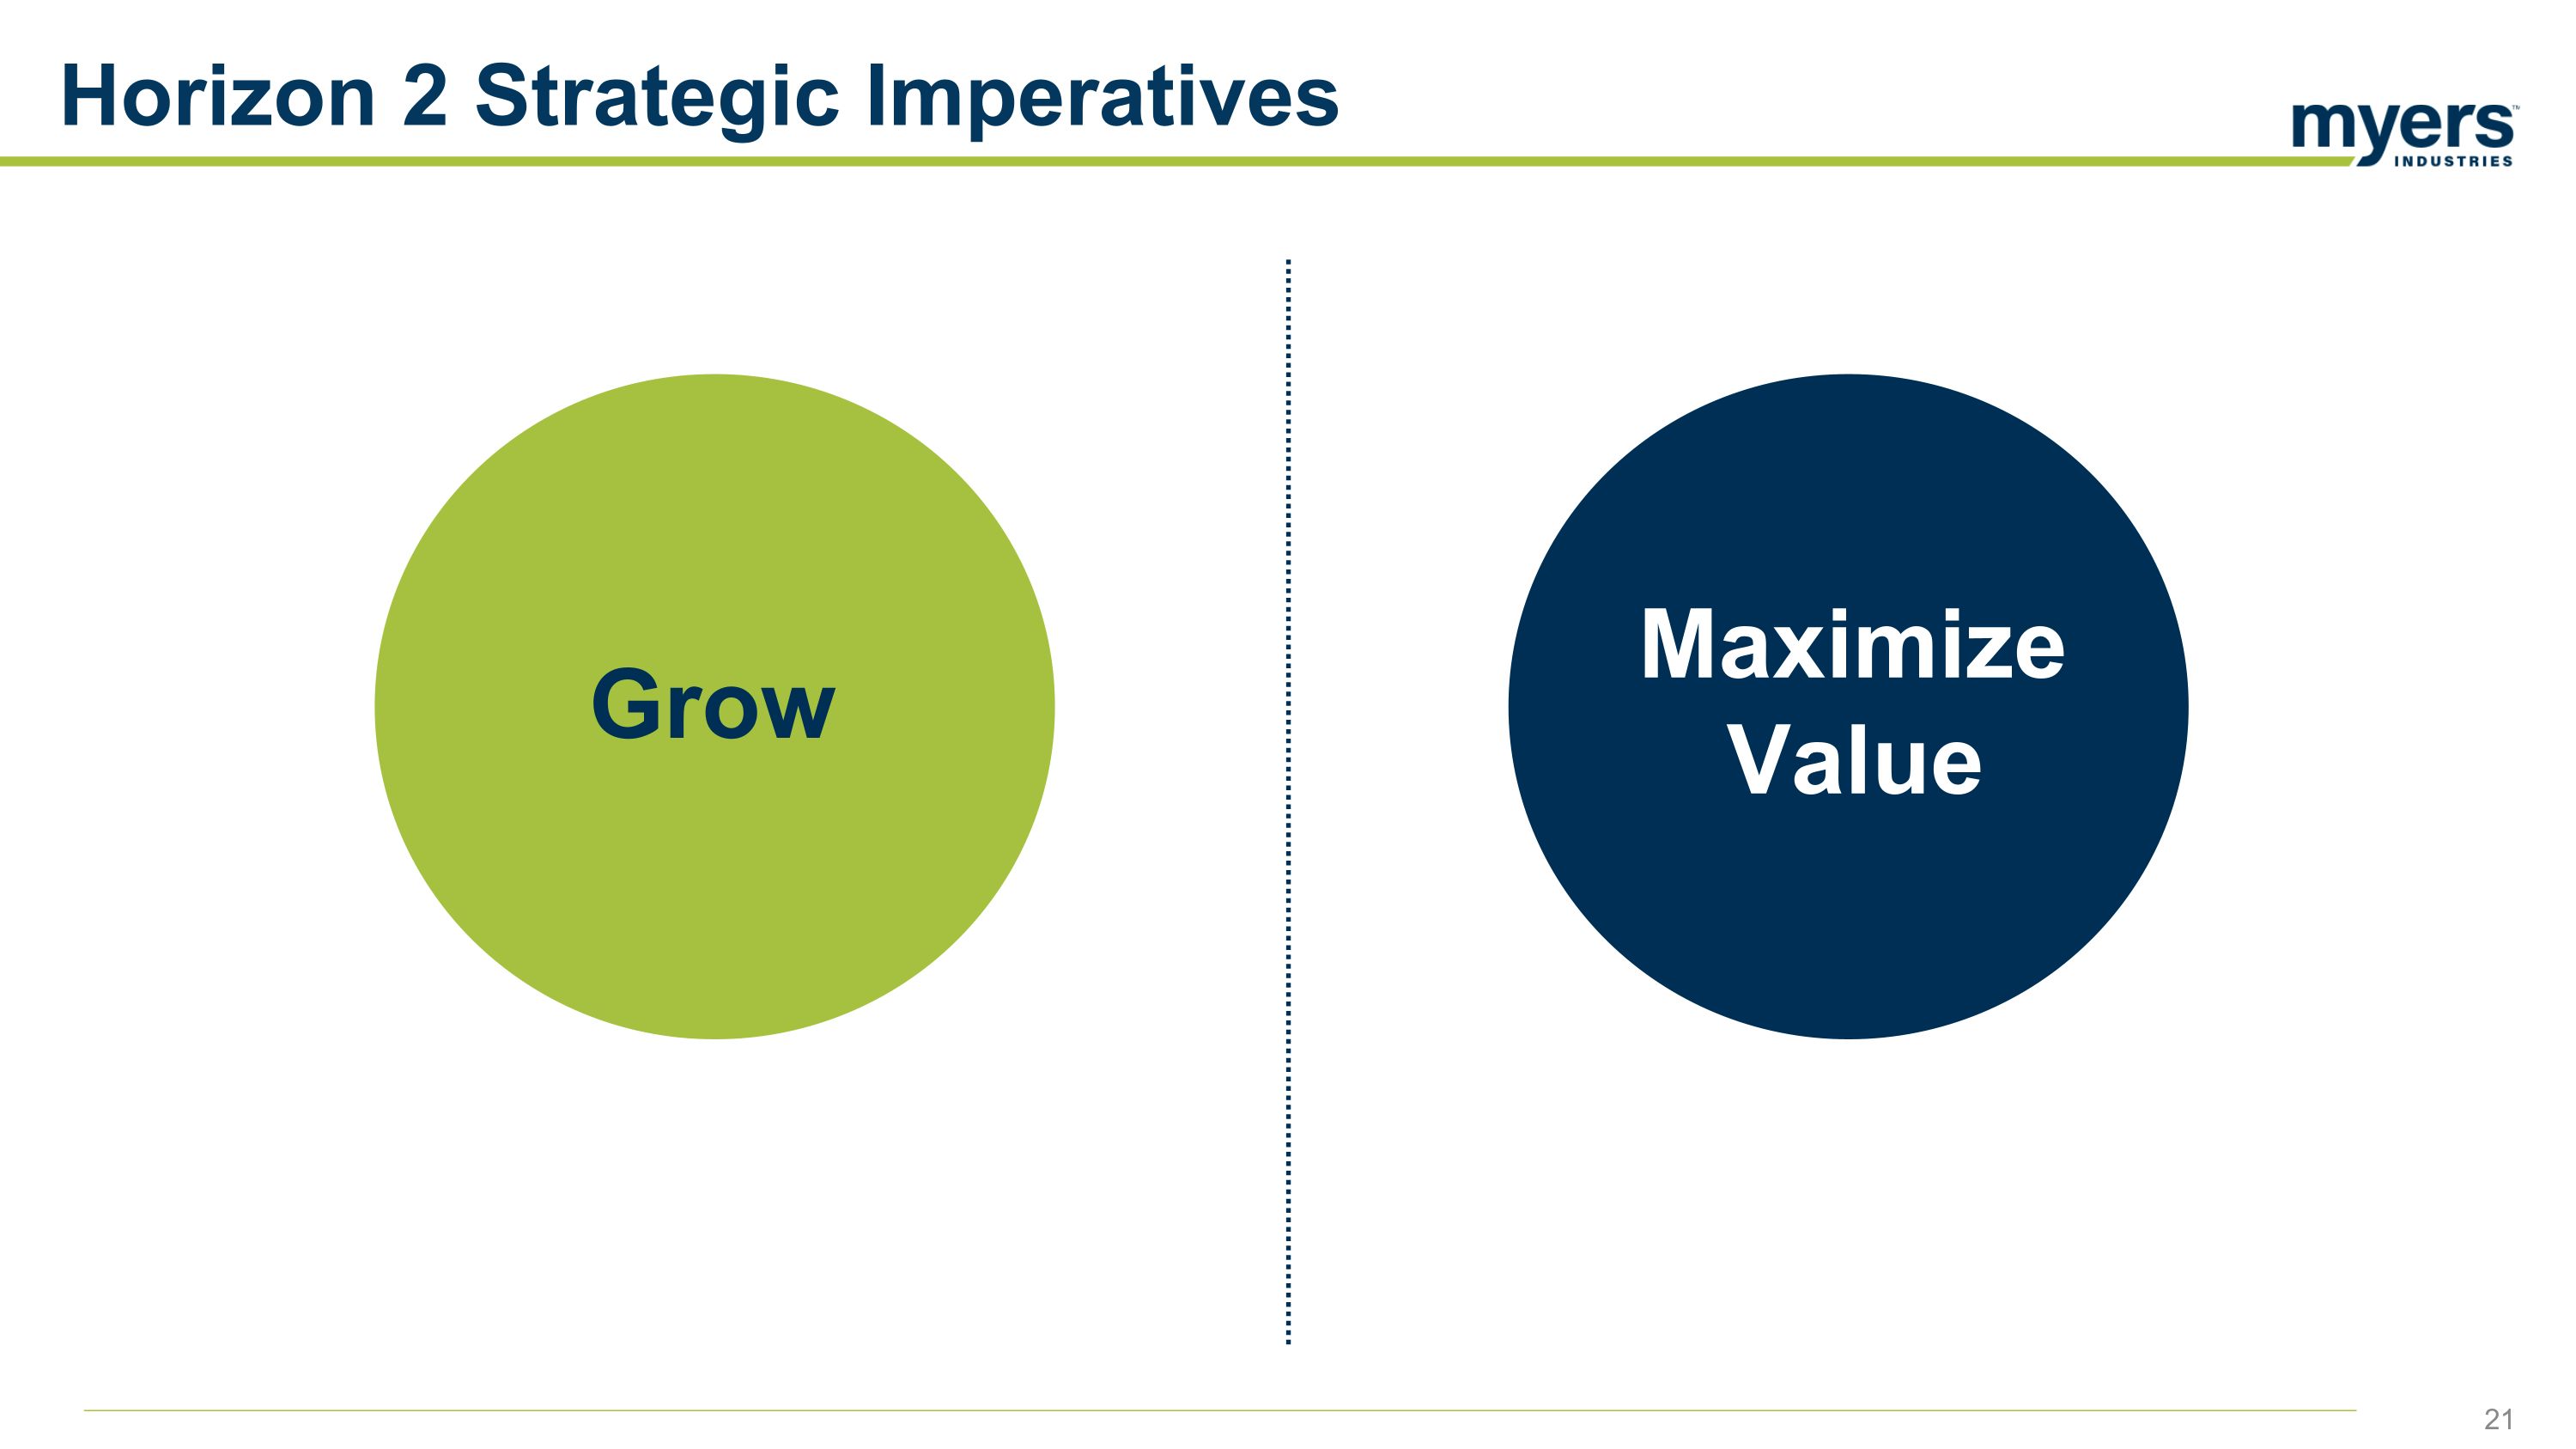
Horizon 2 Strategic Imperatives Grow Maximize Value
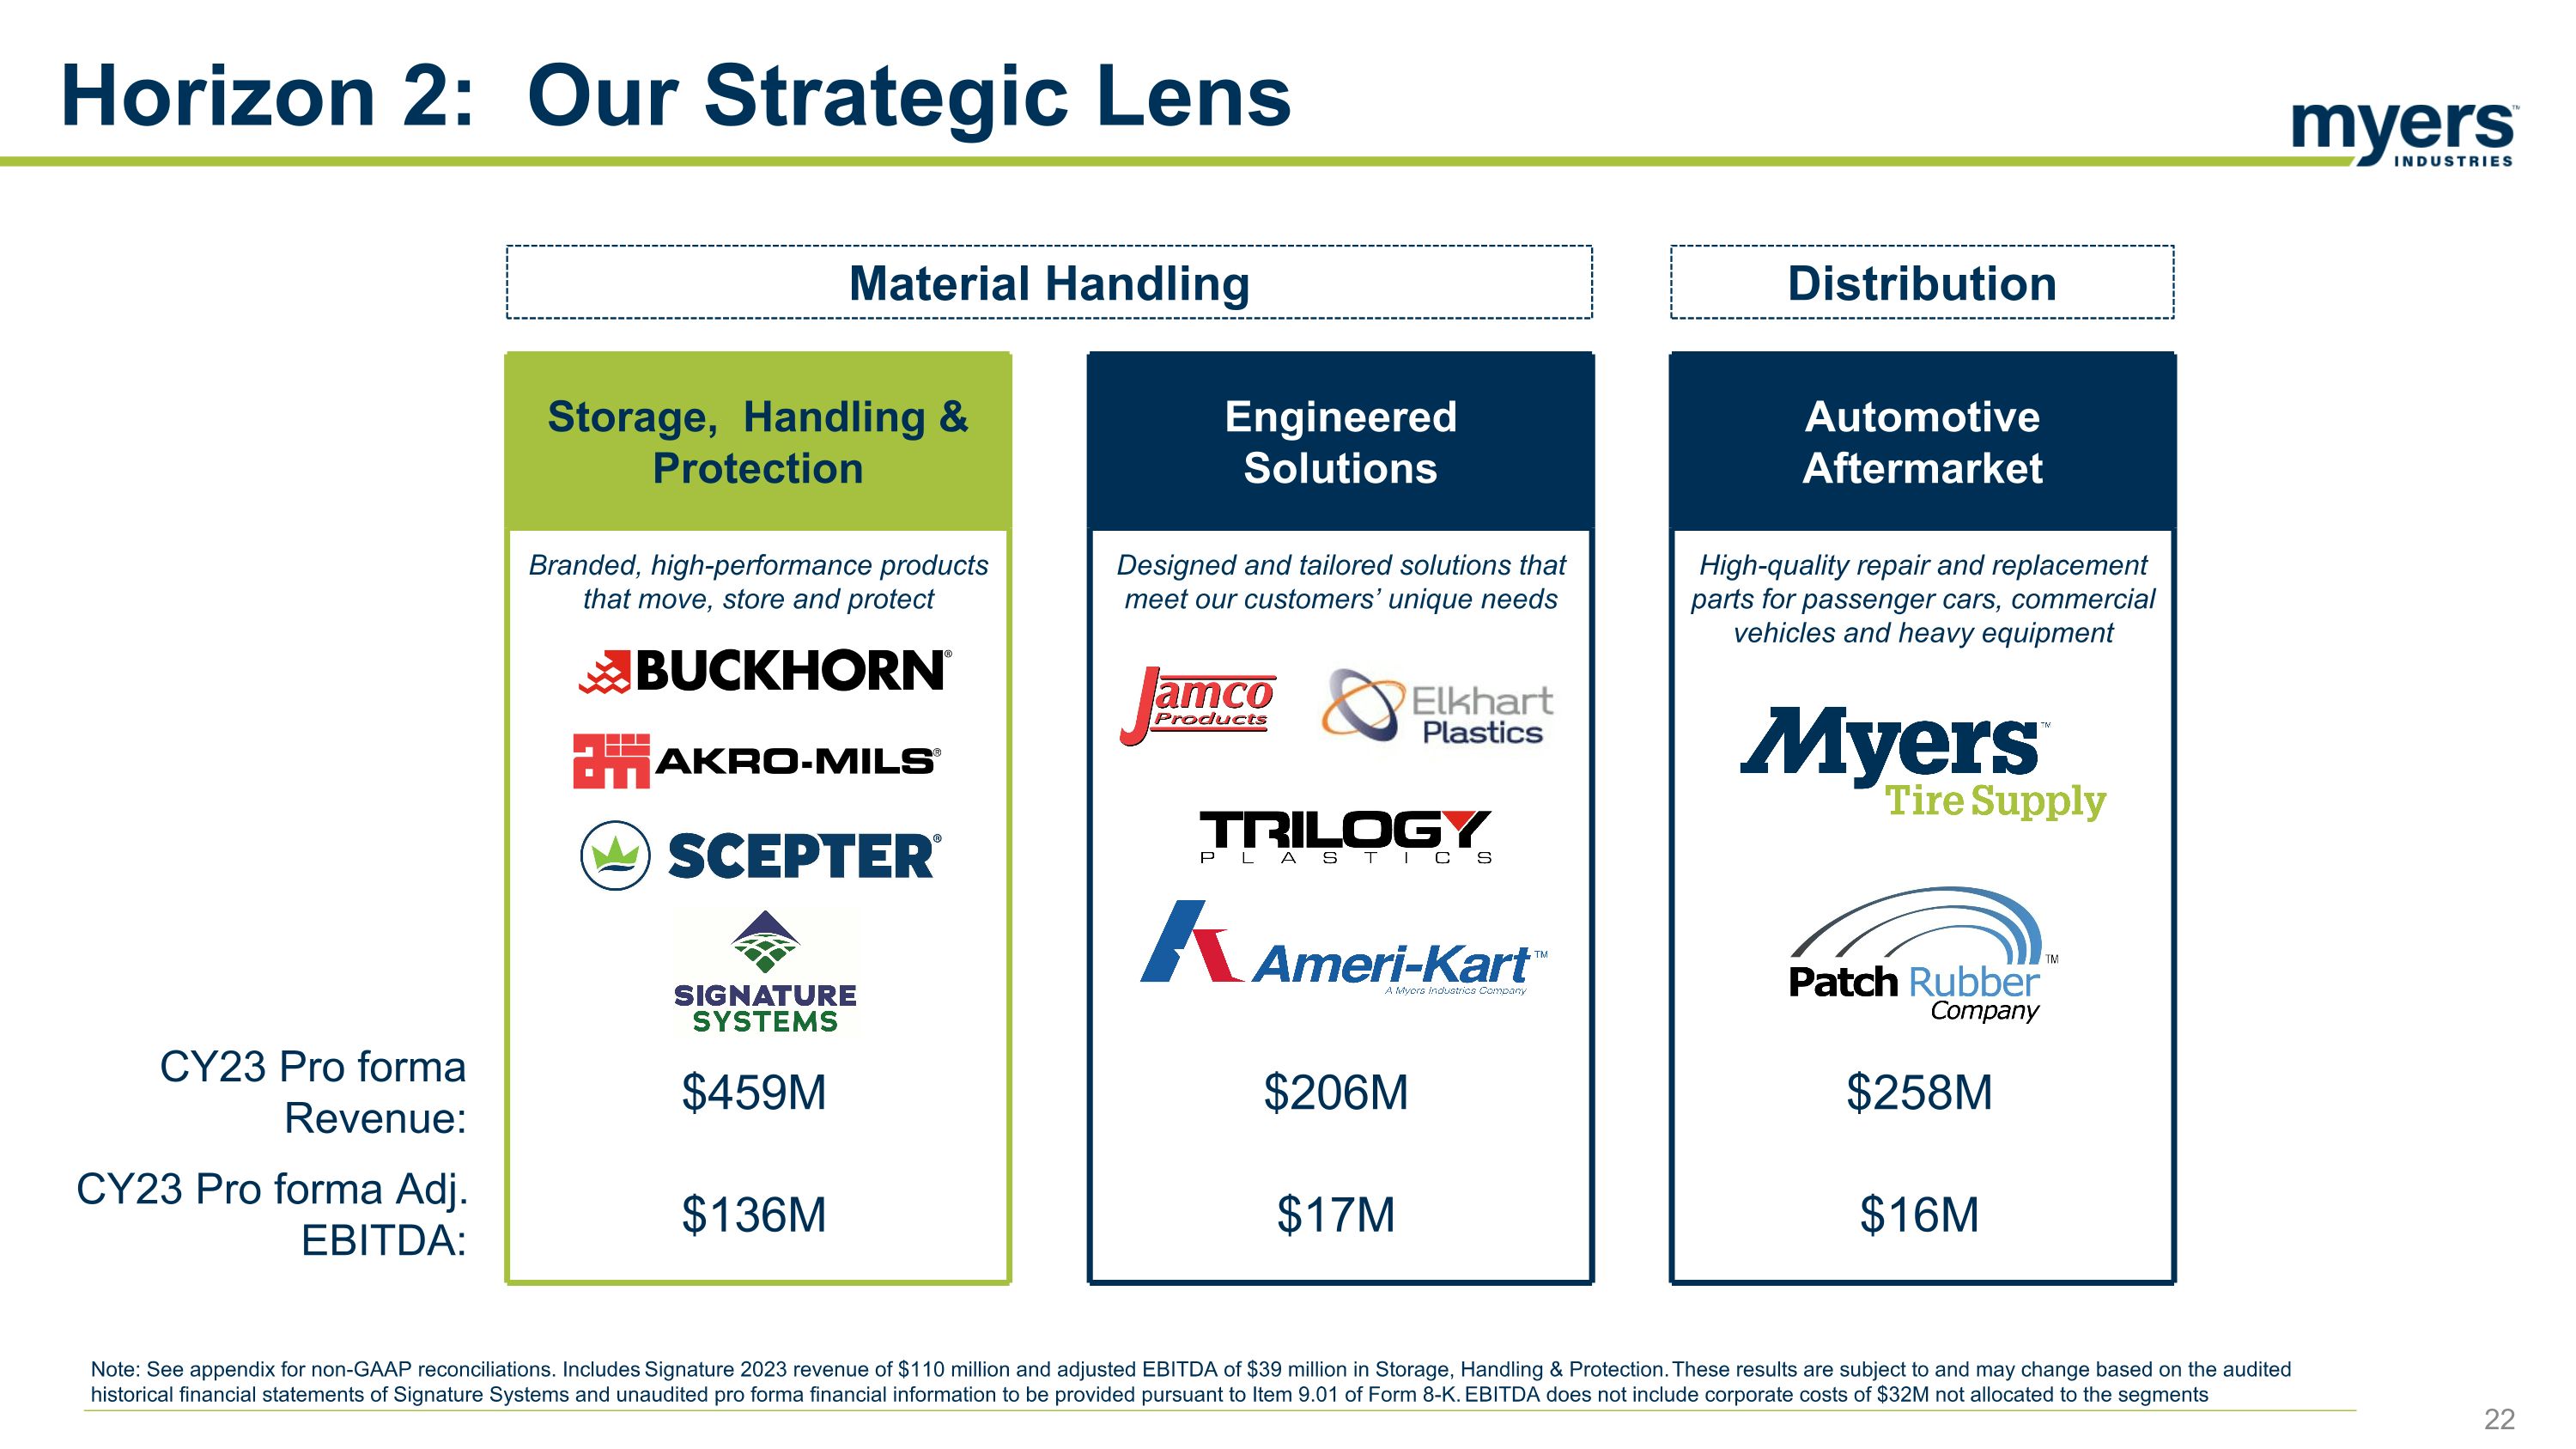
Automotive Aftermarket High-quality repair and replacement parts for passenger cars, commercial vehicles and heavy equipment Engineered Solutions Designed and tailored solutions that meet our customers’ unique needs Storage, Handling & Protection Branded, high-performance products that move, store and protect Horizon 2: Our Strategic Lens CY23 Pro forma Revenue: $459M $206M $258M CY23 Pro forma Adj. EBITDA: $136M $17M $16M Material Handling Distribution Note: See appendix for non-GAAP reconciliations. Includes Signature 2023 revenue of $110 million and adjusted EBITDA of $39 million in Storage, Handling & Protection. These results are subject to and may change based on the audited historical financial statements of Signature Systems and unaudited pro forma financial information to be provided pursuant to Item 9.01 of Form 8-K. EBITDA does not include corporate costs of $32M not allocated to the segments
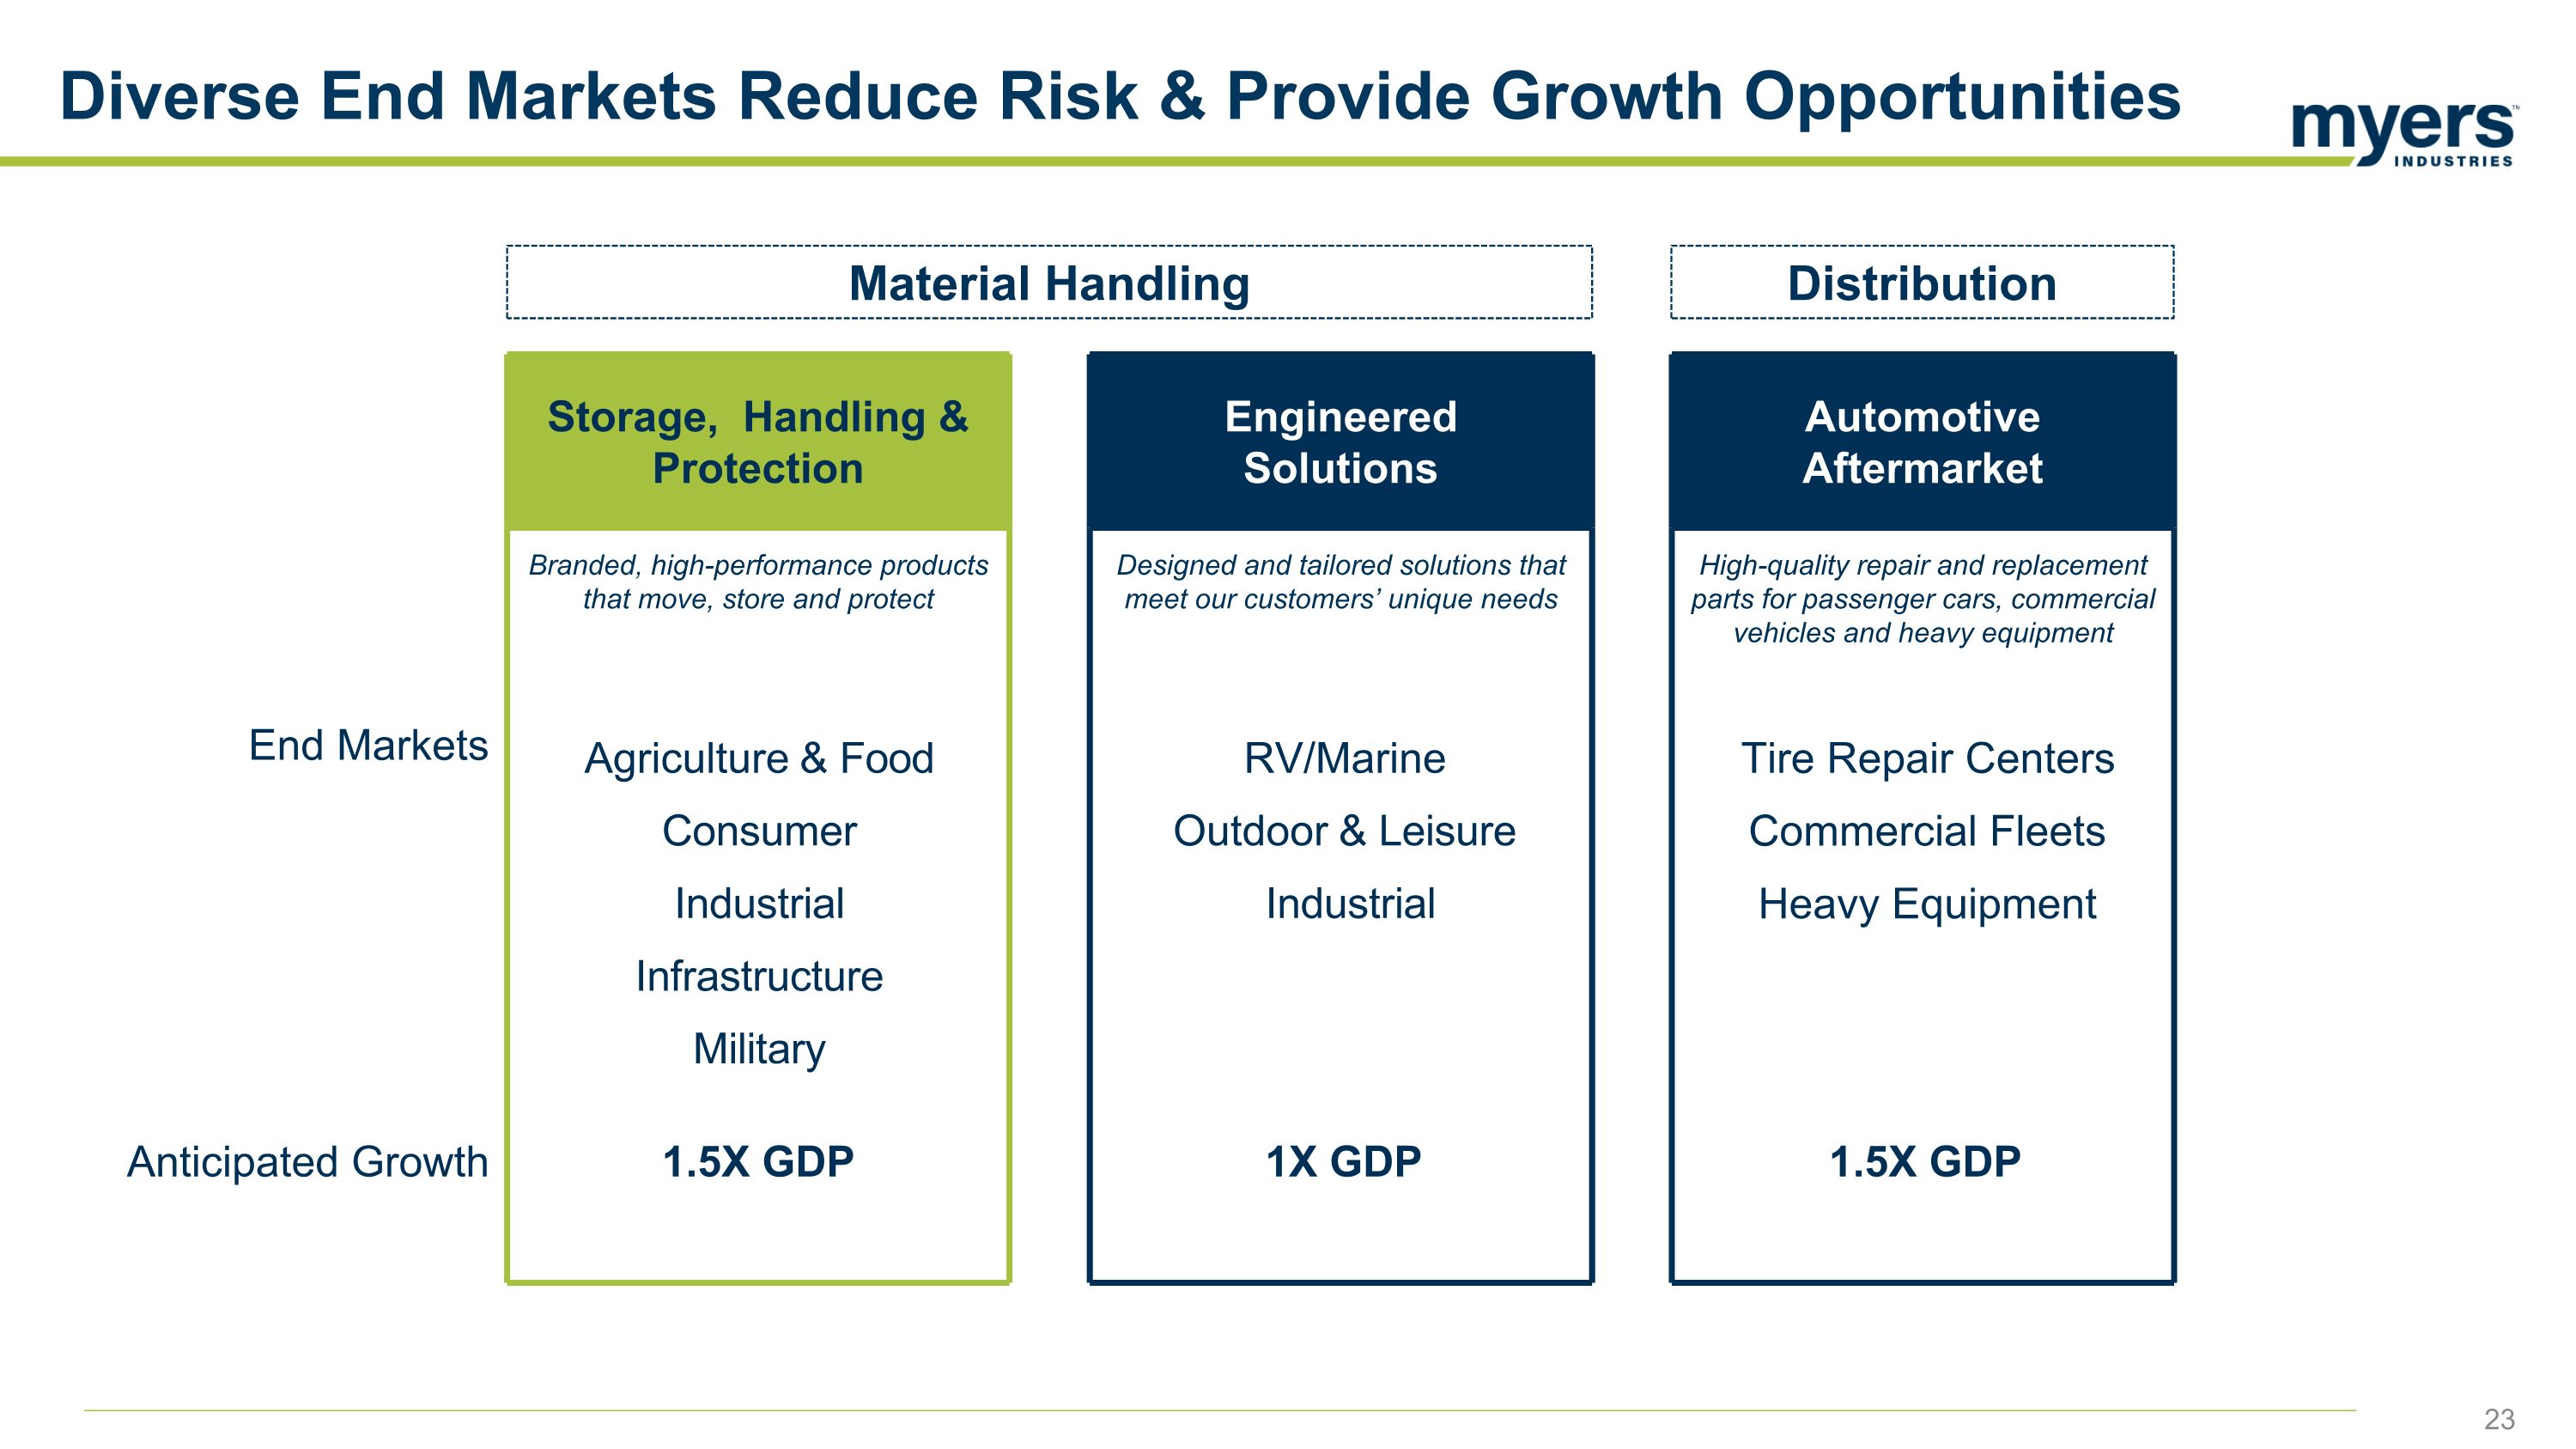
Automotive Aftermarket High-quality repair and replacement parts for passenger cars, commercial vehicles and heavy equipment Engineered Solutions Designed and tailored solutions that meet our customers’ unique needs Storage, Handling & Protection Branded, high-performance products that move, store and protect Diverse End Markets Reduce Risk & Provide Growth Opportunities Material Handling Distribution End Markets Agriculture & Food Consumer Industrial Infrastructure Military RV/Marine Outdoor & Leisure Industrial Tire Repair Centers Commercial Fleets Heavy Equipment Anticipated Growth 1.5X GDP 1X GDP 1.5X GDP
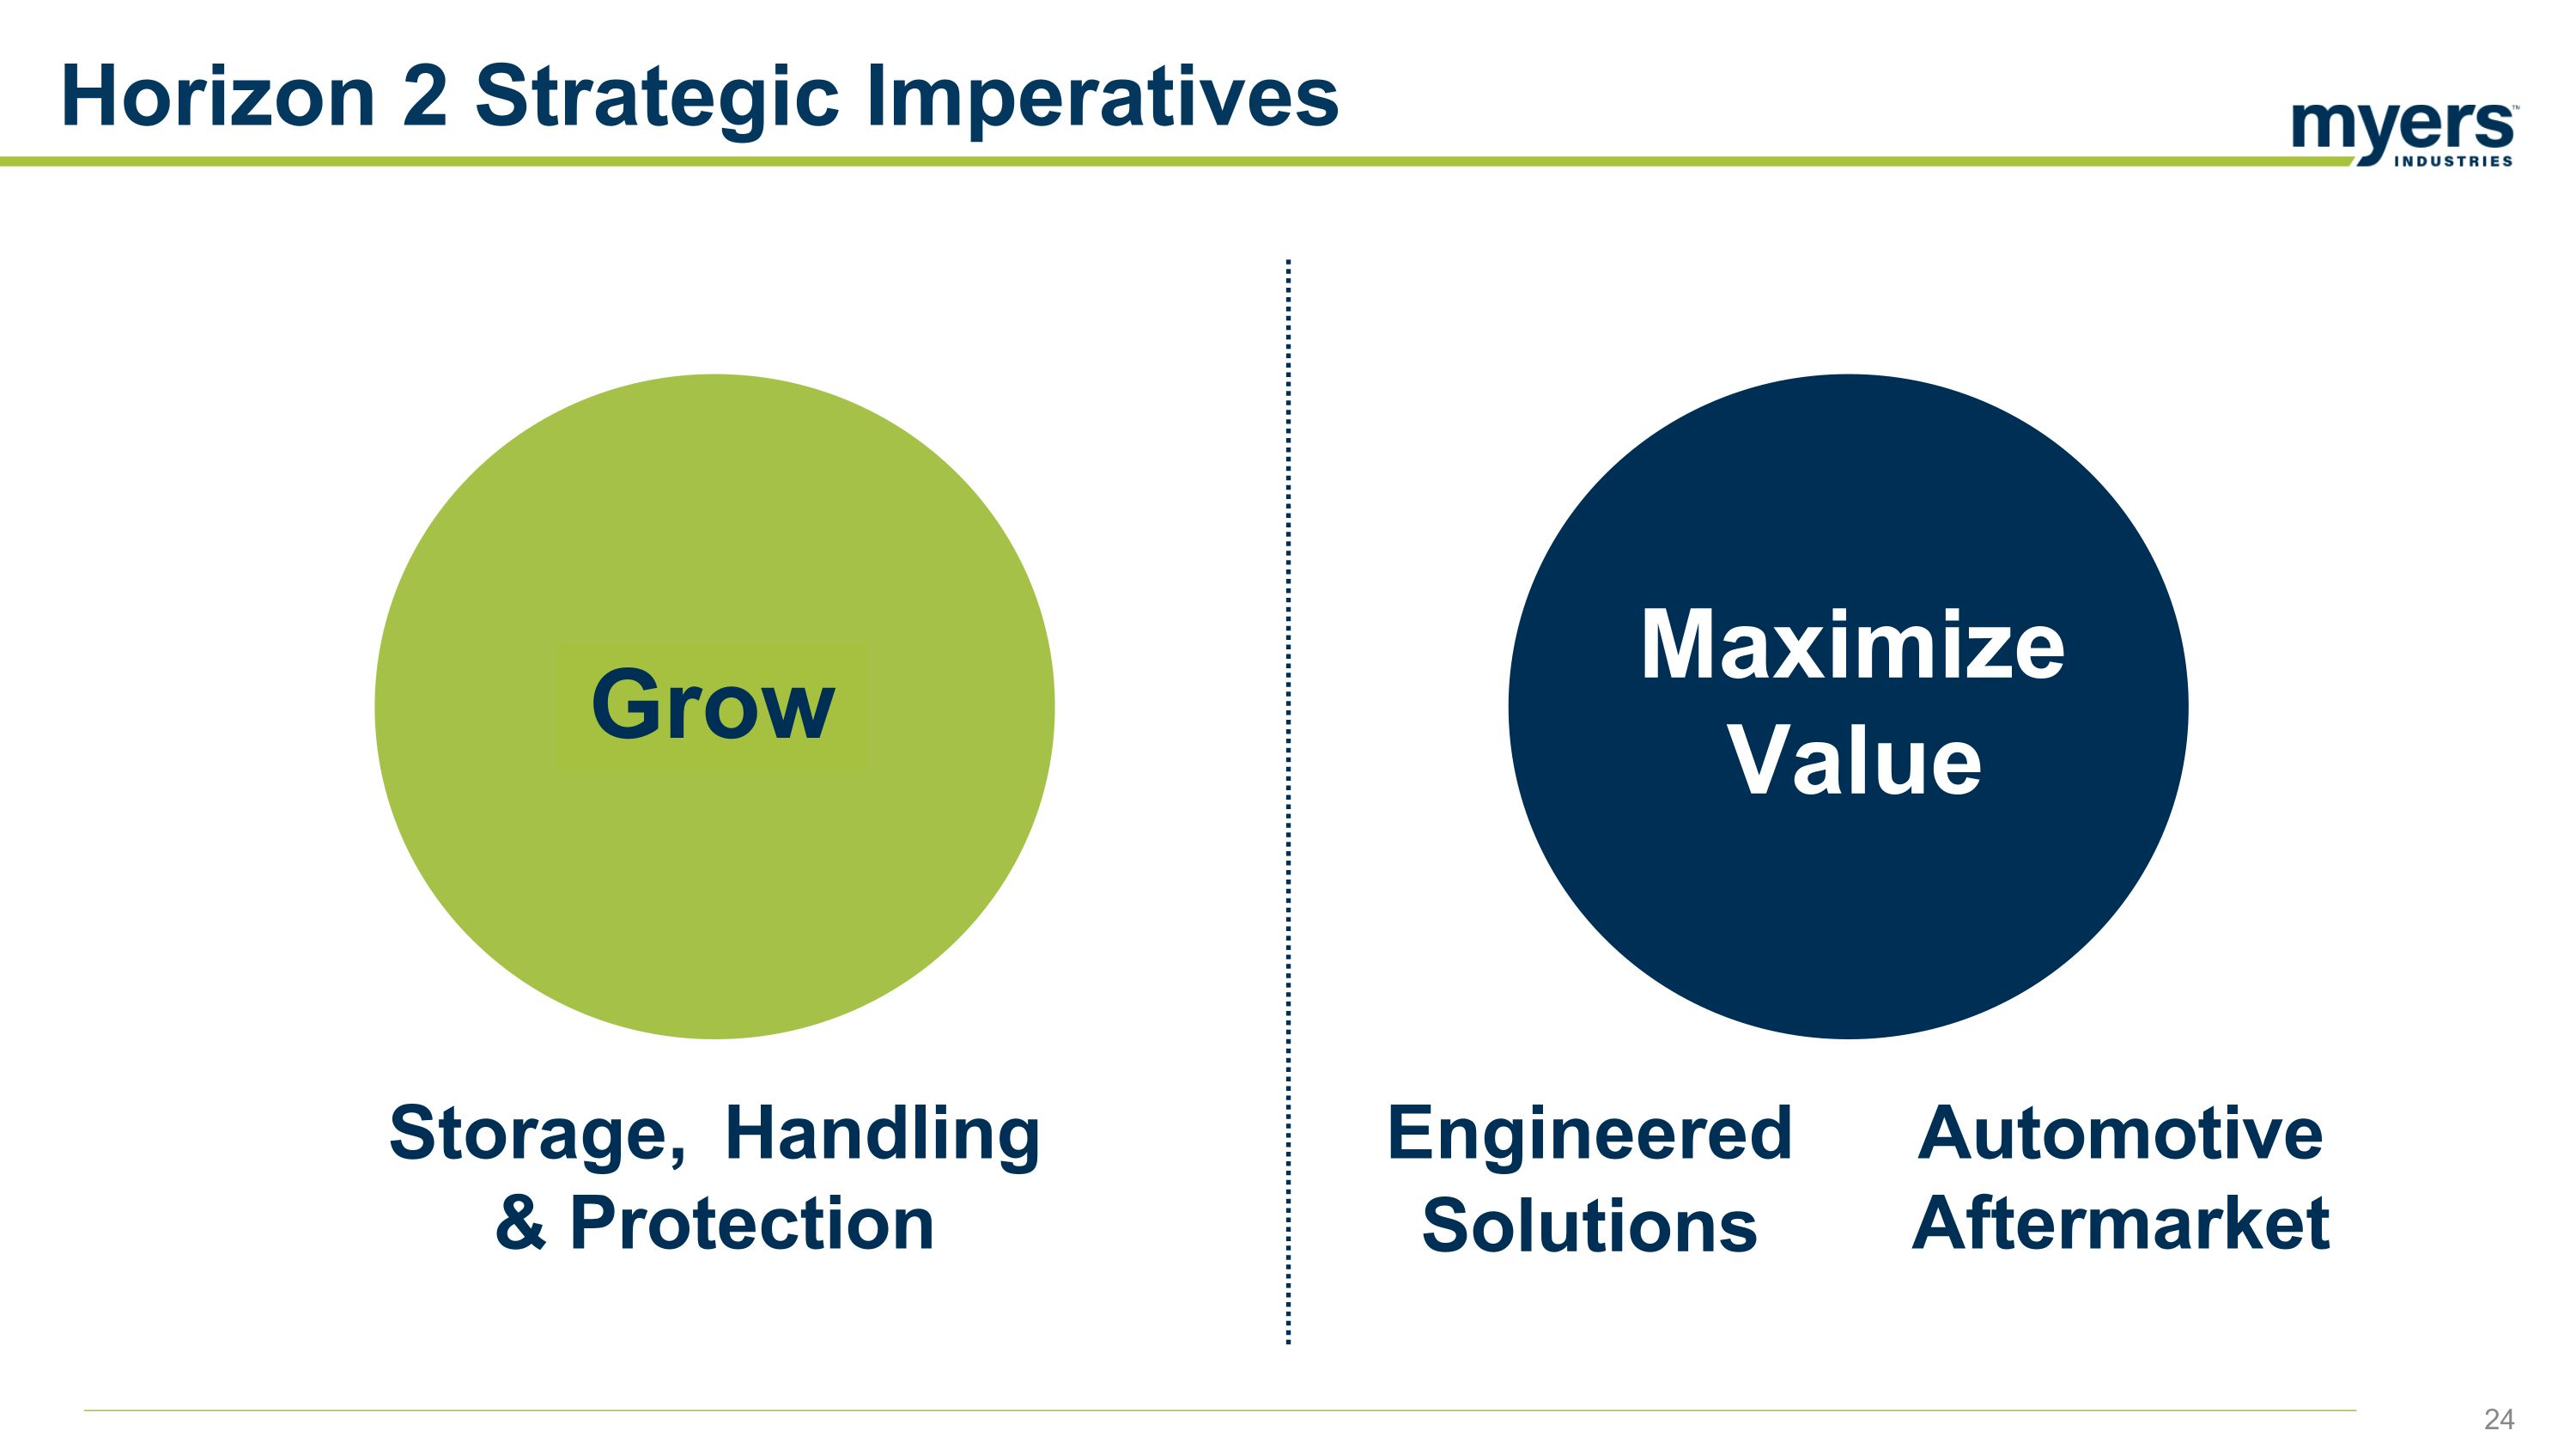
Horizon 2 Strategic Imperatives Storage, Handling & Protection Engineered Solutions Automotive Aftermarket Grow Maximize Value
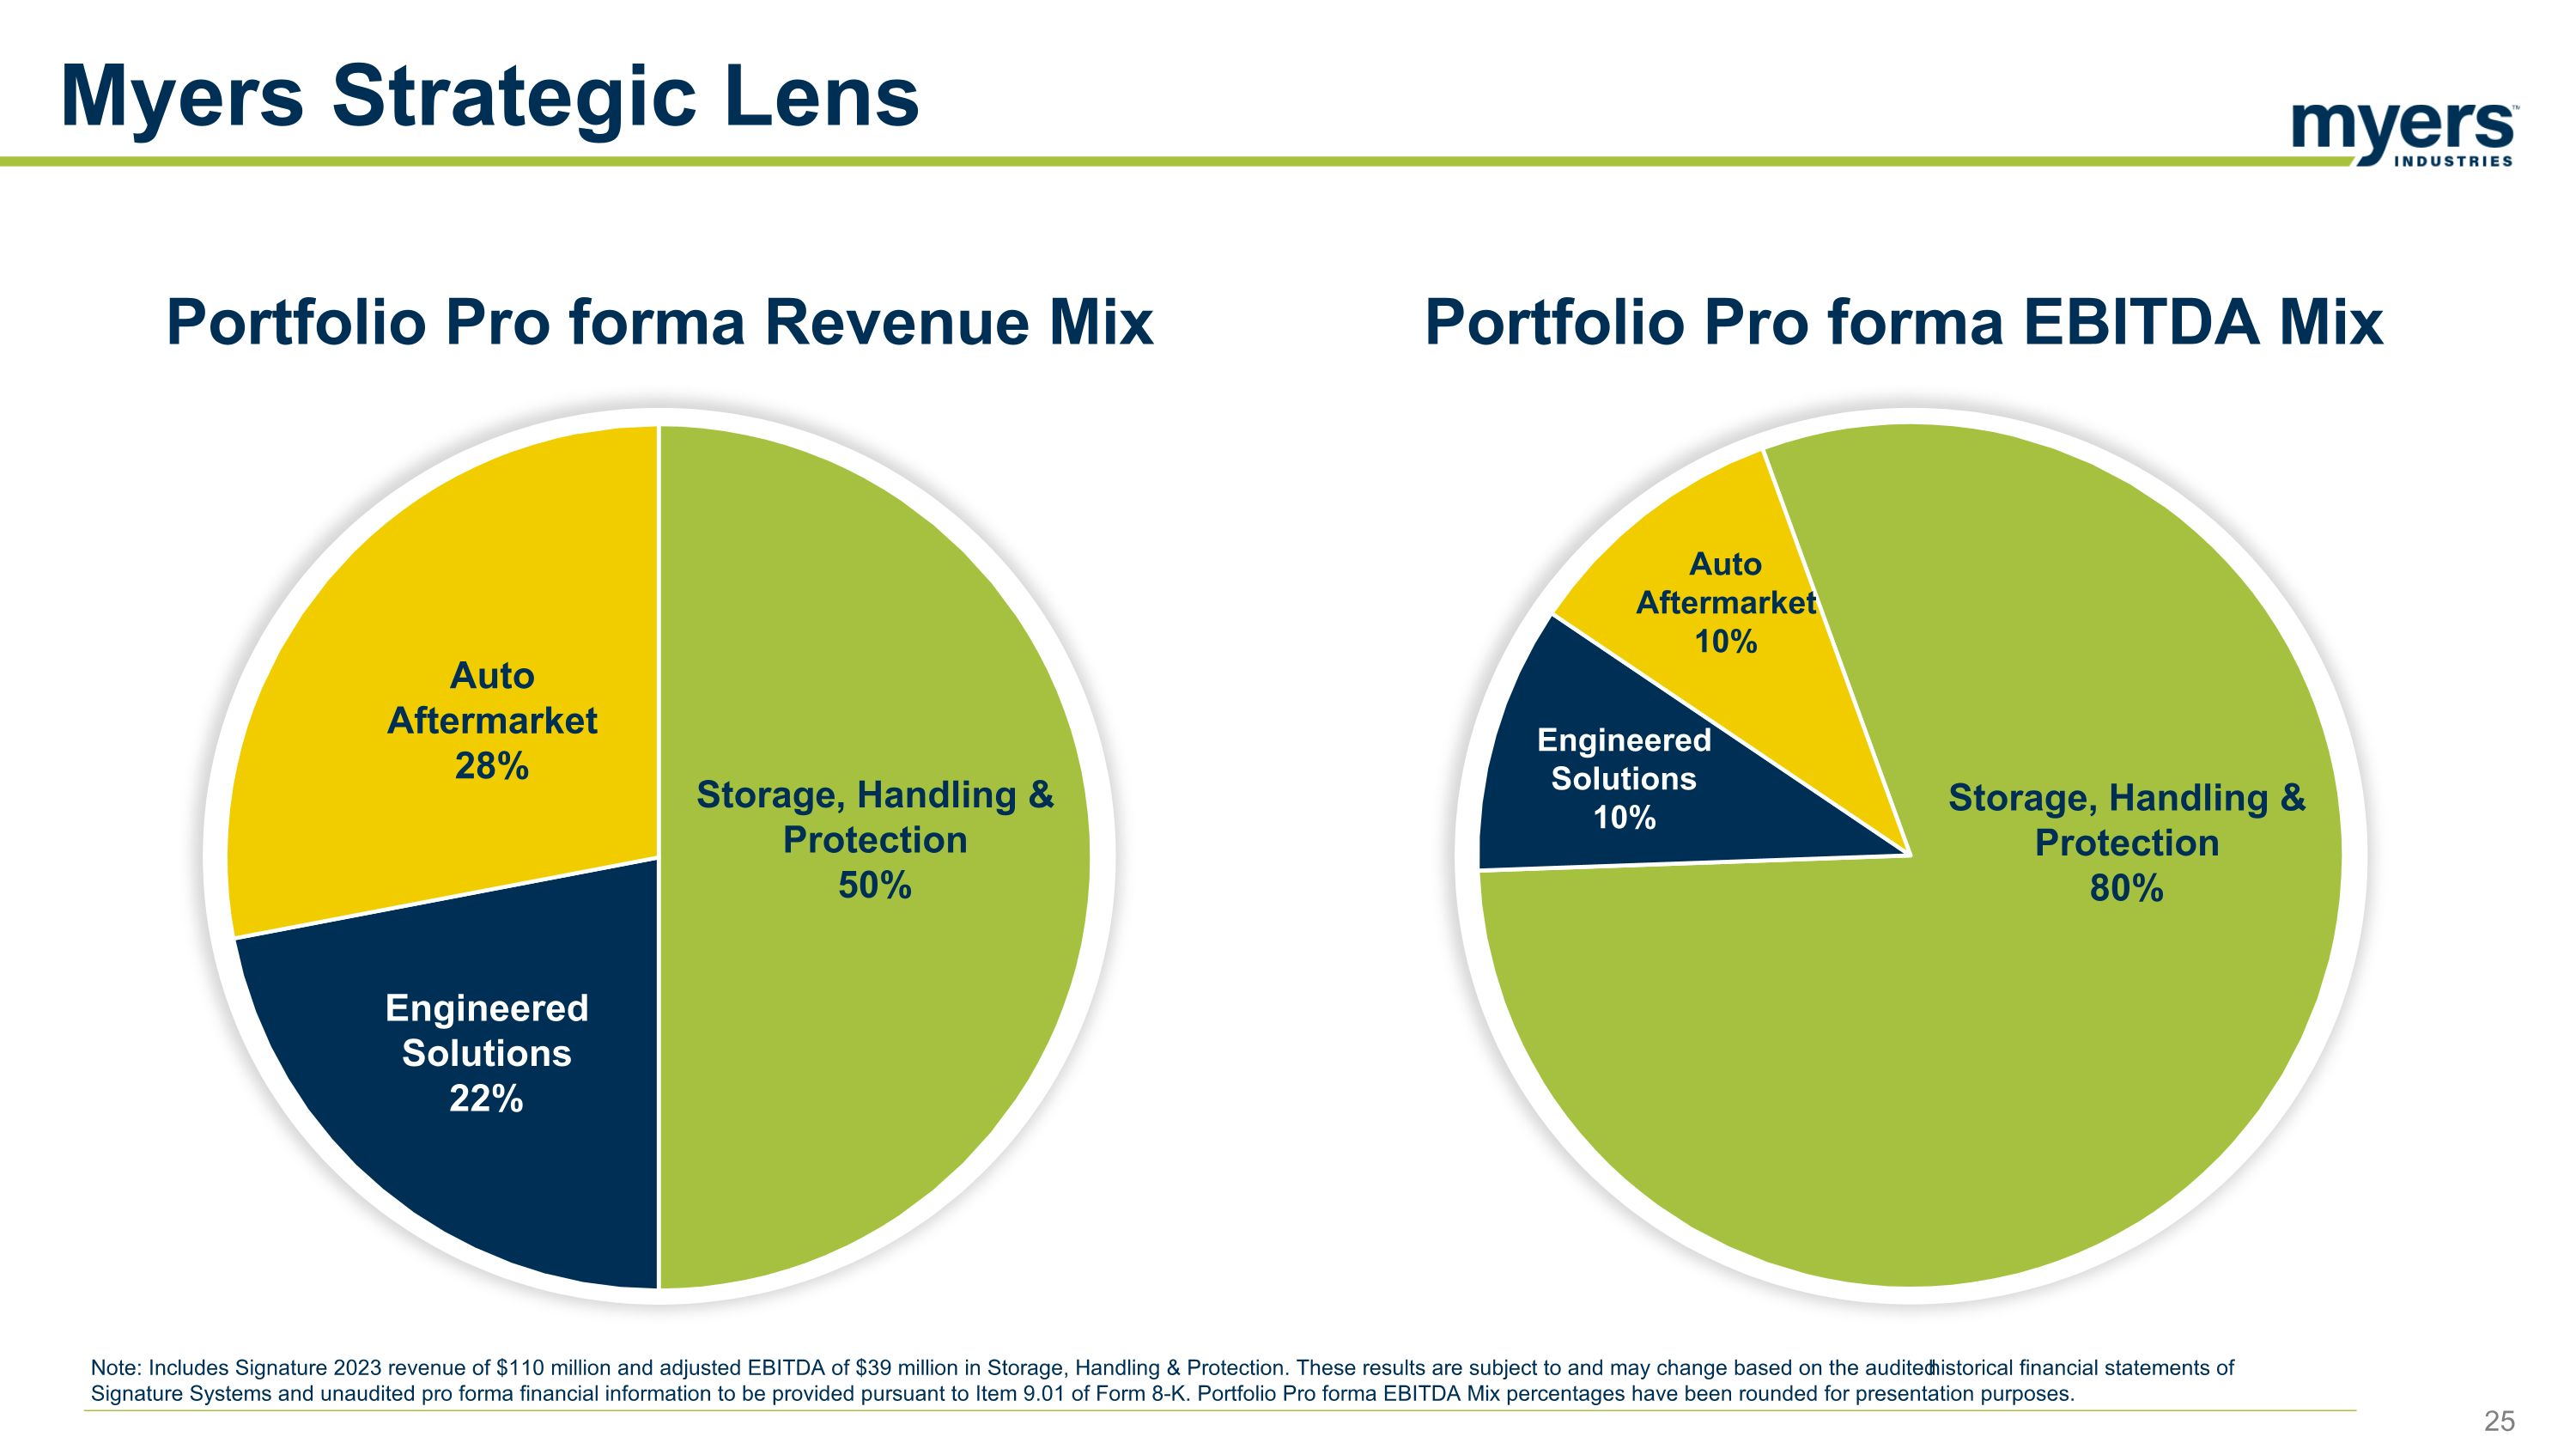
Portfolio Pro forma Revenue Mix Storage, Handling & Protection XX% Portfolio Pro forma EBITDA Mix Note: Includes Signature 2023 revenue of $110 million and adjusted EBITDA of $39 million in Storage, Handling & Protection. These results are subject to and may change based on the audited historical financial statements of Signature Systems and unaudited pro forma financial information to be provided pursuant to Item 9.01 of Form 8-K. Portfolio Pro forma EBITDA Mix percentages have been rounded for presentation purposes. 25 Myers Strategic Lens
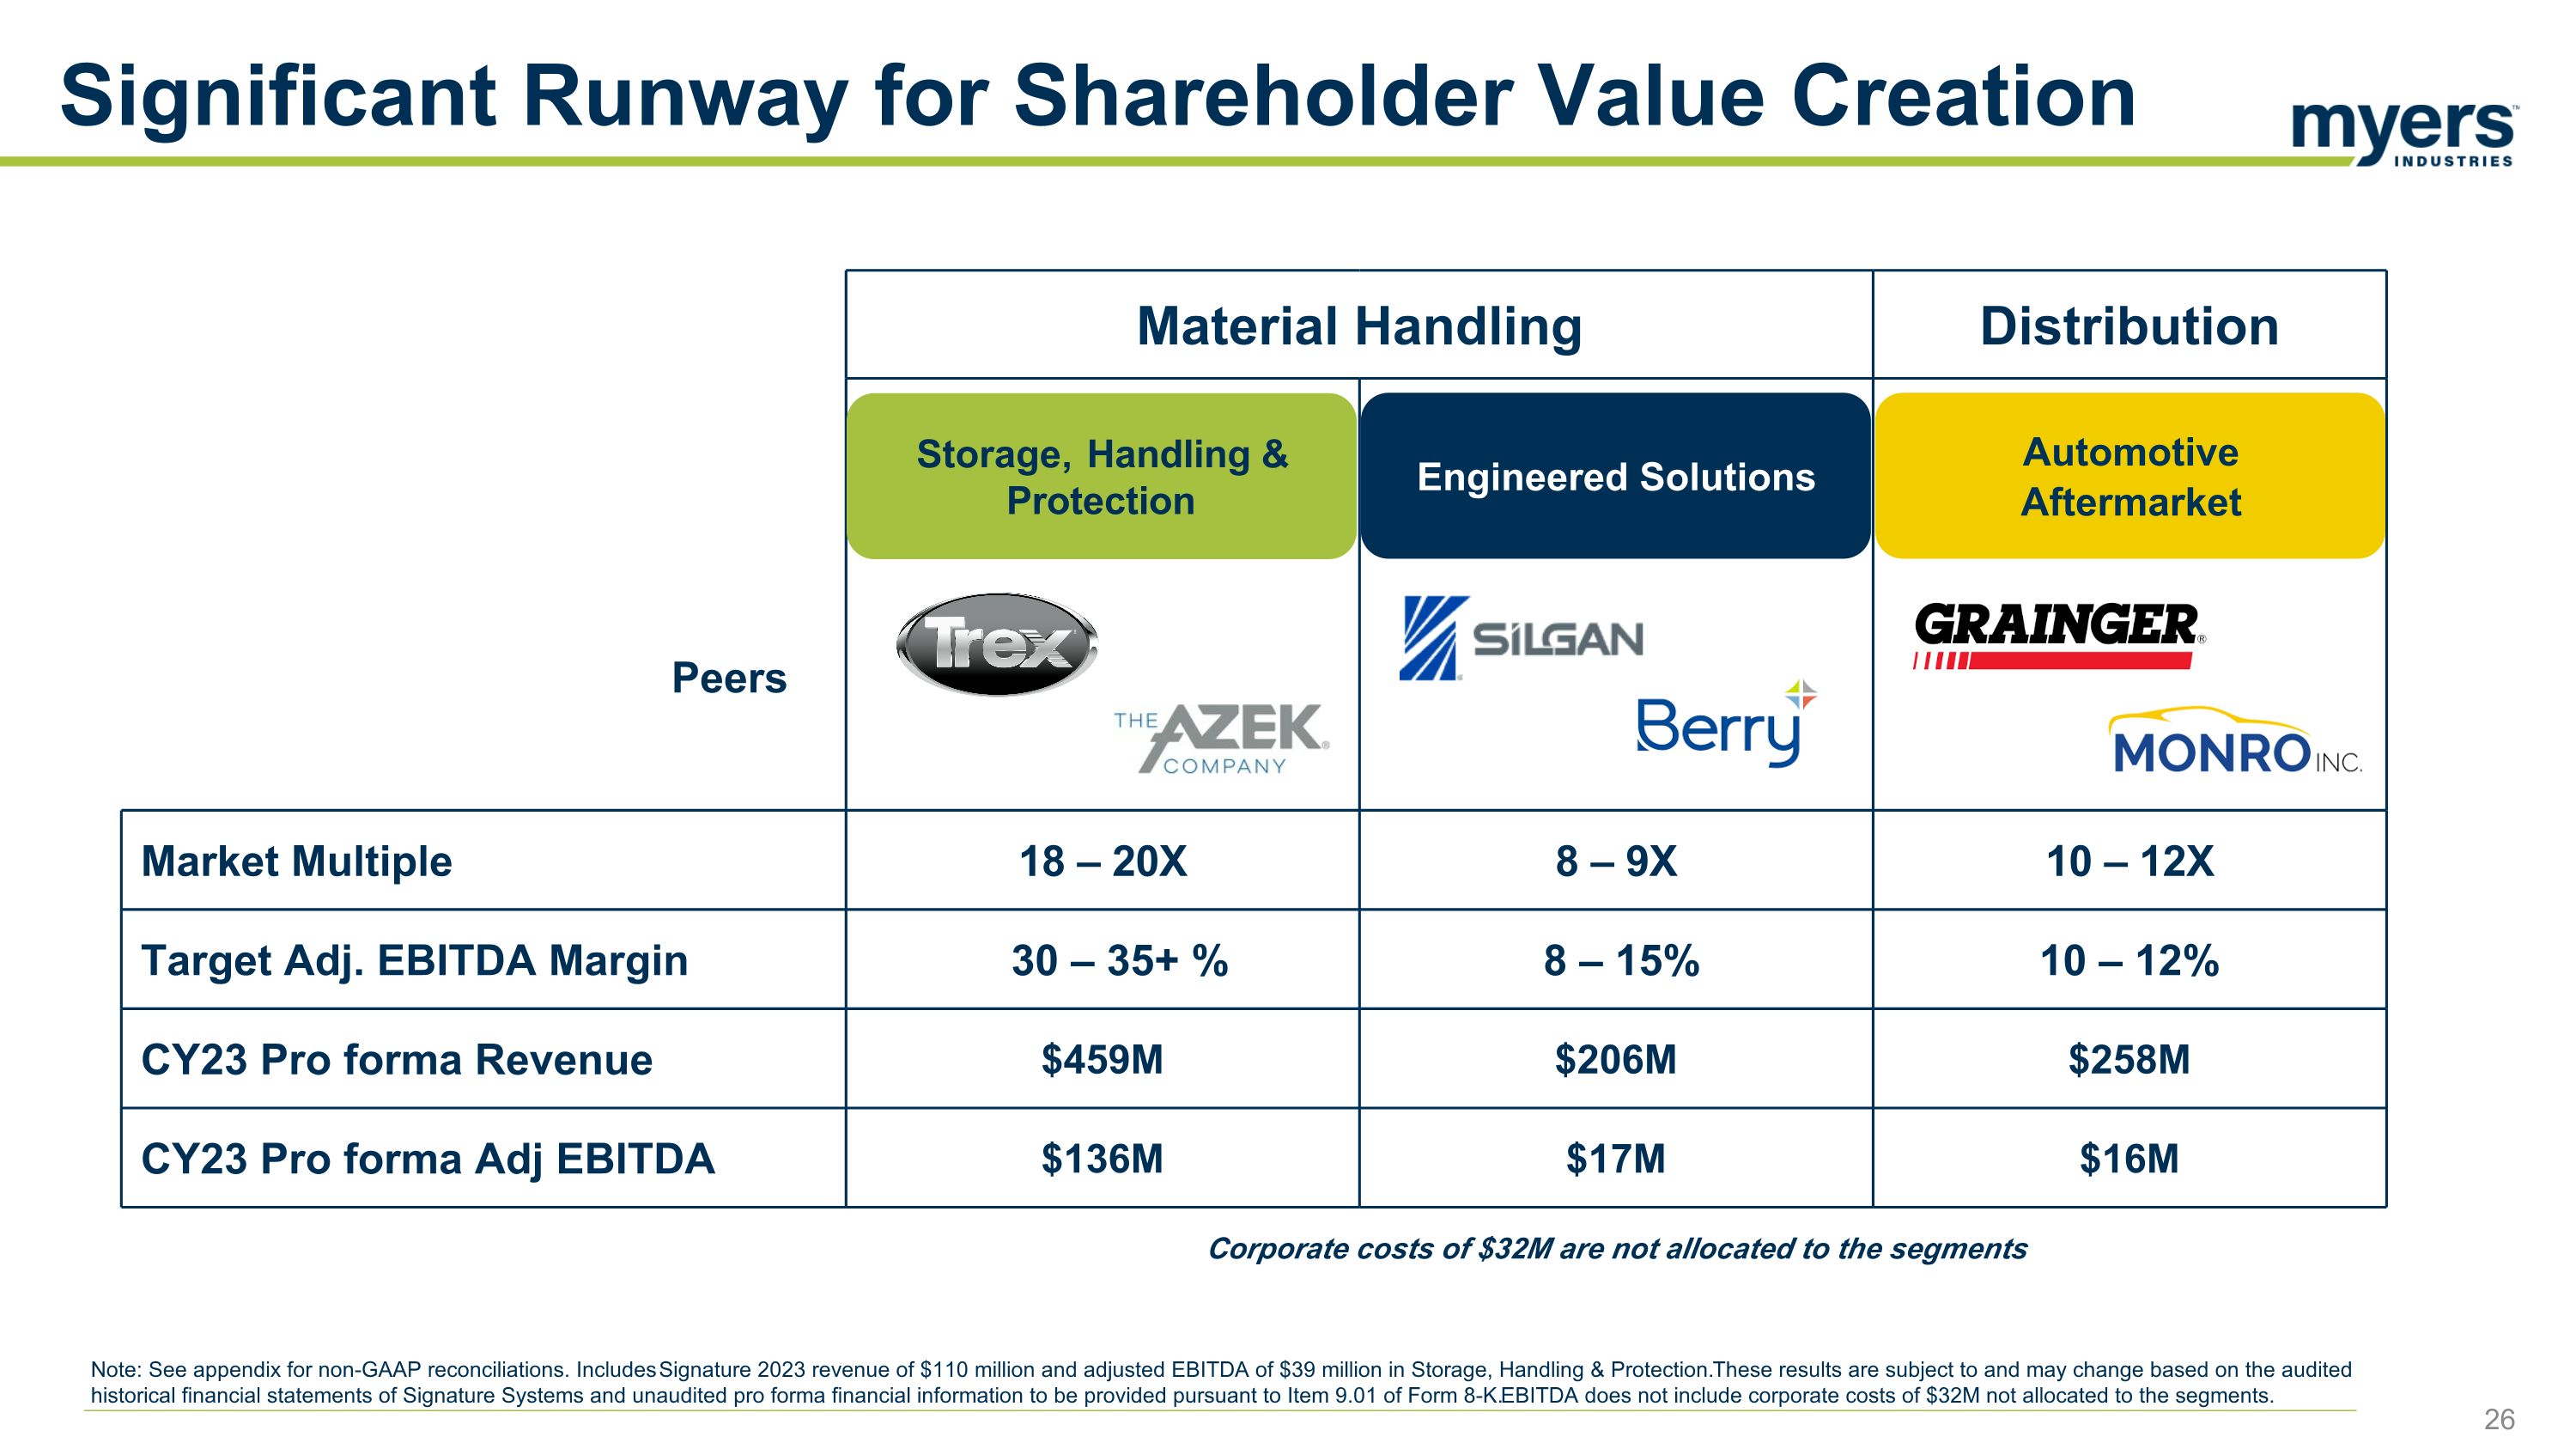
Material Handling Distribution Peers Market Multiple 18 – 20X 8 – 9X 10 – 12X Target Adj. EBITDA Margin 30 – 35+ % 8 – 15% 10 – 12% CY23 Pro forma Revenue $459M $206M $258M CY23 Pro forma Adj EBITDA $136M $17M $16M Corporate costs of $32M are not allocated to the segments Engineered Solutions Automotive Aftermarket Storage, Handling & Protection Significant Runway for Shareholder Value Creation Note: See appendix for non-GAAP reconciliations. Includes Signature 2023 revenue of $110 million and adjusted EBITDA of $39 million in Storage, Handling & Protection. These results are subject to and may change based on the audited historical financial statements of Signature Systems and unaudited pro forma financial information to be provided pursuant to Item 9.01 of Form 8-K. EBITDA does not include corporate costs of $32M not allocated to the segments.
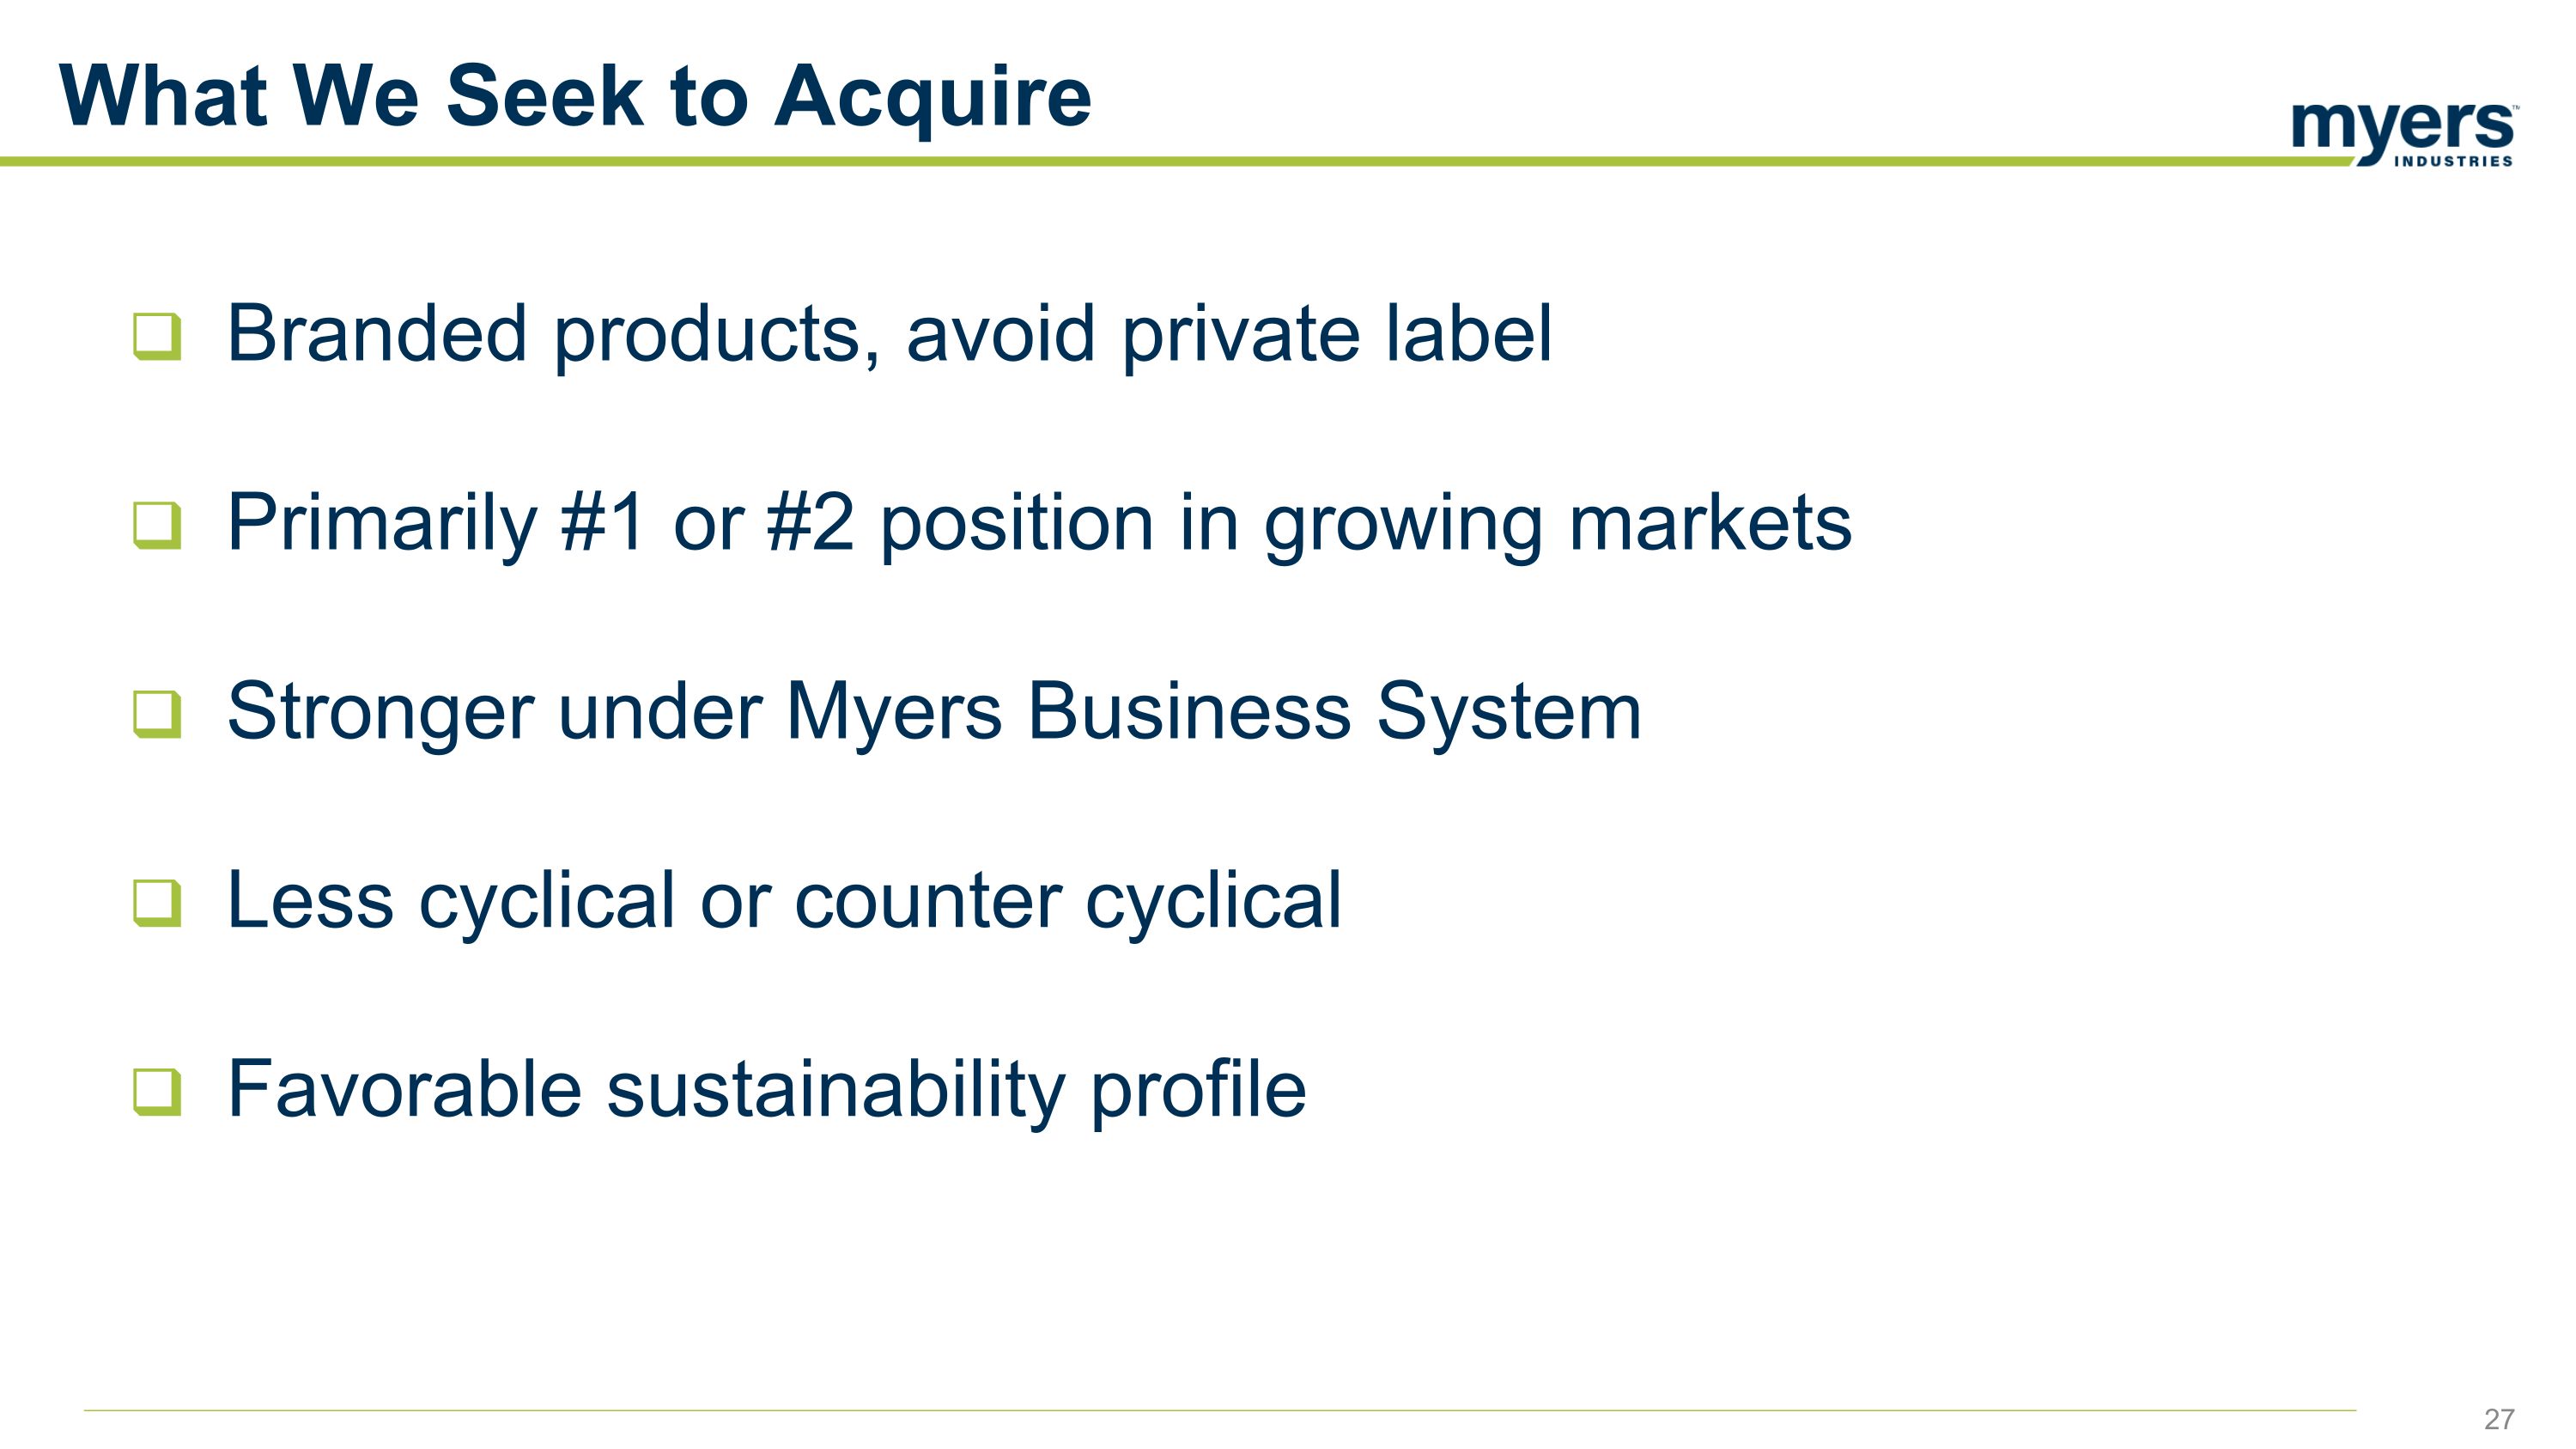
Branded products, avoid private label Primarily #1 or #2 position in growing markets Stronger under Myers Business System Less cyclical or counter cyclical Favorable sustainability profile What We Seek to Acquire
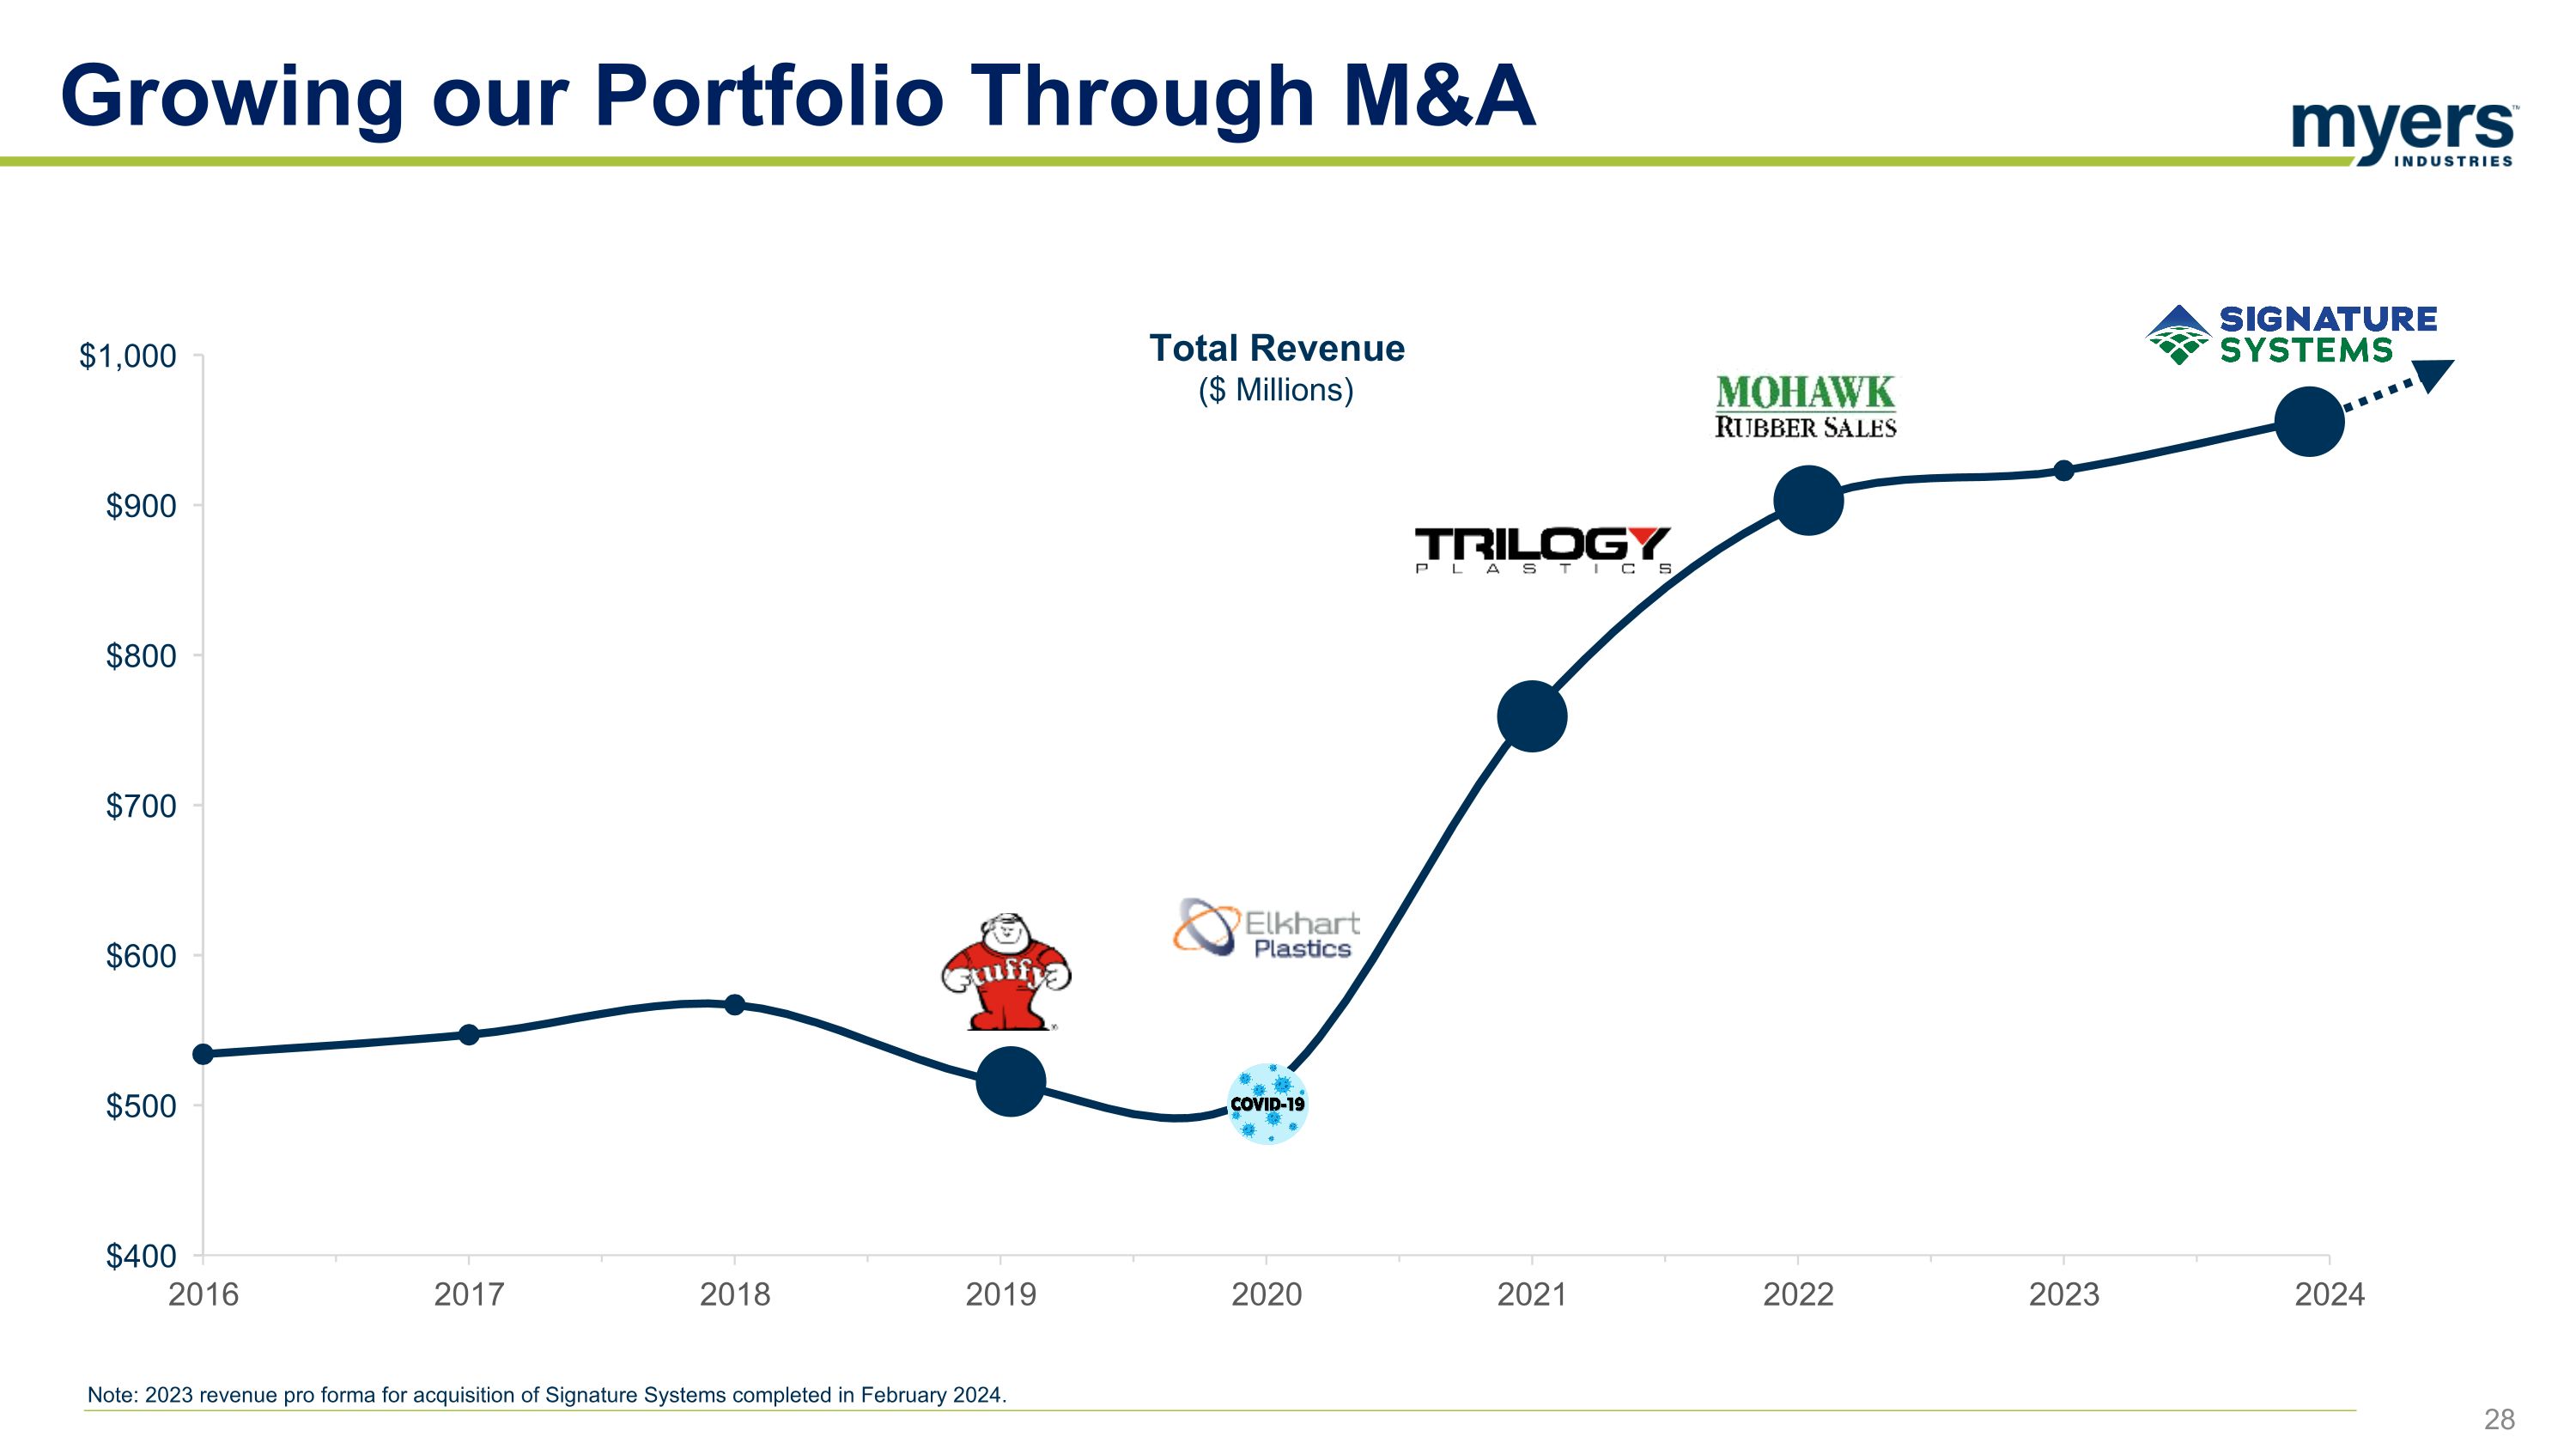
Growing our Portfolio Through M&A Note: 2023 revenue pro forma for acquisition of Signature Systems completed in February 2024. Total Revenue ($ Millions)
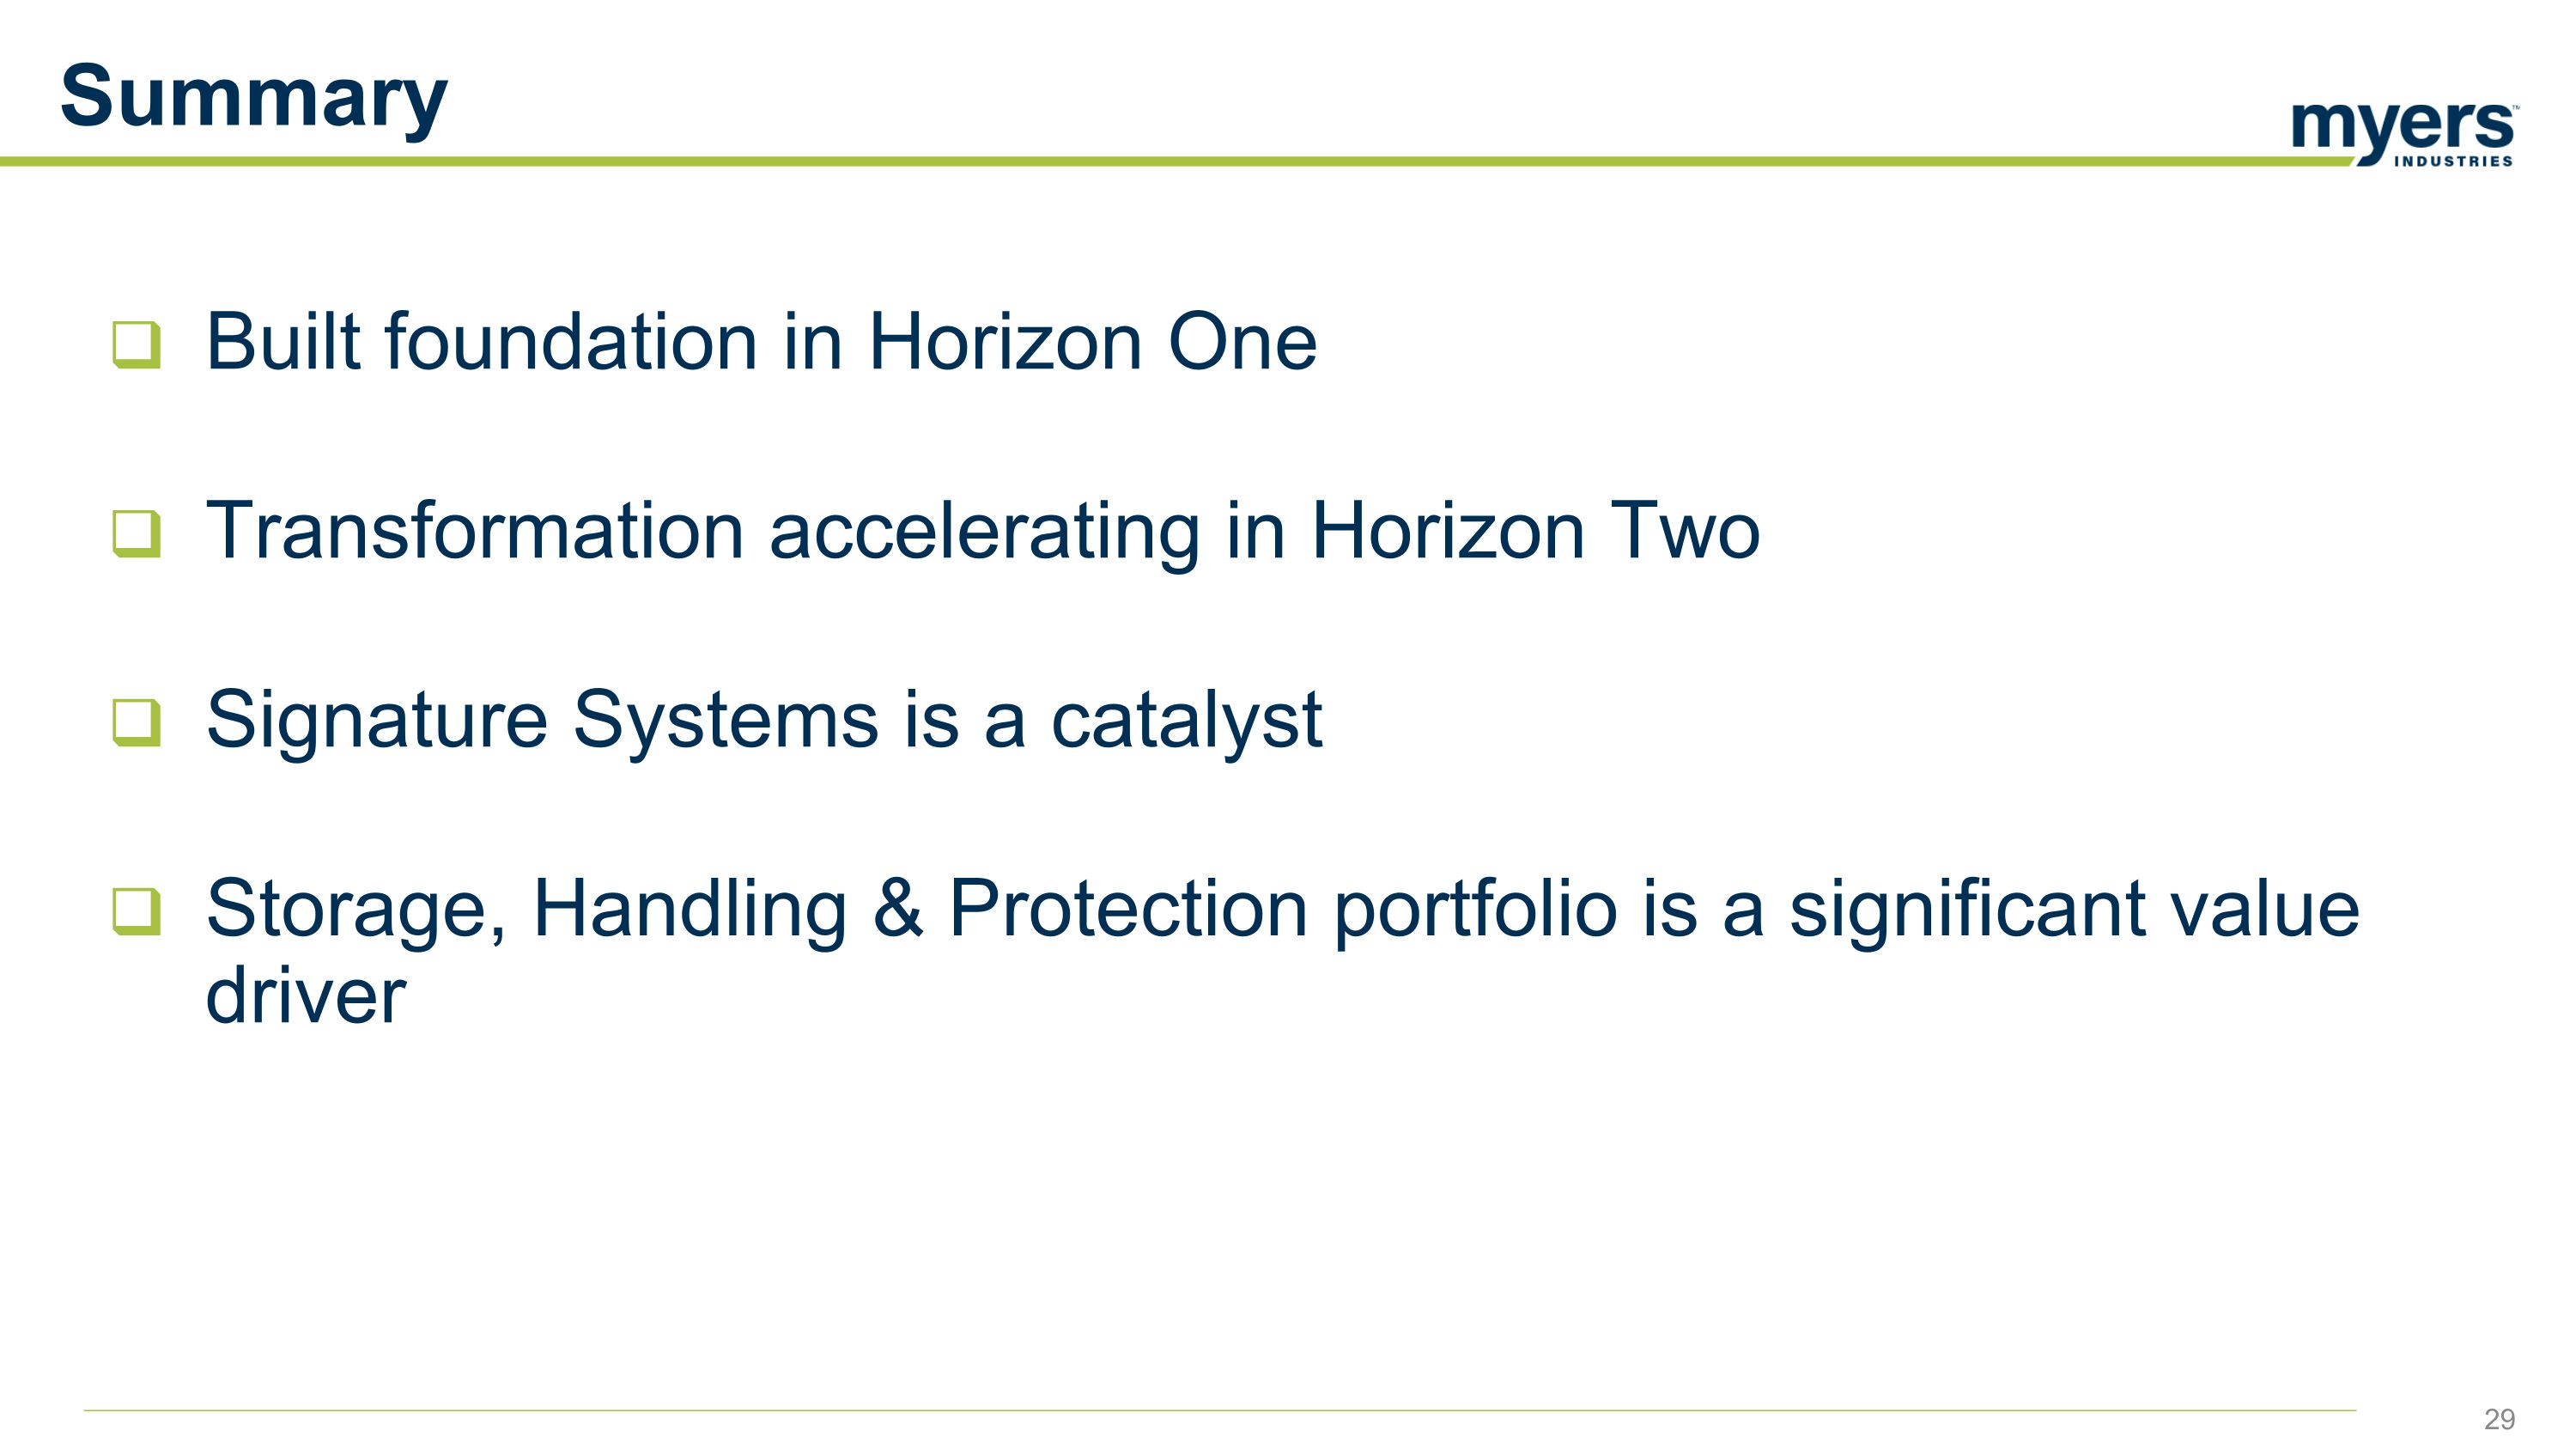
Summary Built foundation in Horizon One Transformation accelerating in Horizon Two Signature Systems is a catalyst Storage, Handling & Protection portfolio is a significant value driver
30 Financials Grant Fitz, EVP & Chief Financial Officer
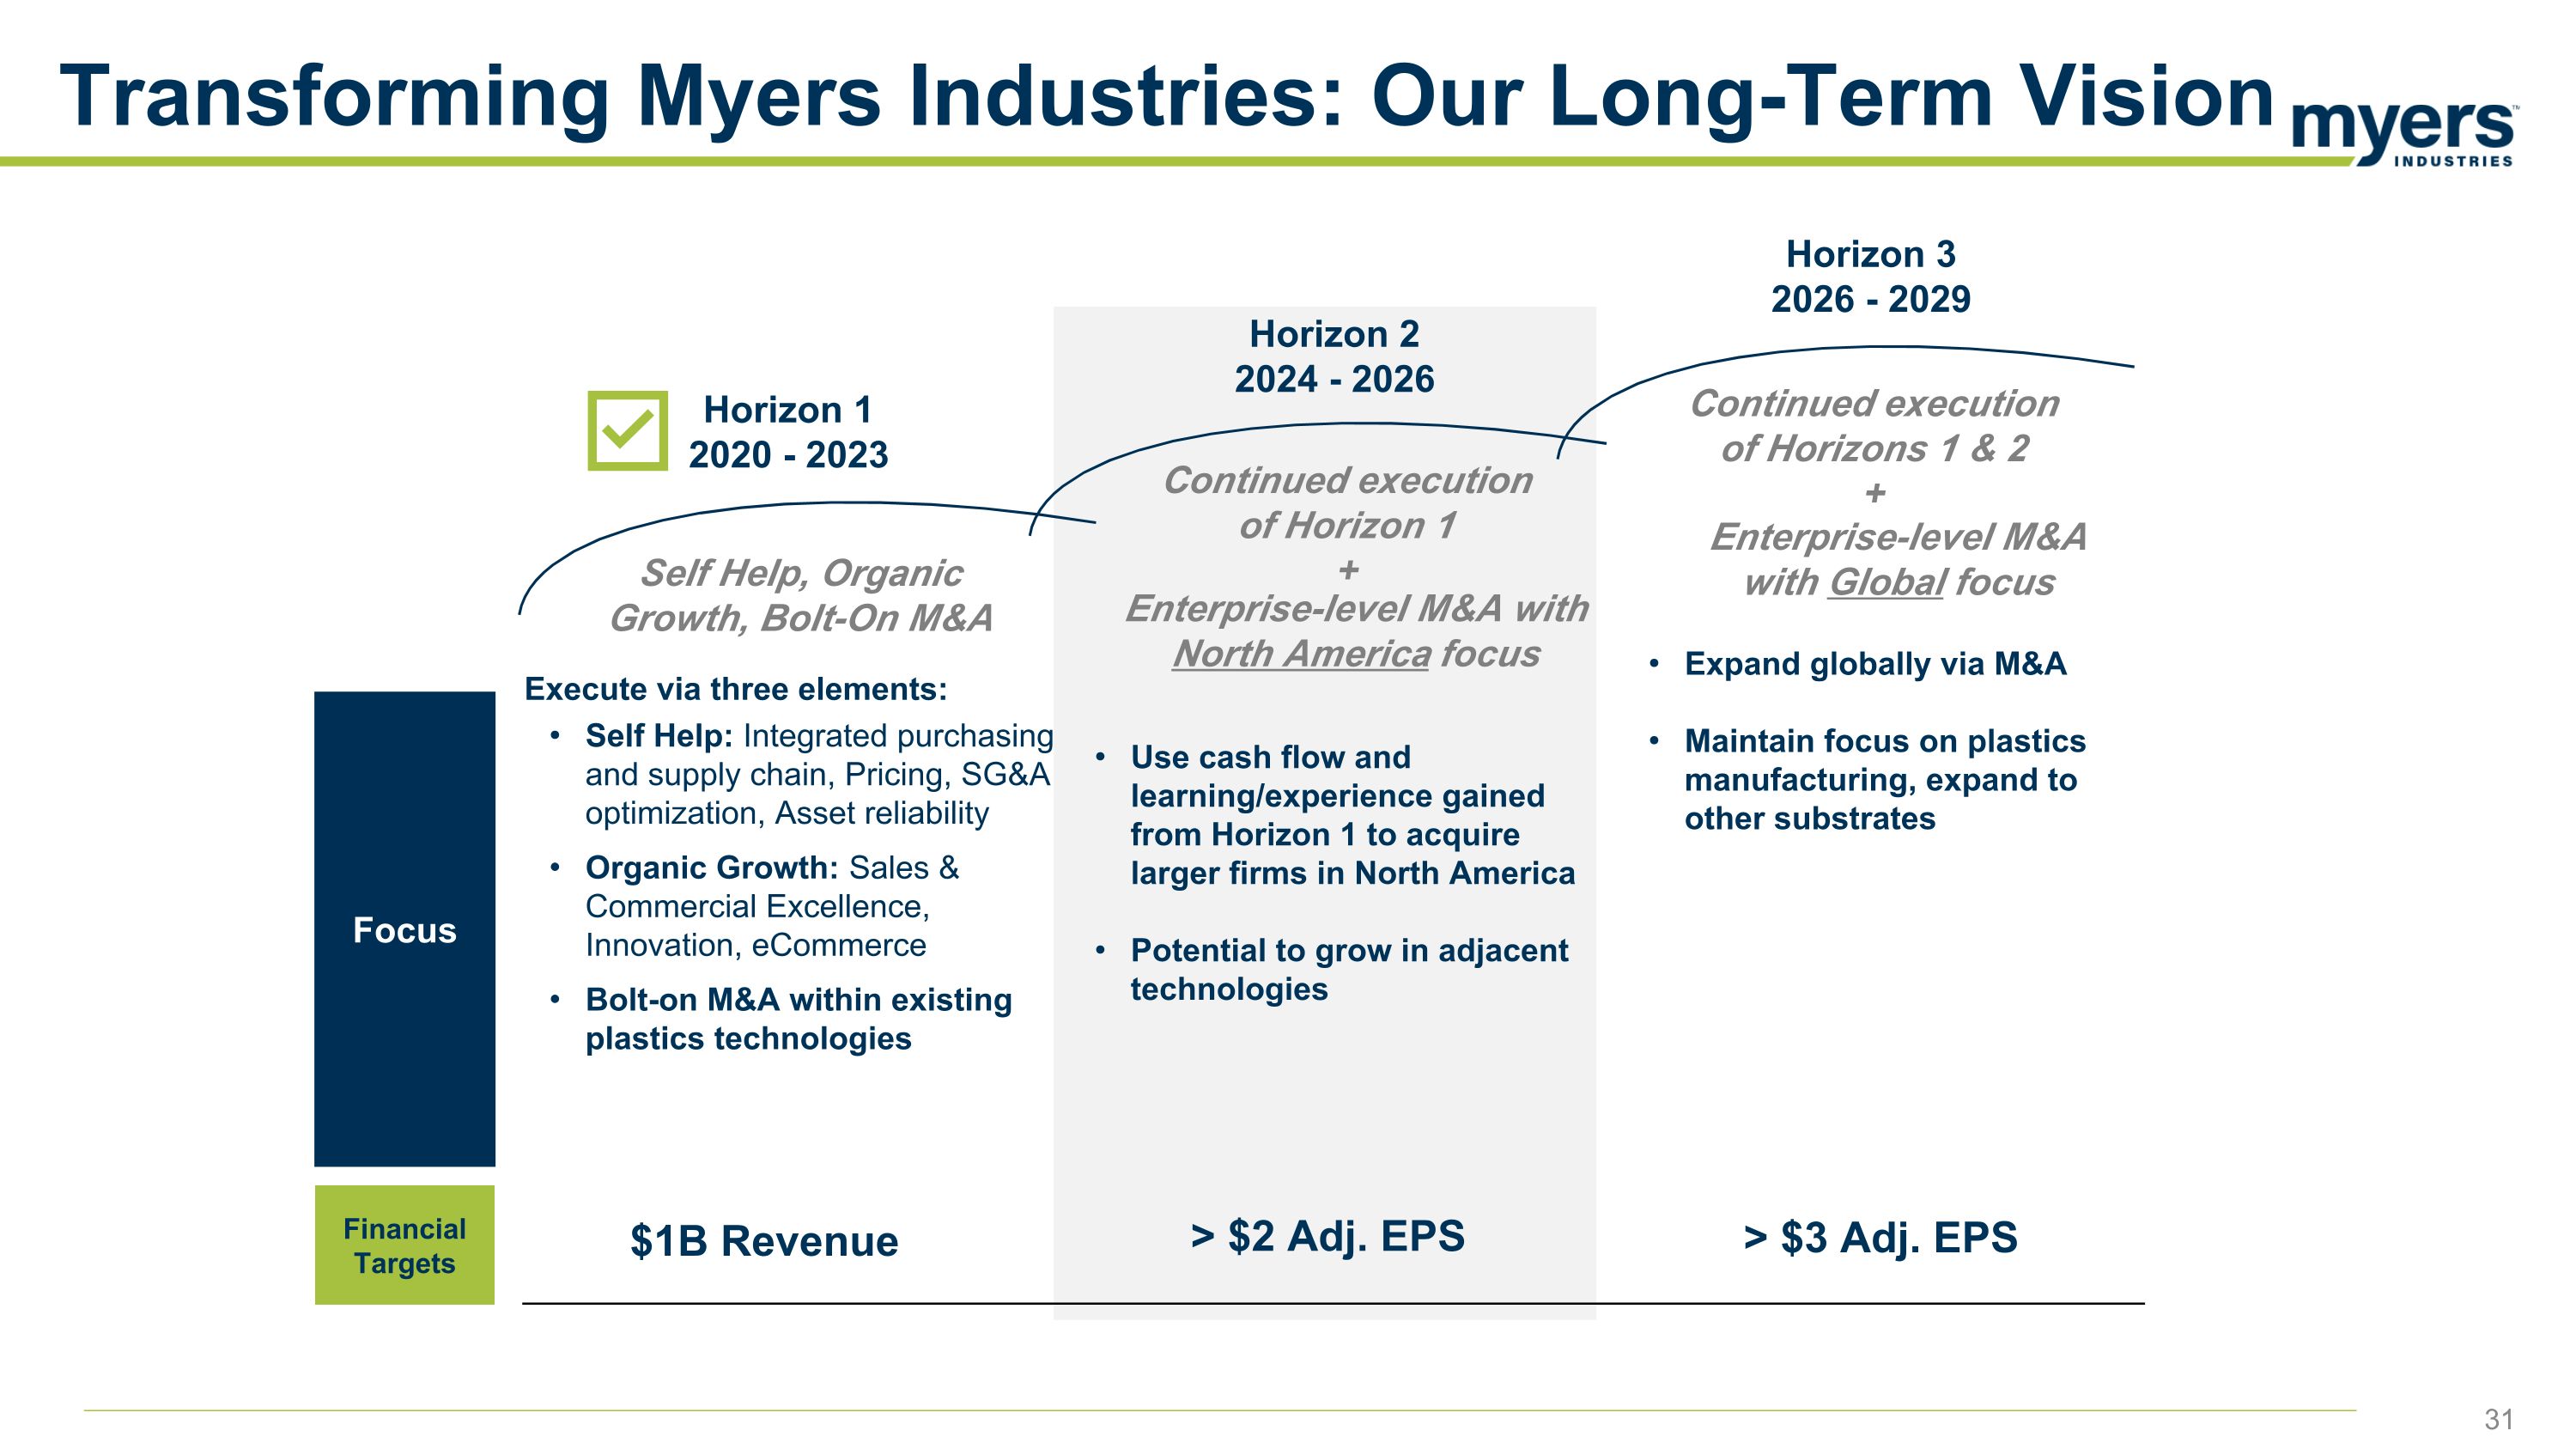
Horizon 1 2020 - 2023 Horizon 2 2024 - 2026 Horizon 3 2026 - 2029 Focus Financial Targets Execute via three elements: Self Help: Integrated purchasing and supply chain, Pricing, SG&A optimization, Asset reliability Organic Growth: Sales & Commercial Excellence, Innovation, eCommerce Bolt-on M&A within existing plastics technologies $1B Revenue Use cash flow and learning/experience gained from Horizon 1 to acquire larger firms in North America Potential to grow in adjacent technologies Expand globally via M&A Maintain focus on plastics manufacturing, expand to other substrates Self Help, Organic Growth, Bolt-On M&A Enterprise-level M&A with North America focus Enterprise-level M&A with Global focus Continued execution of Horizon 1 + Continued execution of Horizons 1 & 2 + Transforming Myers Industries: Our Long-Term Vision > $2 Adj. EPS > $3 Adj. EPS
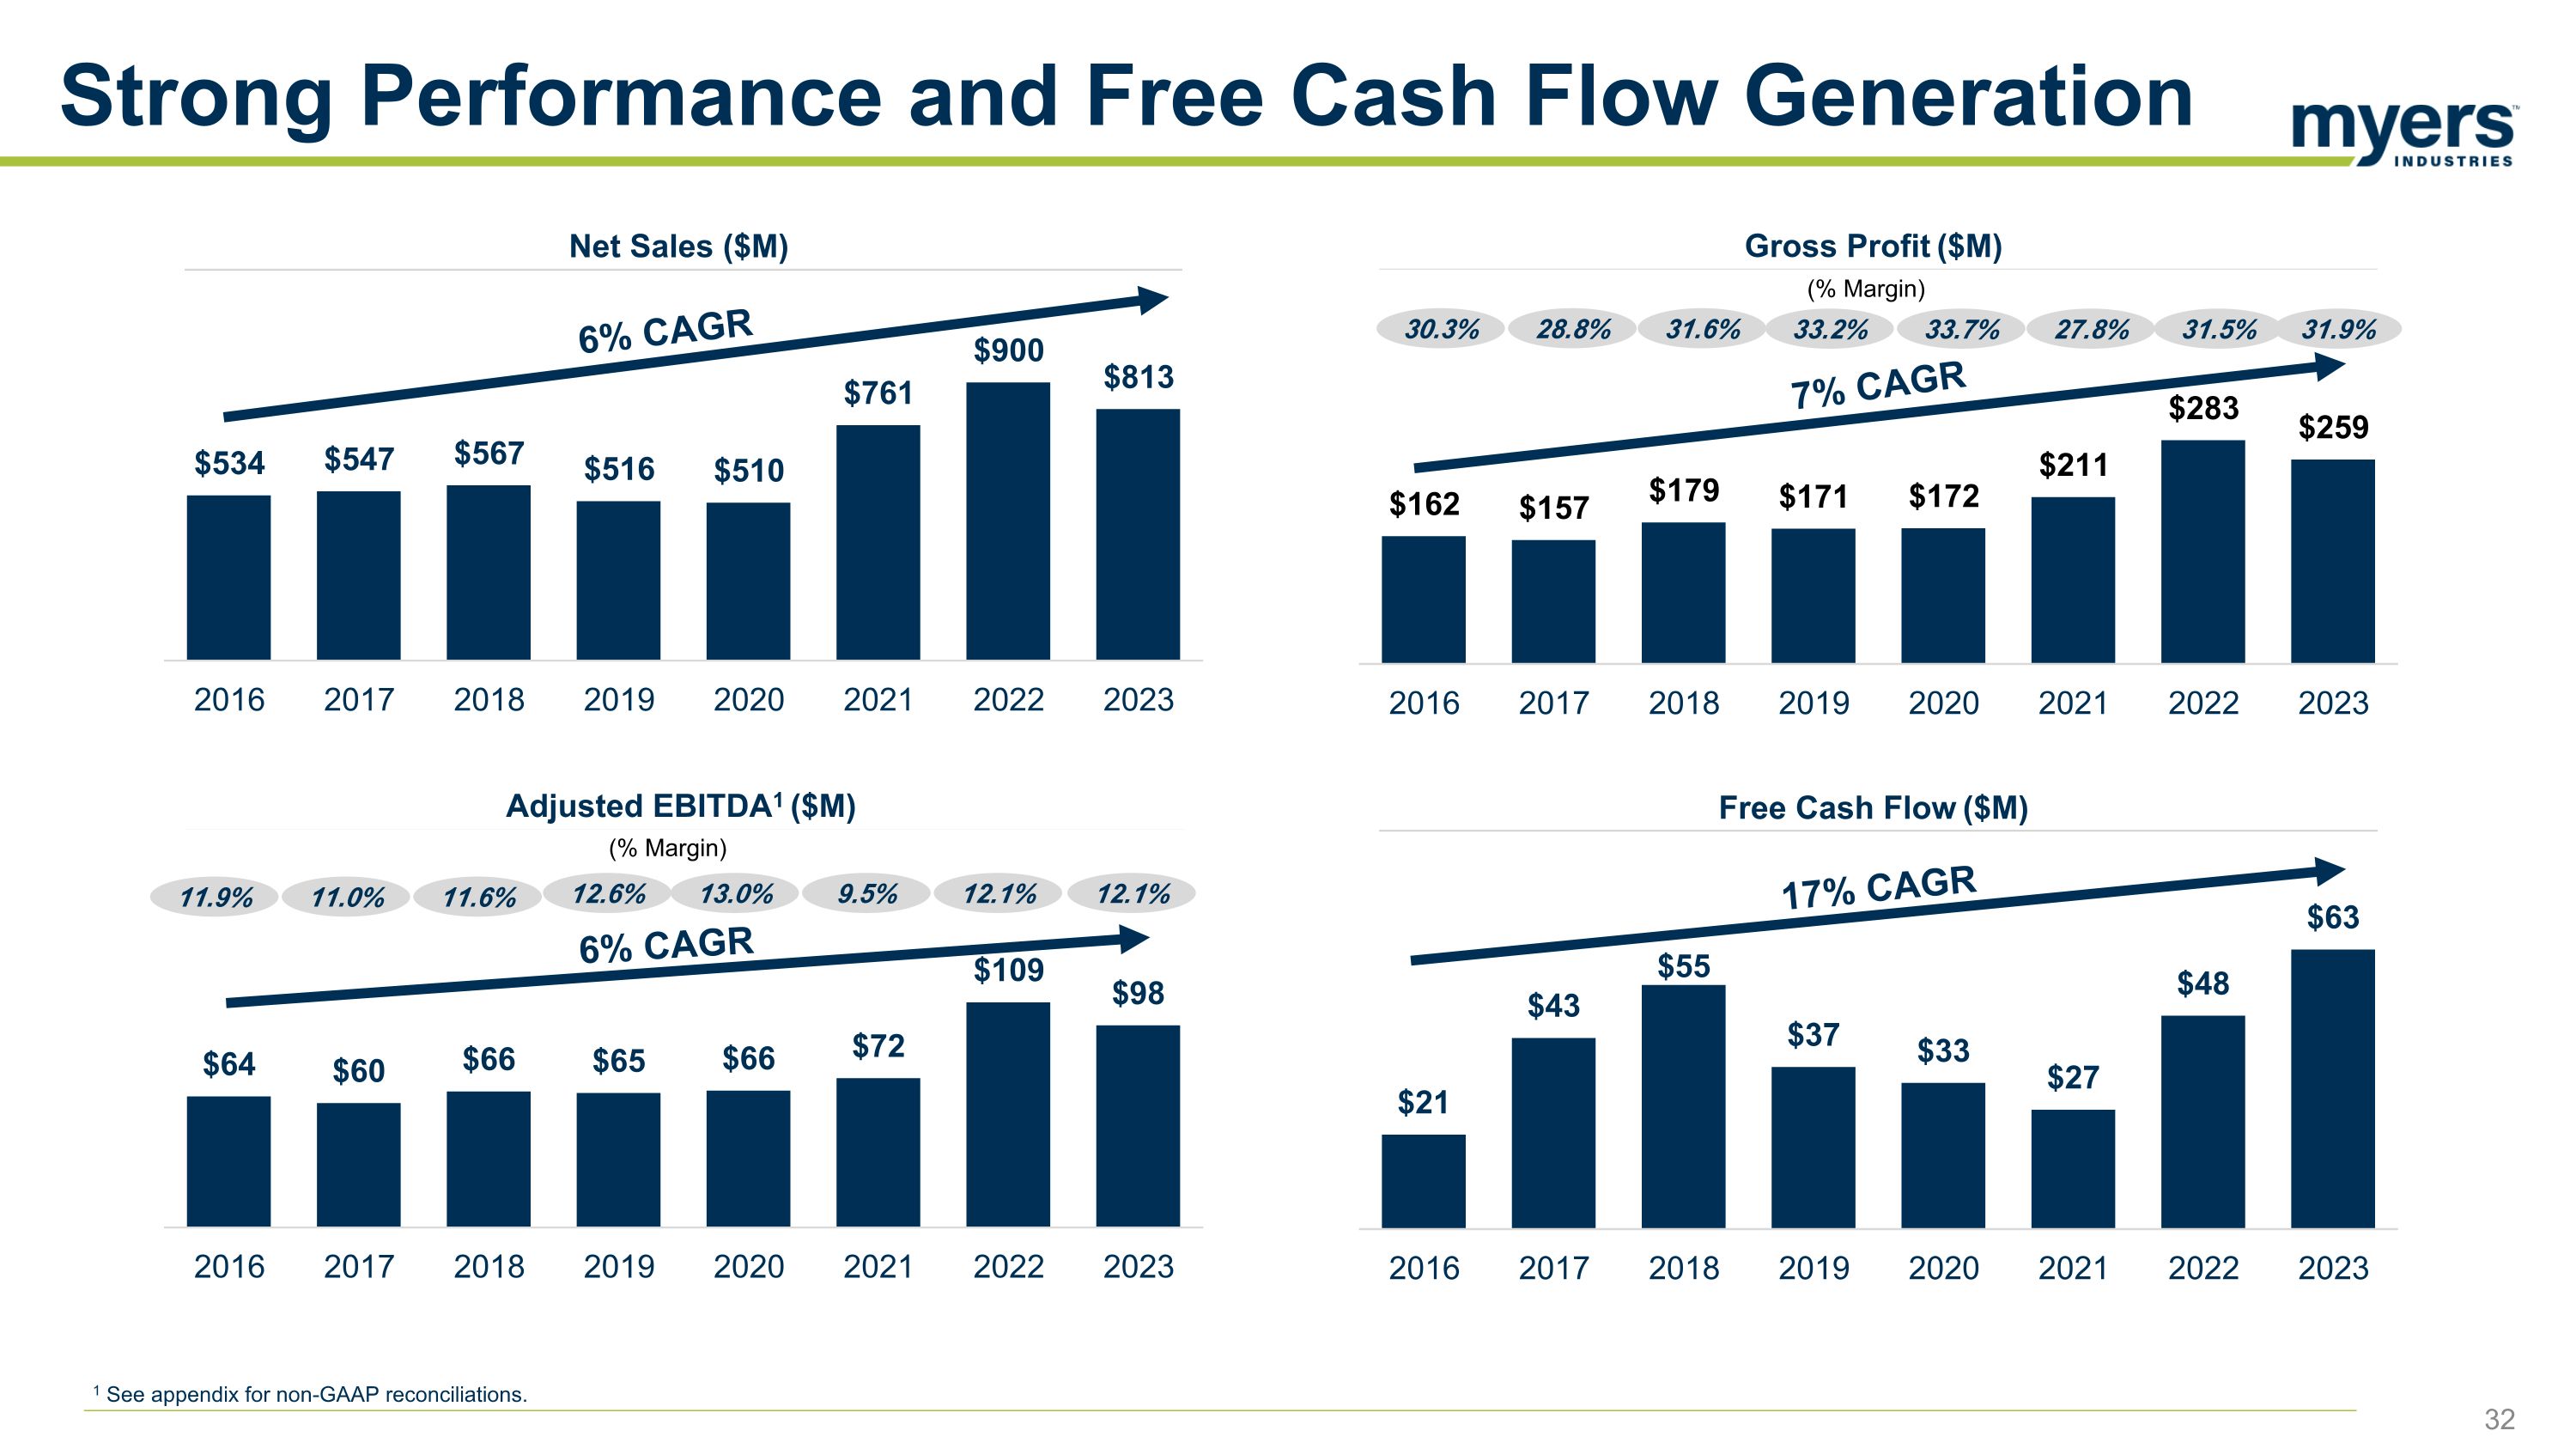
Strong Performance and Free Cash Flow Generation Gross Profit ($M) Free Cash Flow ($M) (% Margin) 33.2% 33.7% 27.8% 31.5% 31.9% 1 See appendix for non-GAAP reconciliations. Net Sales ($M) 6% CAGR 7% CAGR 17% CAGR 30.3% 28.8% 31.6% Adjusted EBITDA1 ($M) 12.6% 13.0% 9.5% 12.1% 12.1% (% Margin) 6% CAGR 11.9% 11.0% 11.6%
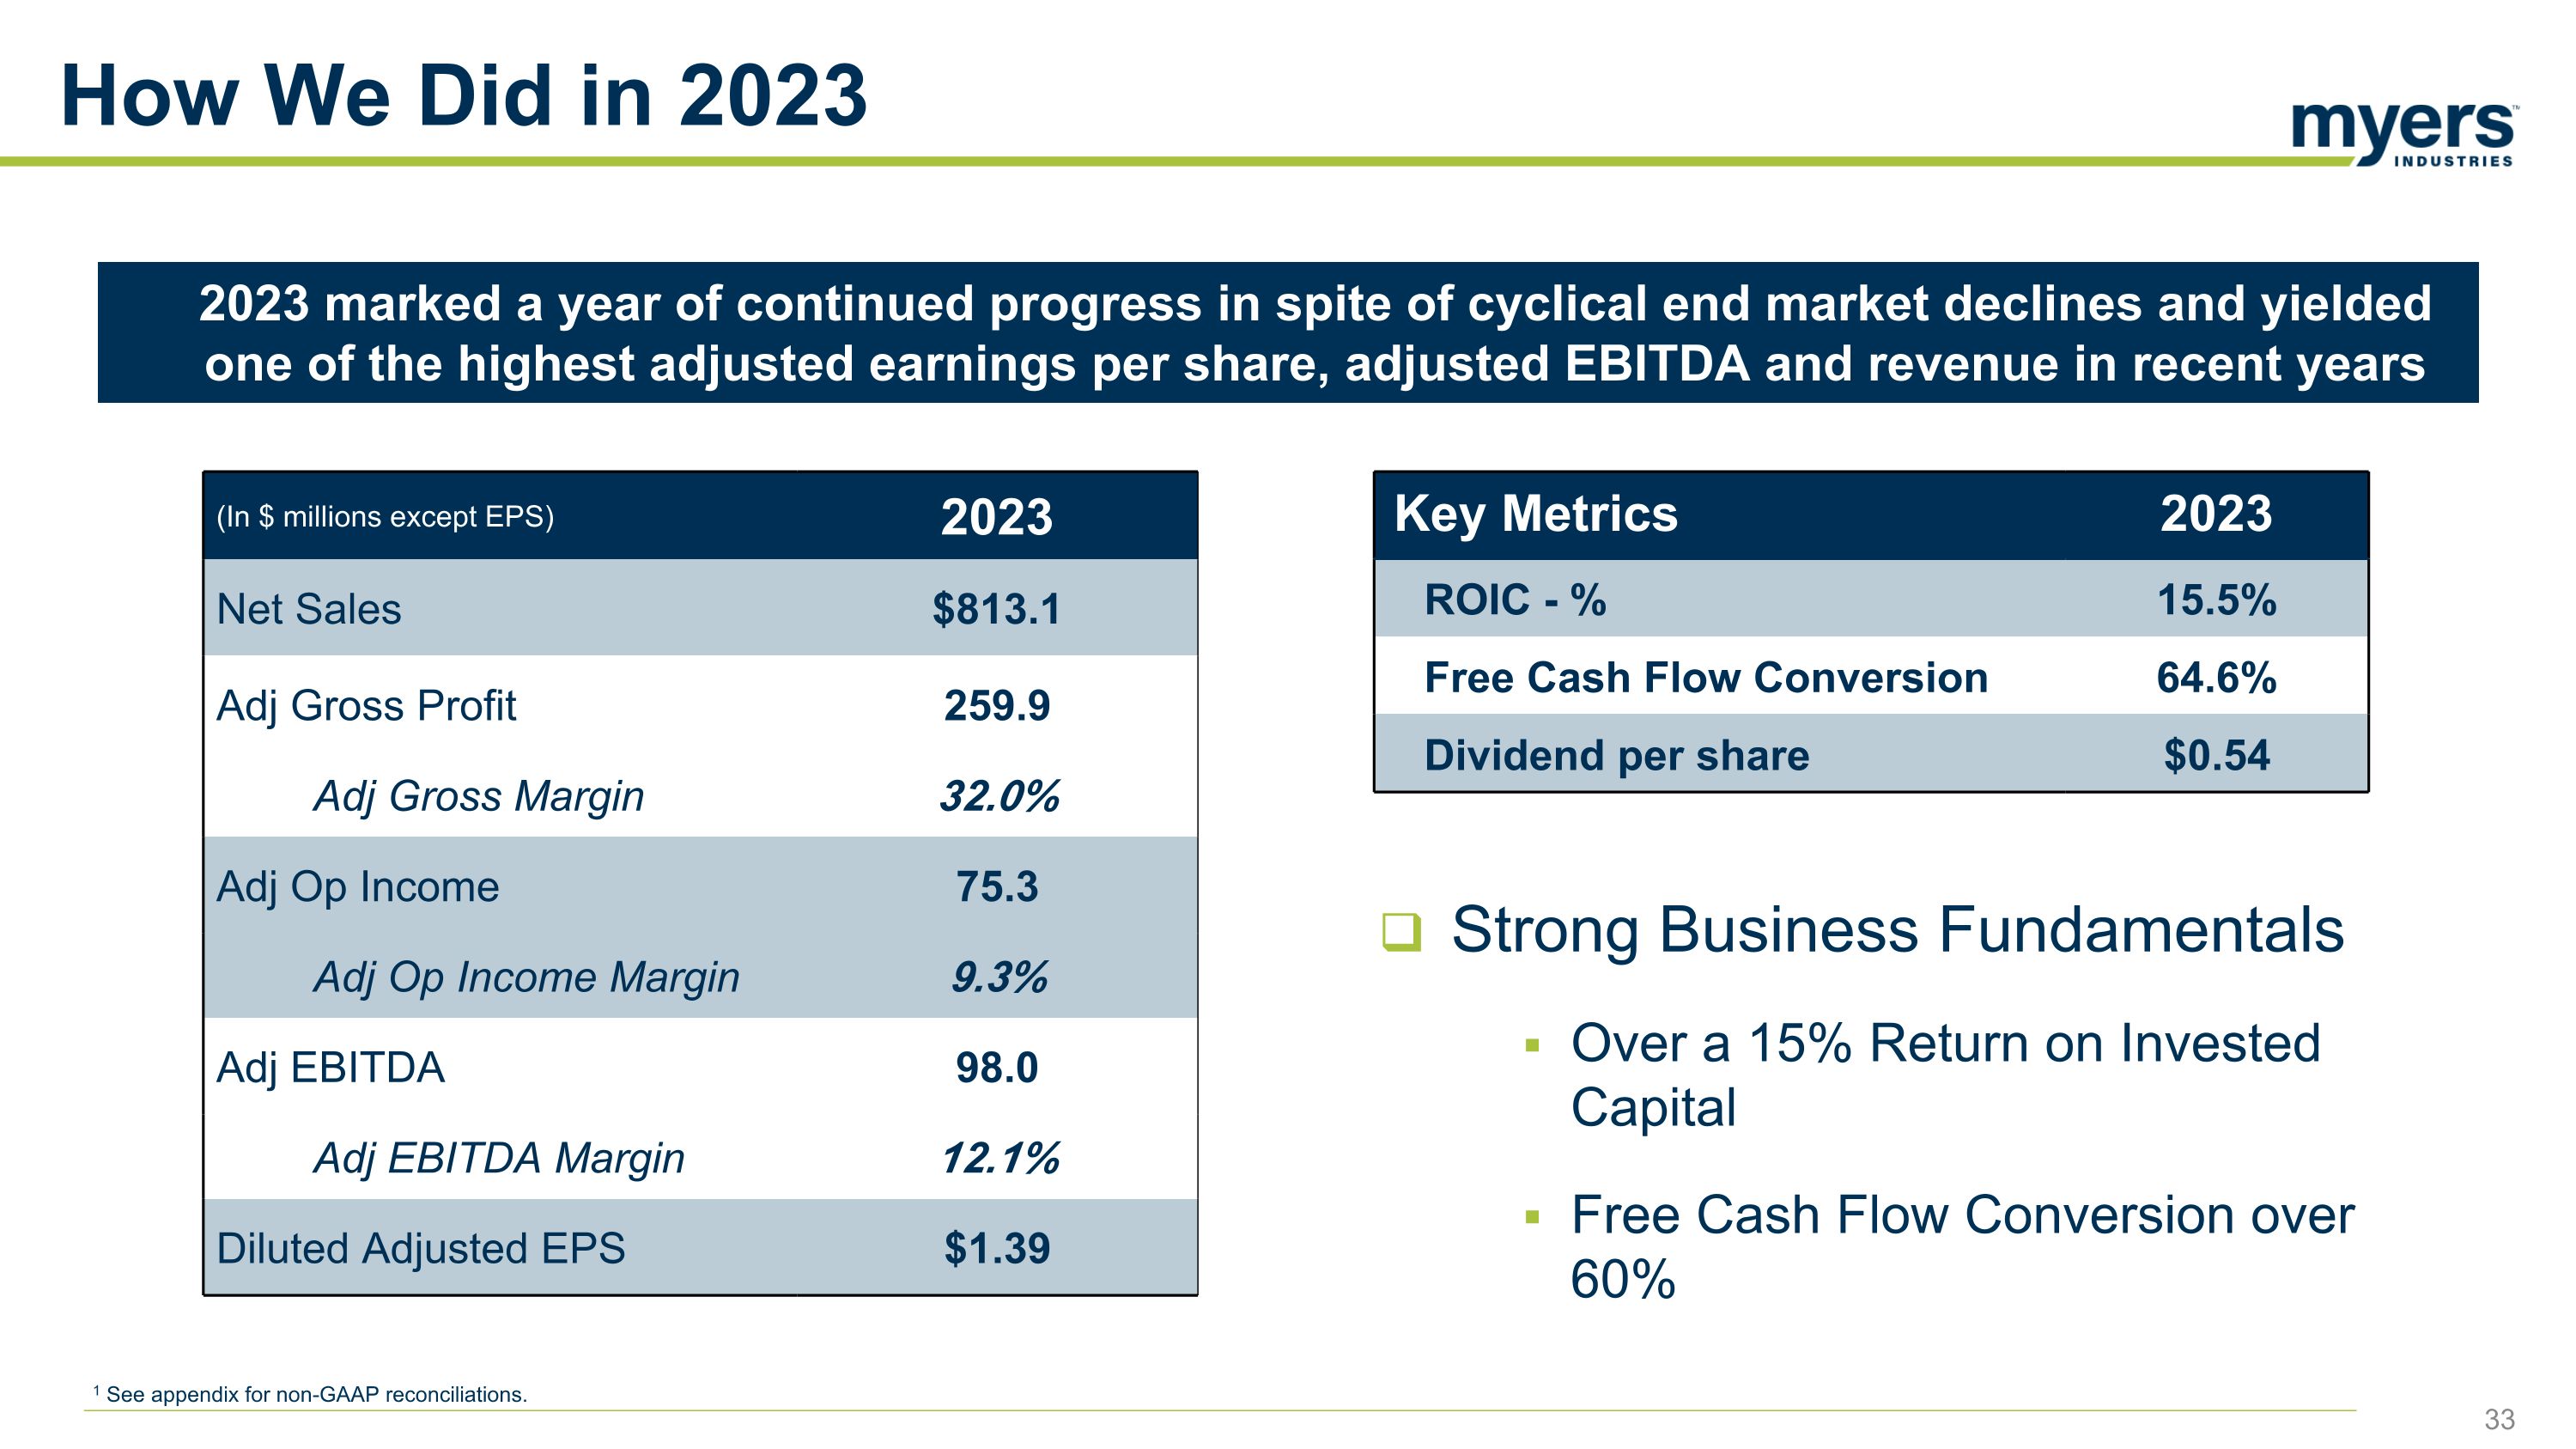
(In $ millions except EPS) 2023 Net Sales $813.1 Adj Gross Profit 259.9 Adj Gross Margin 32.0% Adj Op Income 75.3 Adj Op Income Margin 9.3% Adj EBITDA 98.0 Adj EBITDA Margin 12.1% Diluted Adjusted EPS $1.39 Key Metrics 2023 ROIC - % 15.5% Free Cash Flow Conversion 64.6% Dividend per share $0.54 2023 marked a year of continued progress in spite of cyclical end market declines and yielded one of the highest adjusted earnings per share, adjusted EBITDA and revenue in recent years Strong Business Fundamentals Over a 15% Return on Invested Capital Free Cash Flow Conversion over 60% How We Did in 2023 1 See appendix for non-GAAP reconciliations.
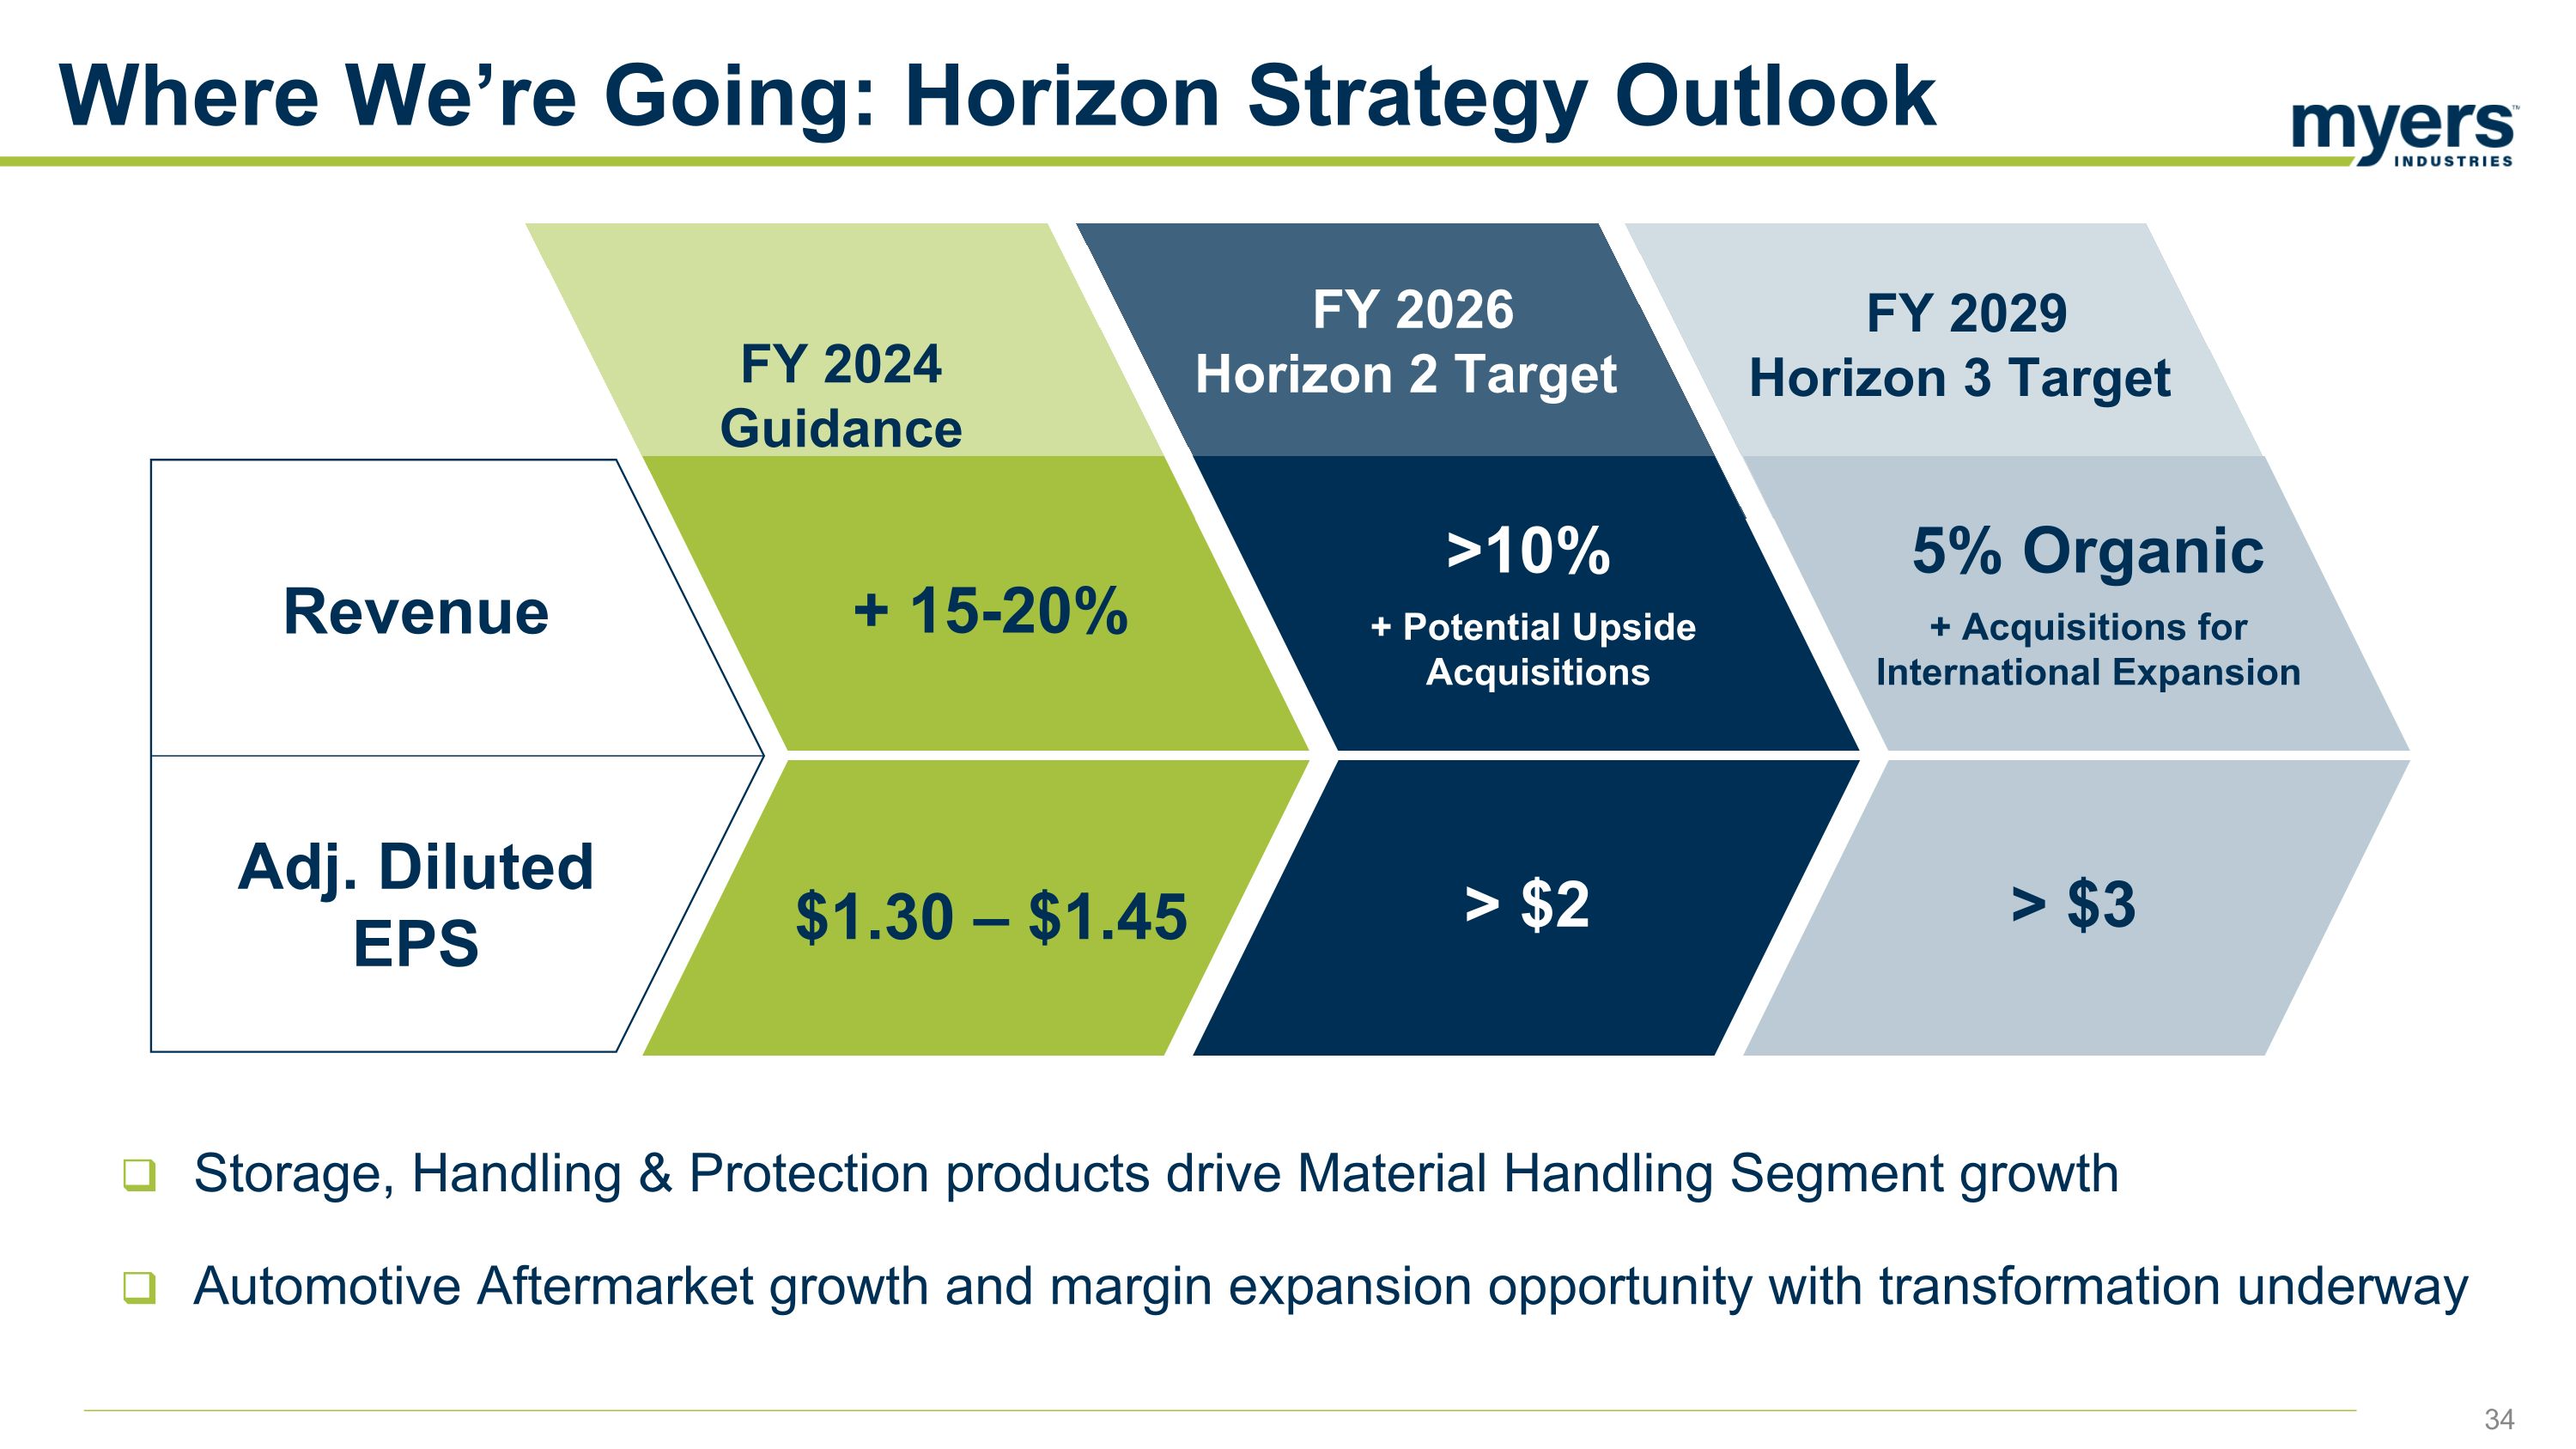
Where We’re Going: Horizon Strategy Outlook Storage, Handling & Protection products drive Material Handling Segment growth Automotive Aftermarket growth and margin expansion opportunity with transformation underway FY 2024 Guidance FY 2029 Horizon 3 Target + 15-20% $1.30 – $1.45 >10% + Potential Upside Acquisitions > $2 5% Organic + Acquisitions for International Expansion FY 2026 Horizon 2 Target > $3 Revenue Adj. Diluted EPS
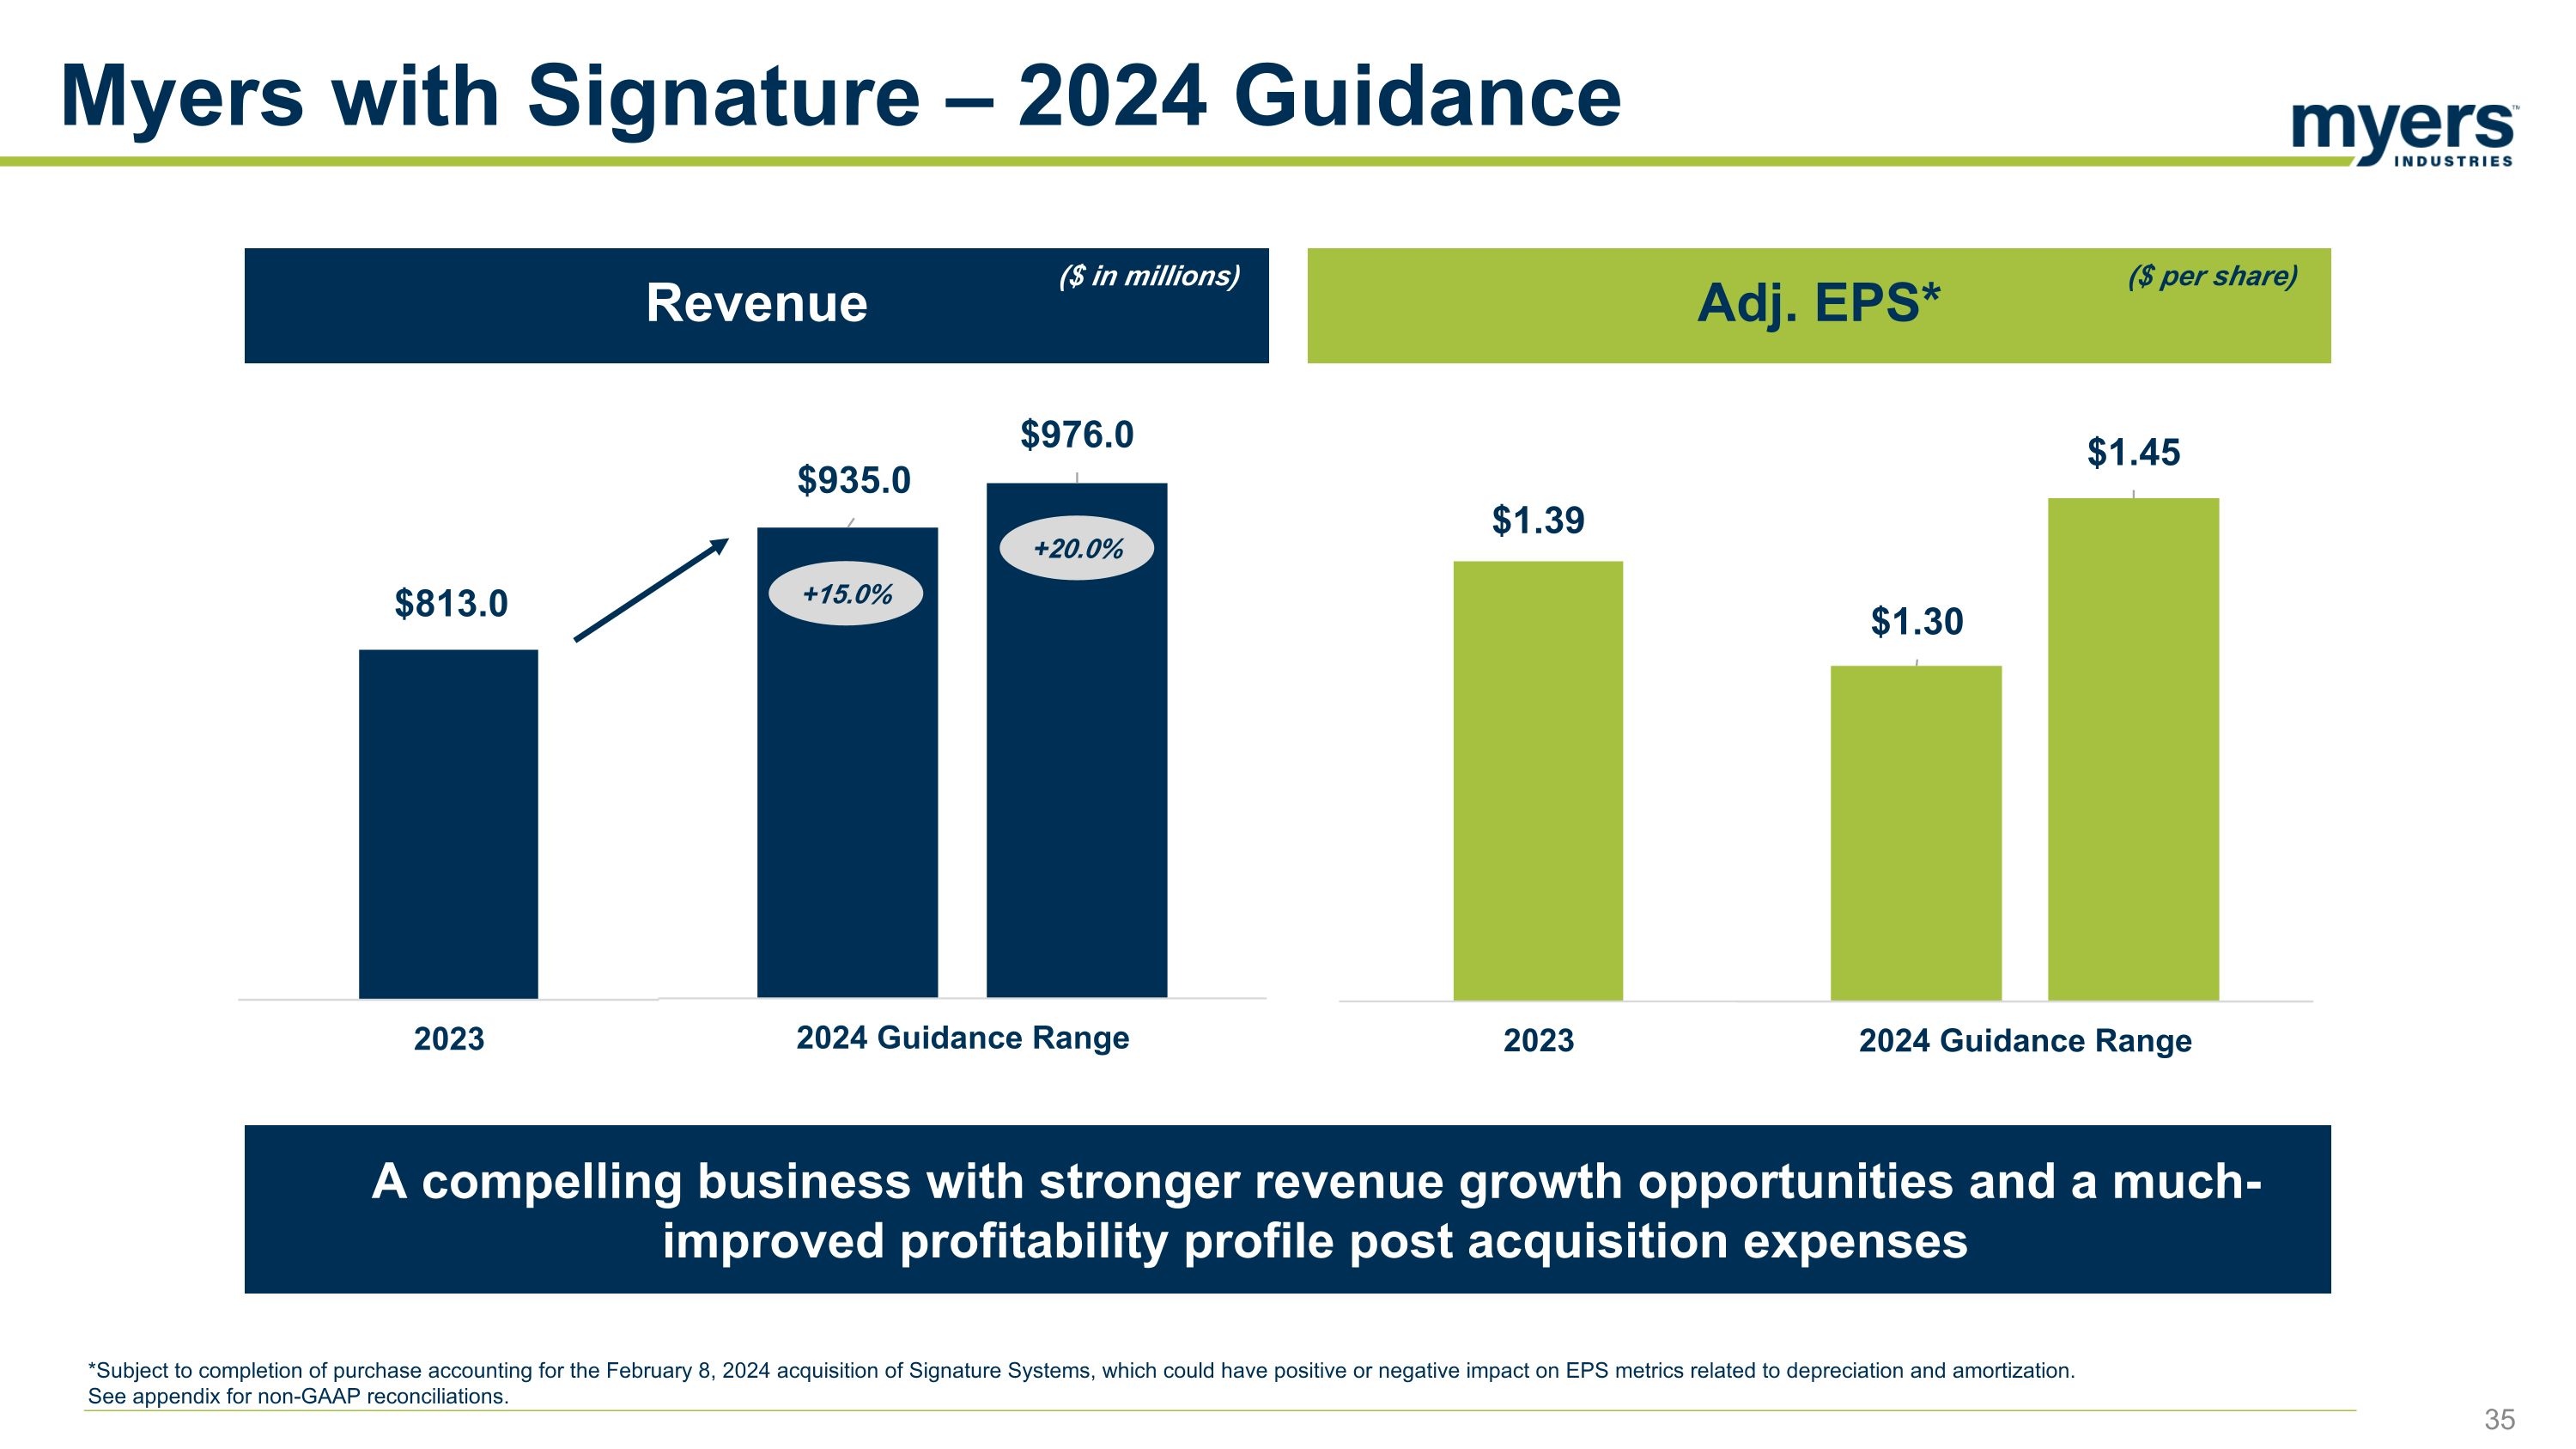
Myers with Signature – 2024 Guidance A compelling business with stronger revenue growth opportunities and a much-improved profitability profile post acquisition expenses Revenue Adj. EPS* +15.0% +20.0% ($ in millions) ($ per share) *Subject to completion of purchase accounting for the February 8, 2024 acquisition of Signature Systems, which could have positive or negative impact on EPS metrics related to depreciation and amortization. See appendix for non-GAAP reconciliations.
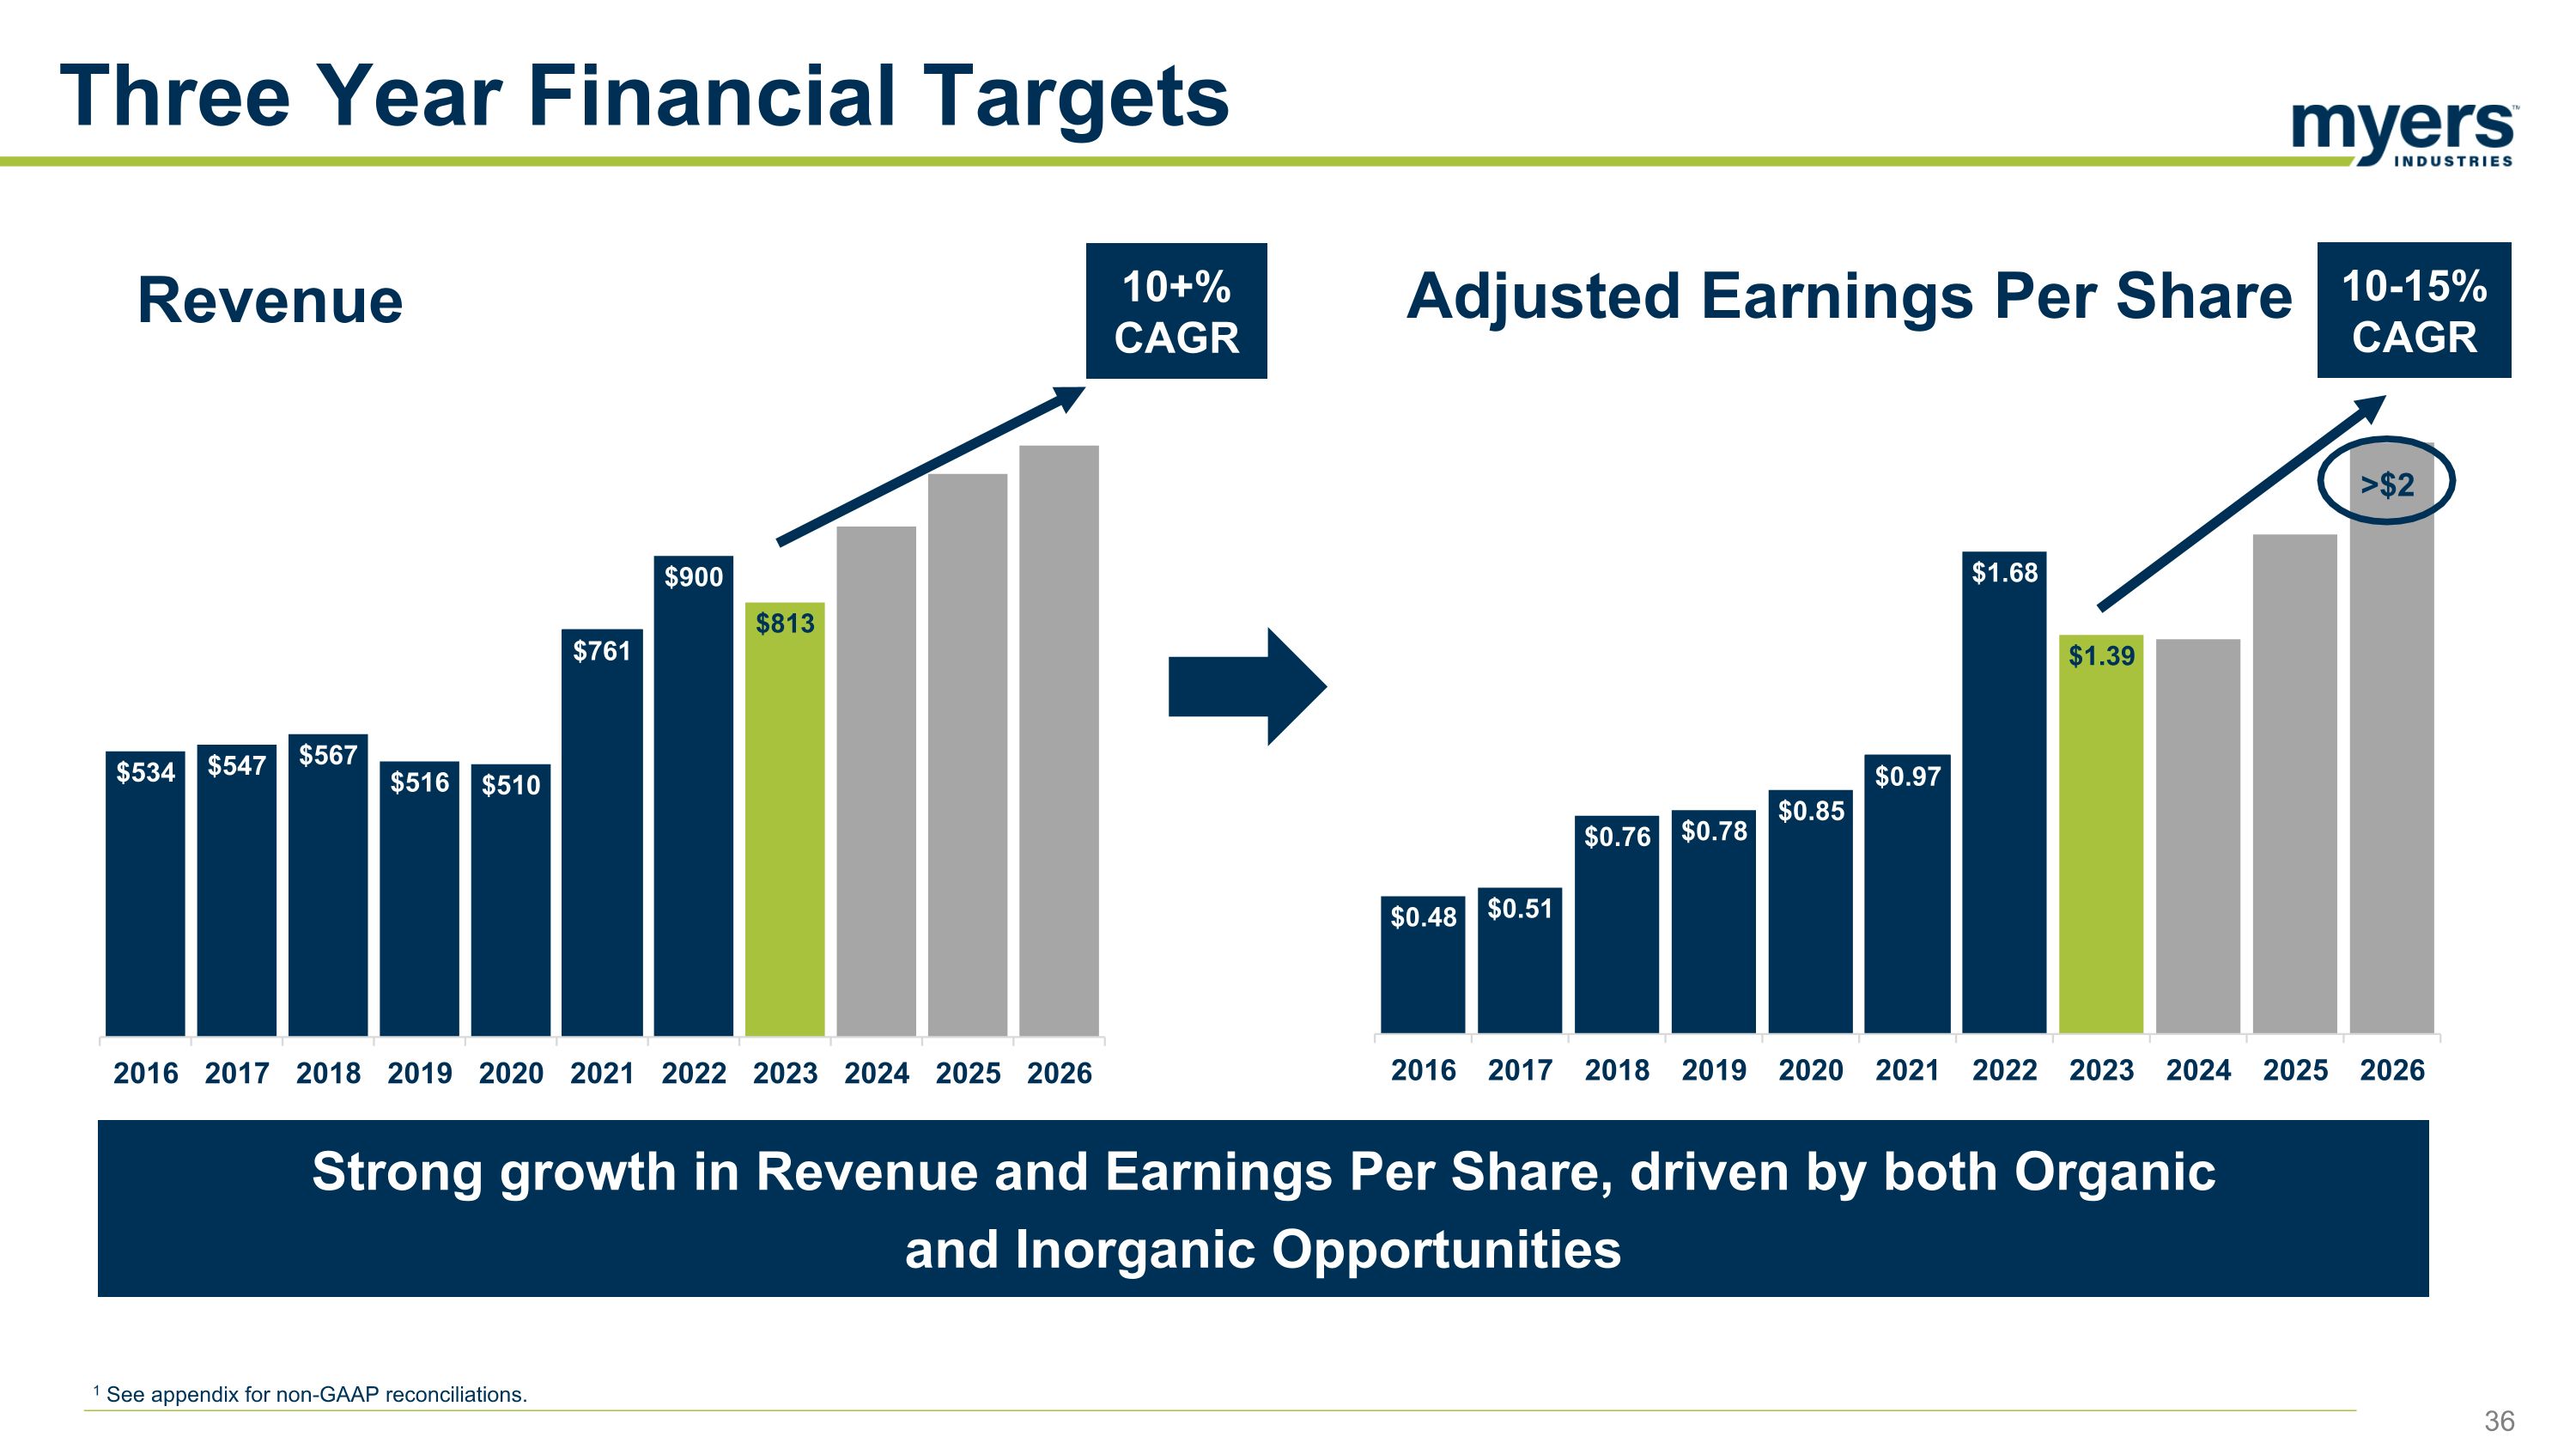
Three Year Financial Targets Adjusted Earnings Per Share Revenue 10+% CAGR 10-15% CAGR Strong growth in Revenue and Earnings Per Share, driven by both Organic and Inorganic Opportunities 1 See appendix for non-GAAP reconciliations. 36
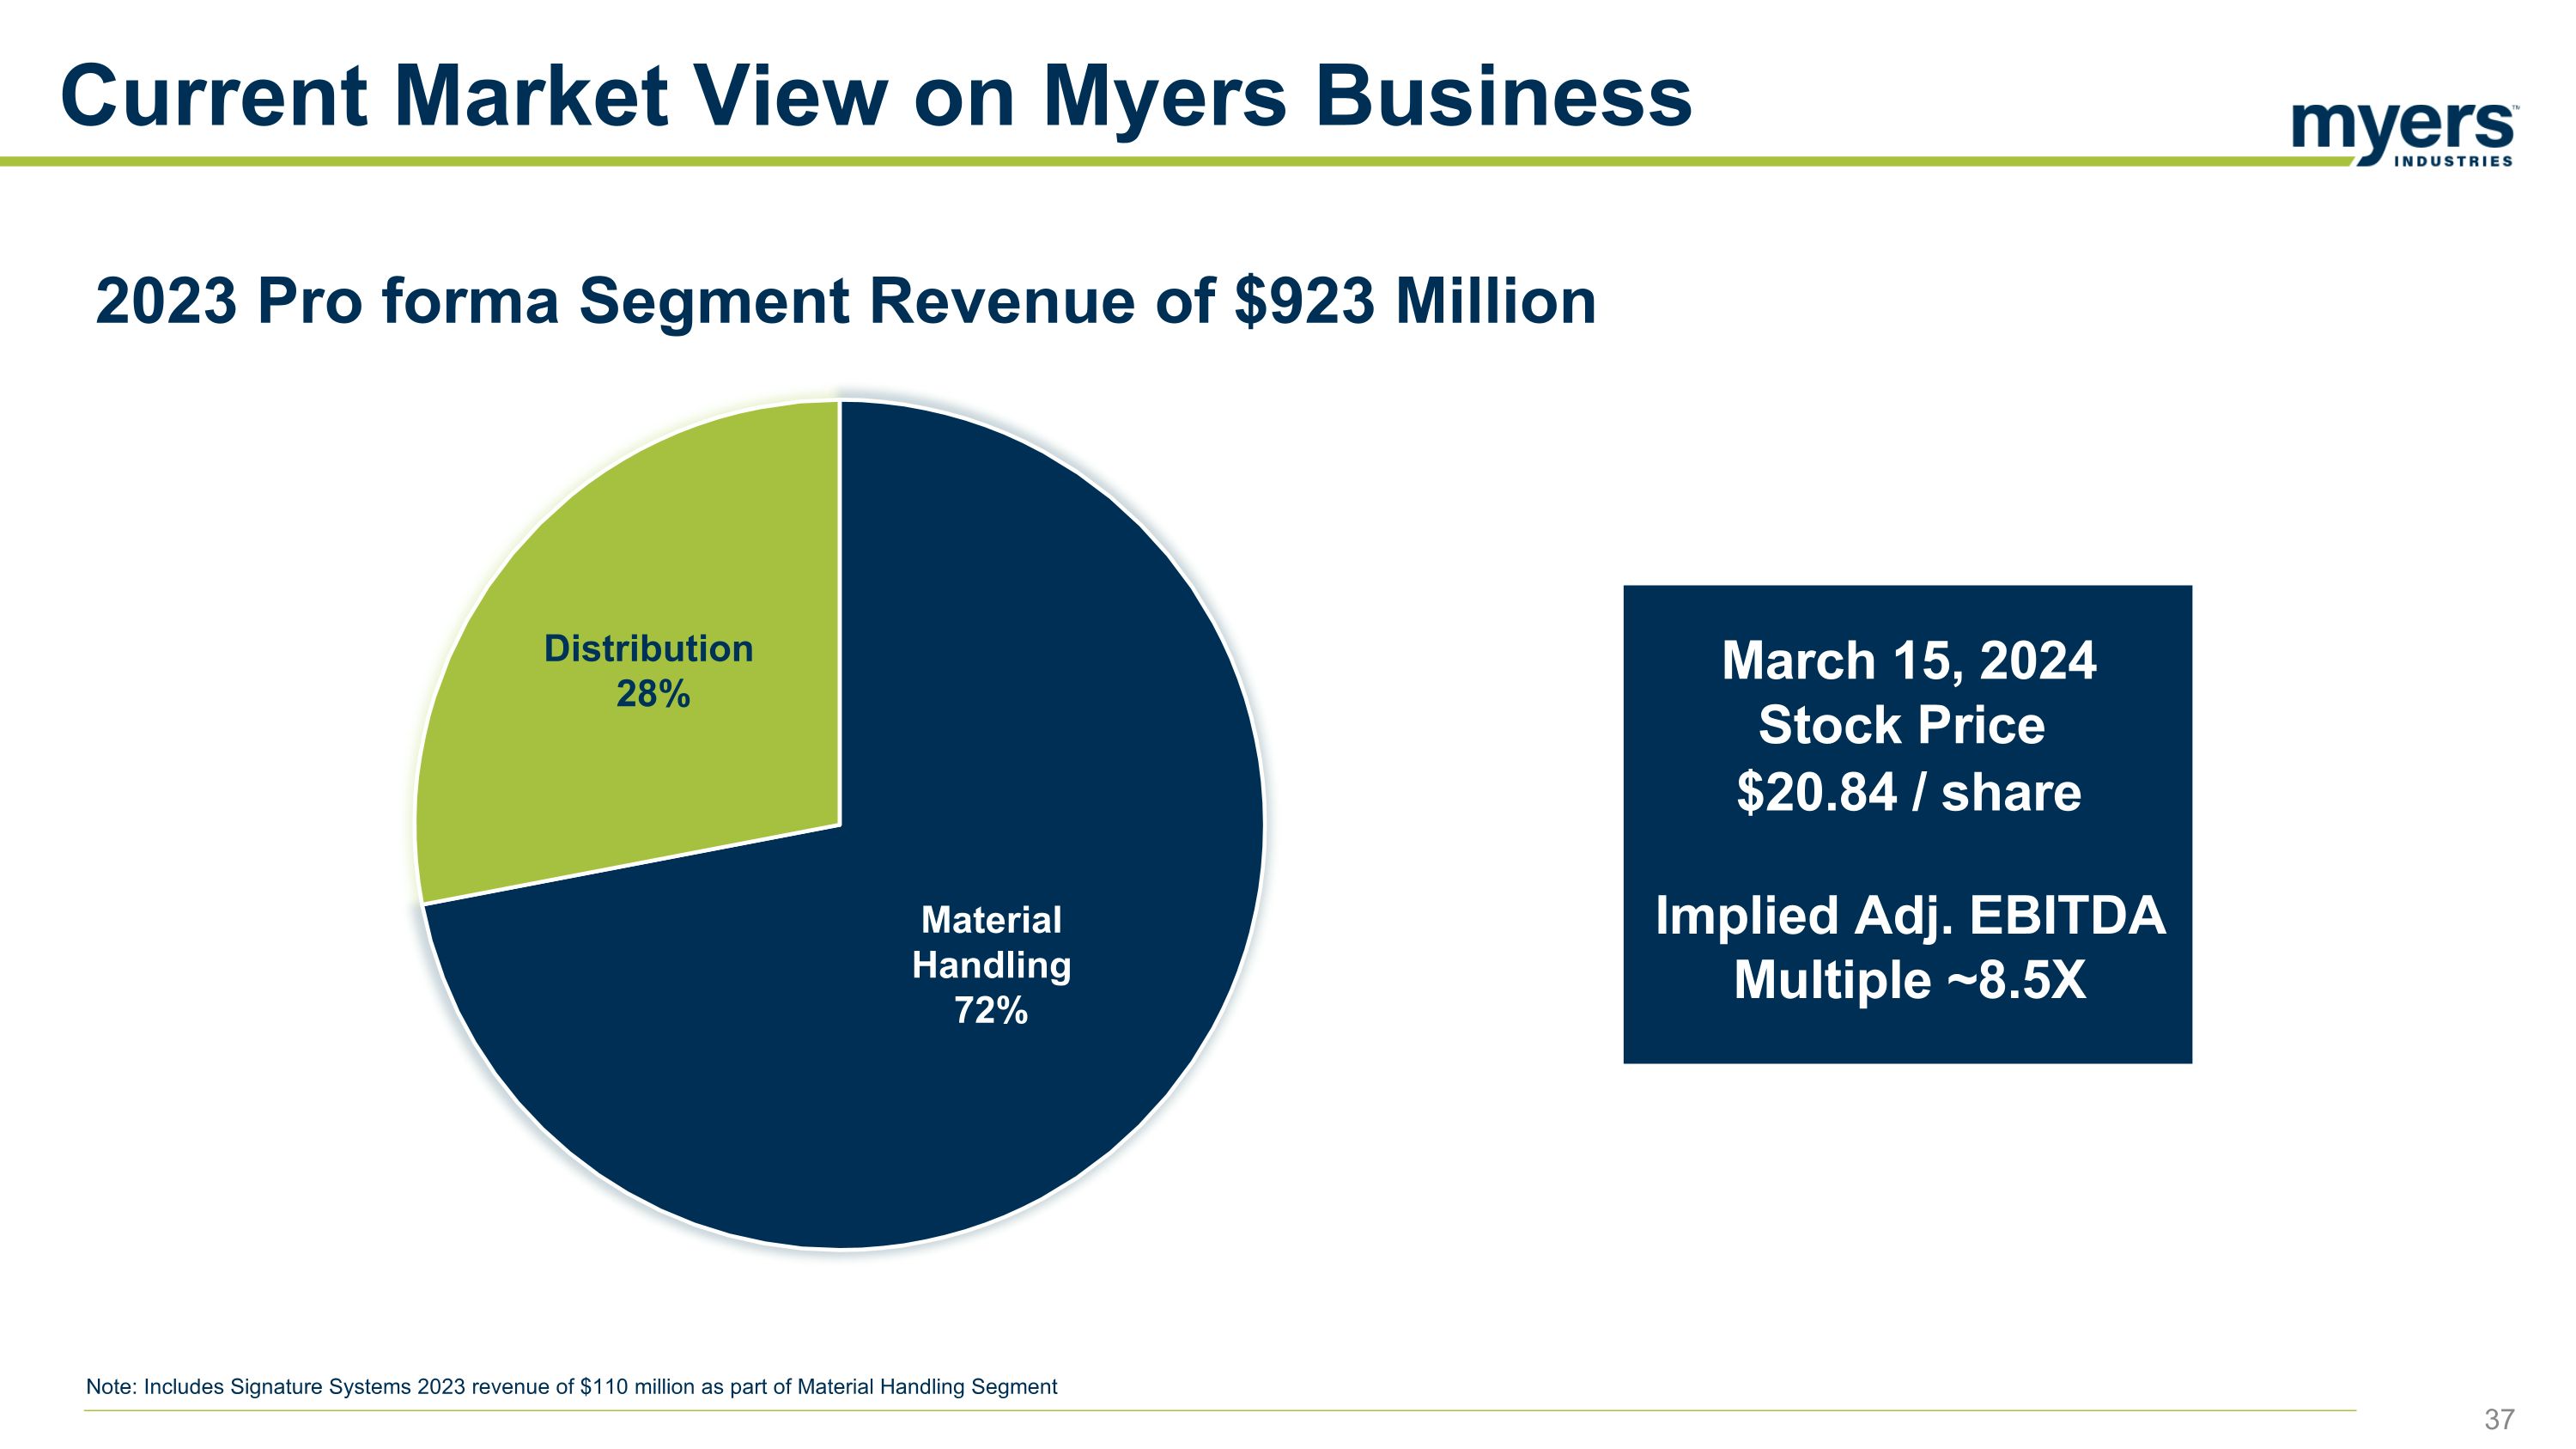
Current Market View on Myers Business March 15, 2024 Stock Price $20.84 / share Implied Adj. EBITDA Multiple ~8.5X Note: Includes Signature Systems 2023 revenue of $110 million as part of Material Handling Segment 2023 Pro forma Segment Revenue of $923 Million
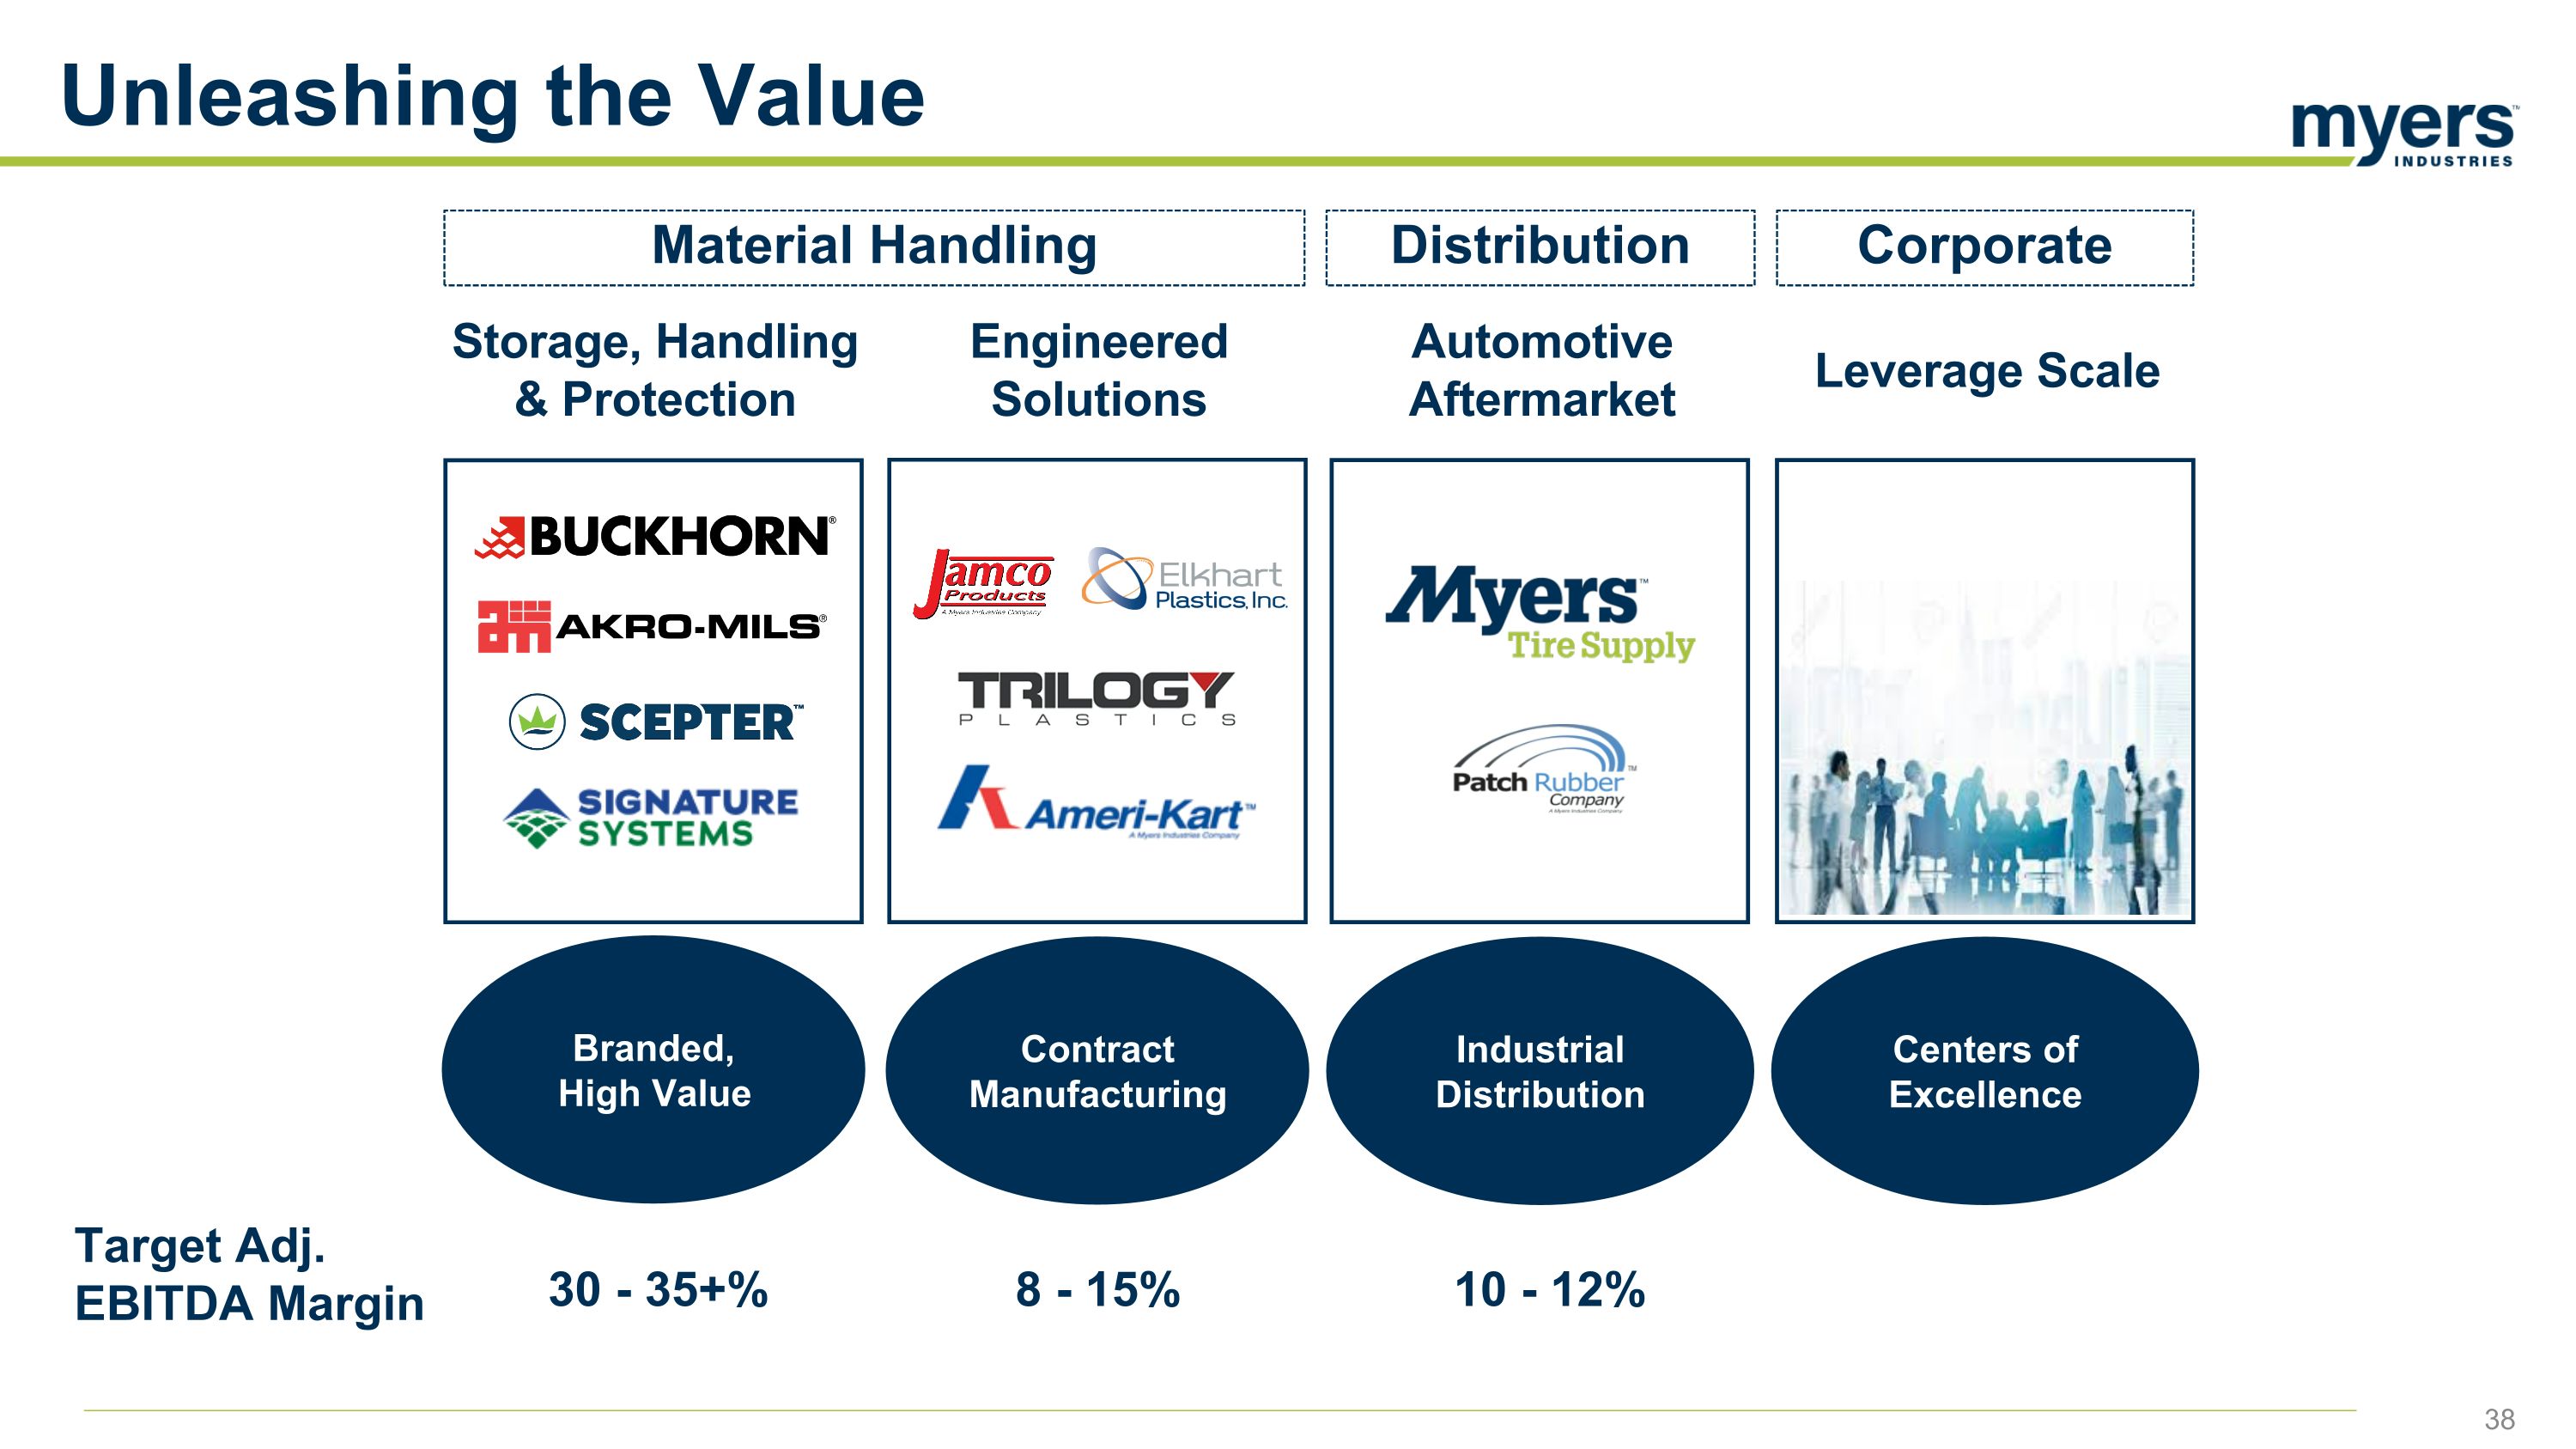
Unleashing the Value Material Handling Distribution Corporate Storage, Handling & Protection Engineered Solutions Automotive Aftermarket Leverage Scale Contract Manufacturing Industrial Distribution Centers of Excellence Target Adj. EBITDA Margin 30 - 35+% 10 - 12% 8 - 15% Branded, High Value
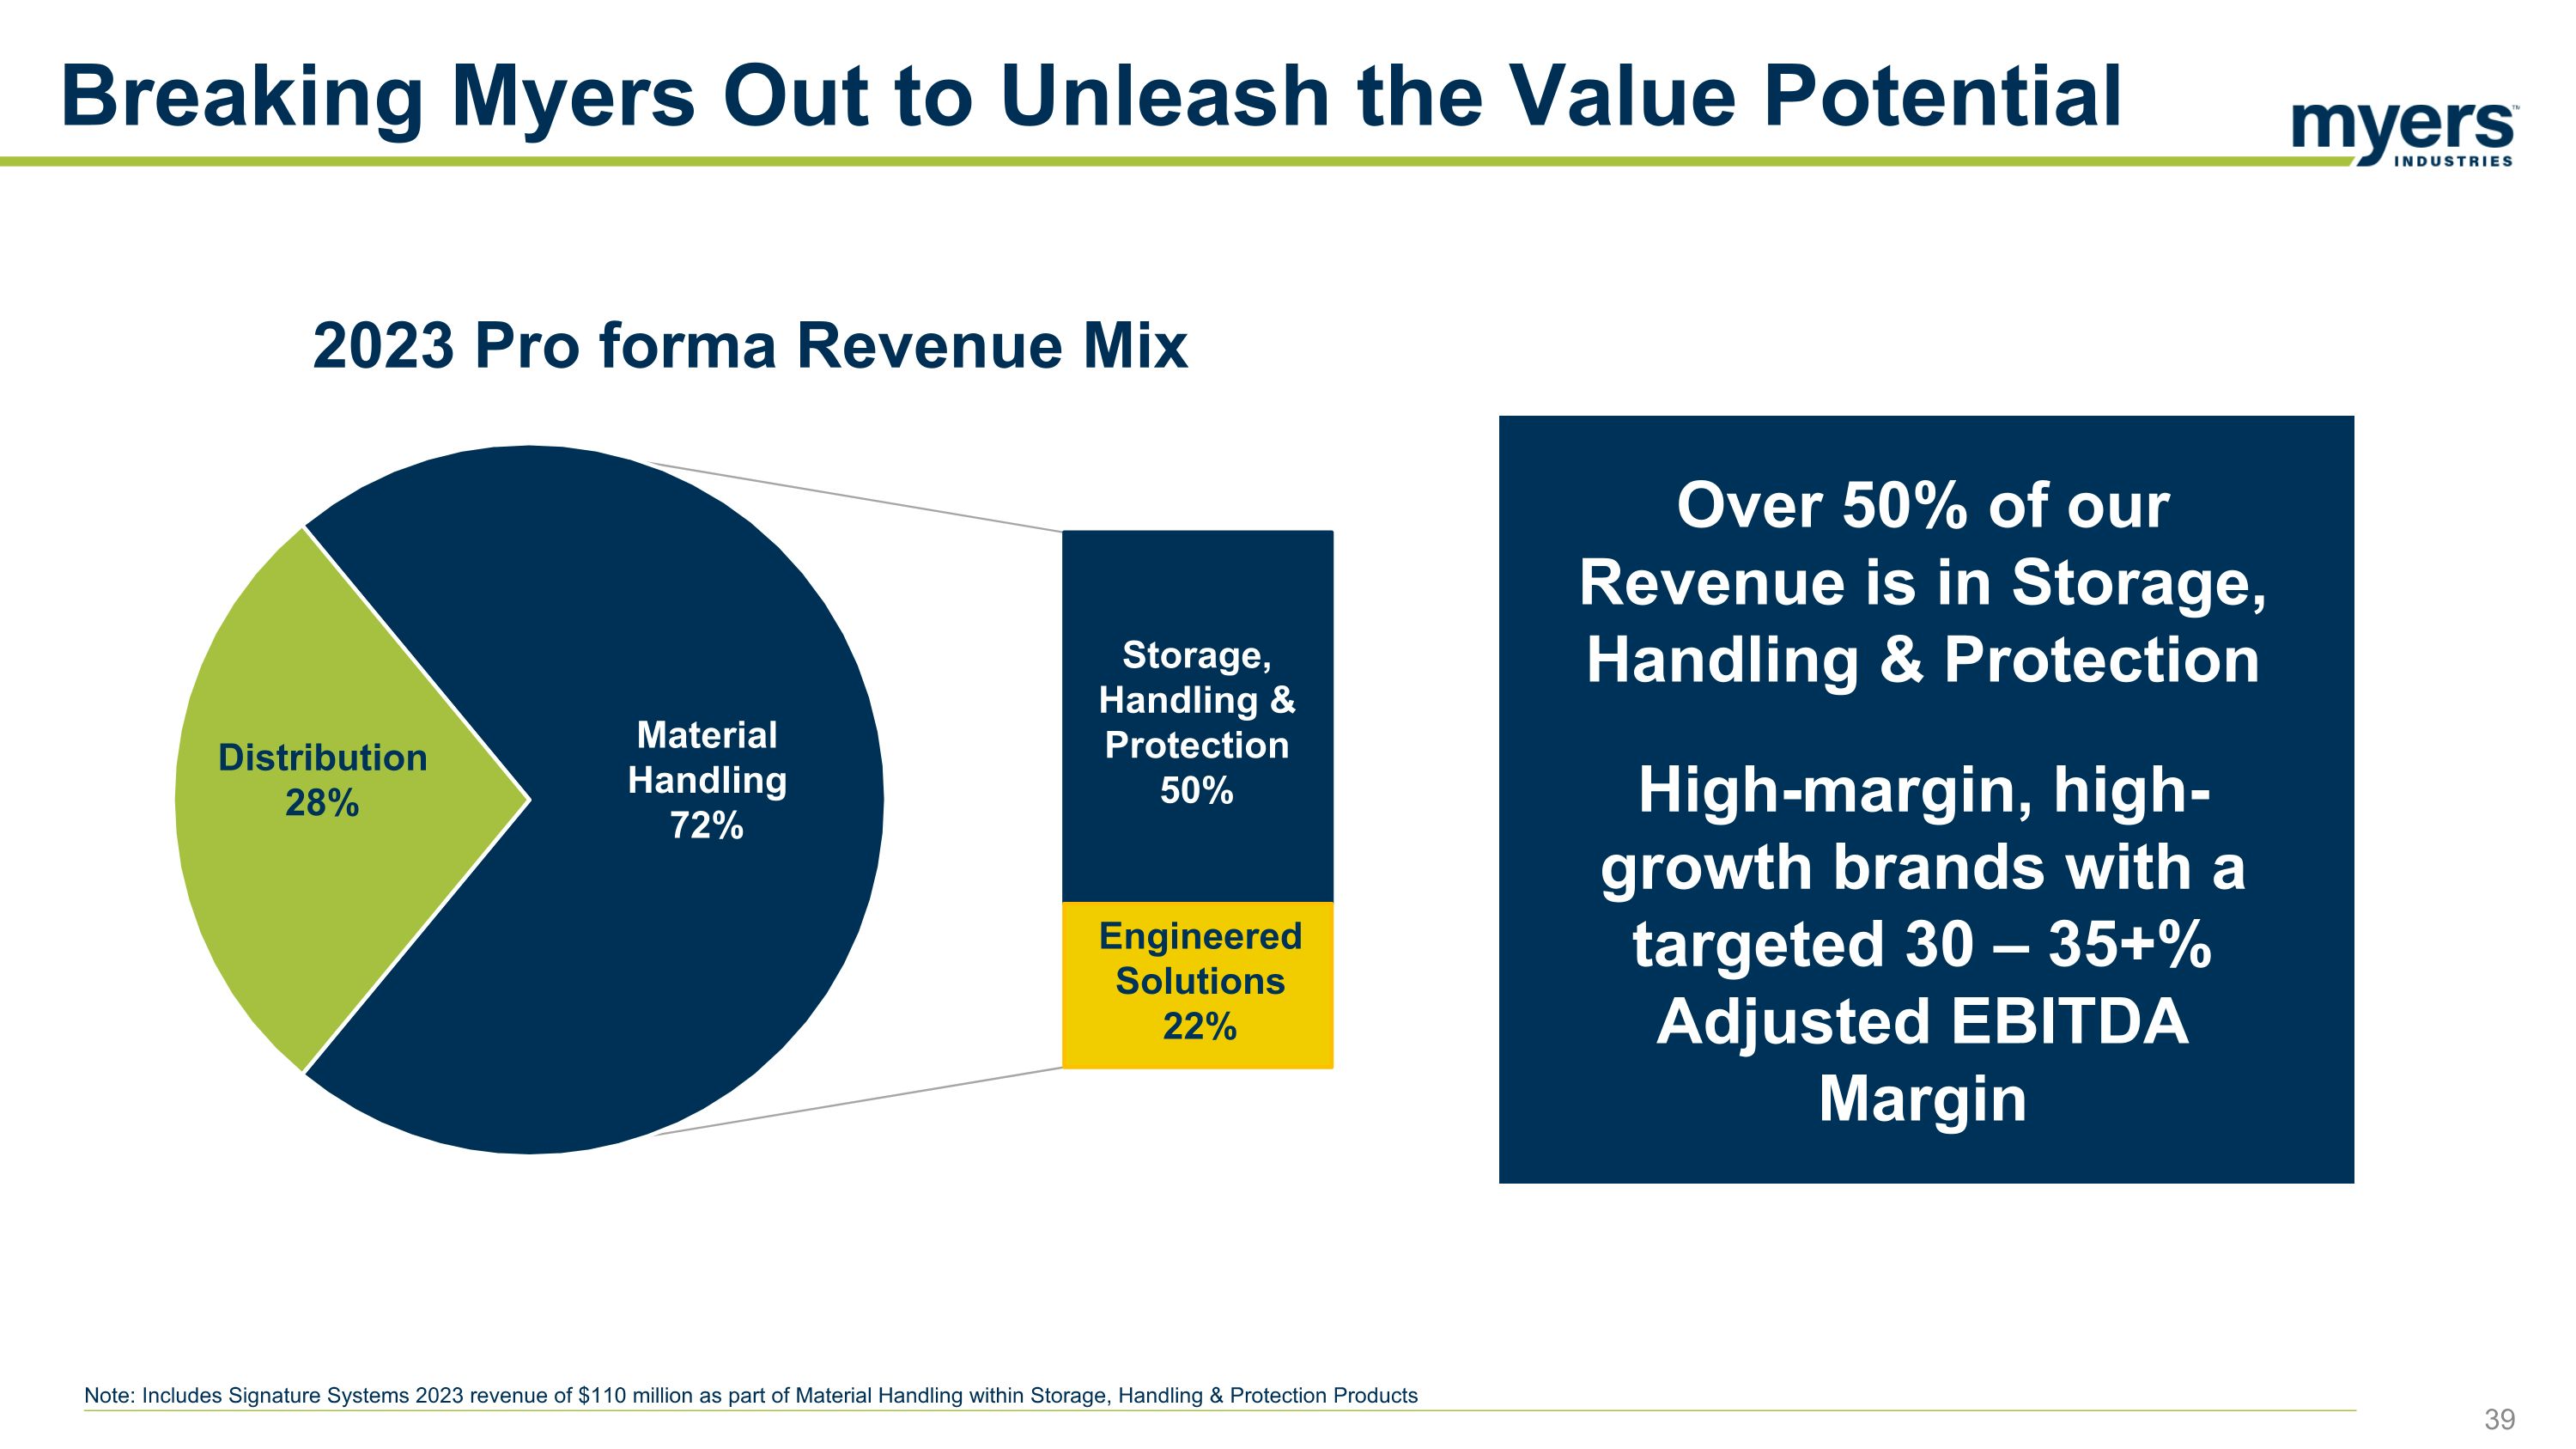
Engineered Solutions 22% Distribution 28% Material Handling 72% Storage, Handling & Protection 50% Breaking Myers Out to Unleash the Value Potential 2023 Pro forma Revenue Mix Over 50% of our Revenue is in Storage, Handling & Protection High-margin, high- growth brands with a targeted 30 – 35+% Adjusted EBITDA Margin Note: Includes Signature Systems 2023 revenue of $110 million as part of Material Handling within Storage, Handling & Protection Products
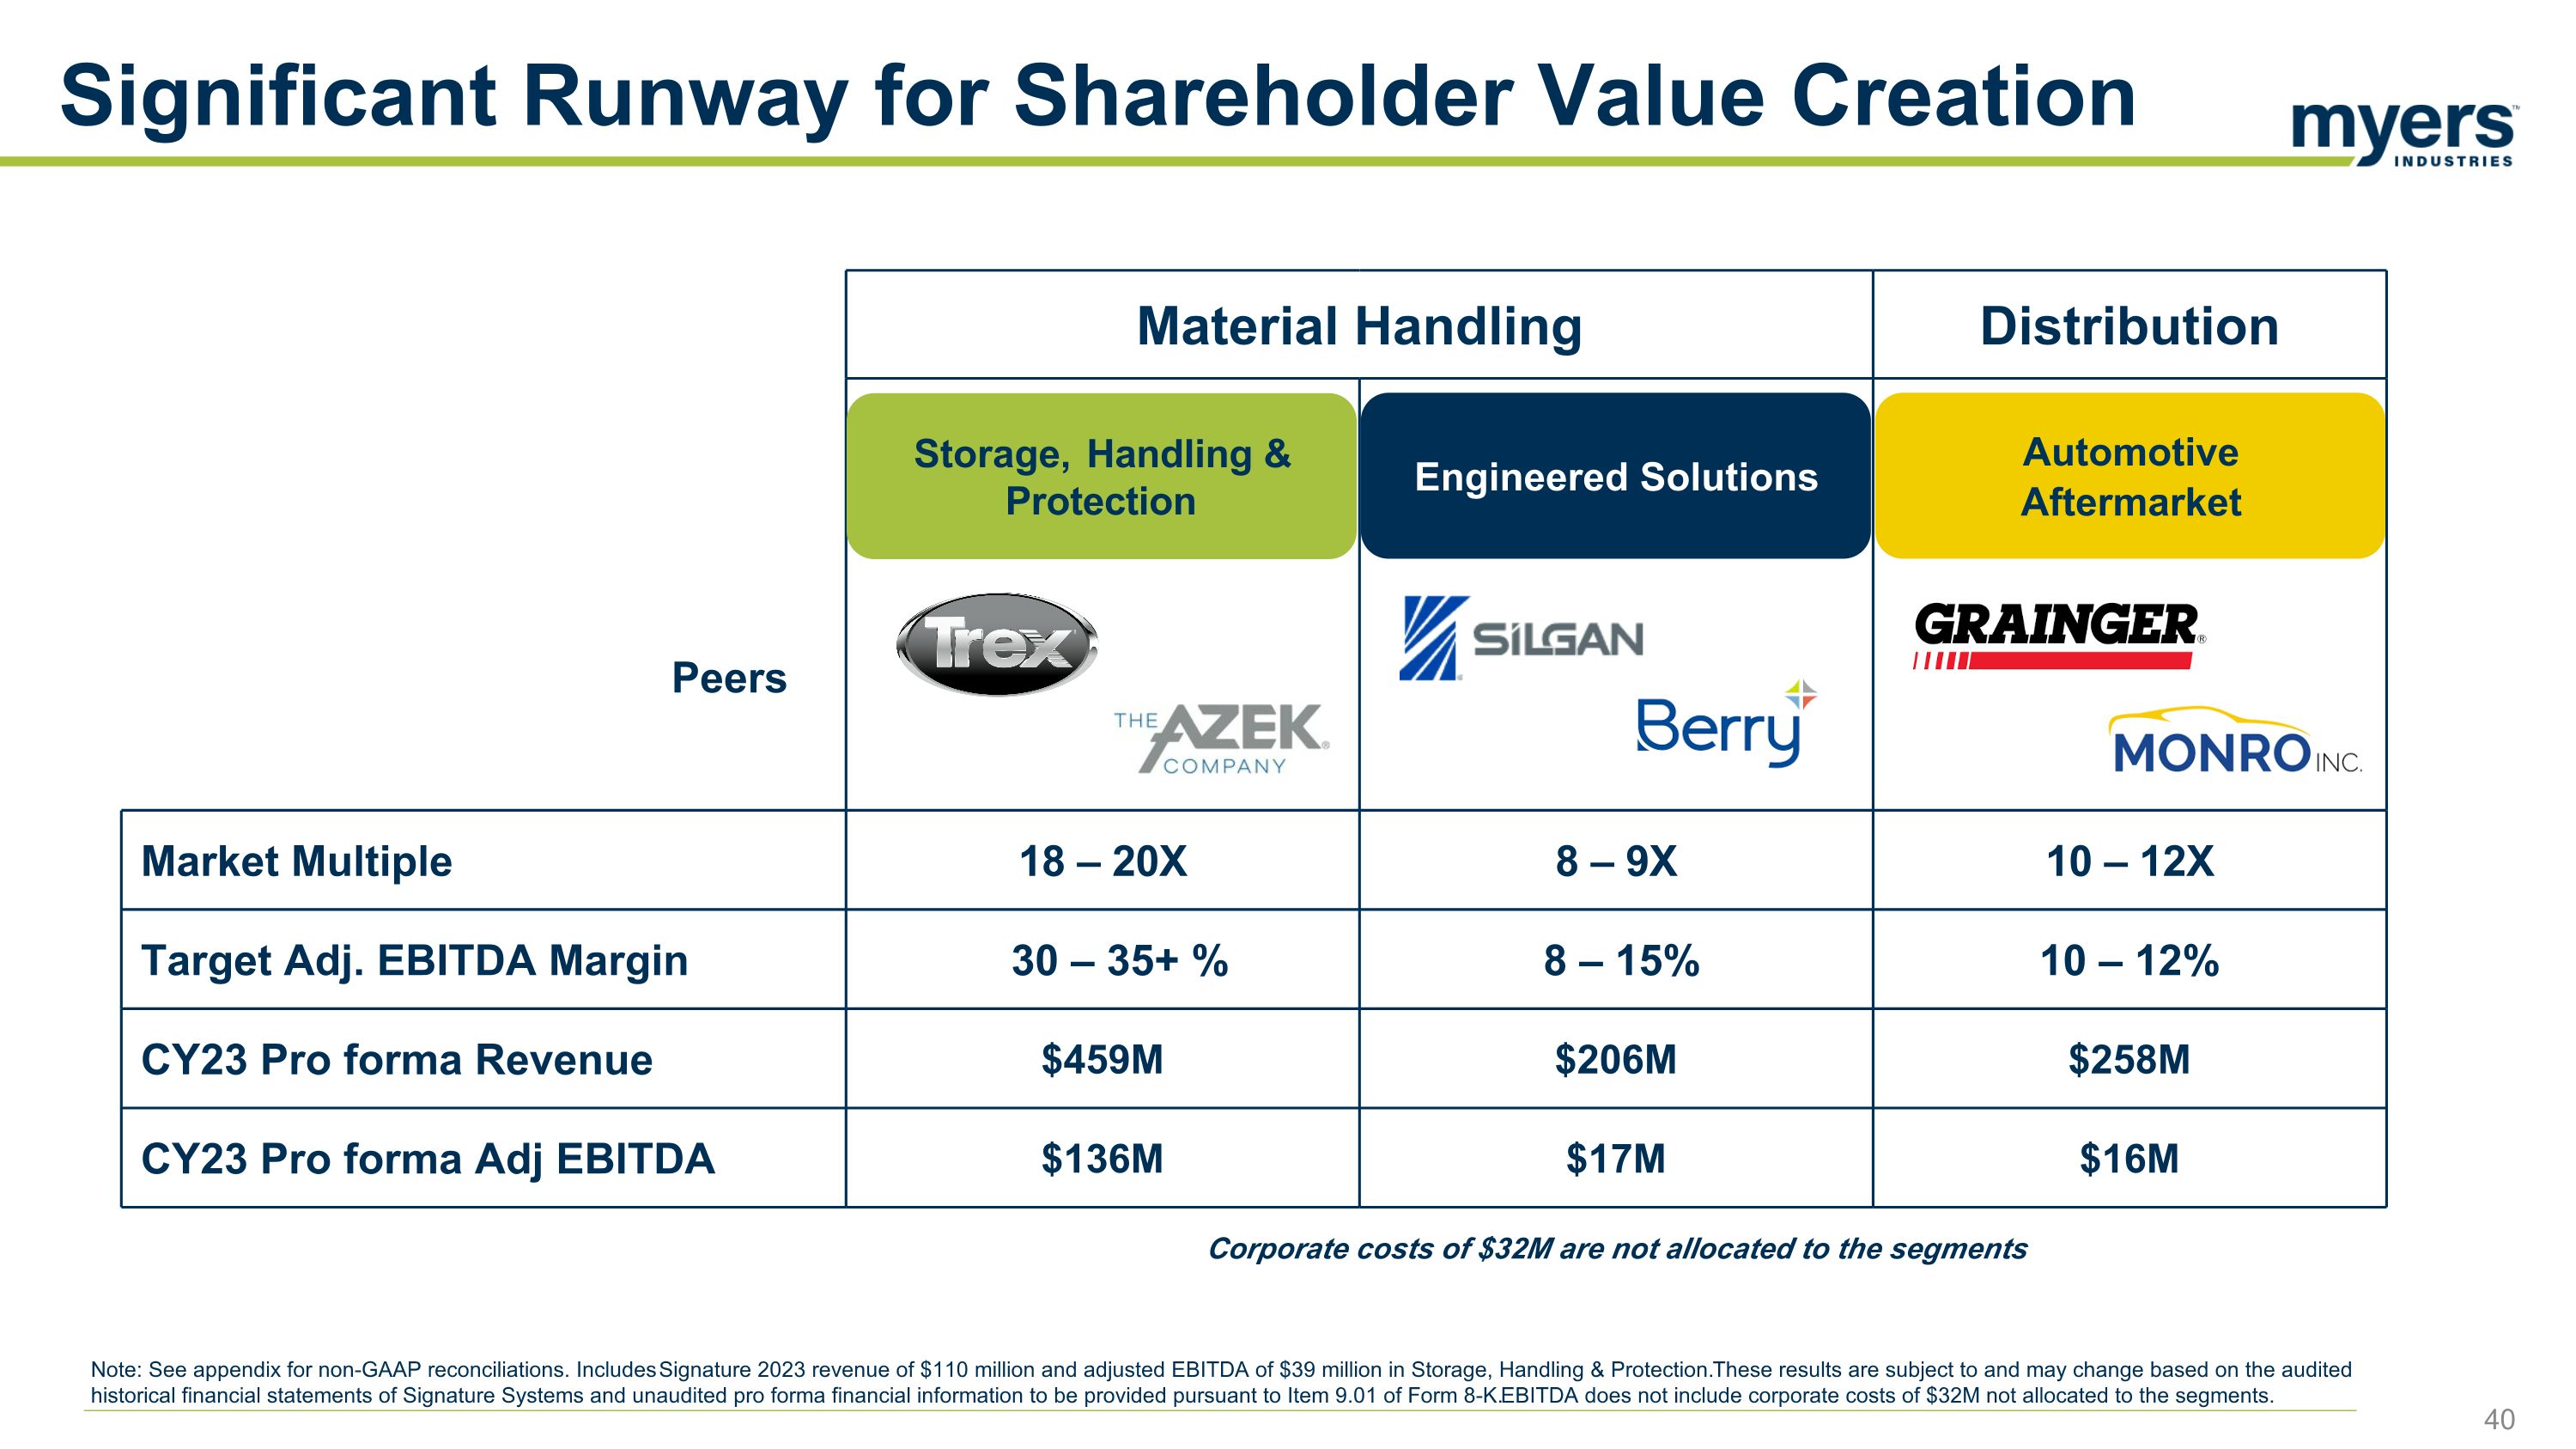
Material Handling Distribution Peers Market Multiple 18 – 20X 8 – 9X 10 – 12X Target Adj. EBITDA Margin 30 – 35+ % 8 – 15% 10 – 12% CY23 Pro forma Revenue $459M $206M $258M CY23 Pro forma Adj EBITDA $136M $17M $16M Corporate costs of $32M are not allocated to the segments Engineered Solutions Automotive Aftermarket Storage, Handling & Protection Significant Runway for Shareholder Value Creation Note: See appendix for non-GAAP reconciliations. Includes Signature 2023 revenue of $110 million and adjusted EBITDA of $39 million in Storage, Handling & Protection. These results are subject to and may change based on the audited historical financial statements of Signature Systems and unaudited pro forma financial information to be provided pursuant to Item 9.01 of Form 8-K. EBITDA does not include corporate costs of $32M not allocated to the segments.
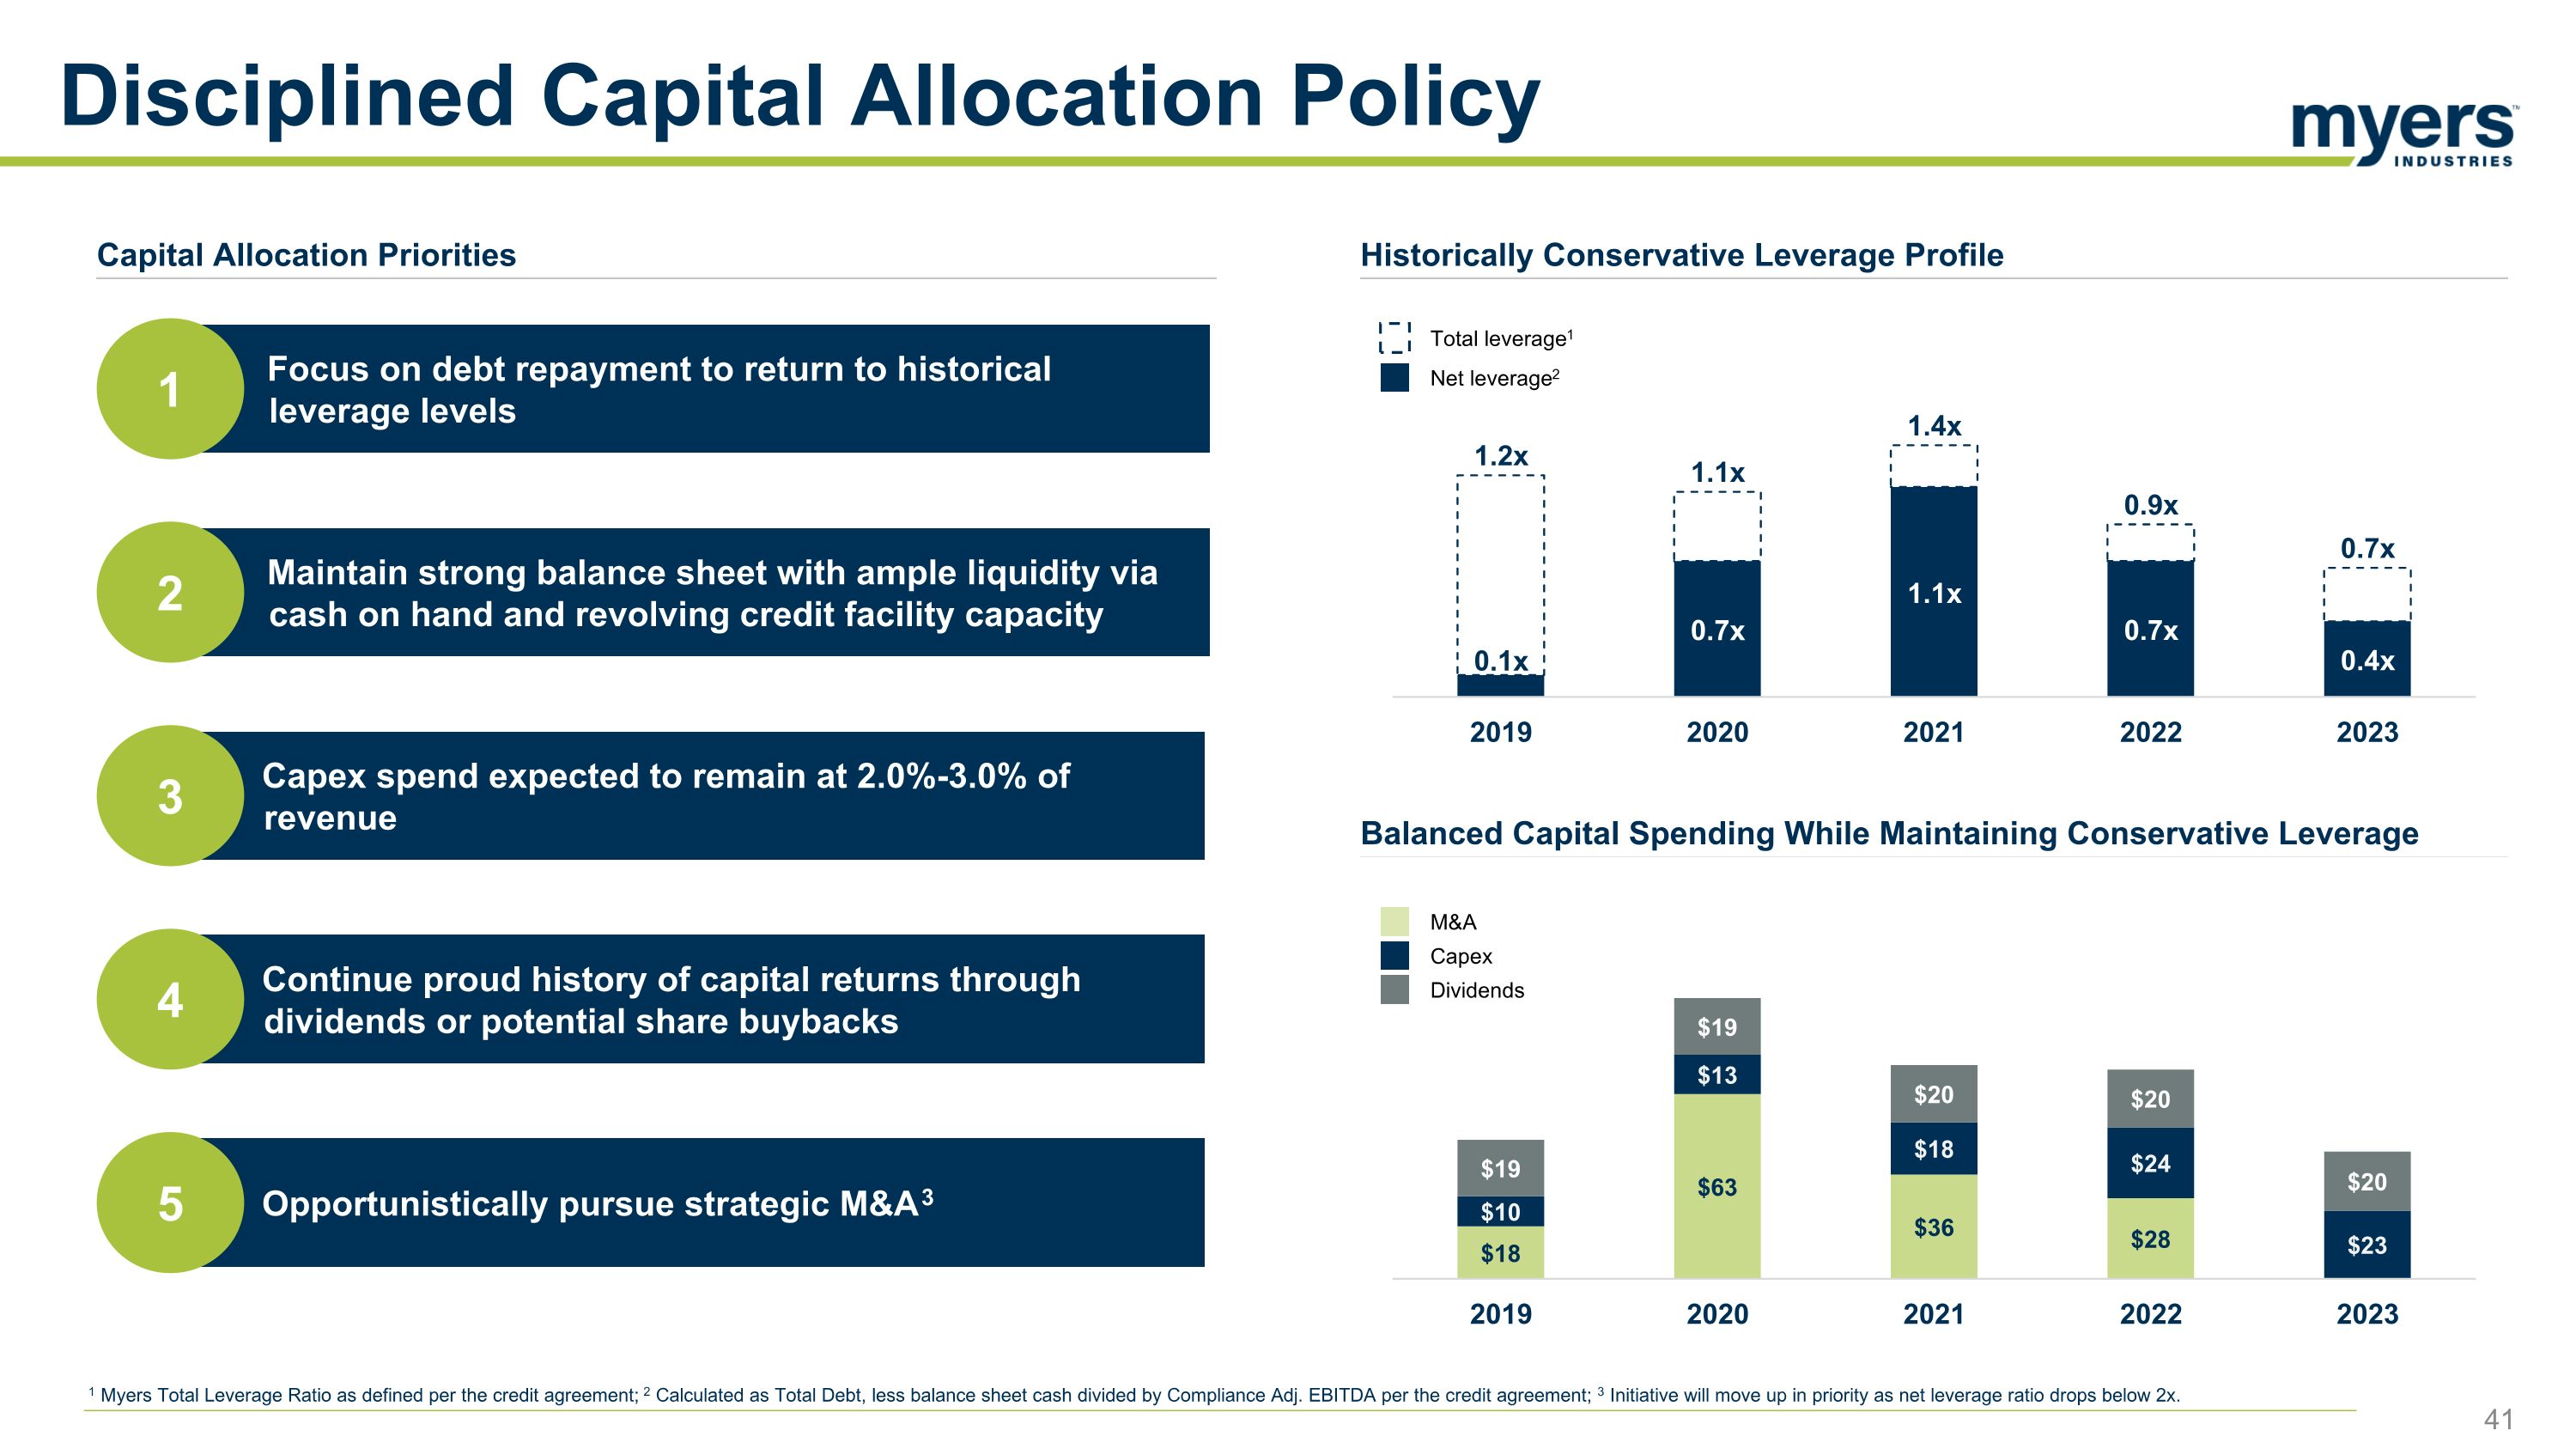
Maintain strong balance sheet with ample liquidity via cash on hand and revolving credit facility capacity 2 Capex spend expected to remain at 2.0%-3.0% of revenue 3 Continue proud history of capital returns through dividends or potential share buybacks 4 Focus on debt repayment to return to historical leverage levels 1 Opportunistically pursue strategic M&A3 5 Net leverage2 Total leverage1 M&A Capex Dividends Capital Allocation Priorities Historically Conservative Leverage Profile Balanced Capital Spending While Maintaining Conservative Leverage Disciplined Capital Allocation Policy 1 Myers Total Leverage Ratio as defined per the credit agreement; 2 Calculated as Total Debt, less balance sheet cash divided by Compliance Adj. EBITDA per the credit agreement; 3 Initiative will move up in priority as net leverage ratio drops below 2x.
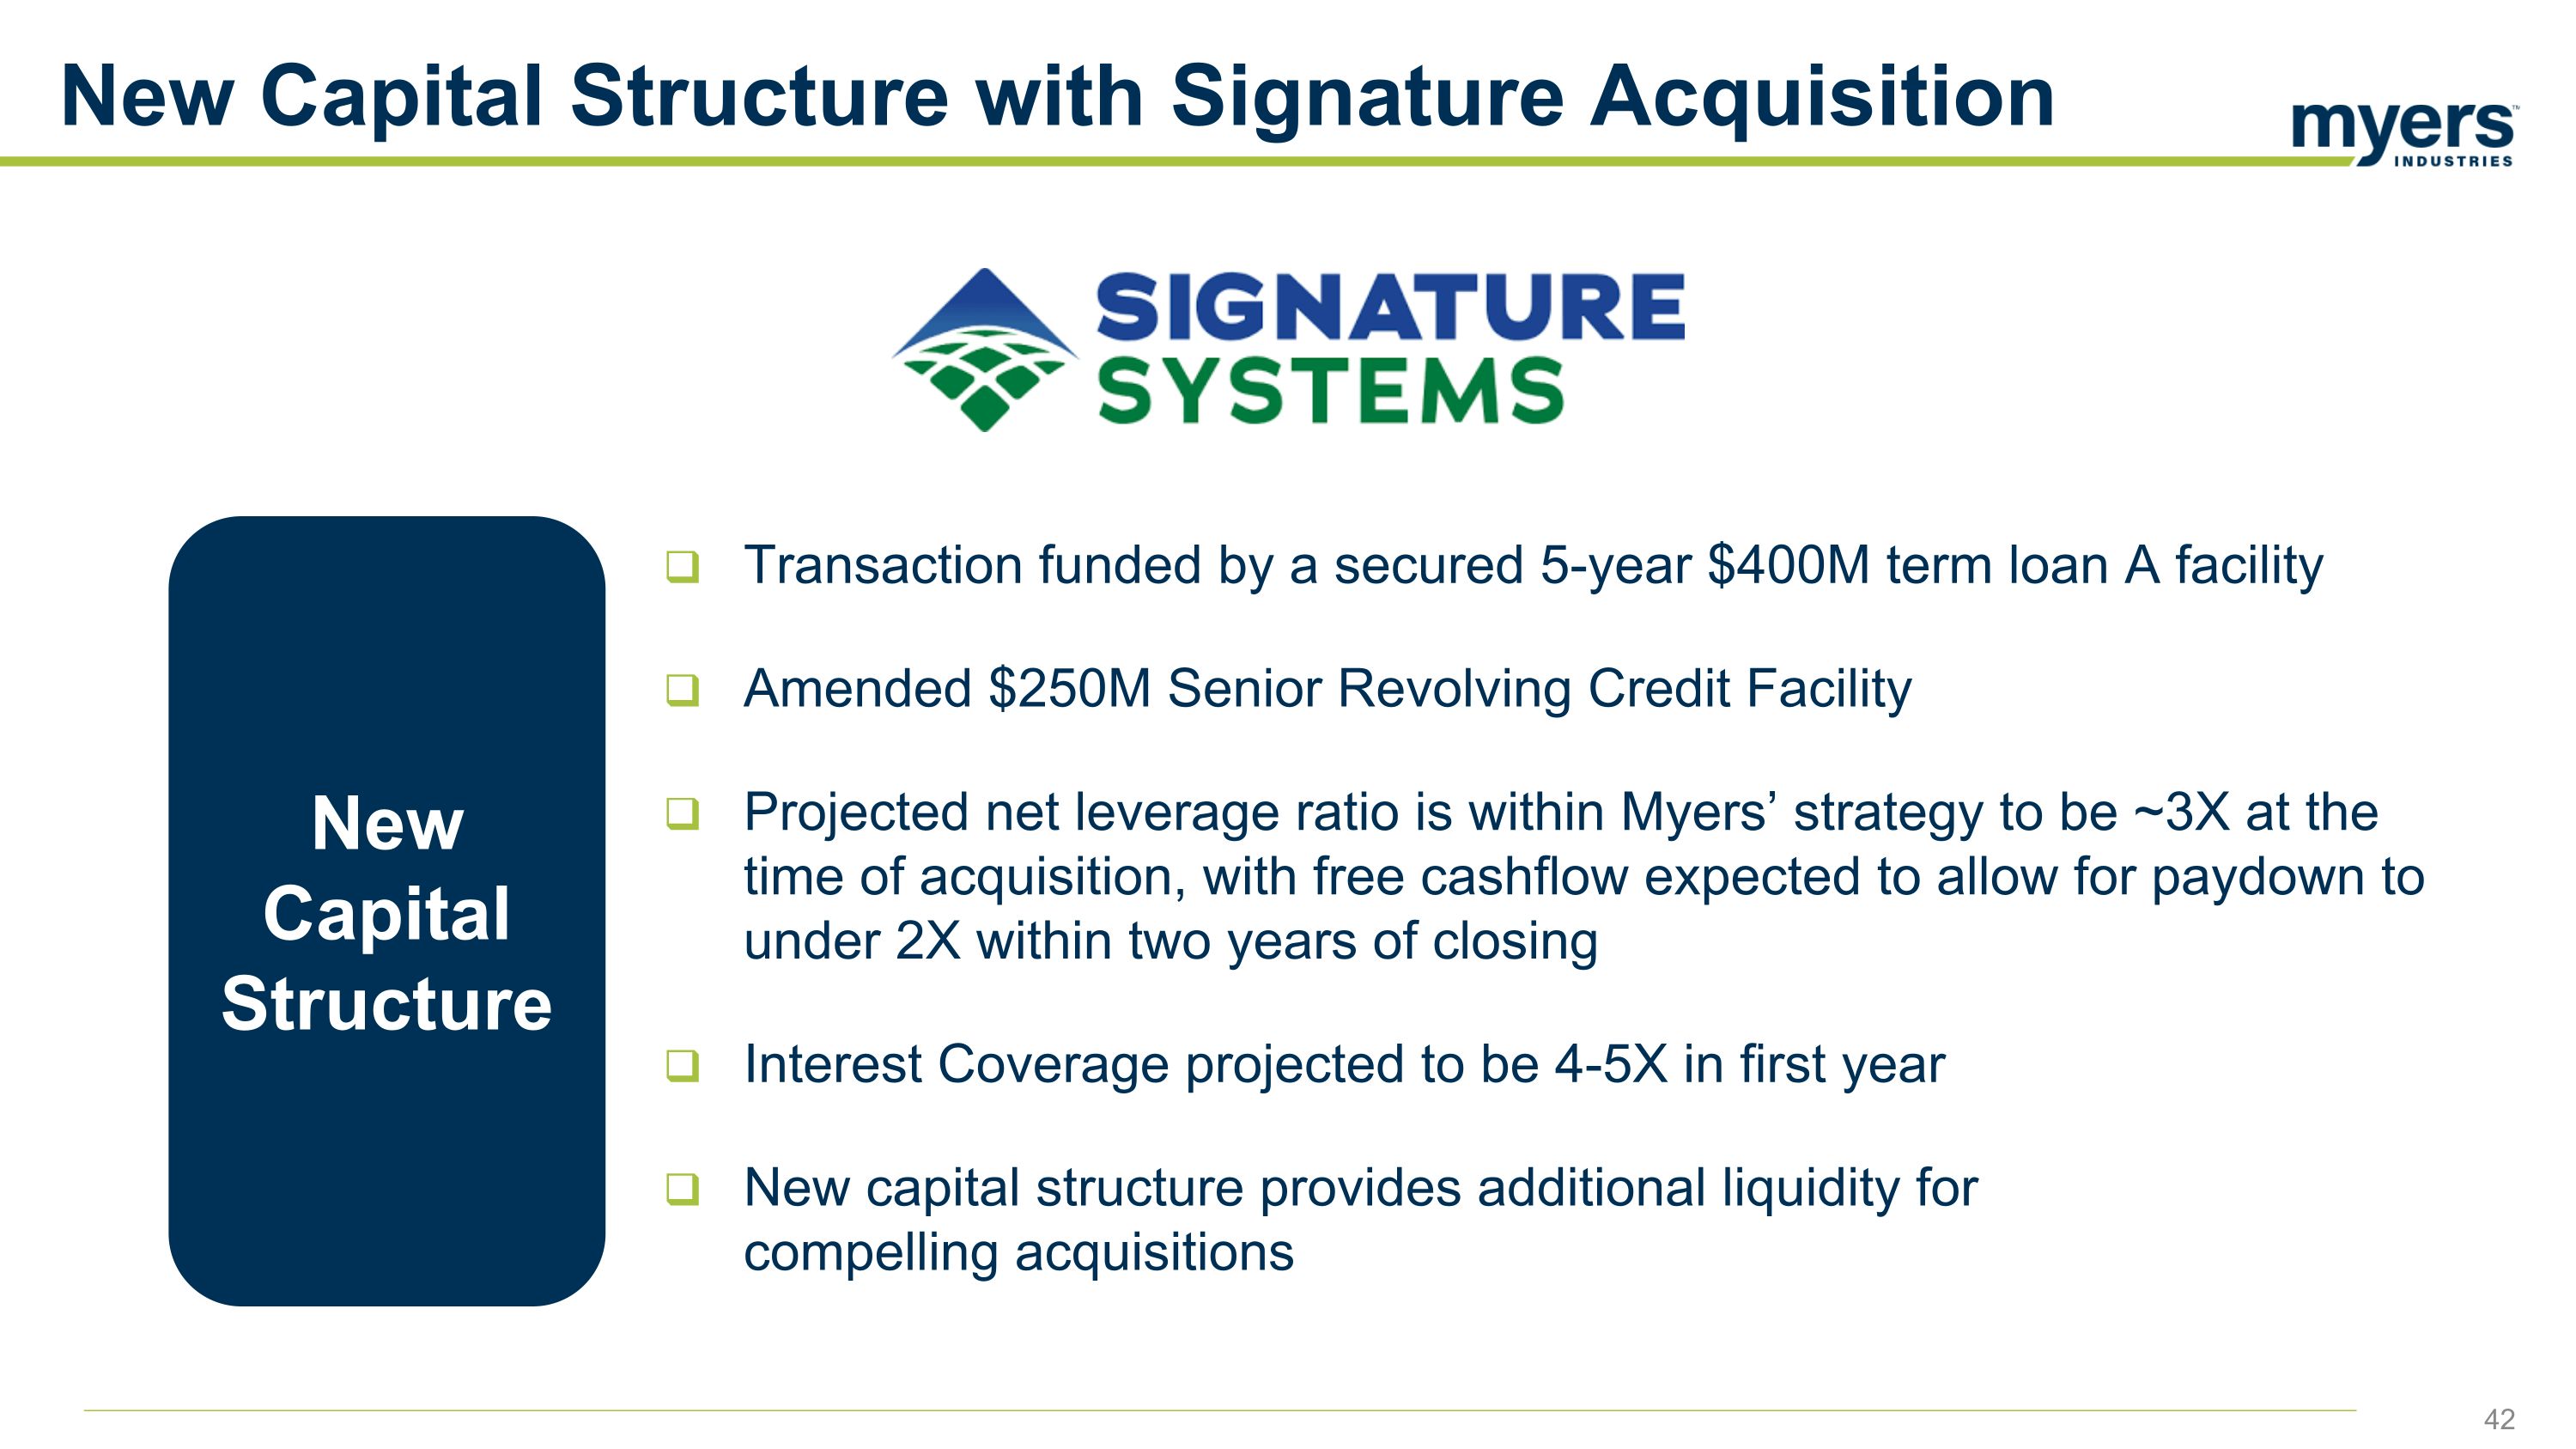
New Capital Structure with Signature Acquisition New Capital Structure Transaction funded by a secured 5-year $400M term loan A facility Amended $250M Senior Revolving Credit Facility Projected net leverage ratio is within Myers’ strategy to be ~3X at the time of acquisition, with free cashflow expected to allow for paydown to under 2X within two years of closing Interest Coverage projected to be 4-5X in first year New capital structure provides additional liquidity for compelling acquisitions
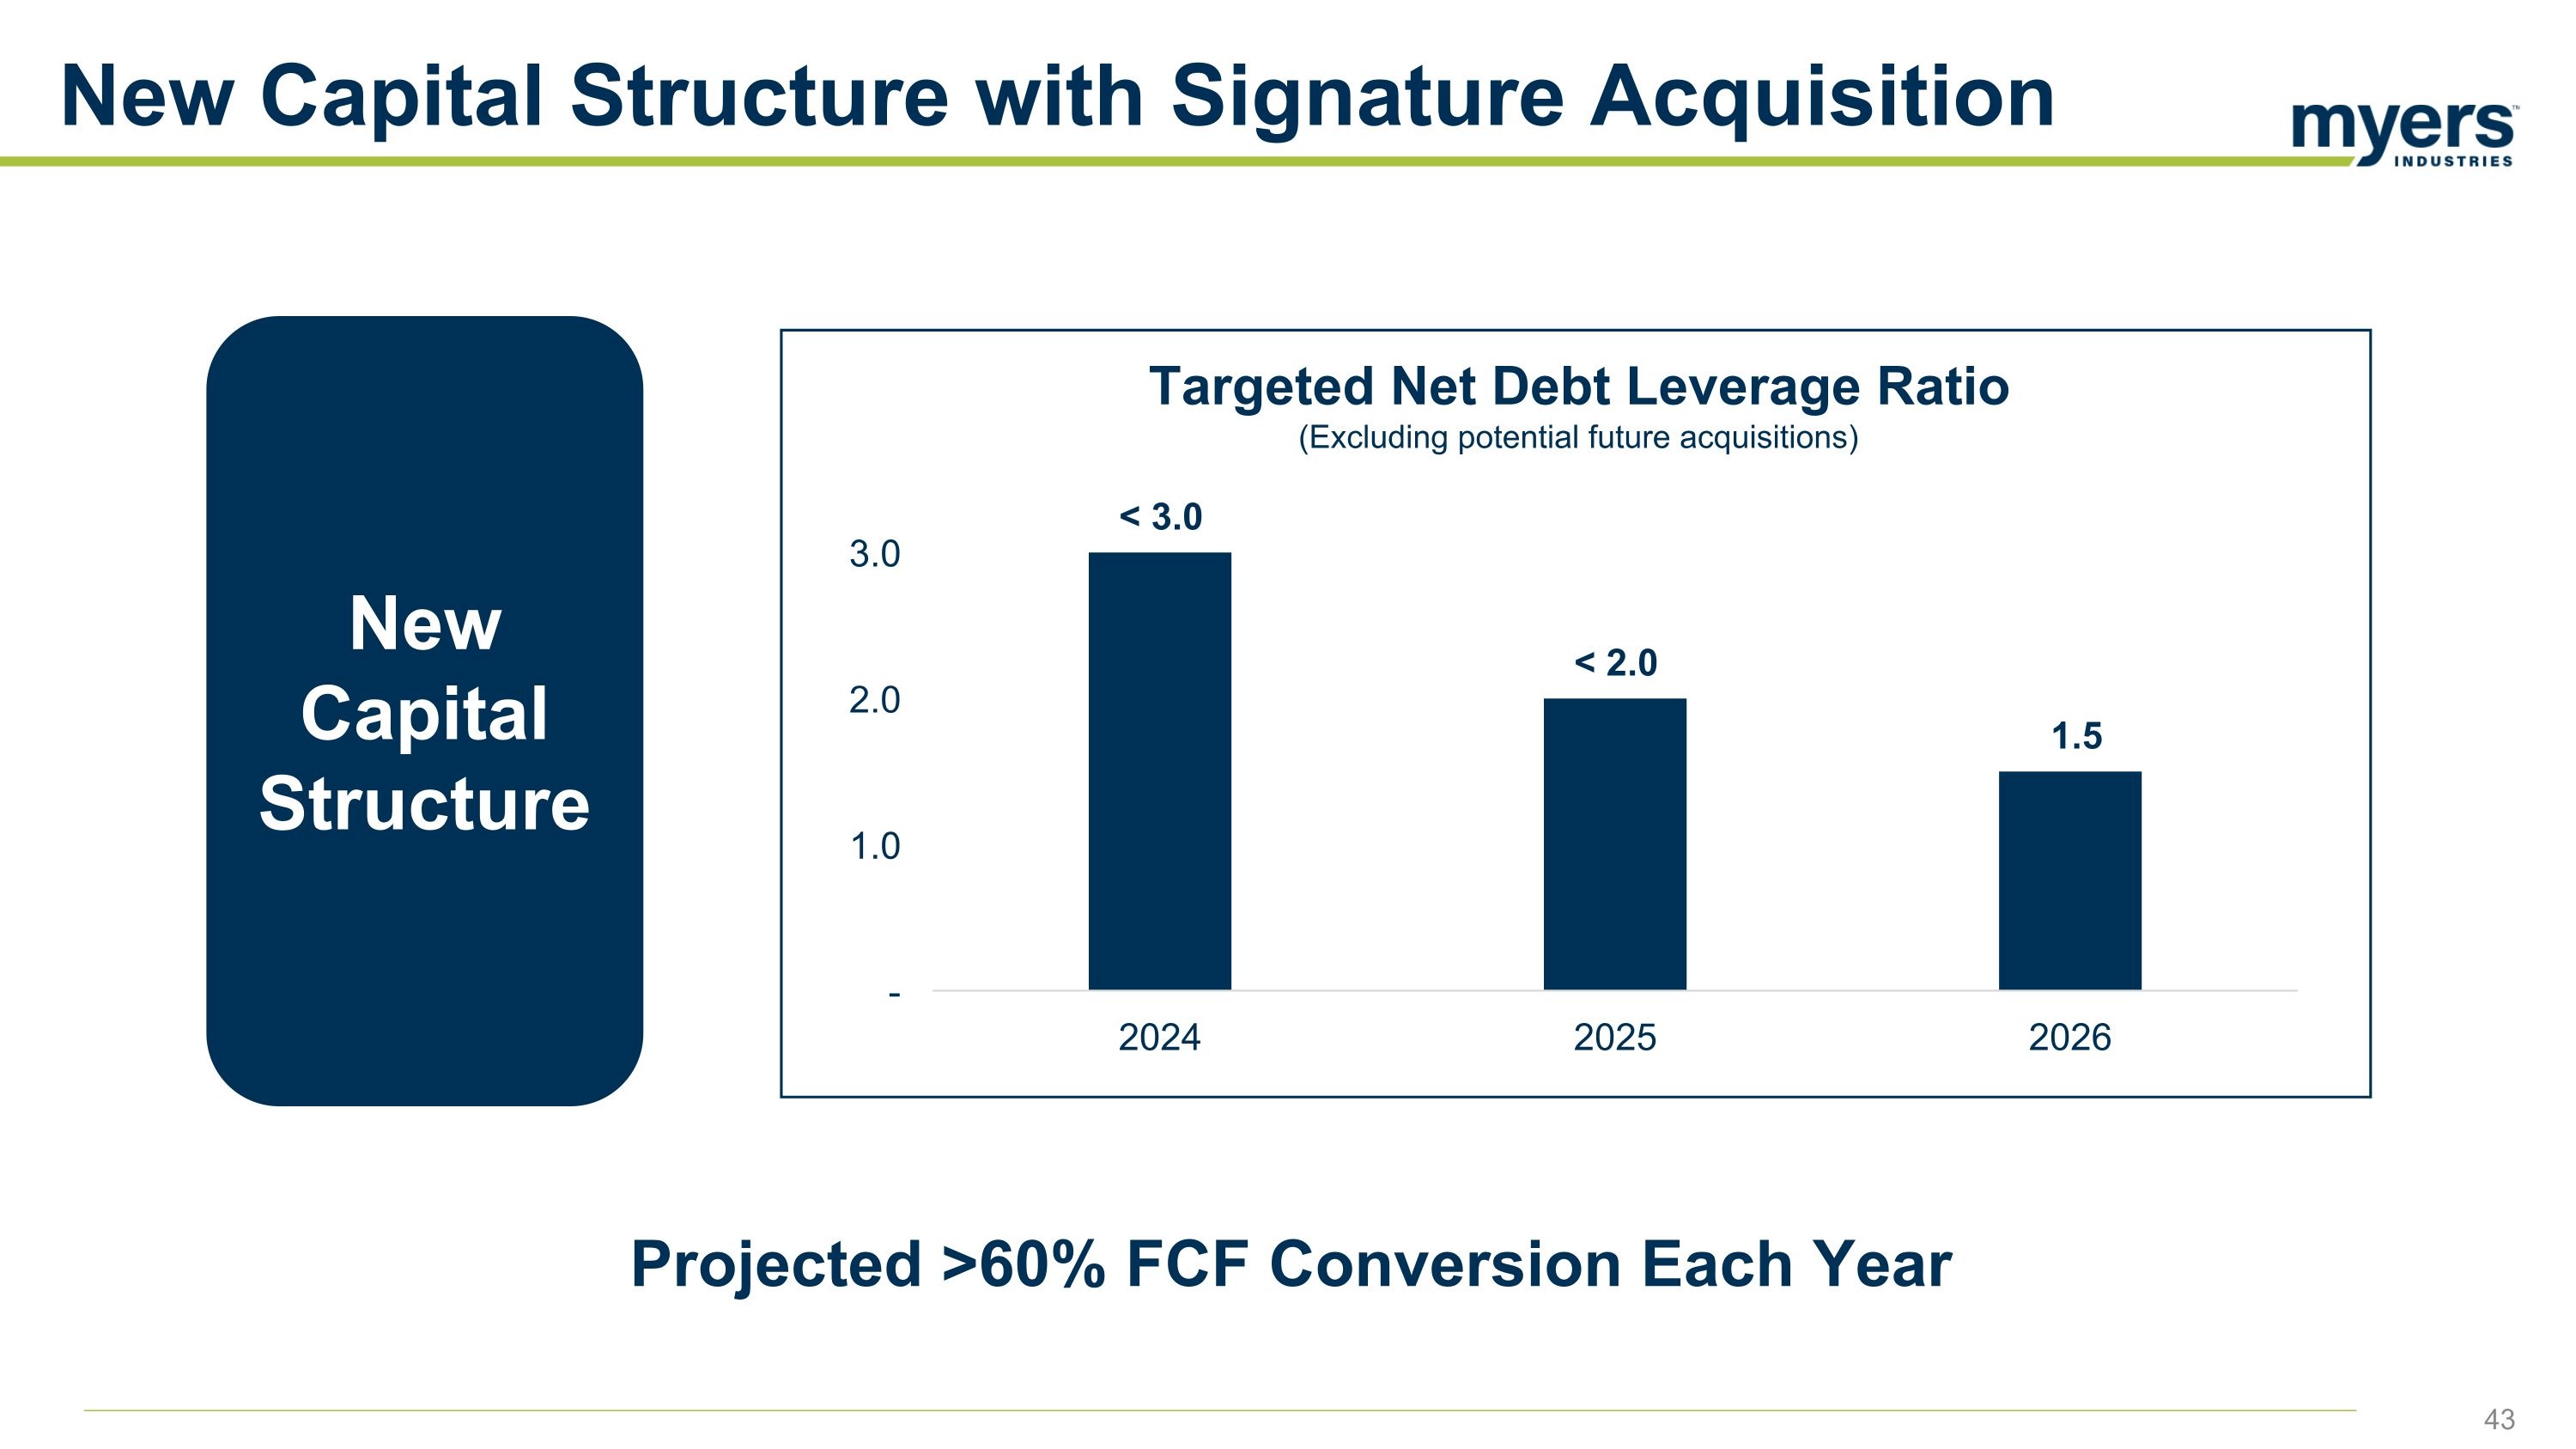
New Capital Structure with Signature Acquisition New Capital Structure Projected >60% FCF Conversion Each Year Targeted Net Debt Leverage Ratio (Excluding potential future acquisitions)
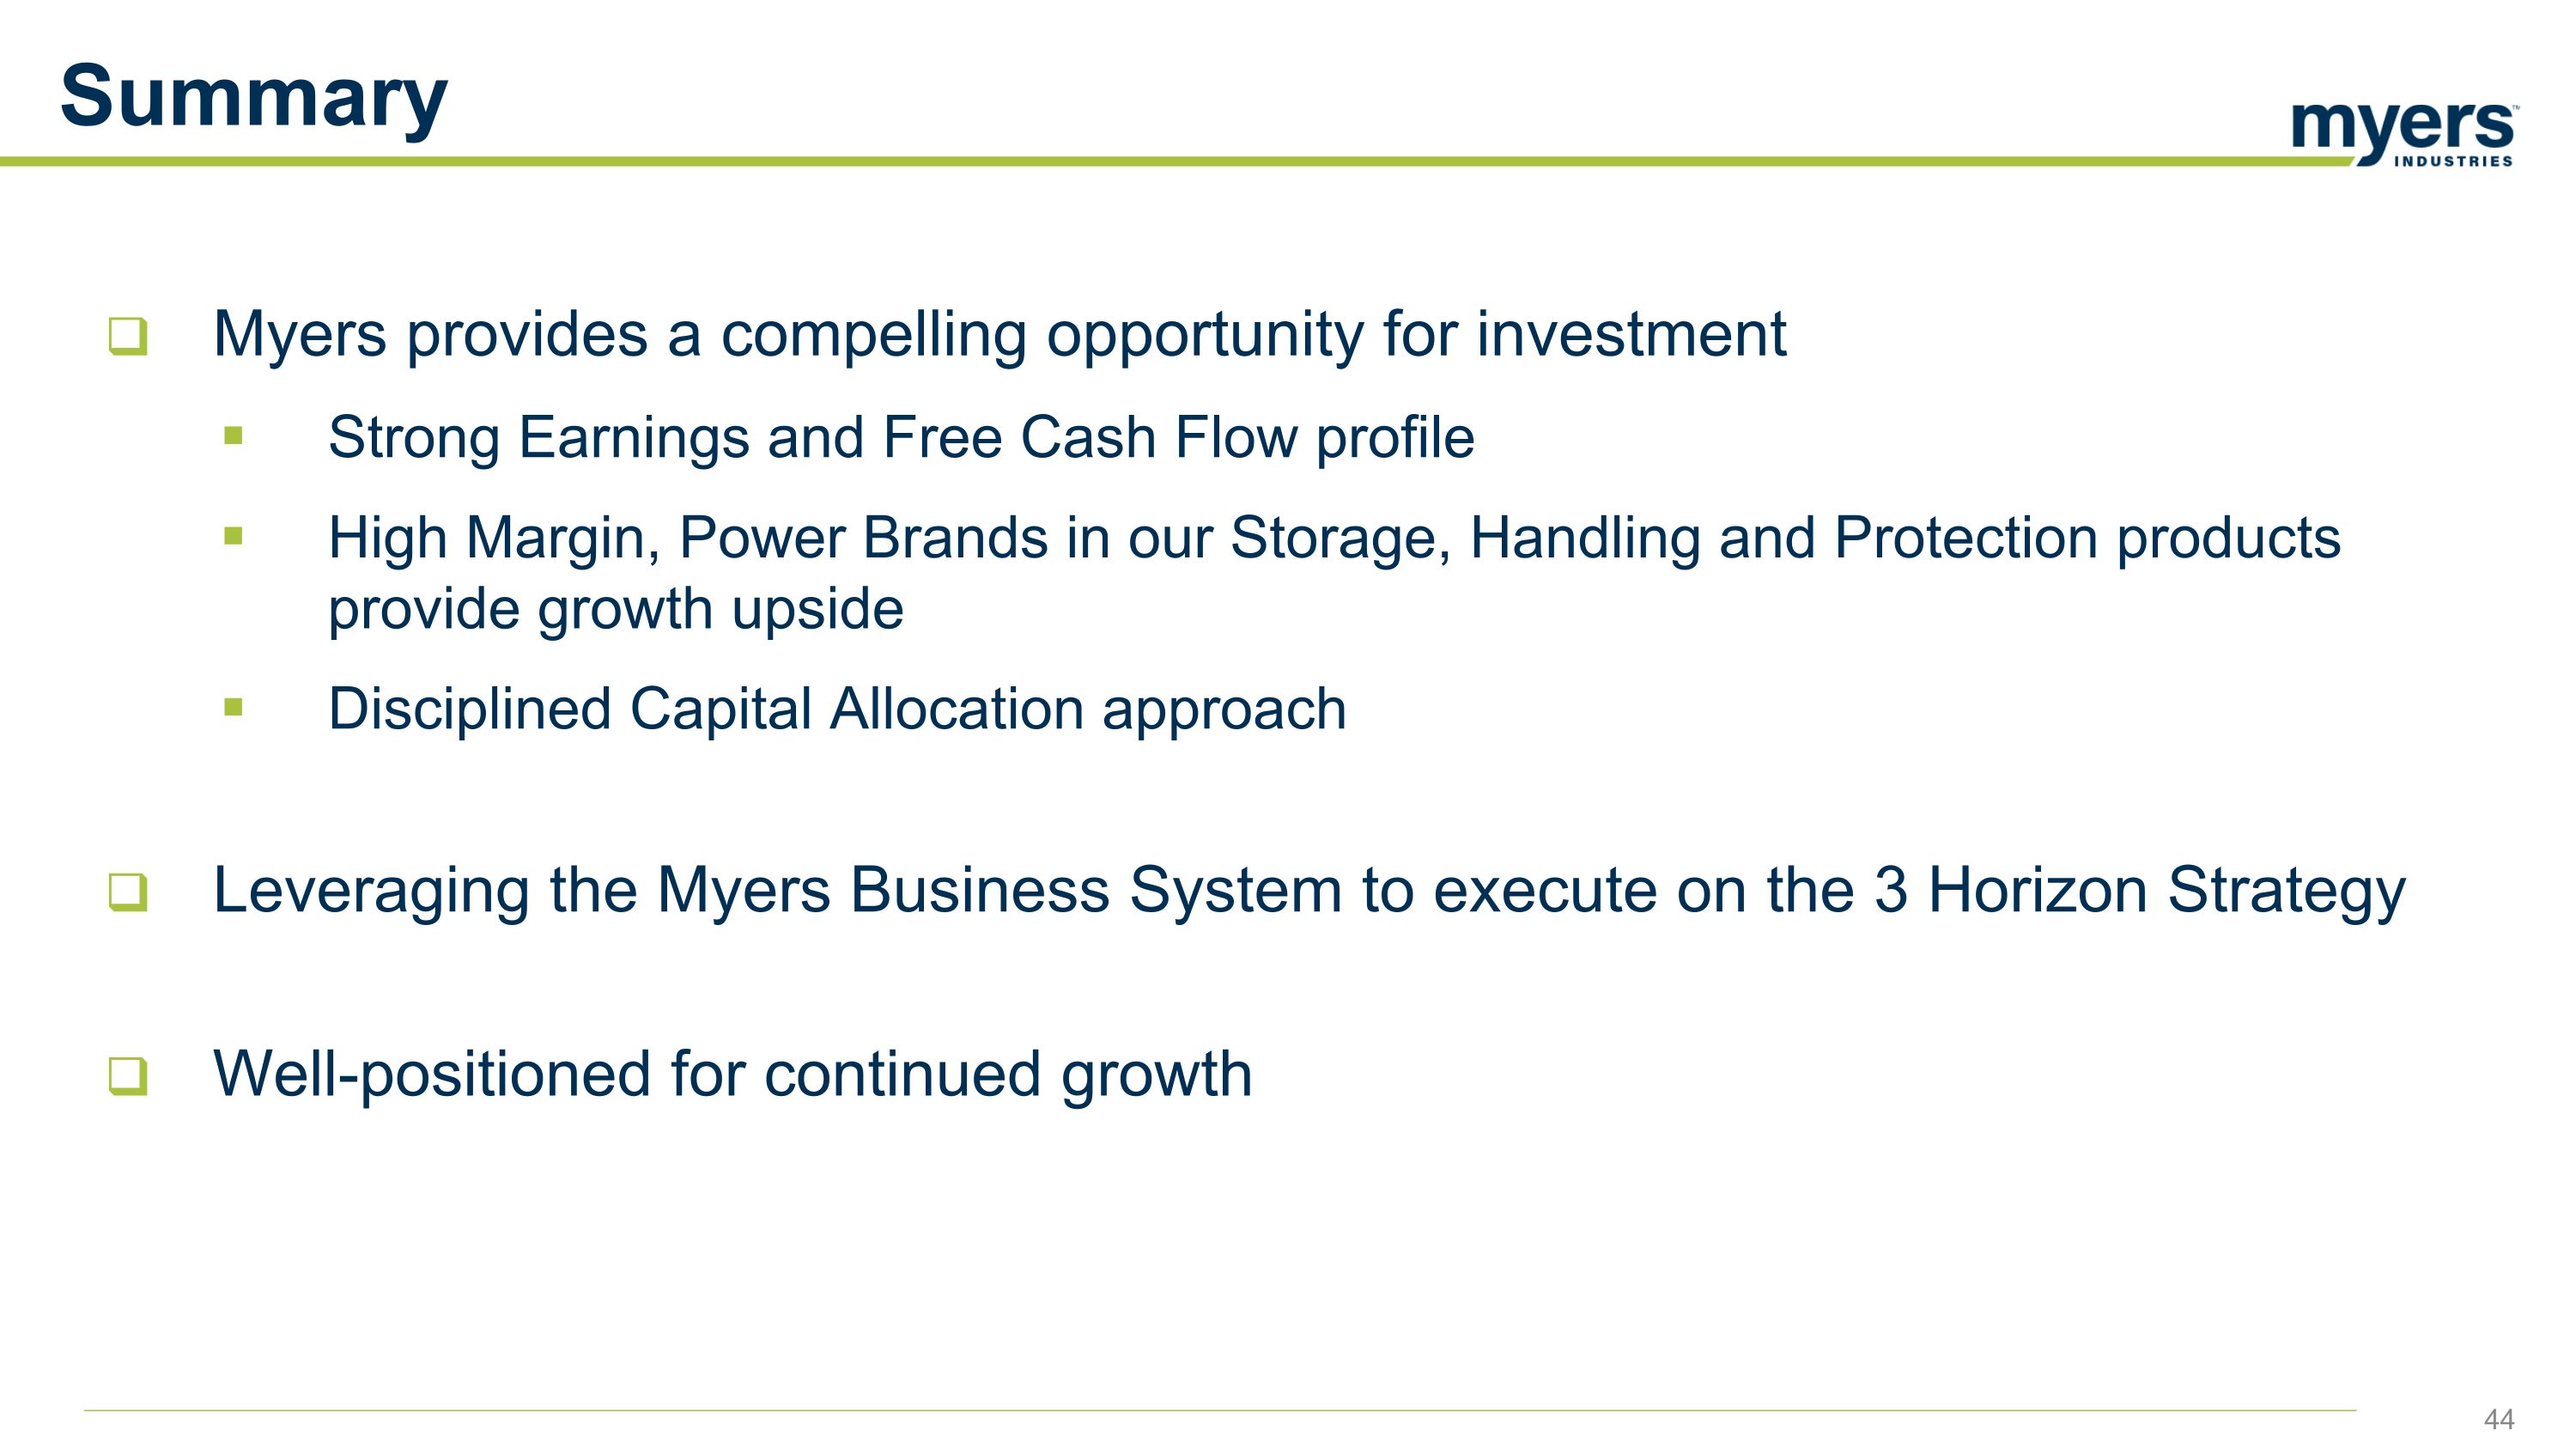
Summary Myers provides a compelling opportunity for investment Strong Earnings and Free Cash Flow profile High Margin, Power Brands in our Storage, Handling and Protection products provide growth upside Disciplined Capital Allocation approach Leveraging the Myers Business System to execute on the 3 Horizon Strategy Well-positioned for continued growth
Automotive Aftermarket Jim Gurnee, Business Vice President 45
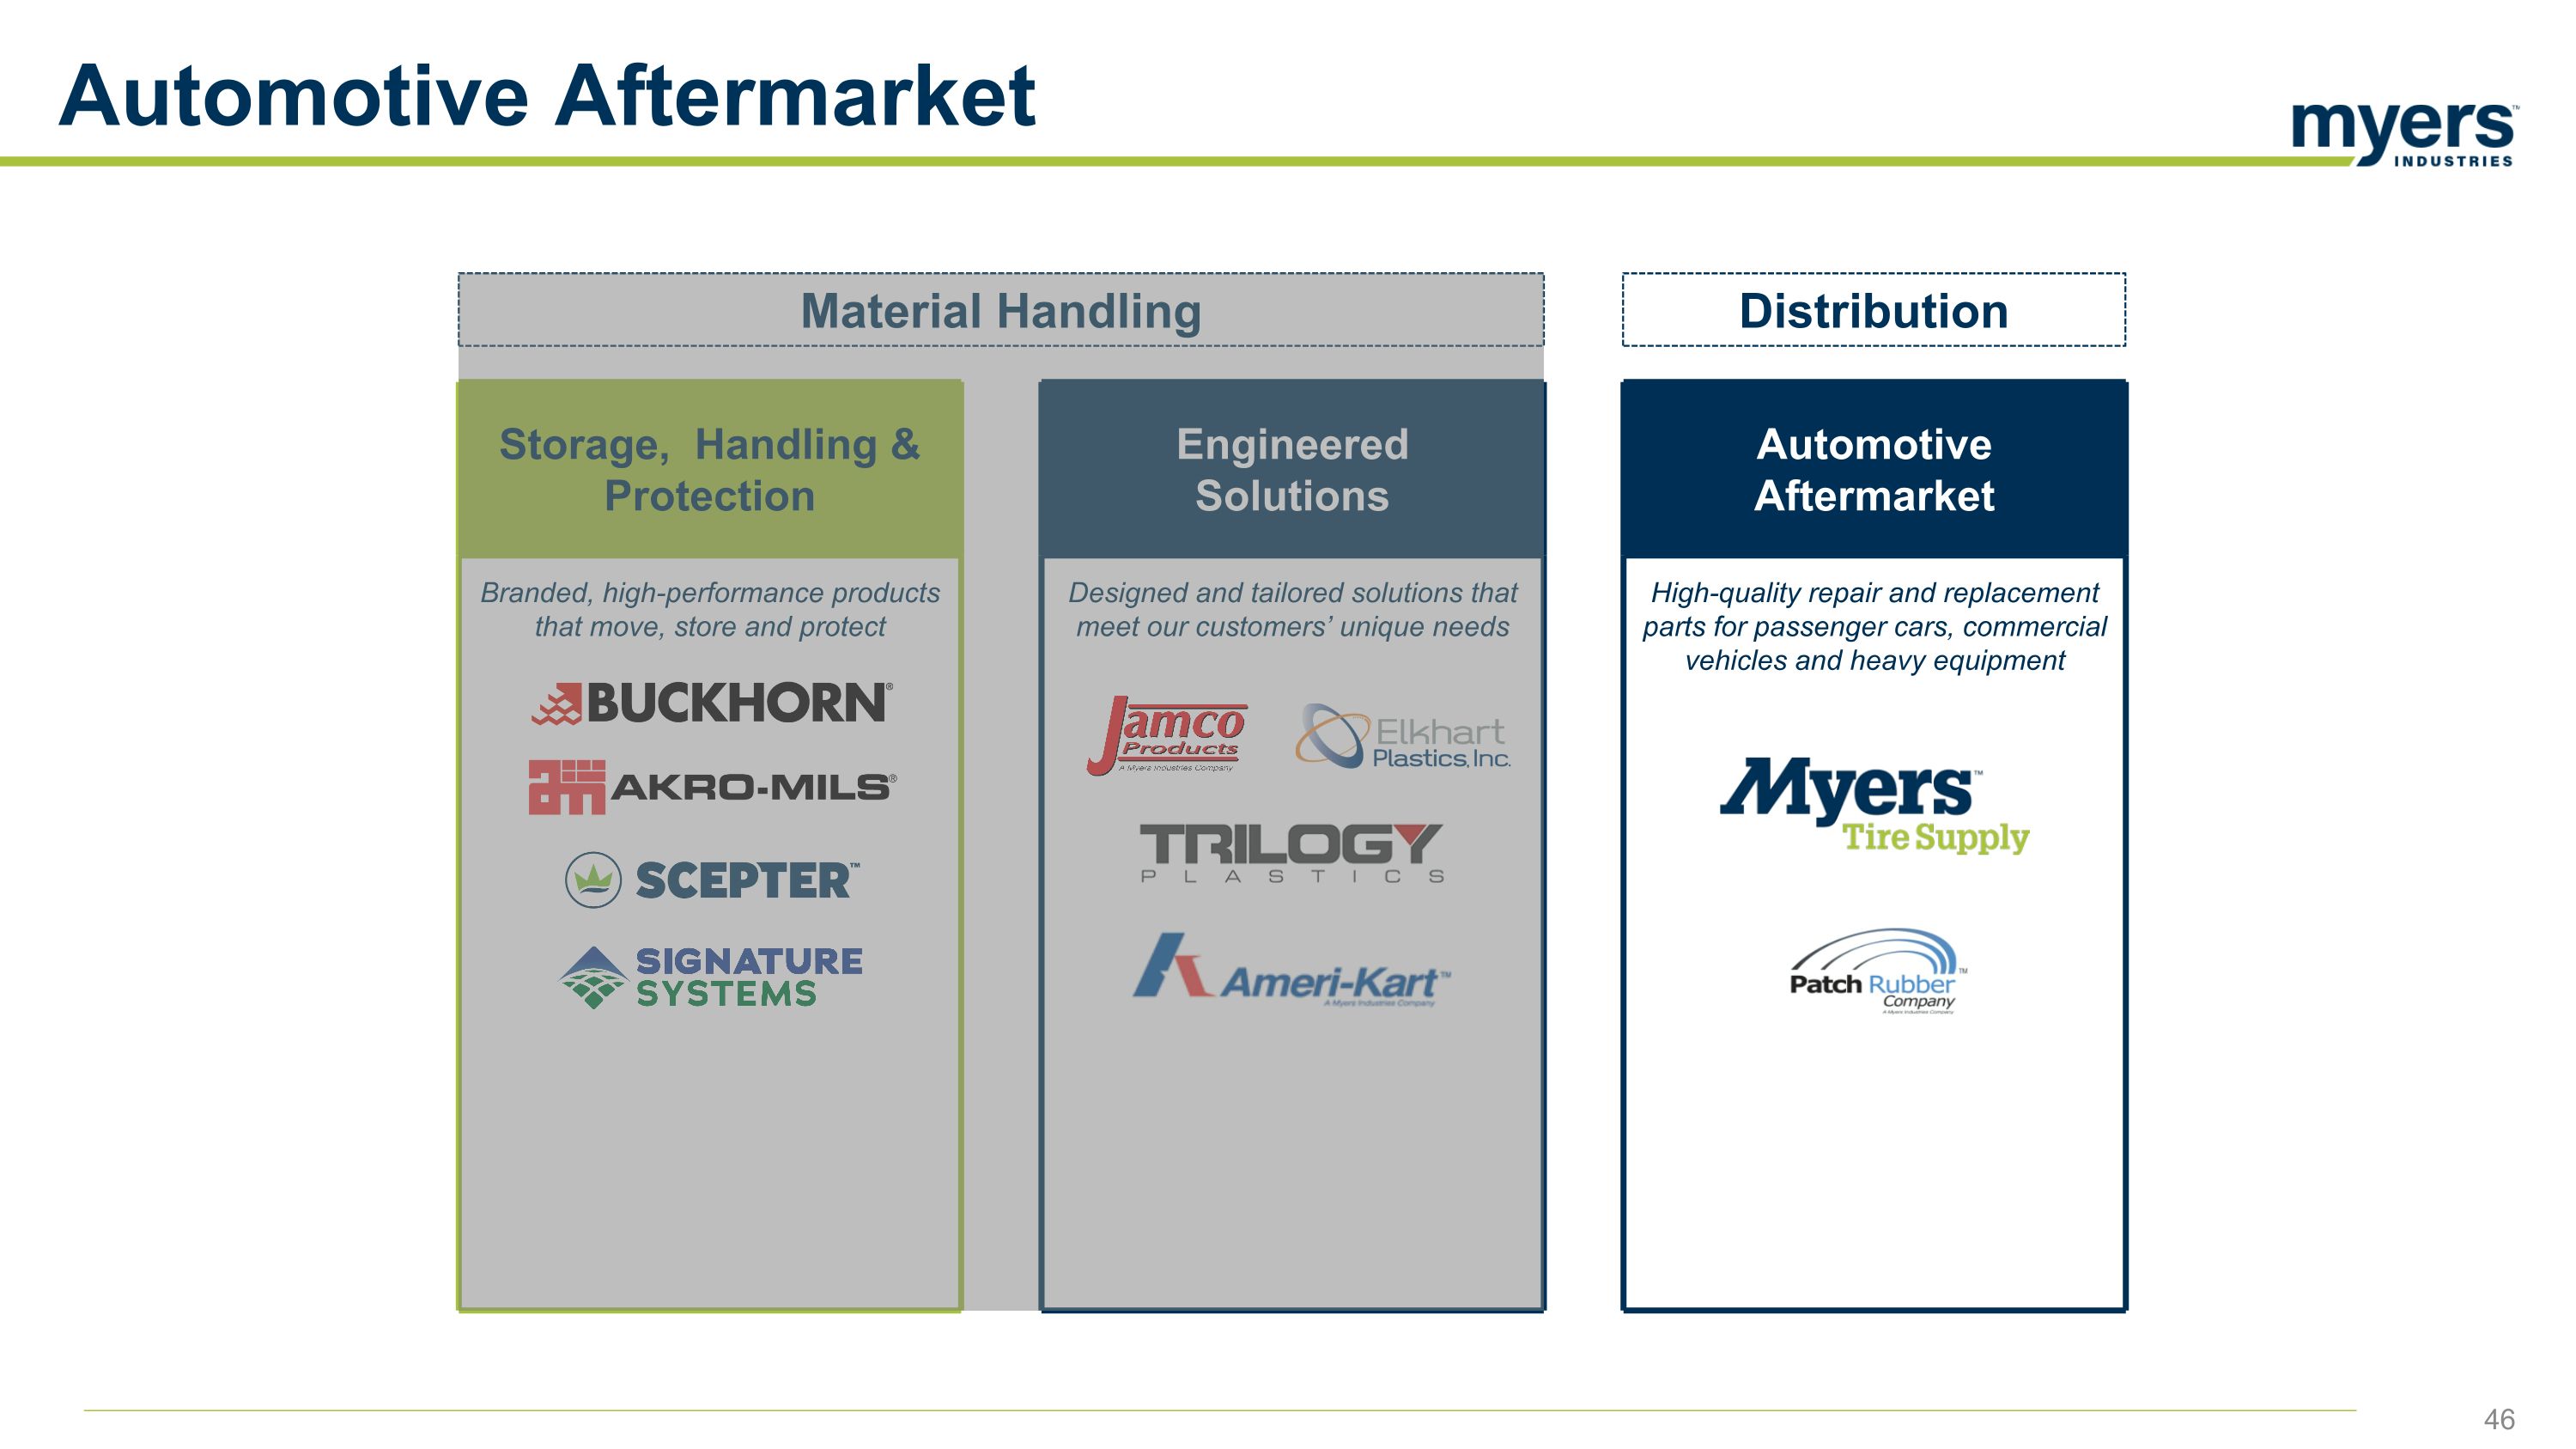
Automotive Aftermarket Automotive Aftermarket High-quality repair and replacement parts for passenger cars, commercial vehicles and heavy equipment Engineered Solutions Designed and tailored solutions that meet our customers’ unique needs Storage, Handling & Protection Branded, high-performance products that move, store and protect Material Handling Distribution
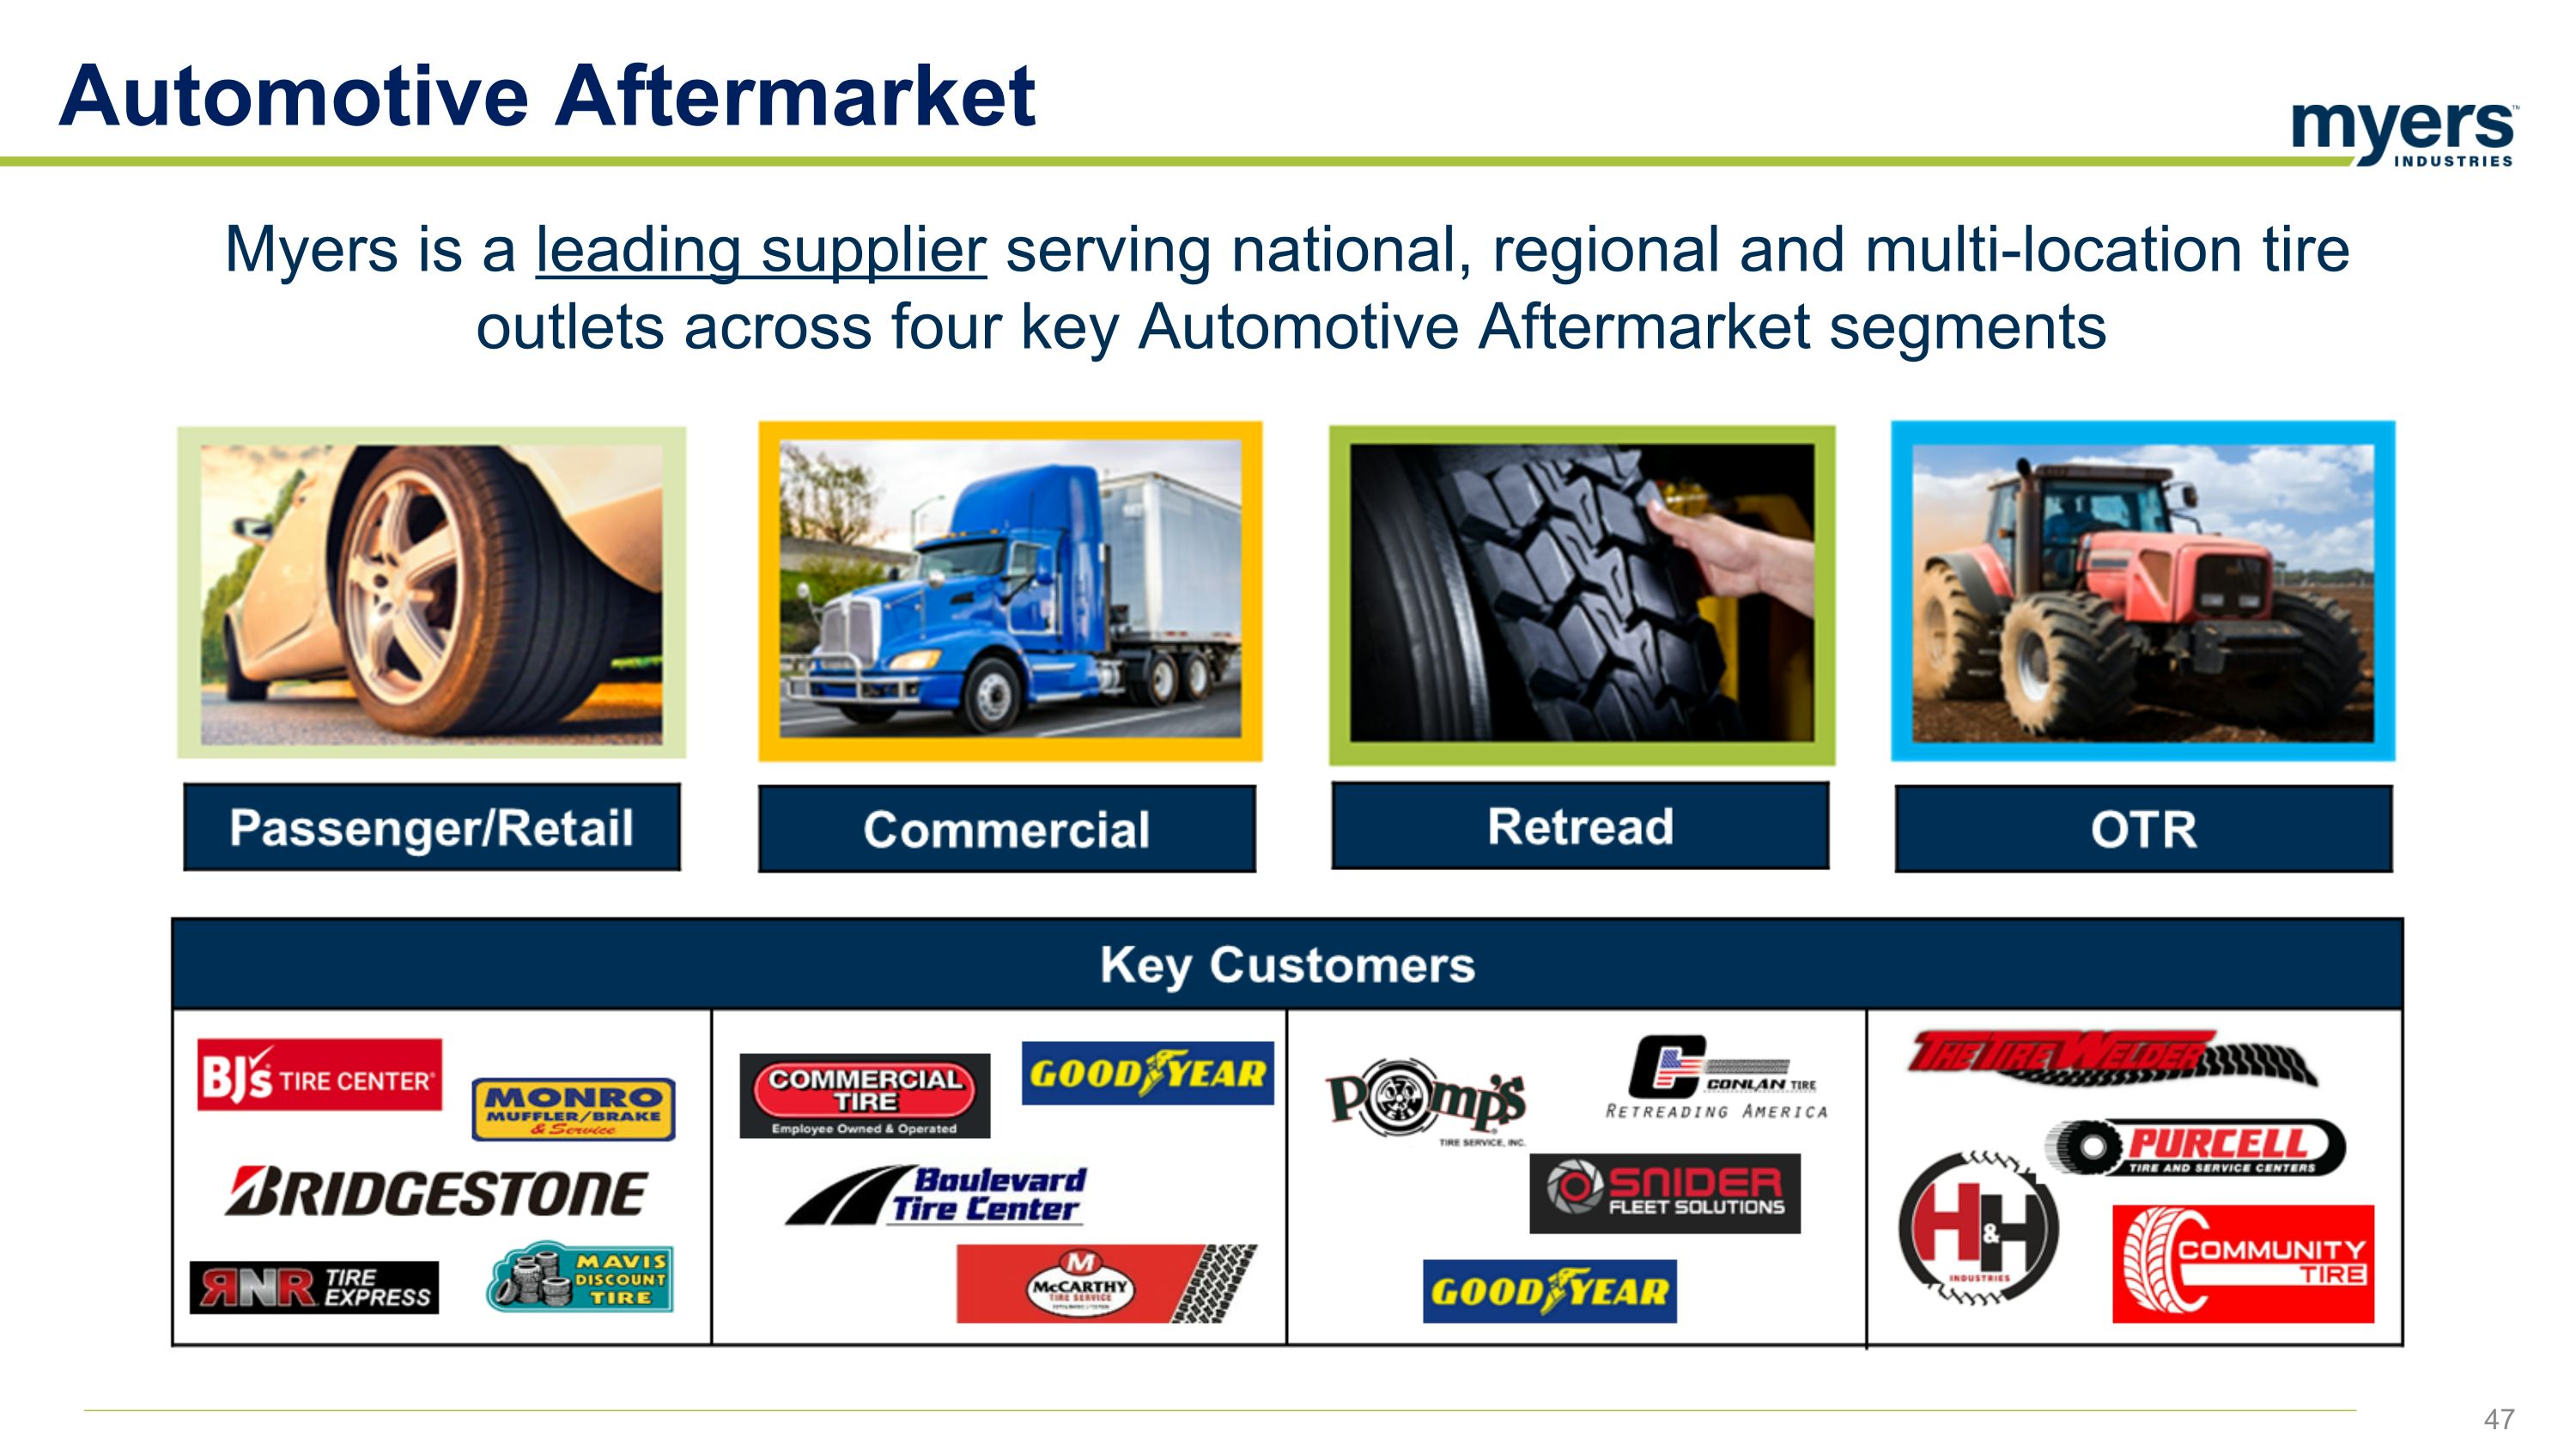
Automotive Aftermarket Myers is a leading supplier serving national, regional and multi-location tire outlets across four key Automotive Aftermarket segments 47
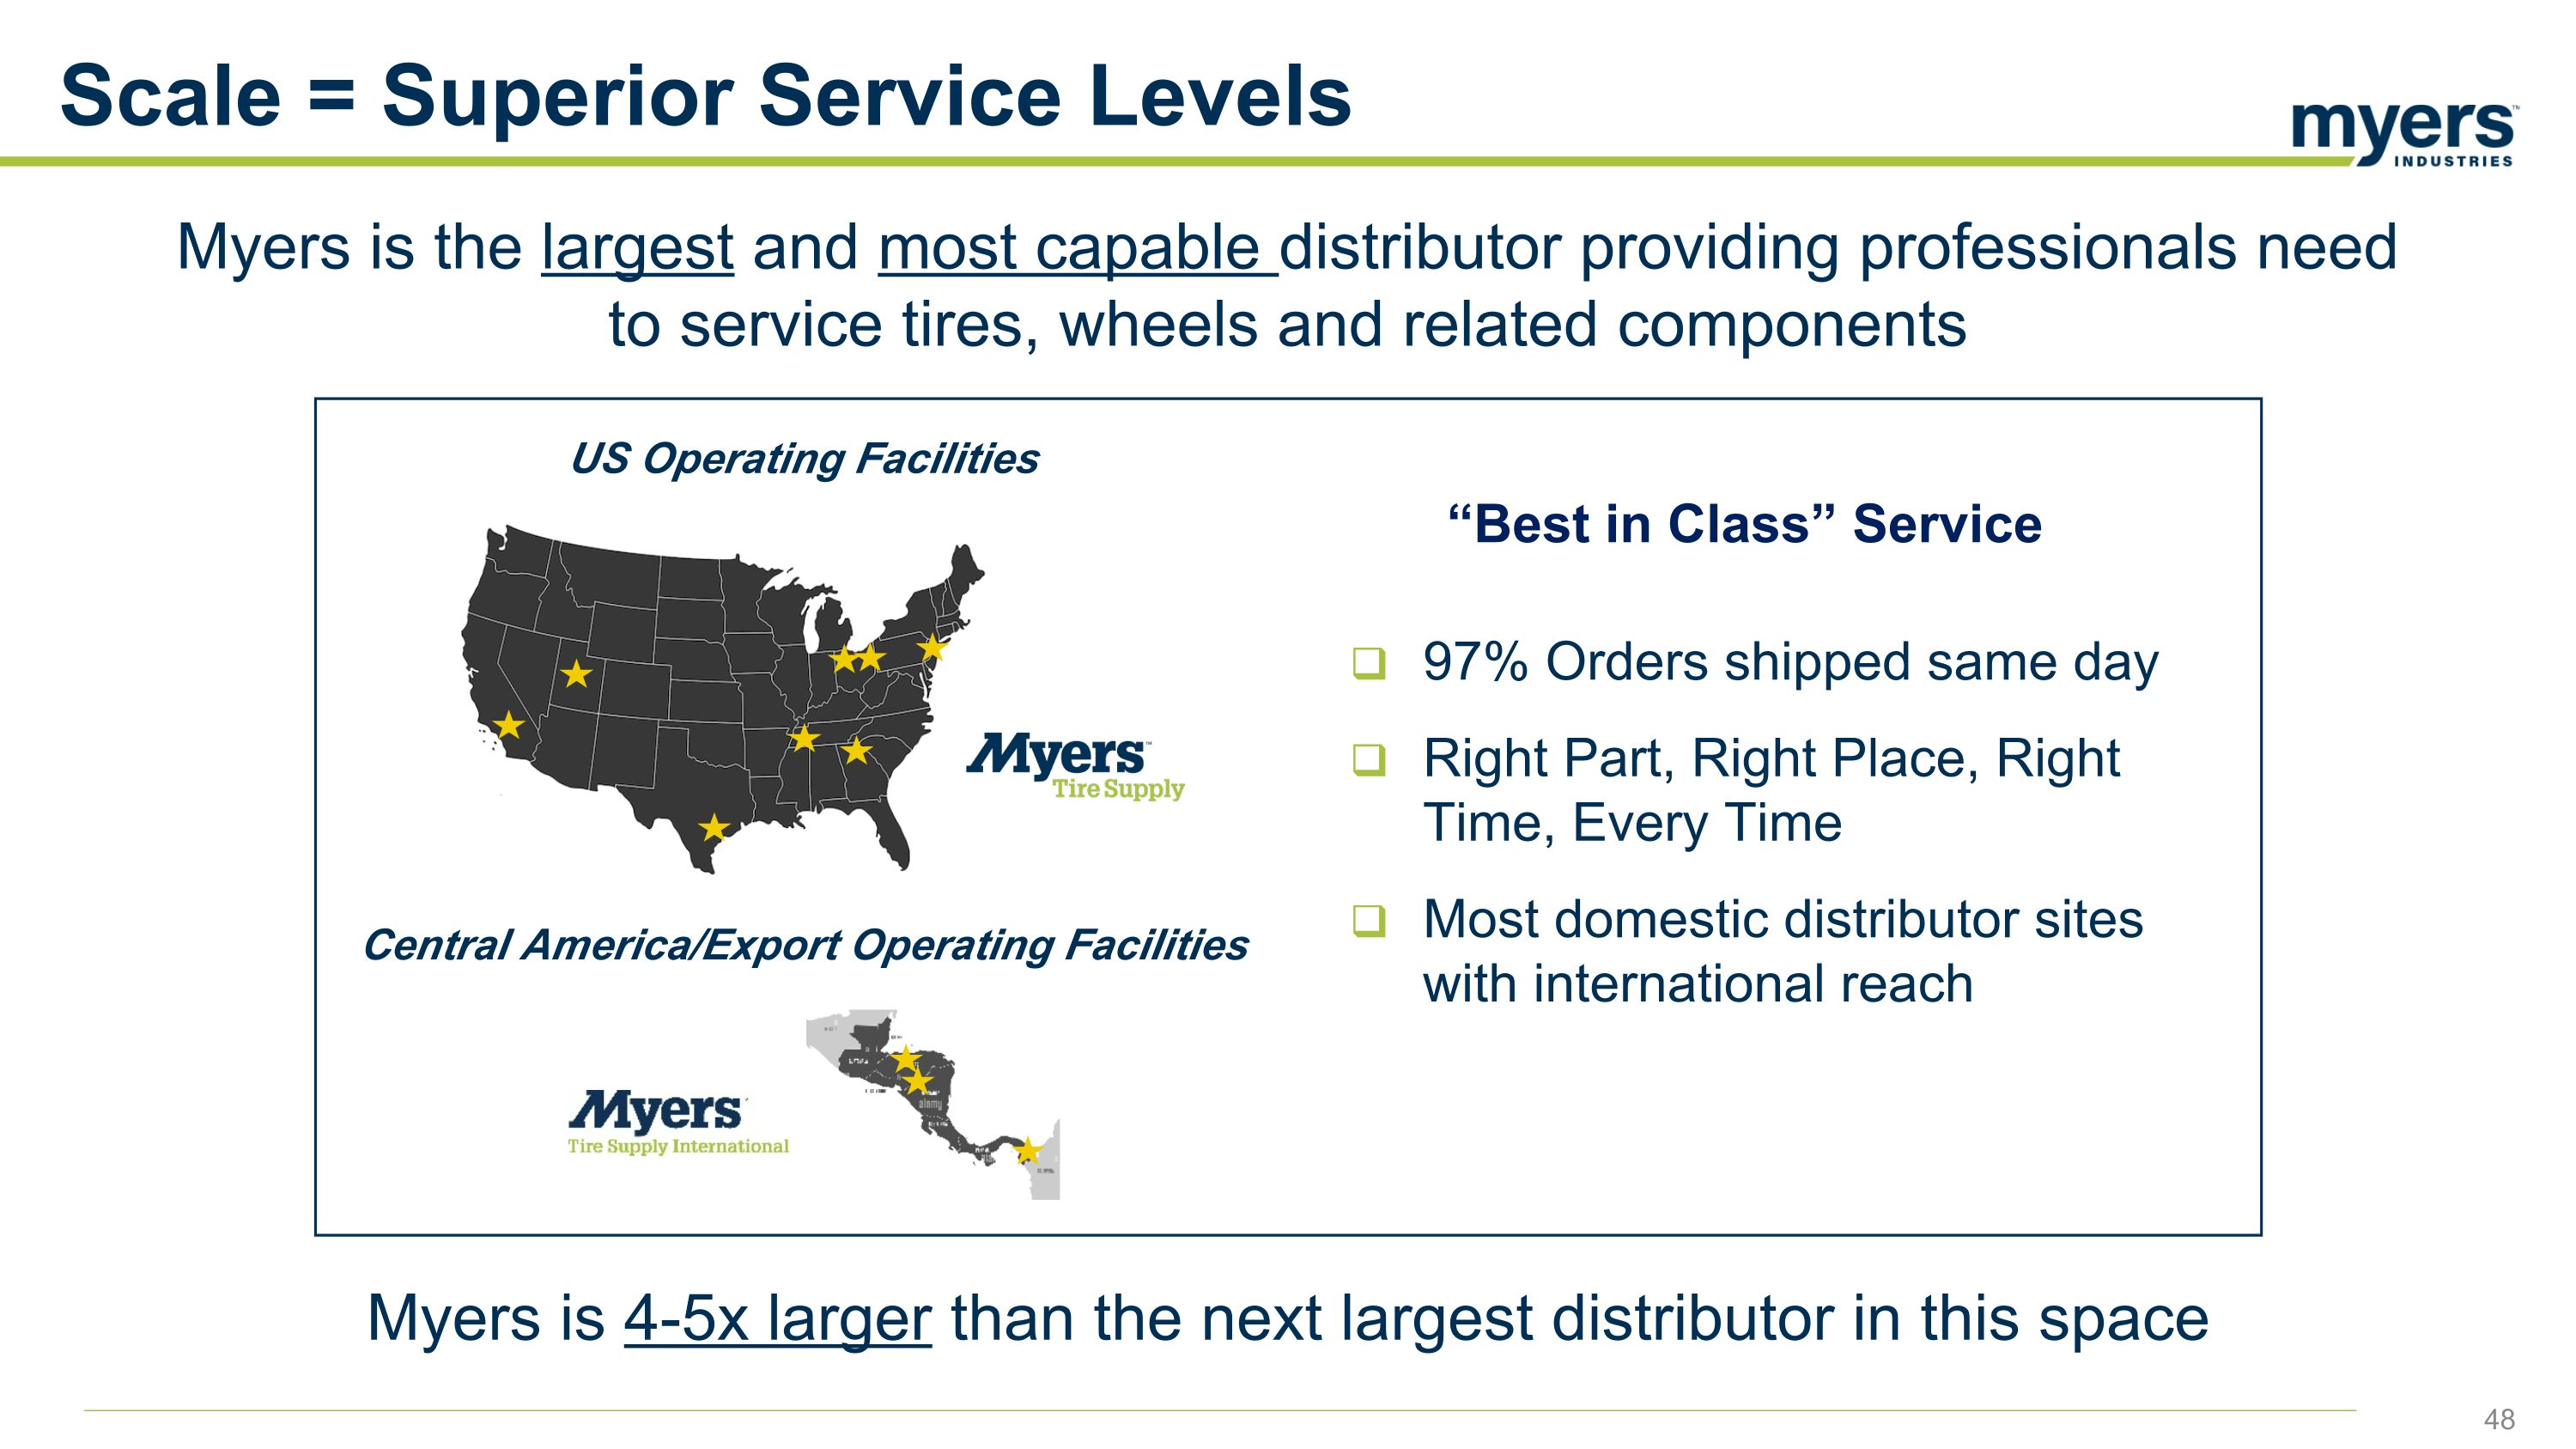
Myers is 4-5x larger than the next largest distributor in this space US Operating Facilities 97% Orders shipped same day Right Part, Right Place, Right Time, Every Time Most domestic distributor sites with international reach Central America/Export Operating Facilities “Best in Class” Service Scale = Superior Service Levels Myers is the largest and most capable distributor providing professionals need to service tires, wheels and related components
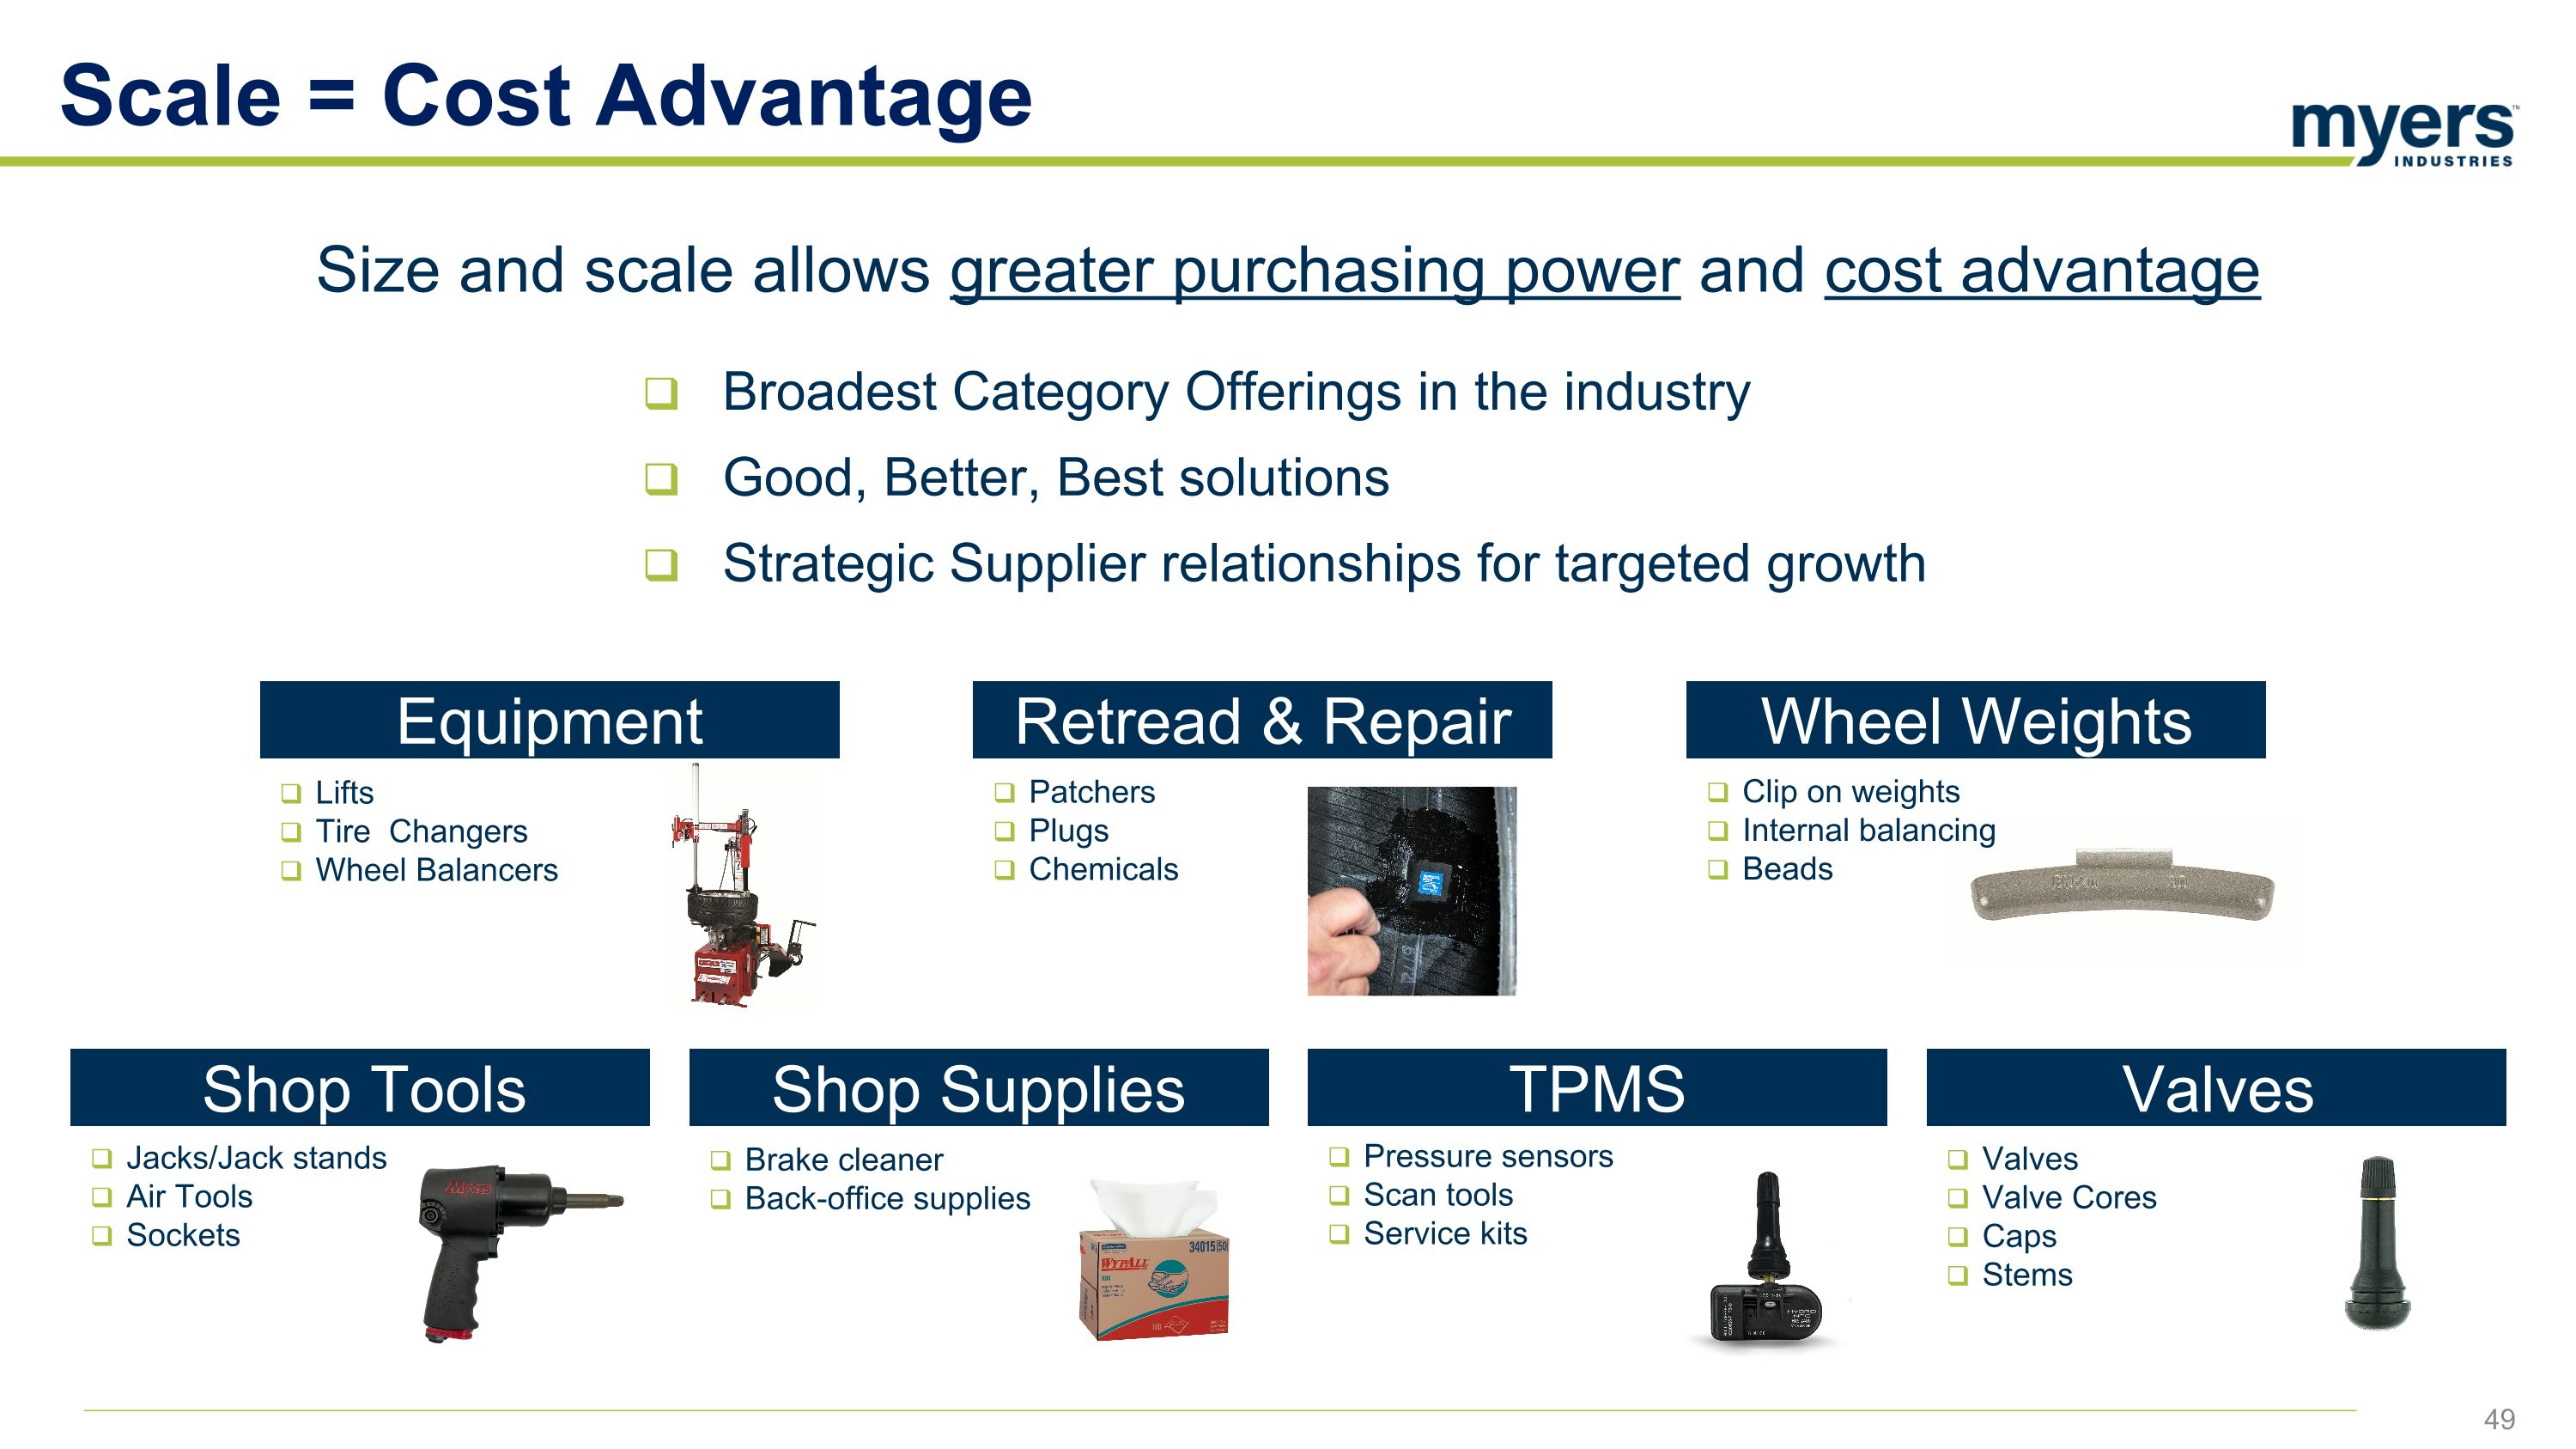
Size and scale allows greater purchasing power and cost advantage Broadest Category Offerings in the industry Good, Better, Best solutions Strategic Supplier relationships for targeted growth Scale = Cost Advantage Equipment Lifts Tire Changers Wheel Balancers Shop Supplies Brake cleaner Back-office supplies TPMS Pressure sensors Scan tools Service kits Shop Tools Jacks/Jack stands Air Tools Sockets Retread & Repair Patchers Plugs Chemicals Valves Valves Valve Cores Caps Stems Wheel Weights Clip on weights Internal balancing Beads
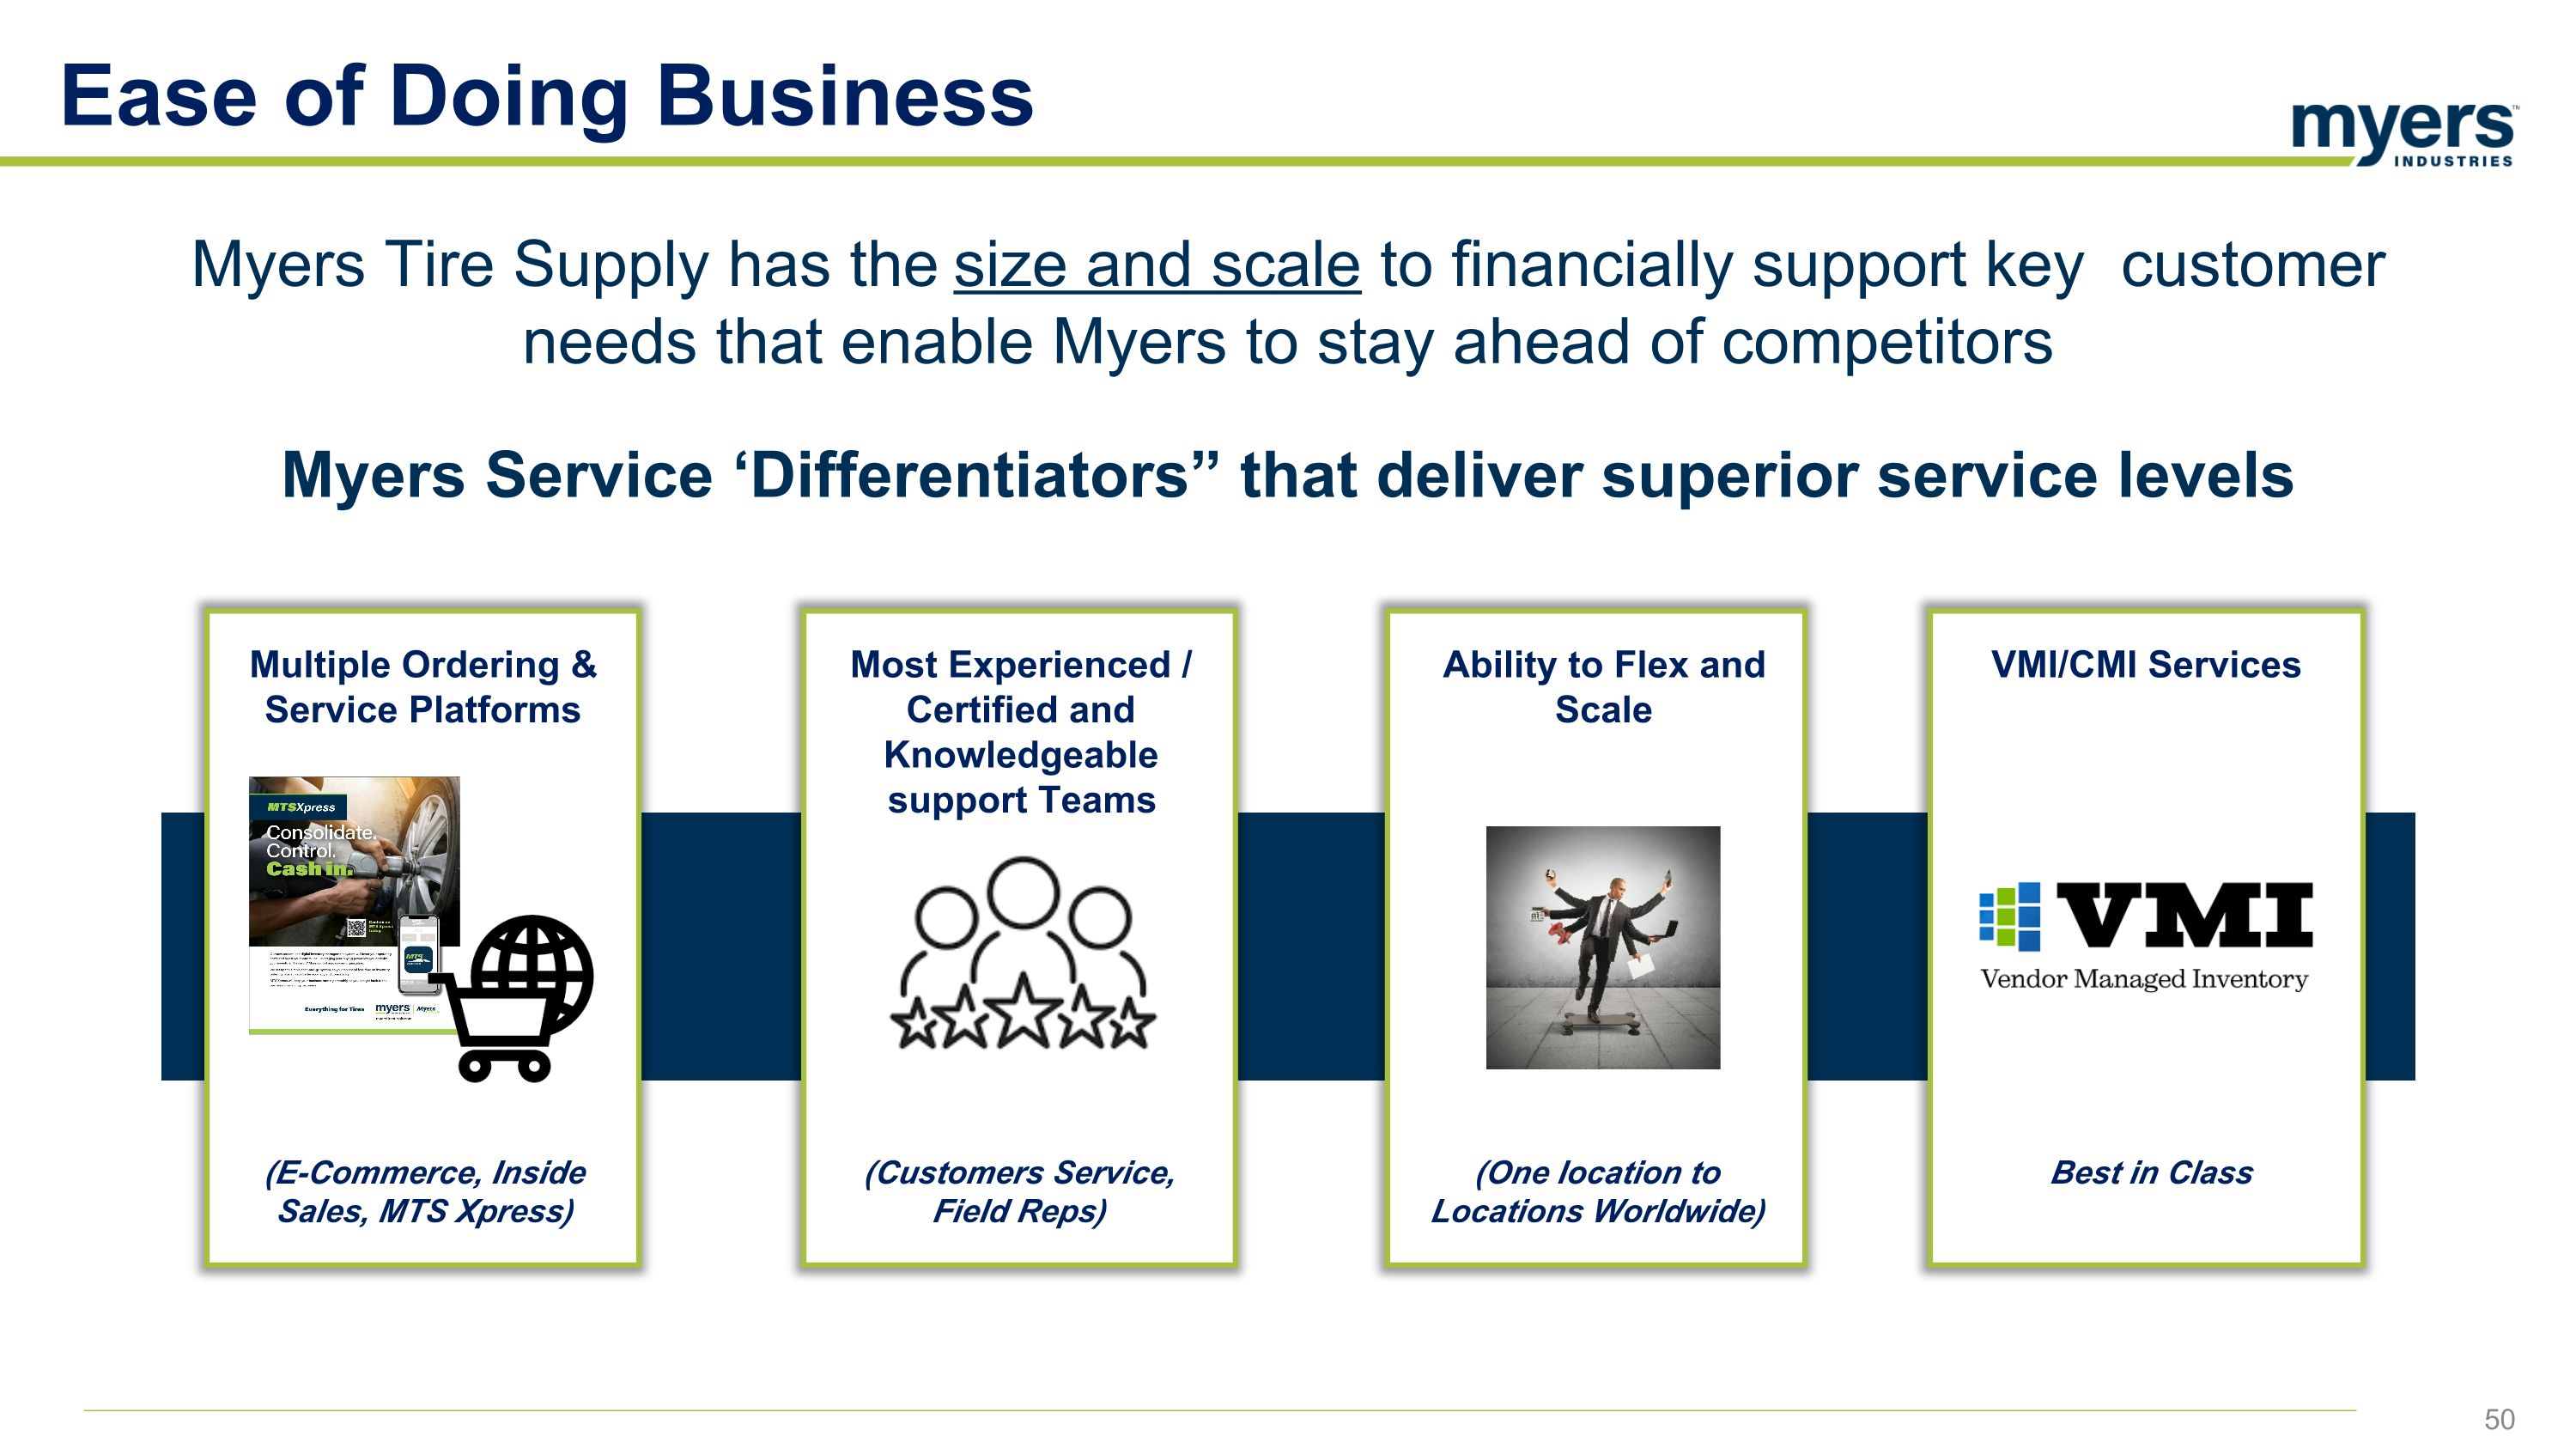
Myers Tire Supply has the size and scale to financially support key customer needs that enable Myers to stay ahead of competitors Myers Service ‘Differentiators” that deliver superior service levels Ease of Doing Business Ability to Flex and Scale (One location to Locations Worldwide) Most Experienced / Certified and Knowledgeable support Teams (Customers Service, Field Reps) Multiple Ordering & Service Platforms (E-Commerce, Inside Sales, MTS Xpress) VMI/CMI Services Best in Class
Pro Sales Myers Service ‘Differentiators” that deliver superior service levels Dedicated Corporate and Regional Account Managers – Industry Leaders Market-focused specialized reps Inside/Outside – Industry Leaders Provide business solution – Product training, certifications, safety audits Reps solve customer problems – Help them win in the marketplace Myers Tire Supply has a strong brand supported by an experienced well-trained team The business is built on relationships and service Myers wins on both
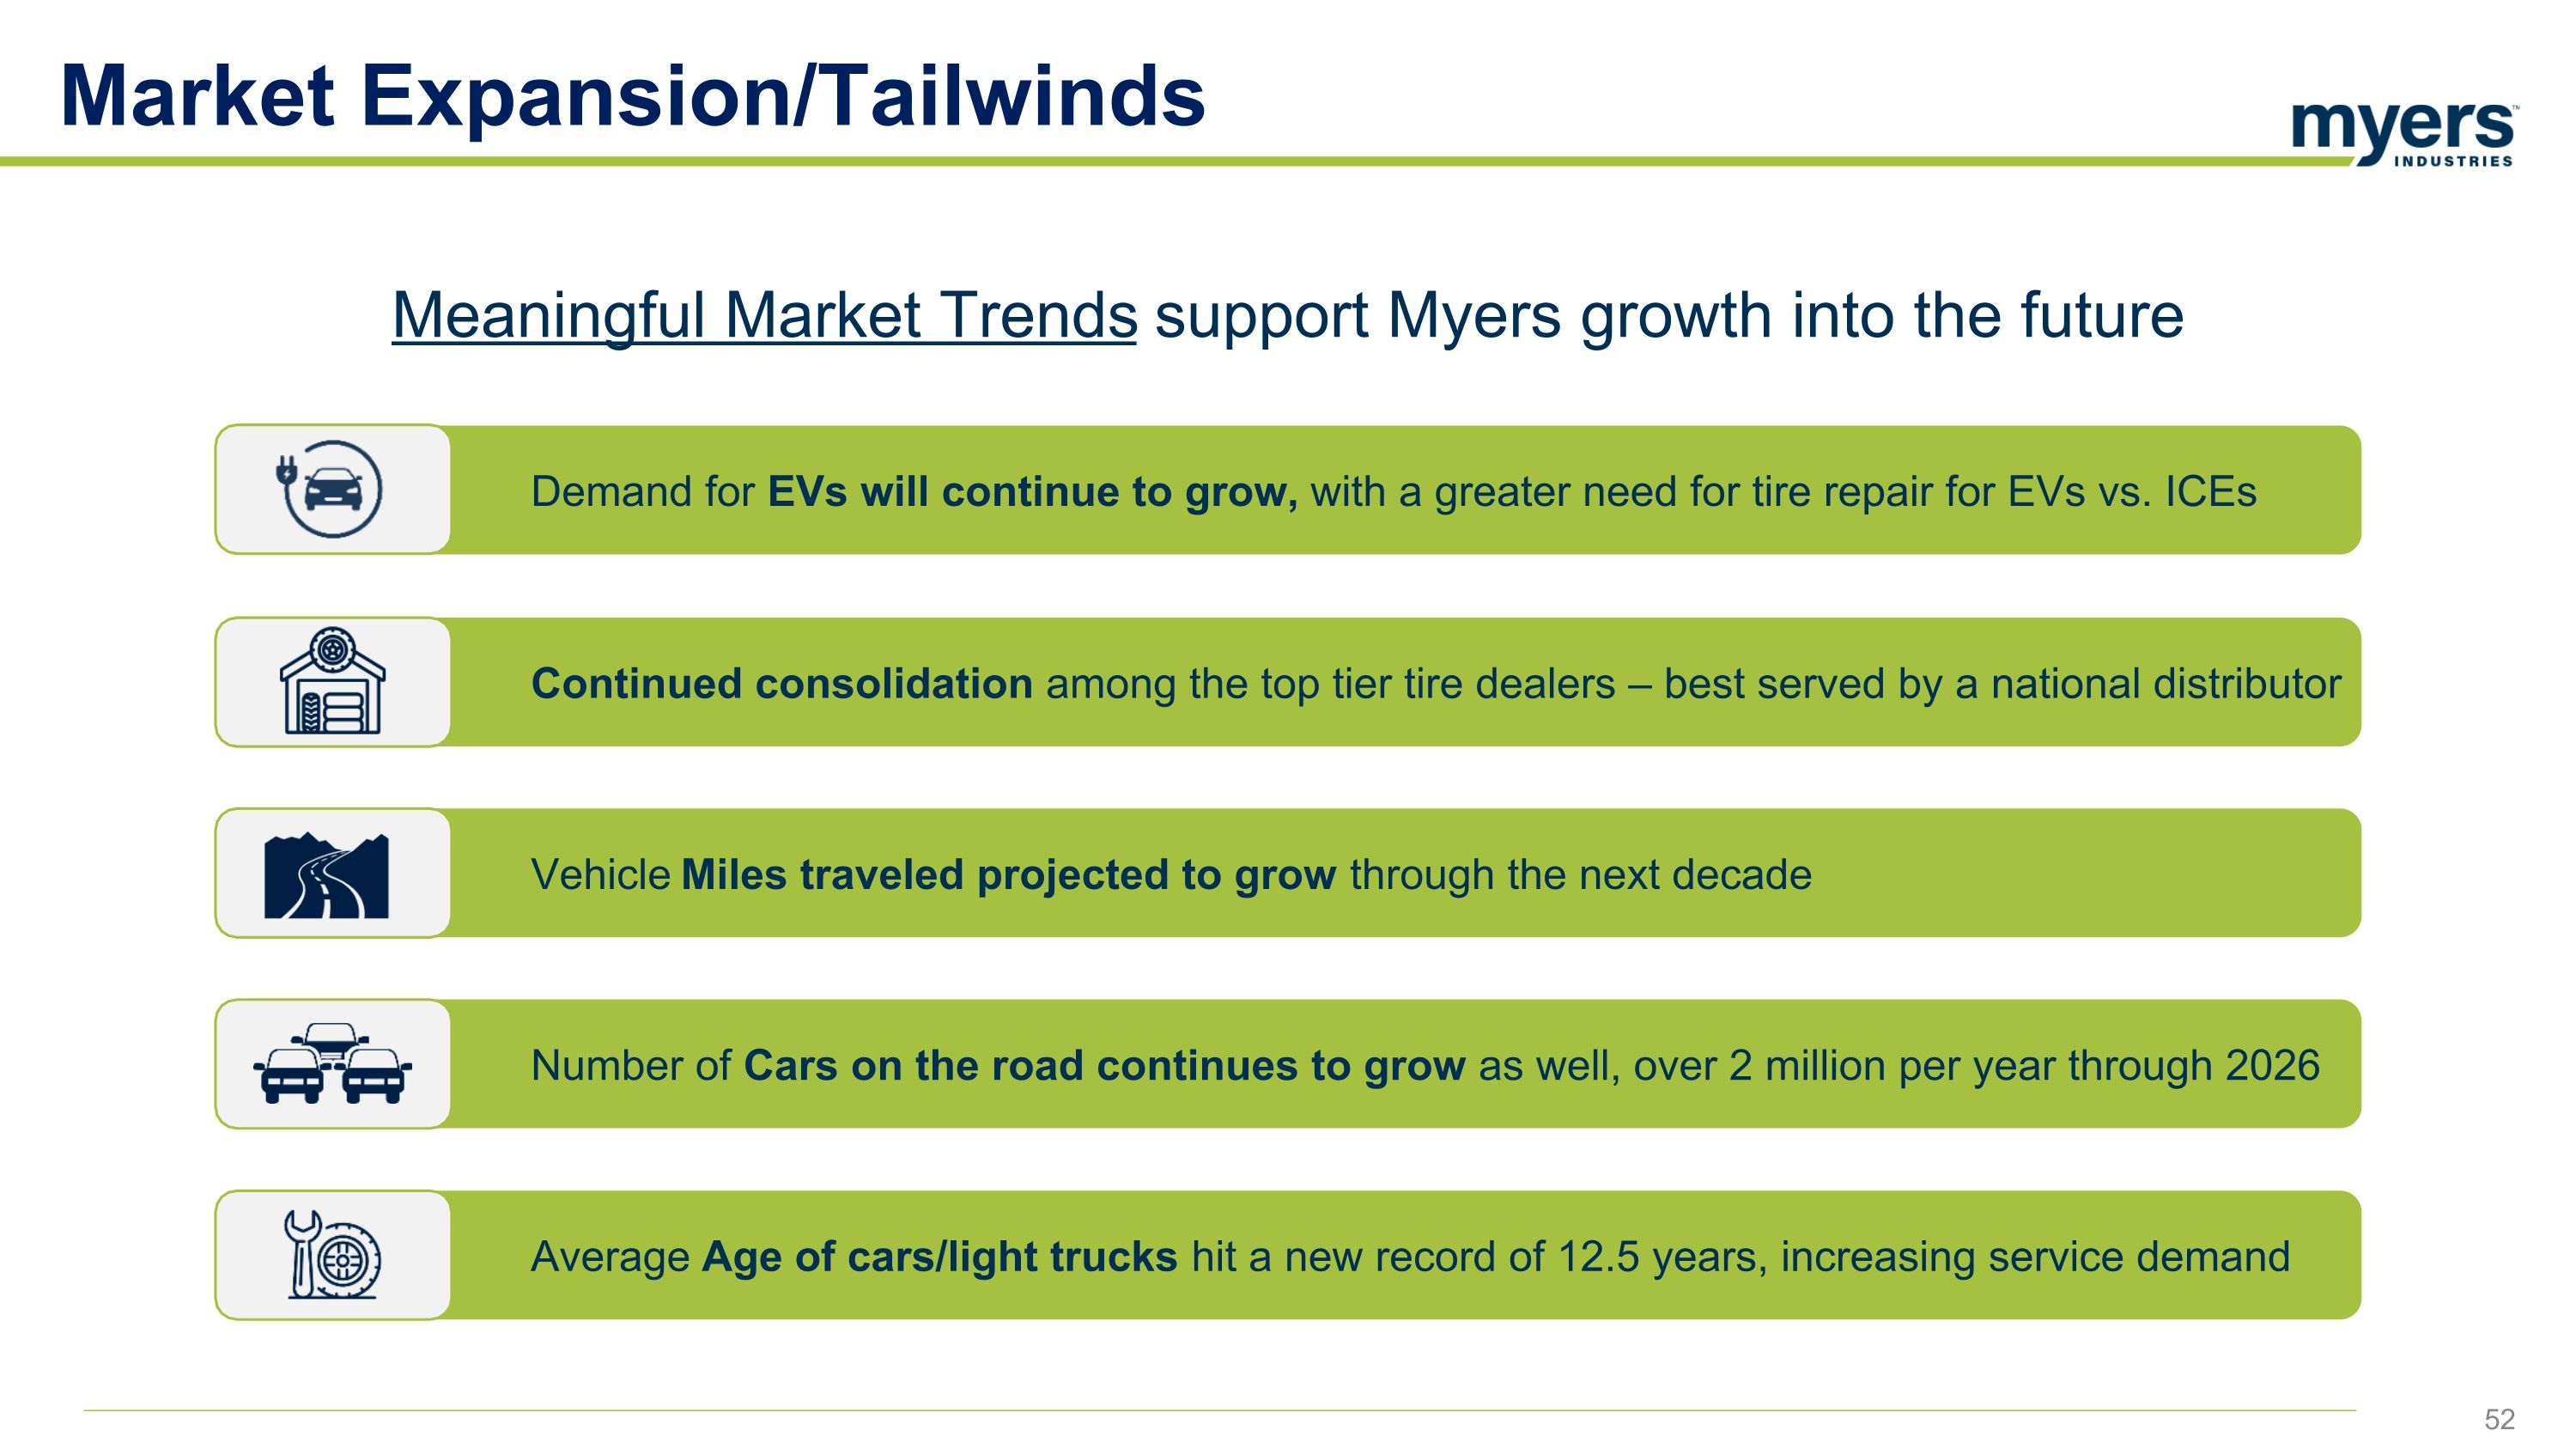
Demand for EVs will continue to grow, with a greater need for tire repair for EVs vs. ICEs Continued consolidation among the top tier tire dealers – best served by a national distributor Vehicle Miles traveled projected to grow through the next decade Number of Cars on the road continues to grow as well, over 2 million per year through 2026 Average Age of cars/light trucks hit a new record of 12.5 years, increasing service demand Meaningful Market Trends support Myers growth into the future Market Expansion/Tailwinds
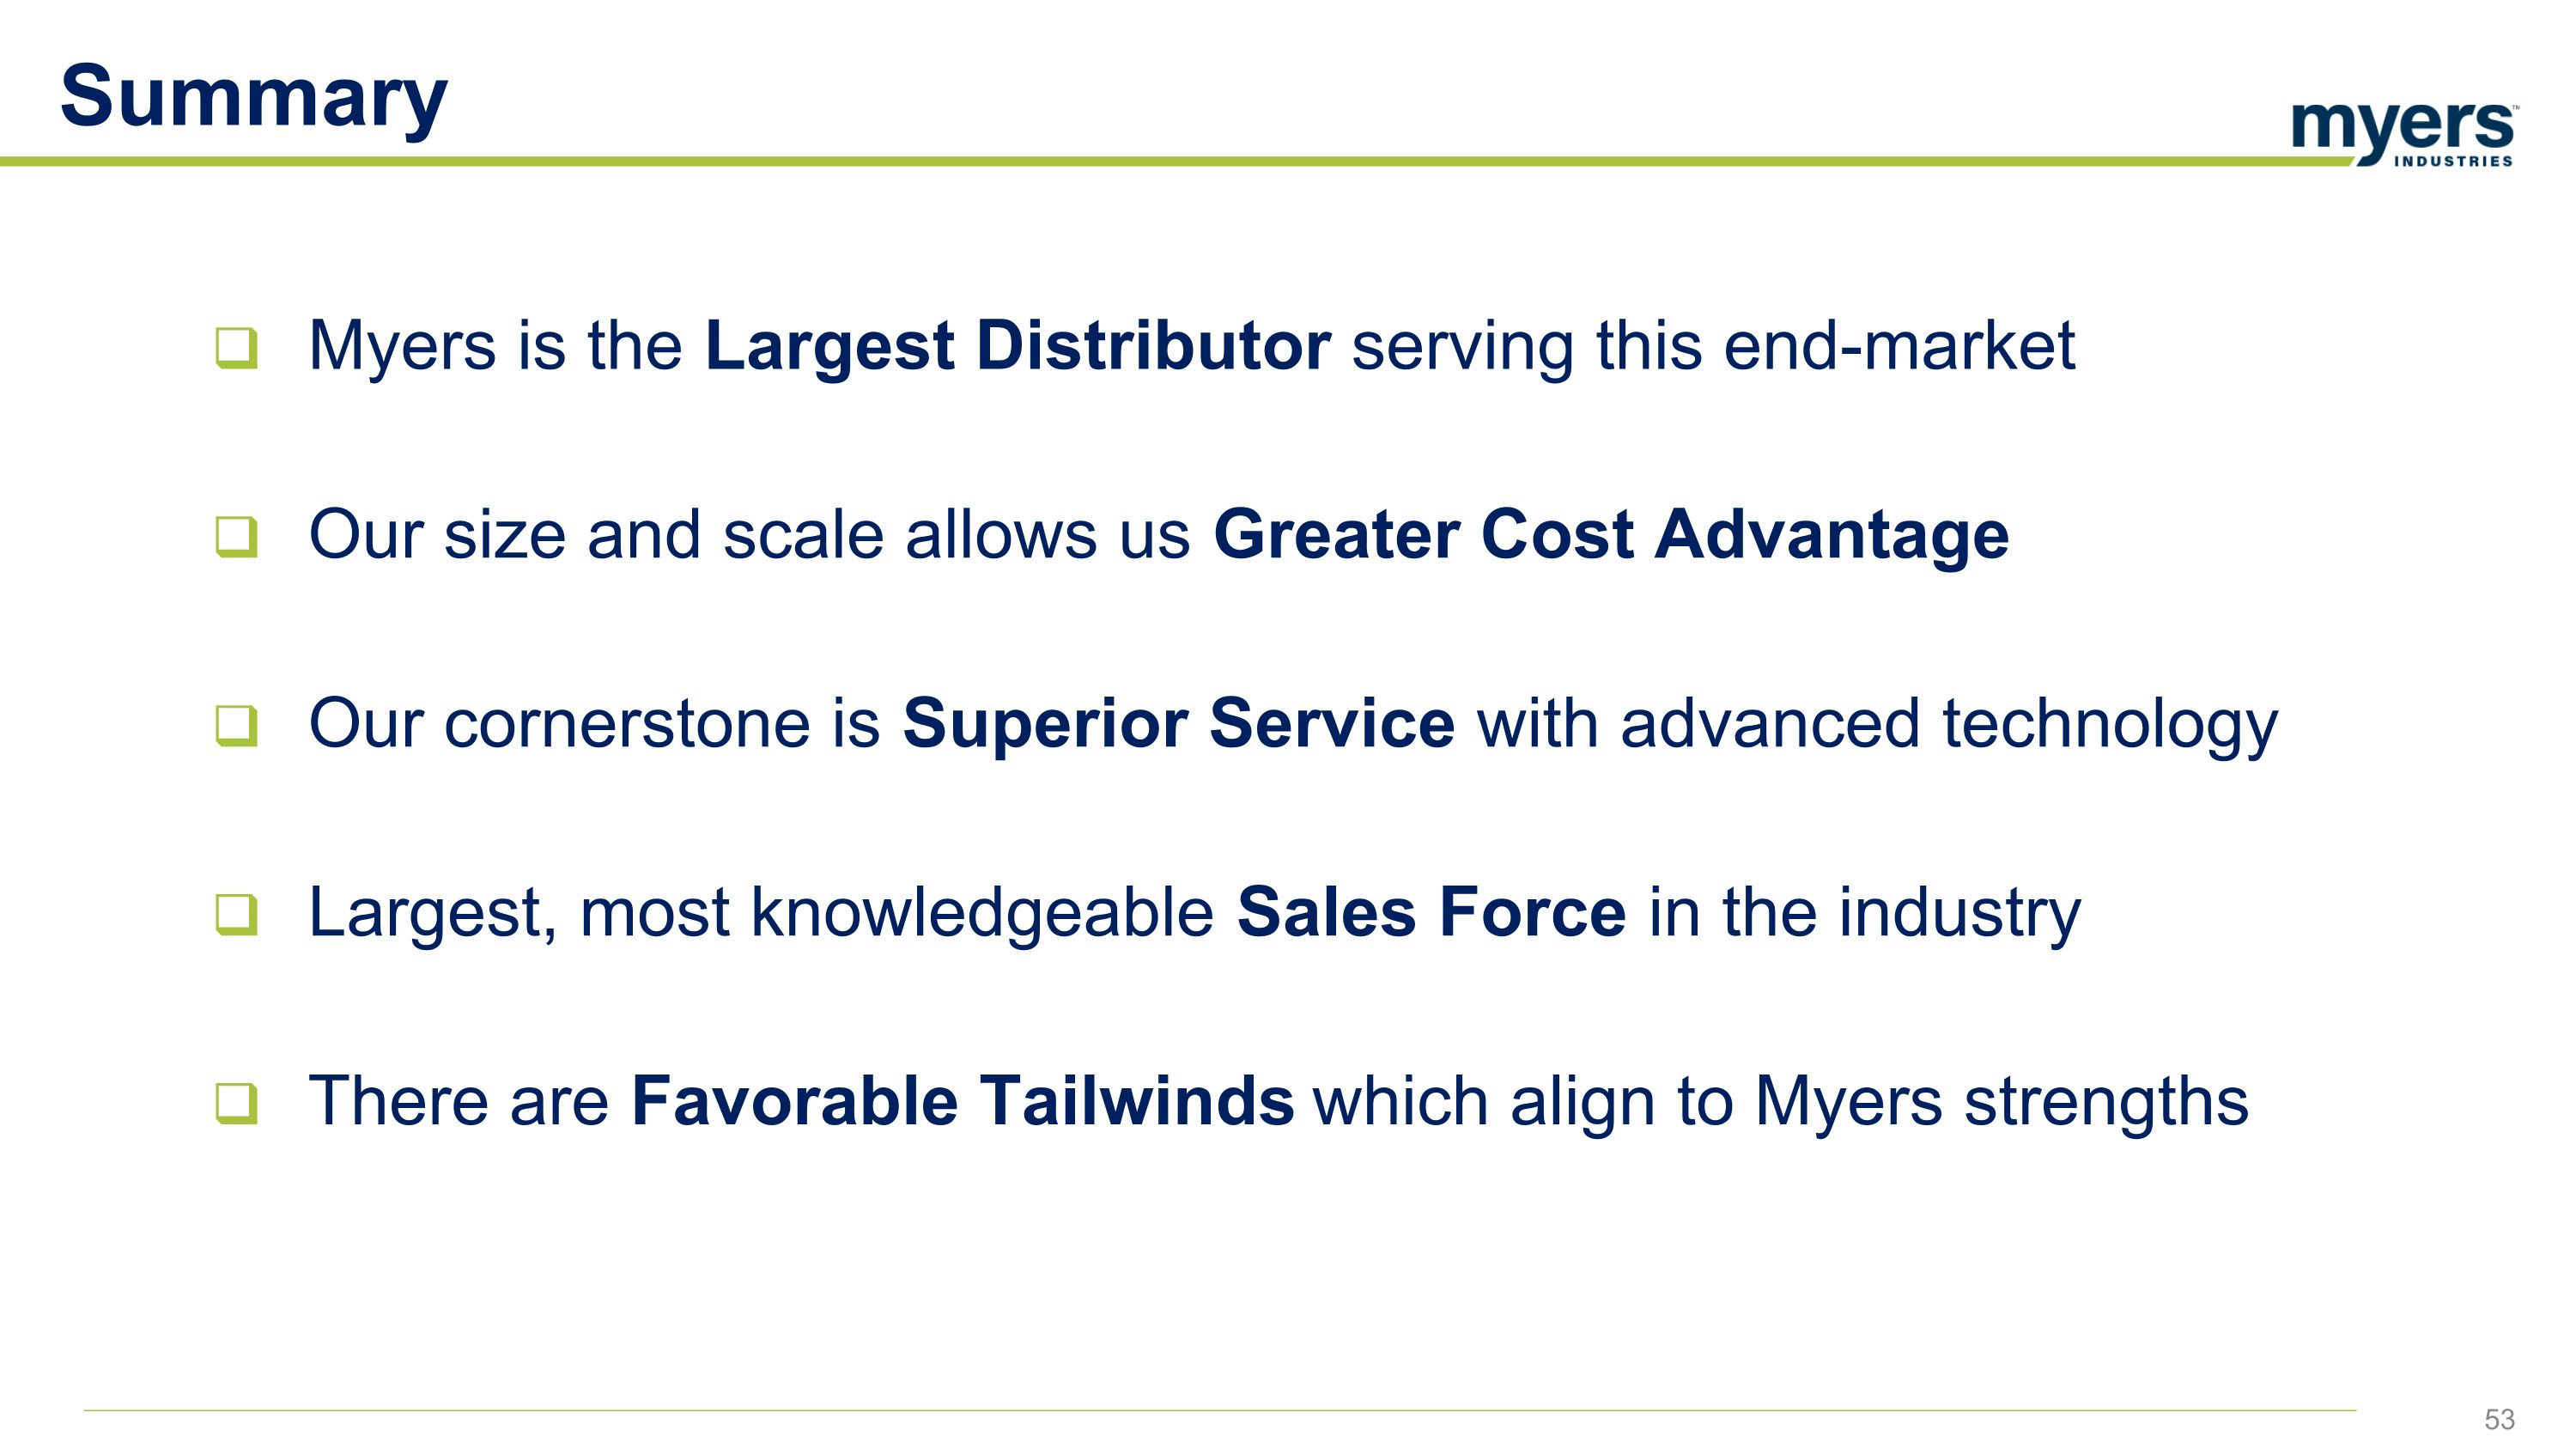
Myers is the Largest Distributor serving this end-market Our size and scale allows us Greater Cost Advantage Our cornerstone is Superior Service with advanced technology Largest, most knowledgeable Sales Force in the industry There are Favorable Tailwinds which align to Myers strengths Summary
Material Handling Dave Basque, Business Vice President 54
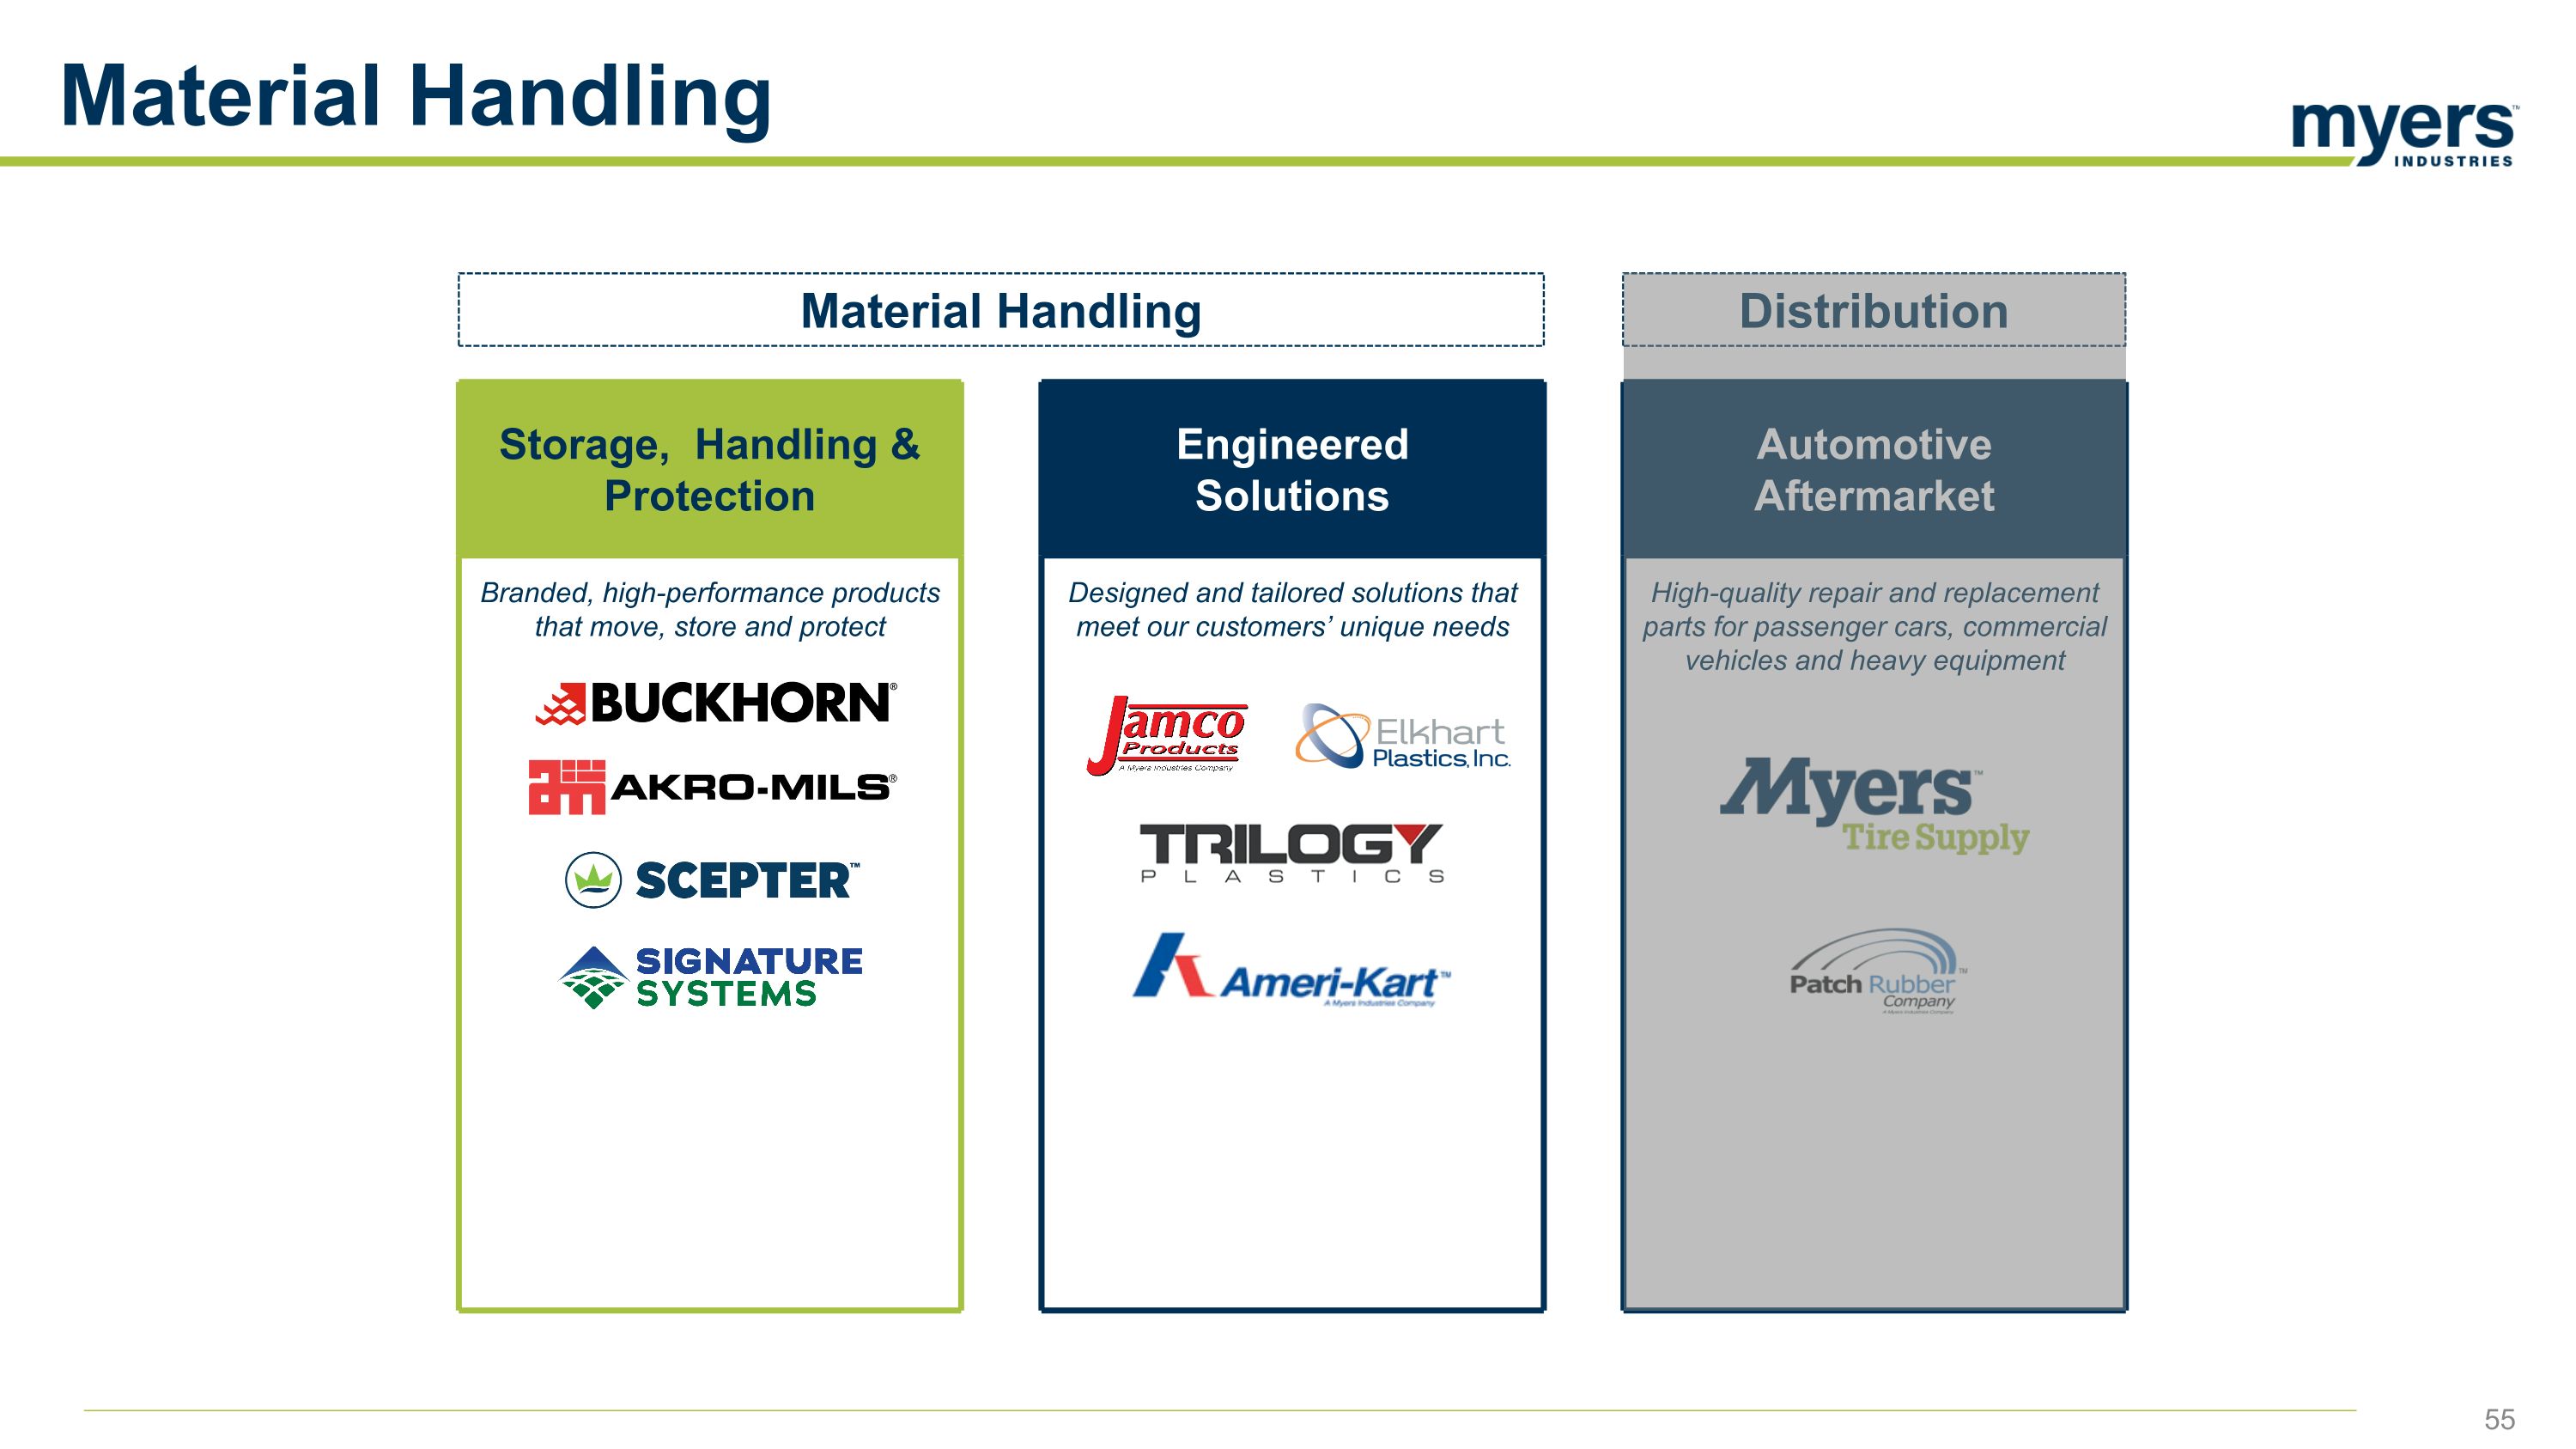
Material Handling Automotive Aftermarket High-quality repair and replacement parts for passenger cars, commercial vehicles and heavy equipment Engineered Solutions Designed and tailored solutions that meet our customers’ unique needs Storage, Handling & Protection Branded, high-performance products that move, store and protect Material Handling Distribution
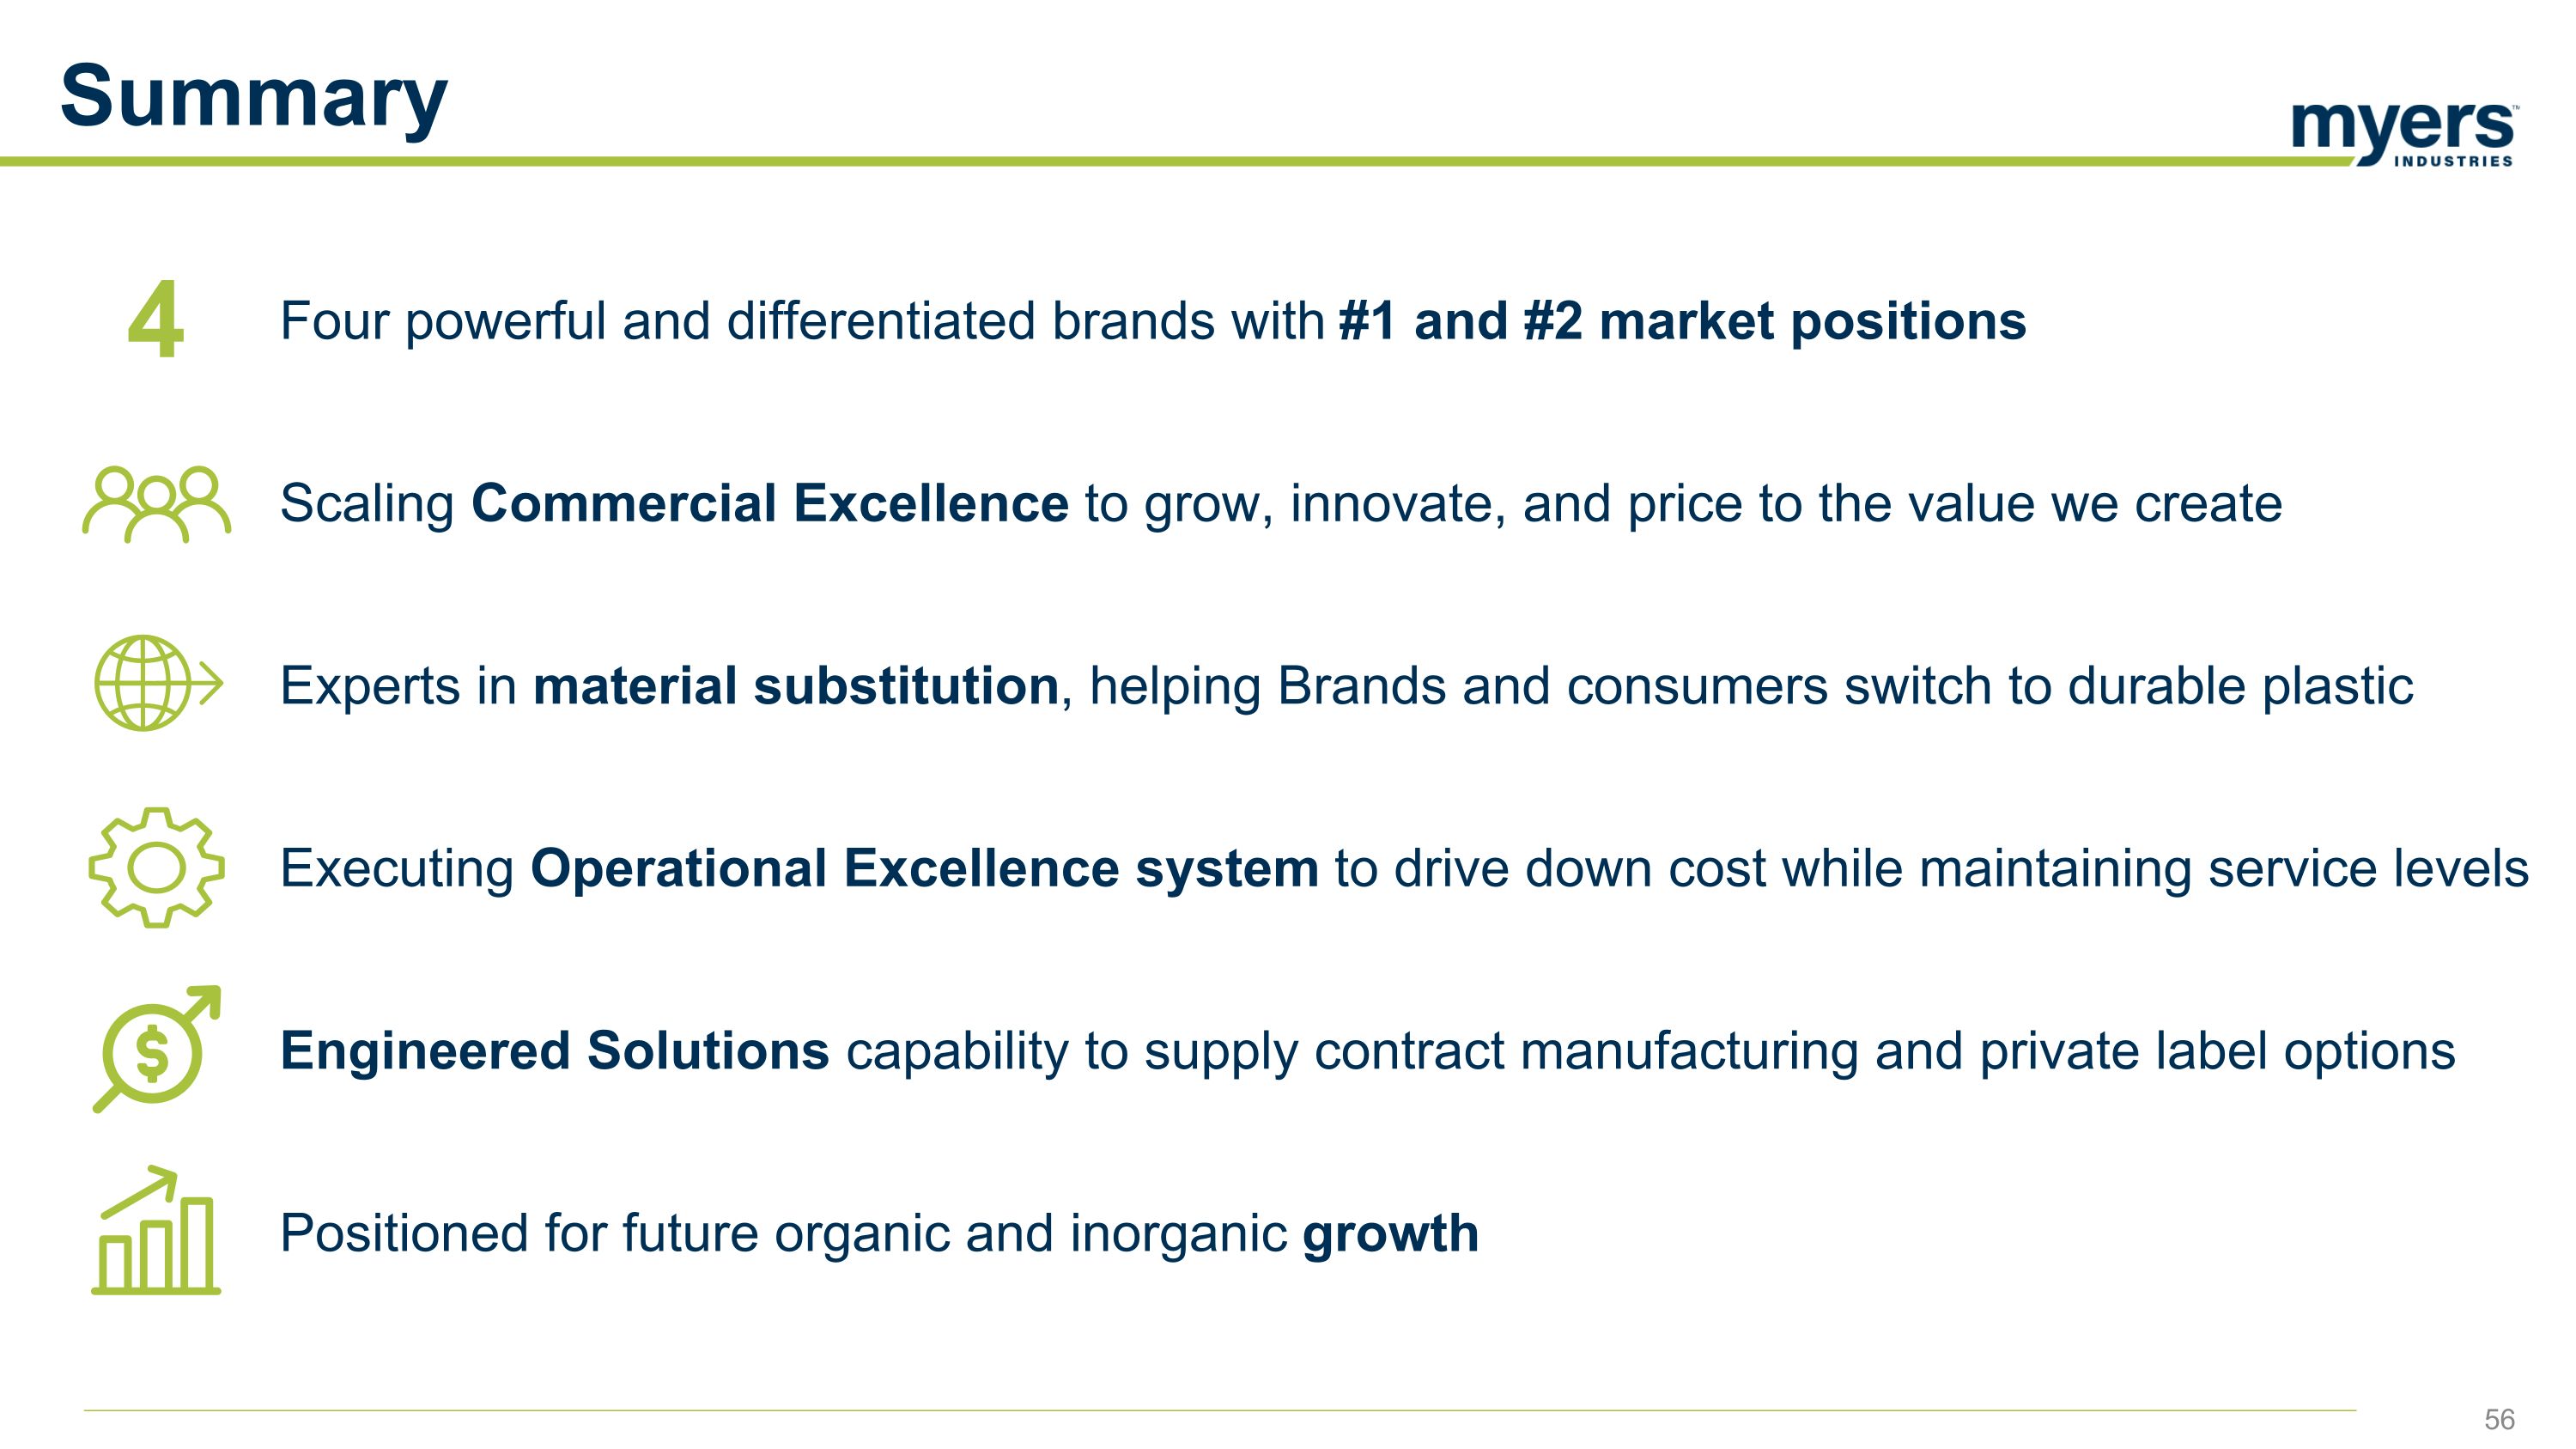
Summary Four powerful and differentiated brands with #1 and #2 market positions Scaling Commercial Excellence to grow, innovate, and price to the value we create Experts in material substitution, helping Brands and consumers switch to durable plastic Executing Operational Excellence system to drive down cost while maintaining service levels Engineered Solutions capability to supply contract manufacturing and private label options Positioned for future organic and inorganic growth 4
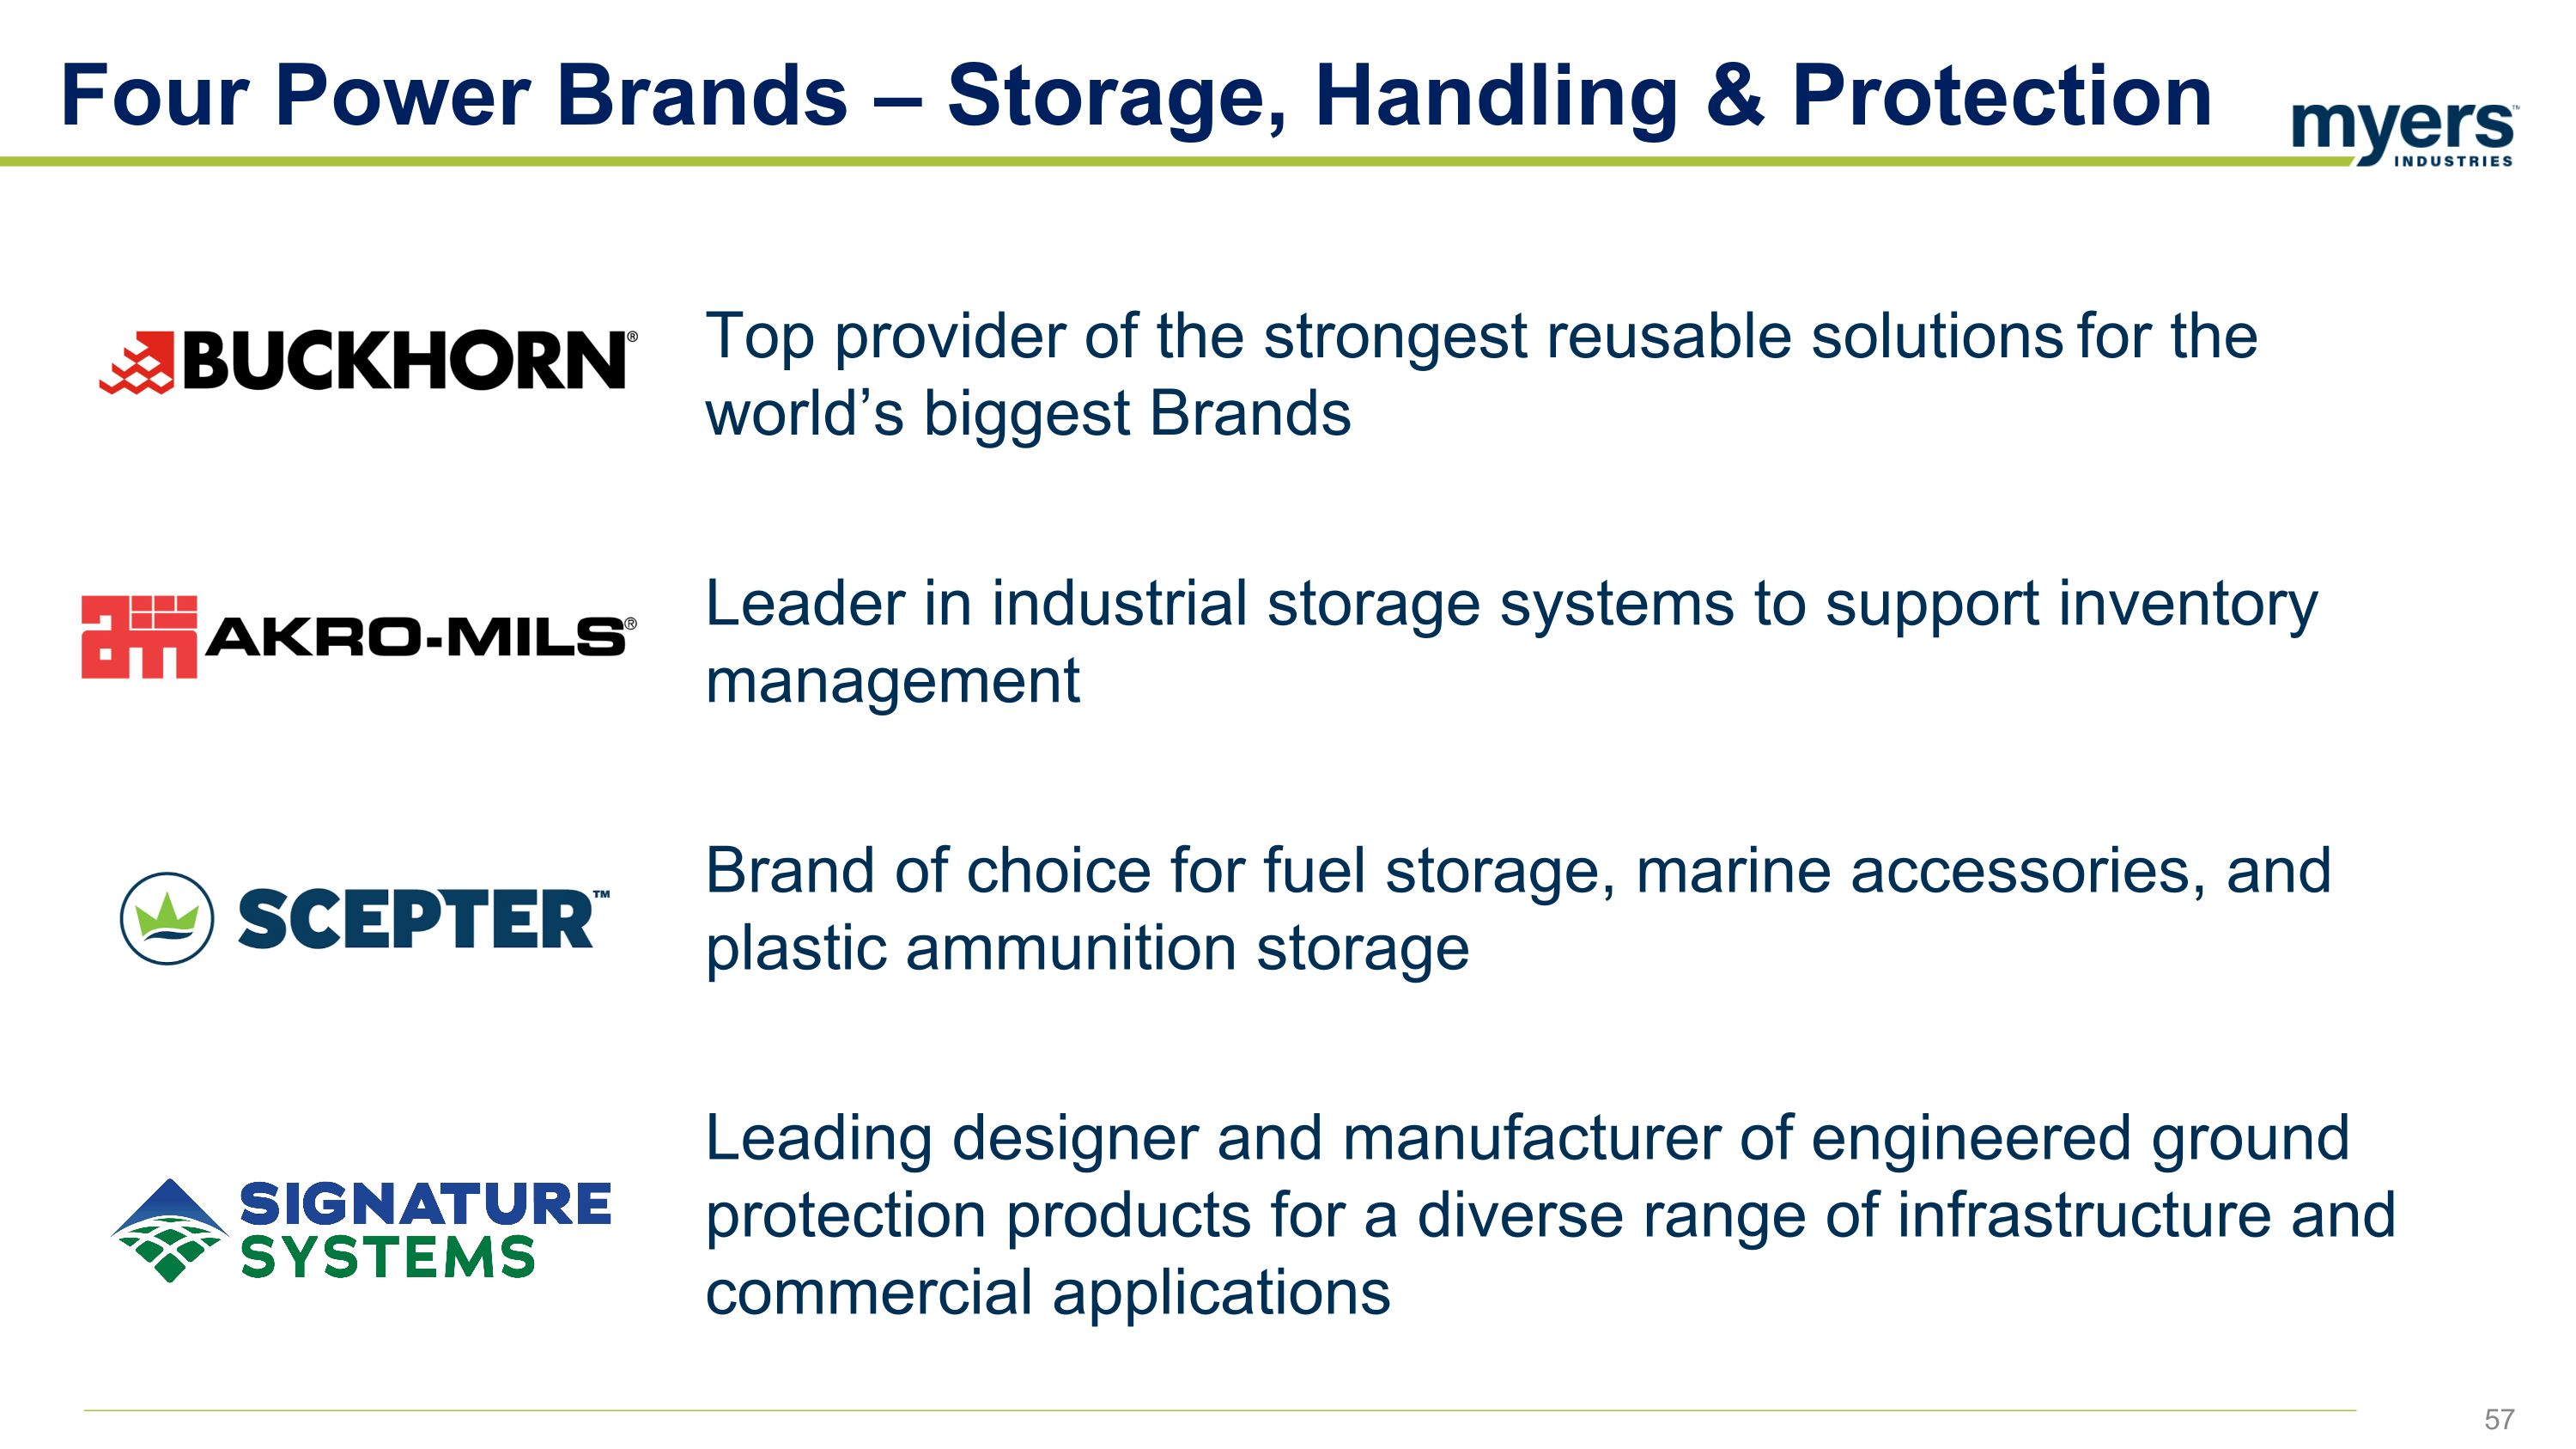
Four Power Brands – Storage, Handling & Protection Top provider of the strongest reusable solutions for the world’s biggest Brands Leader in industrial storage systems to support inventory management Brand of choice for fuel storage, marine accessories, and plastic ammunition storage Leading designer and manufacturer of engineered ground protection products for a diverse range of infrastructure and commercial applications
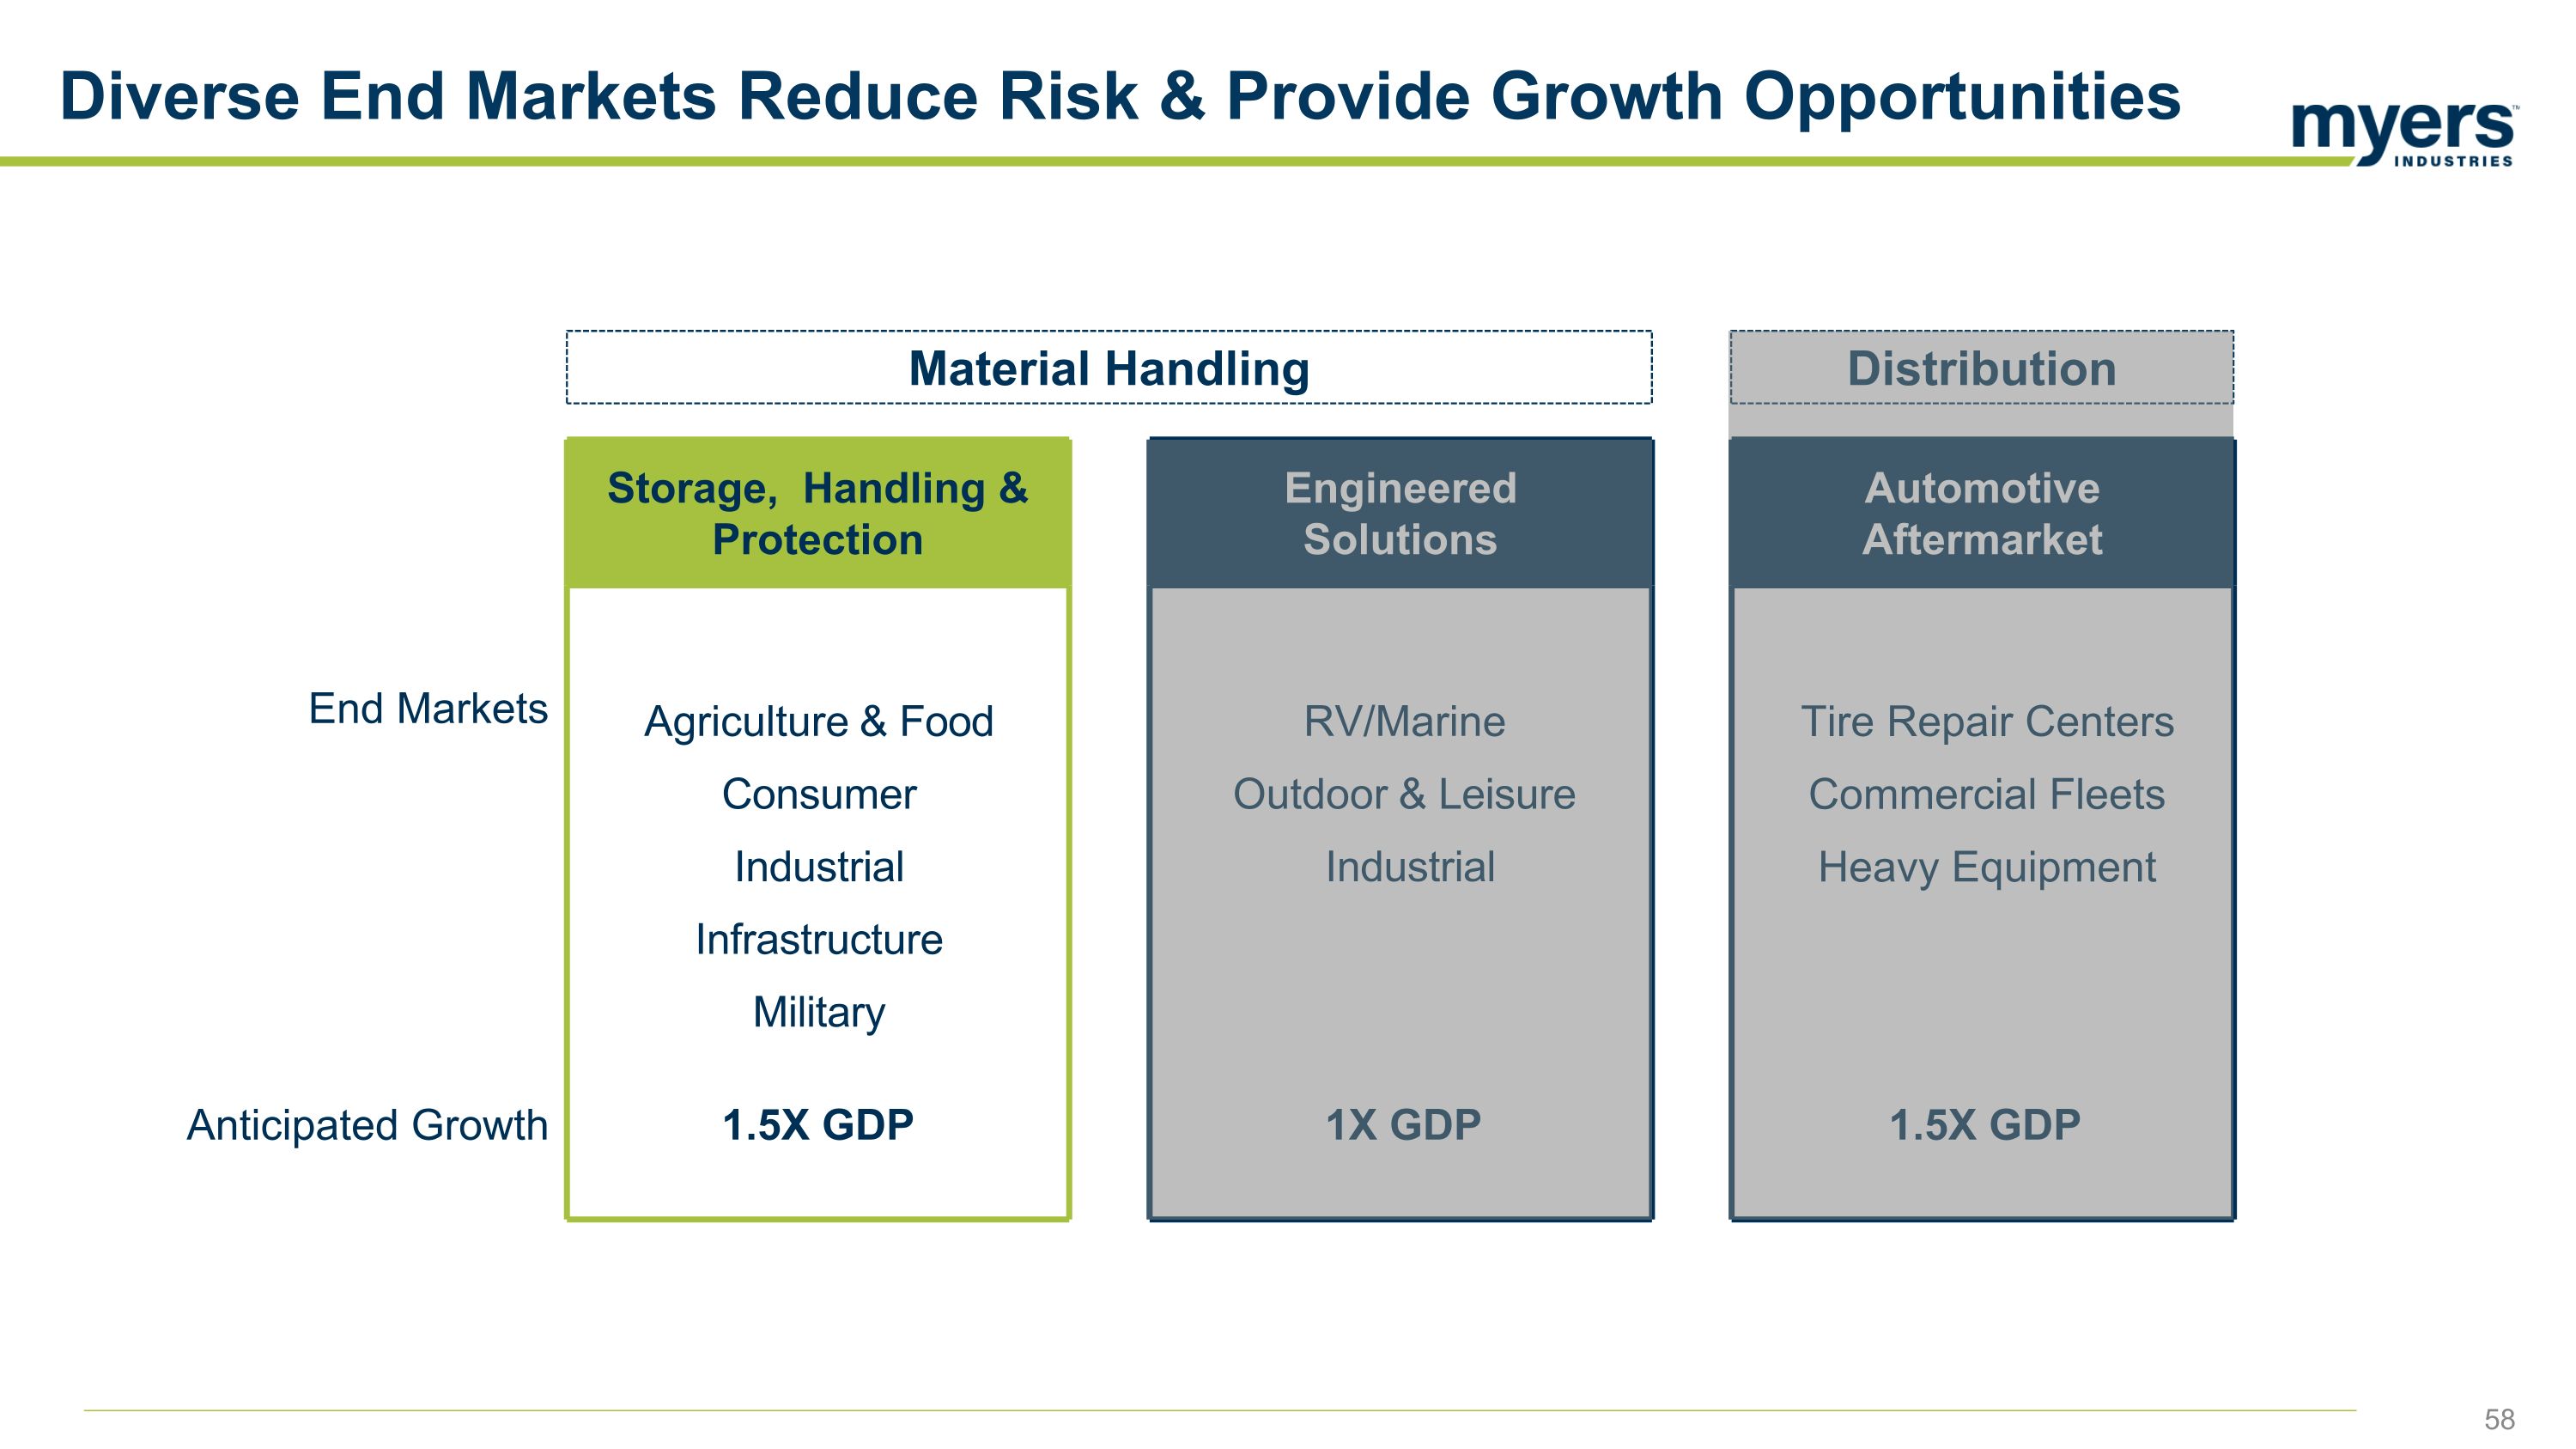
Automotive Aftermarket Engineered Solutions Storage, Handling & Protection Diverse End Markets Reduce Risk & Provide Growth Opportunities Material Handling Distribution End Markets Agriculture & Food Consumer Industrial Infrastructure Military RV/Marine Outdoor & Leisure Industrial Tire Repair Centers Commercial Fleets Heavy Equipment Anticipated Growth 1.5X GDP 1X GDP 1.5X GDP
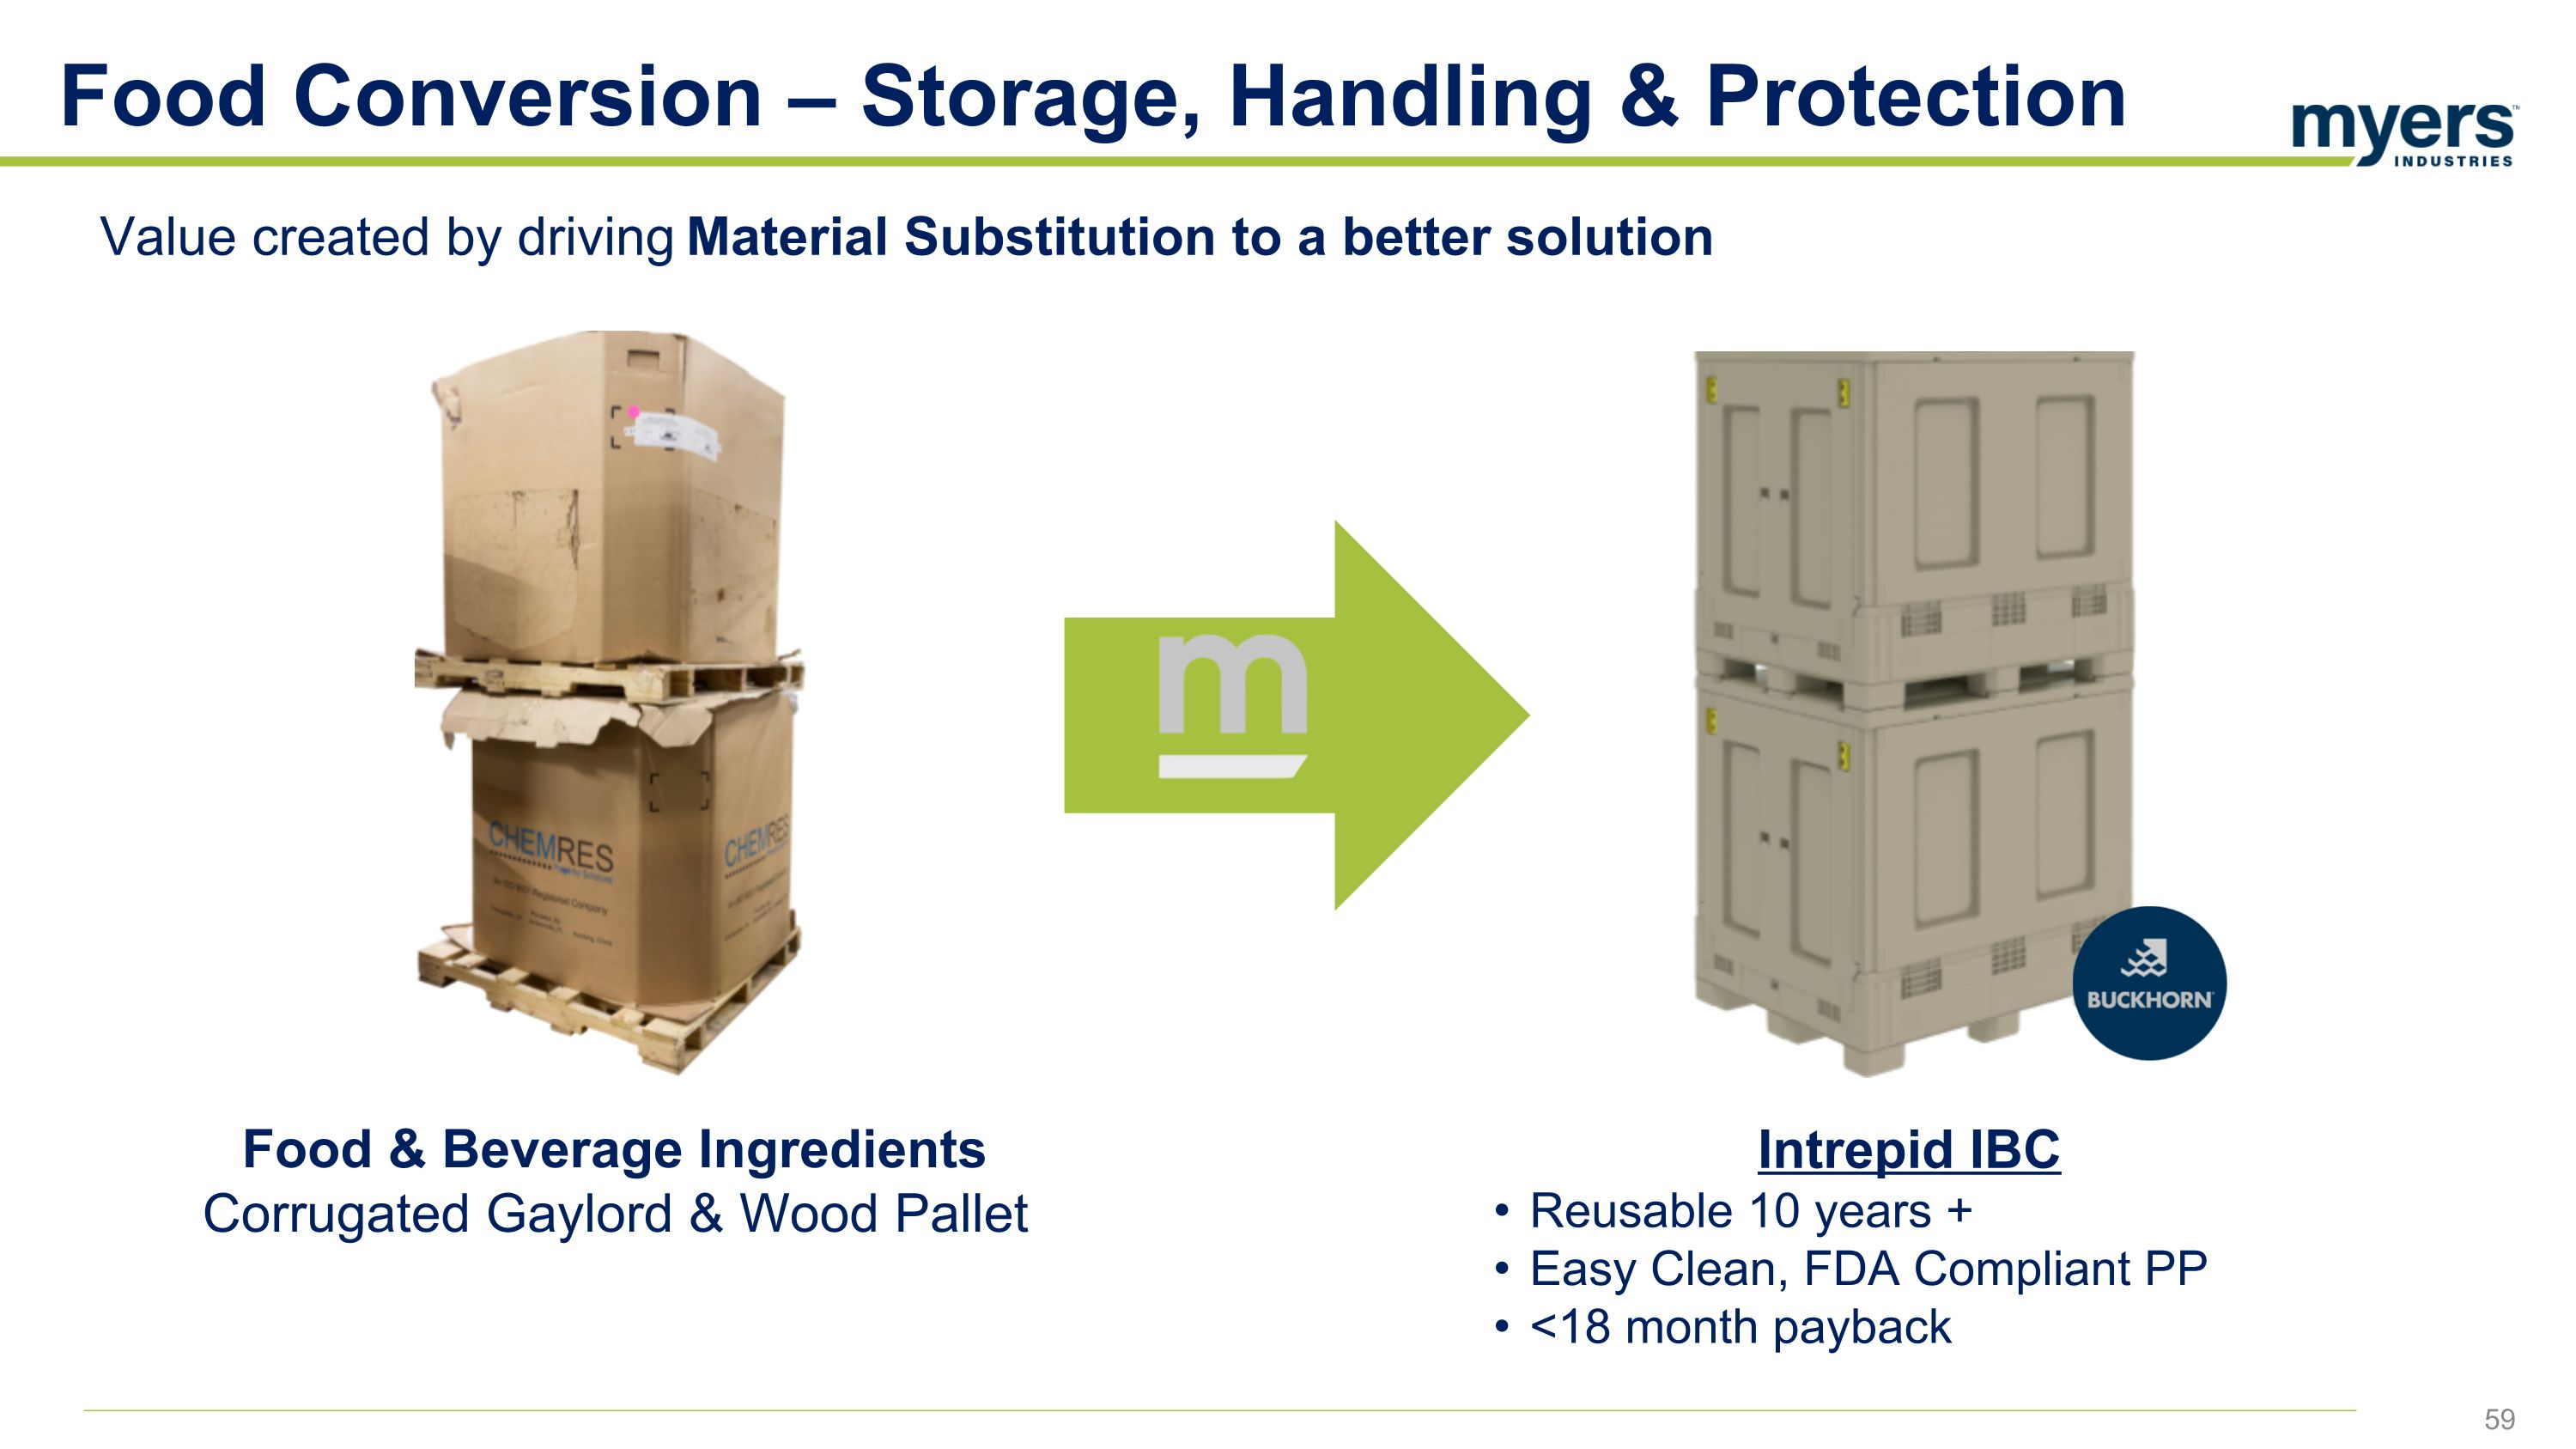
Food Conversion – Storage, Handling & Protection Value created by driving Material Substitution to a better solution Intrepid IBC Reusable 10 years + Easy Clean, FDA Compliant PP <18 month payback Food & Beverage Ingredients Corrugated Gaylord & Wood Pallet
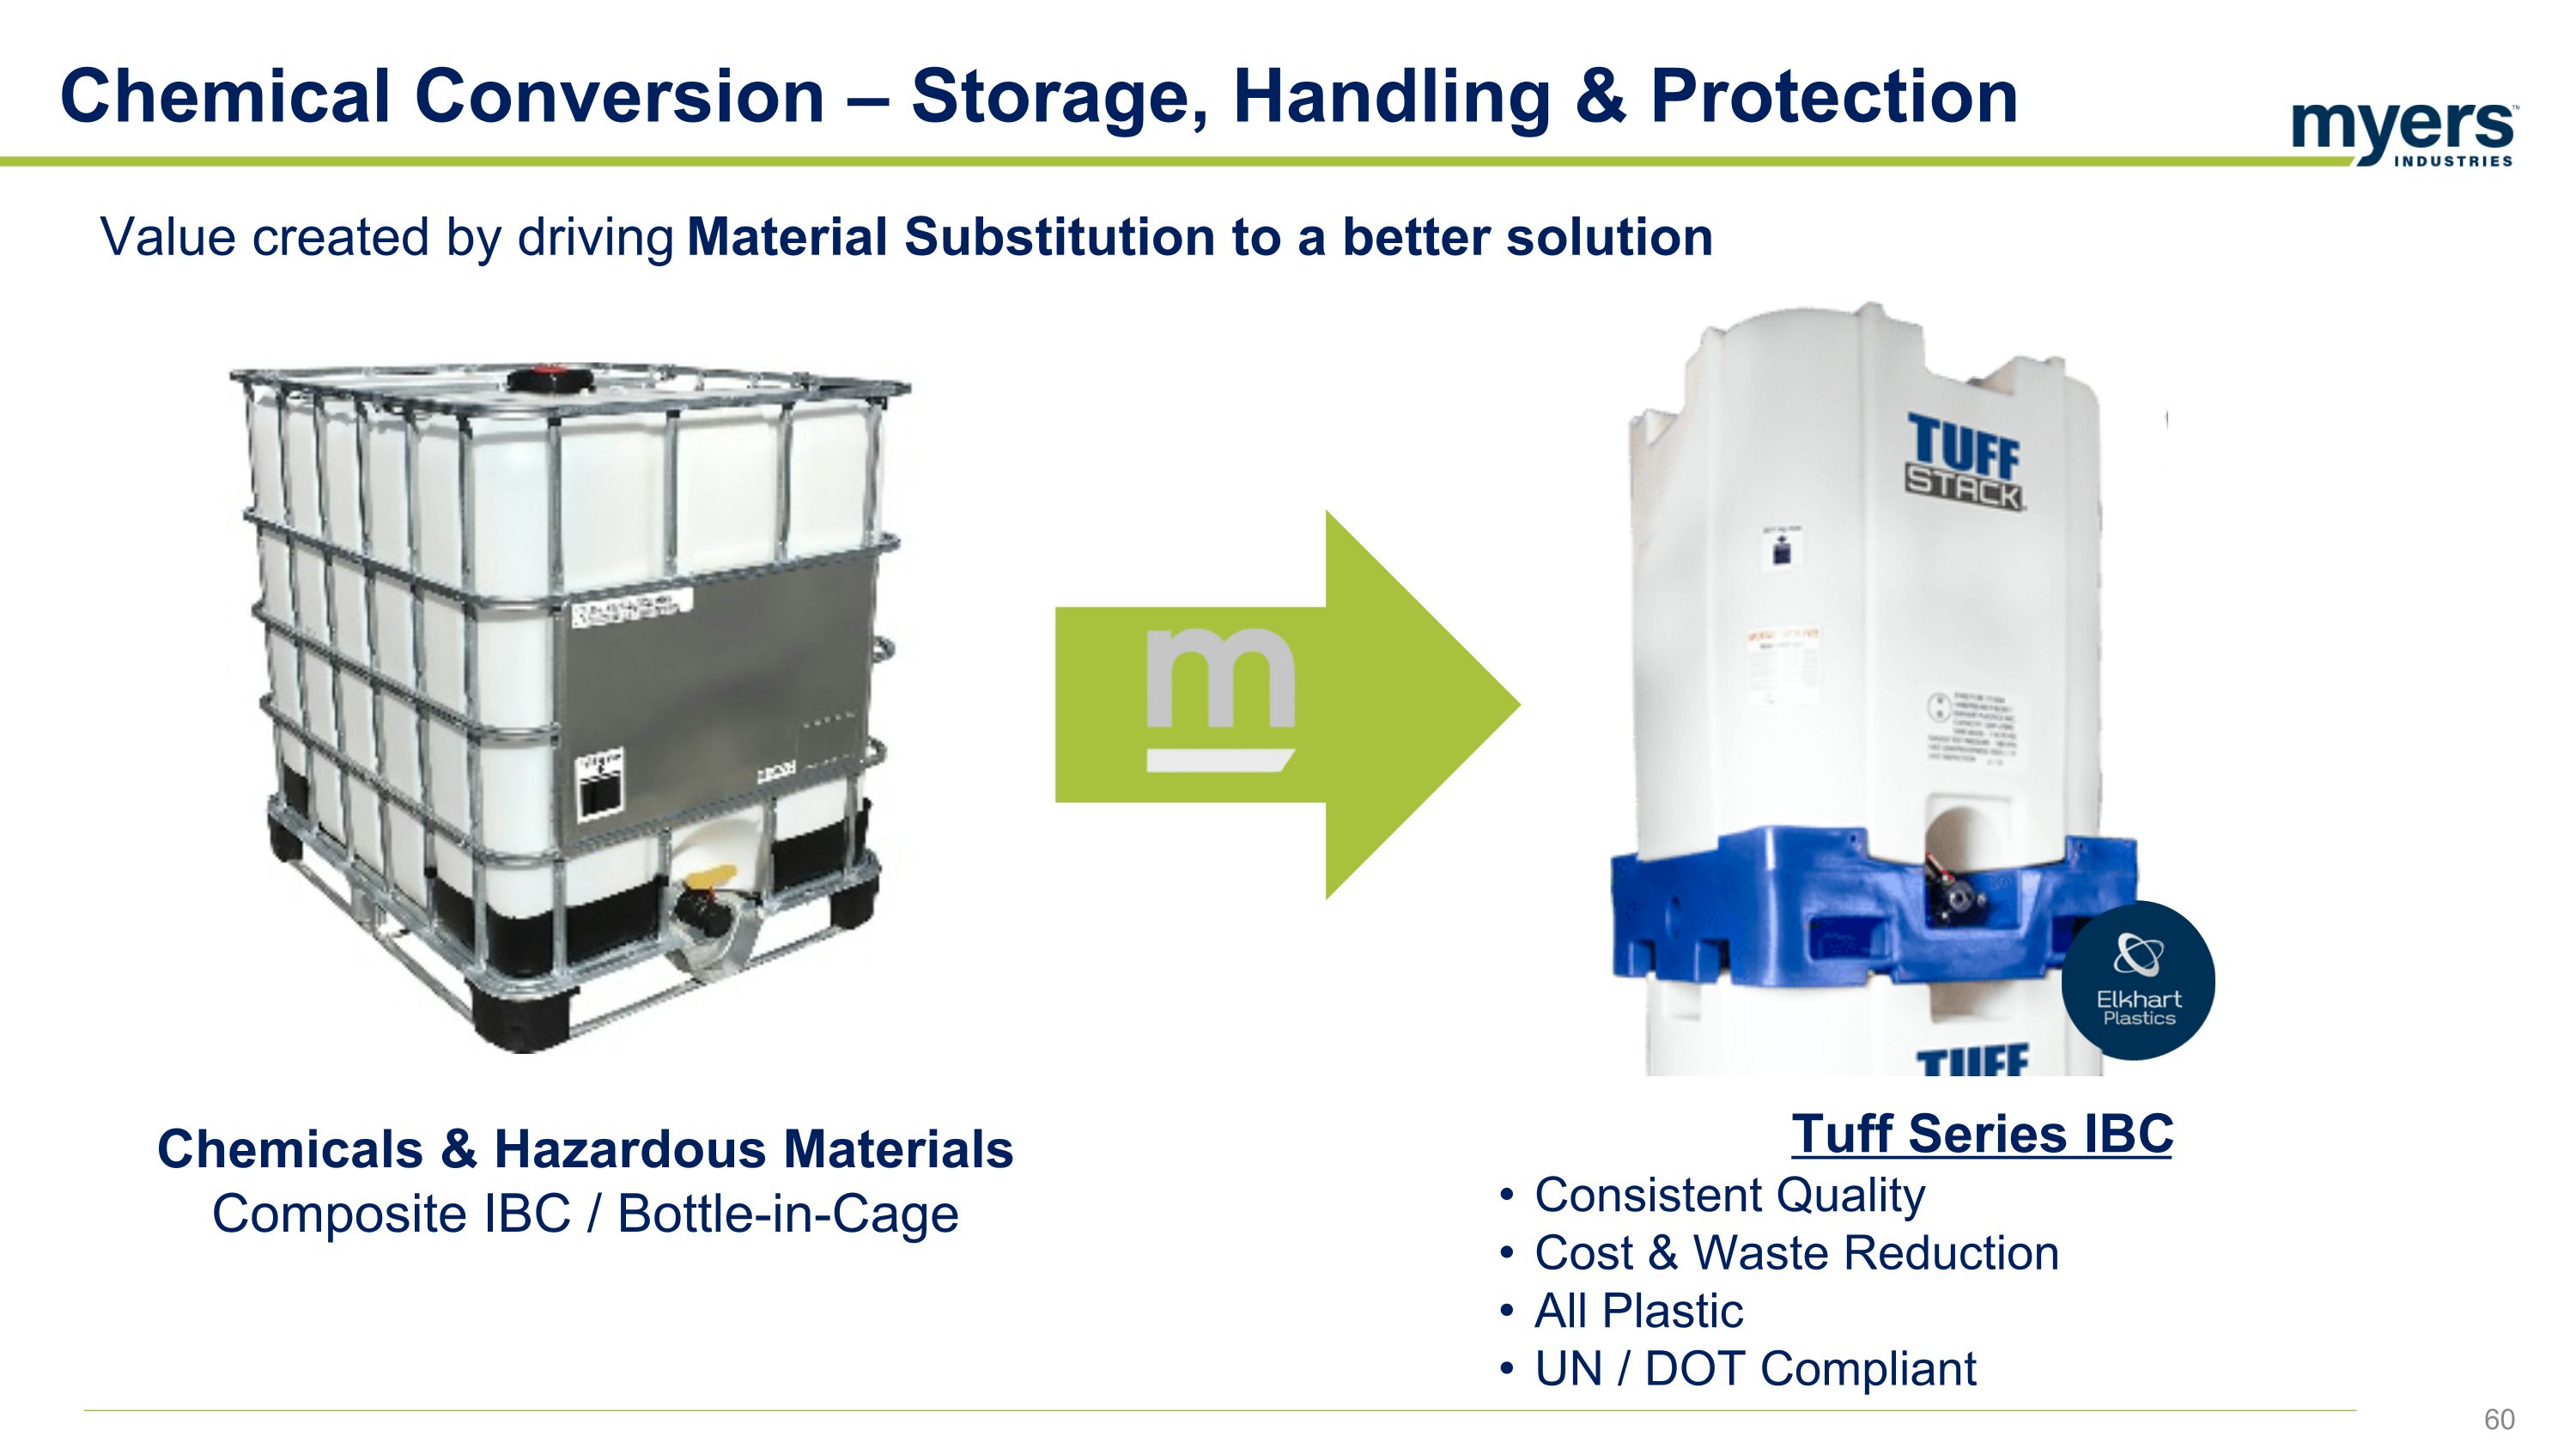
Chemical Conversion – Storage, Handling & Protection Value created by driving Material Substitution to a better solution Tuff Series IBC Consistent Quality Cost & Waste Reduction All Plastic UN / DOT Compliant Chemicals & Hazardous Materials Composite IBC / Bottle-in-Cage
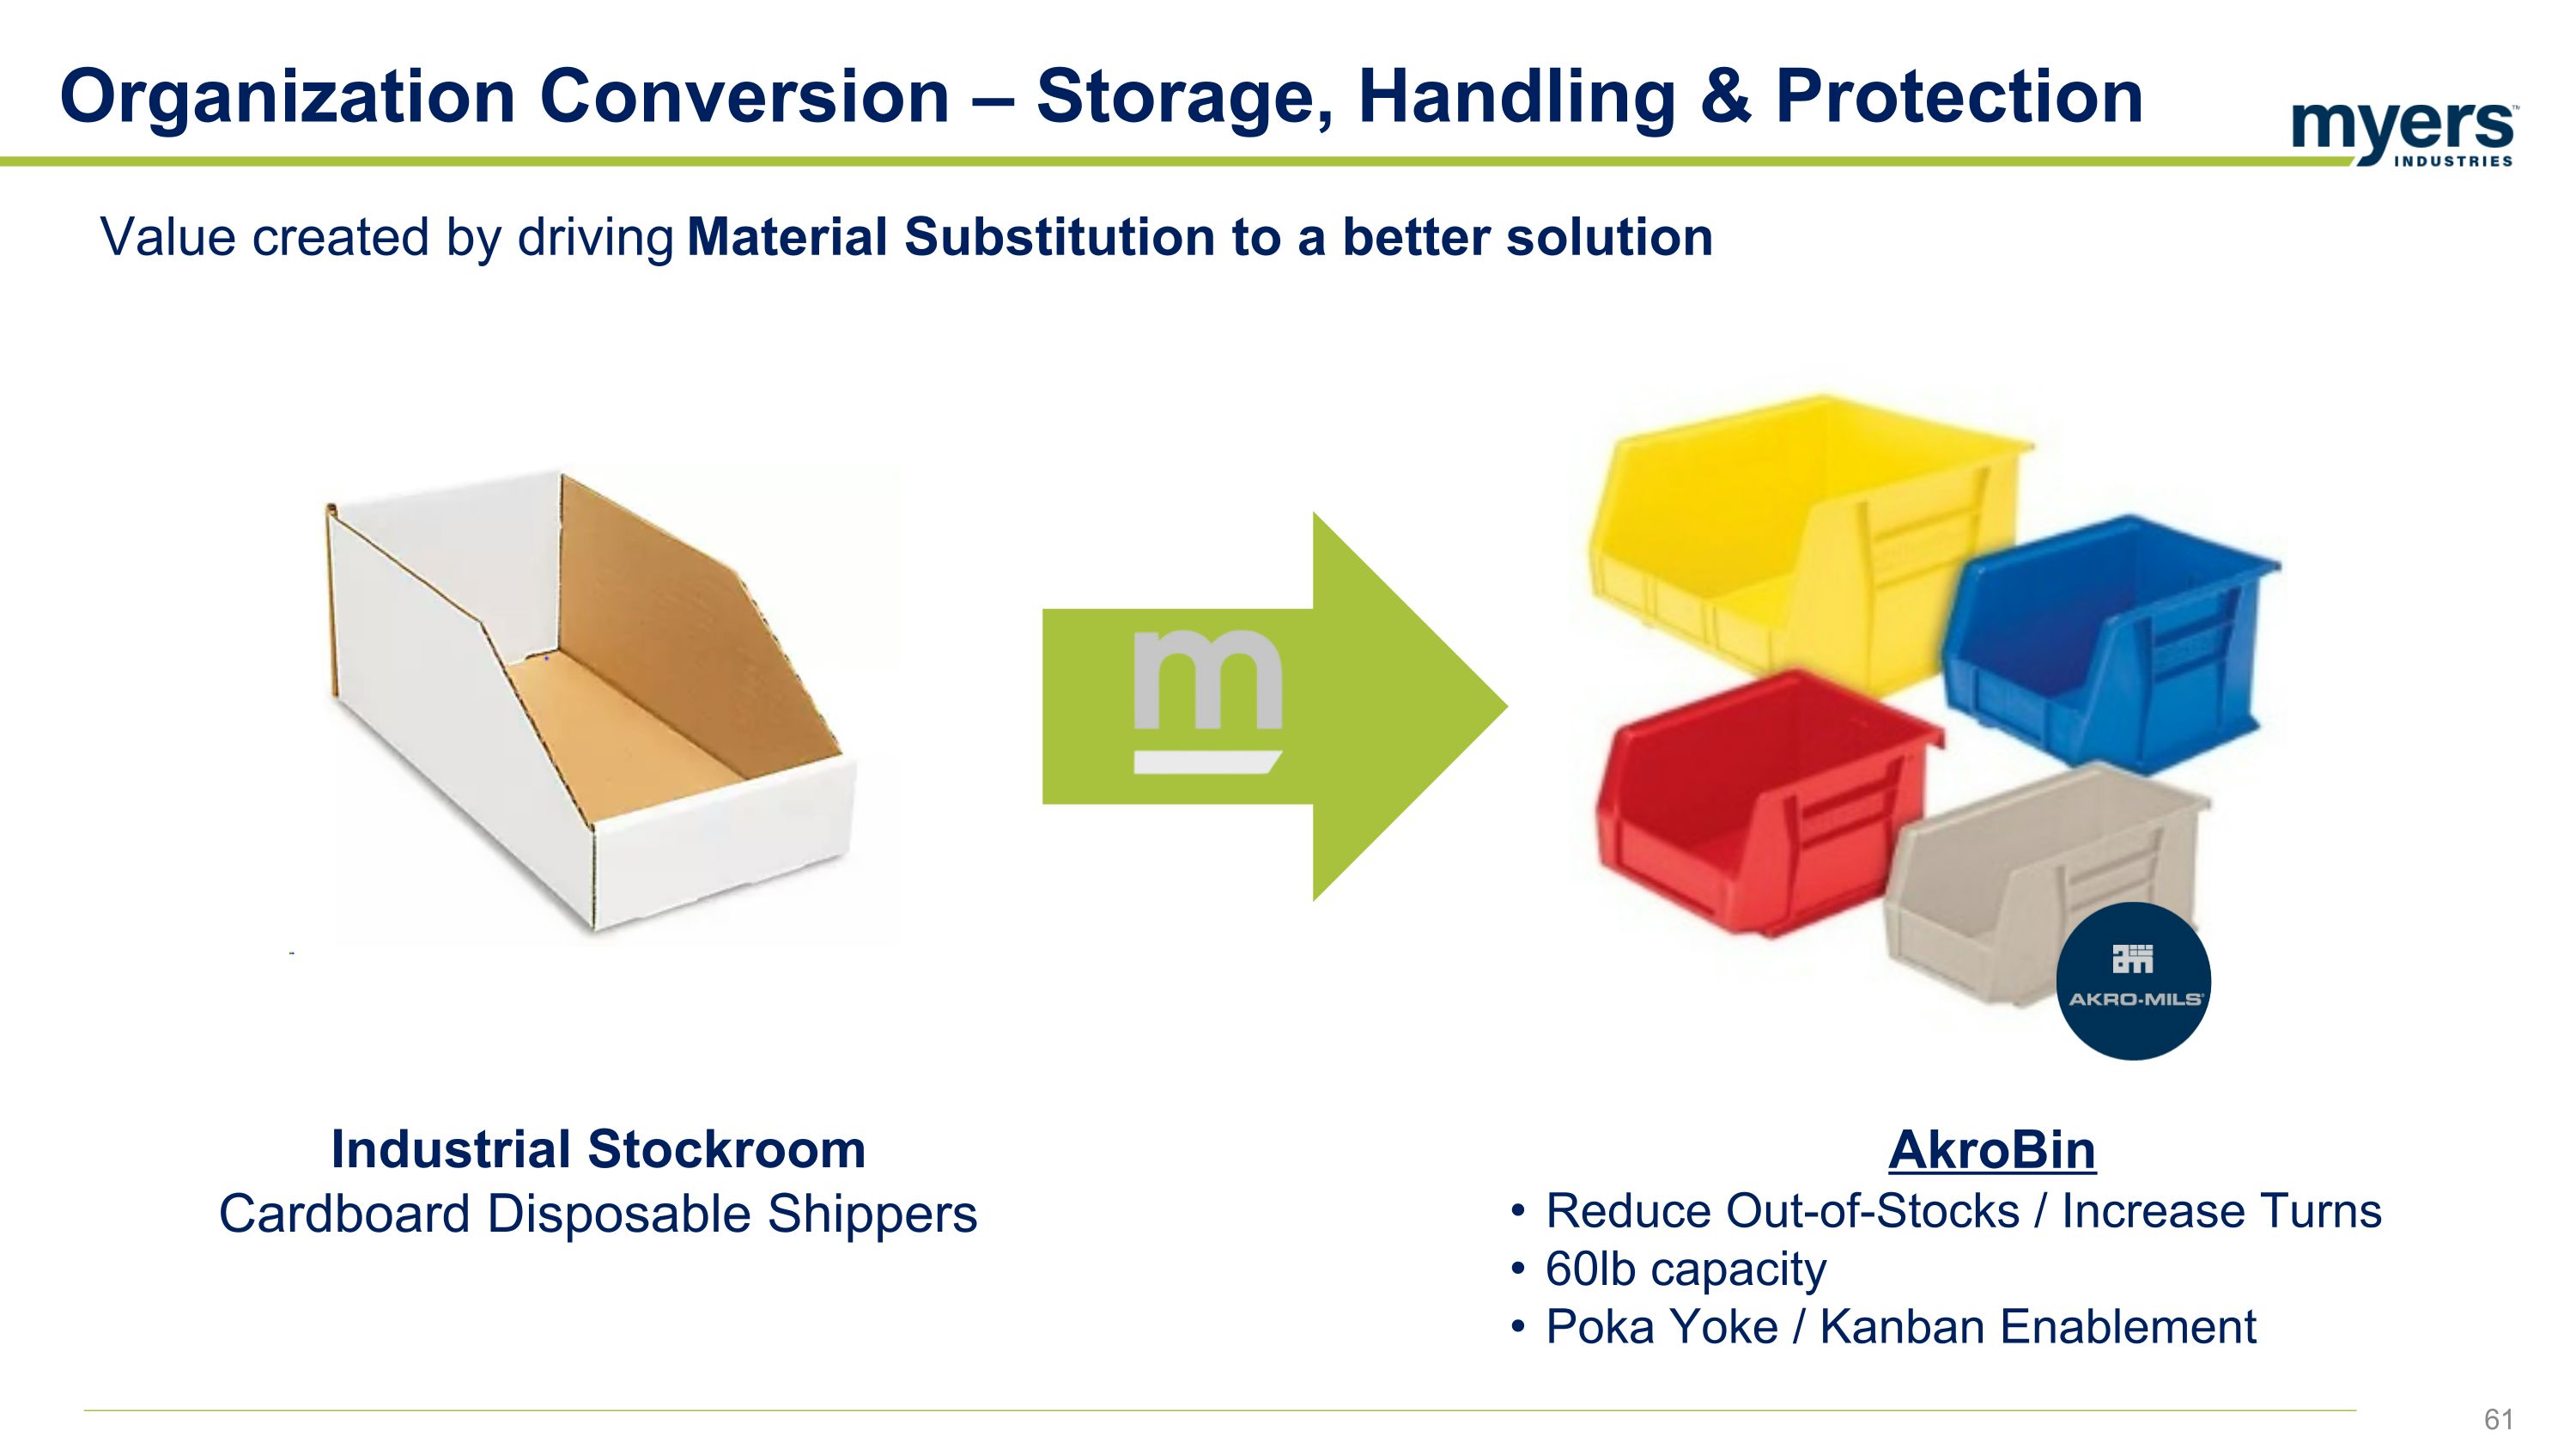
Organization Conversion – Storage, Handling & Protection Value created by driving Material Substitution to a better solution AkroBin Reduce Out-of-Stocks / Increase Turns 60lb capacity Poka Yoke / Kanban Enablement Industrial Stockroom Cardboard Disposable Shippers
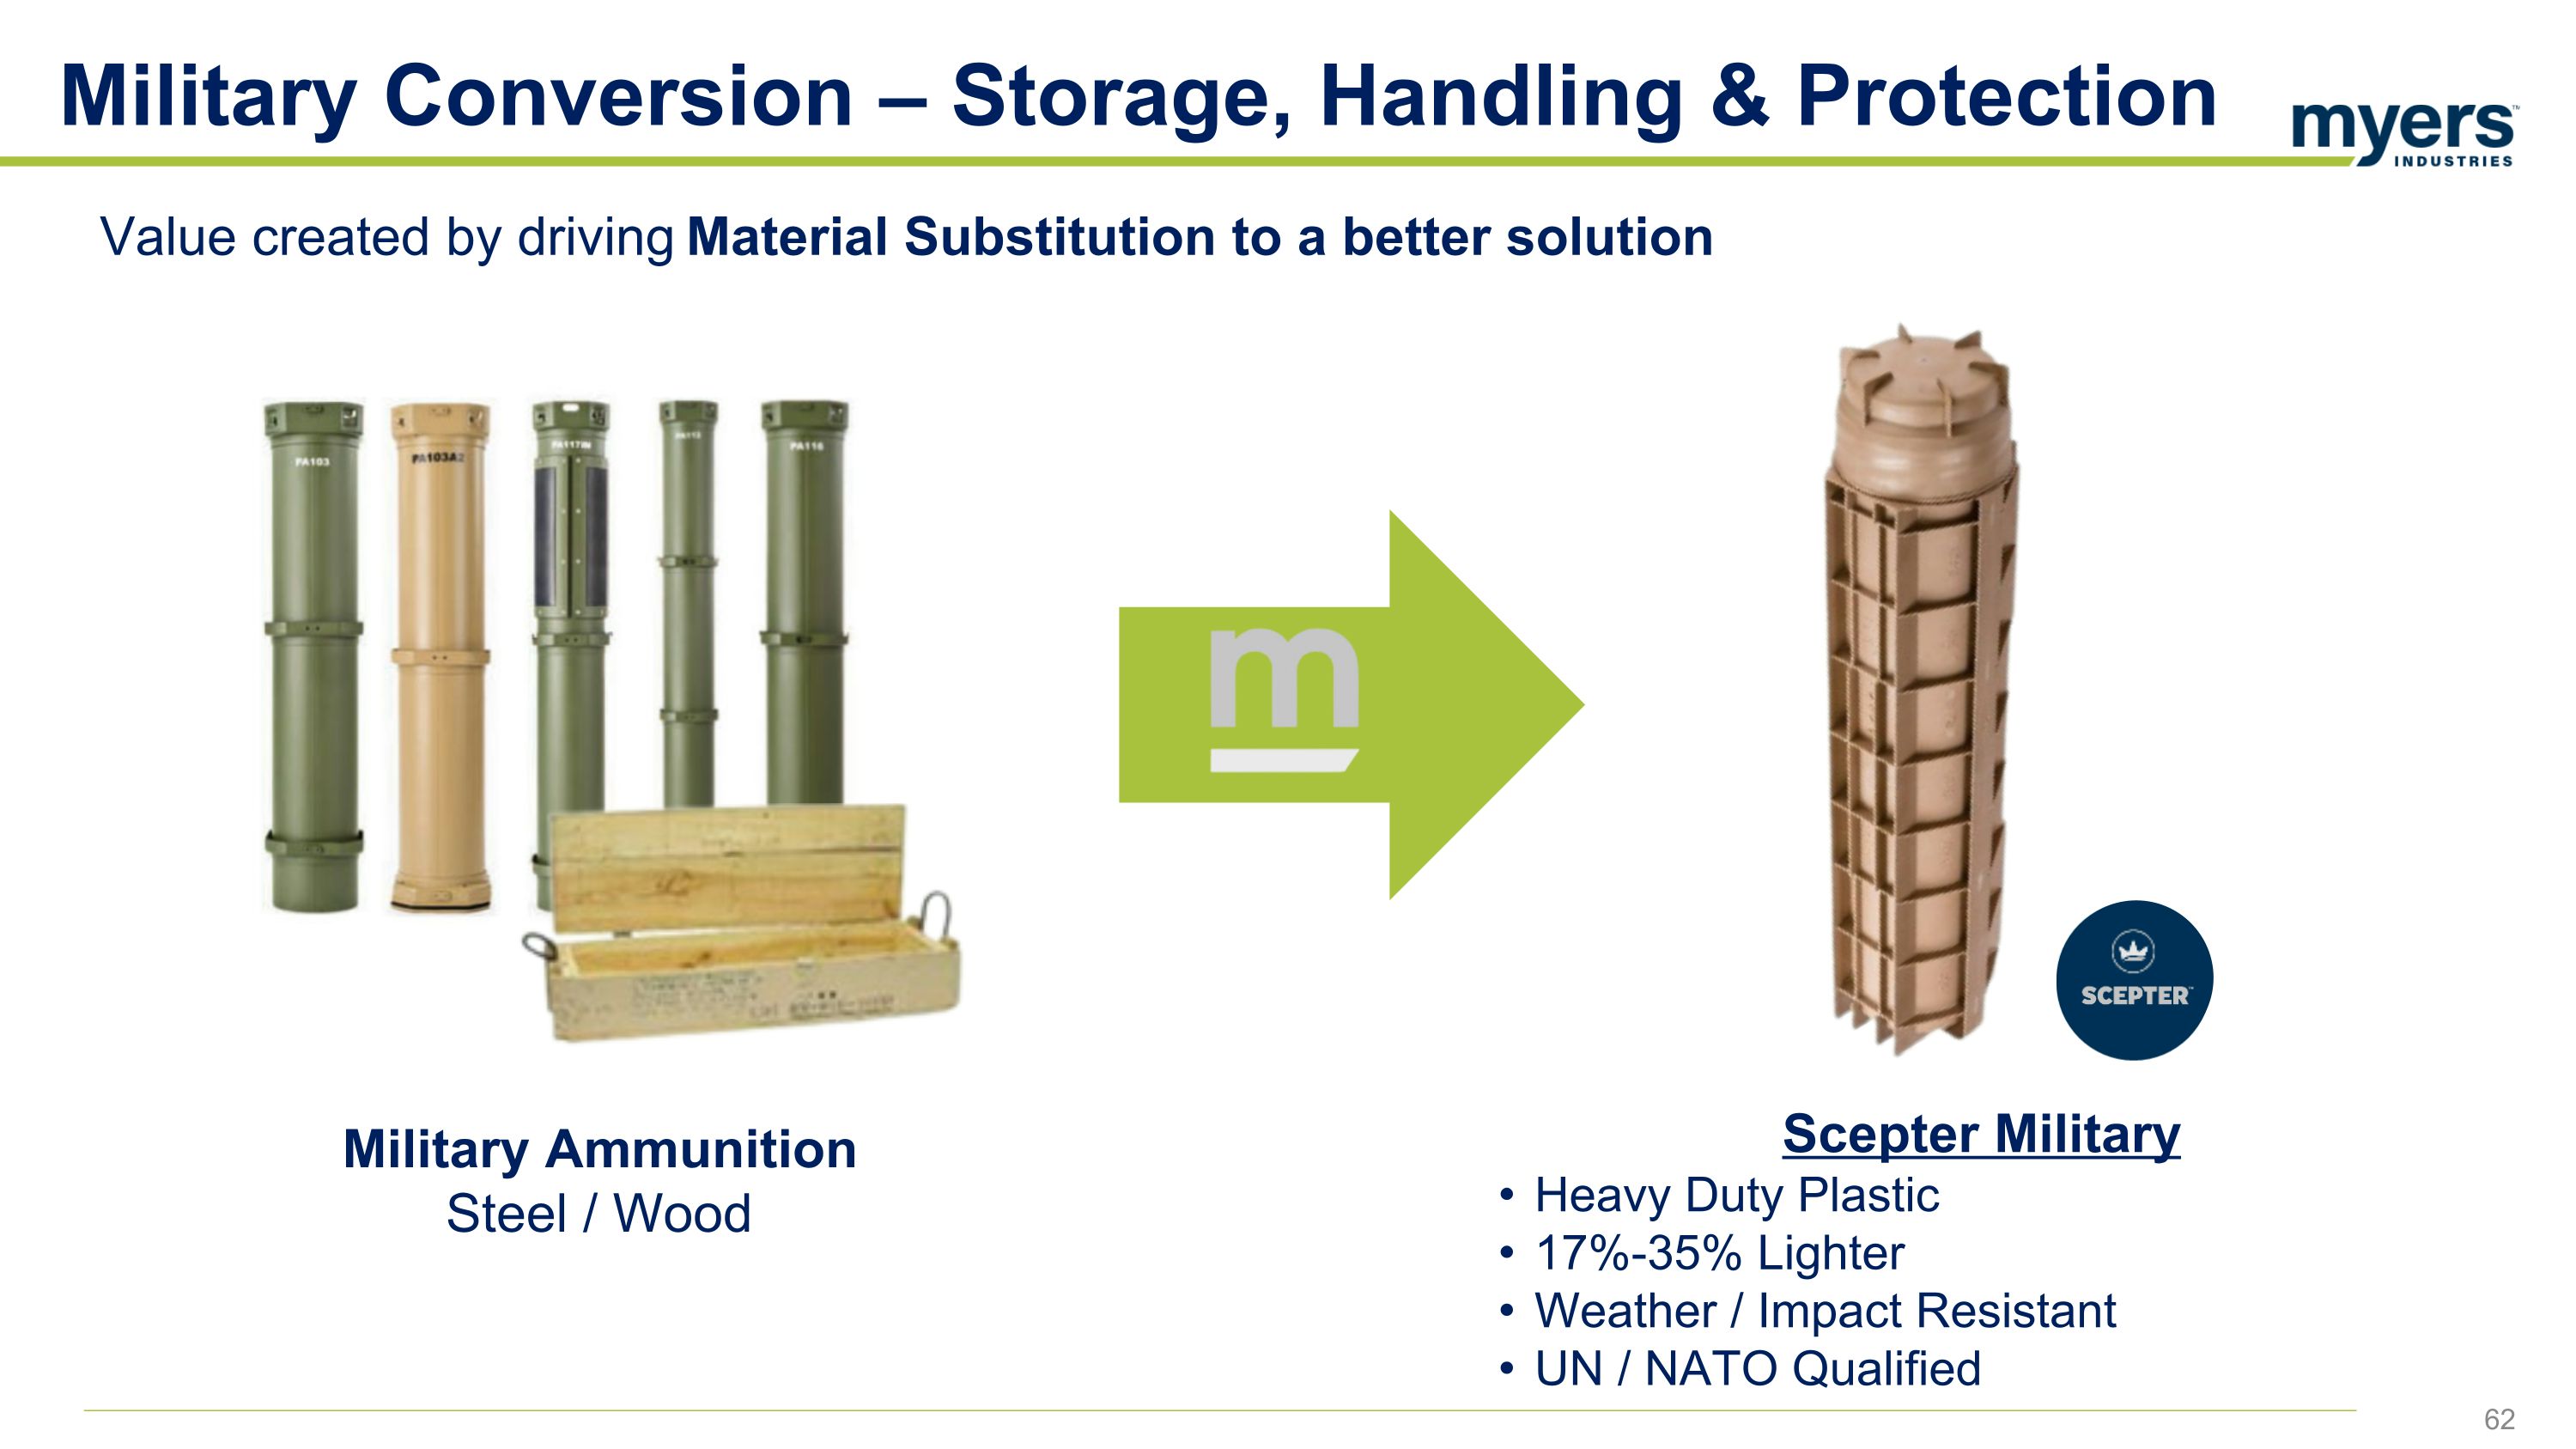
Military Conversion – Storage, Handling & Protection Value created by driving Material Substitution to a better solution Scepter Military Heavy Duty Plastic 17%-35% Lighter Weather / Impact Resistant UN / NATO Qualified Military Ammunition Steel / Wood
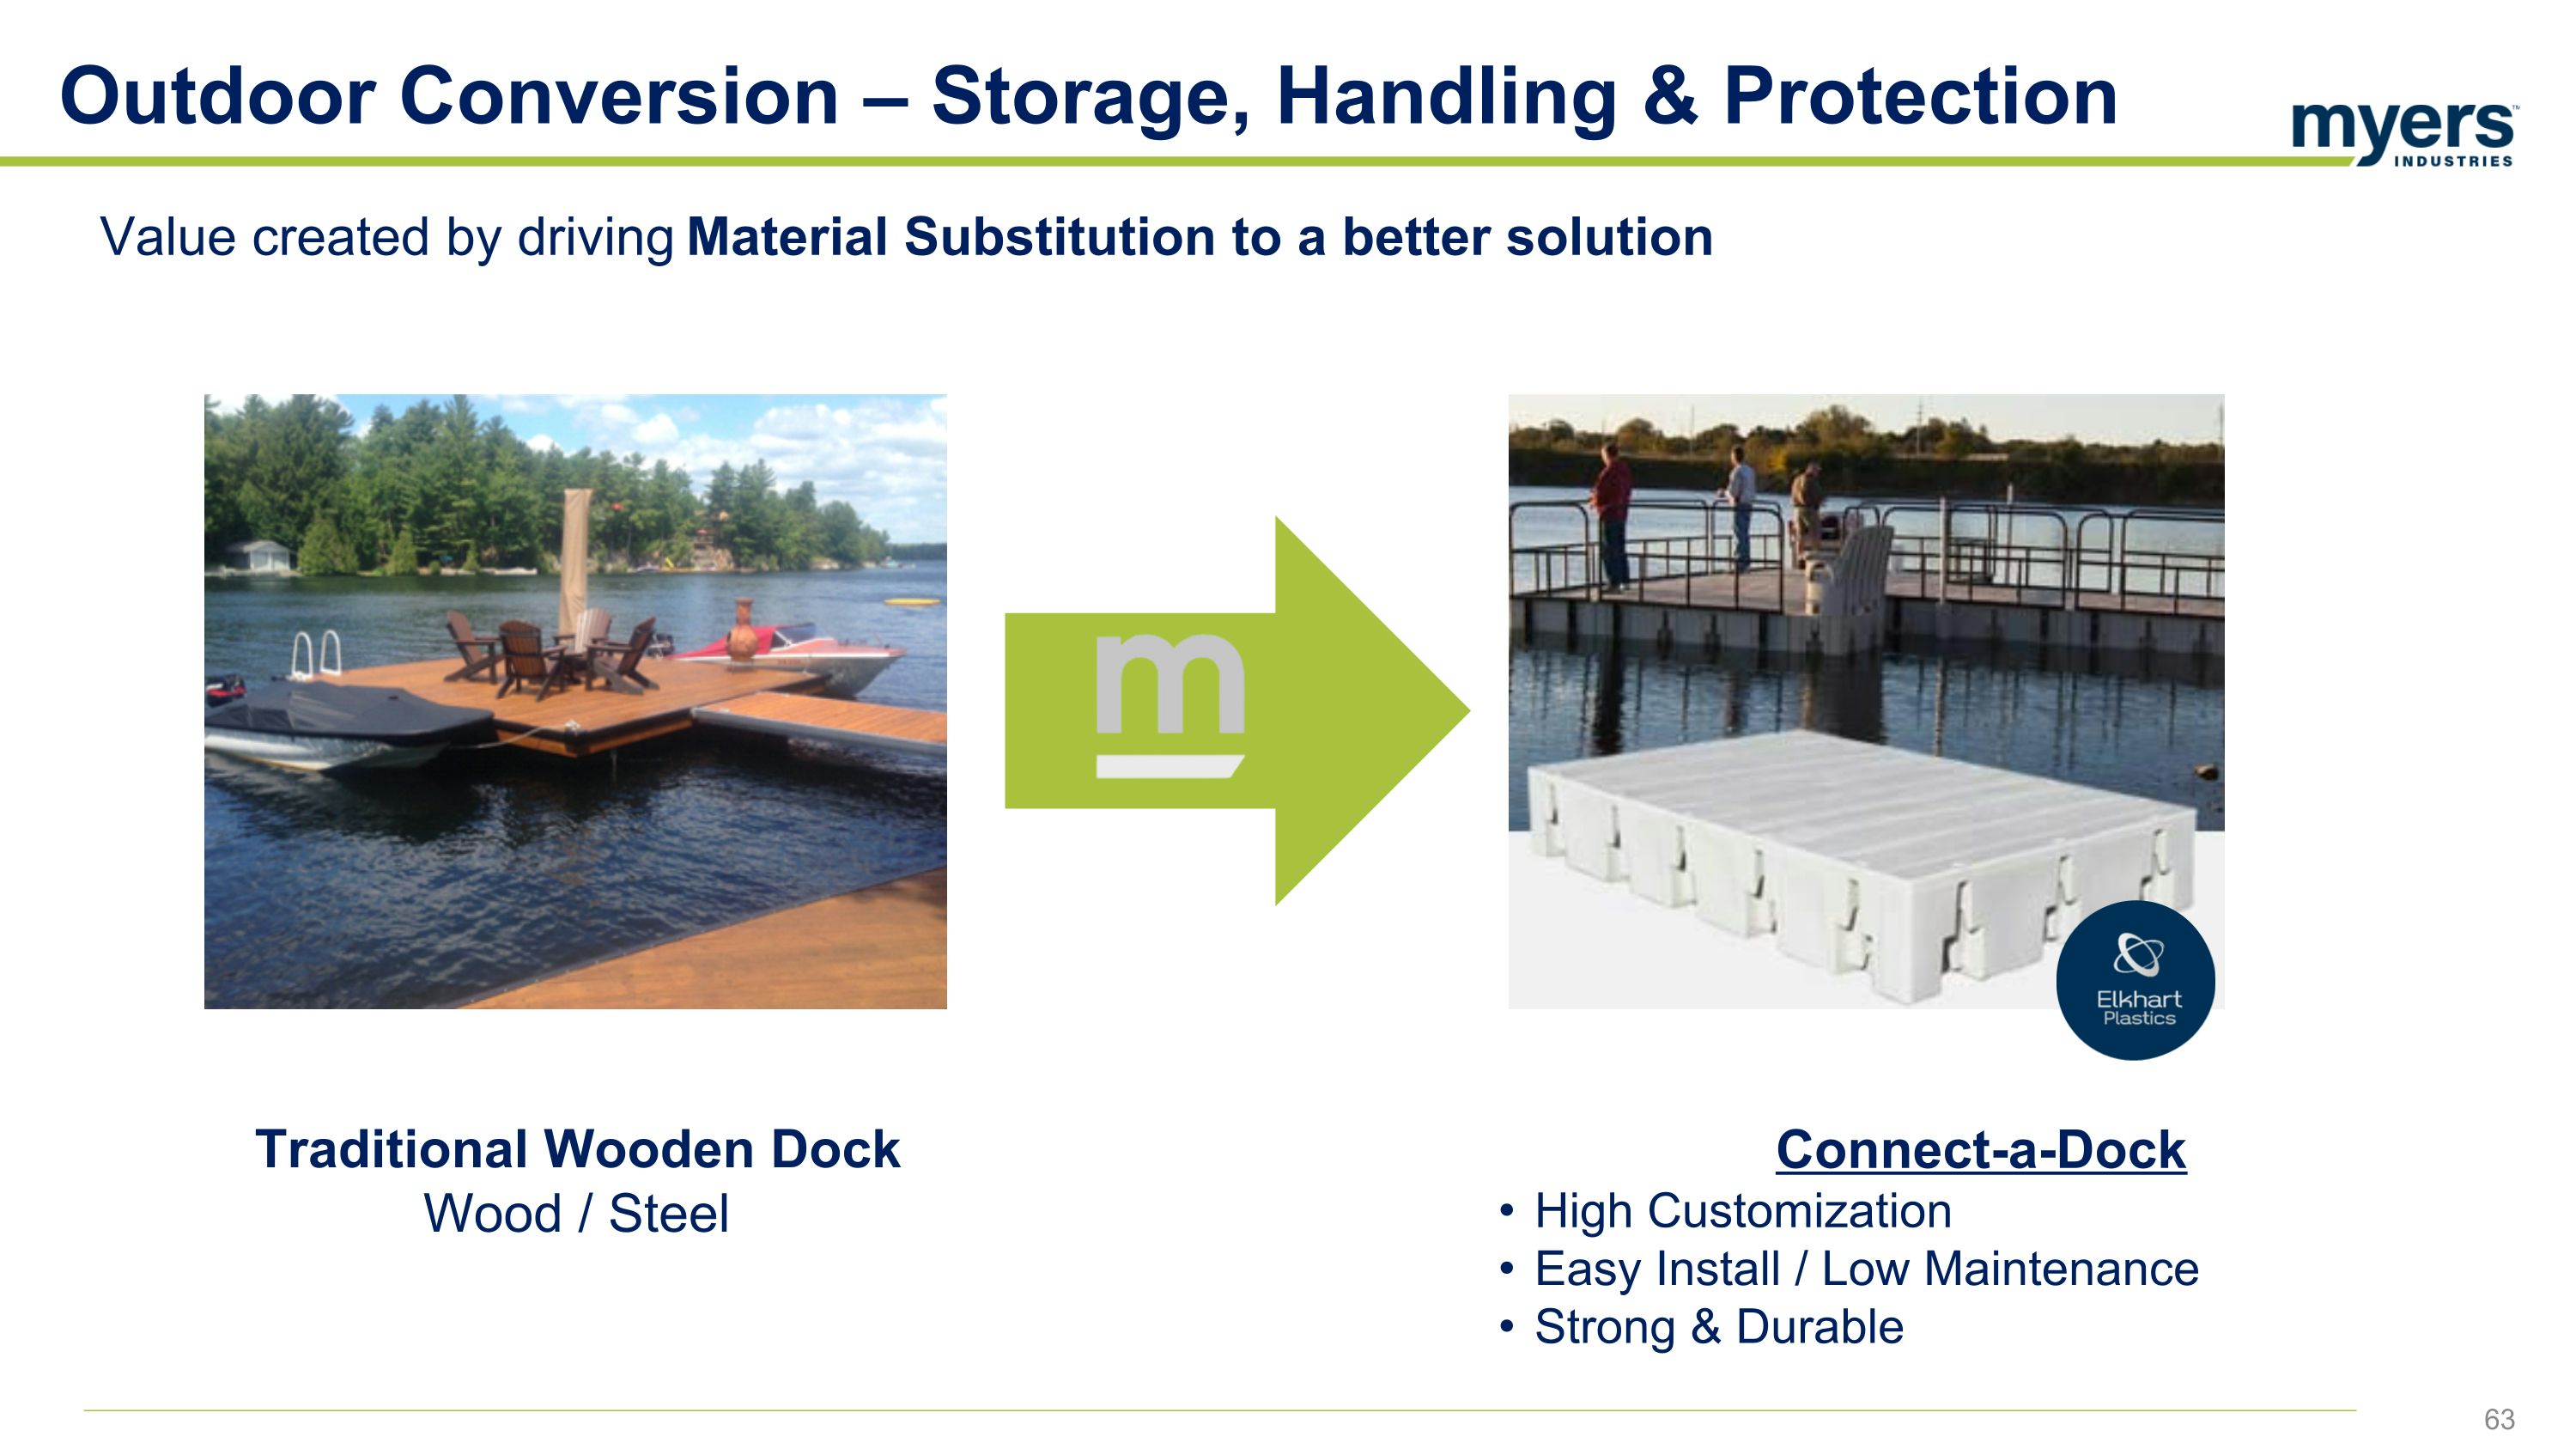
Outdoor Conversion – Storage, Handling & Protection Value created by driving Material Substitution to a better solution Connect-a-Dock High Customization Easy Install / Low Maintenance Strong & Durable Traditional Wooden Dock Wood / Steel
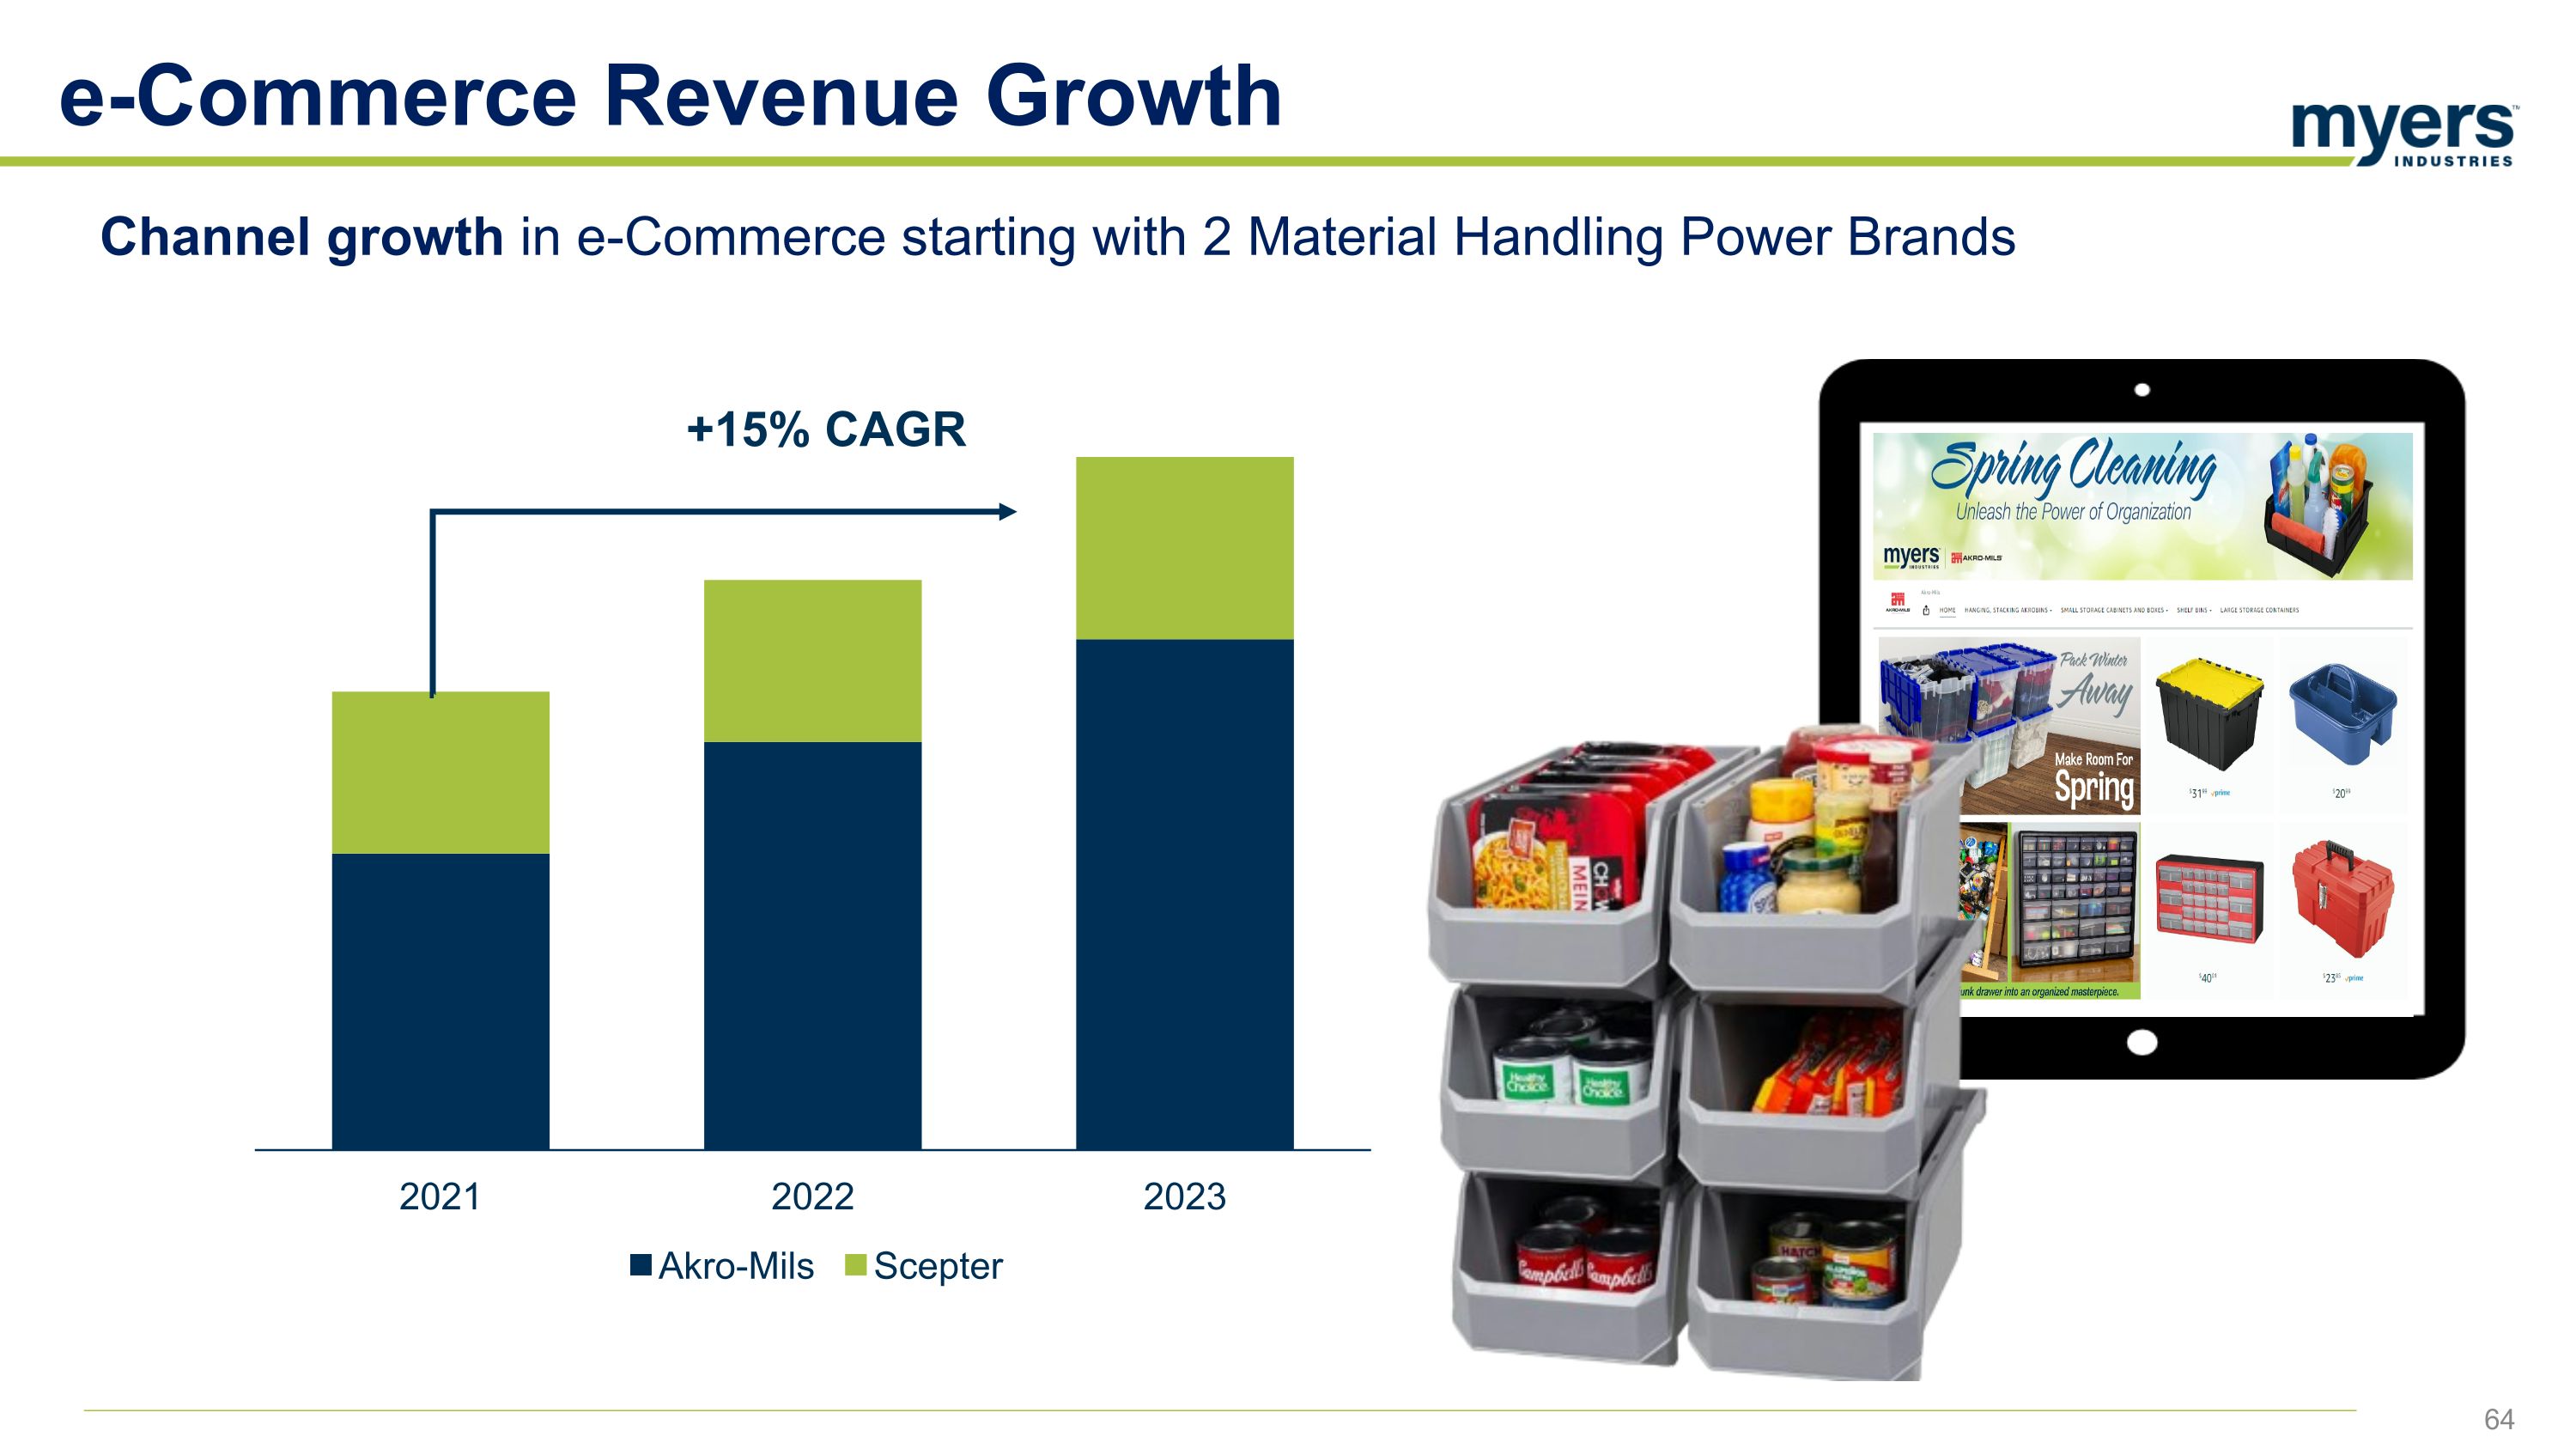
e-Commerce Revenue Growth Channel growth in e-Commerce starting with 2 Material Handling Power Brands +15% CAGR
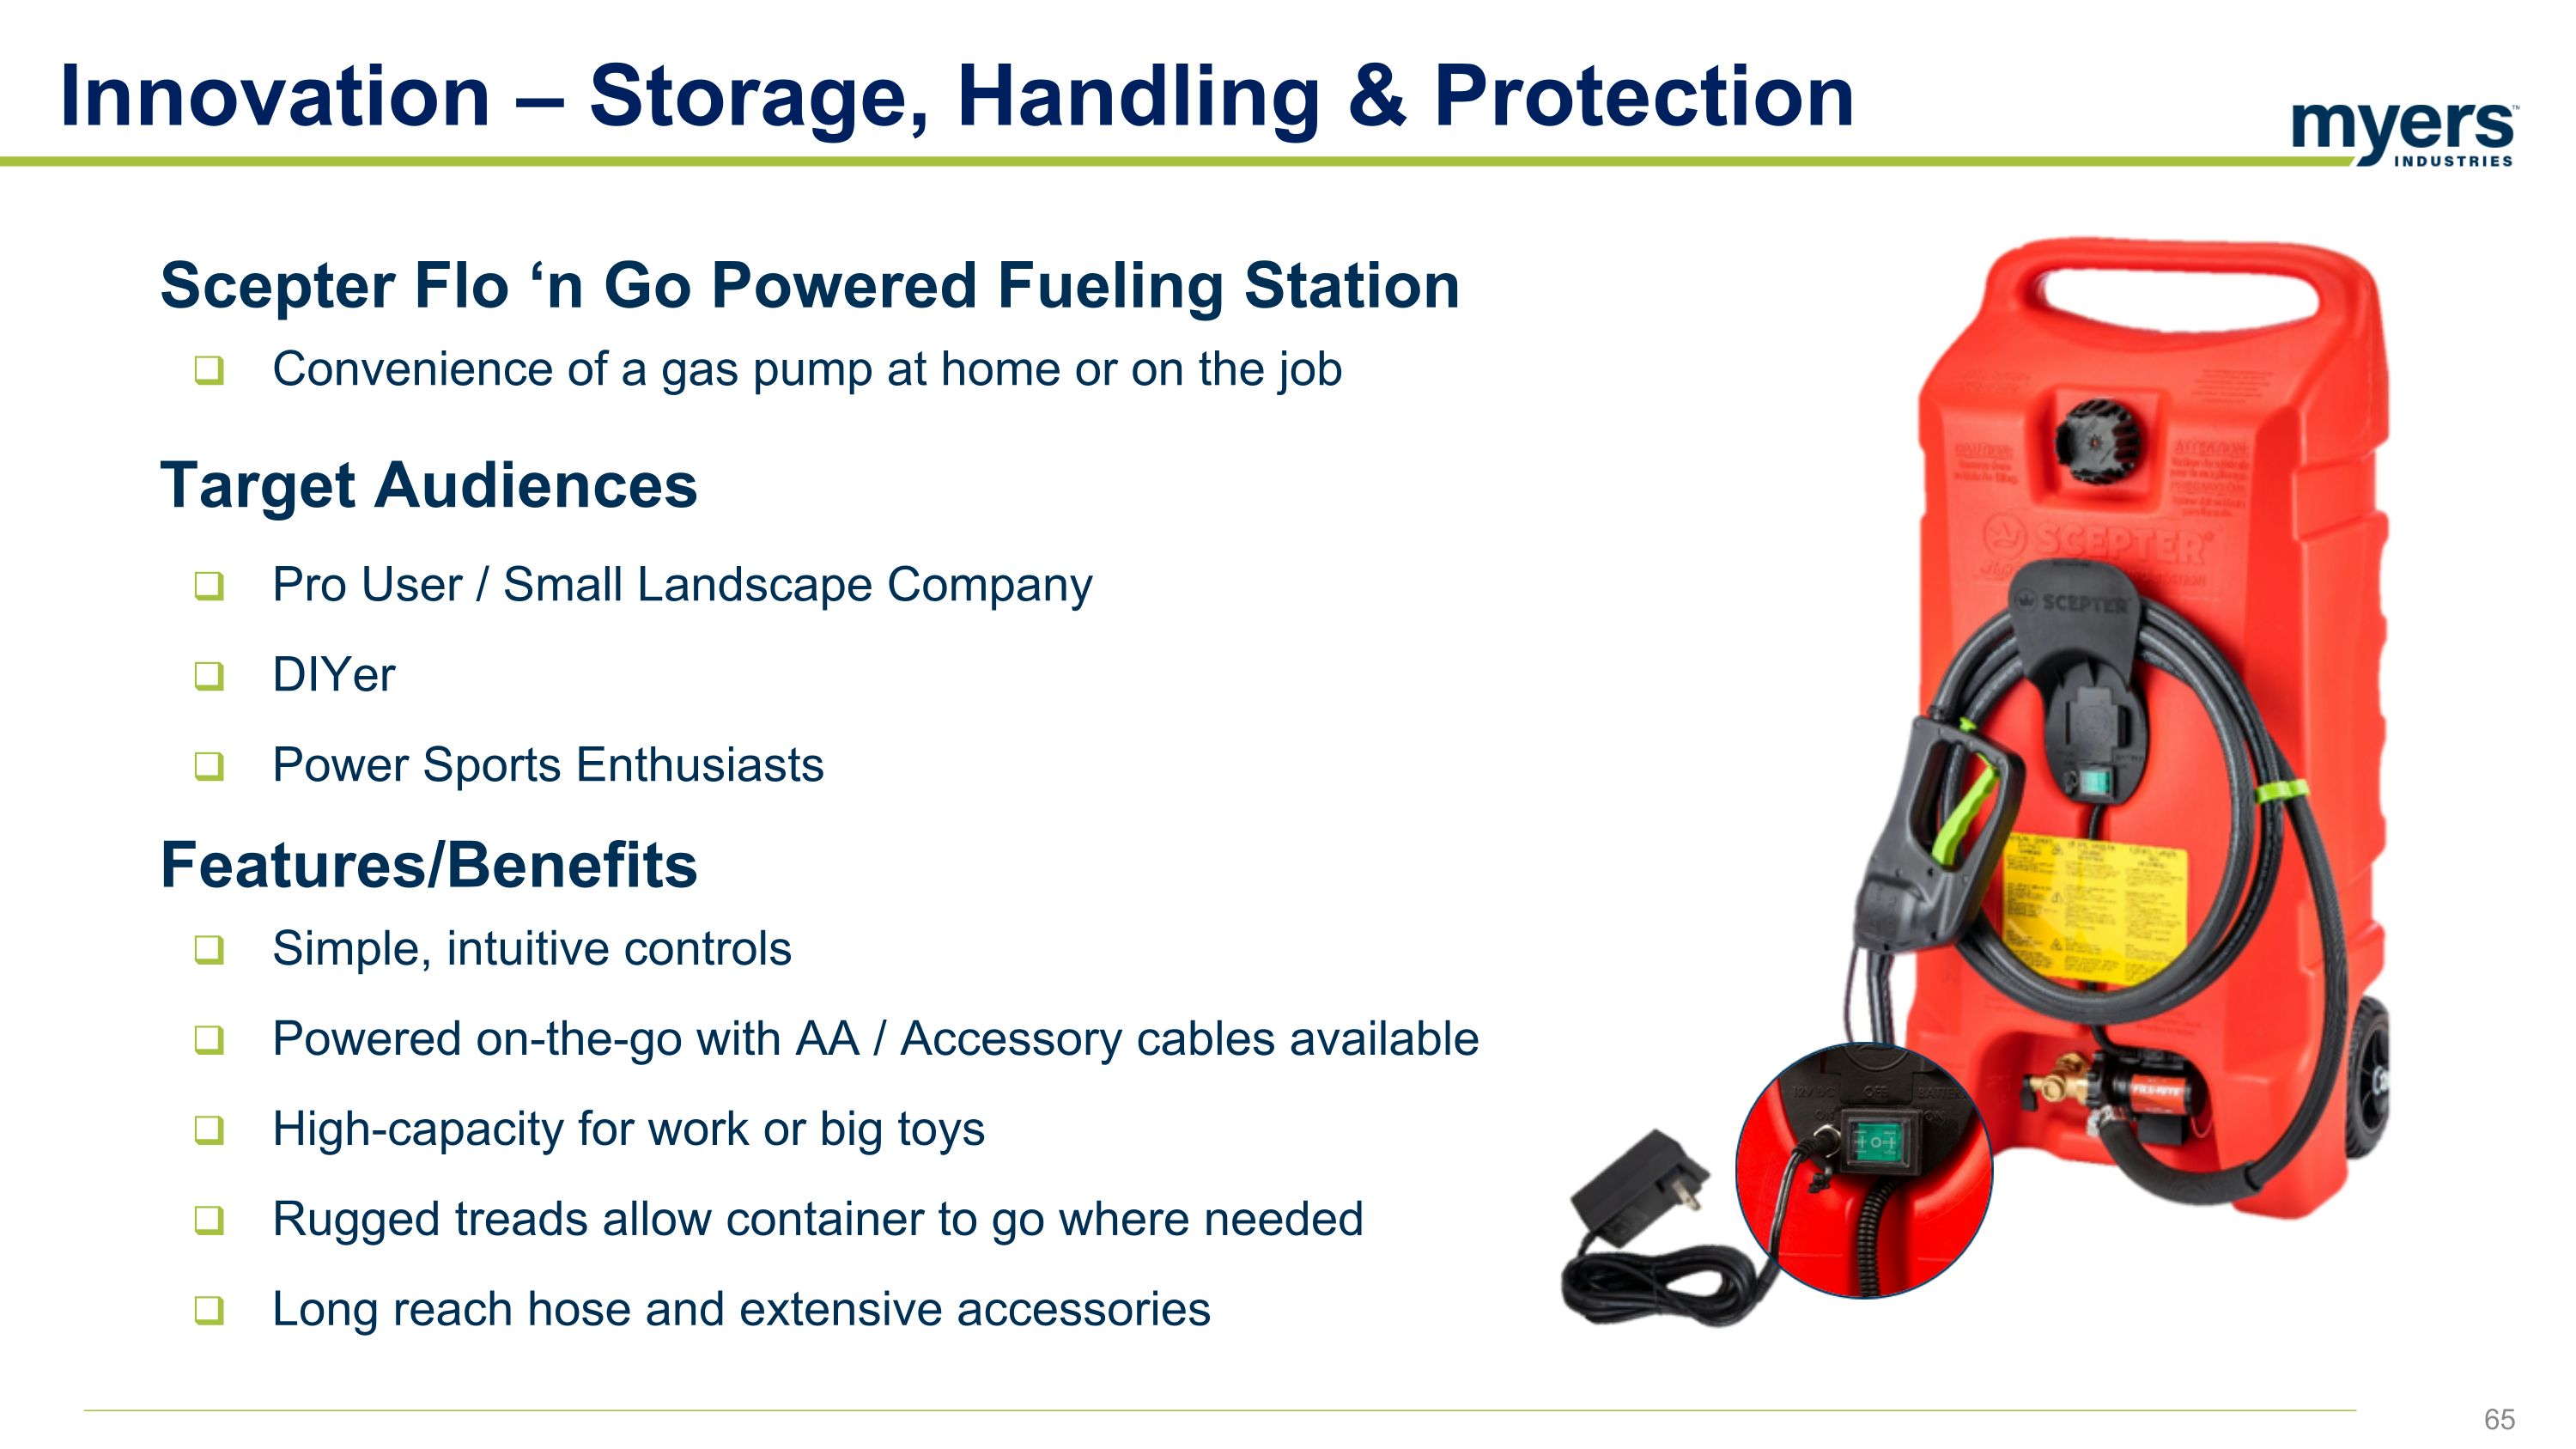
Scepter Flo ‘n Go Powered Fueling Station Convenience of a gas pump at home or on the job Target Audiences Pro User / Small Landscape Company DIYer Power Sports Enthusiasts Features/Benefits Simple, intuitive controls Powered on-the-go with AA / Accessory cables available High-capacity for work or big toys Rugged treads allow container to go where needed Long reach hose and extensive accessories Innovation – Storage, Handling & Protection
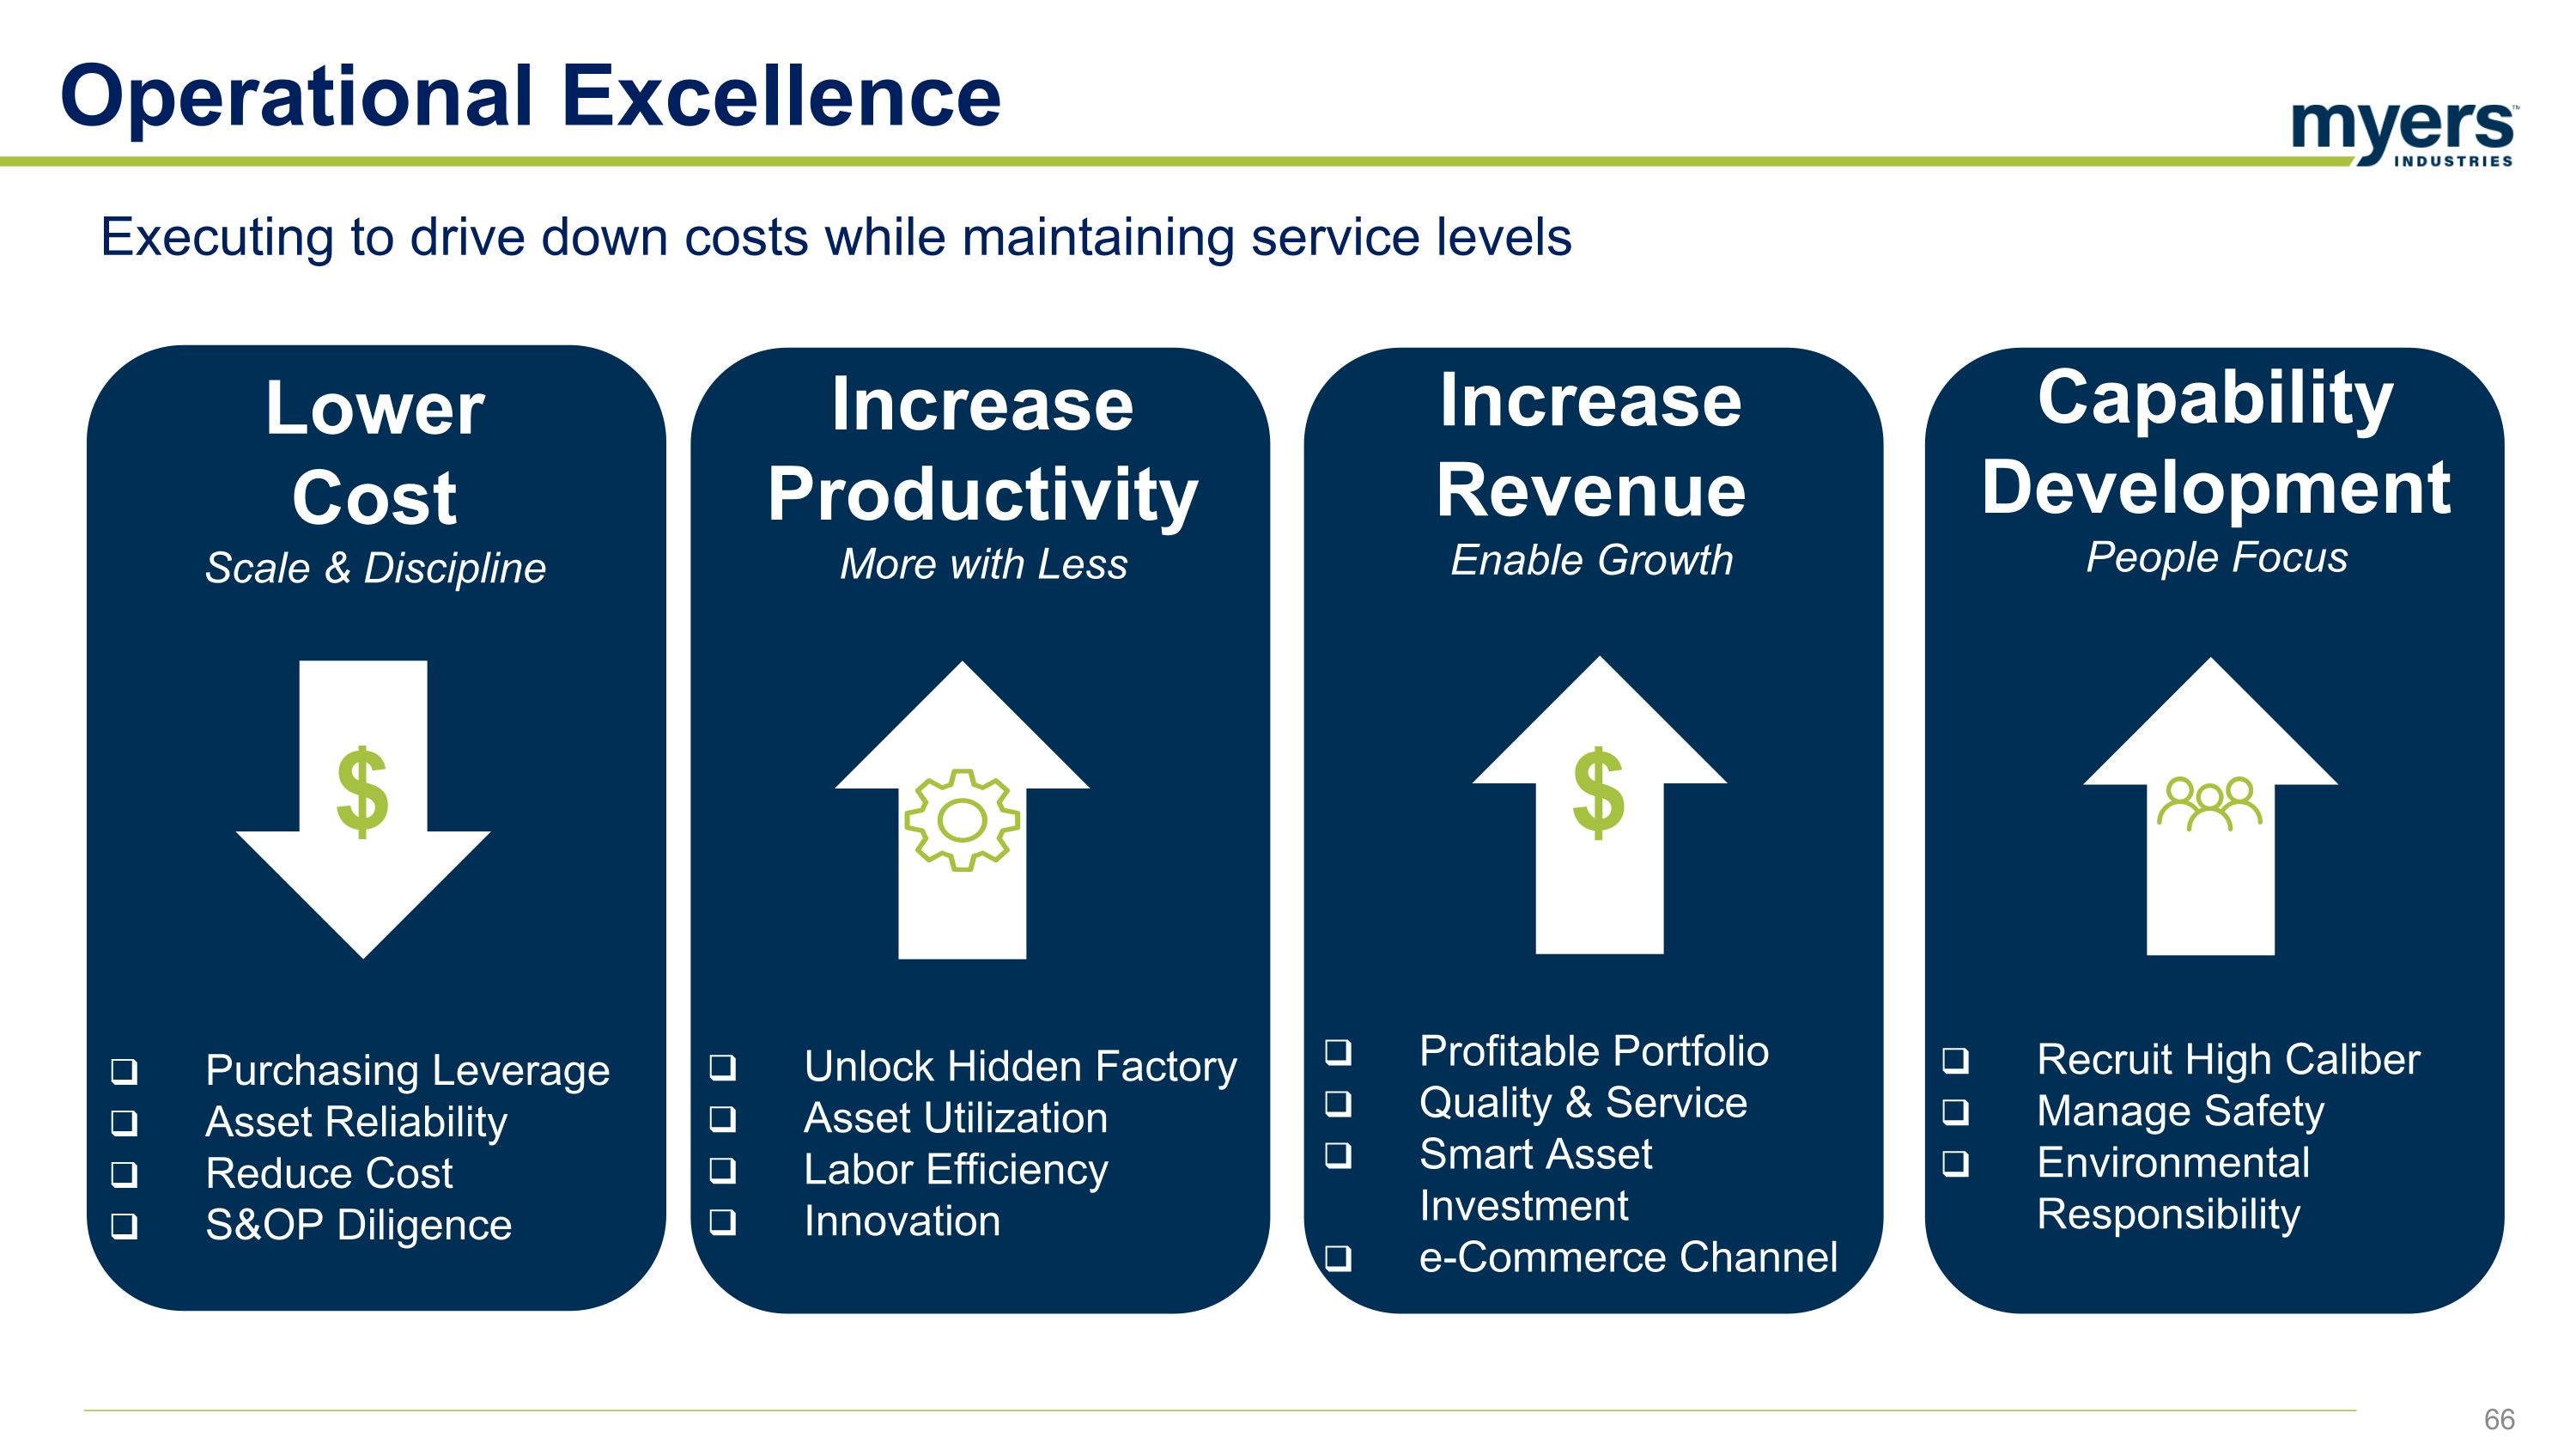
Operational Excellence Executing to drive down costs while maintaining service levels Lower Cost Scale & Discipline Purchasing Leverage Asset Reliability Reduce Cost S&OP Diligence $ Increase Productivity More with Less Unlock Hidden Factory Asset Utilization Labor Efficiency Innovation Increase Revenue Enable Growth Profitable Portfolio Quality & Service Smart Asset Investment e-Commerce Channel $ Capability Development People Focus Recruit High Caliber Manage Safety Environmental Responsibility
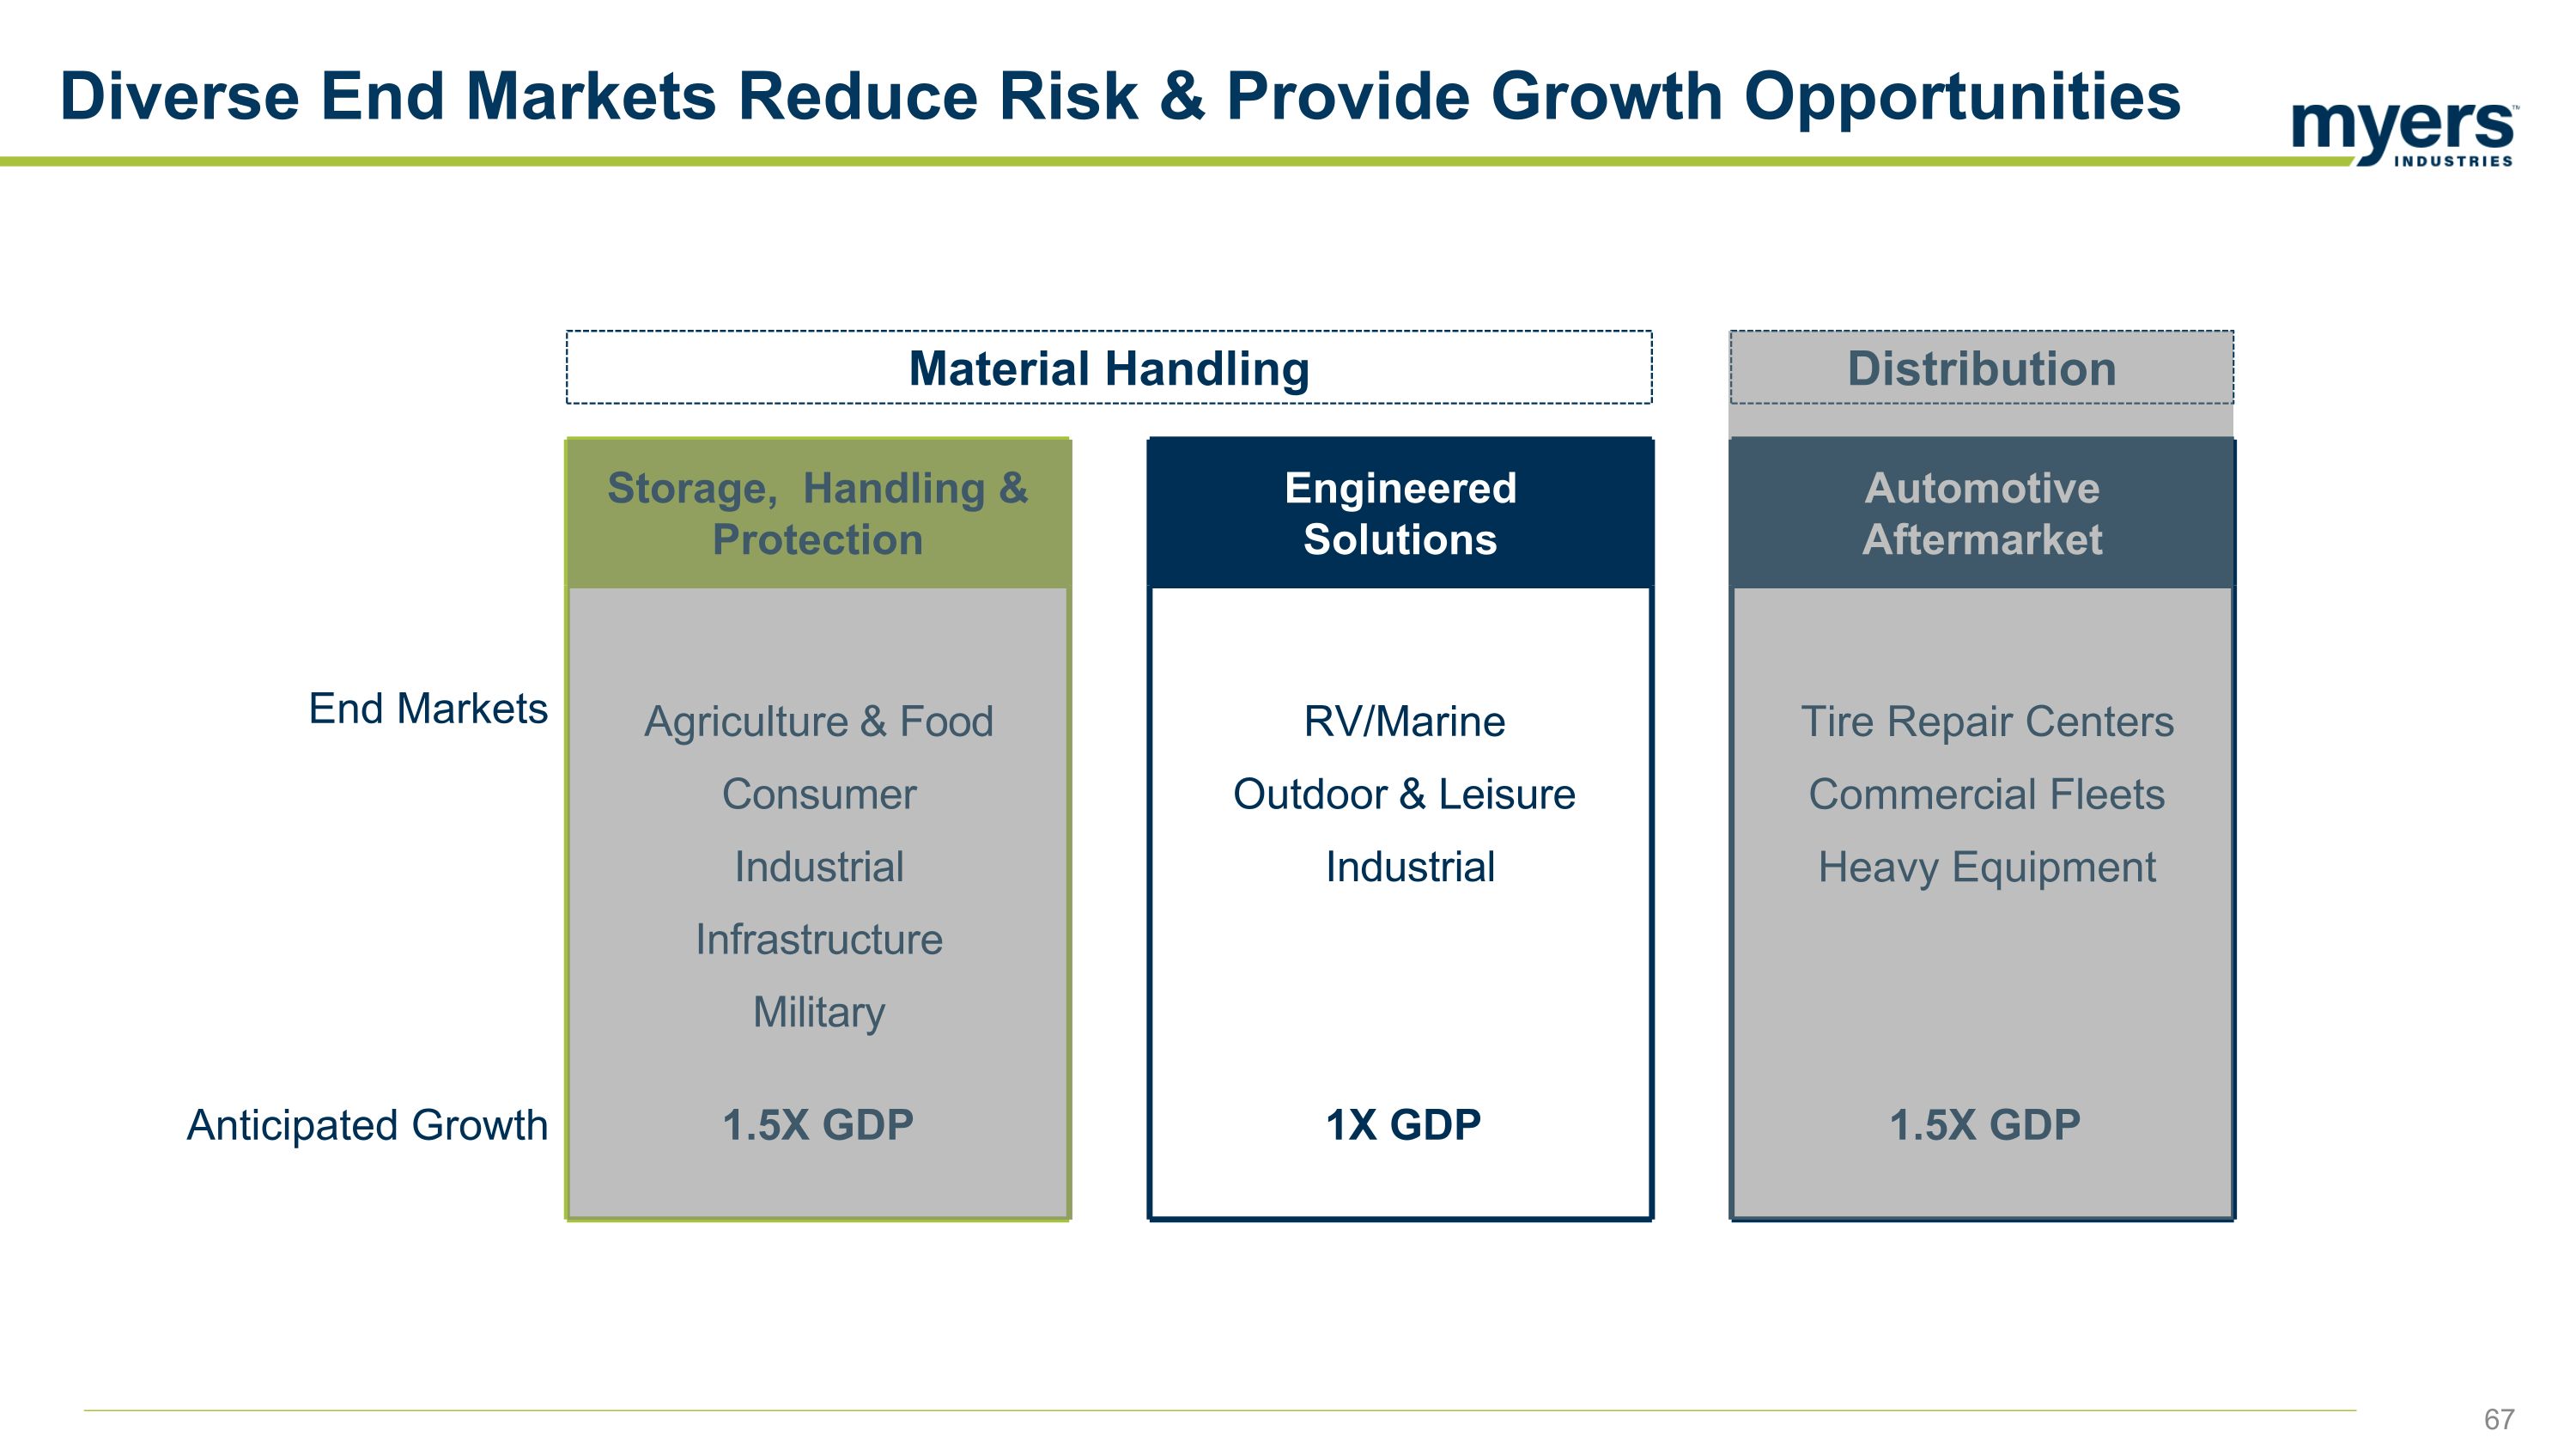
Automotive Aftermarket Engineered Solutions Storage, Handling & Protection Diverse End Markets Reduce Risk & Provide Growth Opportunities Material Handling Distribution End Markets Agriculture & Food Consumer Industrial Infrastructure Military RV/Marine Outdoor & Leisure Industrial Tire Repair Centers Commercial Fleets Heavy Equipment Anticipated Growth 1.5X GDP 1X GDP 1.5X GDP
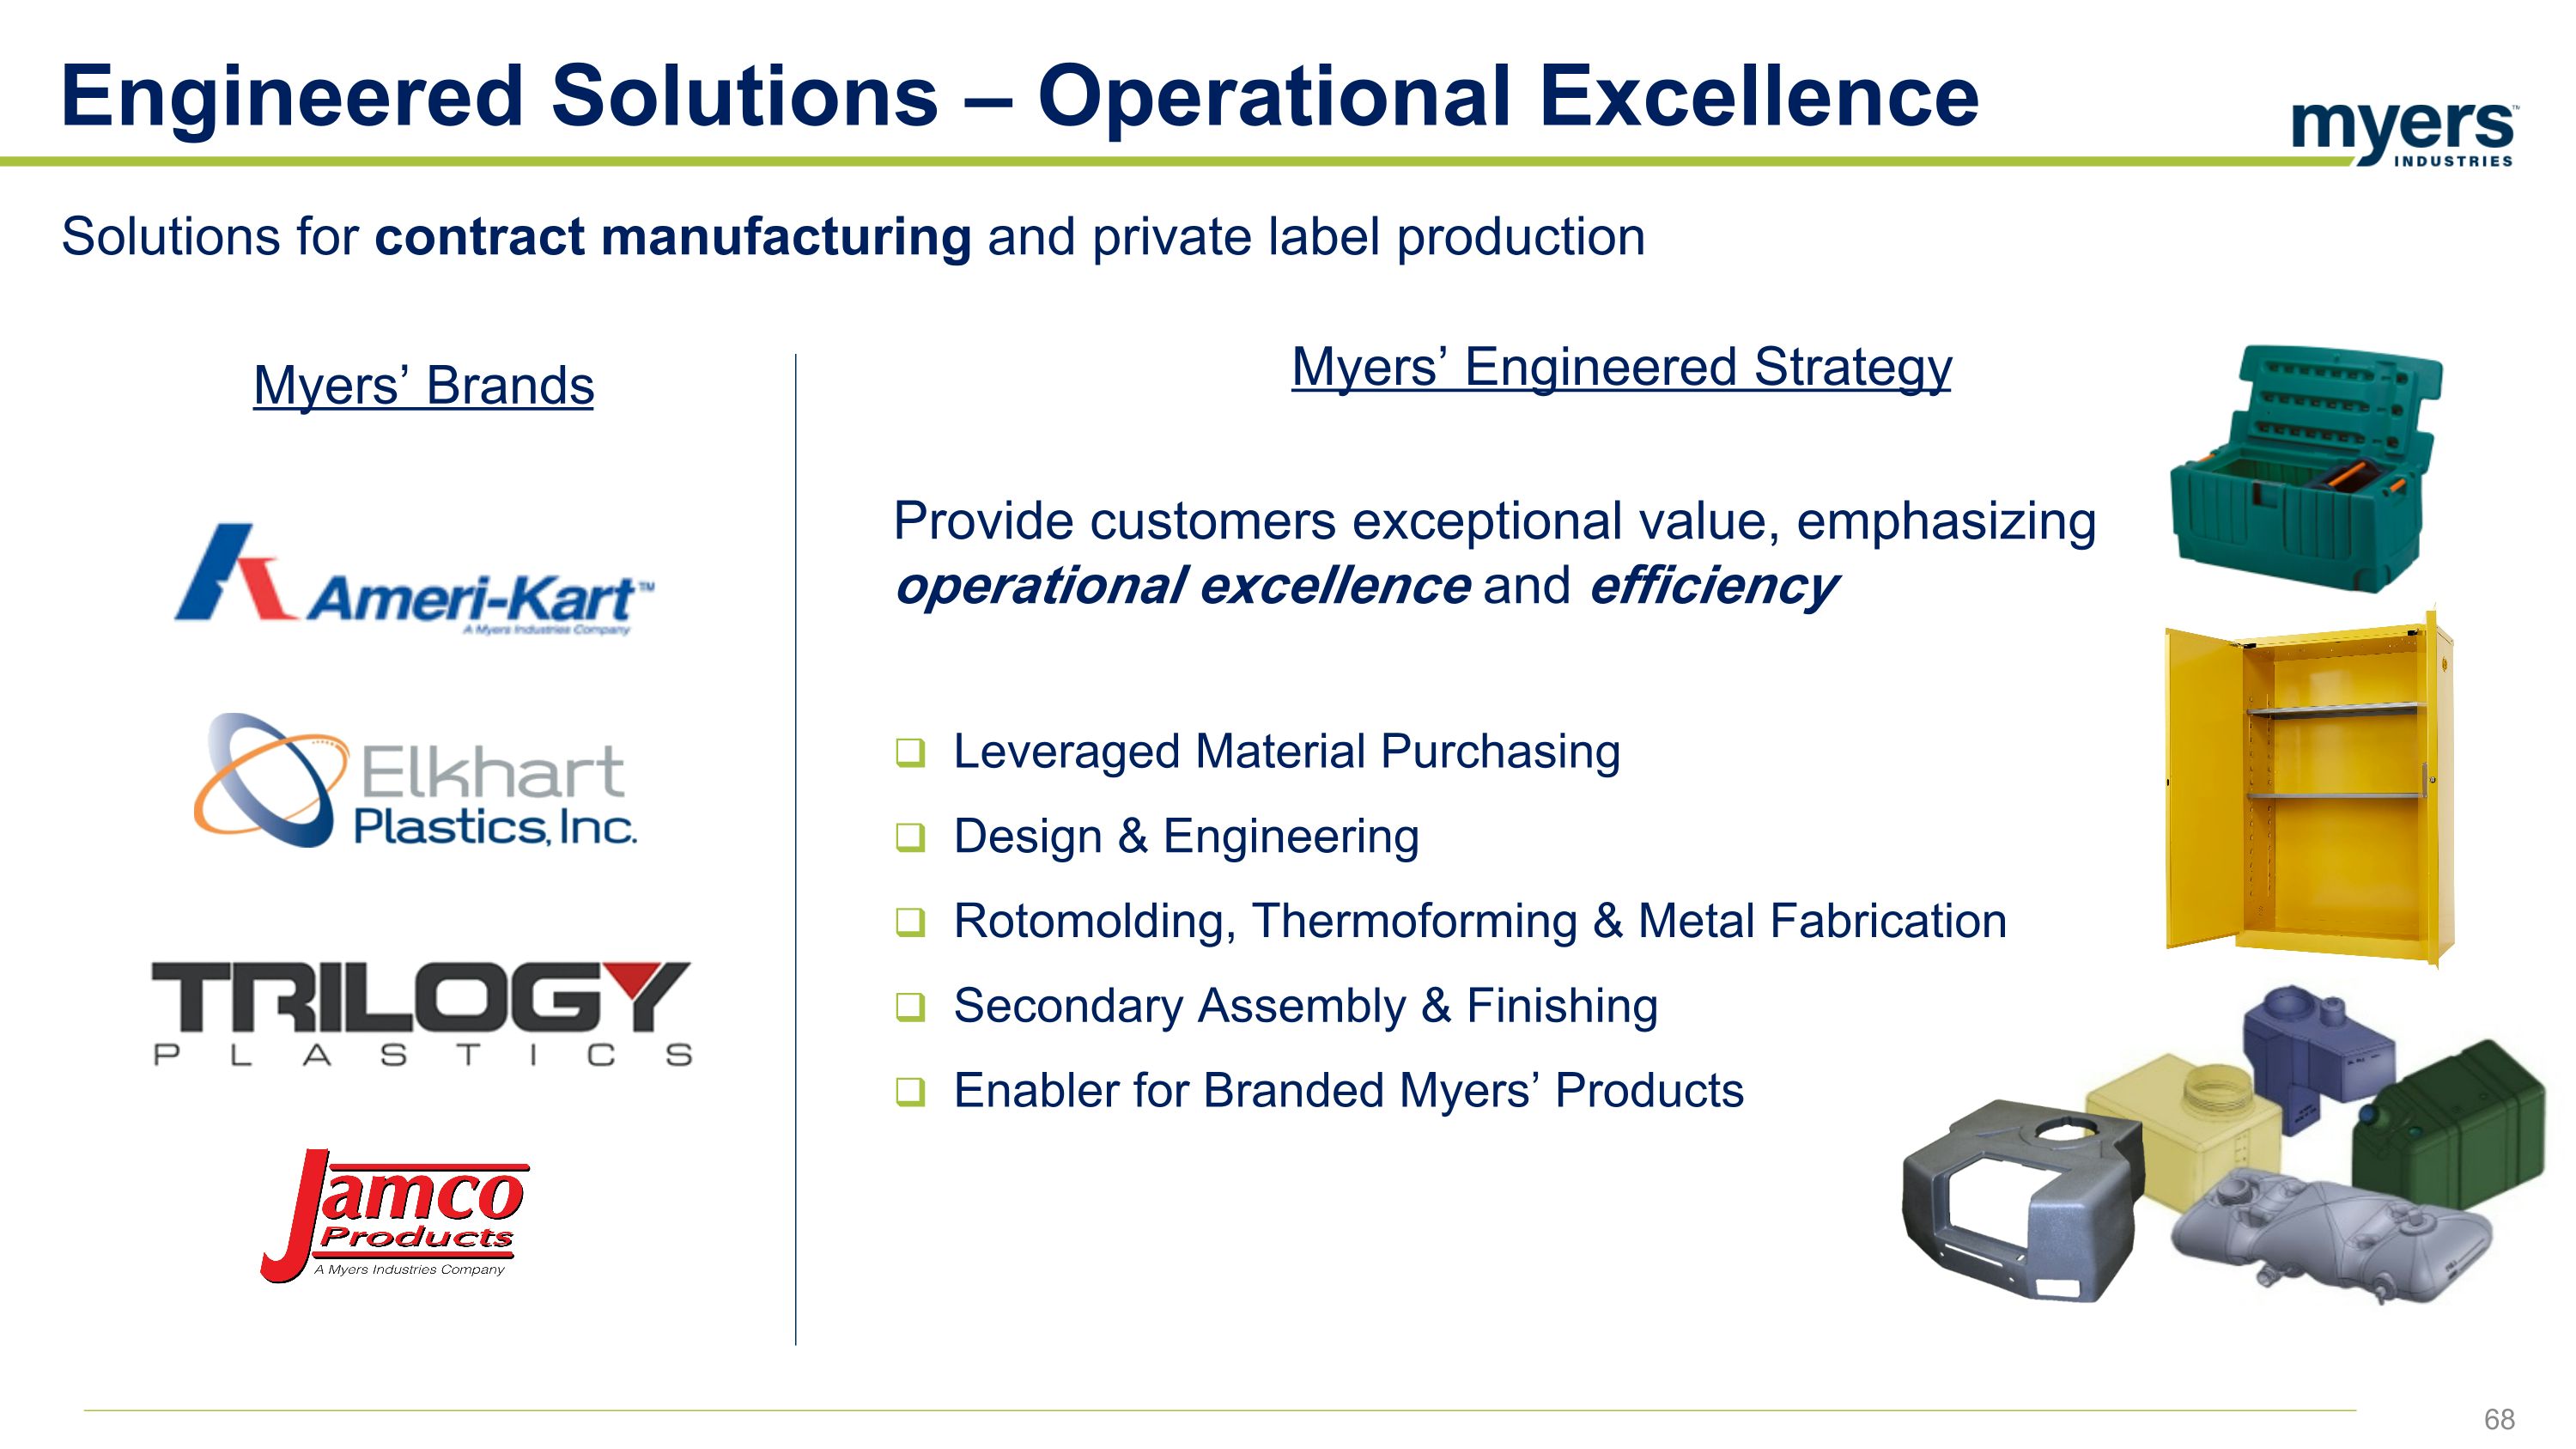
Provide customers exceptional value, emphasizing operational excellence and efficiency Leveraged Material Purchasing Design & Engineering Rotomolding, Thermoforming & Metal Fabrication Secondary Assembly & Finishing Enabler for Branded Myers’ Products Engineered Solutions – Operational Excellence Solutions for contract manufacturing and private label production Myers’ Brands Myers’ Engineered Strategy
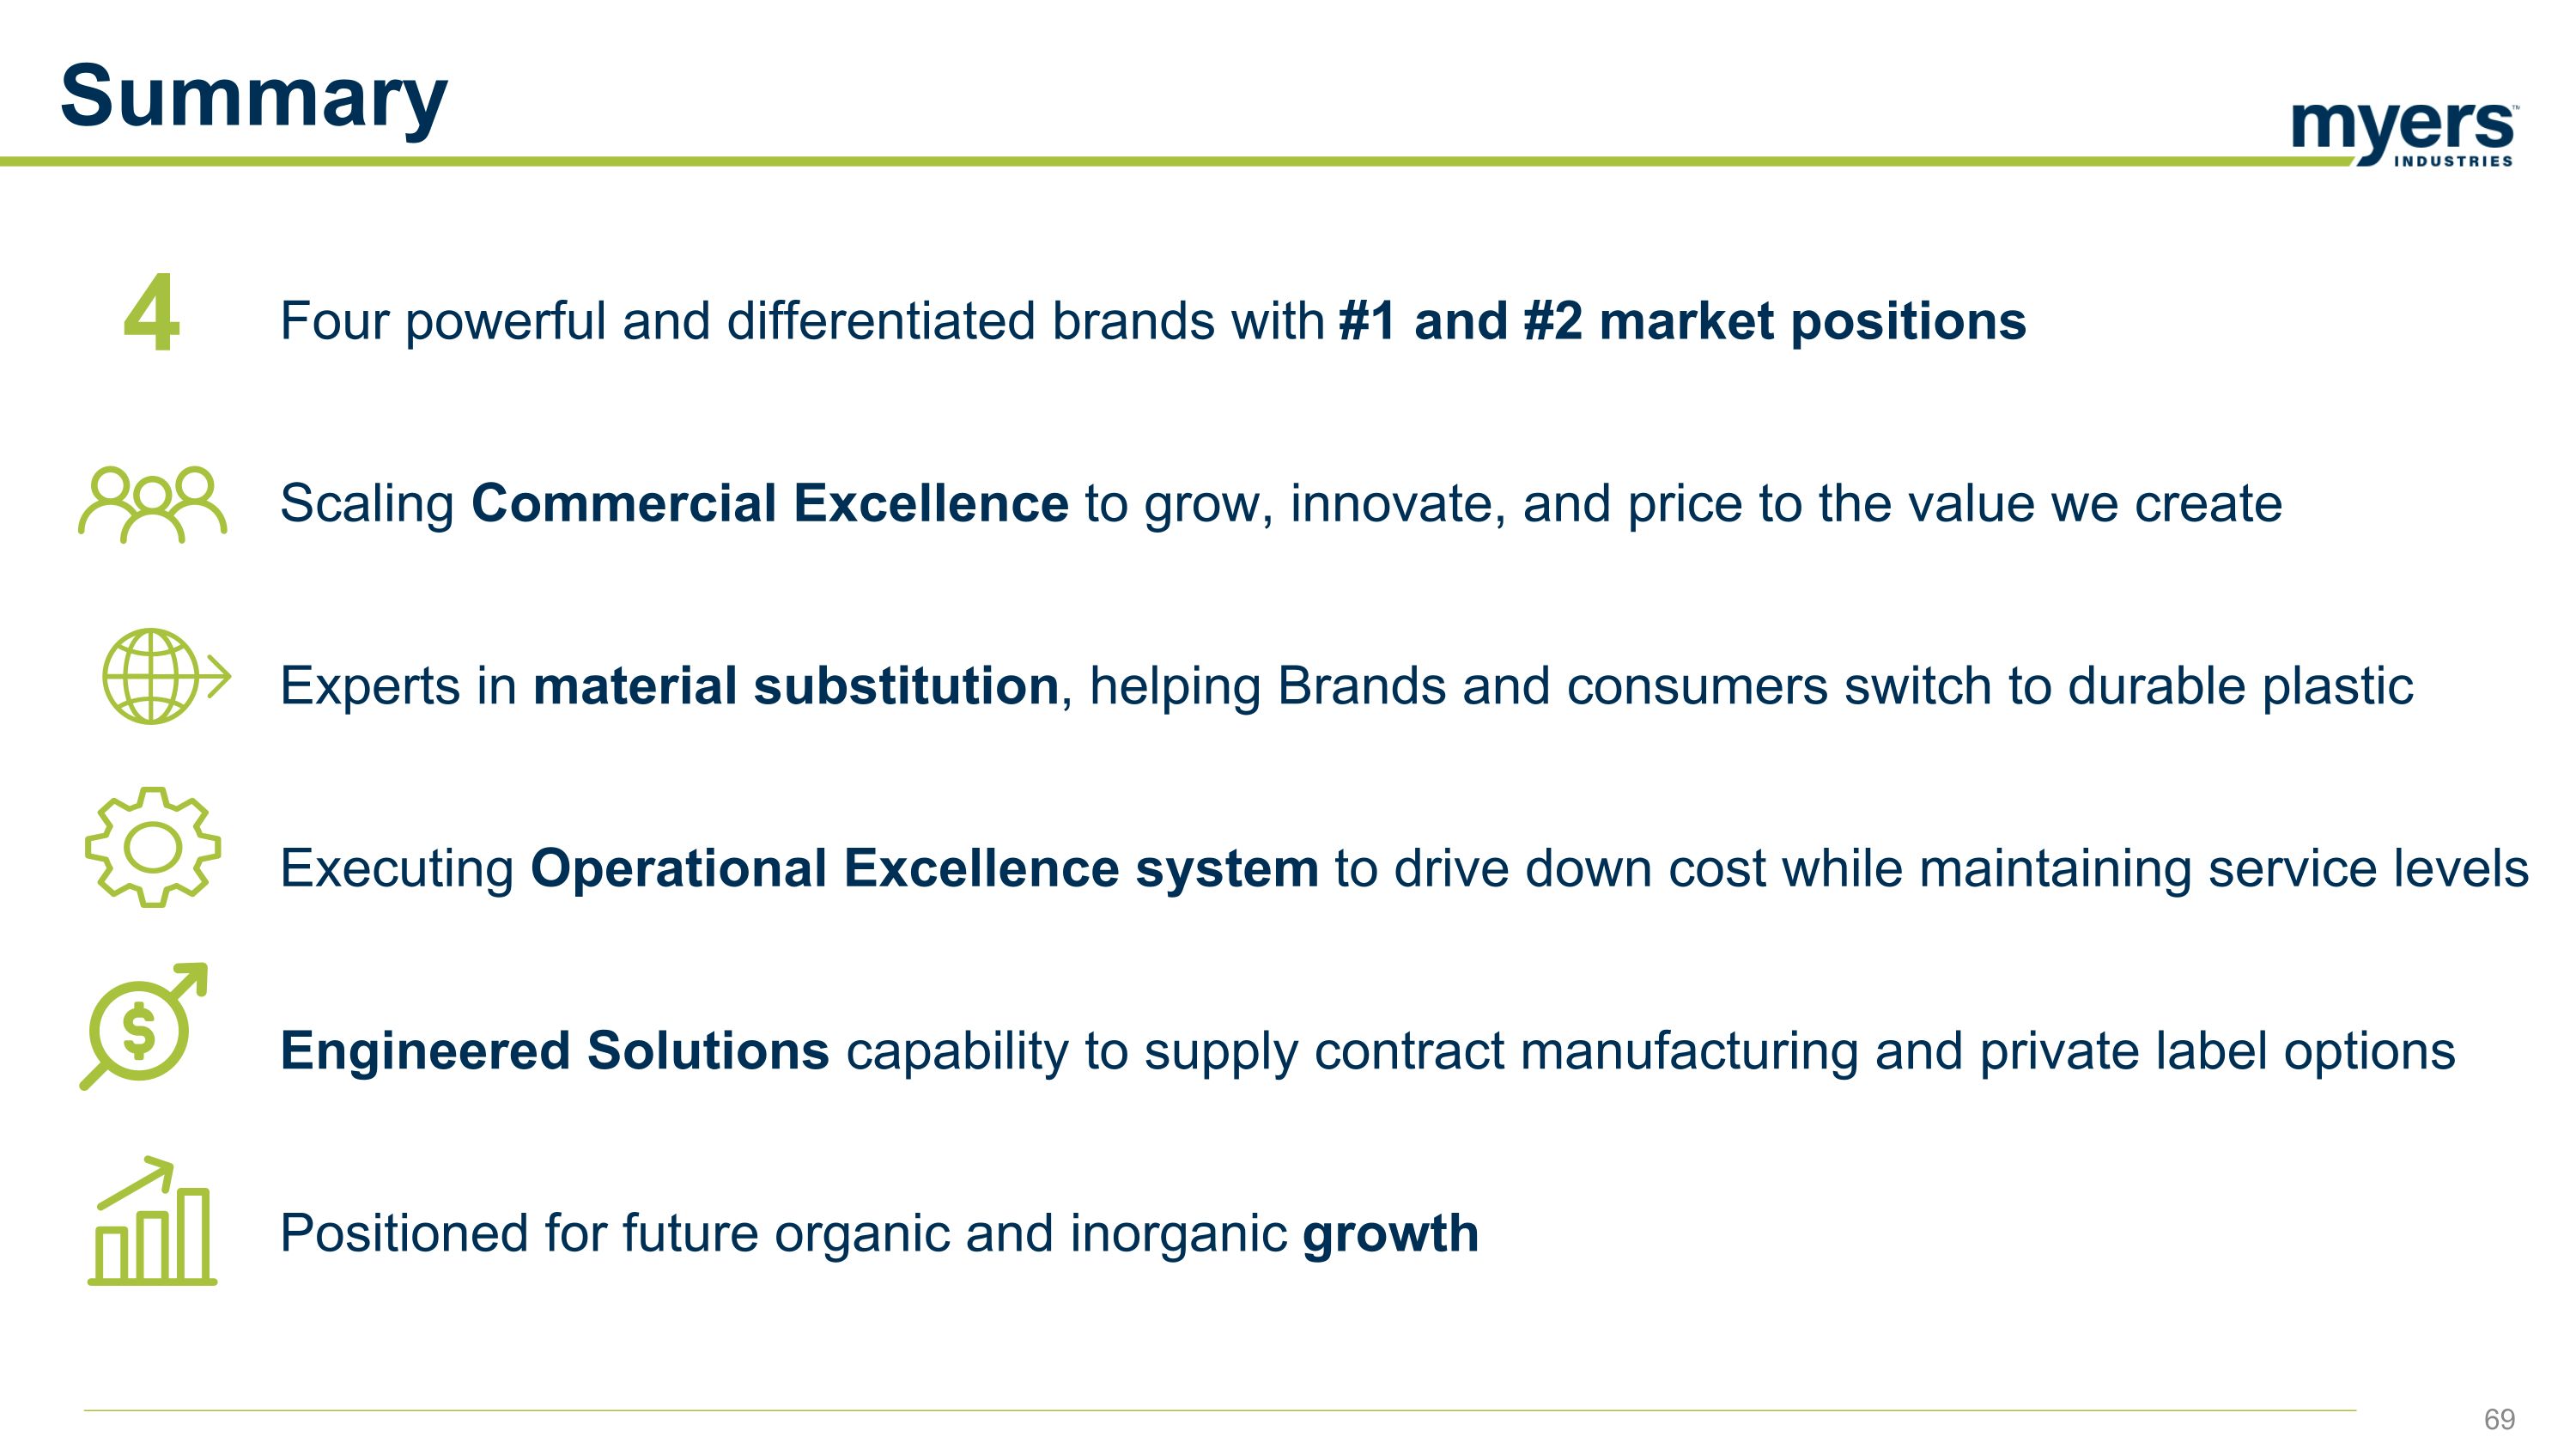
Summary Four powerful and differentiated brands with #1 and #2 market positions Scaling Commercial Excellence to grow, innovate, and price to the value we create Experts in material substitution, helping Brands and consumers switch to durable plastic Executing Operational Excellence system to drive down cost while maintaining service levels Engineered Solutions capability to supply contract manufacturing and private label options Positioned for future organic and inorganic growth 4
Signature Systems Jeff Condino, Business Vice President 70
Protecting the World from the Ground Up Leading manufacturer of composite ground protection solutions Leading provider of turf protection solutions for stadiums and event venues Significant continued growth opportunity for composite mats due to overall end-market demand and displacement of traditional wood mats $2.7 billion estimated total addressable market for ground protection solutions +$1 trillion infrastructure investment over the next decade – a powerful tailwind for North America ground protection matting demand
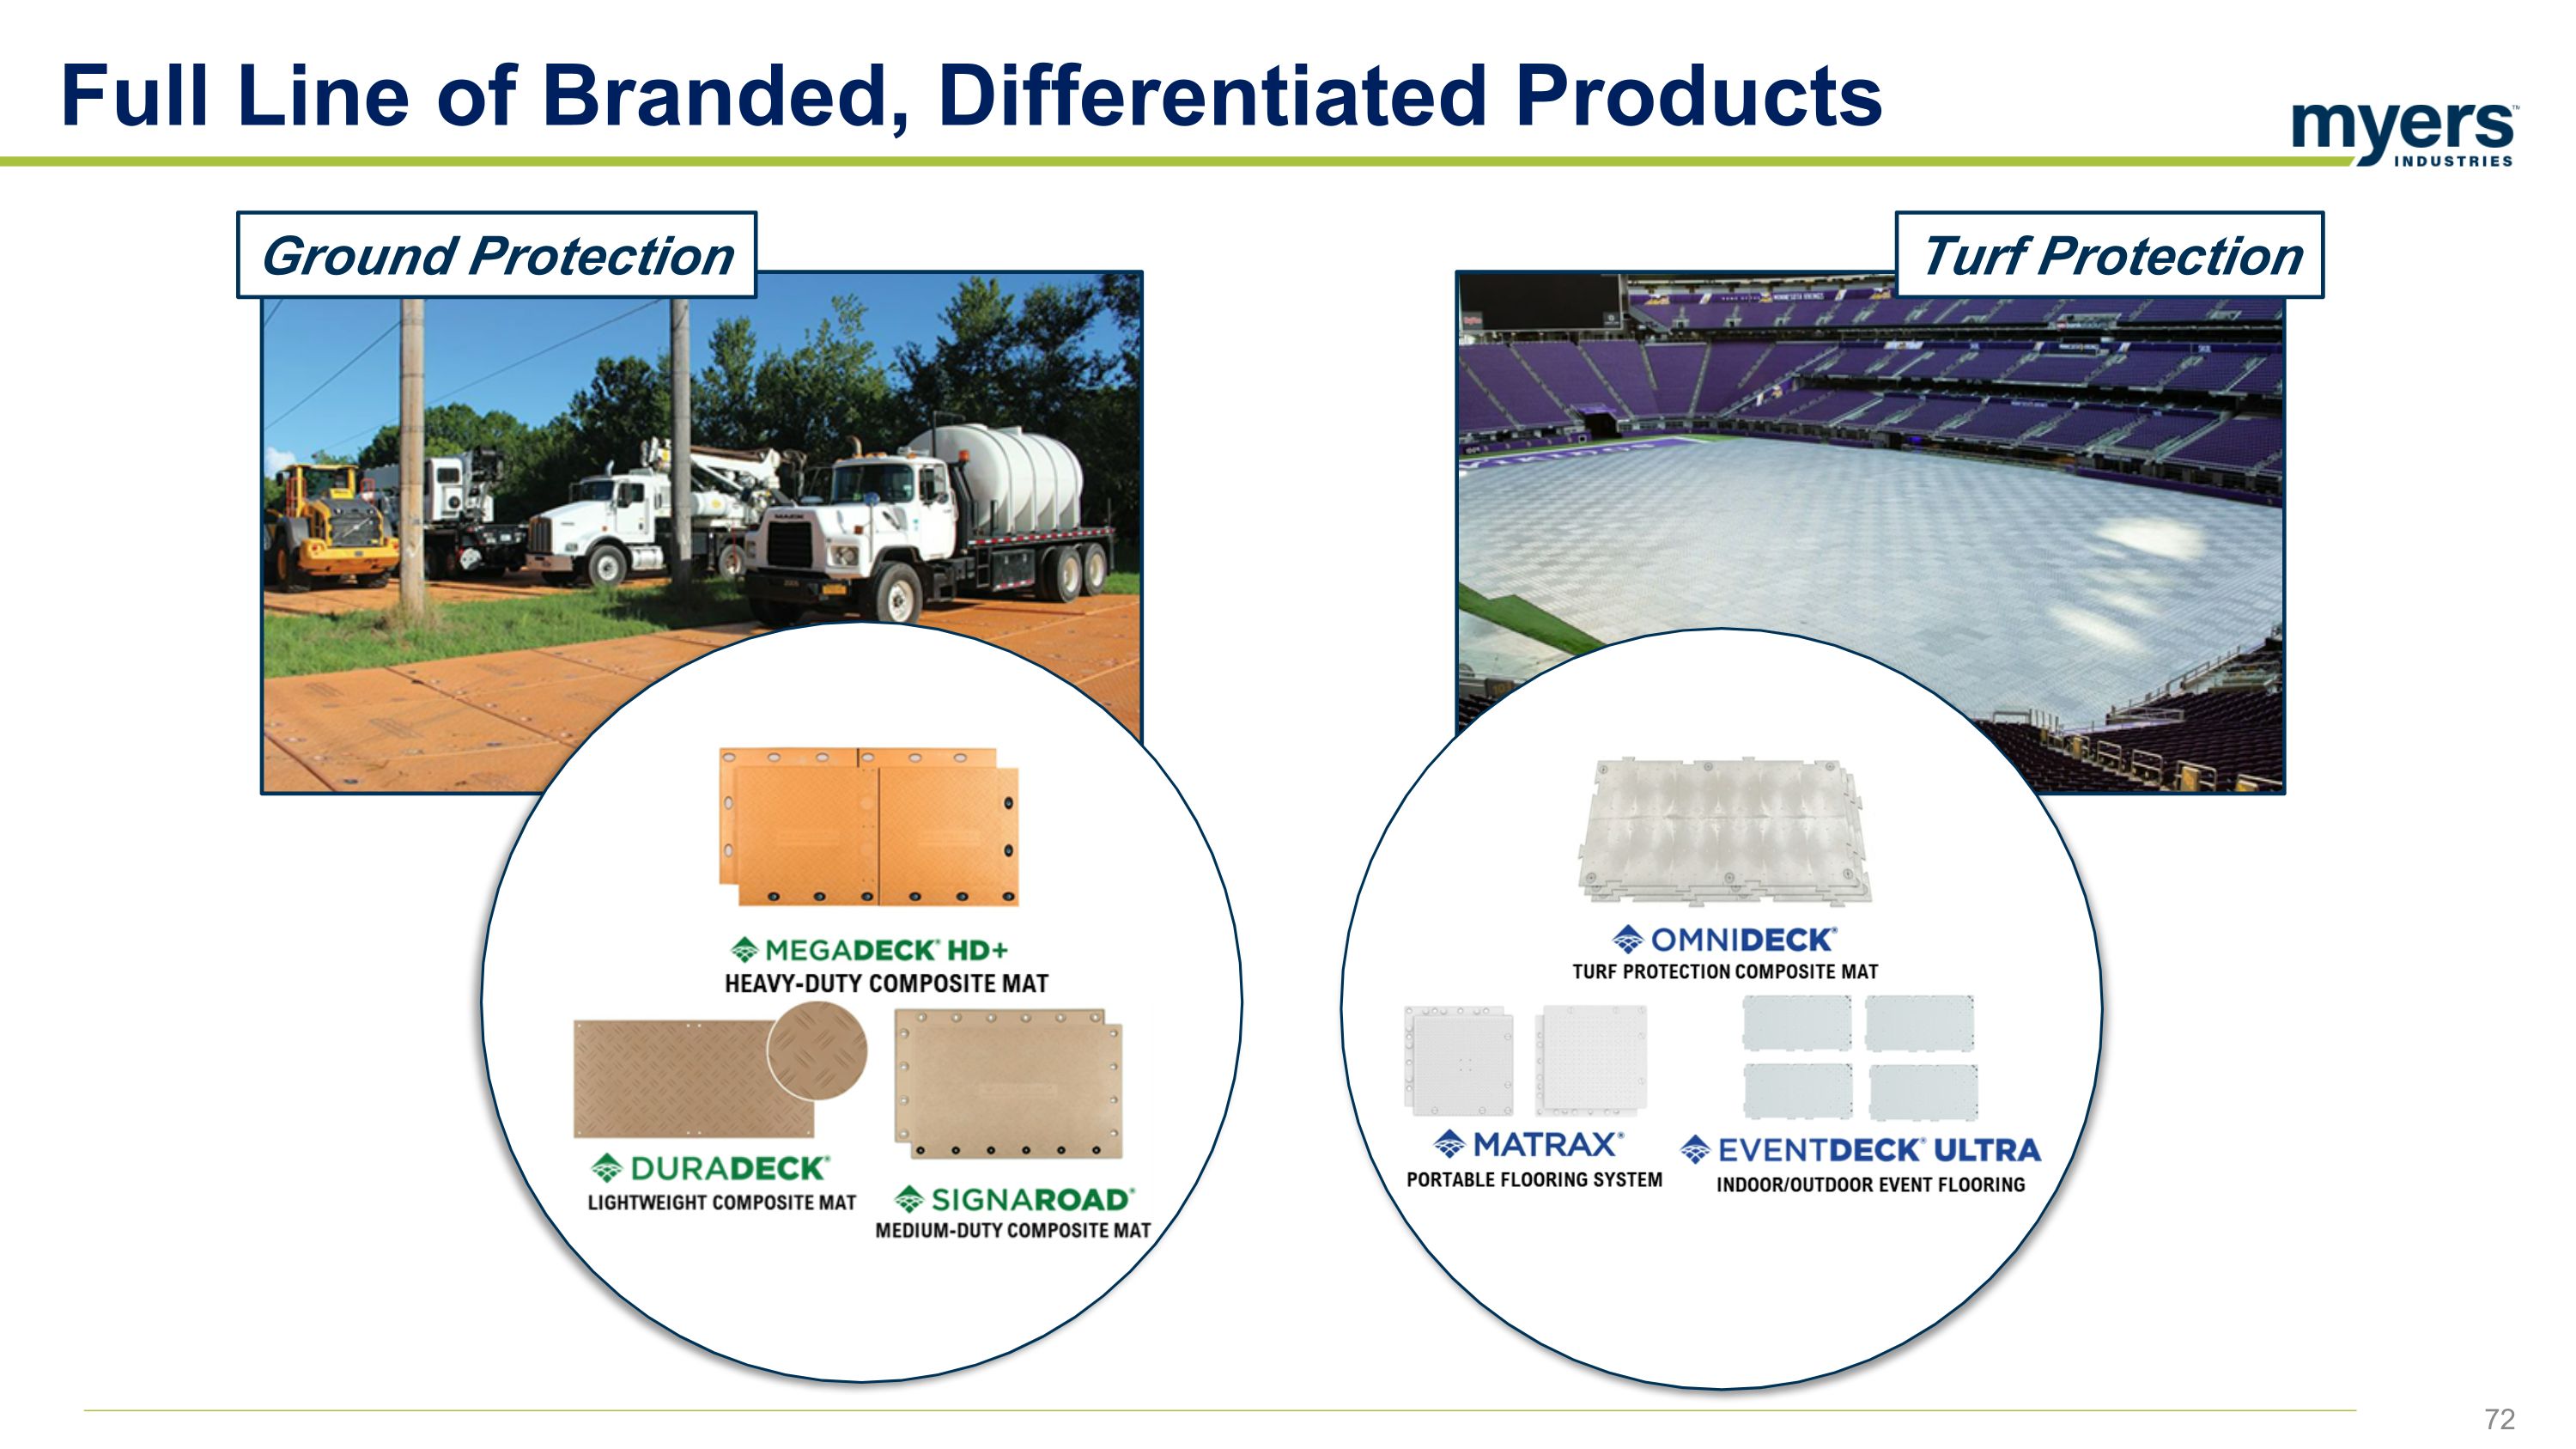
Full Line of Branded, Differentiated Products Ground Protection Turf Protection
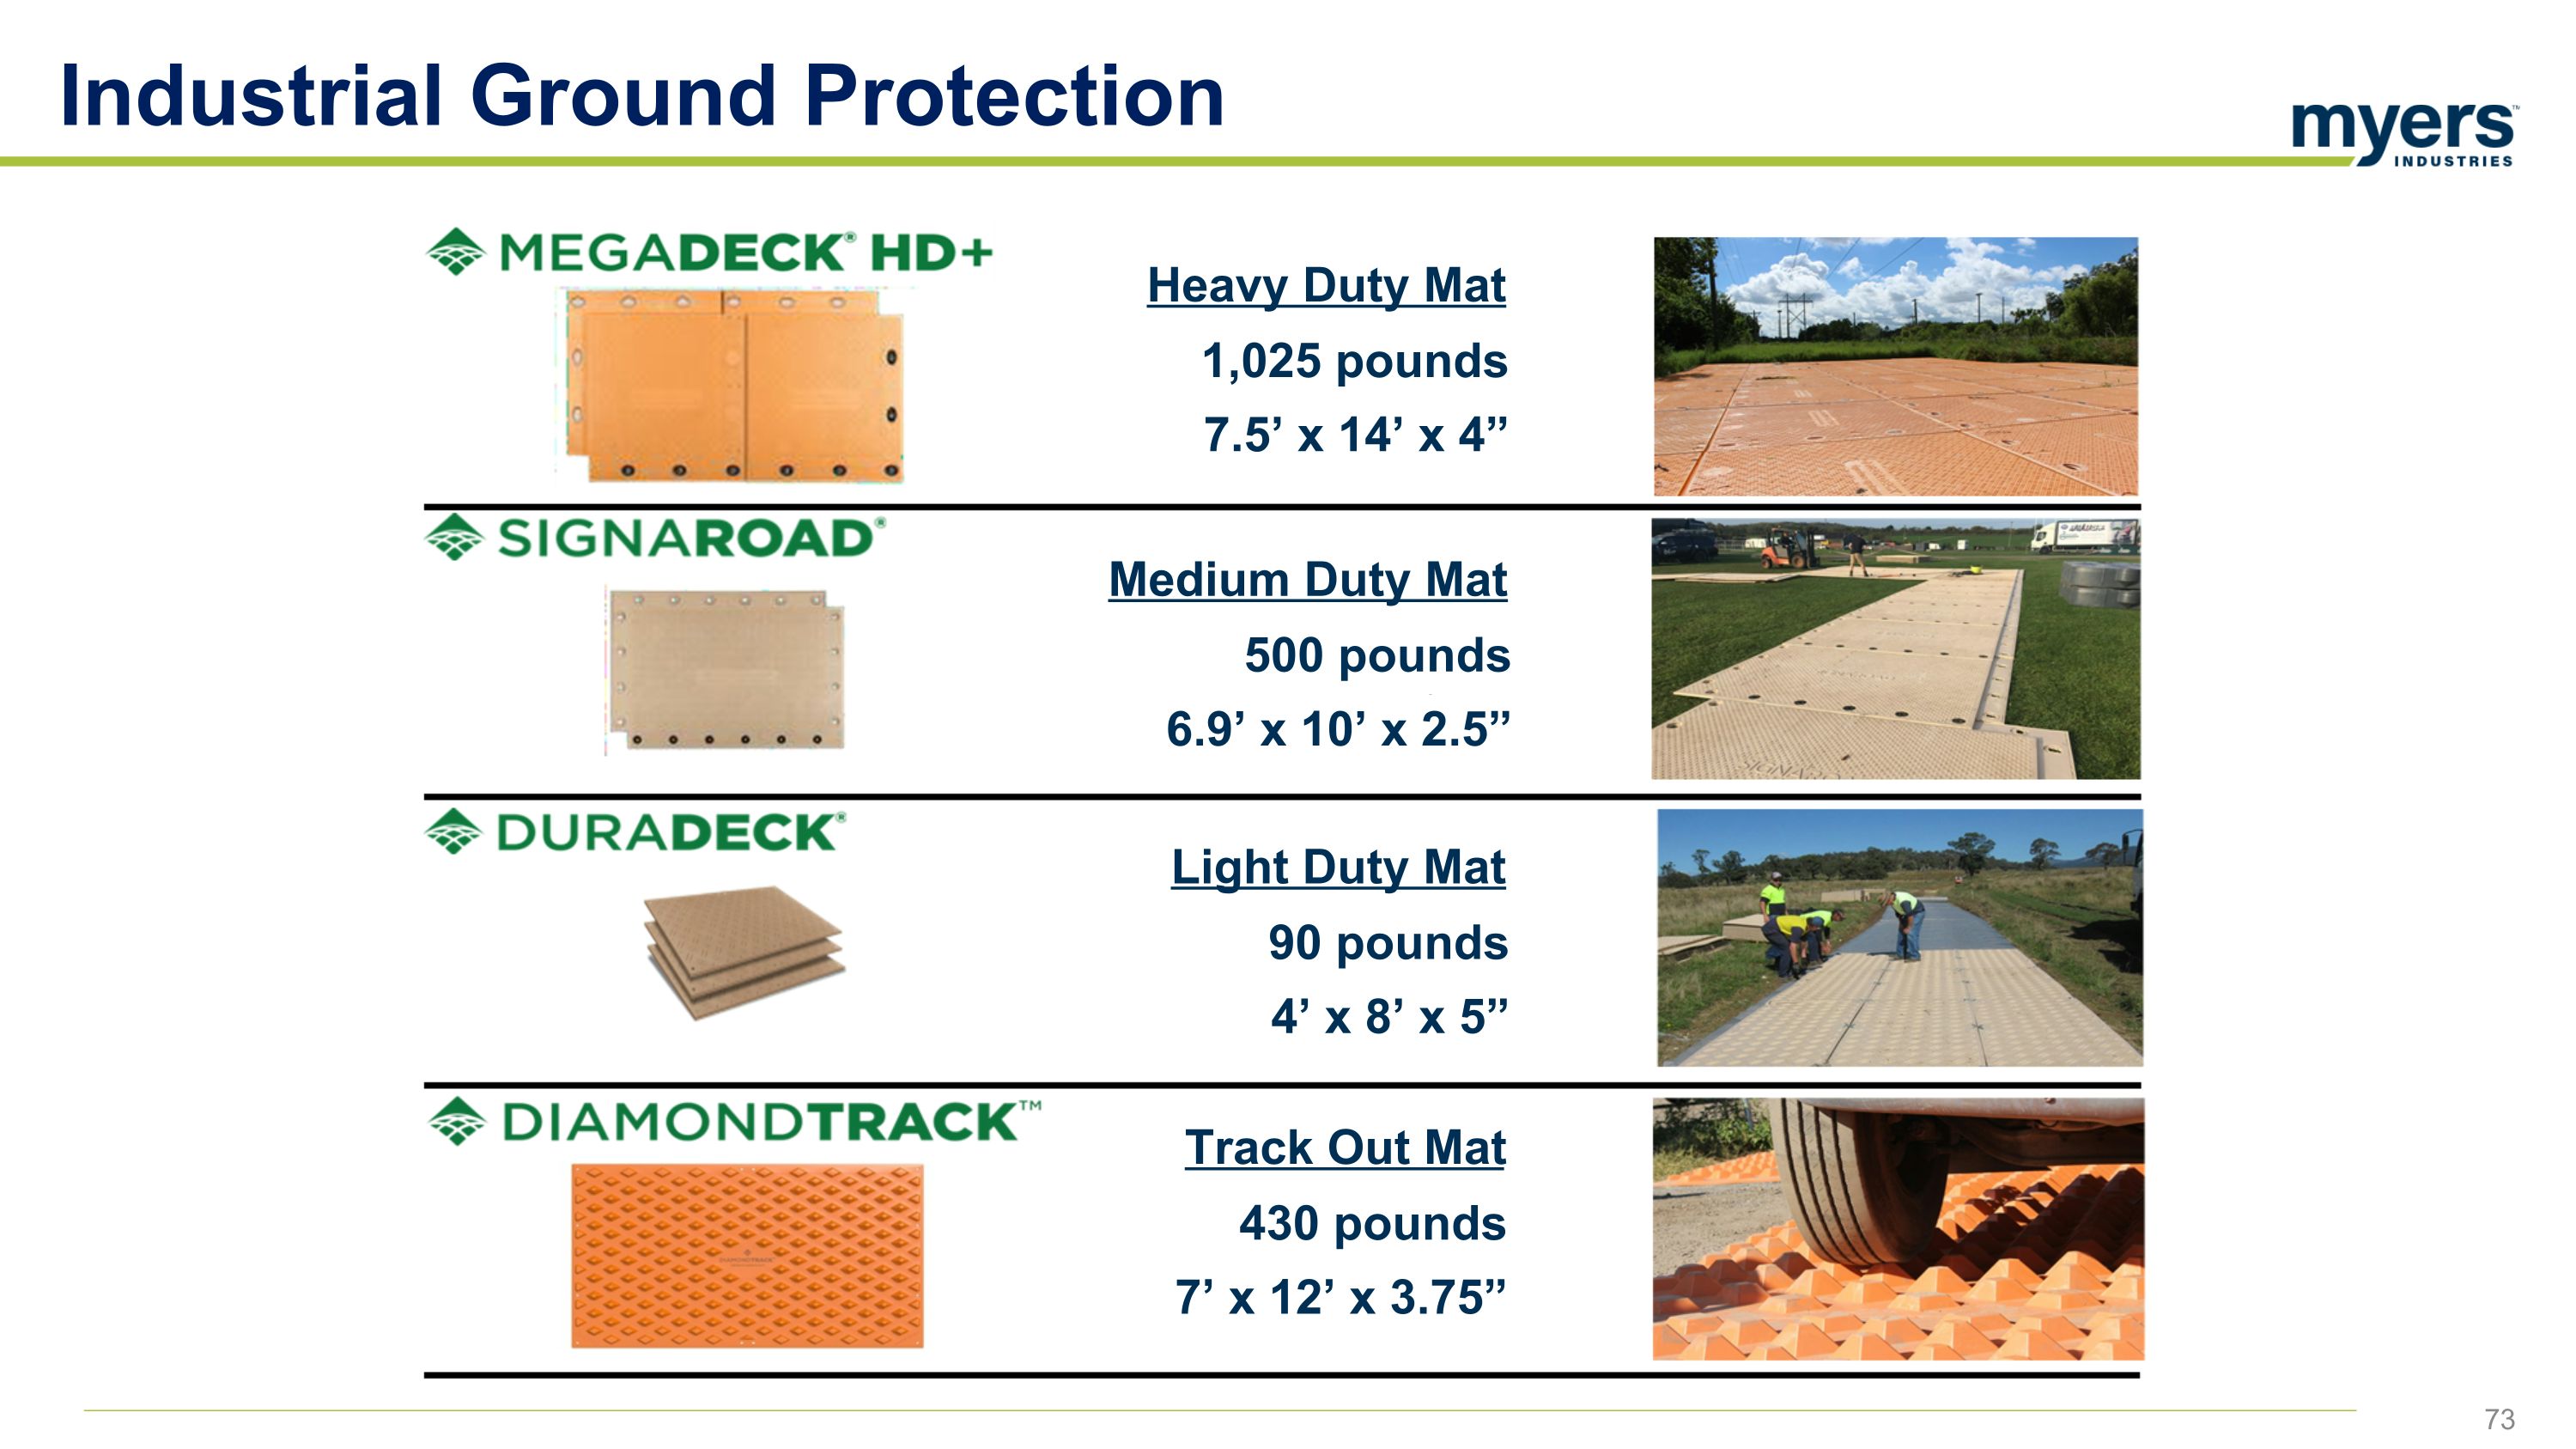
Industrial Ground Protection Heavy Duty Mat 1,025 pounds 7.5’ x 14’ x 4” Medium Duty Mat 500 pounds 6.9’ x 10’ x 2.5” Light Duty Mat 90 pounds 4’ x 8’ x 5” Track Out Mat 430 pounds 7’ x 12’ x 3.75”
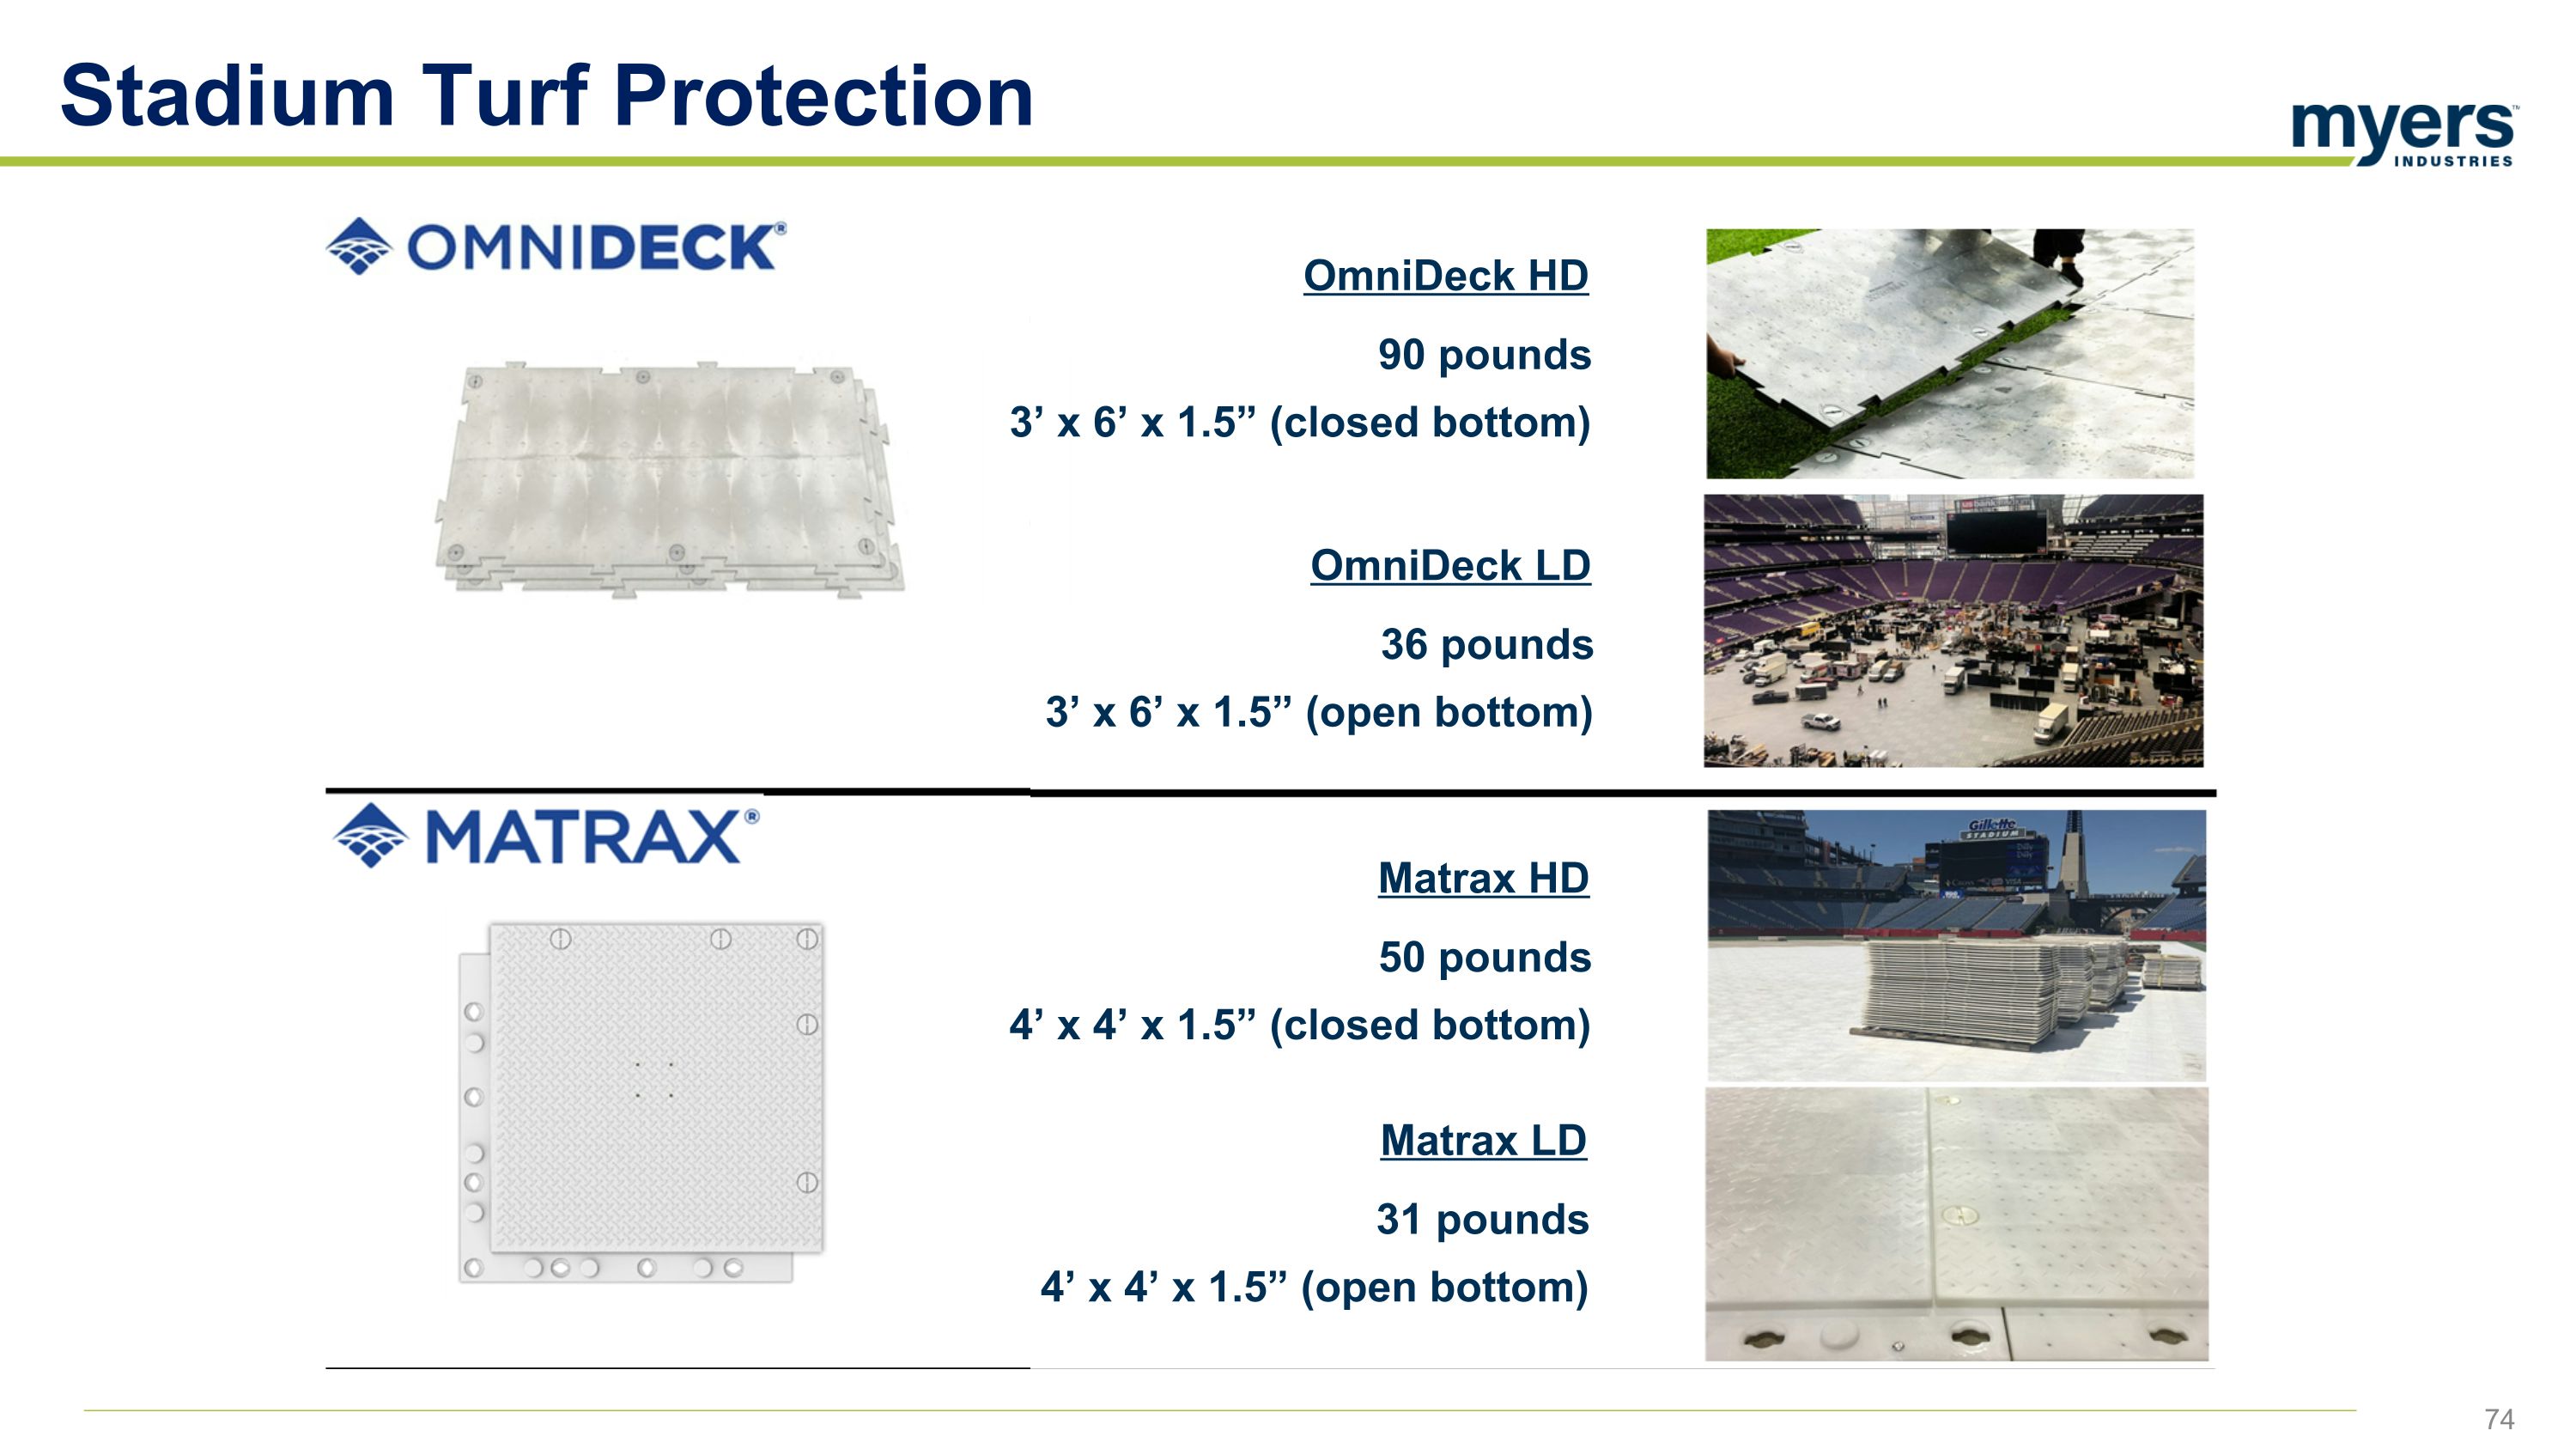
Stadium Turf Protection OmniDeck HD 90 pounds 3’ x 6’ x 1.5” (closed bottom) OmniDeck LD 36 pounds 3’ x 6’ x 1.5” (open bottom) Matrax HD 50 pounds 4’ x 4’ x 1.5” (closed bottom) Matrax LD 31 pounds 4’ x 4’ x 1.5” (open bottom)
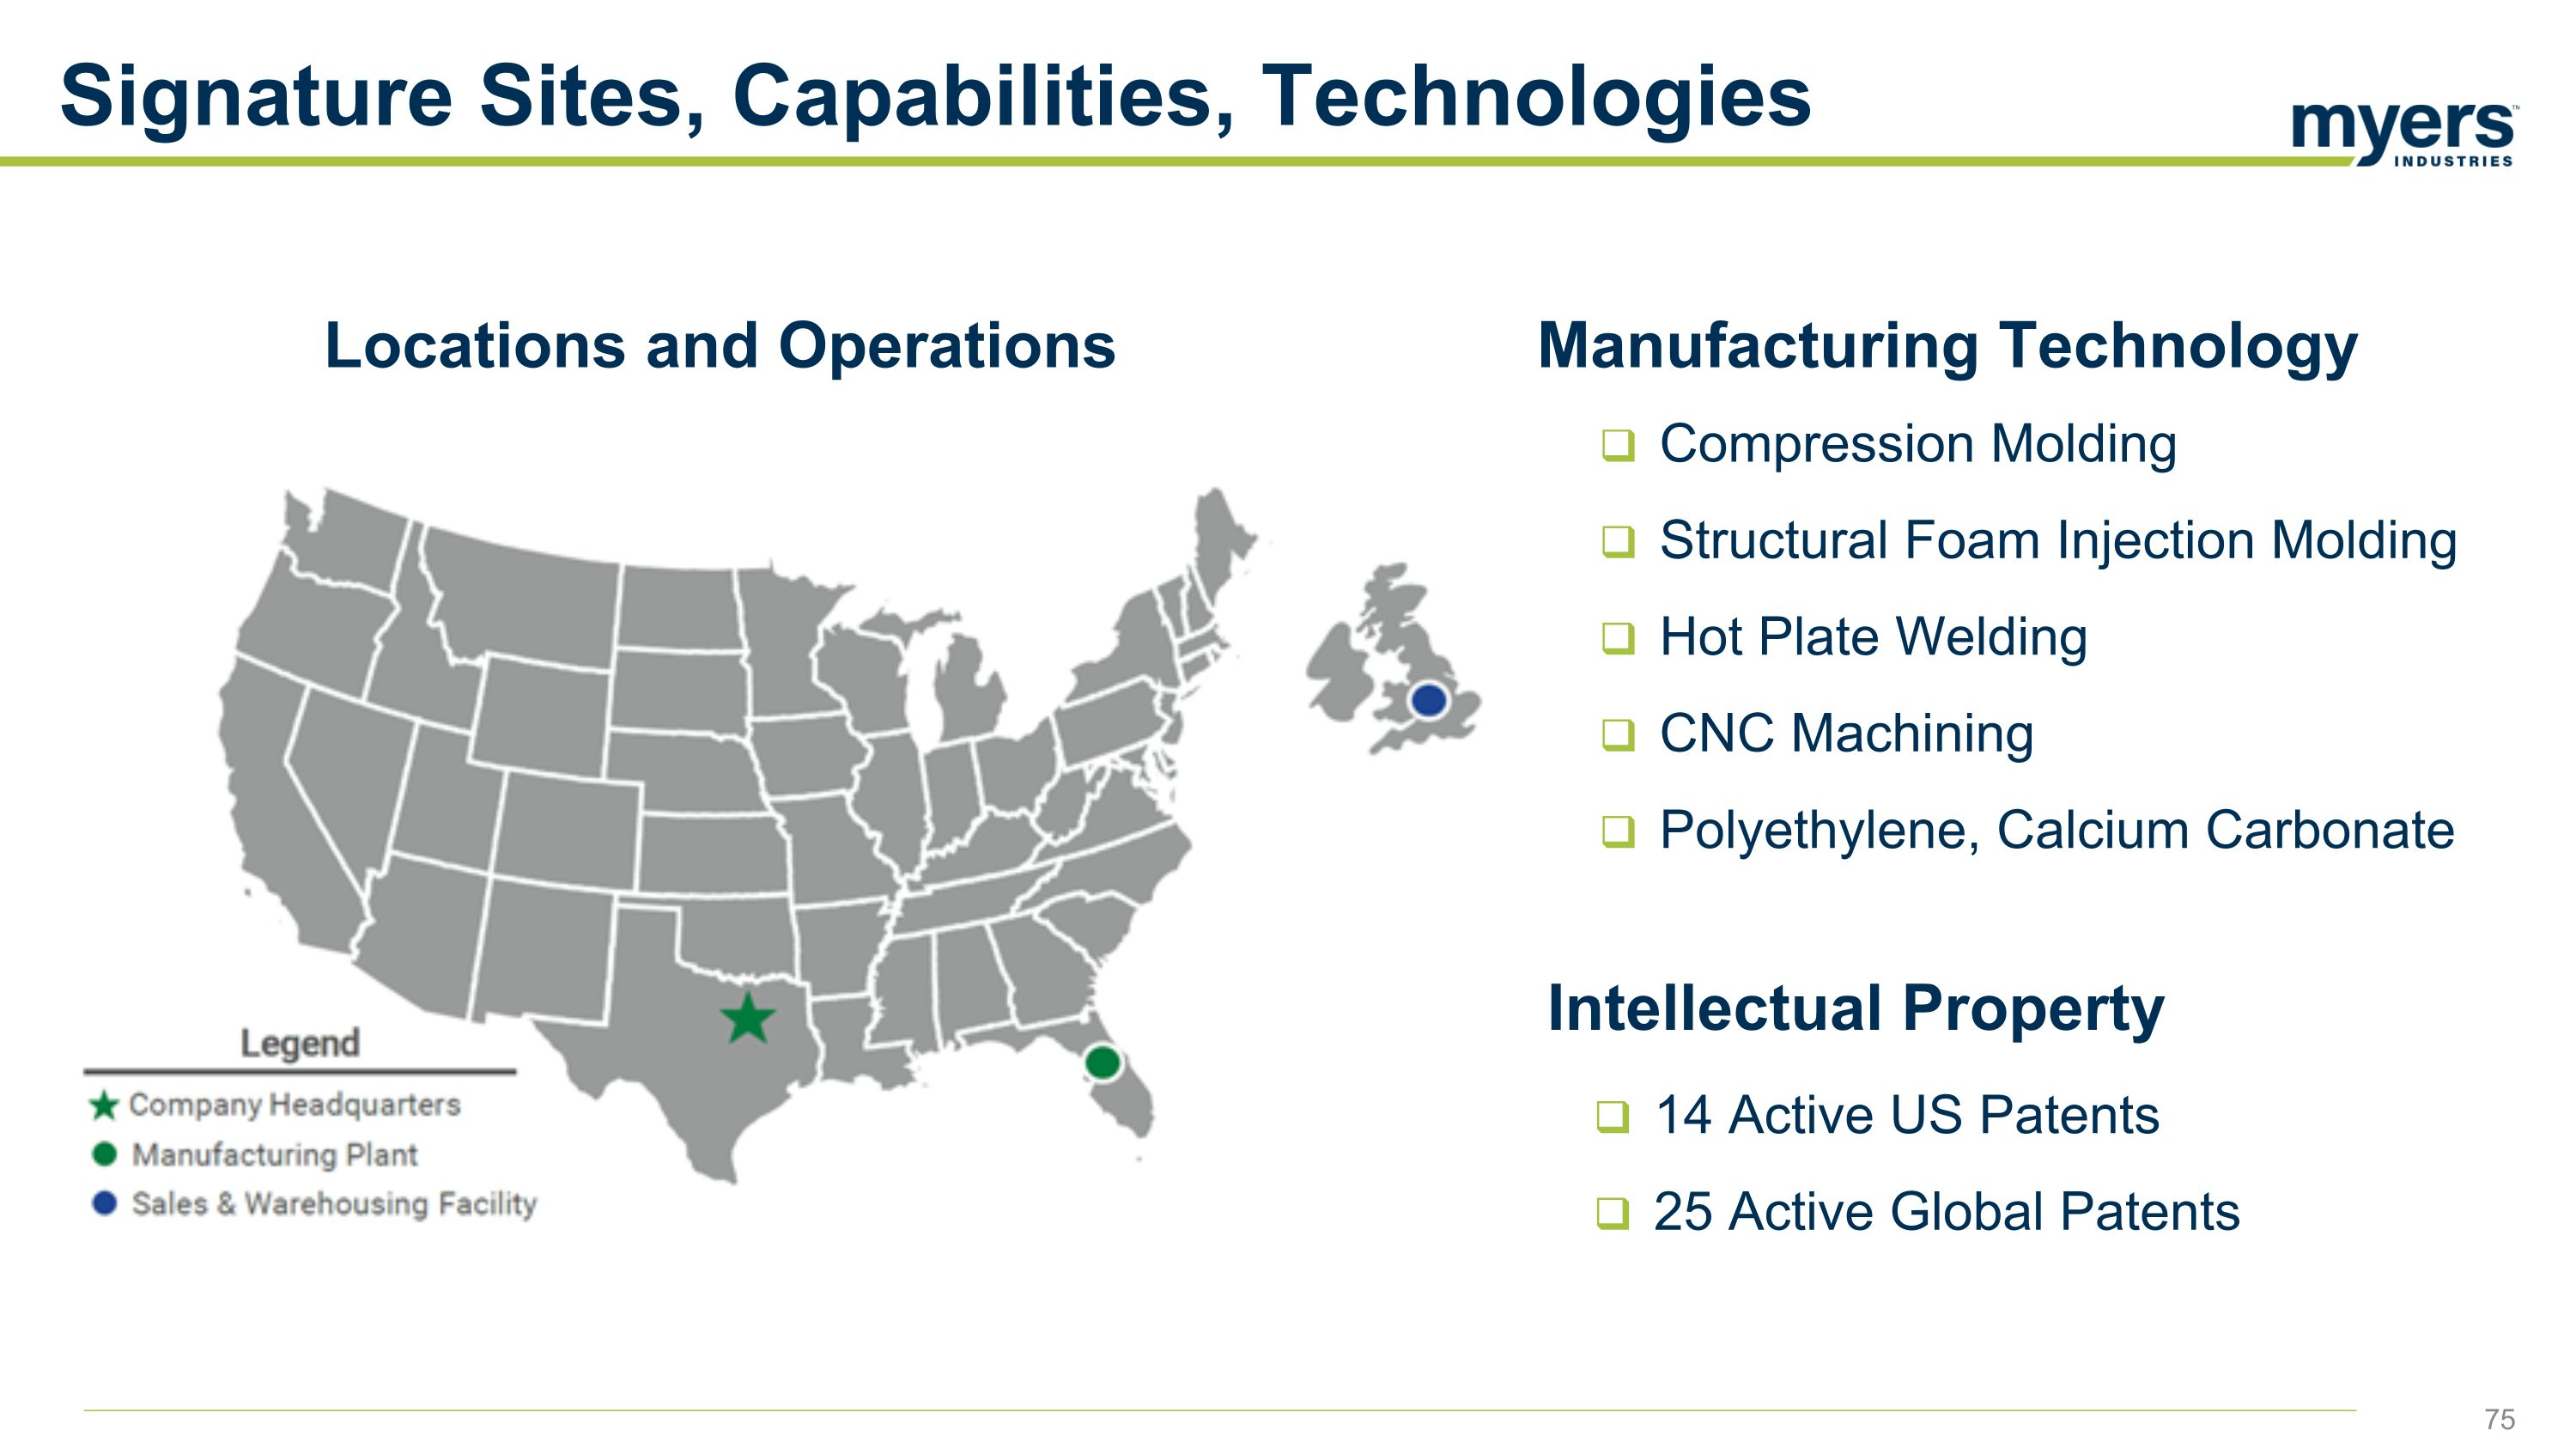
Signature Sites, Capabilities, Technologies Compression Molding Structural Foam Injection Molding Hot Plate Welding CNC Machining Polyethylene, Calcium Carbonate Locations and Operations Manufacturing Technology Intellectual Property 14 Active US Patents 25 Active Global Patents
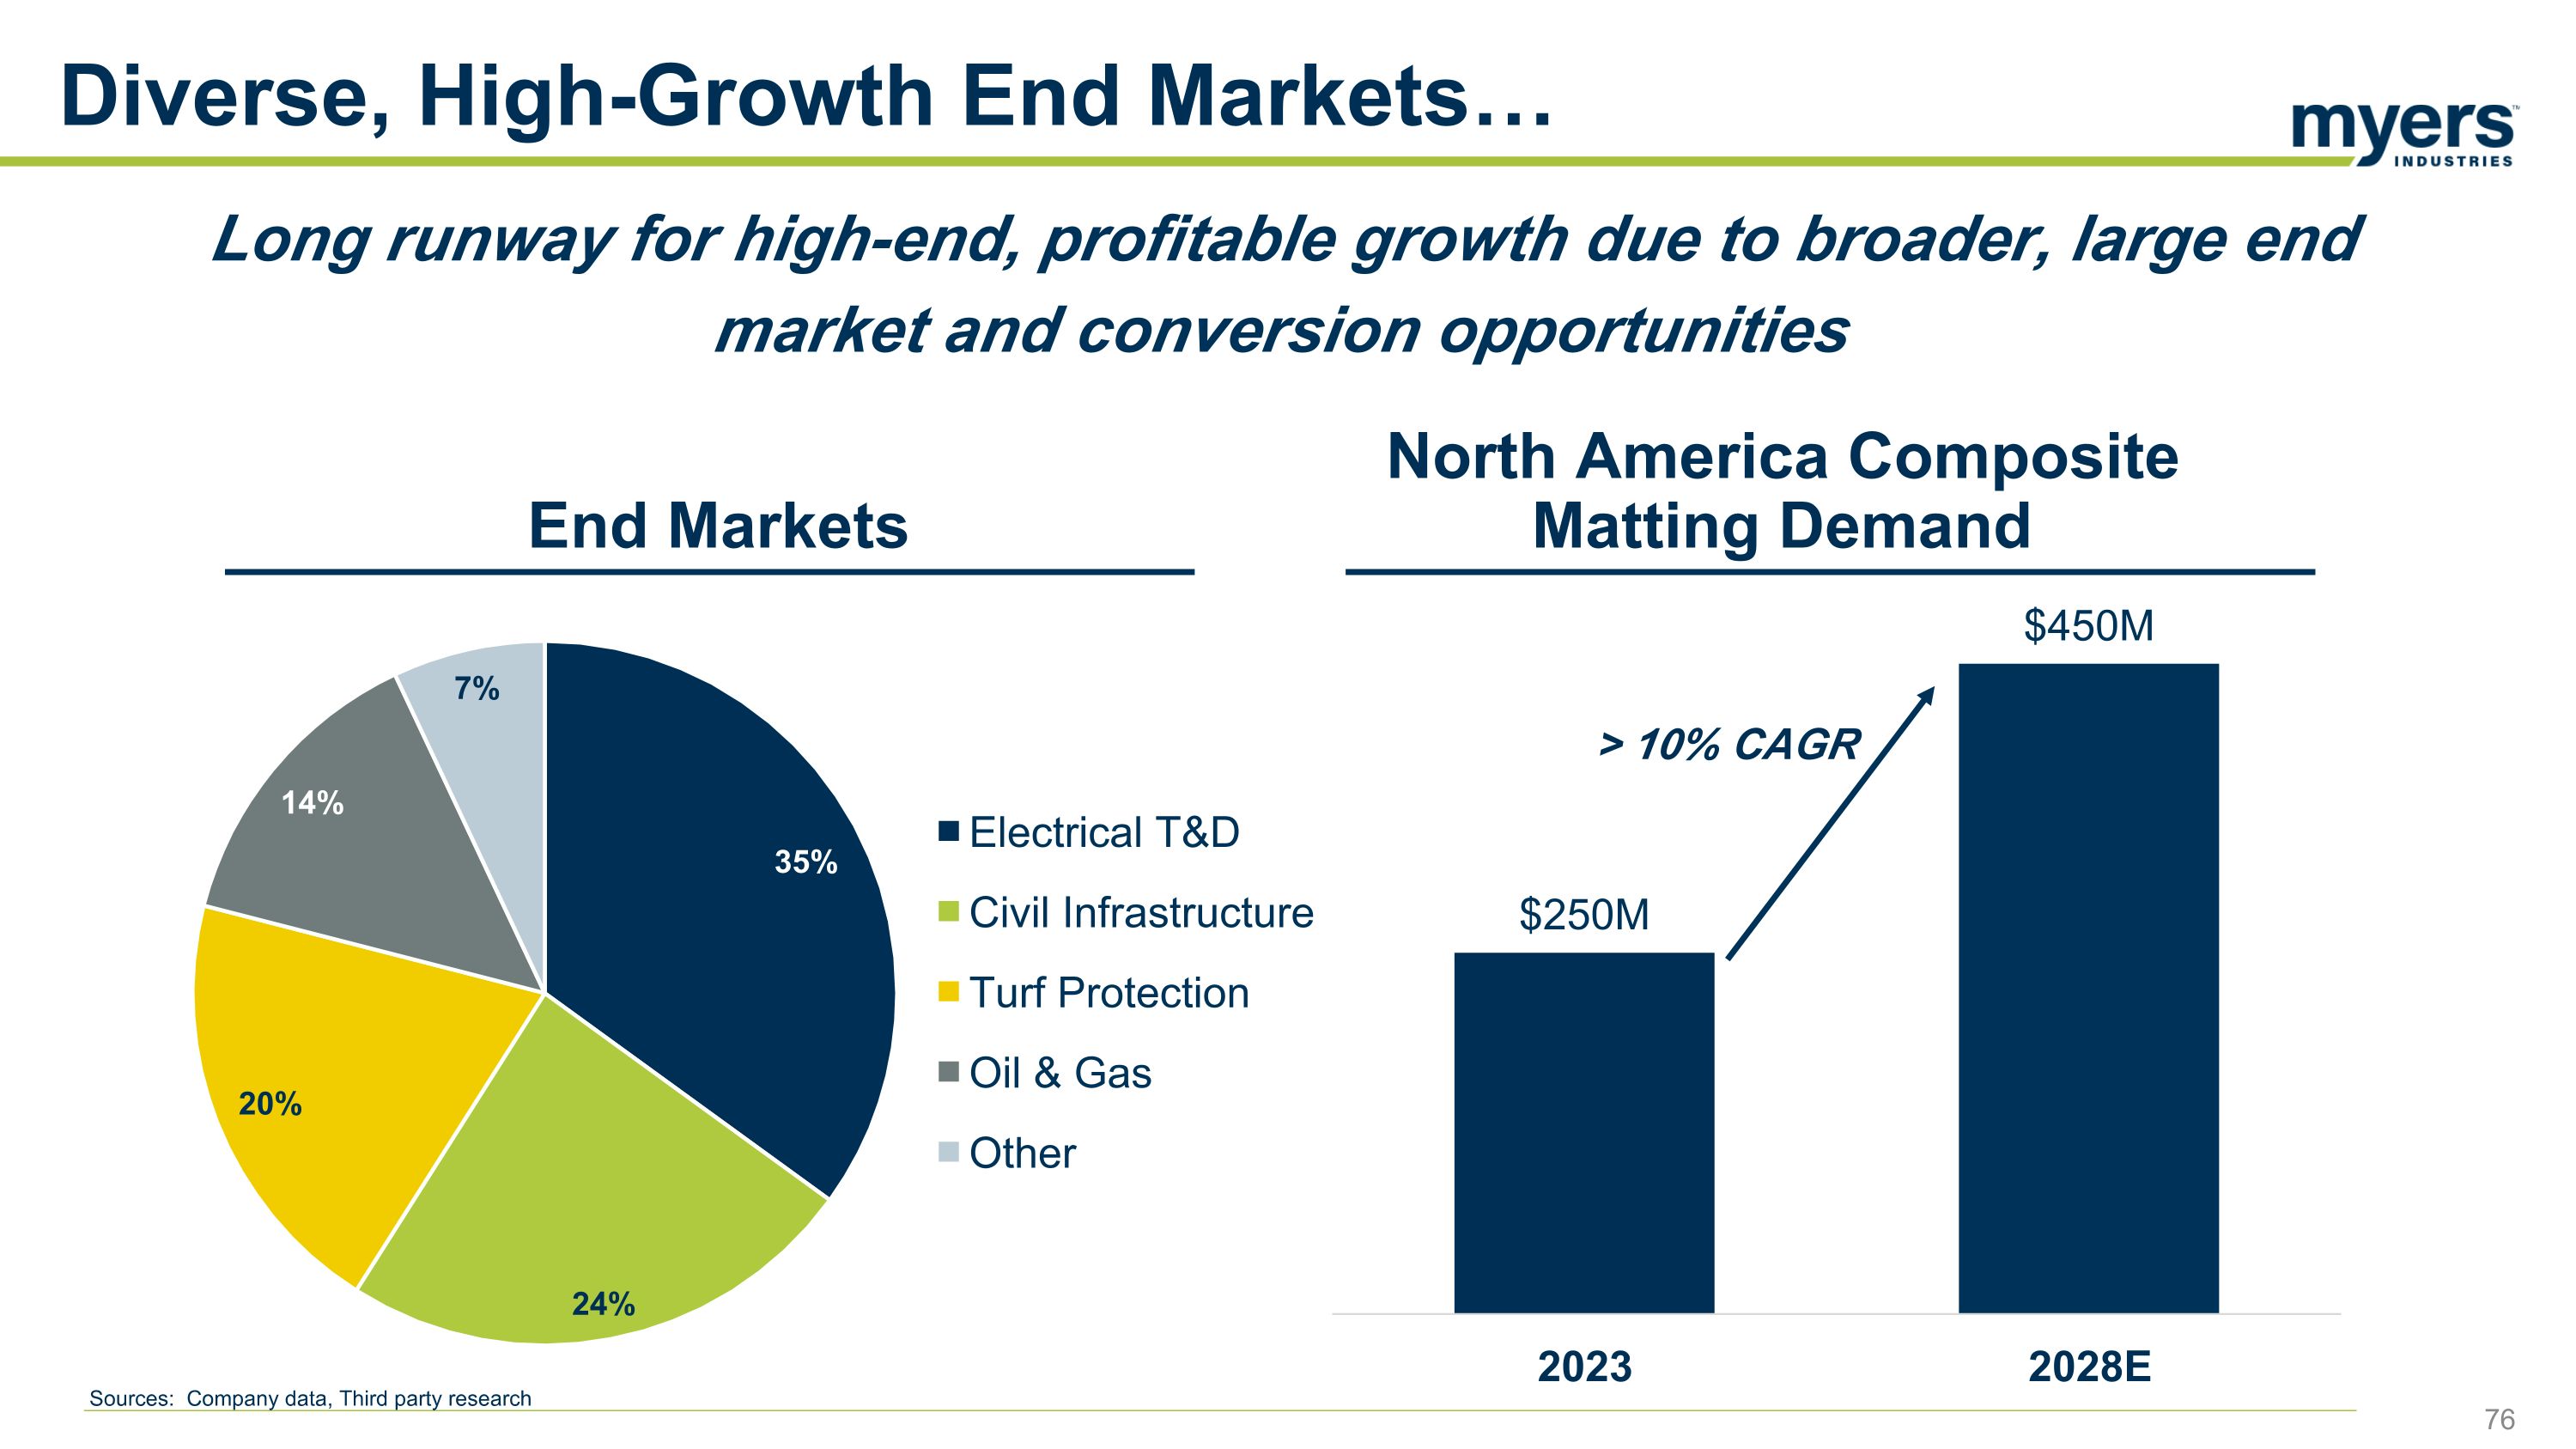
Diverse, High-Growth End Markets… Sources: Company data, Third party research 7% End Markets North America Composite Matting Demand > 10% CAGR Long runway for high-end, profitable growth due to broader, large end market and conversion opportunities
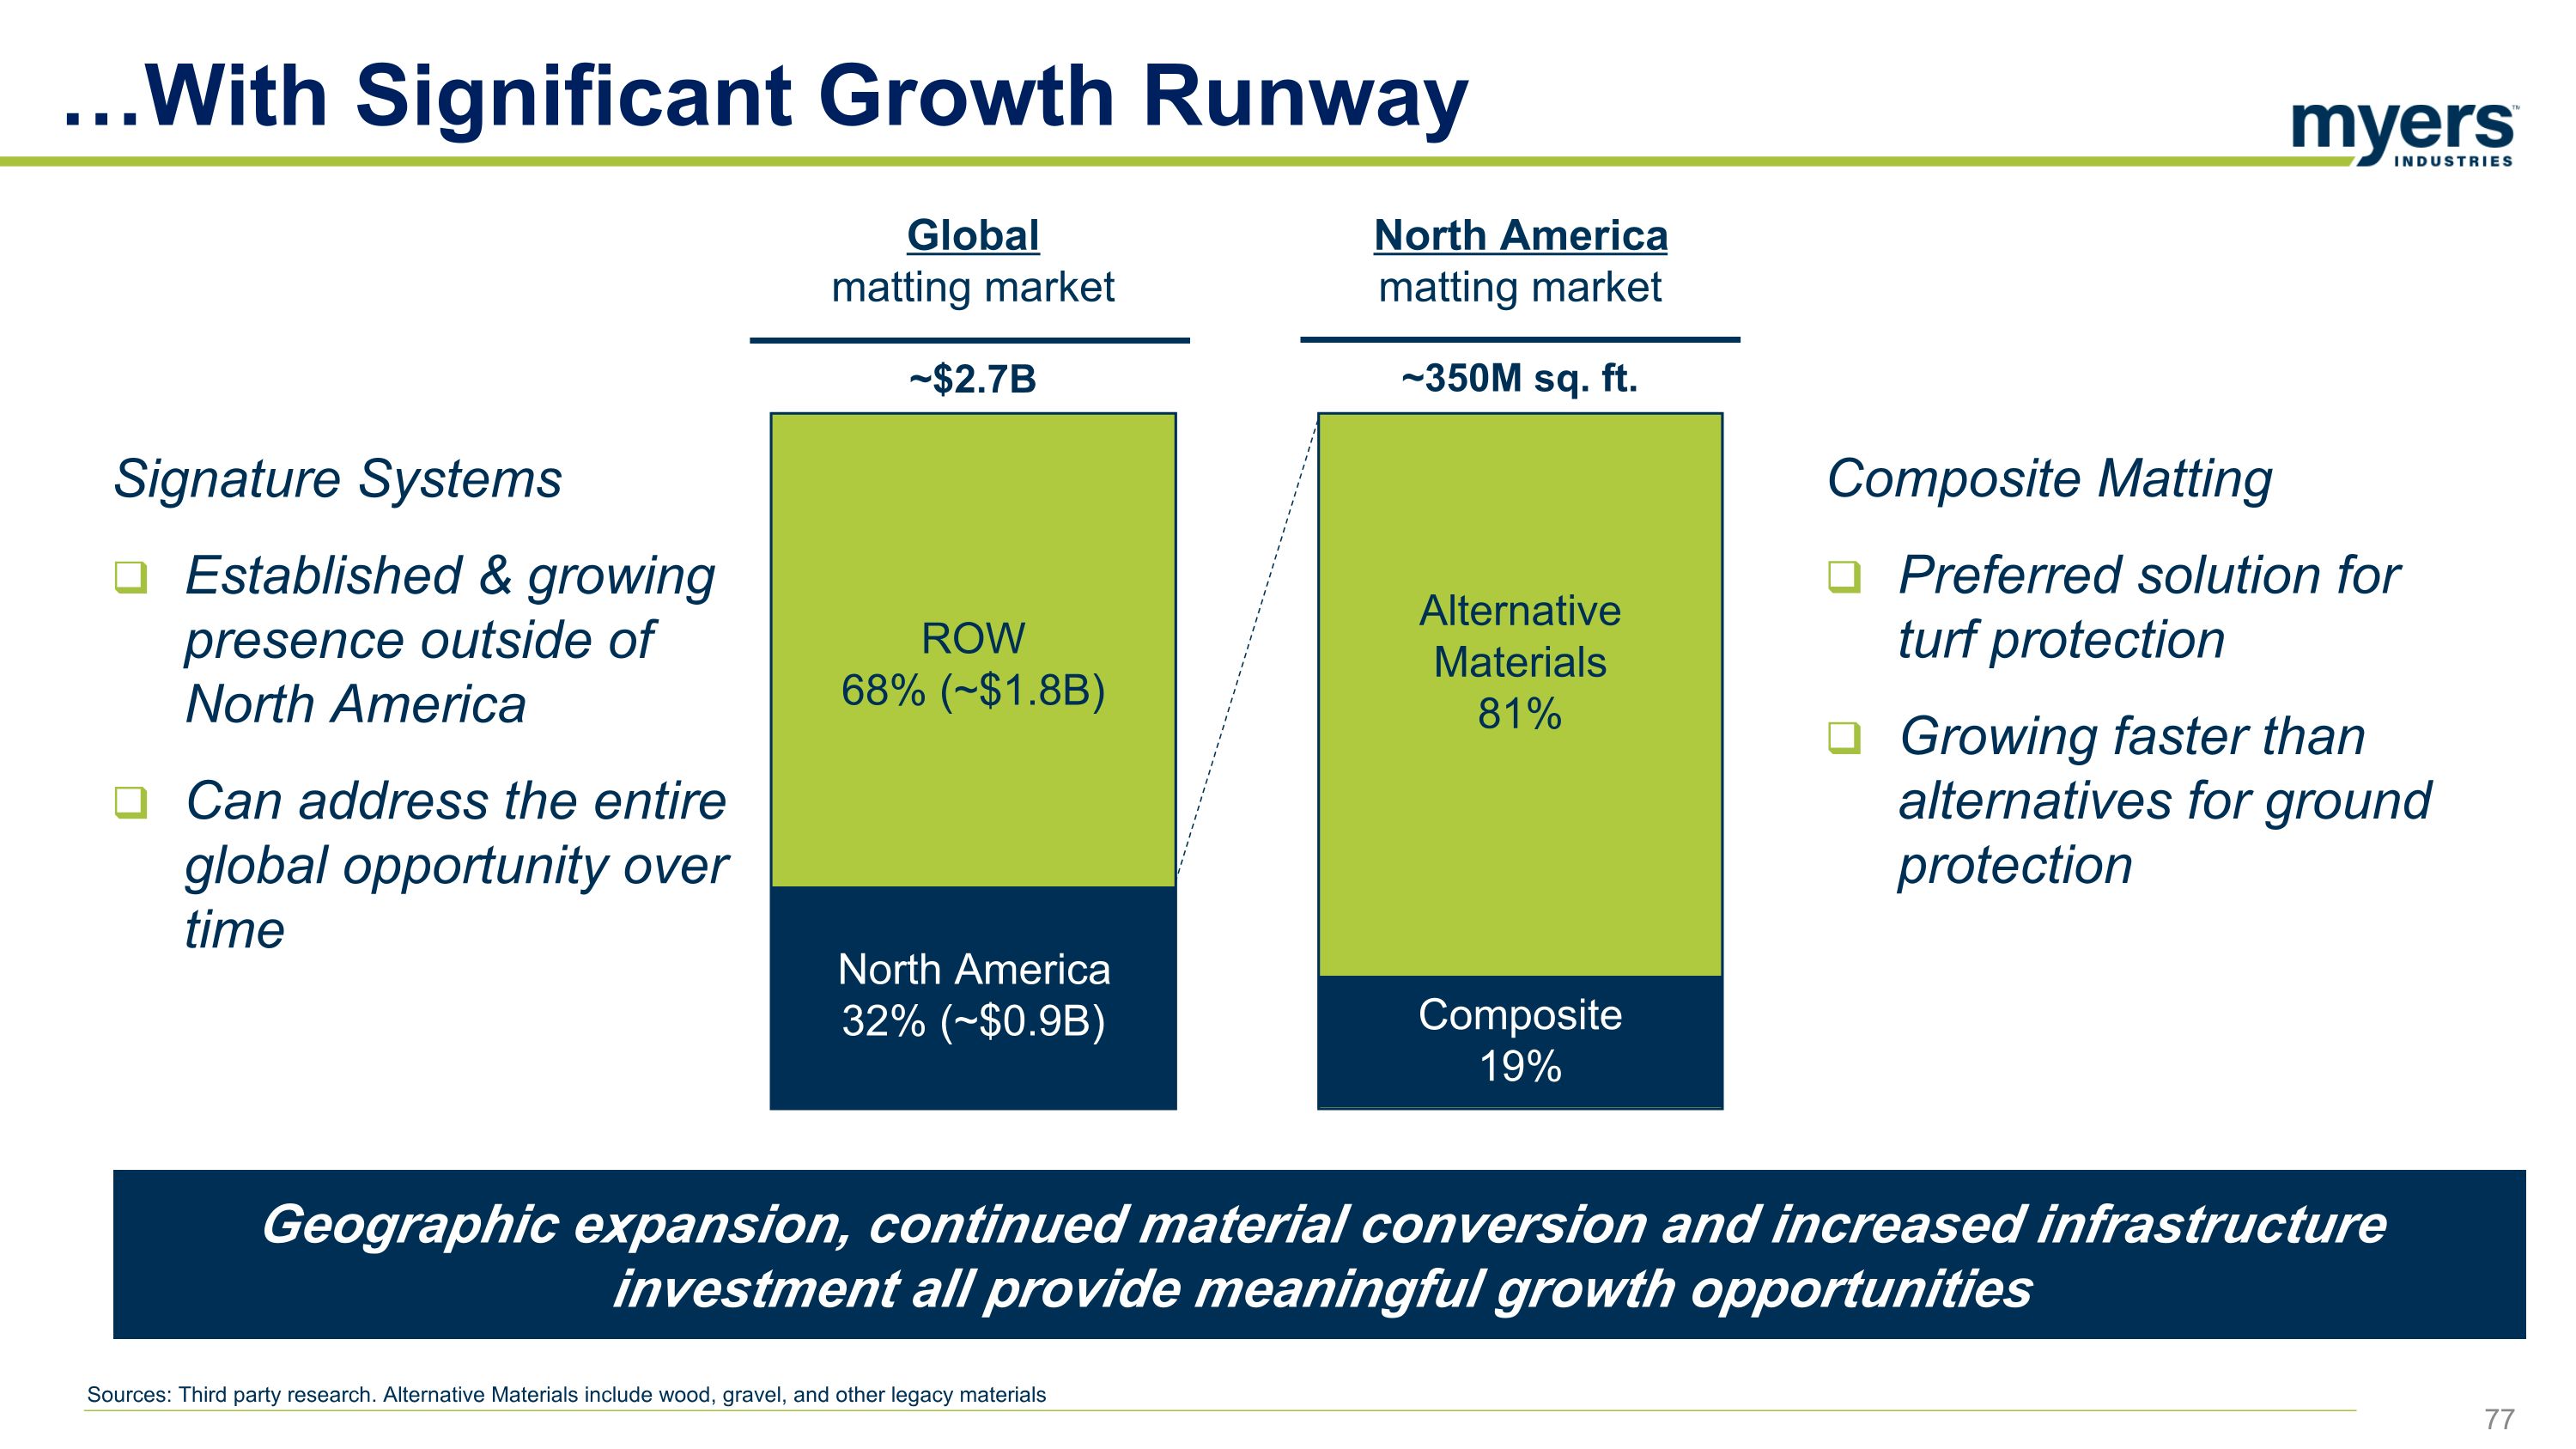
…With Significant Growth Runway Sources: Third party research. Alternative Materials include wood, gravel, and other legacy materials Global matting market North America 32% (~$0.9B) ROW 68% (~$1.8B) North America matting market Composite 19% Alternative Materials 81% ~$2.7B ~350M sq. ft. Signature Systems Established & growing presence outside of North America Can address the entire global opportunity over time Composite Matting Preferred solution for turf protection Growing faster than alternatives for ground protection Geographic expansion, continued material conversion and increased infrastructure investment all provide meaningful growth opportunities
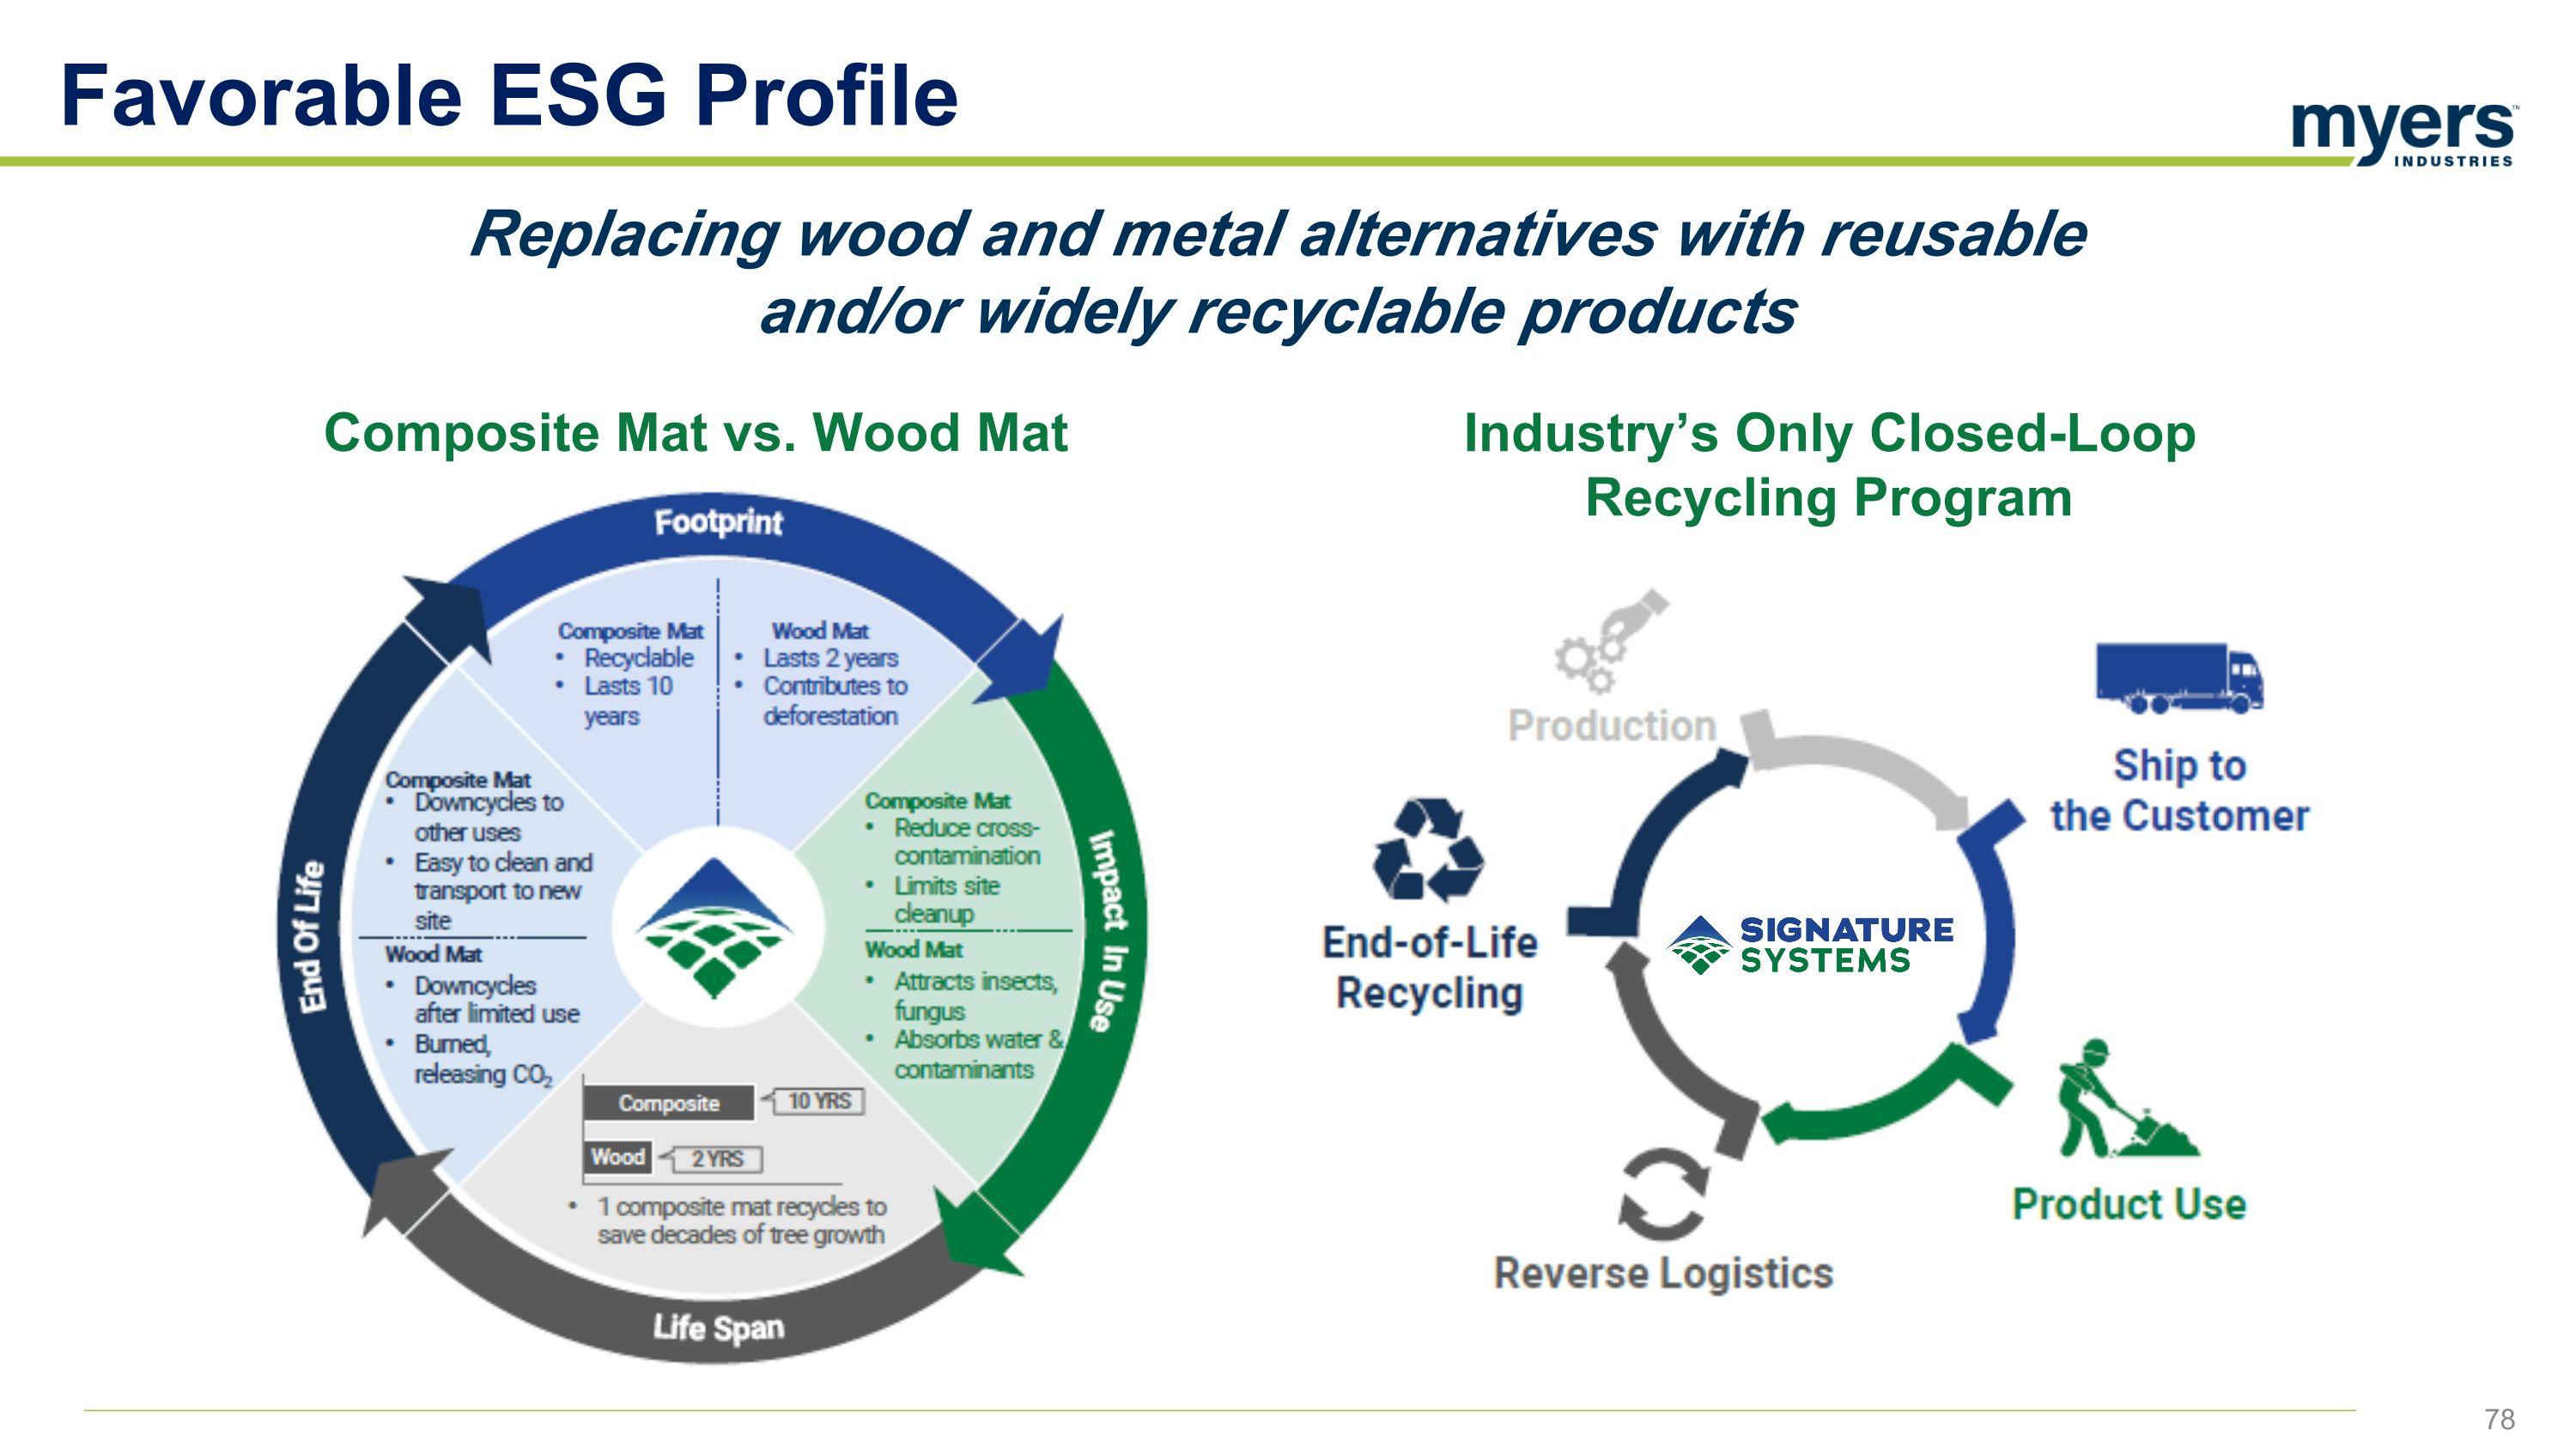
Replacing wood and metal alternatives with reusable and/or widely recyclable products Industry’s Only Closed-Loop Recycling Program Composite Mat vs. Wood Mat Favorable ESG Profile
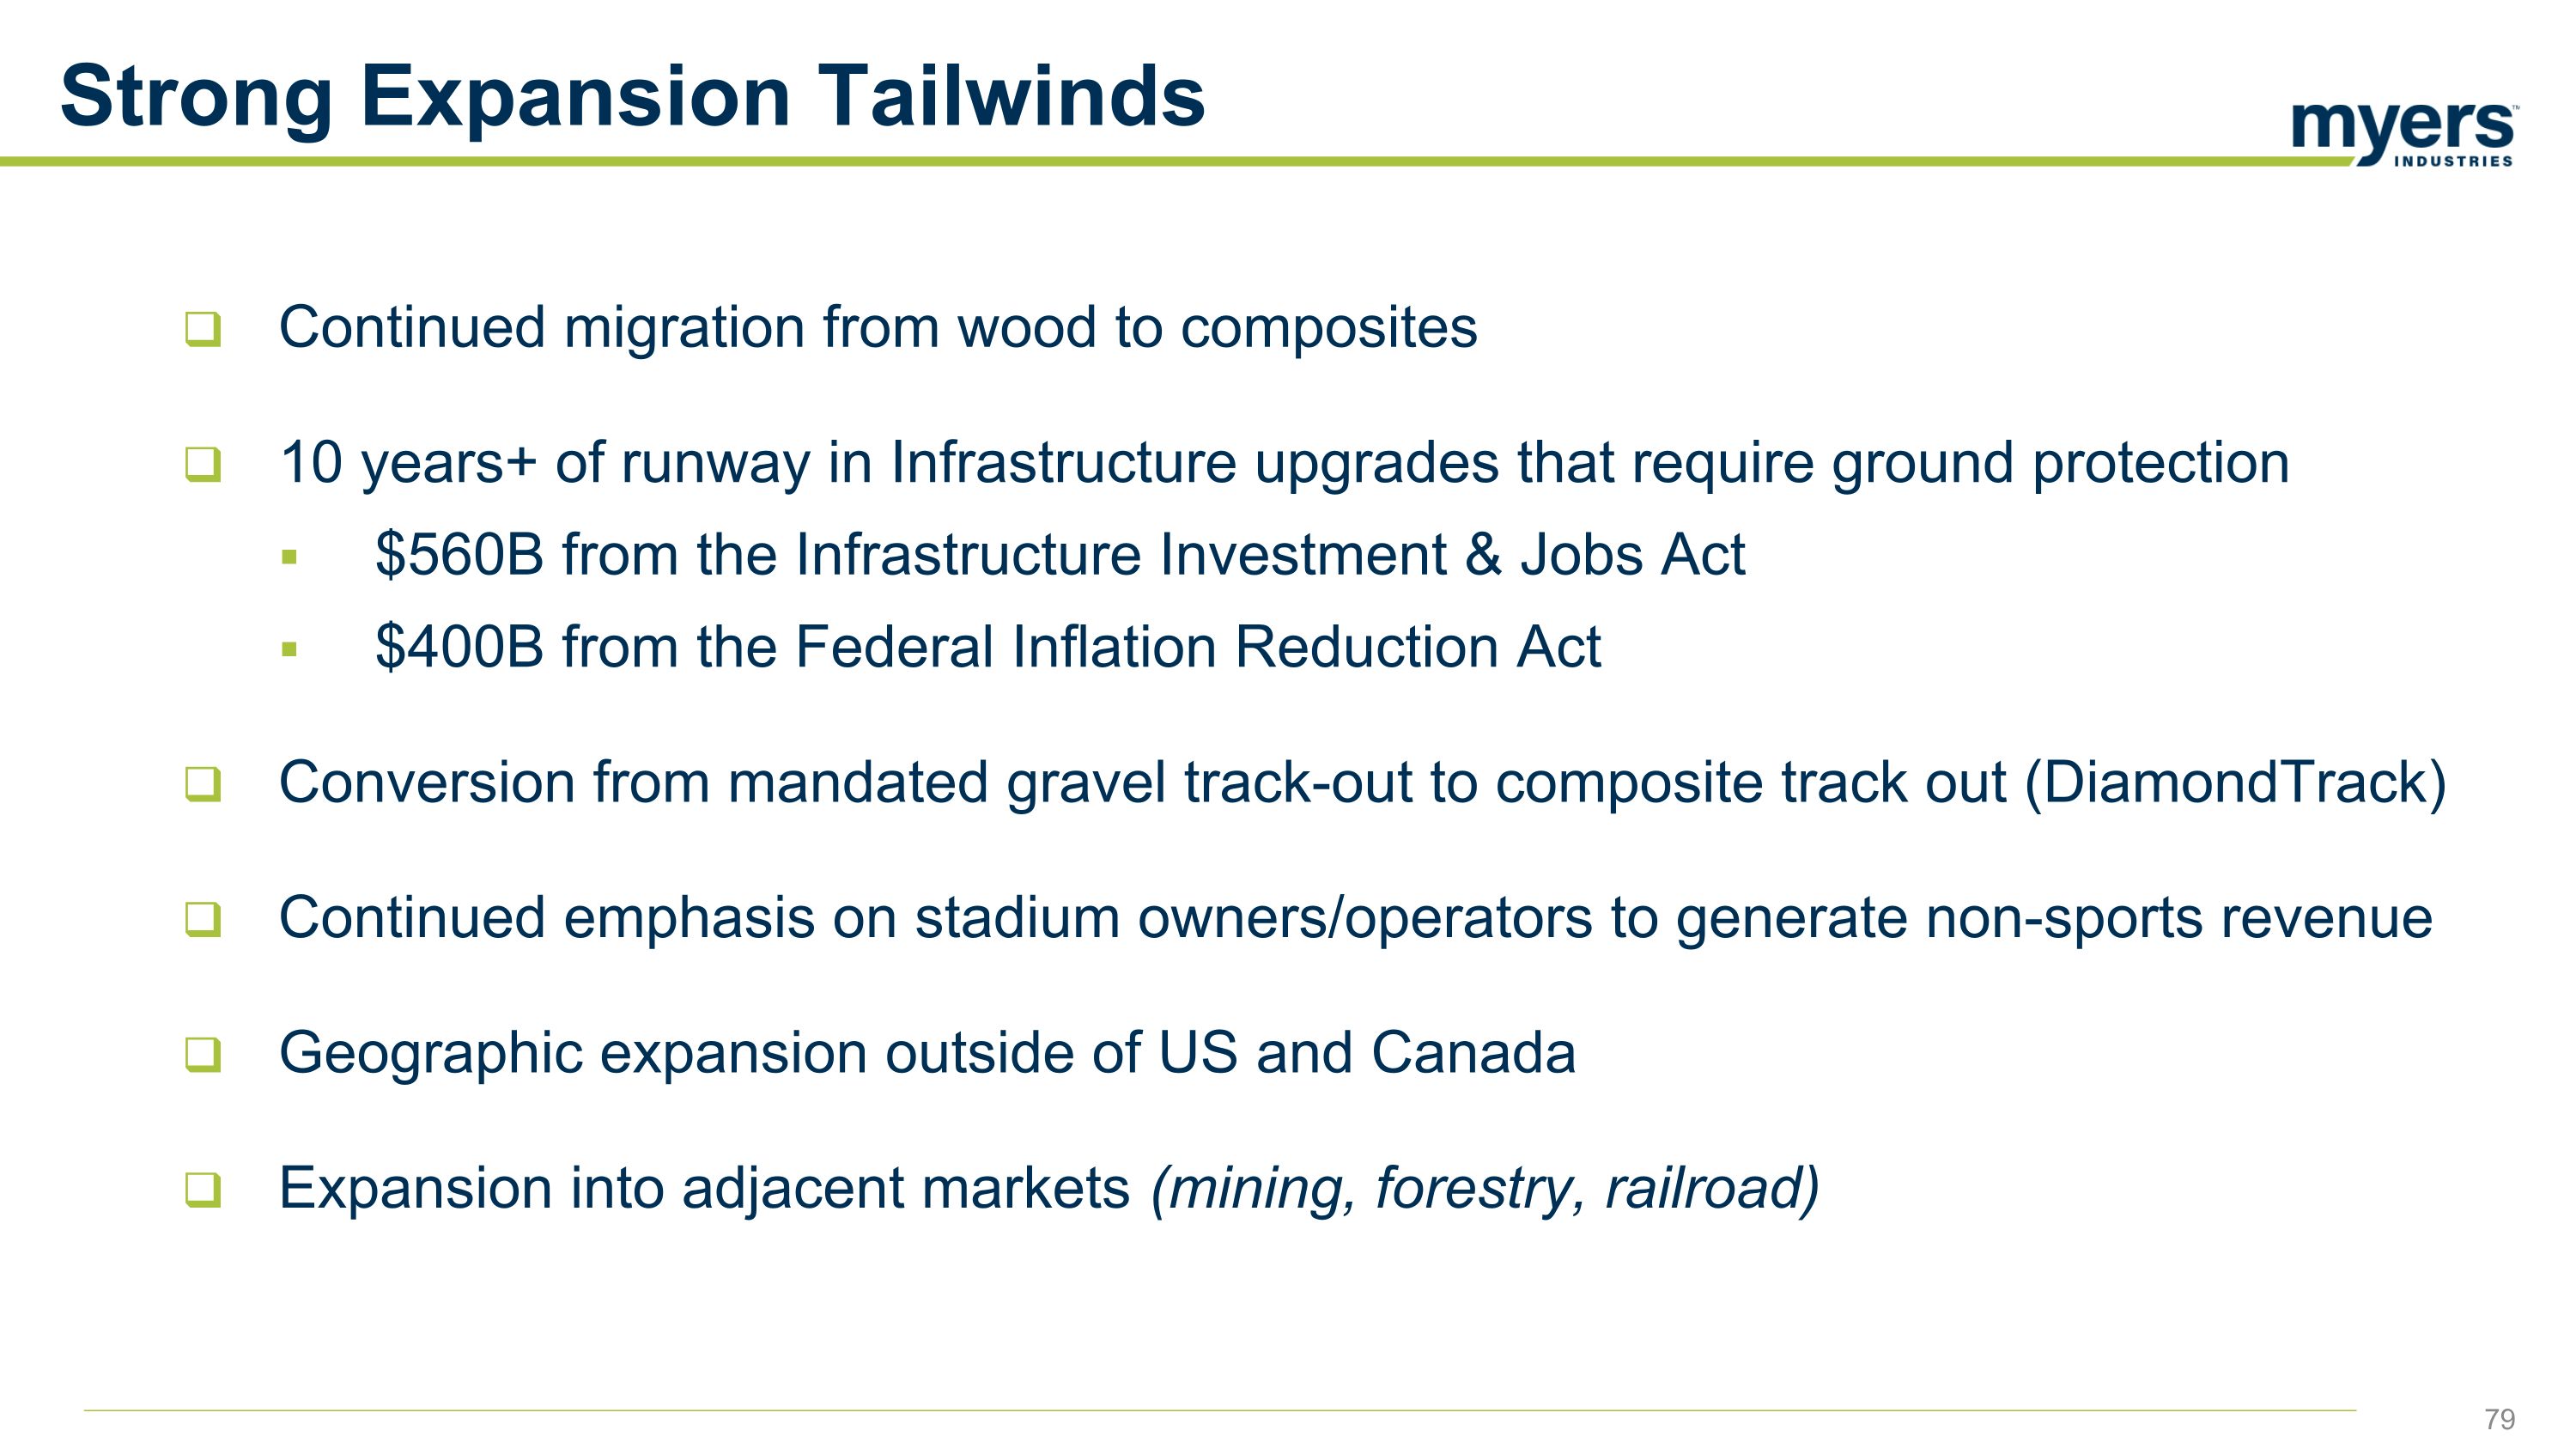
Strong Expansion Tailwinds Continued migration from wood to composites 10 years+ of runway in Infrastructure upgrades that require ground protection $560B from the Infrastructure Investment & Jobs Act $400B from the Federal Inflation Reduction Act Conversion from mandated gravel track-out to composite track out (DiamondTrack) Continued emphasis on stadium owners/operators to generate non-sports revenue Geographic expansion outside of US and Canada Expansion into adjacent markets (mining, forestry, railroad)
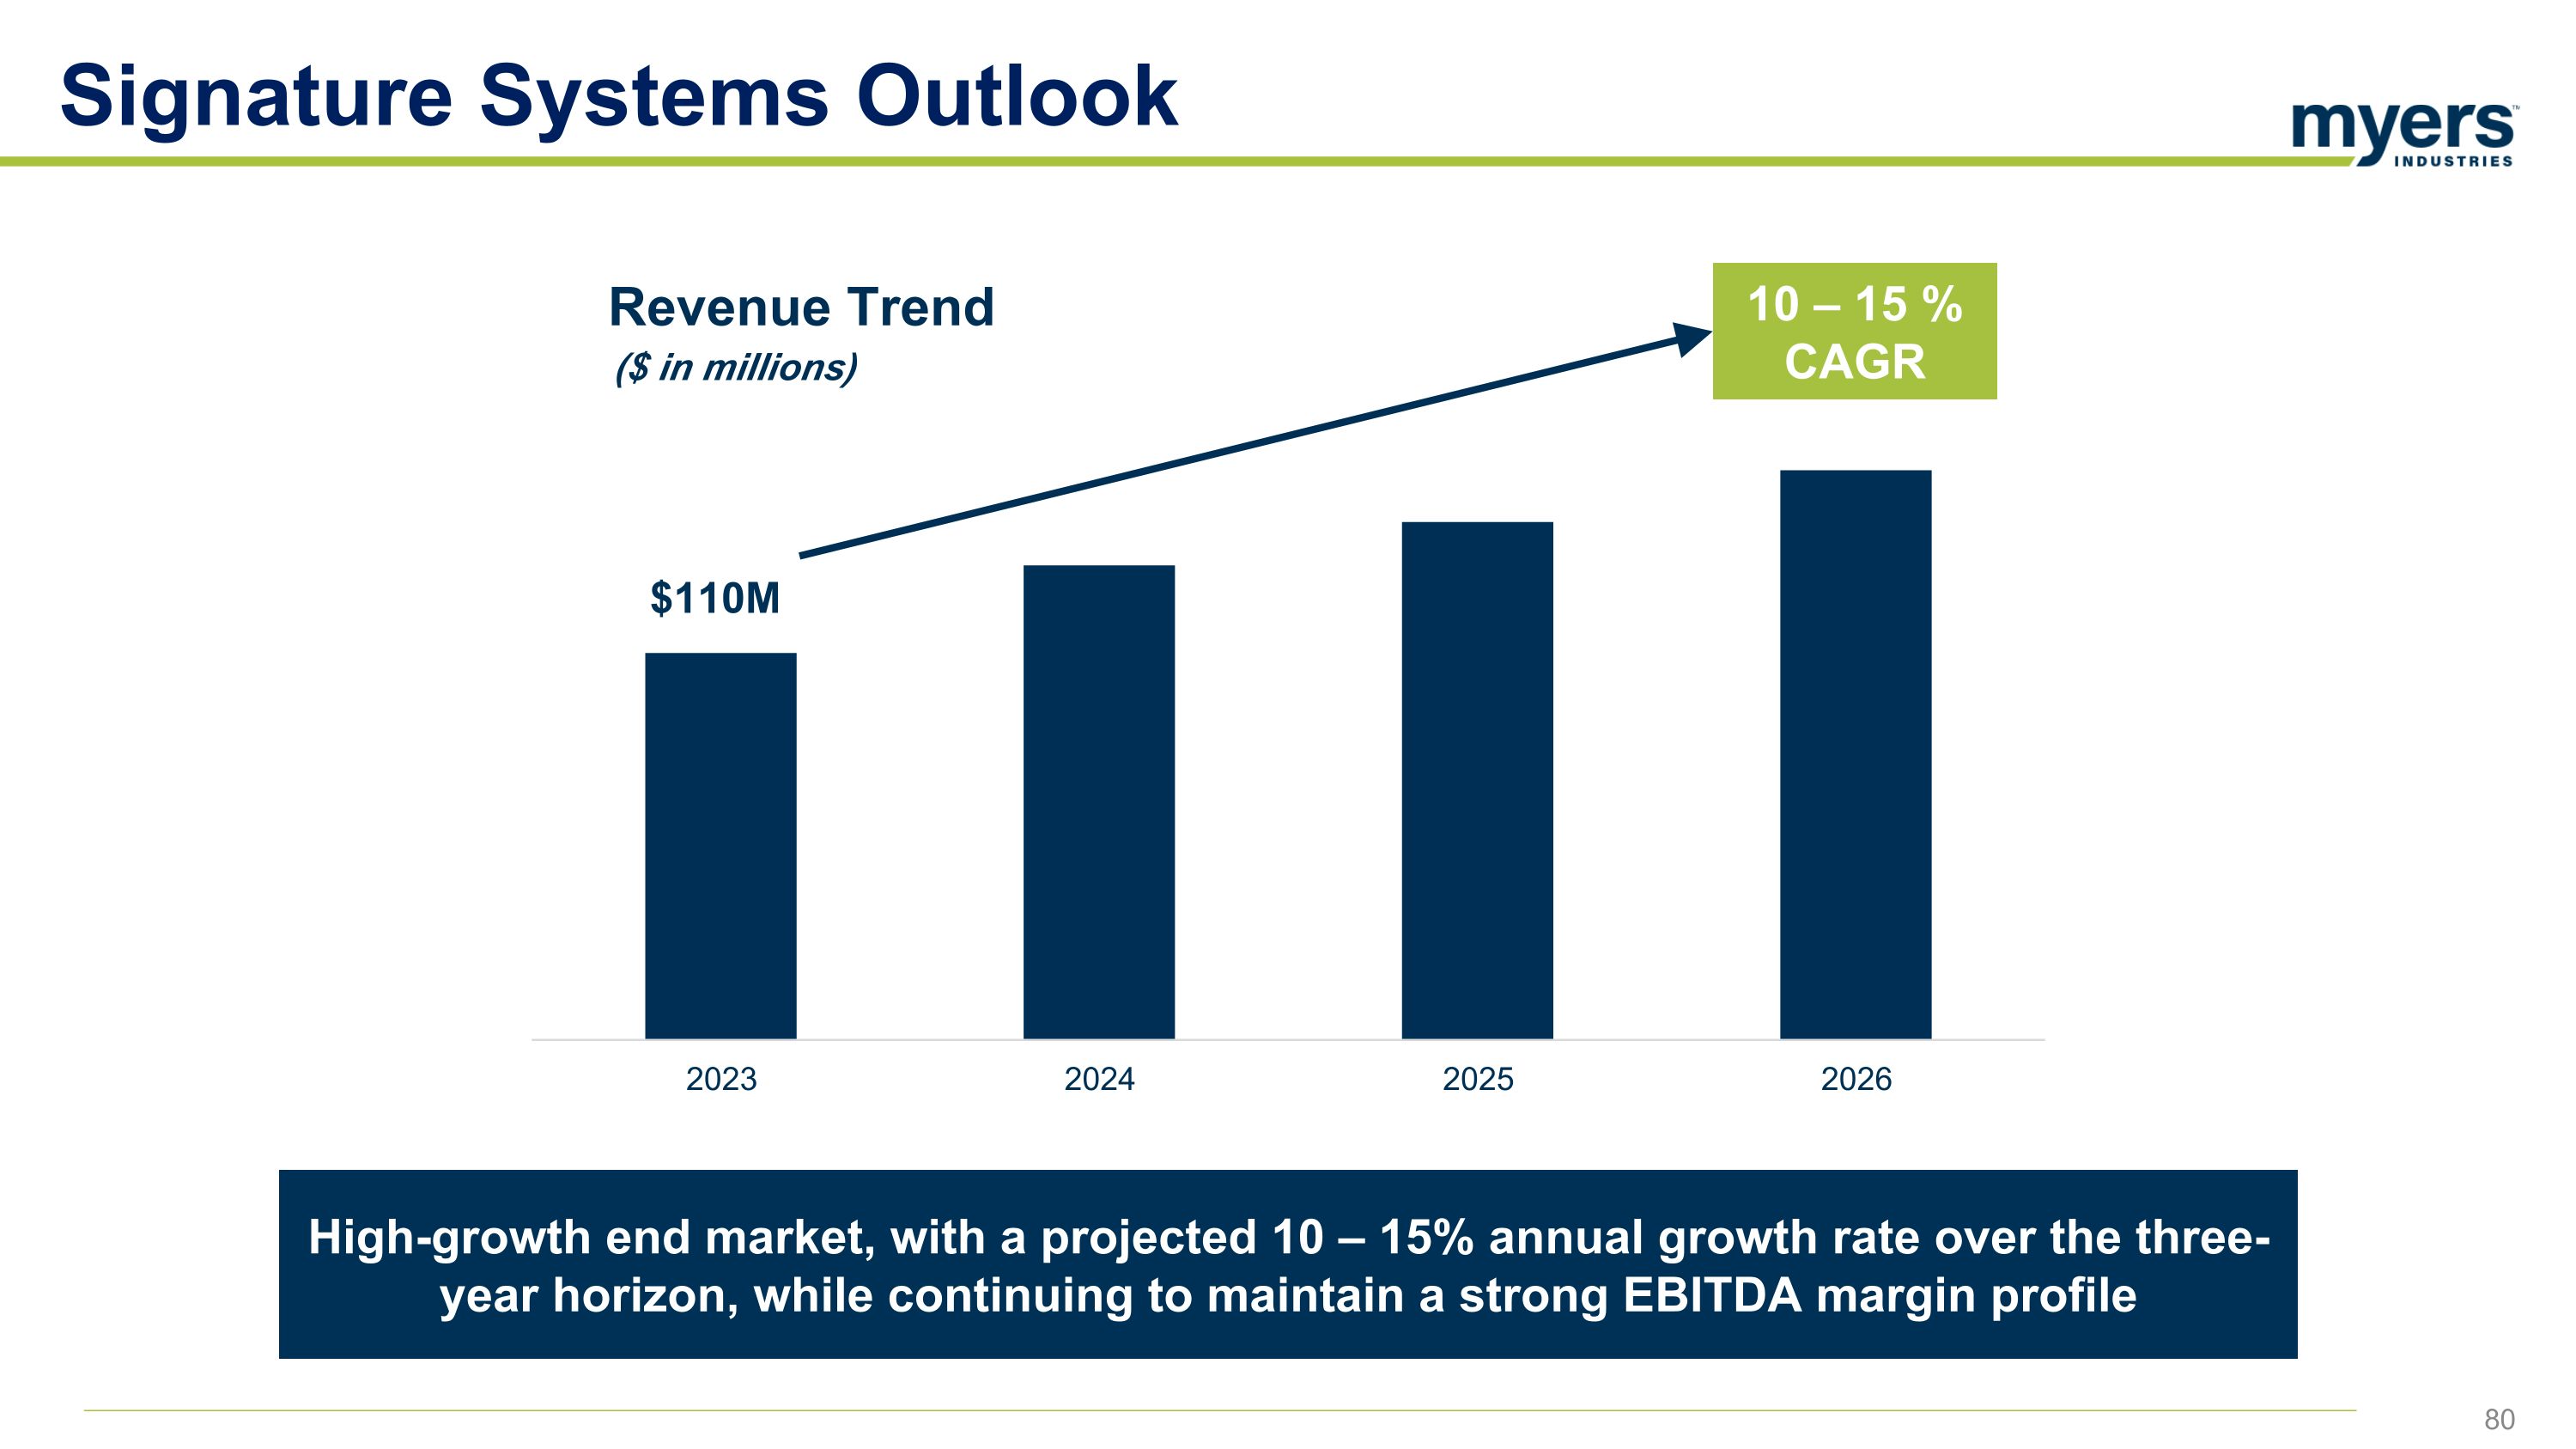
Signature Systems Outlook 10 – 15 % CAGR $110M Revenue Trend ($ in millions) High-growth end market, with a projected 10 – 15% annual growth rate over the three-year horizon, while continuing to maintain a strong EBITDA margin profile
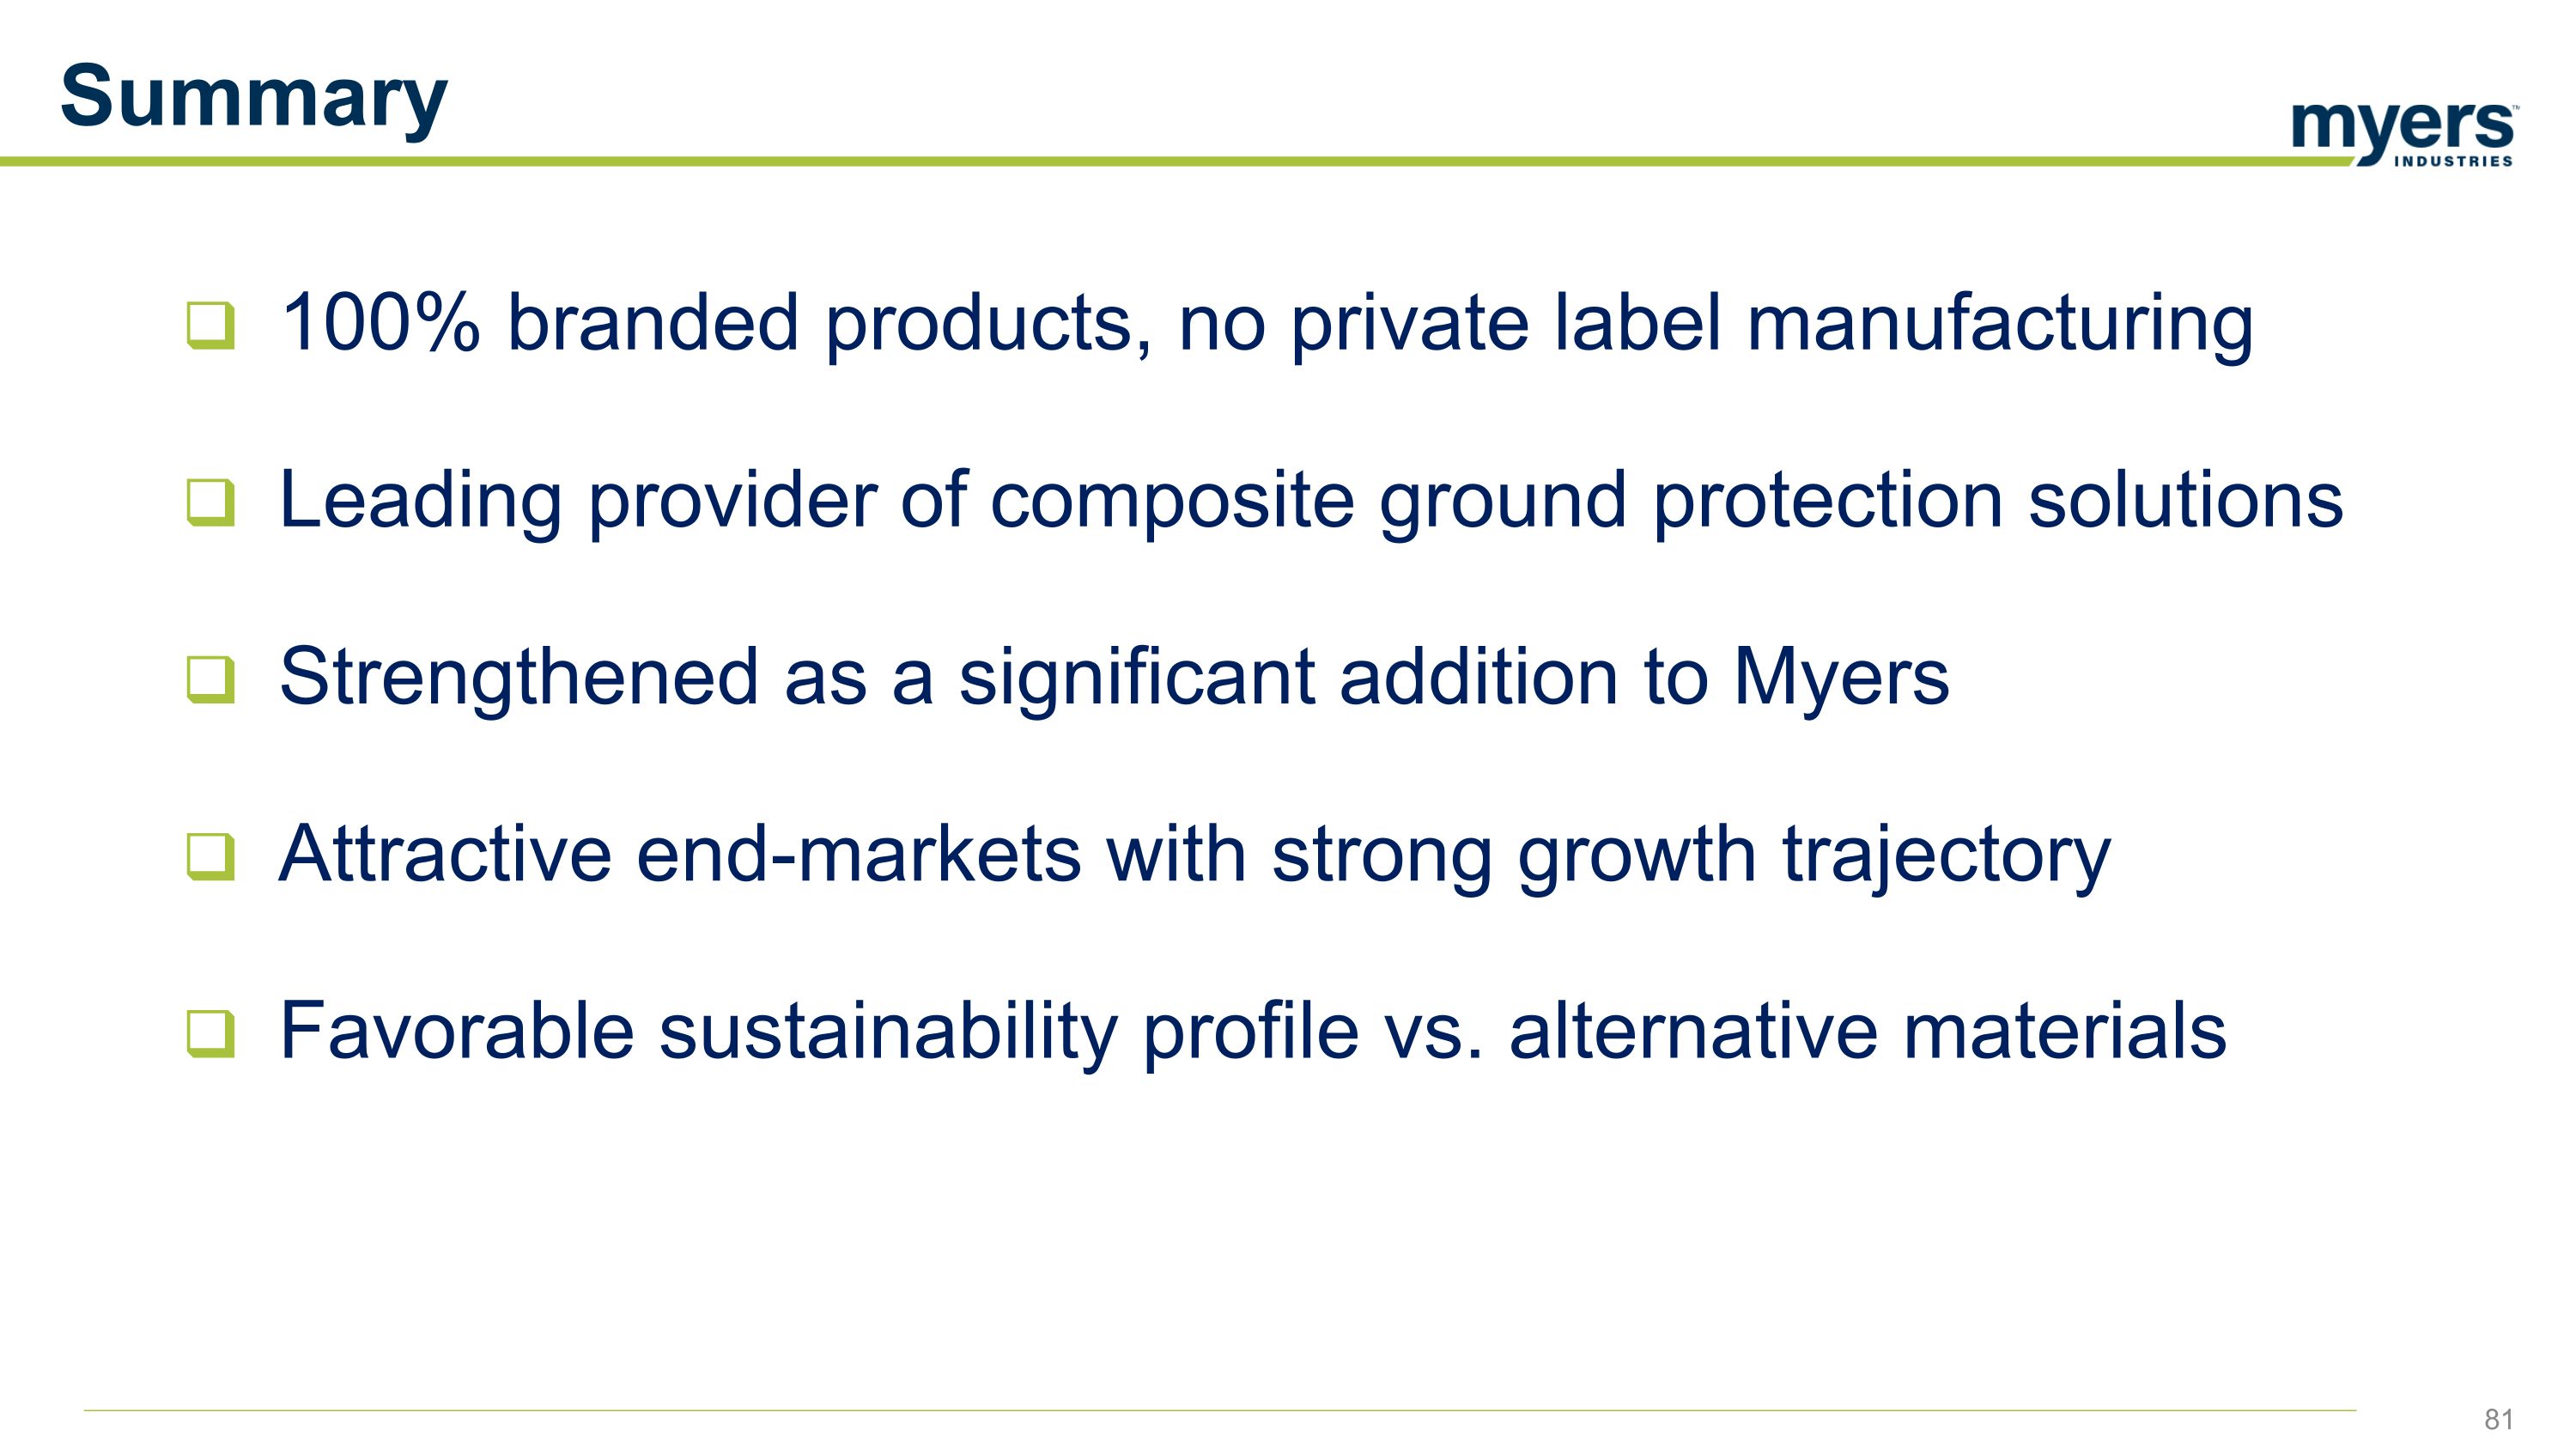
Summary 100% branded products, no private label manufacturing Leading provider of composite ground protection solutions Strengthened as a significant addition to Myers Attractive end-markets with strong growth trajectory Favorable sustainability profile vs. alternative materials
82
Appendix 83
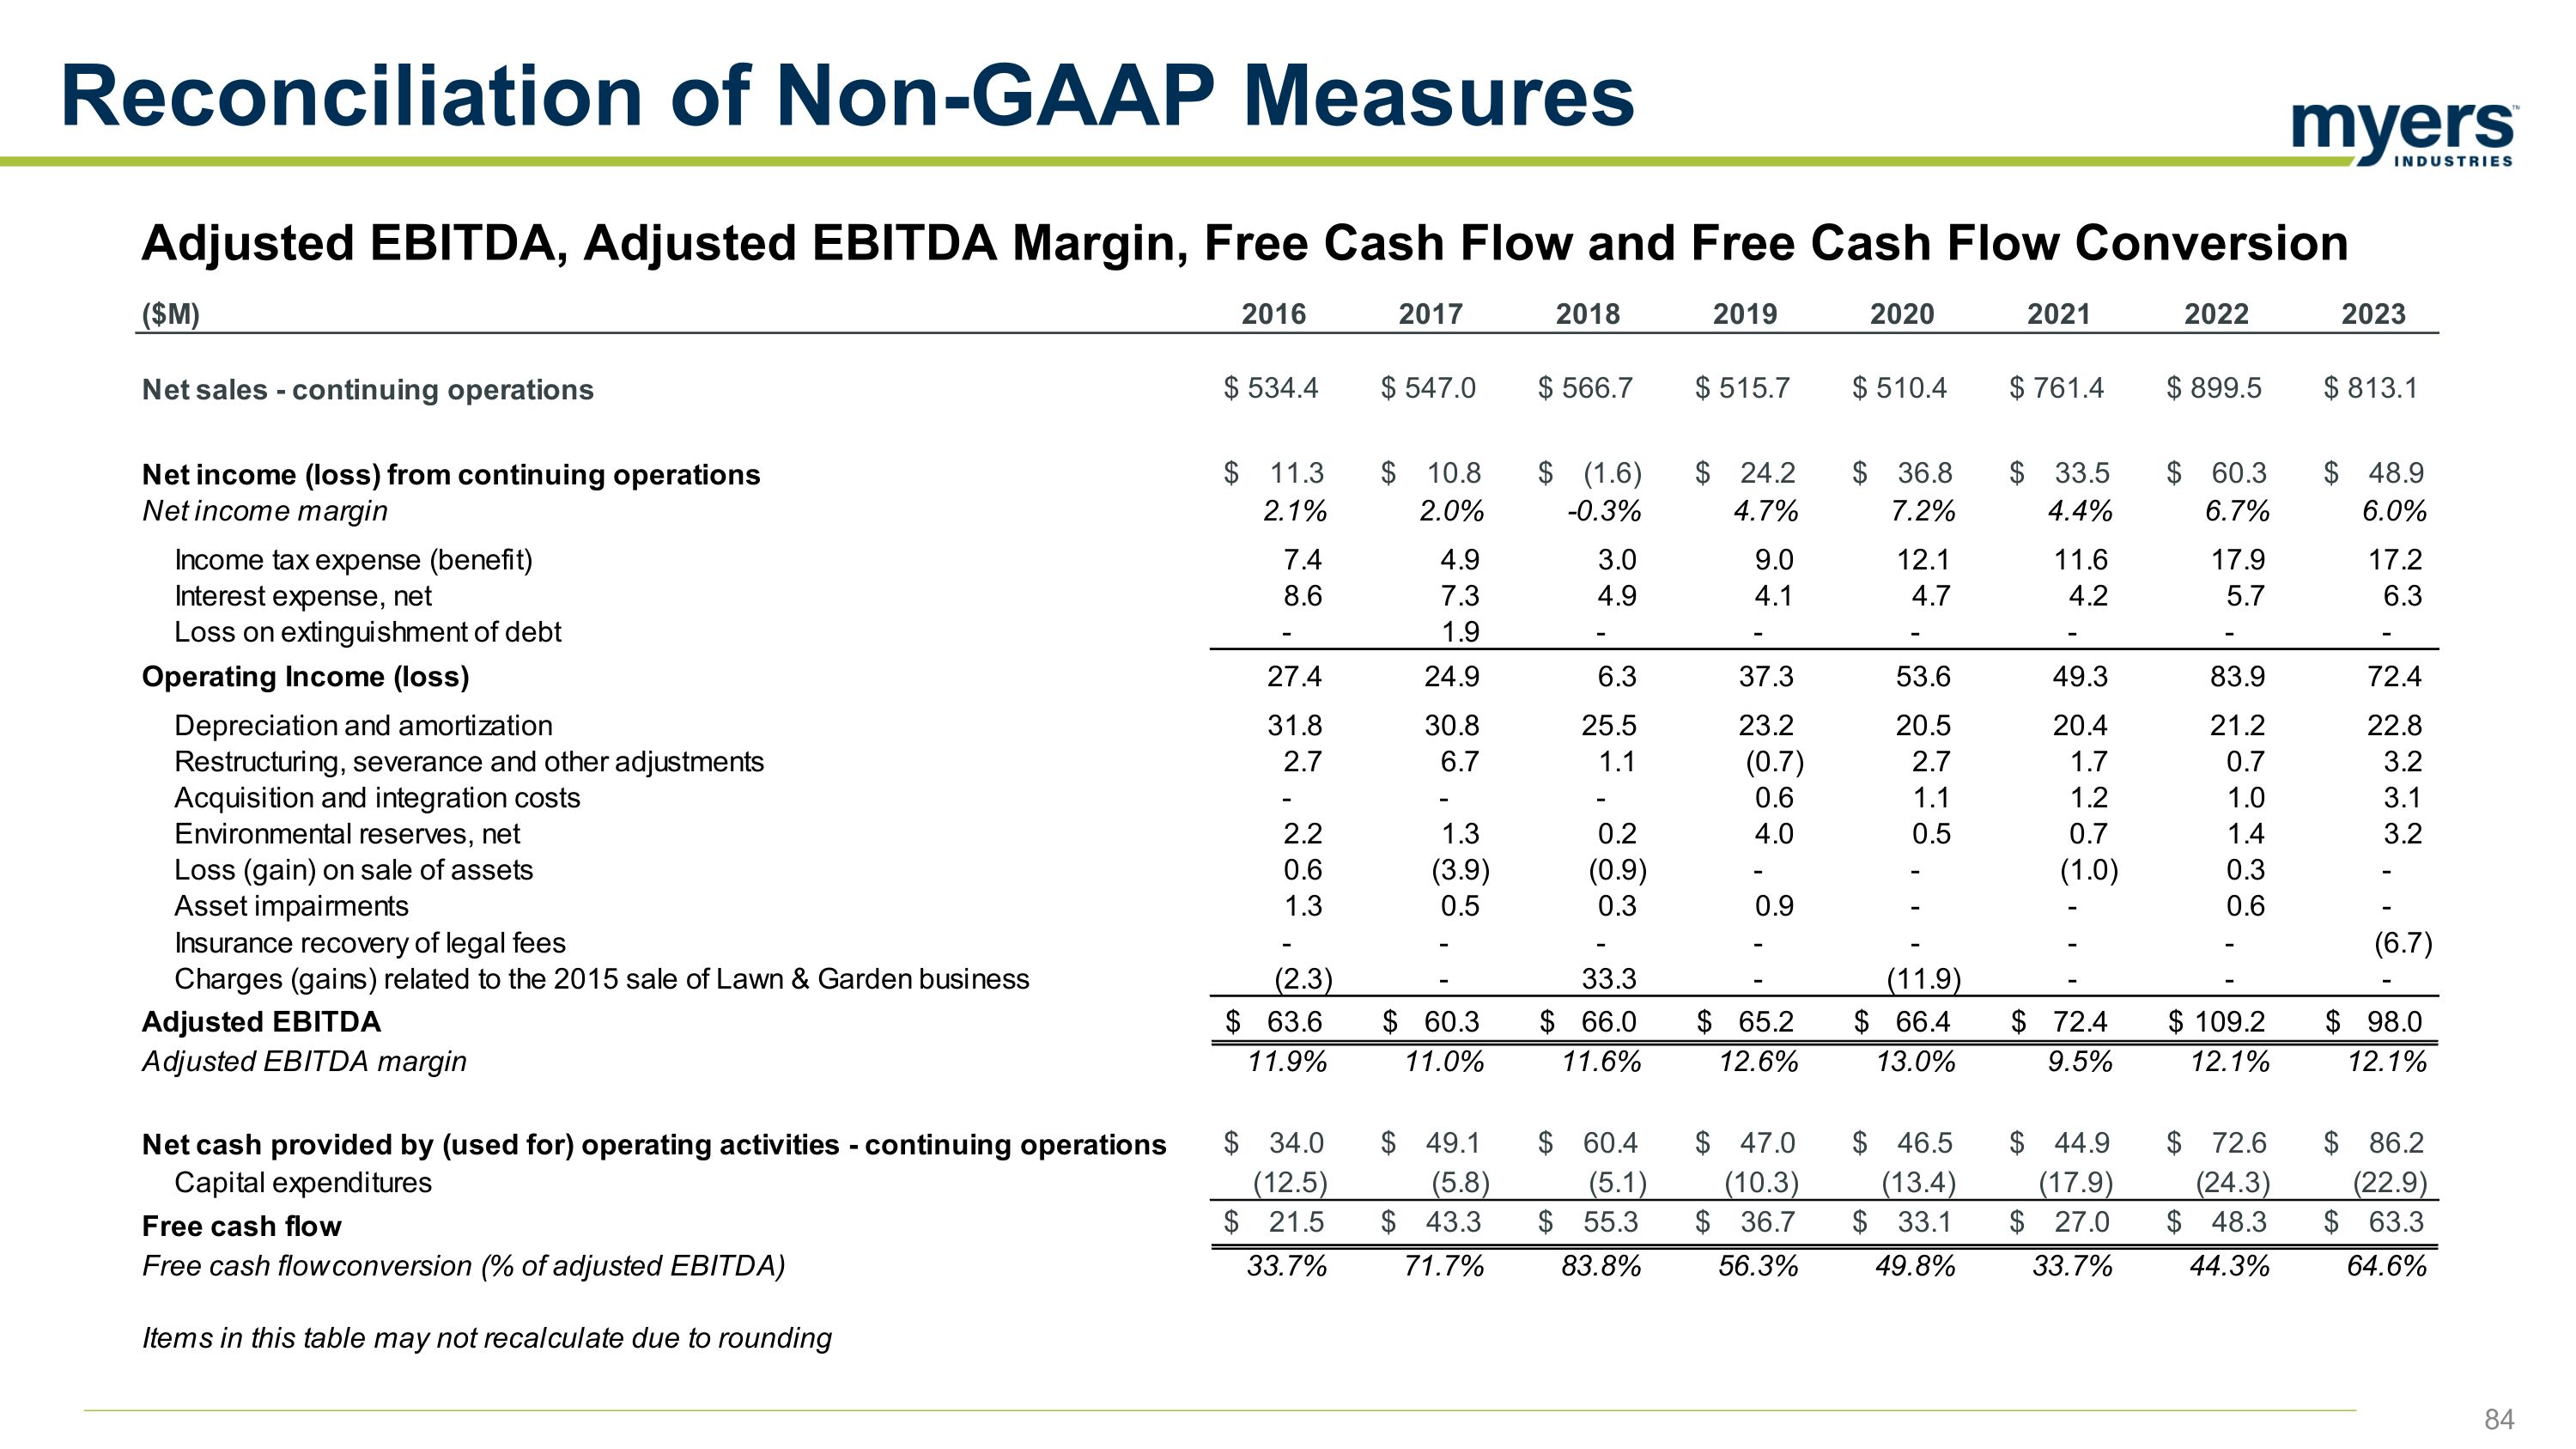
Adjusted EBITDA, Adjusted EBITDA Margin, Free Cash Flow and Free Cash Flow Conversion Reconciliation of Non-GAAP Measures
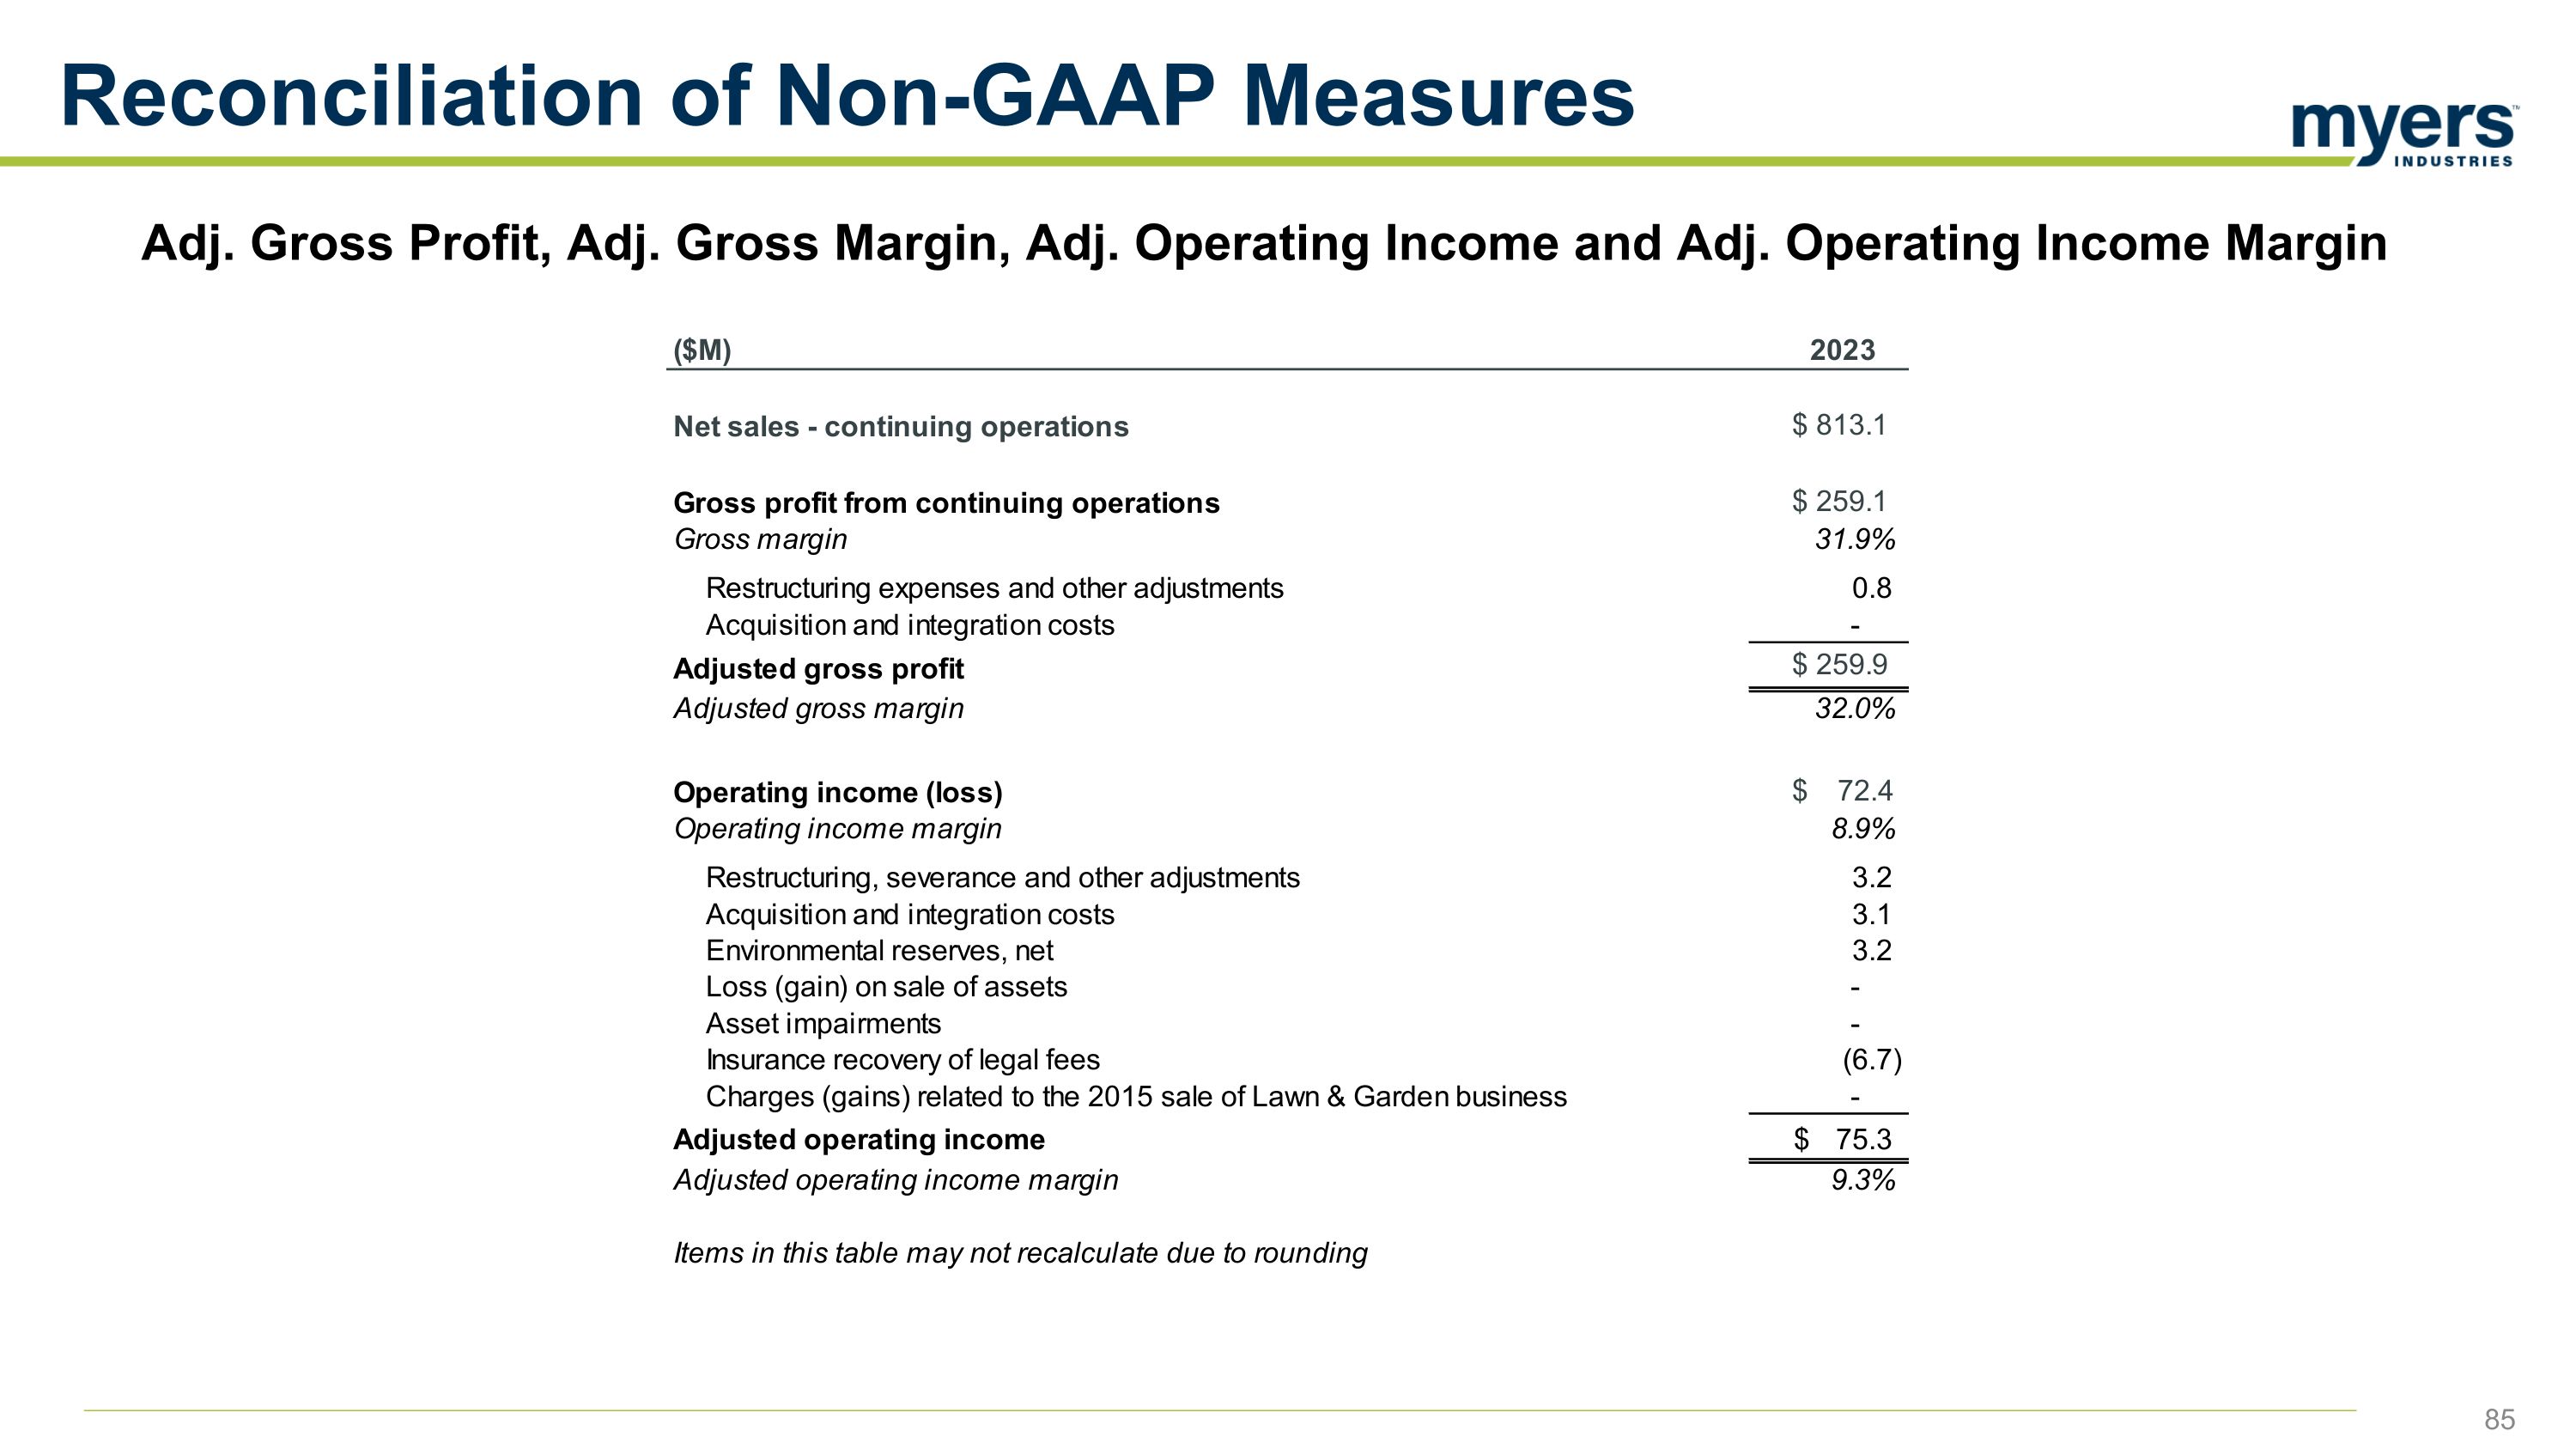
Adj. Gross Profit, Adj. Gross Margin, Adj. Operating Income and Adj. Operating Income Margin Reconciliation of Non-GAAP Measures
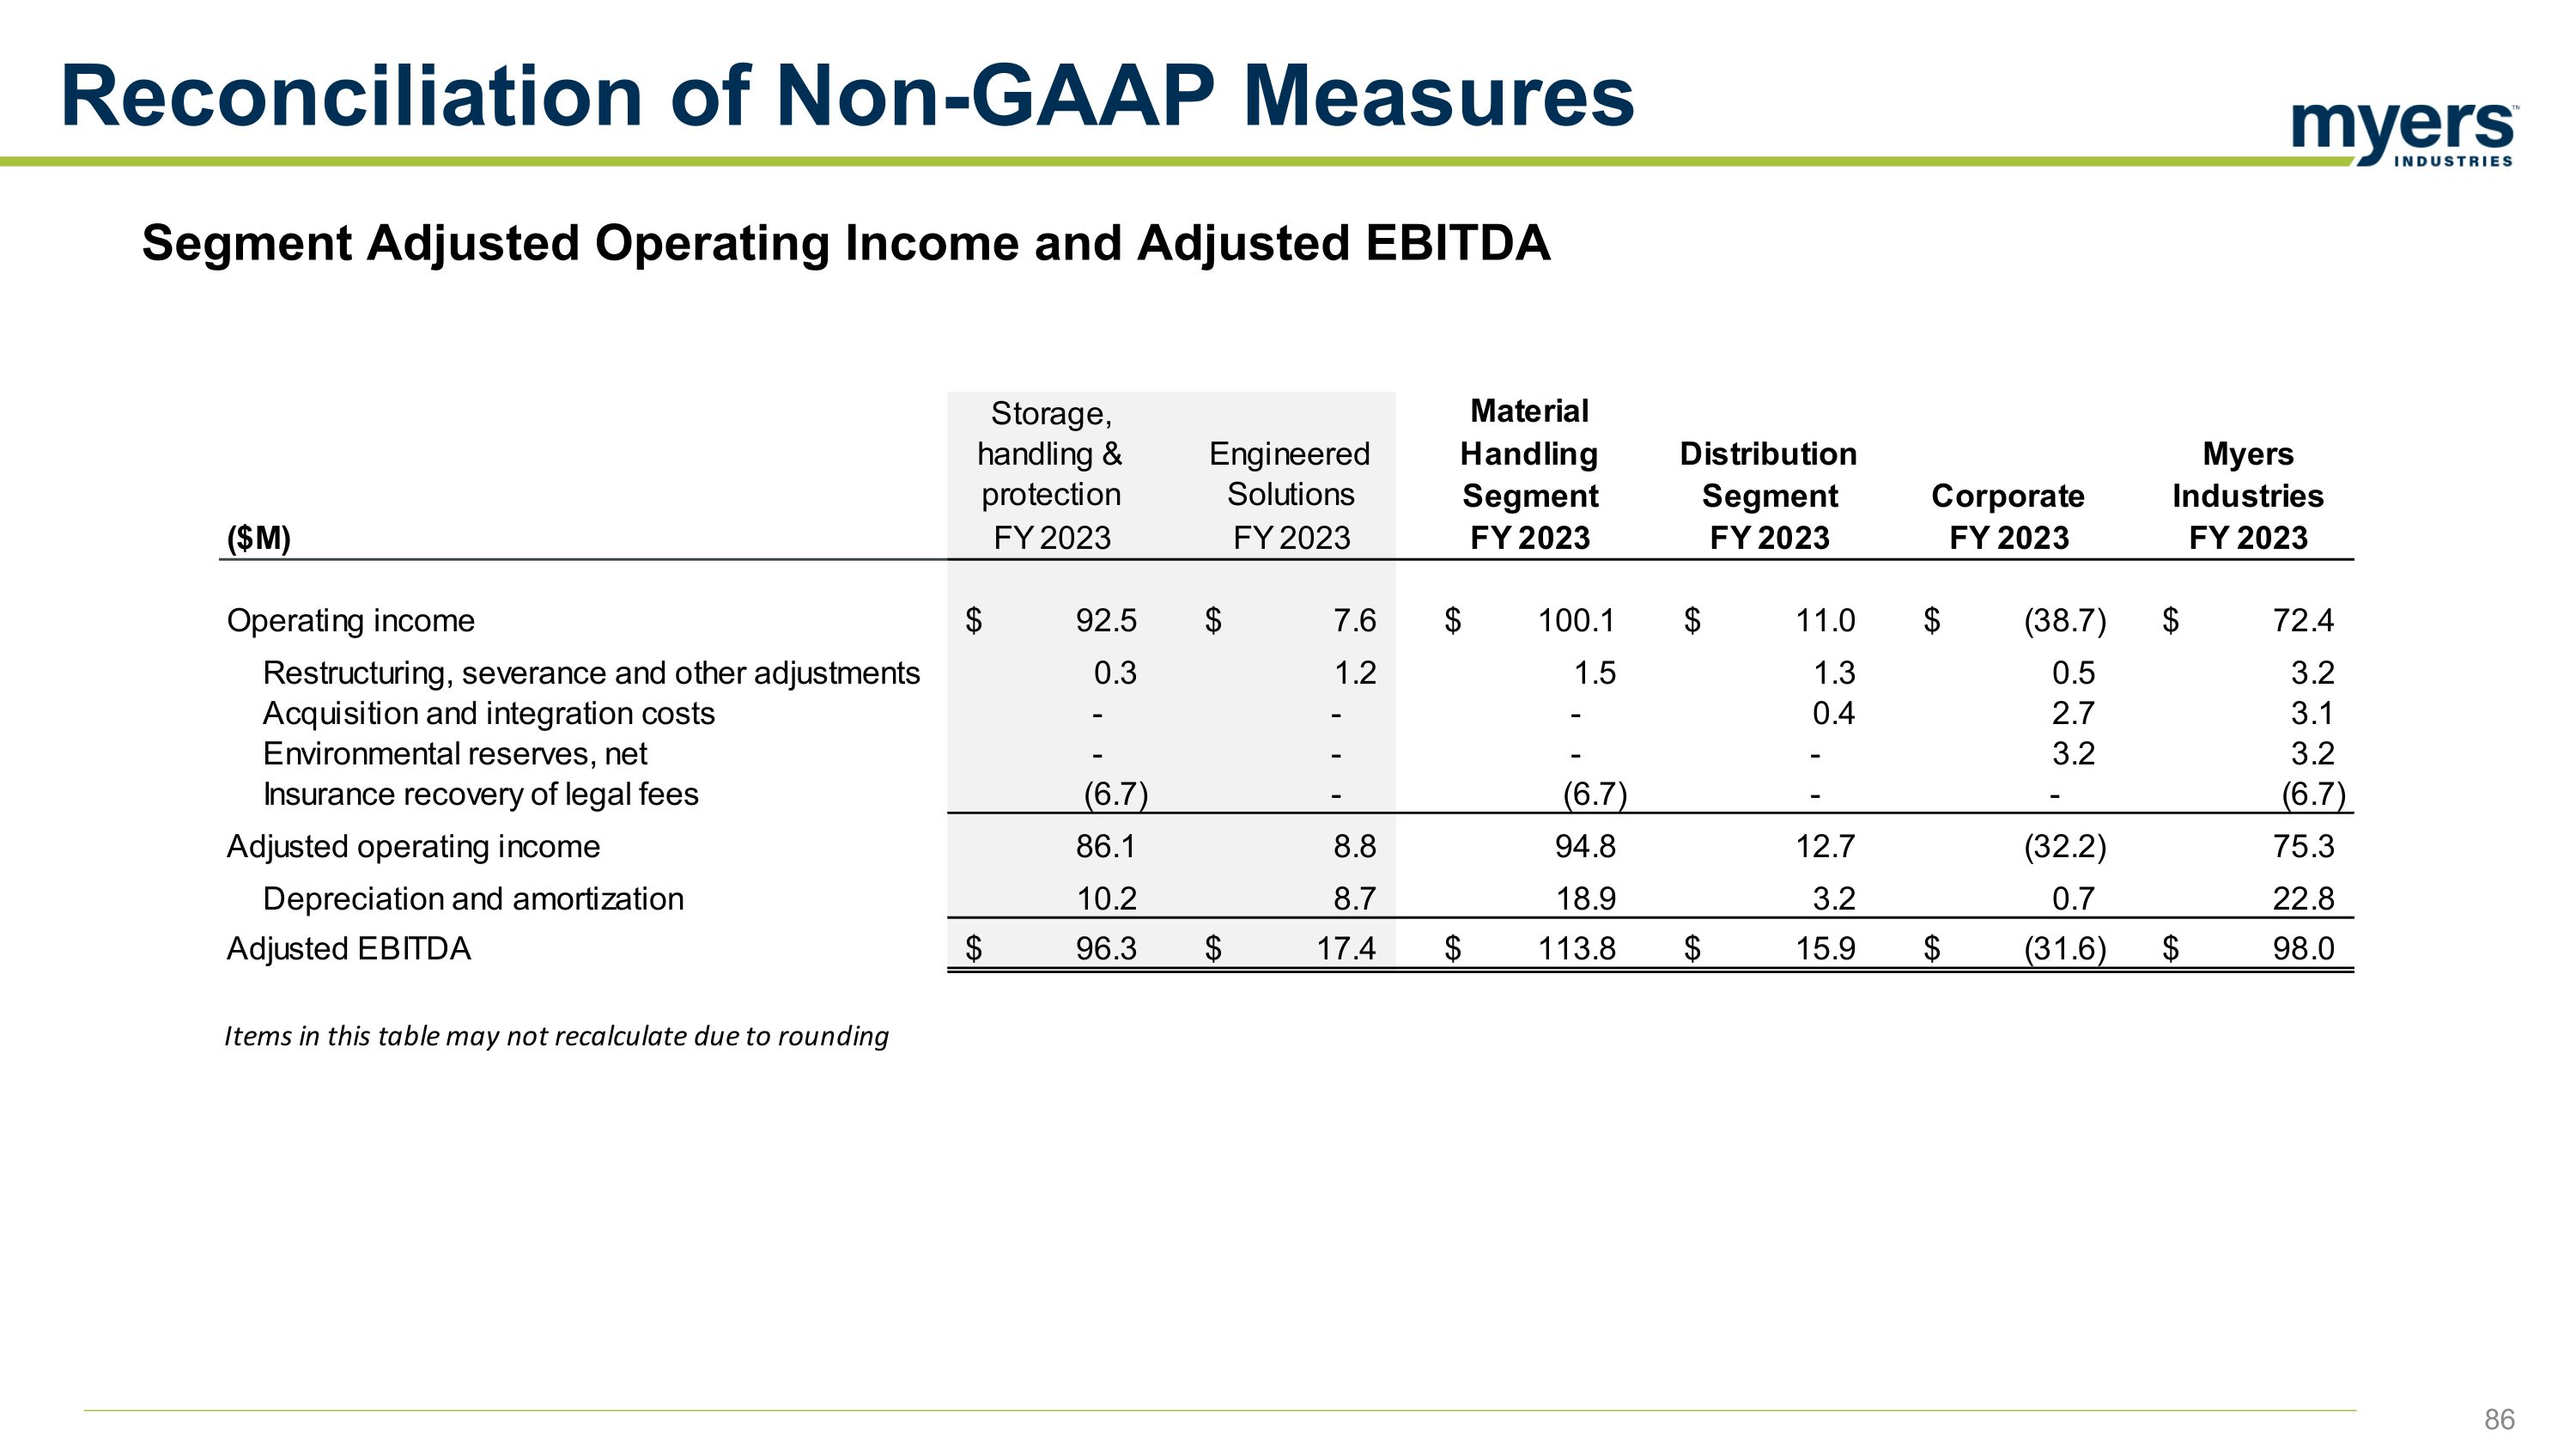
Segment Adjusted Operating Income and Adjusted EBITDA Reconciliation of Non-GAAP Measures
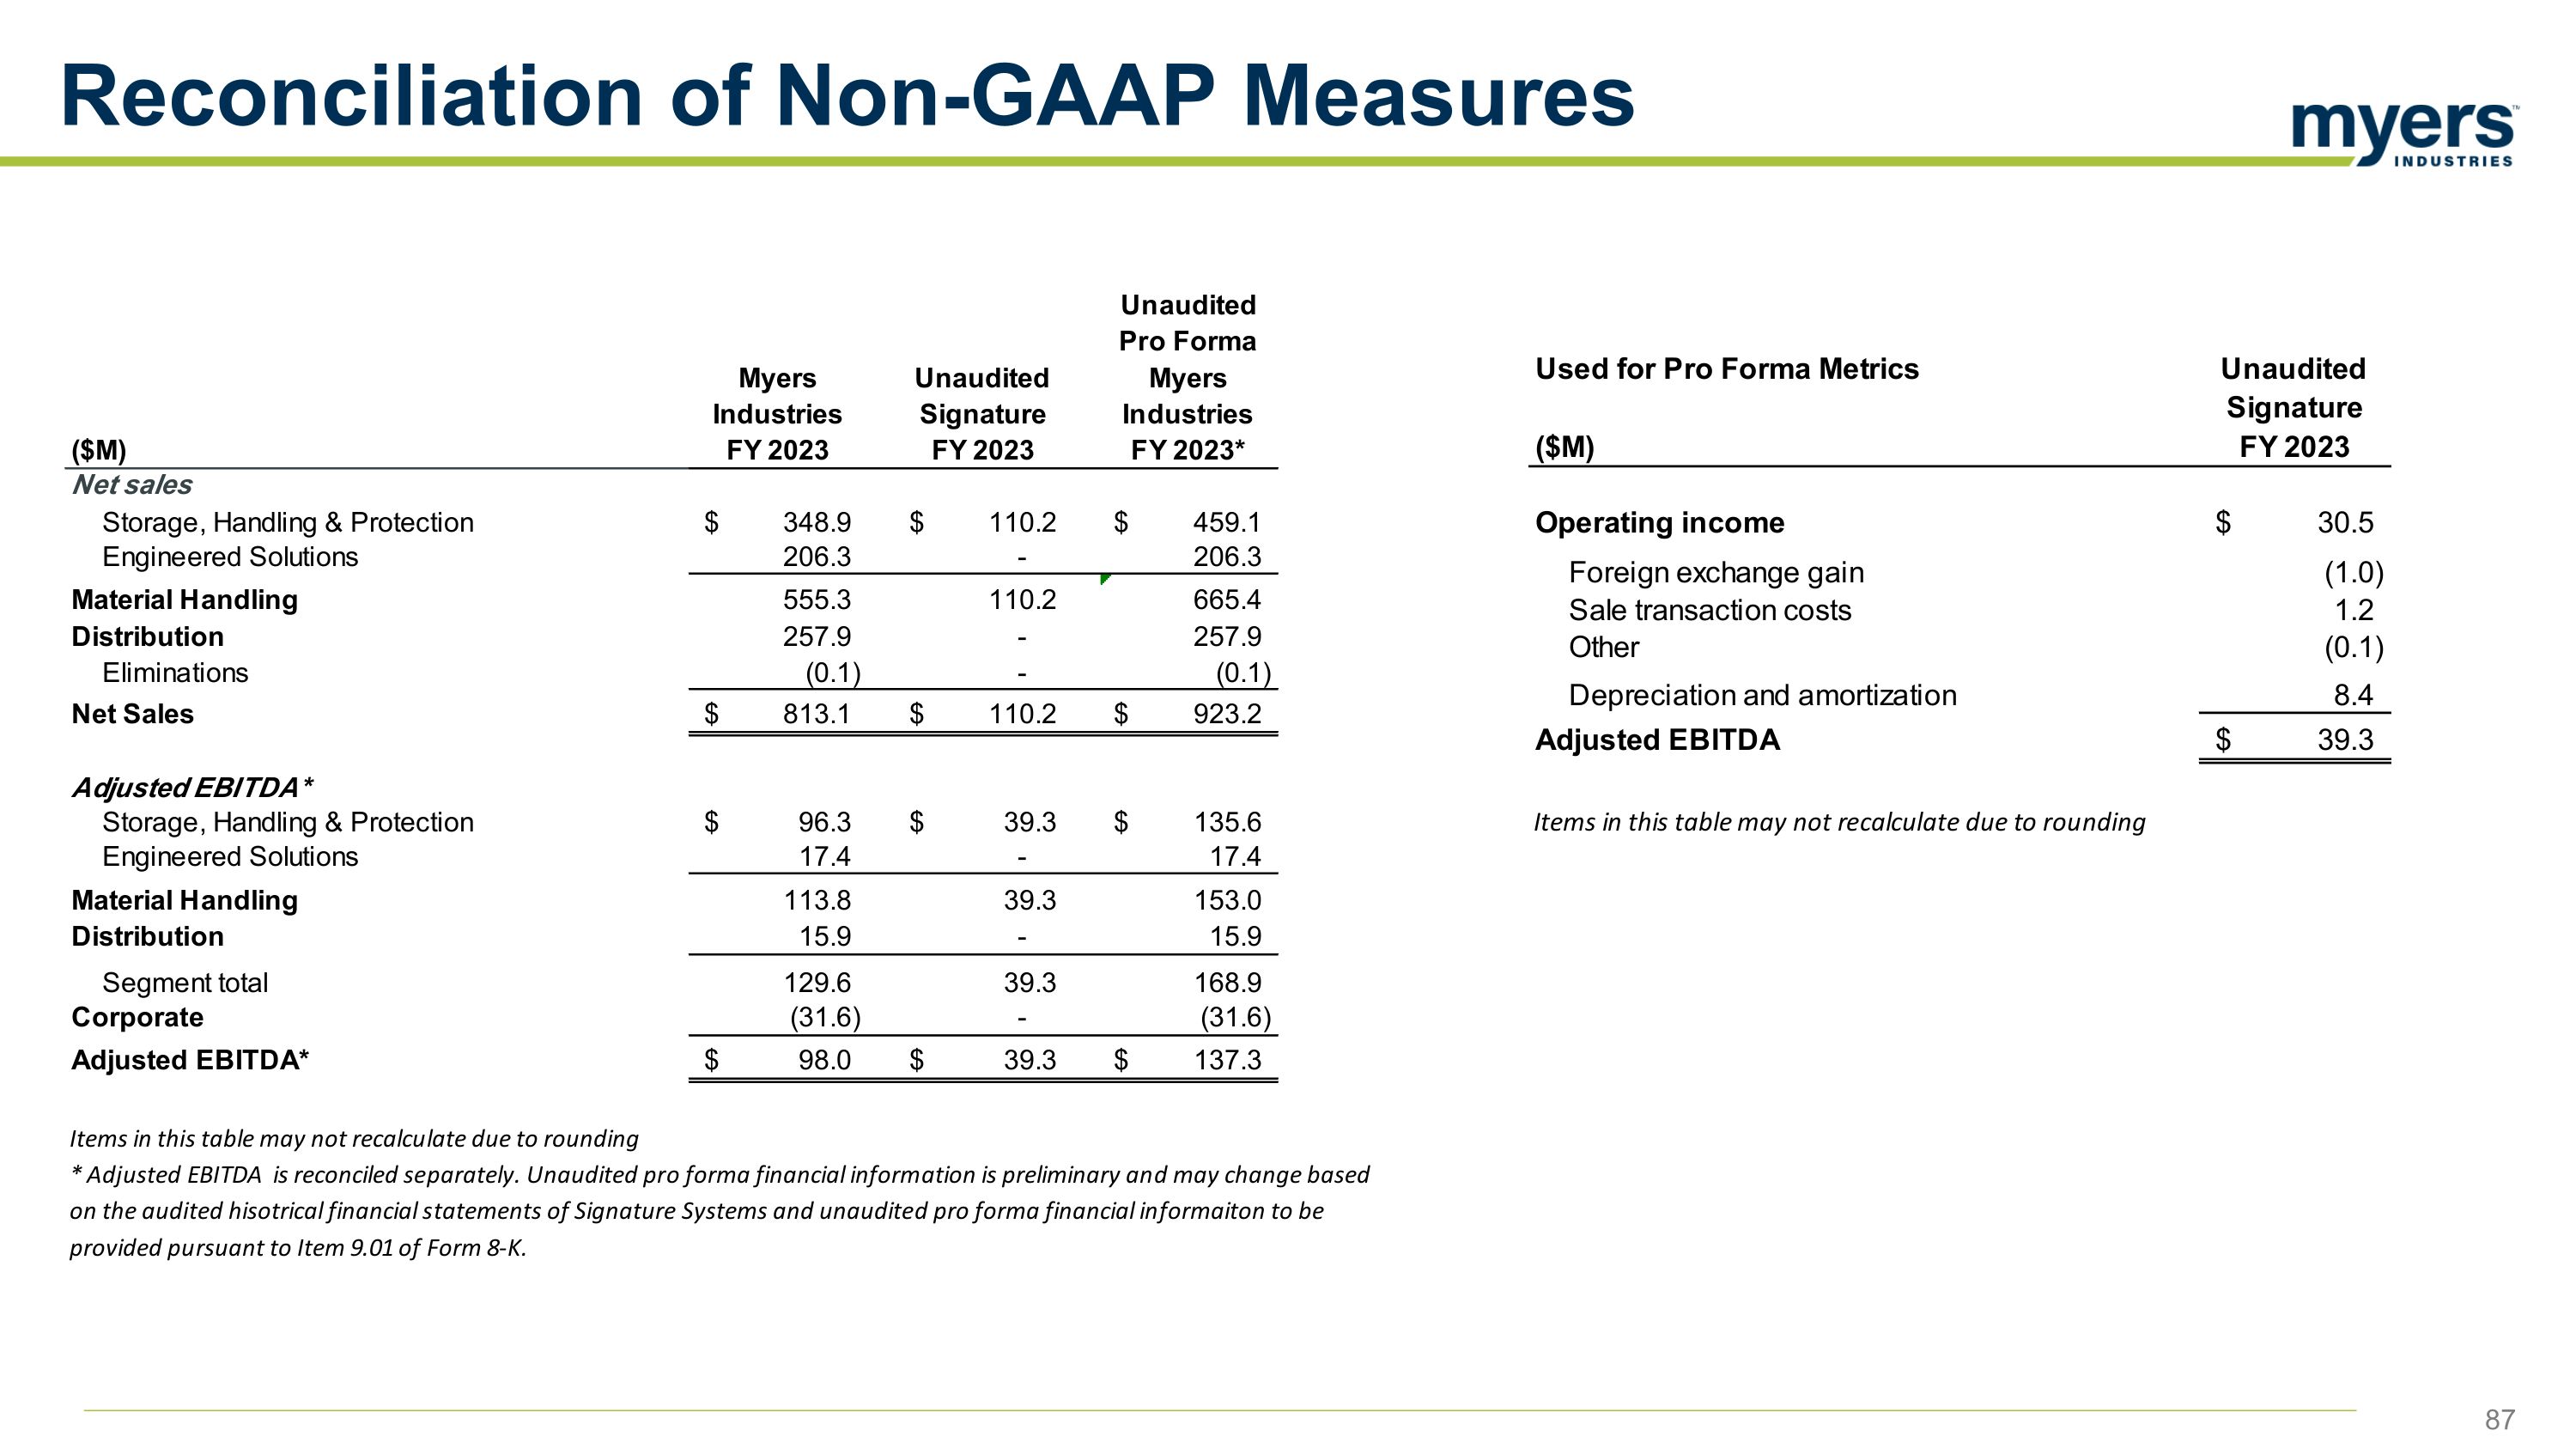
Reconciliation of Non-GAAP Measures 87
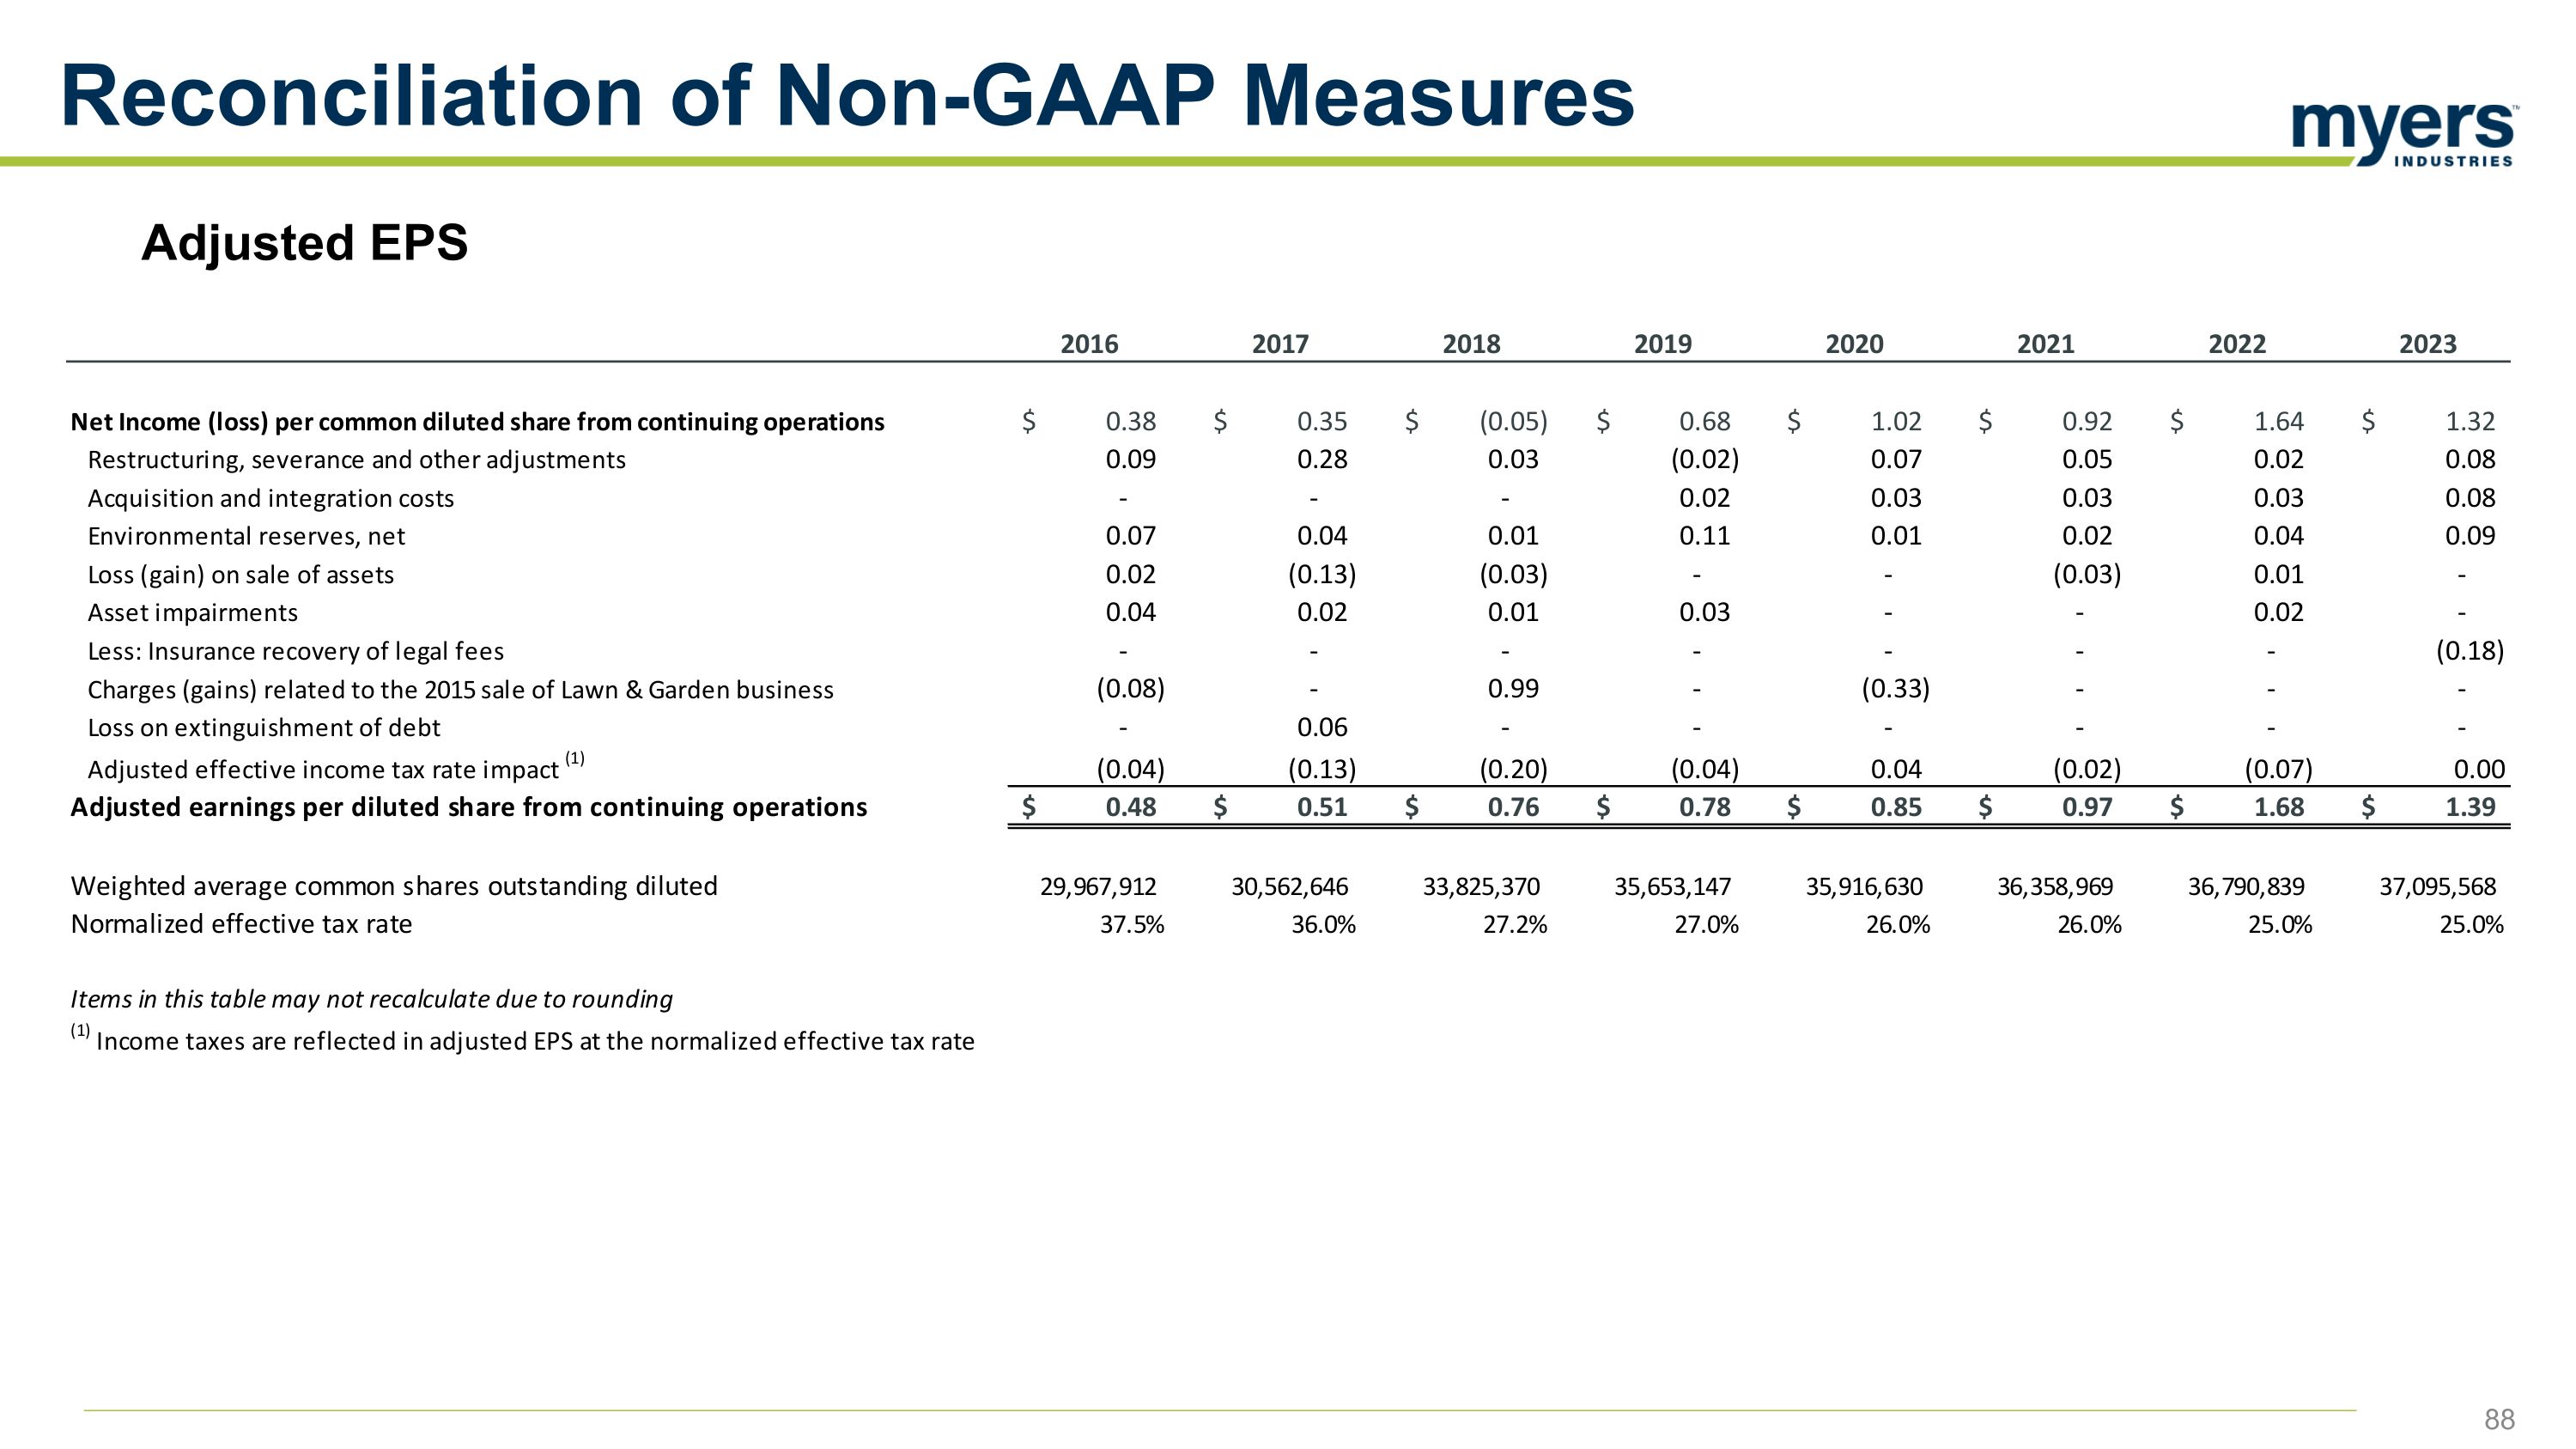
Adjusted EPS Reconciliation of Non-GAAP Measures
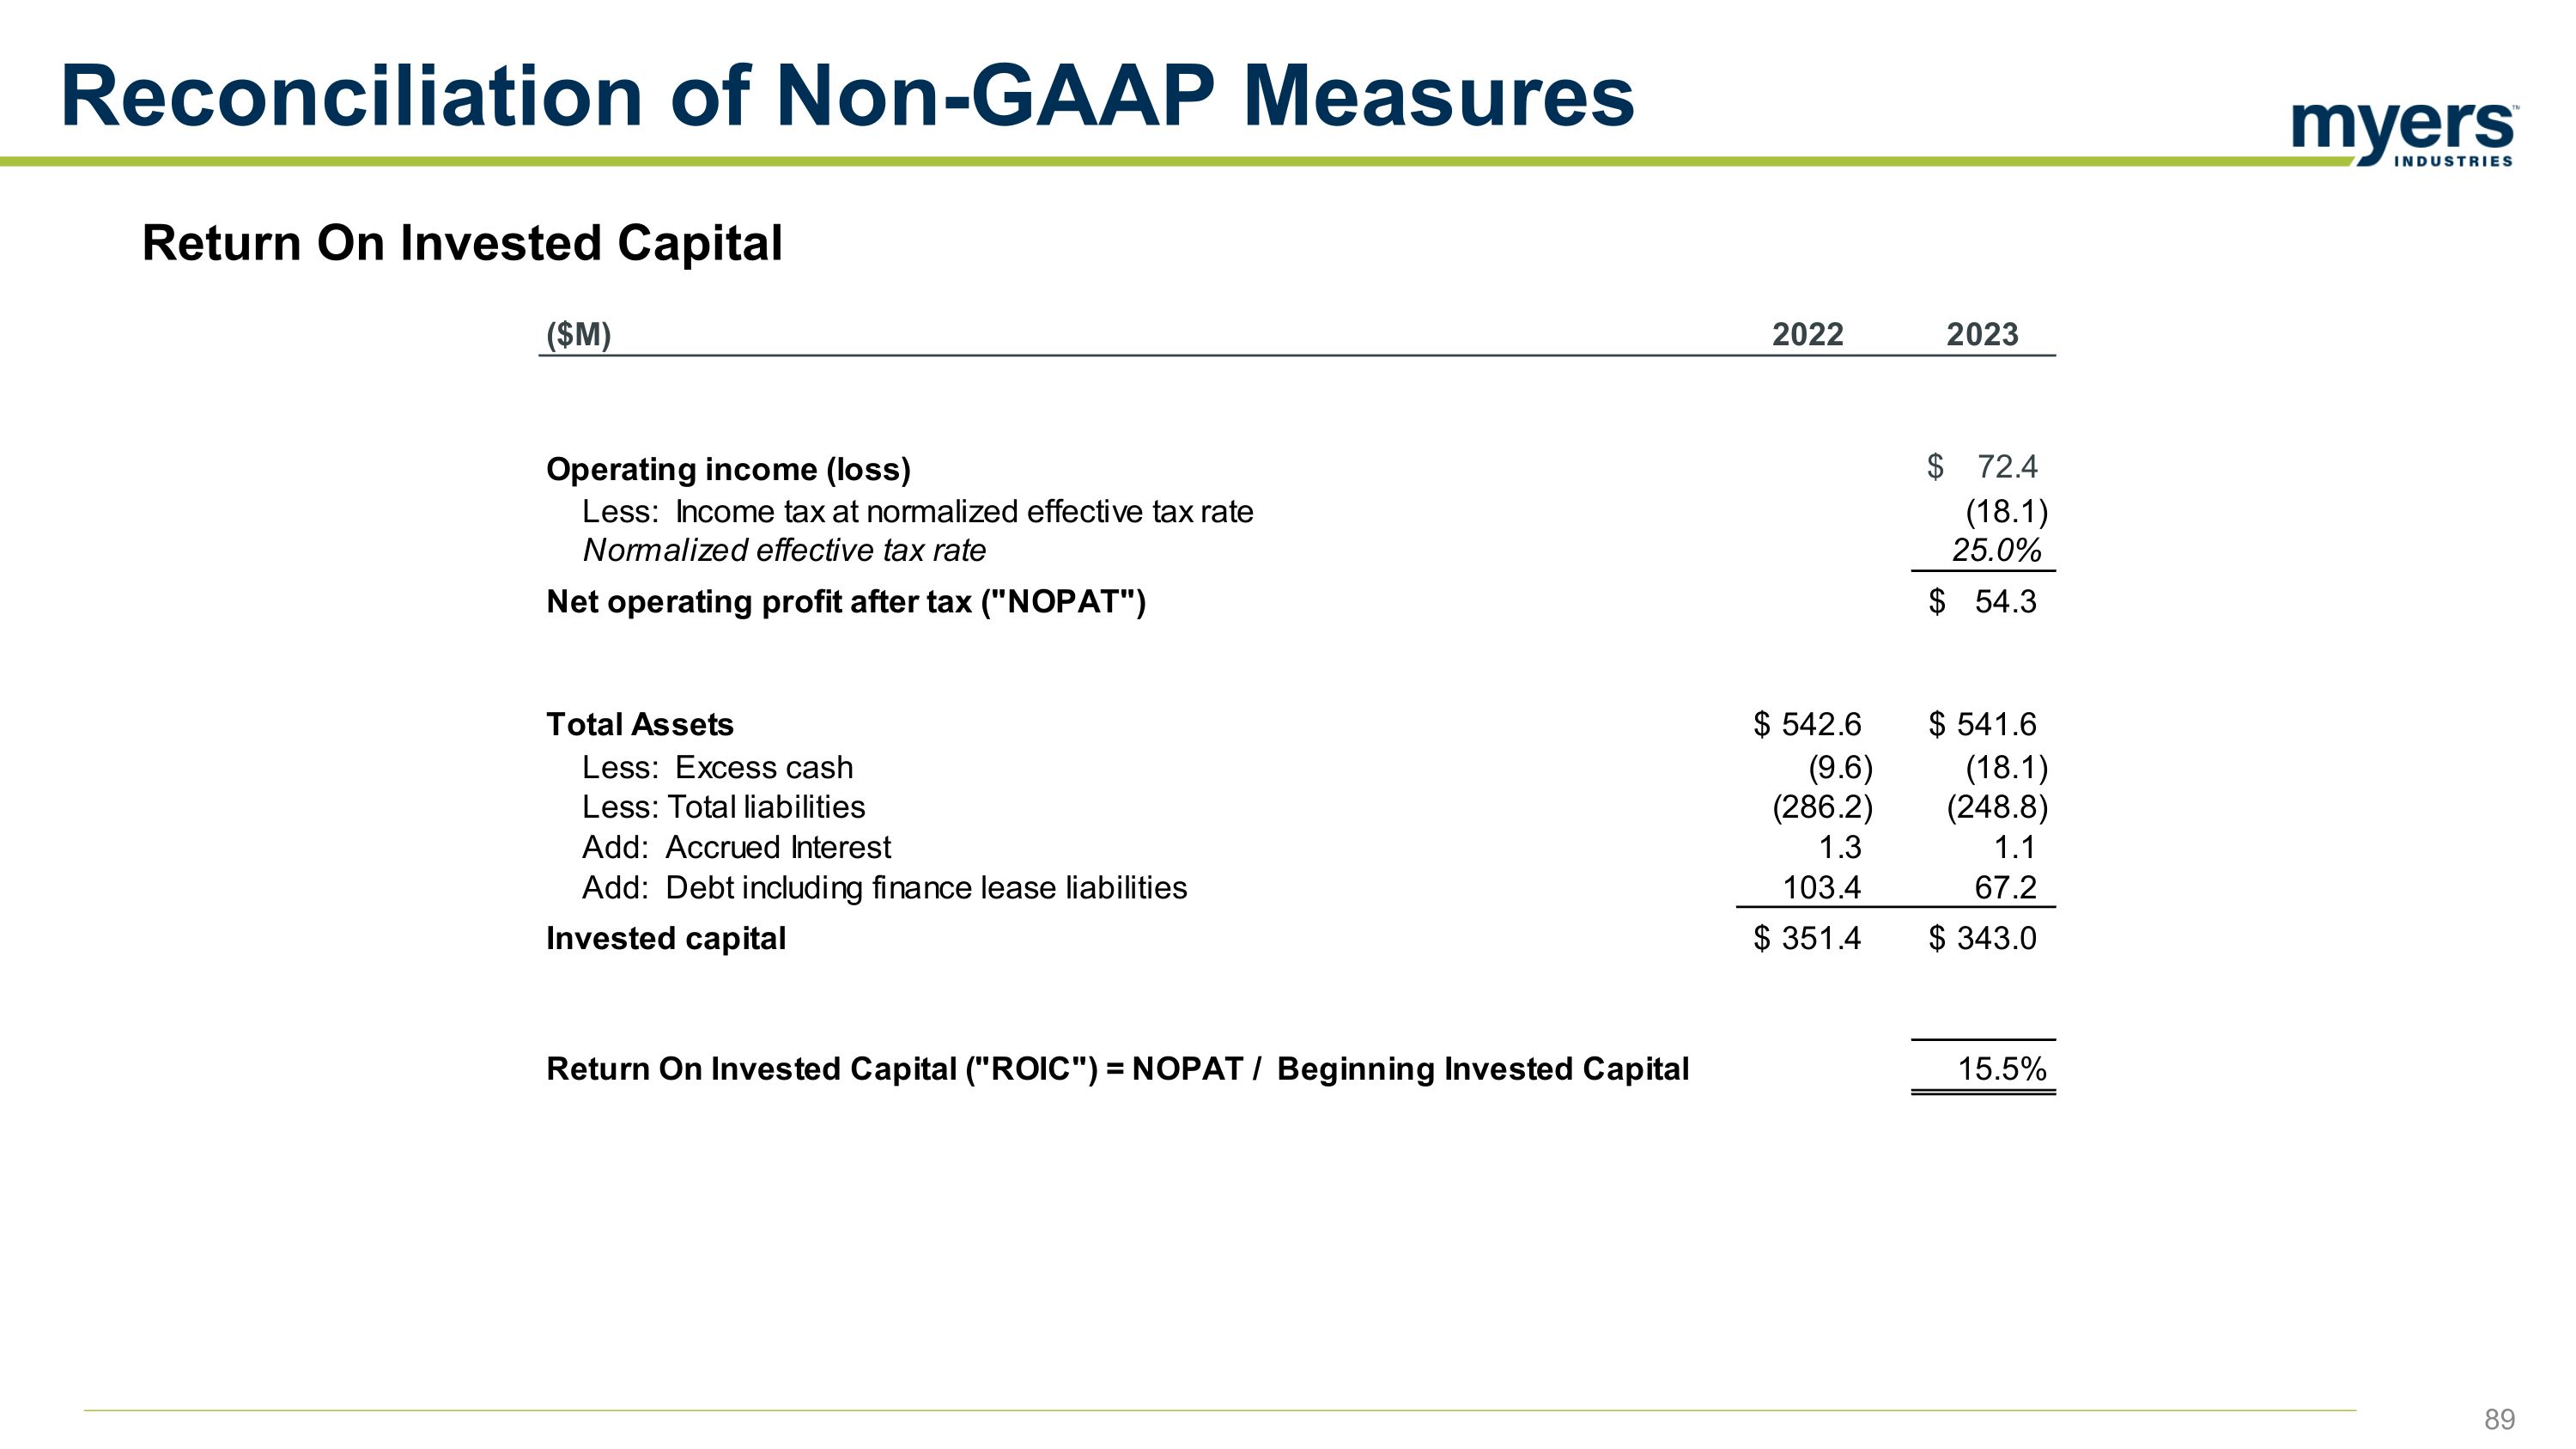
Return On Invested Capital Reconciliation of Non-GAAP Measures
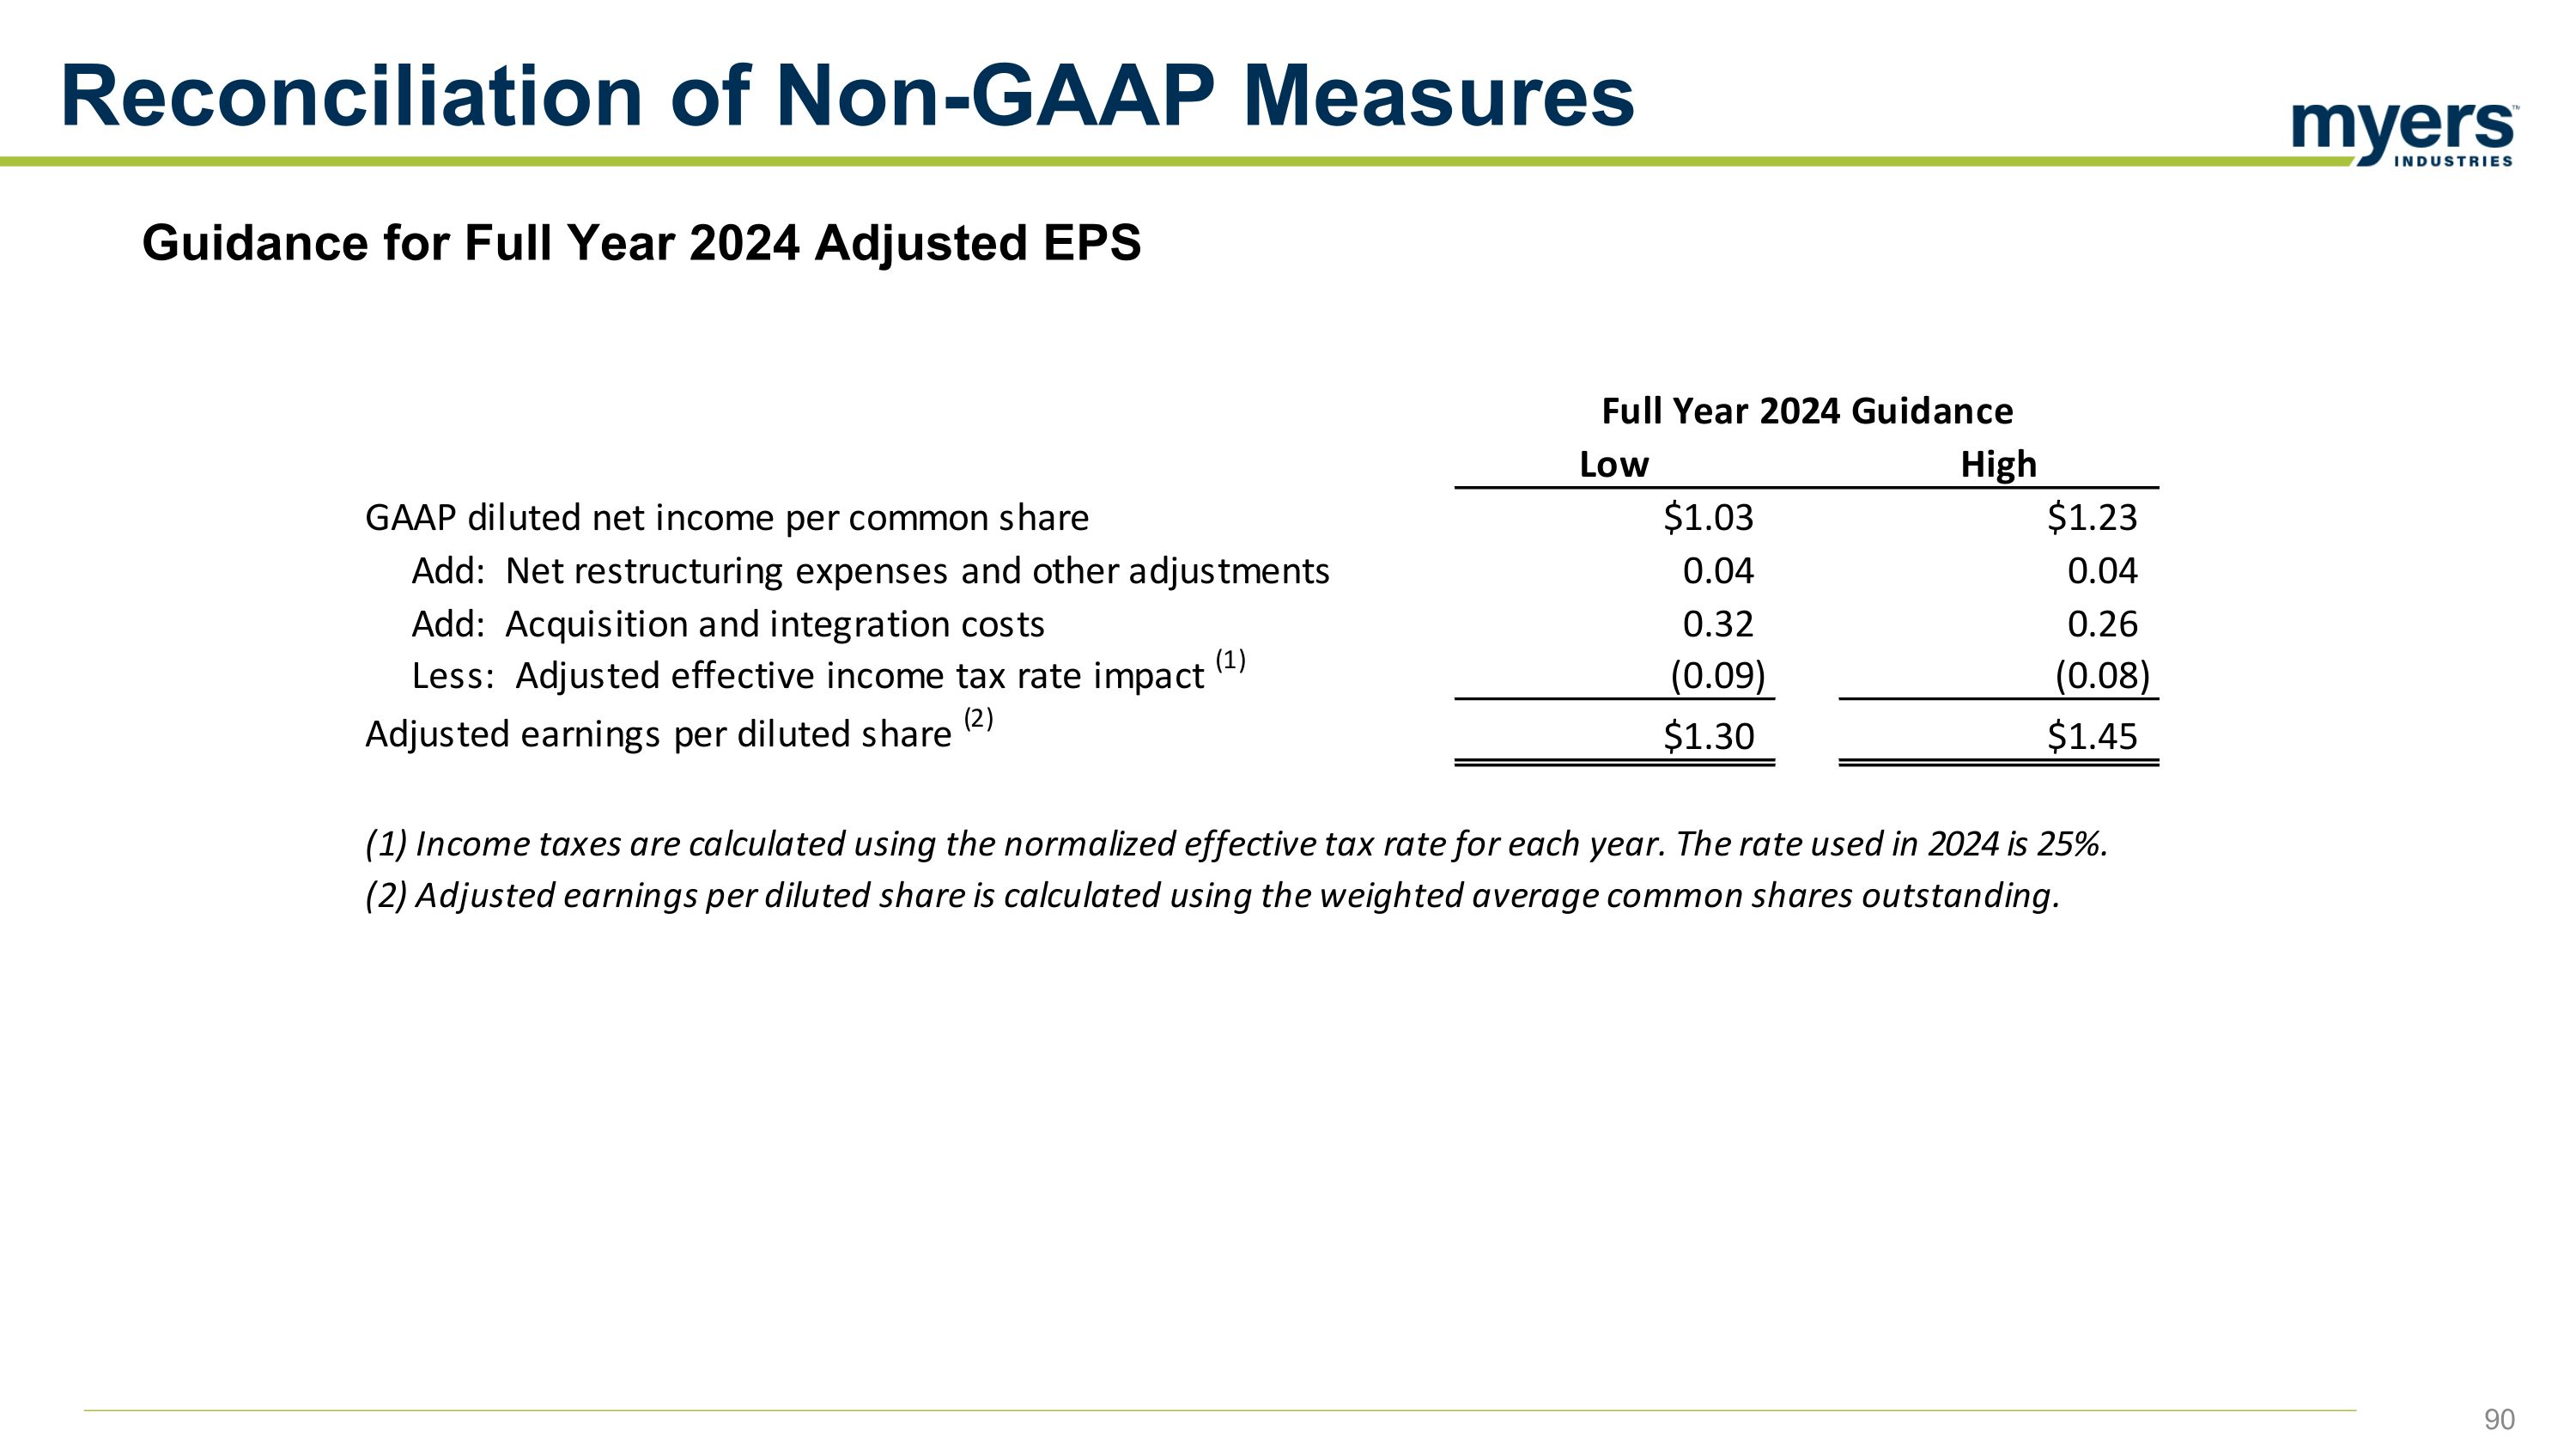
Guidance for Full Year 2024 Adjusted EPS Reconciliation of Non-GAAP Measures