UNITED STATES
SECURITIES AND EXCHANGE COMMISSION
Washington, D.C. 20549
FORM 10-K
☒ ANNUAL REPORT PURSUANT TO SECTION 13 OR 15(d) OF THE SECURITIES EXCHANGE ACT OF 1934
For the fiscal year ended December 31, 2023
OR
☐ TRANSITION REPORT PURSUANT TO SECTION 13 OR 15(d) OF THE SECURITIES EXCHANGE ACT OF 1934
For the transition period from to .
Commission File Number: 001-38087
GUARANTY BANCSHARES, INC.
(Exact name of registrant as specified in its charter)
Texas |
75-1656431 |
(State or other jurisdiction of incorporation or organization) |
(I.R.S. employer identification no.) |
|
|
16475 Dallas Parkway, Suite 600 |
|
Addison, Texas |
75001 |
(Address of principal executive offices) |
(Zip code) |
(888) 572 - 9881
(Registrant’s telephone number, including area code)
Securities registered pursuant to Section 12(b) of the Act:
Title of Each Class of Securities |
|
Trading Symbol |
|
Name of Each Exchange on Which Registered |
Common Stock, par value $1.00 per share |
|
GNTY |
|
New York Stock Exchange |
Securities registered pursuant to Section 12(g) of the Act: None
Indicate by check mark if the registrant is a well-known seasoned issuer, as defined in Rule 405 of the Securities Act.
Yes ☐ No ☒
Indicate by check mark if the registrant is not required to file reports pursuant to Section 13 or Section 15(d) of the Act.
Yes ☐ No ☒
Indicate by check mark whether the registrant (1) has filed all reports required to be filed by Section 13 or 15(d) of the Securities Exchange Act of 1934 during the preceding 12 months (or for such shorter period that the registrant was required to file such reports), and (2) has been subject to such filing requirements for the past 90 days. Yes ☒ No ☐
Indicate by check mark whether the registrant has submitted electronically every Interactive Data File required to be submitted pursuant to Rule 405 of Regulation S-T (§ 232.405 of this chapter) during the preceding 12 months (or for such shorter period that the registrant was required to submit such files). Yes ☒ No ☐
Indicate by check mark whether the registrant is a large accelerated filer, an accelerated filer, a non-accelerated filer, a smaller reporting company or an emerging growth company. See the definitions of “large accelerated filer,” “accelerated filer,” “smaller reporting company,” and "emerging growth company" in Rule 12b-2 under the Exchange Act.
Large accelerated filer |
☐ |
|
Accelerated filer |
☒ |
|
|
|
|
|
Non-accelerated filer |
☐ |
|
Smaller reporting company |
☐ |
|
|
|
|
|
|
|
|
Emerging growth company |
☐ |
If an emerging growth company, indicate by check mark if the registrant has elected not to use the extended transition period for complying with any new or revised financial accounting standards provided pursuant to Section 13(a) of the Exchange Act. ☐
Indicate by check mark whether the registrant has filed a report on and attestation to its management’s assessment of the effectiveness of its internal control over financial reporting under Section 404(b) of the Sarbanes-Oxley Act (15 U.S.C. 7262(b)) by the registered public accounting firm that prepared or issued its audit report. ☒
If securities are registered pursuant to Section 12(b) of the Act, indicate by check mark whether the financial statements of the registrant included in the filing reflect the correction of an error to previously issued financial statements. ☐
Indicate by check mark whether any of those error corrections are restatements that required a recovery analysis of incentive-based compensation received by any of the registrant’s executive officers during the relevant recovery period pursuant to §240.10D-1(b). ☐
Indicate by check mark whether the registrant is a shell company (as defined in Rule 12b-2 of the Exchange Act).
Yes ☐ No ☒ The aggregate market value of the shares of common stock held by non-affiliates based on the closing price of the common stock on the New York Stock Exchange on June 30, 2023, the last day of the Registrant's most recently completed second fiscal quarter, was approximately $234.0 million.
At March 7, 2024, the Company had 11,534,691 outstanding shares of common stock, par value $1.00 per share.
Documents Incorporated By Reference:
Portions of the registrant’s Definitive Proxy Statement relating to the 2024 Annual Meeting of Shareholders are incorporated by reference into Part III of this Annual Report on Form 10-K to the extent stated herein. Such Definitive Proxy Statement will be filed with the Securities and Exchange Commission within 120 days after the end of the registrant’s fiscal year ended December 31, 2023.
GUARANTY BANCSHARES, INC.
TABLE OF CONTENTS
PART I |
|
Page |
Item 1. |
1 |
|
Item 1A. |
16 |
|
Item 1B. |
39 |
|
Item 2. |
41 |
|
Item 3. |
41 |
|
Item 4. |
42 |
|
PART II |
|
|
Item 5. |
43 |
|
Item 6. |
44 |
|
Item 7. |
Management's Discussion and Analysis of Financial Condition and Result of Operations |
44 |
Item 7A. |
71 |
|
Item 8. |
73 |
|
Item 9. |
Changes in and Disagreements With Accountants on Accounting and Financial Disclosure |
73 |
Item 9A. |
73 |
|
Item 9B. |
75 |
|
Item 9C. |
Disclosure Regarding Foreign Jurisdictions that Prevent Inspections |
75 |
PART III |
|
|
Item 10. |
75 |
|
Item 11. |
75 |
|
Item 12. |
Security Ownership of Certain Beneficial Owners and Management and Related Stockholder Matters |
75 |
Item 13. |
Certain Relationships and Related Transactions, And Director Independence |
75 |
Item 14. |
75 |
|
PART IV |
|
|
Item 15. |
75 |
|
|
76 |
|
Item 16. |
79 |
|
79 |
||
F-1 |
||
PART I
ITEM 1. BUSINESS.
Our Company
Except where the context otherwise requires or where otherwise indicated, references in this Annual Report on Form 10-K to “we,” “us,” “our,” “our company,” the “Company” or “Guaranty” refer to Guaranty Bancshares, Inc. and our wholly-owned banking subsidiary, Guaranty Bank & Trust, N.A. and the terms “Bank” and "Guaranty Bank & Trust" refer to Guaranty Bank & Trust, N.A.
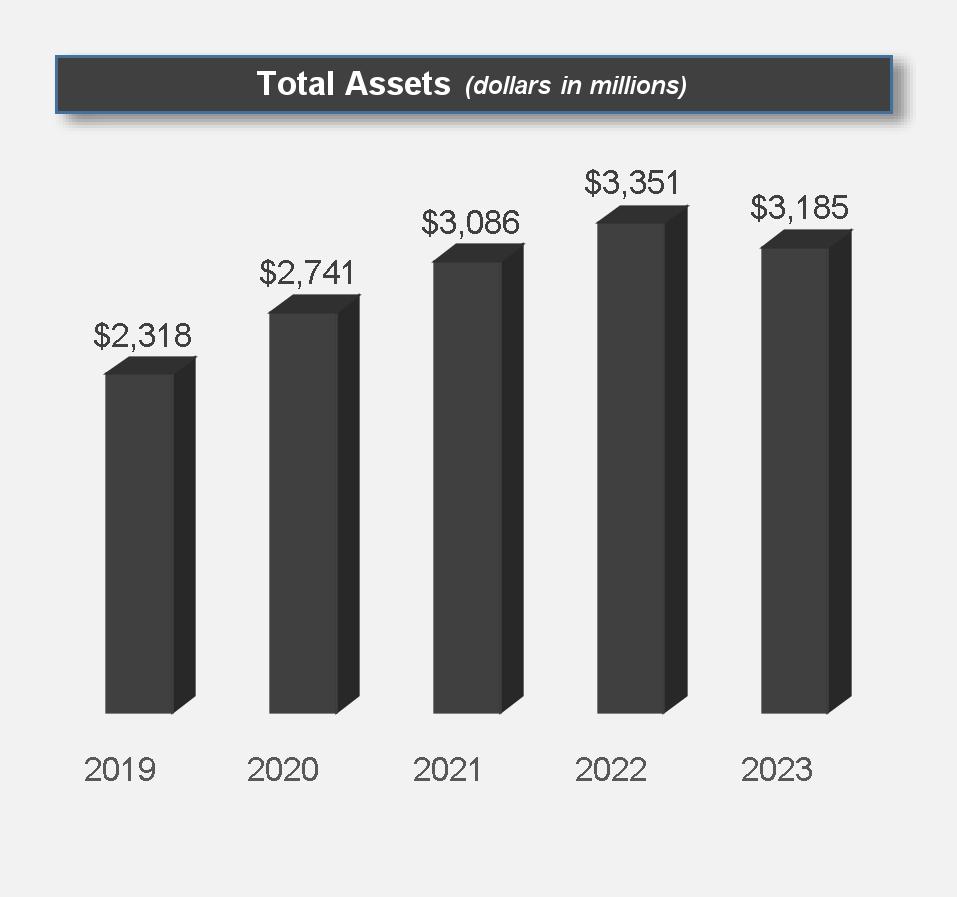
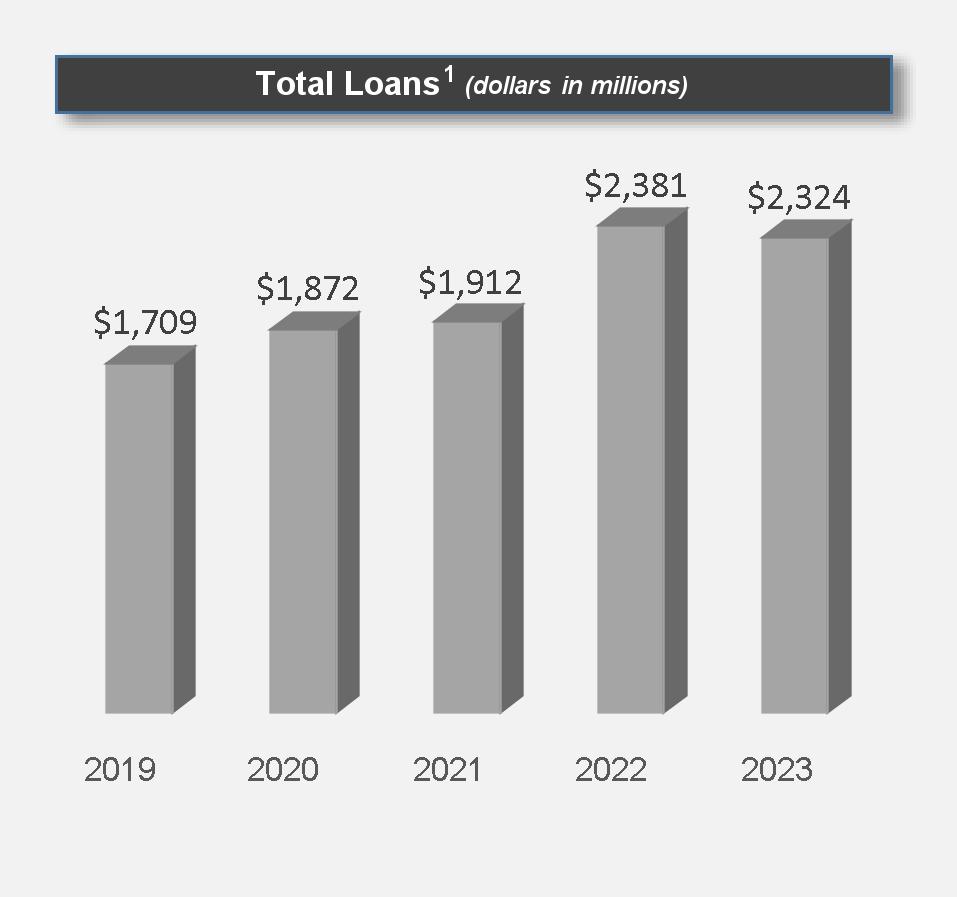
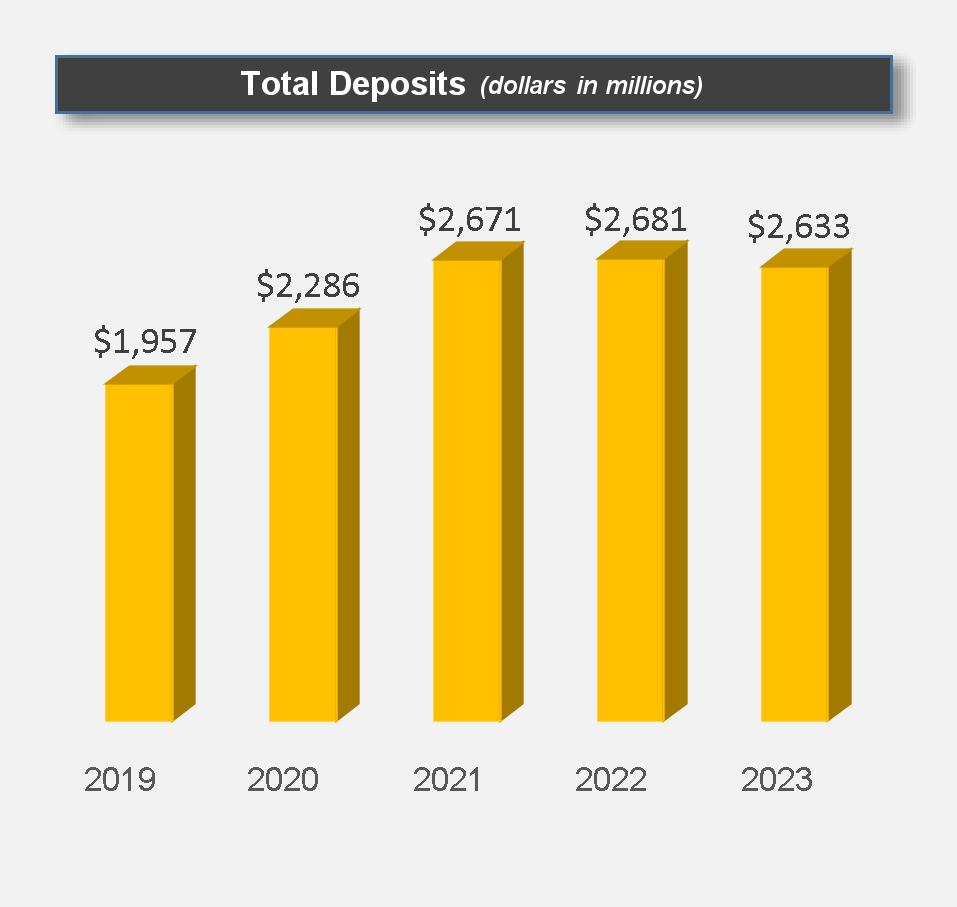
We are a bank holding company, with corporate headquarters in Addison, Texas and operational headquarters in Mount Pleasant, Texas. Through our wholly owned subsidiary, Guaranty Bank & Trust, a national banking association, we provide a wide range of relationship-driven commercial and consumer banking, as well as trust and wealth management products and services that are tailored to meet the needs of small- and medium-sized businesses, professionals and individuals. As of December 31, 2023, the Bank operates 33 full service banking locations in East Texas, Dallas/Fort Worth, Houston and Central Texas regions of the state. As of December 31, 2023, we had total assets of $3.18 billion, total net loans of $2.29 billion, total deposits of $2.63 billion and total shareholders’ equity of $303.8 million.
We completed an initial public offering of our common stock in May 2017. Our common stock was traded on the Nasdaq Global Select Market through March 6, 2023, and commenced trading on the New York Stock Exchange on March 7, 2023, where it continues to trade under the symbol "GNTY."
Our History and Growth
Guaranty Bank & Trust was originally chartered as a Texas state banking association over a century ago in 1913, and converted its charter to a national banking association in 2012. Guaranty was incorporated in 1990 to serve as the holding company for Guaranty Bank & Trust. Since our founding, we have built a strong reputation based on financial stability and community leadership. Our growth has been consistent and primarily organic, both through growth in our established markets and the entry into new markets with de novo banking locations. In 2013, we expanded from our East Texas markets by opening a de novo banking location in Bryan/College Station, Texas. In 2017, we opened de novo banking locations in Fort Worth and Austin, Texas. In late 2021, we opened a second de novo location just outside of Austin in the town of Georgetown, Texas, and we opened a third Austin location in January 2022. We have achieved organic growth over time by enhancing our lending and deposit relationships with existing customers and attracting new customers, as well as cross-selling our deposit, mortgage, trust and wealth management and treasury management products.
We have also supplemented our organic growth and leveraged our strong deposit base with strategic acquisitions. In 2015, we acquired both Texas Leadership Bank and DCB Financial, allowing us to expand our footprint into the Dallas/Fort Worth MSA. In 2018, we entered the Houston MSA through our acquisition of Westbound Bank. Our expansion strategy has enabled us to access markets with stronger loan demand, achieve consistent growth, maintain stable operating efficiencies, recruit top bankers, preserve our historically conservative credit culture, and provide shareholders with stable earnings throughout credit cycles.
Since our initial expansion outside of East Texas in 2013, we have grown our network of banking locations from 18 banking locations in 11 Texas communities to 33 banking locations in 26 Texas communities as of December 31, 2023.
Our Community Banking Philosophy and Culture
We focus on a community-based relationship model, as opposed to a line of business model, because we believe the community-based relationship model promotes an entrepreneurial attitude within our Company while providing personal attention and solutions tailored to our customers. Our culture is one of employee ownership and it is something we take very seriously. We have formally documented our culture in a book called “The Guaranty Culture,” which we give to all prospective new hires and directors before they join our team so that they clearly understand who we are, how we work, what we believe, how we make decisions and what we admire in people.
We believe a great bank requires the right amount of two forms of capital: financial and human. We understand that our ability to successfully deploy our financial capital is directly related to our ability to bring the right talents together to lead our teams. This focus on human capital has rewarded us with a cohesive group of directors, officers and employees that we believe is our greatest asset. We have invested in a robust management development program designed to develop comprehensive bankers who understand all aspects of our operations and embrace our core values. The training program generally lasts 18-24 months and includes rotations through each primary department of the Bank.
1
Successful graduates of our training program are typically promoted to a leadership or managerial position upon completion. We currently have graduates in management, lending and operational roles. Several of the Bank’s market presidents and managers are graduates of our training program.
We continue to expand and grow the offerings provided via Guaranty University, an online professional and continuing education resource for our employees. In addition, certain up and coming leaders participate in our Leadership Development Program (LDP). The LDP program caters to our Senior Vice Presidents (VPs), VPs and Assistant VPs, including department heads, market leaders and lenders and other high potential employees and has proven to be a valuable source of growth and improvement to our leadership participants. For employees at various levels who exhibit leadership aptitude, they frequently participate in online courses, in-person leadership classes and team building activities that allow them to learn about and improve upon various leadership traits and skills.
We have developed a network of banking locations strategically positioned in separate and distinct communities. Each community where we have a banking location is overseen by a local market president or manager, and we emphasize local decision-making by experienced bankers supported by centralized risk and credit oversight. We believe that employing local decision makers, supported by industry-leading technology and centralized operational and credit administration support from our corporate headquarters, allows us to serve our customers’ individual needs while managing risk on a uniform basis. We intend to repeat this scalable model in each market in which we are able to identify high-caliber bankers with a strong banking team. We empower these bankers to implement our operating strategy, grow our customer base and provide the highest level of customer service possible. We believe our organizational approach enables us to attract and retain talented bankers and banking teams who desire the combination of the Bank’s size and loan limits, dedication to culture, commitment to our communities, local decision-making authority, compensation structure and focus on relationship banking.
Growth and Expansion Strategies
Our strategic plan is to be a leading Texas bank holding company with a commitment to operate as a community bank as we continue to execute our long term growth strategy and to generate shareholder value through the following:
2
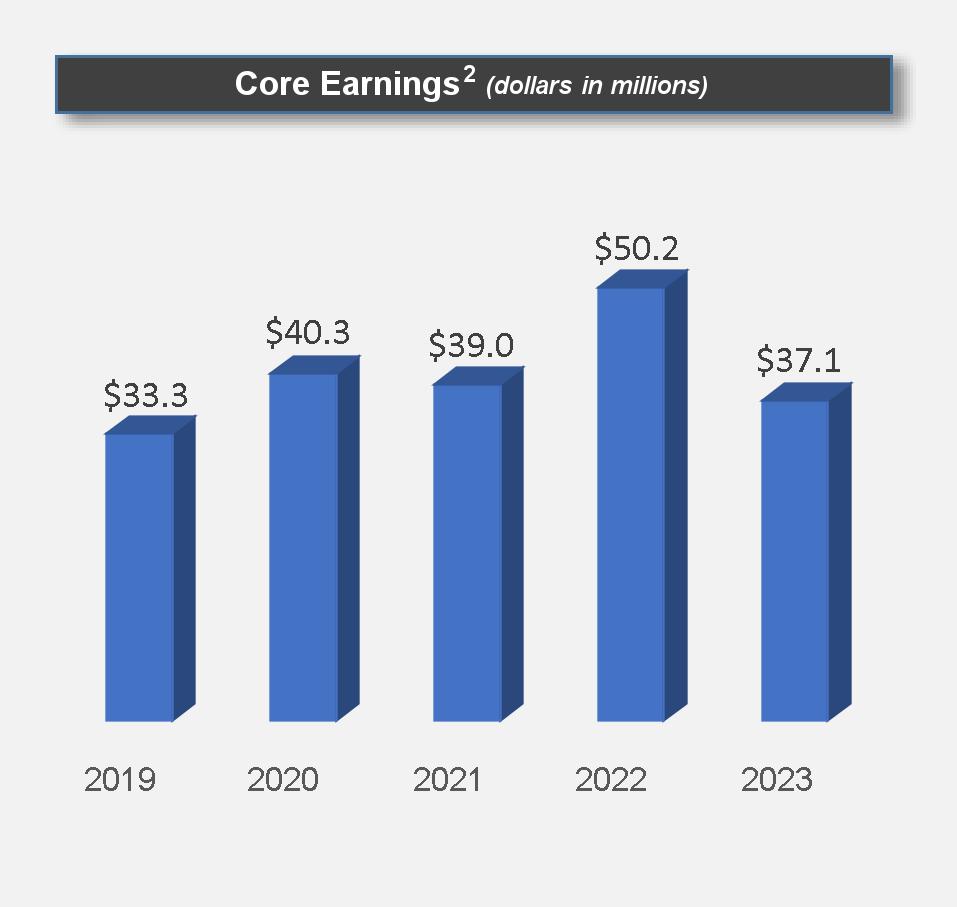
The charts below illustrate our meaningful asset, loan, deposit and net income growth for the last five years:
Although we are devoting substantial resources in furtherance of our longer term expansion strategy, there are no assurances that we will be able to further implement our expansion strategy or that any of the components of our expansion strategy will be successful.
3
We believe the following competitive strengths support our long term growth and expansion strategy:
4
Our Banking Services
Lending Activities. We offer a variety of loans, including commercial lines of credit, working capital loans, commercial real estate-backed loans (including loans secured by owner occupied commercial properties), term loans, equipment financing, acquisition, expansion and development loans, borrowing base loans, real estate construction loans, homebuilder loans, letters of credit and other loan products to small- and medium-sized businesses, real estate developers, manufacturing and industrial companies and other businesses. We also offer various consumer loans to individuals and professionals including residential real estate loans, home equity loans, installment loans, unsecured and secured personal lines of credit, and standby letters of credit. Lending activities originate from the efforts of our bankers, with an emphasis on lending to individuals, professionals, small- to medium-sized businesses and commercial companies located in our market areas. Although all lending involves a degree of risk, we believe that commercial business loans and commercial real estate loans present greater risks than other types of loans in our portfolio. We work to mitigate these risks through conservative underwriting policies and consistent monitoring of credit quality indicators.
We adhere to what we believe are disciplined underwriting standards, but also remain cognizant of the need to serve the credit needs of customers in our primary market areas by offering flexible loan solutions in a responsive and timely manner. We maintain asset quality through an emphasis on local market knowledge, long-term customer relationships, consistent and thorough underwriting for all loans and a conservative credit culture. We also seek to maintain a broadly diversified loan portfolio across customer, product and industry types. Our lending policies do not provide for any loans that are highly speculative, subprime, or that have high loan-to-value ratios. These components, together with active credit management, are the foundation of our credit culture, which we believe is critical to enhancing the long-term value of our organization to our customers, employees, shareholders and communities.
We have a service-driven, relationship-based, business-focused credit culture, rather than a price-driven, transaction-based culture. Substantially all of our loans are made to borrowers located or operating in our primary market areas with whom we have ongoing relationships across various product lines. The limited number of loans secured by properties located in out-of-market areas have been made strictly to borrowers who are well-known to us.
Our credit approval policies provide for various levels of officer and senior management lending authority for new credits and renewals, which are based on position, capability and experience. Loans in excess of an individual officer’s lending limit may be approved by two or more executive officers, with stacking authority, combining their individual lending limits, up to a current maximum of $5.0 million. Loans presenting aggregate lending exposure in excess of $5.0 million are subject to approval of the Bank’s Directors’ Loan Committee, although all loans with aggregate exposure over $1.0 million are provided for review. These limits are reviewed periodically by the Bank’s board of directors. We believe that our credit approval process provides for thorough underwriting and efficient decision making.
Credit risk management involves a partnership between our loan officers and our credit approval, credit administration and collections personnel. We conduct monthly loan meetings, attended by substantially all of our loan officers, related loan production staff and credit administration staff at which asset quality and delinquencies are reviewed. Our evaluation and compensation program for our loan officers includes significant goals, such as the percentages of past due loans and charge-offs to total loans in the officer’s portfolio, that we believe motivate the loan officers to focus on the origination and maintenance of high quality credits consistent with our strategic focus on asset quality.
Deposit Activities. Our deposits serve as the primary funding source for lending, investing and other general banking purposes. We provide a full range of deposit products and services, including a variety of checking and savings accounts, certificates of deposit, money market accounts, debit cards, remote deposit capture, online banking, mobile banking, e-Statements, bank-by-mail and direct deposit services. We also offer business accounts and cash management services, including business checking and savings accounts and treasury management services. We solicit deposits through our relationship-driven team of dedicated and accessible bankers and through community focused marketing. We also seek to cross-sell deposit products at loan origination.
Given the diverse nature of our banking location network and our relationship-driven approach to our customers, we believe our deposit base is comparatively less sensitive to interest rate variations than our competitors. Nevertheless, we attempt to competitively price our deposit products to promote core deposit growth. We believe that our loan pricing encourages deposits from our loan customers.
5
Guaranty Bank & Trust Wealth Management Group. We deliver a comprehensive suite of trust services through Guaranty Bank & Trust Wealth Management Group, a division of our Bank. We provide traditional trustee, custodial and escrow services for institutional and individual accounts, including corporate escrow accounts, serving as custodian for self-directed individual retirement accounts and other retirement accounts. In addition, we offer clients comprehensive investment management solutions whereby we manage all or a portion of a client’s investment portfolio on a discretionary basis. Finally, we provide retirement plan services, such as 401(k) programs, through a national vendor.
Other Products and Services. We offer banking products and services that are attractively priced with a focus on customer convenience and accessibility. We offer a full suite of online banking services including access to account balances, online transfers, online bill payment and electronic delivery of customer statements, as well as ATMs, and banking by telephone, mail and personal appointment. We also offer debit cards, night depository, direct deposit, cashier’s checks, and letters of credit, as well as treasury management services, including wire transfer services, positive pay, remote deposit capture and automated clearinghouse services.
Investments
We manage our investment portfolio primarily for liquidity purposes, with a secondary focus on returns. We separate our portfolio into two categories: (1) short-term investments with maturities less than one year, including federal funds sold; and (2) investments with maturities exceeding one year (the effective duration is approximately 4.09 years as of December 31, 2023), all of which are classified as available for sale and can be used for pledging on public deposits, selling under repurchase agreements and meeting unforeseen liquidity needs. We regularly evaluate the composition of this category as changes occur with respect to the interest rate yield curve. Although we may sell investment securities from time to time to take advantage of changes in interest rate spreads, it is our policy not to sell investment securities unless we can reinvest the proceeds at a similar or higher spread, so as not to take gains to the detriment of future income.
Our Markets
We consider our current market regions to be East Texas, Central Texas, the Dallas/Fort Worth MSA and the Houston MSA. We serve these communities from our corporate headquarters in Addison, Texas, our operational headquarters in Mount Pleasant, Texas and through a network of 15 banking locations within East Texas, seven banking locations in Central Texas, seven banking locations in the Dallas/Fort Worth metroplex and four banking locations in the Houston metroplex. As part of our strategic plan, we intend to further diversify our markets through entry into other large metropolitan markets in Texas and/or continued expansion in our existing newer markets.
Competition
The banking and financial services industry is highly competitive, and we compete with a wide range of financial institutions within our markets, including local, regional and national commercial banks and credit unions. We also compete with mortgage companies, brokerage firms, consumer finance companies, mutual funds, securities firms, insurance companies, third-party payment processors, fintech companies and other financial intermediaries for certain of our products and services. Some of our competitors are not subject to the regulatory restrictions and level of regulatory supervision applicable to us.
Interest rates on loans and deposits, as well as prices on fee-based services, are typically significant competitive factors within banking and financial services industry. Many of our competitors are much larger financial institutions that have greater financial resources than we do and compete aggressively for market share. These competitors attempt to gain market share through their financial product mix, pricing strategies and banking center locations. Other important competitive factors in our industry and markets include office locations and hours, quality of customer service, community reputation, continuity of personnel and services, capacity and willingness to extend credit, and ability to offer sophisticated banking products and services. While we seek to remain competitive with respect to fees charged, interest rates and pricing, we believe that our broad and sophisticated commercial banking product suite, our high-quality customer service culture, our positive reputation and long-standing community relationships will enable us to compete successfully within our markets and enhance our ability to attract and retain customers.
Human Capital Resources
As of December 31, 2023, we employed 488 full-time equivalent persons. We provide extensive training to our employees in an effort to ensure that our customers receive superior customer service. None of our employees are represented by any collective bargaining unit or are parties to a collective bargaining agreement. We consider our relations with our employees to be good. For additional information regarding our human capital resources, please see the Definitive Proxy Statement for our Annual Meeting of Shareholders being held on May 15, 2024, a copy of which will be filed with the SEC.
6
Our Corporate Information
Our principal executive offices are located at 16475 Dallas Parkway, Suite 600, Addison, Texas 75001, and our telephone number is (888) 572-9881. Our website is www.gnty.com. We make available at this address, free of charge, our annual report on Form 10-K, our annual report to shareholders, quarterly reports on Form 10-Q, current reports on Form 8-K and amendments to those reports filed or furnished pursuant to Section 13(a) or 15(d) of the Securities and Exchange Act of 1934, or the Exchange Act, as soon as reasonably practicable after such material is electronically filed with, or furnished to, the Securities and Exchange Commission, or SEC. These documents are also available on the SEC's website at www.sec.gov. The information contained on or accessible from our website does not constitute part of this Annual Report on Form 10-K and is not incorporated by reference herein.
Supervision and Regulation
The U.S. banking industry is highly regulated under federal and state law. Consequently, our growth and earnings performance will be affected not only by management decisions and general and local economic conditions, but also by the statutes administered by, and the regulations and policies of, various governmental regulatory authorities. These authorities include the Board of Governors of the Federal Reserve (“Federal Reserve”), Federal Deposit Insurance Corporation ("FDIC"), Consumer Financial Protection Bureau ("CFPB"), Office of the Comptroller of the Currency ("OCC), Internal Revenue Service ("IRS") and state taxing authorities. The effect of these statutes, regulations and policies, and any changes to such statutes, regulations and policies, can be significant and cannot be predicted.
The material statutory and regulatory requirements that are applicable to the Company and its subsidiaries are summarized below. The description below is not intended to summarize all laws and regulations applicable to the Company and its subsidiaries, and is based upon the statutes, regulations, policies, interpretive letters and other written guidance that are in effect as of the date of this Annual Report on Form 10-K.
Guaranty Bancshares, Inc.
As a bank holding company, we are subject to regulation under the Bank Holding Company Act of 1956, or the BHC Act, and to supervision, examination and enforcement by the Federal Reserve. The BHC Act and other federal laws subject bank holding companies to particular restrictions on the types of activities in which they may engage, and to a range of supervisory requirements and activities, including regulatory enforcement actions for violations of laws and regulations. The Federal Reserve’s jurisdiction also extends to any company that we directly or indirectly control, such as any nonbank subsidiaries and other companies in which we own a controlling investment.
Financial Services Industry Reform. In 2010, the Dodd-Frank Wall Street Reform and Consumer Protection Act, or Dodd-Frank Act, was enacted. The Dodd-Frank Act broadly affected the financial services industry by implementing changes to the financial regulatory landscape aimed at strengthening the sound operation of the financial services sector.
In addition, the Dodd-Frank Act addressed many investor protection, corporate governance and executive compensation matters affecting publicly-traded companies. However, the Jumpstart our Business Startups Act of 2012, or JOBS Act, provided certain exceptions to these requirements for so long as a publicly-traded company qualifies as an emerging growth company. In 2018, the Economic Growth, Regulatory Relief, and Consumer Protection Act, or EGRRCPA, revised certain aspects of the Dodd-Frank Act. Among other things, EGRRCPA exempts banks with less than $10 billion in assets (and total trading assets and trading liabilities of 5% or less of total assets) from Volcker Rule requirements relating to proprietary trading and clarifies definitions pertaining to HVCRE, which require higher capital allocations, so that only loans with increased risk are subject to higher risk weightings. Further changes effected by the passage of EGRRCPA are discussed below.
Revised Rules on Regulatory Capital. Regulatory capital rules pursuant to the Basel III requirements, released in July 2013 and effective January 1, 2015, implemented higher minimum capital requirements for bank holding companies and banks. These rules include a new common equity Tier 1, or CET1, capital requirement and establish criteria that instruments must meet to be considered common equity Tier 1 capital, additional Tier 1 capital or Tier 2 capital. The revised capital rules require banks and bank holding companies to maintain a minimum CET1 capital ratio of 4.5% of risk-based assets, a total Tier 1 capital ratio of 6.0% of risk-based assets, a total capital ratio of 8.0% of risk-based assets and a leverage ratio of 4.0% of average assets. In addition, the revised capital rules require banks and bank holding companies to maintain a 2.5% "capital conservation buffer" above these minimum risk-based capital requirements. This buffer will help to ensure that banking organizations conserve capital when it is most needed, allowing them to better weather periods of economic stress.
7
The buffer is measured relative to risk-weighted assets. An institution would be subject to limitations on certain activities including payment of dividends, share repurchases and discretionary bonuses to executive officers if its capital level is below the buffered ratio. Including the buffer, the rules require banks and bank holding companies to maintain a minimum CET1 capital ratio of 7.0%, Tier 1 capital ratio of 8.5% and total capital ratio of 10.5%.
The capital rules also require banks to maintain a CET1 capital ratio of 6.5%, a total Tier 1 capital ratio of 8.0%, a total capital ratio of 10.0% and a leverage ratio of 5.0% to be deemed “well capitalized” for purposes of certain rules and prompt corrective action requirements.
The EGRRCPA directed the federal banking agencies to develop a new, optional capital ratio for use by eligible community banks. Effective January 1, 2020, certain banks and their holding companies that satisfy the definition of a qualifying community banking organization, or QCBO, have the option to elect out of complying with the Basel III Capital Rules and to instead comply with the community bank leverage ratio, or CBLR, of 9%. QCBOs whose leverage ratios fall between 8% and 9% have a two-quarter grace period to comply with the 9% requirement.
A QCBO is defined as a bank, a savings association, a bank holding company or a savings and loan holding company with:
A QCBO may elect out of complying with the Basel III Capital Rules if, at the time of the election, the QCBO has a CBLR above 9%. The numerator of the CBLR is referred to as ‘‘CBLR tangible equity’’ and is calculated as the QCBO’s total capital as reported in compliance with Call Report and FR Y-9C instructions, or Reporting Instructions (prior to including non-controlling interests in consolidated subsidiaries) less:
The denominator of the CBLR is the QCBO’s average assets, calculated in accordance with reporting instructions and less intangible assets and deferred tax assets deducted from CBLR tangible equity. At this time, the Company and the Bank have not elected to comply with the community bank leverage ratio framework, but the Company and the Bank will continue to consider making such election in the future.
Imposition of Liability for Undercapitalized Subsidiaries. Bank regulators are required to take prompt corrective action to resolve problems associated with insured depository institutions whose capital declines below certain levels. In the event an institution becomes undercapitalized, it must submit a capital restoration plan. The capital restoration plan will not be accepted by the regulators unless each company having control of the undercapitalized institution guarantees the subsidiary’s compliance with the capital restoration plan up to a certain specified amount. Any such guarantee from a depository institution’s holding company is entitled to a priority of payment in bankruptcy.
The aggregate liability of the holding company of an undercapitalized bank is limited to the lesser of 5.0% of the institution’s assets at the time it became undercapitalized or the amount necessary to cause the institution to be adequately capitalized. The bank regulators have greater power in situations where an institution becomes significantly or critically undercapitalized or fails to submit a capital restoration plan. For example, a bank holding company controlling such an institution can be required to obtain prior Federal Reserve approval of proposed dividends, or might be required to consent to a consolidation or to divest the troubled institution or other affiliates.
8
Acquisitions by Bank Holding Companies. The BHC Act requires every bank holding company to obtain the prior approval of the Federal Reserve before it acquires all or substantially all of the assets of any bank, or ownership or control of any voting shares of any bank or bank holding company if after such acquisition it would own or control, directly or indirectly, more than 5.0% of the voting shares of such bank or bank holding company. In approving bank or bank holding company acquisitions by bank holding companies, the Federal Reserve is required to consider, among other things, the effect of the acquisition on competition, the financial condition, managerial resources and future prospects of the bank holding company and the banks concerned, the convenience and needs of the communities to be served (including the record of performance under the CRA), the effectiveness of the applicant in combating money laundering activities and the extent to which the proposed acquisition would result in greater or more concentrated risks to the stability of the U.S. banking or financial system. Our ability to make future acquisitions will depend on our ability to obtain approval for such acquisitions from the Federal Reserve. The Federal Reserve could deny our application based on the above criteria or other considerations. For example, we could be required to sell banking centers as a condition to receiving regulatory approval, which condition may not be acceptable to us or, if acceptable to us, may reduce the benefit of a proposed acquisition.
Control Acquisitions. Federal and state laws, including the BHC Act and the Change in Bank Control Act, or CBCA, impose additional prior notice or approval requirements and ongoing regulatory requirements on any investor that seeks to acquire direct or indirect “control” of an FDIC-insured depository institution or bank holding company. Whether an investor “controls” a depository institution is based on all of the facts and circumstances surrounding the investment. As a general matter, an investor is deemed to control a depository institution or other company if the investor owns or controls 25.0% or more of any class of voting securities. Subject to rebuttal, an investor is presumed to control a depository institution or other company if the investor owns or controls 10.0% or more of any class of voting securities and either the depository institution or company is a public company or no other person will hold a greater percentage of that class of voting securities after the acquisition. If an investor’s ownership of our voting securities were to exceed certain thresholds, the investor could be deemed to “control” us for regulatory purposes, which could subject such investor to regulatory filings or other regulatory consequences. The requirements of the BHC Act and the CBCA could limit our access to capital and could limit parties who could acquire shares of our common stock.
Regulatory Restrictions on Dividends; Source of Strength. Guaranty Bancshares, Inc. is regarded as a legal entity separate and distinct from Guaranty Bank & Trust. The principal source of the Company’s revenues is dividends received from Guaranty Bank & Trust. Federal law currently imposes limitations upon certain capital distributions by national banks, such as certain cash dividends, payments to repurchase or otherwise acquire its shares, payments to shareholders of another institution in a cash-out merger and other distributions charged against capital. The Federal Reserve and OCC regulate all capital distributions by the Bank directly or indirectly to the Company, including dividend payments. The Federal Reserve has issued a policy statement that provides that a bank holding company should not pay dividends unless (1) its net income over the last four quarters (net of dividends paid) has been sufficient to fully fund the dividends, (2) the prospective rate of earnings retention appears to be consistent with the capital needs, asset quality and overall financial condition of the bank holding company and its subsidiaries and (3) the bank holding company will continue to meet minimum required capital adequacy ratios. Accordingly, we should not pay cash dividends that exceed our net income in any year or that can only be funded in ways that weaken our financial strength, including by borrowing money to pay dividends.
Under Federal Reserve policy, bank holding companies have historically been required to act as a source of financial and managerial strength to each of their banking subsidiaries, and the Dodd-Frank Act codified this policy as a statutory requirement. Under this requirement, the Company is expected to commit resources to support Guaranty Bank & Trust, including at times when we may not be in a financial position to provide such resources. Any capital loans by a bank holding company to any of its subsidiary banks are subordinate in right of payment to deposits and to certain other indebtedness of such subsidiary banks. As discussed below, a bank holding company, in certain circumstances, could be required to guarantee the capital restoration plan of an undercapitalized banking subsidiary. If the capital of Guaranty Bank & Trust were to become impaired, the Federal Reserve could assess the Company for the deficiency. If the Company failed to pay the assessment within three months, the Federal Reserve could order the sale of the Company’s stock in Guaranty Bank & Trust to cover the deficiency.
In the event of a bank holding company’s bankruptcy under Chapter 11 of the U.S. Bankruptcy Code, the trustee will be deemed to have assumed and will be required to cure immediately any deficit under any commitment by the debtor holding company to any of the federal banking agencies to maintain the capital of an insured depository institution, and any claim for breach of such obligation will generally have priority over most other unsecured claims.
Scope of Permissible Activities. Under the BHC Act, the Company is prohibited from acquiring a direct or indirect interest in or control of more than 5.0% of the voting shares of any company that is not a bank or financial holding company and from engaging directly or indirectly in activities other than those of banking, managing or controlling banks or furnishing services to or performing services for its subsidiary banks, except that the Company may engage in, directly or indirectly, and may own shares of companies engaged in certain activities found by the Federal Reserve to be so closely related to banking or managing and controlling banks as to be a proper incident thereto.
9
These activities include, among others, operating a mortgage, finance, credit card or factoring company; performing certain data processing operations; providing investment and financial advice; acting as an insurance agent for certain types of credit-related insurance; leasing personal property on a full-payout, nonoperating basis; and providing certain stock brokerage and investment advisory services. In approving acquisitions or the addition of activities, the Federal Reserve considers, among other things, whether the acquisition or the additional activities can reasonably be expected to produce benefits to the public, such as greater convenience, increased competition, or gains in efficiency, that outweigh such possible adverse effects as undue concentration of resources, decreased or unfair competition, conflicts of interest or unsound banking practices.
Notwithstanding the foregoing, the Gramm-Leach-Bliley Act, also known as the Financial Services Modernization Act of 1999, effective March 11, 2000, or the GLB Act, amended the BHC Act and eliminated the barriers to affiliations among banks, securities firms, insurance companies and other financial service providers. The GLB Act permitted bank holding companies to become financial holding companies and thereby affiliate with securities firms and insurance companies and engage in other activities that are financial in nature. The GLB Act defines “financial in nature” to include, among other things, securities underwriting, dealing and market making; sponsoring mutual funds and investment companies; insurance underwriting and agency; merchant banking activities; and activities that the Federal Reserve has determined to be closely related to banking. No regulatory approval will be required for a financial holding company to acquire a company, other than a bank or savings association, engaged in activities that are financial in nature or incidental to activities that are financial in nature, as determined by the Federal Reserve. We currently have no plans to make a financial holding company election, although we may make a financial holding company election in the future if we desire to engage in any lines of business that are impermissible for bank holding companies but permissible for financial holding companies.
Safe and Sound Banking Practices. Bank holding companies are not permitted to engage in unsafe and unsound banking practices. The Federal Reserve’s Regulation Y, for example, generally requires a bank holding company to provide the Federal Reserve with prior notice of any redemption or repurchase of its own equity securities, if the consideration to be paid, together with the consideration paid for any repurchases or redemptions in the preceding year, is equal to 10.0% or more of the bank holding company’s consolidated net worth. The Federal Reserve may oppose the transaction if it believes that the transaction would constitute an unsafe or unsound practice or would violate any law or regulation. In certain circumstances, the Federal Reserve could take the position that paying a dividend would constitute an unsafe or unsound banking practice.
The Federal Reserve has broad authority to prohibit activities of bank holding companies and their nonbanking subsidiaries which represent unsafe and unsound banking practices, result in breaches of fiduciary duty or which constitute violations of laws or regulations, and can assess civil money penalties or impose enforcement action for such activities. The penalties can be in excess of $2,200,000 for each day the activity continues.
Anti-tying Restrictions. Bank holding companies and their affiliates are prohibited from tying the provision of certain services, such as extensions of credit, to other nonbanking services offered by a bank holding company or its affiliates.
Guaranty Bank & Trust, N.A.
The Bank is subject to various requirements and restrictions under the laws of the United States, and to regulation, supervision and examination by the OCC. The Bank is also an insured depository institution and, therefore, subject to regulation by the FDIC, although the OCC is the Bank’s primary federal regulator. The OCC and the FDIC have the power to enforce compliance with applicable banking statutes and regulations. Such requirements and restrictions include requirements to maintain reserves against deposits, restrictions on the nature and amount of loans that may be made and the interest that may be charged thereon and restrictions relating to investments and other activities of the Bank.
Capital Adequacy Requirements. The OCC monitors the capital adequacy of the Bank by using a combination of risk-based guidelines and leverage ratios. The OCC considers the Bank’s capital levels when taking action on various types of applications and when conducting supervisory activities related to the safety and soundness of the Bank and the banking system. Under the revised capital rules which became effective on January 1, 2015, national banks are required to maintain four minimum capital standards: (1) a Tier 1 capital to adjusted total assets ratio, or “leverage capital ratio,” of at least 4.0%, (2) a Tier 1 capital to risk-weighted assets ratio, or “Tier 1 risk-based capital ratio,” of at least 6.0%, (3) a total risk-based capital (Tier 1 plus Tier 2) to risk-weighted assets ratio, or “total risk-based capital ratio,” of at least 8.0%, and (4) a CET1 capital ratio of 4.5%. In addition, the OCC’s prompt corrective action standards discussed below, in effect, increase the minimum regulatory capital ratios for banking organizations.
10
These capital requirements are minimum requirements. Higher capital levels may be required if warranted by the particular circumstances or risk profiles of individual institutions, or if required by the banking regulators due to the economic conditions impacting our market. For example, OCC regulations provide that higher capital may be required to take adequate account of, among other things, interest rate risk and the risks posed by concentrations of credit, nontraditional activities or securities trading activities.
Corrective Measures for Capital Deficiencies. The federal banking regulators are required by the Federal Deposit Insurance Act, or FDI Act, to take “prompt corrective action” with respect to capital-deficient institutions that are FDIC-insured. Agency regulations define, for each capital category, the levels at which institutions are “well capitalized,” “adequately capitalized,” “undercapitalized,” “significantly undercapitalized” and “critically undercapitalized.” Under the revised capital rules, which became effective on January 1, 2015, a “well capitalized” bank has a total risk-based capital ratio of 10.0% or higher, a Tier 1 risk-based capital ratio of 8.0% or higher, a leverage ratio of 5.0% or higher, a CET1 capital ratio of 6.5% or higher, and is not subject to any written agreement, order or directive requiring it to maintain a specific capital level for any capital measure. An “adequately capitalized” bank has a total risk-based capital ratio of 8.0% or higher, a Tier 1 risk-based capital ratio of 6.0% or higher, a leverage ratio of 4.0% or higher (3.0% or higher if the bank was rated a composite 1 in its most recent examination report and is not experiencing significant growth), a CET1 capital ratio of 4.5% or higher, and does not meet the criteria for a well-capitalized bank. A bank is “undercapitalized” if it fails to meet any one of the ratios required to be adequately capitalized.
In addition to requiring undercapitalized institutions to submit a capital restoration plan, agency regulations contain broad restrictions on certain activities of undercapitalized institutions including asset growth, acquisitions, branch establishment and expansion into new lines of business. With certain exceptions, an insured depository institution is prohibited from making capital distributions, including dividends, and is prohibited from paying management fees to control persons if the institution would be undercapitalized after any such distribution or payment.
As a national bank’s capital decreases, the OCC’s enforcement powers become more severe. A significantly undercapitalized national bank is subject to mandated capital raising activities, restrictions on interest rates paid and transactions with affiliates, removal of management and other restrictions. The OCC has very limited discretion in dealing with a critically undercapitalized national bank and is virtually required to appoint a receiver or conservator.
Banks with risk-based capital and leverage ratios below the required minimums may also be subject to certain administrative actions, including the termination of deposit insurance upon notice and hearing, or a temporary suspension of insurance without a hearing in the event the institution has no tangible capital.
Branching. National banks are required by the National Bank Act to adhere to branching laws applicable to state banks in the states in which they are located. Under the Dodd-Frank Act, de novo interstate branching by national banks is permitted if, under the laws of the state where the branch is to be located, a state bank chartered in that state would have been permitted to establish a branch. Under current Texas law, banks are permitted to establish branch offices throughout Texas with prior regulatory approval. In addition, with prior regulatory approval, banks are permitted to acquire branches of existing banks located in Texas. Banks located in Texas may also branch across state lines by merging with banks or by purchasing a branch of another bank in other states if allowed by the applicable states’ laws.
Restrictions on Transactions with Affiliates and Insiders. Transactions between the Bank and its nonbanking subsidiaries and/or affiliates, including the Company, are subject to Section 23A and 23B of the Federal Reserve Act and Regulation.
In general, Section 23A of the Federal Reserve Act imposes limits on the amount of such transactions, and also requires certain levels of collateral for loans to affiliated parties. It also limits the amount of advances to third parties which are collateralized by the securities or obligations of the Company or its subsidiaries. Covered transactions with any single affiliate may not exceed 10.0% of the capital stock and surplus of the Bank, and covered transactions with all affiliates may not exceed, in the aggregate, 20.0% of the Bank’s capital and surplus. For a bank, capital stock and surplus refers to the bank’s Tier 1 and Tier 2 capital, as calculated under the risk-based capital guidelines, plus the balance of the allowance for credit losses excluded from Tier 2 capital. The Bank’s transactions with all of its affiliates in the aggregate are limited to 20.0% of the foregoing capital. “Covered transactions” are defined by statute to include a loan or extension of credit to an affiliate, as well as a purchase of securities issued by an affiliate, a purchase of assets (unless otherwise exempted by the Federal Reserve) from the affiliate, the acceptance of securities issued by the affiliate as collateral for a loan, and the issuance of a guarantee, acceptance or letter of credit on behalf of an affiliate. In addition, in connection with covered transactions that are extensions of credit, the Bank may be required to hold collateral to provide added security to the Bank, and the types of permissible collateral may be limited.
11
The Dodd-Frank Act generally enhances the restrictions on transactions with affiliates, including an expansion of what types of transactions are covered transactions to include credit exposures related to derivatives, repurchase agreement and securities lending arrangements and an increase in the amount of time for which collateral requirements regarding covered transactions must be satisfied.
Affiliate transactions are also subject to Section 23B of the Federal Reserve Act which generally requires that certain transactions between the Bank and its affiliates be on terms substantially the same, or at least as favorable to the Bank, as those prevailing at the time for comparable transactions with or involving other nonaffiliated persons. The Federal Reserve has also issued Regulation W which codifies prior regulations under Sections 23A and 23B of the Federal Reserve Act and interpretive guidance with respect to affiliate transactions.
The restrictions on loans to directors, executive officers, principal shareholders and their related interests (collectively referred to herein as “insiders”) contained in Section 22(h) of the Federal Reserve Act and in Regulation O promulgated by the Federal Reserve apply to all insured institutions and their subsidiaries and bank holding companies. These restrictions include limits on loans to one borrower and conditions that must be met before such a loan can be made. There is also an aggregate limitation on all loans to insiders and their related interests. Generally, the aggregate of these loans cannot exceed the institution’s total unimpaired capital and surplus, although a bank’s regulators may determine that a lesser amount is appropriate. Loans to senior executive officers of a bank are even further restricted. Insiders are subject to enforcement actions for accepting loans in violation of applicable restrictions.
Restrictions on Distribution of Bank Dividends and Assets. Dividends paid by the Bank have provided a substantial part of the Company’s operating funds and for the foreseeable future it is anticipated that dividends paid by the Bank to the Company will continue to be our principal source of operating funds. Earnings and capital adequacy requirements serve to limit the amount of dividends that may be paid by the Bank. In general terms, federal law provides that the Bank’s board of directors may, from time to time and as it deems expedient, declare a dividend out of its net profits. Generally, the total of all dividends declared in a year shall not, unless approved by the OCC, exceed the net profits of that year combined with its net profits of the past two years. At December 31, 2023, the Bank had $56.5 million available for payment of dividends.
In addition, under the Federal Deposit Insurance Corporation Improvement Act of 1991, or FDICIA, the Bank may not pay any dividend if it is undercapitalized or the payment of the dividend would cause it to become undercapitalized. The OCC may further restrict the payment of dividends by requiring that the Bank maintain a higher level of capital than otherwise required for it to be adequately capitalized for regulatory purposes. Moreover, if, in the opinion of the OCC, the Bank is engaged in an unsound practice (which could include the payment of dividends), it may require, generally after notice and hearing, that the Bank cease such practice. The OCC has indicated that paying dividends that deplete a depository institution’s capital base to an inadequate level would be an unsafe banking practice. The OCC has also issued policy statements providing that insured depository institutions generally should pay dividends only out of current operating earnings.
Further, in the event of a liquidation or other resolution of an insured depository institution, the claims of depositors and other general or subordinated creditors are entitled to a priority of payment over the claims of holders of any obligation of the institution to its shareholders, including any depository institution holding company (such as us) or any shareholder or creditor thereof.
Incentive Compensation Guidance. The federal banking agencies have issued comprehensive guidance on incentive compensation policies intended to ensure that the incentive compensation policies of banking organizations do not undermine the safety and soundness of those organizations by encouraging excessive risk-taking. The incentive compensation guidance sets expectations for banking organizations concerning their incentive compensation arrangements and related risk-management, control and governance processes. The incentive compensation guidance, which covers all employees that have the ability to materially affect the risk profile of an organization, either individually or as part of a group, is based upon three primary principles: (1) balanced risk-taking incentives, (2) compatibility with effective controls and risk management and (3) strong corporate governance. Any deficiencies in compensation practices that are identified may be incorporated into the organization’s supervisory ratings, which can affect its ability to make acquisitions or take other actions. In addition, under the incentive compensation guidance, a banking organization’s federal supervisor may initiate enforcement action if the organization’s incentive compensation arrangements pose a risk to the safety and soundness of the organization. Further, a provision of the Basel III capital standards described above would limit discretionary bonus payments to bank executives if the institution’s regulatory capital ratios fail to exceed certain thresholds. The scope and content of the U.S. banking regulators’ policies on executive compensation are continuing to develop and are likely to continue evolving in the future.
12
Audit Reports. For insured institutions with total assets of $1.0 billion or more, requirements include financial statements prepared in accordance with GAAP, management’s certifications signed by our and the Bank’s chief executive officer and chief accounting or financial officer concerning management’s responsibility for the financial statements, and an attestation by the auditors regarding the Bank’s internal controls must be submitted. For institutions with total assets of more than $3.0 billion, independent auditors may be required to review quarterly financial statements. FDICIA requires that the Bank have an independent audit committee, consisting of outside directors who are independent of management of the Bank. The committees of such institutions must include members with experience in banking or financial management, must have access to outside counsel and must not include representatives of large customers. The Bank’s audit committee consists entirely of independent directors.
Deposit Insurance Assessments. The FDIC insures the deposits of federally insured banks up to prescribed statutory limits for each depositor through the Deposit Insurance Fund and safeguards the safety and soundness of the banking and thrift industries. The maximum amount of deposit insurance for banks and savings institutions is $250,000 per depositor. The amount of FDIC assessments paid by each insured depository institution is based on its relative risk of default as measured by regulatory capital ratios and other supervisory factors and is calculated based on an institution’s average consolidated total assets minus average tangible equity.
We are generally unable to control the amount of premiums that we are required to pay for FDIC insurance. At least semi-annually, the FDIC will update its loss and income projections for the Deposit Insurance Fund and, if needed, will increase or decrease assessment rates, following notice-and-comment rulemaking, if required. If there are additional bank or financial institution failures or if the FDIC otherwise determines to increase assessment rates, the Bank may be required to pay higher FDIC insurance premiums. Any future increases in FDIC insurance premiums may have a material and adverse effect on our earnings.
Financial Modernization. Under the GLB Act, banks may establish financial subsidiaries and engage, subject to limitations on investment, in activities that are financial in nature, other than insurance underwriting as principal, insurance company portfolio investment, real estate development, real estate investment, annuity issuance and merchant banking activities. To do so, a bank must be well capitalized, well managed and have a CRA rating from its primary federal regulator of satisfactory or better. Subsidiary banks of financial holding companies or banks with financial subsidiaries must remain well capitalized and well managed in order to continue to engage in activities that are financial in nature without regulatory actions or restrictions. Such actions or restrictions could include divestiture of the “financial in nature” subsidiary or subsidiaries. In addition, a financial holding company or a bank may not acquire a company that is engaged in activities that are financial in nature unless each of the subsidiary banks of the financial holding company or the bank has a CRA rating of satisfactory of better. Neither we nor the Bank maintains a financial subsidiary.
Brokered Deposit Restrictions. Insured depository institutions that are categorized as adequately capitalized institutions under the FDI Act and corresponding federal regulations cannot accept, renew or roll over brokered deposits, without receiving a waiver from the FDIC, and are subject to restrictions on the interest rates that can be paid on any deposits. The EGRRCPA exempted reciprocal deposits from the definition of brokered deposits. Insured depository institutions that are categorized as undercapitalized capitalized institutions under the FDI Act and corresponding federal regulations may not accept, renew, or roll over brokered deposits. The Bank is not currently subject to such restrictions.
Concentrated Commercial Real Estate Lending Regulations. The federal banking regulatory agencies have promulgated guidance governing financial institutions with concentrations in commercial real estate lending. The guidance provides that a bank has a concentration in commercial real estate lending if (1) total reported loans for acquisition, construction, land development, and other land represent 100.0% or more of total capital or (2) total reported loans secured by multifamily and nonfarm residential properties and loans for acquisition, construction, land development, and other land represent 300.0% or more of total capital and the bank’s commercial real estate loan portfolio has increased 50% or more during the prior 36 months. Owner occupied loans are excluded from this second category. If a concentration is present, management must employ heightened risk management practices that address, among other things, Board and management oversight and strategic planning, portfolio management, development of underwriting standards, risk assessment and monitoring through market analysis and stress testing, and maintenance of increased capital levels as needed to support the level of commercial real estate lending. We are currently operating with real estate loan portfolios within such percentage levels.
Community Reinvestment Act. The CRA and the regulations issued thereunder are intended to encourage banks to help meet the credit needs of their entire assessment area, including low and moderate income neighborhoods, consistent with the safe and sound operations of such banks. These regulations also provide for regulatory assessment of a bank’s record in meeting the needs of its assessment area when considering applications to establish branches, merger applications and applications to acquire the assets and assume the liabilities of another bank.
13
The Financial Institution Reform Recovery and Enforcement Act, or FIRREA, requires federal banking agencies to make public a rating of a bank’s performance under the CRA. In the case of a bank holding company, the CRA performance record of the banks involved in the transaction are reviewed in connection with the filing of an application to acquire ownership or control of shares or assets of a bank or to merge with any other bank holding company. An unsatisfactory CRA record could substantially delay approval or result in denial of an application. The Bank received a “satisfactory” rating in its most recent CRA examination.
Consumer Laws and Regulations. The Bank is subject to numerous laws and regulations intended to protect consumers in transactions with the Bank. These laws include, among others, laws regarding unfair, deceptive and abusive acts and practices, usury laws, and other federal consumer protection statutes. These federal laws include the Electronic Fund Transfer Act, the Equal Credit Opportunity Act, the Fair Credit Reporting Act, the Fair Debt Collection Practices Act, the Real Estate Procedures Act of 1974, the S.A.F.E. Mortgage Licensing Act of 2008, the Truth in Lending Act and the Truth in Savings Act, among others. Many states and local jurisdictions have consumer protection laws analogous, and in addition, to those enacted under federal law. These laws and regulations mandate certain disclosure requirements and regulate the manner in which financial institutions must deal with customers when taking deposits, making loans and conducting other types of transactions. Failure to comply with these laws and regulations could give rise to regulatory sanctions, customer rescission and registration rights, action by state and local attorneys general and civil or criminal liability.
In addition, the Dodd-Frank Act created the CFPB. The CFPB has broad authority to regulate the offering and provision of consumer financial products. The Dodd-Frank Act gives the CFPB authority to supervise and examine depository institutions with more than $10.0 billion in assets for compliance with these federal consumer laws. The authority to supervise and examine depository institutions with $10.0 billion or less in assets for compliance with federal consumer laws remains largely with those institutions’ primary regulators. However, the CFPB may participate in examinations of these smaller institutions on a “sampling basis” and may refer potential enforcement actions against such institutions to their primary regulators. Accordingly, the CFPB may participate in examinations of the Bank, which currently has assets of less than $10.0 billion, and could supervise and examine our other direct or indirect subsidiaries that offer consumer financial products or services. The CFPB also has supervisory and examination authority over certain nonbank institutions that offer consumer financial products. The Dodd-Frank Act identifies a number of covered nonbank institutions, and also authorizes the CFPB to identify additional institutions that will be subject to its jurisdiction. In addition, the Dodd-Frank Act permits states to adopt consumer protection laws and regulations that are stricter than those regulations promulgated by the CFPB, and state attorneys general are permitted to enforce consumer protection rules adopted by the CFPB against certain institutions.
Mortgage Lending Rules. The Dodd-Frank Act authorized the CFPB to establish certain minimum standards for the origination of residential mortgages, including a determination of the borrower’s ability to repay. Under the Dodd-Frank Act and related rules, financial institutions may not make a residential mortgage loan unless they make a “reasonable and good faith determination” that the consumer has a “reasonable ability” to repay the loan. The Dodd-Frank Act allows borrowers to raise certain defenses to foreclosure but provides a full or partial safe harbor from such defenses for loans that are “qualified mortgages.” The rules define “qualified mortgages,” imposing both underwriting standards - for example, a borrower’s debt-to-income ratio may not exceed 43.0% - and limits on the terms of their loans. Certain loans, including interest-only loans and negative amortization loans, cannot be qualified mortgages. EGRRCPA, among other matters, expanded the definition of qualified mortgages for banks with less than $10 billion in assets.
Anti-Money Laundering and OFAC. Under federal law, including the Bank Secrecy Act, or BSA, the USA PATRIOT Act of 2001 and the Anti-Money Laundering Act of 2020, certain financial institutions, such as the Bank, must maintain anti-money laundering programs that include established internal policies, procedures and controls; a designated BSA officer; an ongoing employee training program; and testing of the program by an independent audit function. Financial institutions are also prohibited from entering into specified financial transactions and account relationships and must meet enhanced standards for due diligence and customer identification especially in their dealings with foreign financial institutions and foreign customers. Financial institutions must take reasonable steps to conduct enhanced scrutiny of account relationships to guard against money laundering and to report any suspicious transactions, and law enforcement authorities have been granted increased access to financial information maintained by financial institutions. The Financial Crimes Enforcement Network, or FinCEN, has issued rules that clarify and strengthen the due diligence requirements for banks with regard to their customers.
The Office of Foreign Assets Control, or OFAC, administers laws and Executive Orders that prohibit U.S. entities from engaging in transactions with certain prohibited parties. OFAC publishes lists of persons and organizations suspected of aiding, harboring or engaging in terrorist acts, known as Specially Designated Nationals and Blocked Persons.
14
Generally, if a bank identifies a transaction, account or wire transfer relating to a person or entity on an OFAC list, it must freeze the account or block the transaction, file a suspicious activity report and notify the appropriate authorities.
Bank regulators routinely examine institutions for compliance with these obligations and they must consider an institution’s compliance in connection with the regulatory review of applications, including applications for bank mergers and acquisitions. Failure of a financial institution to maintain and implement adequate programs to combat money laundering and terrorist financing and comply with OFAC sanctions, or to comply with relevant laws and regulations, could have serious legal, reputational and financial consequences for the institution.
Privacy. The federal banking regulators have adopted rules that limit the ability of banks and other financial institutions to disclose non-public information about consumers to non-affiliated third parties. These limitations require disclosure of privacy policies to consumers and, in some circumstances, allow consumers to prevent disclosure of certain personal information to a non-affiliated third party. These regulations affect how consumer information is transmitted through financial services companies and conveyed to outside vendors. In addition, consumers may also prevent disclosure of certain information among affiliated companies that is assembled or used to determine eligibility for a product or service, such as that shown on consumer credit reports and asset and income information from applications. Consumers also have the option to direct banks and other financial institutions not to share information about transactions and experiences with affiliated companies for the purpose of marketing products or services. In addition to applicable federal privacy regulations, the Bank is subject to certain state privacy laws.
Federal Home Loan Bank System. The FHLB system, of which the Bank is a member, consists of 12 regional FHLBs governed and regulated by the Federal Housing Finance Board, or FHFB. The FHLBs serve as reserve or credit facilities for member institutions within their assigned regions. The reserves are funded primarily from proceeds derived from the sale of consolidated obligations of the FHLB system. The FHLBs make loans (i.e., advances) to members in accordance with policies and procedures established by the FHLB and the Boards of directors of each regional FHLB.
As a system member, according to currently existing policies and procedures, the Bank is entitled to borrow from the Dallas FHLB provided it posts acceptable collateral. The Bank is also required to own a certain amount of capital stock in the FHLB. The Bank is in compliance with the stock ownership rules with respect to such advances, commitments and letters of credit and collateral requirements with respect to home mortgage loans and similar obligations. All loans, advances and other extensions of credit made by the FHLB to the Bank are secured by a portion of the respective mortgage loan portfolio, certain other investments and the capital stock of the FHLB held by the Bank.
Enforcement Powers. The federal banking agencies, including our primary federal regulator, the OCC, have broad enforcement powers, including the power to terminate deposit insurance, impose substantial fines and other civil and criminal penalties, and appoint a conservator or receiver. Failure to comply with applicable laws, regulations and supervisory agreements, breaches of fiduciary duty or the maintenance of unsafe and unsound conditions or practices could subject the Company or the Bank and their subsidiaries, as well as their respective officers, directors, and other institution-affiliated parties, to administrative sanctions and potentially substantial civil money penalties. For example, the regulatory authorities may appoint the FDIC as conservator or receiver for a banking institution (or the FDIC may appoint itself, under certain circumstances) if any one or more of a number of circumstances exist, including, without limitation, the fact that the banking institution is undercapitalized and has no reasonable prospect of becoming adequately capitalized, fails to become adequately capitalized when required to do so, fails to submit a timely and acceptable capital restoration plan or materially fails to implement an accepted capital restoration plan.
Effect of Governmental Monetary Policies
The commercial banking business is affected not only by general economic conditions but also by U.S. fiscal policy and the monetary policies of the Federal Reserve. Some of the instruments of monetary policy available to the Federal Reserve include changes in the discount rate on member bank borrowings, the fluctuating availability of borrowings at the “discount window,” open market operations, the imposition of and changes in reserve requirements against member banks’ deposits and certain borrowings by banks and their affiliates and assets of foreign branches. These policies influence to a significant extent the overall growth of bank loans, investments, and deposits and the interest rates charged on loans or paid on deposits. We cannot predict the nature of future fiscal and monetary policies or the effect of these policies on our operations and activities, financial condition, results of operations, growth plans or future prospects.
15
Impact of Current Laws and Regulations
The cumulative effect of these laws and regulations, while providing certain benefits, adds significantly to the cost of our operations and thus have a negative impact on our profitability. There has also been a notable expansion in recent years of financial service providers that are not subject to the examination, oversight, and other rules and regulations to which we are subject. Those providers, because they are not so highly regulated, may have a competitive advantage over us and may continue to draw large amounts of funds away from traditional banking institutions, with a continuing adverse effect on the banking industry in general.
Future Legislation and Regulatory Reform
In light of current economic conditions, regulators have increased their focus on the regulation of financial institutions. From time to time, various legislative and regulatory initiatives are introduced in Congress and state legislatures. New regulations and statutes are regularly proposed that contain wide-ranging proposals for altering the structures, regulations and competitive relationships of financial institutions operating in the United States. We cannot predict whether or in what form any proposed regulation or statute will be adopted or the extent to which our business may be affected by any new regulation or statute. Future legislation, regulation and policies, and the effects of that legislation and regulation and those policies, may have a significant influence on our operations and activities, financial condition, results of operations, growth plans or future prospects and the overall growth and distribution of loans, investments and deposits. Such legislation, regulation and policies have had a significant effect on the operations and activities, financial condition, results of operations, growth plans and future prospects of commercial banks in the past and are expected to continue to do so.
ITEM 1A. RISK FACTORS.
Investing in our common stock involves a high degree of risk. Before you decide to invest in our common stock, you should carefully consider the risks described below, together with all other information included in this Annual Report on Form 10‑K, including the disclosures in “Item 7. Management’s Discussion and Analysis of Financial Condition and Results of Operations” and our consolidated financial statements and the related notes included in “Item 8. Financial Statements and Supplementary Data.” The following is a summary of the significant risk factors that we believe could adversely affect our business, followed by more detailed descriptions of those risks. We believe the risks described below are the risks that are material to us as of the date of this Annual Report on Form 10‑K. If any of the following risks actually occur, our business, financial condition, results of operations and growth prospects could be materially and adversely affected. In that case, you could experience a partial or complete loss of your investment.
Risks Related to Our Business
16
Risk Related to Regulation of Our Industry
17
Risks Related to an Investment in Our Common Stock
Risks Related to Our Business
We may not be able to implement aspects of our expansion strategy, which may adversely affect our ability to maintain our historical earnings trends.
Our expansion strategy focuses on organic growth, supplemented by strategic acquisitions and expansion of the Bank’s banking location network, or de novo branching. We may not be able to execute on aspects of our expansion strategy, which may impair our ability to sustain our historical rate of growth or prevent us from growing at all. More specifically, we may not be able to generate sufficient new loans and deposits within acceptable risk and expense tolerances, obtain the personnel or funding necessary for additional growth or find suitable acquisition candidates. Various factors, such as economic conditions and competition with other financial institutions, may impede or prohibit the growth of our operations, the opening of new banking locations and the consummation of acquisitions. Further, we may be unable to attract and retain experienced bankers, which could adversely affect our growth. The success of our strategy also depends on our ability to effectively manage growth, which is dependent upon a number of factors, including our ability to adapt our credit, operational, technology and governance infrastructure to accommodate expanded operations. If we fail to implement one or more aspects of our strategy, we may be unable to maintain our historical earnings trends, which could have an adverse effect on our business, financial condition and results of operations.
18
We may not be able to manage the risks associated with our anticipated growth and expansion through de novo branching.
Our business strategy includes evaluating strategic opportunities to grow through de novo branching, and we believe that banking location expansion has been meaningful to our growth since inception. De novo branching carries with it certain potential risks, including significant startup costs and anticipated initial operating losses; an inability to gain regulatory approval; an inability to secure the services of qualified senior management to operate the de novo banking location and successfully integrate and promote our corporate culture; poor market reception for de novo banking locations established in markets where we do not have a preexisting reputation; challenges posed by local economic conditions; challenges associated with securing attractive locations at a reasonable cost; and the additional strain on management resources and internal systems and controls. Failure to adequately manage the risks associated with our anticipated growth through de novo branching could have an adverse effect on our business, financial condition and results of operations.
We may not be able to overcome the integration and other risks associated with acquisitions, which could have an adverse effect on our ability to implement our business strategy.
Although we plan to continue to grow our business organically and through de novo branching, we also intend to pursue acquisition opportunities that we believe complement our activities and have the ability to enhance our profitability and provide attractive risk-adjusted returns. Our acquisition activities could be material to our business and involve a number of risks, including the following:
Depending on the condition of any institution or assets or liabilities that we may acquire, that acquisition may, at least in the near term, adversely affect our capital and earnings and, if not successfully integrated with our organization, may continue to have such effects over a longer period. We may not be successful in overcoming these risks or any other problems encountered in connection with pending or potential acquisitions, and any acquisition we may consider will be subject to prior regulatory approval. Our inability to overcome these risks could have an adverse effect on our ability to implement our business strategy, which, in turn, could have an adverse effect on our business, financial condition and results of operations.
19
A key piece of our expansion strategy is a focus on decision-making authority at the branch and market level, and our business, financial condition, results of operations and prospects could be adversely affected if our local teams do not follow our internal policies or are negligent in their decision-making.
In order to be able to provide the responsive and individualized customer service that distinguishes us from competitors and in order to attract and retain management talent, we empower our local management teams to make certain business decisions on the local level. Lending authorities are assigned to branch presidents and their banking teams based on their experience, with all loan relationships in excess of internal specified maximums being reviewed by the Bank’s Directors’ Loan Committee, comprised of senior management of the Bank, or the Bank’s board of directors, as the case may be. Our local lenders may not follow our internal procedures or otherwise act in our best interests with respect to their decision-making. A failure of our employees to follow our internal policies, or actions taken by our employees that are negligent or not in our best interests could have an adverse effect on our business, financial condition and results of operations.
As a business operating in the financial services industry, adverse conditions in the general business or economic environment could adversely affect our business, financial condition and results of operations in the future.
Our business and operations, which primarily consist of lending money to customers in the form of loans, borrowing money from customers in the form of deposits and investing in securities, are sensitive to general business and economic conditions in the United States. Uncertainty about the federal fiscal policymaking process, and the medium and long-term fiscal outlook of the federal government and U.S. economy, is a concern for businesses, consumers and investors in the U.S. In addition, economic conditions in foreign countries, including global political hostilities or public health outbreaks and uncertainty over the stability of foreign currency, could affect the stability of global financial markets, which could hinder domestic economic growth. The current economic environment is characterized by interest rates that have increased at a historically rapid rate, from historically low levels, which impacts our ability to retain deposits, causes unrealized losses in the investment security portfolio and can effect borrowers' ability to cover debt service. We are unable to predict changes in market interest rates. In addition, financial institutions in Texas can be affected by volatility with the oil and gas industry and significant decreases in energy prices. Although we do not have material direct exposure to the oil and gas industry, we retain some indirect exposure, as some of our customers’ businesses are directly affected by volatility with the oil and gas industry and energy prices.
Business and consumer customers of the Bank may experience varying degrees of financial distress resulting from economic conditions and Federal Reserve monetary policies, which may adversely affect their ability to timely pay interest and principal on their loans and the value of the collateral securing their obligations. This in turn can influence the recognition of credit losses in our loan portfolios and may increase our allowance for credit losses.
We may not be able to adequately measure and limit our credit risk, which could lead to unexpected losses.
The business of lending is inherently risky, including risks that the principal of or interest on any loan will not be repaid timely or at all or that the value of any collateral supporting the loan will be insufficient to cover our outstanding exposure. These risks may be affected by the strength of the borrower’s business sector and local, regional and national market and economic conditions. Many of our loans are made to small- to medium-sized businesses that may be less able to withstand competitive, economic and financial pressures than larger borrowers. Our risk management practices, such as monitoring the concentration of our loans within specific industries and our credit approval practices, may not adequately reduce credit risk, and our credit administration personnel, policies and procedures may not adequately adapt to changes in economic or any other conditions affecting customers and the quality of the loan portfolio. A failure to effectively measure and limit the credit risk associated with our loan portfolio could lead to unexpected losses and have an adverse effect on our business, financial condition and results of operations.
We are dependent on the use of data and modeling in our management’s decision-making, and faulty data or modeling approaches could negatively impact our decision-making ability or possibly subject us to regulatory scrutiny in the future.
The use of statistical and quantitative models and other quantitative analyses is endemic to bank decision-making, and the employment of such analyses is becoming increasingly widespread in our operations. Liquidity stress testing, interest rate sensitivity analysis, and the identification of possible violations of anti-money laundering regulations are all examples of areas in which we are dependent on models and the data that underlies them. The use of statistical and quantitative models is also becoming more prevalent in regulatory compliance. While we are not currently subject to annual Dodd-Frank Act stress testing, or DFAST, and the Comprehensive Capital Analysis and Review, or CCAR, submissions, we anticipate that model-derived testing may become more extensively implemented by regulators in the future.
20
We anticipate data-based modeling will penetrate further into bank decision-making, particularly risk management efforts, as the capacities developed to meet rigorous stress testing requirements are able to be employed more widely and in differing applications. While we believe these quantitative techniques and approaches improve our decision-making, they also create the possibility that faulty data or flawed quantitative approaches could negatively impact our decision-making ability or, if we become subject to regulatory stress-testing in the future, adverse regulatory scrutiny. Secondarily, because of the complexity inherent in these approaches, misunderstanding or misuse of their outputs could similarly result in suboptimal decision-making.
The small- to medium-sized businesses that we lend to may have fewer resources to weather adverse business developments, which may impair our borrowers’ ability to repay loans.
We focus our business development and marketing strategy primarily on small- to medium-sized businesses. As of December 31, 2023, we had approximately $1.71 billion of loans to businesses, which represents approximately 73.8% of our total loan portfolio. Small- to medium-sized businesses frequently have smaller market shares than their competition, may be more vulnerable to economic downturns, often need substantial additional capital to expand or compete and may experience substantial volatility in operating results, any of which may impair a borrower’s ability to repay a loan. In addition, the success of a small- and medium-sized business often depends on the management skills, talents and efforts of a small group of people, and the death, disability or resignation of one or more of these people could have an adverse effect on the business and its ability to repay its loan. If our borrowers are unable to repay their loans, our business, financial condition and results of operations could be adversely affected.
Our commercial real estate and real estate construction loan portfolio exposes us to credit risks that may be greater than the risks related to other types of loans.
As of December 31, 2023, approximately $1.41 billion, or 60.5%, of our total loans were nonresidential real estate loans, including owner occupied commercial real estate loans of $323.7 million, or 13.9%, and approximately $296.6 million, or 12.8%, of our total loans, that were construction and land development loans. These loans typically involve repayment dependent upon income generated, or expected to be generated, by the property securing the loan in amounts sufficient to cover operating expenses and debt service. The availability of such income for repayment may be adversely affected by changes in the economy or local market conditions. These loans expose a lender to greater credit risk than loans secured by other types of collateral because the collateral securing these loans is typically more difficult to liquidate due to the fluctuation of real estate values. Additionally, non-owner occupied commercial real estate loans generally involve relatively large balances to single borrowers or related groups of borrowers. Unexpected deterioration in the credit quality of our non-owner occupied commercial real estate loan portfolio could require us to increase our allowance for credit losses, which would reduce our profitability and could have an adverse effect on our business, financial condition and results of operations.
Construction and land development loans also involve risks because loan funds are secured by a project under construction and the project is of uncertain value prior to its completion. It can be difficult to accurately evaluate the total funds required to complete a project, and construction lending often involves the disbursement of substantial funds with repayment dependent, in part, on the success of the ultimate project rather than the ability of a borrower or guarantor to repay the loan. If we are forced to foreclose on a project prior to completion, we may be unable to recover the entire unpaid portion of the loan. In addition, we may be required to fund additional amounts to complete a project, incur taxes, maintenance and compliance costs for a foreclosed property and may have to hold the property for an indeterminate period of time, any of which could adversely affect our business, financial condition and results of operations.
Because a significant portion of our loan portfolio is comprised of real estate loans, negative changes in the economy affecting real estate values and liquidity could impair the value of collateral securing our real estate loans and result in loan and other losses.
As of December 31, 2023, approximately $1.99 billion, or 85.7%, of our total loans were loans with real estate as a primary or secondary component of collateral. The market value of real estate can fluctuate significantly in a short period of time. As a result, adverse developments affecting real estate values and the liquidity of real estate in our primary markets, in particular industries or other segments of our loan portfolio, or in Texas generally could increase the credit risk associated with our loan portfolio, and could result in losses that adversely affect credit quality, financial condition and results of operations. Negative changes in the economy affecting real estate values and liquidity in our market areas could significantly impair the value of property pledged as collateral on loans and affect our ability to sell the collateral upon foreclosure without a loss or additional losses.
21
Collateral may have to be sold for less than the outstanding balance of the loan, which could result in losses on such loans. Such declines and losses would have an adverse effect on our business, financial condition and results of operations. If real estate values decline, it is also more likely that we would be required to increase our allowance for credit losses, which would adversely affect our business, financial condition and results of operations.
Appraisals and other valuation techniques we use in evaluating and monitoring loans secured by real property, other real estate owned and repossessed personal property may not accurately describe the net value of the asset.
In considering whether to make a loan secured by real property, we generally require an appraisal of the property. However, an appraisal is only an estimate of the value of the property at the time the appraisal is made, and, as real estate values may change significantly in value in relatively short periods of time (especially in periods of heightened economic uncertainty), this estimate may not accurately describe the net value of the real property collateral after the loan is made. As a result, we may not be able to realize the full amount of any remaining indebtedness when we foreclose on and sell the relevant property. In addition, we rely on appraisals and other valuation techniques to establish the value of our other real estate owned, or OREO, and personal property that we acquire through foreclosure proceedings and to determine certain estimated losses. If any of these valuations are inaccurate, our combined and consolidated financial statements may not reflect the correct value of our OREO, and our allowance for credit losses may not reflect accurate estimate losses. This could have an adverse effect on our business, financial condition or results of operations. As of December 31, 2023, we held $234,000 of repossessed property and equipment, and no OREO.
We engage in lending secured by real estate and may be forced to foreclose on the collateral and own the underlying real estate, subjecting us to the costs and potential risks associated with the ownership of the real property, or consumer protection initiatives or changes in state or federal law may substantially raise the cost of foreclosure or prevent us from foreclosing at all.
Since we originate loans secured by real estate, we may have to foreclose on the collateral property to protect our investment and may thereafter own and operate such property, in which case we would be exposed to the risks inherent in the ownership of real estate. As of December 31, 2023, we held no assets in OREO. In the prior year we held $38,000 assets in OREO. The amount that we, as a mortgagee, may realize after a default is dependent upon factors outside of our control, including, but not limited to general or local economic condition, environmental cleanup liability, assessments, interest rates, real estate tax rates, operating expenses of the mortgaged properties, ability to obtain and maintain adequate occupancy of the properties, zoning laws, governmental and regulatory rules, and natural disasters. Our inability to manage the amount of costs or size of the risks associated with the ownership of real estate, or write-downs in the value of other real estate owned, could have an adverse effect on our business, financial condition and results of operations.
Additionally, consumer protection initiatives or changes in state or federal law may substantially increase the time and expense associated with the foreclosure process or prevent us from foreclosing at all. While historically Texas has had foreclosure laws that are favorable to lenders, a number of states in recent years have either considered or adopted foreclosure reform laws that make it substantially more difficult and expensive for lenders to foreclose on properties in default, and we cannot be certain that Texas will not adopt similar legislation in the future. Foreclosure and eviction moratoria were put in place in many markets in response to the COVID-19 pandemic, and similar moratoria may delay or prevent foreclosures in the future. Additionally, federal regulators have prosecuted a number of mortgage servicing companies for alleged consumer law violations. If new state or federal laws or regulations are ultimately enacted that significantly raise the cost of foreclosure or raise outright barriers, such could have an adverse effect on our business, financial condition and results of operation.
A portion of our loan portfolio is comprised of commercial loans secured by receivables, inventory, equipment or other commercial collateral, the deterioration in value of which could expose us to credit losses.
As of December 31, 2023, approximately $235.5 million, or 10.1%, of our total loans were commercial loans to businesses. In general, these loans are collateralized by general business assets, including, among other things, accounts receivable, inventory and equipment, and most are backed by a personal guaranty of the borrower or principal. These commercial loans are typically larger in amount than loans to individuals and, therefore, have the potential for larger losses on a single loan basis. Additionally, the repayment of commercial loans is subject to the ongoing business operations of the borrower. The collateral securing such loans generally includes moveable property such as equipment and inventory, which may decline in value more rapidly than we anticipate exposing us to increased credit risk. In addition, a portion of our customer base, including customers in the energy and real estate business, may be in industries which are particularly sensitive to commodity prices or market fluctuations, such as energy prices. Accordingly, negative changes in commodity prices and real estate values and liquidity could impair the value of the collateral securing these loans.
22
Significant adverse changes in the economy or local market conditions in which our commercial lending customers operate could cause rapid declines in loan collectability and the values associated with general business assets resulting in inadequate collateral coverage that may expose us to credit losses and could adversely affect our business, financial condition and results of operations.
Our allowance for credit losses may prove to be insufficient to absorb potential losses in our loan portfolio.
We maintain an allowance for credit losses that represents management’s judgment of probable losses and risks inherent in our loan portfolio. As of December 31, 2023, our allowance for credit losses in our loan portfolio totaled $30.9 million, which represents approximately 1.33% of our total loans. The level of the allowance reflects management’s continuing evaluation of general economic conditions, diversification and seasoning of the loan portfolio, historic loss experience, identified credit problems, delinquency levels and adequacy of collateral. The determination of the appropriate level of the allowance for credit losses is inherently highly subjective and requires us to make significant estimates of and assumptions regarding current credit risks and future trends, all of which may undergo material changes. Inaccurate management assumptions, deterioration of economic conditions affecting borrowers, new information regarding existing loans, identification or deterioration of additional problem loans, acquisition of problem loans and other factors, both within and outside of our control, may require us to increase our allowance for credit losses. In addition, our regulators, as an integral part of their periodic examination, review our methodology for calculating, and the adequacy of, our allowance for credit losses and may direct us to make additions to the allowance based on their judgments about information available to them at the time of their examination. Further, if actual charge-offs in future periods exceed the amounts allocated to the allowance for credit losses, we may need additional provisions for credit losses to restore the adequacy of our allowance for credit losses. Finally, the measure of our allowance for credit losses is dependent on the adoption and interpretation of accounting standards. Under the Current Expected Credit Loss, or CECL impairment model, which became applicable to us on January 1, 2020, financial institutions are required to estimate and develop a provision for credit losses at origination for the lifetime of the loan, as opposed to reserving for incurred or probable losses up to the balance sheet date. Under the CECL model, credit deterioration is reflected in the income statement in the period of origination or acquisition of the loan, with changes in expected credit losses due to further credit deterioration or improvement reflected in the periods in which the expectation changes. Accordingly, the CECL model required many financial institutions, like the Bank, to increase their allowances for credit losses. Increases in our level of allowance for credit losses for any reason, could adversely affect our business, financial condition and results of operations.
If we fail to maintain effective internal control over financial reporting, we may not be able to report our financial results accurately and timely, in which case our business may be harmed, investors may lose confidence in the accuracy and completeness of our financial reports, we could be subject to regulatory penalties and the price of our common stock may decline.
Our management is responsible for establishing and maintaining adequate internal control over financial reporting and for evaluating and reporting on that system of internal control. Our internal control over financial reporting is a process designed to provide reasonable assurance regarding the reliability of financial reporting and the preparation of financial statements for external purposes in accordance with generally accepted accounting principles. As a public company, we are required to comply with the Sarbanes-Oxley Act and other rules that govern public companies. In particular, we are required to certify our compliance with Section 404 of the Sarbanes-Oxley Act in our annual report on Form 10-K, which will require us to furnish annually a report by management on the effectiveness of our internal control over financial reporting. In addition, our independent registered public accounting firm is required to report on the effectiveness of our internal control over financial reporting in our annual report on Form 10-K.
We will continue to periodically test and update, as necessary, our internal control systems, including our financial reporting controls. Our actions, however, may not be sufficient to result in an effective internal control environment, and any future failure to maintain effective internal control over financial reporting could impair the reliability of our financial statements which in turn could harm our business, impair investor confidence in the accuracy and completeness of our financial reports and our access to the capital markets and cause the price of our common stock to decline and subject us to regulatory penalties.
We rely heavily on our executive management team and other key employees, and we could be adversely affected by the unexpected loss of their services.
Our success depends in large part on the performance of our executive management team and other key personnel, as well as on our ability to attract, motivate and retain highly qualified senior and middle management and other skilled employees. Competition for qualified employees is intense, and the process of locating key personnel with the combination of skills, attributes and business relationships required to execute our business plan may be lengthy.
23
We may not be successful in retaining our key employees, and the unexpected loss of services of one or more of our key personnel could have an adverse effect on our business because of their skills, knowledge of and business relationships within our primary markets, years of industry experience and the difficulty of promptly finding qualified replacement personnel. If the services of any of our key personnel should become unavailable for any reason, we may not be able to identify and hire qualified persons on terms acceptable to us, or at all, which could have an adverse effect on our business, financial condition, results of operations and future prospects.
We earn income by originating residential mortgage loans and SBA 7(a) loans for resale in the secondary mortgage market, and disruptions in that market could reduce our operating income.
Historically, we have earned income by originating mortgage loans and Small Business Administration 7(a) loans for sale in the secondary market. For the mortgage loans, a historical focus of our loan origination and sales activities has been to enter into formal commitments and informal agreements with larger banking companies and mortgage investors. Under these arrangements, we originate single family mortgages that are priced and underwritten to conform to previously agreed criteria before loan funding and are delivered to the investor shortly after funding. For the SBA 7(a) loans, we obtain various bids for the purchase of the SBA guaranteed portion of the loan from investors and will generally sell the guaranteed portion to the investor with the highest bid. For the years ended December 31, 2023 and 2022, we earned approximately $1.2 million and $2.4 million, respectively, from these activities. However, in the recent past, disruptions in the secondary market for residential mortgage loans have limited the market for, and liquidity of, most mortgage loans other than conforming Fannie Mae and Federal Home Loan Mortgage Corporation, or Freddie Mac, loans. Additionally, the risk appetite for purchasing of SBA 7(a) guaranteed loans fluctuates, occasionally resulting in bids that are not favorable for us to sell the guaranteed portion of the loan. The effects of these disruptions in the secondary market for residential mortgage loans and SBA 7(a) loans may reappear.
In addition, because government-sponsored entities like Fannie Mae and Freddie Mac, who account for a substantial portion of the secondary market, are governed by federal law, any future changes in laws that significantly affect the activity of these entities could, in turn, adversely affect our operations. In September 2008, Fannie Mae and Freddie Mac were placed into conservatorship by the federal government. The federal government has for many years considered proposals to reform Fannie Mae and Freddie Mac, but the results of any such reform and their impact on us are difficult to predict. To date, no reform proposal has been enacted.
These disruptions may not only affect us but also the ability and desire of mortgage investors and other banks to purchase residential mortgage or SBA 7(a) loans that we originate. As a result, we may not be able to maintain or grow the income we receive from originating and reselling residential mortgage and SBA 7(a) loans, which would reduce our operating income. Additionally, we may be required to hold mortgage loans that we originated for sale, increasing our exposure to interest rate risk and the value of the residential real estate that serves as collateral for the mortgage loan.
Delinquencies, defaults and foreclosures in residential mortgages create a higher risk of repurchases and indemnity requests.
We originate residential mortgage loans for sale to government-sponsored enterprises, such as Fannie Mae, Freddie Mac and other investors. As a part of this process, we make various representations and warranties to these purchasers that are tied to the underwriting standards under which the investors agreed to purchase the loan. If a representation or warranty proves to be untrue, we could be required to repurchase one or more of the mortgage loans or indemnify the investor. Repurchase and indemnity obligations tend to increase during weak economic times, as investors seek to pass on the risks associated with mortgage loan delinquencies to the originator of the mortgage. If we are forced to repurchase additional mortgage loans that we have previously sold to investors, or indemnify those investors, our business, financial condition and results of operations could be adversely affected.
A lack of liquidity could impair our ability to fund operations and adversely impact our business, financial condition and results of operations.
Liquidity is essential to our business. We rely on our ability to generate deposits and effectively manage the repayment and maturity schedules of our loans and investment securities, respectively, to ensure that we have adequate liquidity to fund our operations. An inability to raise funds through deposits, borrowings, the sale of our investment securities, the sale of loans, and other sources could have a substantial negative effect on our liquidity.
24
Our most important source of funds is deposits. As of December 31, 2023, approximately $1.92 billion, or 72.9%, of our total deposits were demand, savings and money market accounts. Historically our savings, money market deposit accounts and demand accounts have been stable sources of funds. However, these deposits are subject to potentially dramatic fluctuations in availability or price due to certain factors that may be outside of our control, such as a loss of confidence by customers in us or the banking sector generally, customer perceptions of our financial health and general reputation, increasing competitive pressures from other financial services firms for consumer or corporate customer deposits, changes in interest rates and returns on other investment classes, which could result in significant outflows of deposits within short periods of time or significant changes in pricing necessary to maintain current customer deposits or attract additional deposits, increasing our funding costs and reducing our net interest income and net income.
The $705.2 million remaining balance of deposits consisted of certificates of deposit, of which $647.0 million, or 24.6% of our total deposits, were due to mature within one year. Historically, a majority of our certificates of deposit are renewed upon maturity as long as we pay competitive interest rates. These customers are, however, interest-rate conscious and may be willing to move funds into higher-yielding investment alternatives. If customers transfer money out of the Bank’s deposits and into other investments such as money market funds, we would lose a relatively low-cost source of funds, increasing our funding costs and reducing our net interest income and net income.
Other primary sources of funds consist of cash flows from operations, maturities and sales of investment securities, and proceeds from the issuance and sale of our equity and debt securities to investors. Additional liquidity is provided by our ability to borrow from the Federal Reserve Bank of Dallas and the Federal Home Loan Bank of Dallas, or the FHLB. We also may borrow funds from third-party lenders, such as other financial institutions. Our access to funding sources in amounts adequate to finance or capitalize our activities, or on terms that are acceptable to us, could be impaired by factors that affect us directly or the financial services industry or economy in general, such as disruptions in the financial markets or negative views and expectations about the prospects for the financial services industry. Our access to funding sources could also be affected by a decrease in the level of our business activity as a result of a downturn in Texas or by one or more adverse regulatory actions against us.
Liquidating investment securities with unrealized losses would negatively impact the results from operations due to the recognition of a loss in that period and reduction in the Company's future earnings potential on those securities, unless they are reinvested in higher yielding assets. Furthermore, recognizing a loss on the sale of those investment securities may also have an impact on the Company's overall financial performance and investor perception, potentially damaging investor confidence and causing a decline in stock price.
Any decline in available funding could adversely impact our ability to originate loans, invest in securities, meet our expenses, or fulfill obligations such as repaying our borrowings or meeting deposit withdrawal demands, any of which could, in turn, have an adverse effect on our business, financial condition and results of operations.
We may need to raise additional capital in the future, and such capital may not be available when needed or at all.
We may need to raise additional capital, in the form of additional debt or equity, in the future to have sufficient capital resources and liquidity to meet our commitments and fund our business needs and future growth, particularly if the quality of our assets or earnings were to deteriorate significantly. Our ability to raise additional capital, if needed, will depend on, among other things, conditions in the capital markets at that time, which are outside of our control, and our financial condition. Economic conditions and a loss of confidence in financial institutions may increase our cost of funding at a time when our access to certain customary sources of liquidity, including interbank borrowings, repurchase agreements and borrowings from the FHLB and the discount window of the Federal Reserve System, is also limited. We may not be able to obtain capital on acceptable terms — or at all. Any occurrence that may limit our access to the capital markets, such as a decline in the confidence of debt purchasers, depositors of our bank or counterparties participating in the capital markets or other disruption in capital markets, may adversely affect our capital costs and our ability to raise capital and, in turn, our liquidity. Further, if we need to raise capital in the future, we may have to do so when many other financial institutions are also seeking to raise capital and would then have to compete with those institutions for investors. An inability to raise additional capital on acceptable terms when needed could have a material adverse effect on our business, financial condition or results of operations.
25
We have a concentration of deposit accounts with state and local municipalities that is a material source of our funding, and the loss of these deposits or significant fluctuations in balances held by these public bodies could force us to fund our business through more expensive and less stable sources.
As of December 31, 2023, $229.0 million, or approximately 8.7%, of our total deposits consisted of deposit accounts of public bodies, such as state or local municipalities, or public funds. These types of deposits are often secured and typically fluctuate on a seasonal basis due to timing differences between tax collection and expenditures. Withdrawals of deposits or significant fluctuation in a material portion of our largest public fund depositors could force us to rely more heavily on borrowings and other sources of funding for our business and withdrawal demands, adversely affecting our net interest margin and results of operations. We may also be forced, as a result of any withdrawal of deposits, to rely more heavily on other, potentially more expensive and less stable funding sources. Consequently, the occurrence of any of these events could have an adverse effect on our business, financial condition and results of operations.
We are subject to interest rate risk and fluctuations in interest rates may adversely affect our earnings.
The majority of our banking assets and liabilities are monetary in nature and subject to risk from changes in interest rates. Like most financial institutions, our earnings are significantly dependent on our net interest income, the principal component of our earnings, which is the difference between interest earned by us from our interest-earning assets, such as loans and investment securities, and interest paid by us on our interest-bearing liabilities, such as deposits and borrowings. We expect that we will periodically experience “gaps” in the interest rate sensitivities of our assets and liabilities, meaning that either our interest-bearing liabilities will be more sensitive to changes in market interest rates than our interest-earning assets, or vice versa. In either event, if market interest rates should move contrary to our position, this “gap” will negatively impact our earnings. The impact on earnings is more adverse when the slope of the yield curve flattens, that is, when short-term interest rates increase more than long-term interest rates or when long-term interest rates decrease more than short-term interest rates. Many factors impact interest rates, including governmental monetary policies, inflation, recession, changes in unemployment, the money supply and international economic weakness and disorder and instability in domestic and foreign financial markets. As of December 31, 2023, approximately 52.2% of our interest-earning assets and approximately 38.9% of our interest-bearing liabilities had a variable rate. Our interest rate sensitivity profile was asset sensitive as of December 31, 2023, meaning that we estimate our net interest income would increase more from rising interest rates than from falling interest rates; however, customer and market responses to a changing interest rate environment are highly uncertain and there is no guarantee that our net interest income would increase if interest rates rise.
Interest rate increases often result in larger payment requirements for our borrowers, which increases the potential for default and could result in a decrease in the demand for loans. At the same time, the marketability of the property securing a loan may be adversely affected by any reduced demand resulting from higher interest rates. In a declining interest rate environment, there may be an increase in prepayments on loans as borrowers refinance their loans at lower rates. In addition, in a low interest rate environment, loan customers often pursue long-term fixed rate credits, which could adversely affect our earnings and net interest margin if rates increase. Changes in interest rates also can affect the value of loans, securities and other assets. An increase in interest rates that adversely affects the ability of borrowers to pay the principal or interest on loans may lead to an increase in nonperforming assets and a reduction of income recognized, which could have an adverse effect on our results of operations and cash flows. Further, when we place a loan on nonaccrual status, we reverse any accrued but unpaid interest receivable, which decreases interest income. At the same time, we continue to have a cost to fund the loan, which is reflected as interest expense, without any interest income to offset the associated funding expense. Thus, an increase in the amount of nonperforming assets would have an adverse impact on net interest income. If short-term interest rates continue to remain at their historically low levels for a prolonged period or if longer-term interest rates fall further, we could experience net interest margin compression as our interest-earning assets would continue to reprice downward while our interest-bearing liability rates could fail to decline in tandem. Such an occurrence would have an adverse effect on our net interest income and could have an adverse effect on our business, financial condition and results of operations.
Our business is concentrated in, and largely dependent upon, the continued growth and welfare of our primary markets, and adverse economic conditions in these markets could negatively impact our operations and customers.
Our business, financial condition and results of operations are affected by changes in the economic conditions of our primary markets of East Texas, Central Texas, Houston MSA and the Dallas/Fort Worth MSA. Our success depends to a significant extent upon the business activity, population, income levels, employment trends, deposits and real estate activity in our primary markets. Economic conditions within our primary markets, and the state of Texas in general, are influenced by the energy sector generally and the price of oil and gas specifically.
26
Although our customers’ business and financial interests may extend well beyond our primary markets, adverse conditions that affect our primary markets, including future declines in oil prices, could reduce our growth rate, affect the ability of our customers to repay their loans, affect the value of collateral underlying our loans, affect our ability to attract deposits and generally affect our business, financial condition, results of operations and future prospects. Due to our geographic concentration within our primary markets, we may be less able than other larger regional or national financial institutions to diversify our credit risks across multiple markets.
We face strong competition from financial services companies and other companies that offer banking services.
We operate in the highly competitive financial services industry and face significant competition for customers from financial institutions located both within and beyond our principal markets. We compete with commercial banks, savings banks, credit unions, nonbank financial services companies and other financial institutions operating within or near the areas we serve. Additionally, certain large banks headquartered outside of our markets and large community banking institutions target the same customers we do. In addition, as customer preferences and expectations continue to evolve, technology has lowered barriers to entry and made it possible for banks to expand their geographic reach by providing services over the internet and for nonbanks to offer products and services traditionally provided by banks, such as automatic transfer and automatic payment systems. The banking industry is experiencing rapid changes in technology, and, as a result, our future success will depend in part on our ability to address our customers’ needs by using technology. Customer loyalty can be influenced by a competitor’s new products, especially offerings that could provide cost savings or a higher return to the customer. Increased lending activity of competing banks following the recent downturn has also led to increased competitive pressures on loan rates and terms for high-quality credits. We may not be able to compete successfully with other financial institutions, and we may have to pay higher interest rates to attract deposits, accept lower yields to attract loans and pay higher wages for new employees, resulting in lower net interest margins and reduced profitability.
Many of our non-bank competitors are not subject to the same extensive regulations that govern our activities and may have greater flexibility in competing for business. The financial services industry could become even more competitive as a result of legislative, regulatory and technological changes and continued consolidation. In addition, some of our current commercial banking customers may seek alternative banking sources as they develop needs for credit facilities larger than we may be able to accommodate. Our inability to compete successfully in the markets in which we operate could have an adverse effect on our business, financial condition or results of operations.
Our trust and wealth management division derives its revenue from noninterest income and is subject to operational, compliance, reputational, fiduciary and strategic risks that could adversely affect our business, financial condition and results of operations.
Our trust and wealth management division subjects us to a number of different risks from our commercial activities, any of which could adversely affect our business, financial condition and results of operations. Operational or compliance risk entails inadequate or failed internal processes, people and systems or changes driven by external events. Success in the trust and wealth management business is highly dependent on reputation. Damage to our reputation from negative opinion in the marketplace could adversely impact both revenue and net income. Such results could also be affected by errors in judgment by management or the board, the improper implementation of business decisions or by unexpected external events. Our success in this division is also dependent upon our continuing ability to generate investment results that satisfy our clients and attract prospective clients, which may be adversely impacted by factors that are outside of our control. In addition, our trust and wealth management division is subject to fiduciary risks and risks associated with adverse decisions regarding the scope of fiduciary liabilities. If any claims or legal actions regarding our fiduciary role are not resolved in a manner favorable to us, we may be exposed to significant financial liability and our reputation could be damaged. Either of these results may adversely impact demand for our products and services, including those unrelated to our trust and wealth management division, or otherwise have an adverse effect on our business, financial condition or results of operation.
Additional risks resulting from our mortgage warehouse lending business could have an adverse effect on our business, financial condition and results of operations.
A portion of our lending involves the origination of mortgage warehouse lines of credit. Risks associated with our mortgage warehouse loans include credit risks relating to the mortgage bankers that borrow from us, including the risk of intentional misrepresentation or fraud; changes in the market value of mortgage loans originated by the mortgage banker, the sale of which is the expected source of repayment of the borrowings under a warehouse line of credit, due to changes in interest rates during the time in warehouse; and originations of mortgage loans that are unsalable or impaired, which could lead to decreased collateral value and the failure of a purchaser of the mortgage loan to ultimately purchase the loan from the mortgage banker. Any one or a combination of these events may adversely affect our loan portfolio and may result in increased delinquencies, loan losses and increased future provision levels, which, in turn, could adversely affect our business, financial condition and results of operations.
27
New lines of business, products, product enhancements or services may subject us to additional risks.
From time to time, we implement new lines of business, or offer new products and product enhancements as well as new services within our existing lines of business and we will continue to do so in the future. There are substantial risks and uncertainties associated with these efforts, particularly in instances where the markets are not fully developed. In implementing, developing or marketing new lines of business, products, product enhancements or services, we may invest significant time and resources, although we may not assign the appropriate level of resources or expertise necessary to make these new lines of business, products, product enhancements or services successful or to realize their expected benefits. Further, initial timetables for the introduction and development of new lines of business, products, product enhancements or services may not be achieved, and price and profitability targets may not prove feasible. External factors, such as compliance with regulations, competitive alternatives and shifting market preferences, may also impact the ultimate implementation of a new line of business or offerings of new products, product enhancements or services. Furthermore, any new line of business, product, product enhancement or service could have a significant impact on the effectiveness of our system of internal controls. Failure to successfully manage these risks in the development and implementation of new lines of business or offerings of new products, product enhancements or services could have an adverse impact on our business, financial condition or results of operations.
Negative public opinion regarding our company or failure to maintain our reputation in the communities we serve could adversely affect our business and prevent us from growing our business.
As a community bank, our reputation within the communities we serve is critical to our success. We believe we have set ourselves apart from our competitors by building strong personal and professional relationships with our customers and by being active members of the communities we serve. As such, we strive to enhance our reputation by recruiting, hiring and retaining employees who share our core values of being an integral part of the communities we serve and delivering superior service to our customers. If our reputation is negatively affected by the actions of our employees or otherwise, we may be less successful in attracting new talent and customers or may lose existing customers, and our business, financial condition and results of operations could be adversely affected. Further, negative public opinion can expose us to litigation and regulatory action and delay and impede our efforts to implement our expansion strategy, which could further adversely affect our business, financial condition and results of operations.
We could recognize losses on investment securities held in our securities portfolio, particularly if interest rates increase or economic and market conditions deteriorate.
While we attempt to invest a significant majority of our total assets in loans (our loan to asset ratio was 72.9% as of December 31, 2023), we invest a percentage of our total assets (18.9% as of December 31, 2023) in investment securities with the primary objectives of providing a source of liquidity, providing an appropriate return on funds invested, managing interest rate risk, meeting pledging requirements and meeting regulatory capital requirements. As of December 31, 2023, the fair value of our available for sale investment securities portfolio was $196.2 million, which included a net unrealized loss of $19.2 million. Factors beyond our control can significantly and adversely influence the fair value of securities in our portfolio. For example, fixed-rate securities are generally subject to decreases in market value when interest rates rise. The Federal Open Market Committee increased the target federal funds rate significantly in 2022 and 2023, which resulted in the net unrealized losses of $19.2 million in our available for sale portfolio and $29.7 million in our held to maturity portfolio at December 31, 2023. Additional factors include, but are not limited to, rating agency downgrades of the securities, defaults by the issuer or individual borrowers with respect to the underlying securities, and instability in the credit markets. Any of the foregoing factors could cause other-than-temporary impairment in future periods and result in realized losses. The process for determining whether impairment is other-than-temporary usually requires difficult, subjective judgments about the future financial performance of the issuer and any collateral underlying the security in order to assess the probability of receiving all contractual principal and interest payments on the security. Because of changing economic and market conditions affecting interest rates, the financial condition of issuers of the securities and the performance of the underlying collateral, we may recognize realized and/or unrealized losses in future periods, which could have an adverse effect on our business, financial condition and results of operations.
28
The accuracy of our financial statements and related disclosures could be affected if the judgments, assumptions or estimates used in our critical accounting policies are inaccurate.
The preparation of financial statements and related disclosures in conformity with GAAP requires us to make judgments, assumptions and estimates that affect the amounts reported in our consolidated financial statements and accompanying notes. Our critical accounting policies, which are included in the section captioned “Item 7: Management’s Discussion and Analysis of Financial Condition and Results of Operations” in this Annual Report on Form 10-K, describe those significant accounting policies and methods used in the preparation of our consolidated financial statements that we consider “critical” because they require judgments, assumptions and estimates that materially affect our consolidated financial statements and related disclosures. As a result, if future events or regulatory views concerning such analysis differ significantly from the judgments, assumptions and estimates in our critical accounting policies, those events or assumptions could have a material impact on our consolidated financial statements and related disclosures, in each case resulting in our needing to revise or restate prior period financial statements, cause damage to our reputation and the price of our common stock, and adversely affect our business, financial condition and results of operations.
There could be material changes to our financial statements and disclosures if there are changes in accounting standards or regulatory interpretations of existing standards.
From time to time the Financial Accounting Standards Board or the SEC may change the financial accounting and reporting standards that govern the preparation of our financial statements. Such changes may result in us being subject to new or changing accounting and reporting standards. In addition, the bodies that interpret the accounting standards (such as banking regulators or outside auditors) may change their interpretations or positions on how new or existing standards should be applied. These changes may be beyond our control, can be hard to predict and can materially impact how we record and report our financial condition and results of operations. In some cases, we could be required to apply a new or revised standard retrospectively, or apply an existing standard differently and retrospectively, in each case resulting in our needing to revise or restate prior period financial statements, which could materially change our financial statements and related disclosures, cause damage to our reputation and the price of our common stock, and adversely affect our business, financial condition and results of operations.
Our operations could be interrupted if our third-party service providers experience difficulty, terminate their services or fail to comply with banking regulations.
We outsource some of our operational activities and accordingly depend on a number of relationships with third-party service providers. Specifically, we rely on third parties for certain services, including, but not limited to, core systems support, informational website hosting, internet services, online account opening and other processing services. Our business depends on the successful and uninterrupted functioning of our information technology and telecommunications systems and third-party servicers. The failure of these systems, a cyber security breach involving any of our third-party service providers, or the termination or change in terms of a third-party software license or service agreement on which any of these systems is based, could interrupt our operations. Because our information technology and telecommunications systems interface with and depend on third-party systems, we could experience service denials if demand for such services exceeds capacity or such third-party systems fail or experience interruptions. Replacing vendors or addressing other issues with our third-party service providers could entail significant delay, expense and disruption of service.
As a result, if these third-party service providers experience difficulties, are subject to cyber security breaches, or terminate their services, and we are unable to replace them with other service providers, particularly on a timely basis, our operations could be interrupted. If an interruption were to continue for a significant period of time, our business, financial condition and results of operations could be adversely affected. Even if we are able to replace third-party service providers, it may be at a higher cost to us, which could adversely affect our business, financial condition and results of operations.
In addition, the Bank’s primary federal regulator, the Office of the Comptroller of the Currency, or OCC, has issued guidance outlining the expectations for third-party service provider oversight and monitoring by financial institutions. The federal banking agencies, including the OCC, have recently issued enforcement actions against financial institutions for failure in oversight of third-party providers and violations of federal banking law by such providers when performing services for financial institutions. Accordingly, our operations could be interrupted if any of our third-party service providers experience difficulty, are subject to cyber security breaches, terminate their services or fail to comply with banking regulations, which could adversely affect our business, financial condition and results of operations. In addition, our failure to adequately oversee the actions of our third-party service providers could result in regulatory actions against the Bank, which could adversely affect our business, financial condition and results of operations.
29
System failure or cyber security breaches of our network security could subject us to increased operating costs as well as litigation and other potential losses.
Our computer systems and network infrastructure could be vulnerable to hardware and cyber security issues. Our operations are dependent upon our ability to protect our computer equipment against damage from fire, power loss, telecommunications failure or a similar catastrophic event. We could also experience a breach by intentional or negligent conduct on the part of employees or other internal sources. Any damage or failure that causes an interruption in our operations could have an adverse effect on our financial condition and results of operations. In addition, our operations are dependent upon our ability to protect our computer systems and network infrastructure, including our digital, mobile and internet banking activities, against damage from physical break-ins, cyber security breaches and other disruptive problems caused by the internet or other users. Such computer break-ins and other disruptions would jeopardize the security of information stored in and transmitted through our computer systems and network infrastructure, which may result in significant liability, damage our reputation and inhibit the use of our internet banking services by current and potential customers. We regularly add additional security measures to our computer systems and network infrastructure to mitigate the possibility of cyber security breaches, including firewalls and penetration testing. However, it is difficult or impossible to defend against every risk being posed by changing technologies as well as acts of cyber-crime. Increasing sophistication of cyber criminals and terrorists make keeping up with new threats difficult and could result in a system breach. Controls employed by our information technology department and cloud vendors could prove inadequate. A breach of our security that results in unauthorized access to our data could expose us to a disruption or challenges relating to our daily operations, as well as to data loss, litigation, damages, fines and penalties, significant increases in compliance costs and reputational damage, any of which could have an adverse effect on our business, financial condition and results of operations.
We have a continuing need for technological change, and we may not have the resources to effectively implement new technology, or we may experience operational challenges when implementing new technology or technology needed to compete effectively with larger institutions may not be available to us on a cost effective basis.
The financial services industry is undergoing rapid technological changes with frequent introductions of new technology-driven products and services. In addition to better serving customers, the effective use of technology increases efficiency and enables financial institutions to reduce costs. Our future success will depend, at least in part, upon our ability to address the needs of our customers by using technology to provide products and services that will satisfy customer demands for convenience as well as to create additional efficiencies in our operations as we continue to grow and expand our products and service offerings. We may experience operational challenges as we implement these new technology enhancements or products, which could impair our ability to realize the anticipated benefits from such new technology or require us to incur significant costs to remedy any such challenges in a timely manner.
Many of our larger competitors have substantially greater resources to invest in technological improvements. Third parties upon which we rely for our technology needs may not be able to develop on a cost effective basis systems that will enable us to keep pace with such developments. As a result, they may be able to offer additional or superior products compared to those that we will be able to provide, which would put us at a competitive disadvantage. We may lose customers seeking new technology-driven products and services to the extent we are unable to provide such products and services. Accordingly, the ability to keep pace with technological change is important and the failure to do so could adversely affect our business, financial condition and results of operations.
We are subject to certain operational risks, including, but not limited to, customer, employee or third-party fraud and data processing system failures and errors.
Employee errors and employee or customer misconduct could subject us to financial losses or regulatory sanctions and seriously harm our reputation. Misconduct by our employees could include hiding unauthorized activities from us, improper or unauthorized activities on behalf of our customers or improper use of confidential information. It is not always possible to prevent employee errors and misconduct, and the precautions we take to prevent and detect this activity may not be effective in all cases. Employee errors could also subject us to financial claims for negligence.
We maintain a system of internal controls to mitigate operational risks, including data processing system failures and errors and customer or employee fraud, as well as insurance coverage designed to protect us from material losses associated with these risks, including losses resulting from any associated business interruption. If our internal controls fail to prevent or detect an occurrence, or if any resulting loss is not insured or exceeds applicable insurance limits, it could adversely affect our business, financial condition and results of operations.
30
In addition, we rely heavily upon information supplied by third parties, including the information contained in credit applications, property appraisals, title information, equipment pricing and valuation and employment and income documentation, in deciding which loans we will originate, as well as the terms of those loans. If any of the information upon which we rely is misrepresented, either fraudulently or inadvertently, and the misrepresentation is not detected prior to loan funding, the value of the loan may be significantly lower than expected, or we may fund a loan that we would not have funded or on terms we would not have extended. Whether a misrepresentation is made by the applicant or another third party, we generally bear the risk of loss associated with the misrepresentation. A loan subject to a material misrepresentation is typically unsellable or subject to repurchase if it is sold prior to detection of the misrepresentation. The sources of the misrepresentations are often difficult to locate, and it is often difficult to recover any of the resulting monetary losses we may suffer, which could adversely affect our business, financial condition and results of operations.
Our primary markets are susceptible to natural disasters and other catastrophes that could negatively impact the economies of our markets, our operations or our customers, any of which could have an adverse effect on us.
A significant portion of our business is generated from our primary markets of East Texas, Central Texas, the Dallas/Fort Worth MSA and the Houston MSA, which are susceptible to damage by tornadoes, floods, droughts, hurricanes and other natural disasters and adverse weather. In addition to natural disasters, man-made events, such as acts of terror and governmental response to acts of terror, malfunction of the electronic grid and other infrastructure breakdowns, could adversely affect economic conditions in our primary markets. These catastrophic events can disrupt our operations, cause widespread property damage, and severely depress the local economies in which we operate. If the economies in our primary markets experience an overall decline as a result of a catastrophic event, demand for loans and our other products and services could be reduced. In addition, the rates of delinquencies, foreclosures, bankruptcies and losses on loan portfolios may increase substantially, as uninsured property losses or sustained job interruption or loss may materially impair the ability of borrowers to repay their loans. Moreover, the value of real estate or other collateral that secures the loans could be materially and adversely affected by a catastrophic event. A natural disaster or other catastrophic event could, therefore, result in decreased revenue and loan losses that have an adverse effect on our business, financial condition and results of operations.
We may be subject to environmental liabilities in connection with the real properties we own and the foreclosure on real estate assets securing our loan portfolio.
In the course of our business, we may purchase real estate in connection with our acquisition and expansion efforts, or we may foreclose on and take title to real estate or otherwise be deemed to be in control of property that serves as collateral on loans we make. As a result, we could be subject to environmental liabilities with respect to those properties. We may be held liable to a governmental entity or to third parties for property damage, personal injury, investigation and clean-up costs incurred by these parties in connection with environmental contamination, or we may be required to investigate or clean up hazardous or toxic substances or chemical releases at a property. The costs associated with investigation or remediation activities could be substantial. In addition, if we are the owner or former owner of a contaminated site, we may be subject to common law claims by third parties based on damages and costs resulting from environmental contamination emanating from the property.
The cost of removal or abatement may substantially exceed the value of the affected properties or the loans secured by those properties, we may not have adequate remedies against the prior owners or other responsible parties and we may not be able to resell the affected properties either before or after completion of any such removal or abatement procedures. If material environmental problems are discovered before foreclosure, we generally will not foreclose on the related collateral or will transfer ownership of the loan to a subsidiary. It should be noted, however, that the transfer of the property or loans to a subsidiary may not protect us from environmental liability. Furthermore, despite these actions on our part, the value of the property as collateral will generally be substantially reduced or we may elect not to foreclose on the property and, as a result, we may suffer a loss upon collection of the loan. Any significant environmental liabilities could have an adverse effect on our business, financial condition and results of operations.
We are subject to claims and litigation pertaining to intellectual property.
Banking and other financial services companies, such as our company, rely on technology companies to provide information technology products and services necessary to support their day-to-day operations. Technology companies frequently enter into litigation based on allegations of patent infringement or other violations of intellectual property rights. In addition, patent holding companies seek to monetize patents they have purchased or otherwise obtained. Competitors of our vendors, or other individuals or companies, may from time to time claim to hold intellectual property sold to us by our vendors.
31
Such claims may increase in the future as the financial services sector becomes more reliant on information technology vendors. The plaintiffs in these actions frequently seek injunctions and substantial damages.
Regardless of the scope or validity of such patents or other intellectual property rights, or the merits of any claims by potential or actual litigants, we may have to engage in protracted litigation. Such litigation is often expensive, time-consuming, disruptive to our operations and distracting to management. If we are found to infringe one or more patents or other intellectual property rights, we may be required to pay substantial damages or royalties to a third party. In certain cases, we may consider entering into licensing agreements for disputed intellectual property, although no assurance can be given that such licenses can be obtained on acceptable terms or that litigation will not occur. These licenses may also significantly increase our operating expenses. If legal matters related to intellectual property claims were resolved against us or settled, we could be required to make payments in amounts that could have an adverse effect on our business, financial condition and results of operations.
If the goodwill that we have recorded or may record in connection with a business acquisition becomes impaired, it could require charges to earnings.
Goodwill represents the amount by which the cost of an acquisition exceeded the fair value of net assets we acquired in connection with the purchase of another financial institution. We review goodwill for impairment at least annually, or more frequently if a triggering event occurs which indicates that the carrying value of the asset might be impaired.
Our goodwill impairment test involves a two-step process. Under the first step, the estimation of fair value of the reporting unit is compared to its carrying value including goodwill. If step one indicates a potential impairment, the second step is performed to measure the amount of impairment, if any. If the carrying amount of the reporting unit goodwill exceeds the implied fair value of that goodwill, an impairment loss is recognized in an amount equal to that excess. Any such adjustments are reflected in our results of operations in the periods in which they become known. As of December 31, 2023, our goodwill totaled $32.2 million. While we have not recorded any impairment charges since we initially recorded the goodwill, there can be no assurance that our future evaluations of our existing goodwill or goodwill we may acquire in the future will not result in findings of impairment and related write-downs, which could adversely affect our business, financial condition and results of operations.
We may be adversely affected by changes in U.S. tax laws.
The tax laws applicable to our business activities may change over time. Legislative initiatives, including initiatives currently under discussion, may impact our results of operations by increasing the corporate income tax rate applicable to our business or by enacting other changes that increase our effective tax rate.
Risks Related to the Regulation of Our Industry
The ongoing implementation of the Dodd-Frank Wall Street Reform and Consumer Protection Act of 2010, or the Dodd-Frank Act, could adversely affect our business, financial condition, and results of operations.
On July 21, 2010, the Dodd-Frank Act was signed into law, and the process of implementation is ongoing. The Dodd-Frank Act imposes significant regulatory and compliance changes on many industries, including ours. On May 24, 2018, the EGRRCPA became law. Among other things, the EGRRCPA changes certain of the regulatory requirements of the Dodd-Frank Act and includes provisions intended to relieve the regulatory burden on community banks. There remains significant uncertainty surrounding the manner in which the provisions of the Dodd-Frank Act and the EGRRCPA will ultimately be implemented by the various regulatory agencies and the full extent of the impact of the requirements on our operations is unclear. The changes resulting from this legislation may impact the profitability of our business activities, require changes to certain of our business practices, require the development of new compliance infrastructure, impose upon us more stringent capital, liquidity and leverage requirements or otherwise adversely affect our business. These changes may also require us to invest significant management attention and resources to evaluate and make any changes necessary to comply with new statutory and regulatory requirements. Failure to comply with the new requirements or with any future changes in laws or regulations could adversely affect our business, financial condition and results of operations.
We operate in a highly regulated environment and the laws and regulations that govern our operations, corporate governance, executive compensation and accounting principles, or changes in them, or our failure to comply with them, could adversely affect us.
Banking is highly regulated under federal and state law. As such, we are subject to extensive regulation, supervision and legal requirements that govern almost all aspects of our operations. These laws and regulations are not intended to protect our shareholders.
32
Rather, these laws and regulations are intended to protect customers, depositors, the Deposit Insurance Fund and the overall financial stability of the United States. These laws and regulations, among other matters, prescribe minimum capital requirements, impose limitations on the business activities in which we can engage, limit the dividend or distributions that the Bank can pay to us, restrict the ability of institutions to guarantee our debt and impose certain specific accounting requirements on us that may be more restrictive and may result in greater or earlier charges to earnings or reductions in our capital than GAAP would require. Compliance with laws and regulations can be difficult and costly, and changes to laws and regulations often impose additional operating costs. Our failure to comply with these laws and regulations, even if the failure follows good faith effort or reflects a difference in interpretation, could subject us to restrictions on our business activities, enforcement actions and fines and other penalties, any of which could adversely affect our results of operations, regulatory capital levels and the price of our securities. Further, any new laws, rules and regulations, such as the Dodd-Frank Act, could make compliance more difficult or expensive or otherwise adversely affect our business, financial condition and results of operations.
Recent volatility in the banking sector may result in new legislation, regulations or policy changes that could subject the Company and the Bank to increased government regulation and supervision.
The regional bank crisis that occurred in Spring 2023 led to interventions by the FDIC, the Federal Reserve, and the U.S. Treasury Secretary in order to safeguard the depositors of these establishments. In light of these events, Congress and federal banking authorities have initiated assessments to pinpoint the causes of these failures, proposing various explanations such as insufficient regulation and oversight, as well as the institutions' inability to effectively manage interest rate and liquidity risks. Ongoing analysis of these developments might result in government-driven measures aimed at averting similar bank failures in the future, which could include changes to risk-based capital regulations. Federal banking authorities may also reconsider relevant liquidity risk management standards.
While it is impossible to definitively predict which measures lawmakers and regulatory bodies might adopt, or the specifics and extent of any such measures, any of the aforementioned potential changes could, among other consequences, impose additional costs on us, restrict the range of financial services and products the Bank is able to offer, and curtail the future expansion of both the Company and the Bank. These factors could substantially and negatively impact the Company's business, operational results, or financial standing.
Federal banking agencies periodically conduct examinations of our business, including compliance with laws and regulations, and our failure to comply with any supervisory actions to which we are or become subject as a result of such examinations could adversely affect us.
As part of the bank regulatory process, the OCC and the Board of Governors of the Federal Reserve System, or Federal Reserve, periodically conduct examinations of our business, including compliance with laws and regulations. If, as a result of an examination, one of these federal banking agencies were to determine that the financial condition, capital resources, asset quality, earnings prospects, management, liquidity, asset sensitivity, risk management or other aspects of any of our operations have become unsatisfactory, or that our Company, the Bank or their respective management were in violation of any law or regulation, it may take a number of different remedial actions as it deems appropriate. These actions include the power to enjoin “unsafe or unsound” practices, to require affirmative actions to correct any conditions resulting from any violation or practice, to issue an administrative order that can be judicially enforced, to direct an increase in our capital levels, to restrict our growth, to assess civil monetary penalties against us, the Bank or their respective officers or directors, to remove officers and directors and, if it is concluded that such conditions cannot be corrected or there is an imminent risk of loss to depositors, to terminate the Bank’s deposit insurance. If we become subject to such regulatory actions, our business, financial condition, results of operations and reputation could be adversely affected.
We are subject to stringent capital requirements, which may result in lower returns on equity, require the raising of additional capital, limit our ability to repurchase shares or pay dividends and discretionary bonuses, or result in regulatory action.
As a bank, we are subject to strict risk-based capital requirements and leverage limits, referred to herein as the Basel III capital rules. See the section in Item 1 of this Annual Report on Form 10-K captioned “Supervision and Regulation — Guaranty Bancshares, Inc. — Revised Rules on Regulatory Capital.”
As a result of the enactment of the Basel III capital rules, we became subject to increased required capital levels. Our inability to comply with these more stringent capital requirements, or with future capital requirements, could, among other things, result in lower returns on equity; require the raising of additional capital; limit our ability to repurchase shares or pay dividends and discretionary bonuses; or result in regulatory actions, any of which could adversely affect our business, financial condition and results of operation.
33
Many of our new activities and expansion plans require regulatory approvals, and failure to obtain them may restrict our growth.
We intend to complement and expand our business by pursuing strategic acquisitions of financial institutions and other complementary businesses. Generally, we must receive federal regulatory approval before we can acquire an FDIC-insured depository institution or related business. In determining whether to approve a proposed acquisition, federal banking regulators will consider, among other factors, the effect of the acquisition on competition, our financial condition, our future prospects, and the impact of the proposal on U.S. financial stability. The regulators also review current and projected capital ratios and levels, the competence, experience and integrity of management and its record of compliance with laws and regulations, the convenience and needs of the communities to be served (including the acquiring institution’s record of compliance under the Community Reinvestment Act, or the CRA) and the effectiveness of the acquiring institution in combating money laundering activities. Such regulatory approvals may not be granted on terms that are acceptable to us, or at all. We may also be required to sell banking locations as a condition to receiving regulatory approval, which condition may not be acceptable to us or, if acceptable to us, may reduce the benefit of any acquisition.
In addition to the acquisition of existing financial institutions, as opportunities arise, we plan to continue de novo branching as a part of our expansion strategy. De novo branching and acquisitions carry with them numerous risks, including the inability to obtain all required regulatory approvals. The failure to obtain these regulatory approvals for potential future strategic acquisitions and de novo banking locations could impact our business plans and restrict our growth.
Financial institutions, such as the Bank, face a risk of noncompliance and enforcement action with the Bank Secrecy Act and other anti-money laundering statutes and regulations.
The Bank Secrecy Act, the Uniting and Strengthening America by Providing Appropriate Tools Required to Intercept and Obstruct Terrorism Act of 2001, or the USA PATRIOT Act, and other laws and regulations require financial institutions, among other duties, to institute and maintain an effective anti-money laundering program and file suspicious activity and currency transaction reports as appropriate. The Financial Crimes Enforcement Network, established by the U.S. Department of the Treasury, or the Treasury Department, to administer the Bank Secrecy Act, is authorized to impose significant civil money penalties for violations of those requirements and has recently engaged in coordinated enforcement efforts with the individual federal banking regulators, as well as the U.S. Department of Justice, Drug Enforcement Administration and the Internal Revenue Service. There is also increased scrutiny of compliance with the sanctions programs and rules administered and enforced by the Treasury Department’s Office of Foreign Assets Control.
In order to comply with regulations, guidelines and examination procedures in this area, we have dedicated significant resources to our anti-money laundering program. If our policies, procedures and systems are deemed deficient, we could be subject to liability, including fines and regulatory actions such as restrictions on our ability to pay dividends and the inability to obtain regulatory approvals to proceed with certain aspects of our business plans, including acquisitions and de novo branching.
We are subject to numerous laws designed to protect consumers, including the Community Reinvestment Act and fair lending laws, and failure to comply with these laws could lead to a wide variety of sanctions.
The CRA, the Equal Credit Opportunity Act, the Fair Housing Act and other fair lending laws and regulations impose nondiscriminatory lending requirements on financial institutions. The Consumer Financial Protection Bureau, or CFPB, the U.S. Department of Justice and other federal agencies are responsible for enforcing these laws and regulations. The CFPB was created under the Dodd-Frank Act to centralize responsibility for consumer financial protection with broad rulemaking authority to administer and carry out the purposes and objectives of federal consumer financial laws with respect to all financial institutions that offer financial products and services to consumers. The CFPB is also authorized to prescribe rules applicable to any covered person or service provider, identifying and prohibiting acts or practices that are “unfair, deceptive, or abusive” in connection with any transaction with a consumer for a consumer financial product or service, or the offering of a consumer financial product or service. The ongoing broad rulemaking powers of the CFPB have potential to have a significant impact on the operations of financial institutions offering consumer financial products or services. The CFPB has indicated that it may propose new rules on overdrafts and other consumer financial products or services, which could have an adverse effect on our business, financial condition and results of operations if any such rules limit our ability to provide such financial products or services.
34
A successful regulatory challenge to an institution’s performance under the CRA, fair lending or consumer lending laws and regulations could result in a wide variety of sanctions, including damages and civil money penalties, injunctive relief, restrictions on mergers and acquisitions activity, restrictions on expansion, and restrictions on entering new business lines. Private parties may also have the ability to challenge an institution’s performance under fair lending laws in private class action litigation. Such actions could have an adverse effect on our business, financial condition and results of operations.
Increases in FDIC insurance premiums could adversely affect our earnings and results of operations.
We are generally unable to control the amount of premiums that we are required to pay for FDIC insurance. As a result of economic conditions and the enactment of the Dodd-Frank Act, the FDIC has in recent years increased deposit insurance assessment rates, which in turn raised deposit premiums for many insured depository institutions. If recent increases in premiums are insufficient for the Deposit Insurance Fund to meet its funding requirements, further special assessments or increases in deposit insurance premiums may be required. Further, if there are additional financial institution failures that affect the Deposit Insurance Fund, we may be required to pay higher FDIC premiums. Our FDIC insurance related costs were $1.5 million for the year ended December 31, 2023, compared to $1.1 million for the year ended December 31, 2022. Any future additional assessments, increases or required prepayments in FDIC insurance premiums could adversely affect our earnings and results of operations.
The Federal Reserve may require us to commit capital resources to support the Bank.
The Federal Reserve requires a bank holding company to act as a source of financial and managerial strength to its subsidiary banks and to commit resources to support its subsidiary banks. Under the “source of strength” doctrine that was codified by the Dodd-Frank Act, the Federal Reserve may require a bank holding company to make capital injections into a troubled subsidiary bank at times when the bank holding company may not be inclined to do so and may charge the bank holding company with engaging in unsafe and unsound practices for failure to commit resources to such a subsidiary bank. Accordingly, we could be required to provide financial assistance to the Bank if it experiences financial distress.
A capital injection may be required at a time when our resources are limited, and we may be required to borrow the funds or raise capital to make the required capital injection. Any loan by a bank holding company to its subsidiary bank is subordinate in right with payment to deposits and certain other indebtedness of such subsidiary bank. In the event of a bank holding company’s bankruptcy, the bankruptcy trustee will assume any commitment by the holding company to a federal bank regulatory agency to maintain the capital of a subsidiary bank. Moreover, bankruptcy law provides that claims based on any such commitment will be entitled to a priority of payment over the claims of the holding company’s general unsecured creditors, including the holders of any note obligations. Thus, any borrowing by a bank holding company for the purpose of making a capital injection to a subsidiary bank often becomes more difficult and expensive relative to other corporate borrowings.
We could be adversely affected by the soundness of other financial institutions.
Financial services institutions are interrelated as a result of trading, clearing, counterparty or other relationships. We have exposure to many different industries and counterparties, and routinely execute transactions with counterparties in the financial services industry, including commercial banks, brokers and dealers, investment banks and other institutional clients. Many of these transactions expose us to credit risk in the event of a default by a counterparty or client. In addition, our credit risk may be exacerbated when our collateral cannot be foreclosed upon or is liquidated at prices not sufficient to recover the full amount of the credit or derivative exposure due. Any such losses could adversely affect our business, financial condition and results of operations. In addition, perceived weakness at other financial institutions, particularly those considered to be peers of the Bank, could cause depositors and other customers of the Bank to assume such weakness also applies to the Bank.
Monetary policies and regulations of the Federal Reserve could adversely affect our business, financial condition and results of operations.
In addition to being affected by general economic conditions, our earnings and growth are affected by the policies of the Federal Reserve. An important function of the Federal Reserve is to regulate the U.S. money supply and credit conditions. Among the instruments used by the Federal Reserve to implement these objectives are open market purchases and sales of securities by the Federal Reserve, adjustments of both the discount rate and the federal funds rate and changes in reserve requirements against bank deposits. These instruments are used in varying combinations to influence overall economic growth and the distribution of credit, bank loans, investments and deposits.
35
Their use also affects interest rates charged on loans or paid on deposits.
The monetary policies and regulations of the Federal Reserve have had a significant effect on the operating results of commercial banks in the past and are expected to continue to do so in the future. Although we cannot determine the effects of such policies on us at this time, such policies could adversely affect our business, financial condition and results of operations.
We are subject to commercial real estate lending guidance issued by the federal banking regulators that impacts our operations and capital requirements.
The federal banking regulators have issued guidance regarding concentrations in commercial real estate lending directed at institutions that have particularly high concentrations of commercial real estate loans within their lending portfolios. This guidance suggests that institutions whose commercial real estate loans exceed certain percentages of capital should implement heightened risk management practices appropriate to their concentration risk and may be required to maintain higher capital ratios than institutions with lower concentrations in commercial real estate lending. Based on our commercial real estate concentration as of December 31, 2023, we believe that we are operating within the guidelines. However, increases in our commercial real estate lending, particularly as we expand into metropolitan markets and make more of these loans, could subject us to additional supervisory analysis. We cannot guarantee that any risk management practices we implement will be effective to prevent losses relating to our commercial real estate portfolio. Management has implemented controls to monitor our commercial real estate lending concentrations, but we cannot predict the extent to which this guidance will impact our operations or capital requirements.
Risks Related to an Investment in Our Common Stock
The market price of our common stock may be subject to substantial fluctuations, which may make it difficult for you to sell your shares at the volume, prices and times desired.
The market price of our common stock may be highly volatile, which may make it difficult for you to resell your shares at the volume, prices and times desired. There are many factors that may affect the market price and trading volume of our common stock, including, without limitation:
36
The stock market and, in particular, the market for financial institution stocks have experienced substantial fluctuations in recent years, which in many cases have been unrelated to the operating performance and prospects of particular companies. In addition, significant fluctuations in the trading volume in our common stock may cause significant price variations to occur. Increased market volatility may materially and adversely affect the market price of our common stock, which could make it difficult to sell your shares at the volume, prices and times desired.
The market price of our common stock could decline significantly due to actual or anticipated issuances or sales of our common stock in the future.
We may issue shares of our common stock or other securities from time to time as consideration for future acquisitions and investments and pursuant to compensation and incentive plans. If any such acquisition or investment is significant, the number of shares of our common stock, or the number or aggregate principal amount, as the case may be, of other securities that we may issue may in turn be substantial. We may also grant registration rights covering those shares of our common stock or other securities in connection with any such acquisitions and investments.
We cannot predict the size of future issuances of our common stock or the effect, if any, that future issuances and sales of our common stock will have on the market price of our common stock. Sales of substantial amounts of our common stock (including shares of our common stock issued in connection with an acquisition or under a compensation or incentive plan), or the perception that such sales could occur, may adversely affect prevailing market prices for our common stock and could impair our ability to raise capital through future sales of our securities.
Securities analysts may not initiate or continue coverage on us.
The trading market for our common stock depends, in part, on the research and reports that securities analysts publish about us and our business. We do not have any control over these securities analysts, and they may not cover us. If one or more of these analysts cease to cover us or fail to publish regular reports on us, we could lose visibility in the financial markets, which could cause the price or trading volume of our common stock to decline. If we are covered by securities analysts and are the subject of an unfavorable report, the price of our common stock may decline.
Our management and board of directors have significant control over our business.
As of December 31, 2023, our Company-only directors and executive officers beneficially owned an aggregate of 2,447,788 shares, or approximately 21.0%, of our issued and outstanding shares of common stock, including 231,221 shares that are held by our KSOP and allocated to the accounts of our named executive officers. As of December 31, 2023, our KSOP owned an aggregate of 1,021,462 shares, or approximately 8.9% of our issued and outstanding shares. A committee consisting of four independent directors of the Company, which we refer to herein as the KSOP Committee, currently serves as trustee of the KSOP. Each KSOP participant will have the right to vote the shares allocated to such participant’s account on all matters requiring a vote of our shareholders, but the KSOP committee, as trustee of the KSOP, retains sole voting power over all shares held by the KSOP that are not allocated to participants’ accounts and all shares for which they have received no voting instructions from the participant. As of December 31, 2023, there were no shares owned by our KSOP that were unallocated to participants’ accounts.
As a result of their significant control over our business, our management and board of directors may be able to significantly affect the outcome of the election of directors and the potential outcome of other matters submitted to a vote of our shareholders, such as mergers, the sale of substantially all of our assets and other extraordinary corporate matters. The interests of these insiders could conflict with the interests of our other shareholders, including you.
The holders of our existing debt obligations, as well as debt obligations that may be outstanding in the future, will have priority over our common stock with respect to payment in the event of liquidation, dissolution or winding up and with respect to the payment of interest.
In the event of any liquidation, dissolution or winding up of the Company, our common stock would rank below all claims of debt holders against us. As of December 31, 2023, we had a senior, unsecured line of credit with an available balance of $20.5 million with $4.5 million advanced. We also had $38.6 million of subordinated debt obligations and approximately $7.2 million of junior subordinated debentures issued to statutory trusts that, in turn, issued $7.0 million of trust preferred securities. Payments of the principal and interest on the trust preferred securities are conditionally guaranteed by us. Our debt obligations are senior to our shares of common stock. As a result, we must make payments on our debt obligations before any dividends can be paid on our common stock. In the event of our bankruptcy, dissolution or liquidation, these existing and any future debt obligations must be satisfied in full before any distributions can be made to the holders of our common stock. We have the right to defer distributions on our junior subordinated debentures (and the related trust preferred securities) for up to five years, during which time no dividends may be paid to holders of our common stock.
37
To the extent that we issue additional debt obligations or junior subordinated debentures, the additional debt obligations or additional junior subordinated debentures will be senior to our shares of common stock.
We may issue shares of preferred stock in the future, which could make it difficult for another company to acquire us or could otherwise adversely affect holders of our common stock, which could depress the price of our common stock.
Our amended and restated certificate of formation authorizes us to issue up to 15,000,000 shares of one or more series of preferred stock. Our board of directors has the authority to determine the preferences, limitations and relative rights of shares of preferred stock and to fix the number of shares constituting any series and the designation of such series, without any further vote or action by our shareholders. Our preferred stock could be issued with voting, liquidation, dividend and other rights superior to the rights of our common stock. The potential issuance of preferred stock may delay or prevent a change in control of us, discouraging bids for our common stock at a premium over the market price, and materially adversely affect the market price and the voting and other rights of the holders of our common stock.
We are dependent upon the Bank for cash flow, and the Bank’s ability to make cash distributions is restricted.
Our primary asset is Guaranty Bank & Trust. As such, the Company depends upon the Bank for cash distributions (through dividends on the Bank’s common stock) that the Company uses to pay its operating expenses, satisfy its obligations (including its junior subordinated debentures and other debt obligations) and to pay dividends on the Company’s common stock. Federal statutes, regulations and policies restrict the Bank’s ability to make cash distributions to the Company. These statutes and regulations require, among other things, that the Bank maintain certain levels of capital in order to pay a dividend. Further, the OCC has the ability to restrict the Bank’s payment of dividends by supervisory action. If the Bank is unable to pay dividends to the Company, we will not be able to satisfy our obligations or pay dividends on our common stock.
Our dividend policy may change without notice, and our future ability to pay dividends is subject to restrictions.
We anticipate that dividends will be declared and paid in the month following the end of each calendar quarter, and we anticipate paying a quarterly dividend on our common stock in an amount equal to approximately 25.0% to 30.0% of our net income for the immediately preceding quarter. However, holders of our common stock are entitled to receive only such cash dividends as our board of directors may declare out of funds legally available for such payments. Any declaration and payment of dividends on common stock will depend upon the ability of the Bank to make cash distributions to the Company, our earnings and financial condition, liquidity and capital requirements, the general economic and regulatory climate, our ability to service any equity or debt obligations senior to the common stock and other factors deemed relevant by our board of directors. Furthermore, consistent with our strategic plans, growth initiatives, capital availability, projected liquidity needs and other factors, we have made, and will continue to make, capital management decisions and policies that could adversely affect the amount of dividends, if any, paid to our common shareholders.
The Federal Reserve has indicated that bank holding companies should carefully review their dividend policy in relation to the organization’s overall asset quality, current and prospective earnings and level, composition and quality of capital. The guidance provides that we inform and consult with the Federal Reserve prior to declaring and paying a dividend that exceeds earnings for the period for which the dividend is being paid or that could result in an adverse change to our capital structure, including interest on the junior subordinated debentures underlying our trust preferred securities and our other debt obligations. If required payments on our outstanding junior subordinated debentures, held by our unconsolidated subsidiary trusts, or our other debt obligations, are not made or are deferred, or dividends on any preferred stock we may issue are not paid, we will be prohibited from paying dividends on our common stock.
Our corporate organizational documents and provisions of federal and state law to which we are subject contain certain provisions that could have an anti-takeover effect and may delay, make more difficult or prevent an attempted acquisition that you may favor or an attempted replacement of our board of directors or management.
Our certificate of formation and our bylaws (each as amended and restated) may have an anti-takeover effect and may delay, discourage or prevent an attempted acquisition or change of control or a replacement of our board of directors or management. Our governing documents include provisions that:
38
In addition, certain provisions of Texas law, including a provision which restricts certain business combinations between a Texas corporation and certain affiliated shareholders, may delay, discourage or prevent an attempted acquisition or change in control. Furthermore, banking laws impose notice, approval, and ongoing regulatory requirements on any shareholder or other party that seeks to acquire direct or indirect “control” of an FDIC-insured depository institution or its holding company. These laws include the Bank Holding Company Act of 1956, as amended, or the BHC Act, and the Change in Bank Control Act, or the CBCA. These laws could delay or prevent an acquisition.
Furthermore, our amended and restated certificate of formation provides that the state courts located in Titus County, Texas, the county in which our legacy headquarters in Mount Pleasant lie, will be the exclusive forum for: (a) any actual or purported derivative action or proceeding brought on our behalf, (b) any action asserting a claim of breach of fiduciary duty by any of our directors or officers, (c) any action asserting a claim against us or our directors or officers arising pursuant to the TBOC, our certificate of formation, or our bylaws; or (d) any action asserting a claim against us or our officers or directors that is governed by the internal affairs doctrine. By becoming a shareholder of our Company, you will be deemed to have notice of and have consented to the provisions of our amended and restated certificate of formation related to choice of forum. The choice of forum provision in our amended and restated certificate of formation may limit our shareholders’ ability to obtain a favorable judicial forum for disputes with us. Alternatively, if a court were to find the choice of forum provision contained in our amended and restated certificate of formation to be inapplicable or unenforceable in an action, we may incur additional costs associated with resolving such action in other jurisdictions, which could adversely affect our business, operating results, and financial condition.
An investment in our common stock is not an insured deposit and is subject to risk of loss.
Any shares of our common stock you purchase will not be savings accounts, deposits or other obligations of any of our bank or non-bank subsidiaries and will not be insured or guaranteed by the FDIC or any other government agency. Your investment will be subject to investment risk, and you must be capable of affording the loss of your entire investment.
ITEM 1B. UNRESOLVED STAFF COMMENTS.
None.
ITEM 1C. CYBERSECURITY.
Cybersecurity Risk Management and Strategy
Our enterprise risk management program is designed to identify, assess, and mitigate risks across various aspects of the Company, including financial, operational, regulatory, reputational, and legal. Given the increasing reliance on technology and potential cyber threats, information security (and by entailment cybersecurity) is a critical component of this program.
39
Our Chief Information Security Officer (“CISO”) is primarily responsible for this cybersecurity component and is a key member of the enterprise risk management organization, which is overseen by our Chief Risk Officer. As discussed below, our CISO reports periodically throughout the year on cybersecurity related risks, threats, and our responses, to the Technology Committee and our board of directors.
Cybersecurity risks are constantly evolving and becoming increasingly pervasive across all industries. To mitigate these risks and protect sensitive customer data, financial transactions, and our information systems, Guaranty has implemented comprehensive cybersecurity practices. Key components of the cybersecurity program include the following:
The Bank leverages in-house resources and third-party service providers to implement and maintain processes and controls to manage identified risks.
Our Vendor Management program is designed to ensure that our vendors meet our cybersecurity requirements. This includes conducting periodic risk assessments of vendors, requiring vendors to maintain appropriate cybersecurity controls and monitoring vendor compliance with our cybersecurity requirements.
The Bank’s risk management program and strategy are designed to ensure confidential information and information systems are appropriately protected from a variety of threats, both natural and man-made. Periodic risk assessments are performed to validate control requirements and ensure that the Bank’s information is protected at a level commensurate with its sensitivity, value, and criticality. Preventative and detective security controls are employed on all media where information is stored, the systems that process it, and infrastructure components that facilitate its transmission to ensure the confidentiality, integrity, and availability of Bank and customer information. Minimally, these controls include identity and access management, data encryption, data loss prevention, incident response, security monitoring and alerting, third party risk management, and vulnerability management.
The Bank’s risk management program and strategy are regularly reviewed and updated to ensure that they are aligned with the Bank's business objectives.
Risks from Cyber Threats
Like many businesses, the Bank faces numerous cybersecurity risks in connection with providing services to our customers. Guaranty does not currently believe that any current or pervious cybersecurity threats have materially affected, or are reasonably likely to materially affect the Bank, including its business strategy, results of operations, or financial condition. Unfortunately, the sophistication of cyber threats continues to increase, and the Bank’s cybersecurity risk management and strategy may be insufficient or may not be successful in protecting against all cyber incidents. No cybersecurity program will be able to anticipate all cyber threats and breach attempts, and there may exist limitations to the ability to effectively implement preventive measures against such breaches in a timely manner. For more information on how cybersecurity risk may materially affect the Bank’s business strategy, results of operations or financial condition, please refer to Item 1A Risk Factors.
40
Governance
Board of Directors Oversight
The Board of Directors is charged with overseeing the establishment and execution of the Bank’s risk management framework and monitoring adherence to related policies required by applicable regulations and statutes. Consistent with this responsibility, the Board may delegate some responsibilities to the Audit Committee. The CISO holds the primary day-to-day responsibility for the strategic, operational, and risk management components of cybersecurity. The Audit Committee, and the board through summary reports, receives updates on cybersecurity risks and incidents and the cybersecurity program through direct communication with the CISO. Additionally, awareness and training on cybersecurity topics is provided to the Board at least annually.
Management's Role
The Information Security department is responsible for implementing and maintaining the Banks’s Information Security program, which addresses cybersecurity risk management and cyber threats. The Information Security department consists of cybersecurity and information risk professionals who assess, identify, and manage cybersecurity risks. Information Security is led by the CISO, who reports directly to the Chief Financial Officer and with dotted-line reporting to the Audit Committee. Additionally, the CISO is a key member of the Technology Committee, which is charged with Bank’s managerial oversight and steering organization for all information technology areas (including cybersecurity).
The Bank’s CISO has over 20 years of experience in cybersecurity across various verticals. Our CISO brings a wealth of expertise to his role. His background includes extensive experience and certifications in all facets of information technology and information security. His in-depth knowledge and experience are instrumental in developing and executing our cybersecurity strategies. The Bank’s CISO remains informed about the latest developments in cybersecurity, including potential threats and innovative risk management techniques. This ongoing knowledge acquisition is crucial for the effective prevention, detection, mitigation, and remediation of cybersecurity incidents. To assist the Information Security team in such knowledge acquisition, we subscribe to services that provide Bank personnel with alerts on security incidents and threats. Our CISO oversees the implementation and processes for regular monitoring of our information systems. This includes the deployment of advanced security measures and regular internal/external assessments to identify potential vulnerabilities. In a cybersecurity incident, the information security incident response plan is enacted. This plan includes immediate actions to mitigate the impact of and remediate the incident.
ITEM 2. PROPERTIES.
As of December 31, 2023 the Bank operates 33 banking locations, all of which are located in Texas. Our principal executive office is located at 16475 Dallas Parkway, Suite 600, Addison, Texas 75001. The Bank currently operates banking locations in the following Texas locations: Austin (two locations), Georgetown (two locations), Bogata, Bryan, College Station (two locations), Commerce, Conroe, Dallas (two locations), Denton (two locations), Fort Worth, Hallsville, Houston (three locations), Longview, Mount Pleasant (two locations), Mount Vernon, New Boston, Paris (two locations), Pittsburg, Rockwall, Royse City, Sulphur Springs, and Texarkana (three locations).
As of December 31, 2023, we owned 21 of our banking locations, had one location in which we owned the building and had a long-term land lease on the real property associated with the branch, and leased the remaining 11 locations. We also own our executive headquarters in Mount Pleasant, and lease two buildings for business operations. The terms of our leases generally range from one to 12 years and give us the option to renew for subsequent terms of equal duration or otherwise extend the lease term subject to price adjustment based on market conditions at the time of renewal. We believe that the 13 leases to which we are subject are generally on terms consistent with prevailing market terms, and none of the leases are with our directors, officers, beneficial owners of more than 5% of our voting securities or any affiliates of the foregoing. We believe that our facilities are in good condition and are adequate to meet our operating needs for the foreseeable future.
ITEM 3. LEGAL PROCEEDINGS.
The Company is from time to time subject to claims and litigation arising in the ordinary course of business. These claims and litigation may include, among other things, allegations of violation of banking and other applicable regulations, competition law, labor laws and consumer protection laws, as well as claims or litigation relating to intellectual property, securities, breach of contract and tort. The Company intends to defend itself vigorously against any pending or future claims and litigation.
41
At this time, in the opinion of management, the likelihood is remote that the impact of such proceedings, either individually or in the aggregate, would have a material adverse effect on the Company combined results of operations, financial condition or cash flows. However, one or more unfavorable outcomes in any claim or litigation against the Company could have a material adverse effect for the period in which they are resolved. In addition, regardless of their merits or their ultimate outcomes, such matters are costly, divert management’s attention and may materially adversely affect the Company’s reputation, even if resolved in our favor.
ITEM 4. MINE SAFETY DISCLOSURES.
Not applicable.
42
PART II
ITEM 5. MARKET FOR REGISTRANT’S COMMON EQUITY, RELATED STOCKHOLDER MATTERS AND ISSUER PURCHASES OF EQUITY SECURITIES.
Market Information for Common Stock
Beginning on March 7, 2023, shares of our common stock are traded on the New York Stock Exchange under the symbol “GNTY”. Prior to that date, our shares were traded on the Nasdaq Global Select Market (the "Nasdaq") since our initial public offering ("IPO") on May 9, 2017. Prior to our IPO, there was no public trading market for our common stock.
As of March 7, 2024, there were 364 holders of record of our common stock. The number of holders of record does not represent the actual number of beneficial owners of our common stock because securities dealers and others frequently hold shares in “street name” for the benefit of individual owners who have the right to vote shares.
Dividend Policy
See "Consolidated Financial Statements—Note 16—Regulatory Matters" for the frequency and amount of cash dividends paid by us. Also, see "Item 1. Business—Regulation and Supervision—Guaranty Bancshares, Inc.—Regulatory Restrictions on Dividends” for restrictions on our present or future ability to pay dividends, particularly those restrictions arising under federal and state banking laws.
Unregistered Sales of Equity Securities
None.
Equity Compensation Plan Information
See “Item 12. Security Ownership of Certain Beneficial Owners and Management and Related Stockholder Matters.”
Stock Performance Graph
The following table and graph compares the cumulative total shareholder return on our common stock to the cumulative total return of the S&P 500 Index and the S&P U.S. SmallCap Banks Index for the period of December 31, 2018 through December 31, 2023. The following assumes $100 was invested in each of our common stock, the S&P 500 and the S&P U.S. SmallCap Banks Index values on December 31, 2018, and assumes the reinvestment of dividends, if any.
43
The historical stock price performance for our common stock shown on the graph below is not necessarily indicative of future stock performance.
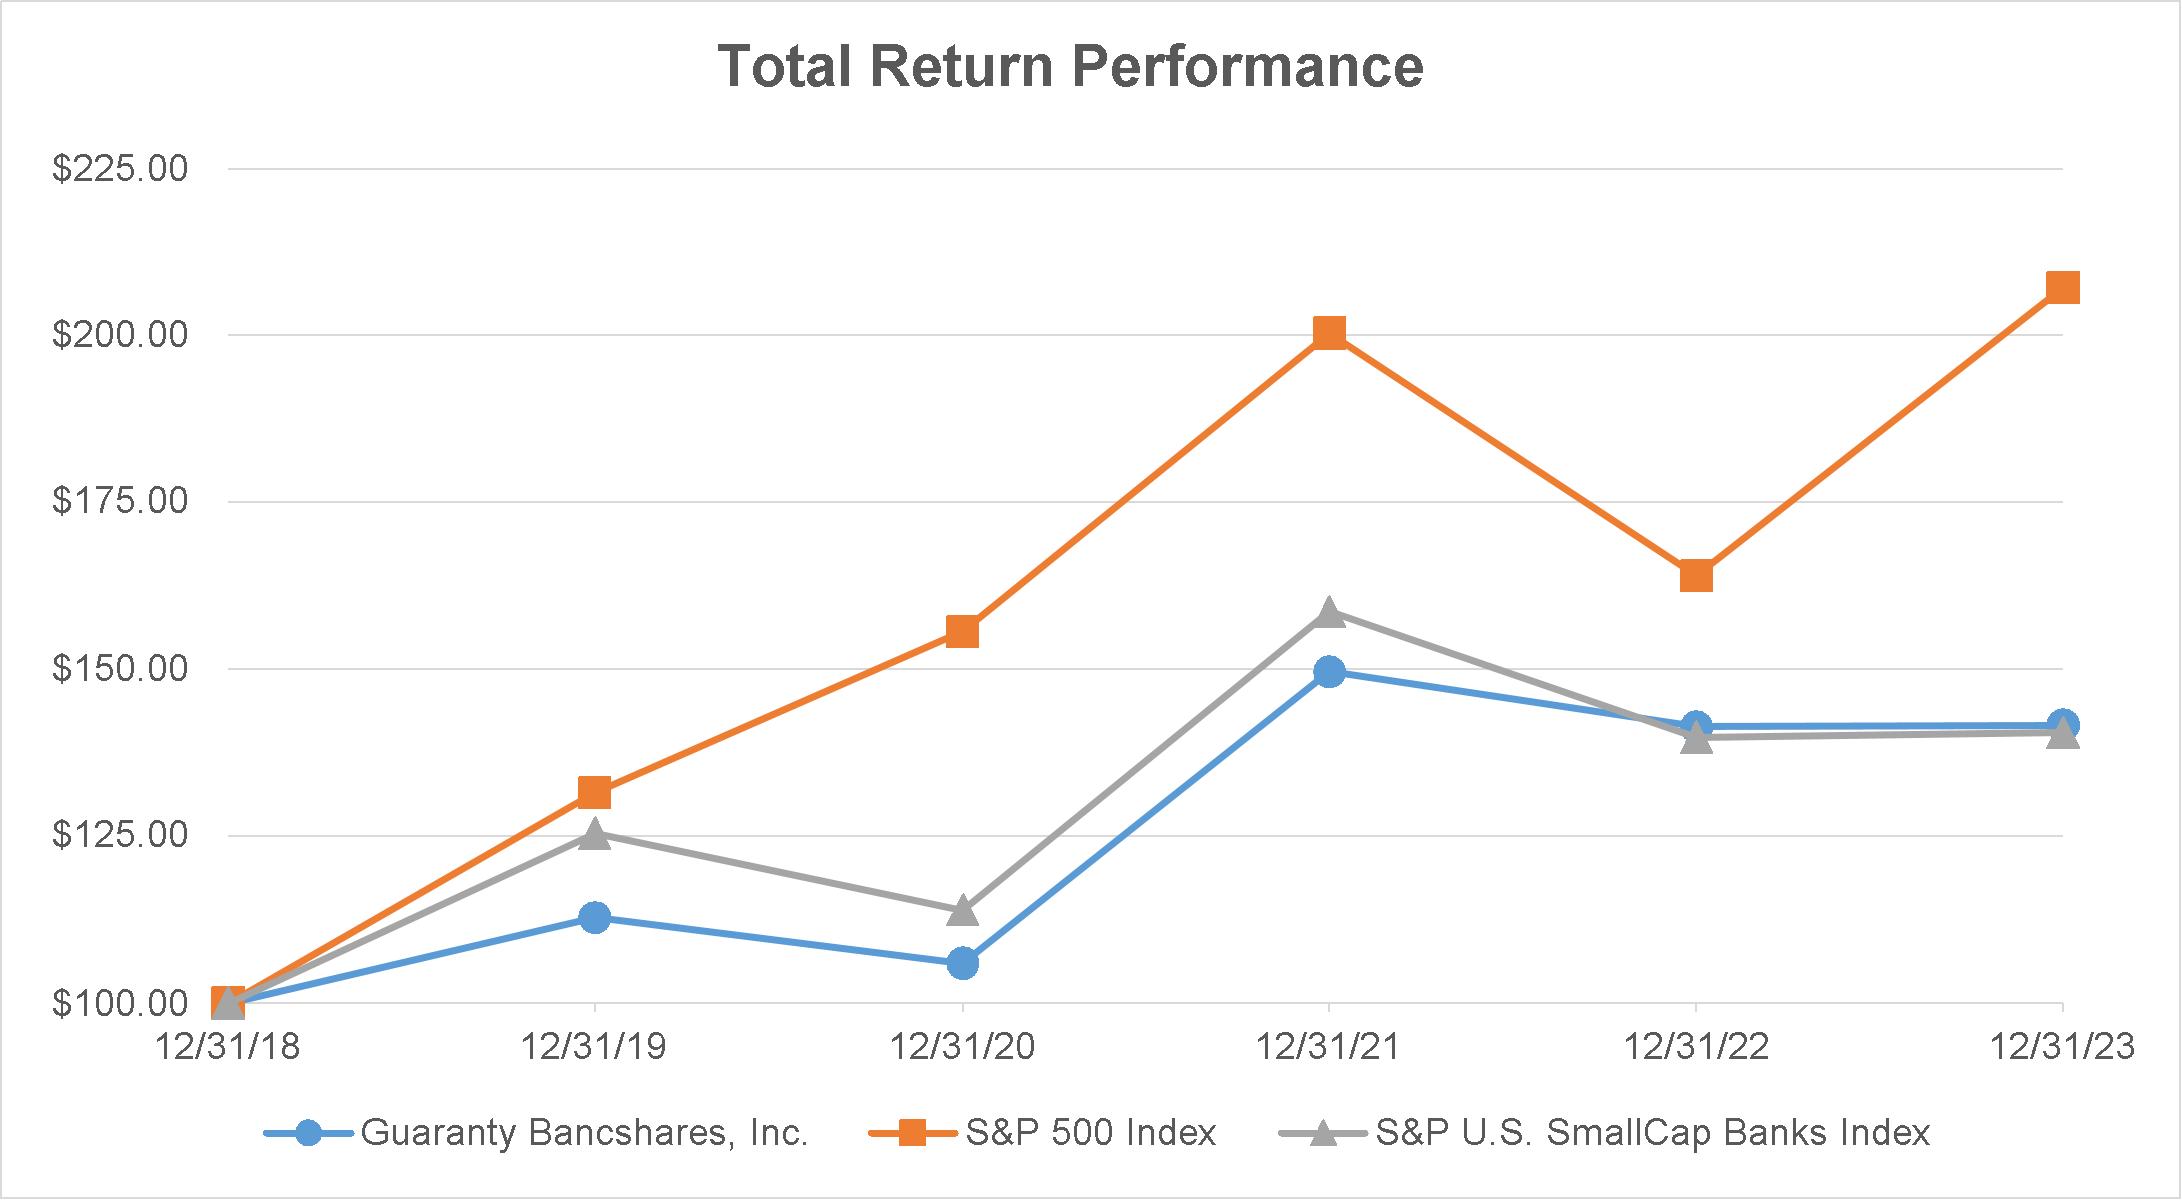
|
|
December 31, |
|
|
December 31, |
|
|
December 31, |
|
|
December 31, |
|
|
December 31, |
|
|
December 31, |
|
||||||
Guaranty Bancshares, Inc. |
|
$ |
100.00 |
|
|
$ |
112.84 |
|
|
$ |
105.96 |
|
|
$ |
149.63 |
|
|
$ |
141.40 |
|
|
$ |
141.66 |
|
S&P 500 Index |
|
|
100.00 |
|
|
|
131.49 |
|
|
|
155.68 |
|
|
|
200.37 |
|
|
|
164.08 |
|
|
|
207.21 |
|
S&P U.S. SmallCap Banks Index |
|
|
100.00 |
|
|
|
125.46 |
|
|
|
113.94 |
|
|
|
158.62 |
|
|
|
139.85 |
|
|
|
140.55 |
|
Source: S&P Global Market Intelligence
Stock Repurchases
On April 21, 2022, the Company announced the adoption of a new stock repurchase program that authorized the repurchase of up to 1,000,000 shares of Company common stock. The stock repurchase program will be effective until the earlier of April 21, 2024, or the date all shares authorized for repurchase under the program have been repurchased, unless shortened or extended by the board of directors. The repurchase plan permits shares to be acquired from time to time in the open market or negotiated transactions at prices management considers to be attractive and in the best interest of both the Company and its shareholders, subject to compliance with applicable laws and regulations, general market and economic conditions, the financial and regulatory condition of the Company, liquidity and other factors.
There were 434,798 shares of Company common stock repurchased during the year ended December 31, 2023, at a weighted-average price per share of $25.82. No shares of Company common stock were repurchased during the quarter ended December 31, 2023. As of December 31, 2023, authority to repurchase 370,814 shares remains available under the stock repurchase program approved on April 21, 2022.
ITEM 6. [RESERVED].
Not applicable.
ITEM 7. MANAGEMENT’S DISCUSSION AND ANALYSIS OF FINANCIAL CONDITION AND RESULTS OF OPERATIONS.
44
The following discussion and analysis of our financial condition and results of operations should be read in conjunction with the Company’s audited consolidated financial statements and the accompanying notes included in "Item 8: Financial Statements and Supplementary Data." This discussion and analysis contains forward-looking statements that are subject to certain risks and uncertainties and are based on certain assumptions that we believe are reasonable but may prove to be inaccurate. Certain risks, uncertainties and other factors, including those set forth under “Forward-Looking Statements,” “Risk Factors” and elsewhere in this Annual Report on Form 10-K, may cause actual results to differ materially from those projected results discussed in the forward-looking statements appearing in this discussion and analysis. We assume no obligation to update any of these forward-looking statements.
FORWARD-LOOKING STATEMENTS
This Annual Report on Form 10-K contains forward-looking statements. These forward-looking statements reflect our current views with respect to, among other things, future events and our financial performance. These statements are often, but not always, made through the use of words or phrases such as “may,” “should,” “could,” “predict,” “potential,” “believe,” “will likely result,” “expect,” “continue,” “will,” “anticipate,” “seek,” “estimate,” “intend,” “plan,” “projection,” “would” and “outlook,” or the negative version of those words or other comparable words or phrases of a future or forward-looking nature. These forward-looking statements are not historical facts, and are based on current expectations, estimates and projections about our industry, management’s beliefs and certain assumptions made by management, many of which, by their nature, are inherently uncertain and beyond our control. Accordingly, we caution you that any such forward-looking statements are not guarantees of future performance and are subject to risks, assumptions and uncertainties that are difficult to predict. Although we believe that the expectations reflected in these forward-looking statements are reasonable as of the date made, actual results may prove to be materially different from the results expressed or implied by the forward-looking statements.
There are or will be important factors that could cause our actual results to differ materially from those indicated in these forward-looking statements, including, but not limited to, the following:
The foregoing factors should not be construed as exhaustive and should be read together with the other cautionary statements included in this Annual Report on Form 10-K. If one or more events related to these or other risks or uncertainties materialize, or if our underlying assumptions prove to be incorrect, actual results may differ materially from what we anticipate.
45
Accordingly, you should not place undue reliance on any such forward-looking statements. Any forward-looking statement speaks only as of the date on which it is made, and we do not undertake any obligation to publicly update or review any forward-looking statement, whether as a result of new information, future developments or otherwise. New factors emerge from time to time, and it is not possible for us to predict which will arise. In addition, we cannot assess the impact of each factor on our business or the extent to which any factor, or combination of factors, may cause actual results to differ materially from those contained in any forward-looking statements.
General
We were incorporated in 1990 to serve as the holding company for Guaranty Bank & Trust. Since our founding, we have built a reputation based on financial stability and community leadership. In May 2017, we consummated an initial public offering of our common stock, which began trading on the Nasdaq Global Select Market until March 7, 2023, at which time our listing was transferred to the New York Stock Exchange, where our common stock continues to trade.
As of December 31, 2023, we operate 33 banking locations in the East Texas, Dallas/Fort Worth, Central Texas and Greater Houston regions of the state. Our principal executive office is located at 16475 Dallas Parkway, Suite 600, Addison, Texas, 75001 and our telephone number is (888) 572-9881. Our website address is gnty.com. Information contained on our website does not constitute a part of this Report and is not incorporated by reference into this filing or any other report.
As a bank holding company that operates through one segment, we generate most of our revenue from interest on loans and investments, customer service and loan fees, fees related to the sale of mortgage loans, and trust and wealth management services. We incur interest expense on deposits and other borrowed funds, as well as noninterest expense, such as salaries and employee benefits and occupancy expenses. We analyze our ability to maximize income generated from interest earning assets and control the interest expenses of our liabilities, measured as net interest income, through our net interest margin and net interest spread. Net interest income is the difference between interest income on interest-earning assets, such as loans and securities, and interest expense on interest-bearing liabilities, such as deposits and borrowings, which are used to fund those assets. Net interest margin is a ratio calculated as net interest income divided by average interest-earning assets. Net interest spread is the difference between rates earned on interest-earning assets and rates paid on interest-bearing liabilities.
Changes in market interest rates and the interest rates we earn on interest-earning assets or pay on interest-bearing liabilities, as well as in the volume and types of interest-earning assets, interest-bearing and noninterest-bearing liabilities and shareholders’ equity, are usually the largest drivers of periodic changes in net interest spread, net interest margin and net interest income. Fluctuations in market interest rates are driven by many factors, including governmental monetary policies, inflation, deflation, macroeconomic developments, changes in unemployment, the money supply, political and international conditions and conditions in domestic and foreign financial markets. Periodic changes in the volume and types of loans in our loan portfolio are affected by, among other factors, economic and competitive conditions in Texas, as well as developments affecting the real estate, technology, financial services, insurance, transportation, manufacturing and energy sectors within our target markets and throughout the State of Texas.
Critical Accounting Policies
Our consolidated financial statements are prepared in accordance with GAAP and with general practices within the financial services industry. Application of these principles requires management to make estimates and assumptions that affect the amounts reported in the financial statements and accompanying notes. We base our estimates on historical experience and on various other assumptions that we believe to be reasonable under current circumstances. These assumptions form the basis for our judgments about the carrying values of assets and liabilities that are not readily available from independent, objective sources. We evaluate our estimates on an ongoing basis. Use of alternative assumptions may have resulted in significantly different estimates. Actual results may differ from these estimates.
We have identified the following accounting policies and estimates that, due to the difficult, subjective or complex judgments and assumptions inherent in those policies and estimates, and the potential sensitivity of our consolidated financial statements to those judgments and assumptions, is critical to an understanding of our financial condition and results of operations. We believe that the judgments, estimates and assumptions used in the preparation of our financial statements are appropriate.
Loans and Allowance for Credit Losses (ACL)
46
Loans are stated at the amount of unpaid principal, reduced by unearned income and an allowance for credit losses. Interest on loans is recognized using the simple-interest method on the daily balances of the principal amounts outstanding. Fees associated with the origination of loans and certain direct loan origination costs are netted and the net amount is deferred and recognized over the life of the loan as an adjustment of yield.
The accrual of interest on loans is discontinued when there is a clear indication that the borrower’s cash flow may not be sufficient to meet payments as they become due, which is generally when a loan is 90 days past due. A loan may continue to accrue interest, even if it is more than 90 days past due, if the loan is both well collateralized and it is in the process of collection. When a loan is placed on nonaccrual status, all previously accrued and unpaid interest is reversed. Interest income is subsequently recognized on a cash basis as long as the remaining book balance of the asset is deemed to be collectible. If collectability is questionable, then cash payments are applied to principal. Loans are returned to accrual status when all the principal and interest amounts contractually due are brought current and future payments are reasonably assured in accordance with the terms of the loan agreement.
The allowance for credit losses is a valuation account that is deducted from the loans' amortized cost basis to present the net amount expected to be collected on the loans. Loans are charged off against the allowance when management believes the uncollectability of a loan balance is confirmed. Recoveries will not exceed the aggregate of loan amounts previously charged-off and expected to be charged-off.
Management estimates the allowance balance using relevant available information, from internal and external sources, relating to past events, current conditions, and reasonable and supportable forecasts. We use the weighted-average remaining maturity method (WARM method) as the basis for the estimation of expected credit losses. The WARM method uses a historical average annual charge-off rate. This average annual charge-off rate contains loss content over a historical lookback period and is used as a foundation for estimating the credit loss reserve for the remaining outstanding balances of loans in a pool or segment of our loan portfolio at the balance sheet date. The average annual charge-off rate is applied to the contractual term, further adjusted for estimated prepayments, to determine the unadjusted historical charge-off rate. The calculation of the unadjusted historical charge-off rate is then adjusted for current conditions and for reasonable and supportable forecast periods. Adjustments to historical loss information are made for differences in current loan-specific risk characteristics such as differences in underwriting standards, portfolio mix, delinquency level, or term as well as for changes in environmental conditions, such as changes in unemployment rates, property values, or other relevant factors. These qualitative factors serve to compensate for additional areas of uncertainty inherent in the portfolio that are not reflected in our historic loss factors.
The allowance for credit losses is measured on a collective (pool or segment) basis when similar risk characteristics exist. Our loan portfolio segments include both regulatory call report codes and internally identified risk ratings for our commercial loan segments and delinquency status for our consumer loan segments. We also have separate segments for our internally originated SBA loans and for our SBA loans acquired from Westbound Bank.
In general, the loans in our portfolio have low historical credit losses. The credit quality of loans in our portfolio is impacted by delinquency status and debt service coverage generated by our borrowers’ businesses and fluctuations in the value of real estate collateral. Management considers delinquency status to be the most meaningful indicator of the credit quality of one-to-four single family residential, home equity loans and lines of credit and other consumer loans. In general, these types of loans do not begin to show signs of credit deterioration or default until they have been outstanding for some period of time, a process we refer to as “seasoning.” As a result, a portfolio of older loans will usually behave more predictably than a portfolio of newer loans. We consider the majority of our consumer type loans to be “seasoned” and that the credit quality and current level of delinquencies and defaults represents the level of reserve needed in the allowance for credit losses. If delinquencies and defaults were to increase, we may be required to increase our provision for credit losses, which would adversely affect our results of operations and financial condition. Delinquency statistics are updated at least monthly.
Internal risk ratings are considered the most meaningful indicator of credit quality for new commercial and industrial, construction, and commercial real estate loans. Internal risk ratings are a key factor that impacts management’s estimates of loss factors used in determining the amount of the allowance for credit losses. Internal risk ratings are updated on a continuous basis.
Loans with unique risk characteristics are evaluated on an individual basis. Loans evaluated individually are excluded from the collective evaluation. When management determines that foreclosure is probable, expected credit losses are based on the fair value of the collateral at the reporting date, adjusted for selling costs as appropriate.
47
For off-balance sheet credit exposures, we estimate expected credit losses over the contractual period in which we are exposed to credit risk via a contractual obligation to extend credit, unless that obligation is unconditionally cancelable by us. The allowance for credit losses on off-balance sheet credit exposures is adjusted as a provision for credit loss expense. The estimate includes consideration of the likelihood that funding will occur and an estimate of expected credit losses on commitments expected to be funded over its estimated life.
From time to time, we modify our loan agreements for borrowers experiencing financial difficulty. Modifications to loan terms may include a lower interest rate, a reduction of principal, or a longer term to maturity. We review each such modified loan and determine on a case-by-case basis if the loan can be grouped with its like segment for allowance consideration or whether it should be individually evaluated for a specific allowance for credit loss allocation. If individually evaluated, an allowance for credit loss allocation is based on either the present value of estimated future cash flows or the estimated fair value of the underlying collateral.
We have certain lending policies and procedures in place that are designed to maximize loan income with an acceptable level of risk. Management reviews and approves these policies and procedures on a regular basis and makes changes as appropriate. Management receives frequent reports related to loan originations, quality, concentrations, delinquencies, non-performing and potential problem loans. Diversification in the loan portfolio is a means of managing risk associated with fluctuations in economic conditions, both by type of loan and geography.
Commercial and industrial loans are underwritten after evaluating and understanding the borrower’s ability to operate profitably and effectively. Underwriting standards are designed to determine whether the borrower possesses sound business ethics and practices and to evaluate current and projected cash flows to determine the ability of the borrower to repay their obligations as agreed. Commercial and industrial loans are primarily made based on the identified cash flows of the borrower and, secondarily, on the underlying collateral provided by the borrower. Most commercial and industrial loans are secured by the assets being financed or other business assets, such as accounts receivable or inventory, and include personal guarantees.
Real estate loans are also subject to underwriting standards and processes similar to commercial and industrial loans. These loans are underwritten primarily based on projected cash flows and, secondarily, as loans secured by real estate collateral. The repayment of real estate loans is generally largely dependent on the successful operation of the property securing the loans or the business conducted on the property securing the loan. Real estate loans may be more adversely affected by conditions in the real estate markets or in the general economy. The properties securing our real estate portfolio are generally diverse in terms of type and geographic location throughout the State of Texas. This diversity helps us reduce the exposure to adverse economic events that affect any single market or industry.
We utilize methodical credit standards and analysis to supplement our policies and procedures in underwriting consumer loans. Our loan policy addresses types of consumer loans that may be originated as well as the underlying collateral, if secured, which must be perfected. The relatively small individual dollar amounts of consumer loans that are spread over numerous individual borrowers also minimize risk.
Marketable Securities
Securities are classified as held to maturity and carried at amortized cost when management has the positive intent and ability to hold them to maturity. Securities are classified as available for sale when they might be sold before maturity. Securities available for sale are carried at fair value, with unrealized holding gains and losses reported in other comprehensive (loss) income. Management determines the appropriate classification of securities at the time of purchase. Interest income includes amortization and accretion of purchase premiums and discounts. Gains and losses on sales are recorded on the trade date and determined using the specific identification method.
From time to time, we have reclassified certain securities from available for sale to held to maturity. Such transfers are made at fair value at the date of transfer. The unrealized holding gains and losses at the date of transfer are retained in accumulated other comprehensive loss and in the carrying value of the held to maturity securities and are amortized or accreted over the remaining life of the security. These unamortized unrealized losses and unaccreted unrealized gains on our transferred securities are included in accumulated other comprehensive loss on our balance sheet and netted to an unrealized loss of $7.0 million at December 31, 2023. This amount will be amortized out of accumulated other comprehensive loss over the remaining lives of the underlying securities as an adjustment of the yield on those securities.
Management evaluates securities for an allowance for credit losses based on whether they are classified as held to maturity or available for sale. For held to maturity securities, management measures expected credit losses on a collective basis by major security type and credit rating.
48
The estimate of expected credit losses considers historical credit loss information that is then adjusted for current conditions and reasonable and supportable forecasts. For available for sale securities in an unrealized loss position, we first assess whether we intend to sell, or it is more likely than not that we will be required to sell the security before recovery of its amortized cost basis. If either of the criteria regarding intent or requirement to sell is met, the security’s amortized cost basis is written down to fair value through income. For securities available for sale that do not meet the aforementioned criteria, we evaluate whether the decline in fair value has resulted from credit losses or other factors. In making this assessment, management considers the extent to which fair value is less than amortized cost, any changes to the rating of the security by a rating agency, and adverse conditions specifically relate to the security, among other factors. If this assessment indicates that a credit loss exists, the present value of cash flows expected to be collected from the security are compared to the amortized cost basis of the security. If the present value of cash flows expected to be collected is less than the amortized cost basis, a credit loss exists and an allowance for credit losses is recorded for the credit loss, limited by the amount that the fair value is less than the amortized cost basis. Any impairment that has not been recorded through an allowance for credit losses is recognized in other comprehensive (loss) income.
Changes in the allowance for credit losses are recorded as provision for (or reversal of provision for) credit losses expense. Losses are charged against the allowance when management believes the uncollectibility of an available for sale security is confirmed or when either of the criteria regarding intent or requirement to sell is met.
Fair Values of Financial Instruments
Fair values of financial instruments are estimated using relevant market information and other assumptions. Fair value estimates involve uncertainties and matters of significant judgment regarding interest rates, credit risk, prepayments, and other factors, especially in the absence of broad markets for particular items. Changes in assumptions or in market conditions could significantly affect the estimates. The fair value estimates of existing on and off-balance sheet financial instruments do not include the value of anticipated future business or the value of assets and liabilities not considered financial instruments.
Discussion and Analysis of Results of Operations for the Years Ended December 31, 2023 and 2022
A discussion regarding our results of operations for the year ended December 31, 2022 compared to the year ended December 31, 2021 can be found under “Item 7. Management's Discussion and Analysis of Financial Condition and Result of Operations” in our Annual Report on Form 10-K for the year ended December 31, 2022, filed with the SEC on March 10, 2023, which is available on the SEC’s website at www.sec.gov and our Investor Relations website at investors.gnty.com.
Net Interest Income
Our operating results depend primarily on our net interest income. Fluctuations in market interest rates impact the yield and rates paid on interest-earning assets and interest-bearing liabilities, respectively. Changes in the amount and type of interest-earning assets and interest-bearing liabilities also impact our net interest income. To evaluate net interest income, we measure and monitor (1) yields on our loans and other interest-earning assets, (2) the costs of our deposits and other funding sources, (3) our net interest spread and (4) our net interest margin. Because noninterest-bearing sources of funds, such as noninterest-bearing deposits and shareholders’ equity also fund interest-earning assets, net interest margin includes the benefit of these noninterest-bearing sources.
Net interest income, before the provision for credit losses, was $97.0 million for the year ended December 31, 2023 compared to $107.8 million for the year ended December 31, 2022, a decrease of $10.8 million, or 10.1%. The decrease in net interest income before the provision for credit losses resulted primarily from a $44.1 million, or 286.9%, increase in interest expense compared to a $33.3 million increase in interest income during the year ended December 31, 2023.
The $44.1 million increase in interest expense for the year ended December 31, 2023 was primarily related to an increase in the cost of interest-bearing deposits of 207 basis points together with a $28.5 million, or 1.7%, increase in average interest-bearing deposits over the same period in 2022. Interest expense was also affected by a 224 basis point increase in the rate paid on our average outstanding FHLB advances and fed funds purchased, which increased $93.5 million, or 70.4%, compared to the year ended December 31, 2022. The average interest bearing deposit balance increase was primarily the result of depositors transferring funds into money market and certificate of deposit accounts to earn higher interest rates, while the increase in the average balance of FHLB advances was made to satisfy liquidity metrics during the year.
49
The $33.3 million increase in interest income for the year ended December 31, 2023 was primarily related to an increase in the yield on loans of 88 basis points, along with a $225.3 million increase in the average balance of loans in 2023 compared to 2022.
For the year ended December 31, 2023, net interest margin on a taxable equivalent basis and net interest spread were 3.15% and 2.13%, respectively, compared to 3.54% and 3.18% for the year ended December 31, 2022, which reflects a 215 basis point increase in the average rate on interest-bearing liabilities partially offset by a 110 basis point increase in the average yield on interest-earning assets from the prior year.
Average Balance Sheet Amounts, Interest Earned and Yield Analysis
The following table presents an analysis of net interest income and net interest spread for the periods indicated, including average outstanding balances for all major categories of interest-earning assets and interest-bearing liabilities, the interest earned or paid on such amounts, and the average rates earned or paid on such assets or liabilities, respectively. The table also sets forth the net interest margin on average total interest-earning assets for the same periods. Interest earned on loans that are classified as nonaccrual is not recognized in income; however, the balances are reflected in average outstanding balances for the period. For the years ended December 31, 2023 and 2022, the amount of interest income not recognized on nonaccrual loans was not material. Any nonaccrual loans have been included in the table as loans carrying a zero yield.
|
|
Year Ended December 31, |
|
|||||||||||||||||||||
|
|
2023 |
|
|
2022 |
|
||||||||||||||||||
(dollars in thousands) |
|
Average |
|
|
Interest |
|
|
Average |
|
|
Average |
|
|
Interest |
|
|
Average |
|
||||||
ASSETS |
|
|
|
|
|
|
|
|
|
|
|
|
|
|
|
|
|
|
||||||
Interest-earning assets: |
|
|
|
|
|
|
|
|
|
|
|
|
|
|
|
|
|
|
||||||
Total loans(1) |
|
$ |
2,352,154 |
|
|
$ |
136,086 |
|
|
|
5.79 |
% |
|
$ |
2,126,810 |
|
|
$ |
104,503 |
|
|
|
4.91 |
% |
Securities available for sale |
|
|
182,277 |
|
|
|
5,159 |
|
|
|
2.83 |
|
|
|
287,764 |
|
|
|
5,808 |
|
|
|
2.02 |
|
Securities held to maturity |
|
|
449,097 |
|
|
|
11,210 |
|
|
|
2.50 |
|
|
|
518,213 |
|
|
|
10,789 |
|
|
|
2.08 |
|
Nonmarketable equity securities |
|
|
27,371 |
|
|
|
1,288 |
|
|
|
4.71 |
|
|
|
18,791 |
|
|
|
1,246 |
|
|
|
6.63 |
|
Interest-bearing deposits in other banks |
|
|
51,507 |
|
|
|
2,749 |
|
|
|
5.34 |
|
|
|
121,609 |
|
|
|
863 |
|
|
|
0.71 |
|
Total interest-earning assets |
|
|
3,062,406 |
|
|
|
156,492 |
|
|
|
5.11 |
|
|
|
3,073,187 |
|
|
|
123,209 |
|
|
|
4.01 |
|
Allowance for credit losses |
|
|
(31,601 |
) |
|
|
|
|
|
|
|
|
(29,415 |
) |
|
|
|
|
|
|
||||
Noninterest-earning assets |
|
|
220,230 |
|
|
|
|
|
|
|
|
|
216,812 |
|
|
|
|
|
|
|
||||
Total assets |
|
$ |
3,251,035 |
|
|
|
|
|
|
|
|
$ |
3,260,584 |
|
|
|
|
|
|
|
||||
LIABILITIES AND EQUITY |
|
|
|
|
|
|
|
|
|
|
|
|
|
|
|
|
|
|
||||||
Interest-bearing liabilities: |
|
|
|
|
|
|
|
|
|
|
|
|
|
|
|
|
|
|
||||||
Interest-bearing deposits |
|
$ |
1,698,758 |
|
|
$ |
44,981 |
|
|
|
2.65 |
% |
|
$ |
1,670,287 |
|
|
$ |
9,753 |
|
|
|
0.58 |
% |
Advances from FHLB and fed funds purchased |
|
|
226,214 |
|
|
|
11,626 |
|
|
|
5.14 |
|
|
|
132,764 |
|
|
|
3,855 |
|
|
|
2.90 |
|
Line of credit |
|
|
4,168 |
|
|
|
363 |
|
|
|
8.71 |
|
|
|
— |
|
|
|
34 |
|
|
|
— |
|
Subordinated debt |
|
|
47,873 |
|
|
|
2,143 |
|
|
|
4.48 |
|
|
|
46,977 |
|
|
|
1,722 |
|
|
|
3.67 |
|
Securities sold under agreements to repurchase |
|
|
20,635 |
|
|
|
399 |
|
|
|
1.93 |
|
|
|
8,596 |
|
|
|
16 |
|
|
|
0.19 |
|
Total interest-bearing liabilities |
|
|
1,997,648 |
|
|
|
59,512 |
|
|
|
2.98 |
|
|
|
1,858,624 |
|
|
|
15,380 |
|
|
|
0.83 |
|
Noninterest-bearing liabilities: |
|
|
|
|
|
|
|
|
|
|
|
|
|
|
|
|
|
|
||||||
Noninterest-bearing deposits |
|
|
924,945 |
|
|
|
|
|
|
|
|
|
1,082,513 |
|
|
|
|
|
|
|
||||
Accrued interest and other liabilities |
|
|
30,924 |
|
|
|
|
|
|
|
|
|
25,537 |
|
|
|
|
|
|
|
||||
Total noninterest-bearing liabilities |
|
|
955,869 |
|
|
|
|
|
|
|
|
|
1,108,050 |
|
|
|
|
|
|
|
||||
Equity |
|
|
297,518 |
|
|
|
|
|
|
|
|
|
293,910 |
|
|
|
|
|
|
|
||||
Total liabilities and equity |
|
$ |
3,251,035 |
|
|
|
|
|
|
|
|
$ |
3,260,584 |
|
|
|
|
|
|
|
||||
Net interest rate spread(2) |
|
|
|
|
|
|
|
|
2.13 |
% |
|
|
|
|
|
|
|
|
3.18 |
% |
||||
Net interest income |
|
|
|
|
$ |
96,980 |
|
|
|
|
|
|
|
|
$ |
107,829 |
|
|
|
|
||||
Net interest margin(3) |
|
|
|
|
|
|
|
|
3.17 |
% |
|
|
|
|
|
|
|
|
3.51 |
% |
||||
Net interest margin, fully taxable equivalent(4) |
|
|
|
|
|
|
|
|
3.15 |
% |
|
|
|
|
|
|
|
|
3.54 |
% |
||||
|
|
|
|
|
|
|
|
|
|
|
|
|
|
|
|
|
|
|
||||||
(1) Includes average outstanding balances of loans held for sale of $1.2 million and $2.4 million for the years ended December 31, 2023 and 2022, respectively. |
|
|||||||||||||||||||||||
(2) Net interest spread is the average yield on interest-earning assets minus the average rate on interest-bearing liabilities. |
|
|||||||||||||||||||||||
(3) Net interest margin is equal to net interest income divided by average interest-earning assets. |
|
|||||||||||||||||||||||
(4) Net interest margin on a taxable equivalent basis is equal to net interest income adjusted for nontaxable income divided by average interest-earning assets, using a marginal tax rate of 21%. |
|
|||||||||||||||||||||||
50
The following tables present the change in interest income and interest expense for the periods indicated for all major components of interest-earning assets and interest-bearing liabilities and distinguishes between the changes attributable to changes in volume and interest rates. For purposes of this table, changes attributable to both rate and volume that cannot be segregated have been allocated to rate.
|
|
For the Year Ended December 31, 2023 vs. 2022 |
|
|||||||||
|
|
Increase (Decrease) |
|
|
|
|
||||||
|
|
Due to Change in |
|
|
Total Increase |
|
||||||
(in thousands) |
|
Volume |
|
|
Rate |
|
|
(Decrease) |
|
|||
Interest-earning assets: |
|
|
|
|
|
|
|
|
|
|||
Total loans |
|
$ |
11,064 |
|
|
$ |
20,519 |
|
|
$ |
31,583 |
|
Securities available for sale |
|
|
(2,131 |
) |
|
|
1,482 |
|
|
|
(649 |
) |
Securities held to maturity |
|
|
(1,438 |
) |
|
|
1,859 |
|
|
|
421 |
|
Nonmarketable equity securities |
|
|
569 |
|
|
|
(527 |
) |
|
|
42 |
|
Interest-earning deposits in other banks |
|
|
(498 |
) |
|
|
2,384 |
|
|
|
1,886 |
|
Total increase in interest income |
|
$ |
7,566 |
|
|
$ |
25,717 |
|
|
$ |
33,283 |
|
|
|
|
|
|
|
|
|
|
|
|||
Interest-bearing liabilities: |
|
|
|
|
|
|
|
|
|
|||
Interest-bearing deposits |
|
$ |
165 |
|
|
$ |
35,063 |
|
|
$ |
35,228 |
|
Advances from FHLB |
|
|
2,710 |
|
|
|
5,061 |
|
|
|
7,771 |
|
Line of credit |
|
|
329 |
|
|
|
— |
|
|
|
329 |
|
Subordinated debt |
|
|
33 |
|
|
|
388 |
|
|
|
421 |
|
Securities sold under agreements to repurchase |
|
|
23 |
|
|
|
360 |
|
|
|
383 |
|
Total increase in interest expense |
|
|
3,260 |
|
|
|
40,872 |
|
|
|
44,132 |
|
Increase (decrease) in net interest income |
|
$ |
4,306 |
|
|
$ |
(15,155 |
) |
|
$ |
(10,849 |
) |
|
|
For the Year Ended December 31, 2022 vs. 2021 |
|
|||||||||
|
|
Increase (Decrease) |
|
|
|
|
||||||
|
|
Due to Change in |
|
|
Total Increase |
|
||||||
(in thousands) |
|
Volume |
|
|
Rate |
|
|
(Decrease) |
|
|||
Interest-earning assets: |
|
|
|
|
|
|
|
|
|
|||
Total loans |
|
$ |
10,419 |
|
|
$ |
1,587 |
|
|
$ |
12,006 |
|
Securities available for sale |
|
|
(1,315 |
) |
|
|
284 |
|
|
|
(1,031 |
) |
Securities held to maturity |
|
|
9,022 |
|
|
|
(374 |
) |
|
|
8,648 |
|
Nonmarketable equity securities |
|
|
645 |
|
|
|
(139 |
) |
|
|
506 |
|
Interest-earning deposits in other banks |
|
|
(222 |
) |
|
|
752 |
|
|
|
530 |
|
Total increase (decrease) in interest income |
|
$ |
18,549 |
|
|
$ |
2,110 |
|
|
$ |
20,659 |
|
|
|
|
|
|
|
|
|
|
|
|||
Interest-bearing liabilities: |
|
|
|
|
|
|
|
|
|
|||
Interest-bearing deposits |
|
$ |
241 |
|
|
$ |
3,861 |
|
|
$ |
4,102 |
|
Advances from FHLB and fed funds purchased |
|
|
703 |
|
|
|
2,739 |
|
|
|
3,442 |
|
Line of credit |
|
|
(216 |
) |
|
|
34 |
|
|
|
(182 |
) |
Subordinated debentures |
|
|
959 |
|
|
|
63 |
|
|
|
1,022 |
|
Securities sold under agreements to repurchase |
|
|
(5 |
) |
|
|
9 |
|
|
|
4 |
|
Total increase in interest expense |
|
|
1,682 |
|
|
|
6,706 |
|
|
|
8,388 |
|
Increase in net interest income |
|
$ |
16,867 |
|
|
$ |
(4,596 |
) |
|
$ |
12,271 |
|
Provision for Credit Losses
The provision for credit losses is a charge to income in order to bring our allowance for credit losses to a level deemed appropriate by management based on factors such as historical loss experience, trends in classified and past due loans, volume and growth in the loan portfolio, current economic conditions in our markets and value of the underlying collateral. Loans are charged off against the allowance for credit losses when determined appropriate. Although management believes it uses the best information available to make determinations with respect to the provision for credit losses, future adjustments may be necessary if economic conditions differ from the assumptions used in making the determination. For a full description of the factors taken into account by our management in determining the allowance for credit losses see “— Financial Condition—Allowance for Credit Losses.”
During the year ended December 31, 2023, we recorded no provision for credit losses, compared to a provision of $2.2 million in 2022. At the onset of the COVID pandemic in 2020, we established COVID-specific qualitative factors to estimate the potential impact of the pandemic to our loan portfolio as a whole, which led to a provision during 2020 of $13.2 million.
51
As the economic, health and other impacts of the virus became more clear and cases began to decline, we reduced the COVID-specific qualitative factors during 2021 and fully unwound these specific factors during the first quarter of 2022, which resulted in a $1.25 million reverse provision during the first quarter of 2022, no provision in the second quarter of 2022 and a $650,000 reverse provision in the third quarter of 2022. During the fourth quarter of 2022, we recorded a $2.8 million provision to incorporate economic forecasts for an economic downturn and possible borrower stressors into our current expected credit loss model ("CECL") model. The factors that were adjusted in the fourth quarter of 2022 are still relevant, however certain minor adjustments were made in subsequent quarters to reflect current portfolio credit quality trends. As of December 31, 2023, our allowance for credit losses as a percentage of total loans was 1.33%.
As of December 31, 2023, there were $9.8 million in loan balances past due 30 or more days, which included $4.2 million in loan balances for nonperforming (nonaccrual) loans, compared to $14.1 million and 9.6 million, respectively, as of December 31, 2022. The decrease in nonperforming assets during the year ended December 31, 2023 compared to 2022 resulted primarily from the resolution of several nonperforming assets during the second quarter of 2023, four of which had outstanding principal balances of $6.7 million and were Small Business Administration (SBA) 7(a), partially guaranteed (75%) loans, acquired in the June 2018 acquisition of Westbound Bank. An additional nonperforming loan with an outstanding balance of $1.4 million was resolved in the second quarter of 2023 and paid off. Each of these nonperforming assets was resolved with minimal incurred losses. Total nonperforming (nonaccrual) loans were $5.6 million and $10.8 million as of December 31, 2023 and 2022, respectively.
Net charge-offs for the year ended December 31, 2023 totaled $1.1 million, compared to $609,000 in 2022. The increase in net charge-offs was primarily due to slight upward trends in smaller dollar loan and overdraft charge-offs, as well as a $373,000 charge-off of a C&I loan in the current year.
The following table shows the ratio of net charge-offs (recoveries) to average loans outstanding by loan category for the dates indicated:
|
|
Year Ended December 31, |
|
|||||||||
|
|
2023 |
|
|
2022 |
|
|
2021 |
|
|||
Commercial and industrial |
|
|
0.15 |
% |
|
|
0.04 |
% |
|
|
0.10 |
% |
Real estate: |
|
|
|
|
|
|
|
|
|
|||
Commercial real estate |
|
|
0.03 |
% |
|
|
— |
|
|
|
0.13 |
% |
1-4 family residential |
|
|
— |
|
|
|
(0.01 |
%) |
|
|
— |
|
Consumer |
|
|
0.12 |
% |
|
|
0.48 |
% |
|
|
0.23 |
% |
Agricultural |
|
|
0.01 |
% |
|
|
— |
|
|
|
(0.05 |
%) |
Overdrafts |
|
|
64.52 |
% |
|
|
55.85 |
% |
|
|
49.85 |
% |
Net charge-offs to total loans |
|
|
0.04 |
% |
|
|
0.03 |
% |
|
|
0.08 |
% |
Noninterest Income
Our primary sources of recurring noninterest income are service charges on deposit accounts, merchant and debit card fees, fiduciary income, gains on the sale of both mortgage and SBA loans, and income from bank-owned life insurance. Noninterest income does not include loan origination fees to the extent they exceed the direct loan origination costs, which are generally recognized over the life of the related loan as an adjustment to yield using the interest method.
The following table presents components of noninterest income for the years ended December 31, 2023 and 2022 and the period-over-period variations in the categories of noninterest income:
|
|
Year Ended December 31, |
|
|
Increase |
|
||||||
(in thousands) |
|
2023 |
|
|
2022 |
|
|
2023 vs. 2022 |
|
|||
Noninterest income: |
|
|
|
|
|
|
|
|
|
|||
Service charges |
|
$ |
4,387 |
|
|
$ |
4,288 |
|
|
$ |
99 |
|
Net realized (loss) gain on securities transactions |
|
|
(229 |
) |
|
|
172 |
|
|
|
(401 |
) |
Gain on sale of loans |
|
|
1,201 |
|
|
|
2,435 |
|
|
|
(1,234 |
) |
Fiduciary and custodial income |
|
|
2,529 |
|
|
|
2,498 |
|
|
|
31 |
|
Bank-owned life insurance income |
|
|
941 |
|
|
|
842 |
|
|
|
99 |
|
Merchant and debit card fees |
|
|
7,307 |
|
|
|
7,121 |
|
|
|
186 |
|
Loan processing fee income |
|
|
520 |
|
|
|
761 |
|
|
|
(241 |
) |
Mortgage fee income |
|
|
194 |
|
|
|
389 |
|
|
|
(195 |
) |
Other noninterest income |
|
|
5,663 |
|
|
|
4,979 |
|
|
|
684 |
|
Total noninterest income |
|
$ |
22,513 |
|
|
$ |
23,485 |
|
|
$ |
(972 |
) |
52
Total noninterest income decreased $972,000, or 4.1%, for the year ended December 31, 2023 compared to 2022. Material changes in the components of noninterest income are discussed below.
Service Charges on Deposit Accounts. We earn fees from our customers for deposit related services, and these fees typically constitute a significant and generally predictable component of our non-interest income. Service fee income was $4.4 million for the year ended December 31, 2023 compared to $4.3 million for the same period in 2022, an increase of $99,000, or 2.3%, resulting from growth in the number of DDAs and debit card usage volume during 2023. The total number of DDAs increased by 1,299 accounts, from 54,867 as of December 31, 2022 to 56,166 as of December 31, 2023.
Net Realized (Loss) Gain on Securities Transactions. We sell securities from time-to-time, which results in gains or losses being recognized in the income statement as noninterest income. During the years ended December 31, 2023 and 2022 we sold securities for a net loss of $229,000 and a net gain of $172,000, respectively.
Gain on Sale of Loans. We originate long-term fixed-rate mortgage loans and Small Business Administration (SBA) loans for resale into the secondary market. We sold 162 mortgage loans for $42.3 million during the year ended December 31, 2023 compared to 271 mortgage loans for $72.8 million for the year ended December 31, 2022, which is consistent with the industry wide decline in overall mortgage volumes attributable to increased mortgage loan rates during the year. Gain on sale of loans was $1.2 million for the year ended December 31, 2023, a decrease of $1.2 million, or 50.7%, compared to $2.4 million for the year ended December 31, 2022. $1.0 million and $162,000 of the gain in the current year was attributable to the sales of mortgage loans and SBA 7(a) loans, respectively, while the gain during the prior year consisted of $2.0 million in mortgage loan sales and $392,000 in SBA 7(a) loan sales.
Fiduciary and Custodial Income. We have trust powers and provide fiduciary and custodial services through our trust and wealth management division. Fiduciary income was $2.5 million for the years ended December 31, 2023 and 2022, which represented an increase of $31,000, or 1.2%. The increase in revenue resulted primarily from 44 new accounts that were opened in 2023, which have generated additional income. Furthermore, revenue for our services fluctuates by month with the market value for all publicly traded assets, which are primarily held in irrevocable trusts and investment management accounts that carry higher fees. Additionally, our custody-only assets are carried in a tiered percentage rate fee schedule charged against market value.
Bank-Owned Life Insurance Income. We invest in bank-owned life insurance due to its attractive nontaxable return and protection against the loss of our key employees. We record income based on the growth of the cash surrender value of these policies as well as the annual yield net of fees and charges, including mortality charges. Income from bank-owned life insurance increased by $99,000, or 11.8%, for the year ended December 31, 2023, compared to 2022. The increase in income is primarily attributable to additional policies purchased on the lives of existing officers of the Company and higher crediting rates due to increases in interest rates.
Merchant and Debit Card Fees. We earn interchange income related to the activity of our customers’ merchant debit card usage. Debit card interchange income was $7.3 million for the year ended December 31, 2023, compared to $7.1 million for 2022, an increase of $186,000, or 2.6%. The increase was primarily due to growth in the number of DDAs and debit card usage volume during 2023. The total number of DDAs increased by 1,299 accounts, from 54,867 as of December 31, 2022 to 56,166 as of December 31, 2023.
Loan Processing Fee Income. Revenue earned from collection of loan processing fees was $520,000 for the year ended December 31, 2023, compared to $761,000 for 2022, a decrease of $241,000, or 31.7%. The decrease in loan processing fee income is primarily attributable to a decrease in the volume of newly originated, renewed or extended loans during the period.
Mortgage Fee Income. Mortgage fee income consists of lender processing fees such as underwriting fees, administrative fees and funding fees that are collected from mortgage loans that the Bank intends to sell on the secondary
market. The decrease of $195,000, or 50.1%, from December 31, 2022 was primarily due to a lower volume of mortgage purchases and refinances during 2023.
Other. This category includes a variety of other income producing activities, including loan origination fees, wire transfer fees, loan administration fees, and other fee income. Other noninterest income increased $684,000, or 13.7%, for the year ended December 31, 2023, compared to 2022, resulting primarily from a one-time gain on the sale of nonmarketable correspondent bank stock of $2.8 million during the year ended December 31, 2023. This was partially offset by one-time net gains in 2022 of $894,000 for the sale of an airplane and $685,000 from the termination of three interest rate swaps, which were not present in 2023. Additionally, there was a decrease in warehouse lending fees of $251,000 due to the closure of the business line during 2023, and a $138,000 downward adjustment on the fair value of our SBA servicing assets in 2023.
53
Noninterest Expense
Generally, noninterest expense is composed of all employee expenses and costs associated with operating our facilities, obtaining and retaining customer relationships and providing bank services. The largest component of noninterest expense is salaries and employee benefits. Noninterest expense also includes operational expenses, such as occupancy expenses, depreciation and amortization of our facilities and our furniture, fixtures and office equipment, professional and regulatory fees, including FDIC assessments, data processing expenses, and advertising and promotion expenses.
For the year ended December 31, 2023, noninterest expense totaled $82.4 million, an increase of $2.4 million, or 3.1%, compared to $79.9 million for the year ended December 31, 2022. The following table presents, for the periods indicated, the major categories of noninterest expense:
|
|
Year Ended December 31, |
|
|
Increase |
|
||||||
(in thousands) |
|
2023 |
|
|
2022 |
|
|
2023 vs. 2022 |
|
|||
Employee compensation and benefits |
|
$ |
48,862 |
|
|
$ |
47,477 |
|
|
$ |
1,385 |
|
Non-staff expenses: |
|
|
|
|
|
|
|
|
|
|||
Occupancy expenses |
|
|
11,301 |
|
|
|
11,129 |
|
|
|
172 |
|
Legal and professional fees |
|
|
3,424 |
|
|
|
2,825 |
|
|
|
599 |
|
Software and technology |
|
|
6,157 |
|
|
|
5,482 |
|
|
|
675 |
|
Amortization |
|
|
602 |
|
|
|
724 |
|
|
|
(122 |
) |
Director and committee fees |
|
|
778 |
|
|
|
836 |
|
|
|
(58 |
) |
Advertising and promotions |
|
|
1,176 |
|
|
|
1,593 |
|
|
|
(417 |
) |
ATM and debit card expense |
|
|
2,904 |
|
|
|
2,715 |
|
|
|
189 |
|
Telecommunication expense |
|
|
707 |
|
|
|
750 |
|
|
|
(43 |
) |
FDIC insurance assessment fees |
|
|
1,507 |
|
|
|
1,101 |
|
|
|
406 |
|
Other noninterest expense |
|
|
4,936 |
|
|
|
5,275 |
|
|
|
(339 |
) |
Total noninterest expense |
|
$ |
82,354 |
|
|
$ |
79,907 |
|
|
$ |
2,447 |
|
Material changes in the components of noninterest expense are discussed below.
Employee Compensation and Benefits. Salaries and employee benefits are the largest component of noninterest expense and include payroll expense, the cost of incentive compensation, benefit plans, health insurance and payroll taxes. Salaries and employee benefits were $48.9 million for the year ended December 31, 2023, an increase of $1.4 million, or 2.9%, compared to $47.5 million in 2022. Employee compensation and benefits expense increased due to higher salaries and employee benefits of $2.5 million, partially offset by a $1.4 million decrease in bonus expense due to lower net earnings during 2023 compared to 2022.
Legal and Professional Fees. Legal and professional fees, which include audit, loan review and regulatory assessments other than FDIC insurance assessment fees, were $3.4 million and $2.8 million for the years ended December 31, 2023 and 2022, respectively, an increase of $599,000, or 21.2%. The increase resulted primarily from increased audit and legal fees during 2023, as well as recruiting fees paid to acquire new talent.
Software and Technology. Software and technology expenses increased $675,000, or 12.3%, from $5.5 million for the year ended December 31, 2022 to $6.2 million for the year ended December 31, 2023. The increase is attributable primarily to new software investments to enhance automation and efficiencies, digital banking initiatives, cybersecurity monitoring and tools, and other technology capabilities. We also moved to a higher asset tier for billing related to our core processing system, which resulted in higher expense paid during the year ended December 31, 2023.
Amortization. Amortization costs include amortization of software and core deposit premiums. Amortization costs were $602,000 for the year ended December 31, 2023, a decrease of $122,000, or 16.9%, compared to $724,000 in 2022. The decrease in amortization expense during 2023 was due to a $110,000 decrease in amortization expense on core deposit intangibles associated with previously acquired deposits being fully amortized and a $12,000 decrease in software amortization.
Advertising and Promotions. Advertising and promotion-related expenses were $1.2 million and $1.6 million for the years ended December 31, 2023 and 2022, respectively, a decrease of $417,000, or 26.2%. The decrease was primarily due to decreased advertising and vendor costs in the current period compared to the same period in the prior year.
54
ATM and Debit Card Expense. We pay processing fees related to the activity of our customers’ ATM and debit card usage. ATM and debit card expenses were $2.9 million for the year ended December 31, 2023, an increase of $189,000, or 7.0%, compared to $2.7 million for the same period in 2022 as a result of increased ATM and debit card usage by our customers.
FDIC Insurance Assessment Fees. FDIC insurance assessment fees were $1.5 million for the year ended December 31, 2023, an increase of $406,000, or 36.9%, compared to $1.1 million for the same period in 2022. The increase was primarily due to an increase in the insurance assessment rate resulting from changes in certain financial ratios used in the calculation and an overall increase in our assessment base, which is calculated as average total assets less average tangible equity.
Income Tax Expense
The amount of income tax expense we incur is influenced by the amounts of our pre-tax income, tax-exempt income and other nondeductible expenses. Deferred tax assets and liabilities are reflected at current income tax rates in effect for the period in which the deferred tax assets and liabilities are expected to be realized or settled. As changes in tax laws or rates are enacted, deferred tax assets and liabilities are adjusted through the provision for income taxes. Valuation allowances are established when necessary to reduce deferred tax assets to the amount expected to be realized.
For the year ended December 31, 2023 and 2022, income tax expense totaled $7.1 million and $8.8 million, respectively. The $1.7 million decrease in income tax expense was primarily due to a decrease in net earnings before taxes of $12.1 million. Our effective tax rates for the years ended December 31, 2023 and 2022 were 19.20% and 17.93%, respectively.
Discussion and Analysis of Financial Condition as of December 31, 2023
Assets
Our total assets decreased $166.7 million, or 5.0%, from $3.35 billion as of December 31, 2022 to $3.18 billion as of December 31, 2023. Our decline was primarily due to a $97.5 million decrease in total investment securities, and a decrease in gross loans of $55.6 million. Additionally, our cash and cash equivalents decreased $16.9 million.
Loan Portfolio
Our primary source of income is derived through interest earned on loans to small- to medium-sized businesses, commercial companies, professionals and individuals located in our primary market areas. A substantial portion of our loan portfolio consists of commercial and industrial loans and real estate loans secured by commercial real estate properties located in our primary market areas. Our loan portfolio represents the highest yielding component of our earning asset base.
As of December 31, 2023, total gross loans held for investment were $2.32 billion, a decrease of $55.6 million, or 2.3%, from the December 31, 2022 balance of $2.38 billion. In addition to these amounts, $976,000 and $3.2 million in loans were classified as held for sale as of December 31, 2023 and 2022, respectively. The decrease in loans resulted from lower demand as a result of higher interest rates and from more conservative underwriting due to several macro-economic factors, including impacts of interest rate increases on debt service coverage and declines in values of commercial real estate, among others.
Total loans, excluding those held for sale, as a percentage of deposits, were 88.2% and 88.7% as of December 31, 2023 and 2022, respectively. Total loans, excluding those held for sale, as a percentage of total assets, were 72.9% and 71.0% as of December 31, 2023 and 2022, respectively.
55
The following table summarizes our loan portfolio by type of loan as of the dates indicated:
|
|
As of December 31, |
|
|||||||||||||||||||||
|
|
2023 |
|
|
2022 |
|
|
2021 |
|
|||||||||||||||
(dollars in thousands) |
|
Amount |
|
|
Percent |
|
|
Amount |
|
|
Percent |
|
|
Amount |
|
|
Percent |
|
||||||
Commercial and industrial |
|
$ |
287,565 |
|
|
|
12.38 |
% |
|
$ |
314,067 |
|
|
|
13.21 |
% |
|
$ |
324,289 |
|
|
|
17.00 |
% |
Real estate: |
|
|
|
|
|
|
|
|
|
|
|
|
|
|
|
|
|
|
||||||
Construction and development |
|
|
296,639 |
|
|
|
12.77 |
% |
|
|
377,135 |
|
|
|
15.86 |
% |
|
|
307,797 |
|
|
|
16.13 |
% |
Commercial real estate |
|
|
923,195 |
|
|
|
39.74 |
% |
|
|
887,587 |
|
|
|
37.32 |
% |
|
|
622,842 |
|
|
|
32.64 |
% |
Farmland |
|
|
186,295 |
|
|
|
8.02 |
% |
|
|
185,817 |
|
|
|
7.81 |
% |
|
|
145,501 |
|
|
|
7.63 |
% |
1-4 family residential |
|
|
514,603 |
|
|
|
22.16 |
% |
|
|
493,061 |
|
|
|
20.73 |
% |
|
|
410,673 |
|
|
|
21.52 |
% |
Multi-family residential |
|
|
44,292 |
|
|
|
1.91 |
% |
|
|
45,147 |
|
|
|
1.90 |
% |
|
|
30,971 |
|
|
|
1.62 |
% |
Consumer and overdrafts |
|
|
57,302 |
|
|
|
2.47 |
% |
|
|
61,676 |
|
|
|
2.59 |
% |
|
|
51,328 |
|
|
|
2.69 |
% |
Agricultural |
|
|
12,685 |
|
|
|
0.55 |
% |
|
|
13,686 |
|
|
|
0.58 |
% |
|
|
14,639 |
|
|
|
0.77 |
% |
Total loans held for investment |
|
$ |
2,322,576 |
|
|
|
100.00 |
% |
|
$ |
2,378,176 |
|
|
|
100.00 |
% |
|
$ |
1,908,040 |
|
|
|
100.00 |
% |
Total loans held for sale |
|
$ |
976 |
|
|
|
|
|
$ |
3,156 |
|
|
|
|
|
$ |
4,129 |
|
|
|
|
|||
Commercial and Industrial. Commercial and industrial loans are underwritten after evaluating and understanding the borrower’s ability to operate profitably and effectively. These loans are primarily made based on the identified cash flows of the borrower, and secondarily, on the underlying collateral provided by the borrower. Most commercial and industrial loans are secured by the assets being financed or other business assets, such as accounts receivable or inventory, and generally include personal guarantees. Commercial and industrial loans decreased $26.5 million, or 8.4%, from $314.1 million as of December 31, 2022 to $287.6 million as of December 31, 2023. The decrease in the commercial and industrial portfolio was partially due to a $10.7 million decrease in our warehouse lending portfolio, which we unwound during 2023, as well as paydowns and payoffs during the year in the normal course of business.
Construction and Development. Construction and land development loans are comprised of loans to fund construction, land acquisition and land development construction. The properties securing the portfolio are located throughout Texas and are generally diverse in terms of type. Construction and development loans decreased $80.5 million, or 21.3%, to $296.6 million as of December 31, 2023 from $377.1 million as of December 31, 2022. The decrease resulted primarily from completion of construction projects that were started in 2021 or 2022 and fewer new construction projects approved and funded in the current year.
Commercial Real Estate. Commercial real estate loans are underwritten primarily based on projected cash flows and, secondarily, as loans secured by real estate. These loans may be more adversely affected by conditions in the real estate markets or in the general economy. The properties securing the portfolio are located primarily within our markets and are generally diverse in terms of type. This diversity helps reduce our exposure to adverse economic events that affect any single industry. Commercial real estate loans increased $35.6 million, or 4.0%, to $923.2 million as of December 31, 2023 from $887.6 million as of December 31, 2022. The increase in commercial real estate loans during the period was driven by organic growth and movement of construction projects into permanent financing.
Farmland. Farmland loans are comprised of loans used for agricultural purposes, and include land with a 1-4 family residential structure if the value of the land exceeds the value of the residence. These loans are subject to risk related to climate change, fluctuations in feed and cattle prices and changes in property values. Farmland loans increased $478,000, or 0.3%, to $186.3 million as of December 31, 2023 from $185.8 million as of December 31, 2022.
1-4 Family Residential. Our 1-4 family residential loan portfolio is comprised of loans secured by 1-4 family homes, which are both owner occupied and investor owned. Our 1-4 family residential loans have a relatively small average balance spread across many individual borrowers compared to our other loan categories. Our 1-4 family residential loans increased $21.5 million, or 4.4%, to $514.6 million as of December 31, 2023 from $493.1 million as of December 31, 2022. This increase is due to normal fluctuations in residential loans, as well as the decision by some borrowers to forego long-term fixed rate secondary market loans and instead financing 1-4 family properties directly with our bank at more favorable shorter-term variable rate loans.
Other Loan Categories. Other categories of loans included in our loan portfolio include agricultural loans made to farmers and ranchers relating to their operations, multi-family residential loans and consumer loans. None of these categories of loans represents a significant portion of our total loan portfolio.
56
Contractual Loan Maturities. The contractual maturity ranges of loans in our loan portfolio and the amount of such loans with fixed and floating interest rates in each maturity range as of December 31, 2023 are summarized in the following table:
|
|
As of December 31, 2023 |
|
|||||||||||||||||
(in thousands) |
|
One Year |
|
|
After One |
|
|
After Five |
|
|
After |
|
|
Total |
|
|||||
Commercial and industrial |
|
$ |
107,393 |
|
|
$ |
116,695 |
|
|
$ |
60,930 |
|
|
$ |
2,547 |
|
|
$ |
287,565 |
|
Real estate: |
|
|
|
|
|
|
|
|
|
|
|
|
|
|
|
|||||
Construction and development |
|
|
152,657 |
|
|
|
50,860 |
|
|
|
57,850 |
|
|
|
35,272 |
|
|
|
296,639 |
|
Commercial real estate |
|
|
57,896 |
|
|
|
225,121 |
|
|
|
332,543 |
|
|
|
307,635 |
|
|
|
923,195 |
|
Farmland |
|
|
32,022 |
|
|
|
66,939 |
|
|
|
43,561 |
|
|
|
43,773 |
|
|
|
186,295 |
|
1-4 family residential |
|
|
31,795 |
|
|
|
34,016 |
|
|
|
186,632 |
|
|
|
262,160 |
|
|
|
514,603 |
|
Multi-family residential |
|
|
1,399 |
|
|
|
20,846 |
|
|
|
16,967 |
|
|
|
5,080 |
|
|
|
44,292 |
|
Consumer |
|
|
13,861 |
|
|
|
39,418 |
|
|
|
1,896 |
|
|
|
2,127 |
|
|
|
57,302 |
|
Agricultural |
|
|
8,220 |
|
|
|
4,029 |
|
|
|
436 |
|
|
|
— |
|
|
|
12,685 |
|
Total loans |
|
$ |
405,243 |
|
|
$ |
557,924 |
|
|
$ |
700,815 |
|
|
$ |
658,594 |
|
|
$ |
2,322,576 |
|
Amounts with fixed rates |
|
$ |
251,010 |
|
|
$ |
423,484 |
|
|
$ |
42,093 |
|
|
$ |
35,395 |
|
|
$ |
751,982 |
|
Amounts with adjustable rates |
|
$ |
154,233 |
|
|
$ |
134,440 |
|
|
$ |
658,722 |
|
|
$ |
623,199 |
|
|
$ |
1,570,594 |
|
Nonperforming Assets
Loans are considered past due if the required principal and interest payments have not been received as of the date such payments were due. Loans are placed on nonaccrual status when, in management’s opinion, the borrower may be unable to meet payment obligations as they become due, as well as when required by regulatory provisions. Loans may be placed on nonaccrual status regardless of whether or not such loans are considered past due. In general, we place loans on nonaccrual status when they become 90 days past due. We also place loans on nonaccrual status if they are less than 90 days past due if the collection of principal or interest is in doubt. When interest accrual is discontinued, all unpaid accrued interest is reversed from income. Interest income is subsequently recognized only to the extent cash payments are received in excess of principal due. Loans are returned to accrual status when all the principal and interest amounts contractually due are brought current and future payments are, in management’s opinion, reasonably assured.
We believe our conservative lending approach and focused management of nonperforming assets has resulted in sound asset quality and timely resolution of problem assets. We have several procedures in place to assist us in maintaining the overall quality of our loan portfolio. We have established underwriting guidelines to be followed by our bankers, and we also monitor our delinquency levels for any negative or adverse trends. There can be no assurance, however, that our loan portfolio will not become subject to increasing pressures from deteriorating borrower credit due to general economic conditions.
Nonperforming assets as a percentage of total loans were 0.25% at December 31, 2023, compared to 0.46% at December 31, 2022. The Bank’s nonperforming assets consist primarily of nonaccrual loans. The decrease in nonperforming assets is primarily due to the resolution of several nonperforming assets during the second quarter, four of which had outstanding principal balances of $6.7 million and were Small Business Administration (SBA) 7(a), partially guaranteed (75%) loans, acquired in the June 2018 acquisition of Westbound Bank. An additional nonperforming loan with an outstanding balance of $1.4 million was resolved in the second quarter and paid off. Each of these nonperforming assets were resolved with minimal incurred losses.
57
The following table presents information regarding nonperforming assets as of the dates indicated:
|
|
As of December 31, |
|
|||||||||
(dollars in thousands) |
|
2023 |
|
|
2022 |
|
|
2021 |
|
|||
Nonaccrual loans |
|
$ |
5,592 |
|
|
$ |
10,848 |
|
|
$ |
2,831 |
|
Accruing loans 90 or more days past due |
|
|
— |
|
|
|
— |
|
|
|
— |
|
Total nonperforming loans |
|
|
5,592 |
|
|
|
10,848 |
|
|
|
2,831 |
|
Other real estate owned: |
|
|
|
|
|
|
|
|
|
|||
Residential real estate |
|
|
— |
|
|
|
38 |
|
|
|
— |
|
Total other real estate owned |
|
|
— |
|
|
|
38 |
|
|
|
— |
|
Repossessed assets owned |
|
|
234 |
|
|
|
— |
|
|
|
14 |
|
Total other assets owned |
|
|
234 |
|
|
|
38 |
|
|
|
14 |
|
Total nonperforming assets |
|
$ |
5,826 |
|
|
$ |
10,886 |
|
|
$ |
2,845 |
|
Ratio of nonaccrual loans to total loans(1) |
|
|
0.24 |
% |
|
|
0.46 |
% |
|
|
0.15 |
% |
Ratio of allowance for credit losses to nonaccrual loans |
|
|
552.93 |
% |
|
|
294.75 |
% |
|
|
1074.99 |
% |
Ratio of nonperforming assets to total assets |
|
|
0.18 |
% |
|
|
0.32 |
% |
|
|
0.09 |
% |
|
|
|
|
|
|
|
|
|
|
|||
(1) Excludes loans held for sale of $976,000, $3.2 million and $4.1 million for the years ended December 31, 2023, 2022 and 2021, respectively. |
|
|||||||||||
The following table presents information regarding nonaccrual loans by category as of the dates indicated:
|
|
As of December 31, |
|
|||||||||
(dollars in thousands) |
|
2023 |
|
|
2022 |
|
|
2021 |
|
|||
Nonaccrual loans by category: |
|
|
|
|
|
|
|
|
|
|||
Commercial and industrial |
|
$ |
1,777 |
|
|
$ |
115 |
|
|
$ |
148 |
|
Real estate: |
|
|
|
|
|
|
|
|
|
|||
Construction and development |
|
|
117 |
|
|
|
1,435 |
|
|
|
— |
|
Commercial real estate |
|
|
132 |
|
|
|
7,271 |
|
|
|
642 |
|
Farmland |
|
|
164 |
|
|
|
109 |
|
|
|
298 |
|
1-4 family residential |
|
|
2,793 |
|
|
|
1,691 |
|
|
|
1,535 |
|
Multi-family residential |
|
|
— |
|
|
|
— |
|
|
|
— |
|
Consumer |
|
|
250 |
|
|
|
170 |
|
|
|
160 |
|
Agricultural |
|
|
359 |
|
|
|
57 |
|
|
|
48 |
|
Total |
|
$ |
5,592 |
|
|
$ |
10,848 |
|
|
$ |
2,831 |
|
Potential Problem Loans
From a credit risk standpoint, we classify loans in one of five risk ratings: pass, special mention, substandard, doubtful or loss. Within the pass rating, we classify loans into one of the following five subcategories based on perceived credit risk, including repayment capacity and collateral security: superior, excellent, good, acceptable and acceptable/watch. The classifications of loans reflect a judgment about the risks of default and loss associated with the loan. We review the ratings on credits monthly. Ratings are adjusted to reflect the degree of risk and loss that is believed to be inherent in each credit as of each monthly reporting period. Our methodology is structured so that specific ACL allocations are increased in accordance with deterioration in credit quality (and a corresponding increase in risk and loss) or decreased in accordance with improvement in credit quality (and a corresponding decrease in risk and loss).
Credits rated special mention show clear signs of financial weaknesses or deterioration in creditworthiness; however, such concerns are not so pronounced that we generally expect to experience significant loss within the short-term. Such credits typically maintain the ability to perform within standard credit terms and credit exposure is not as prominent as credits with a lower rating.
Credits rated substandard are those in which the normal repayment of principal and interest may be, or has been, jeopardized by reason of adverse trends or developments of a financial, managerial, economic or political nature, or important weaknesses which exist in collateral. A protracted workout on these credits is a distinct possibility. Prompt corrective action is therefore required to reduce exposure and to assure that adequate remedial measures are taken by the borrower. Credit exposure becomes more likely in such credits and a serious evaluation of the secondary support to the credit is performed.
Credits rated as doubtful have the weaknesses of substandard assets with the additional characteristic that the weaknesses make collection or liquidation in full questionable and there is a high probability of loss based on currently existing facts, conditions and values.
58
Credits rated as loss are charged-off. We have no expectation of the recovery of any payments in respect of credits rated as loss.
The following tables summarize the internal ratings of our performing, classified and nonaccrual (as well as substandard) loans, by category, as of:
|
|
December 31, 2023 |
|
|||||||||||||||||||||||||
(in thousands) |
|
Pass |
|
|
Special Mention |
|
|
Substandard |
|
|
Doubtful |
|
|
Loss |
|
|
Nonaccrual |
|
|
Total |
|
|||||||
Commercial and industrial |
|
$ |
283,202 |
|
|
$ |
1,503 |
|
|
$ |
1,083 |
|
|
$ |
— |
|
|
$ |
— |
|
|
$ |
1,777 |
|
|
$ |
287,565 |
|
Real estate: |
|
|
|
|
|
|
|
|
|
|
|
|
|
|
|
|
|
|
|
|
|
|||||||
Construction and development |
|
|
296,266 |
|
|
|
— |
|
|
|
256 |
|
|
|
— |
|
|
|
— |
|
|
|
117 |
|
|
|
296,639 |
|
Commercial real estate |
|
|
892,563 |
|
|
|
7,333 |
|
|
|
23,167 |
|
|
|
— |
|
|
|
— |
|
|
|
132 |
|
|
|
923,195 |
|
Farmland |
|
|
186,051 |
|
|
|
— |
|
|
|
80 |
|
|
|
— |
|
|
|
— |
|
|
|
164 |
|
|
|
186,295 |
|
1-4 family residential |
|
|
510,947 |
|
|
|
863 |
|
|
|
— |
|
|
|
— |
|
|
|
— |
|
|
|
2,793 |
|
|
|
514,603 |
|
Multi-family residential |
|
|
44,292 |
|
|
|
— |
|
|
|
— |
|
|
|
— |
|
|
|
— |
|
|
|
— |
|
|
|
44,292 |
|
Consumer and overdrafts |
|
|
57,015 |
|
|
|
37 |
|
|
|
— |
|
|
|
— |
|
|
|
— |
|
|
|
250 |
|
|
|
57,302 |
|
Agricultural |
|
|
12,301 |
|
|
|
— |
|
|
|
25 |
|
|
|
— |
|
|
|
— |
|
|
|
359 |
|
|
|
12,685 |
|
Total |
|
$ |
2,282,637 |
|
|
$ |
9,736 |
|
|
$ |
24,611 |
|
|
$ |
— |
|
|
$ |
— |
|
|
$ |
5,592 |
|
|
$ |
2,322,576 |
|
|
|
December 31, 2022 |
|
|||||||||||||||||||||||||
(in thousands) |
|
Pass |
|
|
Special Mention |
|
|
Substandard |
|
|
Doubtful |
|
|
Loss |
|
|
Nonaccrual |
|
|
Total |
|
|||||||
Commercial and industrial |
|
$ |
311,685 |
|
|
$ |
1,369 |
|
|
$ |
898 |
|
|
$ |
— |
|
|
$ |
— |
|
|
$ |
115 |
|
|
$ |
314,067 |
|
Real estate: |
|
|
|
|
|
|
|
|
|
|
|
|
|
|
|
|
|
|
|
|
|
|||||||
Construction and development |
|
|
374,795 |
|
|
|
905 |
|
|
|
— |
|
|
|
— |
|
|
|
— |
|
|
|
1,435 |
|
|
|
377,135 |
|
Commercial real estate |
|
|
867,426 |
|
|
|
7,321 |
|
|
|
5,569 |
|
|
|
— |
|
|
|
— |
|
|
|
7,271 |
|
|
|
887,587 |
|
Farmland |
|
|
185,615 |
|
|
|
— |
|
|
|
93 |
|
|
|
— |
|
|
|
— |
|
|
|
109 |
|
|
|
185,817 |
|
1-4 family residential |
|
|
491,171 |
|
|
|
199 |
|
|
|
— |
|
|
|
— |
|
|
|
— |
|
|
|
1,691 |
|
|
|
493,061 |
|
Multi-family residential |
|
|
45,147 |
|
|
|
— |
|
|
|
— |
|
|
|
— |
|
|
|
— |
|
|
|
— |
|
|
|
45,147 |
|
Consumer and overdrafts |
|
|
61,456 |
|
|
|
50 |
|
|
|
— |
|
|
|
— |
|
|
|
— |
|
|
|
170 |
|
|
|
61,676 |
|
Agricultural |
|
|
13,594 |
|
|
|
3 |
|
|
|
32 |
|
|
|
— |
|
|
|
— |
|
|
|
57 |
|
|
|
13,686 |
|
Total |
|
$ |
2,350,889 |
|
|
$ |
9,847 |
|
|
$ |
6,592 |
|
|
$ |
— |
|
|
$ |
— |
|
|
$ |
10,848 |
|
|
$ |
2,378,176 |
|
Allowance for Credit Losses
We maintain an allowance for credit losses (“ACL”) that represents management’s best estimate of the appropriate level of losses and risks inherent in our applicable financial assets under CECL. The amount of the allowance for credit losses should not be interpreted as an indication that charge-offs in future periods will necessarily occur in those amounts, or at all. The determination of the amount of allowance involves a high degree of judgment and subjectivity. Refer to Note 1 of the notes to the financial statements for discussion regarding our ACL methodologies for loans held for investment and available for sale securities.
For available for sale debt securities in an unrealized loss position, the Company evaluates the securities at each measurement date to determine whether the decline in the fair value below the amortized cost basis (impairment) is due to credit-related factors or noncredit-related factors, including changes in interest rates. Any impairment that is not credit related is recognized in other comprehensive (loss) income, net of applicable taxes. Credit-related impairment is recognized as an ACL on the balance sheet, limited to the amount by which the amortized cost basis exceeds the fair value, with a corresponding adjustment to earnings through provision for credit loss expense. As of December 31, 2023, the Company determined that all available for sale securities that experienced a decline in fair value below the amortized costs basis were due to noncredit-related factors, therefore no related ACL was recorded and there was no related provision expense recognized during the year ended December 31, 2023.
For held to maturity debt securities, the Company evaluates expected credit losses on a collective basis by major security type with each type sharing similar risk characteristics, and considers historical credit loss information that is adjusted for current conditions and reasonable and supportable forecasts. With regard to U.S. Treasury and residential mortgage backed securities issued by the U.S. governments, or agencies thereof, it is expected that the securities will not be settled at prices less than the amortized cost bases of the securities as such securities are backed by the full faith and credit of and/or guaranteed by the U.S. government. Accordingly, no allowance for credit losses has been recorded for these securities. With regard to municipal securities, management considers 1) issuer bond ratings, 2) whether issuers continue to make timely principal and interest payments under the contractual terms of the securities, 3) internal forecasts and 4) whether or not such securities are guaranteed by the Texas Permanent School Fund or pre-refunded by the issuers.
59
As of December 31, 2023, the Company determined there were no credit related concerns that warrant an ACL for the held to maturity portfolio.
In determining the ACL for loans held for investment, we primarily estimate losses on segments of loans with similar risk characteristics and where the potential loss can be identified and reasonably determined. For loans that do not share similar risk characteristics with our existing segments, they are evaluated individually for an ACL. Our portfolio is segmented by regulatory call report codes, with additional segments for SBA loans acquired from Westbound Bank, SBA loans originated by us and in prior years, SBA PPP loans. The segments are further disaggregated by internally assigned risk rating classifications. The balance of the ACL is determined using CECL, which considers historical loan loss rates, changes in the nature of our loan portfolio, overall portfolio quality, industry concentrations, delinquency trends, current economic factors and reasonable and supportable forecasts of the impact of future economic conditions on loan loss rates. Please see “Critical Accounting Policies - Allowance for Credit Losses.”
In connection with the review of our loan portfolio, we consider risk elements attributable to particular loan types or categories in assessing the quality of individual loans. Some of the risk elements we consider include:
As of December 31, 2023, the allowance for credit losses totaled $30.9 million, or 1.33%, of total loans, excluding those held for sale. As of December 31, 2022, the allowance for credit losses totaled $32.0 million, or 1.34%, of total loans, excluding those held for sale. The slight decrease in the ACL of $1.1 million, or 3.3%, was primarily due to a decrease in the overall loan portfolio, which was offset by incorporation of economic forecasts for a minimal recession and potential debt-service stressors for certain segments into our CECL model throughout 2023.
60
The following table presents, as of and for the periods indicated, an analysis of the allowance for credit losses and other related data:
|
|
As of and for the Years Ended December 31, |
|
|||||||||
(dollars in thousands) |
|
2023 |
|
|
2022 |
|
|
2021 |
|
|||
Average loans outstanding(1) |
|
$ |
2,352,154 |
|
|
$ |
2,126,810 |
|
|
$ |
1,911,540 |
|
Gross loans outstanding at end of period(2) |
|
$ |
2,322,576 |
|
|
$ |
2,378,176 |
|
|
$ |
1,908,040 |
|
Allowance for credit losses at beginning of the period |
|
|
31,974 |
|
|
|
30,433 |
|
|
|
33,619 |
|
Impact of adopting ASC 326 |
|
|
— |
|
|
|
— |
|
|
|
— |
|
Provision for credit losses |
|
|
— |
|
|
|
2,150 |
|
|
|
(1,700 |
) |
Charge offs: |
|
|
|
|
|
|
|
|
|
|||
Commercial and industrial |
|
|
473 |
|
|
|
192 |
|
|
|
411 |
|
Real Estate: |
|
|
|
|
|
|
|
|
|
|||
Commercial real estate |
|
|
277 |
|
|
|
— |
|
|
|
816 |
|
1-4 family residential |
|
|
— |
|
|
|
— |
|
|
|
— |
|
Consumer |
|
|
139 |
|
|
|
322 |
|
|
|
151 |
|
Agriculture |
|
|
3 |
|
|
|
— |
|
|
|
— |
|
Overdrafts |
|
|
312 |
|
|
|
335 |
|
|
|
263 |
|
Total charge-offs |
|
|
1,204 |
|
|
|
849 |
|
|
|
1,641 |
|
Recoveries: |
|
|
|
|
|
|
|
|
|
|||
Commercial and industrial |
|
|
19 |
|
|
|
72 |
|
|
|
21 |
|
Real Estate: |
|
|
|
|
|
|
|
|
|
|||
Construction and development |
|
|
— |
|
|
|
— |
|
|
|
1 |
|
Commercial real estate |
|
|
— |
|
|
|
1 |
|
|
|
30 |
|
1-4 family residential |
|
|
— |
|
|
|
30 |
|
|
|
— |
|
Consumer |
|
|
68 |
|
|
|
55 |
|
|
|
35 |
|
Agriculture |
|
|
2 |
|
|
|
— |
|
|
|
8 |
|
Overdrafts |
|
|
61 |
|
|
|
82 |
|
|
|
60 |
|
Total recoveries |
|
|
150 |
|
|
|
240 |
|
|
|
155 |
|
Net charge-offs |
|
|
1,054 |
|
|
|
609 |
|
|
|
1,486 |
|
Allowance for credit losses at end of period |
|
$ |
30,920 |
|
|
$ |
31,974 |
|
|
$ |
30,433 |
|
Ratio of allowance to end of period loans(2) |
|
|
1.33 |
% |
|
|
1.34 |
% |
|
|
1.59 |
% |
Ratio of net charge-offs to average loans(1) |
|
|
0.04 |
% |
|
|
0.03 |
% |
|
|
0.08 |
% |
|
|
|
|
|
|
|
|
|
|
|||
(1) Includes average outstanding balances of loans held for sale of $1.2 million, $2.4 million and $3.4 million for the years ended December 31, 2023, 2022 and 2021, respectively. |
|
|||||||||||
(2) Excludes loans held for sale of $976,000, $3.2 million and $4.1 million for the years ended December 31, 2023, 2022 and 2021, respectively. |
|
|||||||||||
We believe the successful execution of our expansion strategy through organic growth and strategic acquisitions is generally demonstrated by the upward trend in average loan balances from December 31, 2019 to December 31, 2023. Loan balances, excluding loans held for sale, increased from $1.71 billion as of December 31, 2019, to $2.32 billion as of December 31, 2023. Net charge-offs have been minimal, representing on average 0.03% of average loan balances during the same period. However, we also believe it is sometimes prudent to slow or decrease loan growth, as was the case in 2023, when economic and other uncertainties increase credit risk. End-of-year gross loan balances decreased from $2.4 billion as of December 31, 2022 to $2.3 billion as of December 31, 2023 and net charge-offs remained minimal at 0.04% of average loans balances during 2023.
Although we believe that we have established our allowance for credit losses in accordance with GAAP and that the allowance for credit losses was adequate to provide for known and inherent losses in the portfolio at all times shown above, future provisions for credit losses will be subject to ongoing evaluations of the risks in our loan portfolio. If our primary market areas experience economic declines, if asset quality deteriorates or if we are successful in growing the size of our loan portfolio, our allowance could become inadequate and material additional provisions for credit losses could be required.
The following table shows the allocation of the allowance for credit losses among loan categories and certain other information as of the dates indicated. The allocation of the allowance for credit losses as shown in the table should neither be interpreted as an indication of future charge-offs, nor as an indication that charge-offs in future periods will necessarily occur in these amounts or in the indicated proportions.
61
The total allowance is available to absorb losses from any loan category.
|
|
As of December 31, |
|
|||||||||||||||||||||
|
|
2023 |
|
|
2022 |
|
|
2021 |
|
|||||||||||||||
(dollars in thousands) |
|
Amount |
|
|
Percent |
|
|
Amount |
|
|
Percent |
|
|
Amount |
|
|
Percent |
|
||||||
Commercial and industrial |
|
$ |
3,719 |
|
|
|
12.03 |
% |
|
$ |
4,382 |
|
|
|
13.70 |
% |
|
$ |
3,600 |
|
|
|
11.83 |
% |
Real estate: |
|
|
|
|
|
|
|
|
|
|
|
|
|
|
|
|
|
|
||||||
Construction and development |
|
|
3,623 |
|
|
|
11.72 |
% |
|
|
4,889 |
|
|
|
15.29 |
% |
|
|
4,221 |
|
|
|
13.87 |
% |
Commercial real estate |
|
|
12,257 |
|
|
|
39.64 |
% |
|
|
12,658 |
|
|
|
39.59 |
% |
|
|
13,765 |
|
|
|
45.23 |
% |
Farmland |
|
|
2,231 |
|
|
|
7.22 |
% |
|
|
2,008 |
|
|
|
6.28 |
% |
|
|
1,698 |
|
|
|
5.58 |
% |
1-4 family residential |
|
|
7,470 |
|
|
|
24.16 |
% |
|
|
6,617 |
|
|
|
20.69 |
% |
|
|
5,818 |
|
|
|
19.12 |
% |
Multi-family residential |
|
|
521 |
|
|
|
1.68 |
% |
|
|
490 |
|
|
|
1.53 |
% |
|
|
396 |
|
|
|
1.30 |
% |
Total real estate |
|
|
26,102 |
|
|
|
84.42 |
% |
|
|
26,662 |
|
|
|
83.38 |
% |
|
|
25,898 |
|
|
|
85.10 |
% |
Consumer and overdrafts |
|
|
947 |
|
|
|
3.06 |
% |
|
|
781 |
|
|
|
2.44 |
% |
|
|
766 |
|
|
|
2.51 |
% |
Agricultural |
|
|
152 |
|
|
|
0.49 |
% |
|
|
149 |
|
|
|
0.48 |
% |
|
|
169 |
|
|
|
0.56 |
% |
Total allowance for credit losses |
|
$ |
30,920 |
|
|
|
100.00 |
% |
|
$ |
31,974 |
|
|
|
100.00 |
% |
|
$ |
30,433 |
|
|
|
100.00 |
% |
Securities
We use our securities portfolio to provide a source of liquidity, provide an appropriate return on funds invested, manage interest rate risk, meet collateral requirements and meet regulatory capital requirements. As of December 31, 2023, the carrying amount of our investment securities totaled $600.4 million, a decrease of $97.5 million, or 14.0%, compared to $697.9 million as of December 31, 2022. Investment securities represented 18.9% and 20.8% of total assets as of December 31, 2023 and 2022, respectively.
As of December 31, 2023, securities available for sale totaled $196.2 million and securities held to maturity, totaled $404.2 million. As of December 31, 2022, securities available for sale totaled $188.9 million, and $509.0 million securities held to maturity. Held to maturity securities represented 67.3% and 72.9% of our investment portfolio as of December 31, 2023 and 2022, respectively.
The carrying values of our investment securities classified as available for sale are adjusted for unrealized gain or loss, and any gain or loss is reported on an after-tax basis as a component of other comprehensive (loss) income in shareholders’ equity. As of December 31, 2023, the Company determined that all available for sale securities that experienced a decline in fair value below their amortized cost basis were impacted by noncredit-related factors and that securities held to maturity have not experienced credit deterioration; therefore the Company carried no ACL with respect to our securities portfolio at December 31, 2023.
From time to time, we have reclassified certain securities from available for sale to held to maturity. Such transfers are made at fair value at the date of transfer. The unrealized holding gains and losses at the date of transfer are retained in other comprehensive loss and in the carrying value of the held to maturity securities and are amortized or accreted over the remaining life of the security. These unamortized unrealized losses and unaccreted unrealized gains on our transferred securities are included in accumulated other comprehensive loss on our balance sheet and netted to an unrealized loss of $7.0 million at December 31, 2023. This amount will be amortized and accreted out of accumulated other comprehensive loss over the remaining life of the underlying securities as an adjustment of the yield on those securities.
The following tables summarize the amortized cost and estimated fair value of our investment securities:
|
|
As of December 31, 2023 |
|
|||||||||||||
(in thousands) |
|
Amortized Cost |
|
|
Gross |
|
|
Gross |
|
|
Fair Value |
|
||||
U.S. government agencies |
|
$ |
9,292 |
|
|
$ |
— |
|
|
$ |
1,066 |
|
|
$ |
8,226 |
|
Treasury securities |
|
|
69,432 |
|
|
|
— |
|
|
|
1,038 |
|
|
|
68,394 |
|
Corporate bonds |
|
|
29,882 |
|
|
|
— |
|
|
|
3,077 |
|
|
|
26,805 |
|
Municipal securities |
|
|
170,497 |
|
|
|
1,105 |
|
|
|
6,123 |
|
|
|
165,479 |
|
Mortgage-backed securities |
|
|
284,291 |
|
|
|
1,014 |
|
|
|
30,726 |
|
|
|
254,579 |
|
Collateralized mortgage obligations |
|
|
56,194 |
|
|
|
19 |
|
|
|
8,978 |
|
|
|
47,235 |
|
Total |
|
$ |
619,588 |
|
|
$ |
2,138 |
|
|
$ |
51,008 |
|
|
$ |
570,718 |
|
62
|
|
As of December 31, 2022 |
|
|||||||||||||
(in thousands) |
|
Amortized Cost |
|
|
Gross |
|
|
Gross |
|
|
Fair Value |
|
||||
U.S. government agencies |
|
$ |
9,141 |
|
|
$ |
— |
|
|
$ |
1,259 |
|
|
$ |
7,882 |
|
Treasury securities |
|
|
133,735 |
|
|
|
— |
|
|
|
2,921 |
|
|
|
130,814 |
|
Corporate bonds |
|
|
29,964 |
|
|
|
— |
|
|
|
2,177 |
|
|
|
27,787 |
|
Municipal securities |
|
|
202,004 |
|
|
|
984 |
|
|
|
8,293 |
|
|
|
194,695 |
|
Mortgage-backed securities |
|
|
278,589 |
|
|
|
1 |
|
|
|
30,264 |
|
|
|
248,326 |
|
Collateralized mortgage obligations |
|
|
63,740 |
|
|
|
3 |
|
|
|
9,252 |
|
|
|
54,491 |
|
Total |
|
$ |
717,173 |
|
|
$ |
988 |
|
|
$ |
54,166 |
|
|
$ |
663,995 |
|
We do not hold any Fannie Mae or Freddie Mac preferred stock, collateralized debt obligations, structured investment vehicles or second lien elements in our investment portfolio. As of December 31, 2023 and 2022, our investment portfolio did not contain any securities that are directly backed by subprime or Alt-A mortgages, non-U.S. agency mortgage-backed securities or corporate collateralized mortgage obligations.
The following tables set forth the fair value of available for sale securities and the amortized cost of held to maturity securities, and maturities and approximated weighted average yield based on estimated annual income divided by the average amortized cost of our securities portfolio as of the dates indicated. The contractual maturity of a mortgage-backed security is the date at which the last underlying mortgage matures.
|
|
As of December 31, 2023 |
||||||||||||||||||||||||||||
|
|
Within One Year |
|
After One Year but |
|
After Five Years but |
|
After Ten Years |
|
Total |
||||||||||||||||||||
(dollars in thousands) |
|
Amount |
|
|
Yield |
|
Amount |
|
|
Yield |
|
Amount |
|
|
Yield |
|
Amount |
|
|
Yield |
|
Total |
|
|
Yield |
|||||
U.S. government agencies |
|
$ |
— |
|
|
— |
|
$ |
9,292 |
|
|
1.35% |
|
$ |
— |
|
|
— |
|
$ |
— |
|
|
— |
|
$ |
9,292 |
|
|
1.35% |
Treasury securities |
|
|
39,969 |
|
|
2.21% |
|
|
29,463 |
|
|
2.92% |
|
|
— |
|
|
— |
|
|
— |
|
|
— |
|
|
69,432 |
|
|
2.51% |
Corporate bonds |
|
|
1,980 |
|
|
3.31% |
|
|
7,228 |
|
|
3.40% |
|
|
17,597 |
|
|
4.00% |
|
|
— |
|
|
— |
|
|
26,805 |
|
|
3.80% |
Municipal securities |
|
|
8,568 |
|
|
3.63% |
|
|
43,517 |
|
|
2.90% |
|
|
68,044 |
|
|
3.06% |
|
|
50,550 |
|
|
3.17% |
|
|
170,679 |
|
|
3.08% |
Mortgage-backed securities |
|
|
— |
|
|
— |
|
|
46,823 |
|
|
1.80% |
|
|
187,027 |
|
|
2.87% |
|
|
35,834 |
|
|
3.42% |
|
|
269,684 |
|
|
2.76% |
Collateralized mortgage obligations |
|
|
1,577 |
|
|
2.89% |
|
|
17,623 |
|
|
2.77% |
|
|
30,595 |
|
|
1.48% |
|
|
4,716 |
|
|
2.81% |
|
|
54,511 |
|
|
2.10% |
Total |
|
$ |
52,094 |
|
|
2.51% |
|
$ |
153,946 |
|
|
2.46% |
|
$ |
303,263 |
|
|
2.84% |
|
$ |
91,100 |
|
|
3.25% |
|
$ |
600,403 |
|
|
2.78% |
|
|
As of December 31, 2022 |
||||||||||||||||||||||||||||
|
|
Within One Year |
|
After One Year but |
|
After Five Years but |
|
After Ten Years |
|
Total |
||||||||||||||||||||
(dollars in thousands) |
|
Amount |
|
|
Yield |
|
Amount |
|
|
Yield |
|
Amount |
|
|
Yield |
|
Amount |
|
|
Yield |
|
Total |
|
|
Yield |
|||||
U.S. government agencies |
|
$ |
— |
|
|
— |
|
$ |
— |
|
|
— |
|
$ |
9,141 |
|
|
1.35% |
|
$ |
— |
|
|
— |
|
$ |
9,141 |
|
|
1.35% |
Treasury securities |
|
|
64,798 |
|
|
1.46% |
|
|
68,937 |
|
|
2.51% |
|
|
— |
|
|
— |
|
|
— |
|
|
— |
|
|
133,735 |
|
|
2.00% |
Corporate bonds |
|
|
— |
|
|
— |
|
|
9,690 |
|
|
3.41% |
|
|
18,097 |
|
|
4.00% |
|
|
— |
|
|
— |
|
|
27,787 |
|
|
3.80% |
Municipal securities |
|
|
19,151 |
|
|
3.48% |
|
|
46,087 |
|
|
3.18% |
|
|
56,844 |
|
|
3.21% |
|
|
80,240 |
|
|
3.44% |
|
|
202,322 |
|
|
3.32% |
Mortgage-backed securities |
|
|
3,042 |
|
|
2.43% |
|
|
80,292 |
|
|
1.91% |
|
|
170,487 |
|
|
2.51% |
|
|
9,213 |
|
|
1.93% |
|
|
263,034 |
|
|
2.31% |
Collateralized mortgage obligations |
|
|
626 |
|
|
3.82% |
|
|
25,772 |
|
|
2.79% |
|
|
32,107 |
|
|
1.47% |
|
|
3,411 |
|
|
1.09% |
|
|
61,916 |
|
|
1.98% |
Total |
|
$ |
87,617 |
|
|
1.95% |
|
$ |
230,778 |
|
|
2.49% |
|
$ |
286,676 |
|
|
2.57% |
|
$ |
92,864 |
|
|
3.15% |
|
$ |
697,935 |
|
|
2.54% |
The contractual maturity of mortgage-backed securities and collateralized mortgage obligations is not a reliable indicator of their expected life because borrowers have the right to prepay their obligations at any time. Mortgage-backed securities and collateralized mortgage obligations are typically issued with stated principal amounts and are backed by pools of mortgage loans and other loans with varying maturities.
63
The term of the underlying mortgages and loans may vary significantly due to the ability of a borrower to prepay. Monthly pay downs on mortgage-backed securities typically cause the average life of the securities to be much different from the stated contractual maturity. During a period of increasing interest rates, fixed rate mortgage-backed securities do not tend to experience heavy prepayments of principal, and, consequently, the average life of this security is typically lengthened. If interest rates begin to fall, prepayments may increase, thereby shortening the estimated life of this security. The weighted average life of our investment portfolio was 5.19 years with an estimated effective duration of 4.09 years as of December 31, 2023.
As of December 31, 2023 and 2022, respectively, we did not own securities of any one issuer, other than the U.S. government and its agencies, for which aggregate adjusted cost exceeded 10.0% of the consolidated shareholders’ equity.
The average yield of our securities portfolio was 2.78% as of December 31, 2023, up from 2.54% as of December 31, 2022. The growth in average yield resulted primarily from increases in yields on mortgage-backed securities and treasury securities of 2.31% and 2.00% at December 31, 2022, respectively, to 2.76% and 2.51% at December 31, 2023, respectively. As of December 31, 2023, the fair value of available for sale and amortized cost of held to maturity mortgage-backed securities and municipal securities comprised 44.9% and 28.4% of the portfolio, respectively. As of December 31, 2022, mortgage-backed securities and municipal securities comprised 37.7% and 29.0% of the portfolio, respectively.
Deposits
We offer a variety of deposit products, which have a wide range of interest rates and terms, including demand, savings, money market and time accounts. We rely primarily on competitive pricing policies, convenient locations and personalized service to attract and retain these deposits.
Average total deposits for the year ended December 31, 2023 were $2.62 billion, a decrease of $129.1 million, or 4.7%, compared to $2.75 billion for the year ended December 31, 2022. The average rate paid on total interest-bearing deposits was 2.65% and 0.58% for the years ended December 31, 2023 and 2022, respectively. The increase in average rates for 2023 was driven primarily by increases in market rates due to Federal Reserve interest rate hikes during 2022 and 2023.
The following table presents the average balances and average rates paid on deposits for the periods indicated:
|
|
For the Years Ended December 31, |
||||||||||
|
|
2023 |
|
2022 |
||||||||
(dollars in thousands) |
|
Average |
|
|
Average |
|
Average |
|
|
Average |
||
NOW and interest-bearing demand accounts |
|
$ |
260,297 |
|
|
1.05% |
|
$ |
364,941 |
|
|
0.47% |
Savings accounts |
|
|
134,409 |
|
|
0.75% |
|
|
141,484 |
|
|
0.31% |
Money market accounts |
|
|
707,840 |
|
|
2.80% |
|
|
831,833 |
|
|
0.61% |
Certificates and other time deposits |
|
|
596,212 |
|
|
3.59% |
|
|
332,029 |
|
|
0.77% |
Total interest-bearing deposits |
|
|
1,698,758 |
|
|
2.65% |
|
|
1,670,287 |
|
|
0.58% |
Noninterest-bearing demand accounts |
|
|
924,945 |
|
|
— |
|
|
1,082,513 |
|
|
— |
Total deposits |
|
$ |
2,623,703 |
|
|
1.71% |
|
$ |
2,752,800 |
|
|
0.35% |
The ratio of average noninterest-bearing deposits to average total deposits for the years ended December 31, 2023 and 2022 was 35.3% and 39.3%, respectively.
Total deposits as of December 31, 2023 were $2.63 billion, a decrease of $47.9 million, or 1.8%, compared to $2.68 billion as of December 31, 2022. We believe the majority of the deposit balance decrease was due to depositors using their excess cash for operating needs and to invest funds in other higher earning opportunities.
Noninterest-bearing deposits as of December 31, 2023 were $853.0 million compared to $1.05 billion as of December 31, 2022, a decrease of $199.2 million, or 18.9%. We believe the decrease was primarily the result of depositors moving funds from non-interest bearing accounts to other interest bearing alternatives.
Total interest-bearing deposits as of December 31, 2023 were $1.78 billion, compared to $1.63 billion as of December 31, 2022, an increase of $151.3 million, or 9.3%.
The aggregate amount of certificates and other time deposits in denominations of $250,000 or more as of December 31, 2023 and 2022 was $279.0 million and $130.0 million, respectively.
64
The following table sets forth the amount of uninsured certificates of deposit greater than $250,000 by time remaining until maturity as of December 31, 2023:
(dollars in thousands) |
|
December 31, 2023 |
|
|
Under 3 months |
|
$ |
50,188 |
|
3 to 6 months |
|
|
56,026 |
|
6 to 12 months |
|
|
106,478 |
|
Over 12 months |
|
|
9,988 |
|
Total |
|
$ |
222,680 |
|
Total deposits in denominations greater than $250,000 as of December 31, 2023, 2022 and 2021 were $1.29 billion, $1.49 billion, and $1.51 billion, respectively. Our estimated uninsured deposits, excluding public funds and bank-owned accounts, were $580.1 million, or 22.0% of total deposits, as of December 31, 2023.
Factors affecting the cost of funding interest-bearing assets include the volume of noninterest- and interest-bearing deposits, changes in market interest rates and economic conditions in our primary market areas and their impact on interest paid on deposits, as well as the ongoing execution of our balance sheet management strategy. Cost of total deposits is calculated as total interest expense divided by average total deposits. Our cost of total deposits was 1.71%% and 0.35%% in 2023 and 2022, respectively. The increase in our cost of total deposits for 2023 was primarily due to increases in rates on interest-bearing deposits, which were 2.65% and 0.58% in 2023 and 2022, respectively, in addition to a decrease in the average balance of noninterest-bearing deposits of $157.6 million, or 14.6%,from $1.08 billion in 2022 to $924.9 million in 2023.
Borrowings
We utilize short-term and long-term borrowings to supplement deposits to fund our lending and investment activities, each of which is discussed below.
Federal Home Loan Bank (FHLB) Advances. The FHLB allows us to borrow on a blanket floating lien status collateralized by certain securities and loans. As of December 31, 2023 and 2022, total borrowing capacity of $939.8 million and $755.0 million, respectively, was available under this arrangement. Our outstanding FHLB advances mature within one year. As of December 31, 2023, approximately $1.96 billion in real estate loans were pledged as collateral for our FHLB borrowings. We utilize these borrowings to meet liquidity needs and to hedge interest rate risk. The following table presents our FHLB borrowings as of the dates indicated:
(dollars in thousands) |
|
FHLB Advances |
|
|
December 31, 2023 |
|
|
|
|
Amount outstanding at year-end |
|
$ |
140,000 |
|
Weighted average interest rate at year-end |
|
|
5.36 |
% |
Maximum month-end balance during the year |
|
$ |
340,000 |
|
Average balance outstanding during the year |
|
$ |
226,123 |
|
Weighted average interest rate during the year |
|
|
5.14 |
% |
|
|
|
|
|
December 31, 2022 |
|
|
|
|
Amount outstanding at year-end |
|
$ |
290,000 |
|
Weighted average interest rate at year-end |
|
|
4.74 |
% |
Maximum month-end balance during the year |
|
$ |
290,000 |
|
Average balance outstanding during the year |
|
$ |
132,764 |
|
Weighted average interest rate during the year |
|
|
2.89 |
% |
The following table presents our FHLB borrowings by maturity and weighted average rate as of December 31, 2023:
(dollars in thousands) |
|
Balance |
|
|
Weighted Average |
|
||
Less than 90 days |
|
$ |
130,000 |
|
|
|
5.43 |
% |
90 days to less than one year |
|
|
10,000 |
|
|
|
4.38 |
% |
Total |
|
$ |
140,000 |
|
|
|
5.36 |
% |
Federal Reserve Bank of Dallas. The Federal Reserve Bank of Dallas has an available borrower in custody arrangement, which allows us to borrow on a collateralized basis. Certain commercial and industrial and consumer loans are pledged under this arrangement. We maintain this borrowing arrangement to meet liquidity needs pursuant to our contingency funding plan. As of December 31, 2023 and 2022, $222.2 million and $227.6 million, respectively, were available under this arrangement.
65
As of December 31, 2023 and 2022, approximately $290.7 million and $289.5 million, respectively, in consumer and commercial and industrial loans were pledged as collateral. As of December 31, 2023 and 2022, no borrowings were outstanding under this arrangement.
Other Borrowings. We have historically used a line of credit with a correspondent bank as a source of funding for working capital needs, the payment of dividends when there is a temporary timing difference in cash flows, and repurchases of equity securities. In March 2017, we entered into an unsecured revolving line of credit for $25.0 million, and we renewed that line of credit in March 2023. The line of credit bears interest at the prime rate (8.50% as of December 31, 2023) subject to a floor of 3.50%, with quarterly interest payments, and matures in March 2024. As of December 31, 2023, there was $4.5 million outstanding balance on the line of credit. As of December 31, 2022, there was no outstanding balance on this line of credit with the correspondent bank.
Liquidity and Capital Resources
Liquidity
Liquidity involves our ability to raise funds to support asset growth and acquisitions or reduce assets to meet deposit withdrawals and other payment obligations, to maintain reserve requirements and otherwise to operate on an ongoing basis and manage unexpected events, such as COVID-19. For the years ended December 31, 2023 and 2022, liquidity needs were primarily met by core deposits, security and loan maturities and amortizing investment and loan portfolios. Although access to purchased funds from correspondent banks and overnight or longer term advances from the FHLB and the Federal Reserve Bank of Dallas are available, and have been utilized on occasion to take advantage of investment opportunities, we do not generally rely on these external funding sources. As of December 31, 2023 and 2022, we maintained two federal funds lines of credit with commercial banks that provide for the availability to borrow up to an aggregate $55.0 million in federal funds. There were no funds under these lines of credit outstanding as of December 31, 2023 and 2022. In addition to these federal funds lines of credit, our $25.0 million revolving line of credit discussed above in “Other Borrowings” provides an additional source of liquidity.
The following table illustrates, during the periods presented, the composition of our funding sources and the average assets in which those funds are invested as a percentage of average total assets for the period indicated. Average assets were $3.25 billion for the year ended December 31, 2023 and $3.26 billion for the year ended December 31, 2022.
|
|
Year Ended |
|
|
Year Ended |
|
||
Sources of Funds: |
|
|
|
|
|
|
||
Deposits: |
|
|
|
|
|
|
||
Noninterest-bearing |
|
|
28.45 |
% |
|
|
33.20 |
% |
Interest-bearing |
|
|
52.25 |
% |
|
|
51.23 |
% |
Advances from FHLB |
|
|
6.96 |
% |
|
|
4.07 |
% |
Line of credit |
|
|
0.13 |
% |
|
|
0.00 |
% |
Subordinated debt |
|
|
1.47 |
% |
|
|
1.44 |
% |
Securities sold under agreements to repurchase |
|
|
0.63 |
% |
|
|
0.26 |
% |
Accrued interest and other liabilities |
|
|
0.96 |
% |
|
|
0.79 |
% |
Equity |
|
|
9.15 |
% |
|
|
9.01 |
% |
Total |
|
|
100.00 |
% |
|
|
100.00 |
% |
|
|
|
|
|
|
|
||
Uses of Funds: |
|
|
|
|
|
|
||
Loans |
|
|
71.38 |
% |
|
|
64.33 |
% |
Securities available for sale |
|
|
5.61 |
% |
|
|
8.83 |
% |
Securities held to maturity |
|
|
13.81 |
% |
|
|
15.89 |
% |
Nonmarketable equity securities |
|
|
0.84 |
% |
|
|
0.58 |
% |
Federal funds sold |
|
|
1.41 |
% |
|
|
3.26 |
% |
Interest-bearing deposits in other banks |
|
|
0.18 |
% |
|
|
0.47 |
% |
Other noninterest-earning assets |
|
|
6.77 |
% |
|
|
6.64 |
% |
Total |
|
|
100.00 |
% |
|
|
100.00 |
% |
|
|
|
|
|
|
|
||
Average noninterest-bearing deposits to average deposits |
|
|
35.25 |
% |
|
|
39.32 |
% |
Average loans to average deposits |
|
|
89.65 |
% |
|
|
77.26 |
% |
Our primary source of funds is deposits, and our primary use of funds is loans. We do not expect a change in the primary source or use of our funds in the foreseeable future. Our average loans, including average loans held for sale, increased $225.3 million, or 10.6%, for the year ended December 31, 2023 compared to 2022, while our average deposits decreased $129.1 million, or 4.7%, for the same time periods.
66
We predominantly invest excess deposits in overnight deposits with our correspondent banks, federal funds sold, securities, interest-bearing deposits at other banks or other short-term liquid investments until needed to fund loan growth or other uses.
As of December 31, 2023, we had $336.0 million in outstanding commitments to extend credit and $7.5 million in commitments associated with outstanding standby and commercial letters of credit. As of December 31, 2022, we had $474.7 million in outstanding commitments to extend credit and $8.3 million in commitments associated with outstanding standby and commercial letters of credit. Since commitments associated with letters of credit and commitments to extend credit may expire unused, the total outstanding may not necessarily reflect the actual future cash funding requirements.
As of December 31, 2023 and 2022, we had no exposure to future cash requirements associated with known uncertainties or capital expenditures of a material nature. As of December 31, 2023, we had cash and cash equivalents of $89.5 million, compared to $106.5 million as of December 31, 2022. The decrease was primarily due to the deployment of cash to secure funding for loans and investment securities, and to reduce FHLB borrowings.
Capital Resources
Total shareholders’ equity increased to $303.8 million as of December 31, 2023, compared to $295.6 million as of December 31, 2022, an increase of $8.3 million, or 2.8%. The increase from December 31, 2022 was due to net earnings attributable to Guaranty Bancshares, Inc. of $30.0 million, partially offset by $11.2 million in stock repurchases and $10.7 million in dividends paid during the year ended December 31, 2023.
Capital management consists of providing equity and other instruments that qualify as regulatory capital to support current and future operations. Banking regulators view capital levels as important indicators of an institution’s financial soundness. As a general matter, FDIC-insured depository institutions and their holding companies are required to maintain minimum capital relative to the amount and types of assets they hold. We are subject to regulatory capital requirements at the bank holding company and bank levels. See "Item 1. Business—Guaranty Bank & Trust, N.A.—Regulation and Supervision—Capital Adequacy Requirements” for additional discussion regarding the regulatory capital requirements applicable to us and the Bank. As of December 31, 2023 and 2022, we were in compliance with all applicable regulatory capital requirements at the bank and bank holding company levels, and the Bank was classified as “well capitalized,” for purposes of the prompt corrective action regulations. As we deploy our capital, our regulatory capital levels may decrease depending on our level of earnings and provisions for credit losses. However, we expect to closely monitor our loan portfolio, operating expenses and overall capital levels in order to remain in compliance with all regulatory capital standards applicable to us.
The following table presents the regulatory capital ratios for our Company and the Bank as of the dates indicated:
|
|
December 31, 2023 |
|
|
December 31, 2022 |
|
||||||||||
(dollars in thousands) |
|
Amount |
|
|
Ratio |
|
|
Amount |
|
|
Ratio |
|
||||
Guaranty Bancshares, Inc. (consolidated) |
|
|
|
|
|
|
|
|
|
|
|
|
||||
|
|
|
|
|
|
|
|
|
|
|
|
|
||||
Total capital (to risk-weighted assets) |
|
$ |
367,526 |
|
|
|
15.22 |
% |
|
$ |
358,702 |
|
|
|
14.37 |
% |
Tier 1 capital (to risk-weighted assets) |
|
|
302,757 |
|
|
|
12.53 |
% |
|
|
292,966 |
|
|
|
11.74 |
% |
Tier 1 capital (to average assets) |
|
|
302,757 |
|
|
|
9.47 |
% |
|
|
292,966 |
|
|
|
8.77 |
% |
Common equity tier 1 capital (to risk-weighted assets) |
|
|
295,540 |
|
|
|
12.24 |
% |
|
|
285,749 |
|
|
|
11.45 |
% |
|
|
|
|
|
|
|
|
|
|
|
|
|
||||
Guaranty Bank & Trust, N.A. |
|
|
|
|
|
|
|
|
|
|
|
|
||||
|
|
|
|
|
|
|
|
|
|
|
|
|
||||
Total capital (to risk weighted assets) |
|
$ |
373,778 |
|
|
|
15.49 |
% |
|
$ |
361,125 |
|
|
|
14.48 |
% |
Tier 1 capital (to risk weighted assets) |
|
|
343,607 |
|
|
|
14.24 |
% |
|
|
329,933 |
|
|
|
13.23 |
% |
Tier 1 capital (to average assets) |
|
|
343,607 |
|
|
|
10.78 |
% |
|
|
329,933 |
|
|
|
9.89 |
% |
Common equity tier 1 capital (to risk-weighted assets) |
|
|
343,607 |
|
|
|
14.24 |
% |
|
|
329,933 |
|
|
|
13.23 |
% |
Contractual Obligations
We have issued subordinated debentures relating to the issuance of trust preferred securities.
In October 2002, we formed Guaranty (TX) Capital Trust II, which issued $3.0 million in trust preferred securities to a third party in a private placement. Concurrent with the issuance of the trust preferred securities, the trust issued common securities to the Company in the aggregate liquidation value of $93,000. The trust invested the total proceeds from the sale of the trust preferred securities and the common securities in $3.1 million of the Company’s junior subordinated debentures.
67
These debentures were redeemed in May 2022.
In July 2006, we formed Guaranty (TX) Capital Trust III, which issued $2.0 million in trust preferred securities to a third party in a private placement. Concurrent with the issuance of the trust preferred securities, the trust issued common securities to the Company in the aggregate liquidation value of $62,000. The trust invested the total proceeds from the sale of the trust preferred securities and the common securities in $2.1 million of the Company’s junior subordinated debentures, which will mature on October 1, 2036.
In March 2015, we acquired DCB Trust I, which issued $5.0 million in trust preferred securities to a third party in a private placement. Concurrent with the issuance of the trust preferred securities, the trust issued common securities to the Company in the aggregate liquidation value of $155,000. The trust invested the total proceeds from the sale of the trust preferred securities and the common securities in $5.2 million of the Company’s junior subordinated debentures, which will mature on June 15, 2037.
With certain exceptions, the amount of the principal and any accrued and unpaid interest on the debentures are subordinated in right of payment to the prior payment in full of all of our senior indebtedness. The terms of the debentures are such that they qualify as Tier 1 capital under the Federal Reserve’s regulatory capital guidelines applicable to bank holding companies. Interest on the Trust III Debentures is payable at a variable rate per annum, reset quarterly, equal to the then-current three month term Secured Overnight Financing Rate ("SOFR") plus 1.93%. Interest on the DCB Trust I Debentures is payable at a variable rate per annum, reset quarterly, equal to 3-month SOFR plus 2.06%. The interest is deferrable on a cumulative basis for up to five consecutive years following a suspension of dividend payments on all other capital stock. No principal payments are due until maturity for each of the debentures.
Both the DCB Trust I Debentures and the Trust III Debentures are redeemable, in whole or in part, at our option after at least 30, but not more than 60, days' notice, on any interest payment date, at a redemption price equal to 100% of the amount to be redeemed, plus accrued interest to the date of redemption.
On March 4, 2022, the Company completed a private placement of $35.0 million aggregate principal amount of its fixed-to-floating rate subordinated note due April 1, 2032. The subordinated note initially bears a fixed interest rate of 3.625% per year, due semi-annually in arrears on April 1 and October 1. Commencing on April 1, 2027, the interest rate on the subordinated note will reset each quarter at a floating interest rate equal to the then-current three month term SOFR plus 192 basis points. The Company may at its option redeem in whole or in part the subordinated note on or after March 4, 2027 without a premium. The subordinated note is treated as Tier 2 capital for regulatory purposes (subject to reductions in the amount includable as Tier 2 Capital in the final five years prior to maturity), and is presented net of $432,000 in related unamortized issuance costs on the consolidated balance sheets.
On May 1, 2020, the Company issued $10.0 million in debentures to directors and other related parties. The debentures have stated maturity dates between November 1, 2020 and November 1, 2024, and bear interest at fixed annual rates between 1.00% and 4.00%. The Company pays interest semi-annually on May 1st and November 1st in arrears during the term of the debentures. Various portions of these debentures have matured since issuance and $4.0 million remains outstanding as of December 31, 2023. The debentures are redeemable by the Company at its option, in whole in or part, at any time on or before the due date of any debenture. The redemption price is equal to 100% of the face amount of the debenture redeemed, plus all accrued but unpaid interest.
The following table summarizes contractual obligations and other commitments to make future payments as of December 31, 2023 (other than non-time deposit obligations), which consist of future cash payments associated with our contractual obligations.
|
|
As of December 31, 2023 |
|
|||||||||||||||||
(in thousands) |
|
1 year |
|
|
More than 1 |
|
|
3 years or |
|
|
5 years |
|
|
Total |
|
|||||
Time deposits |
|
$ |
646,978 |
|
|
$ |
53,825 |
|
|
$ |
4,380 |
|
|
$ |
— |
|
|
$ |
705,183 |
|
Advances from FHLB |
|
|
140,000 |
|
|
|
— |
|
|
|
— |
|
|
|
— |
|
|
|
140,000 |
|
Subordinated debt |
|
|
4,000 |
|
|
|
— |
|
|
|
— |
|
|
|
42,217 |
|
|
|
46,217 |
|
Operating leases |
|
|
2,303 |
|
|
|
4,031 |
|
|
|
3,423 |
|
|
|
3,856 |
|
|
|
13,613 |
|
Total |
|
$ |
793,281 |
|
|
$ |
57,856 |
|
|
$ |
7,803 |
|
|
$ |
46,073 |
|
|
$ |
905,013 |
|
68
Off-Balance Sheet Items
In the normal course of business, we enter into various transactions, which, in accordance with GAAP, are not included in our consolidated balance sheets. We enter into these transactions to meet the financing needs of our customers. These transactions include commitments to extend credit and standby and commercial letters of credit, which involve, to varying degrees, elements of credit risk and interest rate risk in excess of the amounts recognized in our consolidated balance sheets.
Our commitments associated with outstanding standby and commercial letters of credit and commitments to extend credit expiring by period as of December 31, 2023 are summarized below. Since commitments associated with letters of credit and commitments to extend credit may expire unused, the amounts shown do not necessarily reflect the actual future cash funding requirements.
|
|
As of December 31, 2023 |
|
|||||||||||||||||
(in thousands) |
|
1 year |
|
|
More than |
|
|
3 years or |
|
|
5 years |
|
|
Total |
|
|||||
Standby and commercial letters of credit |
|
$ |
2,852 |
|
|
$ |
3,793 |
|
|
$ |
27 |
|
|
$ |
864 |
|
|
$ |
7,536 |
|
Commitments to extend credit |
|
|
219,272 |
|
|
|
56,669 |
|
|
|
13,058 |
|
|
|
47,037 |
|
|
|
336,036 |
|
Total |
|
$ |
222,124 |
|
|
$ |
60,462 |
|
|
$ |
13,085 |
|
|
$ |
47,901 |
|
|
$ |
343,572 |
|
Standby and commercial letters of credit are conditional commitments issued by us to guarantee the performance of a customer to a third party. In the event of nonperformance by the customer, we have rights to the underlying collateral, which can include commercial real estate, physical plant and property, inventory, receivables, cash and/or marketable securities. Our credit risk associated with issuing letters of credit is essentially the same as the risk involved in extending loan facilities to our customers. Management evaluated the likelihood of funding the standby and commercial letters of credit as of December 31, 2023, and determined the likelihood to be improbable. Therefore, no ACL was recorded for standby and commercial letters of credit as of December 31, 2023.
Commitments to extend credit are agreements to lend to a customer as long as there is no violation of any condition established in the contract. Commitments generally have fixed expiration dates or other termination clauses and may require payment of a fee. Since many of the commitments are expected to expire without being fully drawn upon, the total commitment amounts disclosed above do not necessarily represent future cash requirements. We evaluate each customer’s creditworthiness on a case-by-case basis. The amount of collateral obtained, if considered necessary by us, upon extension of credit, is based on management’s credit evaluation of the customer.
Loan agreements executed in connection with construction loans and commercial lines of credit have standard conditions which must be met prior to the Company being required to provide additional funding, including conditions precedent that typically include: (i) no event of default or potential default has occurred; (ii) that no material adverse events have taken place that would materially affect the borrower or the value of the collateral, (iii) that the borrower remains in compliance with all loan obligations and covenants and has made no misrepresentations; (iv) that the collateral has not been damaged or impaired; (v) that the project remains on budget and in compliance with all laws and regulations; and (vi) that all management agreements, lease agreements and franchise agreements that affect the value of the collateral remain in force. If the conditions precedent have not been met, the Company retains the option to cease current draws and/or future funding. As a result of these conditions within our loan agreements, management believes the credit risk of these off balance sheet items is minimal and we recorded no ACL with respect to these loan agreements as of December 31, 2023.
Recently Issued Accounting Pronouncements
Recently issued accounting pronouncements are summarized and discussed in Note 1 of the Notes to Consolidated Financial Statements contained in Item 8 of this report.
Impact of Inflation
Our consolidated financial statements and related notes included elsewhere in this Report have been prepared in accordance with GAAP. GAAP requires the measurement of financial position and operating results in terms of historical dollars, without considering changes in the relative value of money over time due to inflation or deflation.
Unlike many industrial companies, substantially all of our assets and liabilities are monetary in nature. As a result, interest rates have a more significant impact on our performance than the effects of general levels of inflation. Interest rates may not necessarily move in the same direction or in the same magnitude as the prices of goods and services.
69
However, other operating expenses do reflect general levels of inflation.
Non-GAAP Financial Measures
Our accounting and reporting policies conform to GAAP and the prevailing practices in the banking industry. However, we also evaluate our performance based on certain additional financial measures discussed in this Report as being non-GAAP financial measures. We classify a financial measure as being a non-GAAP financial measure if that financial measure excludes or includes amounts, or is subject to adjustments that have the effect of excluding or including amounts, that are included or excluded, as the case may be, in the most directly comparable measure calculated and presented in accordance with GAAP as in effect from time to time in the United States in our statements of income, balance sheets or statements of cash flows. Non-GAAP financial measures do not include operating and other statistical measures or ratios or statistical measures calculated using exclusively either financial measures calculated in accordance with GAAP, operating measures or other measures that are not non-GAAP financial measures or both.
The non-GAAP financial measures that we discuss in this Report should not be considered in isolation or as a substitute for the most directly comparable or other financial measures calculated in accordance with GAAP. Moreover, the manner in which we calculate the non-GAAP financial measures that we discuss in this Report may differ from that of other companies reporting measures with similar names. It is important to understand how other banking organizations calculate their financial measures with names similar to the non-GAAP financial measures we have discussed in this Report when comparing such non-GAAP financial measures.
Tangible Book Value Per Common Share. Tangible book value per common share is a non-GAAP measure generally used by investors, financial analysts and investment bankers to evaluate financial institutions. We calculate (1) tangible common equity as total shareholders’ equity, less goodwill, core deposit intangibles and other intangible assets, net of accumulated amortization, and (2) tangible book value per common share as tangible common equity divided by shares of common stock outstanding. The most directly comparable GAAP financial measure for tangible book value per common share is book value per common share.
We believe that the tangible book value per common share measure is important to many investors in the marketplace who are interested in changes from period to period in book value per common share exclusive of changes in intangible assets. Goodwill and other intangible assets have the effect of increasing total book value while not increasing our tangible book value.
The following table reconciles, as of the dates set forth below, total shareholders’ equity to tangible common equity and presents tangible book value per common share compared to book value per common share:
|
|
As of December 31, |
|
|||||||||
(dollars in thousands, except per share data) |
|
2023 |
|
|
2022 |
|
|
2021 |
|
|||
Tangible Common Equity |
|
|
|
|
|
|
|
|
|
|||
Total shareholders’ equity attributable to Guaranty Bancshares, Inc. |
|
$ |
303,300 |
|
|
$ |
294,984 |
|
|
$ |
302,214 |
|
Adjustments: |
|
|
|
|
|
|
|
|
|
|||
Goodwill |
|
|
(32,160 |
) |
|
|
(32,160 |
) |
|
|
(32,160 |
) |
Core deposit intangible, net |
|
|
(1,418 |
) |
|
|
(1,859 |
) |
|
|
(2,313 |
) |
Total tangible common equity attributable to Guaranty Bancshares, Inc. |
|
$ |
269,722 |
|
|
$ |
260,965 |
|
|
$ |
267,741 |
|
Common shares outstanding(1) |
|
|
11,540,644 |
|
|
|
11,941,672 |
|
|
|
12,122,717 |
|
Book value per common share |
|
$ |
26.28 |
|
|
$ |
24.70 |
|
|
$ |
24.93 |
|
Tangible book value per common share |
|
$ |
23.37 |
|
|
$ |
21.85 |
|
|
$ |
22.09 |
|
|
|
|
|
|
|
|
|
|
|
|||
(1) Excludes the dilutive effect, if any, of 44,844, 112,638 and 146,576 shares of common stock issuable upon exercise of outstanding stock options as of December 31, 2023, 2022 and 2021, respectively. |
|
|||||||||||
Tangible Common Equity to Tangible Assets. Tangible common equity to tangible assets is a non-GAAP measure generally used by investors, financial analysts and investment bankers to evaluate financial institutions. We calculate tangible common equity, as described above, and tangible assets as total assets less goodwill, core deposit intangibles and other intangible assets, net of accumulated amortization. The most directly comparable GAAP financial measure for tangible common equity to tangible assets is total common shareholders’ equity to total assets.
70
We believe that this measure is important to many investors in the marketplace who are interested in the relative changes from period to period of tangible common equity to tangible assets, each exclusive of changes in intangible assets. Goodwill and other intangible assets have the effect of increasing both total shareholders’ equity and assets while not increasing our tangible common equity or tangible assets.
The following table reconciles, as of the dates set forth below, total tangible common equity and total assets to tangible assets:
|
|
As of December 31, |
|
|||||||||
(dollars in thousands) |
|
2023 |
|
|
2022 |
|
|
2021 |
|
|||
Tangible Common Equity |
|
|
|
|
|
|
|
|
|
|||
Total shareholders’ equity attributable to Guaranty Bancshares, Inc. |
|
$ |
303,300 |
|
|
$ |
294,984 |
|
|
$ |
302,214 |
|
Adjustments: |
|
|
|
|
|
|
|
|
|
|||
Goodwill |
|
|
(32,160 |
) |
|
|
(32,160 |
) |
|
|
(32,160 |
) |
Core deposit intangible, net |
|
|
(1,418 |
) |
|
|
(1,859 |
) |
|
|
(2,313 |
) |
Total tangible common equity attributable to Guaranty Bancshares, Inc. |
|
$ |
269,722 |
|
|
$ |
260,965 |
|
|
$ |
267,741 |
|
Tangible Assets |
|
|
|
|
|
|
|
|
|
|||
Total assets |
|
$ |
3,184,791 |
|
|
$ |
3,351,495 |
|
|
$ |
3,086,070 |
|
Adjustments: |
|
|
|
|
|
|
|
|
|
|||
Goodwill |
|
|
(32,160 |
) |
|
|
(32,160 |
) |
|
|
(32,160 |
) |
Core deposit intangible, net |
|
|
(1,418 |
) |
|
|
(1,859 |
) |
|
|
(2,313 |
) |
Total tangible assets |
|
$ |
3,151,213 |
|
|
$ |
3,317,476 |
|
|
$ |
3,051,597 |
|
Tangible Common Equity to Tangible Assets |
|
|
8.56 |
% |
|
|
7.87 |
% |
|
|
8.77 |
% |
Core Earnings. The following table reconciles, as of and for the dates set forth below, net earnings, a GAAP measure, and net core earnings, a non-GAAP measure that excludes provisions for credit losses and income tax and net PPP income.
Net Core Earnings and Net Core Earnings per Common Share
(dollars in thousands, except per share data) |
|
2023 |
|
|
2022 |
|
|
2021 |
|
|
2020 |
|
|
2019 |
|
|||||
Net earnings attributable to Guaranty Bancshares, Inc. |
|
$ |
30,037 |
|
|
$ |
40,447 |
|
|
$ |
39,806 |
|
|
$ |
27,402 |
|
|
$ |
26,279 |
|
Adjustments: |
|
|
|
|
|
|
|
|
|
|
|
|
|
|
|
|||||
Provision for (reversal of provision for) credit losses |
|
|
— |
|
|
|
2,150 |
|
|
|
(1,700 |
) |
|
|
13,200 |
|
|
|
1,250 |
|
Income tax provision |
|
|
7,130 |
|
|
|
8,834 |
|
|
|
8,750 |
|
|
|
5,895 |
|
|
|
5,778 |
|
PPP loans, including fees |
|
|
(21 |
) |
|
|
(1,277 |
) |
|
|
(7,822 |
) |
|
|
(6,270 |
) |
|
|
— |
|
Net interest expense on PPP-related borrowings |
|
|
— |
|
|
|
— |
|
|
|
— |
|
|
|
34 |
|
|
|
— |
|
Net core earnings attributable to Guaranty Bancshares, Inc. |
|
$ |
37,146 |
|
|
$ |
50,154 |
|
|
$ |
39,034 |
|
|
$ |
40,261 |
|
|
$ |
33,307 |
|
|
|
|
|
|
|
|
|
|
|
|
|
|
|
|
|
|||||
Weighted-average common shares outstanding, basic* |
|
|
11,693,761 |
|
|
|
11,980,209 |
|
|
|
12,065,182 |
|
|
|
12,219,420 |
|
|
|
12,802,787 |
|
Earnings per common share, basic* |
|
$ |
2.57 |
|
|
$ |
3.38 |
|
|
$ |
3.30 |
|
|
$ |
2.25 |
|
|
$ |
2.05 |
|
Net core earnings attributable to Guaranty Bancshares, Inc. per common share, basic* |
|
|
3.18 |
|
|
|
4.19 |
|
|
|
3.24 |
|
|
|
3.29 |
|
|
|
2.60 |
|
|
|
|
|
|
|
|
|
|
|
|
|
|
|
|
|
|||||
* Periods prior to the stock dividend issued during the first quarter of 2021 have been adjusted to give effect to the 10% stock dividend. |
|
|||||||||||||||||||
ITEM 7A. QUANTITATIVE AND QUALITATIVE DISCLOSURES ABOUT MARKET RISK.
Interest Rate Sensitivity and Market Risk
As a financial institution, our primary component of market risk is interest rate volatility. Our asset liability and funds management policy provides management with the guidelines for effective funds management, and we have established a measurement system for monitoring our net interest rate sensitivity position. We have historically managed our sensitivity position within our established guidelines.
Fluctuations in interest rates will ultimately impact both the level of income and expense recorded on most of our assets and liabilities, and the market value of all interest-earning assets and interest-bearing liabilities, other than those which have a short term to maturity. Interest rate risk is the potential of economic losses due to future interest rate changes. These economic losses can be reflected as a loss of future net interest income and/or a loss of current fair market values.
71
The objective is to measure the effect on net interest income and to adjust the balance sheet to minimize the inherent risk while at the same time maximizing income.
We manage our exposure to interest rates by structuring our balance sheet in the ordinary course of business. We do not enter into instruments such as leveraged derivatives, financial options, financial future contracts or forward delivery contracts for the purpose of reducing interest rate risk. Based upon the nature of our operations, we are not subject to foreign exchange or commodity price risk. We do not own any trading assets.
Our exposure to interest rate risk is managed by the asset-liability committee of Guaranty Bank & Trust, in accordance with policies approved by its board of directors. The committee formulates strategies based on appropriate levels of interest rate risk. In determining the appropriate level of interest rate risk, the committee considers the impact on earnings and capital on the current outlook on interest rates, potential changes in interest rates, regional economies, liquidity, business strategies and other factors. The committee meets regularly to review, among other things, the sensitivity of assets and liabilities to interest rate changes, the book and market values of assets and liabilities, unrealized gains and losses, purchase and sale activities, commitments to originate loans and the maturities of investments and borrowings. Additionally, the committee reviews liquidity, cash flow flexibility, maturities of deposits and consumer and commercial deposit activity. Management employs methodologies to manage interest rate risk, which include an analysis of relationships between interest-earning assets and interest-bearing liabilities and an interest rate shock simulation model.
We use interest rate risk simulation models and shock analyses to test the interest rate sensitivity of net interest income and fair value of equity, and the impact of changes in interest rates on other financial metrics. Contractual maturities and re-pricing opportunities of loans are incorporated in the model as are prepayment assumptions, maturity data and call options within the investment portfolio. Average life of non-maturity deposit accounts are based on standard regulatory decay assumptions and are incorporated into the model. The assumptions used are inherently uncertain and, as a result, the model cannot precisely measure future net interest income or precisely predict the impact of fluctuations in market interest rates on net interest income. Actual results will differ from the model’s simulated results due to timing, magnitude and frequency of interest rate changes as well as changes in market conditions and the application and timing of various management strategies.
On a quarterly basis, we run two simulation models including a static balance sheet and dynamic growth balance sheet. These models test the impact on net interest income and fair value of equity from changes in market interest rates under various scenarios. Under the static and dynamic growth models, rates are shocked instantaneously and ramped rate changes over a twelve-month horizon based upon parallel and non-parallel yield curve shifts. Parallel shock scenarios assume instantaneous parallel movements in the yield curve compared to a flat yield curve scenario. Non-parallel simulation involves analysis of interest income and expense under various changes in the shape of the yield curve. Our internal policy regarding internal rate risk simulations currently specifies that for instantaneous parallel shifts of the yield curve, estimated net income at risk for the subsequent one-year period should not decline by more than 15.0% for a 100 basis point shift, 20.0% for a 200 basis point shift and 30.0% for a 300 basis point shift.
The following table summarizes the simulated change in net interest income and fair value of equity over a 12-month horizon as of the dates indicated:
|
|
December 31, 2023 |
|
|
December 31, 2022 |
|
||||||||||
Change in Interest Rates |
|
Percent Change |
|
|
Percent Change |
|
|
Percent Change |
|
|
Percent Change |
|
||||
+300 |
|
|
(2.31 |
%) |
|
|
(19.90 |
%) |
|
|
0.43 |
% |
|
|
(18.35 |
%) |
+200 |
|
|
(1.64 |
%) |
|
|
(12.07 |
%) |
|
|
0.17 |
% |
|
|
(10.87 |
%) |
+100 |
|
|
(1.13 |
%) |
|
|
(5.77 |
%) |
|
|
(0.21 |
%) |
|
|
(5.17 |
%) |
Base |
|
|
— |
|
|
|
— |
|
|
|
— |
|
|
|
— |
|
-100 |
|
|
(0.57 |
%) |
|
|
2.67 |
% |
|
|
0.34 |
% |
|
|
1.48 |
% |
-200 |
|
|
0.07 |
% |
|
|
3.13 |
% |
|
|
4.16 |
% |
|
|
(0.70 |
%) |
The results are primarily due to behavior of demand, money market and savings deposits during such rate fluctuations. We have found that, historically, interest rates on these deposits change more slowly than changes in the discount and federal funds rates. This assumption is incorporated into the simulation model and is generally not fully reflected in a gap analysis. The assumptions incorporated into the model are inherently uncertain and, as a result, the model cannot precisely measure future net interest income or precisely predict the impact of fluctuations in market interest rates on net interest income. Actual results will differ from the model’s simulated results due to timing, magnitude and frequency of interest rate changes as well as changes in market conditions and the application and timing of various strategies.
72
ITEM 8. FINANCIAL STATEMENTS AND SUPPLEMENTARY DATA.
The financial statements, the reports thereon, the notes thereto and supplementary data commence on page F-1 of this Annual Report on Form 10-K. See “Item 15. Exhibits and Financial Statement Schedules.”
ITEM 9. CHANGES IN AND DISAGREEMENTS WITH ACCOUNTANTS ON ACCOUNT AND FINANCIAL DISCLOSURE.
None.
ITEM 9A. CONTROLS AND PROCEDURES.
Evaluation of disclosure controls and procedures. As of the end of the period covered by this Annual Report on Form 10‑K, the Company carried out an evaluation, under the supervision and with the participation of its management, including its Chief Executive Officer and Chief Financial Officer, of the effectiveness of the design and operation of its disclosure controls and procedures. In designing and evaluating the disclosure controls and procedures, management recognizes that any controls and procedures, no matter how well designed and operated, can provide only reasonable assurance of achieving the desired control objectives, and management was required to apply judgment in evaluating its controls and procedures. Based on this evaluation, the Company’s Chief Executive Officer and Chief Financial Officer concluded that the Company’s disclosure controls and procedures (as defined in Rules 13a‑15(e) and 15d‑15(e) under the Exchange Act, were effective as of the end of the period covered by this report.
Changes in internal control over financial reporting. There were no changes in the Company’s internal control over financial reporting (as defined in Rules 13a‑15(f) and 15d‑15(f) under the Exchange Act) that occurred during the year ended December 31, 2023, that have materially affected, or are reasonably likely to materially affect, the Company’s internal control over financial reporting.
Report on Management’s Assessment of Internal Control Over Financial Reporting. Management of the Company is responsible for establishing and maintaining adequate internal control over financial reporting (as defined in Rules 13a-15(e) and 15d-15(e) under the Exchange Act). The Company’s internal control system is a process designed to provide reasonable assurance regarding the preparation and fair presentation of published financial statements in accordance with GAAP. All internal control systems, no matter how well designed, have inherent limitations and can only provide reasonable assurance with respect to financial reporting.
As of December 31, 2023, management assessed the effectiveness of the Company’s internal control over financial reporting based on the criteria for effective internal control over financial reporting established in “Internal Control—Integrated Framework,” issued by the Committee of Sponsoring Organizations (“COSO”) of the Treadway Commission in 2013. Based on the assessment, management determined that the Company maintained effective internal control over financial reporting as of December 31, 2023.
Whitley Penn LLP, Plano, Texas, (U.S. PCAOB Auditor Firm I.D.: 726), the independent registered public accounting firm that audited the consolidated financial statements of the Company included in this Annual Report on Form 10-K, has issued a report on the effectiveness of the Company’s internal control over financial reporting as of December 31, 2023. The report, which expresses an unqualified opinion on the effectiveness of the Company’s internal control over financial reporting as of December 31, 2023, is included in this Item under the heading “Report of Independent Registered Public Accounting Firm.”
73
REPORT OF INDEPENDENT REGISTERED PUBLIC ACCOUNTING FIRM
Board of Directors and Shareholders
Guaranty Bancshares, Inc.
Opinion on Internal Control Over Financial Reporting
We have audited Guaranty Bancshares, Inc.’s (the “Company”) internal control over financial reporting as of December 31, 2023, based on criteria established in 2013 Internal Control—Integrated Framework issued by the Committee of Sponsoring Organizations of the Treadway Commission (COSO). In our opinion, the Company maintained, in all material respects, effective internal control over financial reporting as of December 31, 2023, based on criteria established in 2013 Internal Control—Integrated Framework issued by the Committee of Sponsoring Organizations of the Treadway Commission (COSO).
We also have audited, in accordance with the standards of the Public Company Accounting Oversight Board (United States) (“PCAOB”), the consolidated balance sheets of the Company of December 31, 2023 and 2022, and the related consolidated statements of earnings, comprehensive income, changes in shareholders’ equity, and cash flows for each of the three years in the period ended December 31, 2023, and the related notes (collectively referred to as the “consolidated financial statements”) and our report dated March 14, 2024 expressed an unqualified opinion on those consolidated financial statements.
Basis for Opinion
The Company’s management is responsible for maintaining effective internal control over financial reporting, and for its assessment of the effectiveness of internal control over financial reporting, included in the accompanying Report on Management’s Assessment of Internal Control Over Financial Reporting. Our responsibility is to express an opinion on the entity’s internal control over financial reporting based on our audit. We are a public accounting firm registered with the PCAOB and are required to be independent with respect to the Company in accordance with the U.S. federal securities laws and the applicable rules and regulations of the Securities and Exchange Commission and the PCAOB.
We conducted our audit in accordance with the standards of the PCAOB. Those standards require that we plan and perform the audit to obtain reasonable assurance about whether effective internal control over financial reporting was maintained in all material respects. Our audit of internal control over financial reporting included obtaining an understanding of internal control over financial reporting, assessing the risk that a material weakness exists, and testing and evaluating the design and operating effectiveness of internal control based on the assessed risk. Our audit also included performing such other procedures as we considered necessary in the circumstances. We believe that our audit provides a reasonable basis for our opinion.
Definition and Limitations of Internal Control Over Financial Reporting
An entity’s internal control over financial reporting is a process designed to provide reasonable assurance regarding the reliability of financial reporting and the preparation of financial statements for external purposes in accordance with accounting principles generally accepted in the United States of America. An entity’s internal control over financial reporting includes those policies and procedures that (1) pertain to the maintenance of records that, in reasonable detail, accurately and fairly reflect the transactions and dispositions of the assets of the entity; (2) provide reasonable assurance that transactions are recorded as necessary to permit preparation of financial statements in accordance with accounting principles generally accepted in the United States of America, and that receipts and expenditures of the entity are being made only in accordance with authorizations of management and directors of the entity; and (3) provide reasonable assurance regarding prevention or timely detection of unauthorized acquisition, use, or disposition of the entity’s assets that could have a material effect on the financial statements.
Because of its inherent limitations, internal control over financial reporting may not prevent or detect misstatements. Also, projections of any evaluation of effectiveness to future periods are subject to the risk that controls may become inadequate because of changes in conditions, or that the degree of compliance with the policies or procedures may deteriorate.
/s/ Whitley Penn LLP
Plano, Texas
March 14, 2024
74
ITEM 9B. OTHER INFORMATION.
(a) Not applicable.
(b) During the three months ended December 31, 2023, no director or officer of the Company adopted or terminated a "Rule 10b5-1 trading arrangement" or "non-Rule 10b5-1 trading arrangement," as each term is defined in item 408(a) of Regulation S-K.
ITEM 9C. DISCLOSURE REGARDING FOREIGN JURISDICTIONS THAT PREVENT INSPECTIONS.
Not applicable.
PART III
ITEM 10. DIRECTORS, EXECUTIVE OFFICERS AND CORPORATE GOVERNANCE.
The information called for by this item is incorporated herein by reference from our Definitive Proxy Statement for our Annual Meeting of Shareholders being held on May 15, 2024, a copy of which will be filed with the SEC within 120 days of the end of the fiscal year ended December 31, 2023.
ITEM 11. EXECUTIVE COMPENSATION.
The information called for by this item is incorporated herein by reference from our Definitive Proxy Statement for our Annual Meeting of Shareholders being held on May 15, 2024, a copy of which will be filed with the SEC within 120 days of the end of the fiscal year ended December 31, 2023.
ITEM 12. SECURITY OWNERSHIP OF CERTAIN BENEFICIAL OWNERS AND MANAGEMENT AND RELATED STOCKHOLDER MATTERS.
The information called for by this item related to security ownership of certain beneficial owners and management is incorporated herein by reference from our Definitive Proxy Statement for our Annual Meeting of Shareholders being held on May 15, 2024, a copy of which will be filed with the SEC within 120 days of the end of the fiscal year ended December 31, 2023.
The information called for by this item is incorporated herein by reference from our Definitive Proxy Statement for our Annual Meeting of Shareholders being held on May 15, 2024, a copy of which will be filed with the SEC within 120 days of the end of the fiscal year ended December 31, 2023.
ITEM 14. PRINCIPAL ACCOUNTANT FEES AND SERVICES.
The information concerning principal accounting fees and services is incorporated herein by reference from our Definitive Proxy Statement for our Annual Meeting of Shareholders being held on May 15, 2024, a copy of which will be filed with the SEC within 120 days of the end of the fiscal year ended December 31, 2023.
PART IV
ITEM 15. EXHIBITS AND FINANCIAL STATEMENT SCHEDULES.
The following documents are filed as part of this Annual Report on Form 10-K:
75
Each exhibit marked with an asterisk is filed or furnished with this Annual Report on Form 10-K as noted below:
|
Exhibit No. |
|
Description |
3.1 |
|
|
3.2 |
|
|
4.1 |
|
|
|
|
The other instruments defining the rights of the long-term debt securities of Guaranty Bancshares, Inc. and its subsidiaries are omitted pursuant to section (b)(4)(iii)(A) of Item 601 of Regulation S-K. Guaranty Bancshares, Inc. hereby agrees to furnish copies of these instruments to the SEC upon request. |
4.2 |
|
Description of Securities Registered under Section 12 of the Exchange Act.* |
10.1† |
|
|
10.2† |
|
|
10.3† |
|
|
10.4† |
|
|
10.5† |
|
|
10.6† |
|
|
10.7† |
|
|
10.8† |
|
|
10.9† |
|
|
10.10† |
|
76
10.11† |
|
|
10.12† |
|
|
10.13† |
|
|
10.14† |
|
|
10.15† |
|
|
10.16 |
|
|
10.17 |
|
|
10.18 |
|
|
10.19 |
|
|
10.20† |
|
|
10.21† |
|
|
10.22† |
|
|
10.23† |
|
|
21.1 |
|
|
23.1 |
|
|
31.1 |
|
|
31.2 |
|
|
32.1 |
|
|
32.2 |
|
|
97.1 |
|
Guaranty Bancshares, Inc. Clawback Policy adopted October 2, 2023.* |
101.INS |
|
XBRL Instance Document* |
101.SCH |
|
XBRL Taxonomy Extension Schema Document* |
101.CAL |
|
XBRL Taxonomy Extension Calculation Linkbase Document* |
101.DEF |
|
XBRL Taxonomy Extension Definition Linkbase Document* |
101.LAB |
|
XBRL Taxonomy Extension Label Linkbase Document* |
101.PRE |
|
XBRL Taxonomy Extension Presentation Linkbase Document* |
* Filed with this Annual Report on Form 10-K.
** Furnished with this Annual Report on Form 10-K.
† Represents a management contract or a compensatory plan or arrangement.
77
78
ITEM 16. FORM 10-K SUMMARY
None.
SIGNATURES
Pursuant to the requirements of Section 13 or 15(d) of the Securities Exchange Act of 1934, the registrant has duly caused this report to be signed on its behalf by the undersigned thereunto duly authorized.
Date: March 14, 2024 |
GUARANTY BANCSHARES, INC. |
|
|
|
|
|
By: |
/s/ Tyson T. Abston |
|
Name: |
Tyson T. Abston |
|
Title: |
Chairman of the Board & Chief Executive Officer |
Pursuant to the requirements of the Securities Exchange Act of 1934, this report has been signed below by the following persons, on behalf of the registrant and in the capacities and on the dates indicated.
Name |
|
Title |
|
Date |
|
|
|
|
|
/s/ Tyson T. Abston |
|
Chairman and Chief Executive Officer |
|
3/14/2024 |
Tyson T. Abston |
|
(Principal Executive Officer) |
|
|
|
|
|
|
|
/s/ Shalene A. Jacobson |
|
Executive Vice President and Chief Financial Officer |
|
3/14/2024 |
Shalene A. Jacobson |
|
(Principal Financial and Accounting Officer) |
|
|
|
|
|
|
|
/s/ Kirk L. Lee |
|
President |
|
3/14/2024 |
Kirk L. Lee |
|
|
||
|
|
|
|
|
/s/ Richard W. Baker |
|
Director |
|
3/14/2024 |
Richard W. Baker |
|
|
||
|
|
|
|
|
/s/ Jeffrey W. Brown |
|
Director |
|
3/14/2024 |
Jeffrey W. Brown |
||||
|
|
|
|
|
/s/ James S. Bunch |
|
Director |
|
3/14/2024 |
James S. Bunch |
|
|
||
|
|
|
|
|
/s/ Sondra Cunningham |
|
Director |
|
3/14/2024 |
Sondra Cunningham |
|
|
||
|
|
|
|
|
/s/ Bradley K. Drake |
|
Director |
|
3/14/2024 |
Bradley K. Drake |
|
|
||
|
|
|
|
|
/s/ Christopher B. Elliott |
|
Director |
|
3/14/2024 |
Christopher B. Elliott |
|
|
||
|
|
|
|
|
/s/ Carl Johnson, Jr. |
|
Director |
|
3/14/2024 |
Carl Johnson, Jr. |
|
|
||
|
|
|
|
|
/s/ James M. Nolan, Jr. |
|
Director |
|
3/14/2024 |
James M. Nolan, Jr. |
||||
|
|
|
|
|
79
INDEX TO FINANCIAL STATEMENTS
Audited Consolidated Financial Statements of Guaranty Bancshares, Inc. as of December 31, 2023 and 2022 and for each of the three years ending December 31, 2023, 2022 and 2021.
F-1
REPORT OF INDEPENDENT REGISTERED PUBLIC ACCOUNTING FIRM
To the Board of Directors and Shareholders of
Guaranty Bancshares, Inc.
Opinion on the Financial Statements
We have audited the accompanying consolidated balance sheets of Guaranty Bancshares, Inc. (the “Company”) as of December 31, 2023 and 2022, and the related consolidated statements of earnings, comprehensive income, changes in shareholders’ equity, and cash flows for each of the three years in the period ended December 31, 2023, and the related notes (collectively referred to as the “consolidated financial statements”). In our opinion, the consolidated financial statements present fairly, in all material respects, the financial position of the Company as of December 31, 2023 and 2022, and the results of their operations and their cash flows for each of the three years in the period ended December 31, 2023, in conformity with accounting principles generally accepted in the United States of America.
We also have audited, in accordance with the standards of the Public Company Accounting Oversight Board (United States) (“PCAOB”), the Company’s internal control over financial reporting as of December 31, 2023, based on criteria established in 2013 Internal Control—Integrated Framework issued by the Committee of Sponsoring Organizations of the Treadway Commission (COSO), and our report dated March 14, 2024 expressed an unqualified opinion.
Basis for Opinion
These consolidated financial statements are the responsibility of the Company’s management. Our responsibility is to express an opinion on these consolidated financial statements based on our audits. We are a public accounting firm registered with the PCAOB and are required to be independent with respect to the Company in accordance with the U.S. federal securities laws and the applicable rules and regulations of the Securities and Exchange Commission and the PCAOB.
We conducted our audits in accordance with the standards of the PCAOB. Those standards require that we plan and perform the audit to obtain reasonable assurance about whether the financial statements are free of material misstatement, whether due to error or fraud. Our audits included performing procedures to assess the risks of material misstatement of the financial statements, whether due to error or fraud, and performing procedures that respond to those risks. Such procedures included examining, on a test basis, evidence regarding the amounts and disclosures in the financial statements. Our audits also included evaluating the accounting principles used and significant estimates made by management, as well as evaluating the overall presentation of the financial statements. We believe that our audits provide a reasonable basis for our opinion.
Critical Audit Matter
The critical audit matter communicated below is a matter arising from the current period audit of the financial statements that was communicated or required to be communicated to the audit committee and that: (1) relates to accounts or disclosures that are material to the financial statements and (2) involved especially challenging, subjective, or complex judgments. The communication of the critical audit matter does not alter in any way our opinion on the financial statements, taken as a whole, and we are not, by communicating the critical audit matter below, providing a separate opinion on the critical audit matter or on the accounts or disclosures to which it relates.
Allowance for Credit Losses for Loans – Qualitative Factors
Description of the Matter
As described in Notes 1 and 3 to the consolidated financial statements, the Company accounts for credit losses under Accounting Standards Codification ("ASC") 326, Financial Instruments – Credit Losses. ASC 326 requires the measurement of expected lifetime credit losses for financial assets measured at amortized cost at the reporting date. As of December 31, 2023, the balance of the allowance for credit losses on loans was approximately $31 million. The Company’s allowance for credit losses represents management’s best estimate of expected losses in the loan portfolio. Estimates of expected credit losses for loans are based on reasonable and supportable forecasts of future economic conditions, historical loss experience and qualitative factors.
F-2
Management estimates the allowance for credit losses balance using relevant available information, from internal and external sources, relating to past events, current conditions, and reasonable and supportable forecasts. Historical credit loss experience provides the basis for the estimation of expected credit losses. Adjustments to historical loss information are made for differences in current loan-specific risk characteristics such as differences in underwriting standards, portfolio mix, delinquency level, or term as well as for changes in environmental conditions, such as changes in unemployment rates, property values, or other relevant factors.
Our determination that auditing the qualitative adjustments of the allowance for credit losses for loans is a critical audit matter is a result of the high degree of subjectivity involved in management’s assessment of the risk of loss associated with the qualitative adjustments and the determination of the adjustment amounts to historical loss rates for current conditions, and reasonable and supportable forecasts.
How We Addressed the Matter in Our Audit
The primary procedures performed to address this critical audit matter included:
/s/ Whitley Penn LLP
We have served as the Company’s auditor since 2015.
Plano, Texas
March 14, 2024
F-3
GUARANTY BANCSHARES, INC.
CONSOLIDATED BALANCE SHEETS
December 31, 2023 and 2022
(Dollars in thousands, except per share amounts)
|
|
|
|
|
|
|
||
|
|
2023 |
|
|
2022 |
|
||
ASSETS |
|
|
|
|
|
|
||
Cash and due from banks |
|
$ |
47,744 |
|
|
$ |
52,390 |
|
Federal funds sold |
|
|
36,575 |
|
|
|
47,275 |
|
Interest-bearing deposits |
|
|
5,205 |
|
|
|
6,802 |
|
Total cash and cash equivalents |
|
|
89,524 |
|
|
|
106,467 |
|
Securities available for sale |
|
|
196,195 |
|
|
|
188,927 |
|
Securities held to maturity |
|
|
404,208 |
|
|
|
509,008 |
|
Loans held for sale |
|
|
976 |
|
|
|
3,156 |
|
Loans, net of allowance for credit losses of $30,920 and $31,974, respectively |
|
|
2,290,881 |
|
|
|
2,344,245 |
|
Accrued interest receivable |
|
|
13,143 |
|
|
|
11,555 |
|
Premises and equipment, net |
|
|
57,018 |
|
|
|
54,291 |
|
Other real estate owned |
|
|
— |
|
|
|
38 |
|
Cash surrender value of life insurance |
|
|
42,348 |
|
|
|
38,404 |
|
Core deposit intangible, net |
|
|
1,418 |
|
|
|
1,859 |
|
Goodwill |
|
|
32,160 |
|
|
|
32,160 |
|
Other assets |
|
|
56,920 |
|
|
|
61,385 |
|
Total assets |
|
$ |
3,184,791 |
|
|
$ |
3,351,495 |
|
LIABILITIES AND EQUITY |
|
|
|
|
|
|
||
Liabilities |
|
|
|
|
|
|
||
Deposits |
|
|
|
|
|
|
||
Noninterest-bearing |
|
$ |
852,957 |
|
|
$ |
1,052,144 |
|
Interest-bearing |
|
|
1,780,289 |
|
|
|
1,629,010 |
|
Total deposits |
|
|
2,633,246 |
|
|
|
2,681,154 |
|
Securities sold under agreements to repurchase |
|
|
25,172 |
|
|
|
7,221 |
|
Accrued interest and other liabilities |
|
|
32,242 |
|
|
|
28,409 |
|
Line of credit |
|
|
4,500 |
|
|
|
— |
|
Federal Home Loan Bank advances |
|
|
140,000 |
|
|
|
290,000 |
|
Subordinated debt, net |
|
|
45,785 |
|
|
|
49,153 |
|
Total liabilities |
|
|
2,880,945 |
|
|
|
3,055,937 |
|
Commitments and contingencies (see Note 15) |
|
|
|
|
|
|
||
Equity |
|
|
|
|
|
|
||
Preferred stock, $5.00 par value, 15,000,000 shares authorized, no shares issued |
|
|
— |
|
|
|
— |
|
Common stock, $1.00 par value, 50,000,000 shares authorized, 14,242,328 and 14,208,558 shares issued, and 11,540,644 and 11,941,672 shares outstanding, respectively |
|
|
14,242 |
|
|
|
14,209 |
|
Additional paid-in capital |
|
|
228,986 |
|
|
|
227,727 |
|
Retained earnings |
|
|
156,878 |
|
|
|
137,565 |
|
Treasury stock, 2,701,684 and 2,266,886 shares, respectively, at cost |
|
|
(71,484 |
) |
|
|
(60,257 |
) |
Accumulated other comprehensive loss |
|
|
(25,322 |
) |
|
|
(24,260 |
) |
Equity attributable to Guaranty Bancshares, Inc. |
|
|
303,300 |
|
|
|
294,984 |
|
Noncontrolling interest |
|
|
546 |
|
|
|
574 |
|
Total equity |
|
|
303,846 |
|
|
|
295,558 |
|
Total liabilities and equity |
|
$ |
3,184,791 |
|
|
$ |
3,351,495 |
|
See accompanying notes to consolidated financial statements.
F-4
GUARANTY BANCSHARES, INC.
CONSOLIDATED STATEMENTS OF EARNINGS
For the Years Ended December 31, 2023, 2022 and 2021
(Dollars in thousands, except per share data)
|
|
|
|
|
|
|
|
|
|
|||
|
|
2023 |
|
|
2022 |
|
|
2021 |
|
|||
Interest income |
|
|
|
|
|
|
|
|
|
|||
Loans, including fees |
|
$ |
136,086 |
|
|
$ |
104,503 |
|
|
$ |
92,497 |
|
Securities |
|
|
|
|
|
|
|
|
|
|||
Taxable |
|
|
11,580 |
|
|
|
11,466 |
|
|
|
4,762 |
|
Nontaxable |
|
|
4,789 |
|
|
|
5,131 |
|
|
|
4,218 |
|
Nonmarketable equity securities |
|
|
1,288 |
|
|
|
1,246 |
|
|
|
740 |
|
Federal funds sold and interest-bearing deposits |
|
|
2,749 |
|
|
|
863 |
|
|
|
333 |
|
Total interest income |
|
|
156,492 |
|
|
|
123,209 |
|
|
|
102,550 |
|
|
|
|
|
|
|
|
|
|
|
|||
Interest expense |
|
|
|
|
|
|
|
|
|
|||
Deposits |
|
|
44,981 |
|
|
|
9,753 |
|
|
|
5,651 |
|
FHLB advances and federal funds purchased |
|
|
11,626 |
|
|
|
3,855 |
|
|
|
413 |
|
Subordinated debt |
|
|
2,143 |
|
|
|
1,722 |
|
|
|
700 |
|
Other borrowed money |
|
|
762 |
|
|
|
50 |
|
|
|
228 |
|
Total interest expense |
|
|
59,512 |
|
|
|
15,380 |
|
|
|
6,992 |
|
|
|
|
|
|
|
|
|
|
|
|||
Net interest income |
|
|
96,980 |
|
|
|
107,829 |
|
|
|
95,558 |
|
Provision for (reversal of provision for) credit losses |
|
|
— |
|
|
|
2,150 |
|
|
|
(1,700 |
) |
Net interest income after reversal of provision for credit losses |
|
|
96,980 |
|
|
|
105,679 |
|
|
|
97,258 |
|
|
|
|
|
|
|
|
|
|
|
|||
Noninterest income |
|
|
|
|
|
|
|
|
|
|||
Service charges |
|
|
4,387 |
|
|
|
4,288 |
|
|
|
3,772 |
|
Net realized (loss) gain on sales of securities available for sale |
|
|
(229 |
) |
|
|
172 |
|
|
|
— |
|
Net realized gain on sale of loans |
|
|
1,201 |
|
|
|
2,435 |
|
|
|
5,528 |
|
Merchant and debit card fees |
|
|
7,307 |
|
|
|
7,121 |
|
|
|
6,717 |
|
Other income |
|
|
9,847 |
|
|
|
9,469 |
|
|
|
8,559 |
|
Total noninterest income |
|
|
22,513 |
|
|
|
23,485 |
|
|
|
24,576 |
|
|
|
|
|
|
|
|
|
|
|
|||
Noninterest expense |
|
|
|
|
|
|
|
|
|
|||
Employee compensation and benefits |
|
|
48,862 |
|
|
|
47,477 |
|
|
|
42,345 |
|
Occupancy expenses |
|
|
11,301 |
|
|
|
11,129 |
|
|
|
10,944 |
|
Other expenses |
|
|
22,191 |
|
|
|
21,301 |
|
|
|
19,989 |
|
Total noninterest expense |
|
|
82,354 |
|
|
|
79,907 |
|
|
|
73,278 |
|
|
|
|
|
|
|
|
|
|
|
|||
Income before income taxes |
|
|
37,139 |
|
|
|
49,257 |
|
|
|
48,556 |
|
Income tax provision |
|
|
7,130 |
|
|
|
8,834 |
|
|
|
8,750 |
|
Net earnings |
|
$ |
30,009 |
|
|
$ |
40,423 |
|
|
$ |
39,806 |
|
Net loss attributable to noncontrolling interest |
|
|
28 |
|
|
|
24 |
|
|
|
— |
|
Net earnings attributable to Guaranty Bancshares, Inc. |
|
$ |
30,037 |
|
|
$ |
40,447 |
|
|
$ |
39,806 |
|
Basic earnings per share |
|
$ |
2.57 |
|
|
$ |
3.38 |
|
|
$ |
3.30 |
|
Diluted earnings per share |
|
$ |
2.56 |
|
|
$ |
3.34 |
|
|
$ |
3.26 |
|
|
|
|
|
|
|
|
|
|
|
|||
See accompanying notes to consolidated financial statements.
F-5
GUARANTY BANCSHARES, INC.
CONSOLIDATED STATEMENTS OF COMPREHENSIVE INCOME
For the Years Ended December 31, 2023, 2022 and 2021
(Dollars in thousands)
|
|
|
|
|
|
|
|
|
|
|||
|
|
2023 |
|
|
2022 |
|
|
2021 |
|
|||
Net earnings |
|
$ |
30,009 |
|
|
$ |
40,423 |
|
|
$ |
39,806 |
|
Other comprehensive loss: |
|
|
|
|
|
|
|
|
|
|||
Unrealized losses on securities: |
|
|
|
|
|
|
|
|
|
|||
Unrealized holding losses arising during the period, net of tax |
|
|
(139 |
) |
|
|
(12,750 |
) |
|
|
(15,673 |
) |
Reclassification adjustment for net losses (gains) included in net earnings, net of tax |
|
|
181 |
|
|
|
(136 |
) |
|
|
— |
|
Unrealized losses on available for sale securities transferred to held to maturity, net of tax and amortization |
|
|
(1,104 |
) |
|
|
(17,491 |
) |
|
|
11,010 |
|
Unrealized losses on securities, net of tax |
|
|
(1,062 |
) |
|
|
(30,377 |
) |
|
|
(4,663 |
) |
|
|
|
|
|
|
|
|
|
|
|||
Unrealized (losses) gains on interest rate swaps: |
|
|
|
|
|
|
|
|
|
|||
Unrealized holding gains arising during the period |
|
|
— |
|
|
|
497 |
|
|
|
873 |
|
Reclassification of realized (gains) losses on interest rate swap termination from accumulated other comprehensive loss |
|
|
— |
|
|
|
(685 |
) |
|
|
466 |
|
Unrealized (losses) gains on interest rate swaps |
|
|
— |
|
|
|
(188 |
) |
|
|
1,339 |
|
|
|
|
|
|
|
|
|
|
|
|||
Total other comprehensive loss |
|
|
(1,062 |
) |
|
|
(30,565 |
) |
|
|
(3,324 |
) |
|
|
|
|
|
|
|
|
|
|
|||
Comprehensive income |
|
|
28,947 |
|
|
|
9,858 |
|
|
|
36,482 |
|
Less comprehensive loss attributable to noncontrolling interest |
|
|
28 |
|
|
|
24 |
|
|
|
— |
|
Comprehensive income attributable to Guaranty Bancshares, Inc. |
|
$ |
28,975 |
|
|
$ |
9,882 |
|
|
$ |
36,482 |
|
See accompanying notes to consolidated financial statements.
F-6
GUARANTY BANCSHARES, INC.
CONSOLIDATED STATEMENTS OF CHANGES IN SHAREHOLDERS’ EQUITY
For the Years Ended December 31, 2023, 2022 and 2021
(Dollars in thousands, except per share amounts)
|
|
Attributable to Guaranty Bancshares, Inc. |
|
|
|
|
|
|
|
|||||||||||||||||||||||
|
|
Preferred |
|
|
Common |
|
|
Additional |
|
|
Retained |
|
|
Treasury |
|
|
Accumulated |
|
|
Noncontrolling Interest |
|
|
Total |
|
||||||||
Balance at December 31, 2020 |
|
$ |
— |
|
|
$ |
12,952 |
|
|
$ |
188,032 |
|
|
$ |
113,449 |
|
|
$ |
(51,419 |
) |
|
$ |
9,629 |
|
|
$ |
— |
|
|
$ |
272,643 |
|
Net earnings |
|
|
— |
|
|
|
— |
|
|
|
— |
|
|
|
39,806 |
|
|
|
— |
|
|
|
— |
|
|
|
— |
|
|
|
39,806 |
|
Other comprehensive income |
|
|
— |
|
|
|
— |
|
|
|
— |
|
|
|
— |
|
|
|
— |
|
|
|
(3,324 |
) |
|
|
— |
|
|
|
(3,324 |
) |
10% stock dividend |
|
|
— |
|
|
|
1,094 |
|
|
|
34,853 |
|
|
|
(35,947 |
) |
|
|
— |
|
|
|
— |
|
|
|
— |
|
|
|
— |
|
Exercise of stock options |
|
|
— |
|
|
|
90 |
|
|
|
1,929 |
|
|
|
— |
|
|
|
— |
|
|
|
— |
|
|
|
— |
|
|
|
2,019 |
|
Restricted stock grants |
|
|
— |
|
|
|
3 |
|
|
|
(3 |
) |
|
|
— |
|
|
|
— |
|
|
|
— |
|
|
|
— |
|
|
|
— |
|
Stock based compensation |
|
|
— |
|
|
|
— |
|
|
|
733 |
|
|
|
— |
|
|
|
— |
|
|
|
— |
|
|
|
— |
|
|
|
733 |
|
Cash dividends: |
|
|
|
|
|
|
|
|
|
|
|
|
|
|
|
|
|
|
|
|
|
|
|
|
||||||||
Common - $0.80 per share |
|
|
— |
|
|
|
— |
|
|
|
— |
|
|
|
(9,663 |
) |
|
|
— |
|
|
|
— |
|
|
|
— |
|
|
|
(9,663 |
) |
Balance at December 31, 2021 |
|
|
— |
|
|
|
14,139 |
|
|
|
225,544 |
|
|
|
107,645 |
|
|
|
(51,419 |
) |
|
|
6,305 |
|
|
|
— |
|
|
|
302,214 |
|
Net earnings |
|
|
— |
|
|
|
— |
|
|
|
— |
|
|
|
40,447 |
|
|
|
— |
|
|
|
— |
|
|
|
(24 |
) |
|
|
40,423 |
|
Other comprehensive loss |
|
|
— |
|
|
|
— |
|
|
|
— |
|
|
|
— |
|
|
|
— |
|
|
|
(30,565 |
) |
|
|
— |
|
|
|
(30,565 |
) |
Contributions from noncontrolling interest |
|
|
— |
|
|
|
— |
|
|
|
— |
|
|
|
— |
|
|
|
— |
|
|
|
— |
|
|
|
598 |
|
|
|
598 |
|
Exercise of stock options |
|
|
— |
|
|
|
70 |
|
|
|
1,495 |
|
|
|
— |
|
|
|
— |
|
|
|
— |
|
|
|
— |
|
|
|
1,565 |
|
Purchase of treasury stock |
|
|
— |
|
|
|
— |
|
|
|
— |
|
|
|
— |
|
|
|
(8,838 |
) |
|
|
— |
|
|
|
— |
|
|
|
(8,838 |
) |
Stock based compensation |
|
|
— |
|
|
|
— |
|
|
|
688 |
|
|
|
— |
|
|
|
— |
|
|
|
— |
|
|
|
— |
|
|
|
688 |
|
Cash dividends: |
|
|
|
|
|
|
|
|
|
|
|
|
|
|
|
|
|
|
|
|
|
|
|
|
||||||||
Common - $0.88 per share |
|
|
— |
|
|
|
— |
|
|
|
— |
|
|
|
(10,527 |
) |
|
|
— |
|
|
|
— |
|
|
|
— |
|
|
|
(10,527 |
) |
Balance at December 31, 2022 |
|
|
— |
|
|
|
14,209 |
|
|
|
227,727 |
|
|
|
137,565 |
|
|
|
(60,257 |
) |
|
|
(24,260 |
) |
|
|
574 |
|
|
|
295,558 |
|
Net earnings |
|
|
— |
|
|
|
— |
|
|
|
— |
|
|
|
30,037 |
|
|
|
— |
|
|
|
— |
|
|
|
(28 |
) |
|
|
30,009 |
|
Other comprehensive loss |
|
|
— |
|
|
|
— |
|
|
|
— |
|
|
|
— |
|
|
|
— |
|
|
|
(1,062 |
) |
|
|
— |
|
|
|
(1,062 |
) |
Exercise of stock options |
|
|
— |
|
|
|
29 |
|
|
|
669 |
|
|
|
— |
|
|
|
— |
|
|
|
— |
|
|
|
— |
|
|
|
698 |
|
Purchase of treasury stock |
|
|
— |
|
|
|
— |
|
|
|
— |
|
|
|
— |
|
|
|
(11,227 |
) |
|
|
— |
|
|
|
— |
|
|
|
(11,227 |
) |
Restricted stock grants |
|
|
— |
|
|
|
4 |
|
|
|
(4 |
) |
|
|
— |
|
|
|
— |
|
|
|
— |
|
|
|
— |
|
|
|
— |
|
Stock based compensation |
|
|
— |
|
|
|
— |
|
|
|
594 |
|
|
|
— |
|
|
|
— |
|
|
|
— |
|
|
|
— |
|
|
|
594 |
|
Cash dividends: |
|
|
|
|
|
|
|
|
|
|
|
|
|
|
|
|
|
|
|
|
|
|
|
|
||||||||
Common - $0.92 per share |
|
|
— |
|
|
|
— |
|
|
|
— |
|
|
|
(10,724 |
) |
|
|
— |
|
|
|
— |
|
|
|
— |
|
|
|
(10,724 |
) |
Balance at December 31, 2023 |
|
$ |
— |
|
|
$ |
14,242 |
|
|
$ |
228,986 |
|
|
$ |
156,878 |
|
|
$ |
(71,484 |
) |
|
$ |
(25,322 |
) |
|
$ |
546 |
|
|
$ |
303,846 |
|
See accompanying notes to consolidated financial statements.
F-7
GUARANTY BANCSHARES, INC.
CONSOLIDATED STATEMENTS OF CASH FLOWS
For the Years Ended December 31, 2023, 2022 and 2021
(Dollars in thousands)
|
|
|
|
|||||||||
|
|
2023 |
|
|
2022 |
|
|
2021 |
|
|||
Cash flows from operating activities |
|
|
|
|
|
|
|
|
|
|||
Net earnings |
|
$ |
30,009 |
|
|
$ |
40,423 |
|
|
$ |
39,806 |
|
Adjustments to reconcile net earnings to net cash provided by operating activities: |
|
|
|
|
|
|
|
|
|
|||
Depreciation |
|
|
4,042 |
|
|
|
4,211 |
|
|
|
4,358 |
|
Amortization |
|
|
734 |
|
|
|
724 |
|
|
|
1,154 |
|
Deferred taxes |
|
|
346 |
|
|
|
(1,157 |
) |
|
|
(143 |
) |
Premium amortization, net of discount accretion |
|
|
2,070 |
|
|
|
4,919 |
|
|
|
4,368 |
|
Net realized loss (gain) on sales of securities available for sale |
|
|
229 |
|
|
|
(172 |
) |
|
|
— |
|
Gain on sale of loans |
|
|
(1,201 |
) |
|
|
(2,435 |
) |
|
|
(5,528 |
) |
Provision for (reversal of) credit losses |
|
|
— |
|
|
|
2,150 |
|
|
|
(1,700 |
) |
Origination of loans held for sale |
|
|
(39,066 |
) |
|
|
(73,292 |
) |
|
|
(118,500 |
) |
Proceeds from loans held for sale |
|
|
42,447 |
|
|
|
76,700 |
|
|
|
125,441 |
|
Write-down of other real estate and repossessed assets |
|
|
— |
|
|
|
19 |
|
|
|
6 |
|
Net gain on sale of premises, equipment, other real estate owned and other assets |
|
|
(2,943 |
) |
|
|
(925 |
) |
|
|
(23 |
) |
Stock based compensation |
|
|
594 |
|
|
|
688 |
|
|
|
733 |
|
Gain on BOLI death benefits |
|
|
— |
|
|
|
— |
|
|
|
(277 |
) |
Net change in accrued interest receivable and other assets |
|
|
(1,860 |
) |
|
|
(14,446 |
) |
|
|
(8,565 |
) |
Net change in accrued interest payable and other liabilities |
|
|
3,806 |
|
|
|
1,439 |
|
|
|
2,414 |
|
Net cash provided by operating activities |
|
$ |
39,207 |
|
|
$ |
38,846 |
|
|
$ |
43,544 |
|
|
|
|
|
|
|
|
|
|
|
|||
Cash flows from investing activities |
|
|
|
|
|
|
|
|
|
|||
Securities available for sale: |
|
|
|
|
|
|
|
|
|
|||
Purchases |
|
$ |
(1,671,050 |
) |
|
$ |
(641,739 |
) |
|
$ |
(1,223,595 |
) |
Proceeds from sales |
|
|
21,268 |
|
|
|
26,130 |
|
|
|
— |
|
Proceeds from maturities and principal repayments |
|
|
1,641,283 |
|
|
|
628,160 |
|
|
|
1,079,462 |
|
Securities held to maturity: |
|
|
|
|
|
|
|
|
|
|||
Purchases |
|
|
— |
|
|
|
(457,452 |
) |
|
|
(15,057 |
) |
Proceeds from maturities and principal repayments |
|
|
102,681 |
|
|
|
234,150 |
|
|
|
890 |
|
Net repayments (originations) of loans |
|
|
53,072 |
|
|
|
(470,389 |
) |
|
|
(43,148 |
) |
Purchases of premises and equipment |
|
|
(6,779 |
) |
|
|
(5,684 |
) |
|
|
(2,896 |
) |
Proceeds from BOLI death benefit |
|
|
— |
|
|
|
— |
|
|
|
464 |
|
Proceeds from sale of premises, equipment, other real estate owned and other assets |
|
|
3,558 |
|
|
|
1,860 |
|
|
|
1,202 |
|
Net cash provided by (used in) investing activities |
|
$ |
144,033 |
|
|
$ |
(684,964 |
) |
|
$ |
(202,678 |
) |
See accompanying notes to consolidated financial statements.
F-8
GUARANTY BANCSHARES, INC.
CONSOLIDATED STATEMENTS OF CASH FLOWS
For the Years Ended December 31, 2023, 2022 and 2021
(Dollars in thousands)
|
|
|
|
|||||||||
|
|
2023 |
|
|
2022 |
|
|
2021 |
|
|||
Cash flows from financing activities |
|
|
|
|
|
|
|
|
|
|||
Net change in deposits |
|
$ |
(47,908 |
) |
|
$ |
10,664 |
|
|
$ |
384,437 |
|
Net change in securities sold under agreements to repurchase |
|
|
17,951 |
|
|
|
(6,930 |
) |
|
|
(1,480 |
) |
Proceeds from FHLB advances |
|
|
3,275,000 |
|
|
|
1,135,000 |
|
|
|
160,000 |
|
Repayment of FHLB advances |
|
|
(3,425,000 |
) |
|
|
(892,500 |
) |
|
|
(221,601 |
) |
Proceeds from line of credit |
|
|
17,500 |
|
|
|
1,000 |
|
|
|
10,000 |
|
Repayment of line of credit |
|
|
(13,000 |
) |
|
|
(6,000 |
) |
|
|
(17,000 |
) |
Proceeds from issuance of subordinated debt |
|
|
— |
|
|
|
34,436 |
|
|
|
— |
|
Repayments of debentures |
|
|
(3,500 |
) |
|
|
(5,093 |
) |
|
|
— |
|
Purchase of treasury stock |
|
|
(11,227 |
) |
|
|
(8,838 |
) |
|
|
— |
|
Exercise of stock options |
|
|
698 |
|
|
|
1,565 |
|
|
|
2,019 |
|
Cash dividends paid |
|
|
(10,697 |
) |
|
|
(10,324 |
) |
|
|
(9,427 |
) |
Net cash (used in) provided by financing activities |
|
$ |
(200,183 |
) |
|
$ |
252,980 |
|
|
$ |
306,948 |
|
Net change in cash and cash equivalents |
|
|
(16,943 |
) |
|
|
(393,138 |
) |
|
|
147,814 |
|
Cash and cash equivalents at beginning of period |
|
|
106,467 |
|
|
|
499,605 |
|
|
|
351,791 |
|
Cash and cash equivalents at end of period |
|
$ |
89,524 |
|
|
$ |
106,467 |
|
|
$ |
499,605 |
|
|
|
|
|
|
|
|
|
|
|
|||
Supplemental disclosures of cash flow information |
|
|
|
|
|
|
|
|
|
|||
Interest paid |
|
$ |
56,588 |
|
|
$ |
13,513 |
|
|
$ |
7,315 |
|
Income taxes paid |
|
|
7,580 |
|
|
|
9,940 |
|
|
|
9,650 |
|
|
|
|
|
|
|
|
|
|
|
|||
Supplemental schedule of noncash investing and financing activities |
|
|
|
|
|
|
|
|
|
|||
Cash dividends accrued |
|
$ |
2,654 |
|
|
$ |
2,627 |
|
|
$ |
2,424 |
|
Lease right of use assets obtained in exchange for lease liabilities |
|
|
1,695 |
|
|
|
337 |
|
|
|
1,085 |
|
Available for sale securities transferred to held to maturity, net of unrealized loss of $13,186 for 2022 and net of unrealized gain of $10,235 for 2021. |
|
|
— |
|
|
|
106,157 |
|
|
|
172,292 |
|
Transfer of loans to other real estate owned and repossessed assets |
|
|
292 |
|
|
|
70 |
|
|
|
509 |
|
Contributions from noncontrolling interest |
|
|
— |
|
|
|
574 |
|
|
|
— |
|
Stock dividend |
|
|
— |
|
|
|
— |
|
|
|
35,947 |
|
See accompanying notes to consolidated financial statements.
F-9
|
GUARANTY BANCSHARES, INC. NOTES TO CONSOLIDATED FINANCIAL STATEMENTS (Dollars in thousands, except per share data) |
NOTE 1 - SUMMARY OF SIGNIFICANT ACCOUNTING POLICIES
The following is a summary of the significant accounting policies followed in the preparation of the consolidated financial statements. The policies conform to accounting principles generally accepted in the United States of America and to general practices within the banking industry.
Principles of Consolidation: The consolidated financial statements in this Annual Report on Form 10-K (this “Report”) include the accounts of Guaranty Bancshares, Inc. ("Guaranty"), Guaranty Bank & Trust N.A. (the "Bank") and indirect subsidiaries that are wholly-owned or controlled. Subsidiaries that are less than wholly owned are fully consolidated if they are controlled by Guaranty or one of its subsidiaries, and the portion of any subsidiary not owned by Guaranty is reported as noncontrolling interest. All significant intercompany balances and transactions have been eliminated in consolidation. The Bank has eight wholly-owned or controlled non-bank subsidiaries, Guaranty Company, Inc., G B COM, INC., 2800 South Texas Avenue LLC, Pin Oak Realty Holdings, Inc., Pin Oak Asset Management, LLC, Guaranty Bank & Trust Political Action Committee, White Oak Aviation, LLC and Caliber Guaranty Private Account, LLC, the entity which has a noncontrolling interest. The accounting and financial reporting policies followed by the Company conform, in all material respects, to accounting principles generally accepted in the United States of America (“GAAP”) and to general practices within the financial services industry.
Basis of Presentation: All dollar amounts referenced and discussed in the notes to the consolidated financial statements in this report are presented in thousands, unless noted otherwise.
The preparation of financial statements in conformity with GAAP requires management to make estimates and assumptions that affect the amounts reported in the financial statements and accompanying notes. These estimates and assumptions may also affect disclosure of contingent assets and liabilities at the date of the financial statements and the reported amounts of revenues and expenses during the reporting period. Actual results could differ from these estimates.
Nature of Operations: Guaranty Bancshares, Inc. is a bank holding company headquartered in Mount Pleasant, Texas that provides, through its wholly-owned subsidiary, Guaranty Bank & Trust, N.A., a broad array of financial products and services to individuals and corporate customers, primarily in its markets of East Texas, Dallas/Fort Worth, Greater Houston and Central Texas. The terms “the Company,” “we,” “us” and “our” mean Guaranty and its subsidiaries, when appropriate. The Company’s main sources of income are derived from granting loans throughout its markets and investing in securities issued or guaranteed by the U.S. Treasury, U.S. government agencies and state and political subdivisions. The Company’s primary lending products are real estate, commercial and consumer loans. Although the Company has a diversified loan portfolio, a substantial portion of its debtors’ abilities to honor contracts is dependent on the economy of the State of Texas and primarily the economies of East Texas, Dallas/Fort Worth, Greater Houston and Central Texas. The Company primarily funds its lending activities with deposit operations. The Company’s primary deposit products are checking accounts, money market accounts and certificates of deposit.
Use of Estimates: To prepare financial statements in conformity with GAAP, management makes estimates and assumptions based on available information. These estimates and assumptions affect the amounts reported in the financial statements and the disclosures provided. Actual future results could differ.
Cash and Cash Equivalents: Cash and cash equivalents include cash, due from banks, interest-bearing deposits with other banks that have initial maturities less than 90 days and federal funds sold. Net cash flows are reported for loan and deposit transactions, and short-term borrowings with initial maturities less than 90 days.
Marketable Securities: Securities are classified as held to maturity and carried at amortized cost when management has the positive intent and ability to hold them to maturity. Securities are classified as available for sale when they might be sold before maturity. Securities available for sale are carried at fair value, with unrealized holding gains and losses reported in other comprehensive loss. Management determines the appropriate classification of securities at the time of purchase or transfer. Interest income includes amortization and accretion of purchase premiums and discounts. Gains and losses on sales are recorded on the trade date and determined using the specific identification method.
Management evaluates securities that are in an unrealized loss position for credit-related factors, in order to determine if an allowance for credit losses is required. This evaluation is performed on at least a quarterly basis, and more frequently when economic or market conditions warrant such an evaluation.
F-10
|
GUARANTY BANCSHARES, INC. NOTES TO CONSOLIDATED FINANCIAL STATEMENTS (Dollars in thousands, except per share data) |
For securities in an unrealized loss position, management considers the extent and duration of the unrealized loss, and the financial condition and near-term prospects of the issuer. Management also assesses whether it intends to sell, or it is more likely than not that it will be required to sell, an available for sale security in an unrealized loss position before recovery of its amortized cost basis. If either of the criteria regarding intent or requirement to sell is met, any previous allowance for credit loss is written off and the amortized cost basis of the securities is written down to fair value, through earnings. For debt securities that do not meet the aforementioned criteria, management will determine if the decline in fair value has resulted from a credit loss or other factors and apply the following: 1) recognize an allowance for credit loss by a charge to earnings for the credit-related component of the decline in fair value (subject to a floor of the excess of the amortized cost over fair value) and 2) recognize the noncredit-related component of the fair value decline, if any, in other comprehensive loss. The credit loss is defined as the difference between the present value of the cash flows expected to be collected and the amortized cost basis. To the extent that expected cash flows improve, the standard permits reversal of allowance amounts in the current period earnings.
Nonmarketable Securities: Other securities, such as stock in the Federal Reserve Bank and the Federal Home Loan Bank are accounted for on the cost basis and are carried in other assets. Stock in Valesco Commerce Street Capital, L.P., Valesco Fund II, L.P., Valesco Fund III, L.P., Independent Bankers Capital Fund III, L.P., Independent Bankers Capital Fund IV, L.P., Lightspring Capital I, L.P., Pharos Capital Partners IV-A, L.P., Bluehenge Capital SBIC II, L.P., JAM FINTOP Blockchain, L.P., JAM FINTOP Frontier Fund, L.P., Castle Creek Launchpad Fund I, and Austin Housing Conservancy Fund are accounted for on the cost basis in other assets.
Loans Held for Sale: Certain residential mortgage loans are originated for sale in the secondary mortgage loan market. These loans are carried at the lower of cost or estimated fair value in the aggregate. Net unrealized losses, if any, are recognized through a valuation allowance by charges to income. To mitigate the interest rate risk, fixed commitments may be obtained at the time loans are originated or identified for sale. All sales are made without recourse. Gains or losses on sales of mortgage loans are recognized at settlement dates based on the difference between the selling price and the carrying value of the related mortgage loans sold.
Loans: Loans that management has the intent and ability to hold for the foreseeable future, or until maturity or payoff, are reported at their outstanding principal balances adjusted for any charge-offs, the allowance for credit losses, discounts and any deferred fees or costs on originated loans. Interest income was reported on the level-yield interest method and included amortization of net deferred loan fees and costs over the loan term.
Nonaccrual Loans: Loans are placed on nonaccrual status at ninety days past due or as determined by management, and interest is considered a loss. The accrual of interest on loans is discontinued when, in management’s opinion, the borrower may be unable to meet payments as they become due. When interest accrual is discontinued, all unpaid accrued interest is reversed. Interest income is subsequently recognized only to the extent cash payments are received in excess of principal due. Loans are returned to accrual status when all principal and interest amounts contractually due are brought current and future payments are reasonably assured.
COVID-19: Government leaders and the Federal Reserve took several actions designed to mitigate the economic fallout resulting from the coronavirus ("COVID-19"). The Coronavirus Aid, Relief and Economic Security (“CARES”) Act, signed into law on March 27, 2020, authorized more than $2 trillion to battle COVID-19 and its economic effects, including immediate cash relief for individual citizens, loan programs for small businesses, support for hospitals and other medical providers, and various types of economic relief for impacted businesses and industries. The goal of CARES Act was to prevent severe economic downturn. The CARES Act also provided for temporary interest only or payment deferral modifications for loans without classifying them as troubled debt restructurings under current accounting rules. Additional government-backed hardship relief measures were signed into law in early 2021, as well as extension of many of the CARES Act provisions, throughout 2021 and 2022.
Due to the COVID-19 pandemic, market interest rates declined significantly, with the 10-year Treasury bond falling below 1.00% on March 3, 2020 for the first time. On March 16, 2020, the Federal Open Market Committee ("FOMC") reduced the target federal funds rate range to 0.00% to 0.25%, at which it remained until March 2022, when the FOMC began to rapidly increase market interest rates in response to high levels of inflation that arose in the U.S. economy. From March 2022 through July 31, 2023, the FOMC increased market rates from 0.00% to a target range of 5.25% to 5.50%. These rapid increases in interest rates, the impact of future rate increases or decreases, high levels of inflation and other lingering effects of the COVID-19 outbreak may adversely affect the Company’s financial condition and results of operations, as well as business and consumer confidence. Economic uncertainties remain which can negatively impact net interest income and noninterest income.
F-11
|
GUARANTY BANCSHARES, INC. NOTES TO CONSOLIDATED FINANCIAL STATEMENTS (Dollars in thousands, except per share data) |
Allowance for Credit Losses:
Held to Maturity Debt Securities
The allowance for credit losses on held to maturity securities is a contra-asset valuation account that is deducted from the amortized cost basis of held to maturity securities to present management's best estimate of the net amount expected to be collected. Held to maturity securities are charged-off against the allowance when deemed uncollectible. Adjustments to the allowance are reported in our income statement as a component of provision for credit losses. Management measures expected credit losses on held to maturity securities on a collective basis by major security type with each type sharing similar risk characteristics and considers historical credit loss information that is adjusted for current conditions and reasonable and supportable forecasts. As of December 31, 2023 and 2022, our held to maturity securities consisted of U.S. government agencies, treasury securities, municipal securities, collateralized mortgage obligations and mortgage-backed securities issued by the U.S. government and its agencies. With regard to the treasuries, collateralized mortgage obligations and mortgage-backed securities issued by the U.S. government, or agencies thereof, it is expected that the securities will not be settled at prices less than the amortized cost bases of the securities as such securities are backed by the full faith and credit of and/or guaranteed by the U.S. government. For municipal securities, management reviewed key risk indicators, including ratings by credit agencies when available, and determined that there is no current expectation of credit loss as of December 31, 2023 and 2022. Management has made the accounting policy election to exclude accrued interest receivable on held to maturity securities from the estimate of credit losses.
Available for Sale Debt Securities
For available for sale debt securities in an unrealized loss position, the Company first assesses whether or not it intends to sell, or it is more likely than not that it will be required to sell the security before recovery of its amortized cost basis. If either of the criteria regarding intent or requirement to sell is met, the securities amortized cost basis is written down to fair value through income. For available for sale debt securities that do not meet the aforementioned criteria, the Company evaluates whether the decline in fair value has resulted from credit losses or other factors. In making this assessment, management considers the extent to which fair value is less than amortized cost, any changes to the rating of the security by a rating agency, and adverse conditions specifically related to the security, among other factors. If this assessment indicates that a credit loss exists, the present value of the cash flows expected to be collected from the security are compared to the amortized cost basis of the security. If the present value of cash flows expected to be collected are less than the amortized cost basis, a credit loss exists and an allowance for credit losses is recorded for the credit loss, limited by the amount that the fair value is less than the amortized cost basis. Any impairment that has not been recorded through an allowance for credit losses is recognized in other comprehensive loss.
Changes in the allowance for credit losses are recorded as provisions for or reversal of credit loss expense. Losses are charged against the allowance when management believes a security is uncollectible or when either of the criteria regarding intent to sell or required to sell is met. Accrued interest receivable on securities is excluded from the estimate of credit losses.
Loans
The allowance for credit losses is a valuation account that is deducted from the loans' amortized cost basis to present the net amount expected to be collected over the lifetime of the loans. Loans are charged off against the allowance when management believes the uncollectibility of a loan balance is confirmed. Recoveries do not exceed the aggregate of amounts previously charged-off and expected to be charged-off. Subsequent recoveries, if any, are credited to the allowance.
Management estimates the allowance balance using relevant available information, from internal and external sources, relating to past events, current conditions, and reasonable and supportable forecasts. We use the weighted-average remaining maturity method (WARM method) as the basis for the estimation of expected credit losses. The WARM method uses a historical average annual charge-off rate. This average annual charge-off rate contains loss content over a historical lookback period and is used as a foundation for estimating the credit loss reserve for the remaining outstanding balances of loans in a segment at the balance sheet date. The average annual charge-off rate is applied to the contractual term, further adjusted for estimated prepayments, to determine the unadjusted historical charge-off rate.
F-12
|
GUARANTY BANCSHARES, INC. NOTES TO CONSOLIDATED FINANCIAL STATEMENTS (Dollars in thousands, except per share data) |
The calculation of the unadjusted historical charge-off rate is then adjusted for current conditions and for reasonable and supportable forecast periods. Adjustments to historical loss information are made for differences in current loan-specific risk characteristics such as differences in underwriting standards, portfolio mix, delinquency level, or term as well as for changes in environmental conditions, such as changes in unemployment rates, property values, or other relevant factors. These qualitative factors serve to compensate for additional areas of uncertainty inherent in the portfolio that are not reflected in our historic loss factors.
The allowance for credit losses is measured on a collective (pool or segment) basis when similar risk characteristics exist. Our loan portfolio segments include both regulatory call report codes and by internally identified risk ratings for our commercial loan segments and by delinquency status for our consumer loan segments. We also have separately identified internally originated SBA loans and SBA loans acquired from Westbound Bank in 2018 for inherent risk analysis. Accrued interest receivable on loans is excluded from the estimate of credit losses.
Below is a summary of the segments and certain of the inherent risks in the Company’s loan portfolio:
Commercial and industrial: |
|
This portfolio segment includes general secured and unsecured commercial loans which are not secured by real estate or may be secured by real estate but made for the primary purpose of a short-term revolving line of credit. Credit risks inherent in this portfolio segment include fluctuations in the local and national economy. |
|
|
|
Construction and development: |
|
This portfolio segment includes all loans for the purpose of construction, including both business and residential structures; and real estate development loans, including non-agricultural vacant land. Credit risks inherent in this portfolio include fluctuations in property values, unemployment, and changes in the local and national economy. |
|
|
|
Commercial real estate: |
|
The commercial real estate portfolio segment includes all commercial loans that are secured by real estate, other than those included in the construction and development, farmland, multi-family, and 1-4 family residential segments. Risks inherent in this portfolio segment include fluctuations in property values and changes in the local and national economy impacting the sale or lease of the finished structures. |
|
|
|
Farmland: |
|
The farmland portfolio includes loans that are secured by real estate that is used or usable for agricultural purposes, including land used for crops, livestock production, grazing & pastureland and timberland. This segment includes land with a 1-4 family residential structure if the value of the land exceeds the value of the residence. Risks inherent in this portfolio segment include adverse changes in climate, fluctuations in feed and cattle prices and changes in property values. |
|
|
|
Consumer: |
|
This portfolio segment consists of non-real estate loans to consumers. This includes secured and unsecured loans such as auto and personal loans. The risks inherent in this portfolio segment include those factors that would impact the consumer’s ability to meet their obligations under the loan. These include increases in the local unemployment rate and fluctuations in consumer and business sales. |
|
|
|
1-4 family residential: |
|
This portfolio segment includes loans to both commercial and consumer borrowers secured by real estate for housing units of up to four families. Risks inherent in this portfolio segment include increases in the local unemployment rate, changes in the local economy and factors that would impact the value of the underlying collateral, such as changes in property values. |
|
|
|
F-13
|
GUARANTY BANCSHARES, INC. NOTES TO CONSOLIDATED FINANCIAL STATEMENTS (Dollars in thousands, except per share data) |
Multi-family residential: |
|
This portfolio segment includes loans secured by structures containing five or more residential housing units. Risks inherent in this portfolio segment include increases to the local unemployment rate, changes in the local economy, and factors that would impact property values. |
|
|
|
Agricultural: |
|
The agricultural portfolio segment includes loans to individuals and companies in the dairy and cattle industries and farmers. Loans in the segment are secured by collateral including cattle, crops and equipment. Risks inherent in this portfolio segment include adverse changes in climate and fluctuations in feed and cattle prices. |
The following groups of loans are considered to carry specific similar inherent risk characteristics, which the Bank considers separately during its calculation of the allowance for credit losses. These groups of loans are reported within the segments identified in the previous table.
Mortgage Warehouse: |
|
The mortgage warehouse portfolio, which was discontinued as a product line in May 2023, includes loans in which we purchase mortgage loan ownership interests from unaffiliated mortgage originators that are generally held by us for a period of less than 30-days, typically 5-10 days before they are sold to an approved investor. These loans are consistently underwritten based on standards established by the approved investor. Risks inherent in this portfolio include borrower or mortgage originator fraud. |
|
|
|
SBA – Acquired Loans |
|
The SBA – acquired loans segment consists of partially SBA guaranteed loans that were acquired from Westbound Bank in June 2018. These loans are commercial real estate and commercial and industrial in nature and were underwritten with guidelines that are less conservative than our Company. Risks inherent in this portfolio include increases in interest rates, as most are variable rate loans, generally lower levels of borrower equity, less conservative underwriting guidelines, fluctuations in real estate values and changes in the local and national economy. |
|
|
|
SBA – Originated Loans |
|
The SBA – originated loans segment consists of loans that are partially guaranteed by the SBA and were originated and underwritten by Guaranty Bank & Trust loan officers. Risks inherent in this portfolio include increases in interest rates due to variable rate structures, generally lower levels of borrower equity or net worth, fluctuations in real estate values and changes in the local and national economy. |
In general, the loans in our portfolio have low historical credit losses. The credit quality of loans in our portfolio is impacted by delinquency status and debt service coverage generated by our borrowers’ businesses and fluctuations in the value of real estate collateral. Management considers delinquency status to be the most meaningful indicator of the credit quality of one-to-four single family residential, home equity loans and lines of credit and other consumer loans. In general, these types of loans do not begin to show signs of credit deterioration or default until they have been outstanding for some period of time, a process we refer to as “seasoning.” As a result, a portfolio of older loans will usually behave more predictably than a portfolio of newer loans. We consider the majority of our consumer type loans to be “seasoned” and that the credit quality and current level of delinquencies and defaults represents the level of reserve needed in the allowance for credit losses. If delinquencies and defaults were to increase, we may be required to increase our provision for credit losses, which would adversely affect our results of operations and financial condition. Delinquency statistics are updated at least monthly.
Internal risk ratings are considered the most meaningful indicator of credit quality for new commercial and industrial, construction, and commercial real estate loans. Internal risk ratings are a key factor that impact management’s estimates of loss factors used in determining the amount of the allowance for credit losses. Internal risk ratings are updated on a continuous basis.
F-14
|
GUARANTY BANCSHARES, INC. NOTES TO CONSOLIDATED FINANCIAL STATEMENTS (Dollars in thousands, except per share data) |
Loans that do not share risk characteristics are evaluated on an individual basis. Loans evaluated individually are not also included in the collective evaluation. When management determines that foreclosure is probable, expected credit losses are based on the fair value of the collateral at the reporting date, adjusted for selling costs as appropriate.
Credit Quality Indicators - The Company monitors the credit quality of the loans in the various segments by identifying and evaluating credit quality indicators specific to each segment class. This information is incorporated into management’s analysis of the adequacy of the allowance for credit losses. Information for the credit quality indicators is updated monthly or quarterly for classified assets and at least annually for the remainder of the portfolio.
The following is a discussion of the primary credit quality indicators most closely monitored for the loan portfolio, by class:
Commercial and industrial: |
|
In assessing risk associated with commercial loans, management considers the business’s cash flow and the value of the underlying collateral to be the primary credit quality indicators. |
|
|
|
Construction and development: |
|
In assessing the credit quality of construction loans, management considers the ability of the borrower to make principal and interest payments in the event that they are unable to sell the completed structure to be a primary credit quality indicator. For real estate development loans, management also considers the likelihood of the successful sale of the constructed properties in the development. |
|
|
|
Commercial real estate: |
|
Management considers the strength of the borrower’s cash flows, changes in property values and occupancy status to be key credit quality indicators of commercial real estate loans. |
|
|
|
Farmland: |
|
In assessing risk associated with farmland loans, management considers the borrower’s cash flows and underlying property values to be key credit quality indicators. |
|
|
|
Consumer: |
|
Management considers delinquency status to be the primary credit quality indicator of consumer loans. Others include the debt to income ratio of the borrower, the borrower’s credit history, the availability of other credit to the borrower, the borrower’s past-due history, and, if applicable, the value of the underlying collateral to be primary credit quality indicators. |
|
|
|
1-4 family residential: |
|
Management considers delinquency status to be the primary credit quality indicator of 1-4 family residential loans. Others include changes in the local economy, changes in property values, and changes in local unemployment rates to be key credit quality indicators of the loans in the 1-4 family residential loan segment. |
|
|
|
Multi-family residential: |
|
Management considers changes in the local economy, changes in property values, vacancy rates and changes in local unemployment rates to be key credit quality indicators of the loans in the multifamily loan segment. |
|
|
|
Agricultural: |
|
In assessing risk associated with agricultural loans, management considers the borrower’s cash flows, the value of the underlying collateral and sources of secondary repayment to be primary credit quality indicators. |
From time to time, we modify the terms of loans for borrowers experiencing financial difficulties. These modifications may include adjustments such as a lower interest rate, a reduction of principal, or a longer term to maturity. Such modifications are evaluated under FASB's ASU 2022-02, Financial Instruments - Credit Losses (Topic 326): Troubled Debt Restructurings and Vintage Disclosures, which eliminates the recognition and measurement guidance for troubled debt restructurings ("TDRs") by creditors in ASC 310-40. We assess each loan experiencing financial difficulties on a case-by-case basis to determine the appropriate method for allocating an allowance for credit losses. This determination considers factors such as the loan's specific situation, its collateral, and the borrower's prospects for recovery.
F-15
|
GUARANTY BANCSHARES, INC. NOTES TO CONSOLIDATED FINANCIAL STATEMENTS (Dollars in thousands, except per share data) |
In some cases, the loan may be grouped with similar loans for allowance consideration, while in others, an individual assessment may be necessary. The allowance for credit loss allocation is based on either the present value of estimated future cash flows or the estimated fair value of the underlying collateral.
Reserve for Unfunded Commitments
The Company estimates expected credit losses over the contractual period in which the Company is exposed to credit risk via a contractual obligation to extend credit, unless that obligation is unconditionally cancelable by the Company. The allowance for credit losses on off balance sheet credit exposures is adjusted as a provision for credit loss expense. The estimate includes consideration of the likelihood that funding will occur and an estimate of expected credit losses on commitments expected to be funded over its estimated life.
Premises and Equipment: Land is carried at cost. Premises and equipment are stated at cost, less accumulated depreciation. Depreciation is provided on the straight-line method over the estimated useful lives of the related assets. Maintenance, repairs and minor improvements are charged to noninterest expense as incurred. The following table provides a summary of the estimated useful life of the different fixed asset classes as stated in the policy:
Bank Buildings |
|
Up to 40 years |
Equipment |
|
to 10 years |
Furniture and Fixtures |
|
to 7 years |
Software |
|
to 5 years |
Automobiles |
|
to 4 years |
Other Real Estate Owned: Assets acquired through, or in lieu of, foreclosure are initially recorded at fair value, less estimated carrying and selling costs, when acquired, establishing a new cost basis. If fair value declines, a valuation allowance is recorded through expense. Costs after acquisition are expensed.
Transfers of Financial Assets: Transfers of financial assets are accounted for as sales, when control over the assets has been surrendered. Control over transferred assets is deemed to be surrendered when (1) the assets have been isolated from the Company, (2) the transferee obtains the right (free of conditions that constrain it from taking advantage of that right) to pledge or exchange the transferred assets, and (3) the Company does not maintain effective control over the transferred assets through an agreement to repurchase them before their maturity.
Goodwill and Other Intangible Assets: Goodwill resulting from business combinations is generally determined as the excess of the fair value of the consideration transferred, plus the fair value of any noncontrolling interests in the acquiree, over the fair value of the net assets acquired and liabilities assumed as of the acquisition date. Goodwill and intangible assets acquired in a purchase business combination and determined to have an indefinite useful life are not amortized, but tested for impairment at least annually or more frequently if events and circumstances exists that indicate that a goodwill impairment test should be performed. Intangible assets with definite useful lives are amortized over their estimated useful lives to their estimated residual values. Goodwill is the only intangible asset with an indefinite life on our balance sheet.
Impairment is tested for annually or when a triggering event occurs, and exists when a reporting unit’s carrying value of goodwill exceeds its fair value. At the measurement date, the Company had positive equity and the Company elected to perform a qualitative assessment to determine if it was more likely than not that the fair value of the reporting unit exceeded its carrying value, including goodwill. The qualitative assessment indicated that it was more likely than not that the fair value of the reporting unit exceeded its carrying value, resulting in no impairment.
Core deposit intangibles represent premiums paid on acquired deposits based on the estimated fair value of the deposits at the time of purchase. These premiums are amortized over a ten year period. Impairment is tested for annually, and exists when there is significant runoff of these deposits. Management has concluded that there is no impairment to the Company's core deposit intangibles.
F-16
|
GUARANTY BANCSHARES, INC. NOTES TO CONSOLIDATED FINANCIAL STATEMENTS (Dollars in thousands, except per share data) |
Bank Owned Life Insurance: The Company has purchased life insurance policies on certain key executives. Bank owned life insurance is recorded at the amount that can be realized under the insurance contract at the balance sheet date, which is the cash surrender value adjusted for other charges or other amounts due that are probable at settlement.
Income Taxes: Deferred tax assets and liabilities are the expected future tax amounts for the temporary differences between carrying amounts and tax bases of assets and liabilities, computed using enacted tax rates. A valuation allowance, if needed, reduces deferred tax assets to the amount expected to be realized.
A tax position is recognized as a benefit only if it is “more likely than not” that the tax position would be sustained in a tax examination, with a tax examination being presumed to occur. The amount recognized is the largest amount of tax benefit that is greater than 50% likely of being realized on examination. For tax positions not meeting the “more likely than not” test, no tax benefit is recorded.
The Company recognizes interest and/or penalties related to income tax matters in income tax expense.
Fair Values of Financial Instruments: Fair values of financial instruments are estimated using relevant market information and other assumptions. Fair value estimates involve uncertainties and matters of significant judgment regarding interest rates, credit risk, prepayments, and other factors, especially in the absence of broad markets for particular items. Changes in assumptions or in market conditions could significantly affect the estimates. The fair value estimates of existing on and off-balance sheet financial instruments do not include the value of anticipated future business or the value of assets and liabilities not considered financial instruments.
Loss Contingencies: Loss contingencies, including claims and legal actions arising in the ordinary course of business, are recorded as liabilities when the likelihood of loss is probable and an amount or range of loss can be reasonably estimated.
Derivative Financial Instruments: The Company accounts for its derivatives under ASC 815, “Derivatives and Hedging,” which requires recognition of all derivatives as either assets or liabilities in the balance sheet and requires measurement of those instruments at fair value through adjustments to accumulated other comprehensive loss and/or current earnings, as appropriate. On the date the Company enters into a derivative contract, the Company designates the derivative instrument as either a fair value hedge, cash flow hedge or as a free-standing derivative instrument. For a fair value hedge, changes in the fair value of the derivative instrument and changes in the fair value of the hedged asset or liability or of an unrecognized firm commitment attributable to the hedged risk are recorded in current period operations. For a cash flow hedge, changes in the fair value of the derivative instrument, to the extent that it is effective, are recorded in accumulated other comprehensive loss and subsequently reclassified to operations in the same period(s) that the hedged transaction impacts operations. For free-standing derivative instruments, changes in fair value are reported in current period operations.
Prior to entering a hedge transaction, the Company formally documents the relationship between hedging instruments and hedged items, as well as the risk management objective and strategy for undertaking various hedge transactions. This process includes linking all derivative instruments that are designated as fair value or cash flow hedges to specific assets and liabilities on the balance sheet or to specific forecasted transactions along with a formal assessment at both inception of the hedge and on an ongoing basis as to the effectiveness of the derivative instrument in offsetting changes in fair values or cash flows of the hedged item. If it is determined that the derivative instrument is not highly effective as a hedge, hedge accounting is discontinued and the adjustment to fair value of the derivative instrument is recorded in operations. Likewise, if the risk exposure declines to acceptable levels, interest rate swaps may be terminated and the associated cost expensed or amortized and expensed, as appropriate.
Dividend Restriction: Banking regulations require the maintenance of certain capital levels that may limit the amount of dividends that may be paid. Regulatory capital requirements are more fully disclosed in Note 16.
Restrictions on Cash: The Company was not required to have cash on hand or on deposit with the Federal Reserve Bank to meet regulatory reserve and clearing requirements as of December 31, 2023 and 2022. Deposits held with the Federal Reserve Bank earn interest.
Stock Compensation: In accordance with ASC 718, “Stock Compensation,” the Company uses the fair value method of accounting for share-based compensation prescribed by the standard. The fair value of options granted is determined using the Black-Scholes option valuation model.
F-17
|
GUARANTY BANCSHARES, INC. NOTES TO CONSOLIDATED FINANCIAL STATEMENTS (Dollars in thousands, except per share data) |
Compensation cost is recognized over the required service period, generally defined as the vesting period. For awards with graded vesting, compensation cost is recognized on a straight-line basis over the requisite service period for the entire award. Nonvested restricted stock awards and options are forfeited upon termination, and vested options are subject to a 90-day grace period prior to forfeiture.
Earnings Per Share: Basic earnings per share is net income divided by the weighted average number of common shares outstanding during the period. All outstanding nonvested share-based payment awards that contain rights to nonforfeitable dividends are considered participating securities for this calculation. Diluted earnings per share includes the dilutive effect of additional potential common shares issuable under stock options. Earnings and dividends per share are presented as if all stock splits and stock dividends were effective from the earliest period presented through the date of issuance of the financial statements.
Comprehensive Income: Comprehensive income consists of net income and other comprehensive loss. Other comprehensive loss includes unrealized gains and losses on securities available for sale, unrealized gains and losses on securities transferred from available for sale to held to maturity and unrealized gains and losses on cash flow hedges which are also recognized as separate components of equity.
Operating Segments: While the chief decision-makers monitor the revenue streams of the various products and services, operations are managed and financial performance is evaluated on a Company-wide basis.
Operating segments are aggregated into one as operating results for all segments are similar. Accordingly, all of the financial service operations are considered by management to be aggregated in one reportable operating segment.
Revenue Recognition: ASU 2014-09, Revenue from Contracts with Customers (Topic 606), establishes principles for reporting information about the nature, amount, timing and uncertainty of revenue and cash flows arising from the entity's contracts to provide goods or services to customers. The core principle requires an entity to recognize revenue to depict the transfer of goods or services to customers in an amount that reflects the consideration that it expects to be entitled to receive in exchange for those goods or services recognized as performance obligations are satisfied.
The majority of the Company's revenue-generating transactions are not subject to Topic 606, including revenue generated from financial instruments, such as loans, letters of credit, loan processing fees and investment securities, as well as revenue related to mortgage banking activities, and BOLI, as these activities are subject to other accounting guidance. Descriptions of revenue-generating activities that are within the scope of Topic 606, and are presented in the accompanying consolidated statements of earnings as components of noninterest income, are as follows:
F-18
|
GUARANTY BANCSHARES, INC. NOTES TO CONSOLIDATED FINANCIAL STATEMENTS (Dollars in thousands, except per share data) |
Reclassification: Certain amounts in prior period financial statements have been reclassified to conform to current period presentation. These reclassifications are immaterial and have no effect on net income, total assets or stockholders' equity.
Recent Accounting Pronouncements:
In March 2022, the FASB issued ASU 2022-02, Financial Instruments - Credit Losses (Topic 326): Troubled Debt Restructurings and Vintage Disclosures, which eliminates the recognition and measurement guidance for troubled debt restructurings ("TDRs") by creditors in ASC 310-40. The update also enhances disclosure requirements for certain loan restructurings by creditors when a borrower is experiencing financial difficulty. Specially, rather than applying the recognition and measurement guidance for TDRs, an entity will apply the loan refinancing and restructuring guidance to determine whether a modification or other form of restructuring results in a new loan or a continuation of an existing loan. Finally, the amendments in this ASU require a public business entity to disclose current-period gross write-offs by year of origination for financing receivables and net investments in leases in the existing vintage disclosures. The Company adopted this ASU effective on January 1, 2023, and used the prospective method, which did not have a significant impact on its consolidated financial statements.
NOTE 2 - MARKETABLE SECURITIES
The following tables summarize the amortized cost and fair value of available for sale and held to maturity securities as of December 31, 2023 and 2022 and the corresponding amounts of gross unrealized gains and losses:
December 31, 2023 |
|
Amortized |
|
|
Gross |
|
|
Gross |
|
|
Estimated |
|
||||
Available for sale: |
|
|
|
|
|
|
|
|
|
|
|
|
||||
Corporate bonds |
|
$ |
29,882 |
|
|
$ |
— |
|
|
$ |
3,077 |
|
|
$ |
26,805 |
|
Municipal securities |
|
|
2,322 |
|
|
|
182 |
|
|
|
— |
|
|
|
2,504 |
|
Mortgage-backed securities |
|
|
164,419 |
|
|
|
1,014 |
|
|
|
15,621 |
|
|
|
149,812 |
|
Collateralized mortgage obligations |
|
|
18,757 |
|
|
|
19 |
|
|
|
1,702 |
|
|
|
17,074 |
|
Total available for sale |
|
$ |
215,380 |
|
|
$ |
1,215 |
|
|
$ |
20,400 |
|
|
$ |
196,195 |
|
|
|
|
|
|
|
|
|
|
|
|
|
|
||||
Held to maturity: |
|
|
|
|
|
|
|
|
|
|
|
|
||||
U.S. government agencies |
|
$ |
9,292 |
|
|
$ |
— |
|
|
$ |
1,066 |
|
|
$ |
8,226 |
|
Treasury securities |
|
|
69,432 |
|
|
|
— |
|
|
|
1,038 |
|
|
|
68,394 |
|
Municipal securities |
|
|
168,175 |
|
|
|
923 |
|
|
|
6,123 |
|
|
|
162,975 |
|
Mortgage-backed securities |
|
|
119,872 |
|
|
|
— |
|
|
|
15,105 |
|
|
|
104,767 |
|
Collateralized mortgage obligations |
|
|
37,437 |
|
|
|
— |
|
|
|
7,276 |
|
|
|
30,161 |
|
Total held to maturity |
|
$ |
404,208 |
|
|
$ |
923 |
|
|
$ |
30,608 |
|
|
$ |
374,523 |
|
December 31, 2022 |
|
Amortized |
|
|
Gross |
|
|
Gross |
|
|
Estimated |
|
||||
Available for sale: |
|
|
|
|
|
|
|
|
|
|
|
|
||||
Corporate bonds |
|
$ |
29,964 |
|
|
$ |
— |
|
|
$ |
2,177 |
|
|
$ |
27,787 |
|
Municipal securities |
|
|
10,324 |
|
|
|
326 |
|
|
|
8 |
|
|
|
10,642 |
|
Mortgage-backed securities |
|
|
145,896 |
|
|
|
1 |
|
|
|
15,556 |
|
|
|
130,341 |
|
Collateralized mortgage obligations |
|
|
21,981 |
|
|
|
3 |
|
|
|
1,827 |
|
|
|
20,157 |
|
Total available for sale |
|
$ |
208,165 |
|
|
$ |
330 |
|
|
$ |
19,568 |
|
|
$ |
188,927 |
|
|
|
|
|
|
|
|
|
|
|
|
|
|
||||
Held to maturity: |
|
|
|
|
|
|
|
|
|
|
|
|
||||
U.S. government agencies |
|
$ |
9,141 |
|
|
$ |
— |
|
|
$ |
1,259 |
|
|
$ |
7,882 |
|
Treasury securities |
|
|
133,735 |
|
|
|
— |
|
|
|
2,921 |
|
|
|
130,814 |
|
Municipal securities |
|
|
191,680 |
|
|
|
658 |
|
|
|
8,285 |
|
|
|
184,053 |
|
Mortgage-backed securities |
|
|
132,693 |
|
|
|
— |
|
|
|
14,708 |
|
|
|
117,985 |
|
Collateralized mortgage obligations |
|
|
41,759 |
|
|
|
— |
|
|
|
7,425 |
|
|
|
34,334 |
|
Total held to maturity |
|
$ |
509,008 |
|
|
$ |
658 |
|
|
$ |
34,598 |
|
|
$ |
475,068 |
|
From time to time, we have reclassified certain securities from available for sale to held to maturity. Such transfers are made at fair value at the date of transfer. The unrealized holding gains and losses at the date of transfer are retained in accumulated other comprehensive loss and in the carrying value of the held to maturity securities and are amortized or accreted over the remaining life of the security.
F-19
|
GUARANTY BANCSHARES, INC. NOTES TO CONSOLIDATED FINANCIAL STATEMENTS (Dollars in thousands, except per share data) |
During the second quarter of 2022, we transferred $106,157 of securities from available for sale to held to maturity, which included a net unrealized loss on the date of transfer of $13,186. During the third quarter of 2021, we transferred $172,292 of securities from available for sale to held to maturity, which included a net unrealized gain on the date of transfer of $10,235. These unamortized unrealized losses and unaccreted unrealized gains on our transferred securities are included in accumulated other comprehensive loss on our balance sheet and they netted to an unrealized loss of $6,964 at December 31, 2023 compared to an unrealized gain of $5,860 at December 31, 2022. This amount will continue to be amortized and accreted out of accumulated other comprehensive loss over the remaining life of the underlying securities as an adjustment of the yield on those securities.
There is no allowance for credit losses recorded for our available for sale or held to maturity debt securities as of December 31, 2023 or 2022.
Information pertaining to available for sale securities with gross unrealized losses as of December 31, 2023 and 2022, for which no allowance for credit losses has been recorded, aggregated by investment category and length of time that individual securities have been in a continuous unrealized loss position is detailed in the following tables:
|
|
Less Than 12 Months |
|
|
12 Months or Longer |
|
|
Total |
|
|||||||||||||||
December 31, 2023 |
|
Gross |
|
|
Estimated |
|
|
Gross |
|
|
Estimated |
|
|
Gross |
|
|
Estimated |
|
||||||
Available for sale: |
|
|
|
|
|
|
|
|
|
|
|
|
|
|
|
|
|
|
||||||
Corporate bonds |
|
$ |
— |
|
|
$ |
— |
|
|
$ |
(3,077 |
) |
|
$ |
26,805 |
|
|
$ |
(3,077 |
) |
|
$ |
26,805 |
|
Mortgage-backed securities |
|
|
(742 |
) |
|
|
13,308 |
|
|
|
(14,879 |
) |
|
|
101,889 |
|
|
|
(15,621 |
) |
|
|
115,197 |
|
Collateralized mortgage obligations |
|
|
— |
|
|
|
— |
|
|
|
(1,702 |
) |
|
|
13,976 |
|
|
|
(1,702 |
) |
|
|
13,976 |
|
Total available for sale |
|
$ |
(742 |
) |
|
$ |
13,308 |
|
|
$ |
(19,658 |
) |
|
$ |
142,670 |
|
|
$ |
(20,400 |
) |
|
$ |
155,978 |
|
|
|
Less Than 12 Months |
|
|
12 Months or Longer |
|
|
Total |
|
|||||||||||||||
December 31, 2022 |
|
Gross |
|
|
Estimated |
|
|
Gross |
|
|
Estimated |
|
|
Gross |
|
|
Estimated |
|
||||||
Available for sale: |
|
|
|
|
|
|
|
|
|
|
|
|
|
|
|
|
|
|
||||||
Corporate bonds |
|
$ |
(1,518 |
) |
|
$ |
20,323 |
|
|
$ |
(659 |
) |
|
$ |
7,464 |
|
|
$ |
(2,177 |
) |
|
$ |
27,787 |
|
Municipal securities |
|
|
(8 |
) |
|
|
1,659 |
|
|
|
— |
|
|
|
— |
|
|
|
(8 |
) |
|
|
1,659 |
|
Mortgage-backed securities |
|
|
(6,150 |
) |
|
|
74,146 |
|
|
|
(9,406 |
) |
|
|
55,826 |
|
|
|
(15,556 |
) |
|
|
129,972 |
|
Collateralized mortgage obligations |
|
|
(908 |
) |
|
|
16,575 |
|
|
|
(919 |
) |
|
|
3,411 |
|
|
|
(1,827 |
) |
|
|
19,986 |
|
Total available for sale |
|
$ |
(8,584 |
) |
|
$ |
112,703 |
|
|
$ |
(10,984 |
) |
|
$ |
66,701 |
|
|
$ |
(19,568 |
) |
|
$ |
179,404 |
|
There were 233 investments in an unrealized loss position at December 31, 2023, of which 74 were available for sale debt securities in an unrealized loss position with no recorded allowance for credit losses as of December 31, 2023. The available for sale securities in a loss position were composed of corporate bonds, collateralized mortgage obligations and mortgage-backed securities as of December 31, 2023, along with municipal securities as of December 31, 2022. Management evaluates available for sale debt securities in an unrealized loss position to determine whether the impairment is due to credit-related factors or noncredit-related factors. With respect to the collateralized mortgage obligations and mortgage-backed securities issued by the U.S. government and its agencies, the Company has determined that a decline in fair value is mainly attributable to rate, and not due to credit-related factors. The Company monitors the credit quality of other debt securities through the use of credit ratings and other factors specific to an individual security in assessing whether or not the decline in fair value of municipal or corporate securities, relative to their amortized cost, is due to credit-related factors. Triggers to prompt further investigation of securities when the fair value is less than the amortized cost are when a security has been downgraded and falls below an A credit rating, and the security’s unrealized loss exceeds 20% of its book value. Consideration is given to (1) the extent to which fair value is less than cost, (2) the financial condition and near-term prospects of the issuer, and (3) the intent and ability of the Company to retain its investment in the security for a period of time sufficient to allow for any anticipated recovery in fair value. Based on evaluation of available evidence, management believes the unrealized losses on the securities as of December 31, 2023 and 2022 are not credit-related. Management does not have the intent to sell any of these securities and believes that it is more likely than not the Company will not have to sell any such securities before recovery of cost. The fair values are expected to recover as the securities approach their maturity date or repricing date or if market yields for the investments decline. Accordingly, no allowance for credit losses has been recorded for these securities.
F-20
|
GUARANTY BANCSHARES, INC. NOTES TO CONSOLIDATED FINANCIAL STATEMENTS (Dollars in thousands, except per share data) |
Management assesses held to maturity securities sharing similar risk characteristics on a collective basis for expected credit losses under the current expected credit loss model ("CECL"). As of December 31, 2023 and 2022, our held to maturity securities consisted of U.S. government agencies, municipal securities, treasury securities, collateralized mortgage obligations and mortgage-backed securities issued by the U.S. government and its agencies. With regard to the treasuries, collateralized mortgage obligations and mortgage-backed securities issued by the U.S. government, or agencies thereof, it is expected that the securities will not be settled at prices less than the amortized cost bases of the securities as such securities are backed by the full faith and credit of and/or guaranteed by the U.S. government. Mortgage-backed securities and collateralized mortgage obligations are backed by pools of mortgages that are insured or guaranteed by the Federal Home Loan Mortgage Corporation, the Federal National Mortgage Association or the government National Mortgage Association. For municipal securities, management reviewed key risk indicators, including ratings by credit agencies when available, and determined that there is no current expectation of credit loss. Accordingly, no allowance for credit losses has been recorded for these securities.
As of December 31, 2023, there were no holdings of securities of any one issuer, other than the collateralized mortgage obligations, treasuries and mortgage-backed securities issued by the U.S. government and its agencies, in an amount greater than 10% of shareholders’ equity. As of December 31, 2022, there were no holdings of securities of any one issuer, other than the collateralized mortgage obligations and mortgage-backed securities issued by the U.S. government and its agencies, in an amount greater than 10% of shareholders’ equity.
There were no held to maturity securities past due on interest or principal payments, and none that were on nonaccrual as of December 31, 2023.
Securities with fair values of approximately $317,112 and $396,584 at December 31, 2023 and 2022, respectively, were pledged to secure public fund deposits and for other purposes as required or permitted by law.
Proceeds from the sales of available for sale securities and the associated gains and losses for the years ended December 31, 2023 and 2022 are listed below. There were no securities sold during the year ended December 31, 2021.
|
|
|
|
|
|
|
|
|
|
|||
|
|
2023 |
|
|
2022 |
|
|
2021 |
|
|||
Proceeds from sales |
|
$ |
21,268 |
|
|
$ |
26,130 |
|
|
$ |
— |
|
Gross gains |
|
|
184 |
|
|
|
234 |
|
|
|
— |
|
Gross losses |
|
|
(413 |
) |
|
|
(62 |
) |
|
|
— |
|
There were no held to maturity securities sold during the years ended December 31, 2023, 2022 or 2021.
The contractual maturities at December 31, 2023 of available for sale and held to maturity securities at carrying value and estimated fair value are shown below. The Company invests in securities that may have expected maturities that differ from their contractual maturities. These differences arise because borrowers and/or issuers may have the right to call or prepay their obligation with or without call or prepayment penalties. Securities not due at a single maturity date are shown separately.
|
|
Available for Sale |
|
|
Held to Maturity |
|
||||||||||
December 31, 2023 |
|
Amortized |
|
|
Estimated |
|
|
Amortized |
|
|
Estimated |
|
||||
Due within one year |
|
$ |
2,003 |
|
|
$ |
1,979 |
|
|
$ |
47,009 |
|
|
$ |
46,674 |
|
Due after one year through five years |
|
|
7,540 |
|
|
|
7,229 |
|
|
|
68,564 |
|
|
|
66,189 |
|
Due after five years through ten years |
|
|
22,661 |
|
|
|
20,101 |
|
|
|
79,950 |
|
|
|
77,878 |
|
Due after ten years |
|
|
— |
|
|
|
— |
|
|
|
51,376 |
|
|
|
48,854 |
|
Mortgage-backed securities |
|
|
164,419 |
|
|
|
149,812 |
|
|
|
119,872 |
|
|
|
104,767 |
|
Collateralized mortgage obligations |
|
|
18,757 |
|
|
|
17,074 |
|
|
|
37,437 |
|
|
|
30,161 |
|
Total securities |
|
$ |
215,380 |
|
|
$ |
196,195 |
|
|
$ |
404,208 |
|
|
$ |
374,523 |
|
F-21
|
GUARANTY BANCSHARES, INC. NOTES TO CONSOLIDATED FINANCIAL STATEMENTS (Dollars in thousands, except per share data) |
NOTE 3 - LOANS AND ALLOWANCE FOR CREDIT LOSSES
The following table summarizes the Company’s loan portfolio by type of loan as of:
|
|
2023 |
|
|
2022 |
|
||
Commercial and industrial |
|
$ |
287,565 |
|
|
$ |
314,067 |
|
Real estate: |
|
|
|
|
|
|
||
Construction and development |
|
|
296,639 |
|
|
|
377,135 |
|
Commercial real estate |
|
|
923,195 |
|
|
|
887,587 |
|
Farmland |
|
|
186,295 |
|
|
|
185,817 |
|
1-4 family residential |
|
|
514,603 |
|
|
|
493,061 |
|
Multi-family residential |
|
|
44,292 |
|
|
|
45,147 |
|
Consumer |
|
|
57,059 |
|
|
|
61,394 |
|
Agricultural |
|
|
12,685 |
|
|
|
13,686 |
|
Overdrafts |
|
|
243 |
|
|
|
282 |
|
Total loans |
|
|
2,322,576 |
|
|
|
2,378,176 |
|
Net of: |
|
|
|
|
|
|
||
Deferred loan fees, net |
|
|
(775 |
) |
|
|
(1,957 |
) |
Allowance for credit losses |
|
|
(30,920 |
) |
|
|
(31,974 |
) |
Total net loans(1) |
|
$ |
2,290,881 |
|
|
$ |
2,344,245 |
|
|
|
|
|
|
|
|
||
(1) Excludes accrued interest receivable on loans of $9.5 million and $7.6 million as of December 31, 2023 and 2022, respectively, which is presented separately on the consolidated balance sheets. |
|
|||||||
The Company has entered into transactions, at prevailing market rates and terms, with certain directors, executive officers, significant shareholders and their affiliates. Loans to such related parties at December 31, 2023 and 2022, totaled $63,551 and $72,539, respectively. Unfunded commitments to such related parties at December 31, 2023 totaled $30,716.
Loans to principal officers, directors, and their affiliates during the year ended December 31, 2023, was as follows:
|
|
December 31, 2023 |
|
|
Beginning balance |
|
$ |
72,539 |
|
New loans |
|
|
42,661 |
|
Effect of changes in composition of related parties |
|
|
(492 |
) |
Repayments |
|
|
(51,157 |
) |
Ending balance |
|
$ |
63,551 |
|
F-22
|
GUARANTY BANCSHARES, INC. NOTES TO CONSOLIDATED FINANCIAL STATEMENTS (Dollars in thousands, except per share data) |
Allowance for Credit Losses
The Company’s estimate of the allowance for credit losses (“ACL”) reflects losses expected over the remaining contractual life of the assets. The contractual term does not consider extensions, renewals or modifications unless the Company has identified an expected modification for borrower experiencing financial difficulty. The following tables present the activity in the ACL by class of loans for the years ended December 31, 2023, 2022 and 2021:
For the Year Ended |
|
Commercial |
|
|
Construction |
|
|
Commercial |
|
|
Farmland |
|
|
1-4 family |
|
|
Multi-family |
|
|
Consumer |
|
|
Agricultural |
|
|
Overdrafts |
|
|
Total |
|
||||||||||
Allowance for credit losses: |
|
|
|
|
|
|
|
|
|
|
|
|
|
|
|
|
|
|
|
|
|
|
|
|
|
|
|
|
|
|
||||||||||
Beginning balance |
|
$ |
4,382 |
|
|
$ |
4,889 |
|
|
$ |
12,658 |
|
|
$ |
2,008 |
|
|
$ |
6,617 |
|
|
$ |
490 |
|
|
$ |
778 |
|
|
$ |
149 |
|
|
$ |
3 |
|
|
$ |
31,974 |
|
(Reversal of) provision for credit losses |
|
|
(209 |
) |
|
|
(1,266 |
) |
|
|
(124 |
) |
|
|
223 |
|
|
|
853 |
|
|
|
31 |
|
|
|
238 |
|
|
|
4 |
|
|
|
250 |
|
|
|
— |
|
Loans charged-off |
|
|
(473 |
) |
|
|
— |
|
|
|
(277 |
) |
|
|
— |
|
|
|
— |
|
|
|
— |
|
|
|
(139 |
) |
|
|
(3 |
) |
|
|
(312 |
) |
|
|
(1,204 |
) |
Recoveries |
|
|
19 |
|
|
|
— |
|
|
|
— |
|
|
|
— |
|
|
|
— |
|
|
|
— |
|
|
|
68 |
|
|
|
2 |
|
|
|
61 |
|
|
|
150 |
|
Ending balance |
|
$ |
3,719 |
|
|
$ |
3,623 |
|
|
$ |
12,257 |
|
|
$ |
2,231 |
|
|
$ |
7,470 |
|
|
$ |
521 |
|
|
$ |
945 |
|
|
$ |
152 |
|
|
$ |
2 |
|
|
$ |
30,920 |
|
For the Year Ended |
|
Commercial |
|
|
Construction |
|
|
Commercial |
|
|
Farmland |
|
|
1-4 family |
|
|
Multi-family |
|
|
Consumer |
|
|
Agricultural |
|
|
Overdrafts |
|
|
Total |
|
||||||||||
Allowance for credit losses: |
|
|
|
|
|
|
|
|
|
|
|
|
|
|
|
|
|
|
|
|
|
|
|
|
|
|
|
|
|
|
||||||||||
Beginning balance |
|
$ |
3,600 |
|
|
$ |
4,221 |
|
|
$ |
13,765 |
|
|
$ |
1,698 |
|
|
$ |
5,818 |
|
|
$ |
396 |
|
|
$ |
762 |
|
|
$ |
169 |
|
|
$ |
4 |
|
|
$ |
30,433 |
|
Provision for (reversal of) credit losses |
|
|
902 |
|
|
|
668 |
|
|
|
(1,108 |
) |
|
|
310 |
|
|
|
769 |
|
|
|
94 |
|
|
|
283 |
|
|
|
(20 |
) |
|
|
252 |
|
|
|
2,150 |
|
Loans charged-off |
|
|
(192 |
) |
|
|
— |
|
|
|
— |
|
|
|
— |
|
|
|
— |
|
|
|
— |
|
|
|
(322 |
) |
|
|
— |
|
|
|
(335 |
) |
|
|
(849 |
) |
Recoveries |
|
|
72 |
|
|
|
— |
|
|
|
1 |
|
|
|
— |
|
|
|
30 |
|
|
|
— |
|
|
|
55 |
|
|
|
— |
|
|
|
82 |
|
|
|
240 |
|
Ending balance |
|
$ |
4,382 |
|
|
$ |
4,889 |
|
|
$ |
12,658 |
|
|
$ |
2,008 |
|
|
$ |
6,617 |
|
|
$ |
490 |
|
|
$ |
778 |
|
|
$ |
149 |
|
|
$ |
3 |
|
|
$ |
31,974 |
|
For the Year Ended |
|
Commercial |
|
|
Construction |
|
|
Commercial |
|
|
Farmland |
|
|
1-4 family |
|
|
Multi-family |
|
|
Consumer |
|
|
Agricultural |
|
|
Overdrafts |
|
|
Total |
|
||||||||||
Allowance for credit losses: |
|
|
|
|
|
|
|
|
|
|
|
|
|
|
|
|
|
|
|
|
|
|
|
|
|
|
|
|
|
|
||||||||||
Beginning balance |
|
$ |
4,033 |
|
|
$ |
4,735 |
|
|
$ |
15,780 |
|
|
$ |
1,220 |
|
|
$ |
6,313 |
|
|
$ |
363 |
|
|
$ |
929 |
|
|
$ |
239 |
|
|
$ |
7 |
|
|
|
33,619 |
|
Provision for (reversal of) credit losses |
|
|
(43 |
) |
|
|
(515 |
) |
|
|
(1,229 |
) |
|
|
478 |
|
|
|
(495 |
) |
|
|
33 |
|
|
|
(51 |
) |
|
|
(78 |
) |
|
|
200 |
|
|
|
(1,700 |
) |
Loans charged-off |
|
|
(411 |
) |
|
|
— |
|
|
|
(816 |
) |
|
|
— |
|
|
|
— |
|
|
|
— |
|
|
|
(151 |
) |
|
|
— |
|
|
|
(263 |
) |
|
|
(1,641 |
) |
Recoveries |
|
|
21 |
|
|
|
1 |
|
|
|
30 |
|
|
|
— |
|
|
|
— |
|
|
|
— |
|
|
|
35 |
|
|
|
8 |
|
|
|
60 |
|
|
|
155 |
|
Ending balance |
|
$ |
3,600 |
|
|
$ |
4,221 |
|
|
$ |
13,765 |
|
|
$ |
1,698 |
|
|
$ |
5,818 |
|
|
$ |
396 |
|
|
$ |
762 |
|
|
$ |
169 |
|
|
$ |
4 |
|
|
$ |
30,433 |
|
F-23
|
GUARANTY BANCSHARES, INC. NOTES TO CONSOLIDATED FINANCIAL STATEMENTS (Dollars in thousands, except per share data) |
During 2021, a reverse provision of $1,700 was recorded as a result of improvements that occurred to macroeconomic factors evaluated at the onset of the pandemic as well as risk rating upgrades for specific loans. During 2022, the remaining COVID-specific qualitative factors were removed. However, growth in the loan portfolio, as well as declines in economic outlooks during the year and an adjustment to qualitative factors for expected recession forecasts, resulted in a $2,150 provision expense for the year ended December 31, 2022. During 2023, certain minor adjustments were made to qualitative factors to incorporate changes in some economic and portfolio activities, however, we recorded no provision for credit losses during 2023.
Credit Quality
Assets are graded “pass” when the relationship exhibits acceptable credit risk and indicates repayment ability, tolerable collateral coverage and reasonable performance history. Lending relationships exhibiting potentially significant credit risk and marginal repayment ability and/or asset protection are graded “special mention.” Assets classified as “substandard” are inadequately protected by the current net worth and paying capacity of the obligor or of the collateral pledged, if any. Loans so classified must have a well-defined weakness that jeopardizes the liquidation of the debt. Substandard graded loans are characterized by the distinct possibility that the Company will sustain some loss if the deficiencies are not corrected. Assets graded “doubtful” are substandard graded loans that have added characteristics that make collection or liquidation in full improbable. Loans that are on nonaccrual status are generally classified as substandard.
In general, the loans in our portfolio have low historical credit losses. The Company closely monitors economic conditions and loan performance trends to manage and evaluate the exposure to credit risk. Key factors tracked by the Company and utilized in evaluating the credit quality of the loan portfolio include trends in delinquency ratios, the level of nonperforming assets, borrower’s repayment capacity, and collateral coverage.
F-24
|
GUARANTY BANCSHARES, INC. NOTES TO CONSOLIDATED FINANCIAL STATEMENTS (Dollars in thousands, except per share data) |
The following table summarizes the credit exposure in the Company’s loan portfolio, by year of origination, as of December 31, 2023:
December 31, 2023 |
|
2023 |
|
|
2022 |
|
|
2021 |
|
|
2020 |
|
|
2019 |
|
|
Prior |
|
|
Revolving Loans Amortized Cost |
|
|
Total |
|
||||||||
Commercial and industrial: |
|
|
|
|
|
|
|
|
|
|
|
|
|
|
|
|
|
|
|
|
|
|
|
|
||||||||
Pass |
|
$ |
42,646 |
|
|
$ |
72,376 |
|
|
$ |
38,328 |
|
|
$ |
12,864 |
|
|
$ |
8,249 |
|
|
$ |
12,524 |
|
|
$ |
96,215 |
|
|
$ |
283,202 |
|
Special mention |
|
|
— |
|
|
|
16 |
|
|
|
132 |
|
|
|
958 |
|
|
|
147 |
|
|
|
— |
|
|
|
250 |
|
|
|
1,503 |
|
Substandard |
|
|
— |
|
|
|
190 |
|
|
|
— |
|
|
|
370 |
|
|
|
370 |
|
|
|
153 |
|
|
|
— |
|
|
|
1,083 |
|
Nonaccrual |
|
|
— |
|
|
|
129 |
|
|
|
1,528 |
|
|
|
7 |
|
|
|
— |
|
|
|
79 |
|
|
|
34 |
|
|
|
1,777 |
|
Total commercial and industrial loans |
|
$ |
42,646 |
|
|
$ |
72,711 |
|
|
$ |
39,988 |
|
|
$ |
14,199 |
|
|
$ |
8,766 |
|
|
$ |
12,756 |
|
|
$ |
96,499 |
|
|
$ |
287,565 |
|
|
|
|
|
|
|
|
|
|
|
|
|
|
|
|
|
|
|
|
|
|
|
|
|
|
||||||||
Charge-offs |
|
$ |
(79 |
) |
|
$ |
— |
|
|
$ |
(25 |
) |
|
$ |
(41 |
) |
|
$ |
(31 |
) |
|
$ |
(4 |
) |
|
$ |
(293 |
) |
|
$ |
(473 |
) |
Recoveries |
|
|
— |
|
|
|
— |
|
|
|
— |
|
|
|
— |
|
|
|
— |
|
|
|
4 |
|
|
|
15 |
|
|
|
19 |
|
Current period net |
|
$ |
(79 |
) |
|
$ |
— |
|
|
$ |
(25 |
) |
|
$ |
(41 |
) |
|
$ |
(31 |
) |
|
$ |
— |
|
|
$ |
(278 |
) |
|
$ |
(454 |
) |
|
|
|
|
|
|
|
|
|
|
|
|
|
|
|
|
|
|
|
|
|
|
|
|
|
||||||||
Construction and development: |
|
|
|
|
|
|
|
|
|
|
|
|
|
|
|
|
|
|
|
|
|
|
|
|
||||||||
Pass |
|
$ |
86,641 |
|
|
$ |
112,347 |
|
|
$ |
62,548 |
|
|
$ |
7,074 |
|
|
$ |
5,915 |
|
|
$ |
12,504 |
|
|
$ |
9,237 |
|
|
$ |
296,266 |
|
Special mention |
|
|
— |
|
|
|
— |
|
|
|
— |
|
|
|
— |
|
|
|
— |
|
|
|
— |
|
|
|
— |
|
|
|
— |
|
Substandard |
|
|
— |
|
|
|
189 |
|
|
|
— |
|
|
|
— |
|
|
|
— |
|
|
|
67 |
|
|
|
— |
|
|
|
256 |
|
Nonaccrual |
|
|
— |
|
|
|
73 |
|
|
|
— |
|
|
|
— |
|
|
|
— |
|
|
|
44 |
|
|
|
— |
|
|
|
117 |
|
Total construction and development loans |
|
$ |
86,641 |
|
|
$ |
112,609 |
|
|
$ |
62,548 |
|
|
$ |
7,074 |
|
|
$ |
5,915 |
|
|
$ |
12,615 |
|
|
$ |
9,237 |
|
|
$ |
296,639 |
|
|
|
|
|
|
|
|
|
|
|
|
|
|
|
|
|
|
|
|
|
|
|
|
|
|
||||||||
Charge-offs |
|
$ |
— |
|
|
$ |
— |
|
|
$ |
— |
|
|
$ |
— |
|
|
$ |
— |
|
|
$ |
— |
|
|
$ |
— |
|
|
$ |
— |
|
Recoveries |
|
|
— |
|
|
|
— |
|
|
|
— |
|
|
|
— |
|
|
|
— |
|
|
|
— |
|
|
|
— |
|
|
|
— |
|
Current period net |
|
$ |
— |
|
|
$ |
— |
|
|
$ |
— |
|
|
$ |
— |
|
|
$ |
— |
|
|
$ |
— |
|
|
$ |
— |
|
|
$ |
— |
|
|
|
|
|
|
|
|
|
|
|
|
|
|
|
|
|
|
|
|
|
|
|
|
|
|
||||||||
Commercial real estate: |
|
|
|
|
|
|
|
|
|
|
|
|
|
|
|
|
|
|
|
|
|
|
|
|
||||||||
Pass |
|
$ |
46,655 |
|
|
$ |
368,933 |
|
|
$ |
149,536 |
|
|
$ |
81,765 |
|
|
$ |
54,100 |
|
|
$ |
176,509 |
|
|
$ |
15,065 |
|
|
$ |
892,563 |
|
Special mention |
|
|
— |
|
|
|
7,000 |
|
|
|
— |
|
|
|
— |
|
|
|
— |
|
|
|
333 |
|
|
|
— |
|
|
|
7,333 |
|
Substandard |
|
|
— |
|
|
|
15,831 |
|
|
|
6,950 |
|
|
|
— |
|
|
|
49 |
|
|
|
337 |
|
|
|
— |
|
|
|
23,167 |
|
Nonaccrual |
|
|
— |
|
|
|
— |
|
|
|
— |
|
|
|
— |
|
|
|
32 |
|
|
|
100 |
|
|
|
— |
|
|
|
132 |
|
Total commercial real estate loans |
|
$ |
46,655 |
|
|
$ |
391,764 |
|
|
$ |
156,486 |
|
|
$ |
81,765 |
|
|
$ |
54,181 |
|
|
$ |
177,279 |
|
|
$ |
15,065 |
|
|
$ |
923,195 |
|
|
|
|
|
|
|
|
|
|
|
|
|
|
|
|
|
|
|
|
|
|
|
|
|
|
||||||||
Charge-offs |
|
$ |
(190 |
) |
|
$ |
— |
|
|
$ |
— |
|
|
$ |
— |
|
|
$ |
— |
|
|
$ |
(87 |
) |
|
$ |
— |
|
|
$ |
(277 |
) |
Recoveries |
|
|
— |
|
|
|
— |
|
|
|
— |
|
|
|
— |
|
|
|
— |
|
|
|
— |
|
|
|
— |
|
|
|
— |
|
Current period net |
|
$ |
(190 |
) |
|
$ |
— |
|
|
$ |
— |
|
|
$ |
— |
|
|
$ |
— |
|
|
$ |
(87 |
) |
|
$ |
— |
|
|
$ |
(277 |
) |
F-25
|
GUARANTY BANCSHARES, INC. NOTES TO CONSOLIDATED FINANCIAL STATEMENTS (Dollars in thousands, except per share data) |
December 31, 2023 |
|
2023 |
|
|
2022 |
|
|
2021 |
|
|
2020 |
|
|
2019 |
|
|
Prior |
|
|
Revolving Loans Amortized Cost |
|
|
Total |
|
||||||||
Farmland: |
|
|
|
|
|
|
|
|
|
|
|
|
|
|
|
|
|
|
|
|
|
|
|
|
||||||||
Pass |
|
$ |
25,009 |
|
|
$ |
77,371 |
|
|
$ |
46,817 |
|
|
$ |
8,556 |
|
|
$ |
5,599 |
|
|
$ |
15,850 |
|
|
$ |
6,849 |
|
|
$ |
186,051 |
|
Special mention |
|
|
— |
|
|
|
— |
|
|
|
— |
|
|
|
— |
|
|
|
— |
|
|
|
— |
|
|
|
— |
|
|
|
— |
|
Substandard |
|
|
— |
|
|
|
— |
|
|
|
— |
|
|
|
— |
|
|
|
27 |
|
|
|
53 |
|
|
|
— |
|
|
|
80 |
|
Nonaccrual |
|
|
— |
|
|
|
— |
|
|
|
— |
|
|
|
— |
|
|
|
— |
|
|
|
164 |
|
|
|
— |
|
|
|
164 |
|
Total farmland loans |
|
$ |
25,009 |
|
|
$ |
77,371 |
|
|
$ |
46,817 |
|
|
$ |
8,556 |
|
|
$ |
5,626 |
|
|
$ |
16,067 |
|
|
$ |
6,849 |
|
|
$ |
186,295 |
|
|
|
|
|
|
|
|
|
|
|
|
|
|
|
|
|
|
|
|
|
|
|
|
|
|
||||||||
Charge-offs |
|
$ |
— |
|
|
$ |
— |
|
|
$ |
— |
|
|
$ |
— |
|
|
$ |
— |
|
|
$ |
— |
|
|
$ |
— |
|
|
$ |
— |
|
Recoveries |
|
|
— |
|
|
|
— |
|
|
|
— |
|
|
|
— |
|
|
|
— |
|
|
|
— |
|
|
|
— |
|
|
|
— |
|
Current period net |
|
$ |
— |
|
|
$ |
— |
|
|
$ |
— |
|
|
$ |
— |
|
|
$ |
— |
|
|
$ |
— |
|
|
$ |
— |
|
|
$ |
— |
|
|
|
|
|
|
|
|
|
|
|
|
|
|
|
|
|
|
|
|
|
|
|
|
|
|
||||||||
1-4 family residential: |
|
|
|
|
|
|
|
|
|
|
|
|
|
|
|
|
|
|
|
|
|
|
|
|
||||||||
Pass |
|
$ |
57,348 |
|
|
$ |
143,992 |
|
|
$ |
120,964 |
|
|
$ |
42,535 |
|
|
$ |
28,764 |
|
|
$ |
95,198 |
|
|
$ |
22,146 |
|
|
$ |
510,947 |
|
Special mention |
|
|
— |
|
|
|
— |
|
|
|
— |
|
|
|
— |
|
|
|
— |
|
|
|
863 |
|
|
|
— |
|
|
|
863 |
|
Substandard |
|
|
— |
|
|
|
— |
|
|
|
— |
|
|
|
— |
|
|
|
— |
|
|
|
— |
|
|
|
— |
|
|
|
— |
|
Nonaccrual |
|
|
— |
|
|
|
— |
|
|
|
1,249 |
|
|
|
53 |
|
|
|
175 |
|
|
|
1,316 |
|
|
|
— |
|
|
|
2,793 |
|
Total 1-4 family residential loans |
|
$ |
57,348 |
|
|
$ |
143,992 |
|
|
$ |
122,213 |
|
|
$ |
42,588 |
|
|
$ |
28,939 |
|
|
$ |
97,377 |
|
|
$ |
22,146 |
|
|
$ |
514,603 |
|
|
|
|
|
|
|
|
|
|
|
|
|
|
|
|
|
|
|
|
|
|
|
|
|
|
||||||||
Charge-offs |
|
$ |
— |
|
|
$ |
— |
|
|
$ |
— |
|
|
$ |
— |
|
|
$ |
— |
|
|
$ |
— |
|
|
$ |
— |
|
|
$ |
— |
|
Recoveries |
|
|
— |
|
|
|
— |
|
|
|
— |
|
|
|
— |
|
|
|
— |
|
|
|
— |
|
|
|
— |
|
|
|
— |
|
Current period net |
|
$ |
— |
|
|
$ |
— |
|
|
$ |
— |
|
|
$ |
— |
|
|
$ |
— |
|
|
$ |
— |
|
|
$ |
— |
|
|
$ |
— |
|
|
|
|
|
|
|
|
|
|
|
|
|
|
|
|
|
|
|
|
|
|
|
|
|
|
||||||||
Multi-family residential: |
|
|
|
|
|
|
|
|
|
|
|
|
|
|
|
|
|
|
|
|
|
|
|
|
||||||||
Pass |
|
$ |
1,984 |
|
|
$ |
18,041 |
|
|
$ |
16,496 |
|
|
$ |
2,363 |
|
|
$ |
3,862 |
|
|
$ |
1,492 |
|
|
$ |
54 |
|
|
$ |
44,292 |
|
Special mention |
|
|
— |
|
|
|
— |
|
|
|
— |
|
|
|
— |
|
|
|
— |
|
|
|
— |
|
|
|
— |
|
|
|
— |
|
Substandard |
|
|
— |
|
|
|
— |
|
|
|
— |
|
|
|
— |
|
|
|
— |
|
|
|
— |
|
|
|
— |
|
|
|
— |
|
Nonaccrual |
|
|
— |
|
|
|
— |
|
|
|
— |
|
|
|
— |
|
|
|
— |
|
|
|
— |
|
|
|
— |
|
|
|
— |
|
Total multi-family residential loans |
|
$ |
1,984 |
|
|
$ |
18,041 |
|
|
$ |
16,496 |
|
|
$ |
2,363 |
|
|
$ |
3,862 |
|
|
$ |
1,492 |
|
|
$ |
54 |
|
|
$ |
44,292 |
|
|
|
|
|
|
|
|
|
|
|
|
|
|
|
|
|
|
|
|
|
|
|
|
|
|
||||||||
Charge-offs |
|
$ |
— |
|
|
$ |
— |
|
|
$ |
— |
|
|
$ |
— |
|
|
$ |
— |
|
|
$ |
— |
|
|
$ |
— |
|
|
$ |
— |
|
Recoveries |
|
|
— |
|
|
|
— |
|
|
|
— |
|
|
|
— |
|
|
|
— |
|
|
|
— |
|
|
|
— |
|
|
|
— |
|
Current period net |
|
$ |
— |
|
|
$ |
— |
|
|
$ |
— |
|
|
$ |
— |
|
|
$ |
— |
|
|
$ |
— |
|
|
$ |
— |
|
|
$ |
— |
|
F-26
|
GUARANTY BANCSHARES, INC. NOTES TO CONSOLIDATED FINANCIAL STATEMENTS (Dollars in thousands, except per share data) |
December 31, 2023 |
|
2023 |
|
|
2022 |
|
|
2021 |
|
|
2020 |
|
|
2019 |
|
|
Prior |
|
|
Revolving Loans Amortized Cost |
|
|
Total |
|
||||||||
Consumer and overdrafts: |
|
|
|
|
|
|
|
|
|
|
|
|
|
|
|
|
|
|
|
|
|
|
|
|
||||||||
Pass |
|
$ |
26,161 |
|
|
$ |
15,181 |
|
|
$ |
5,840 |
|
|
$ |
2,449 |
|
|
$ |
589 |
|
|
$ |
2,307 |
|
|
$ |
4,488 |
|
|
$ |
57,015 |
|
Special mention |
|
|
6 |
|
|
|
26 |
|
|
|
5 |
|
|
|
— |
|
|
|
— |
|
|
|
— |
|
|
|
— |
|
|
|
37 |
|
Substandard |
|
|
— |
|
|
|
— |
|
|
|
— |
|
|
|
— |
|
|
|
— |
|
|
|
— |
|
|
|
— |
|
|
|
— |
|
Nonaccrual |
|
|
19 |
|
|
|
52 |
|
|
|
75 |
|
|
|
25 |
|
|
|
42 |
|
|
|
37 |
|
|
|
— |
|
|
|
250 |
|
Total consumer loans and overdrafts |
|
$ |
26,186 |
|
|
$ |
15,259 |
|
|
$ |
5,920 |
|
|
$ |
2,474 |
|
|
$ |
631 |
|
|
$ |
2,344 |
|
|
$ |
4,488 |
|
|
$ |
57,302 |
|
|
|
|
|
|
|
|
|
|
|
|
|
|
|
|
|
|
|
|
|
|
|
|
|
|
||||||||
Charge-offs |
|
$ |
(346 |
) |
|
$ |
(38 |
) |
|
$ |
(51 |
) |
|
$ |
(11 |
) |
|
$ |
(5 |
) |
|
$ |
— |
|
|
$ |
— |
|
|
$ |
(451 |
) |
Recoveries |
|
|
61 |
|
|
|
— |
|
|
|
4 |
|
|
|
1 |
|
|
|
— |
|
|
|
23 |
|
|
|
40 |
|
|
|
129 |
|
Current period net |
|
$ |
(285 |
) |
|
$ |
(38 |
) |
|
$ |
(47 |
) |
|
$ |
(10 |
) |
|
$ |
(5 |
) |
|
$ |
23 |
|
|
$ |
40 |
|
|
$ |
(322 |
) |
|
|
|
|
|
|
|
|
|
|
|
|
|
|
|
|
|
|
|
|
|
|
|
|
|
||||||||
Agricultural: |
|
|
|
|
|
|
|
|
|
|
|
|
|
|
|
|
|
|
|
|
|
|
|
|
||||||||
Pass |
|
$ |
1,857 |
|
|
$ |
1,962 |
|
|
$ |
1,078 |
|
|
$ |
685 |
|
|
$ |
236 |
|
|
$ |
604 |
|
|
$ |
5,879 |
|
|
$ |
12,301 |
|
Special mention |
|
|
— |
|
|
|
— |
|
|
|
— |
|
|
|
— |
|
|
|
— |
|
|
|
— |
|
|
|
— |
|
|
|
— |
|
Substandard |
|
|
— |
|
|
|
— |
|
|
|
— |
|
|
|
— |
|
|
|
— |
|
|
|
25 |
|
|
|
— |
|
|
|
25 |
|
Nonaccrual |
|
|
— |
|
|
|
— |
|
|
|
256 |
|
|
|
— |
|
|
|
74 |
|
|
|
29 |
|
|
|
— |
|
|
|
359 |
|
Total agricultural loans |
|
$ |
1,857 |
|
|
$ |
1,962 |
|
|
$ |
1,334 |
|
|
$ |
685 |
|
|
$ |
310 |
|
|
$ |
658 |
|
|
$ |
5,879 |
|
|
$ |
12,685 |
|
|
|
|
|
|
|
|
|
|
|
|
|
|
|
|
|
|
|
|
|
|
|
|
|
|
||||||||
Charge-offs |
|
$ |
— |
|
|
$ |
— |
|
|
$ |
— |
|
|
$ |
— |
|
|
$ |
— |
|
|
$ |
(3 |
) |
|
$ |
— |
|
|
$ |
(3 |
) |
Recoveries |
|
|
— |
|
|
|
— |
|
|
|
— |
|
|
|
— |
|
|
|
— |
|
|
|
2 |
|
|
|
— |
|
|
|
2 |
|
Current period net |
|
$ |
— |
|
|
$ |
— |
|
|
$ |
— |
|
|
$ |
— |
|
|
$ |
— |
|
|
$ |
(1 |
) |
|
$ |
— |
|
|
$ |
(1 |
) |
|
|
|
|
|
|
|
|
|
|
|
|
|
|
|
|
|
|
|
|
|
|
|
|
|
||||||||
Total loans: |
|
|
|
|
|
|
|
|
|
|
|
|
|
|
|
|
|
|
|
|
|
|
|
|
||||||||
Pass |
|
$ |
288,301 |
|
|
$ |
810,203 |
|
|
$ |
441,607 |
|
|
$ |
158,291 |
|
|
$ |
107,314 |
|
|
$ |
316,988 |
|
|
$ |
159,933 |
|
|
$ |
2,282,637 |
|
Special mention |
|
|
6 |
|
|
|
7,042 |
|
|
|
137 |
|
|
|
958 |
|
|
|
147 |
|
|
|
1,196 |
|
|
|
250 |
|
|
|
9,736 |
|
Substandard |
|
|
— |
|
|
|
16,210 |
|
|
|
6,950 |
|
|
|
370 |
|
|
|
446 |
|
|
|
635 |
|
|
|
— |
|
|
|
24,611 |
|
Nonaccrual |
|
|
19 |
|
|
|
254 |
|
|
|
3,108 |
|
|
|
85 |
|
|
|
323 |
|
|
|
1,769 |
|
|
|
34 |
|
|
|
5,592 |
|
Total loans |
|
$ |
288,326 |
|
|
$ |
833,709 |
|
|
$ |
451,802 |
|
|
$ |
159,704 |
|
|
$ |
108,230 |
|
|
$ |
320,588 |
|
|
$ |
160,217 |
|
|
$ |
2,322,576 |
|
|
|
|
|
|
|
|
|
|
|
|
|
|
|
|
|
|
|
|
|
|
|
|
|
|
||||||||
Charge-offs |
|
$ |
(615 |
) |
|
$ |
(38 |
) |
|
$ |
(76 |
) |
|
$ |
(52 |
) |
|
$ |
(36 |
) |
|
$ |
(94 |
) |
|
$ |
(293 |
) |
|
$ |
(1,204 |
) |
Recoveries |
|
|
61 |
|
|
|
— |
|
|
|
4 |
|
|
|
1 |
|
|
|
— |
|
|
|
29 |
|
|
|
55 |
|
|
|
150 |
|
Total current period net (charge-offs) recoveries |
|
$ |
(554 |
) |
|
$ |
(38 |
) |
|
$ |
(72 |
) |
|
$ |
(51 |
) |
|
$ |
(36 |
) |
|
$ |
(65 |
) |
|
$ |
(238 |
) |
|
$ |
(1,054 |
) |
F-27
|
GUARANTY BANCSHARES, INC. NOTES TO CONSOLIDATED FINANCIAL STATEMENTS (Dollars in thousands, except per share data) |
The following table summarizes the credit exposure in the Company’s loan portfolio, by year of origination, as of December 31, 2022:
December 31, 2022 |
|
2022 |
|
|
2021 |
|
|
2020 |
|
|
2019 |
|
|
2018 |
|
|
Prior |
|
|
Revolving Loans Amortized Cost |
|
|
Total |
|
||||||||
Commercial and industrial: |
|
|
|
|
|
|
|
|
|
|
|
|
|
|
|
|
|
|
|
|
|
|
|
|
||||||||
Pass |
|
$ |
99,750 |
|
|
$ |
57,854 |
|
|
$ |
19,577 |
|
|
$ |
11,797 |
|
|
$ |
4,172 |
|
|
$ |
12,907 |
|
|
$ |
105,628 |
|
|
$ |
311,685 |
|
Special mention |
|
|
— |
|
|
|
131 |
|
|
|
— |
|
|
|
333 |
|
|
|
— |
|
|
|
— |
|
|
|
905 |
|
|
|
1,369 |
|
Substandard |
|
|
14 |
|
|
|
— |
|
|
|
246 |
|
|
|
423 |
|
|
|
192 |
|
|
|
23 |
|
|
|
— |
|
|
|
898 |
|
Nonaccrual |
|
|
72 |
|
|
|
33 |
|
|
|
10 |
|
|
|
— |
|
|
|
— |
|
|
|
— |
|
|
|
— |
|
|
|
115 |
|
Total commercial and industrial loans |
|
$ |
99,836 |
|
|
$ |
58,018 |
|
|
$ |
19,833 |
|
|
$ |
12,553 |
|
|
$ |
4,364 |
|
|
$ |
12,930 |
|
|
$ |
106,533 |
|
|
$ |
314,067 |
|
|
|
|
|
|
|
|
|
|
|
|
|
|
|
|
|
|
|
|
|
|
|
|
|
|
||||||||
Charge-offs |
|
$ |
— |
|
|
$ |
— |
|
|
$ |
(67 |
) |
|
$ |
— |
|
|
$ |
— |
|
|
$ |
— |
|
|
$ |
(125 |
) |
|
$ |
(192 |
) |
Recoveries |
|
|
— |
|
|
|
— |
|
|
|
— |
|
|
|
— |
|
|
|
— |
|
|
|
32 |
|
|
|
40 |
|
|
|
72 |
|
Current period net |
|
$ |
— |
|
|
$ |
— |
|
|
$ |
(67 |
) |
|
$ |
— |
|
|
$ |
— |
|
|
$ |
32 |
|
|
$ |
(85 |
) |
|
$ |
(120 |
) |
|
|
|
|
|
|
|
|
|
|
|
|
|
|
|
|
|
|
|
|
|
|
|
|
|
||||||||
Construction and development: |
|
|
|
|
|
|
|
|
|
|
|
|
|
|
|
|
|
|
|
|
|
|
|
|
||||||||
Pass |
|
$ |
179,501 |
|
|
$ |
138,388 |
|
|
$ |
17,361 |
|
|
$ |
8,697 |
|
|
$ |
3,443 |
|
|
$ |
10,535 |
|
|
$ |
16,870 |
|
|
$ |
374,795 |
|
Special mention |
|
|
905 |
|
|
|
— |
|
|
|
— |
|
|
|
— |
|
|
|
— |
|
|
|
— |
|
|
|
— |
|
|
|
905 |
|
Substandard |
|
|
— |
|
|
|
— |
|
|
|
— |
|
|
|
— |
|
|
|
— |
|
|
|
— |
|
|
|
— |
|
|
|
— |
|
Nonaccrual |
|
|
— |
|
|
|
— |
|
|
|
— |
|
|
|
— |
|
|
|
1,435 |
|
|
|
— |
|
|
|
— |
|
|
|
1,435 |
|
Total construction and development loans |
|
$ |
180,406 |
|
|
$ |
138,388 |
|
|
$ |
17,361 |
|
|
$ |
8,697 |
|
|
$ |
4,878 |
|
|
$ |
10,535 |
|
|
$ |
16,870 |
|
|
$ |
377,135 |
|
|
|
|
|
|
|
|
|
|
|
|
|
|
|
|
|
|
|
|
|
|
|
|
|
|
||||||||
Charge-offs |
|
$ |
— |
|
|
$ |
— |
|
|
$ |
— |
|
|
$ |
— |
|
|
$ |
— |
|
|
$ |
— |
|
|
$ |
— |
|
|
$ |
— |
|
Recoveries |
|
|
— |
|
|
|
— |
|
|
|
— |
|
|
|
— |
|
|
|
— |
|
|
|
— |
|
|
|
— |
|
|
|
— |
|
Current period net |
|
$ |
— |
|
|
$ |
— |
|
|
$ |
— |
|
|
$ |
— |
|
|
$ |
— |
|
|
$ |
— |
|
|
$ |
— |
|
|
$ |
— |
|
|
|
|
|
|
|
|
|
|
|
|
|
|
|
|
|
|
|
|
|
|
|
|
|
|
||||||||
Commercial real estate: |
|
|
|
|
|
|
|
|
|
|
|
|
|
|
|
|
|
|
|
|
|
|
|
|
||||||||
Pass |
|
$ |
347,162 |
|
|
$ |
147,986 |
|
|
$ |
86,897 |
|
|
$ |
63,988 |
|
|
$ |
51,002 |
|
|
$ |
158,384 |
|
|
$ |
12,007 |
|
|
$ |
867,426 |
|
Special mention |
|
|
— |
|
|
|
— |
|
|
|
1,300 |
|
|
|
— |
|
|
|
2,594 |
|
|
|
3,427 |
|
|
|
— |
|
|
|
7,321 |
|
Substandard |
|
|
1,336 |
|
|
|
— |
|
|
|
— |
|
|
|
— |
|
|
|
26 |
|
|
|
4,207 |
|
|
|
— |
|
|
|
5,569 |
|
Nonaccrual |
|
|
— |
|
|
|
— |
|
|
|
251 |
|
|
|
96 |
|
|
|
— |
|
|
|
6,924 |
|
|
|
— |
|
|
|
7,271 |
|
Total commercial real estate loans |
|
$ |
348,498 |
|
|
$ |
147,986 |
|
|
$ |
88,448 |
|
|
$ |
64,084 |
|
|
$ |
53,622 |
|
|
$ |
172,942 |
|
|
$ |
12,007 |
|
|
$ |
887,587 |
|
|
|
|
|
|
|
|
|
|
|
|
|
|
|
|
|
|
|
|
|
|
|
|
|
|
||||||||
Charge-offs |
|
$ |
— |
|
|
$ |
— |
|
|
$ |
— |
|
|
$ |
— |
|
|
$ |
— |
|
|
$ |
— |
|
|
$ |
— |
|
|
$ |
— |
|
Recoveries |
|
|
— |
|
|
|
— |
|
|
|
— |
|
|
|
— |
|
|
|
1 |
|
|
|
— |
|
|
|
— |
|
|
|
1 |
|
Current period net |
|
$ |
— |
|
|
$ |
— |
|
|
$ |
— |
|
|
$ |
— |
|
|
$ |
1 |
|
|
$ |
— |
|
|
$ |
— |
|
|
$ |
1 |
|
F-28
|
GUARANTY BANCSHARES, INC. NOTES TO CONSOLIDATED FINANCIAL STATEMENTS (Dollars in thousands, except per share data) |
December 31, 2022 |
|
2022 |
|
|
2021 |
|
|
2020 |
|
|
2019 |
|
|
2018 |
|
|
Prior |
|
|
Revolving Loans Amortized Cost |
|
|
Total |
|
||||||||
Farmland: |
|
|
|
|
|
|
|
|
|
|
|
|
|
|
|
|
|
|
|
|
|
|
|
|
||||||||
Pass |
|
$ |
93,128 |
|
|
$ |
51,912 |
|
|
$ |
10,284 |
|
|
$ |
6,646 |
|
|
$ |
5,956 |
|
|
$ |
11,741 |
|
|
$ |
5,948 |
|
|
$ |
185,615 |
|
Special mention |
|
|
— |
|
|
|
— |
|
|
|
— |
|
|
|
— |
|
|
|
— |
|
|
|
— |
|
|
|
— |
|
|
|
— |
|
Substandard |
|
|
— |
|
|
|
— |
|
|
|
— |
|
|
|
31 |
|
|
|
— |
|
|
|
62 |
|
|
|
— |
|
|
|
93 |
|
Nonaccrual |
|
|
— |
|
|
|
— |
|
|
|
— |
|
|
|
— |
|
|
|
— |
|
|
|
109 |
|
|
|
— |
|
|
|
109 |
|
Total farmland loans |
|
$ |
93,128 |
|
|
$ |
51,912 |
|
|
$ |
10,284 |
|
|
$ |
6,677 |
|
|
$ |
5,956 |
|
|
$ |
11,912 |
|
|
$ |
5,948 |
|
|
$ |
185,817 |
|
|
|
|
|
|
|
|
|
|
|
|
|
|
|
|
|
|
|
|
|
|
|
|
|
|
||||||||
Charge-offs |
|
$ |
— |
|
|
$ |
— |
|
|
$ |
— |
|
|
$ |
— |
|
|
$ |
— |
|
|
$ |
— |
|
|
$ |
— |
|
|
$ |
— |
|
Recoveries |
|
|
— |
|
|
|
— |
|
|
|
— |
|
|
|
— |
|
|
|
— |
|
|
|
— |
|
|
|
— |
|
|
|
— |
|
Current period net |
|
$ |
— |
|
|
$ |
— |
|
|
$ |
— |
|
|
$ |
— |
|
|
$ |
— |
|
|
$ |
— |
|
|
$ |
— |
|
|
$ |
— |
|
|
|
|
|
|
|
|
|
|
|
|
|
|
|
|
|
|
|
|
|
|
|
|
|
|
||||||||
1-4 family residential: |
|
|
|
|
|
|
|
|
|
|
|
|
|
|
|
|
|
|
|
|
|
|
|
|
||||||||
Pass |
|
$ |
143,268 |
|
|
$ |
128,957 |
|
|
$ |
50,140 |
|
|
$ |
30,068 |
|
|
$ |
27,104 |
|
|
$ |
89,678 |
|
|
$ |
21,956 |
|
|
$ |
491,171 |
|
Special mention |
|
|
— |
|
|
|
— |
|
|
|
43 |
|
|
|
— |
|
|
|
— |
|
|
|
156 |
|
|
|
— |
|
|
|
199 |
|
Substandard |
|
|
— |
|
|
|
— |
|
|
|
— |
|
|
|
— |
|
|
|
— |
|
|
|
— |
|
|
|
— |
|
|
|
— |
|
Nonaccrual |
|
|
— |
|
|
|
148 |
|
|
|
— |
|
|
|
116 |
|
|
|
118 |
|
|
|
1,309 |
|
|
|
— |
|
|
|
1,691 |
|
Total 1-4 family residential loans |
|
$ |
143,268 |
|
|
$ |
129,105 |
|
|
$ |
50,183 |
|
|
$ |
30,184 |
|
|
$ |
27,222 |
|
|
$ |
91,143 |
|
|
$ |
21,956 |
|
|
$ |
493,061 |
|
|
|
|
|
|
|
|
|
|
|
|
|
|
|
|
|
|
|
|
|
|
|
|
|
|
||||||||
Charge-offs |
|
$ |
— |
|
|
$ |
— |
|
|
$ |
— |
|
|
$ |
— |
|
|
$ |
— |
|
|
$ |
— |
|
|
$ |
— |
|
|
$ |
— |
|
Recoveries |
|
|
— |
|
|
|
— |
|
|
|
— |
|
|
|
— |
|
|
|
— |
|
|
|
30 |
|
|
|
— |
|
|
|
30 |
|
Current period net |
|
$ |
— |
|
|
$ |
— |
|
|
$ |
— |
|
|
$ |
— |
|
|
$ |
— |
|
|
$ |
30 |
|
|
$ |
— |
|
|
$ |
30 |
|
|
|
|
|
|
|
|
|
|
|
|
|
|
|
|
|
|
|
|
|
|
|
|
|
|
||||||||
Multi-family residential: |
|
|
|
|
|
|
|
|
|
|
|
|
|
|
|
|
|
|
|
|
|
|
|
|
||||||||
Pass |
|
$ |
18,183 |
|
|
$ |
18,331 |
|
|
$ |
2,463 |
|
|
$ |
4,216 |
|
|
$ |
878 |
|
|
$ |
985 |
|
|
$ |
91 |
|
|
$ |
45,147 |
|
Special mention |
|
|
— |
|
|
|
— |
|
|
|
— |
|
|
|
— |
|
|
|
— |
|
|
|
— |
|
|
|
— |
|
|
|
— |
|
Substandard |
|
|
— |
|
|
|
— |
|
|
|
— |
|
|
|
— |
|
|
|
— |
|
|
|
— |
|
|
|
— |
|
|
|
— |
|
Nonaccrual |
|
|
— |
|
|
|
— |
|
|
|
— |
|
|
|
— |
|
|
|
— |
|
|
|
— |
|
|
|
— |
|
|
|
— |
|
Total multi-family residential loans |
|
$ |
18,183 |
|
|
$ |
18,331 |
|
|
$ |
2,463 |
|
|
$ |
4,216 |
|
|
$ |
878 |
|
|
$ |
985 |
|
|
$ |
91 |
|
|
$ |
45,147 |
|
|
|
|
|
|
|
|
|
|
|
|
|
|
|
|
|
|
|
|
|
|
|
|
|
|
||||||||
Charge-offs |
|
$ |
— |
|
|
$ |
— |
|
|
$ |
— |
|
|
$ |
— |
|
|
$ |
— |
|
|
$ |
— |
|
|
$ |
— |
|
|
$ |
— |
|
Recoveries |
|
|
— |
|
|
|
— |
|
|
|
— |
|
|
|
— |
|
|
|
— |
|
|
|
— |
|
|
|
— |
|
|
|
— |
|
Current period net |
|
$ |
— |
|
|
$ |
— |
|
|
$ |
— |
|
|
$ |
— |
|
|
$ |
— |
|
|
$ |
— |
|
|
$ |
— |
|
|
$ |
— |
|
F-29
|
GUARANTY BANCSHARES, INC. NOTES TO CONSOLIDATED FINANCIAL STATEMENTS (Dollars in thousands, except per share data) |
December 31, 2022 |
|
2022 |
|
|
2021 |
|
|
2020 |
|
|
2019 |
|
|
2018 |
|
|
Prior |
|
|
Revolving Loans Amortized Cost |
|
|
Total |
|
||||||||
Consumer and overdrafts: |
|
|
|
|
|
|
|
|
|
|
|
|
|
|
|
|
|
|
|
|
|
|
|
|
||||||||
Pass |
|
$ |
32,817 |
|
|
$ |
11,789 |
|
|
$ |
5,455 |
|
|
$ |
1,835 |
|
|
$ |
3,079 |
|
|
$ |
473 |
|
|
$ |
6,008 |
|
|
$ |
61,456 |
|
Special mention |
|
|
14 |
|
|
|
4 |
|
|
|
— |
|
|
|
28 |
|
|
|
4 |
|
|
|
— |
|
|
|
— |
|
|
|
50 |
|
Substandard |
|
|
— |
|
|
|
— |
|
|
|
— |
|
|
|
— |
|
|
|
— |
|
|
|
— |
|
|
|
— |
|
|
|
— |
|
Nonaccrual |
|
|
17 |
|
|
|
93 |
|
|
|
21 |
|
|
|
12 |
|
|
|
23 |
|
|
|
4 |
|
|
|
— |
|
|
|
170 |
|
Total consumer loans and overdrafts |
|
$ |
32,848 |
|
|
$ |
11,886 |
|
|
$ |
5,476 |
|
|
$ |
1,875 |
|
|
$ |
3,106 |
|
|
$ |
477 |
|
|
$ |
6,008 |
|
|
$ |
61,676 |
|
|
|
|
|
|
|
|
|
|
|
|
|
|
|
|
|
|
|
|
|
|
|
|
|
|
||||||||
Charge-offs |
|
$ |
(335 |
) |
|
$ |
(26 |
) |
|
$ |
(25 |
) |
|
$ |
(21 |
) |
|
$ |
— |
|
|
$ |
— |
|
|
$ |
(250 |
) |
|
$ |
(657 |
) |
Recoveries |
|
|
83 |
|
|
|
3 |
|
|
|
6 |
|
|
|
11 |
|
|
|
1 |
|
|
|
33 |
|
|
|
— |
|
|
|
137 |
|
Current period net |
|
$ |
(252 |
) |
|
$ |
(23 |
) |
|
$ |
(19 |
) |
|
$ |
(10 |
) |
|
$ |
1 |
|
|
$ |
33 |
|
|
$ |
(250 |
) |
|
$ |
(520 |
) |
|
|
|
|
|
|
|
|
|
|
|
|
|
|
|
|
|
|
|
|
|
|
|
|
|
||||||||
Agricultural: |
|
|
|
|
|
|
|
|
|
|
|
|
|
|
|
|
|
|
|
|
|
|
|
|
||||||||
Pass |
|
$ |
3,148 |
|
|
$ |
1,914 |
|
|
$ |
984 |
|
|
$ |
491 |
|
|
$ |
392 |
|
|
$ |
422 |
|
|
$ |
6,243 |
|
|
$ |
13,594 |
|
Special mention |
|
|
— |
|
|
|
— |
|
|
|
— |
|
|
|
— |
|
|
|
— |
|
|
|
3 |
|
|
|
— |
|
|
|
3 |
|
Substandard |
|
|
— |
|
|
|
— |
|
|
|
— |
|
|
|
— |
|
|
|
— |
|
|
|
32 |
|
|
|
— |
|
|
|
32 |
|
Nonaccrual |
|
|
— |
|
|
|
— |
|
|
|
— |
|
|
|
— |
|
|
|
4 |
|
|
|
53 |
|
|
|
— |
|
|
|
57 |
|
Total agricultural loans |
|
$ |
3,148 |
|
|
$ |
1,914 |
|
|
$ |
984 |
|
|
$ |
491 |
|
|
$ |
396 |
|
|
$ |
510 |
|
|
$ |
6,243 |
|
|
$ |
13,686 |
|
|
|
|
|
|
|
|
|
|
|
|
|
|
|
|
|
|
|
|
|
|
|
|
|
|
||||||||
Charge-offs |
|
$ |
— |
|
|
$ |
— |
|
|
$ |
— |
|
|
$ |
— |
|
|
$ |
— |
|
|
$ |
— |
|
|
$ |
— |
|
|
$ |
— |
|
Recoveries |
|
|
— |
|
|
|
— |
|
|
|
— |
|
|
|
— |
|
|
|
— |
|
|
|
— |
|
|
|
— |
|
|
|
— |
|
Current period net |
|
$ |
— |
|
|
$ |
— |
|
|
$ |
— |
|
|
$ |
— |
|
|
$ |
— |
|
|
$ |
— |
|
|
$ |
— |
|
|
$ |
— |
|
|
|
|
|
|
|
|
|
|
|
|
|
|
|
|
|
|
|
|
|
|
|
|
|
|
||||||||
Total loans: |
|
|
|
|
|
|
|
|
|
|
|
|
|
|
|
|
|
|
|
|
|
|
|
|
||||||||
Pass |
|
$ |
916,957 |
|
|
$ |
557,131 |
|
|
$ |
193,161 |
|
|
$ |
127,738 |
|
|
$ |
96,026 |
|
|
$ |
285,125 |
|
|
$ |
174,751 |
|
|
$ |
2,350,889 |
|
Special mention |
|
|
919 |
|
|
|
135 |
|
|
|
1,343 |
|
|
|
361 |
|
|
|
2,598 |
|
|
|
3,586 |
|
|
|
905 |
|
|
|
9,847 |
|
Substandard |
|
|
1,350 |
|
|
|
— |
|
|
|
246 |
|
|
|
454 |
|
|
|
218 |
|
|
|
4,324 |
|
|
|
— |
|
|
|
6,592 |
|
Nonaccrual |
|
|
89 |
|
|
|
274 |
|
|
|
282 |
|
|
|
224 |
|
|
|
1,580 |
|
|
|
8,399 |
|
|
|
— |
|
|
|
10,848 |
|
Total loans |
|
$ |
919,315 |
|
|
$ |
557,540 |
|
|
$ |
195,032 |
|
|
$ |
128,777 |
|
|
$ |
100,422 |
|
|
$ |
301,434 |
|
|
$ |
175,656 |
|
|
$ |
2,378,176 |
|
|
|
|
|
|
|
|
|
|
|
|
|
|
|
|
|
|
|
|
|
|
|
|
|
|
||||||||
Charge-offs |
|
$ |
(335 |
) |
|
$ |
(26 |
) |
|
$ |
(92 |
) |
|
$ |
(21 |
) |
|
$ |
— |
|
|
$ |
— |
|
|
$ |
(375 |
) |
|
$ |
(849 |
) |
Recoveries |
|
|
83 |
|
|
|
3 |
|
|
|
6 |
|
|
|
11 |
|
|
|
2 |
|
|
|
95 |
|
|
|
40 |
|
|
|
240 |
|
Total current period net charge-offs |
|
$ |
(252 |
) |
|
$ |
(23 |
) |
|
$ |
(86 |
) |
|
$ |
(10 |
) |
|
$ |
2 |
|
|
$ |
95 |
|
|
$ |
(335 |
) |
|
$ |
(609 |
) |
There were no loans classified in the “doubtful” or “loss” risk rating categories as of December 31, 2023 and 2022.
The following table presents the amortized cost basis of individually evaluated collateral-dependent loans by class of loans, and their impact on the ACL, as of December 31, 2023:
December 31, 2023 |
|
Real Estate |
|
|
Non-RE |
|
|
Total |
|
|
Allowance for Credit Losses Allocation |
|
||||
Commercial and industrial |
|
$ |
— |
|
|
$ |
217 |
|
|
$ |
217 |
|
|
$ |
217 |
|
Real estate: |
|
|
|
|
|
|
|
|
|
|
|
|
||||
Commercial real estate |
|
|
14,527 |
|
|
|
— |
|
|
|
14,527 |
|
|
|
— |
|
Total |
|
$ |
14,527 |
|
|
$ |
217 |
|
|
$ |
14,744 |
|
|
$ |
217 |
|
F-30
|
GUARANTY BANCSHARES, INC. NOTES TO CONSOLIDATED FINANCIAL STATEMENTS (Dollars in thousands, except per share data) |
There were no individually evaluated collateral-dependent loans within the ACL model as of December 31, 2022.
The following tables summarize the payment status of loans in the Company’s total loan portfolio, including an aging of delinquent loans and loans 90 days or more past due continuing to accrue interest as of:
December 31, 2023 |
|
30 to 59 Days |
|
|
60 to 89 Days |
|
|
90 Days |
|
|
Total |
|
|
Current |
|
|
Total |
|
|
Recorded |
|
|||||||
Commercial and industrial |
|
$ |
621 |
|
|
$ |
30 |
|
|
$ |
1,656 |
|
|
$ |
2,307 |
|
|
$ |
285,258 |
|
|
$ |
287,565 |
|
|
$ |
— |
|
Real estate: |
|
|
|
|
|
|
|
|
|
|
|
|
|
|
|
|
|
|
|
|
|
|||||||
Construction and |
|
|
315 |
|
|
|
288 |
|
|
|
117 |
|
|
|
720 |
|
|
|
295,919 |
|
|
|
296,639 |
|
|
|
— |
|
Commercial real |
|
|
356 |
|
|
|
— |
|
|
|
132 |
|
|
|
488 |
|
|
|
922,707 |
|
|
|
923,195 |
|
|
|
— |
|
Farmland |
|
|
226 |
|
|
|
84 |
|
|
|
— |
|
|
|
310 |
|
|
|
185,985 |
|
|
|
186,295 |
|
|
|
— |
|
1-4 family residential |
|
|
2,827 |
|
|
|
1,110 |
|
|
|
1,612 |
|
|
|
5,549 |
|
|
|
509,054 |
|
|
|
514,603 |
|
|
|
— |
|
Multi-family residential |
|
|
— |
|
|
|
— |
|
|
|
— |
|
|
|
— |
|
|
|
44,292 |
|
|
|
44,292 |
|
|
|
— |
|
Consumer |
|
|
169 |
|
|
|
77 |
|
|
|
162 |
|
|
|
408 |
|
|
|
56,651 |
|
|
|
57,059 |
|
|
|
— |
|
Agricultural |
|
|
16 |
|
|
|
— |
|
|
|
— |
|
|
|
16 |
|
|
|
12,669 |
|
|
|
12,685 |
|
|
|
— |
|
Overdrafts |
|
|
— |
|
|
|
— |
|
|
|
— |
|
|
|
— |
|
|
|
243 |
|
|
|
243 |
|
|
|
— |
|
Total |
|
$ |
4,530 |
|
|
$ |
1,589 |
|
|
$ |
3,679 |
|
|
$ |
9,798 |
|
|
$ |
2,312,778 |
|
|
$ |
2,322,576 |
|
|
$ |
— |
|
December 31, 2022 |
|
30 to 59 Days |
|
|
60 to 89 Days |
|
|
90 Days |
|
|
Total |
|
|
Current |
|
|
Total |
|
|
Recorded |
|
|||||||
Commercial and industrial |
|
$ |
440 |
|
|
$ |
44 |
|
|
$ |
105 |
|
|
$ |
589 |
|
|
$ |
313,478 |
|
|
$ |
314,067 |
|
|
$ |
— |
|
Real estate: |
|
|
|
|
|
|
|
|
|
|
|
|
|
|
|
|
|
|
|
|
|
|||||||
Construction and |
|
|
258 |
|
|
|
73 |
|
|
|
1,435 |
|
|
|
1,766 |
|
|
|
375,369 |
|
|
|
377,135 |
|
|
|
— |
|
Commercial real |
|
|
882 |
|
|
|
354 |
|
|
|
6,708 |
|
|
|
7,944 |
|
|
|
879,643 |
|
|
|
887,587 |
|
|
|
— |
|
Farmland |
|
|
129 |
|
|
|
79 |
|
|
|
— |
|
|
|
208 |
|
|
|
185,609 |
|
|
|
185,817 |
|
|
|
— |
|
1-4 family residential |
|
|
2,101 |
|
|
|
547 |
|
|
|
572 |
|
|
|
3,220 |
|
|
|
489,841 |
|
|
|
493,061 |
|
|
|
— |
|
Multi-family residential |
|
|
— |
|
|
|
— |
|
|
|
— |
|
|
|
— |
|
|
|
45,147 |
|
|
|
45,147 |
|
|
|
— |
|
Consumer |
|
|
164 |
|
|
|
118 |
|
|
|
70 |
|
|
|
352 |
|
|
|
61,042 |
|
|
|
61,394 |
|
|
|
— |
|
Agricultural |
|
|
37 |
|
|
|
10 |
|
|
|
— |
|
|
|
47 |
|
|
|
13,639 |
|
|
|
13,686 |
|
|
|
— |
|
Overdrafts |
|
|
— |
|
|
|
— |
|
|
|
— |
|
|
|
— |
|
|
|
282 |
|
|
|
282 |
|
|
|
— |
|
Total |
|
$ |
4,011 |
|
|
$ |
1,225 |
|
|
$ |
8,890 |
|
|
$ |
14,126 |
|
|
$ |
2,364,050 |
|
|
$ |
2,378,176 |
|
|
$ |
— |
|
The following table presents information regarding nonaccrual loans as of:
|
|
2023 |
|
|
2022 |
|
||
Commercial and industrial |
|
$ |
1,777 |
|
|
$ |
115 |
|
Real estate: |
|
|
|
|
|
|
||
Construction and development |
|
|
117 |
|
|
|
1,435 |
|
Commercial real estate |
|
|
132 |
|
|
|
7,271 |
|
Farmland |
|
|
164 |
|
|
|
109 |
|
1-4 family residential |
|
|
2,793 |
|
|
|
1,691 |
|
Consumer and overdrafts |
|
|
250 |
|
|
|
170 |
|
Agricultural |
|
|
359 |
|
|
|
57 |
|
Total |
|
$ |
5,592 |
|
|
$ |
10,848 |
|
If interest on nonaccrual loans had been accrued, such income would have been approximately $167 and $434 for the years ended December 31, 2023 and 2022, respectively. There were no commitments to lend additional funds to borrowers whose loans were classified as nonaccrual. There were no individually analyzed loans classified as nonaccrual with an associated allowance for credit losses applied as of December 31, 2023 and 2022.
F-31
|
GUARANTY BANCSHARES, INC. NOTES TO CONSOLIDATED FINANCIAL STATEMENTS (Dollars in thousands, except per share data) |
Modifications to Borrowers Experiencing Financial Difficulty
The Company adopted Accounting Standards Update (“ASU”) 2022-02, Financial Instruments - Credit Losses (Topic 326) Troubled Debt Restructurings and Vintage Disclosures (“ASU 2022-02”) effective January 1, 2023. The amendments in ASU 2022-02 eliminated the recognition and measure of troubled debt restructurings and enhanced disclosures for loan modifications to borrowers experiencing financial difficulty.
The following table presents the amortized cost basis of loans modified during the year ended December 31, 2023 to borrowers experiencing financial difficulty:
For the Year Ended |
|
Term |
|
|
Total Class of Financing Receivable |
|
||
Commercial and industrial |
|
$ |
900 |
|
|
|
0.00 |
% |
1-4 family residential |
|
|
57 |
|
|
|
0.01 |
% |
Consumer |
|
|
12 |
|
|
|
0.02 |
% |
Total loans |
|
$ |
969 |
|
|
|
0.03 |
% |
The following table presents the financial effect of the loan modifications presented above to borrowers experiencing financial difficulty during the year ended December 31, 2023:
Term Extension |
||
Loan Type |
|
Financial Effect |
Commercial and industrial |
|
Amortization period was extended by a weighted-average period of 0.25 years. |
1-4 family residential |
|
Amortization period was extended by a weighted-average period of 5.00 years. |
Consumer |
|
Amortization period was extended by a weighted-average period of 0.26 years. |
The following table provides an age analysis of loans made to borrowers experiencing financial difficult that were modified on or after our ASU 2022-02 adoption date of January 1, 2023:
|
|
Current |
|
|
30 to 89 Days |
|
|
90 Days |
|
|||
Commercial and industrial |
|
$ |
900 |
|
|
$ |
— |
|
|
$ |
— |
|
1-4 family residential |
|
|
— |
|
|
|
57 |
|
|
|
— |
|
Consumer |
|
|
12 |
|
|
|
— |
|
|
|
— |
|
Total loans |
|
$ |
912 |
|
|
$ |
57 |
|
|
$ |
— |
|
As of December 31, 2023, the Company did not have any loans made to borrowers experiencing financial difficulty that were modified during the year ended December 31, 2023 that subsequently defaulted. There were no commitments to lend additional funds to borrowers experiencing financial difficulty as of December 31, 2023.
There were no loans restructured during the year ended December 31, 2022.
NOTE 4 - PREMISES AND EQUIPMENT
Premises and equipment balances, by type, were as follows:
|
|
December 31, |
|
|
December 31, |
|
||
Land |
|
$ |
11,135 |
|
|
$ |
11,135 |
|
Building and improvements |
|
|
59,955 |
|
|
|
59,448 |
|
Construction in progress |
|
|
9,027 |
|
|
|
4,153 |
|
Furniture, fixtures and equipment |
|
|
20,983 |
|
|
|
19,708 |
|
Automobiles |
|
|
365 |
|
|
|
370 |
|
|
|
|
101,465 |
|
|
|
94,814 |
|
Less: accumulated depreciation |
|
|
44,447 |
|
|
|
40,523 |
|
|
|
$ |
57,018 |
|
|
$ |
54,291 |
|
F-32
|
GUARANTY BANCSHARES, INC. NOTES TO CONSOLIDATED FINANCIAL STATEMENTS (Dollars in thousands, except per share data) |
NOTE 5 - GOODWILL
There were no changes in the carrying amount of goodwill as presented in the accompanying consolidated balance sheets as of December 31, 2023 or 2022.
NOTE 6 - CORE DEPOSIT INTANGIBLES
Changes in the carrying amount of core deposit intangibles in the accompanying consolidated balance sheets as of December 31 are summarized as follows:
|
|
2023 |
|
|
2022 |
|
||
Beginning of year |
|
$ |
1,859 |
|
|
$ |
2,313 |
|
Amortization |
|
|
(441 |
) |
|
|
(454 |
) |
End of year |
|
$ |
1,418 |
|
|
$ |
1,859 |
|
Accumulated amortization was $7,113 and $6,672 at December 31, 2023 and 2022, respectively. Amortization expense related to core deposit intangibles was $441, $454 and $686 during the years ended December 31, 2023, 2022 and 2021, respectively. The estimated aggregate future amortization expense for core deposit intangibles remaining as of December 31, 2023 was as follows:
Year Ended December 31, |
|
Amount |
|
|
2024 |
|
$ |
424 |
|
2025 |
|
|
316 |
|
2026 |
|
|
272 |
|
2027 |
|
|
270 |
|
2028 |
|
|
136 |
|
|
|
$ |
1,418 |
|
NOTE 7 - INTEREST-BEARING DEPOSITS
Interest-bearing deposits, by type of account, were as follows as of:
|
|
December 31, 2023 |
|
|
December 31, 2022 |
|
||
NOW accounts |
|
$ |
150,548 |
|
|
$ |
225,859 |
|
Savings and money market accounts |
|
|
924,558 |
|
|
|
1,048,612 |
|
Time deposits $250,000 or less |
|
|
426,145 |
|
|
|
224,550 |
|
Time deposits greater than $250,000 |
|
|
279,038 |
|
|
|
129,989 |
|
|
|
$ |
1,780,289 |
|
|
$ |
1,629,010 |
|
Year-end maturities of time deposits, as of December 31, 2023, were as follows:
Year Ended December 31, |
|
Amount |
|
|
2024 |
|
$ |
646,978 |
|
2025 |
|
|
49,642 |
|
2026 |
|
|
4,183 |
|
2027 |
|
|
2,238 |
|
2028 |
|
|
2,142 |
|
Thereafter |
|
|
— |
|
|
|
$ |
705,183 |
|
Deposits of executive officers, directors and significant shareholders at December 31, 2023 and 2022 totaled $40,799 and $56,291, respectively.
NOTE 8 - BORROWED MONEY
Advances from the Federal Home Loan Bank (FHLB) were $140,000 at a 5.36% weighted average rate as of December 31, 2023 and $290,000 at a 4.74% weighted average rate as of December 31, 2022, and were collateralized by blanket floating liens on certain securities and loans.
F-33
|
GUARANTY BANCSHARES, INC. NOTES TO CONSOLIDATED FINANCIAL STATEMENTS (Dollars in thousands, except per share data) |
FHLB advances bear interest based on a fixed rate, payable monthly, with all principal due at maturity. The following table presents the scheduled maturities of FHLB advances and their weighted average rates, each as of December 31, 2023:
Year |
|
Current |
|
|
Principal Due |
|
||
Fixed rate advances |
|
|
|
|
|
|
||
2024 |
|
|
5.36 |
% |
|
|
140,000 |
|
Total FHLB advances |
|
|
|
|
$ |
140,000 |
|
|
The outstanding FHLB advances above will be repaid with cash flows from operations or renewed into new advances.
The Company has an unsecured $25,000 revolving line of credit with a correspondent bank that bears interest at the greater of (i) the prime rate, which was 8.50% at December 31, 2023, or (ii) the rate floor of 3.50%, with interest payable quarterly, and matures in March 2024. Under the terms of the line of credit, the Company agreed not to pledge or grant a lien or security interest in the stock of the Bank or in any other assets without prior consent of the lender. As of December 31, 2023, there was a $4,500 outstanding balance on the line of credit. To be in compliance with the loan covenants, the Bank is required to maintain no less than a 10% total risk-based capital ratio, must maintain no less than $85,000 in tangible net worth, the ratio of non-performing assets to equity plus allowance for credit losses must not exceed 15%, the cash flow coverage must be greater than 1.25 times, the ratio of other additional debt to total assets must not exceed 15%, and the Company is limited to acquiring additional debt of no more than $500 without prior approval. The Company is in compliance with all loan covenants.
NOTE 9 - SUBORDINATED DEBT
Subordinated debt was made up of the following as of:
|
|
December 31, 2023 |
|
|
December 31, 2022 |
|
||
Trust III Debentures |
|
$ |
2,062 |
|
|
$ |
2,062 |
|
DCB Trust I Debentures |
|
|
5,155 |
|
|
|
5,155 |
|
Subordinated note |
|
|
34,568 |
|
|
|
34,436 |
|
Other debentures |
|
|
4,000 |
|
|
|
7,500 |
|
|
|
$ |
45,785 |
|
|
$ |
49,153 |
|
As of December 31, 2023, the Company has two active trusts, Guaranty (TX) Capital Trust III (“Trust III”) and DCB Financial Trust I (“DCB Trust I”). Upon formation, the Trusts issued pass-through securities (“TruPS”) with a liquidation value of $1,000 per share to third parties in private placements. Concurrently with the issuance of the TruPS, the Trusts (composed of Trust III and DCB Trust I) issued common securities to the Company. The Trusts invested the proceeds of the sales of securities to the Company (“Debentures”). The Debentures mature approximately 30 years after the formation date, which may be shortened if certain conditions are met (including the Company having received prior approval of the Federal Reserve and any other required regulatory approvals).
|
|
Trust III |
|
|
DCB Trust I |
|
||
Formation date |
|
July 25, 2006 |
|
|
March 29, 2007 |
|
||
Capital trust pass-through securities |
|
|
|
|
|
|
||
Number of shares |
|
|
2,000 |
|
|
|
5,000 |
|
Original liquidation value |
|
$ |
2,000 |
|
|
$ |
5,000 |
|
Common securities liquidation value |
|
|
62 |
|
|
|
155 |
|
The securities held by the Trusts qualify as Tier 1 capital for the Company under Federal Reserve Board guidelines. The Federal Reserve’s guidelines restrict core capital elements (including trust preferred securities and qualifying perpetual preferred stock) to 25% of all core capital elements, net of goodwill less any associated deferred tax liability. Because the Company’s aggregate amount of trust preferred securities is less than the limit of 25% of Tier 1 capital, net of goodwill, the full amount is includable in Tier 1 capital at December 31, 2023 and December 31, 2022. Additionally, the terms provide that trust preferred securities would no longer qualify for Tier 1 capital within five years of their maturity, but would be included as Tier 2 capital. However, the trust preferred securities would be amortized out of Tier 2 capital by one-fifth each year and excluded from Tier 2 capital completely during the year prior to maturity of the junior subordinated debentures.
F-34
|
GUARANTY BANCSHARES, INC. NOTES TO CONSOLIDATED FINANCIAL STATEMENTS (Dollars in thousands, except per share data) |
With certain exceptions, the amount of the principal and any accrued and unpaid interest on the Debentures are subordinated in right of payment to the prior payment in full of all senior indebtedness of the Company. Interest on the Debentures is payable quarterly. The interest is deferrable on a cumulative basis for up to five consecutive years following a suspension of dividend payments on all other capital stock. No principal payments are due until maturity for each of the Debentures.
|
|
Trust III Debentures |
|
|
DCB Trust I |
|
||
Original amount |
|
$ |
2,062 |
|
|
$ |
5,155 |
|
Maturity date |
|
October 1, 2036 |
|
|
June 15, 2037 |
|
||
Interest due |
|
Quarterly |
|
|
Quarterly |
|
||
In accordance with ASC 810, "Consolidation," the junior subordinated debentures issued by the Company to the subsidiary trusts are shown as liabilities in the consolidated balance sheets and interest expense associated with the junior subordinated debentures is shown in the consolidated statements of earnings.
Trust II Debentures
In May 2022, the Company redeemed the $3.1 million in junior subordinated debentures issued to Guaranty (TX) Capital Trust II relating to such trust's issuance of trust preferred securities to a third party. Prior to repayment, interest was payable at a variable rate per annum, reset quarterly, equal to 3-month LIBOR plus 3.35%.
Trust III Debentures
Interest is payable at a variable rate per annum, reset quarterly, equal to 3-month Secured Overnight Financing Rate (SOFR) plus 1.93%.
On any interest payment date on or after October 1, 2016 and prior to maturity date, the debentures are redeemable for cash at the option of the Company, on at least 30, but not more than 60 days’ notice, in whole or in part, at a redemption price equal to 100% of the principal amount to be redeemed, plus accrued interest to the date of redemption.
DCB Trust I Debentures
Interest is payable at a variable rate per annum, reset quarterly, equal to 3-month SOFR plus 2.06%.
On any interest payment date on or after June 15, 2012 and prior to maturity date, the debentures are redeemable for cash at the option of the Company, on at least 30, but not more than 60 days’ notice, in whole or in part, at a redemption price equal to 100% of the principal amount to be redeemed, plus accrued interest to the date of redemption.
Subordinated Note
In March 2022, the Company completed a private placement of $35,000 aggregate principal amount of its fixed-to-floating rate subordinated note due April 1, 2032. The subordinated note initially bears a fixed interest rate of 3.625% per year, due semi-annually in arrears on April 1 and October 1. Commencing on April 1, 2027, the interest rate on the subordinated note will reset each quarter at a floating interest rate equal to the then-current three-month SOFR plus 192 basis points. The Company may at its option redeem in whole or in part the subordinated note on or after March 4, 2027 without a premium. The subordinated note is treated as Tier 2 capital for regulatory purposes (subject to reductions in the amount includable as Tier 2 capital in the final five years prior to maturity), and is presented net of related unamortized issuance costs on the consolidated balance sheets.
Other Debentures
In May 2020, the Company issued $10,000 in debentures to directors and other related parties. The debentures were issued at a par value of $500 each with fixed annual rates between 1.00% and 4.00% and maturity dates between November 1, 2020 and November 1, 2024. Various of these debentures have matured since issuance and $4,000 remains as of December 31, 2023. At the Company’s option, and with 30 days advanced notice to the holder, the entire principal amount and all accrued interest may be paid to the holder on or before the maturity date of any debenture. The redemption price is equal to 100% of the face amount of the debenture redeemed, plus all accrued interest.
F-35
|
GUARANTY BANCSHARES, INC. NOTES TO CONSOLIDATED FINANCIAL STATEMENTS (Dollars in thousands, except per share data) |
The scheduled principal payments and weighted average rates of the Debentures, the subordinated note and other debentures are as follows:
Year |
|
Current |
|
|
Principal Due |
|
||
2024 |
|
|
3.74 |
% |
|
$ |
4,000 |
|
2025 - 2028 |
|
|
— |
|
|
|
— |
|
Thereafter |
|
|
4.23 |
% |
|
|
42,217 |
|
Total scheduled principal payments |
|
|
|
|
|
46,217 |
|
|
Unamortized debt issuance costs |
|
|
|
|
|
(432 |
) |
|
|
|
|
|
|
$ |
45,785 |
|
|
NOTE 10 – EQUITY AWARDS
The Company’s 2015 Equity Incentive Plan (the “Plan”) was adopted by the Company and approved by its shareholders in April 2015. The maximum number of shares of common stock that may be issued pursuant to stock-based awards under the Plan equals 1,100,000 shares, all of which may be subject to incentive stock option treatment. Option awards are generally granted with an exercise price equal to the market price of the Company’s common stock at the date of grant; those option awards have vesting periods ranging from 5 to 10 years and have 10-year contractual terms. Restricted stock awards vest under the period of restriction specified within their respective award agreements as determined by the Company. Forfeitures are recognized as they occur, subject to a 90-day grace period for vested options.
The fair value of each option award is estimated on the date of grant using a closed form option valuation (Black-Scholes) model that uses the assumptions noted in the table below. Expected volatilities are based on historical volatilities of the Company’s common stock and similar peer group averages. The Company uses historical data to estimate option exercise and post-vesting termination behavior. The expected term of options granted is based on historical data and represents the period of time that options granted are expected to be outstanding, which takes in to account that the options are not transferable. The dividend yield is the total dividends per share paid during the period divided by the average of the Company's stock price on each date a grant was issued. The risk-free interest rate for the expected term of the option is based on U.S. Treasury yield in effect at the time of the grant.
The fair value of options granted was determined using the following weighted-average assumptions as of grant date, for the years ended December 31:
|
|
2023 |
|
|
2022 |
|
|
2021 |
|
|||
Risk-free interest rate |
|
|
4.08 |
% |
|
|
2.90 |
% |
|
|
0.98 |
% |
Expected term (in years) |
|
|
6.50 |
|
|
|
6.50 |
|
|
|
6.50 |
|
Expected stock price volatility |
|
|
23.53 |
% |
|
|
21.70 |
% |
|
|
23.98 |
% |
Dividend yield |
|
|
3.23 |
% |
|
|
2.47 |
% |
|
|
2.35 |
% |
A summary of stock option activity in the Plan during the years ended December 31, 2023 and 2022 follows:
2023 |
|
Number of |
|
|
Weighted- |
|
|
Weighted- |
|
|
Aggregate |
|
||||
Outstanding at beginning of year |
|
|
497,820 |
|
|
$ |
28.07 |
|
|
|
5.87 |
|
|
$ |
3,402 |
|
Granted |
|
|
52,500 |
|
|
|
28.72 |
|
|
|
|
|
|
|
||
Exercised |
|
|
(29,790 |
) |
|
|
23.46 |
|
|
|
|
|
|
|
||
Forfeited |
|
|
(54,850 |
) |
|
|
30.80 |
|
|
|
|
|
|
|
||
Balance, December 31, 2023 |
|
|
465,680 |
|
|
$ |
28.12 |
|
|
|
5.46 |
|
|
$ |
2,782 |
|
|
|
|
|
|
|
|
|
|
|
|
|
|
||||
Exercisable at end of period |
|
|
283,110 |
|
|
$ |
26.03 |
|
|
|
3.87 |
|
|
$ |
2,202 |
|
F-36
|
GUARANTY BANCSHARES, INC. NOTES TO CONSOLIDATED FINANCIAL STATEMENTS (Dollars in thousands, except per share data) |
2022 |
|
Number of |
|
|
Weighted- |
|
|
Weighted- |
|
|
Aggregate |
|
||||
Outstanding at beginning of year |
|
|
502,780 |
|
|
$ |
25.77 |
|
|
|
5.59 |
|
|
$ |
5,936 |
|
Granted |
|
|
102,500 |
|
|
|
35.58 |
|
|
|
|
|
|
|
||
Exercised |
|
|
(69,580 |
) |
|
|
22.49 |
|
|
|
|
|
|
|
||
Forfeited |
|
|
(37,880 |
) |
|
|
28.16 |
|
|
|
|
|
|
|
||
Balance, December 31, 2022 |
|
|
497,820 |
|
|
$ |
28.07 |
|
|
|
5.87 |
|
|
$ |
3,402 |
|
|
|
|
|
|
|
|
|
|
|
|
|
|
||||
Exercisable at end of period |
|
|
281,340 |
|
|
$ |
25.25 |
|
|
|
4.32 |
|
|
$ |
2,648 |
|
A summary of nonvested stock option activity in the Plan during the years ended December 31, 2023 and 2022 follows:
2023 |
|
Number of |
|
|
Weighted-Average |
|
||
Outstanding at beginning of year |
|
|
216,480 |
|
|
$ |
5.95 |
|
Granted |
|
|
52,500 |
|
|
|
6.04 |
|
Vested |
|
|
(65,690 |
) |
|
|
5.63 |
|
Forfeited |
|
|
(20,720 |
) |
|
|
14.39 |
|
Balance, December 31, 2023 |
|
|
182,570 |
|
|
$ |
6.10 |
|
2022 |
|
Number of |
|
|
Weighted-Average |
|
||
Outstanding at beginning of year |
|
|
207,084 |
|
|
$ |
5.23 |
|
Granted |
|
|
102,500 |
|
|
|
6.98 |
|
Vested |
|
|
(71,944 |
) |
|
|
5.50 |
|
Forfeited |
|
|
(21,160 |
) |
|
|
8.86 |
|
Balance, December 31, 2022 |
|
|
216,480 |
|
|
$ |
5.95 |
|
Information related to stock options in the Plan is as follows for the years ended:
|
|
2023 |
|
|
2022 |
|
|
2021 |
|
|||
Intrinsic value of options exercised |
|
$ |
303 |
|
|
$ |
846 |
|
|
$ |
1,273 |
|
Cash received from options exercised |
|
|
698 |
|
|
|
1,565 |
|
|
|
2,019 |
|
Weighted average fair value of options granted |
|
|
6.04 |
|
|
|
6.98 |
|
|
|
5.92 |
|
Restricted Stock Awards and Units
A summary of restricted stock activity in the Plan during the years ended December 31, 2023 and 2022 follows:
2023 |
|
Number of |
|
|
Weighted-Average |
|
||
Outstanding at beginning of year |
|
|
18,930 |
|
|
$ |
27.51 |
|
Granted |
|
|
5,056 |
|
|
|
31.96 |
|
Vested |
|
|
(7,520 |
) |
|
|
27.52 |
|
Forfeited |
|
|
(1,076 |
) |
|
|
28.93 |
|
Balance, December 31, 2023 |
|
|
15,390 |
|
|
$ |
28.87 |
|
2022 |
|
Number of |
|
|
Weighted-Average |
|
||
Outstanding at beginning of year |
|
|
30,190 |
|
|
$ |
27.52 |
|
Vested |
|
|
(11,260 |
) |
|
|
27.52 |
|
Balance, December 31, 2022 |
|
|
18,930 |
|
|
$ |
27.51 |
|
F-37
|
GUARANTY BANCSHARES, INC. NOTES TO CONSOLIDATED FINANCIAL STATEMENTS (Dollars in thousands, except per share data) |
Restricted stock granted to employees typically vests over five years, but vesting periods may vary. Compensation expense for these grants will be recognized over the vesting period of the awards based on the fair value of the stock at the issue date.
As of December 31, 2023, there was $1,390 of total unrecognized compensation expense related to nonvested stock options granted under the Plan. The expense is expected to be recognized over a weighted-average period of 3.10 years.
The Company granted options and restricted stock under the Plan during both 2023 and 2022. Expense of $594, $688 and $733 was recorded during the years ended December 31, 2023, 2022 and 2021, respectively, which represents the fair value of restricted stock and stock options vested during those periods.
NOTE 11 - EMPLOYEE BENEFITS
KSOP
The Company maintains an Employee Stock Ownership Plan containing Section 401(k) provisions covering substantially all employees (“KSOP”). The plan provides for a matching contribution of up to 5% of a participant’s qualified compensation starting January 1, 2016. Guaranty’s total contributions accrued or paid during the years ended December 31, 2023, 2022 and 2021 totaled $1,643, $1,576 and $1,455, respectively, and is included in employee compensation and benefits on the Company’s consolidated statements of earnings.
Upon separation from service or other distributable event, a participant’s account under the KSOP may be distributed in kind in the form of the GNTY common shares allocated to his or her account (with the balance payable in cash), or the entire account can be liquidated and distributed in cash.
As of December 31, 2023, the number of shares held by the KSOP was 1,021,462. There were no unallocated shares to plan participants as of December 31, 2023, and all shares held by the KSOP were treated as outstanding.
Executive Incentive Retirement Plan
The Company established a non-qualified, non-contributory executive incentive retirement plan covering a selected group of key personnel to provide benefits equal to amounts computed under an “award criteria” at various targeted salary levels as adjusted for annual earnings performance of the Company. The plan is non-funded.
In connection with the Executive Incentive Retirement Plan, the Company has purchased life insurance policies on the respective officers. The cash surrender value of life insurance policies held by the Company totaled $42,348 and $38,404 as of December 31, 2023 and 2022, respectively. For the year ended December 31, 2021, a gain of $277 was included in other income in the Company's consolidated statement of earnings, from $464 in proceeds received from these life insurance policies resulting from the death of a former bank officer. No such gains were recorded during the years ended December 31, 2023 or 2022.
Expense related to these plans totaled $949, $796 and $738 for the years ended December 31, 2023, 2022 and 2021, respectively. This expense is included in employee compensation and benefits on the Company’s consolidated statements of earnings. The recorded liability totaled approximately $6,050 and $5,388 as of December 31, 2023 and 2022, respectively, and is included in accrued interest and other liabilities on the Company’s consolidated balance sheets.
Bonus Plan
The Company has a bonus plan that rewards officers and employees based on performance of individual business units of the Company. Earnings and growth performance goals for each business unit and for the Company as a whole are established at the beginning of the calendar year and approved annually by Guaranty’s board of directors. The bonus plan provides for a predetermined bonus amount to be contributed to the employee bonus pool based on (i) earnings target and growth for individual business units and (ii) achieving certain pre-tax return on average equity and pre-tax return on average asset levels for the Company as a whole. These bonus amounts are established annually by Guaranty’s board of directors. The bonus expense under this plan for the years ended December 31, 2023, 2022 and 2021 totaled $3,764, $5,177 and $4,867, respectively, which included accrued bonus expense at December 31, 2023, 2022 and 2021 of $1,684, $2,332 and $2,190, respectively.
F-38
|
GUARANTY BANCSHARES, INC. NOTES TO CONSOLIDATED FINANCIAL STATEMENTS (Dollars in thousands, except per share data) |
The expense is included in employee compensation and benefits on the consolidated statements of earnings and the accrual is included in accrued interest and other liabilities on the consolidated balance sheets.
NOTE 12 – LEASES
The Company has operating leases for bank locations, ATMs, corporate offices, and certain other arrangements, which have remaining lease terms of 1 year to 12 years. Some of the Company’s operating leases include options to extend the leases for up to 10 years.
Operating leases in which we are the lessee must be recorded as right-of-use assets with corresponding lease liabilities. The right-of-use asset represents our right to utilize the underlying asset during the lease term, while the lease liability represents the present value of the obligation of the Company to make periodic lease payments over the life of the lease. The associated operating lease costs are comprised of the amortization of the right-of-use asset and the implicit interest accreted on the lease liability, which is recognized on a straight-line basis over the life of the lease. As of December 31, 2023, operating lease right-of-use assets were $12,485 and liabilities were $13,128, and as of December 31, 2022, lease assets and liabilities were $12,896 and $13,520, respectively, and were included within the accompanying consolidated balance sheets as components of other assets and accrued interest and other liabilities, respectively.
Operating lease expense for operating leases accounted for under ASC 842 for the years ended December 31, 2023, 2022 and 2021 was approximately $2,292, $2,236 and $2,278, respectively, and were included as a component of occupancy expenses within the accompanying consolidated statements of earnings.
The table below summarizes other information related to our operating leases as of:
|
|
December 31, 2023 |
|
|
December 31, 2022 |
|
||
Operating leases |
|
|
|
|
|
|
||
Operating lease right-of-use assets |
|
$ |
12,485 |
|
|
$ |
12,896 |
|
Operating lease liabilities |
|
|
13,128 |
|
|
|
13,520 |
|
|
|
|
|
|
|
|
||
Weighted average remaining lease term |
|
|
|
|
|
|
||
Operating leases |
|
7 years |
|
|
8 years |
|
||
Weighted average discount rate |
|
|
|
|
|
|
||
Operating leases |
|
|
2.28 |
% |
|
|
2.00 |
% |
The Company leases some of its banking facilities under non-cancelable operating leases expiring in various years through 2028 and thereafter. Minimum future lease payments under these non-cancelable operating leases as of December 31, 2023, are as follows:
Year Ended December 31, |
|
Amount |
|
|
2024 |
|
$ |
2,303 |
|
2025 |
|
|
2,134 |
|
2026 |
|
|
1,897 |
|
2027 |
|
|
1,735 |
|
2028 |
|
|
1,688 |
|
Thereafter |
|
|
3,856 |
|
Total lease payments |
|
|
13,613 |
|
Less: interest |
|
|
(485 |
) |
Present value of lease liabilities |
|
$ |
13,128 |
|
NOTE 13 - INCOME TAXES
Management of the Company considers the likelihood of changes by taxing authorities in its filed income tax returns and discloses potential significant changes that management believes are more likely than not to occur upon examination by tax authorities.
F-39
|
GUARANTY BANCSHARES, INC. NOTES TO CONSOLIDATED FINANCIAL STATEMENTS (Dollars in thousands, except per share data) |
Management has not identified any uncertain tax positions in previously filed income tax returns that require disclosure in the accompanying consolidated financial statements. The Company is subject to U.S. federal income taxes.
The consolidated provision for income taxes was as follows as of December 31:
|
|
2023 |
|
|
2022 |
|
|
2021 |
|
|||
Current federal tax expense |
|
$ |
6,784 |
|
|
$ |
9,991 |
|
|
$ |
8,893 |
|
Deferred federal tax expense (benefit) |
|
|
346 |
|
|
|
(1,157 |
) |
|
|
(143 |
) |
Total |
|
$ |
7,130 |
|
|
$ |
8,834 |
|
|
$ |
8,750 |
|
The provision for federal income taxes differs from that computed by applying federal statutory rates to income before federal income tax expense, as indicated in the following analysis as of December 31:
|
|
2023 |
|
|
2022 |
|
|
2021 |
|
|||
Federal statutory income tax at 21% |
|
$ |
7,799 |
|
|
$ |
10,344 |
|
|
$ |
10,197 |
|
Tax exempt interest income |
|
|
(944 |
) |
|
|
(1,076 |
) |
|
|
(1,043 |
) |
Earnings of bank owned life insurance |
|
|
(198 |
) |
|
|
(177 |
) |
|
|
(235 |
) |
Nondeductible expenses |
|
|
669 |
|
|
|
277 |
|
|
|
180 |
|
Other |
|
|
(196 |
) |
|
|
(534 |
) |
|
|
(349 |
) |
Total |
|
$ |
7,130 |
|
|
$ |
8,834 |
|
|
$ |
8,750 |
|
The following table summarizes the components of our deferred tax assets and liabilities as of December 31, 2023 and 2022. Our net deferred tax assets are included in other assets in the accompanying consolidated balance sheets.
|
|
2023 |
|
|
2022 |
|
||
Deferred tax assets: |
|
|
|
|
|
|
||
Allowance for credit losses |
|
$ |
6,493 |
|
|
$ |
6,714 |
|
Deferred compensation |
|
|
1,271 |
|
|
|
1,132 |
|
Unrealized loss on available for sale securities |
|
|
4,029 |
|
|
|
4,040 |
|
Bonus accrual |
|
|
385 |
|
|
|
526 |
|
Deferred loan fees, net |
|
|
163 |
|
|
|
330 |
|
Accretion of acquisition allowance |
|
|
37 |
|
|
|
54 |
|
Other |
|
|
297 |
|
|
|
360 |
|
Total deferred tax assets |
|
|
12,675 |
|
|
|
13,156 |
|
Deferred tax liabilities: |
|
|
|
|
|
|
||
Premises and equipment |
|
|
(1,187 |
) |
|
|
(1,494 |
) |
Prepaid expenses |
|
|
(375 |
) |
|
|
(281 |
) |
Intangibles |
|
|
(196 |
) |
|
|
(230 |
) |
Other |
|
|
(178 |
) |
|
|
(55 |
) |
Total deferred tax liabilities |
|
|
(1,936 |
) |
|
|
(2,060 |
) |
Net deferred tax asset |
|
$ |
10,739 |
|
|
$ |
11,096 |
|
The Company is no longer subject to U.S. federal income tax examinations for years before 2020.
NOTE 14 - DERIVATIVE FINANCIAL INSTRUMENTS
The Company utilizes certain derivative financial instruments. Stand-alone derivative financial instruments such as interest rate swaps, are used to economically hedge interest rate risk related to the Company’s liabilities. These derivative instruments involve both credit and market risk. The notional amounts are amounts on which calculations, payments, and the value of the derivative are based. Notional amounts do not represent direct credit exposures. Direct credit exposure is limited to the net difference between the calculated amounts to be received and paid, if any. Such difference, which represents the fair value of the derivative instruments, is reflected on the Company’s consolidated balance sheets in other liabilities, if applicable.
The Company is exposed to credit related losses in the event of nonperformance by the counterparties to those agreements. The Company controls the credit risk of its financial contracts through credit approvals, limits and monitoring procedures, and does not expect any counterparties to fail to perform their respective obligations.
F-40
|
GUARANTY BANCSHARES, INC. NOTES TO CONSOLIDATED FINANCIAL STATEMENTS (Dollars in thousands, except per share data) |
The Company entered into interest rate swaps to receive payments at a fixed rate in exchange for paying a floating rate on the debentures discussed in Note 9. Management believed that entering into the interest rate swaps exposed the Company to variability in their fair value due to changes in the level of interest rates. It was the Company’s objective to hedge the change in fair value of floating rate debentures at coverage levels that were appropriate, given anticipated or existing interest rate levels and other market considerations, as well as the relationship of change in the liability to other liabilities of the Company. During the quarter ended September 30, 2021, Guaranty terminated these interest rate swaps with notional amounts totaling $5,000 at the time of termination, as the risk exposure declined to acceptable levels. The swaps were canceled at an expense of $466, which is included in non-interest expense in the 2021 consolidated statement of earnings.
In the first quarter of 2022, the Company also terminated interest rate swaps that were originally designed to receive payments at a floating rate in exchange for paying a fixed rate, the objective of which was to reduce the overall cost of short-term 3-month FHLB advances that were renewed consistent with the reset terms on the interest rate swaps. The swaps were canceled at a net gain of $685, which is included in other non-interest income in the consolidated statements of earnings. The interest rate swaps, with notional amounts totaling $40,000 as of December 31, 2021 were designated as cash flow hedges of the FHLB advances.
The changes in fair value of the swaps was recorded in other comprehensive loss.
There were no outstanding interest rate swap agreements as of December 31, 2023 or 2022.
Interest expense recorded on these swap transactions totaled, $282 and $607 during the years ended December 31, 2022 and 2021, respectively. This expense is reported as a component of interest expense on the debentures, FHLB advances and federal funds purchased on the consolidated statements of earnings. No interest expense on swap transactions was recorded during the year ended December 31, 2023.
NOTE 15 - COMMITMENTS AND CONTINGENCIES
In the normal course of business, the Company enters into various transactions, which, in accordance with GAAP, are not included in its consolidated balance sheets. These transactions are referred to as “off-balance sheet commitments.” The Company enters into these transactions to meet the financing needs of its customers. These transactions include commitments to extend credit and letters of credit, which involve elements of credit risk in excess of the amounts recognized in the consolidated balance sheets. The Company minimizes its exposure to loss under these commitments by subjecting them to credit approval and monitoring procedures.
The Company enters into contractual commitments to extend credit, normally with fixed expiration dates or termination clauses, at specified rates and for specific purposes. Customers use credit commitments to ensure that funds will be available for working capital purposes, for capital expenditures and to ensure access to funds at specified terms and conditions. Substantially all of the Company’s commitments to extend credit are contingent upon customers maintaining specific credit standards at the time of loan funding. Management considers the likelihood of commitments and letters of credit to be funded, along with credit related conditions present in the loan agreements when estimating an ACL for off-balance sheet commitments. Loan agreements executed in connection with construction loans and commercial lines of credit have standard conditions which must be met prior to the Company being required to provide additional funding, including conditions precedent that typically include: (i) no event of default or potential default has occurred; (ii) that no material adverse events have taken place that would materially affect the borrower or the value of the collateral, (iii) that the borrower remains in compliance with all loan obligations and covenants and has made no misrepresentations; (iv) that the collateral has not been damaged or impaired; (v) that the project remains on budget and in compliance with all laws and regulations; and (vi) that all management agreements, lease agreements and franchise agreements that affect the value of the collateral remain in force. If the conditions precedent have not been met, the Company retains the option to cease current draws and/or future funding. As a result of these conditions within our loan agreements, management has determined that credit risk is minimal and there is no recorded ACL with respect to these commitments as of December 31, 2023 and 2022.
Letters of credit are written conditional commitments issued by the Company to guarantee the performance of a customer to a third party. The Company’s policies generally require that letters of credit arrangements contain security and debt covenants similar to those contained in loan agreements. In the event the customer does not perform in accordance with the terms of the agreement with the third party, the Company would be required to fund the commitment. The maximum potential amount of future payments the Company could be required to make is represented by the contractual amount shown in the table below.
F-41
|
GUARANTY BANCSHARES, INC. NOTES TO CONSOLIDATED FINANCIAL STATEMENTS (Dollars in thousands, except per share data) |
If the commitment were funded, the Company would be entitled to seek recovery from the customer. Our credit risk associated with issuing letters of credit is essentially the same as the risk involved in extending loan facilities to our customers. As of December 31, 2023 and 2022, no amounts have been recorded as an ACL for the Bank’s potential obligations under these guarantees.
Commitments and letters of credit outstanding were as follows as of:
|
|
Contract or Notional Amount |
|
|||||
|
|
2023 |
|
|
2022 |
|
||
Commitments to extend credit |
|
$ |
336,036 |
|
|
$ |
474,745 |
|
Letters of credit |
|
|
7,536 |
|
|
|
8,289 |
|
Litigation
The Company is involved in certain claims and lawsuits occurring in the normal course of business. Management, after consultation with legal counsel, does not believe that the outcome of these actions, if determined adversely, would have a material impact on the consolidated financial statements of the Company.
FHLB Letters of Credit
At December 31, 2023, the Company had letters of credit of $5,000 pledged to secure public deposits, repurchase agreements, and for other purposes required or permitted by law.
NOTE 16 - REGULATORY MATTERS
The Company on a consolidated basis and the Bank are subject to various regulatory capital requirements administered by federal banking agencies. Failure to meet minimum capital requirements can initiate certain mandatory and possibly additional discretionary actions by regulators that, if undertaken, could have a direct material effect on the Company’s financial statements. Under capital adequacy guidelines and the regulatory framework for prompt corrective action, the Company must meet specific capital guidelines that involve quantitative measures of the Company’s assets, liabilities, and certain off balance sheet items as calculated under regulatory accounting practices. The Company’s capital amounts and classification are also subject to qualitative judgments by the regulators about components, risk weightings, and other factors.
The Basel III Capital Rules, a comprehensive capital framework for U.S. banking organizations, became effective for the Company and Bank on January 1, 2015, with certain transition provisions that were fully phased in on January 1, 2019. Quantitative measures established by the Basel III Capital Rules to ensure capital adequacy require the maintenance of minimum amounts and ratios (set forth in the table below) of Common Equity Tier 1 capital, Tier 1 capital and Total capital (as defined in the regulations) to risk-weighted assets (as defined), and or Tier 1 capital to adjusted quarterly average assets (as defined). Management believes, as of December 31, 2023 and 2022, that the Bank met all capital adequacy requirements to which it was subject.
The Basel III Capital Rules, among other things, (i) introduced a new capital measure called “Common Equity Tier 1” (“CET1”), (ii) specified that Tier 1 capital consist of CET1 and “Additional Tier 1 Capital” instruments meeting specified requirements, (iii) defined CET1 narrowly by requiring that most deductions/adjustments to regulatory capital measures be made to CET1 and not to the other components of capital, (iv) expanded the scope of the deductions/adjustments as compared to existing regulations, and (v) imposed a "capital conservation buffer" of 2.5% above minimum risk-based capital requirements, below which an institution would be subject to limitations on certain activities including payment of dividends, share repurchases and discretionary bonuses to executive officers.
As of December 31, 2023 and 2022, the Company’s capital ratios exceeded those levels necessary to be categorized as “well capitalized” under the regulatory framework for prompt corrective action. To be categorized as “well capitalized”, the Company must maintain minimum capital ratios as set forth in the table. There are no conditions or events since December 31, 2023 that management believes have changed the Company’s category.
The Federal Reserve’s guidelines regarding the capital treatment of trust preferred securities limits restricted core capital elements (including trust preferred securities and qualifying perpetual preferred stock) to 25% of all core capital elements, net of goodwill less any associated deferred tax liability. Because the Company’s aggregate amount of trust preferred securities is less than the limit of 25% of Tier 1 capital, net of goodwill, the rules permit the inclusion of $7,217 of trust preferred securities in Tier 1 capital as of both December 31, 2023 and 2022.
F-42
|
GUARANTY BANCSHARES, INC. NOTES TO CONSOLIDATED FINANCIAL STATEMENTS (Dollars in thousands, except per share data) |
Additionally, the rules provide that trust preferred securities would no longer qualify for Tier 1 capital within five years of their maturity, but would be included as Tier 2 capital. However, the trust preferred securities would be amortized out of Tier 2 capital by one-fifth each year and excluded from Tier 2 capital completely during the year prior to maturity of the subordinated debentures.
A comparison of the Company’s and Bank’s actual capital amounts and ratios to required capital amounts and ratios are presented in the following tables as of:
|
|
Actual |
|
Minimum Required |
|
Minimum Required |
|
To Be Well |
||||||||||||||||
|
|
Amount |
|
|
Ratio |
|
Amount |
|
|
Ratio |
|
Amount |
|
|
Ratio |
|
Amount |
|
|
Ratio |
||||
December 31, 2023 |
|
|
|
|
|
|
|
|
|
|
|
|
|
|
|
|
|
|
|
|
||||
Total capital to risk-weighted assets: |
|
|
|
|
|
|
|
|
|
|
|
|
|
|
|
|
|
|
|
|
||||
Consolidated |
|
$ |
367,526 |
|
|
15.22% |
|
$ |
193,232 |
|
|
8.00% |
|
$ |
253,617 |
|
|
10.50% |
|
$ |
241,540 |
|
|
10.00% |
Bank |
|
|
373,778 |
|
|
15.49% |
|
|
193,035 |
|
|
8.00% |
|
|
253,359 |
|
|
10.50% |
|
|
241,294 |
|
|
10.00% |
Tier 1 capital to risk-weighted assets: |
|
|
|
|
|
|
|
|
|
|
|
|
|
|
|
|
|
|
|
|
||||
Consolidated |
|
|
302,757 |
|
|
12.53% |
|
|
144,924 |
|
|
6.00% |
|
|
205,309 |
|
|
8.50% |
|
|
144,924 |
|
|
6.00% |
Bank |
|
|
343,607 |
|
|
14.24% |
|
|
144,777 |
|
|
6.00% |
|
|
205,100 |
|
|
8.50% |
|
|
193,035 |
|
|
8.00% |
Tier 1 capital to average assets:(1) |
|
|
|
|
|
|
|
|
|
|
|
|
|
|
|
|
|
|
|
|
||||
Consolidated |
|
|
302,757 |
|
|
9.47% |
|
|
127,878 |
|
|
4.00% |
|
|
127,878 |
|
|
4.00% |
|
n/a |
||||
Bank |
|
|
343,607 |
|
|
10.78% |
|
|
127,531 |
|
|
4.00% |
|
|
127,531 |
|
|
4.00% |
|
|
159,414 |
|
|
5.00% |
Common equity tier 1 capital to risk-weighted assets: |
|
|
|
|
|
|
|
|
|
|
|
|
|
|
|
|
|
|
|
|
||||
Consolidated |
|
|
295,540 |
|
|
12.24% |
|
|
108,693 |
|
|
4.50% |
|
|
169,078 |
|
|
7.00% |
|
n/a |
||||
Bank |
|
|
343,607 |
|
|
14.24% |
|
|
108,582 |
|
|
4.50% |
|
|
168,906 |
|
|
7.00% |
|
|
156,841 |
|
|
6.50% |
(1) The Tier 1 capital ratio (to average assets) is not impacted by the Basel III Capital Rules; however, the Federal Reserve and the FDIC may require the Consolidated Company and the Bank, respectively, to maintain a Tier 1 capital ratio (to average assets) above the required minimum. |
||||||||||||||||||||||||
|
|
Actual |
|
Minimum Required |
|
Minimum Required |
|
To Be Well |
||||||||||||||||
|
|
Amount |
|
|
Ratio |
|
Amount |
|
|
Ratio |
|
Amount |
|
|
Ratio |
|
Amount |
|
|
Ratio |
||||
December 31, 2022 |
|
|
|
|
|
|
|
|
|
|
|
|
|
|
|
|
|
|
|
|
||||
Total capital to risk-weighted assets: |
|
|
|
|
|
|
|
|
|
|
|
|
|
|
|
|
|
|
|
|
||||
Consolidated |
|
$ |
358,702 |
|
|
14.37% |
|
$ |
199,687 |
|
|
8.00% |
|
$ |
262,089 |
|
|
10.50% |
|
$ |
249,608 |
|
|
10.00% |
Bank |
|
|
361,125 |
|
|
14.48% |
|
|
199,570 |
|
|
8.00% |
|
|
261,936 |
|
|
10.50% |
|
|
249,463 |
|
|
10.00% |
Tier 1 capital to risk-weighted assets: |
|
|
|
|
|
|
|
|
|
|
|
|
|
|
|
|
|
|
|
|
||||
Consolidated |
|
|
292,966 |
|
|
11.74% |
|
|
149,765 |
|
|
6.00% |
|
|
212,167 |
|
|
8.50% |
|
|
149,765 |
|
|
6.00% |
Bank |
|
|
329,933 |
|
|
13.23% |
|
|
149,678 |
|
|
6.00% |
|
|
212,044 |
|
|
8.50% |
|
|
199,570 |
|
|
8.00% |
Tier 1 capital to average assets:(1) |
|
|
|
|
|
|
|
|
|
|
|
|
|
|
|
|
|
|
|
|
||||
Consolidated |
|
|
292,966 |
|
|
8.77% |
|
|
133,614 |
|
|
4.00% |
|
|
133,614 |
|
|
4.00% |
|
n/a |
||||
Bank |
|
|
329,933 |
|
|
9.89% |
|
|
133,375 |
|
|
4.00% |
|
|
133,375 |
|
|
4.00% |
|
|
166,718 |
|
|
5.00% |
Common equity tier 1 capital to risk-weighted assets: |
|
|
|
|
|
|
|
|
|
|
|
|
|
|
|
|
|
|
|
|
||||
Consolidated |
|
|
285,749 |
|
|
11.45% |
|
|
112,324 |
|
|
4.50% |
|
|
174,726 |
|
|
7.00% |
|
n/a |
||||
Bank |
|
|
329,933 |
|
|
13.23% |
|
|
112,258 |
|
|
4.50% |
|
|
174,624 |
|
|
7.00% |
|
|
162,151 |
|
|
6.50% |
(1) The Tier 1 capital ratio (to average assets) is not impacted by the Basel III Capital Rules; however, the Federal Reserve and the FDIC may require the Consolidated Company and the Bank, respectively, to maintain a Tier 1 capital ratio (to average assets) above the required minimum. |
||||||||||||||||||||||||
Dividends paid by Guaranty are mainly provided by dividends from its subsidiaries. However, certain regulatory restrictions exist regarding the ability of its bank subsidiary to transfer funds to Guaranty in the form of cash dividends, loans or advances. The amount of dividends that a subsidiary bank organized as a national banking association, such as the Bank, may declare in a calendar year is the subsidiary bank’s net profits for that year combined with its retained net profits for the preceding two years. Retained net profits, as defined by the Office of the Comptroller of the Currency ("OCC"), consist of net income less dividends declared during the period.
F-43
|
GUARANTY BANCSHARES, INC. NOTES TO CONSOLIDATED FINANCIAL STATEMENTS (Dollars in thousands, except per share data) |
As of December 31, 2023, the Bank had $56,504 available for payment of dividends. Dividends are paid quarterly, and $10,724 in dividends were paid during the year ended December 31, 2023.
NOTE 17 - CONCENTRATIONS OF CREDIT RISK
Most of the Company’s business activity is with customers located within the state of Texas. Investments in state and municipal securities involve governmental entities within the Company’s market area. The Company also maintains deposits with other financial institutions in amounts that exceed FDIC insurance coverage.
The Company has not experienced any losses in such accounts and believes it is not exposed to any significant credit risk on cash and cash equivalents.
NOTE 18 - SECURITIES SOLD UNDER AGREEMENTS TO REPURCHASE
Securities sold under agreements to repurchase were $25,172 and $7,221 as of December 31, 2023 and 2022, respectively, and are secured by mortgage-backed securities and collateralized mortgage obligations.
Securities sold under agreements to repurchase are financing arrangements that mature within two years. At maturity, the securities underlying the agreements are returned to the Company. Information concerning securities sold under agreements to repurchase is summarized as follows as of December 31:
|
|
2023 |
|
|
2022 |
|
||
Average balance during the year |
|
$ |
20,635 |
|
|
$ |
8,596 |
|
Average interest rate during the year |
|
|
1.27 |
% |
|
|
0.42 |
% |
Maximum month-end balance during the year |
|
$ |
31,644 |
|
|
$ |
12,118 |
|
Weighted average interest rate at year-end |
|
|
2.12 |
% |
|
|
0.44 |
% |
NOTE 19 - RELATED PARTIES
As more fully described in Note 3, Note 7 and Note 9, the Company has entered into loans, deposits and debenture transactions with related parties. Management believes the transactions entered into with related parties are in the ordinary course of business and are on terms similar to transitions with unaffiliated parties.
NOTE 20 - FAIR VALUE
Fair value is the exchange price that would be received for an asset or paid to transfer a liability (exit price) in the principal or most advantageous market for the asset or liability in an orderly transaction between market participants on the measurement date. There are three levels of inputs that may be used to measure fair values:
Level 1 - Quoted prices (unadjusted) for identical assets or liabilities in active markets that the entity has the ability to access as of the measurement date.
Level 2 - Significant other observable inputs other than Level 1 prices such as quoted prices for similar assets or liabilities; quoted prices in markets that are not active; or other inputs that are observable or can be corroborated by observable market data.
Level 3 - Significant unobservable inputs that reflect a company’s own assumptions about the assumptions that market participants would use in pricing an asset or liability.
The Company used the following methods and significant assumptions to estimate fair value:
Marketable Securities: The fair values for marketable securities are determined by quoted market prices, if available (Level 1). For securities where quoted prices are not available, fair values are calculated based on market prices of similar securities (Level 2). For securities where quoted prices or market prices of similar securities are not available, fair values are calculated using discounted cash flows or other market indicators (Level 3).
F-44
|
GUARANTY BANCSHARES, INC. NOTES TO CONSOLIDATED FINANCIAL STATEMENTS (Dollars in thousands, except per share data) |
Loans Held For Sale: Loans held for sale are carried at the lower of cost or fair value, which is evaluated on a pool-level basis. The fair value of loans held for sale is determined using quoted prices for similar assets, adjusted for specific attributes of that loan or other observable market data, such as outstanding commitments from third party investors (Level 2).
Other Real Estate Owned: Assets acquired through or instead of loan foreclosure are initially recorded at fair value less costs to sell when acquired, establishing a new cost basis. These assets are subsequently accounted for at lower of cost or fair value less estimated costs to sell. Fair value is commonly based on recent real estate appraisals which are updated no less frequently than annually. These appraisals may utilize a single valuation approach or a combination of approaches including comparable sales and the income approach. Adjustments are routinely made in the appraisal process by the independent appraisers to adjust for differences between the comparable sales and income data available. Real estate owned properties are evaluated on a quarterly basis for additional impairment and adjusted accordingly (Level 3).
Individually Evaluated Collateral Dependent Loans: The fair value of individually evaluated collateral dependent loans is generally based on the fair value of collateral, less costs to sell. The fair value of real estate collateral is determined using recent real estate appraisals. These appraisals may utilize a single valuation approach or a combination of approaches including comparable sales and the income approach. Adjustments are routinely made in the appraisal process by the independent appraisers to adjust for differences between the comparable sales and income data available. Such adjustments are usually significant (Level 3). Non-real estate collateral may be valued using an appraisal, net book value per the borrower’s financial statements, or aging reports, adjusted or discounted based on management’s historical knowledge, changes in market conditions from the time of the valuation, and management’s expertise and knowledge of the client and client’s business (Level 3).
The following tables summarize quantitative disclosures about the fair value measurements for each category of financial assets (liabilities) carried at fair value:
December 31, 2023 |
|
Fair Value |
|
|
Quoted |
|
|
Significant |
|
|
Significant |
|
||||
Assets at fair value on a recurring basis: |
|
|
|
|
|
|
|
|
|
|
|
|
||||
Available for sale securities: |
|
|
|
|
|
|
|
|
|
|
|
|
||||
Mortgage-backed securities |
|
$ |
149,812 |
|
|
$ |
— |
|
|
$ |
149,812 |
|
|
$ |
— |
|
Collateralized mortgage obligations |
|
|
17,074 |
|
|
|
— |
|
|
|
17,074 |
|
|
|
— |
|
Municipal securities |
|
|
2,504 |
|
|
|
— |
|
|
|
2,504 |
|
|
|
— |
|
Corporate bonds |
|
|
26,805 |
|
|
|
— |
|
|
|
26,805 |
|
|
|
— |
|
Loans held for sale |
|
|
976 |
|
|
|
— |
|
|
|
— |
|
|
|
976 |
|
Cash surrender value of life insurance |
|
|
42,348 |
|
|
|
— |
|
|
|
42,348 |
|
|
|
— |
|
SBA servicing assets |
|
|
691 |
|
|
|
— |
|
|
|
— |
|
|
|
691 |
|
|
|
|
|
|
|
|
|
|
|
|
|
|
||||
Assets at fair value on a nonrecurring basis: |
|
|
|
|
|
|
|
|
|
|
|
|
||||
Individually evaluated collateral dependent loans |
|
|
14,527 |
|
|
|
— |
|
|
|
— |
|
|
|
14,527 |
|
F-45
|
GUARANTY BANCSHARES, INC. NOTES TO CONSOLIDATED FINANCIAL STATEMENTS (Dollars in thousands, except per share data) |
December 31, 2022 |
|
Fair Value |
|
|
Quoted |
|
|
Significant |
|
|
Significant |
|
||||
Assets at fair value on a recurring basis: |
|
|
|
|
|
|
|
|
|
|
|
|
||||
Available for sale securities: |
|
|
|
|
|
|
|
|
|
|
|
|
||||
Mortgage-backed securities |
|
$ |
130,341 |
|
|
$ |
— |
|
|
$ |
130,341 |
|
|
$ |
— |
|
Collateralized mortgage obligations |
|
|
20,157 |
|
|
|
— |
|
|
|
20,157 |
|
|
|
— |
|
Municipal securities |
|
|
10,642 |
|
|
|
— |
|
|
|
10,642 |
|
|
|
— |
|
Corporate bonds |
|
|
27,787 |
|
|
|
— |
|
|
|
27,787 |
|
|
|
— |
|
Loans held for sale |
|
|
3,156 |
|
|
|
— |
|
|
|
— |
|
|
|
3,156 |
|
Cash surrender value of life insurance |
|
|
38,404 |
|
|
|
— |
|
|
|
38,404 |
|
|
|
— |
|
SBA servicing assets |
|
|
874 |
|
|
|
— |
|
|
|
— |
|
|
|
874 |
|
|
|
|
|
|
|
|
|
|
|
|
|
|
||||
Assets at fair value on a nonrecurring basis: |
|
|
|
|
|
|
|
|
|
|
|
|
||||
Individually evaluated collateral dependent loans |
|
|
— |
|
|
|
— |
|
|
|
— |
|
|
|
— |
|
There were no transfers between Level 2 and Level 3 during the years ended December 31, 2023 or 2022.
Nonfinancial Assets and Nonfinancial Liabilities
Nonfinancial assets measured at fair value on a nonrecurring basis include certain foreclosed assets which, upon initial recognition, are remeasured and reported at fair value through a charge-off to the allowance for credit losses and certain foreclosed assets which, subsequent to their initial recognition, are remeasured at fair value through a write-down included in current earnings. The fair value of a foreclosed asset is estimated using Level 2 inputs based on observable market data or Level 3 inputs based on customized discounting criteria.
As of December 31, 2023 and 2022, there were no foreclosed assets that were remeasured and recorded at fair value.
The following table presents quantitative information about nonrecurring Level 3 fair value measurements as of December 31, 2022. There were no nonrecurring Level 3 fair value measurements requiring quantitative information as of December 31, 2023.
December 31, 2022 |
|
Fair Value |
|
|
Valuation |
|
Unobservable Input(s) |
|
Range |
|
||
Other real estate owned |
|
$ |
38 |
|
|
Appraisal value of collateral |
|
Selling costs or other normal adjustments |
|
|
49 |
% |
The following table presents information on individually evaluated collateral dependent loans included in the ACL model as of December 31, 2023. There were no individually evaluated collateral dependent loans included in the ACL model as of December 31, 2022:
|
|
Fair Value Measurements Using |
|
|
|
|
||||||||||
December 31, 2023 |
|
Level 1 |
|
|
Level 2 |
|
|
Level 3 |
|
|
Total Fair Value |
|
||||
Commercial and industrial |
|
$ |
— |
|
|
$ |
— |
|
|
$ |
— |
|
|
$ |
— |
|
Real estate: |
|
|
|
|
|
|
|
|
|
|
|
|
||||
Commercial real estate |
|
|
— |
|
|
|
— |
|
|
|
14,527 |
|
|
|
14,527 |
|
Total |
|
$ |
— |
|
|
$ |
— |
|
|
$ |
14,527 |
|
|
$ |
14,527 |
|
F-46
|
GUARANTY BANCSHARES, INC. NOTES TO CONSOLIDATED FINANCIAL STATEMENTS (Dollars in thousands, except per share data) |
The carrying amounts and estimated fair values of financial instruments not previously discussed in this note, as of December 31, 2023 and 2022, are as follows:
|
|
Fair value measurements as of |
|
|||||||||||||||||
|
|
Carrying |
|
|
Level 1 |
|
|
Level 2 |
|
|
Level 3 |
|
|
Total |
|
|||||
Financial assets: |
|
|
|
|
|
|
|
|
|
|
|
|
|
|
|
|||||
Cash, due from banks, federal funds sold and interest-bearing deposits |
|
$ |
89,524 |
|
|
$ |
89,524 |
|
|
$ |
— |
|
|
$ |
— |
|
|
$ |
89,524 |
|
Marketable securities held to maturity |
|
|
404,208 |
|
|
|
— |
|
|
|
374,523 |
|
|
|
— |
|
|
|
374,523 |
|
Loans, net |
|
|
2,290,881 |
|
|
|
— |
|
|
|
— |
|
|
|
2,187,669 |
|
|
|
2,187,669 |
|
Accrued interest receivable |
|
|
13,143 |
|
|
|
— |
|
|
|
13,143 |
|
|
|
— |
|
|
|
13,143 |
|
Nonmarketable equity securities |
|
|
24,128 |
|
|
|
— |
|
|
|
24,128 |
|
|
|
— |
|
|
|
24,128 |
|
Financial liabilities: |
|
|
|
|
|
|
|
|
|
|
|
|
|
|
|
|||||
Deposits |
|
$ |
2,633,246 |
|
|
$ |
1,928,063 |
|
|
$ |
706,074 |
|
|
$ |
— |
|
|
$ |
2,634,137 |
|
Securities sold under repurchase agreements |
|
|
25,172 |
|
|
|
— |
|
|
|
25,172 |
|
|
|
— |
|
|
|
25,172 |
|
Accrued interest payable |
|
|
5,272 |
|
|
|
— |
|
|
|
5,272 |
|
|
|
— |
|
|
|
5,272 |
|
Federal Home Loan Bank advances |
|
|
140,000 |
|
|
|
— |
|
|
|
139,963 |
|
|
|
— |
|
|
|
139,963 |
|
Subordinated debt |
|
|
45,785 |
|
|
|
— |
|
|
|
46,433 |
|
|
|
— |
|
|
|
46,433 |
|
|
|
Fair value measurements as of |
|
|||||||||||||||||
|
|
Carrying |
|
|
Level 1 |
|
|
Level 2 |
|
|
Level 3 |
|
|
Total |
|
|||||
Financial assets: |
|
|
|
|
|
|
|
|
|
|
|
|
|
|
|
|||||
Cash, due from banks, federal funds sold and interest-bearing deposits |
|
$ |
106,467 |
|
|
$ |
106,467 |
|
|
$ |
— |
|
|
$ |
— |
|
|
$ |
106,467 |
|
Marketable securities held to maturity |
|
|
509,008 |
|
|
|
— |
|
|
|
475,068 |
|
|
|
— |
|
|
|
475,068 |
|
Loans, net |
|
|
2,344,245 |
|
|
|
— |
|
|
|
— |
|
|
|
2,217,606 |
|
|
|
2,217,606 |
|
Accrued interest receivable |
|
|
11,555 |
|
|
|
— |
|
|
|
11,555 |
|
|
|
— |
|
|
|
11,555 |
|
Nonmarketable equity securities |
|
|
25,585 |
|
|
|
— |
|
|
|
25,585 |
|
|
|
— |
|
|
|
25,585 |
|
Financial liabilities: |
|
|
|
|
|
|
|
|
|
|
|
|
|
|
|
|||||
Deposits |
|
$ |
2,681,154 |
|
|
$ |
2,326,615 |
|
|
$ |
351,981 |
|
|
$ |
— |
|
|
$ |
2,678,596 |
|
Securities sold under repurchase agreements |
|
|
7,221 |
|
|
|
— |
|
|
|
7,221 |
|
|
|
— |
|
|
|
7,221 |
|
Accrued interest payable |
|
|
2,348 |
|
|
|
— |
|
|
|
2,348 |
|
|
|
— |
|
|
|
2,348 |
|
Federal Home Loan Bank advances |
|
|
290,000 |
|
|
|
— |
|
|
|
289,926 |
|
|
|
— |
|
|
|
289,926 |
|
Subordinated debt |
|
|
49,153 |
|
|
|
— |
|
|
|
50,025 |
|
|
|
— |
|
|
|
50,025 |
|
The methods and assumptions, not previously presented, used to estimate fair values are described as follows:
Cash and Cash Equivalents: The carrying amounts of cash and short-term instruments approximate fair values (Level 1).
Marketable Securities Held to Maturity: The fair values for marketable securities held to maturity are determined by quoted market prices, if available (Level 1). For securities where quoted prices are not available, fair values are calculated based on market prices of similar securities (Level 2).
Loans, net: The fair value of fixed-rate loans and variable-rate loans that reprice on an infrequent basis is estimated by discounting future cash flows using the current interest rates at which similar loans with similar terms would be made to borrowers of similar credit quality (Level 3).
Nonmarketable Equity Securities: It is not practical to determine the fair value of Independent Bankers Financial Corporation, Federal Home Loan Bank, Federal Reserve Bank and other stock due to restrictions placed on its transferability.
Deposits and Securities Sold Under Repurchase Agreements: The fair values disclosed for demand deposits (e.g., interest and noninterest checking, passbook savings, and certain types of money market accounts) are, by definition, equal to the amount payable on demand at the reporting date (i.e., their carrying amount) (Level 1). The fair values of deposit liabilities with defined maturities are estimated by discounting future cash flows using interest rates currently offered for deposits of similar remaining maturities (Level 2).
F-47
|
GUARANTY BANCSHARES, INC. NOTES TO CONSOLIDATED FINANCIAL STATEMENTS (Dollars in thousands, except per share data) |
Other Borrowings: The fair value of borrowings, consisting of lines of credit, Federal Home Loan Bank advances and subordinated debt, is estimated by discounting future cash flows using currently available rates for similar financing (Level 2).
Accrued Interest Receivable/Payable: The carrying amounts of accrued interest approximate their fair values (Level 2).
Off-balance Sheet Instruments: Fair values for off-balance sheet, credit-related financial instruments are based on fees currently charged to enter into similar agreements, taking into account the remaining terms of the agreements and the counterparties’ credit standing. The fair value of commitments is not material.
NOTE 21 - ACCUMULATED OTHER COMPREHENSIVE (LOSS) INCOME
The following are changes in accumulated other comprehensive loss by component, net of tax, for the year ending December 31, 2023:
|
|
Cash Flow Hedges |
|
|
Available for Sale Securities |
|
|
Held to Maturity Securities |
|
|
Total |
|
||||
Beginning balance |
|
$ |
— |
|
|
$ |
(18,400 |
) |
|
$ |
(5,860 |
) |
|
$ |
(24,260 |
) |
Unrealized gains (losses) arising during the period |
|
|
— |
|
|
|
282 |
|
|
|
(1,104 |
) |
|
|
(822 |
) |
Tax effect |
|
|
— |
|
|
|
(59 |
) |
|
|
— |
|
|
|
(59 |
) |
Amounts reclassified from accumulated other comprehensive loss |
|
|
— |
|
|
|
(181 |
) |
|
|
— |
|
|
|
(181 |
) |
Net current period other comprehensive income (loss) |
|
|
— |
|
|
|
42 |
|
|
|
(1,104 |
) |
|
|
(1,062 |
) |
Ending balance |
|
$ |
— |
|
|
$ |
(18,358 |
) |
|
$ |
(6,964 |
) |
|
$ |
(25,322 |
) |
The following are amounts reclassified out of each component of accumulated other comprehensive loss for the year ended December 31, 2023:
Details about Accumulated Other Comprehensive Loss Components |
|
Amount Reclassified From |
|
|
Affected Line Item in the |
|
Unrealized loss on available for sale securities |
|
$ |
229 |
|
|
Net realized loss on sale of securities available for sale |
Tax effect |
|
|
(48 |
) |
|
Tax expense |
Net of tax |
|
$ |
181 |
|
|
|
The following are changes in accumulated other comprehensive loss by component, net of tax, for the year ended December 31, 2022:
|
|
Cash Flow Hedges |
|
|
Available for Sale Securities |
|
|
Held to Maturity Securities |
|
|
Total |
|
||||
Beginning balance |
|
$ |
188 |
|
|
$ |
(2,744 |
) |
|
$ |
8,861 |
|
|
$ |
6,305 |
|
Transfer from AFS to HTM |
|
|
— |
|
|
|
13,186 |
|
|
|
(13,186 |
) |
|
|
— |
|
Unrealized gains (losses) arising during the period |
|
|
497 |
|
|
|
(33,175 |
) |
|
|
(1,535 |
) |
|
|
(34,213 |
) |
Tax effect |
|
|
— |
|
|
|
4,197 |
|
|
|
— |
|
|
|
4,197 |
|
Amounts reclassified from accumulated other comprehensive loss |
|
|
(685 |
) |
|
|
136 |
|
|
|
— |
|
|
|
(549 |
) |
Net current period other comprehensive loss |
|
|
(188 |
) |
|
|
(15,656 |
) |
|
|
(14,721 |
) |
|
|
(30,565 |
) |
Ending balance |
|
$ |
— |
|
|
$ |
(18,400 |
) |
|
$ |
(5,860 |
) |
|
$ |
(24,260 |
) |
F-48
|
GUARANTY BANCSHARES, INC. NOTES TO CONSOLIDATED FINANCIAL STATEMENTS (Dollars in thousands, except per share data) |
The following are amounts reclassified out of each component of accumulated other comprehensive loss for the year ended December 31, 2022:
Details about Accumulated Other Comprehensive Loss Components |
|
Amount Reclassified From |
|
|
Affected Line Item in the Statement Where Net |
|
Unrealized gain on available for sale securities |
|
$ |
(172 |
) |
|
Net realized gain on sale of securities available for sale |
Tax effect |
|
|
36 |
|
|
Tax expense |
Net of tax |
|
$ |
(136 |
) |
|
|
Gains on cash flow hedges |
|
|
867 |
|
|
Other income |
Tax effect |
|
|
(182 |
) |
|
Tax expense |
Net of tax |
|
$ |
685 |
|
|
|
Total amounts reclassified out of accumulated other comprehensive loss |
|
$ |
549 |
|
|
|
The following are changes in accumulated other comprehensive income by component, net of tax, for the year ended December 31, 2021:
|
|
Cash Flow Hedges |
|
|
Available for Sale Securities |
|
|
Held to Maturity Securities |
|
|
Total |
|
||||
Beginning balance |
|
$ |
(1,151 |
) |
|
$ |
10,780 |
|
|
$ |
— |
|
|
$ |
9,629 |
|
Transfer from AFS to HTM |
|
|
|
|
|
(10,235 |
) |
|
|
10,235 |
|
|
|
— |
|
|
Unrealized gains (losses) arising during the period |
|
|
873 |
|
|
|
(6,884 |
) |
|
|
(1,374 |
) |
|
|
(7,385 |
) |
Tax effect |
|
|
— |
|
|
|
3,595 |
|
|
|
— |
|
|
|
3,595 |
|
Amounts reclassified from accumulated other comprehensive loss |
|
|
466 |
|
|
|
— |
|
|
|
— |
|
|
|
466 |
|
Net current period other comprehensive income (loss) |
|
|
1,339 |
|
|
|
(13,524 |
) |
|
|
8,861 |
|
|
|
(3,324 |
) |
Ending balance |
|
$ |
188 |
|
|
$ |
(2,744 |
) |
|
$ |
8,861 |
|
|
$ |
6,305 |
|
The following are amounts reclassified out of each component of accumulated other comprehensive loss for the year ended December 31, 2021:
Details about Accumulated Other Comprehensive Loss Components |
|
Amount Reclassified From |
|
|
Affected Line Item in the |
|
Unrealized loss on interest rate termination |
|
$ |
590 |
|
|
Other expenses |
Tax effect |
|
|
(124 |
) |
|
Tax expense |
Net of tax |
|
$ |
466 |
|
|
|
NOTE 22 - EARNINGS PER SHARE
Basic earnings per share is computed by dividing net earnings available to common shareholders by the weighted-average common shares outstanding for the period. Net losses attributable to the noncontrolling interest during the years ended December 31, 2023 and 2022 were $28 and $24, respectively, and are excluded from this calculation.
Diluted earnings per share reflects the maximum potential dilution that could occur if securities or other contracts to issue common stock were exercised or converted into common stock and would then share in the net earnings of the Company. Dilutive share equivalents include stock-based awards issued to employees.
Stock options granted by the Company are treated as potential shares in computing diluted earnings per share. Diluted shares outstanding include the dilutive effect of in-the-money awards which is calculated based on the average share price for each fiscal period using the treasury stock method. Under the treasury stock method, the amount that the employee must pay for exercising stock options, the amount of compensation cost for future service that the Company has not yet recognized, and the amount of tax impact that would be recorded in additional paid-in capital when the award becomes deductible are assumed to be used to repurchase shares.
F-49
|
GUARANTY BANCSHARES, INC. NOTES TO CONSOLIDATED FINANCIAL STATEMENTS (Dollars in thousands, except per share data) |
The computations of basic and diluted earnings per share for the Company were as follows (in thousands except per share amounts) as of December 31:
|
|
|
|
|
|
|
|
|
|
|||
|
|
2023 |
|
|
2022 |
|
|
2021 |
|
|||
Numerator: |
|
|
|
|
|
|
|
|
|
|||
Net earnings attributable to Guaranty Bancshares, Inc. |
|
$ |
30,037 |
|
|
$ |
40,447 |
|
|
$ |
39,806 |
|
|
|
|
|
|
|
|
|
|
|
|||
Denominator: |
|
|
|
|
|
|
|
|
|
|||
Weighted-average shares outstanding (basic) |
|
|
11,693,761 |
|
|
|
11,980,209 |
|
|
|
12,065,182 |
|
Effect of dilutive securities: |
|
|
|
|
|
|
|
|
|
|||
Common stock equivalent shares from stock options |
|
|
44,844 |
|
|
|
112,638 |
|
|
|
146,576 |
|
Weighted-average shares outstanding (diluted) |
|
|
11,738,605 |
|
|
|
12,092,847 |
|
|
|
12,211,758 |
|
|
|
|
|
|
|
|
|
|
|
|||
Net earnings attributable to Guaranty Bancshares, Inc. per share |
|
|
|
|
|
|
|
|
|
|||
Basic |
|
$ |
2.57 |
|
|
$ |
3.38 |
|
|
$ |
3.30 |
|
Diluted |
|
$ |
2.56 |
|
|
$ |
3.34 |
|
|
$ |
3.26 |
|
|
|
|
|
|
|
|
|
|
|
|||
NOTE 23 - PARENT COMPANY ONLY CONDENSED FINANCIAL INFORMATION
Condensed financial information of Guaranty Bancshares, Inc. follows:
|
|
December 31, |
|
|||||
|
|
2023 |
|
|
2022 |
|
||
ASSETS |
|
|
|
|
|
|
||
Cash and cash equivalents |
|
$ |
2,987 |
|
|
$ |
6,848 |
|
Investment in banking subsidiary |
|
|
351,367 |
|
|
|
339,168 |
|
Other assets |
|
|
2,428 |
|
|
|
1,351 |
|
Total assets |
|
$ |
356,782 |
|
|
$ |
347,367 |
|
|
|
|
|
|
|
|
||
LIABILITIES AND EQUITY |
|
|
|
|
|
|
||
Line of credit |
|
$ |
4,500 |
|
|
$ |
— |
|
Subordinated debt, net |
|
|
45,785 |
|
|
|
49,153 |
|
Accrued expenses and other liabilities |
|
|
3,197 |
|
|
|
3,230 |
|
Shareholders’ equity |
|
|
303,300 |
|
|
|
294,984 |
|
Total liabilities and shareholders’ equity |
|
$ |
356,782 |
|
|
$ |
347,367 |
|
|
|
For the Years Ended December 31, |
|
|||||||||
|
|
2023 |
|
|
2022 |
|
|
2021 |
|
|||
Interest income |
|
$ |
15 |
|
|
$ |
8 |
|
|
$ |
7 |
|
Dividends from Guaranty Bank & Trust |
|
|
20,000 |
|
|
|
— |
|
|
|
18,000 |
|
|
|
|
20,015 |
|
|
|
8 |
|
|
|
18,007 |
|
Expenses |
|
|
|
|
|
|
|
|
|
|||
Interest expense |
|
|
2,506 |
|
|
|
1,755 |
|
|
|
916 |
|
Other expenses |
|
|
1,645 |
|
|
|
1,974 |
|
|
|
2,520 |
|
|
|
|
4,151 |
|
|
|
3,729 |
|
|
|
3,436 |
|
Income (loss) before income tax and equity in undistributed income of subsidiary |
|
|
15,864 |
|
|
|
(3,721 |
) |
|
|
14,571 |
|
Income tax benefit |
|
|
912 |
|
|
|
924 |
|
|
|
718 |
|
Income (loss) before equity in undistributed earnings of subsidiary |
|
|
16,776 |
|
|
|
(2,797 |
) |
|
|
15,289 |
|
Equity in undistributed earnings of subsidiary |
|
|
13,261 |
|
|
|
43,244 |
|
|
|
24,517 |
|
Net earnings |
|
$ |
30,037 |
|
|
$ |
40,447 |
|
|
$ |
39,806 |
|
Comprehensive income |
|
$ |
28,975 |
|
|
$ |
9,882 |
|
|
$ |
36,482 |
|
F-50
|
GUARANTY BANCSHARES, INC. NOTES TO CONSOLIDATED FINANCIAL STATEMENTS (Dollars in thousands, except per share data) |
|
|
For the Years Ended December 31, |
|
|||||||||
|
|
2023 |
|
|
2022 |
|
|
2021 |
|
|||
Cash flows from operating activities |
|
|
|
|
|
|
|
|
|
|||
Net earnings |
|
$ |
30,037 |
|
|
$ |
40,447 |
|
|
$ |
39,806 |
|
Adjustments: |
|
|
|
|
|
|
|
|
|
|||
Equity in undistributed subsidiary earnings |
|
|
(13,261 |
) |
|
|
(43,244 |
) |
|
|
(24,517 |
) |
Stock based compensation |
|
|
594 |
|
|
|
688 |
|
|
|
733 |
|
Change in other assets |
|
|
(945 |
) |
|
|
(724 |
) |
|
|
(176 |
) |
Change in other liabilities |
|
|
(60 |
) |
|
|
226 |
|
|
|
44 |
|
Net cash provided by (used in) operating activities |
|
|
16,365 |
|
|
|
(2,607 |
) |
|
|
15,890 |
|
|
|
|
|
|
|
|
|
|
|
|||
Cash flows from investing activities |
|
|
|
|
|
|
|
|
|
|||
Net cash provided by investing activities |
|
|
— |
|
|
|
— |
|
|
|
— |
|
|
|
|
|
|
|
|
|
|
|
|||
Cash flows from financing activities |
|
|
|
|
|
|
|
|
|
|||
Proceeds from line of credit |
|
|
17,500 |
|
|
|
35,436 |
|
|
|
10,000 |
|
Repayments of borrowings |
|
|
(16,500 |
) |
|
|
(11,093 |
) |
|
|
(17,000 |
) |
Purchase of treasury stock |
|
|
(11,227 |
) |
|
|
(8,838 |
) |
|
|
— |
|
Exercise of stock options |
|
|
698 |
|
|
|
1,565 |
|
|
|
2,019 |
|
Cash dividends paid |
|
|
(10,697 |
) |
|
|
(10,324 |
) |
|
|
(9,427 |
) |
Net cash (used in) provided by financing activities |
|
|
(20,226 |
) |
|
|
6,746 |
|
|
|
(14,408 |
) |
|
|
|
|
|
|
|
|
|
|
|||
Net change in cash and cash equivalents |
|
|
(3,861 |
) |
|
|
4,139 |
|
|
|
1,482 |
|
Beginning cash and cash equivalents |
|
|
6,848 |
|
|
|
2,709 |
|
|
|
1,227 |
|
Ending cash and cash equivalents |
|
$ |
2,987 |
|
|
$ |
6,848 |
|
|
$ |
2,709 |
|
F-51
EXHIBIT 4.2
DESCRIPTION OF COMMON STOCK
As of December 31, 2023, Guaranty Bancshares, Inc. (the “Company,” “we,” or “our”) had one class of securities, our common stock, par value $1.00 per share (“common stock”), registered under Section 12 of the Securities Exchange Act of 1934, as amended (the “Exchange Act”).
Our common stock is listed on the New York Stock Exchange under the symbol “GNTY.”
The following is a summary of our common stock and certain terms of our amended and restated certificate of formation and our amended and restated bylaws, which we refer to herein as our certificate of formation and bylaws, respectively. This discussion summarizes some of the important rights of our shareholders but does not purport to be a complete description of these rights and may not contain all of the information regarding our capital stock that is important to you. The descriptions herein are qualified in their entirety by reference to our certificate of formation and bylaws, copies of which are filed with the SEC as exhibits to this report, and applicable law.
General
Our certificate of formation authorizes us to issue up to 50,000,000 shares of common stock, par value $1.00 per share. As of December 31, 2023, 11,540,644 shares of our common stock were outstanding, and we had reserved an additional 618,930 shares of our common stock for future issuance pursuant to awards granted under our 2015 Equity Incentive Plan. As of December 31, 2023, there were issued and outstanding options to purchase 465,680 shares of our common stock and 15,390 outstanding restricted stock units with respect to shares of our common stock, all of which were issued pursuant to awards under our 2015 Equity Incentive Plan. As of December 31, 2023, no other types of incentive awards were issued or outstanding under our 2015 Equity Incentive Plan. The authorized but unissued shares of our capital stock are available for future issuance without shareholder approval, unless otherwise required by applicable law or the rules of any applicable securities exchange.
The rights of our shareholders are generally covered by Texas law and our certificate of formation and bylaws (each as amended and restated and in effect as of the date hereof). The terms of our common stock are therefore subject to Texas law, including the Texas Business Organizations Code (“TBOC”), and the common and constitutional law of Texas.
Preferred Stock
Our certificate of formation authorizes us to issue 15,000,000 shares of preferred stock, par value $5.00 per share. As of December 31, 2023, we had no shares of our preferred stock outstanding.
Our certificate of formation authorizes our Board of Directors to designate the preferences, limitations and relative rights of any such series of preferred stock. Preferred stock may have voting rights, subject to applicable law and determination at issuance of our Board of Directors. While the terms of preferred stock may vary from series to series, common shareholders should assume that all shares of preferred stock will be senior to our common stock in respect of distributions and on liquidation.
Although the creation and authorization of preferred stock does not, in and of itself, have any effect on the rights of the holders of our common stock, the issuance of one or more series of preferred stock may affect the holders of common stock in a number of respects, including the following: by subordinating our common stock to the preferred stock with respect to dividend rights, liquidation preferences, and other rights, preferences, and privileges; by diluting the voting power of our common stock; by diluting the earnings per share of our common stock; and by issuing common stock, upon the conversion of the preferred stock, at a price below the fair market value or original issue price of the common stock that is outstanding prior to such issuance. Subject to the provisions of our certificate of formation and limitations prescribed by law and the rules of the Nasdaq Global Select Market, if applicable, our Board of Directors has the discretion to issue shares, establish the number of shares, change the number of shares constituting any series, and provide or change the voting powers, designations, preferences and relative rights, qualifications, limitations or restrictions on shares of our preferred stock, including dividend rights, terms of redemption, conversion rights and liquidation preferences, in each case without any action or vote by the holders of our common stock.
It is not possible to state the actual effect of the issuance of any shares of preferred stock upon the rights of holders of our common stock until such time as our Board of Directors determines the specific terms of the preferred stock.
Voting Rights
Each holder of our common stock is entitled to one vote for each share on all matters submitted to a vote of shareholders, except as otherwise required by law and subject to the rights and preferences of the holders of any outstanding shares of our preferred stock. Our certificate of formation do not provide for cumulative voting in the election of directors. Directors are elected by a majority of the votes cast, unless the number of director nominees exceeds the number of directors to be elected at the meeting, in which case directors would be elected by a plurality of the votes cast.
Dividend Rights
Subject to certain regulatory restrictions and to the rights of holders of any preferred stock that we may issue, all shares of our common stock are entitled to share equally in dividends from legally available funds, when, as, and if declared by our board of directors.
No Preemptive Rights
No holder of our common stock has a right under the TBOC, or our certificate of formation or bylaws, to purchase shares of common stock upon any future issuance.
Liquidation Rights
In the event of our liquidation, dissolution or winding up, whether voluntarily or involuntarily, the holders of our common stock would be entitled to share ratably in any of the net assets or funds which are available for distribution to shareholders, after the satisfaction of all liabilities and accrued and unpaid dividends and liquidation preferences on any outstanding preferred stock.
Modification of Rights
An amendment to our certificate of formation requires the approval of a majority of the votes entitled to be cast. Our bylaws may be amended by our board of directors or by the affirmative vote of the holders of two-thirds or more of the shares entitled to vote at a meeting of our shareholders called for such purpose.
Other Rights
Holders of our common stock have no conversion rights or other subscription rights. There are no other redemption or sinking fund provisions that are applicable to our common stock.
Action by Written Consent
Under the TBOC, no action required or permitted to be taken at an annual or special meeting of shareholders may be taken by written consent in lieu of a meeting of shareholders without the unanimous written consent of all shareholders entitled to vote on the action unless the certificate of formation specifically allows action to be taken by the written consent of shareholders holding at least the minimum number of shares necessary to take the action that is subject to that consent at a meeting of shareholders, even though the consent is not signed by all of the corporation’s shareholders. Our certificate of formation does not provide for shareholder action by less than unanimous written consent.
Certain Certificate of Formation and Bylaw Provisions Potentially Having an Anti-Takeover Effect
Certain provisions of our certificate of formation and bylaws, and the corporate and banking laws applicable to us, may be deemed to have anti-takeover effects and may delay, prevent or make more difficult unsolicited tender offers or takeover attempts that a shareholder may consider to be in his or her best interests, including those attempts that might result in a premium over the market price for the shares held by shareholders. These provisions may also have the effect of making it more difficult for third parties to cause the replacement of our current management.
Authorized but Unissued Shares. The corporate laws and regulations applicable to us enable our board of directors to issue, from time to time and at its discretion, but subject to the rules of any applicable securities exchange, any authorized but unissued shares of our common or preferred stock. Any such issuance of shares could be utilized for a variety of corporate purposes, including future offerings to raise additional capital, acquisitions and employee benefit plans. The ability of our board of directors to issue authorized but unissued shares of our common or preferred stock at its sole discretion may enable our board to sell shares to individuals or groups who the board perceives as friendly with management, which may make more difficult unsolicited attempts to obtain control of our organization. In addition, the ability of our board of directors to issue authorized but unissued shares of our capital stock at its sole discretion could deprive the shareholders of opportunities to sell their shares of common stock or preferred stock for prices higher than prevailing market prices.
Preferred Stock. Our certificate of formation contain provisions that permit our board of directors to issue, without any further vote or action by the shareholders, shares of preferred stock in one or more series and, with respect to each such series, to fix the number of shares constituting the series and the designation of the series, the voting rights (if any) of the shares of the series, and the powers, preferences and relative, participation, optional and other special rights, if any, and any qualifications, limitations or restrictions, of the shares of such series.
Board Structure and Vacancies. Our certificate of formation provides that our board of directors is divided into three classes serving staggered three year terms. In addition, our certificate of formation provides that any vacancy on the board of directors, including up to two newly created directorships, may be filled by a majority of the board of directors then in officer, even if less than a quorum. Our certificate of formation also provides that directors may be removed from office only for cause and only by the affirmative vote of the holders of a majority of the combined voting power of the then outstanding shares of stock, with all classes and series of shares entitled to vote generally in the election of directors voting together as a single class.
No Cumulative Voting. The TBOC does not permit cumulative voting in the election of directors, unless expressly provided in a corporation’s certificate of formation, and our certificate of formation does not provide for such authority.
Special Meetings of Shareholders. For a special shareholders’ meeting to be called by one or more shareholder(s), our bylaws require the request of holders of at least 50% of the outstanding shares entitled to vote at the meeting to call a special shareholders’ meeting.
Advance Notice Procedures for Director Nominations and Shareholder Proposals. Our bylaws establish an advance notice procedure with regard to business to be brought before an annual or special meeting of shareholders and with regard to the nomination of candidates for election as directors, other than by or at the direction of the board of directors. Although this procedure does not give our board of directors any power to approve or disapprove shareholder nominations for the election of directors or proposals for action, it may have the effect of precluding a contest for the election of directors or the consideration of shareholder proposals if the established procedure is not followed, and of discouraging or deterring a third party from conducting a solicitation of proxies to elect its own slate of directors or to approve its proposal without regard to whether consideration of the nominees or proposals might be harmful or beneficial to our shareholders and us.
Amending our Bylaws. Our board of directors may alter, amend or repeal our bylaws, or adopt new bylaws, without shareholder approval.
Shareholder Actions. Our certificate of formation prohibits shareholder action by less than unanimous written consent, thereby requiring virtually all actions to be taken at a meeting of the shareholders.
Exclusive Forum. Our certificate of formation provides that, subject to certain exceptions, the state courts located in Titus County, Texas shall be the sole and exclusive forum for certain shareholder litigation matters. Although we believe this provision benefits us by providing increased consistency in the application of Texas law in the types of lawsuits to which it applies and in limiting our litigation costs, the provision may have the effect of discouraging lawsuits against our directors and officers and may limit our shareholders’ ability to obtain a favorable judicial forum for disputes with us.
However, it is possible that a court could rule that this provision is unenforceable or inapplicable to a particular dispute.
Notice and Approval Requirements. Federal banking laws also impose notice, approval and ongoing regulatory requirements on any shareholder or other party that seeks to acquire direct or “indirect” control of an FDIC-insured depository institution. These laws include the Bank Holding Company Act of 1956 and the Change in Bank Control Act.
The overall effect of these provisions may be to deter a future offer or other merger or acquisition proposals that a majority of our shareholders might view to be in their best interests as the offer might include a substantial premium over the market price of our common stock at that time. In addition, these provisions may have the effect of assisting our board of directors and our management in retaining their respective positions and placing them in a better position to resist changes that the shareholders may want to make if dissatisfied with the conduct of our business.
Indemnification
Our certificate of formation provides that our directors and officers will be indemnified by us to the fullest extent permitted by the TBOC, against any and all expenses, liabilities or other matters while acting in his or her capacity as a director or officer. We have also agreed to advance expenses incurred by any such director or officer in connection with threatened, pending or completed proceeding to the fullest extent permitted by the TBOC, subject to certain conditions. To the extent that indemnification for liabilities arising under the Securities Act may be permitted to our directors, officers and controlling persons, we have been advised that, in the opinion of the SEC, this indemnification is against public policy as expressed in the Securities Act and is, therefore, unenforceable.
Limitation of Liability
Our certificate of formation also limits the personal liability of our directors and officers in actions brought on our behalf or on behalf of our shareholders for monetary damages as a result of a director’s acts or omissions while acting in a capacity as a director or officer, with certain exceptions. Our certificate of formation does not eliminate or limit our right or the right of our shareholders to seek injunctive or other equitable relief not involving monetary damages.
Transfer Agent and Registrar
Computershare Trust Company, N.A. serves as our transfer agent and registrar.
EXHIBIT 21.1
|
||
|
|
|
Subsidiaries of Guaranty Bancshares, Inc. |
|
|
Name |
|
Jurisdiction of Organization |
Guaranty Bank & Trust, N.A. |
|
United States |
Guaranty (TX) Capital Trust III |
|
Delaware |
DCB Financial Trust I |
|
Delaware |
|
|
|
Subsidiaries of Guaranty Bank & Trust, N.A. |
|
|
Name |
|
Jurisdiction of Organization |
Guaranty Company, Inc. |
|
Texas |
GB Com, Inc. |
|
Texas |
2800 South Texas Avenue, LLC |
|
Texas |
Pin Oak Realty Holdings, Inc. |
|
Texas |
Pin Oak Asset Management, LLC |
|
Texas |
Guaranty Bank & Trust Political Action Committee |
|
Texas |
Caliber Guaranty Private Account, LLC |
|
Texas |
|
|
|
Subsidiaries of Guaranty Company, Inc. |
|
|
Name |
|
Jurisdiction of Organization |
White Oak Aviation, LLC |
|
Texas |
EXHIBIT 23.1
Consent of Independent Registered Public Accounting Firm
We consent to the incorporation by reference in the Registration Statements on Form S-3 (File No. 333-261266) and Form S-8 (File No. 333-217801) of Guaranty Bancshares, Inc. of our report dated March 14, 2024, relating to the consolidated financial statements and our report dated March 14, 2024, relating to the effectiveness of internal control over financial reporting appearing in this Annual Report on Form 10-K of Guaranty Bancshares, Inc. for the year ended December 31, 2023.
/s/ Whitley Penn LLP
Plano, Texas
March 14, 2024
EXHIBIT 31.1
CERTIFICATION
I, Tyson T. Abston, certify that:
Date: March 14, 2024
/s/ Tyson T. Abston |
Tyson T. Abston |
Chairman of the Board & Chief Executive Officer |
EXHIBIT 31.2
CERTIFICATION
I, Shalene A. Jacobson, certify that:
Date: March 14, 2024
/s/ Shalene A. Jacobson |
Chief Financial Officer |
Shalene A. Jacobson |
EXHIBIT 32.1
CERTIFICATION
In connection with the Annual Report on Form 10-K of Guaranty Bancshares, Inc. (the “Company”) for the year ended December 31, 2023 (the “Report”), as filed with the Securities and Exchange Commission on the date hereof, I, Tyson T. Abston, Chairman of the Board & Chief Executive Officer of the Company, certify, pursuant to 18 U.S.C. Section 1350, as adopted pursuant to Section 906 of the Sarbanes-Oxley Act of 2002, that to the best of my knowledge:
/s/ Tyson T. Abston |
Tyson T. Abston |
Chairman of the Board & Chief Executive Officer |
Date: March 14, 2024 |
EXHIBIT 32.2
CERTIFICATION
In connection with the Annual Report on Form 10-K of Guaranty Bancshares, Inc. (the “Company”) for the year ended December 31, 2023 (the “Report”), as filed with the Securities and Exchange Commission on the date hereof, I, Shalene A. Jacobson, Chief Financial Officer of the Company, certify, pursuant to 18 U.S.C. Section 1350, as adopted pursuant to Section 906 of the Sarbanes-Oxley Act of 2002, that to the best of my knowledge:
/s/ Shalene A. Jacobson |
Shalene A. Jacobson |
Chief Financial Officer |
Date: March 14, 2024 |
EXHIBIT 97.1
GUARANTY BANCSHARES, INC.
CLAWBACK POLICY
As adopted by the Board of Directors, effective October 2, 2023
Overview
The following Clawback Policy has been adopted by the Board of Directors (the “Board of Directors” or the “Board”) of Guaranty Bancshares, Inc. (“Company”) to assist the Board of Directors in the exercise of its responsibilities. This Clawback Policy is subject to modification from time to time by the Board of Directors.
In October 2022, the SEC adopted a Final Rule, Listing Standards for Recovery of Erroneously Awarded Compensation. As a result, the New York Stock Exchange requires its publicly listed companies to adopt and disclose a related policy to address the SEC standards, which is referred to herein as a “Clawback Policy.” The Final Rule requires the Company to recover erroneously awarded incentive compensation to certain executive officers for a three year period preceding the date of an accounting restatement that would have impacted the compensation awarded to those executive officers had the accounting been reported correctly. The difference between the amount actually paid to the applicable executive officers and the amount that should have been paid to the officers will be recovered by the Company, with certain exceptions described below.
Policy Requirements and Restatement Determination
The Final Rule requires the Company to:
Under the rules, the Company is required to perform a clawback analysis when it has an accounting restatement that (1) corrects an error in previously issued financial statements that is material to the previously issued financial statements, or (2) would result in a material misstatement if the error was either corrected in the current period or left uncorrected in the current period.
The standards recognize that U.S. GAAP permits certain retrospective changes to previously issued financial statements that do not represent error corrections and, therefore, would not trigger a recovery analysis. Examples include:
Clawback Analysis
If an accounting restatement is required, the Compensation Committee of the Board of Directors will require a clawback analysis and will assign a qualified administrator of the policy to determine whether recovery of erroneously awarded incentive compensation is necessary. If the analysis determines a recovery is not required, the Company will disclose the reasons for this conclusion. The Compensation Committee, consisting entirely of independent directors, will be responsible for making the final conclusion. Documentation backing up the conclusions and calculations in the analysis will be maintained, be available to the Board of Directors and to the New York Stock Exchange as required.
The clawback analysis shall apply a well-reasoned, holistic and objective approach when assessing the error. Information will allow the Board of Directors to have an objective assessment of whether the error is material and whether there is substantial likelihood that the error would be important to a reasonable investor. If the Company determines that the accounting restatement requires clawback of previously awarded compensation, the Company shall disclose:
If recovery is determined to be impracticable and will not be pursued, the Company is required to disclose the amount of recovery forgone, and to describe why recovery is impracticable under one of the limited exceptions below.
Limited exceptions to the mandatory clawback requirements include situations where:
The Final Rule defines “incentive-based compensation” as “any compensation that is granted, earned or vested based wholly or in part upon the attainment of any financial reporting measure.” As a result, the guidance applies, but is not limited, to:
Executive Officers
The Board of Directors has defined executive officers under the scope of this Policy to be those current and former executive officers as defined under Section 16 of the Securities and Exchange Act of 1934.
[End of Policy]