UNITED STATES
SECURITIES AND EXCHANGE COMMISSION
Washington, D.C. 20549
FORM 8-K
|
CURRENT REPORT Pursuant to Section 13 or 15(d) of the Securities Exchange Act of 1934
Date of report (Date of earliest event reported): March 13, 2024
QUEST RESOURCE HOLDING CORPORATION |
(Exact Name of Registrant as Specified in Its Charter) |
Nevada |
|
001-36451 |
|
51-0665952 |
(State or other Jurisdiction of Incorporation) |
|
(Commission File Number) |
|
(IRS Employer Identification No.) |
3481 Plano Parkway, The Colony, Texas |
|
75056 |
(Address of Principal Executive Offices) |
|
(Zip Code) |
Registrant’s telephone number, including area code: (972) 464-0004
|
(Former name or former address if changed since last report) |
Check the appropriate box below if the Form 8-K filing is intended to simultaneously satisfy the filing obligation of the registrant under any of the follow provisions:
☐ Written communications pursuant to Rule 425 under the Securities Act (17 CFR 230.425)
☐ Soliciting material pursuant to Rule 14a-12 under the Exchange Act (17 CFR 240.14a-12)
☐ Pre-commencement communications pursuant to Rule 14d-2(b) under the Exchange Act (17 CFR 240.14d-2(b))
☐ Pre-commencement communications pursuant to Rule 13e-4(c) under the Exchange Act (17 CFR 240.13e-4(c))
Securities registered pursuant to Section 12(b) of the Act:
Title of each class |
Trading Symbol(s) |
Name of each exchange on which registered |
Common Stock, $0.001 par value |
QRHC |
The NASDAQ Stock Market LLC |
Indicate by check mark whether the registrant is an emerging growth company as defined in Rule 405 of the Securities Act of 1933 (§230.405 of this chapter) or Rule 12b-2 of the Securities Exchange Act of 1934 (§240.12b-2 of this chapter).
Emerging growth company ☐
If an emerging growth company, indicate by check mark if the registrant has elected not to use the extended transition period for complying with any new or revised financial accounting standards provided pursuant to Section 13(a) of the Exchange Act. ☐
Item 7.01 Regulation FD Disclosure.
We are furnishing this Current Report on Form 8-K in connection with the disclosure of information, in the form of the textual information from a presentation to be given at meetings with investors. This information may be amended or updated at any time and from time to time through another Form 8-K, a later company filing, or other means. The presentation attached as Exhibit 99.1 to this Current Report on Form 8-K updates and replaces in its entirety all prior presentations filed by us, including the presentation filed as Exhibit 99.1 to the Current Report on Form 8-K dated August 18, 2022 which was filed with the Securities and Exchange Commission on August 18, 2022.
The information in this Current Report on Form 8-K (including the exhibit) is furnished pursuant to Item 7.01 and shall not be deemed to be “filed” for the purpose of Section 18 of the Securities Exchange Act of 1934, as amended, or otherwise subject to the liabilities of that section. This Current Report on Form 8-K will not be deemed an admission as to the materiality of any information in the Report that is required to be disclosed solely by Regulation FD.
We do not have, and expressly disclaim, any obligation to release publicly any updates or any changes in our expectations or any change in events, conditions, or circumstances on which any forward-looking statement is based.
The text included with this Current Report on Form 8-K is available on our website located at http://investors.qrhc.com/, although we reserve the right to discontinue that availability at any time.
Item 9.01. Financial Statements and Exhibits.
(d) Exhibits.
Exhibit No. |
Description |
99.1 |
Quest Resource Holding Corporation Investor Presentation Dated March 2024 |
104 |
Cover Page Interactive Data File (embedded within the Inline XBRL document) |
SIGNATURES
Pursuant to the requirements of the Securities Exchange Act of 1934, the registrant has duly caused this report to be signed on its behalf by the undersigned hereunto duly authorized.
|
QUEST RESOURCE HOLDING CORPORATION |
|
||
|
|
|
||
|
|
|
|
|
Dated: March 13, 2024 |
By: |
/s/ S. Ray Hatch |
|
|
|
|
Name: |
S. Ray Hatch |
|
|
|
Title: |
President and Chief Executive Officer |
|
© 2022 Quest Resource Holding Corporation. Copying, publication or redistribution outside of Quest is strictly prohibited. Quest Resource Holding Corporation (NASDAQ: QRHC) INVESTOR PRESENTATION March NATIONAL PROVIDER OF WASTE & RECYCLING SOLUTIONS 2024 Exhibit 99.1
The statements contained in this Investor Presentation that are not purely historical are forward-looking statements within the meaning of Section 27A of the Securities Act of 1933, as amended, and Section 21E of the Securities Exchange Act of 1934, as amended. All statements other than statements of historical facts contained in this Investor Presentation, including statements regarding our future operating results, future financial position, business strategy, objectives, goals, plans, prospects, and markets, and plans and objectives for future operations, are forward-looking statements. In some cases, you can identify forward-looking statements by terms such as "anticipates," "believes," "estimates," "expects," "intends," " targets," "contemplates," "projects," "predicts," "may," "might," "plan," "will," "would," "should," "could, "can," "potential,” “continue," "objective," or the negative of those terms, or similar expressions intended to identify forward-looking statements. However, not all forward-looking statements contain these identifying words. Specific forward-looking statements in this Investor Presentation include our belief that we turn our Clients' sustainability strategies into financial gains and competitive strength; our belief that we are poised to achieve significant margin improvement; and our growth strategy. All forward-looking statements included herein are based on information available to us as of the date hereof and speak only as of such date. Except as required by law, we undertake no obligation to update any forward-looking statements to reflect events or circumstances after the date of such statements. The forward-looking statements contained in this Investor Presentation reflect our views as of the date of this Investor Presentation about future events and are subject to risks, uncertainties, assumptions, and changes in circumstances that may cause our actual results, performance, or achievements to differ significantly from those expressed or implied in any forward-looking statement. Although we believe that the expectations reflected in the forward-looking statements are reasonable, we cannot guarantee future events, results, performance, or achievements. A number of factors could cause actual results to differ materially from those indicated by the forward-looking statements, including competition in the environmental services industry, the impact of the current economic environment, and other factors detailed from time to time in our reports to the Securities and Exchange Commission, including our Annual Report on Form 10-K for the fiscal year ended December 31, 2023. Certain information contained in this material is made available to Quest Resource Holding Corporation by third parties. Quest Resource Holding Corporation is not responsible for the content of any information made available to it by any third party. Quest Resource Holding Corporation disclaims any liability to any person for any delays, inaccuracies, errors, omissions, or defects in any such information or the transmission thereof, or for any actions taken by any person in reliance on such information or any damages arising from or relating to any use of such information. Information prepared by Quest Resource Holding Corporation that is included in this material speaks only as of the date that it was prepared. This information may be incomplete or may have become out of date. Quest Resource Holding Corporation makes no commitment and disclaims any duty, to update or revise such information. Reconciliation of U.S. GAAP to Non-GAAP Financial Measures In this Investor Presentation, non-GAAP financial measures, "Adjusted EBITDA," and “Adjusted Net Income,” are presented. From time-to-time, Quest considers and uses these supplemental measures of operating performance in order to provide an improved understanding of underlying performance trends. Quest believes it is useful to review, as applicable, both (1) GAAP measures that include (i) depreciation and amortization, (ii) interest expense, (iii) stock-based compensation expense, (iv) income tax expense, and (v) certain other adjustments, and (2) non-GAAP measures that exclude such items. Quest presents these non-GAAP measures because it considers it an important supplemental measure of Quest's performance. Quest's definition of this adjusted financial measure may differ from similarly named measures used by others. Quest believes these measures facilitate operating performance comparisons from period to period by eliminating potential differences caused by the existence and timing of certain expense items that would not otherwise be apparent on a GAAP basis. These non-GAAP measures have limitations as an analytical tool and should not be considered in isolation or as a substitute for the Company's GAAP measures. (See attached tables "Reconciliation of Net Income (Loss) to Adjusted EBITDA" and “Reconciliation of Adjusted Net Income Per Share”). *Adjusted EBITDA and Adjusted Net Income are Non-GAAP terms. SEC SAFE HARBOR © 2024 Quest Resource Holding Corporation. Copying, publishing or redistributing outside of Quest is strictly prohibited.
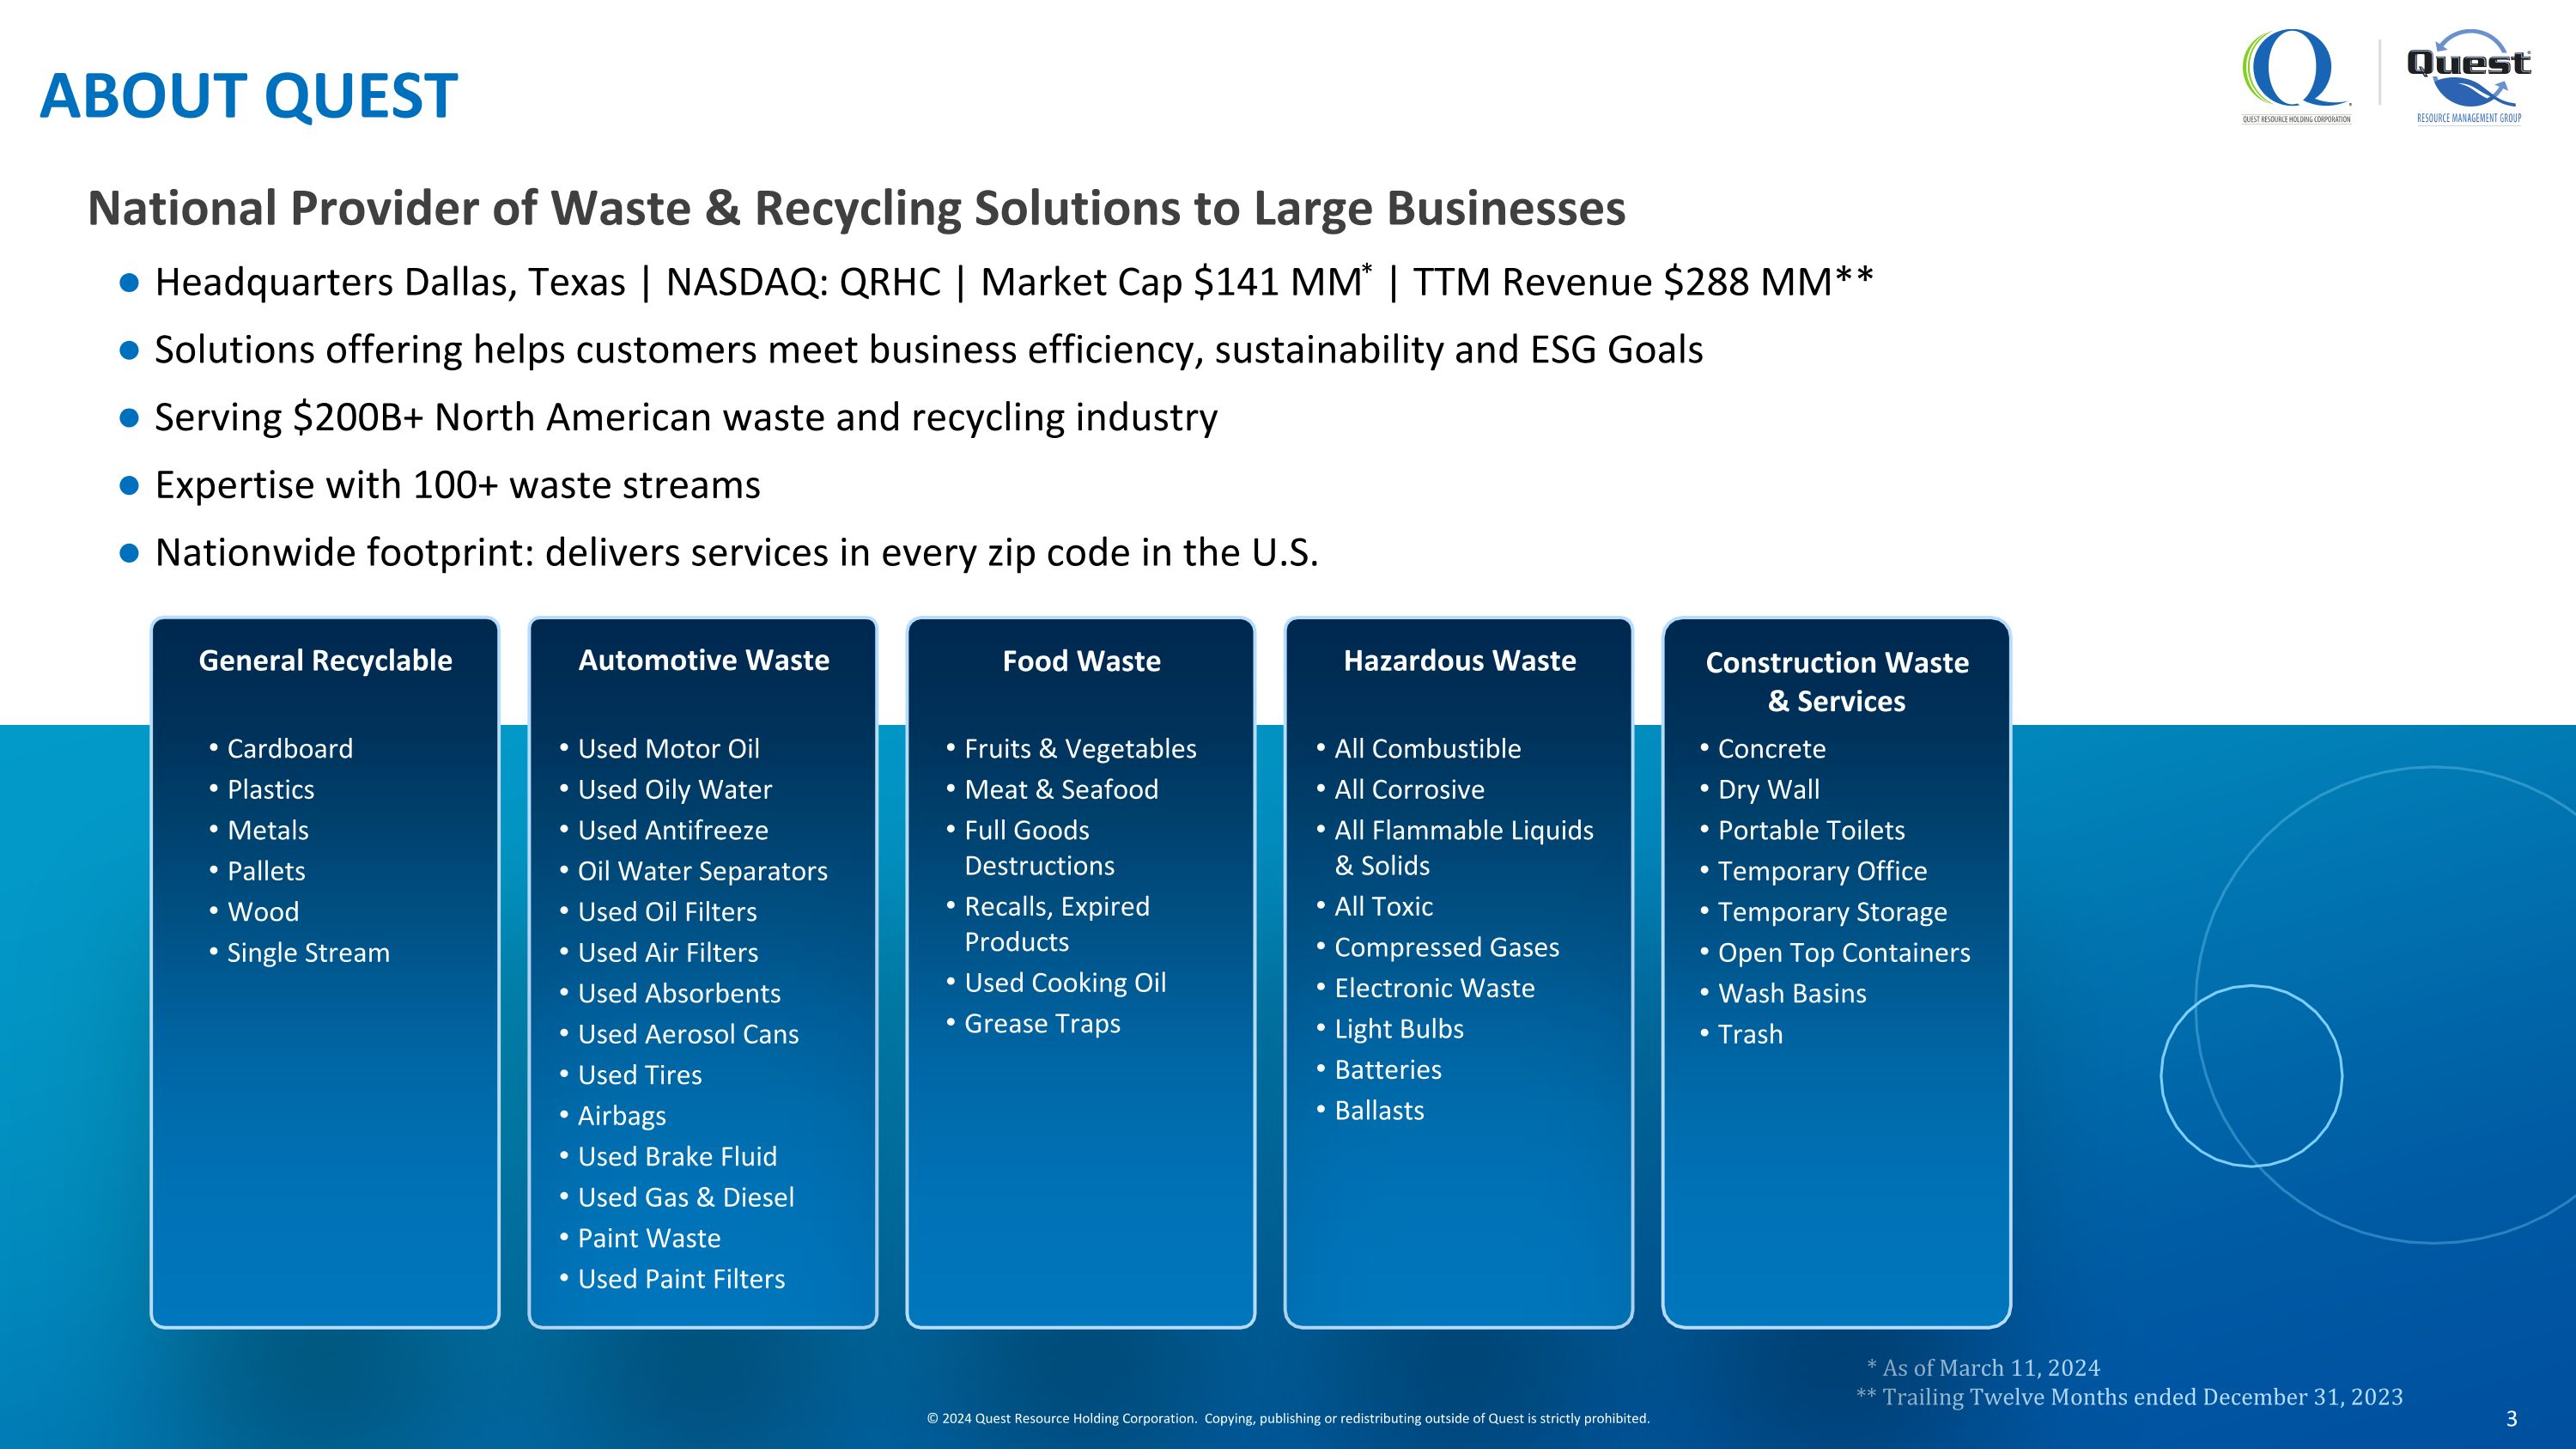
ABOUT QUEST National Provider of Waste & Recycling Solutions to Large Businesses Headquarters Dallas, Texas | NASDAQ: QRHC | Market Cap $141 MM * | TTM Revenue $288 MM** Solutions offering helps customers meet business efficiency, sustainability and ESG Goals Serving $200B+ North American waste and recycling industry Expertise with 100+ waste streams Nationwide footprint: delivers services in every zip code in the U.S. * As of March 11, 2024 ** Trailing Twelve Months ended December 31, 2023 Hazardous Waste All Combustible All Corrosive All Flammable Liquids & Solids All Toxic Compressed Gases Electronic Waste Light Bulbs Batteries Ballasts Automotive Waste Used Motor Oil Used Oily Water Used Antifreeze Oil Water Separators Used Oil Filters Used Air Filters Used Absorbents Used Aerosol Cans Used Tires Airbags Used Brake Fluid Used Gas & Diesel Paint Waste Used Paint Filters Food Waste Fruits & Vegetables Meat & Seafood Full Goods Destructions Recalls, Expired Products Used Cooking Oil Grease Traps Construction Waste & Services Concrete Dry Wall Portable Toilets Temporary Office Temporary Storage Open Top Containers Wash Basins Trash General Recyclable Cardboard Plastics Metals Pallets Wood Single Stream © 2024 Quest Resource Holding Corporation. Copying, publishing or redistributing outside of Quest is strictly prohibited.
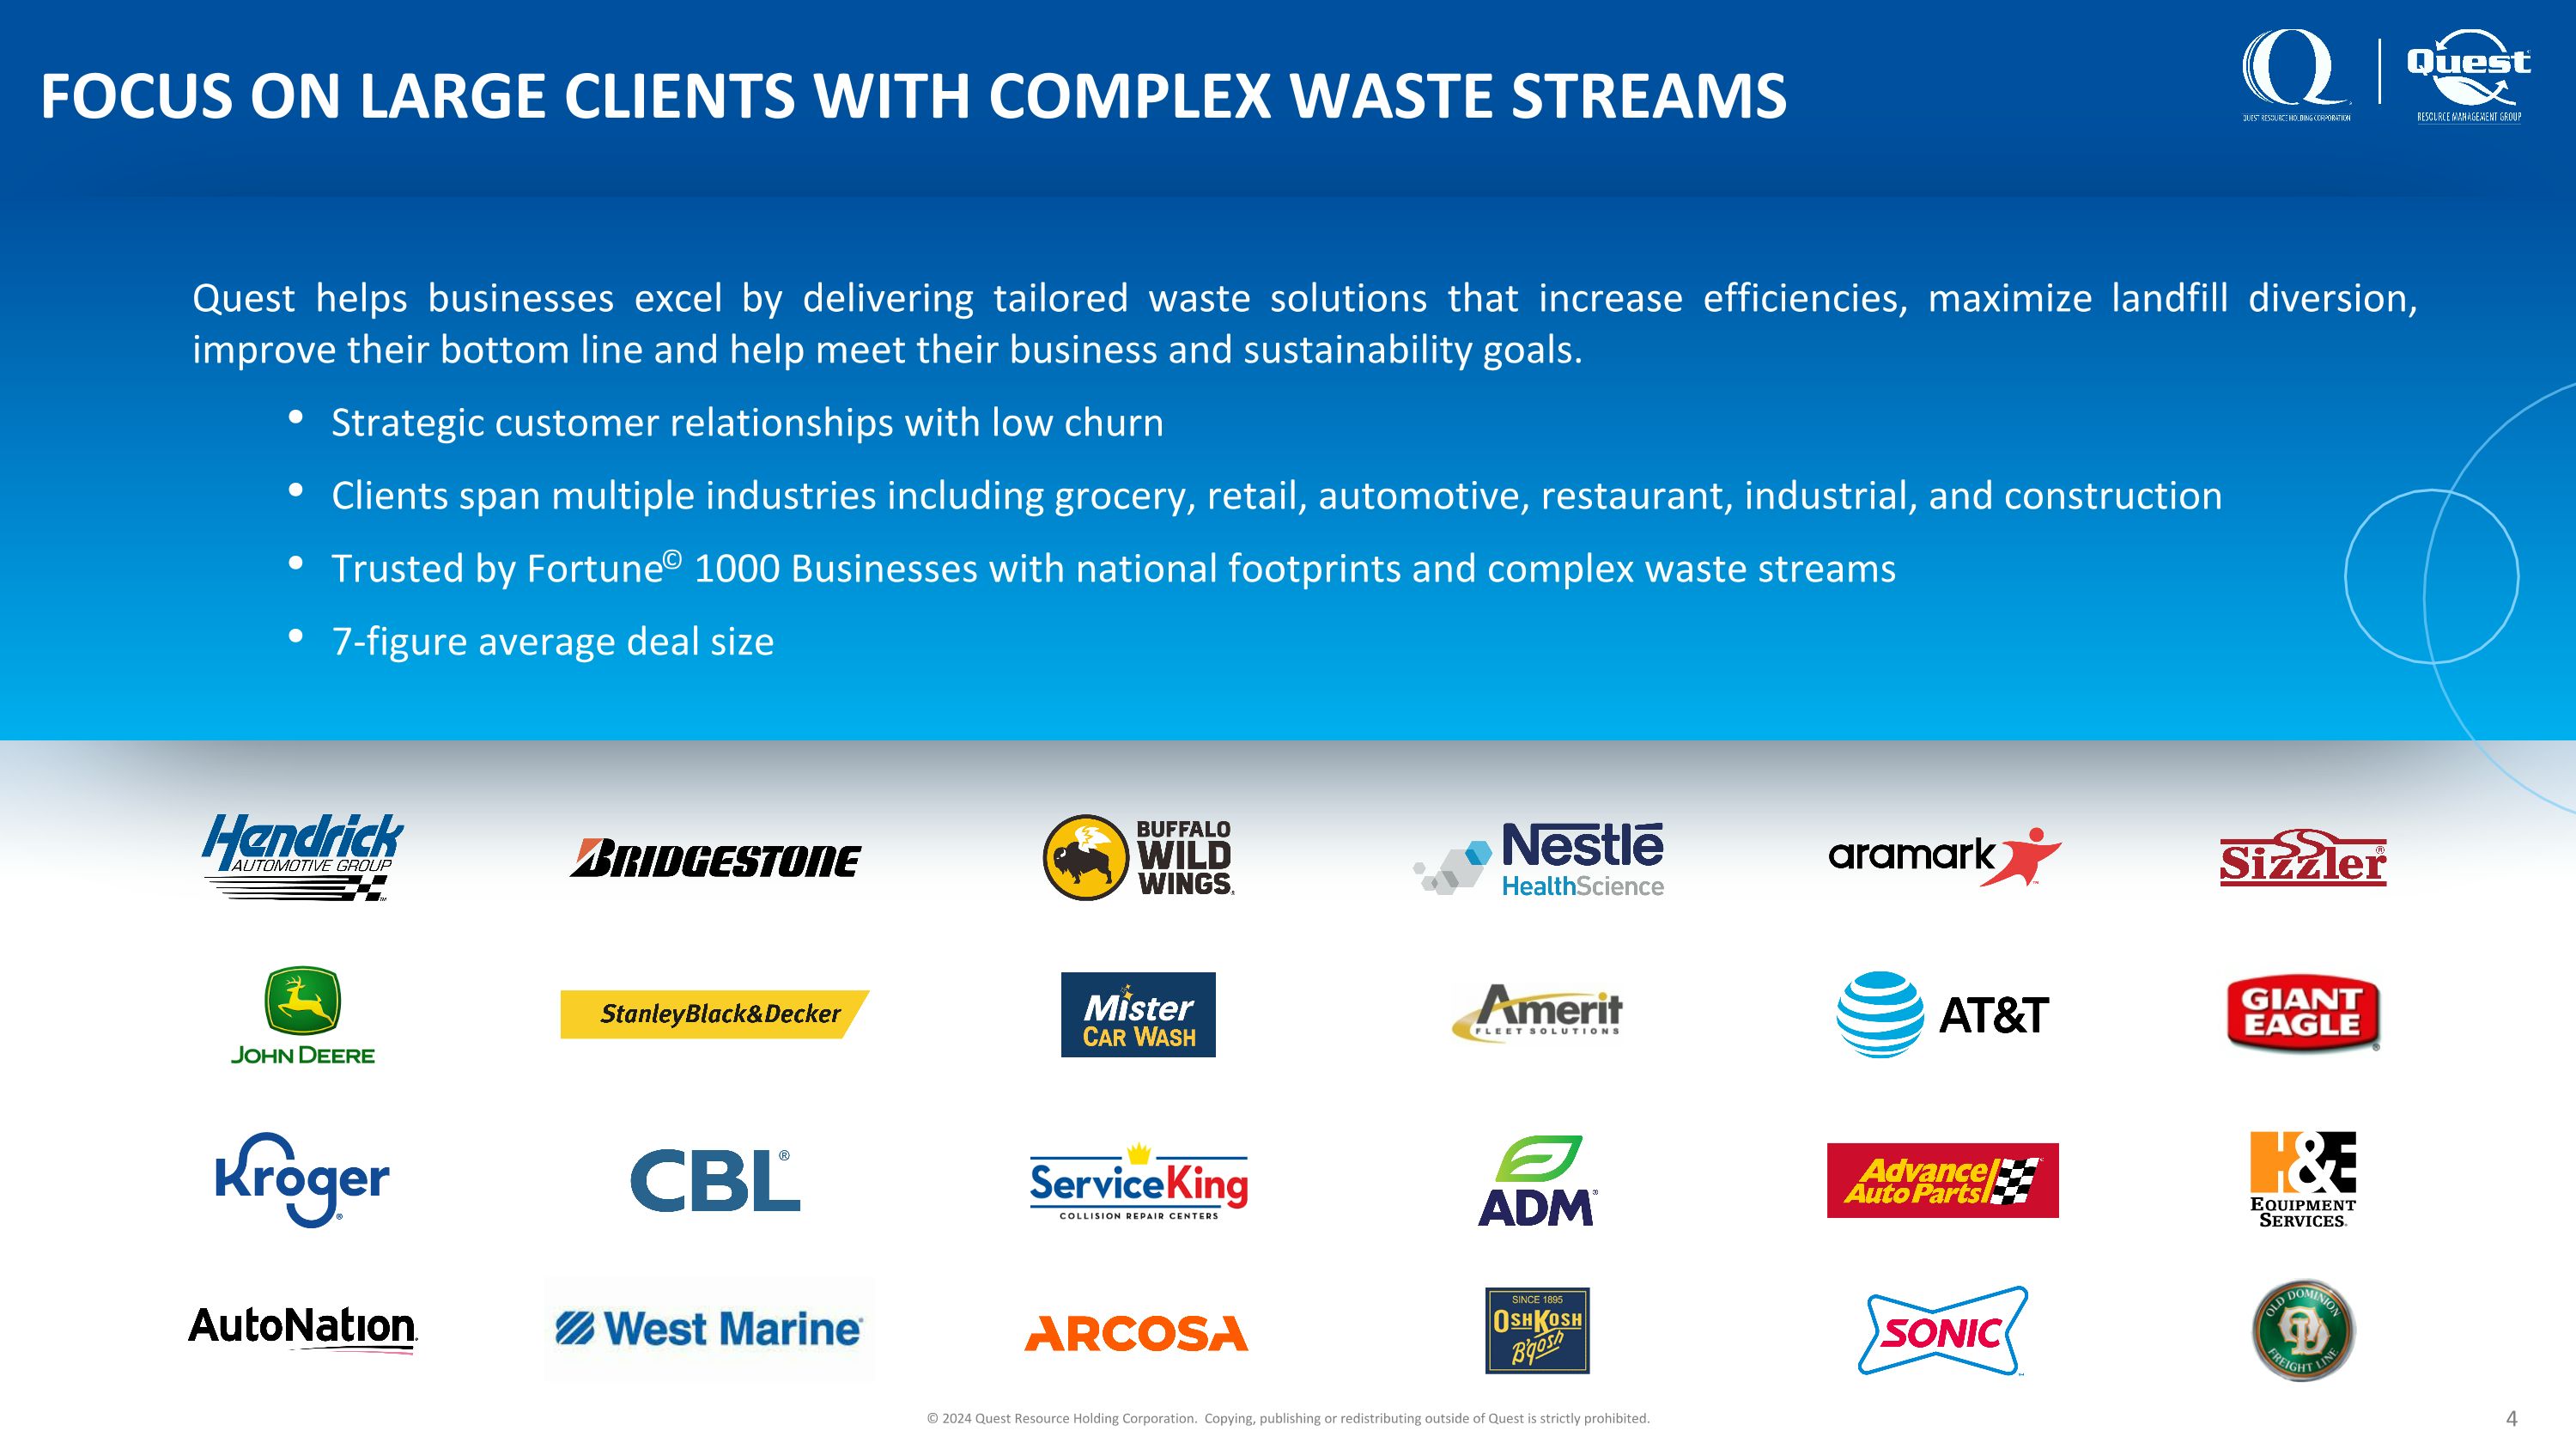
Quest helps businesses excel by delivering tailored waste solutions that increase efficiencies, maximize landfill diversion, improve their bottom line and help meet their business and sustainability goals. Strategic customer relationships with low churn Clients span multiple industries including grocery, retail, automotive, restaurant, industrial, and construction Trusted by Fortune© 1000 Businesses with national footprints and complex waste streams 7-figure average deal size FOCUS ON LARGE CLIENTS WITH COMPLEX WASTE STREAMS © 2024 Quest Resource Holding Corporation. Copying, publishing or redistributing outside of Quest is strictly prohibited.
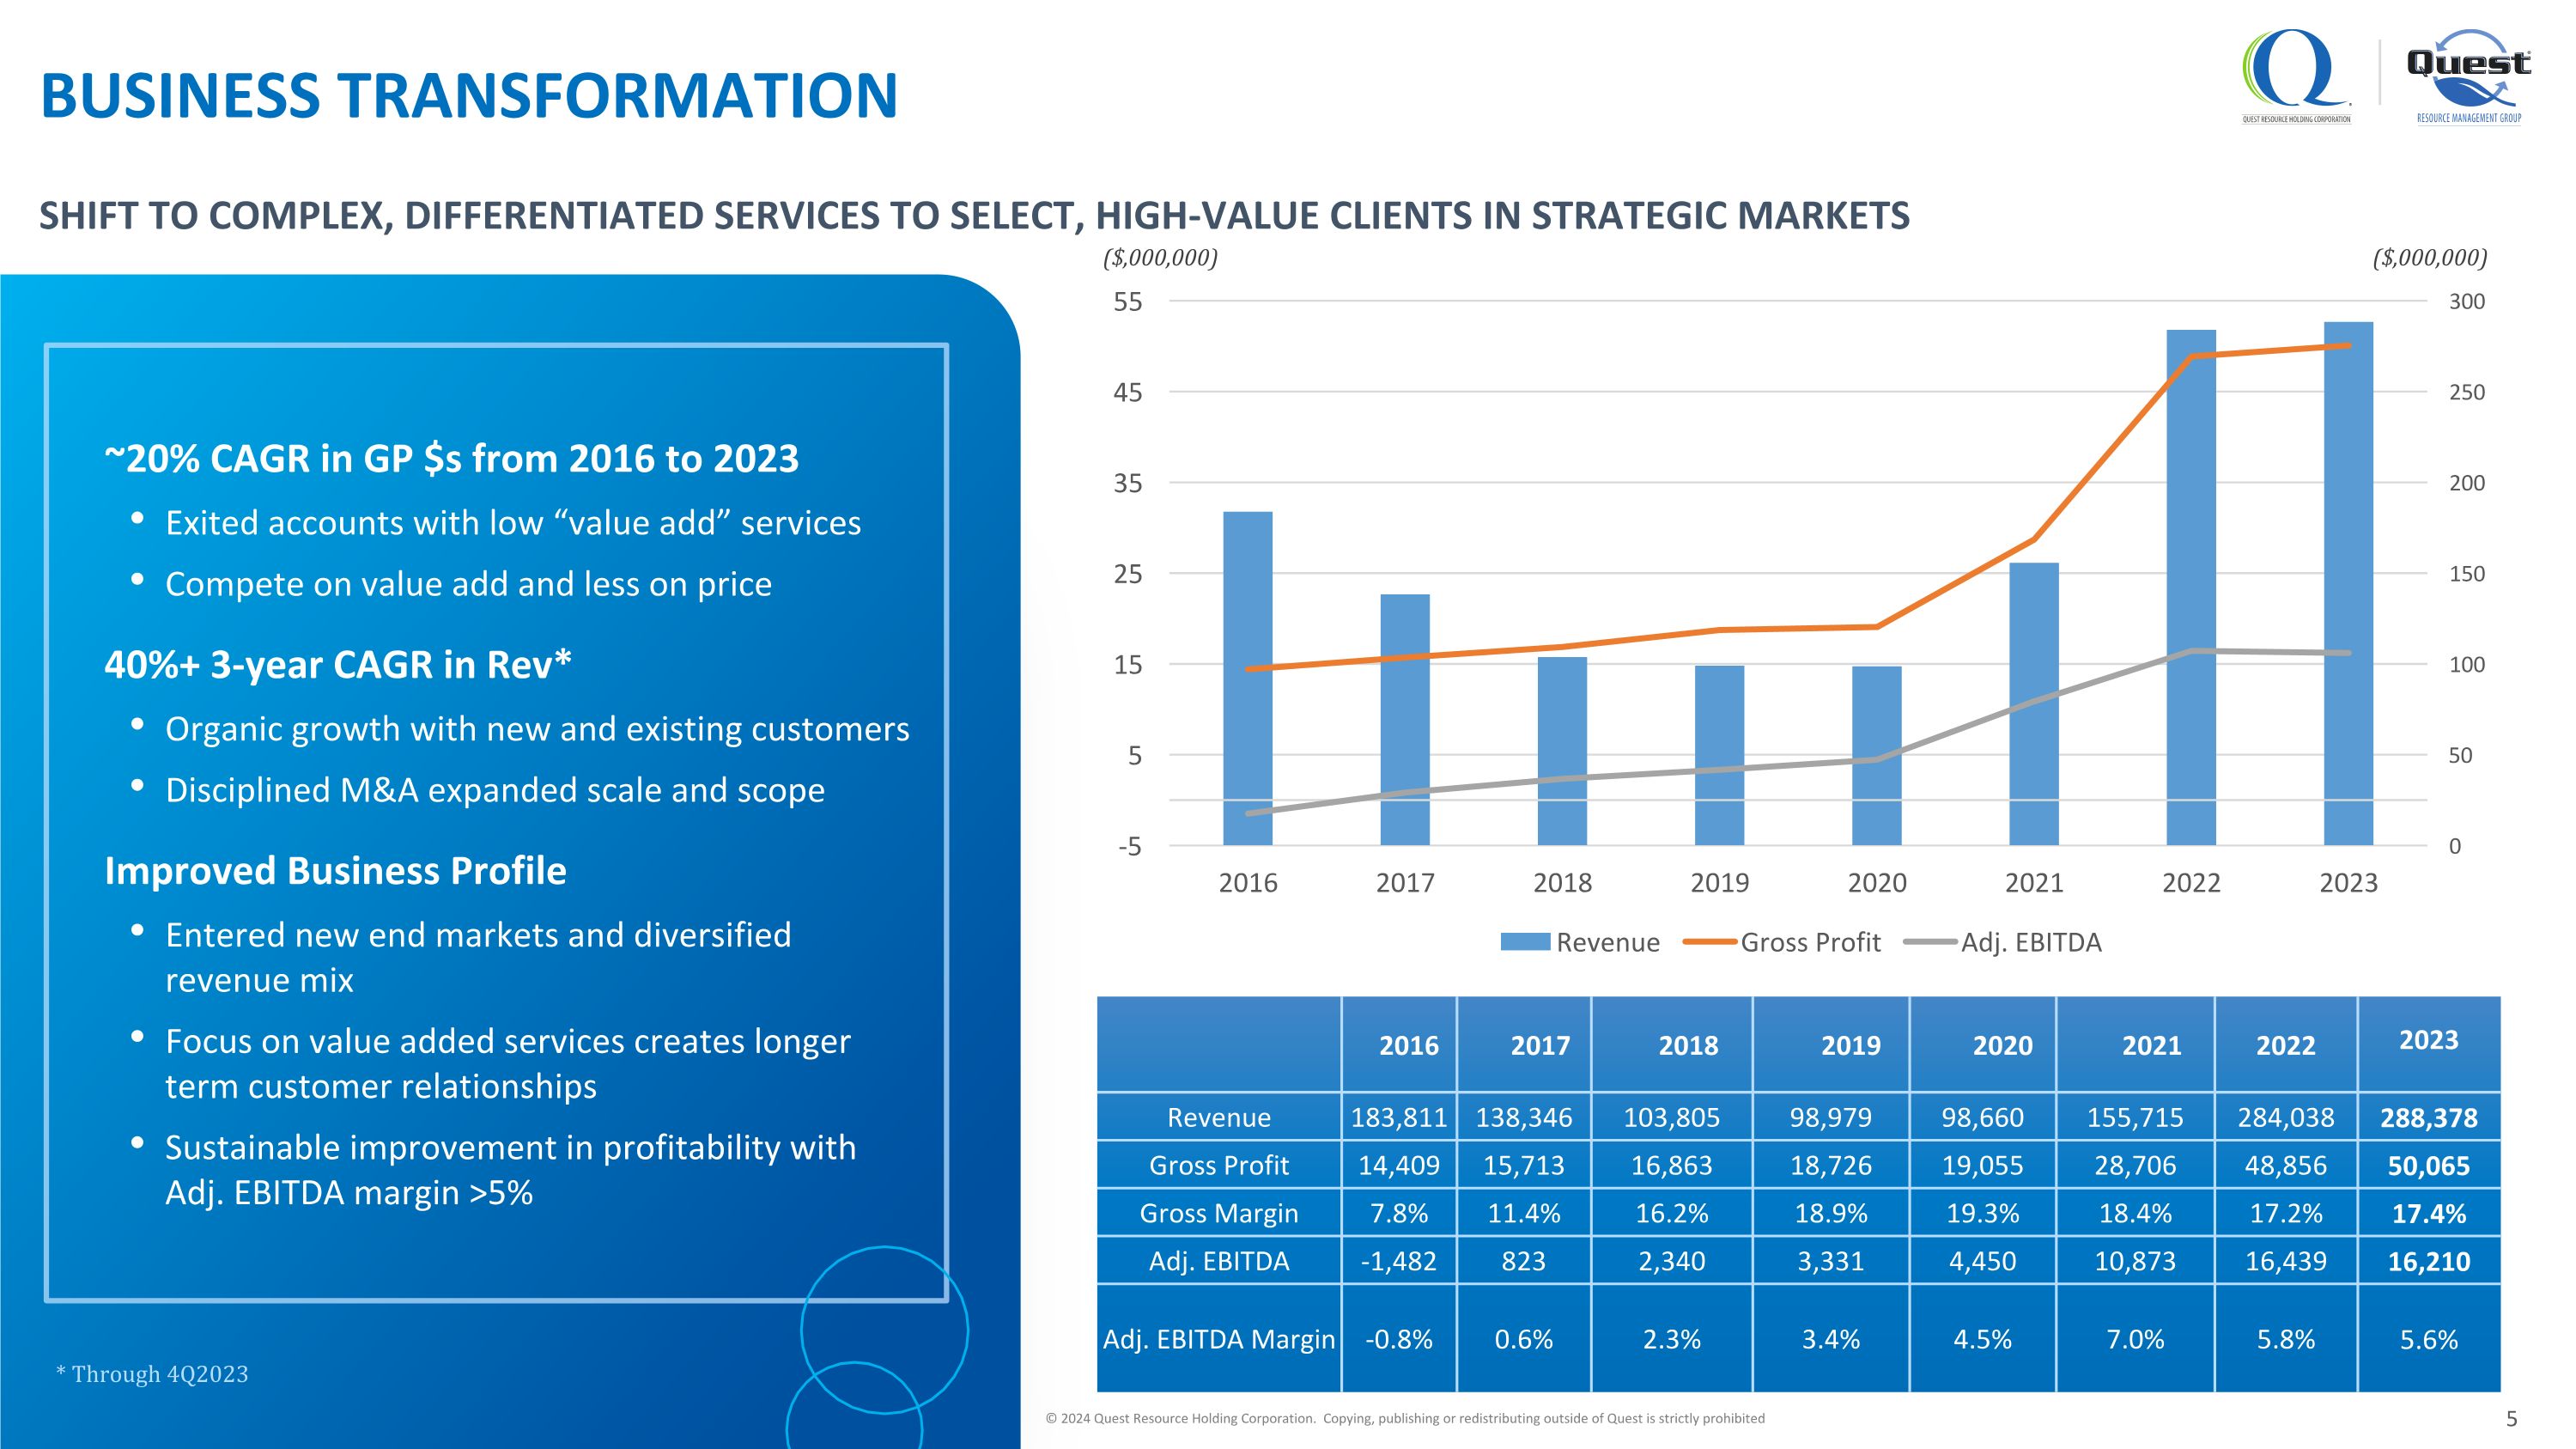
© 2024 Quest Resource Holding Corporation. Copying, publishing or redistributing outside of Quest is strictly prohibited SHIFT TO COMPLEX, DIFFERENTIATED SERVICES TO SELECT, HIGH-VALUE CLIENTS IN STRATEGIC MARKETS ~20% CAGR in GP $s from 2016 to 2023 Exited accounts with low “value add” services Compete on value add and less on price 40%+ 3-year CAGR in Rev* Organic growth with new and existing customers Disciplined M&A expanded scale and scope Improved Business Profile Entered new end markets and diversified revenue mix Focus on value added services creates longer term customer relationships Sustainable improvement in profitability with Adj. EBITDA margin >5% BUSINESS TRANSFORMATION 2016 2017 2018 2019 2020 2021 2022 2023 Revenue 183,811 138,346 103,805 98,979 98,660 155,715 284,038 288,378 Gross Profit 14,409 15,713 16,863 18,726 19,055 28,706 48,856 50,065 Gross Margin 7.8% 11.4% 16.2% 18.9% 19.3% 18.4% 17.2% 17.4% Adj. EBITDA -1,482 823 2,340 3,331 4,450 10,873 16,439 16,210 Adj. EBITDA Margin -0.8% 0.6% 2.3% 3.4% 4.5% 7.0% 5.8% 5.6% ($,000,000) ($,000,000) * Through 4Q2023
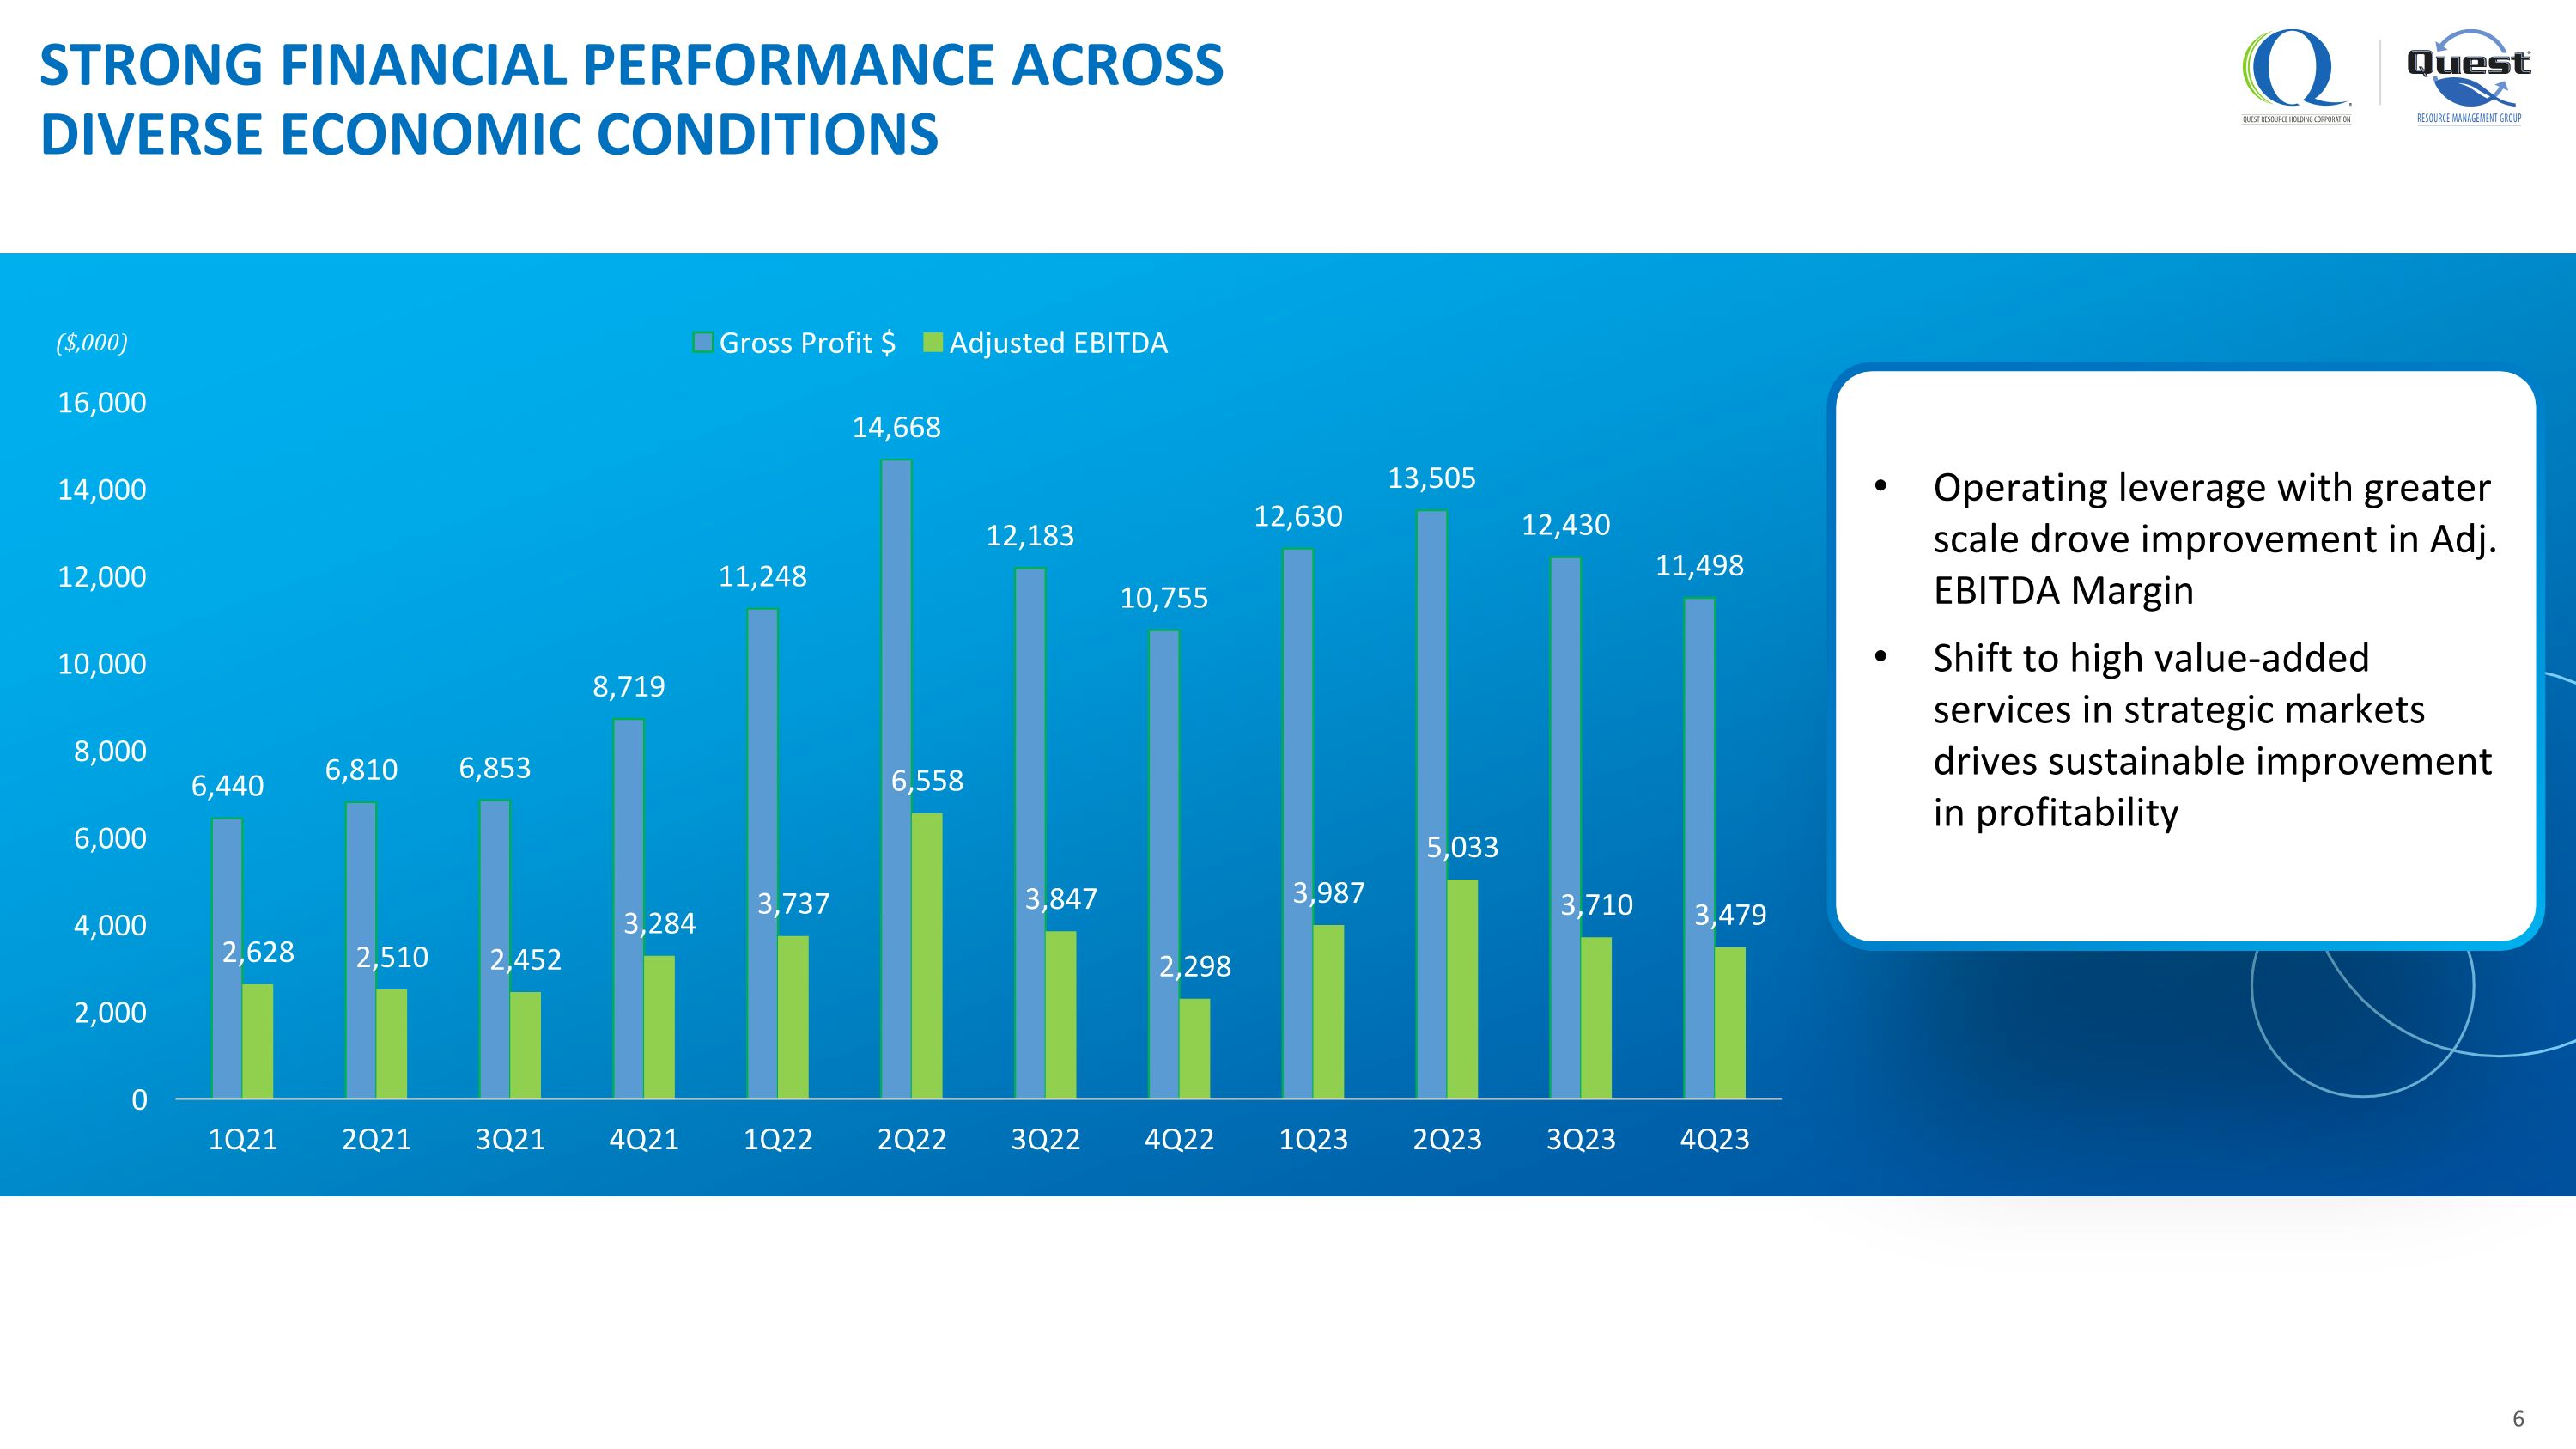
© 2022 Quest Resource Holding Corporation. Copying, publication or redistribution outside of Quest is strictly prohibited. STRONG FINANCIAL PERFORMANCE ACROSS DIVERSE ECONOMIC CONDITIONS ($,000) Operating leverage with greater scale drove improvement in Adj. EBITDA Margin Shift to high value-added services in strategic markets drives sustainable improvement in profitability 6
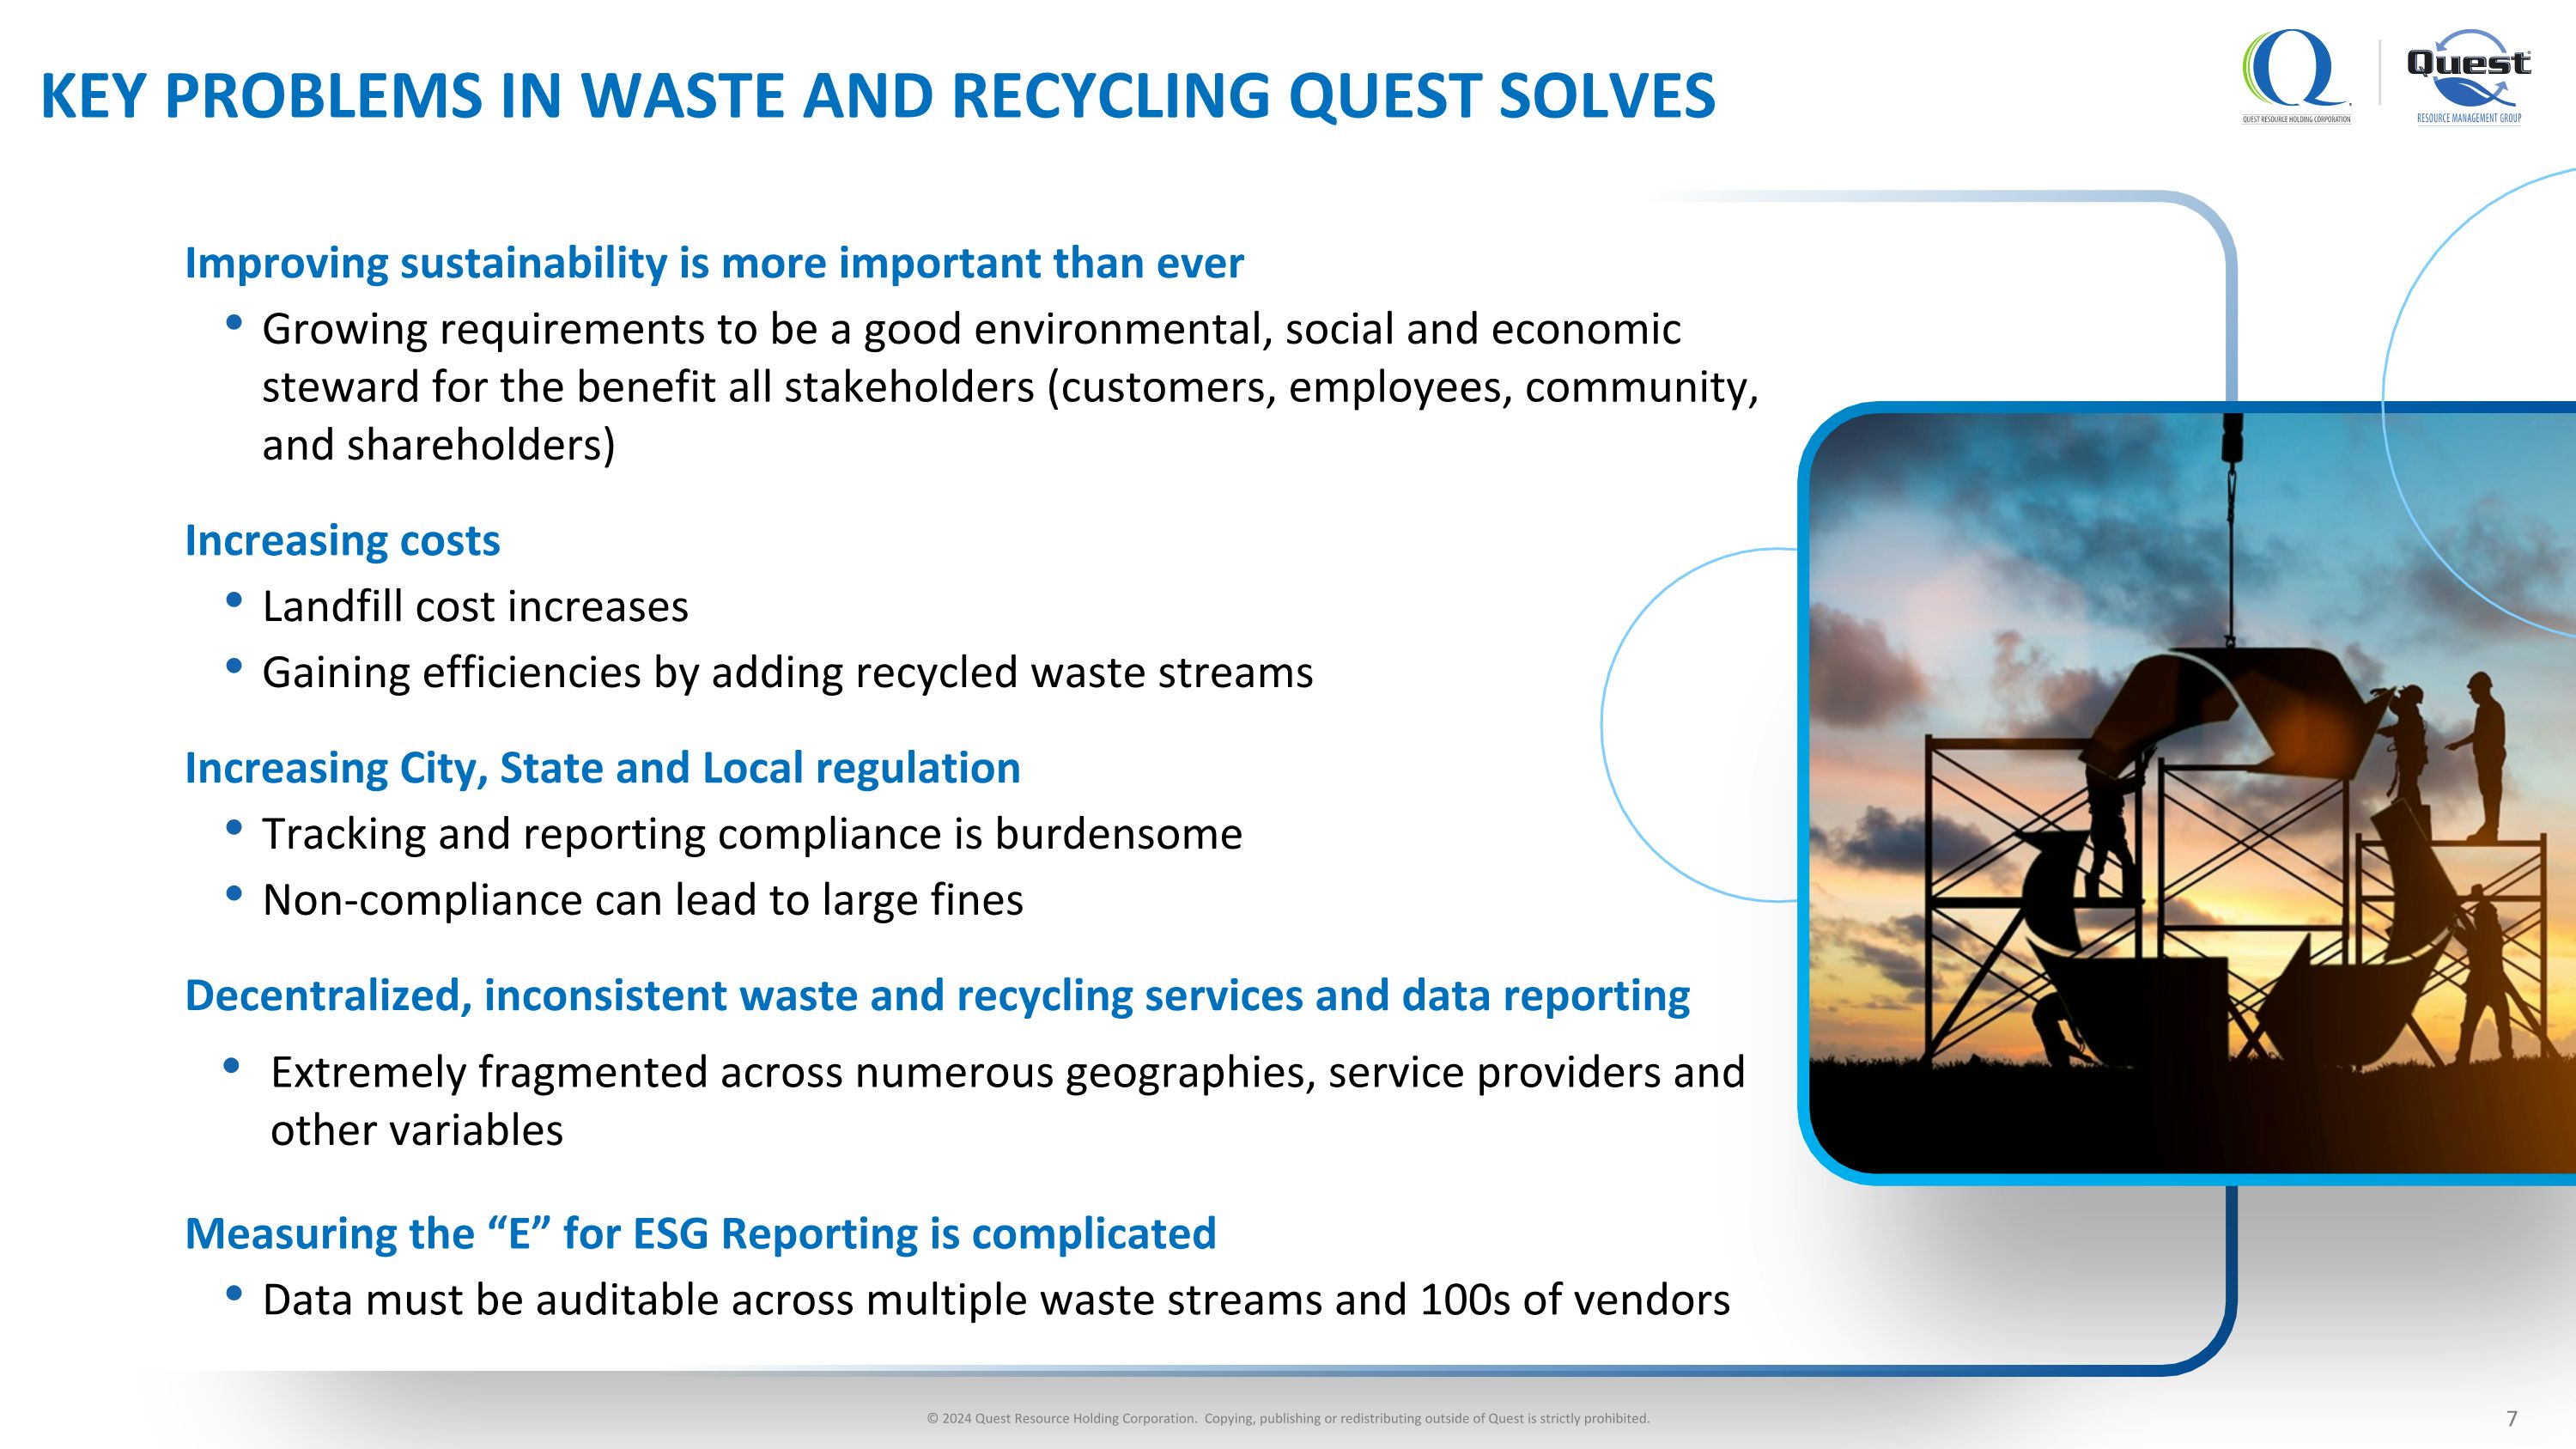
Improving sustainability is more important than ever Growing requirements to be a good environmental, social and economic steward for the benefit all stakeholders (customers, employees, community, and shareholders) Increasing costs Landfill cost increases Gaining efficiencies by adding recycled waste streams Increasing City, State and Local regulation Tracking and reporting compliance is burdensome Non-compliance can lead to large fines Decentralized, inconsistent waste and recycling services and data reporting Extremely fragmented across numerous geographies, service providers and other variables Measuring the “E” for ESG Reporting is complicated Data must be auditable across multiple waste streams and 100s of vendors KEY PROBLEMS IN WASTE AND RECYCLING QUEST SOLVES © 2024 Quest Resource Holding Corporation. Copying, publishing or redistributing outside of Quest is strictly prohibited.
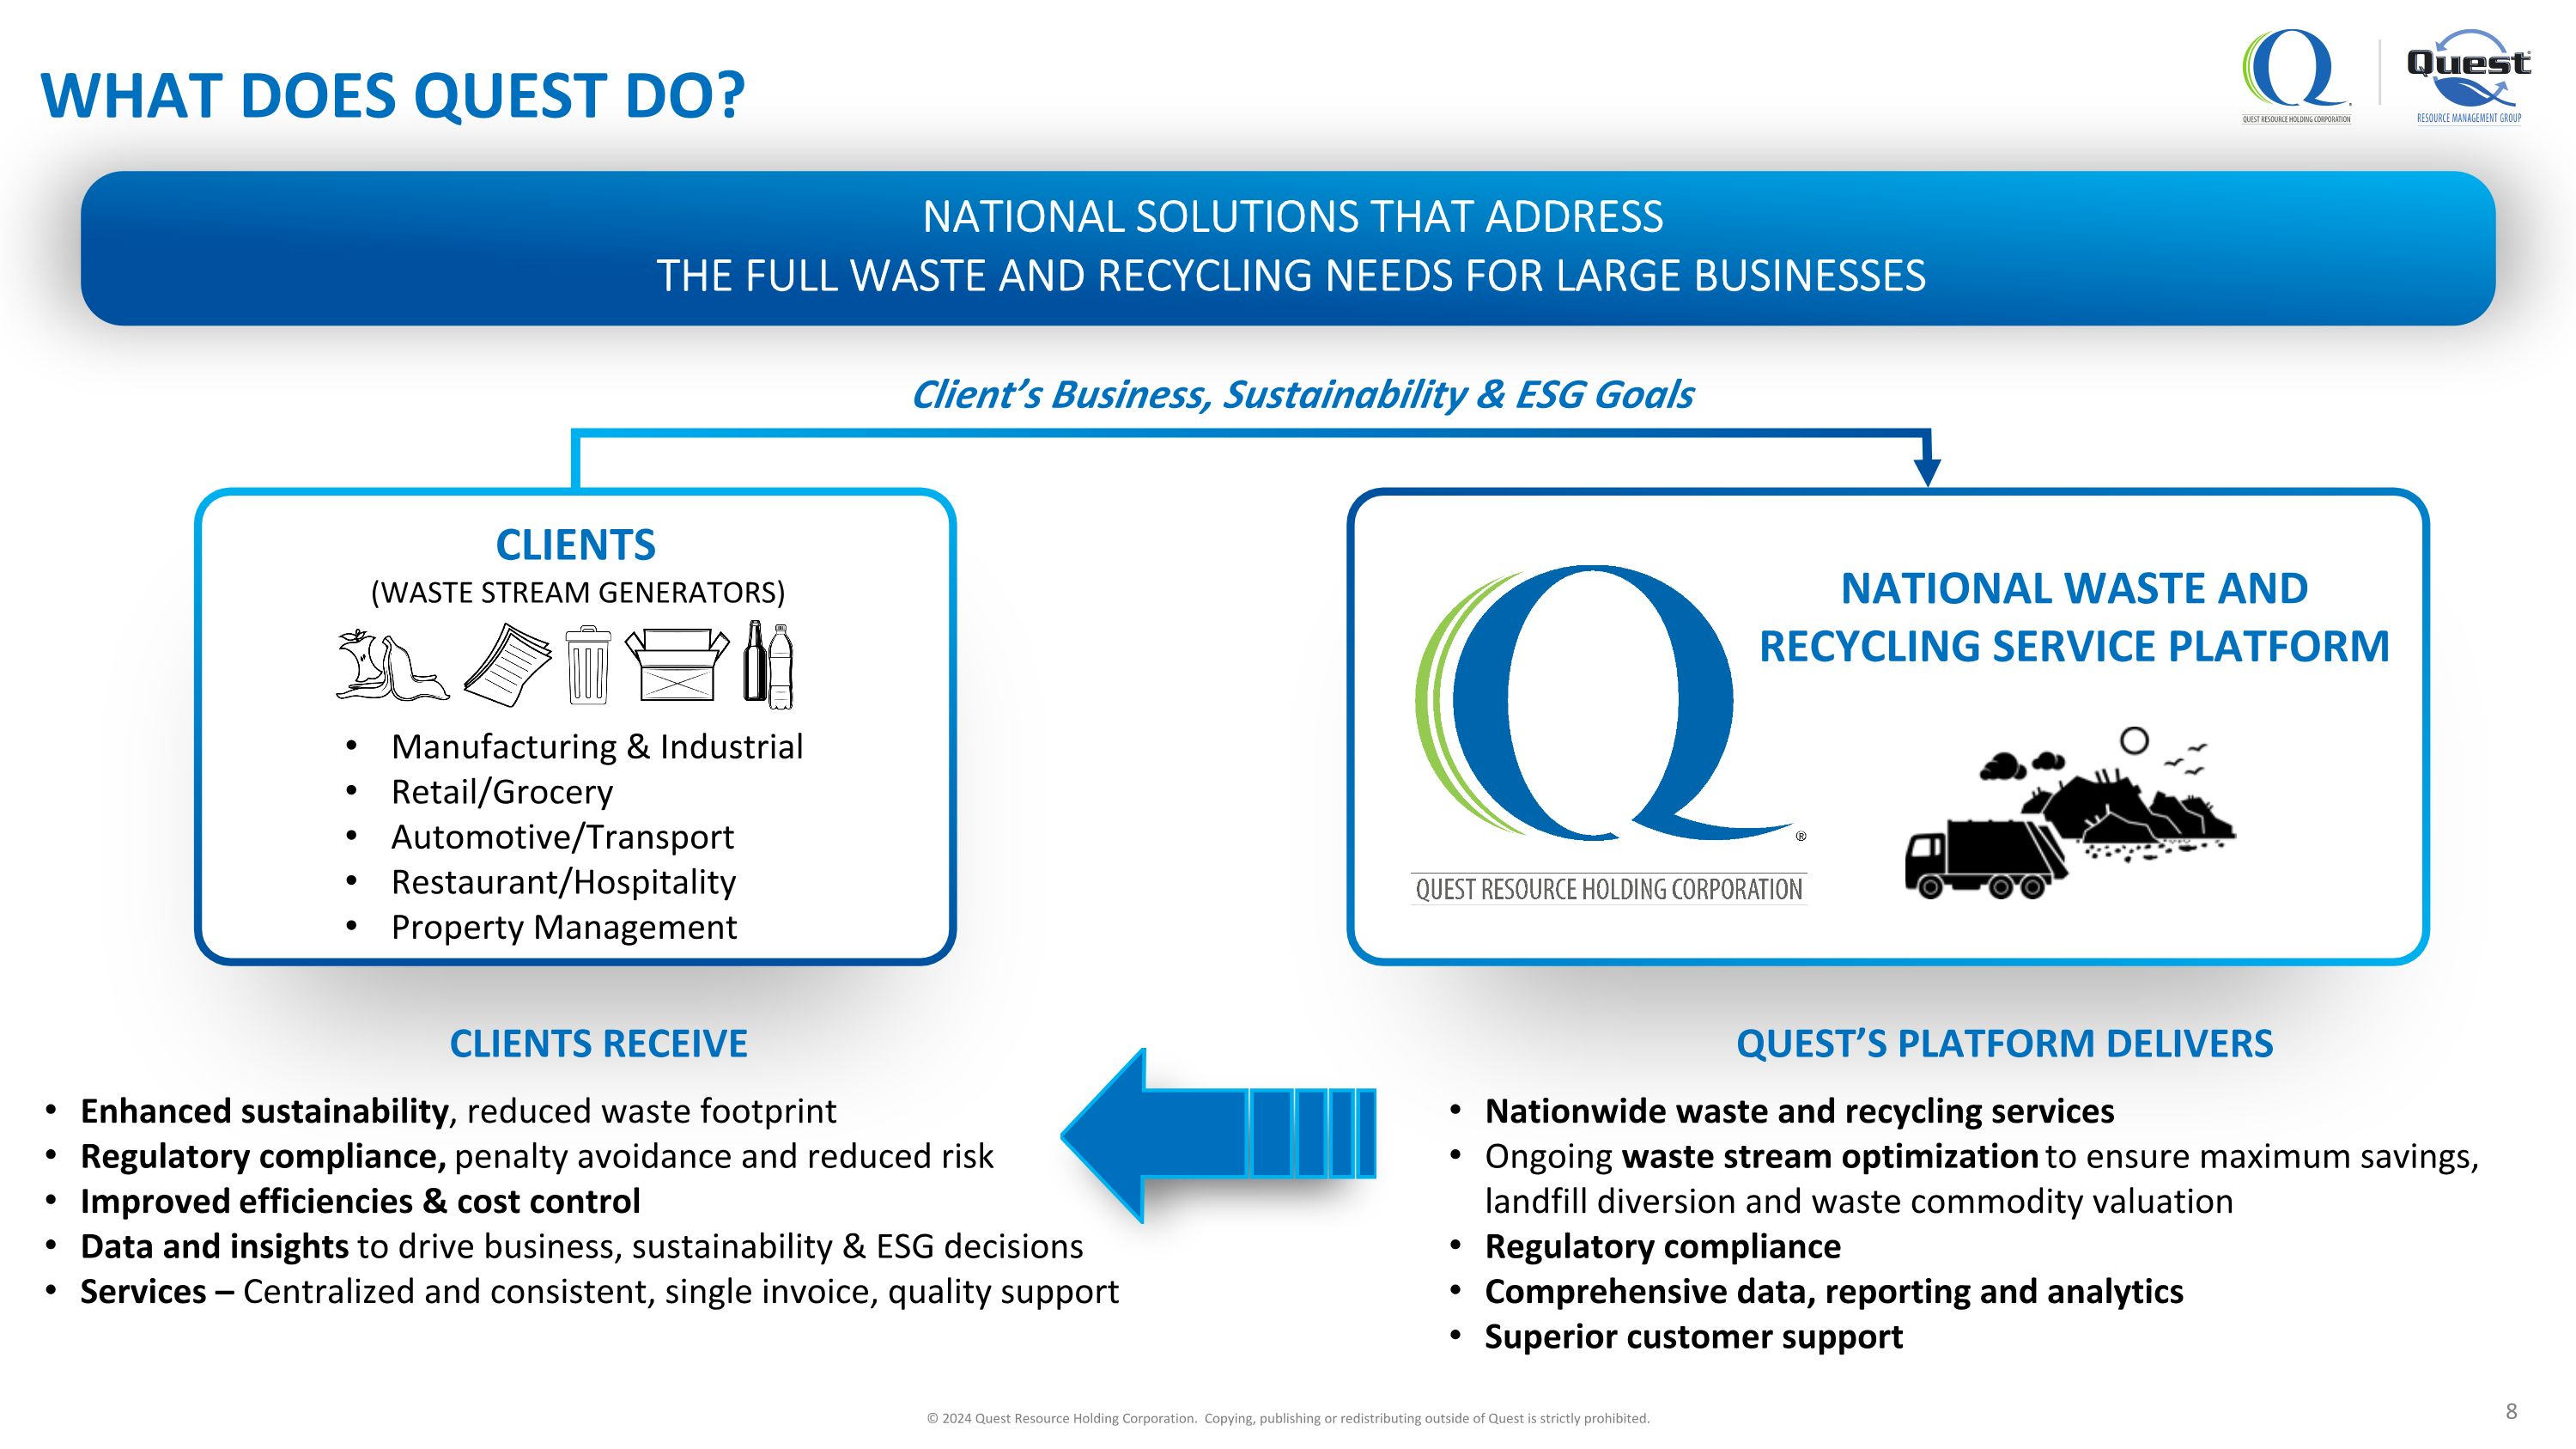
WHAT DOES QUEST DO? CLIENTS (WASTE STREAM GENERATORS) NATIONAL WASTE AND RECYCLING SERVICE PLATFORM CLIENTS RECEIVE Enhanced sustainability, reduced waste footprint Regulatory compliance, penalty avoidance and reduced risk Improved efficiencies & cost control Data and insights to drive business, sustainability & ESG decisions Services – Centralized and consistent, single invoice, quality support QUEST’S PLATFORM DELIVERS Nationwide waste and recycling services Ongoing waste stream optimization to ensure maximum savings, landfill diversion and waste commodity valuation Regulatory compliance Comprehensive data, reporting and analytics Superior customer support Manufacturing & Industrial Retail/Grocery Automotive/Transport Restaurant/Hospitality Property Management Client’s Business, Sustainability & ESG Goals 8 NATIONAL SOLUTIONS THAT ADDRESS THE FULL WASTE AND RECYCLING NEEDS FOR LARGE BUSINESSES © 2024 Quest Resource Holding Corporation. Copying, publishing or redistributing outside of Quest is strictly prohibited.
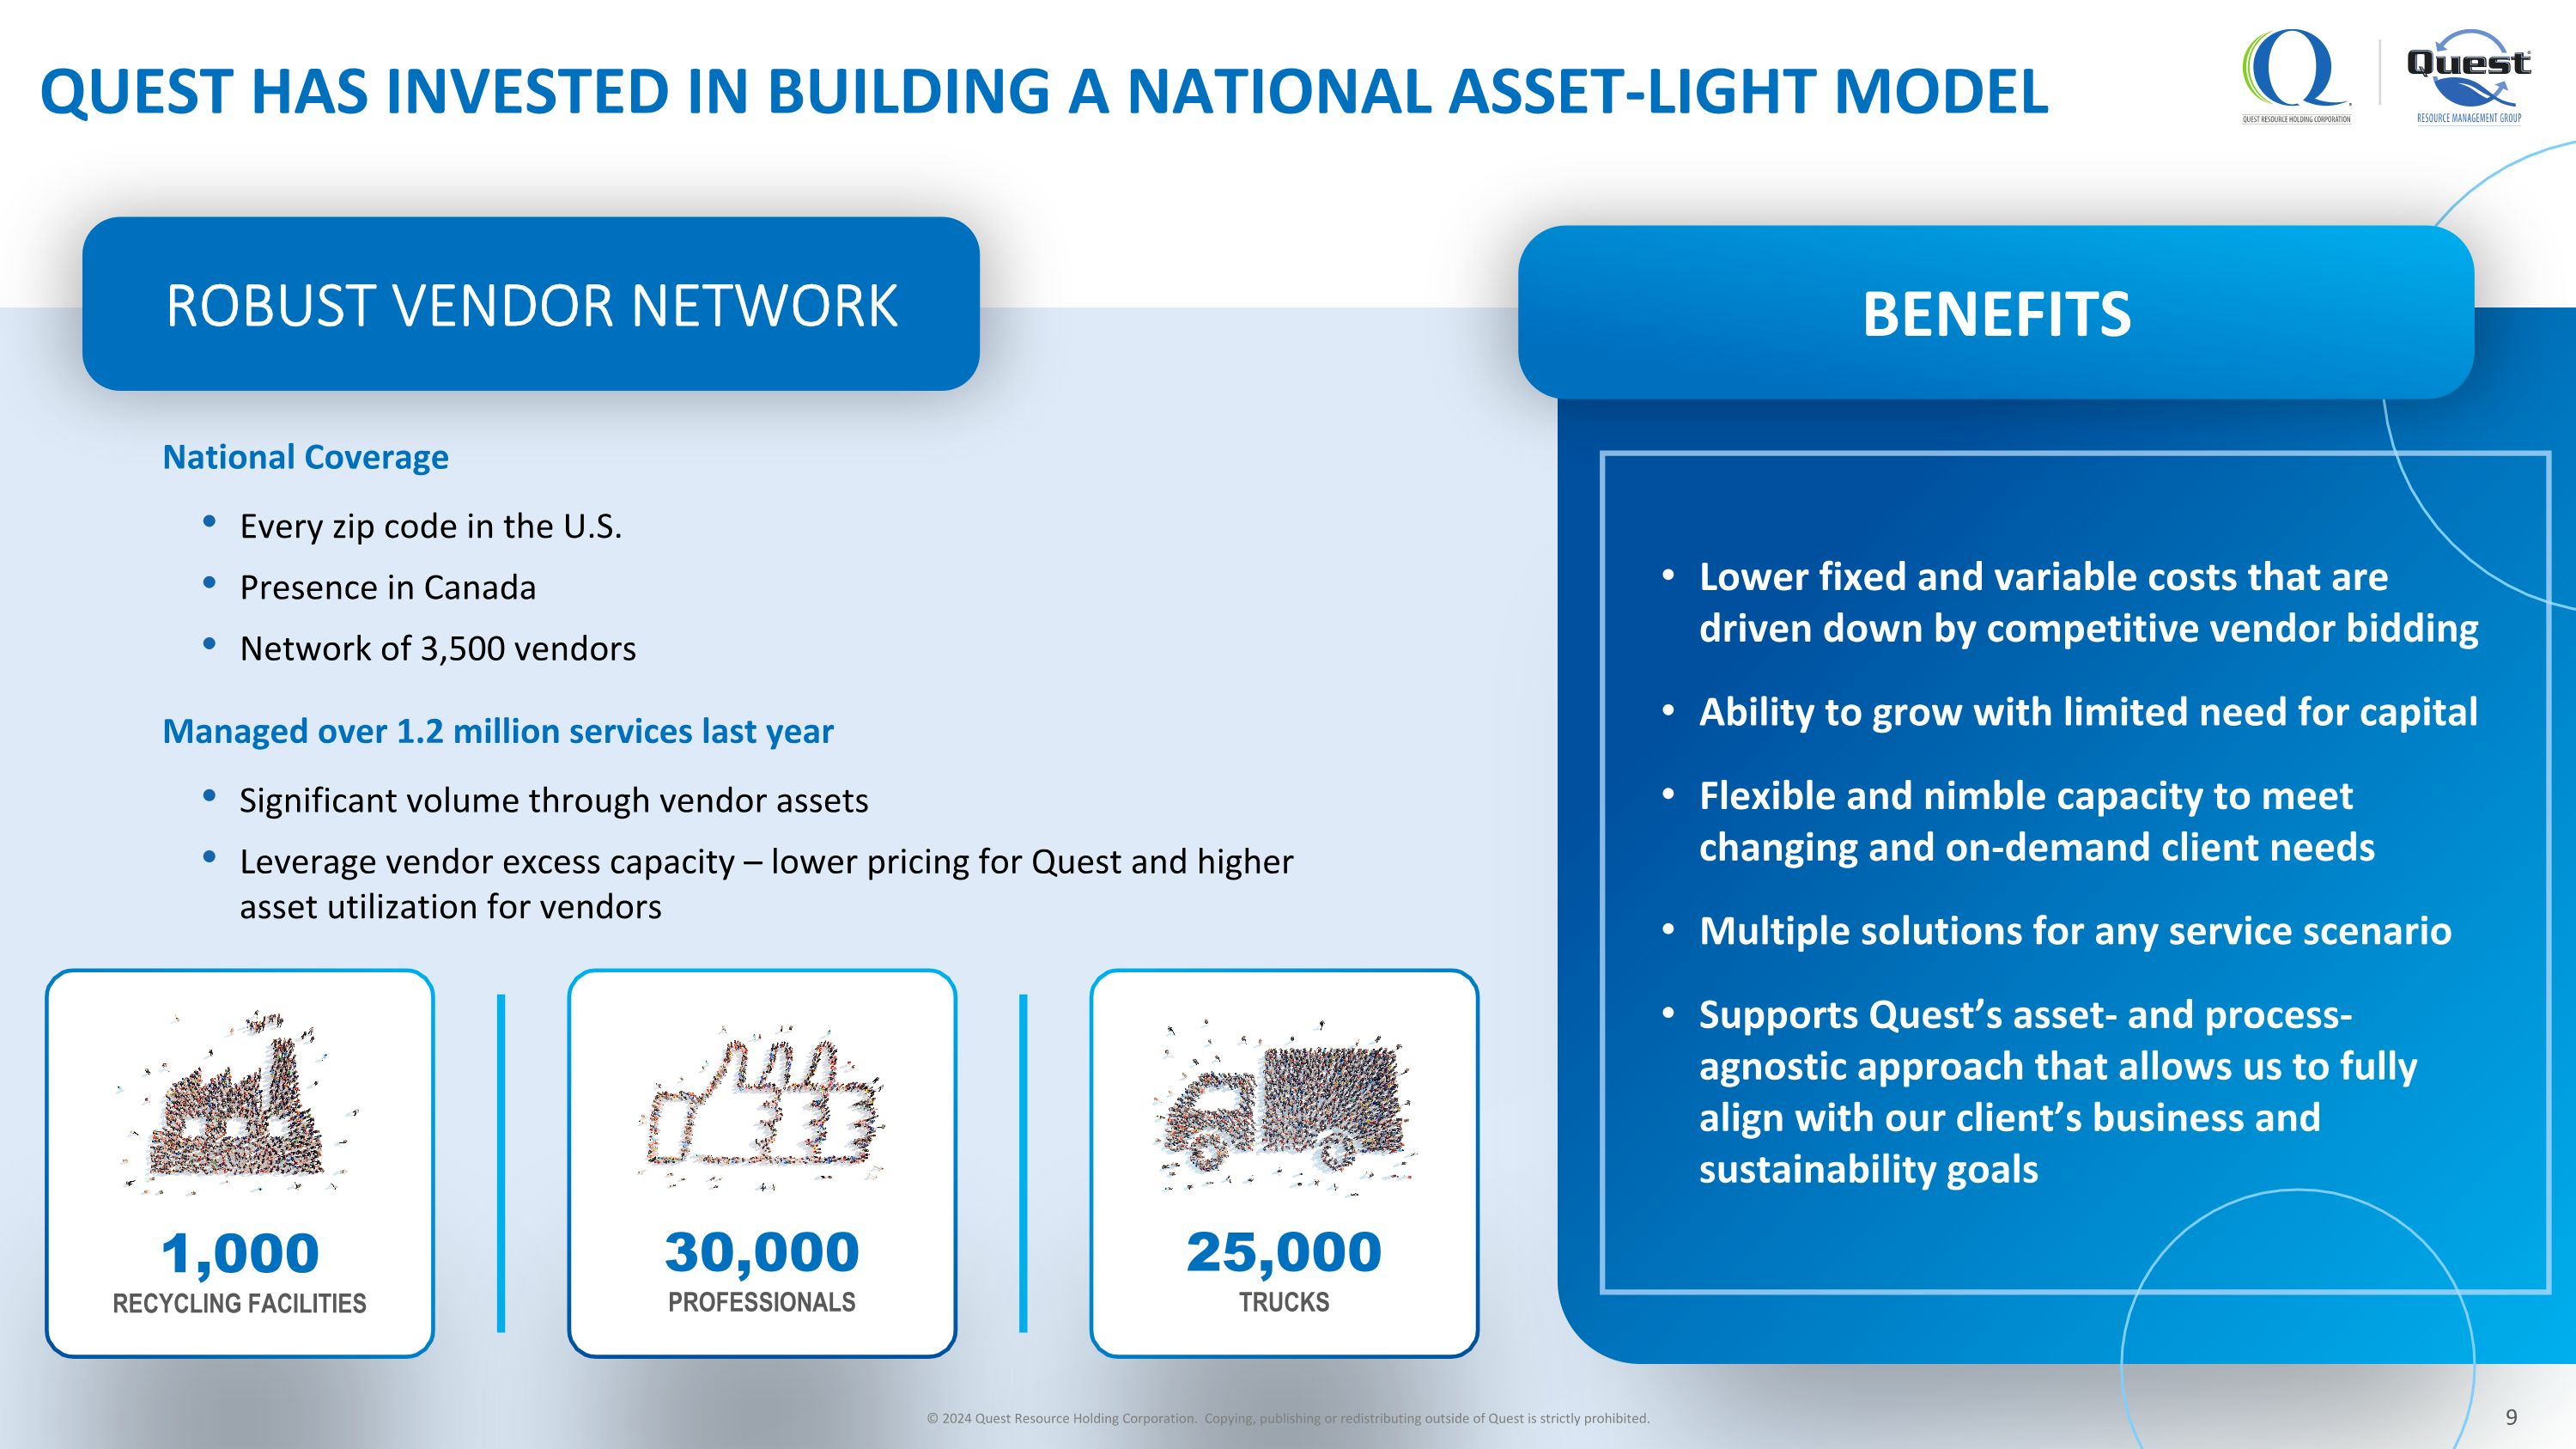
QUEST HAS INVESTED IN BUILDING A NATIONAL ASSET-LIGHT MODEL 25,000 TRUCKS 30,000 PROFESSIONALS 1,000 RECYCLING FACILITIES ROBUST VENDOR NETWORK Lower fixed and variable costs that are driven down by competitive vendor bidding Ability to grow with limited need for capital Flexible and nimble capacity to meet changing and on-demand client needs Multiple solutions for any service scenario Supports Quest’s asset- and process-agnostic approach that allows us to fully align with our client’s business and sustainability goals BENEFITS National Coverage Every zip code in the U.S. Presence in Canada Network of 3,500 vendors Managed over 1.2 million services last year Significant volume through vendor assets Leverage vendor excess capacity – lower pricing for Quest and higher asset utilization for vendors © 2024 Quest Resource Holding Corporation. Copying, publishing or redistributing outside of Quest is strictly prohibited.
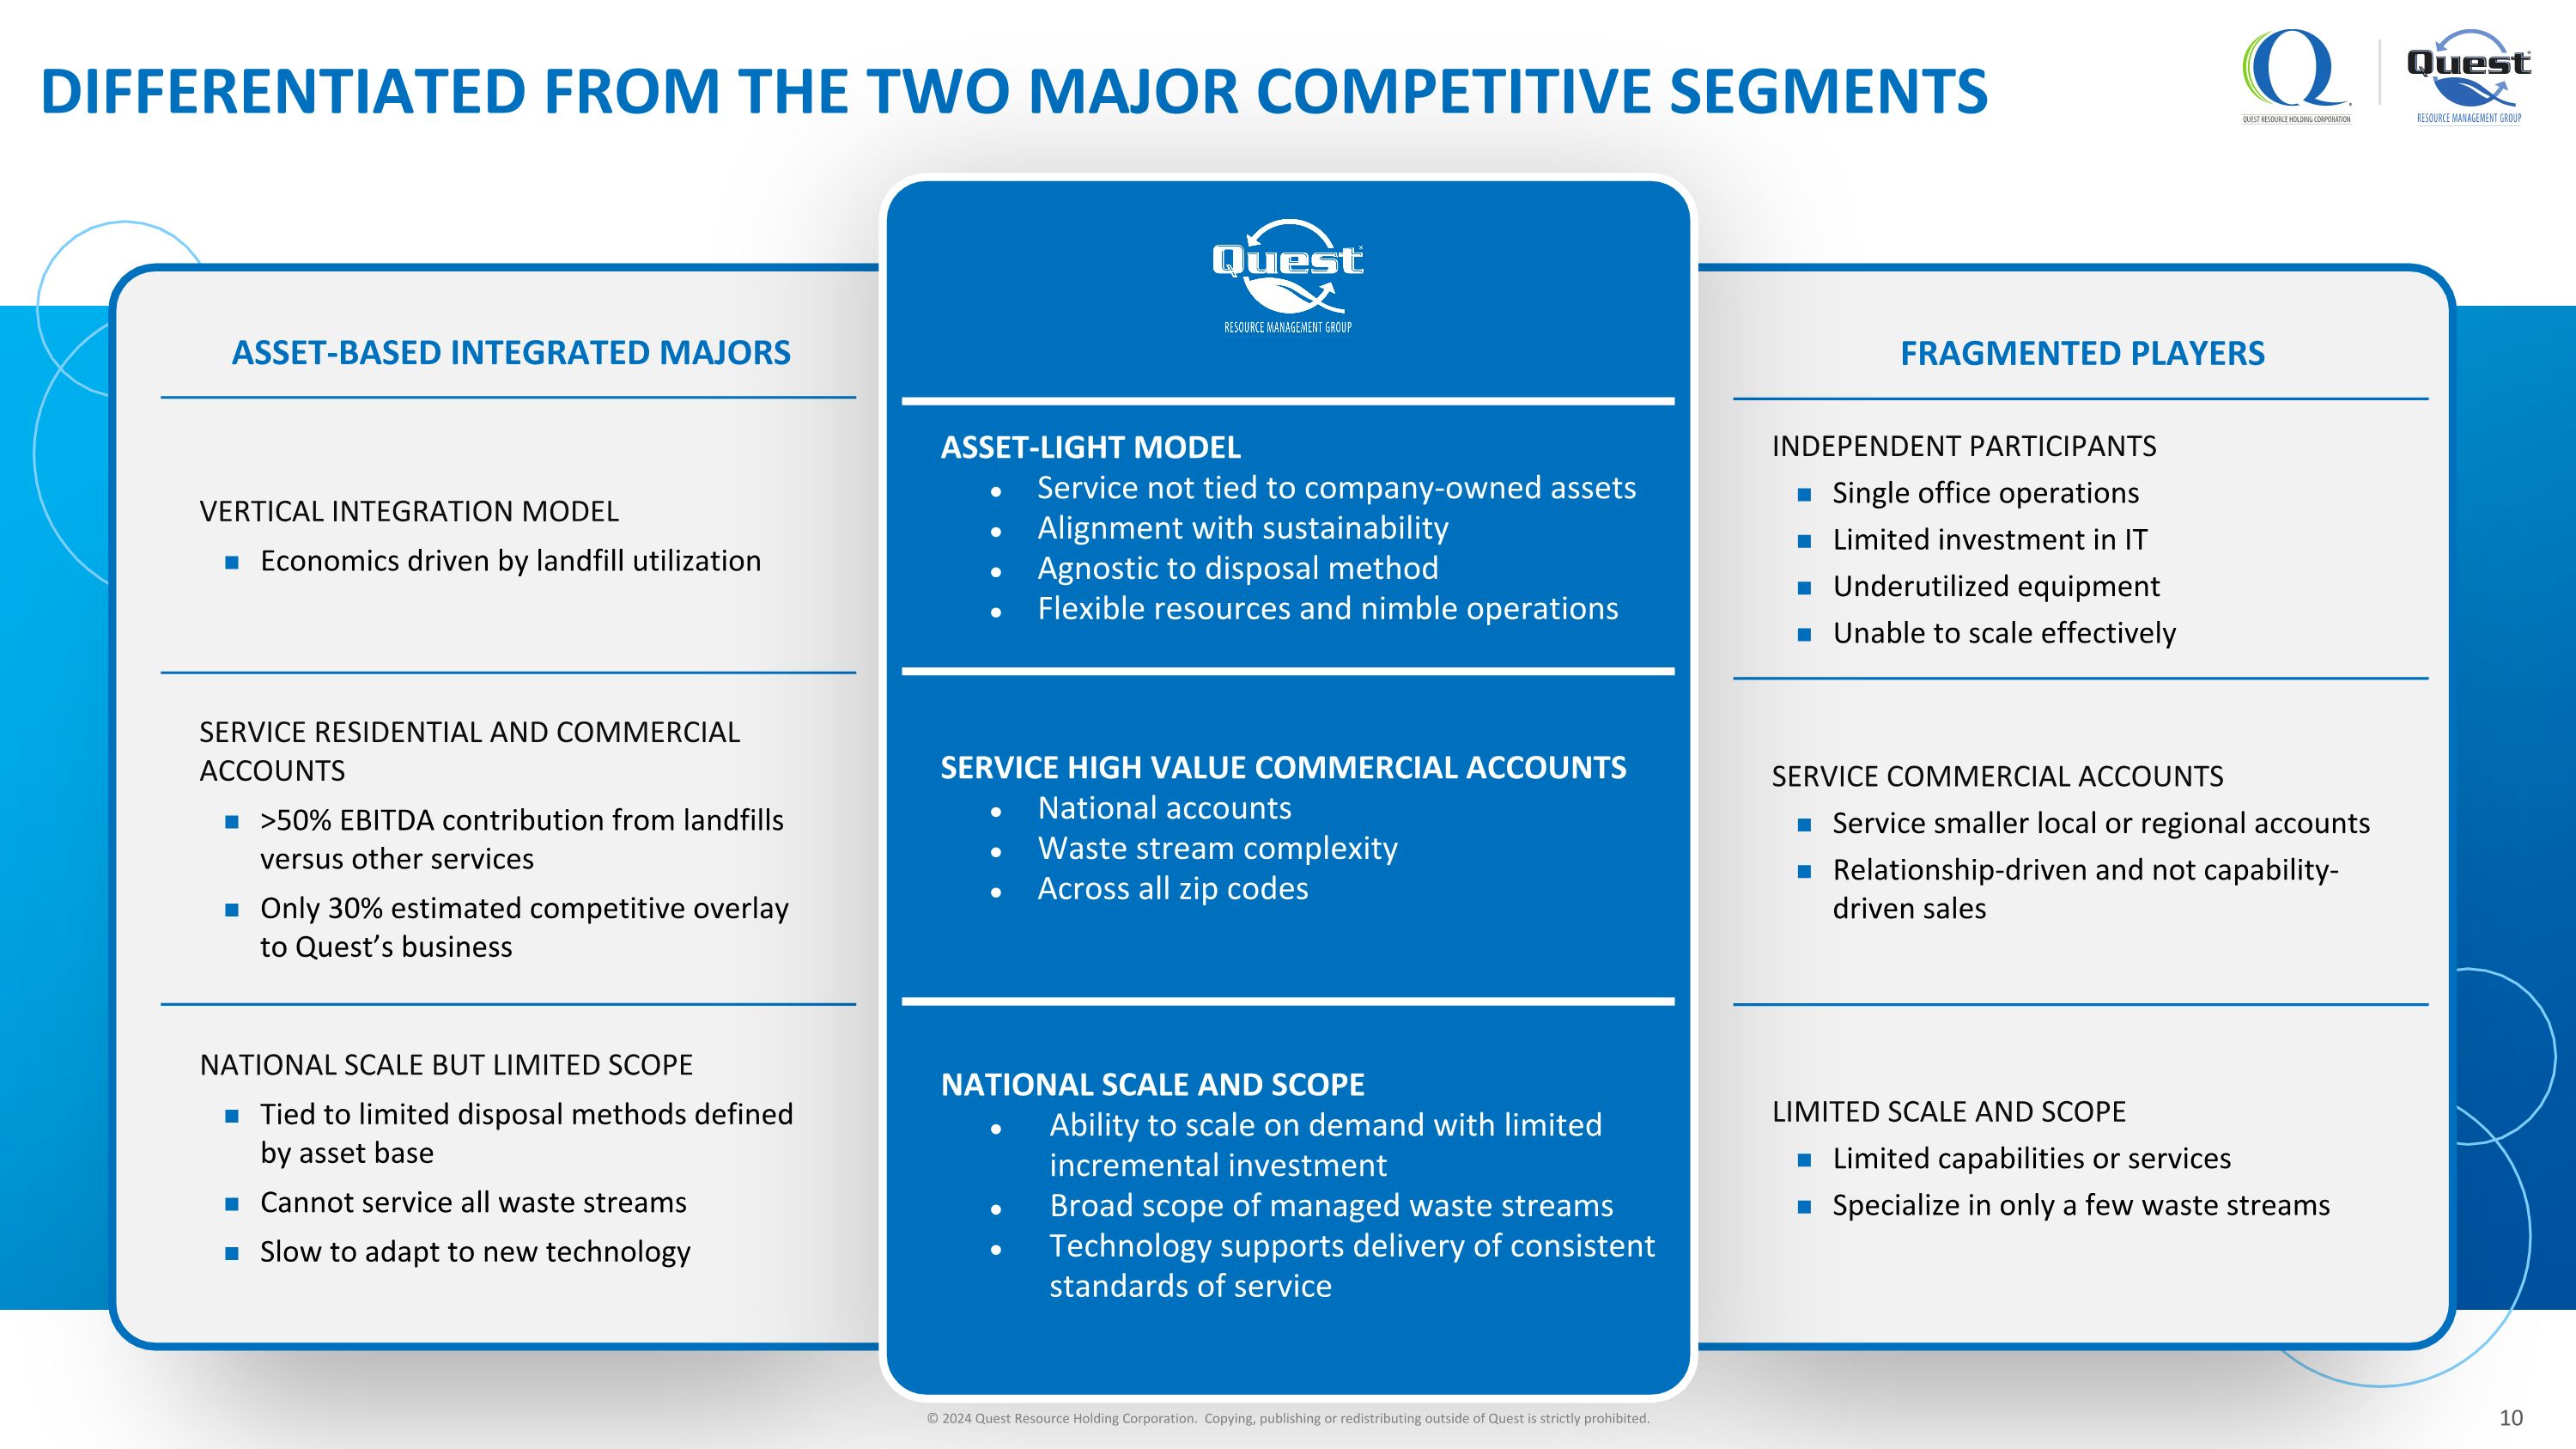
DIFFERENTIATED FROM THE TWO MAJOR COMPETITIVE SEGMENTS ASSET-BASED INTEGRATED MAJORS VERTICAL INTEGRATION MODEL Economics driven by landfill utilization SERVICE RESIDENTIAL AND COMMERCIAL ACCOUNTS >50% EBITDA contribution from landfills versus other services Only 30% estimated competitive overlay to Quest’s business NATIONAL SCALE BUT LIMITED SCOPE Tied to limited disposal methods defined by asset base Cannot service all waste streams Slow to adapt to new technology FRAGMENTED PLAYERS INDEPENDENT PARTICIPANTS Single office operations Limited investment in IT Underutilized equipment Unable to scale effectively SERVICE COMMERCIAL ACCOUNTS Service smaller local or regional accounts Relationship-driven and not capability-driven sales LIMITED SCALE AND SCOPE Limited capabilities or services Specialize in only a few waste streams ASSET-LIGHT MODEL Service not tied to company-owned assets Alignment with sustainability Agnostic to disposal method Flexible resources and nimble operations SERVICE HIGH VALUE COMMERCIAL ACCOUNTS National accounts Waste stream complexity Across all zip codes NATIONAL SCALE AND SCOPE Ability to scale on demand with limited incremental investment Broad scope of managed waste streams Technology supports delivery of consistent standards of service © 2024 Quest Resource Holding Corporation. Copying, publishing or redistributing outside of Quest is strictly prohibited. 10
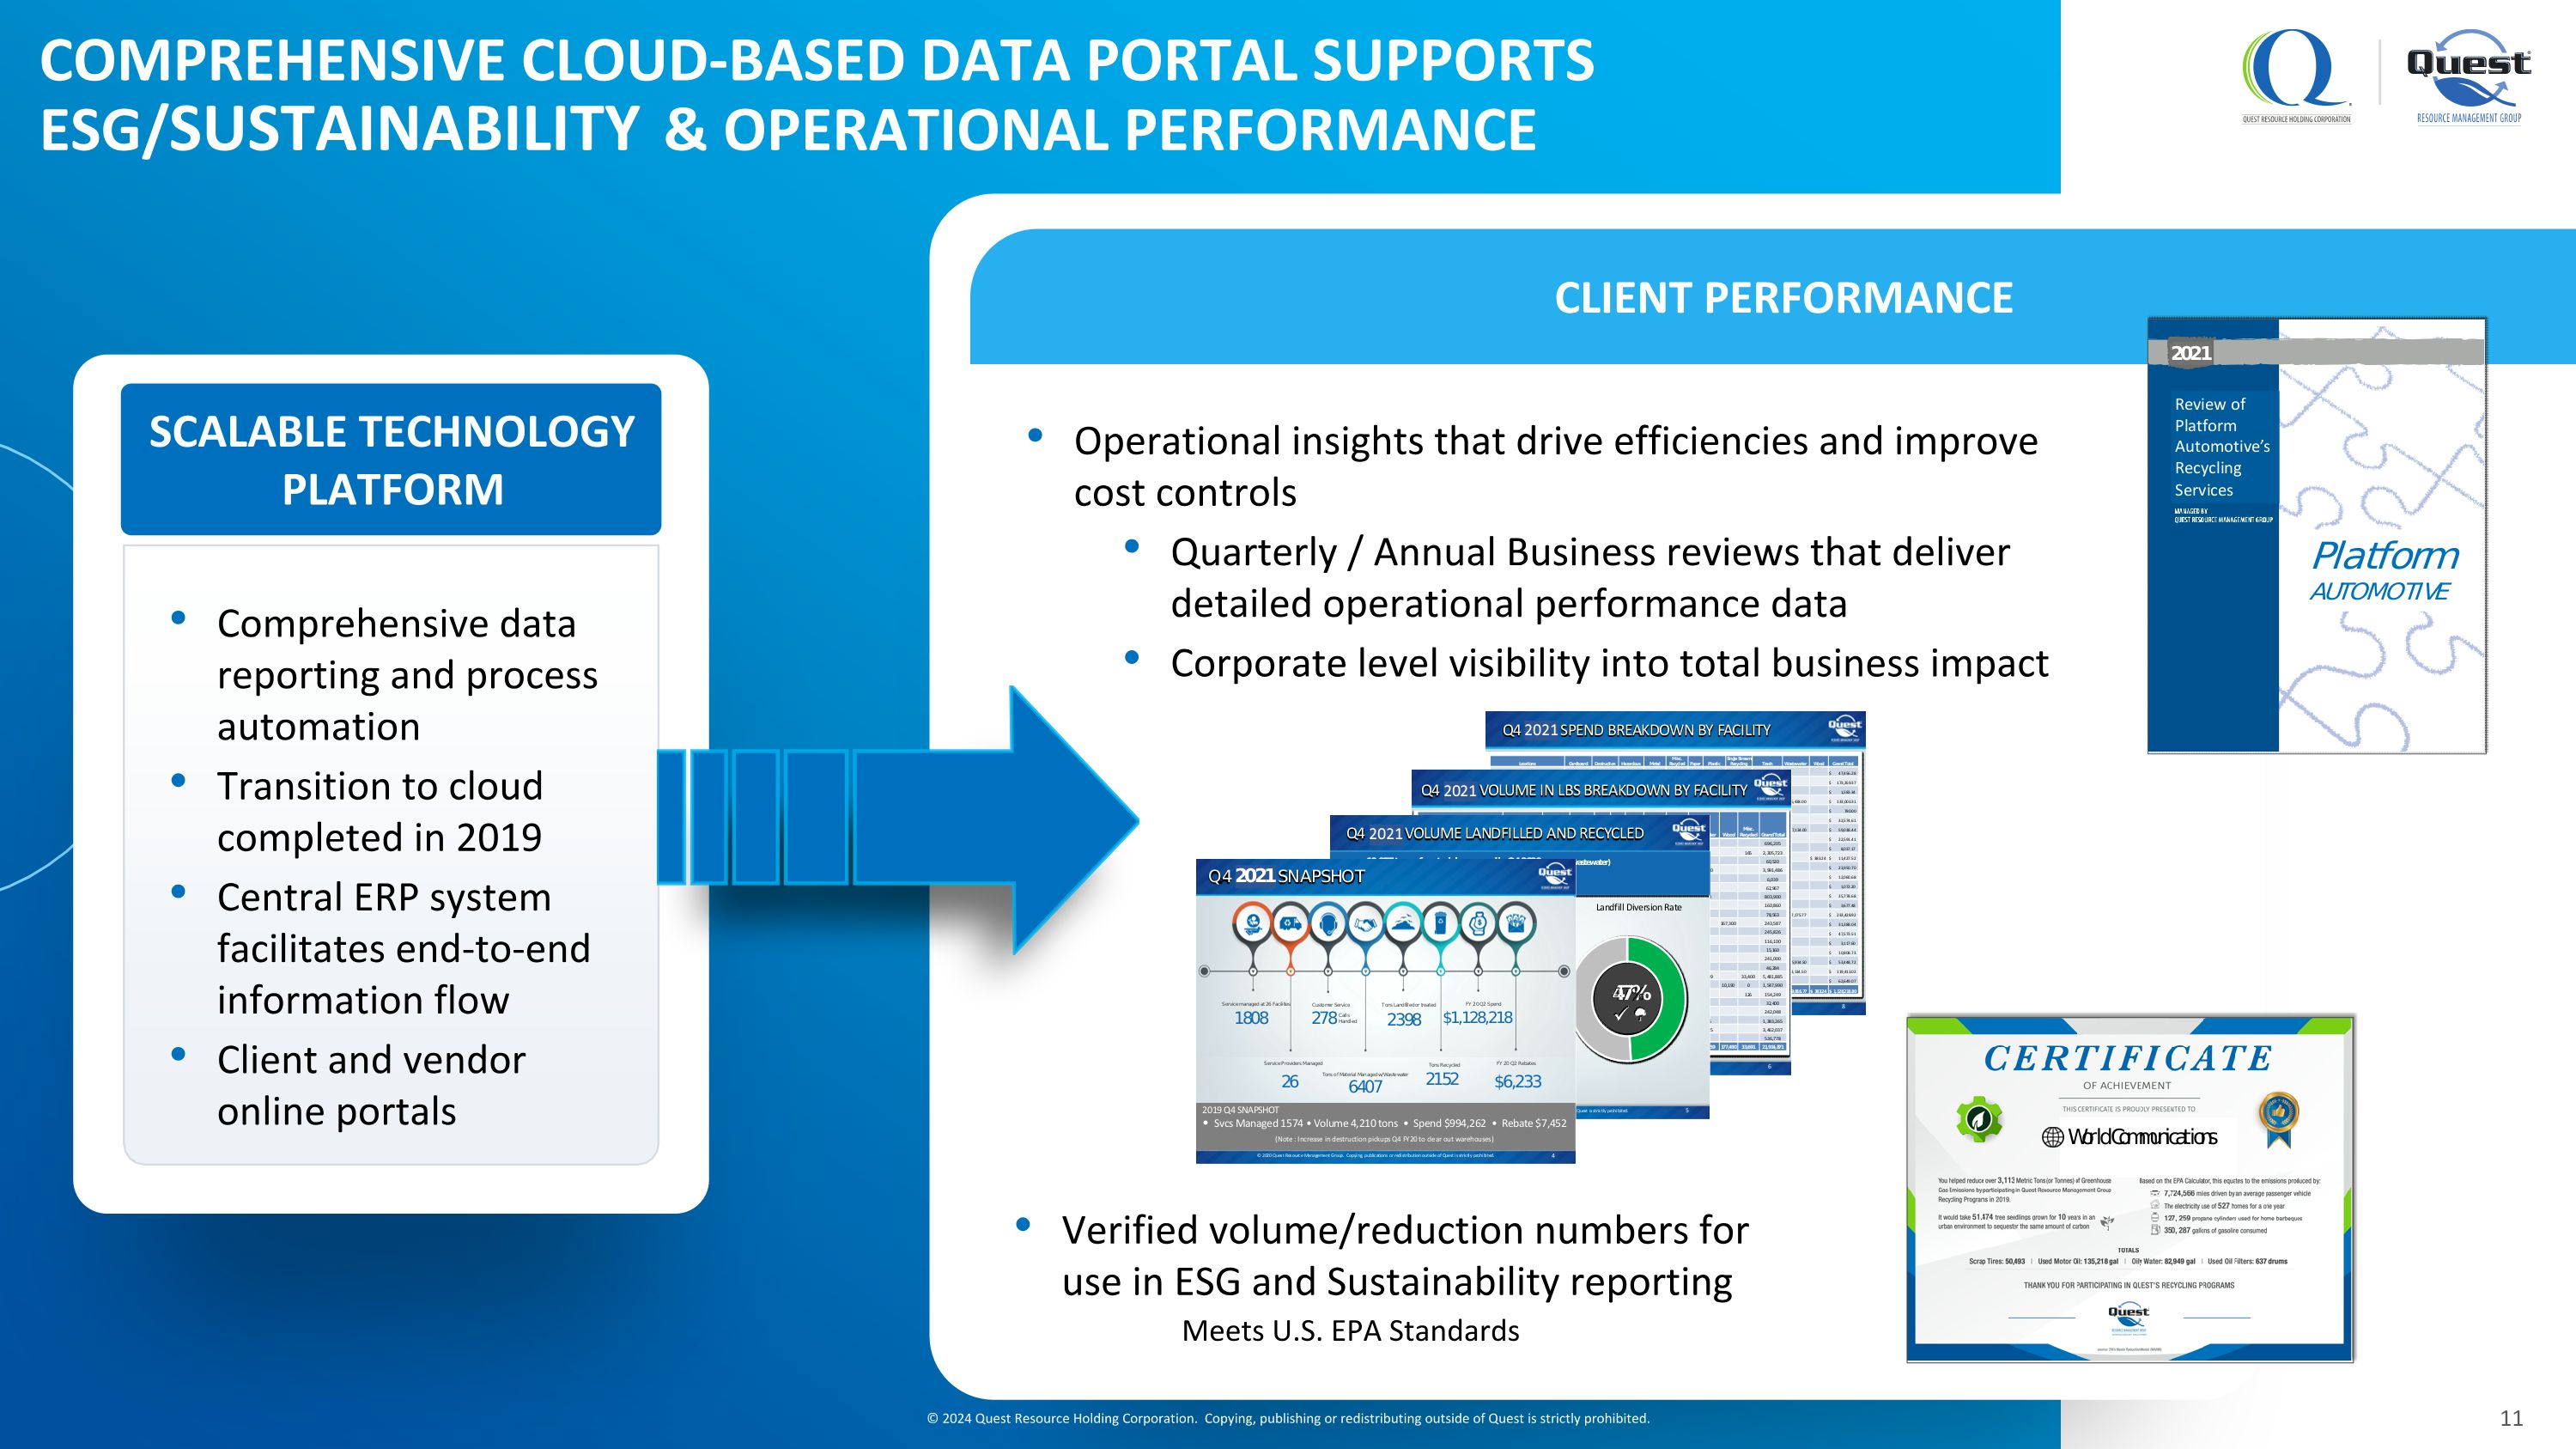
Comprehensive data reporting and process automation Transition to cloud completed in 2019 Central ERP system facilitates end-to-end information flow Client and vendor online portals COMPREHENSIVE CLOUD-BASED DATA PORTAL SUPPORTS ESG/SUSTAINABILITY & OPERATIONAL PERFORMANCE Meets U.S. EPA Standards Operational insights that drive efficiencies and improve cost controls Quarterly / Annual Business reviews that deliver detailed operational performance data Corporate level visibility into total business impact Verified volume/reduction numbers for use in ESG and Sustainability reporting SCALABLE TECHNOLOGY PLATFORM CLIENT PERFORMANCE © 2024 Quest Resource Holding Corporation. Copying, publishing or redistributing outside of Quest is strictly prohibited.
ESTABLISHED GROWTH PLATFORM Land and Expand Strategy Drives Organic Growth Land - Growing pipeline of new client opportunities Increased scale adds to value proposition Favorable sustainability trends and increased landfill costs create secular tailwind Growing base of highly referenceable Fortune 1000 clients Expand - Large opportunity to expand by adding services and geographies to existing customers Opportunistically pursue M&A © 2024 Quest Resource Holding Corporation. Copying, publishing or redistributing outside of Quest is strictly prohibited.
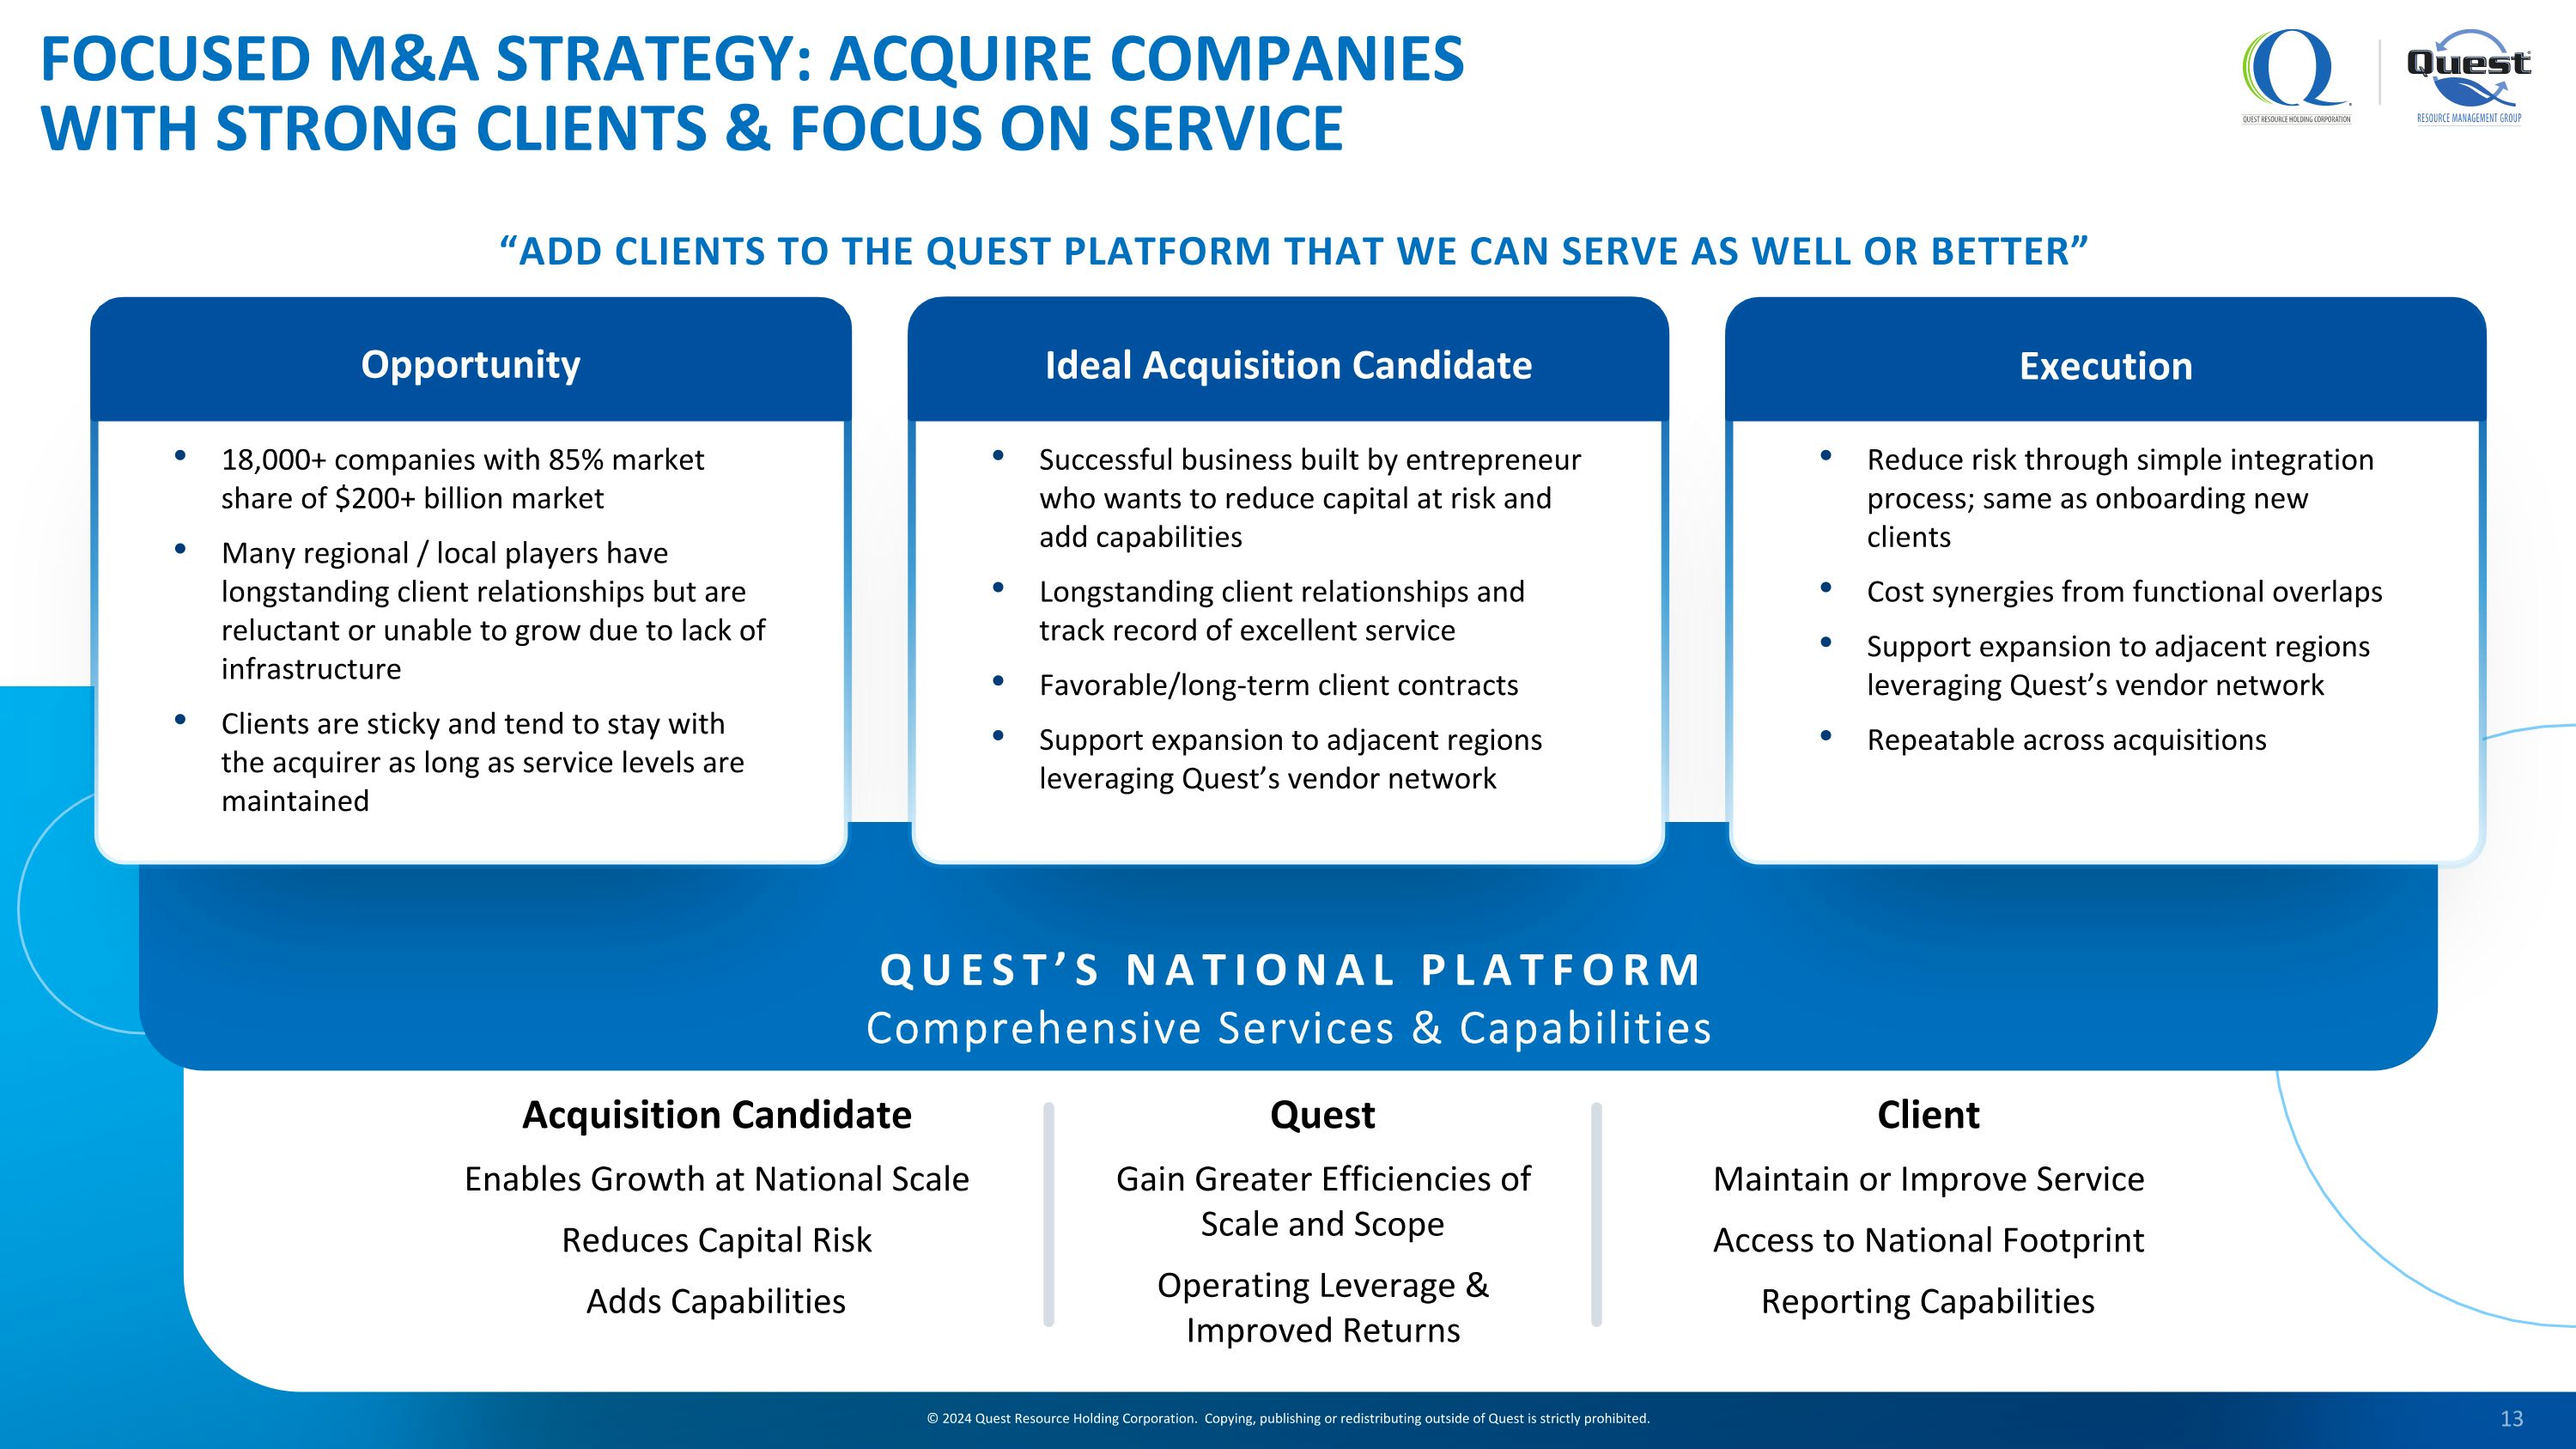
Execution Reduce risk through simple integration process; same as onboarding new clients Cost synergies from functional overlaps Support expansion to adjacent regions leveraging Quest’s vendor network Repeatable across acquisitions Ideal Acquisition Candidate Successful business built by entrepreneur who wants to reduce capital at risk and add capabilities Longstanding client relationships and track record of excellent service Favorable/long-term client contracts Support expansion to adjacent regions leveraging Quest’s vendor network Opportunity 18,000+ companies with 85% market share of $200+ billion market Many regional / local players have longstanding client relationships but are reluctant or unable to grow due to lack of infrastructure Clients are sticky and tend to stay with the acquirer as long as service levels are maintained “ADD CLIENTS TO THE QUEST PLATFORM THAT WE CAN SERVE AS WELL OR BETTER” FOCUSED M&A STRATEGY: ACQUIRE COMPANIES WITH STRONG CLIENTS & FOCUS ON SERVICE Acquisition Candidate Enables Growth at National Scale Reduces Capital Risk Adds Capabilities Client Maintain or Improve Service Access to National Footprint Reporting Capabilities Quest Gain Greater Efficiencies of Scale and Scope Operating Leverage & Improved Returns QUEST’S NATIONAL PLATFORM Comprehensive Services & Capabilities © 2024 Quest Resource Holding Corporation. Copying, publishing or redistributing outside of Quest is strictly prohibited.
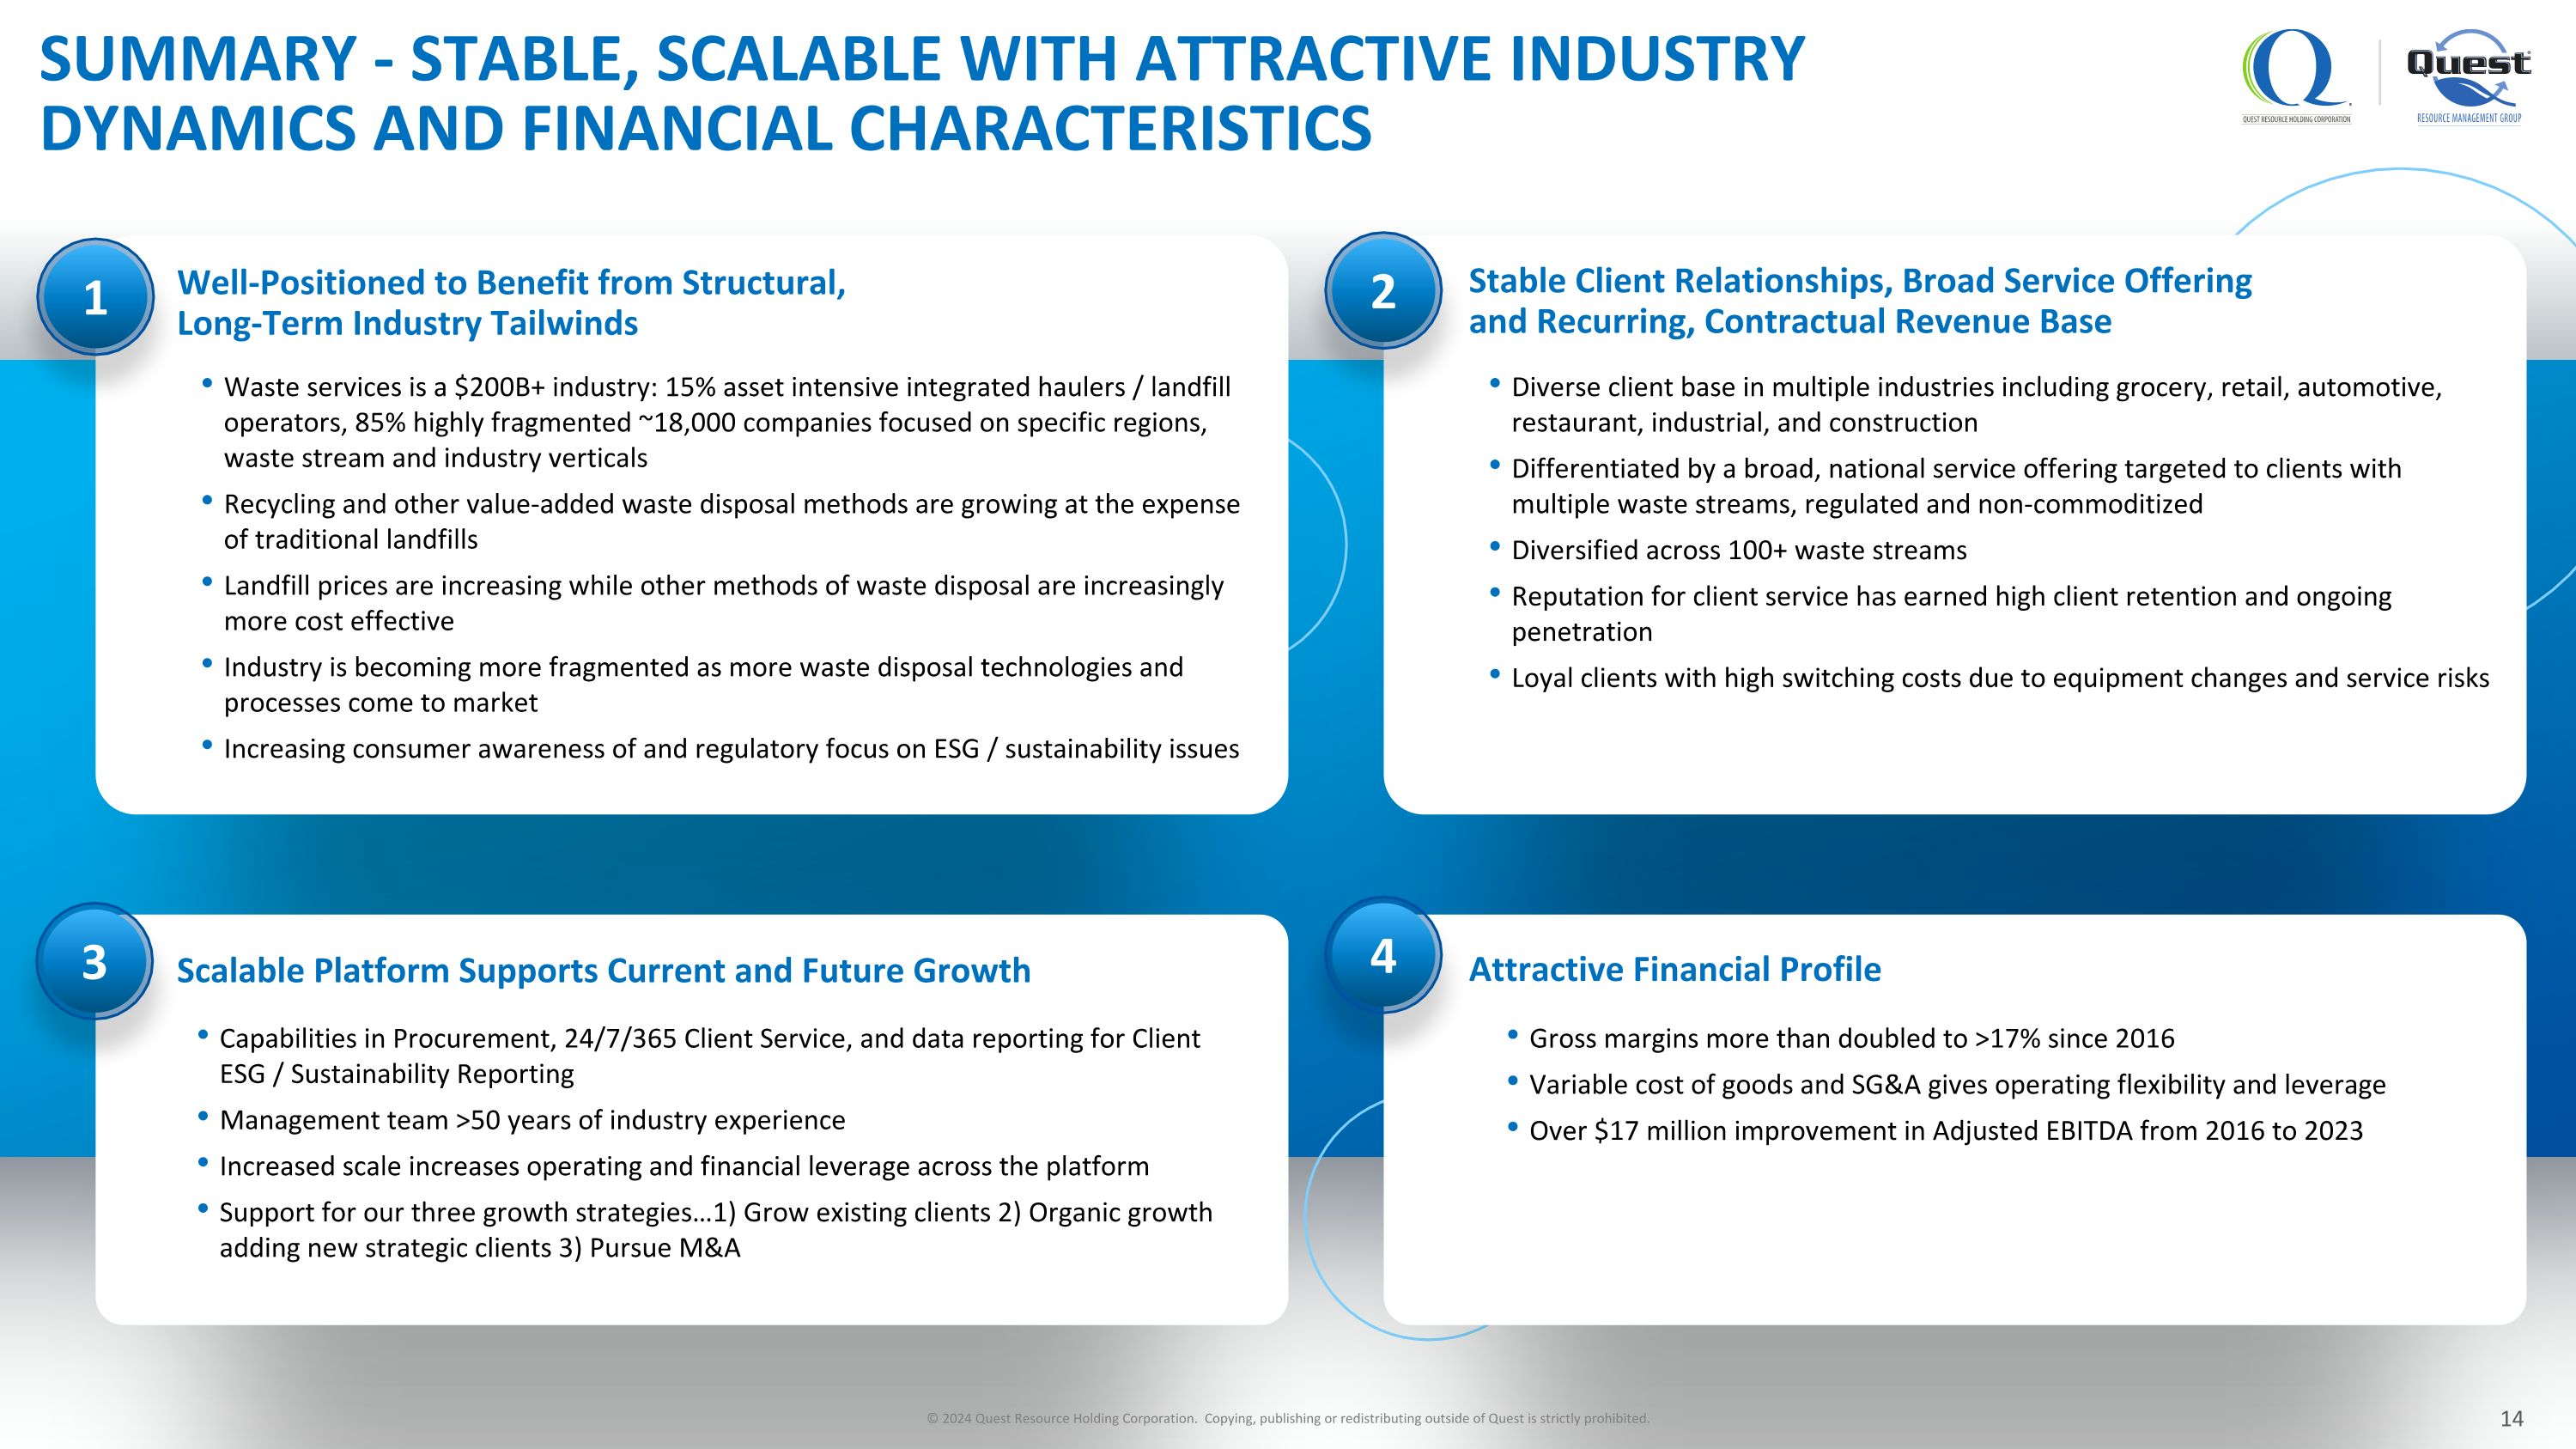
Well-Positioned to Benefit from Structural, Long-Term Industry Tailwinds Waste services is a $200B+ industry: 15% asset intensive integrated haulers / landfill operators, 85% highly fragmented ~18,000 companies focused on specific regions, waste stream and industry verticals Recycling and other value-added waste disposal methods are growing at the expense of traditional landfills Landfill prices are increasing while other methods of waste disposal are increasingly more cost effective Industry is becoming more fragmented as more waste disposal technologies and processes come to market Increasing consumer awareness of and regulatory focus on ESG / sustainability issues Diverse client base in multiple industries including grocery, retail, automotive, restaurant, industrial, and construction Differentiated by a broad, national service offering targeted to clients with multiple waste streams, regulated and non-commoditized Diversified across 100+ waste streams Reputation for client service has earned high client retention and ongoing penetration Loyal clients with high switching costs due to equipment changes and service risks Stable Client Relationships, Broad Service Offering and Recurring, Contractual Revenue Base 1 2 3 Attractive Financial Profile Scalable Platform Supports Current and Future Growth Gross margins more than doubled to >17% since 2016 Variable cost of goods and SG&A gives operating flexibility and leverage Over $17 million improvement in Adjusted EBITDA from 2016 to 2023 Capabilities in Procurement, 24/7/365 Client Service, and data reporting for Client ESG / Sustainability Reporting Management team >50 years of industry experience Increased scale increases operating and financial leverage across the platform Support for our three growth strategies…1) Grow existing clients 2) Organic growth adding new strategic clients 3) Pursue M&A 4 SUMMARY - STABLE, SCALABLE WITH ATTRACTIVE INDUSTRY DYNAMICS AND FINANCIAL CHARACTERISTICS © 2024 Quest Resource Holding Corporation. Copying, publishing or redistributing outside of Quest is strictly prohibited.
APPENDIX 15
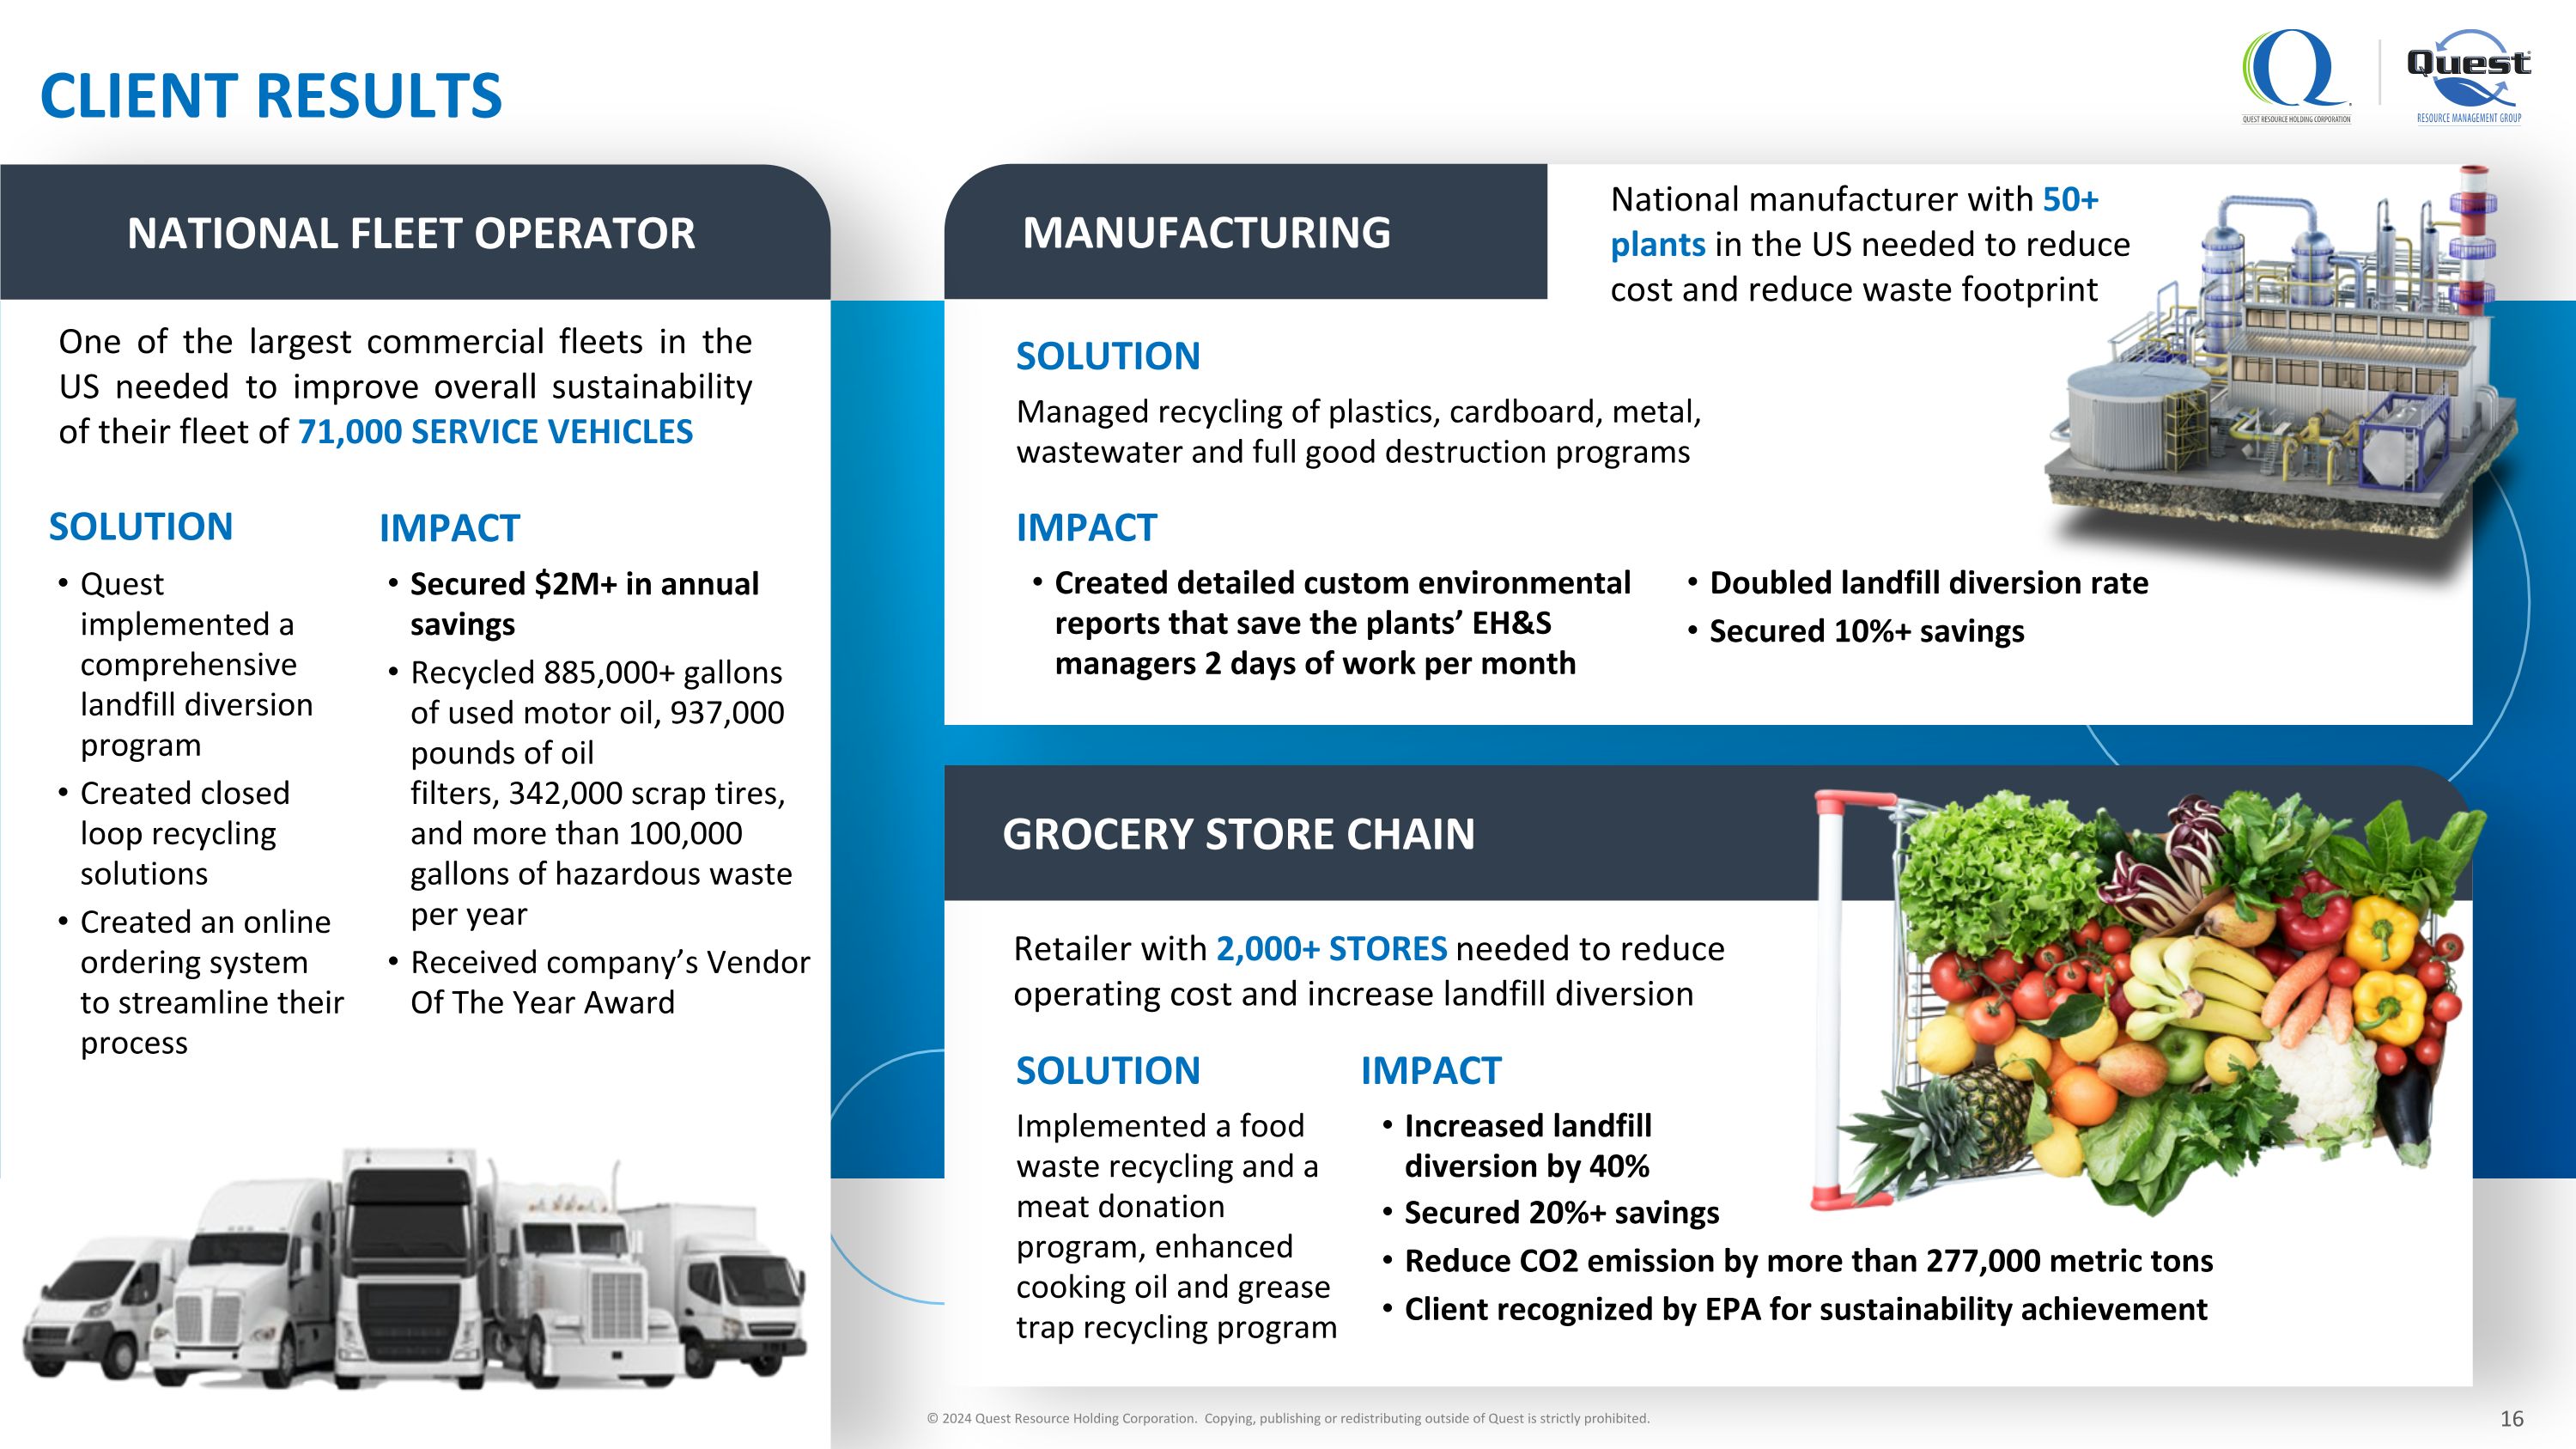
GROCERY STORE CHAIN MANUFACTURING Implemented a food waste recycling and a meat donation program, enhanced cooking oil and grease trap recycling program SOLUTION Increased landfill diversion by 40% Secured 20%+ savings Reduce CO2 emission by more than 277,000 metric tons Client recognized by EPA for sustainability achievement IMPACT Increased landfill diversion by 40% Reduce CO2 emission by more than 277,000 metric tons Secured 20%+ savings Client recognized by EPA for sustainability achievement Retailer with 2,000+ STORES needed to reduce operating cost and increase landfill diversion Managed recycling of plastics, cardboard, metal, wastewater and full good destruction programs SOLUTION IMPACT Created detailed custom environmental reports that save the plants’ EH&S managers 2 days of work per month Doubled landfill diversion rate Secured 10%+ savings National manufacturer with 50+ plants in the US needed to reduce cost and reduce waste footprint NATIONAL FLEET OPERATOR Quest implemented a comprehensive landfill diversion program Created closed loop recycling solutions Created an online ordering system to streamline their process SOLUTION IMPACT Secured $2M+ in annual savings Recycled 885,000+ gallons of used motor oil, 937,000 pounds of oil filters, 342,000 scrap tires, and more than 100,000 gallons of hazardous waste per year Received company’s Vendor Of The Year Award One of the largest commercial fleets in the US needed to improve overall sustainability of their fleet of 71,000 SERVICE VEHICLES CLIENT RESULTS © 2024 Quest Resource Holding Corporation. Copying, publishing or redistributing outside of Quest is strictly prohibited.
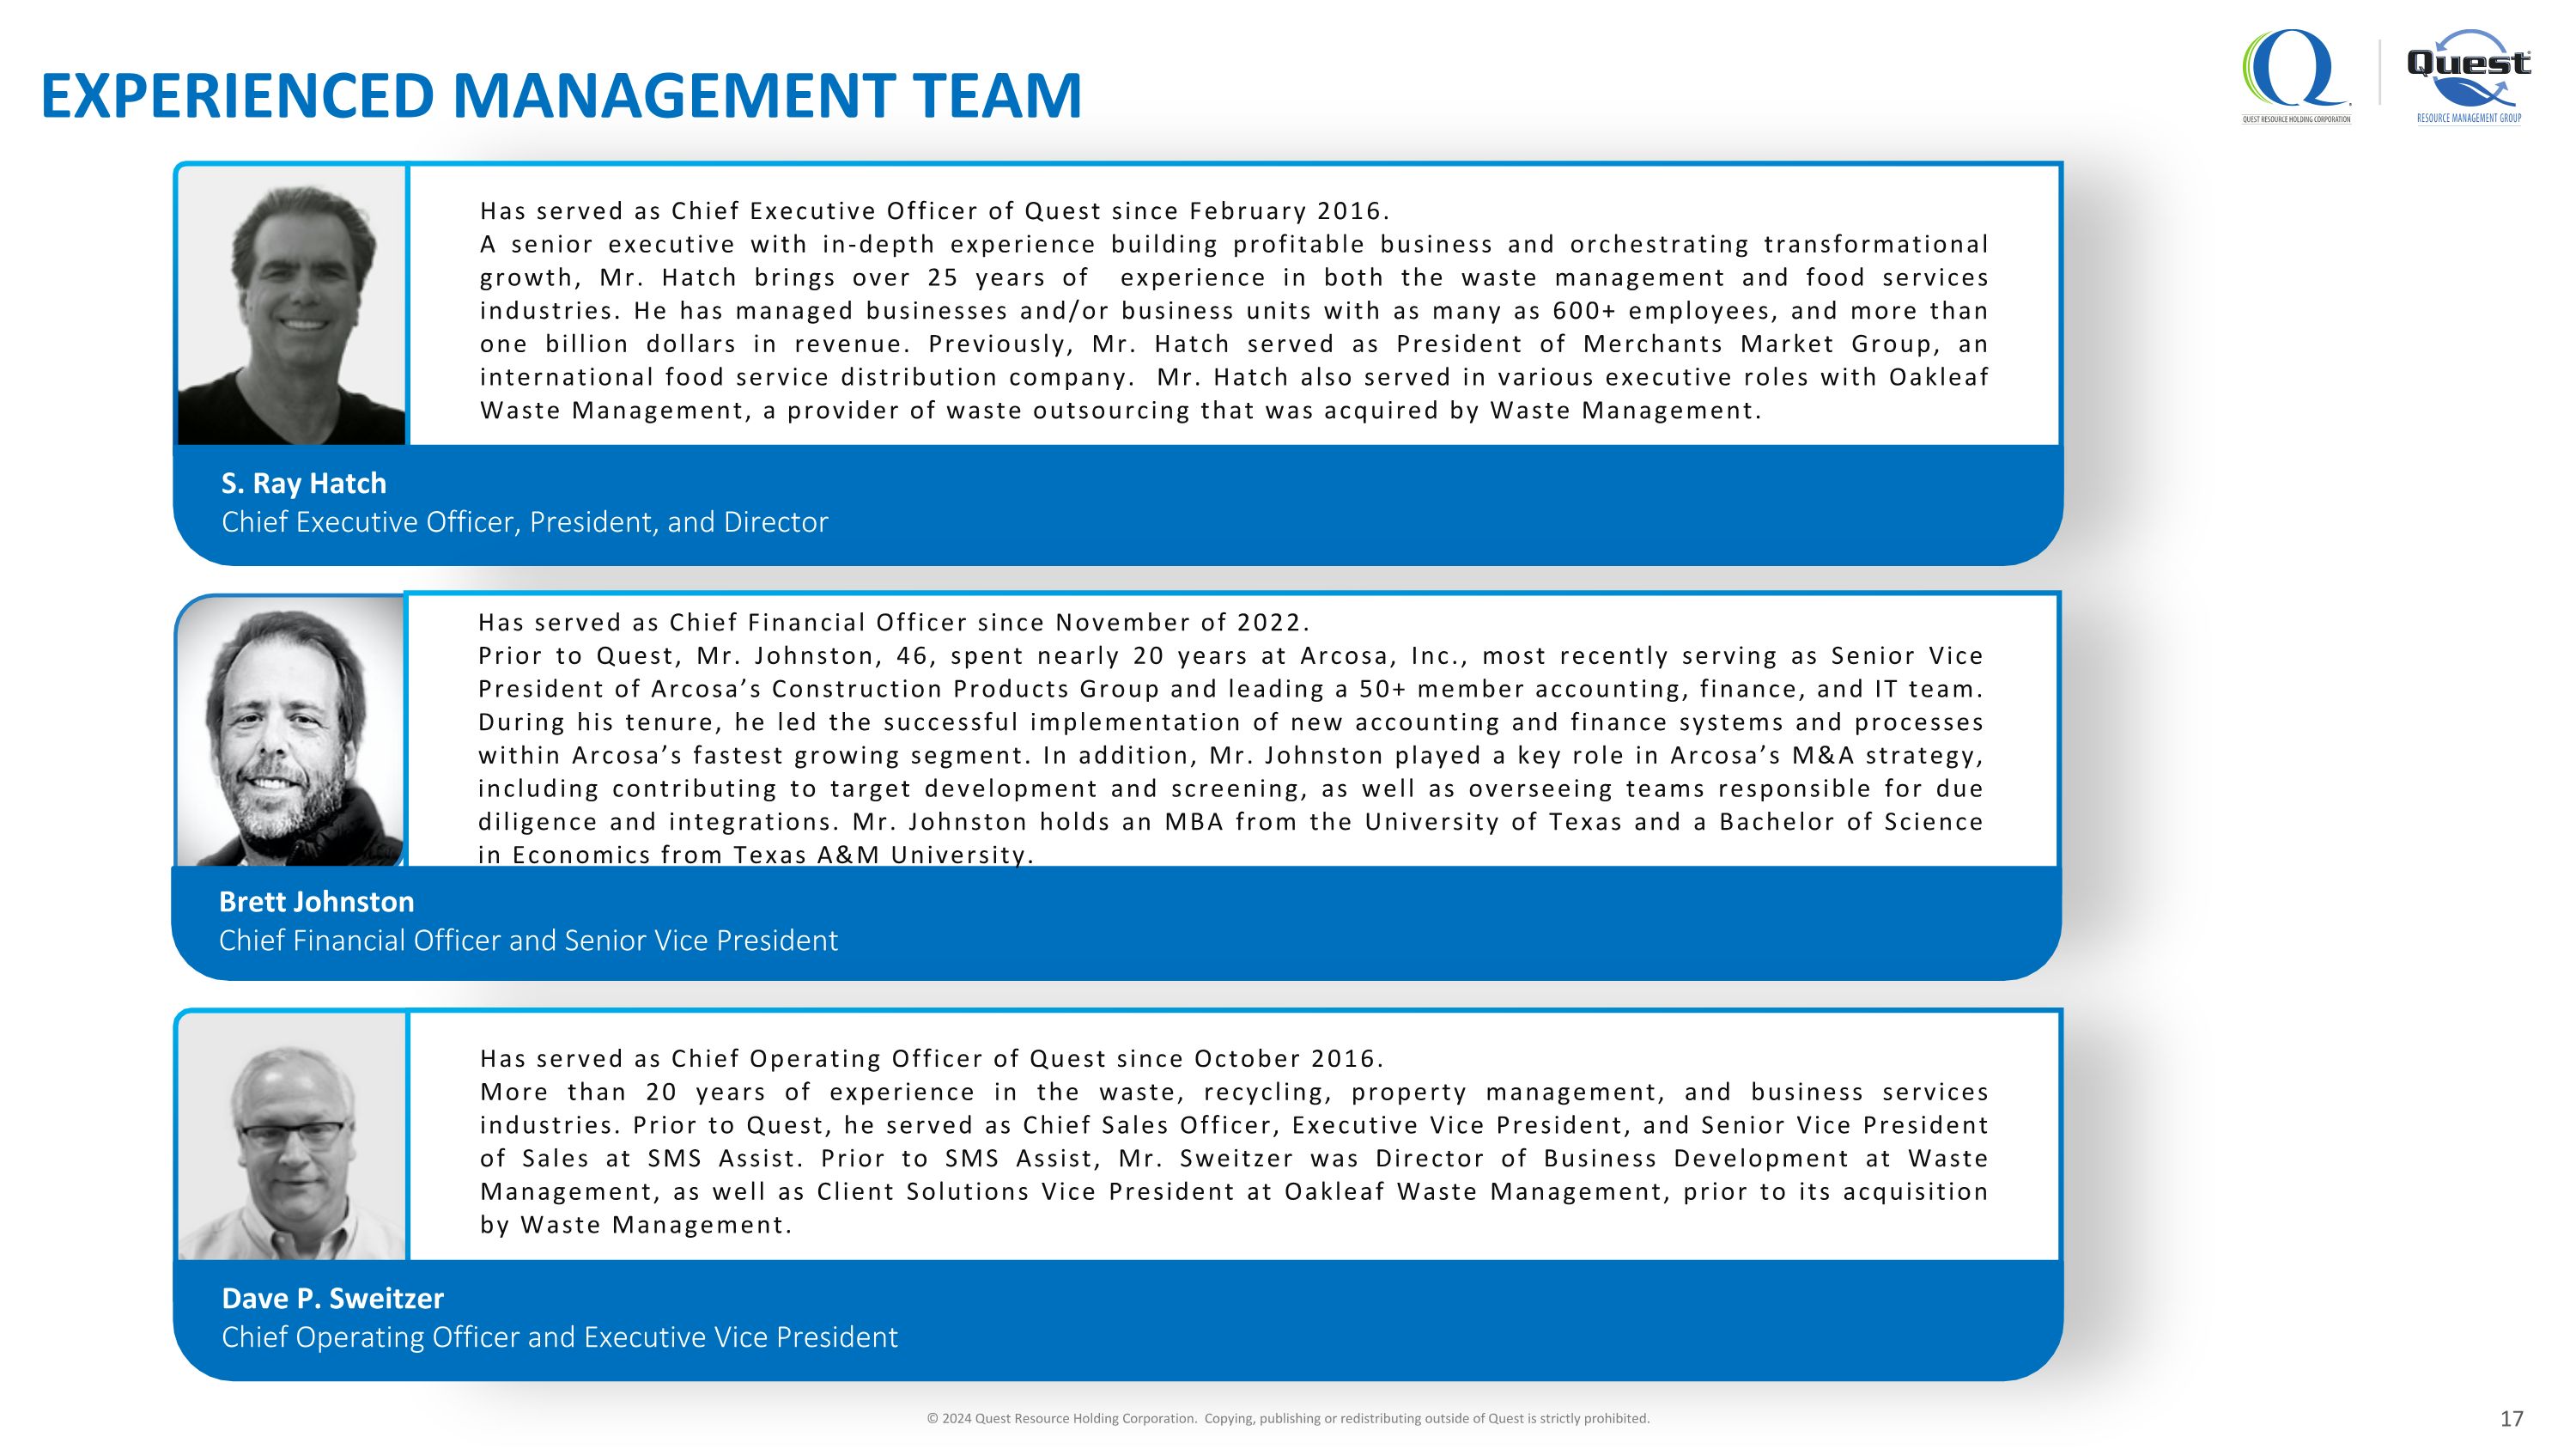
S. Ray Hatch Chief Executive Officer, President, and Director Has served as Chief Executive Officer of Quest since February 2016. A senior executive with in-depth experience building profitable business and orchestrating transformational growth, Mr. Hatch brings over 25 years of experience in both the waste management and food services industries. He has managed businesses and/or business units with as many as 600+ employees, and more than one billion dollars in revenue. Previously, Mr. Hatch served as President of Merchants Market Group, an international food service distribution company. Mr. Hatch also served in various executive roles with Oakleaf Waste Management, a provider of waste outsourcing that was acquired by Waste Management. Brett Johnston Chief Financial Officer and Senior Vice President Has served as Chief Financial Officer since November of 2022. Prior to Quest, Mr. Johnston, 46, spent nearly 20 years at Arcosa, Inc., most recently serving as Senior Vice President of Arcosa’s Construction Products Group and leading a 50+ member accounting, finance, and IT team. During his tenure, he led the successful implementation of new accounting and finance systems and processes within Arcosa’s fastest growing segment. In addition, Mr. Johnston played a key role in Arcosa’s M&A strategy, including contributing to target development and screening, as well as overseeing teams responsible for due diligence and integrations. Mr. Johnston holds an MBA from the University of Texas and a Bachelor of Science in Economics from Texas A&M University. Dave P. Sweitzer Chief Operating Officer and Executive Vice President Has served as Chief Operating Officer of Quest since October 2016. More than 20 years of experience in the waste, recycling, property management, and business services industries. Prior to Quest, he served as Chief Sales Officer, Executive Vice President, and Senior Vice President of Sales at SMS Assist. Prior to SMS Assist, Mr. Sweitzer was Director of Business Development at Waste Management, as well as Client Solutions Vice President at Oakleaf Waste Management, prior to its acquisition by Waste Management. EXPERIENCED MANAGEMENT TEAM © 2024 Quest Resource Holding Corporation. Copying, publishing or redistributing outside of Quest is strictly prohibited.
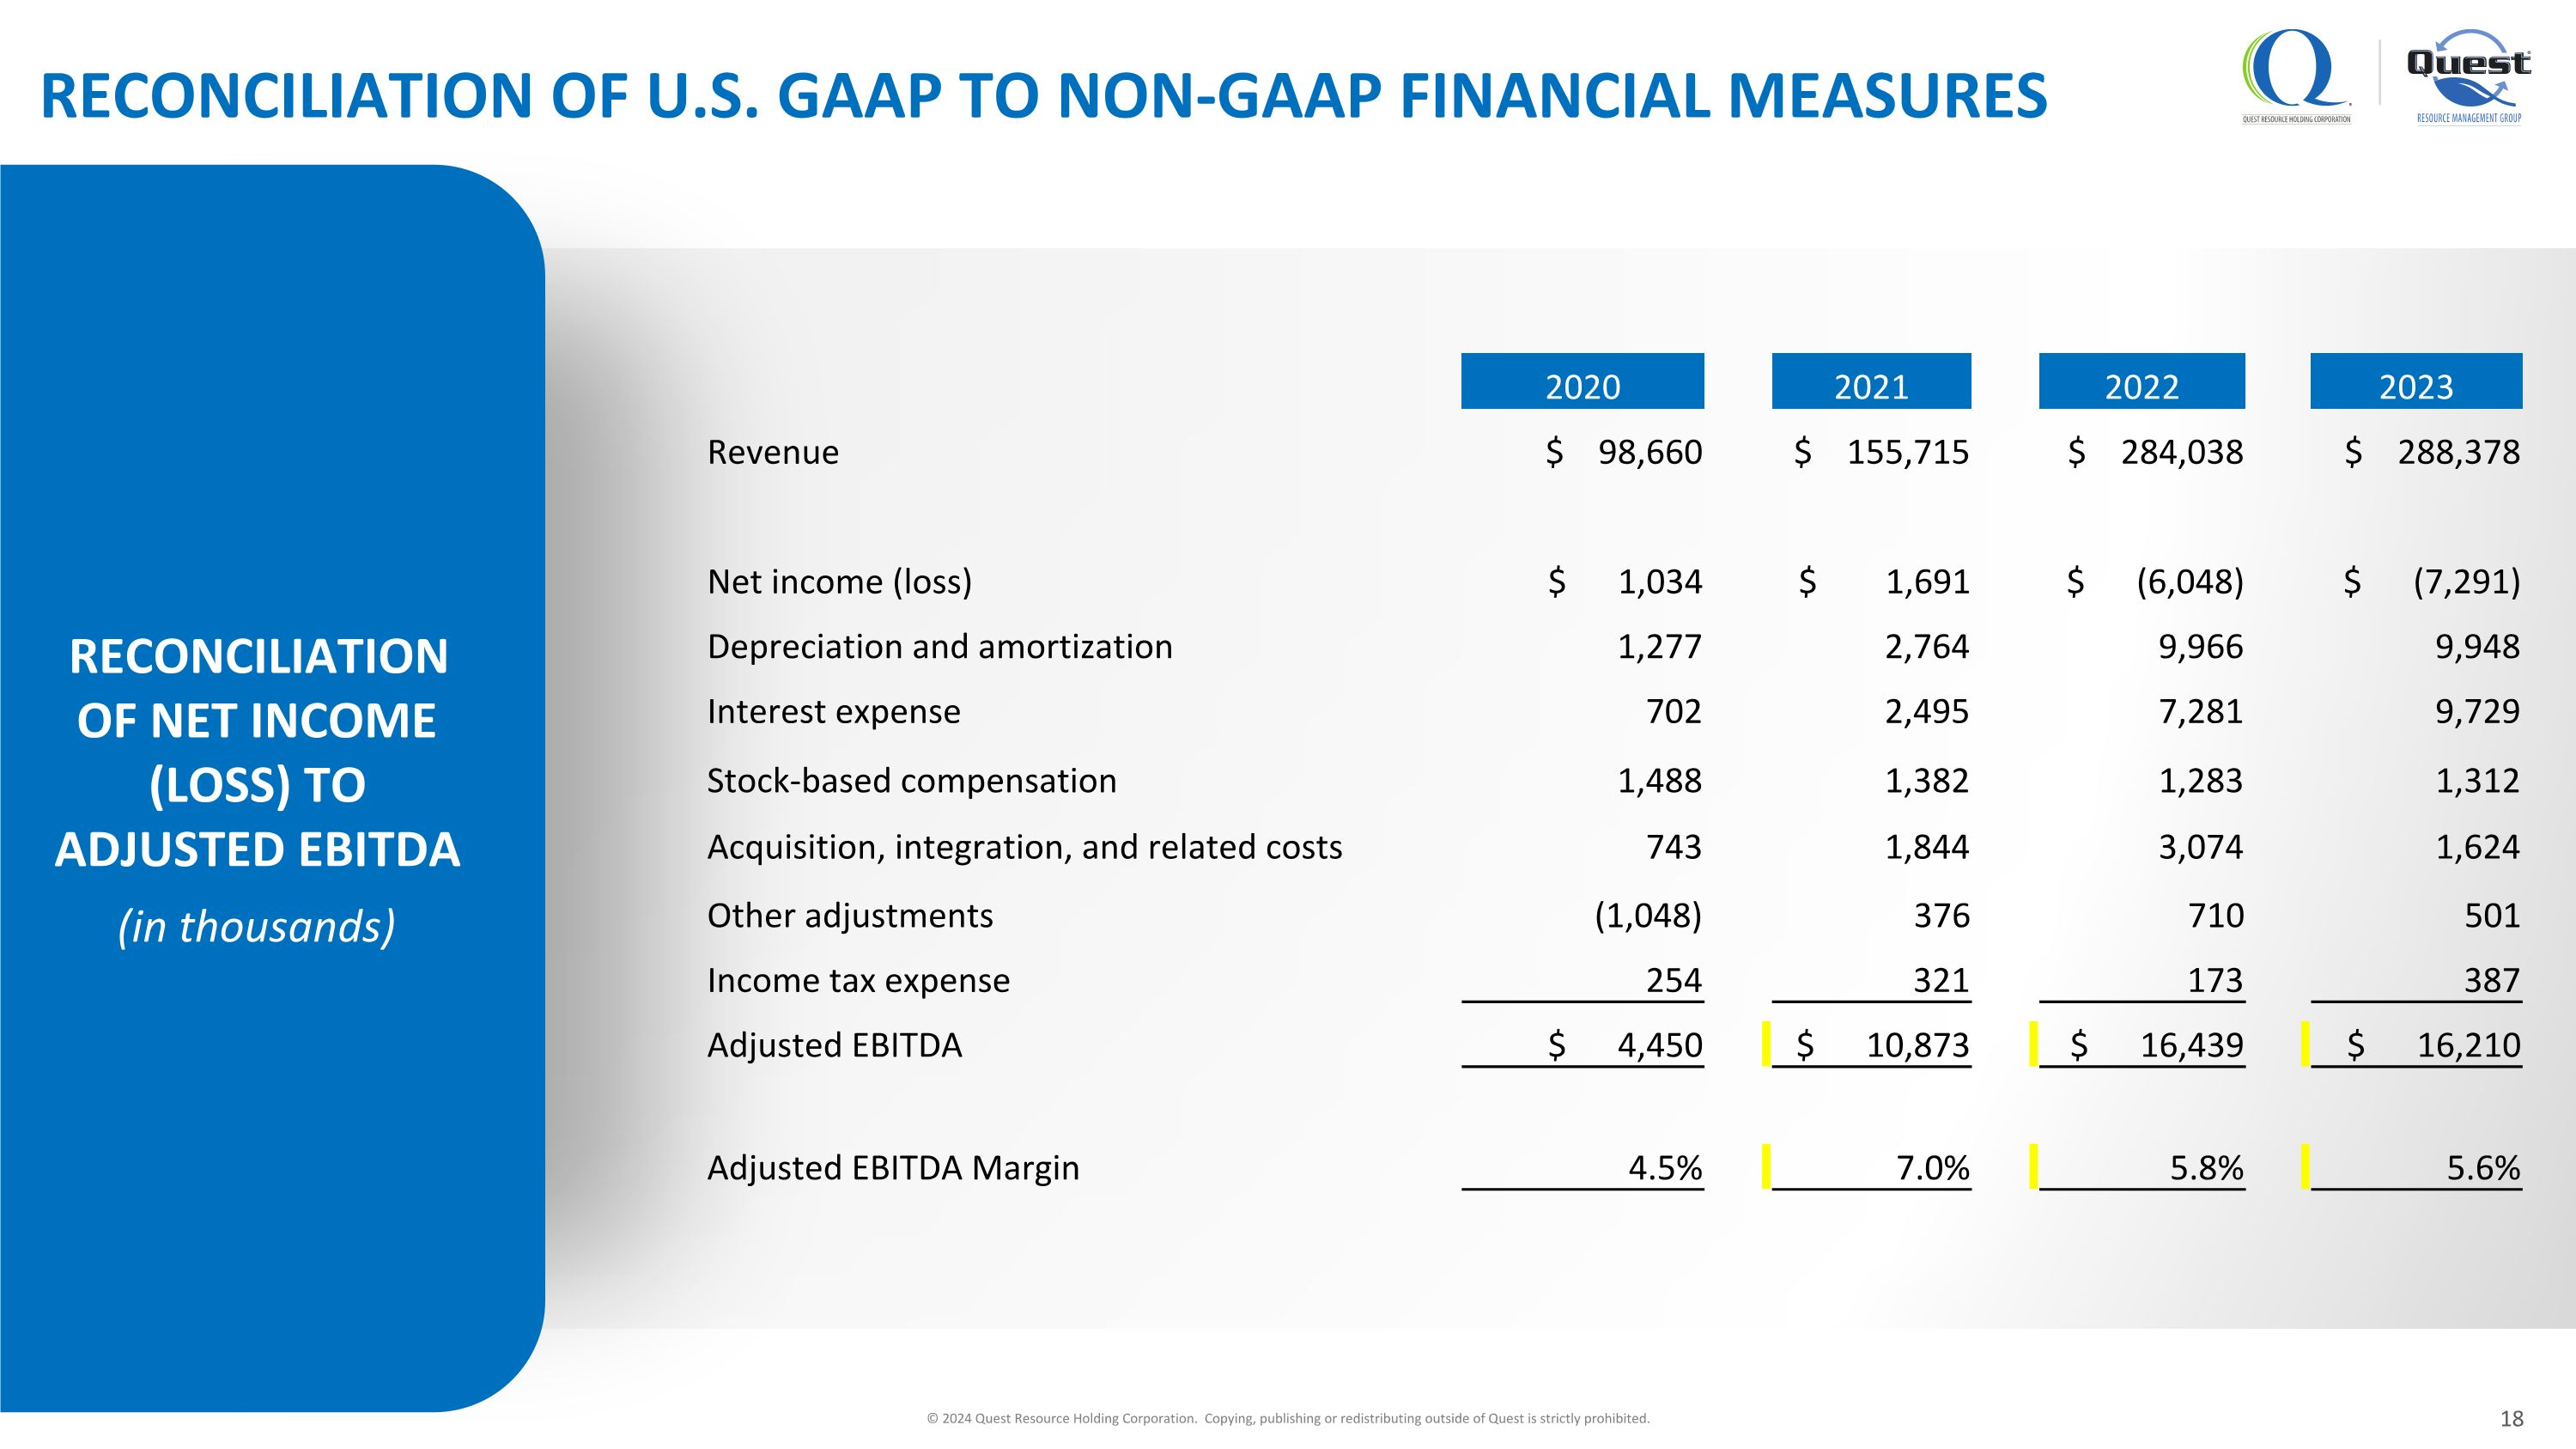
RECONCILIATION OF NET INCOME (LOSS) TO ADJUSTED EBITDA (in thousands) RECONCILIATION OF U.S. GAAP TO NON-GAAP FINANCIAL MEASURES 2020 2021 2022 2023 Revenue $ 98,660 $ 155,715 $ 284,038 $ 288,378 Net income (loss) $ 1,034 $ 1,691 $ (6,048) $ (7,291) Depreciation and amortization 1,277 2,764 9,966 9,948 Interest expense 702 2,495 7,281 9,729 Stock-based compensation 1,488 1,382 1,283 1,312 Acquisition, integration, and related costs 743 1,844 3,074 1,624 Other adjustments (1,048) 376 710 501 Income tax expense 254 321 173 387 Adjusted EBITDA $ 4,450 $ 10,873 $ 16,439 $ 16,210 Adjusted EBITDA Margin 4.5% 7.0% 5.8% 5.6% © 2024 Quest Resource Holding Corporation. Copying, publishing or redistributing outside of Quest is strictly prohibited.
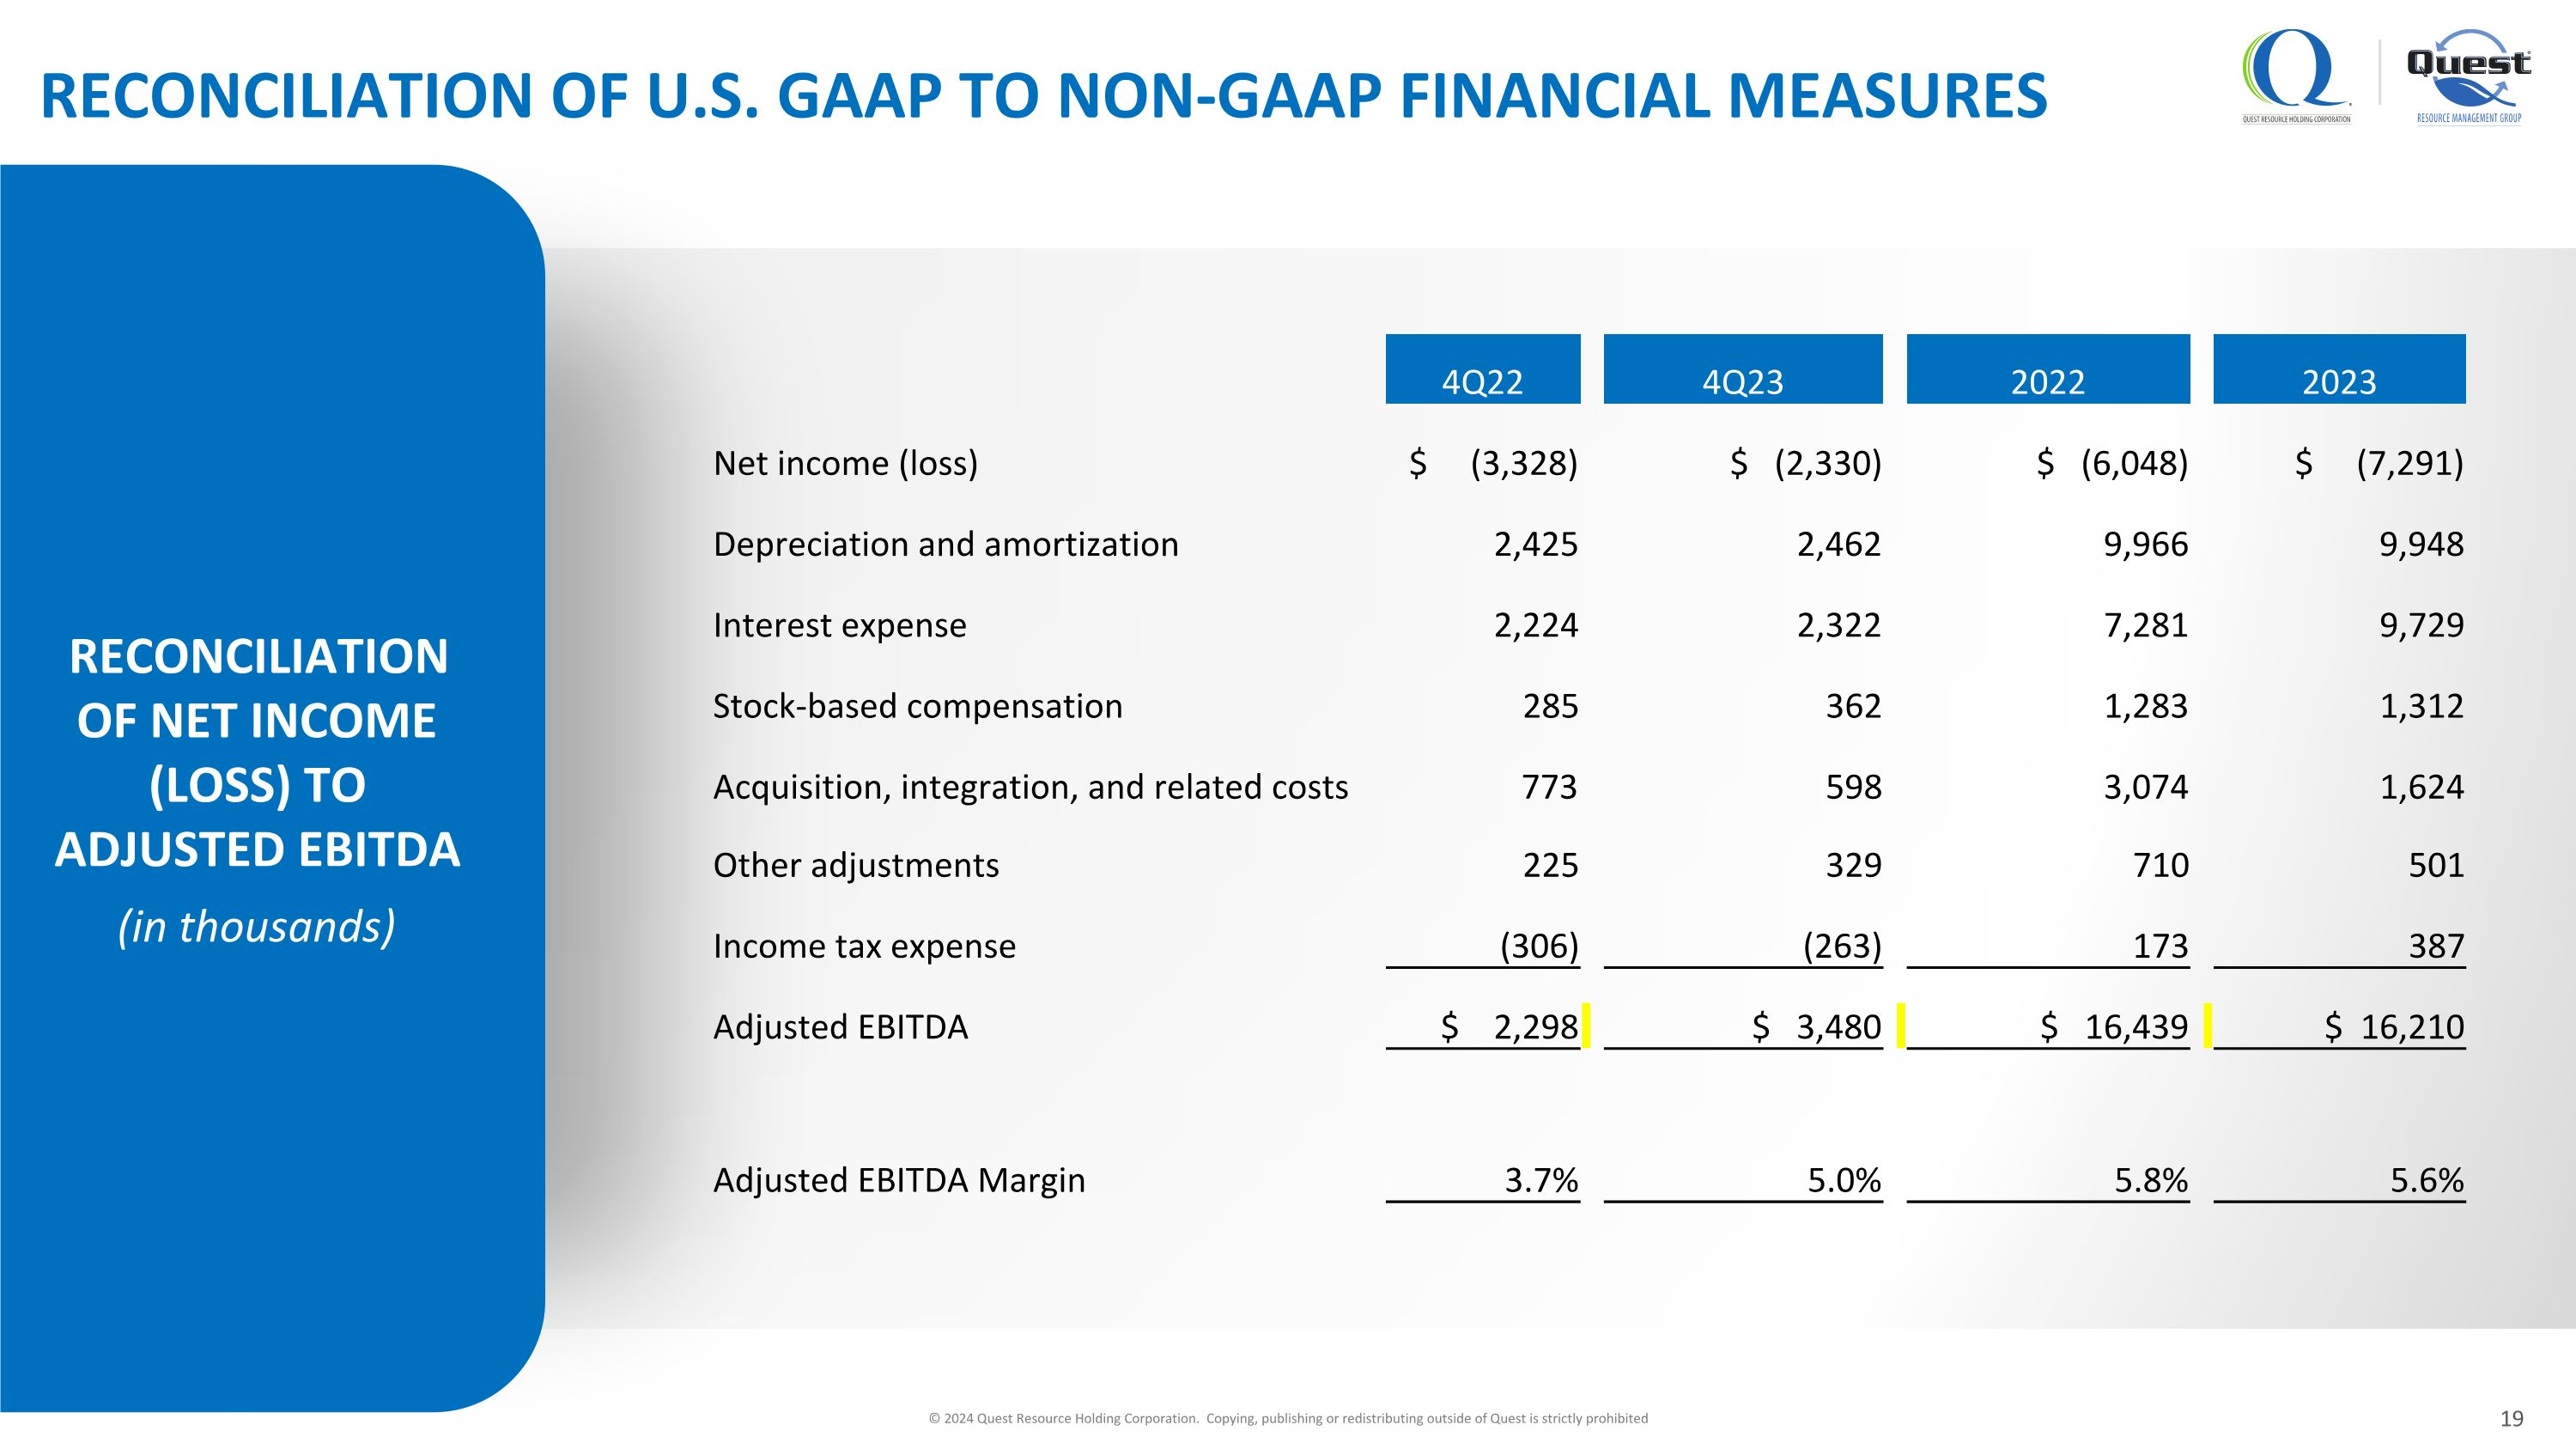
RECONCILIATION OF U.S. GAAP TO NON-GAAP FINANCIAL MEASURES © 2024 Quest Resource Holding Corporation. Copying, publishing or redistributing outside of Quest is strictly prohibited 4Q22 4Q23 2022 2023 Net income (loss) $ (3,328) $ (2,330) $ (6,048) $ (7,291) Depreciation and amortization 2,425 2,462 9,966 9,948 Interest expense 2,224 2,322 7,281 9,729 Stock-based compensation 285 362 1,283 1,312 Acquisition, integration, and related costs 773 598 3,074 1,624 Other adjustments 225 329 710 501 Income tax expense (306) (263) 173 387 Adjusted EBITDA $ 2,298 $ 3,480 $ 16,439 $ 16,210 Adjusted EBITDA Margin 3.7% 5.0% 5.8% 5.6% RECONCILIATION OF NET INCOME (LOSS) TO ADJUSTED EBITDA (in thousands)
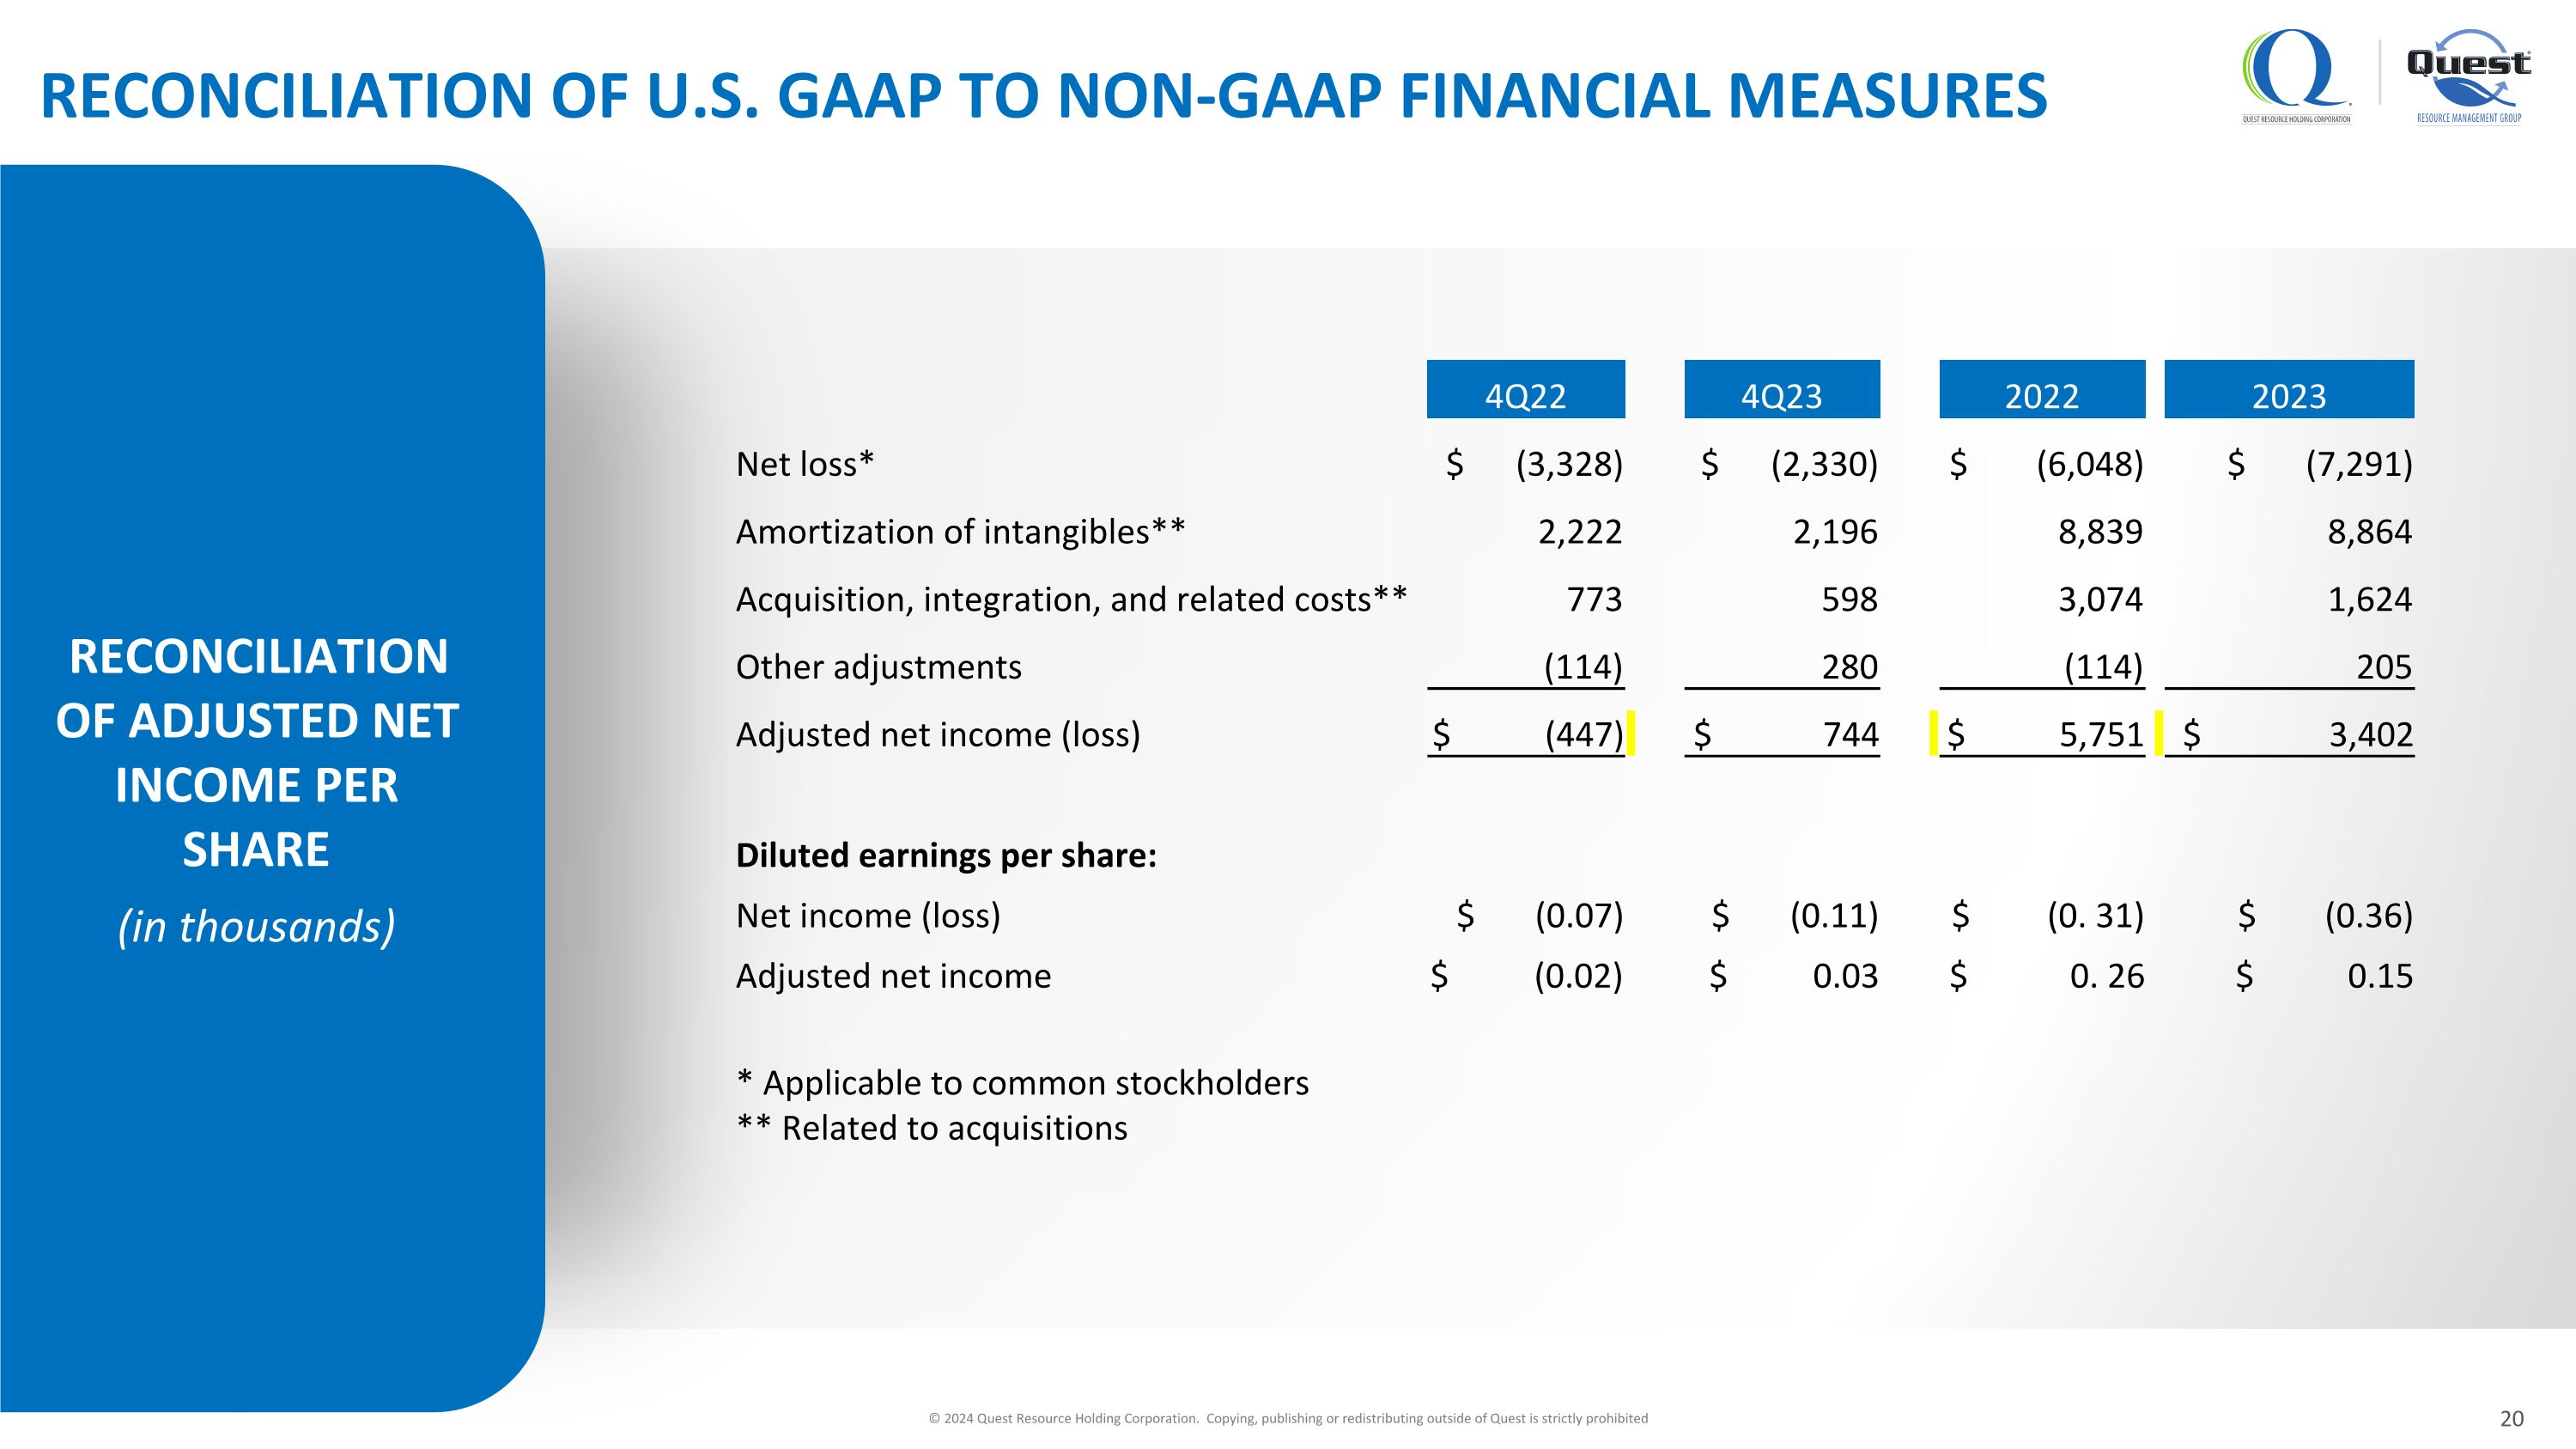
RECONCILIATION OF U.S. GAAP TO NON-GAAP FINANCIAL MEASURES © 2024 Quest Resource Holding Corporation. Copying, publishing or redistributing outside of Quest is strictly prohibited RECONCILIATION OF ADJUSTED NET INCOME PER SHARE (in thousands) 4Q22 4Q23 2022 2023 Net loss* $ (3,328) $ (2,330) $ (6,048) $ (7,291) Amortization of intangibles** 2,222 2,196 8,839 8,864 Acquisition, integration, and related costs** 773 598 3,074 1,624 Other adjustments (114) 280 (114) 205 Adjusted net income (loss) $ (447) $ 744 $ 5,751 $ 3,402 Diluted earnings per share: Net income (loss) $ (0.07) $ (0.11) $ (0. 31) $ (0.36) Adjusted net income $ (0.02) $ 0.03 $ 0. 26 $ 0.15 * Applicable to common stockholders ** Related to acquisitions
3481 Plano Pkwy. The Colony, TX 75056 877.321.1811 www.QuestRMG.com DAVE SWEITZER Chief Operations Officer RAY HATCH Chief Executive Officer BRETT JOHNSTON Chief Financial Officer © 2024 Quest Resource Holding Corporation. Copying, publishing or redistributing outside of Quest is strictly prohibited.