UNITED STATES
SECURITIES AND EXCHANGE COMMISSION
WASHINGTON, D.C. 20549
FORM 8-K
CURRENT REPORT
Pursuant to Section 13 or 15(d) of the Securities Exchange Act of 1934
Date of Report (Date of earliest event reported): February 21, 2024 |
BROADSTONE NET LEASE, INC.
(Exact name of Registrant as Specified in Its Charter)
Maryland |
001-39529 |
26-1516177 |
||
(State or Other Jurisdiction |
(Commission File Number) |
(IRS Employer |
||
|
|
|
|
|
|
207 High Point Drive Suite 300 |
|
|||
Victor, New York |
|
14564 |
||
(Address of Principal Executive Offices) |
|
(Zip Code) |
||
Registrant’s Telephone Number, Including Area Code: 585 287-6500 |
N/A |
(Former Name or Former Address, if Changed Since Last Report)
Check the appropriate box below if the Form 8-K filing is intended to simultaneously satisfy the filing obligation of the registrant under any of the following provisions:
Securities registered pursuant to Section 12(b) of the Act:
|
|
Trading |
|
|
Common Stock, $0.00025 par value |
|
BNL |
|
The New York Stock Exchange |
Indicate by check mark whether the registrant is an emerging growth company as defined in Rule 405 of the Securities Act of 1933 (§ 230.405 of this chapter) or Rule 12b-2 of the Securities Exchange Act of 1934 (§ 240.12b-2 of this chapter).
Emerging growth company ☐
If an emerging growth company, indicate by check mark if the registrant has elected not to use the extended transition period for complying with any new or revised financial accounting standards provided pursuant to Section 13(a) of the Exchange Act. ☐
Item 2.02 Results of Operations and Financial Condition.
On February 21, 2024, Broadstone Net Lease, Inc. (the “Company”) issued a press release announcing its financial results for the quarter ended December 31, 2023. A copy of the press release is attached hereto as Exhibit 99.1 and is incorporated herein by reference. Additionally, on February 21, 2024, the Company made available on its website an updated presentation containing quarterly supplemental information pertaining to its operations and financial results including the quarter ended December 31, 2023. A copy of the quarterly supplemental information is attached hereto as Exhibit 99.2 and is incorporated herein by reference. The press release and quarterly supplemental information are also available on the Company’s website.
The information contained in this Item 2.02, including the information contained in the press release attached as Exhibit 99.1 hereto and quarterly supplemental information attached as Exhibit 99.2 hereto, are being “furnished” and shall not be deemed to be “filed” for purposes of Section 18 of the Securities Exchange Act of 1934, as amended (the “Exchange Act”), or otherwise subject to the liabilities of that section, nor shall such information be deemed to be incorporated by reference in any filing under the Securities Act of 1933, as amended, or the Exchange Act, except as shall be expressly set forth by specific reference in such filing. References to the Company’s website in this Current Report on Form 8-K and in the attached Exhibit 99.1 and Exhibit 99.2 to this Current Report on Form 8-K do not incorporate by reference the information on such website into this Current Report on Form 8-K and the Company disclaims any such incorporation by reference.
Item 7.01 Regulation FD Disclosure.
Also on February 21, 2024, the Company posted its fourth quarter investor presentation on its website. The investor presentation, which members of the Company’s management may use in connection with upcoming investor presentations, is attached hereto as Exhibit 99.3 and is incorporated herein by reference.
The information contained in this Item 7.01, including the information contained in the investor presentation attached as Exhibit 99.3, are being “furnished” and shall not be deemed to be “filed” for purposes of Section 18 of the Securities Exchange Act of 1934, as amended (the “Exchange Act”), or otherwise subject to the liabilities of that section, nor shall such information be deemed to be incorporated by reference in any filing under the Securities Act of 1933, as amended, or the Exchange Act, except as shall be expressly set forth by specific reference in such filing. References to the Company’s website in this Current Report on Form 8-K and in the attached Exhibit 99.3 to this Current Report on Form 8-K do not incorporate by reference the information on such website into this Current Report on Form 8-K and the Company disclaims any such incorporation by reference.
Item 9.01 Financial Statements and Exhibits.
(d) |
Exhibits |
INDEX TO EXHIBITS
Exhibit No. |
|
Description |
|
|
|
99.1 |
|
|
99.2 |
|
Quarterly Supplemental Information for the Quarter Ended December 31, 2023 |
99.3 |
|
|
104 |
|
Cover Page Interactive Data File - the cover page XBRL tags are embedded within the Inline XBRL document. |
SIGNATURES
Pursuant to the requirements of the Securities Exchange Act of 1934, the registrant has duly caused this report to be signed on its behalf by the undersigned thereunto duly authorized.
|
|
|
BROADSTONE NET LEASE, INC. |
|
|
|
|
Date: |
February 21, 2024 |
By: |
/s/ John D. Callan |
|
|
|
Name: John D. Callan |
EXHIBIT 99.1
For Immediate Release
February 21, 2024
|
Company Contact:
Brent Maedl Director, Corporate Finance & Investor Relations brent.maedl@broadstone.com 585.382.8507 |
|
Broadstone Net Lease Announces 2023 Results and its Healthcare Portfolio Simplification Strategy
VICTOR, N.Y. – Broadstone Net Lease, Inc. (NYSE: BNL) (“BNL”, the “Company”, “we”, “our”, or “us”), today announced its operating results for the year and quarter ended December 31, 2023, and its healthcare portfolio simplification strategy.
MANAGEMENT COMMENTARY
“I am incredibly proud of our 2023 results, which we were able to deliver despite significant economic headwinds and capital market volatility through the year. We thoughtfully navigated a challenging environment by intentionally focusing on portfolio composition and quality which we believe will be the catalyst for increasing shareholder value as markets stabilize,” said John Moragne, BNL’s Chief Executive Officer. “We employed a disciplined and selective approach to all aspects of our investment cycle: intentionally evading risk and creatively sourcing investment opportunities that were created by the distressed lending environment and complementary to our core competencies and asset classes; maintaining a high quality portfolio of diversified properties with strong operating metrics; pruning tenant credit risk and lease rollover risk through selective dispositions with attractive spreads to redeployment yields; and maintaining a fortified investment grade balance sheet with low leverage at 5.0x, no material debt maturities until 2026, and ample liquidity to capitalize on additional investment opportunities. As a result, we were able to achieve $1.41 per share of AFFO, in line with the midpoint of our guidance range.”
FULL YEAR 2023 HIGHLIGHTS
INVESTMENT ACTIVITY |
•
We completed investments totaling $165.6 million, including $97.2 million in development fundings, $42.8 million in revenue generating capital expenditures, and $25.6 million in new property acquisitions. The revenue generating capital expenditures and new property acquisitions had a weighted average initial cash capitalization rate of 7.2%, lease term of 15.5 years, and annual rent increase of 1.8%.
•
In 2023 and through the date of this release, we sold 14 properties for gross proceeds of $200.1 million at a weighted average cash capitalization rate of 6.0% on tenanted properties. The gross proceeds represented a $35.0 million gain over original purchase price.
•
Subsequent to year-end, we invested an additional $12.3 million in development fundings and $3.0 million in revenue generating capital expenditures. As of the date of this release, we have $97.1 million of acquisitions under control, $98.9 million of commitments to fund developments, and $6.8 million of commitments to fund revenue generating capital expenditures with existing tenants.
•
Subsequent to year end, we executed contracts to sell 37 clinical, surgical, and traditional medical office building (“MOB”) properties for approximately $253.0 million at a weighted average cash capitalization rate of 7.9%. The agreed upon sales price represents a gain of $0.8 million over their original purchase price. See Healthcare Portfolio Simplification Strategy section below for additional information.
|
|
OPERATING RESULTS |
•
Collected 99.8% of base rents due for the year for all properties under lease.
•
Portfolio was 99.4% leased based on rentable square footage, with only two of our 796 properties vacant and not subject to a lease at year end.
•
Incurred $39.4 million of general and administrative expenses, inclusive of $6.0 million of stock-based compensation and $1.6 million of severance and executive transition costs.
•
Generated net income of $163.3 million, or $0.83 per share.
•
Generated adjusted funds from operations (“AFFO”) of $277.7 million, or $1.41 per share, in-line with the midpoint of our guidance range.
|
CAPITAL MARKETS ACTIVITY |
•
Ended the year with total outstanding debt of $1.9 billion, Net Debt of $1.9 billion, and a Net Debt to Annualized Adjusted EBITDAre ratio (“Leverage Ratio”) of 5.0x.
•
At December 31, 2023, had $909.6 million of capacity on our Revolving Credit Facility.
•
At December 31, 2023, had $145.4 million of capacity remaining on our at-the-market common equity offering (“ATM Program”).
•
On March 14, 2023, our board of directors approved a $150.0 million common stock repurchase program. We did not repurchase any shares under the Repurchase Program during the year.
•
Declared dividends of $1.12 in 2023, representing a 3.7% increase over prior year.
•
At its February 16, 2024, meeting, our Board of Directors declared a quarterly dividend of $0.285 per common share and OP Unit to holders of record as of March 29, 2024, payable on or before April 15, 2024.
|
FOURTH QUARTER 2023 HIGHLIGHTS
INVESTMENT ACTIVITY |
•
During the fourth quarter, we invested $64.1 million in three industrial properties and two restaurant properties, including $47.9 million in both new and existing development fundings and $16.2 million in revenue generating capital expenditures. Revenue generating capital expenditures had a weighted average initial cash capitalization rate of 7.5%, lease term of 12.7 years, and annual rent increase of 1.5%.
•
During the fourth quarter, we sold five properties for gross proceeds of $16.5 million at a weighted average cash capitalization rate of 6.7%, representing a $5.3 million gain over their original purchase price.
|
|
OPERATING RESULTS |
•
Collected 99.2% of base rents due for the fourth quarter for all properties subject to a lease. Outstanding base rents relate solely to Green Valley Medical Center, whereby rents were scheduled to commence in October 2023.
•
Incurred $9.4 million of general and administrative expenses, inclusive of $1.4 million of stock-based compensation and $0.2 million of severance and executive transition costs.
•
Generated net income of $6.8 million, or $0.03 per diluted share.
•
Generated AFFO of $71.3 million, or $0.36 per share.
|
HEALTHCARE PORTFOLIO SIMPLIFICATION STRATEGY
Subsequent to quarter end, we made the strategic decision to sell our clinically-oriented healthcare properties, furthering our focus on core net lease assets in the industrial, retail, and restaurant sectors. The assets identified for sale are not customarily included in single tenant net lease portfolios and include clinical, surgical, and traditional MOB properties. These types of assets generally have shorter lease durations, greater landlord responsibilities, longer potential downtime upon lease maturity, and in some cases, greater potential challenges with tenants. The characteristics of these assets can make them attractive for a dedicated healthcare property investor and manager, but those same characteristics can make them challenging in the net lease space.
In total, we have identified 75 healthcare assets for sale that account for approximately 11% of total annualized base rent (“ABR”) with proceeds expected to be redeployed into our core industrial, retail, and restaurant assets. On a proforma basis as of December 31, 2023, the sale of all clinically-oriented healthcare properties will reduce our healthcare assets from 17.6% to 7.5% of our portfolio based on ABR, and our scheduled healthcare lease maturities through 2030 by 76.2%.
Of the properties identified for sale, we have executed contracts on 37 healthcare properties for approximately $253.0 million at a weighted average cash capitalization rate of 7.9%, representing a $0.8 million gain over original purchase price. The properties represent approximately $19.9 million or 5.1% of our December 31, 2023 ABR, 28.7% of our healthcare portfolio, and have a weighted average remaining lease term of 4.7 years. We anticipate the transactions will close during the first quarter of 2024. The remaining healthcare properties identified for sale are in varying stages of sales efforts.
2
Following the sales, the remaining assets in our healthcare portfolio will consist of consumer-centric medical properties that are customary for many publicly-traded net lease REITs, examples of which include plasma, dialysis, and veterinary services; assets with real estate fundamentals critical to the tenant’s business and little to no regulatory risk. Refer to our fourth quarter 2023 investor presentation for more detailed information regarding our healthcare portfolio simplification strategy.
As part of our healthcare portfolio simplification strategy, we made the decision to sell Green Valley Medical Center after the tenant failed to pay rent since October 2023 as the result of not meeting certain operational thresholds, and we are actively marketing the property through the date of this release. The decision resulted in us recognizing approximately $26.4 million of impairment during the quarter, and the tenant’s unpaid rents represent the only outstanding rents of our 99.2% quarterly rent collections. The tenant is responsible for all ongoing property costs under the terms of the lease.
In reference to BNL’s healthcare portfolio simplification strategy, John Moragne, BNL’s Chief Executive Officer, said, “As I’ve highlighted in recent quarters, we continue to focus more heavily on net lease industrial assets, while continuing to have deep conviction in net lease retail and restaurant assets, and have taken a hard look at property types that don’t fit within our investment thesis, particularly clinical, surgical, and traditional medical office building assets. Tenant bankruptcies, hands-on property management, heavier landlord responsibilities and costs, and messaging complexity in these properties has been an unnecessary distraction from our otherwise prudent and successful capital allocations. Our healthcare portfolio simplification strategy is an extension of our focus on portfolio quality and evolution, which we believe will result in meaningful value creation for investors.”
SUMMARIZED FINANCIAL RESULTS
|
|
For the Year Ended |
|
|
For the Three Months Ended |
|
||||||||||||||
(in thousands, except per share data) |
|
December 31, |
|
|
December 31, |
|
|
December 31, |
|
|
September 30, |
|
|
December 31, |
|
|||||
Revenues |
|
$ |
442,888 |
|
|
$ |
407,513 |
|
|
$ |
105,000 |
|
|
$ |
109,543 |
|
|
$ |
112,135 |
|
|
|
|
|
|
|
|
|
|
|
|
|
|
|
|
|
|||||
Net income, including non-controlling interests |
|
$ |
163,312 |
|
|
$ |
129,475 |
|
|
$ |
6,797 |
|
|
$ |
52,145 |
|
|
$ |
36,773 |
|
Net earnings per share - diluted |
|
$ |
0.83 |
|
|
$ |
0.72 |
|
|
$ |
0.03 |
|
|
$ |
0.26 |
|
|
$ |
0.20 |
|
|
|
|
|
|
|
|
|
|
|
|
|
|
|
|
|
|||||
FFO |
|
$ |
298,622 |
|
|
$ |
273,730 |
|
|
$ |
69,443 |
|
|
$ |
75,478 |
|
|
$ |
71,718 |
|
FFO per share |
|
$ |
1.52 |
|
|
$ |
1.52 |
|
|
$ |
0.35 |
|
|
$ |
0.39 |
|
|
$ |
0.39 |
|
|
|
|
|
|
|
|
|
|
|
|
|
|
|
|
|
|||||
Core FFO |
|
$ |
298,883 |
|
|
$ |
267,265 |
|
|
$ |
75,275 |
|
|
$ |
74,754 |
|
|
$ |
70,527 |
|
Core FFO per share |
|
$ |
1.52 |
|
|
$ |
1.48 |
|
|
$ |
0.38 |
|
|
$ |
0.38 |
|
|
$ |
0.38 |
|
|
|
|
|
|
|
|
|
|
|
|
|
|
|
|
|
|||||
AFFO |
|
$ |
277,725 |
|
|
$ |
252,173 |
|
|
$ |
71,278 |
|
|
$ |
69,958 |
|
|
$ |
65,585 |
|
AFFO per share |
|
$ |
1.41 |
|
|
$ |
1.40 |
|
|
$ |
0.36 |
|
|
$ |
0.36 |
|
|
$ |
0.36 |
|
|
|
|
|
|
|
|
|
|
|
|
|
|
|
|
|
|||||
Diluted Weighted Average Shares Outstanding |
|
|
196,315 |
|
|
|
180,201 |
|
|
|
196,373 |
|
|
|
196,372 |
|
|
|
183,592 |
|
FFO, Core FFO, and AFFO are measures that are not calculated in accordance with accounting principles generally accepted in the United States of America (“GAAP”). See the Reconciliation of Non-GAAP Measures later in this press release.
REAL ESTATE PORTFOLIO UPDATE
As of December 31, 2023, we owned a diversified portfolio of 796 individual net leased commercial properties with 789 properties located in 44 U.S. states and seven properties located in four Canadian provinces, comprising approximately 38.3 million rentable square feet of operational space. As of December 31, 2023, all but two of our properties were subject to a lease, and our properties were occupied by 220 different commercial tenants, with no single tenant accounting for more than 4.1% of ABR. Properties subject to a lease represent 99.4% of our portfolio's rentable square footage. The ABR weighted average lease term and ABR weighted average annual minimum rent increase, pursuant to leases on properties in the portfolio as of December 31, 2023, was 10.5 years and 2.0%, respectively.
3
BALANCE SHEET AND CAPITAL MARKETS ACTIVITIES
As of December 31, 2023, we had total outstanding debt of $1.9 billion, Net Debt of $1.9 billion, and a Leverage Ratio of 5.0x. We had $909.6 million of available capacity on our revolving credit facility as of year end, and have no material debt maturities until 2026.
We did not raise any equity during the quarter and year, and had approximately $145.4 million of capacity remaining on our ATM Program as of December 31, 2023.
DISTRIBUTIONS
At its February 16, 2024, meeting, our board of directors declared a quarterly dividend of $0.285 per common share and OP Unit to holders of record as of March 29, 2024, payable on or before April 15, 2024.
2024 GUIDANCE
For 2024, BNL expects to report AFFO of $1.41 per diluted share.
The guidance is based on the following key assumptions:
Our per share results are sensitive to both the timing and amount of real estate investments, property dispositions, and capital markets activities that occur throughout the year.
The Company does not provide guidance for the most comparable GAAP financial measure, net income, or a reconciliation of the forward-looking non-GAAP financial measure of AFFO to net income computed in accordance with GAAP, because it is unable to reasonably predict, without unreasonable efforts, certain items that would be contained in the GAAP measure, including items that are not indicative of the Company’s ongoing operations, including, without limitation, potential impairments of real estate assets, net gain/loss on dispositions of real estate assets, changes in allowance for credit losses, and stock-based compensation expense. These items are uncertain, depend on various factors, and could have a material impact on the Company’s GAAP results for the guidance periods.
CONFERENCE CALL AND WEBCAST
The company will host its fourth quarter earnings conference call and audio webcast on Thursday, February 22, 2024, at 11:00 a.m. Eastern Time.
To access the live webcast, which will be available in listen-only mode, please visit: https://events.q4inc.com/attendee/958546087. If you prefer to listen via phone, U.S. participants may dial: 1-833-470-1428 (toll free) or 1-404-975-4839 (local), access code 822981. International access numbers are viewable here: https://www.netroadshow.com/events/global-numbers?confId=59986.
A replay of the conference call webcast will be available approximately one hour after the conclusion of the live broadcast. To listen to a replay of the call via the web, which will be available for one year, please visit: https://investors.bnl.broadstone.com.
About Broadstone Net Lease, Inc.
BNL is an industrial-focused, diversified net lease REIT that invests in primarily single-tenant commercial real estate properties that are net leased on a long-term basis to a diversified group of tenants. Utilizing an investment strategy underpinned by strong fundamental credit analysis and prudent real estate underwriting, as of December 31, 2023, BNL’s diversified portfolio consisted of 796 individual net leased commercial properties with 789 properties located in 44 U.S. states and seven properties located in four Canadian provinces across the industrial, healthcare, restaurant, retail, and office property types.
4
Forward-Looking Statements
This press release contains “forward-looking” statements within the meaning of Section 27A of the Securities Act of 1933, as amended, and Section 21E of the Securities Exchange Act of 1934, as amended, regarding, among other things, our plans, strategies, and prospects, both business and financial. Such forward-looking statements can generally be identified by our use of forward-looking terminology such as “outlook,” “potential,” “may,” “will,” “should,” “could,” “seeks,” “approximately,” “projects,” “predicts,” “expect,” “intends,” “anticipates,” “estimates,” “plans,” “would be,” “believes,” “continues,” or the negative version of these words or other comparable words. Forward-looking statements, including our 2023 guidance and assumptions, involve known and unknown risks and uncertainties, which may cause BNL’s actual future results to differ materially from expected results, including, without limitation, risks and uncertainties related to general economic conditions, including but not limited to increases in the rate of inflation and/or interest rates, local real estate conditions, tenant financial health, property investments and acquisitions, and the timing and uncertainty of completing these property investments and acquisitions, and uncertainties regarding future distributions to our stockholders. These and other risks, assumptions, and uncertainties are described in Item 1A “Risk Factors” of the Company's Annual Report on Form 10-K for the fiscal year ended December 31, 2023, which BNL expects to file with the SEC on February 22, 2024, which you are encouraged to read, and will be available on the SEC’s website at www.sec.gov. Should one or more of these risks or uncertainties materialize, or should underlying assumptions prove incorrect, actual results may vary materially from those indicated or anticipated by such forward-looking statements. Accordingly, you are cautioned not to place undue reliance on these forward-looking statements, which speak only as of the date they are made. The Company assumes no obligation to, and does not currently intend to, update any forward-looking statements after the date of this press release, whether as a result of new information, future events, changes in assumptions, or otherwise.
Notice Regarding Non-GAAP Financial Measures
In addition to our reported results and net earnings per diluted share, which are financial measures presented in accordance with GAAP, this press release contains and may refer to certain non-GAAP financial measures, including Funds from Operations (“FFO”), Core Funds From Operations (“Core FFO”), Adjusted Funds from Operations (“AFFO”), Net Debt, and Net Debt to Annualized Adjusted EBITDAre. We believe the use of FFO, Core FFO, and AFFO are useful to investors because they are widely accepted industry measures used by analysts and investors to compare the operating performance of REITs. FFO, Core FFO, and AFFO should not be considered alternatives to net income as a performance measure or to cash flows from operations, as reported on our statement of cash flows, or as a liquidity measure, and should be considered in addition to, and not in lieu of, GAAP financial measures. We believe presenting Net Debt to Annualized Adjusted EBITDAre is useful to investors because it provides information about gross debt less cash and cash equivalents, which could be used to repay debt, compared to our performance as measured using Annualized Adjusted EBITDAre. You should not consider our Annualized Adjusted EBITDAre as an alternative to net income or cash flows from operating activities determined in accordance with GAAP. A reconciliation of non-GAAP measures to the most directly comparable GAAP financial measure and statements of why management believes these measures are useful to investors are included below.
5
Broadstone Net Lease, Inc. and Subsidiaries
Consolidated Balance Sheets
(in thousands, except per share amounts)
|
|
December 31, |
|
|
December 31, |
|
||
|
|
|
|
|
|
|
||
Assets |
|
|
|
|
|
|
||
Accounted for using the operating method: |
|
|
|
|
|
|
||
Land |
|
$ |
748,529 |
|
|
$ |
768,667 |
|
Land improvements |
|
|
328,746 |
|
|
|
340,385 |
|
Buildings and improvements |
|
|
3,803,156 |
|
|
|
3,888,756 |
|
Equipment |
|
|
8,265 |
|
|
|
10,422 |
|
Total accounted for using the operating method |
|
|
4,888,696 |
|
|
|
5,008,230 |
|
Less accumulated depreciation |
|
|
(626,597 |
) |
|
|
(533,965 |
) |
Accounted for using the operating method, net |
|
|
4,262,099 |
|
|
|
4,474,265 |
|
Accounted for using the direct financing method |
|
|
26,643 |
|
|
|
27,045 |
|
Accounted for using the sales-type method |
|
|
572 |
|
|
|
571 |
|
Property under development |
|
|
94,964 |
|
|
|
— |
|
Investment in rental property, net |
|
|
4,384,278 |
|
|
|
4,501,881 |
|
Cash and cash equivalents |
|
|
19,494 |
|
|
|
21,789 |
|
Accrued rental income |
|
|
152,724 |
|
|
|
135,666 |
|
Tenant and other receivables, net |
|
|
1,487 |
|
|
|
1,349 |
|
Prepaid expenses and other assets |
|
|
36,661 |
|
|
|
64,180 |
|
Interest rate swap, assets |
|
|
46,096 |
|
|
|
63,390 |
|
Goodwill |
|
|
339,769 |
|
|
|
339,769 |
|
Intangible lease assets, net |
|
|
288,226 |
|
|
|
329,585 |
|
Total assets |
|
$ |
5,268,735 |
|
|
$ |
5,457,609 |
|
|
|
|
|
|
|
|
||
Liabilities and equity |
|
|
|
|
|
|
||
Unsecured revolving credit facility |
|
$ |
90,434 |
|
|
$ |
197,322 |
|
Mortgages, net |
|
|
79,068 |
|
|
|
86,602 |
|
Unsecured term loans, net |
|
|
895,947 |
|
|
|
894,692 |
|
Senior unsecured notes, net |
|
|
845,309 |
|
|
|
844,555 |
|
Accounts payable and other liabilities |
|
|
47,534 |
|
|
|
47,547 |
|
Dividends payable |
|
|
56,869 |
|
|
|
54,460 |
|
Accrued interest payable |
|
|
5,702 |
|
|
|
7,071 |
|
Intangible lease liabilities, net |
|
|
53,531 |
|
|
|
62,855 |
|
Total liabilities |
|
|
2,074,394 |
|
|
|
2,195,104 |
|
|
|
|
|
|
|
|
||
Commitments and contingencies |
|
|
|
|
|
|
||
|
|
|
|
|
|
|
||
Equity |
|
|
|
|
|
|
||
Broadstone Net Lease, Inc. equity: |
|
|
|
|
|
|
||
Preferred stock, $0.001 par value; 20,000 shares authorized, no shares issued or outstanding |
|
|
— |
|
|
|
— |
|
Common stock, $0.00025 par value; 500,000 shares authorized, 187,614 and 186,114 shares issued and outstanding at December 31, 2023 and 2022, respectively |
|
|
47 |
|
|
|
47 |
|
Additional paid-in capital |
|
|
3,440,639 |
|
|
|
3,419,395 |
|
Cumulative distributions in excess of retained earnings |
|
|
(440,731 |
) |
|
|
(386,049 |
) |
Accumulated other comprehensive income |
|
|
49,286 |
|
|
|
59,525 |
|
Total Broadstone Net Lease, Inc. equity |
|
|
3,049,241 |
|
|
|
3,092,918 |
|
Non-controlling interests |
|
|
145,100 |
|
|
|
169,587 |
|
Total equity |
|
|
3,194,341 |
|
|
|
3,262,505 |
|
Total liabilities and equity |
|
$ |
5,268,735 |
|
|
$ |
5,457,609 |
|
6
Broadstone Net Lease, Inc. and Subsidiaries
Consolidated Statements of Income and Comprehensive Income
(in thousands, except per share amounts)
|
|
(Unaudited) |
|
|
|
|
||||||||||
|
|
For the Three Months Ended |
|
|
For the Year Ended |
|
||||||||||
|
|
December 31, |
|
|
September 30, |
|
|
December 31, |
|
|
December 31, |
|
||||
Revenues |
|
|
|
|
|
|
|
|
|
|
|
|
||||
Lease revenues, net |
|
$ |
105,000 |
|
|
$ |
109,543 |
|
|
$ |
442,888 |
|
|
$ |
407,513 |
|
|
|
|
|
|
|
|
|
|
|
|
|
|
||||
Operating expenses |
|
|
|
|
|
|
|
|
|
|
|
|
||||
Depreciation and amortization |
|
|
39,278 |
|
|
|
38,533 |
|
|
|
158,626 |
|
|
|
154,807 |
|
Property and operating expense |
|
|
5,995 |
|
|
|
5,707 |
|
|
|
22,576 |
|
|
|
21,773 |
|
General and administrative |
|
|
9,383 |
|
|
|
10,143 |
|
|
|
39,425 |
|
|
|
37,375 |
|
Provision for impairment of investment in rental properties |
|
|
29,801 |
|
|
|
— |
|
|
|
31,274 |
|
|
|
5,535 |
|
Total operating expenses |
|
|
84,457 |
|
|
|
54,383 |
|
|
|
251,901 |
|
|
|
219,490 |
|
|
|
|
|
|
|
|
|
|
|
|
|
|
||||
Other (expenses) income |
|
|
|
|
|
|
|
|
|
|
|
|
||||
Interest income |
|
|
141 |
|
|
|
127 |
|
|
|
512 |
|
|
|
44 |
|
Interest expense |
|
|
(18,972 |
) |
|
|
(19,665 |
) |
|
|
(80,053 |
) |
|
|
(78,652 |
) |
Gain on sale of real estate |
|
|
6,270 |
|
|
|
15,163 |
|
|
|
54,310 |
|
|
|
15,953 |
|
Income taxes |
|
|
268 |
|
|
|
(104 |
) |
|
|
(763 |
) |
|
|
(1,275 |
) |
Other (expenses) income |
|
|
(1,453 |
) |
|
|
1,464 |
|
|
|
(1,681 |
) |
|
|
5,382 |
|
Net income |
|
|
6,797 |
|
|
|
52,145 |
|
|
|
163,312 |
|
|
|
129,475 |
|
Net income attributable to non-controlling interests |
|
|
(319 |
) |
|
|
(2,463 |
) |
|
|
(7,834 |
) |
|
|
(7,360 |
) |
Net income attributable to Broadstone Net |
|
$ |
6,478 |
|
|
$ |
49,682 |
|
|
$ |
155,478 |
|
|
$ |
122,115 |
|
|
|
|
|
|
|
|
|
|
|
|
|
|
||||
Weighted average number of common shares outstanding |
|
|||||||||||||||
Basic |
|
|
186,829 |
|
|
|
186,766 |
|
|
|
186,617 |
|
|
|
169,840 |
|
Diluted |
|
|
196,373 |
|
|
|
196,372 |
|
|
|
196,315 |
|
|
|
180,201 |
|
Net earnings per common share |
|
|
|
|
|
|
|
|
|
|
|
|
||||
Basic |
|
$ |
0.03 |
|
|
$ |
0.27 |
|
|
$ |
0.83 |
|
|
$ |
0.72 |
|
Diluted |
|
$ |
0.03 |
|
|
$ |
0.26 |
|
|
$ |
0.83 |
|
|
$ |
0.72 |
|
|
|
|
|
|
|
|
|
|
|
|
|
|
||||
Comprehensive income |
|
|
|
|
|
|
|
|
|
|
|
|
||||
Net income |
|
$ |
6,797 |
|
|
$ |
52,145 |
|
|
$ |
163,312 |
|
|
$ |
129,475 |
|
Other comprehensive income |
|
|
|
|
|
|
|
|
|
|
|
|
||||
Change in fair value of interest rate swaps |
|
|
(32,989 |
) |
|
|
13,943 |
|
|
|
(17,293 |
) |
|
|
90,560 |
|
Realized loss on interest rate swaps |
|
|
317 |
|
|
|
522 |
|
|
|
1,883 |
|
|
|
2,514 |
|
Comprehensive (loss) income |
|
|
(25,875 |
) |
|
|
66,610 |
|
|
|
147,902 |
|
|
|
222,549 |
|
Comprehensive loss (income) attributable to non-controlling interests |
|
|
1,215 |
|
|
|
(3,147 |
) |
|
|
(7,070 |
) |
|
|
(12,700 |
) |
Comprehensive (loss) income attributable to Broadstone Net Lease, Inc. |
|
$ |
(24,660 |
) |
|
$ |
63,463 |
|
|
$ |
140,832 |
|
|
$ |
209,849 |
|
7
Reconciliation of Non-GAAP Measures
The following is a reconciliation of net income to FFO, Core FFO, and AFFO for the three months ended December 31, 2023 and September 30, 2023 and for the year ended December 31, 2023 and 2022. Also presented is the weighted average number of shares of our common stock and OP Units used for the diluted per share computation:
|
|
For the Three Months Ended |
|
|
For the Year Ended |
|
||||||||||
(in thousands, except per share data) |
|
December 31, |
|
|
September 30, |
|
|
December 31, |
|
|
December 31, |
|
||||
Net income |
|
$ |
6,797 |
|
|
$ |
52,145 |
|
|
$ |
163,312 |
|
|
$ |
129,475 |
|
Real property depreciation and amortization |
|
|
39,115 |
|
|
|
38,496 |
|
|
|
158,346 |
|
|
|
154,673 |
|
Gain on sale of real estate |
|
|
(6,270 |
) |
|
|
(15,163 |
) |
|
|
(54,310 |
) |
|
|
(15,953 |
) |
Provision for impairment on investment in rental properties |
|
|
29,801 |
|
|
|
— |
|
|
|
31,274 |
|
|
|
5,535 |
|
FFO |
|
$ |
69,443 |
|
|
$ |
75,478 |
|
|
$ |
298,622 |
|
|
$ |
273,730 |
|
Net write-offs of accrued rental income |
|
|
4,161 |
|
|
|
— |
|
|
|
4,458 |
|
|
|
1,326 |
|
Lease termination fees |
|
|
— |
|
|
|
— |
|
|
|
(7,500 |
) |
|
|
(2,469 |
) |
Cost of debt extinguishment |
|
|
— |
|
|
|
— |
|
|
|
— |
|
|
|
(341 |
) |
Gain on insurance recoveries |
|
|
— |
|
|
|
— |
|
|
|
3 |
|
|
|
308 |
|
Severance and executive transition costs |
|
|
218 |
|
|
|
740 |
|
|
|
1,622 |
|
|
|
401 |
|
Other expenses (income)(1) |
|
|
1,453 |
|
|
|
(1,464 |
) |
|
|
1,678 |
|
|
|
(5,690 |
) |
Core FFO |
|
$ |
75,275 |
|
|
$ |
74,754 |
|
|
$ |
298,883 |
|
|
$ |
267,265 |
|
Straight-line rent adjustment |
|
|
(5,404 |
) |
|
|
(6,785 |
) |
|
|
(26,736 |
) |
|
|
(21,900 |
) |
Adjustment to provision for credit losses |
|
|
— |
|
|
|
— |
|
|
|
(10 |
) |
|
|
(5 |
) |
Amortization of debt issuance costs |
|
|
983 |
|
|
|
983 |
|
|
|
3,938 |
|
|
|
3,692 |
|
Amortization of net mortgage premiums |
|
|
— |
|
|
|
— |
|
|
|
(78 |
) |
|
|
(104 |
) |
Loss on interest rate swaps and other non-cash |
|
|
319 |
|
|
|
522 |
|
|
|
1,884 |
|
|
|
2,514 |
|
Amortization of lease intangibles |
|
|
(1,014 |
) |
|
|
(1,056 |
) |
|
|
(5,846 |
) |
|
|
(4,809 |
) |
Stock-based compensation |
|
|
1,401 |
|
|
|
1,540 |
|
|
|
5,972 |
|
|
|
5,316 |
|
Deferred taxes |
|
|
(282 |
) |
|
|
— |
|
|
|
(282 |
) |
|
|
204 |
|
AFFO |
|
$ |
71,278 |
|
|
$ |
69,958 |
|
|
$ |
277,725 |
|
|
$ |
251,969 |
|
Diluted WASO(2) |
|
|
196,373 |
|
|
|
196,372 |
|
|
|
196,315 |
|
|
|
180,201 |
|
Net earnings per diluted share(3) |
|
$ |
0.03 |
|
|
$ |
0.26 |
|
|
$ |
0.83 |
|
|
$ |
0.72 |
|
FFO per share(3) |
|
|
0.35 |
|
|
|
0.39 |
|
|
|
1.52 |
|
|
|
1.52 |
|
Core FFO per share(3) |
|
|
0.38 |
|
|
|
0.38 |
|
|
|
1.52 |
|
|
|
1.48 |
|
AFFO per share(3) |
|
|
0.36 |
|
|
|
0.36 |
|
|
|
1.41 |
|
|
|
1.40 |
|
1 Amount includes $1.5 million and $(1.4) million of unrealized foreign exchange loss (gain) for the three months ended December 31, 2023 and September 30, 2023, respectively, and $1.7 and $(5.6) million of unrealized foreign exchange loss (gain) for the year ended December 31, 2023 and 2022, primarily associated with our Canadian dollar denominated revolving borrowings.
2 Excludes 493,524 and 506,172 weighted average shares of unvested restricted common stock for the three months ended December 31, 2023 and September 30, 2023, respectively. Excludes 492,046 and 396,383 weighted average shares of unvested restricted common stock for the year ended December 31, 2023 and 2022, respectively.
3 Excludes $0.1 million from the numerator for the three months ended December 31, 2023 and September 30, 2023, respectively, and $0.5 million and $0.4 million from the numerator for the year ended December 31, 2023 and 2022, respectively, related to dividends paid or declared on shares of unvested restricted common stock.
Our reported results and net earnings per diluted share are presented in accordance with GAAP. We also disclose FFO, Core FFO, and AFFO, each of which are non-GAAP measures. We believe the use of FFO, Core FFO, and AFFO are useful to investors because they are widely accepted industry measures used by analysts and investors to compare the operating performance of REITs. FFO, Core FFO, and AFFO should not be considered alternatives to net income as a performance measure or to cash flows from operations, as reported on our statement of cash flows, or as a liquidity measure and should be considered in addition to, and not in lieu of, GAAP financial measures.
8
We compute FFO in accordance with the standards established by the Board of Governors of Nareit, the worldwide representative voice for REITs and publicly traded real estate companies with an interest in the U.S. real estate and capital markets. Nareit defines FFO as GAAP net income or loss adjusted to exclude net gains (losses) from sales of certain depreciated real estate assets, depreciation and amortization expense from real estate assets, and impairment charges related to certain previously depreciated real estate assets. FFO is used by management, investors, and analysts to facilitate meaningful comparisons of operating performance between periods and among our peers, primarily because it excludes the effect of real estate depreciation and amortization and net gains (losses) on sales, which are based on historical costs and implicitly assume that the value of real estate diminishes predictably over time, rather than fluctuating based on existing market conditions.
We compute Core FFO by adjusting FFO, as defined by Nareit, to exclude certain GAAP income and expense amounts that we believe are infrequently recurring, unusual in nature, or not related to its core real estate operations, including write-offs or recoveries of accrued rental income, lease termination fees, gain on insurance recoveries, cost of debt extinguishments, unrealized and realized gains or losses on foreign currency transactions, severance and executive transition costs, and other extraordinary items. Exclusion of these items from similar FFO-type metrics is common within the equity REIT industry, and management believes that presentation of Core FFO provides investors with a metric to assist in their evaluation of our operating performance across multiple periods and in comparison to the operating performance of our peers, because it removes the effect of unusual items that are not expected to impact our operating performance on an ongoing basis.
We compute AFFO by adjusting Core FFO for certain non-cash revenues and expenses, including straight-line rents, amortization of lease intangibles, adjustment to provision for credit losses, amortization of debt issuance costs, amortization of net mortgage premiums, (gain) loss on interest rate swaps and other non-cash interest expense, deferred taxes, stock-based compensation, and other specified non-cash items. We believe that excluding such items assists management and investors in distinguishing whether changes in our operations are due to growth or decline of operations at our properties or from other factors. We use AFFO as a measure of our performance when we formulate corporate goals, and is a factor in determining management compensation. We believe that AFFO is a useful supplemental measure for investors to consider because it will help them to better assess our operating performance without the distortions created by non-cash revenues or expenses.
Specific to our adjustment for straight-line rents, our leases include cash rents that increase over the term of the lease to compensate us for anticipated increases in market rental rates over time. Our leases do not include significant front-loading or back-loading of payments, or significant rent-free periods. Therefore, we find it useful to evaluate rent on a contractual basis as it allows for comparison of existing rental rates to market rental rates.
FFO, Core FFO, and AFFO may not be comparable to similarly titled measures employed by other REITs, and comparisons of our FFO, Core FFO, and AFFO with the same or similar measures disclosed by other REITs may not be meaningful.
Neither the SEC nor any other regulatory body has passed judgment on the acceptability of the adjustments to FFO that we use to calculate Core FFO and AFFO. In the future, the SEC, Nareit or another regulatory body may decide to standardize the allowable adjustments across the REIT industry and in response to such standardization we may have to adjust our calculation and characterization of Core FFO and AFFO accordingly.
9
The following is a reconciliation of net income to EBITDA, EBITDAre, and Adjusted EBITDAre, debt to Net Debt and Net Debt to Annualized Adjusted EBITDAre as of and for the three months ended December 31, 2023, September 30, 2023, and December 31, 2022:
|
|
For the Three Months Ended |
|
|||||||||
(in thousands) |
|
December 31, |
|
|
September 30, |
|
|
December 31, |
|
|||
Net income |
|
$ |
6,797 |
|
|
$ |
52,145 |
|
|
$ |
36,773 |
|
Depreciation and amortization |
|
|
39,278 |
|
|
|
38,533 |
|
|
|
45,606 |
|
Interest expense |
|
|
18,972 |
|
|
|
19,665 |
|
|
|
23,773 |
|
Income taxes |
|
|
(268 |
) |
|
|
104 |
|
|
|
105 |
|
EBITDA |
|
$ |
64,779 |
|
|
$ |
110,447 |
|
|
$ |
106,257 |
|
Provision for impairment of investment in rental properties |
|
|
29,801 |
|
|
|
— |
|
|
|
— |
|
Gain on sale of real estate |
|
|
(6,270 |
) |
|
|
(15,163 |
) |
|
|
(10,625 |
) |
EBITDAre |
|
$ |
88,310 |
|
|
$ |
95,284 |
|
|
$ |
95,632 |
|
Adjustment for current quarter investment activity (1) |
|
|
153 |
|
|
|
26 |
|
|
|
1,283 |
|
Adjustment for current quarter disposition activity (2) |
|
|
(156 |
) |
|
|
(400 |
) |
|
|
(440 |
) |
Adjustment to exclude non-recurring and other expenses (income) (3) |
|
|
128 |
|
|
|
740 |
|
|
|
— |
|
Adjustment to exclude net write-offs of accrued rental income |
|
|
4,161 |
|
|
|
— |
|
|
|
— |
|
Adjustment to exclude gain on insurance recoveries |
|
|
— |
|
|
|
— |
|
|
|
(341 |
) |
Adjustment to exclude realized / unrealized foreign exchange |
|
|
1,453 |
|
|
|
(1,433 |
) |
|
|
796 |
|
Adjustment to exclude cost of debt extinguishments |
|
|
— |
|
|
|
— |
|
|
|
77 |
|
Adjustment to exclude lease termination fees |
|
|
— |
|
|
|
— |
|
|
|
(1,678 |
) |
Adjusted EBITDAre |
|
$ |
94,049 |
|
|
$ |
94,217 |
|
|
$ |
95,329 |
|
Annualized EBITDAre |
|
$ |
353,240 |
|
|
$ |
381,136 |
|
|
$ |
382,528 |
|
Annualized Adjusted EBITDAre |
|
$ |
376,196 |
|
|
$ |
376,868 |
|
|
$ |
381,316 |
|
1 Reflects an adjustment to give effect to all investments during the quarter as if they had been made as of the beginning of the quarter.
2 Reflects an adjustment to give effect to all dispositions during the quarter as if they had been sold as of the beginning of the quarter.
3 Amount includes $0.2 million of employee severance and executive transition costs and ($0.1) million of forfeited stock-based compensation for the three months ended December 31, 2023 and $0.7 million of employee severance and executive transition costs during the three months ended September 30, 2023.
(in thousands) |
|
December 31, |
|
|
September 30, |
|
|
December 31, |
|
|||
Debt |
|
|
|
|
|
|
|
|
|
|||
Unsecured revolving credit facility |
|
$ |
90,434 |
|
|
$ |
74,060 |
|
|
$ |
197,322 |
|
Unsecured term loans, net |
|
|
895,947 |
|
|
|
895,633 |
|
|
|
894,692 |
|
Senior unsecured notes, net |
|
|
845,309 |
|
|
|
845,121 |
|
|
|
844,555 |
|
Mortgages, net |
|
|
79,068 |
|
|
|
79,613 |
|
|
|
86,602 |
|
Debt issuance costs |
|
|
8,848 |
|
|
|
9,360 |
|
|
|
10,905 |
|
Gross Debt |
|
|
1,919,606 |
|
|
|
1,903,787 |
|
|
|
2,034,076 |
|
Cash and cash equivalents |
|
|
(19,494 |
) |
|
|
(35,061 |
) |
|
|
(21,789 |
) |
Restricted cash |
|
|
(1,138 |
) |
|
|
(15,436 |
) |
|
|
(38,251 |
) |
Net Debt |
|
$ |
1,898,974 |
|
|
$ |
1,853,290 |
|
|
$ |
1,974,036 |
|
Net Debt to Annualized EBITDAre |
|
5.4x |
|
|
4.9x |
|
|
5.2x |
|
|||
Net Debt to Annualized Adjusted EBITDAre |
|
5.0x |
|
|
4.9x |
|
|
5.2x |
|
|||
We define Net Debt as gross debt (total reported debt plus debt issuance costs) less cash and cash equivalents and restricted cash. We believe that the presentation of Net Debt to Annualized EBITDAre and Net Debt to Annualized Adjusted EBITDAre is useful to investors and analysts because these ratios provide information about gross debt less cash and cash equivalents, which could be used to repay debt, compared to our performance as measured using EBITDAre.
10
We compute EBITDA as earnings before interest, income taxes and depreciation and amortization. EBITDA is a measure commonly used in our industry. We believe that this ratio provides investors and analysts with a measure of our performance that includes our operating results unaffected by the differences in capital structures, capital investment cycles and useful life of related assets compared to other companies in our industry. We compute EBITDAre in accordance with the definition adopted by Nareit, as EBITDA excluding gains (losses) from the sales of depreciable property and provisions for impairment on investment in real estate. We believe EBITDA and EBITDAre are useful to investors and analysts because they provide important supplemental information about our operating performance exclusive of certain non-cash and other costs. EBITDA and EBITDAre are not measures of financial performance under GAAP, and our EBITDA and EBITDAre may not be comparable to similarly titled measures of other companies. You should not consider our EBITDA and EBITDAre as alternatives to net income or cash flows from operating activities determined in accordance with GAAP.
We are focused on a disciplined and targeted investment strategy, together with active asset management that includes selective sales of properties. We manage our leverage profile using a ratio of Net Debt to Annualized Adjusted EBITDAre, discussed below, which we believe is a useful measure of our ability to repay debt and a relative measure of leverage, and is used in communications with our lenders and rating agencies regarding our credit rating. As we fund new investments using our unsecured revolving credit facility, our leverage profile and Net Debt will be immediately impacted by current quarter investments. However, the full benefit of EBITDAre from new investments will not be received in the same quarter in which the properties are acquired. Additionally, EBITDAre for the quarter includes amounts generated by properties that have been sold during the quarter. Accordingly, the variability in EBITDAre caused by the timing of our investments and dispositions can temporarily distort our leverage ratios. We adjust EBITDAre (“Adjusted EBITDAre”) for the most recently completed quarter (i) to recalculate as if all investments and dispositions had occurred at the beginning of the quarter, (ii) to exclude certain GAAP income and expense amounts that are either non-cash, such as cost of debt extinguishments, realized or unrealized gains and losses on foreign currency transactions, or gains on insurance recoveries, or that we believe are one time, or unusual in nature because they relate to unique circumstances or transactions that had not previously occurred and which we do not anticipate occurring in the future, and (iii) to eliminate the impact of lease termination fees and other items, that are not a result of normal operations. While investments in property developments have an immediate impact to Net Debt, we do not make an adjustment to EBITDAre until the quarter in which the lease commences. We then annualize quarterly Adjusted EBITDAre by multiplying it by four (“Annualized Adjusted EBITDAre”). You should not unduly rely on this measure as it is based on assumptions and estimates that may prove to be inaccurate. Our actual reported EBITDAre for future periods may be significantly different from our Annualized Adjusted EBITDAre. Adjusted EBITDAre and Annualized Adjusted EBITDAre are not measurements of performance under GAAP, and our Adjusted EBITDAre and Annualized Adjusted EBITDAre may not be comparable to similarly titled measures of other companies. You should not consider our Adjusted EBITDAre and Annualized Adjusted EBITDAre as alternatives to net income or cash flows from operating activities determined in accordance with GAAP.
11
Exhibit 99.2

toneet Lease, Inc. (NYSE: BNL) is a Real Estate Investment Trust (REIT) that acquires, owns, and manages single-tenant commercial real estate properties that are net leased on a long-term basis to a diversified group of tenants. www.broadstone.com
Table of Contents
Section |
Page |
|
About the Data |
3 |
|
Company Overview |
4 |
|
Quarterly Financial Summary |
5 |
|
Balance Sheet |
6 |
|
Income Statement Summary |
7 |
|
Funds From Operations (FFO), Core Funds From Operations (Core FFO), and Adjusted Funds From Operations (AFFO) |
8 |
|
EBITDA, EBITDAre, and Other Non-GAAP Operating Measures |
9 |
|
Lease Revenues Detail |
10 |
|
Capital Structure |
11 |
|
Equity Rollforward |
12 |
|
Debt Outstanding |
13 |
|
Interest Rate Swaps |
14 |
|
Net Debt Metrics |
15 |
|
Covenants |
16 |
|
Debt & Swap Maturities |
17 |
|
Investment Activity |
18 |
|
Developments |
19 |
|
Dispositions |
20 |
|
Portfolio at a Glance: Key Metrics |
21 |
|
Diversification: Tenants and Brands |
22-25 |
|
Diversification: Property Type |
26-27 |
|
Key Statistics by Property Type |
28 |
|
Diversification: Tenant Industry |
29 |
|
Diversification: Geography |
30 |
|
Lease Expirations |
31 |
|
Portfolio Occupancy |
32 |
|
Definitions and Explanations |
33-34 |
|
|
|
|
|
|
|
|
|
|
|
|
BROADSTONE NET LEASE, INC. | www.broadstone.com | © 2024 Broadstone Net Lease, LLC. All rights reserved. 2 This data and other information described herein are as of and for the three months ended December 31, 2023 unless otherwise indicated.
About the Data
Future performance may not be consistent with past performance and is subject to change and inherent risks and uncertainties. This information should be read in conjunction with Broadstone Net Lease, Inc.’s Annual Report on Form 10-K for the year ended December 31, 2023, including the financial statements and the management’s discussion and analysis of financial condition and results of operations sections.
Forward Looking Statements
Information set forth herein contains forward-looking statements, which reflect our current views regarding our business, financial performance, growth prospects and strategies, market opportunities, and market trends. Forward-looking statements include all statements that are not historical facts. In some cases, you can identify these forward-looking statements by the use of words such as “outlook,” “believes,” “expects,” “potential,” “continues,” “may,” “will,” “should,” “could,” “would be,” “seeks,” “approximately,” “projects,” “predicts,” “intends,” “plans,” “estimates,” “anticipates,” or the negative version of these words or other comparable words. All of the forward-looking statements herein are subject to various risks and uncertainties. Assumptions relating to the foregoing involve judgments with respect to, among other things, future economic, competitive and market conditions, and future business decisions, all of which are difficult or impossible to predict accurately and many of which are beyond our control. Although we believe that the expectations reflected in such forward-looking statements are based on reasonable assumptions, our actual results, performance, and achievements could differ materially from those expressed in or by the forward-looking statements and may be affected by a variety of risks and other factors. Accordingly, there are or will be important factors that could cause actual outcomes or results to differ materially from such forward-looking statements. These factors include, but are not limited to, risks and uncertainties related to general economic conditions, including but not limited to increases in the rate of inflation and/or interest rates, local real estate conditions, tenant financial health, and property acquisitions and the timing of these investments and acquisitions. These and other risks, assumptions, and uncertainties are described in our filings with the SEC, which are available on the SEC’s website at www.sec.gov. This document contains references to copyrights, trademarks, trade names, and service marks that belong to other companies. Broadstone Net Lease is not affiliated or associated with, and is not endorsed by and does not endorse, such companies or their products or services.
You are cautioned not to place undue reliance on any forward-looking statements included herein. All forward-looking statements are made as of the date of this document and the risk that actual results, performance, and achievements will differ materially from the expectations expressed or referenced herein will increase with the passage of time. We undertake no obligation to publicly update or review any forward-looking statement, whether as a result of new information, future developments, or otherwise, except as required by law.
Company Overview
BROADSTONE NET LEASE, INC. | www.broadstone.com | © 2024 Broadstone Net Lease, LLC. All rights reserved. 3 Broadstone Net Lease, Inc. (NYSE:BNL) (the “Company”, “BNL”, “us”, “our”, and “we”) is an industrial-focused, diversified net lease real estate investment trust (“REIT”) that invests in primarily single-tenant commercial real estate properties that are net leased on a long-term basis to a diversified group of tenants. Since our inception, we have selectively invested in real estate across the industrial, healthcare, restaurant, retail, and office property types. We target properties with credit worthy tenants in industries characterized by positive business drivers and trends, where the properties are an integral part of the tenants’ businesses and there are opportunities to secure long-term net leases. Through long-term net leases, our tenants are able to retain operational control of their strategically important locations, while allocating their debt and equity capital to fund core business operations rather than real estate ownership.
|
Executive Team John D. Moragne Chief Executive Officer and Member, Board of Directors Ryan M. Albano President and Chief Operating Officer Kevin M. Fennell Executive Vice President and Chief Financial Officer John D. Callan, Jr. Senior Vice President, General Counsel, and Secretary Michael B. Caruso Senior Vice President, Underwriting & Strategy Timothy D. Dieffenbacher Senior Vice President, Chief Accounting Officer, and Treasurer Jennie L. O’Brien Senior Vice President, Accounting, and Controller Roderick A. Pickney Senior Vice President, Acquisitions Molly Kelly Wiegel Senior Vice President, Human Resources & Administration Andrea T. Wright Senior Vice President, Property Management
|
|
Board of Directors Laurie A. Hawkes Chairman of the Board John D. Moragne Chief Executive Officer Denise Brooks-Williams Michael A. Coke Jessica Duran Laura Felice David M. Jacobstein Shekar Narasimhan James H. Watters
|
|
Company Contact Information Brent Maedl brent.maedl@broadstone.com 585-382-8507
Transfer Agent Computershare Trust Company, N.A. 150 Royall Street Canton, Massachusetts 02021 800-736-3001 |
|
BROADSTONE NET LEASE, INC. | www.broadstone.com | © 2024 Broadstone Net Lease, LLC. All rights reserved. 4
Quarterly Financial Summary
(unaudited, dollars in thousands, except per share data)
|
|
Q4 2023 |
|
|
Q3 2023 |
|
|
Q2 2023 |
|
|
Q1 2023 |
|
|
Q4 2022 |
|
|||||
Financial Summary |
|
|
|
|
|
|
|
|
|
|
|
|
|
|
|
|||||
Investment in rental property |
|
$ |
4,915,911 |
|
|
$ |
4,939,598 |
|
|
$ |
4,981,430 |
|
|
$ |
5,002,330 |
|
|
$ |
5,035,846 |
|
Less accumulated depreciation |
|
|
(626,597 |
) |
|
|
(601,895 |
) |
|
|
(578,616 |
) |
|
|
(558,410 |
) |
|
|
(533,965 |
) |
Property under development |
|
|
94,964 |
|
|
|
49,819 |
|
|
|
37,449 |
|
|
|
— |
|
|
|
— |
|
Investment in rental property, net |
|
|
4,384,278 |
|
|
|
4,387,522 |
|
|
|
4,440,263 |
|
|
|
4,443,920 |
|
|
|
4,501,881 |
|
Cash and cash equivalents |
|
|
19,494 |
|
|
|
35,061 |
|
|
|
20,763 |
|
|
|
15,412 |
|
|
|
21,789 |
|
Restricted cash |
|
|
1,138 |
|
|
|
15,436 |
|
|
|
15,502 |
|
|
|
3,898 |
|
|
|
38,251 |
|
Total assets |
|
|
5,268,735 |
|
|
|
5,335,043 |
|
|
|
5,368,150 |
|
|
|
5,335,868 |
|
|
|
5,457,609 |
|
Unsecured revolving credit facility |
|
|
90,434 |
|
|
|
74,060 |
|
|
|
122,912 |
|
|
|
108,330 |
|
|
|
197,322 |
|
Mortgages, net |
|
|
79,068 |
|
|
|
79,613 |
|
|
|
80,141 |
|
|
|
85,853 |
|
|
|
86,602 |
|
Unsecured term loans, net |
|
|
895,947 |
|
|
|
895,633 |
|
|
|
895,319 |
|
|
|
895,006 |
|
|
|
894,692 |
|
Senior unsecured notes, net |
|
|
845,309 |
|
|
|
845,121 |
|
|
|
844,932 |
|
|
|
844,744 |
|
|
|
844,555 |
|
Total liabilities |
|
|
2,074,394 |
|
|
|
2,059,570 |
|
|
|
2,106,553 |
|
|
|
2,103,551 |
|
|
|
2,195,104 |
|
Total Broadstone Net Lease, Inc. |
|
|
3,049,241 |
|
|
|
3,120,776 |
|
|
|
3,107,536 |
|
|
|
3,079,207 |
|
|
|
3,092,918 |
|
Total equity (book value) |
|
|
3,194,341 |
|
|
|
3,275,473 |
|
|
|
3,261,597 |
|
|
|
3,232,317 |
|
|
|
3,262,505 |
|
|
|
|
|
|
|
|
|
|
|
|
|
|
|
|
|
|||||
Revenues |
|
|
105,000 |
|
|
|
109,543 |
|
|
|
109,353 |
|
|
|
118,992 |
|
|
|
112,135 |
|
General and administrative - |
|
|
7,982 |
|
|
|
8,603 |
|
|
|
7,944 |
|
|
|
8,924 |
|
|
|
7,814 |
|
Stock based compensation |
|
|
1,401 |
|
|
|
1,540 |
|
|
|
1,539 |
|
|
|
1,492 |
|
|
|
1,503 |
|
General and administrative |
|
|
9,383 |
|
|
|
10,143 |
|
|
|
9,483 |
|
|
|
10,416 |
|
|
|
9,317 |
|
Total operating expenses |
|
|
84,457 |
|
|
|
54,383 |
|
|
|
53,502 |
|
|
|
59,559 |
|
|
|
61,320 |
|
Interest expense |
|
|
18,972 |
|
|
|
19,665 |
|
|
|
20,277 |
|
|
|
21,139 |
|
|
|
23,773 |
|
Net income |
|
|
6,797 |
|
|
|
52,145 |
|
|
|
62,996 |
|
|
|
41,374 |
|
|
|
36,773 |
|
Net earnings per common share, |
|
$ |
0.03 |
|
|
$ |
0.26 |
|
|
$ |
0.32 |
|
|
$ |
0.21 |
|
|
$ |
0.20 |
|
|
|
|
|
|
|
|
|
|
|
|
|
|
|
|
|
|||||
FFO |
|
|
69,443 |
|
|
|
75,478 |
|
|
|
72,524 |
|
|
|
81,177 |
|
|
|
71,718 |
|
FFO per share, diluted |
|
$ |
0.35 |
|
|
$ |
0.39 |
|
|
$ |
0.37 |
|
|
$ |
0.41 |
|
|
$ |
0.39 |
|
Core FFO |
|
|
75,275 |
|
|
|
74,754 |
|
|
|
74,381 |
|
|
|
74,473 |
|
|
|
70,527 |
|
Core FFO per share, diluted |
|
$ |
0.38 |
|
|
$ |
0.38 |
|
|
$ |
0.38 |
|
|
$ |
0.38 |
|
|
$ |
0.38 |
|
AFFO |
|
|
71,278 |
|
|
|
69,958 |
|
|
|
69,004 |
|
|
|
67,485 |
|
|
|
65,584 |
|
AFFO per share, diluted |
|
$ |
0.36 |
|
|
$ |
0.36 |
|
|
$ |
0.35 |
|
|
$ |
0.34 |
|
|
$ |
0.36 |
|
|
|
|
|
|
|
|
|
|
|
|
|
|
|
|
|
|||||
Net cash provided by operating activities |
|
|
60,582 |
|
|
|
73,888 |
|
|
|
62,228 |
|
|
|
74,376 |
|
|
|
60,440 |
|
Capital expenditures and improvements |
|
|
568 |
|
|
|
1,106 |
|
|
|
1,011 |
|
|
|
758 |
|
|
|
31,374 |
|
Capital expenditures and improvements - |
|
|
16,229 |
|
|
|
4,755 |
|
|
|
7,000 |
|
|
|
14,825 |
|
|
|
— |
|
Net cash (used in) provided by investing activities |
|
|
(49,536 |
) |
|
|
42,528 |
|
|
|
1,713 |
|
|
|
29,633 |
|
|
|
(274,485 |
) |
Net cash (used in) provided by financing activities |
|
|
(40,911 |
) |
|
|
(102,184 |
) |
|
|
(46,986 |
) |
|
|
(144,739 |
) |
|
|
191,724 |
|
Distributions declared |
|
|
56,433 |
|
|
|
54,274 |
|
|
|
55,419 |
|
|
|
54,887 |
|
|
|
54,372 |
|
Distributions declared per diluted |
|
$ |
0.285 |
|
|
$ |
0.280 |
|
|
$ |
0.280 |
|
|
$ |
0.275 |
|
|
$ |
0.275 |
|
BROADSTONE NET LEASE, INC. | www.broadstone.com | © 2024 Broadstone Net Lease, LLC. All rights reserved. 5
Balance Sheet
(unaudited, in thousands)
|
|
December 31, |
|
|
September 30, |
|
|
June 30, |
|
|
March 31, |
|
|
December 31, |
|
|||||
Assets |
|
|
|
|
|
|
|
|
|
|
|
|
|
|
|
|||||
Accounted for using the operating method: |
|
|
|
|
|
|
|
|
|
|
|
|
|
|
|
|||||
Land |
|
$ |
748,529 |
|
|
$ |
752,708 |
|
|
$ |
754,402 |
|
|
$ |
760,142 |
|
|
$ |
768,667 |
|
Land improvements |
|
|
328,746 |
|
|
|
330,214 |
|
|
|
332,757 |
|
|
|
337,296 |
|
|
|
340,385 |
|
Buildings and improvements |
|
|
3,803,156 |
|
|
|
3,819,745 |
|
|
|
3,857,236 |
|
|
|
3,866,952 |
|
|
|
3,888,756 |
|
Equipment |
|
|
8,265 |
|
|
|
9,608 |
|
|
|
9,608 |
|
|
|
10,422 |
|
|
|
10,422 |
|
Total accounted for using the |
|
|
4,888,696 |
|
|
|
4,912,275 |
|
|
|
4,954,003 |
|
|
|
4,974,812 |
|
|
|
5,008,230 |
|
Less accumulated depreciation |
|
|
(626,597 |
) |
|
|
(601,895 |
) |
|
|
(578,616 |
) |
|
|
(558,410 |
) |
|
|
(533,965 |
) |
Accounted for using the |
|
|
4,262,099 |
|
|
|
4,310,380 |
|
|
|
4,375,387 |
|
|
|
4,416,402 |
|
|
|
4,474,265 |
|
Accounted for using the direct |
|
|
26,643 |
|
|
|
26,751 |
|
|
|
26,855 |
|
|
|
26,947 |
|
|
|
27,045 |
|
Accounted for using the sales-type |
|
|
572 |
|
|
|
572 |
|
|
|
572 |
|
|
|
571 |
|
|
|
571 |
|
Property under development |
|
|
94,964 |
|
|
|
49,819 |
|
|
|
37,449 |
|
|
|
— |
|
|
|
— |
|
Investment in rental property, net |
|
|
4,384,278 |
|
|
|
4,387,522 |
|
|
|
4,440,263 |
|
|
|
4,443,920 |
|
|
|
4,501,881 |
|
Cash and cash equivalents |
|
|
19,494 |
|
|
|
35,061 |
|
|
|
20,763 |
|
|
|
15,412 |
|
|
|
21,789 |
|
Accrued rental income |
|
|
152,724 |
|
|
|
152,268 |
|
|
|
148,697 |
|
|
|
142,031 |
|
|
|
135,666 |
|
Tenant and other receivables, net |
|
|
1,487 |
|
|
|
1,372 |
|
|
|
1,895 |
|
|
|
2,004 |
|
|
|
1,349 |
|
Prepaid expenses and other assets |
|
|
36,661 |
|
|
|
42,309 |
|
|
|
42,322 |
|
|
|
29,764 |
|
|
|
64,180 |
|
Interest rate swap, assets |
|
|
46,096 |
|
|
|
79,086 |
|
|
|
65,143 |
|
|
|
45,490 |
|
|
|
63,390 |
|
Goodwill |
|
|
339,769 |
|
|
|
339,769 |
|
|
|
339,769 |
|
|
|
339,769 |
|
|
|
339,769 |
|
Intangible lease assets, net |
|
|
288,226 |
|
|
|
297,656 |
|
|
|
309,298 |
|
|
|
317,478 |
|
|
|
329,585 |
|
Total assets |
|
$ |
5,268,735 |
|
|
$ |
5,335,043 |
|
|
$ |
5,368,150 |
|
|
$ |
5,335,868 |
|
|
$ |
5,457,609 |
|
Liabilities and equity |
|
|
|
|
|
|
|
|
|
|
|
|
|
|
|
|||||
Unsecured revolving credit facility |
|
$ |
90,434 |
|
|
$ |
74,060 |
|
|
$ |
122,912 |
|
|
$ |
108,330 |
|
|
$ |
197,322 |
|
Mortgages, net |
|
|
79,068 |
|
|
|
79,613 |
|
|
|
80,141 |
|
|
|
85,853 |
|
|
|
86,602 |
|
Unsecured term loans, net |
|
|
895,947 |
|
|
|
895,633 |
|
|
|
895,319 |
|
|
|
895,006 |
|
|
|
894,692 |
|
Senior unsecured notes, net |
|
|
845,309 |
|
|
|
845,121 |
|
|
|
844,932 |
|
|
|
844,744 |
|
|
|
844,555 |
|
Accounts payable and other liabilities |
|
|
47,534 |
|
|
|
44,886 |
|
|
|
44,147 |
|
|
|
46,090 |
|
|
|
47,547 |
|
Dividends payable |
|
|
56,869 |
|
|
|
55,770 |
|
|
|
55,640 |
|
|
|
54,515 |
|
|
|
54,460 |
|
Accrued interest payable |
|
|
5,702 |
|
|
|
9,186 |
|
|
|
5,889 |
|
|
|
9,654 |
|
|
|
7,071 |
|
Intangible lease liabilities, net |
|
|
53,531 |
|
|
|
55,301 |
|
|
|
57,573 |
|
|
|
59,359 |
|
|
|
62,855 |
|
Total liabilities |
|
|
2,074,394 |
|
|
|
2,059,570 |
|
|
|
2,106,553 |
|
|
|
2,103,551 |
|
|
|
2,195,104 |
|
Equity |
|
|
|
|
|
|
|
|
|
|
|
|
|
|
|
|||||
Broadstone Net Lease, Inc. |
|
|
|
|
|
|
|
|
|
|
|
|
|
|
|
|||||
Preferred stock, $0.001 par value |
|
|
— |
|
|
|
— |
|
|
|
— |
|
|
|
— |
|
|
|
— |
|
Common stock, $0.00025 par value |
|
|
47 |
|
|
|
47 |
|
|
|
47 |
|
|
|
47 |
|
|
|
47 |
|
Additional paid-in capital |
|
|
3,440,639 |
|
|
|
3,430,725 |
|
|
|
3,430,692 |
|
|
|
3,434,534 |
|
|
|
3,419,395 |
|
Cumulative distributions in excess of |
|
|
(440,731 |
) |
|
|
(393,571 |
) |
|
|
(391,631 |
) |
|
|
(398,890 |
) |
|
|
(386,049 |
) |
Accumulated other comprehensive |
|
|
49,286 |
|
|
|
83,575 |
|
|
|
68,428 |
|
|
|
43,516 |
|
|
|
59,525 |
|
Total Broadstone Net Lease, Inc. |
|
|
3,049,241 |
|
|
|
3,120,776 |
|
|
|
3,107,536 |
|
|
|
3,079,207 |
|
|
|
3,092,918 |
|
Non-controlling interests |
|
|
145,100 |
|
|
|
154,697 |
|
|
|
154,061 |
|
|
|
153,110 |
|
|
|
169,587 |
|
Total equity |
|
|
3,194,341 |
|
|
|
3,275,473 |
|
|
|
3,261,597 |
|
|
|
3,232,317 |
|
|
|
3,262,505 |
|
Total liabilities and equity |
|
$ |
5,268,735 |
|
|
$ |
5,335,043 |
|
|
$ |
5,368,150 |
|
|
$ |
5,335,868 |
|
|
$ |
5,457,609 |
|
BROADSTONE NET LEASE, INC. | www.broadstone.com | © 2024 Broadstone Net Lease, LLC. All rights reserved. 6
Income Statement Summary
(unaudited, in thousands, except per share data)
|
|
Three Months Ended |
|
|||||||||||||||||
|
|
December 31, |
|
|
September 30, |
|
|
June 30, |
|
|
March 31, |
|
|
December 31, |
|
|||||
Revenues |
|
|
|
|
|
|
|
|
|
|
|
|
|
|
|
|||||
Lease revenues, net |
|
$ |
105,000 |
|
|
$ |
109,543 |
|
|
$ |
109,353 |
|
|
$ |
118,992 |
|
|
$ |
112,135 |
|
Operating expenses |
|
|
|
|
|
|
|
|
|
|
|
|
|
|
|
|||||
Depreciation and amortization |
|
|
39,278 |
|
|
|
38,533 |
|
|
|
39,031 |
|
|
|
41,784 |
|
|
|
45,606 |
|
Property and operating |
|
|
5,995 |
|
|
|
5,707 |
|
|
|
4,988 |
|
|
|
5,886 |
|
|
|
6,397 |
|
General and administrative |
|
|
9,383 |
|
|
|
10,143 |
|
|
|
9,483 |
|
|
|
10,416 |
|
|
|
9,317 |
|
Provision for impairment of |
|
|
29,801 |
|
|
|
— |
|
|
|
— |
|
|
|
1,473 |
|
|
|
— |
|
Total operating expenses |
|
|
84,457 |
|
|
|
54,383 |
|
|
|
53,502 |
|
|
|
59,559 |
|
|
|
61,320 |
|
Other income (expenses) |
|
|
|
|
|
|
|
|
|
|
|
|
|
|
|
|||||
Interest income |
|
|
141 |
|
|
|
127 |
|
|
|
82 |
|
|
|
162 |
|
|
|
40 |
|
Interest expense |
|
|
(18,972 |
) |
|
|
(19,665 |
) |
|
|
(20,277 |
) |
|
|
(21,139 |
) |
|
|
(23,773 |
) |
Gain on sale of real estate |
|
|
6,270 |
|
|
|
15,163 |
|
|
|
29,462 |
|
|
|
3,415 |
|
|
|
10,625 |
|
Income taxes |
|
|
268 |
|
|
|
(104 |
) |
|
|
(448 |
) |
|
|
(479 |
) |
|
|
(106 |
) |
Other (expenses) income |
|
|
(1,453 |
) |
|
|
1,464 |
|
|
|
(1,674 |
) |
|
|
(18 |
) |
|
|
(828 |
) |
Net income |
|
|
6,797 |
|
|
|
52,145 |
|
|
|
62,996 |
|
|
|
41,374 |
|
|
|
36,773 |
|
Net income attributable to |
|
|
(319 |
) |
|
|
(2,463 |
) |
|
|
(2,982 |
) |
|
|
(2,070 |
) |
|
|
(2,041 |
) |
Net income attributable to |
|
$ |
6,478 |
|
|
$ |
49,682 |
|
|
$ |
60,014 |
|
|
$ |
39,304 |
|
|
$ |
34,732 |
|
|
|
|
|
|
|
|
|
|
|
|
|
|
|
|
|
|||||
Weighted average number of common shares outstanding |
|
|
|
|
|
|
|
|
|
|
|
|
|
|
|
|||||
Basic1 |
|
|
186,829 |
|
|
|
186,766 |
|
|
|
186,733 |
|
|
|
186,130 |
|
|
|
173,283 |
|
Diluted1 |
|
|
196,373 |
|
|
|
196,372 |
|
|
|
196,228 |
|
|
|
196,176 |
|
|
|
183,592 |
|
Net earnings per common share2 |
|
|
|
|
|
|
|
|
|
|
|
|
|
|
|
|||||
Basic |
|
$ |
0.03 |
|
|
$ |
0.27 |
|
|
$ |
0.32 |
|
|
$ |
0.21 |
|
|
$ |
0.20 |
|
Diluted |
|
$ |
0.03 |
|
|
$ |
0.26 |
|
|
$ |
0.32 |
|
|
$ |
0.21 |
|
|
$ |
0.20 |
|
1 Excludes 493,524, 506,172, 504,161, 431,392, and 396,924, weighted average shares of unvested restricted common stock for the three months ended December 31, 2023, September 30, 2023, June 30, 2023, March 31, 2023 and December 31, 2022.
2 Excludes $0.1 million from the numerator for the three months ended December 31, 2023, September 30, 2023, June 30, 2023, March 31, 2023, and December 31, 2022, related to dividends declared on shares of unvested restricted common stock.
BROADSTONE NET LEASE, INC. | www.broadstone.com | © 2024 Broadstone Net Lease, LLC. All rights reserved. 7
Funds From Operations (FFO), Core Funds From Operations (Core FFO), and Adjusted Funds From Operations (AFFO)
(unaudited, in thousands, except per share data)
|
|
Three Months Ended |
|
|||||||||||||||||
|
|
December 31, |
|
|
September 30, |
|
|
June 30, |
|
|
March 31, |
|
|
December 31, |
|
|||||
Net income |
|
$ |
6,797 |
|
|
$ |
52,145 |
|
|
$ |
62,996 |
|
|
$ |
41,374 |
|
|
$ |
36,773 |
|
Real property depreciation and |
|
|
39,115 |
|
|
|
38,496 |
|
|
|
38,990 |
|
|
|
41,745 |
|
|
|
45,570 |
|
Gain on sale of real estate |
|
|
(6,270 |
) |
|
|
(15,163 |
) |
|
|
(29,462 |
) |
|
|
(3,415 |
) |
|
|
(10,625 |
) |
Provision for impairment of investment |
|
|
29,801 |
|
|
|
— |
|
|
|
— |
|
|
|
1,473 |
|
|
|
— |
|
FFO |
|
$ |
69,443 |
|
|
$ |
75,478 |
|
|
$ |
72,524 |
|
|
$ |
81,177 |
|
|
$ |
71,718 |
|
Net write-offs of accrued rental income |
|
|
4,161 |
|
|
|
— |
|
|
|
— |
|
|
|
297 |
|
|
|
— |
|
Lease termination fees |
|
|
— |
|
|
|
— |
|
|
|
— |
|
|
|
(7,500 |
) |
|
|
(1,678 |
) |
Cost of debt extinguishment |
|
|
— |
|
|
|
— |
|
|
|
3 |
|
|
|
— |
|
|
|
77 |
|
Gain on insurance recoveries |
|
|
— |
|
|
|
— |
|
|
|
— |
|
|
|
— |
|
|
|
(341 |
) |
Severance and executive transition costs |
|
|
218 |
|
|
|
740 |
|
|
|
183 |
|
|
|
481 |
|
|
|
— |
|
Other (income) expenses1 |
|
|
1,453 |
|
|
|
(1,464 |
) |
|
|
1,671 |
|
|
|
18 |
|
|
|
751 |
|
Core FFO |
|
$ |
75,275 |
|
|
$ |
74,754 |
|
|
$ |
74,381 |
|
|
$ |
74,473 |
|
|
$ |
70,527 |
|
Straight-line rent adjustment |
|
|
(5,404 |
) |
|
|
(6,785 |
) |
|
|
(7,276 |
) |
|
|
(7,271 |
) |
|
|
(6,826 |
) |
Adjustment to provision for credit |
|
|
— |
|
|
|
— |
|
|
|
(10 |
) |
|
|
— |
|
|
|
— |
|
Amortization of debt issuance costs |
|
|
983 |
|
|
|
983 |
|
|
|
986 |
|
|
|
986 |
|
|
|
988 |
|
Amortization of net mortgage |
|
|
— |
|
|
|
— |
|
|
|
(52 |
) |
|
|
(26 |
) |
|
|
(26 |
) |
Loss on interest rate swaps and |
|
|
319 |
|
|
|
522 |
|
|
|
521 |
|
|
|
522 |
|
|
|
522 |
|
Amortization of lease intangibles |
|
|
(1,014 |
) |
|
|
(1,056 |
) |
|
|
(1,085 |
) |
|
|
(2,691 |
) |
|
|
(1,308 |
) |
Stock-based compensation |
|
|
1,401 |
|
|
|
1,540 |
|
|
|
1,539 |
|
|
|
1,492 |
|
|
|
1,503 |
|
Deferred taxes |
|
|
(282 |
) |
|
|
— |
|
|
|
— |
|
|
|
— |
|
|
|
204 |
|
AFFO |
|
$ |
71,278 |
|
|
$ |
69,958 |
|
|
$ |
69,004 |
|
|
$ |
67,485 |
|
|
$ |
65,584 |
|
|
|
|
|
|
|
|
|
|
|
|
|
|
|
|
|
|||||
Diluted weighted average shares |
|
|
196,373 |
|
|
|
196,372 |
|
|
|
196,228 |
|
|
|
196,176 |
|
|
|
183,592 |
|
Net earnings per diluted share3 |
|
$ |
0.03 |
|
|
$ |
0.26 |
|
|
$ |
0.32 |
|
|
$ |
0.21 |
|
|
$ |
0.20 |
|
FFO per diluted share3 |
|
|
0.35 |
|
|
|
0.39 |
|
|
|
0.37 |
|
|
|
0.41 |
|
|
|
0.39 |
|
Core FFO per diluted share3 |
|
|
0.38 |
|
|
|
0.38 |
|
|
|
0.38 |
|
|
|
0.38 |
|
|
|
0.38 |
|
AFFO per diluted share3 |
|
|
0.36 |
|
|
|
0.36 |
|
|
|
0.35 |
|
|
|
0.34 |
|
|
|
0.36 |
|
1 Amount includes $1.5 million, ($1.4) million, $1.7 million, $18 thousand, and $0.8 million of unrealized and realized foreign exchange loss (gain) for the three months ended December 31,2023, September 30, 2023, June 30, 2023, March 31, 2023, and December 31, 2022, respectively, primarily associated with our Canadian dollar denominated revolver borrowings.
2 Excludes 493,524, 506,172, 504,161, 431,392, and 396,924, weighted average shares of unvested restricted common stock for the three months ended December 31, 2023, September 30, 2023, June 30, 2023, March 31, 2023 and December 31, 2022, respectively.
3 Excludes $0.1 million from the numerator for the three months ended December 31, 2023, September 30, 2023, June 30, 2023, March 31, 2023, and December 31, 2022, related to dividends declared on shares of unvested restricted common stock.
BROADSTONE NET LEASE, INC. | www.broadstone.com | © 2024 Broadstone Net Lease, LLC. All rights reserved. 8
EBITDA, EBITDAre, and Other-Non GAAP Operating Measures
(unaudited, in thousands)
|
|
Three Months Ended |
|
|||||||||||||||||
|
|
December 31, |
|
|
September 30, |
|
|
June 30, |
|
|
March 31, |
|
|
December 31, |
|
|||||
Net income |
|
$ |
6,797 |
|
|
$ |
52,145 |
|
|
$ |
62,996 |
|
|
$ |
41,374 |
|
|
$ |
36,773 |
|
Depreciation and amortization |
|
|
39,278 |
|
|
|
38,533 |
|
|
|
39,031 |
|
|
|
41,784 |
|
|
|
45,606 |
|
Interest expense |
|
|
18,972 |
|
|
|
19,665 |
|
|
|
20,277 |
|
|
|
21,139 |
|
|
|
23,773 |
|
Income taxes |
|
|
(268 |
) |
|
|
104 |
|
|
|
448 |
|
|
|
479 |
|
|
|
105 |
|
EBITDA |
|
$ |
64,779 |
|
|
$ |
110,447 |
|
|
$ |
122,752 |
|
|
$ |
104,776 |
|
|
$ |
106,257 |
|
Provision for impairment of investment in |
|
|
29,801 |
|
|
|
— |
|
|
|
— |
|
|
|
1,473 |
|
|
|
— |
|
Gain on sale of real estate |
|
|
(6,270 |
) |
|
|
(15,163 |
) |
|
|
(29,462 |
) |
|
|
(3,415 |
) |
|
|
(10,625 |
) |
EBITDAre |
|
$ |
88,310 |
|
|
$ |
95,284 |
|
|
$ |
93,290 |
|
|
$ |
102,834 |
|
|
$ |
95,632 |
|
Adjustment for current quarter investment activity 1 |
|
|
153 |
|
|
|
26 |
|
|
|
342 |
|
|
|
406 |
|
|
|
1,283 |
|
Adjustment for current quarter disposition activity 2 |
|
|
(156 |
) |
|
|
(400 |
) |
|
|
(444 |
) |
|
|
(365 |
) |
|
|
(440 |
) |
Adjustment to exclude non-recurring and other expenses 3 |
|
|
128 |
|
|
|
740 |
|
|
|
183 |
|
|
|
(1,023 |
) |
|
|
— |
|
Adjustment to exclude gain on insurance recoveries |
|
|
— |
|
|
|
— |
|
|
|
— |
|
|
|
— |
|
|
|
(341 |
) |
Adjustment to exclude net write-offs of accrued rental income |
|
|
4,161 |
|
|
|
— |
|
|
|
— |
|
|
|
297 |
|
|
|
— |
|
Adjustment to exclude realized / unrealized foreign exchange (gain) loss |
|
|
1,453 |
|
|
|
(1,433 |
) |
|
|
1,681 |
|
|
|
18 |
|
|
|
796 |
|
Adjustment to exclude cost of debt extinguishments |
|
|
— |
|
|
|
— |
|
|
|
3 |
|
|
|
— |
|
|
|
77 |
|
Adjustment to exclude lease termination fees |
|
|
— |
|
|
|
— |
|
|
|
— |
|
|
|
(7,500 |
) |
|
|
(1,678 |
) |
Adjusted EBITDAre |
|
$ |
94,049 |
|
|
$ |
94,217 |
|
|
$ |
95,055 |
|
|
$ |
94,667 |
|
|
$ |
95,329 |
|
General and administrative |
|
|
9,254 |
|
|
|
9,404 |
|
|
|
9,300 |
|
|
|
9,935 |
|
|
|
9,318 |
|
Adjusted Net Operating Income ("NOI") |
|
$ |
103,303 |
|
|
$ |
103,621 |
|
|
$ |
104,355 |
|
|
$ |
104,602 |
|
|
$ |
104,647 |
|
Straight-line rental revenue, net |
|
|
(5,438 |
) |
|
|
(6,744 |
) |
|
|
(7,277 |
) |
|
|
(7,425 |
) |
|
|
(7,315 |
) |
Other amortization and non-cash charges |
|
|
(1,014 |
) |
|
|
(1,087 |
) |
|
|
(1,095 |
) |
|
|
(1,668 |
) |
|
|
(1,353 |
) |
Adjusted Cash NOI |
|
$ |
96,851 |
|
|
$ |
95,789 |
|
|
$ |
95,983 |
|
|
$ |
95,509 |
|
|
$ |
95,979 |
|
Annualized EBITDAre |
|
$ |
353,240 |
|
|
$ |
381,136 |
|
|
$ |
373,160 |
|
|
$ |
411,336 |
|
|
$ |
382,528 |
|
Annualized Adjusted EBITDAre |
|
|
376,196 |
|
|
|
376,868 |
|
|
|
380,220 |
|
|
|
378,668 |
|
|
|
381,315 |
|
Annualized Adjusted NOI |
|
|
413,212 |
|
|
|
414,483 |
|
|
|
417,420 |
|
|
|
418,411 |
|
|
|
418,585 |
|
Annualized Adjusted Cash NOI |
|
|
387,404 |
|
|
|
383,157 |
|
|
|
383,932 |
|
|
|
382,043 |
|
|
|
383,914 |
|
1 Reflects an adjustment to give effect to all investments during the quarter as if they had been made as of the beginning of the quarter.
2 Reflects an adjustment to give effect to all dispositions during the quarter as if they had been sold as of the beginning of the quarter.
3 Amounts include $0.2 million, $0.7 million and $0.2 million of employee severance and executive transition costs during the three months ended December 31, 2023, September 30, 2023, and June 30, 2023, respectively, and ($0.1) million of forfeited stock-based compensation for the three months ended December 31, 2023. Amounts include a combined $0.5 million of executive transition costs and accelerated amortization of stock-based compensation, related to the departure of our previous chief executive officer and $(1.5) million of accelerated amortization of lease intangibles for the three months ended March 31, 2023.
BROADSTONE NET LEASE, INC. | www.broadstone.com | © 2024 Broadstone Net Lease, LLC. All rights reserved. 9
Lease Revenues Detail
(unaudited, in thousands)
|
|
Three Months Ended |
|
|||||||||||||||||
|
|
December 31, |
|
|
September 30, |
|
|
June 30, |
|
|
March 31, |
|
|
December 31, |
|
|||||
Contractual rental amounts billed for |
|
$ |
97,182 |
|
|
$ |
96,333 |
|
|
$ |
96,456 |
|
|
$ |
98,102 |
|
|
$ |
96,208 |
|
Adjustment to recognize contractual |
|
|
5,513 |
|
|
|
6,891 |
|
|
|
7,380 |
|
|
|
7,370 |
|
|
|
6,898 |
|
Net write-offs of accrued rental income |
|
|
(4,161 |
) |
|
|
— |
|
|
|
— |
|
|
|
(105 |
) |
|
|
— |
|
Variable rental amounts earned |
|
|
971 |
|
|
|
513 |
|
|
|
452 |
|
|
|
341 |
|
|
|
721 |
|
Earned income from direct financing |
|
|
685 |
|
|
|
687 |
|
|
|
689 |
|
|
|
691 |
|
|
|
693 |
|
Interest income from sales-type |
|
|
15 |
|
|
|
14 |
|
|
|
15 |
|
|
|
14 |
|
|
|
15 |
|
Operating expenses billed to tenants |
|
|
5,513 |
|
|
|
5,181 |
|
|
|
4,594 |
|
|
|
5,075 |
|
|
|
5,720 |
|
Other income from real estate |
|
|
— |
|
|
|
19 |
|
|
|
3 |
|
|
|
7,392 |
|
|
|
2,019 |
|
Adjustment to revenue recognized for |
|
|
(718 |
) |
|
|
(95 |
) |
|
|
(236 |
) |
|
|
112 |
|
|
|
(139 |
) |
Total Lease revenues, net |
|
$ |
105,000 |
|
|
$ |
109,543 |
|
|
$ |
109,353 |
|
|
$ |
118,992 |
|
|
$ |
112,135 |
|
BROADSTONE NET LEASE, INC. | www.broadstone.com | © 2024 Broadstone Net Lease, LLC. All rights reserved. 10
Capital Structure
(in thousands, except per share data)
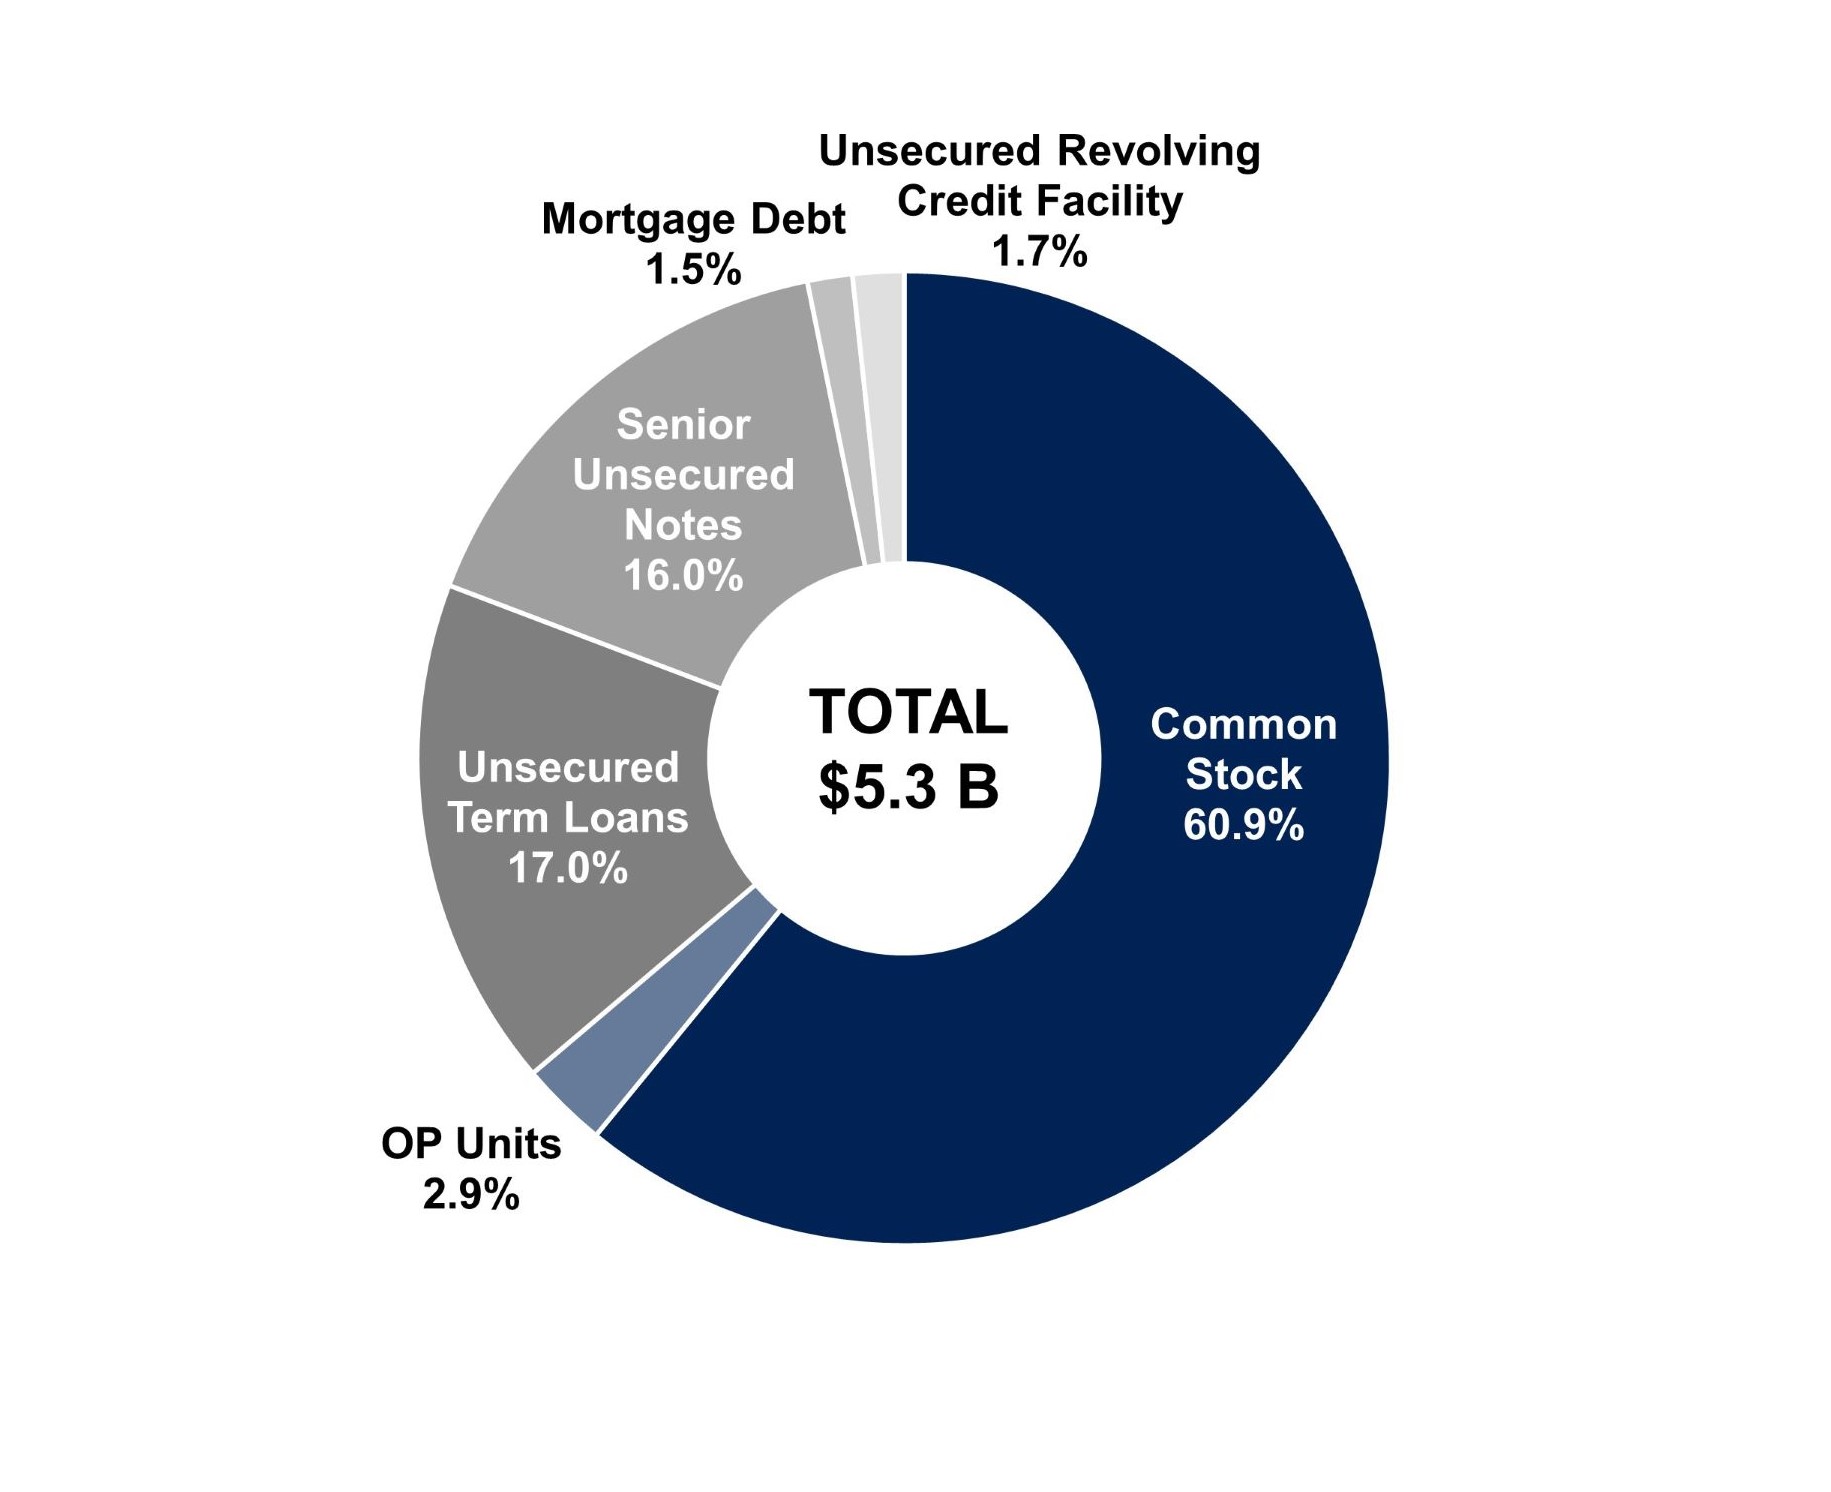
EQUITY |
|
|
|
|
Shares of Common Stock |
|
|
187,614 |
|
OP Units |
|
|
8,928 |
|
Common Stock & OP Units |
|
|
196,542 |
|
Price Per Share / Unit at December 31, 2023 |
|
$ |
17.22 |
|
IMPLIED EQUITY MARKET CAPITALIZATION |
|
$ |
3,384,453 |
|
% of Total Capitalization |
|
|
63.8 |
% |
DEBT |
|
|
|
|
Unsecured Revolving Credit Facility - 2026 |
|
$ |
90,434 |
|
Unsecured Term Loans |
|
|
900,000 |
|
Unsecured Term Loan - 2026 |
|
|
400,000 |
|
Unsecured Term Loan - 2027 |
|
|
200,000 |
|
Unsecured Term Loan - 2029 |
|
|
300,000 |
|
Senior Unsecured Notes |
|
|
850,000 |
|
Senior Unsecured Notes - 2027 |
|
|
150,000 |
|
Senior Unsecured Notes - 2028 |
|
|
225,000 |
|
Senior Unsecured Notes - 2030 |
|
|
100,000 |
|
Senior Unsecured Public Notes - 2031 |
|
|
375,000 |
|
Mortgage Debt - Various |
|
|
79,068 |
|
TOTAL DEBT |
|
$ |
1,919,502 |
|
% of Total Capitalization |
|
|
36.2 |
% |
Floating Rate Debt % |
|
|
0.8 |
% |
Fixed Rate Debt % |
|
|
99.2 |
% |
Secured Debt % |
|
|
4.1 |
% |
Unsecured Debt % |
|
|
95.9 |
% |
|
|
|
|
|
Total Capitalization |
|
$ |
5,303,955 |
|
Less: Cash and Cash Equivalents |
|
|
(19,494 |
) |
Enterprise Value |
|
$ |
5,284,461 |
|
BROADSTONE NET LEASE, INC. | www.broadstone.com | © 2024 Broadstone Net Lease, LLC. All rights reserved. 11
Equity Rollforward
(in thousands)
|
|
|
Shares of Common Stock |
|
|
OP Units |
|
|
Total Diluted Shares |
|
|||
Balance, January 1, 2023 |
|
|
|
186,114 |
|
|
|
10,205 |
|
|
|
196,319 |
|
Grants of restricted stock awards - employees |
|
|
|
259 |
|
|
|
— |
|
|
|
259 |
|
Retirement of common shares under equity incentive plan |
|
|
|
(66 |
) |
|
|
— |
|
|
|
(66 |
) |
OP unit conversion |
|
|
|
896 |
|
|
|
(896 |
) |
|
|
— |
|
Balance, March 31, 2023 |
|
|
|
187,203 |
|
|
|
9,309 |
|
|
|
196,512 |
|
Grants of restricted stock awards - board of directors |
|
|
|
50 |
|
|
|
— |
|
|
|
50 |
|
Grants of restricted stock awards - employees |
|
|
|
1 |
|
|
|
— |
|
|
|
1 |
|
Forfeiture of restricted stock awards |
|
|
|
(6 |
) |
|
|
— |
|
|
|
(6 |
) |
OP unit conversion |
|
|
|
25 |
|
|
|
(25 |
) |
|
|
— |
|
Balance, June 30, 2023 |
|
|
|
187,273 |
|
|
|
9,284 |
|
|
|
196,557 |
|
Forfeiture of restricted stock awards |
|
|
|
(2 |
) |
|
|
— |
|
|
|
(2 |
) |
OP unit conversion |
|
|
|
1 |
|
|
|
(1 |
) |
|
|
— |
|
Balance, September 30, 2023 |
|
|
|
187,272 |
|
|
|
9,283 |
|
|
|
196,555 |
|
Grants of restricted stock awards - employees |
|
|
|
2 |
|
|
|
— |
|
|
|
2 |
|
Forfeiture of restricted stock awards |
|
|
|
(15 |
) |
|
|
— |
|
|
|
(15 |
) |
OP unit conversion |
|
|
|
355 |
|
|
|
(355 |
) |
|
|
— |
|
Balance, December 31, 2023 |
|
|
|
187,614 |
|
|
|
8,928 |
|
|
|
196,542 |
|
|
|
|
|
|
|
|
|
|
|
||||
BROADSTONE NET LEASE, INC. | www.broadstone.com | © 2024 Broadstone Net Lease, LLC. All rights reserved. 12
Debt Outstanding
(in thousands)
|
|
Outstanding Balance |
|
|
|
|
|
|||||
|
|
December 31, |
|
|
December 31, |
|
|
|
|
|
||
|
|
2023 |
|
|
2022 |
|
|
Interest Rate |
|
Maturity Date |
||
Revolving Credit Facility |
$ |
90,434 |
|
|
$ |
197,322 |
|
|
Applicable reference rate |
|
Mar. 20264 |
|
Unsecured term loans: |
|
|
|
|
|
|
|
|
|
|
||
2026 Unsecured Term Loan |
|
|
400,000 |
|
|
|
400,000 |
|
|
one-month adjusted SOFR + 1.00%2, 3 |
|
Feb. 2026 |
2027 Unsecured Term Loan |
|
|
200,000 |
|
|
|
200,000 |
|
|
one-month adjusted SOFR + 0.95%3 |
|
Aug. 2027 |
2029 Unsecured Term Loan |
|
|
300,000 |
|
|
|
300,000 |
|
|
one-month adjusted SOFR + 1.25%3 |
|
Aug. 2029 |
Total unsecured term loans |
|
|
900,000 |
|
|
|
900,000 |
|
|
|
|
|
Unamortized debt issuance costs, net |
|
|
(4,053 |
) |
|
|
(5,308 |
) |
|
|
|
|
Total unsecured term loans, net |
|
|
895,947 |
|
|
|
894,692 |
|
|
|
|
|
Senior unsecured notes: |
|
|
|
|
|
|
|
|
|
|
||
2027 Senior Unsecured Notes - Series A |
|
150,000 |
|
|
|
150,000 |
|
|
4.84% |
|
Apr. 2027 |
|
2028 Senior Unsecured Notes - Series B |
|
225,000 |
|
|
|
225,000 |
|
|
5.09% |
|
Jul. 2028 |
|
2030 Senior Unsecured Notes - Series C |
|
100,000 |
|
|
|
100,000 |
|
|
5.19% |
|
Jul. 2030 |
|
2031 Senior Unsecured Public Notes |
|
|
375,000 |
|
|
|
375,000 |
|
|
2.60% |
|
Sep. 2031 |
Total senior unsecured notes |
|
|
850,000 |
|
|
|
850,000 |
|
|
|
|
|
Unamortized debt issuance costs and |
|
|
(4,691 |
) |
|
|
(5,445 |
) |
|
|
|
|
Total senior unsecured notes, net |
|
|
845,309 |
|
|
|
844,555 |
|
|
|
|
|
Total unsecured debt, net |
|
$ |
1,831,690 |
|
|
$ |
1,936,569 |
|
|
|
|
|
1 At December 31, 2023 and 2022, a balance of $15.0 million and $123.5 million, respectively was subject to the one-month SOFR. The remaining balances include $100 million CAD borrowings remeasured to $75.4 million and $73.8 million USD, respectively, which were subject to the one-month Canadian Dollar Offered Rate.
2 At December 31, 2023, one-month SOFR was 5.35%. At December 31, 2022, the applicable interest rate was 1-month LIBOR of 4.39%.
3 At December 31, 2023 and 2022, one-month SOFR was 5.35% and 4.36%, respectively.
4 Our Revolving Credit Facility contains two six-month extension options subject to certain conditions, including the payment of an extension fee equal to 0.0625% of the revolving commitments.
|
|
Origination |
|
Maturity |
|
|
|
|
|
|
|
|
||
|
|
Date |
|
Date |
|
Interest |
|
December 31, |
|
|
December 31, |
|
||
Lender |
|
(Month/Year) |
|
(Month/Year) |
|
Rate |
|
2023 |
|
|
2022 |
|
||
Wilmington Trust National Association |
|
Apr-19 |
|
Feb-28 |
|
4.92% |
|
$ |
44,207 |
|
|
$ |
45,516 |
|
Wilmington Trust National Association |
|
Jun-18 |
|
Aug-25 |
|
4.36% |
|
|
18,725 |
|
|
|
19,150 |
|
PNC Bank |
|
Oct-16 |
|
Nov-26 |
|
3.62% |
|
|
16,241 |
|
|
|
16,675 |
|
Aegon |
|
Apr-12 |
|
Oct-23 |
|
6.38% |
|
|
— |
|
|
|
5,413 |
|
Total mortgages |
|
|
|
|
|
|
|
|
79,173 |
|
|
|
86,754 |
|
Debt issuance costs, net |
|
|
|
|
|
|
|
|
(105 |
) |
|
|
(152 |
) |
Mortgages, net |
|
|
|
|
|
|
|
$ |
79,068 |
|
|
$ |
86,602 |
|
Year of Maturity |
|
Revolving |
|
|
Mortgages |
|
|
Term Loans |
|
|
Senior Notes |
|
Total |
|
|||||
2024 |
|
$ |
— |
|
|
$ |
2,260 |
|
|
$ |
— |
|
|
$ |
— |
|
$ |
2,260 |
|
2025 |
|
|
— |
|
|
|
20,195 |
|
|
|
— |
|
|
|
— |
|
|
20,195 |
|
2026 |
|
|
90,434 |
|
|
|
16,843 |
|
|
|
400,000 |
|
|
|
— |
|
|
507,277 |
|
2027 |
|
|
— |
|
|
|
1,596 |
|
|
|
200,000 |
|
|
|
150,000 |
|
|
351,596 |
|
2028 |
|
|
— |
|
|
|
38,278 |
|
|
|
— |
|
|
|
225,000 |
|
|
263,278 |
|
Thereafter |
|
|
— |
|
|
|
— |
|
|
|
300,000 |
|
|
|
475,000 |
|
|
775,000 |
|
Total |
|
$ |
90,434 |
|
|
$ |
79,172 |
|
|
$ |
900,000 |
|
|
$ |
850,000 |
|
$ |
1,919,606 |
|
BROADSTONE NET LEASE, INC. | www.broadstone.com | © 2024 Broadstone Net Lease, LLC. All rights reserved. 13
Interest Rate Swaps
(in thousands, except interest rates)
|
|
|
|
|
|
|
December 31, 2023 |
|
||||||||
Counterparty |
|
Maturity Date |
|
Fixed |
|
|
Variable Rate Index (1) |
|
Notional |
|
|
Fair |
|
|||
Wells Fargo Bank, N.A. |
|
October 2024 |
|
|
2.72 |
% |
|
daily compounded SOFR |
|
$ |
15,000 |
|
|
$ |
255 |
|
Capital One, National Association |
|
December 2024 |
|
|
1.58 |
% |
|
daily compounded SOFR |
|
|
15,000 |
|
|
|
445 |
|
Bank of Montreal |
|
January 2025 |
|
|
1.91 |
% |
|
daily compounded SOFR |
|
|
25,000 |
|
|
|
713 |
|
Truist Financial Corporation |
|
April 2025 |
|
|
2.20 |
% |
|
daily compounded SOFR |
|
|
25,000 |
|
|
|
734 |
|
Bank of Montreal |
|
July 2025 |
|
|
2.32 |
% |
|
daily compounded SOFR |
|
|
25,000 |
|
|
|
768 |
|
Truist Financial Corporation |
|
July 2025 |
|
|
1.99 |
% |
|
daily compounded SOFR |
|
|
25,000 |
|
|
|
888 |
|
Truist Financial Corporation |
|
December 2025 |
|
|
2.30 |
% |
|
daily compounded SOFR |
|
|
25,000 |
|
|
|
887 |
|
Bank of Montreal |
|
January 2026 |
|
|
1.92 |
% |
|
daily compounded SOFR |
|
|
25,000 |
|
|
|
1,071 |
|
Bank of Montreal |
|
January 2026 |
|
|
2.05 |
% |
|
daily compounded SOFR |
|
|
40,000 |
|
|
|
1,615 |
|
Capital One, National Association |
|
January 2026 |
|
|
2.08 |
% |
|
daily compounded SOFR |
|
|
35,000 |
|
|
|
1,389 |
|
Truist Financial Corporation |
|
January 2026 |
|
|
1.93 |
% |
|
daily compounded SOFR |
|
|
25,000 |
|
|
|
1,067 |
|
Capital One, National Association |
|
April 2026 |
|
|
2.68 |
% |
|
daily compounded SOFR |
|
|
15,000 |
|
|
|
439 |
|
Capital One, National Association |
|
July 2026 |
|
|
1.32 |
% |
|
daily compounded SOFR |
|
|
35,000 |
|
|
|
2,186 |
|
Bank of Montreal |
|
December 2026 |
|
|
2.33 |
% |
|
daily compounded SOFR |
|
|
10,000 |
|
|
|
423 |
|
Bank of Montreal |
|
December 2026 |
|
|
1.99 |
% |
|
daily compounded SOFR |
|
|
25,000 |
|
|
|
1,299 |
|
Toronto-Dominion Bank |
|
March 2027 |
|
|
2.46 |
% |
|
one-month CDOR |
|
|
15,087 |
|
(2) |
|
572 |
|
Wells Fargo Bank, N.A. |
|
April 2027 |
|
|
2.72 |
% |
|
daily compounded SOFR |
|
|
25,000 |
|
|
|
806 |
|
Bank of Montreal |
|
December 2027 |
|
|
2.37 |
% |
|
daily compounded SOFR |
|
|
25,000 |
|
|
|
1,215 |
|
Capital One, National Association |
|
December 2027 |
|
|
2.37 |
% |
|
daily compounded SOFR |
|
|
25,000 |
|
|
|
1,197 |
|
Wells Fargo Bank, N.A. |
|
January 2028 |
|
|
2.37 |
% |
|
daily compounded SOFR |
|
|
75,000 |
|
|
|
3,632 |
|
Bank of Montreal |
|
May 2029 |
|
|
2.09 |
% |
|
daily compounded SOFR |
|
|
25,000 |
|
|
|
1,835 |
|
Regions Bank |
|
May 2029 |
|
|
2.11 |
% |
|
daily compounded SOFR |
|
|
25,000 |
|
|
|
1,801 |
|
Regions Bank |
|
June 2029 |
|
|
2.03 |
% |
|
daily compounded SOFR |
|
|
25,000 |
|
|
|
1,900 |
|
U.S. Bank National Association |
|
June 2029 |
|
|
2.03 |
% |
|
daily compounded SOFR |
|
|
25,000 |
|
|
|
1,908 |
|
Regions Bank |
|
August 2029 |
|
|
2.58 |
% |
|
one-month SOFR |
|
|
100,000 |
|
|
|
4,392 |
|
Toronto-Dominion Bank |
|
August 2029 |
|
|
2.58 |
% |
|
one-month SOFR |
|
|
45,000 |
|
|
|
2,021 |
|
U.S. Bank National Association |
|
August 2029 |
|
|
2.65 |
% |
|
one-month SOFR |
|
|
15,000 |
|
|
|
618 |
|
U.S. Bank National Association |
|
August 2029 |
|
|
2.58 |
% |
|
one-month SOFR |
|
|
100,000 |
|
|
|
4,427 |
|
U.S. Bank National Association |
|
August 2029 |
|
|
1.35 |
% |
|
daily compounded SOFR |
|
|
25,000 |
|
|
|
2,828 |
|
Regions Bank |
|
March 2032 |
|
|
2.69 |
% |
|
one-month CDOR |
|
|
15,087 |
|
(2) |
|
677 |
|
U.S. Bank National Association |
|
March 2032 |
|
|
2.70 |
% |
|
one-month CDOR |
|
|
15,087 |
|
(2) |
|
678 |
|
Bank of Montreal |
|
March 2034 |
|
|
2.81 |
% |
|
one-month CDOR |
|
|
30,174 |
|
(3) |
|
1,410 |
|
|
|
|
|
|
|
|
|
|
$ |
975,435 |
|
|
$ |
46,096 |
|
|
1 Prior to the cessation of LIBOR on July 1, 2023, the variable rate index for daily compounded SOFR-based swaps was one-month LIBOR.
2 The contractual notional amount is $20.0 million CAD.
3 The contractual notional amount is $40.0 million CAD.
BROADSTONE NET LEASE, INC. | www.broadstone.com | © 2024 Broadstone Net Lease, LLC. All rights reserved. 14
Net Debt Metrics
(in thousands)
|
|
|
|
|
|
|
|
|
|
|
|
|
|
|
|
|||||
|
|
December 31, |
|
|
September 30, |
|
|
June 30, |
|
|
March 31, |
|
|
December 31, |
|
|||||
Debt |
|
|
|
|
|
|
|
|
|
|
|
|
|
|
|
|||||
Unsecured revolving credit facility |
|
$ |
90,434 |
|
|
$ |
74,060 |
|
|
$ |
122,912 |
|
|
$ |
108,330 |
|
|
$ |
197,322 |
|
Unsecured term loans, net |
|
|
895,947 |
|
|
|
895,633 |
|
|
|
895,319 |
|
|
|
895,006 |
|
|
|
894,692 |
|
Senior unsecured notes, net |
|
|
845,309 |
|
|
|
845,121 |
|
|
|
844,932 |
|
|
|
844,744 |
|
|
|
844,555 |
|
Mortgages, net |
|
|
79,068 |
|
|
|
79,613 |
|
|
|
80,141 |
|
|
|
85,853 |
|
|
|
86,602 |
|
Debt issuance costs |
|
|
8,848 |
|
|
|
9,360 |
|
|
|
9,872 |
|
|
|
10,390 |
|
|
|
10,905 |
|
Gross Debt |
|
|
1,919,606 |
|
|
|
1,903,787 |
|
|
|
1,953,176 |
|
|
|
1,944,323 |
|
|
|
2,034,076 |
|
Cash and cash equivalents |
|
|
(19,494 |
) |
|
|
(35,061 |
) |
|
|
(20,763 |
) |
|
|
(15,412 |
) |
|
|
(21,789 |
) |
Restricted cash |
|
|
(1,138 |
) |
|
|
(15,436 |
) |
|
|
(15,502 |
) |
|
|
(3,898 |
) |
|
|
(38,251 |
) |
Net Debt |
|
$ |
1,898,974 |
|
|
$ |
1,853,290 |
|
|
$ |
1,916,911 |
|
|
$ |
1,925,013 |
|
|
$ |
1,974,036 |
|
|
|
|
|
|
|
|
|
|
|
|
|
|
|
|
|
|||||
Net Debt to Annualized EBITDAre |
|
5.4x |
|
|
4.9x |
|
|
5.1x |
|
|
4.7x |
|
|
5.2x |
|
|||||
Net Debt to Annualized Adjusted |
|
5.0x |
|
|
4.9x |
|
|
5.0x |
|
|
5.1x |
|
|
5.2x |
|
|||||
BROADSTONE NET LEASE, INC. | www.broadstone.com | © 2024 Broadstone Net Lease, LLC. All rights reserved. 15 The following is a summary of key financial covenants for the Company’s unsecured debt instruments.
Covenants
The covenants associated with the Revolving Credit Facility, Unsecured Term Loans with commercial banks, and the Series A-C Senior Unsecured Notes, are reported to the respective lenders via quarterly covenant reporting packages. The covenants associated with the 2031 Senior Unsecured Public Notes are not required to be reported externally to third parties, and are instead calculated in connection with borrowing activity and for financial reporting purposes only. These calculations, which are not based on U.S. GAAP measurements, are presented to investors to show that as of December 31, 2023, the Company believes it is in compliance with the covenants.
Covenants |
|
Required |
|
Revolving Credit Facility and Unsecured Term Loans |
|
|
Senior Unsecured |
|
|
2031 Senior Unsecured Public Notes |
|
|||
Leverage ratio |
|
≤ 0.60 to 1.00 |
|
|
0.32 |
|
|
|
0.33 |
|
|
Not Applicable |
|
|
Secured indebtedness ratio |
|
≤ 0.40 to 1.00 |
|
|
0.01 |
|
|
|
0.01 |
|
|
Not Applicable |
|
|
Unencumbered coverage ratio |
|
≥ 1.75 to 1.00 |
|
|
3.61 |
|
|
Not Applicable |
|
|
Not Applicable |
|
||
Fixed charge coverage ratio |
|
≥ 1.50 to 1.00 |
|
|
4.48 |
|
|
|
4.48 |
|
|
Not Applicable |
|
|
Total unsecured indebtedness to |
|
≤ 0.60 to 1.00 |
|
|
0.34 |
|
|
|
0.35 |
|
|
Not Applicable |
|
|
Dividends and other restricted |
|
Only applicable |
|
Not Applicable |
|
|
Not Applicable |
|
|
Not Applicable |
|
|||
Aggregate debt ratio |
|
≤ 0.60 to 1.00 |
|
Not Applicable |
|
|
Not Applicable |
|
|
|
0.35 |
|
||
Consolidated income available for |
|
≥ 1.50 to 1.00 |
|
Not Applicable |
|
|
Not Applicable |
|
|
|
4.96 |
|
||
Total unencumbered assets to |
|
≥ 1.50 to 1.00 |
|
Not Applicable |
|
|
Not Applicable |
|
|
|
2.87 |
|
||
Secured debt ratio |
|
≤ 0.40 to 1.00 |
|
Not Applicable |
|
|
Not Applicable |
|
|
|
0.01 |
|
||
BROADSTONE NET LEASE, INC. | www.broadstone.com | © 2024 Broadstone Net Lease, LLC. All rights reserved. 16 The Company utilizes diversified sources of debt capital including unsecured bank debt, unsecured notes, and secured mortgages (where appropriate).
Debt Maturities
(dollars in millions)

1 Our Revolving Credit Facility contains two six-month extension options subject to certain conditions, including the payment of an extension fee equal to 0.0625% of the revolving commitments.
Swap Maturities
(dollars in millions)

BROADSTONE NET LEASE, INC. | www.broadstone.com | © 2024 Broadstone Net Lease, LLC. All rights reserved. 17 The following tables summarize the Company’s investment activity during 2023.
Investment Activity
(square feet and dollars in thousands)
|
|
Q1 20231 |
|
|
Q2 2023 |
|
|
|
Q3 2023 |
|
|
Q4 2023 |
|
|
YTD 2023 |
|
||||||
Acquisitions: |
|
|
|
|
|
|
|
|
|
|
|
|
|
|
|
|
||||||
Number of transactions |
|
|
1 |
|
|
|
2 |
|
|
|
|
— |
|
|
|
— |
|
|
|
3 |
|
|
Number of properties |
|
|
1 |
|
|
|
3 |
|
|
|
|
— |
|
|
|
— |
|
|
|
4 |
|
|
Square feet |
|
|
10 |
|
|
|
144 |
|
|
|
|
— |
|
|
|
— |
|
|
|
154 |
|
|
Acquisition price |
|
$ |
5,221 |
|
|
$ |
20,384 |
|
|
|
|
— |
|
|
|
— |
|
|
$ |
25,605 |
|
|
Industrial |
|
|
— |
|
|
|
20,384 |
|
|
|
|
— |
|
|
|
— |
|
|
|
20,384 |
|
|
Retail |
|
|
5,221 |
|
|
|
— |
|
|
|
|
— |
|
|
|
— |
|
|
|
5,221 |
|
|
Restaurant |
|
|
— |
|
|
|
— |
|
|
|
|
— |
|
|
|
— |
|
|
|
— |
|
|
Healthcare |
|
|
— |
|
|
|
— |
|
|
|
|
— |
|
|
|
— |
|
|
|
— |
|
|
Initial cash capitalization rate |
|
|
6.8 |
% |
|
|
7.4 |
% |
|
|
|
— |
|
|
|
— |
|
|
|
7.3 |
% |
|
GAAP capitalization rate |
|
|
8.0 |
% |
|
|
8.6 |
% |
|
|
|
— |
|
|
|
— |
|
|
|
8.5 |
% |
|
Weighted avg. lease term (years) |
|
|
20.1 |
|
|
|
14.2 |
|
|
|
|
— |
|
|
|
— |
|
|
|
15.3 |
|
|
Weighted average annual rent increase |
|
|
1.8 |
% |
|
|
2.0 |
% |
|
|
|
— |
|
|
|
— |
|
|
|
2.0 |
% |
|
|
|
|
|
|
|
|
|
|
|
|
|
|
|
|
|
|
||||||
Revenue generating capital expenditures: |
|
|
|
|
|
|
|
|
|
|
|
|
|
|
|
|
||||||
Number of existing properties |
|
|
2 |
|
|
|
1 |
|
|
|
|
3 |
|
|
|
2 |
|
|
|
8 |
|
|
Investments2 |
|
$ |
14,825 |
|
|
$ |
7,000 |
|
|
|
$ |
4,755 |
|
|
$ |
16,229 |
|
|
$ |
42,809 |
|
|
Industrial |
|
|
14,825 |
|
|
|
7,000 |
|
|
|
|
4,755 |
|
|
|
16,229 |
|
|
|
42,809 |
|
|
Initial cash capitalization rate |
|
|
7.0 |
% |
|
|
7.0 |
% |
|
|
|
6.7 |
% |
|
|
7.5 |
% |
|
|
7.2 |
% |
|
Weighted avg. lease term (years) |
|
|
18.2 |
|
|
|
18.4 |
|
|
|
|
14.1 |
|
|
|
12.7 |
|
|
|
15.6 |
|
|
Weighted average annual rent increase |
|
|
1.8 |
% |
|
|
1.8 |
% |
|
|
|
2.0 |
% |
|
|
1.5 |
% |
|
|
1.7 |
% |
|
|
|
|
|
|
|
|
|
|
|
|
|
|
|
|
|
|
||||||
Development funding opportunities: |
|
|
|
|
|
|
|
|
|
|
|
|
|
|
|
|
||||||
Number of new properties |
|
|
— |
|
|
|
1 |
|
|
|
|
1 |
|
|
|
1 |
|
|
|
3 |
|
|
Total development funding opportunities |
|
|
— |
|
|
|
37,549 |
|
|
- |
|
|
11,746 |
|
|
|
47,878 |
|
|
|
97,173 |
|
|
|
|
|
|
|
|
|
|
|
|
|
|
|
|
|
|
||||||
Total investments |
|
$ |
20,046 |
|
|
$ |
64,933 |
|
|
|
$ |
16,501 |
|
|
$ |
64,107 |
|
|
$ |
165,587 |
|
|
Total initial cash capitalization rate3 |
|
|
7.0 |
% |
|
|
7.3 |
% |
|
|
|
6.7 |
% |
|
|
7.5 |
% |
|
|
7.2 |
% |
|
Total weighted average lease term (years)3 |
|
|
18.7 |
|
|
|
15.2 |
|
|
|
|
14.1 |
|
|
|
12.7 |
|
|
|
15.5 |
|
|
Total weighted average annual rent increase3 |
|
|
1.8 |
% |
|
|
1.9 |
% |
|
|
|
2.0 |
% |
|
|
1.5 |
% |
|
|
1.8 |
% |
|
1 During the first quarter, we entered into an agreement under the terms of an existing lease to substitute two properties with a tenant in exchange for one new property of equal value. Property substitutions are not included in the acquisition/disposition activity, but will impact the total number of properties reported as of December 31, 2023.
2 Total unfunded investment commitments at December 31, 2023, include up to $111.0 million in development fundings and $9.8 million in revenue generating capital expenditures.
3 Due to the nature of development funding opportunities not generating revenue during construction, these developments are excluded from the calculation of total capitalization rates, weighted average lease terms, and rent increases.
BROADSTONE NET LEASE, INC. | www.broadstone.com | © 2024 Broadstone Net Lease, LLC. All rights reserved. 18 The following table summarizes the Company’s developments under construction as of December 31, 2023:
Developments4
(square feet and dollars in thousands)
Property |
|
Property Type |
|
Projected Rentable Square Feet |
|
Start Date4 |
|
Target Completion Date4 |
|
Initial Purchase Price4 |
|
Estimated Project Development Costs4 |
|
Estimated Total Project Investment4 |
|
QTD Q4 2023 Investment |
|
Cumulative Investment at 12/31/23 |
|
Estimated Cash Capitalization Rate4 |
|
Estimated GAAP Capitalization Rate4 |
UNFI (Sarasota - FL) |
|
Industrial |
|
1,016 |
|
5/2023 |
|
10/2024 |
|
$17,300 |
|
$187,500 |
|
$204,800 |
|
$45,302 |
|
$93,858 |
|
7.2% |
|
8.3% |
Total |
|
|
|
1,016 |
|
|
|
|
|
$17,300 |
|
$187,500 |
|
$204,800 |
|
$45,302 |
|
$93,858 |
|
7.2% |
|
8.3% |
The following table summarizes the Company’s completed developments as of December 31, 2023:
Property |
|
Property Type |
|
Rentable Square Feet |
|
|
Completion Date4 |
|
Project Investment Costs Funded |
|
|
Project Investment Costs to be Funded |
|
|
Total Project Investment Costs |
|
|
Cash Capitalization Rate4 |
|
|
GAAP Capitalization Rate4 |
|
||||||
7 Brew (Tulsa - OK) |
|
Restaurant |
|
|
1 |
|
|
10/2023 |
|
$ |
1,668 |
|
|
$ |
- |
|
|
$ |
1,668 |
|
|
|
7.1 |
% |
|
|
7.3 |
% |
Taco Bell (Stilwell - OK) |
|
Restaurant |
|
|
2 |
|
|
12/2023 |
|
|
1,647 |
|
|
|
316 |
|
|
|
1,963 |
|
|
|
7.0 |
% |
|
|
8.3 |
% |
Total |
|
|
|
|
3 |
|
|
|
|
$ |
3,315 |
|
|
$ |
316 |
|
|
$ |
3,631 |
|
|
|
7.1 |
% |
|
|
7.8 |
% |
4 Refer to definitions and explanations appearing at the end of this supplemental document.
BROADSTONE NET LEASE, INC. | www.broadstone.com | © 2024 Broadstone Net Lease, LLC. All rights reserved. 19 The following table summarizes the Company’s property disposition activity during 2023.
Dispositions1
(square feet and dollars in thousands)
Q1 20231 |
|
|
|
|
|
|
|
|
|
|
|
|
|
|
|
|||||
Property Type |
|
Number of Properties |
|
|
Square Feet |
|
|
Acquisition Price |
|
|
Disposition Price |
|
|
Net Book |
|
|||||
Office2 |
|
|
1 |
|
|
|
282 |
|
|
$ |
33,050 |
|
|
|
32,000 |
|
|
$ |
30,881 |
|
Industrial |
|
|
1 |
|
|
|
74 |
|
|
|
16,240 |
|
|
|
18,550 |
|
|
|
15,015 |
|
Restaurant |
|
|
1 |
|
|
|
5 |
|
|
|
1,186 |
|
|
|
1,324 |
|
|
|
1,099 |
|
Total Properties |
|
|
3 |
|
|
|
361 |
|
|
$ |
50,476 |
|
|
$ |
51,874 |
|
|
$ |
46,995 |
|
Weighted average cash cap rate2 |
|
|
|
|
|
|
|
|
|
|
|
|
6.0 |
% |
||||||
|
|
|
|
|
|
|
|
|
|
|
|
|
|
|
|
|||||
Q2 2023 |
|
|
|
|
|
|
|
|
|
|
|
|
|
|
|
|||||
Property Type |
|
Number of Properties |
|
|
Square Feet |
|
|
Acquisition Price |
|
|
Disposition Price |
|
|
Net Book |
|
|||||
Office |
|
|
1 |
|
|
|
58 |
|
|
$ |
5,925 |
|
|
|
3,000 |
|
|
$ |
2,701 |
|
Industrial |
|
|
2 |
|
|
|
601 |
|
|
|
43,000 |
|
|
|
61,950 |
|
|
|
32,961 |
|
Retail |
|
|
1 |
|
|
|
4 |
|
|
|
3,454 |
|
|
|
4,440 |
|
|
|
2,719 |
|
Total Properties |
|
|
4 |
|
|
|
663 |
|
|
$ |
52,379 |
|
|
$ |
69,390 |
|
|
$ |
38,381 |
|
Weighted average cash cap rate |
|
|
|
|
|
|
|
|
|
|
|
|
5.6 |
% |
||||||
|
|
|
|
|
|
|
|
|
|
|
|
|
|
|
|
|||||
Q3 2023 |
|
|
|
|
|
|
|
|
|
|
|
|
|
|
|
|||||
Property Type |
|
Number of Properties |
|
|
Square Feet |
|
|
Acquisition Price |
|
|
Disposition Price |
|
|
Net Book |
|
|||||
Industrial |
|
|
2 |
|
|
|
298 |
|
|
$ |
51,054 |
|
|
$ |
62,300 |
|
|
$ |
45,770 |
|
Total Properties |
|
|
2 |
|
|
|
298 |
|
|
$ |
51,054 |
|
|
$ |
62,300 |
|
|
$ |
45,770 |
|
Weighted average cash cap rate |
|
|
|
|
|
|
|
|
|
|
|
|
6.2 |
% |
||||||
|
|
|
|
|
|
|
|
|
|
|
|
|
|
|
|
|||||
Q4 2023 |
|
|
|
|
|
|
|
|
|
|
|
|
|
|
|
|||||
Property Type |
|
Number of Properties |
|
|
Square Feet |
|
|
Acquisition Price |
|
|
Disposition Price |
|
|
Net Book |
|
|||||
Industrial |
|
|
1 |
|
|
|
8 |
|
|
|
1,185 |
|
|
|
760 |
|
|
|
626 |
|
Retail |
|
|
3 |
|
|
|
16 |
|
|
|
6,957 |
|
|
|
11,993 |
|
|
|
5,978 |
|
Restaurant |
|
|
1 |
|
|
|
11 |
|
|
|
3,063 |
|
|
|
3,755 |
|
|
|
2,899 |
|
Total Properties |
|
|
5 |
|
|
|
35 |
|
|
$ |
11,205 |
|
|
$ |
16,508 |
|
|
$ |
9,503 |
|
Weighted average cash cap rate |
|
|
|
|
|
|
|
|
|
|
|
|
6.7 |
% |
||||||
|
|
|
|
|
|
|
|
|
|
|
|
|
|
|
|
|||||
2023 Dispositions |
|
|
|
|
|
|
|
|
|
|
|
|
|
|
|
|||||
Property Type |
|
Number of Properties |
|
|
Square Feet |
|
|
Acquisition Price |
|
|
Disposition Price |
|
|
Net Book |
|
|||||
Office2 |
|
|
2 |
|
|
|
340 |
|
|
$ |
38,975 |
|
|
$ |
35,000 |
|
|
$ |
33,582 |
|
Industrial |
|
|
6 |
|
|
|
981 |
|
|
|
111,479 |
|
|
|
143,560 |
|
|
|
94,372 |
|
Retail |
|
|
4 |
|
|
|
20 |
|
|
|
10,411 |
|
|
|
16,433 |
|
|
|
8,697 |
|
Restaurant |
|
|
2 |
|
|
|
16 |
|
|
|
4,249 |
|
|
|
5,079 |
|
|
|
3,998 |
|
Total Properties |
|
|
14 |
|
|
|
1,357 |
|
|
$ |
165,114 |
|
|
$ |
200,072 |
|
|
$ |
140,649 |
|
Weighted average cash cap rate2 |
|
|
|
|
|
|
|
|
|
|
|
|
6.0 |
% |
||||||
1 During the first quarter, we entered into an agreement under the terms of an existing lease to substitute two properties with a tenant in exchange for one new property of equal value. Property substitutions are not included in the acquisition/disposition activity, however will affect the total number of properties reported as of December 31, 2023.
2 Sale of office asset executed simultaneously with a $7.5 million lease buyout for total proceeds of $39.5 million, representing an all-in cash capitalization rate of 6.1%. Amounts have been excluded from the weighted average cash capitalization rate due to the nature of the separate transactions.
BROADSTONE NET LEASE, INC. | www.broadstone.com | © 2024 Broadstone Net Lease, LLC. All rights reserved. 20
Portfolio at a Glance: Key Metrics
|
December 31, |
|
|
September 30, |
|
|
June 30, |
|
|
March 31, |
|
|
December 31, |
|
|||||
Properties1 |
|
796 |
|
|
|
800 |
|
|
|
801 |
|
|
|
801 |
|
|
|
804 |
|
U.S. States |
|
44 |
|
|
|
44 |
|
|
|
44 |
|
|
|
44 |
|
|
|
44 |
|
Canadian Provinces |
|
4 |
|
|
|
4 |
|
|
|
4 |
|
|
|
4 |
|
|
|
4 |
|
Total Annualized Base Rent |
$392.2M |
|
|
$390.0M |
|
|
$391.0M |
|
|
$389.5M |
|
|
$389.1M |
|
|||||
Total Rentable Sq. Footage |
38.3M |
|
|
38.2M |
|
|
38.5M |
|
|
39.1M |
|
|
39.1M |
|
|||||
Tenants |
|
220 |
|
|
|
220 |
|
|
|
221 |
|
|
|
221 |
|
|
|
221 |
|
Brands |
|
208 |
|
|
|
208 |
|
|
|
209 |
|
|
|
209 |
|
|
|
211 |
|
Industries |
|
53 |
|
|
|
54 |
|
|
|
54 |
|
|
|
54 |
|
|
|
55 |
|
Occupancy (based on SF) |
|
99.4 |
% |
|
|
99.4 |
% |
|
|
99.4 |
% |
|
|
99.4 |
% |
|
|
99.4 |
% |
Rent Collection |
|
99.2 |
% |
|
|
99.9 |
% |
|
|
99.9 |
% |
|
|
100.0 |
% |
|
|
99.9 |
% |
Top 10 Tenant Concentration |
|
19.6 |
% |
|
|
19.3 |
% |
|
|
19.4 |
% |
|
|
19.2 |
% |
|
|
19.0 |
% |
Top 20 Tenant Concentration |
|
32.3 |
% |
|
|
32.0 |
% |
|
|
32.1 |
% |
|
|
31.4 |
% |
|
|
31.4 |
% |
Investment Grade (tenant/guarantor) |
|
15.3 |
% |
|
|
15.3 |
% |
|
|
15.3 |
% |
|
|
15.6 |
% |
|
|
15.4 |
% |
Financial Reporting Coverage2 |
|
93.8 |
% |
|
|
93.7 |
% |
|
|
94.2 |
% |
|
|
94.3 |
% |
|
|
94.3 |
% |
Rent Coverage Ratio (Restaurants Only) |
3.4x |
|
|
3.4x |
|
|
3.3x |
|
|
3.2x |
|
|
3.2x |
|
|||||
Weighted Average Annual Rent Increases |
|
2.0 |
% |
|
|
2.0 |
% |
|
|
2.0 |
% |
|
|
2.0 |
% |
|
|
2.0 |
% |
Weighted Average Remaining Lease Term |
10.5 years |
|
|
10.5 years |
|
|
10.7 years |
|
|
10.8 years |
|
|
10.9 years |
|
|||||
Master Leases (based on ABR) |
|
|
|
|
|
|
|
|
|
|
|
|
|
|
|||||
Total Portfolio |
|
41.5 |
% |
|
|
41.6 |
% |
|
|
41.5 |
% |
|
|
41.2 |
% |
|
|
40.8 |
% |
Multi-site tenants |
|
69.0 |
% |
|
|
69.3 |
% |
|
|
69.3 |
% |
|
|
69.3 |
% |
|
|
67.7 |
% |
1 During the first quarter, we entered into an agreement under the terms of an existing lease to substitute two properties with a tenant in exchange for one new property of equal value. Property substitutions are not included in the acquisition/disposition activity, however will affect the total number of properties reported as of December 31, 2023.
2 Includes 7.8%, 7.5%, 7.9%, 7.9%, and 8.5%, related to tenants not required to provide financial information under the terms of our lease, but whose financial statements are available publicly at December 31, 2023, September 30, 2023, June 30, 2023, March 31, 2023, and December 31, 2022, respectively.
BROADSTONE NET LEASE, INC. | www.broadstone.com | © 2024 Broadstone Net Lease, LLC. All rights reserved. 21
Diversification: Tenants & Brands
Top 20 Tenants
Tenant |
|
Property Type |
|
# |
|
|
ABR |
|
|
ABR as a |
|
|
Square |
|
|
SF as a |
|
|||||
Roskam Baking Company* |
|
Food Processing |
|
|
7 |
|
|
$ |
15,917 |
|
|
|
4.1 |
% |
|
|
2,250 |
|
|
|
5.9 |
% |
AHF, LLC* |
|
Distribution & Warehouse/ Manufacturing |
|
|
8 |
|
|
|
9,378 |
|
|
|
2.4 |
% |
|
|
2,284 |
|
|
|
6.0 |
% |
Joseph T. Ryerson & Son, Inc |
|
Distribution & Warehouse |
|
|
11 |
|
|
|
7,780 |
|
|
|
2.0 |
% |
|
|
1,599 |
|
|
|
4.2 |
% |
Jack’s Family Restaurants LP* |
|
Quick Service Restaurants |
|
|
43 |
|
|
|
7,456 |
|
|
|
1.9 |
% |
|
|
147 |
|
|
|
0.3 |
% |
J. Alexander’s, LLC* |
|
Casual Dining |
|
|
16 |
|
|
|
6,207 |
|
|
|
1.6 |
% |
|
|
131 |
|
|
|
0.3 |
% |
Axcelis Technologies, Inc. |
|
Flex and R&D |
|
|
1 |
|
|
|
6,126 |
|
|
|
1.6 |
% |
|
|
417 |
|
|
|
1.1 |
% |
Salm Partners, LLC* |
|
Food Processing |
|
|
2 |
|
|
|
6,062 |
|
|
|
1.5 |
% |
|
|
368 |
|
|
|
1.0 |
% |
Red Lobster Hospitality & Red Lobster Restaurants LLC* |
|
Casual Dining |
|
|
18 |
|
|
|
6,060 |
|
|
|
1.5 |
% |
|
|
147 |
|
|
|
0.4 |
% |
Hensley & Company* |
|
Distribution & Warehouse |
|
|
3 |
|
|
|
5,989 |
|
|
|
1.5 |
% |
|
|
577 |
|
|
|
1.5 |
% |
Dollar General Corporation |
|
General Merchandise |
|
|
60 |
|
|
|
5,977 |
|
|
|
1.5 |
% |
|
|
562 |
|
|
|
1.5 |
% |
Total Top 10 Tenants |
|
|
|
|
169 |
|
|
$ |
76,952 |
|
|
|
19.6 |
% |
|
|
8,482 |
|
|
|
22.2 |
% |
|
|
|
|
|
|
|
|
|
|
|
|
|
|
|
|
|
|
|||||
BluePearl Holdings, LLC** |
|
Animal Health Services |
|
|
13 |
|
|
$ |
5,693 |
|
|
|
1.4 |
% |
|
|
165 |
|
|
|
0.4 |
% |
Krispy Kreme Doughnut Corporation |
|
Quick Service Restaurants/ |
|
|
27 |
|
|
|
5,538 |
|
|
|
1.4 |
% |
|
|
156 |
|
|
|
0.4 |
% |
Outback Steakhouse of Florida LLC*1 |
|
Casual Dining |
|
|
22 |
|
|
|
5,454 |
|
|
|
1.4 |
% |
|
|
140 |
|
|
|
0.4 |
% |
Tractor Supply Company |
|
General Merchandise |
|
|
21 |
|
|
|
5,360 |
|
|
|
1.4 |
% |
|
|
417 |
|
|
|
1.1 |
% |
Big Tex Trailer Manufacturing, Inc.* |
|
Automotive/ Distribution & |
|
|
17 |
|
|
|
5,056 |
|
|
|
1.3 |
% |
|
|
1,302 |
|
|
|
3.4 |
% |
Nestle’ Dreyer’s Ice Cream Company2 |
|
Cold Storage |
|
|
1 |
|
|
|
4,611 |
|
|
|
1.2 |
% |
|
|
309 |
|
|
|
0.8 |
% |
Carvana, LLC* |
|
Industrial Services |
|
|
2 |
|
|
|
4,590 |
|
|
|
1.2 |
% |
|
|
230 |
|
|
|
0.6 |
% |
Arkansas Surgical Hospital |
|
Surgical |
|
|
1 |
|
|
|
4,588 |
|
|
|
1.2 |
% |
|
|
129 |
|
|
|
0.3 |
% |
Klosterman Bakery* |
|
Food Processing |
|
|
11 |
|
|
|
4,568 |
|
|
|
1.1 |
% |
|
|
549 |
|
|
|
1.4 |
% |
Chiquita Holdings Limited |
|
Food Processing |
|
|
1 |
|
|
|
4,420 |
|
|
|
1.1 |
% |
|
|
335 |
|
|
|
0.9 |
% |
Total Top 20 Tenants |
|
|
|
|
285 |
|
|
$ |
126,830 |
|
|
|
32.3 |
% |
|
|
12,214 |
|
|
|
31.9 |
% |
1Nestle’s ABR excludes $1.6 million of rent paid under a sub-lease for an additional property, which will convert to a prime lease no later than August 2024
*Subject to a master lease.
**Includes properties leased by multiple tenants, some, not all, of which are subject to master leases.
BROADSTONE NET LEASE, INC. | www.broadstone.com | © 2024 Broadstone Net Lease, LLC. All rights reserved. 22 BROADSTONE NET LEASE, INC. | www.broadstone.com | © 2024 Broadstone Net Lease, LLC. All rights reserved. 23
Top 20 Tenant Descriptions1
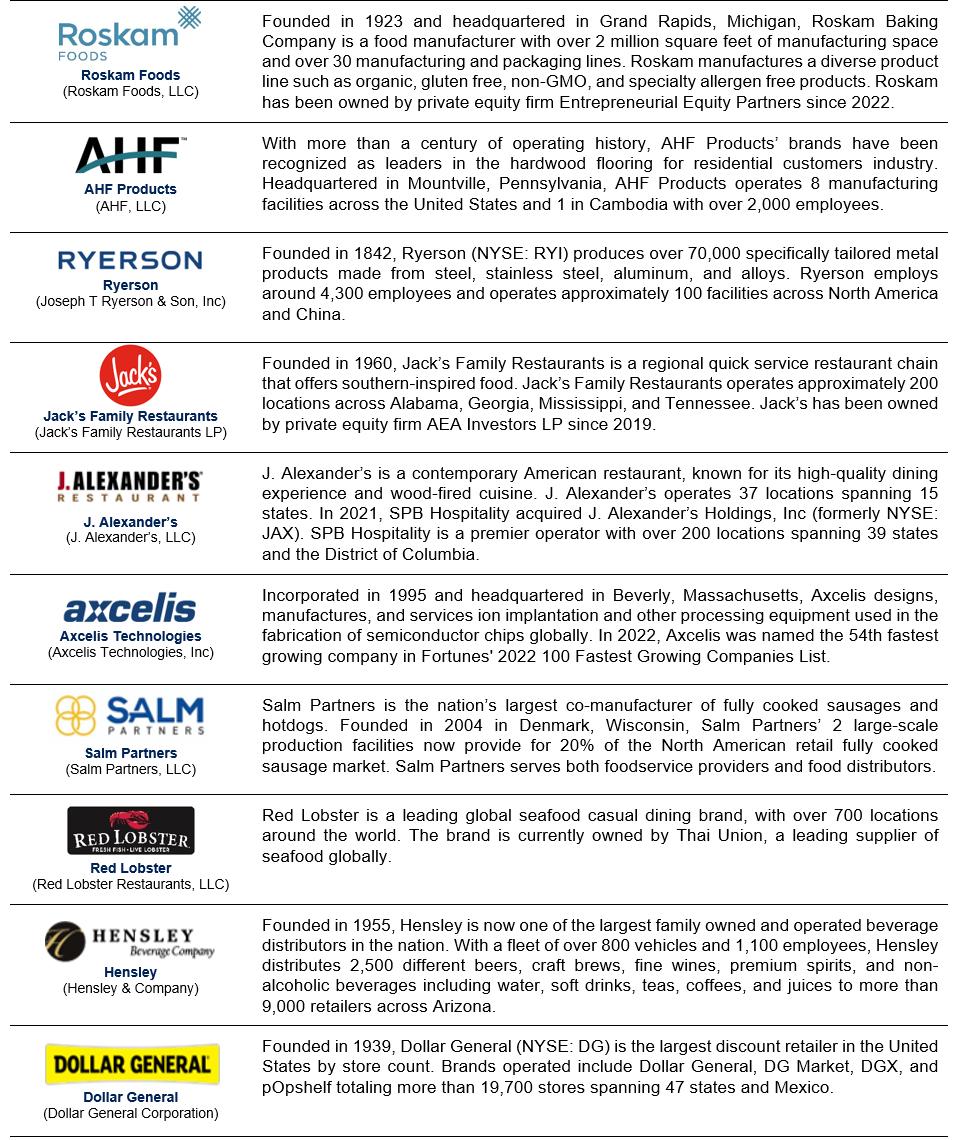
Top 20 Tenant Descriptions1 (continued)

BROADSTONE NET LEASE, INC. | www.broadstone.com | © 2024 Broadstone Net Lease, LLC. All rights reserved. 24
Top 20 Brands
Brand |
|
Property Type |
|
# |
|
|
ABR |
|
|
ABR as a |
|
|
Square |
|
|
SF as a |
|
|||||
Roskam Baking Company, LLC* |
|
Food Processing |
|
|
7 |
|
|
$ |
15,917 |
|
|
|
4.1 |
% |
|
|
2,250 |
|
|
|
5.9 |
% |
AHF Products* |
|
Distribution & Warehouse/ |
|
|
8 |
|
|
|
9,378 |
|
|
|
2.4 |
% |
|
|
2,284 |
|
|
|
6.0 |
% |
Ryerson |
|
Distribution & Warehouse |
|
|
11 |
|
|
|
7,780 |
|
|
|
2.0 |
% |
|
|
1,599 |
|
|
|
4.2 |
% |
Jack’s Family Restaurants* |
|
Quick Service Restaurants |
|
|
43 |
|
|
|
7,456 |
|
|
|
1.9 |
% |
|
|
147 |
|
|
|
0.4 |
% |
Axcelis |
|
Flex and R&D |
|
|
1 |
|
|
|
6,126 |
|
|
|
1.6 |
% |
|
|
417 |
|
|
|
1.1 |
% |
Salm Partners, LLC* |
|
Food Processing |
|
|
2 |
|
|
|
6,062 |
|
|
|
1.5 |
% |
|
|
368 |
|
|
|
1.0 |
% |
Red Lobster* |
|
Casual Dining |
|
|
18 |
|
|
|
6,060 |
|
|
|
1.5 |
% |
|
|
147 |
|
|
|
0.3 |
% |
Hensley* |
|
Distribution & Warehouse |
|
|
3 |
|
|
|
5,989 |
|
|
|
1.5 |
% |
|
|
577 |
|
|
|
1.5 |
% |
Dollar General |
|
General Merchandise |
|
|
60 |
|
|
|
5,977 |
|
|
|
1.5 |
% |
|
|
562 |
|
|
|
1.5 |
% |
BluePearl Veterinary Partners** |
|
Animal Health Services |
|
|
13 |
|
|
|
5,693 |
|
|
|
1.5 |
% |
|
|
165 |
|
|
|
0.4 |
% |
Total Top 10 Brands |
|
|
|
|
166 |
|
|
$ |
76,438 |
|
|
|
19.5 |
% |
|
|
8,516 |
|
|
|
22.3 |
% |
|
|
|
|
|
|
|
|
|
|
|
|
|
|
|
|
|
|
|||||
Krispy Kreme |
|
Quick Service Restaurants/ |
|
|
27 |
|
|
$ |
5,538 |
|
|
|
1.4 |
% |
|
|
156 |
|
|
|
0.4 |
% |
Bob Evans Farms*1 |
|
Casual Dining/ Food Processing |
|
|
21 |
|
|
|
5,498 |
|
|
|
1.4 |
% |
|
|
281 |
|
|
|
0.7 |
% |
Tractor Supply Company |
|
General Merchandise |
|
|
21 |
|
|
|
5,360 |
|
|
|
1.4 |
% |
|
|
417 |
|
|
|
1.1 |
% |
Big Tex Trailers* |
|
Automotive/ Distribution & |
|
|
17 |
|
|
|
5,056 |
|
|
|
1.3 |
% |
|
|
1,302 |
|
|
|
3.4 |
% |
Outback Steakhouse* |
|
Casual Dining |
|
|
20 |
|
|
|
4,718 |
|
|
|
1.2 |
% |
|
|
126 |
|
|
|
0.3 |
% |
Nestle’ |
|
Cold Storage |
|
|
1 |
|
|
|
4,611 |
|
|
|
1.2 |
% |
|
|
309 |
|
|
|
0.8 |
% |
Carvana* |
|
Industrial Services |
|
|
2 |
|
|
|
4,590 |
|
|
|
1.2 |
% |
|
|
230 |
|
|
|
0.6 |
% |
Arkansas Surgical Hospital |
|
Surgical |
|
|
1 |
|
|
|
4,588 |
|
|
|
1.2 |
% |
|
|
129 |
|
|
|
0.3 |
% |
Klosterman Bakery* |
|
Food Processing |
|
|
11 |
|
|
|
4,568 |
|
|
|
1.1 |
% |
|
|
549 |
|
|
|
1.5 |
% |
Chiquita Holdings Limited |
|
Food Processing |
|
|
1 |
|
|
|
4,420 |
|
|
|
1.1 |
% |
|
|
335 |
|
|
|
0.9 |
% |
Total Top 20 Brands |
|
|
|
|
288 |
|
|
$ |
125,385 |
|
|
|
32.0 |
% |
|
|
12,350 |
|
|
|
32.3 |
% |
1Nestle’s ABR excludes $1.6 million of rent paid under a sub-lease for an additional property, which will convert to a prime lease no later than August 2024
*Subject to a master lease.
**Includes properties leased by multiple tenants, some, not all, of which are subject to master leases.
BROADSTONE NET LEASE, INC. | www.broadstone.com | © 2024 Broadstone Net Lease, LLC. All rights reserved. 25 BROADSTONE NET LEASE, INC. | www.broadstone.com | © 2024 Broadstone Net Lease, LLC. All rights reserved. 26
Diversification: Property Type
(rent percentages based on ABR)

Diversification: Property Type (continued)
Property Type |
|
# Properties |
|
|
ABR |
|
|
ABR as a % |
|
|
Square Feet (’000s) |
|
|
SF as a % |
|
|||||
Industrial |
|
|
|
|
|
|
|
|
|
|
|
|
|
|
|
|||||
Manufacturing |
|
|
80 |
|
|
$ |
65,675 |
|
|
|
16.8 |
% |
|
|
12,178 |
|
|
|
31.8 |
% |
Distribution & Warehouse |
|
|
45 |
|
|
|
51,859 |
|
|
|
13.2 |
% |
|
|
9,212 |
|
|
|
24.1 |
% |
Food Processing |
|
|
33 |
|
|
|
46,630 |
|
|
|
11.9 |
% |
|
|
5,442 |
|
|
|
14.2 |
% |
Flex and R&D |
|
|
6 |
|
|
|
16,061 |
|
|
|
4.1 |
% |
|
|
1,157 |
|
|
|
3.0 |
% |
Industrial Services |
|
|
23 |
|
|
|
11,877 |
|
|
|
3.0 |
% |
|
|
607 |
|
|
|
1.6 |
% |
Cold Storage |
|
|
4 |
|
|
|
9,978 |
|
|
|
2.5 |
% |
|
|
724 |
|
|
|
1.9 |
% |
Untenanted |
|
|
1 |
|
|
|
- |
|
|
|
0.0 |
% |
|
|
122 |
|
|
|
0.3 |
% |
Industrial Total |
|
|
192 |
|
|
|
202,080 |
|
|
|
51.5 |
% |
|
|
29,442 |
|
|
|
76.9 |
% |
Healthcare |
|
|
|
|
|
|
|
|
|
|
|
|
|
|
|
|||||
Clinical |
|
|
52 |
|
|
|
27,570 |
|
|
|
7.0 |
% |
|
|
1,090 |
|
|
|
2.9 |
% |
Healthcare Services |
|
|
29 |
|
|
|
11,853 |
|
|
|
3.0 |
% |
|
|
478 |
|
|
|
1.2 |
% |
Animal Health Services |
|
|
27 |
|
|
|
11,054 |
|
|
|
2.8 |
% |
|
|
405 |
|
|
|
1.1 |
% |
Surgical |
|
|
12 |
|
|
|
10,675 |
|
|
|
2.7 |
% |
|
|
329 |
|
|
|
0.9 |
% |
Life Science |
|
|
9 |
|
|
|
8,011 |
|
|
|
2.1 |
% |
|
|
550 |
|
|
|
1.4 |
% |
Healthcare Total |
|
|
129 |
|
|
|
69,163 |
|
|
|
17.6 |
% |
|
|
2,852 |
|
|
|
7.5 |
% |
Restaurant |
|
|
|
|
|
|
|
|
|
|
|
|
|
|
|
|||||
Casual Dining |
|
|
100 |
|
|
|
27,167 |
|
|
|
7.0 |
% |
|
|
662 |
|
|
|
1.7 |
% |
Quick Service Restaurants |
|
|
148 |
|
|
|
25,966 |
|
|
|
6.6 |
% |
|
|
502 |
|
|
|
1.3 |
% |
Restaurant Total |
|
|
248 |
|
|
|
53,133 |
|
|
|
13.6 |
% |
|
|
1,164 |
|
|
|
3.0 |
% |
Retail |
|
|
|
|
|
|
|
|
|
|
|
|
|
|
|
|||||
General Merchandise |
|
|
132 |
|
|
|
25,018 |
|
|
|
6.4 |
% |
|
|
1,865 |
|
|
|
4.9 |
% |
Automotive |
|
|
64 |
|
|
|
11,790 |
|
|
|
3.0 |
% |
|
|
757 |
|
|
|
1.9 |
% |
Home Furnishings |
|
|
13 |
|
|
|
7,265 |
|
|
|
1.9 |
% |
|
|
797 |
|
|
|
2.1 |
% |
Child Care |
|
|
2 |
|
|
|
726 |
|
|
|
0.1 |
% |
|
|
20 |
|
|
|
0.1 |
% |
Retail Total |
|
|
211 |
|
|
|
44,799 |
|
|
|
11.4 |
% |
|
|
3,439 |
|
|
|
9.0 |
% |
Office |
|
|
|
|
|
|
|
|
|
|
|
|
|
|
|
|||||
Strategic Operations |
|
|
6 |
|
|
|
10,450 |
|
|
|
2.7 |
% |
|
|
632 |
|
|
|
1.7 |
% |
Corporate Headquarters |
|
|
7 |
|
|
|
8,527 |
|
|
|
2.2 |
% |
|
|
409 |
|
|
|
1.1 |
% |
Call Center |
|
|
2 |
|
|
|
4,049 |
|
|
|
1.0 |
% |
|
|
287 |
|
|
|
0.7 |
% |
Untenanted |
|
|
1 |
|
|
|
— |
|
|
|
0.0 |
% |
|
|
46 |
|
|
|
0.1 |
% |
Office Total |
|
|
16 |
|
|
|
23,026 |
|
|
|
5.9 |
% |
|
|
1,374 |
|
|
|
3.6 |
% |
Total |
|
|
796 |
|
|
$ |
392,201 |
|
|
|
100.0 |
% |
|
|
38,271 |
|
|
|
100.0 |
% |
BROADSTONE NET LEASE, INC. | www.broadstone.com | © 2024 Broadstone Net Lease, LLC. All rights reserved. 27
Key Statistics by Property Type
|
|
Q4 2023 |
|
|
Q3 2023 |
|
|
Q2 2023 |
|
|
Q1 2023 |
|
|
Q4 2022 |
|
|||||
Industrial |
|
|
|
|
|
|
|
|
|
|
|
|
|
|
|
|||||
Number of properties |
|
|
192 |
|
|
|
193 |
|
|
|
195 |
|
|
|
193 |
|
|
|
195 |
|
Square feet (000s) |
|
|
29,442 |
|
|
|
29,387 |
|
|
|
29,686 |
|
|
|
30,142 |
|
|
|
29,947 |
|
Weighted average lease term (years) |
|
|
11.7 |
|
|
|
11.5 |
|
|
|
11.8 |
|
|
|
11.9 |
|
|
|
11.2 |
|
Weighted average annual rent escalation |
|
|
2.0 |
% |
|
|
2.0 |
% |
|
|
2.0 |
% |
|
|
2.0 |
% |
|
|
2.0 |
% |
Percentage of total ABR |
|
|
51.5 |
% |
|
|
51.2 |
% |
|
|
51.6 |
% |
|
|
51.8 |
% |
|
|
51.5 |
% |
|
|
|
|
|
|
|
|
|
|
|
|
|
|
|
|
|||||
Healthcare |
|
|
|
|
|
|
|
|
|
|
|
|
|
|
|
|||||
Number of properties |
|
|
129 |
|
|
|
129 |
|
|
|
129 |
|
|
|
130 |
|
|
|
130 |
|
Square feet (000s) |
|
|
2,852 |
|
|
|
2,851 |
|
|
|
2,852 |
|
|
|
2,870 |
|
|
|
2,870 |
|
Weighted average lease term (years) |
|
|
6.6 |
|
|
|
6.8 |
|
|
|
6.8 |
|
|
|
7.0 |
|
|
|
8.2 |
|
Weighted average annual rent escalation |
|
|
2.4 |
% |
|
|
2.4 |
% |
|
|
2.3 |
% |
|
|
2.3 |
% |
|
|
2.2 |
% |
Percentage of total ABR |
|
|
17.6 |
% |
|
|
17.6 |
% |
|
|
17.5 |
% |
|
|
17.4 |
% |
|
|
17.1 |
% |
|
|
|
|
|
|
|
|
|
|
|
|
|
|
|
|
|||||
Restaurant |
|
|
|
|
|
|
|
|
|
|
|
|
|
|
|
|||||
Number of properties |
|
|
248 |
|
|
|
248 |
|
|
|
247 |
|
|
|
247 |
|
|
|
248 |
|
Square feet (000s) |
|
|
1,164 |
|
|
|
1,172 |
|
|
|
1,172 |
|
|
|
1,172 |
|
|
|
1,177 |
|
Weighted average lease term (years) |
|
|
13.9 |
|
|
|
13.9 |
|
|
|
14.1 |
|
|
|
14.3 |
|
|
|
14.8 |
|
Weighted average annual rent escalation |
|
|
1.8 |
% |
|
|
1.8 |
% |
|
|
1.8 |
% |
|
|
1.8 |
% |
|
|
1.8 |
% |
Percentage of total ABR |
|
|
13.6 |
% |
|
|
13.7 |
% |
|
|
13.5 |
% |
|
|
13.4 |
% |
|
|
13.5 |
% |
|
|
|
|
|
|
|
|
|
|
|
|
|
|
|
|
|||||
Retail |
|
|
|
|
|
|
|
|
|
|
|
|
|
|
|
|||||
Number of properties |
|
|
211 |
|
|
|
214 |
|
|
|
214 |
|
|
|
215 |
|
|
|
214 |
|
Square feet (000s) |
|
|
3,439 |
|
|
|
3,455 |
|
|
|
3,455 |
|
|
|
3,459 |
|
|
|
3,448 |
|
Weighted average lease term (years) |
|
|
9.4 |
|
|
|
9.7 |
|
|
|
10.0 |
|
|
|
10.2 |
|
|
|
10.5 |
|
Weighted average annual rent escalation |
|
|
1.6 |
% |
|
|
1.6 |
% |
|
|
1.6 |
% |
|
|
1.6 |
% |
|
|
1.6 |
% |
Percentage of total ABR |
|
|
11.4 |
% |
|
|
11.6 |
% |
|
|
11.6 |
% |
|
|
11.6 |
% |
|
|
11.5 |
% |
|
|
|
|
|
|
|
|
|
|
|
|
|
|
|
|
|||||
Office |
|
|
|
|
|
|
|
|
|
|
|
|
|
|
|
|||||
Number of properties |
|
|
16 |
|
|
|
16 |
|
|
|
16 |
|
|
|
16 |
|
|
|
17 |
|
Square feet (000s) |
|
|
1,374 |
|
|
|
1,375 |
|
|
|
1,374 |
|
|
|
1,415 |
|
|
|
1,697 |
|
Weighted average lease term (years) |
|
|
5.3 |
|
|
|
5.6 |
|
|
|
5.9 |
|
|
|
6.0 |
|
|
|
6.1 |
|
Weighted average annual rent escalation |
|
|
2.5 |
% |
|
|
2.5 |
% |
|
|
2.5 |
% |
|
|
2.5 |
% |
|
|
2.5 |
% |
Percentage of total ABR |
|
|
5.9 |
% |
|
|
5.9 |
% |
|
|
5.8 |
% |
|
|
5.8 |
% |
|
|
6.4 |
% |
BROADSTONE NET LEASE, INC. | www.broadstone.com | © 2024 Broadstone Net Lease, LLC. All rights reserved. 28
Diversification: Tenant Industry
Industry |
|
# Properties |
|
|
ABR |
|
|
ABR as a % |
|
|
Square Feet (’000s) |
|
|
SF as a % |
|
|||||
Healthcare Facilities |
|
|
104 |
|
|
$ |
54,973 |
|
|
|
14.0 |
% |
|
|
2,062 |
|
|
|
5.4 |
% |
Restaurants |
|
|
251 |
|
|
|
53,973 |
|
|
|
13.8 |
% |
|
|
1,207 |
|
|
|
3.2 |
% |
Packaged Foods & Meats |
|
|
29 |
|
|
|
41,046 |
|
|
|
10.5 |
% |
|
|
4,713 |
|
|
|
12.3 |
% |
Distributors |
|
|
27 |
|
|
|
17,477 |
|
|
|
4.5 |
% |
|
|
2,757 |
|
|
|
7.2 |
% |
Auto Parts & Equipment |
|
|
44 |
|
|
|
15,599 |
|
|
|
4.0 |
% |
|
|
2,710 |
|
|
|
7.1 |
% |
Specialty Stores |
|
|
31 |
|
|
|
14,362 |
|
|
|
3.7 |
% |
|
|
1,338 |
|
|
|
3.5 |
% |
Food Distributors |
|
|
8 |
|
|
|
14,206 |
|
|
|
3.6 |
% |
|
|
1,712 |
|
|
|
4.5 |
% |
Home Furnishing Retail |
|
|
18 |
|
|
|
12,914 |
|
|
|
3.3 |
% |
|
|
1,858 |
|
|
|
4.9 |
% |
Specialized Consumer Services |
|
|
45 |
|
|
|
11,842 |
|
|
|
3.0 |
% |
|
|
709 |
|
|
|
1.9 |
% |
Metal & Glass Containers |
|
|
8 |
|
|
|
10,229 |
|
|
|
2.6 |
% |
|
|
2,206 |
|
|
|
5.8 |
% |
General Merchandise Stores |
|
|
96 |
|
|
|
9,716 |
|
|
|
2.5 |
% |
|
|
880 |
|
|
|
2.3 |
% |
Industrial Machinery |
|
|
20 |
|
|
|
9,654 |
|
|
|
2.5 |
% |
|
|
1,949 |
|
|
|
5.1 |
% |
Forest Products |
|
|
8 |
|
|
|
9,378 |
|
|
|
2.4 |
% |
|
|
2,284 |
|
|
|
6.0 |
% |
Healthcare Services |
|
|
18 |
|
|
|
9,371 |
|
|
|
2.4 |
% |
|
|
515 |
|
|
|
1.3 |
% |
Internet & Direct Marketing Retail |
|
|
3 |
|
|
|
7,057 |
|
|
|
1.8 |
% |
|
|
447 |
|
|
|
1.2 |
% |
Other (38 industries) |
|
|
84 |
|
|
|
100,404 |
|
|
|
25.4 |
% |
|
|
10,700 |
|
|
|
27.7 |
% |
Untenanted properties |
|
|
2 |
|
|
|
— |
|
|
|
— |
|
|
|
224 |
|
|
|
0.6 |
% |
Total |
|
|
796 |
|
|
$ |
392,201 |
|
|
|
100.0 |
% |
|
|
38,271 |
|
|
|
100.0 |
% |
BROADSTONE NET LEASE, INC. | www.broadstone.com | © 2024 Broadstone Net Lease, LLC. All rights reserved. 29
Diversification: Geography
(rent percentages based on ABR)

State / |
|
# |
|
|
ABR |
|
|
ABR as |
|
|
Square |
|
|
SF as a |
|
|
|
State / |
|
# |
|
|
ABR |
|
|
ABR as |
|
|
Square |
|
|
SF as a |
|
||||||||||
TX |
|
|
69 |
|
|
$ |
38,110 |
|
|
|
9.7 |
% |
|
|
3,603 |
|
|
|
9.4 |
% |
|
|
WA |
|
|
15 |
|
|
$ |
4,384 |
|
|
|
1.1 |
% |
|
|
150 |
|
|
|
0.4 |
% |
MI |
|
|
55 |
|
|
|
33,060 |
|
|
|
8.4 |
% |
|
|
3,810 |
|
|
|
10.0 |
% |
|
|
LA |
|
|
4 |
|
|
|
3,407 |
|
|
|
0.9 |
% |
|
|
194 |
|
|
|
0.5 |
% |
IL |
|
|
32 |
|
|
|
24,383 |
|
|
|
6.2 |
% |
|
|
2,424 |
|
|
|
6.3 |
% |
|
|
MS |
|
|
11 |
|
|
|
3,370 |
|
|
|
0.9 |
% |
|
|
430 |
|
|
|
1.1 |
% |
WI |
|
|
35 |
|
|
|
23,096 |
|
|
|
5.9 |
% |
|
|
2,163 |
|
|
|
5.7 |
% |
|
|
NE |
|
|
6 |
|
|
|
3,286 |
|
|
|
0.8 |
% |
|
|
509 |
|
|
|
1.3 |
% |
CA |
|
|
13 |
|
|
|
19,617 |
|
|
|
5.0 |
% |
|
|
1,718 |
|
|
|
4.5 |
% |
|
|
SC |
|
|
13 |
|
|
|
2,986 |
|
|
|
0.8 |
% |
|
|
308 |
|
|
|
0.8 |
% |
FL |
|
|
42 |
|
|
|
16,319 |
|
|
|
4.2 |
% |
|
|
840 |
|
|
|
2.2 |
% |
|
|
IA |
|
|
4 |
|
|
|
2,819 |
|
|
|
0.7 |
% |
|
|
622 |
|
|
|
1.6 |
% |
OH |
|
|
47 |
|
|
|
16,308 |
|
|
|
4.2 |
% |
|
|
1,582 |
|
|
|
4.1 |
% |
|
|
NM |
|
|
9 |
|
|
|
2,779 |
|
|
|
0.7 |
% |
|
|
107 |
|
|
|
0.3 |
% |
IN |
|
|
32 |
|
|
|
16,240 |
|
|
|
4.1 |
% |
|
|
1,906 |
|
|
|
5.0 |
% |
|
|
CO |
|
|
4 |
|
|
|
2,545 |
|
|
|
0.6 |
% |
|
|
126 |
|
|
|
0.3 |
% |
MN |
|
|
21 |
|
|
|
15,668 |
|
|
|
4.0 |
% |
|
|
2,500 |
|
|
|
6.5 |
% |
|
|
UT |
|
|
3 |
|
|
|
2,492 |
|
|
|
0.6 |
% |
|
|
280 |
|
|
|
0.7 |
% |
TN |
|
|
49 |
|
|
|
15,225 |
|
|
|
3.9 |
% |
|
|
1,093 |
|
|
|
2.9 |
% |
|
|
MD |
|
|
3 |
|
|
|
2,174 |
|
|
|
0.6 |
% |
|
|
205 |
|
|
|
0.5 |
% |
NC |
|
|
36 |
|
|
|
12,491 |
|
|
|
3.2 |
% |
|
|
1,135 |
|
|
|
3.0 |
% |
|
|
CT |
|
|
2 |
|
|
|
1,837 |
|
|
|
0.5 |
% |
|
|
55 |
|
|
|
0.1 |
% |
AL |
|
|
53 |
|
|
|
12,418 |
|
|
|
3.2 |
% |
|
|
873 |
|
|
|
2.3 |
% |
|
|
ND |
|
|
3 |
|
|
|
1,726 |
|
|
|
0.4 |
% |
|
|
48 |
|
|
|
0.1 |
% |
AZ |
|
|
9 |
|
|
|
11,929 |
|
|
|
3.0 |
% |
|
|
909 |
|
|
|
2.4 |
% |
|
|
MT |
|
|
7 |
|
|
|
1,582 |
|
|
|
0.4 |
% |
|
|
43 |
|
|
|
0.1 |
% |
GA |
|
|
33 |
|
|
|
11,894 |
|
|
|
3.0 |
% |
|
|
1,576 |
|
|
|
4.1 |
% |
|
|
DE |
|
|
4 |
|
|
|
1,180 |
|
|
|
0.3 |
% |
|
|
133 |
|
|
|
0.3 |
% |
KY |
|
|
24 |
|
|
|
9,832 |
|
|
|
2.5 |
% |
|
|
962 |
|
|
|
2.5 |
% |
|
|
VT |
|
|
2 |
|
|
|
426 |
|
|
|
0.1 |
% |
|
|
20 |
|
|
|
0.1 |
% |
PA |
|
|
22 |
|
|
|
9,807 |
|
|
|
2.5 |
% |
|
|
1,836 |
|
|
|
4.8 |
% |
|
|
WY |
|
|
1 |
|
|
|
307 |
|
|
|
0.1 |
% |
|
|
25 |
|
|
|
0.1 |
% |
NY |
|
|
26 |
|
|
|
9,467 |
|
|
|
2.4 |
% |
|
|
680 |
|
|
|
1.8 |
% |
|
|
NV |
|
|
1 |
|
|
|
272 |
|
|
|
0.1 |
% |
|
|
6 |
|
|
|
0.0 |
% |
OK |
|
|
24 |
|
|
|
8,415 |
|
|
|
2.1 |
% |
|
|
990 |
|
|
|
2.6 |
% |
|
|
OR |
|
|
1 |
|
|
|
136 |
|
|
|
0.0 |
% |
|
|
9 |
|
|
|
0.0 |
% |
AR |
|
|
11 |
|
|
|
7,855 |
|
|
|
2.0 |
% |
|
|
283 |
|
|
|
0.7 |
% |
|
|
SD |
|
|
1 |
|
|
|
81 |
|
|
|
0.0 |
% |
|
|
9 |
|
|
|
0.0 |
% |
MA |
|
|
3 |
|
|
|
6,548 |
|
|
|
1.7 |
% |
|
|
444 |
|
|
|
1.2 |
% |
|
|
Total U.S. |
|
|
789 |
|
|
|
383,657 |
|
|
|
97.8 |
% |
|
|
37,841 |
|
|
|
98.8 |
% |
MO |
|
|
12 |
|
|
|
6,231 |
|
|
|
1.6 |
% |
|
|
1,138 |
|
|
|
3.0 |
% |
|
|
BC |
|
|
2 |
|
|
|
4,992 |
|
|
|
1.2 |
% |
|
|
253 |
|
|
|
0.7 |
% |
VA |
|
|
17 |
|
|
|
5,550 |
|
|
|
1.4 |
% |
|
|
204 |
|
|
|
0.5 |
% |
|
|
ON |
|
|
3 |
|
|
|
2,168 |
|
|
|
0.6 |
% |
|
|
101 |
|
|
|
0.3 |
% |
KS |
|
|
10 |
|
|
|
5,495 |
|
|
|
1.4 |
% |
|
|
643 |
|
|
|
1.7 |
% |
|
|
AB |
|
|
1 |
|
|
|
1,027 |
|
|
|
0.3 |
% |
|
|
55 |
|
|
|
0.1 |
% |
WV |
|
|
17 |
|
|
|
4,997 |
|
|
|
1.3 |
% |
|
|
884 |
|
|
|
2.3 |
% |
|
|
MB |
|
|
1 |
|
|
|
357 |
|
|
|
0.1 |
% |
|
|
21 |
|
|
|
0.1 |
% |
NJ |
|
|
3 |
|
|
|
4,913 |
|
|
|
1.3 |
% |
|
|
366 |
|
|
|
1.0 |
% |
|
|
Total Canada |
|
|
7 |
|
|
|
8,544 |
|
|
|
2.2 |
% |
|
|
430 |
|
|
|
1.2 |
% |
|
|
|
|
|
|
|
|
|
|
|
|
|
|
|
|
|
|
Grand Total |
|
|
796 |
|
|
$ |
392,201 |
|
|
|
100.0 |
% |
|
|
38,271 |
|
|
|
100.0 |
% |
|||||
BROADSTONE NET LEASE, INC. | www.broadstone.com | © 2024 Broadstone Net Lease, LLC. All rights reserved. 30
Lease Expirations
(rent percentages based on ABR)

Expiration Year |
|
# Properties |
|
|
# Leases |
|
|
ABR |
|
|
ABR as a % of Total Portfolio |
|
|
Square Feet (’000s) |
|
|
SF as a % of Total Portfolio |
|
||||||
2024 |
|
|
5 |
|
|
|
5 |
|
|
$ |
4,817 |
|
|
|
1.2 |
% |
|
|
482 |
|
|
|
1.3 |
% |
2025 |
|
|
19 |
|
|
|
21 |
|
|
|
7,105 |
|
|
|
1.8 |
% |
|
|
394 |
|
|
|
1.0 |
% |
2026 |
|
|
34 |
|
|
|
36 |
|
|
|
17,843 |
|
|
|
4.5 |
% |
|
|
1,153 |
|
|
|
3.0 |
% |
2027 |
|
|
29 |
|
|
|
30 |
|
|
|
24,903 |
|
|
|
6.3 |
% |
|
|
2,079 |
|
|
|
5.4 |
% |
2028 |
|
|
36 |
|
|
|
37 |
|
|
|
23,144 |
|
|
|
5.9 |
% |
|
|
1,930 |
|
|
|
5.0 |
% |
2029 |
|
|
73 |
|
|
|
74 |
|
|
|
23,921 |
|
|
|
6.1 |
% |
|
|
2,754 |
|
|
|
7.2 |
% |
2030 |
|
|
93 |
|
|
|
93 |
|
|
|
53,364 |
|
|
|
13.6 |
% |
|
|
4,985 |
|
|
|
13.0 |
% |
2031 |
|
|
33 |
|
|
|
33 |
|
|
|
8,724 |
|
|
|
2.2 |
% |
|
|
805 |
|
|
|
2.1 |
% |
2032 |
|
|
62 |
|
|
|
63 |
|
|
|
32,285 |
|
|
|
8.2 |
% |
|
|
3,469 |
|
|
|
9.1 |
% |
2033 |
|
|
50 |
|
|
|
50 |
|
|
|
19,398 |
|
|
|
4.9 |
% |
|
|
1,593 |
|
|
|
4.2 |
% |
2034 |
|
|
35 |
|
|
|
35 |
|
|
|
8,916 |
|
|
|
2.3 |
% |
|
|
780 |
|
|
|
2.0 |
% |
2035 |
|
|
19 |
|
|
|
19 |
|
|
|
13,947 |
|
|
|
3.6 |
% |
|
|
2,021 |
|
|
|
5.3 |
% |
2036 |
|
|
87 |
|
|
|
87 |
|
|
|
27,227 |
|
|
|
6.9 |
% |
|
|
2,781 |
|
|
|
7.3 |
% |
2037 |
|
|
20 |
|
|
|
20 |
|
|
|
16,284 |
|
|
|
4.2 |
% |
|
|
1,110 |
|
|
|
2.9 |
% |
2038 |
|
|
39 |
|
|
|
39 |
|
|
|
13,868 |
|
|
|
3.5 |
% |
|
|
1,226 |
|
|
|
3.2 |
% |
2039 |
|
|
11 |
|
|
|
11 |
|
|
|
8,125 |
|
|
|
2.1 |
% |
|
|
928 |
|
|
|
2.4 |
% |
2040 |
|
|
31 |
|
|
|
31 |
|
|
|
5,877 |
|
|
|
1.5 |
% |
|
|
312 |
|
|
|
0.8 |
% |
2041 |
|
|
38 |
|
|
|
38 |
|
|
|
16,507 |
|
|
|
4.2 |
% |
|
|
1,363 |
|
|
|
3.6 |
% |
2042 |
|
|
58 |
|
|
|
58 |
|
|
|
44,324 |
|
|
|
11.3 |
% |
|
|
4,803 |
|
|
|
12.5 |
% |
2043 |
|
|
12 |
|
|
|
12 |
|
|
|
12,107 |
|
|
|
3.1 |
% |
|
|
795 |
|
|
|
2.1 |
% |
Thereafter |
|
|
10 |
|
|
|
10 |
|
|
|
9,515 |
|
|
|
2.6 |
% |
|
|
2,284 |
|
|
|
6.0 |
% |
Untenanted properties |
|
|
2 |
|
|
|
— |
|
|
|
— |
|
|
|
— |
|
|
|
224 |
|
|
|
0.6 |
% |
Total |
|
|
796 |
|
|
|
802 |
|
|
|
392,201 |
|
|
|
100.0 |
% |
|
|
38,271 |
|
|
|
100.0 |
% |
BROADSTONE NET LEASE, INC. | www.broadstone.com | © 2024 Broadstone Net Lease, LLC. All rights reserved. 31
Occupancy
Occupancy by Rentable Square Footage

Change in Occupancy
|
|
|
Number of properties |
|
|
Vacant properties at January 1, 2023 |
|
|
|
3 |
|
Lease expirations1 |
|
|
|
2 |
|
Leasing activities |
|
|
|
(3 |
) |
Vacant dispositions |
|
|
|
— |
|
Vacant properties at March 31, 2023 |
|
|
|
2 |
|
Lease expirations1 |
|
|
|
3 |
|
Leasing activities |
|
|
|
(3 |
) |
Vacant dispositions |
|
|
|
— |
|
Vacant properties at June 30, 2023 |
|
|
|
2 |
|
Lease expirations1 |
|
|
|
3 |
|
Leasing activities |
|
|
|
(3 |
) |
Vacant dispositions |
|
|
|
— |
|
Vacant properties at September 30, 2023 |
|
|
|
2 |
|
Lease expirations1 |
|
|
|
3 |
|
Leasing activities |
|
|
|
(3 |
) |
Vacant dispositions |
|
|
- |
|
|
Vacant properties at December 31, 2023 |
|
|
|
2 |
|
|
|
|
|
|
|
1 Includes scheduled and unscheduled expirations (including leases rejected in bankruptcy), as well as future expirations resolved in the periods indicated above.
BROADSTONE NET LEASE, INC. | www.broadstone.com | © 2024 Broadstone Net Lease, LLC. All rights reserved. 32 Adjusted NOI, Annualized Adjusted NOI, Adjusted Cash NOI and Annualized Adjusted Cash NOI: Our reported results and net earnings per diluted share are presented in accordance with accounting principles generally accepted in the United States of America (GAAP).
Definitions and Explanations
Adjusted NOI and Adjusted Cash NOI are non-GAAP financial measures that we believe are useful to assess property-level performance. We compute Adjusted NOI by adjusting Adjusted EBITDAre (defined below) to exclude general and administrative expenses incurred at the corporate level. Given the net lease nature of our portfolio, we do not incur general and administrative expenses at the property level. To compute Adjusted Cash NOI, we adjust Adjusted NOI to exclude non-cash items included in total revenues and property expenses, such as straight-line rental revenue and other amortization and non-cash items, based on an estimate calculated as if all investment and disposition activity that took place during the quarter had occurred on the first day of the quarter. We then annualize quarterly Adjusted NOI and Adjusted Cash NOI by multiplying each amount by four to compute Annualized Adjusted NOI and Annualized Adjusted Cash NOI, respectively, which are also non-GAAP financial measures. We believe Adjusted NOI and Adjusted Cash NOI provide useful and relevant information because they reflect only those income and expense items that are incurred at the property level and present such items on an unlevered basis. We believe that the exclusion of certain non-cash revenues and expenses from Adjusted Cash NOI is a useful supplemental measure for investors to consider because it will help them to better assess our operating performance without the distortions created by non-cash revenues or expenses. You should not unduly rely on Annualized Adjusted NOI and Annualized Adjusted Cash NOI as they are based on assumptions and estimates that may prove to be inaccurate. Our actual reported Adjusted NOI and Adjusted Cash NOI for future periods may be significantly different from our Annualized Adjusted NOI and Annualized Adjusted Cash NOI. Additionally, our computation of Adjusted NOI and Adjusted Cash NOI may differ from the methodology for calculating these metrics used by companies in our industry, and, therefore, may not be comparable to similarly titled measures reported by other companies.
Adjusted Secured Overnight Financing Rate (SOFR): We define Adjusted SOFR as the current one month term SOFR plus an adjustment of 0.10% per the terms of our credit facilities.
Annualized Base Rent (ABR): We define ABR as the annualized contractual cash rent due for the last month of the reporting period, excluding the impacts of short-term rent deferrals, abatements, or free rent, and adjusted to remove rent from properties sold during the month and to include a full month of contractual cash rent for investments made during the month.
Cash Capitalization Rate: Cash Capitalization Rate represents either (1) for acquisitions and new developments, the estimated first year cash yield to be generated on a real estate investment, which was estimated at the time of investment based on the contractually specified cash base rent for the first full year after the date of the investment, divided by the purchase price for the property excluding capitalized acquisitions costs, or (2) for disposition properties, the estimated first year cash yield to be generated subsequent to disposition based on contractually specified cash base rent divided by the disposition price.
EBITDA, EBITDAre, Adjusted EBITDAre, and Annualized Adjusted EBITDAre: EBITDA, EBITDAre, Adjusted EBITDAre, and Annualized Adjusted EBITDAre are non-GAAP financial measures. We compute EBITDA as earnings before interest, income taxes and depreciation and amortization. EBITDA is a measure commonly used in our industry. We believe that this ratio provides investors and analysts with a measure of our performance that includes our operating results unaffected by the differences in capital structures, capital investment cycles and useful life of related assets compared to other companies in our industry. We compute EBITDAre in accordance with the definition adopted by Nareit. Nareit defines EBITDAre as EBITDA excluding gains (loss) from the sales of depreciable property and provisions for impairment on investment in real estate. We believe EBITDA and EBITDAre are useful to investors and analysts because they provide important supplemental information about our operating performance exclusive of certain non-cash and other costs. Adjusted EBITDAre represents EBITDAre, adjusted to reflect revenue producing investments and dispositions for the quarter as if such investments and dispositions had occurred at the beginning of the quarter, and to exclude certain GAAP income and expense amounts that are either non-cash, such as cost of debt extinguishments, realized or unrealized gains and losses on foreign currency transactions, or gains on insurance recoveries, or that we believe are one time, or unusual in nature because they relate to unique circumstances or transactions that had not previously occurred and which we do not anticipate occurring in the future, and to eliminate the impact of lease termination fees, and other items that are not a result of normal operations. While investments in developments have an immediate impact to Net Debt, we do not make an adjustment to EBITDAre until the quarter in which the lease commences. We then annualize quarterly Adjusted EBITDAre by multiplying it by four to compute Annualized Adjusted EBITDAre. Our reported EBITDA, EBITDAre, Adjusted EBITDAre, and Annualized Adjusted EBITDAre may not be comparable to similarly titled measures of other companies. You should not consider these measures as alternatives to net income or cash flows from operating activities determined in accordance with GAAP.
Funds From Operations (FFO), Core Funds From Operations (Core FFO), and Adjusted Funds From Operations (AFFO): FFO, Core FFO, and AFFO are non-GAAP measures. We believe the use of FFO, Core FFO, and AFFO are useful to investors because they are widely accepted industry measures used by analysts and investors to compare the operating performance of REITs. FFO, Core FFO, and AFFO should not be considered alternatives to net income as a performance measure or to cash flows from operations, as reported on our statement of cash flows, or as a liquidity measure and should be considered in addition to, and not in lieu of, GAAP financial measures. We compute Core FFO by adjusting FFO to exclude certain GAAP income and expense amounts that we believe are infrequently recurring, unusual in nature, or not related to its core real estate operations, including write-offs or recoveries of accrued rental income, lease termination fees, the gain on insurance recoveries, cost of debt extinguishments, unrealized and realized gains or losses on foreign currency transactions, severance and executive transition costs, and other extraordinary items. We compute AFFO by adjusting Core FFO for certain non-cash revenues and expenses, including straight-line rents, amortization of lease intangibles, amortization of debt issuance costs, amortization of net mortgage premiums, (gain) loss on interest rate swaps and other non-cash interest expense, stock-based compensation, and other specified non-cash items.
Definitions and Explanations (continued)
BROADSTONE NET LEASE, INC. | www.broadstone.com | © 2024 Broadstone Net Lease, LLC. All rights reserved. 33 GAAP Capitalization Rate: GAAP Capitalization Rate represents the estimated first year GAAP yield to be generated on a real estate investment, which was computed at the time of investment based on the first full year of rental income computed in accordance with GAAP, divided by the purchase price including capitalized costs for the property.
Gross Debt: We define Gross Debt as total debt plus debt issuance costs and original issuance discount.
Net Debt: Net Debt is a non-GAAP financial measure. We define Net Debt as our Gross Debt less cash and cash equivalents and restricted cash.
Occupancy: Occupancy or a specified percentage of our portfolio that is “occupied” or “leased” means as of a specified date the quotient of (1) the total rentable square footage of our properties minus the square footage of our properties that are vacant and from which we are not receiving any rental payment, and (2) the total square footage of our properties.
Rent Coverage Ratio: Rent Coverage Ratio means the ratio of tenant-reported or, when available, management’s estimate, based on tenant-reported financial information, of annual earnings before interest, taxes, depreciation, amortization, and cash rent attributable to the leased property (or properties, in the case of a master lease) to the annualized base rental obligation as of a specified date.
Definitions Related to Development Properties:
BROADSTONE NET LEASE, INC. | www.broadstone.com | © 2024 Broadstone Net Lease, LLC. All rights reserved. 34


DISCLAIMER CAUTIONARY STATEMENTS CONCERNING FORWARD-LOOKING STATEMENTS This presentation contains “forward-looking” statements within the meaning of Section 27A of the Securities Act of 1933, as amended, and Section 21E of the Securities Exchange Act of 1934, as amended, regarding, among other things, our plans, strategies, and prospects, both business and financial. Such forward-looking statements can generally be identified by our use of forward-looking terminology such as “outlook,” “potential,” “may,” “will,” “should,” “could,” “seeks,” “approximately,” “projects,” “predicts,” “expects,” “intends,” “anticipates,” “estimates,” “plans,” “would be,” “believes,” “continues,” or the negative version of these words or other comparable words. Forward-looking statements, including our 2024 guidance, involve known and unknown risks and uncertainties, which may cause BNL’s actual future results to differ materially from expected results, including, without limitation, general economic conditions, including but not limited to increases in the rate of inflation and/or interest rates, local real estate conditions, tenant financial health, property acquisitions, and the timing and uncertainty of completing these acquisitions, and uncertainties regarding future distributions to our stockholders. These and other risks, assumptions, and uncertainties are described in Item 1A “Risk Factors” of the Company’s Annual Report on Form 10-K for the fiscal year ended December 31, 2023, which BNL expects to file with the SEC on February 22, 2024, which you are encouraged to read, and will be available on the SEC’s website at www.sec.gov. Should one or more of these risks or uncertainties materialize, or should underlying assumptions prove incorrect, actual results may vary materially from those indicated or anticipated by such forward-looking statements. Accordingly, you are cautioned not to place undue reliance on these forward-looking statements, which speak only as of the date they are made. The Company assumes no obligation to, and does not currently intend to, update any forward-looking statements after the date of this presentation, whether as a result of new information, future events, changes in assumptions or otherwise. This document contains references to copyrights, trademarks, trade names, and service marks that belong to other companies. Broadstone Net Lease is not affiliated or associated with, and is not endorsed by and does not endorse, such companies or their products or services. NON-GAAP FINANCIAL INFORMATION This presentation contains certain financial information that is not presented in conformity with accounting principles generally accepted in the United States of America (GAAP), including funds from operations (“FFO”), core funds from operations (“Core FFO”), adjusted funds from operations (“AFFO”), earnings before interest, taxes, depreciation and amortization (“EBITDA”), EBITDA further adjusted to exclude gains (losses) on sales of depreciable property and provisions for impairment on investments in real estate (“EBITDAre”), Adjusted EBITDAre, Annualized Adjusted EBITDAre and Net Debt. We believe the use of FFO, Core FFO, and AFFO are useful to investors because they are widely accepted industry measures used by analysts and investors to compare the operating performance of REITs. We believe that EBITDA provides investors and analysts with a measure of our performance that includes our operating results unaffected by the differences in capital structures, capital investment cycles and useful life of related assets compared to other companies in our industry. We believe that the presentation of Net Debt to Annualized Adjusted EBITDAre is a useful measure of our ability to repay debt and a relative measure of leverage and is used in communications with our lenders and rating agencies regarding our credit rating. Such non-GAAP measures should not be considered in isolation or as an indicator of the Company's performance. Furthermore, they should not be seen as a substitute for metrics prepared in accordance with GAAP. Reconciliations of these measures to their most directly comparable GAAP measures for the periods that are presented in this presentation can be found in the section entitled “Management’s Discussion and Analysis of Financial Condition and Results of Operations – Non-GAAP Measures” in the Company’s Annual Report on Form 10-K for the fiscal year ended December 31, 2023, which BNL expects to file with the SEC on February 22, 2024. PROJECTED PORTFOLIO INFORMATION – HEALTHCARE PORTFOLIO SIMPLIFICATION STRATEGY Slides 11 and 12 contain “Projected Portfolio Information,” which assumes the successful disposition of certain healthcare assets. As discussed herein, the Company has identified 75 healthcare assets for sale comprised of clinical, surgical, and traditional MOB properties. Such properties consist of 37 properties subject to executed purchase contracts and expected to close in the first quarter of 2024, and 38 properties in varying stages of sale efforts. There are inherent risks to the successful execution of such sales, and particularly the sale of properties not currently subject to an executed purchase contract. Accordingly, future portfolio composition and related information may differ from the Projected Portfolio Information should the Company not successfully execute the contemplated sales.

BROADSTONE AT-A-GLANCE Data as of December 31, 2023; does not reflect ongoing healthcare portfolio simplification % of square footage “WALT”, or weighted average lease term Includes 7.8% of tenants who are public filers % of ABR Under contract or executed letter of intent 796 Properties 44 States 4 Canadian Provinces $64.1 Million Investments in Q4 2023 $97.1 Million Investments Under Control5 220 / 208 / 53 Tenants / Brands / Industries 4.1% Top Tenant4 19.6% Top Ten Tenants4 10.5 Years WALT2 2.0% Annual Escalation $392 Million Annualized Base Rent 52% Industrial 18% Healthcare 13% Restaurant 11% Retail 6% Office 99.2% Rent Collections in Q4 93.8% Financial Reporting3,4 38.3 Million Rentable Square Footage 99.4% Occupancy1 S&P BBB Stable Moody’s Baa2 Stable $1 Billion Total Revolver Capacity

INVESTMENT THESIS Data as of December 31, 2023, unless otherwise noted Thoughtfully Constructed and Highly Diversified Portfolio with Best-in-Class Metrics Highly granular diversified strategy with exposure to desirable net lease sectors including industrial, healthcare, retail, and restaurant Significant tenant and industry diversification has acted as a proven defensive hedge against economic distress Top tier portfolio metrics: 2.0% weighted average annual rent escalations, 10.5 years WALT, 19.6% top 10 tenant concentration Active Portfolio Management with Exceptional Results Throughout Multiple Economic Cycles Consistently strong rent collections through multiple real estate economic cycles with 99.8% rent collected for the full year 2023 Specialized infrastructure in-place to support the entire investment lifecycle across different property segments Proactive disposition strategy mitigates portfolio risk while facilitating value creation through accretive capital recycling Differentiated and Proven Investment Strategy with Attractive Pipeline of Opportunities Diversified strategy allows for capital allocation flexibility across sectors and ensures consistent high-quality deal flow Invested $165.6 million at a weighted average initial cash cap rate of 7.2% in 2023, with $97.1 million of additional investments under our control, $98.9 million of commitments to fund developments, and $6.8 million in revenue generating capital expenditures with existing tenants. Scalable Platform with Flexible and Fortified Investment Grade Balance Sheet to Support Growth Optimal size with a large efficient in-place platform, but small enough to drive meaningful growth Investment grade balance sheet (S&P – BBB, Moody’s – Baa2) with a robust liquidity profile and no near-term debt maturities Conservative leverage profile with net debt to annualized adjusted EBITDAre of 5.0x Experienced Management Team with Deep Pool of Talent Experienced, cycle-tested management team constructed over 10 years with long-term relationships and expertise Diverse board of directors with meaningful public REIT experience and substantial personal investment in the Company Focus on corporate responsibility has been a cornerstone of Broadstone since inception Established REIT with Longstanding Track Record of Success Delivering Shareholder Value 15+ year operating history pursuing a diversified net lease strategy with a leading team, now proven through two cycles Publicly traded on the NYSE (BNL) with experience operating under substantially all public company requirements since 2017 Continued growth of the portfolio and consistent performance has delivered predictable cash flow and returns to investors

BROADSTONE NET LEASE (NYSE: BNL) Data as of December 31, 2023, unless otherwise noted Gross asset value “GAV” which is equal to undepreciated book value; represents the fair value of the assets as of the date acquired, less any subsequent write-downs due to impairment charges. 2024E based on midpoint of guidance of $525mm of investments and $400mm of dispositions. Reflects ongoing healthcare portfolio simplification strategy and 2024 guidance as announced 2/21/2024 Longstanding operating history and track record of success delivering results to shareholders ACCELERATED GROWTH BNL is founded Baa3 Moody’s rating Management Internalization & IPO Public / SEC filer FOUNDATION Thoughtful construction of BNL diversified portfolio and team AVERAGE EMPLOYEE TENURE: 5.3 YEARS AVERAGE SENIOR EMPLOYEE TENURE: 7.2 YEARS Employee Tenure (Years) ($mm) BBB S&P rating ESTIMATED GROWTH IN GROSS ASSET VALUE SINCE INCEPTION1 Announced 2 Healthcare Portfolio Simplification

Q4 2023 AT-A-GLANCE Data as of December 31, 2023; does not reflect ongoing healthcare portfolio simplification strategy Percent of ABR Includes 7.8% related to tenants not required to provide financial information under their lease terms, but whose financial statements are available publicly Reflects the impact of a $26.4 million impairment during the fourth quarter of 2024 in relation with our Green Valley Medical Center healthcare asset 19.6% For Three Months Ended ($ in thousands, except per share data) 12/31/2023 9/30/2023 Revenues $105,000 $109,543 Net Income3 $6,797 $52,145 Earnings Per Share $0.03 $0.26 Funds From Operations (‘FFO’) $69,443 $75,478 FFO Per Share $0.35 $0.39 Core Funds From Operations (‘Core FFO’) $75,275 $74,754 Core FFO Per Share $0.38 $0.38 Adjusted Funds From Operations (‘AFFO’) $71,278 $69,958 AFFO Per Share $0.36 $0.36 Diluted WASO 196,373 196,372 KEY OPERATING METRICS SUMMARY FINANCIAL RESULTS PORTFOLIO OVERVIEW Top 10 Tenant Concentration1 32.3% Top 20 Tenant Concentration1 $392 Million Annualized Base Rent 796 Properties 38.3 Million Square Footage 99.2% Rent Collection $16.5mm Dispositions $64.1mm Investments 99.4% Occupancy BBB S&P Stable $5.3 billion Enterprise Value 220 Tenants 53 Industries 10.5 years Weighted Average Remaining Lease Term 44 + 4 States + Canadian Provinces 2.0% Weighted Average Rent Escalation 93.8% Tenants providing Financial Reporting1,2 15.3% % Investment Grade Credit Rated Tenants1 5.0x Net Debt / Annualized Adjusted EBITDAre Baa2 Moody’s Stable Our diversified portfolio continues to generate consistent results and steady same-store growth

Industrial 52% Manufacturing 17% Distribution & Warehouse 13% Food Processing 12% Flex and R&D 4% Industrial Services 3% Cold Storage 3% PORTFOLIO DIVERSIFICATION Data as of December 31, 2023; does not reflect ongoing healthcare portfolio simplification strategy * Subject to master lease. ** Includes properties leased by multiple tenants, some, not all, of which are subject to master leases Nestle’s ABR excludes $1.6 million of rent paid under a sub-lease for an additional property, which will convert to a prime lease no later than August 2024. Office 6% Strategic Operations 3% Corporate Headquarters 2% Call Center 1% Healthcare 18% Clinical 7% Healthcare Services 3% Animal Health Services 3% Surgical 3% Life Science 2% Restaurants 13% Casual Dining 7% Quick Service Restaurants 6% Retail 11% General Merchandise 6% Automotive 3% Home Furnishings 2% Child Care <1% Tenant Property Type # of Properties ABR as a % of Total Portfolio Roskam Baking Industrial 7 4.1% AHF Products* Industrial 8 2.4% Ryerson Industrial 11 2.0% Jack's Family Restaurants* Restaurants 43 1.9% J. Alexander’s* Restaurants 16 1.6% Axcelis Industrial 1 1.6% Salm Partners* Industrial 2 1.5% Red Lobster Hospitality* Restaurants 18 1.5% Hensley* Industrial 3 1.5% Dollar General Retail 60 1.5% Top 10 Tenants 169 19.6% BluePearl** Healthcare 13 1.4% Krispy Kreme Rest. / Ind 27 1.4% Outback Steakhouse* Restaurant 22 1.4% Tractor Supply Co. Retail 21 1.4% Big Tex Trailer Manufacturing* Ind. / Retail / Office 17 1.3% Nestle' USA, Inc.1 Industrial 1 1.2% Carvana* Industrial 2 1.2% Arkansas Surgical Hospital Healthcare 1 1.2% Klosterman Bakery* Industrial 11 1.1% Chiquita Industrial 1 1.1% Top 20 Tenants 285 32.3% Top 20 Tenants PROPERTY TYPE Diversification (by ABR) $392mm Annualized Base Rent

TOP 10 TENANT DESCRIPTIONS Source: Company Websites and Public Filings TENANT BUSINESS DESCRIPTION Roskam Foods (Roskam Baking Company, LLC) Founded in 1923 and headquartered in Grand Rapids, Michigan, Roskam Baking Company is a food manufacturer with over 2 million square feet of manufacturing space and over 30 manufacturing and packaging lines. Roskam manufactures a diverse product line such as organic, gluten free, non-GMO, and specialty allergen free products. Roskam has been owned by private equity firm Entrepreneurial Equity Partners since 2022. AHF Products (AHF, LLC) With more than a century of operating history, AHF Products’ brands have been recognized as leaders in the hardwood flooring for residential customers industry. Headquartered in Mountville, Pennsylvania, AHF Products operates 8 manufacturing facilities across the United States and 1 in Cambodia with over 2,000 employees. Ryerson (Joseph T Ryerson & Son, Inc) Founded in 1842, Ryerson (NYSE: RYI) produces over 70,000 specifically tailored metal products made from steel, stainless steel, aluminum, and alloys. Ryerson employs around 4,300 employees and operates approximately 100 facilities across North America and China. Jack’s Family Restaurants (Jack’s Family Restaurants LP) Founded in 1960, Jack’s Family Restaurants is a regional quick service restaurant chain that offers southern-inspired food. Jack’s Family Restaurants operates approximately 200 locations across Alabama, Georgia, Mississippi, and Tennessee. Jack’s has been owned by private equity firm AEA Investors LP since 2019. J. Alexander’s (J. Alexander’s, LLC) J. Alexander’s is a contemporary American restaurant, known for its high-quality dining experience and wood-fired cuisine. J. Alexander’s operates 37 locations spanning 15 states. In 2021, SPB Hospitality acquired J. Alexander’s Holdings, Inc (formerly NYSE: JAX). SPB Hospitality is a premier operator with over 200 locations spanning 39 states and the District of Columbia.

TENANT BUSINESS DESCRIPTION Axcelis Technologies (Axcelis Technologies, Inc) Incorporated in 1995 and headquartered in Beverly, Massachusetts, Axcelis designs, manufactures, and services ion implantation and other processing equipment used in the fabrication of semiconductor chips globally. In 2022, Axcelis was named the 54th fastest growing company in Fortunes' 2022 100 Fastest Growing Companies List. Salm Partners (Salm Partners, LLC) Salm Partners is the nation’s largest co-manufacturer of fully cooked sausages and hotdogs. Founded in 2004 in Denmark, Wisconsin, Salm Partners’ 2 large-scale production facilities now provide for 20% of the North American retail fully cooked sausage market. Salm Partners serves both foodservice providers and food distributors. Red Lobster (Red Lobster Restaurants, LLC) Red Lobster is a leading global seafood casual dining brand, with over 700 locations around the world. The brand is currently owned by Thai Union, a leading supplier of seafood globally. Hensley (Hensley & Company) Founded in 1955, Hensley is now one of the largest family owned and operated beverage distributors in the nation. With a fleet of over 800 vehicles and 1,100 employees, Hensley distributes 2,500 different beers, craft brews, fine wines, premium spirits, and non-alcoholic beverages including water, soft drinks, teas, coffees, and juices to more than 9,000 retailers across Arizona. Dollar General (Dollar General Corporation) Founded in 1939, Dollar General (NYSE: DG) is the largest discount retailer in the United States by store count. Brands operated include Dollar General, DG Market, DGX, and pOpshelf totaling more than 19,700 stores spanning 47 states and Mexico. TOP 10 TENANT DESCRIPTIONS (CONT.) Source: Company Websites and Public Filings

Healthcare Portfolio Simplification Strategy

IDENTIFIED ASSETS TO BE SOLD – PORTFOLIO STATISTICS Assets to be Sold WALT 6.2 Rent Escalations 2.4% Occupancy 99.1% Property Count 75 Tenant Count 41 Total ABR ($,mm) $43.2 Total Square feet (mm) 1.6 Strategic Decision to Sell Clinically-Oriented Healthcare and Focus on Core Net Lease Assets While clinical, surgical, and traditional medical office building (MOB) assets add an additional layer of diversification, they also have characteristics that do not fit as well within our core net lease operating structure, adding unnecessary complexity and uncertainty to our business Clinically-oriented assets have heavier reliance on third-party management, represent an outsized contribution to potential leakage given greater landlord responsibilities, account for the majority of near-term capital projects, and have greater renewal risk at lease maturity than most other assets in our portfolio 75 healthcare assets identified for sale that account for ~11% of total ABR. 37 assets (~5% of total ABR) are under executed contract to sell, which is projected to close in March; remaining 38 assets (~6% of total ABR) are in varying stages of the sale process with additional progress expected in 2024 SIMPLIFYING COMPOSITION OF HEALTHCARE PORTFOLIO Assets to be Sold account for ~76% of total healthcare ABR maturing through 2030 Pro Forma Portfolio Retains Strong Operating Performance with Greater Industrial Weighting and Significant Balance Sheet Flexibility Simplified portfolio composition with industrial weighting increasing to ~58% from ~52% and an improved WALT expected to drive multiple expansion No material changes to balance sheet with leverage substantially unchanged through redeployment of proceeds Capital available and approximately $253.0 million in sales proceeds with ample leverage capacity provide significant runway for investment opportunities Dividend remains well covered with expectation to return to targeted payout ratio (mid-high 70% payout ratio) in the near-term through redeployment efforts Simplified Net Lease Focused Portfolio with Improved Statistics Identified assets have an existing weighted average remaining lease term (WALT) of 6.2 years, which is significantly less than the overall portfolio WALT of 10.5 years; pro forma WALT improves to 11.0 years before proceeds are redeployed Reduces reliance on third-party management and leakage providing an overall improved operating structure focused on industrial, retail, and restaurant assets Remaining healthcare portfolio to consist of consumer-centric healthcare assets. Examples include dialysis, plasma, and veterinary services that are critical to tenants with little to no regulatory risk with real estate fundamentals more closely aligned with our core property types than clinically-oriented assets being sold Note: This slide contains “Projected Portfolio Information,” which assumes the successful disposition of certain healthcare assets. Please see slide 2 for additional information.

Portfolio as of 12/31/23 Projected March 2024 Post-Assets to be Sold Portfolio Concentration % Healthcare Concentration 17.6% (4.3%) 13.3% (5.8%) 7.5% % Clinical 7.0% (4.1%) 2.9% (2.2%) 0.7% % Healthcare Services 3.0% 0.1% 3.1% (1.8%) 1.3% % Animal Health Services 2.8% 0.2% 3.0% 0.2% 3.2% % Surgical 2.7% (0.4%) 2.3% (2.1%) 0.2% % Life Sciences 2.0% 0.2% 2.2% — 2.2% WALT 10.5 4.7 10.8 7.5 11.0 Rent Escalations 2.0% 2.1% 2.0% 2.6% 2.0% Occupancy 99.4% 100% 99.2% 98.4% 99.2% Property Count 796 37 759 38 721 Tenant Count 220 20 200 21 179 Total ABR ($,mm) $392.2 $19.9 $372.3 $23.3 $349.0 Total Square feet (mm) 38.3 0.7 37.6 0.9 36.6 Gross RE Asset Value ($, mm)1 $5,391.4 $205.4 $5,186.0 $216.6 $4,969.4 PRO FORMA PORTFOLIO COMPOSITION Note: This slide contains “Projected Portfolio Information,” which assumes the successful disposition of certain healthcare assets. Please see slide 2 for additional information. 1. Gross Real Estate (RE) Asset Value calculated as book value of real estate with accumulated depreciation added back. PORTFOLIO STATISTICS SIZE Significantly reduces exposure to clinical, surgical, and traditional MOB assets First-Step Under Contract Assets to be Sold Remaining Consumer-Centric Healthcare

Diversified Portfolio

PORTFOLIO AT-A-GLANCE: INDUSTRIAL Data as of December 31, 2023 Excludes one property that is classified as a corporate headquarters ($0.2mm ABR) PROPERTY TYPE BREAKDOWN PROPERTY TYPE OVERVIEW UNFI BUILD-TO-SUIT DEVELOPMENT FUNDING 52% ABR Manufacturing32% Distribution & Warehouse 25% Food Processing 23% Flex and R&D 8% Cold Storage 6% Industrial Services 6% Industrial exposure has grown from 31.2% at YE 2018 to 51.5% at 4Q23 192 Properties $202mm ABR 29.4mm SF 95 Tenants 2.0% Wtd. Avg. Rent Escalations 11.7 Years WALT Rank Tenant Property Use # Prop. ABR ($M) % ABR 1 Roskam Baking1 Food Processing 6 15.7 4.0% 2 AHF Products Distribution & Warehouse / Manufacturing 8 9.4 2.4% 3 Ryerson Distribution & Warehouse 11 7.8 2.0% 4 Axcelis Flex and R&D 1 6.1 1.6% 5 Salm Partners Food Processing 2 6.1 1.5% 6 Hensley Distribution & Warehouse 3 6.0 1.5% 7 Nestle' USA, Inc. Cold Storage / Food Processing 1 4.6 1.2% 8 Carvana Industrial Services 2 4.6 1.2% 9 Klosterman Bakery Food Processing 11 4.6 1.1% 10 Chiquita Food Processing 1 4.4 1.1% Top 10 Industrial Tenants 46 $69.2 17.6% TOP TENANTS BNL has agreed to fund up to $204.8 million build-to-suit transaction with United Natural Foods, Inc (NYSE: UNFI), and will earn capitalized interest at customary rates during the 18-month construction period The facility is scheduled to open in the third quarter of 2024, with rent beginning no later than October 2024. The lease will be 15-years with multiple renewal options and 2.50% annual rent escalations The stabilized yield upon completion will be approximately 7.2%, and, together with rent escalations, will translate into a GAAP capitalization rate of approximately 8.3% As of quarter end, BNL has funded $93.9 million towards the development

REMAINING PORTFOLIO AT-A-GLANCE Data as of December 31, 2023; does not reflect ongoing healthcare portfolio simplification strategy Top Tenants KEY STATISTICS ABR % | $: 13% | $53mm Properties: 248 Square Feet: 1.2mm WALT: 13.9 years Wtd Avg. Annual Rent Escalation: 1.8% QSR 48% Casual Dining 52% ABR % | $: 6% | $23mm Properties: 16 Square Feet: 1.4mm WALT: 5.3 years Wtd Avg. Annual Rent Escalation: 2.5% Corporate Headquarters 37% Strategic Operations 46% Call Center 17% ABR % | $: 11% | $45mm Properties: 211 Square Feet: 3.4mm WALT: 9.4 years Wtd Avg. Annual Rent Escalation: 1.6% PROPERTY TYPE BREAKDOWN 13% ABR 6% ABR 11% ABR 18% ABR ABR % | $: 18% | $69mm Properties: 129 Square Feet: 2.9mm WALT: 6.6 years Wtd Avg. Annual Rent Escalation: 2.4% RESTAURANT OFFICE RETAIL HEALTHCARE

SIGNIFICANT GEOGRAPHIC DIVERSITY Data as of December 31, 2023; does not reflect ongoing healthcare portfolio simplification strategy TOTAL PROPERTIES: 796 TOTAL STATES/PROVINCES: 44 + 4 Canadian provinces State ABR as a % of Total Portfolio 1 TX 9.7% 2 MI 8.4% 3 IL 6.2% 4 WI 5.9% 5 CA 5.0% 6 FL 4.2% 7 OH 4.2% 8 IN 4.1% 9 MN 4.0% 10 TN 3.9% Top 10 States Top 10 States 55.6%

SIGNIFICANT CROSS-DIVERSIFICATION Data as of December 31, 2023; does not reflect ongoing healthcare portfolio simplification strategy Significant Geographic, Property Type, and Industry Diversification Helps to Mitigate State Specific Risk $38.1mm ABR $38.1mm ABR STATE DIVERSIFICATION BY INDUSTRY STATE DIVERSIFICATION BY PROPERTY TYPE State: Texas Concentration: 1 ABR: % | $ 9.7% | $38.1mm Tenants: 37 Properties: 69 Property Types: 5 Industries: 19 MSAs: 22 ($ in millions) ($ in millions) STATE EXPOSURE AT-A-GLANCE TENANT INDUSTRY PROPERTY TYPE ABR % STATE ABR Restaurants 6.5 16.9% Health Care Facilities 5.1 13.3% Application Software 4.1 10.6% Managed Health Care 3.6 9.4% Auto Parts & Equipment 3.4 9.0% Home Furnishing Retail 3.0 8.0% Home Furnishings 2.7 7.1% Packaged Foods & Meats 1.5 4.1% Distributors 1.5 4.0% Automotive Retail 1.4 3.7% Industrial Machinery 1.0 2.6% Office Services & Supplies 0.9 2.4% Building Products 0.7 1.9% General Merchandise Stores 0.6 1.5% Soft Drinks 0.5 1.3% Specialty Stores 0.5 1.3% Health Care Services 0.4 1.1% Metal & Glass Containers 0.4 1.0% Specialized Consumer Services 0.3 0.8% TOTAL $38.1 100.0%

TOP-TIER PORTFOLIO METRICS Data as of December 31, 2023; does not reflect ongoing healthcare portfolio simplification strategy RENT COLLECTION RENT ESCALATION LONG WALT WITH MINIMAL NEAR-TERM EXPIRATIONS WALT: 6.6 11.7 5.3 13.9 9.4 Weighted Average of 10.5 Years 80.0% Leases with Annual Increases

KEY PORTFOLIO METRICS Source: 4Q 2023 Company Filings LEASE ROLLOVER THROUGH 2026 1.8% 12.4% 7.2% 11.6% 12.0% 4.1% 9.0% 6.4% 30.0% WEIGHTED AVERAGE LEASE TERM REMAINING PORTFOLIO RENT ESCALATIONS 2.6% 4.1% 2.0% N/R 1.7% 1.4% N/R N/R N/R INDUSTRIAL EXPOSURE PERCENT INVESTMENT GRADE 70.5% 49.2% 59.0% N/R 69.1% 17.1% 15.3% 39.6% 23.9% OCCUPANCY TENANT COUNT 374 220 336 1,326 390 N/R N/R 85 N/R TOP 10 TENANT EXPOSURE Portfolio composition and underlying metrics rank toward the top of the net lease space

DIFFERENTIATED INVESTMENT APPROACH Agile Investment Strategy Enables Identification of Attractive Investment Opportunities A decade plus of experience sourcing, underwriting, and managing a portfolio diversified across traditional and emerging net lease sectors Significant presence in industrial, healthcare, restaurant, and retail Flexibility to identify adjacent property sectors well-suited for long term leases Specialized infrastructure conducive to staying ahead of industry trends Executing acquisitions in emerging sectors prior to institutionalization has helped generate attractive returns Increased investment opportunity and consistency in deal flow Enhanced ability to adhere to stringent underwriting standards in competitive environment Drives attractive risk-adjusted returns over the long-term Diversified Core Property Sectors Attractive Capital Allocation Proven Investment Strategy Restaurant Retail Industrial Healthcare Automotive Food Processing Cold Storage

SYSTEMATIC INVESTMENT APPROACH SALELEASEBACK LEASE ASSUMPTION FORWARDCOMMITMENTS & BUILD TO SUITS EXISTING PORTFOLIO ADD-ONs PROPERTY EXPANSIONS & Improvements EXISTING PORTFOLIO NEW OPPORTUNITIES Acquire single-tenant property with a simultaneous new long-term lease with seller Maximum flexibility to negotiate lease terms coupled with strength of our own lease form Acquire single-tenant property with existing lease Deepest market opportunity set Focus on lease modifications to strengthen lease structure and improve risk-adjusted return Take-out of newly constructed property upon completion from developer or existing tenants Drive higher risk-adjusted returns via attractive cap rates and long lease term Addition of property from existing tenant strengthens relationship and leads to potential future opportunities Directly sourced opportunities from preferred tenants already underwritten and routinely monitored Fund construction for existing single-tenant property with long-term lease already in place Collaborate in design and construction of property or approval Opportunity to enhance lease structure and / or extend lease term INVESTMENT TYPE DESCRIPTION INVESTMENT TEAMS: CURRENT OWNERS BROKERAGE NETWORK DEVELOPMENT PARTNERS TENANT RELATIONSHIPS PRIVATE EQUITY SOURCING CHANNELS: INDUSTRIAL HEALTHCARE RESTAURANT / RETAIL UPREIT

PROVEN & DISCIPLINED INVESTMENT APPROACH Data as of December 31, 2023 % of previous year end, Gross asset value “GAV” means undepreciated book value, which represents the fair value of the assets as of the date acquired, less any subsequent write-downs due to impairment charges Represents the estimated first year cash yield, calculated as specified cash base rent for the first full year after investment divided by property purchase price Represents expected investment guidance as a % of the 2024E GAV. 2024E based on midpoint of guidance of approximately $525 million investments. 2015-2018 portfolio concentration shown as a percentage of NTM per Company filings, 2019-2023 shown as a percentage of ABR Represents $97.1 million of additional investments under control, $98.9 million of commitments to fund developments, and $6.8 million in revenue generating capital expenditures with existing tenants. $350 Recent investment activity heavily weighted to industrial opportunities given attractive trends and risk-adjusted returns, but maintain acquisition flexibility to execute on diversified pipeline of assets Guidance: ~$350 - 700 Industrial Investments 2019 – 2023 $2.1 Billion 72% of Total Volume % of GAV1 35.8% 35.3% 23.5% 32.8% 2.5% 16.2% 19.8% 3.1% 9.5%3 Investment Cap Rate2 6.8% 7.2% 6.9% 6.6% 6.9% 6.3% 6.4% 7.2% TBD Portfolio Concentration by Property Type4 TBD 5

CONSERVATIVE BALANCE SHEET & PRUDENT CAPITAL ALLOCATION Specialized, national sourcing model with robust pipeline of opportunities Diversified acquisition strategy provides flexibility to optimize risk / return profile “Sweet spot” sizing – meaningful scale yet modest acquisitions move the needle Highly scalable infrastructure already in place and operating efficiently Carefully constructed platform built to deliver accretive external growth Defensive leverage profile with broad access to diversified capital sources 1 2 3 4 5 6

WELL CAPITALIZED BALANCE SHEET Data as of December 31, 2023 ($ in thousands) December 31, 2023 Equity Common Stock 187,614 OP Units 8,928 Common Stock & OP Units 196,542 Price Per Share / Unit $17.22 Equity Market Capitalization $3,384,453 % of Total Capitalization 63.8% Debt Unsecured Revolving Credit Facility $90,434 Unsecured Term Loan Facilities 900,000 Senior Unsecured Notes 850,000 Mortgage Debt – Various 79,068 Total Debt $1,919,502 % of Total Capitalization 36.2% Enterprise Value Total Capitalization $5,303,955 Less: Cash and Cash Equivalents (19,494) Enterprise Value $5,284,461 TOTAL CAPITALIZATION DETAIL Investment Grade Credit Rated Balance Sheet with Well Laddered Maturities and Strong Liquidity TOTAL CAPITALIZATION ON DECEMBER 31, 2023 DEBT MATURITY SCHEDULE Common Stock OP Units Unsecured Term Loans Senior Unsecured Notes Mortgage Debt Total Capitalization $5.3B ($mm) Unsecured Credit Facilities Undrawn Revolver Capacity Senior Unsecured Notes Mortgages Unsecured Revolving Credit Facility Unsecured Revolving Credit Facility

EMPHASIS PLACED ON LIQUIDITY Data as of December 31, 2023 Calculated in accordance with revolving credit facility, unsecured term loans and senior unsecured notes. Net Debt / Annualized Adjusted EBITDAre Calculated in accordance with senior unsecured notes LEVERAGE PROFILE EVOLUTION2 KEY CREDIT METRICS AS OF DECEMBER 31, 2023 Conservative Leverage Profile & Ample Liquidity to Navigate Current and Future Economic Uncertainly 4.5x Fixed Charge Coverage Ratio1 1.0% Secured Indebtedness Ratio1 5.0x Net Debt / Annualized Adjusted EBITDAre AMPLE COVENANT HEADROOM CORPORATE LIQUIDITY PROFILE ($mm) 3 BBB / Baa2 Issuer Ratings Stable / Stable Ratings Outlook 1 $929 million of Corporate Liquidity 1 1 3

CORPORATE RESPONSIBILITY Environmental Stewardship Social Responsibility Community Engagement & Giving Commitment to Diversity, Equity, & Inclusion Employee Learning & Development As a real estate owner, we aim to maintain environmentally sustainable practices. “Go Green” Initiative Subcommittee Environmental Considerations In Our Offices Tenant & Portfolio Practices BNL works to foster a culture that is dynamic, collaborative, collegial, and based on trust Benefits & Wellness Programs Employee Satisfaction & Appreciation Based on an employee-feedback survey, BNL has won the Rochester top workplaces award nine years in a row Employee Satisfaction Commitment to Corporate Responsibility We are committed to being a responsible corporate citizen by conducting our operations in a sustainable and ethical manner. We strive to foster a culture that is inclusive, collaborative, and based on trust, and invest heavily in the health and well-being of our employees. We also strive to conduct our operations in an environmentally responsible way and with a governance structure that requires the highest ethical standards. We believe these commitments benefit both the company and society and are consistent with our focus on long-term positive impact and value for our shareholders, employees, tenants, partners, and the communities in which we live, work, and invest.

BOARD OF DIRECTORS & GOVERNANCE Board of Directors (NON-INDEPENDENT) Key GOVERNANCE highlights Name, tenure Experience John Moragne Director since 2023 CEO, Broadstone Net Lease Joined BNL in 2016 Board of Directors (Independent) Name, tenure Experience Laurie Hawkes (Chairman) Director since 2016 Chairman since 2021 Co-Founder, American Residential Properties Director, Appreciate Holdings, Inc. (NASDAQ: SFR) Shekar Narasimhan Director since 2007 Co-Founder & Managing Partner, Beekman Advisors Former Chairman & CEO, WMF Group James Watters Director since 2007 SVP & Treasurer, Rochester Institute of Technology Board member, Canandaigua National Corp. David Jacobstein Director since 2013 Former President & COO, Developers Diversified Realty Corp. Former Trustee, Corporate Office Properties Trust (NYSE: OFC) Denise Brooks-Williams Director since 2021 Executive Vice President and Chief Executive Officer, Care Delivery System Operations, Henry Ford Health System, Inc. Michael Coke Director since 2021 President and Co-Founder, Terreno Realty Corporation (NYSE: TRNO) Jessica Duran Director since 2023 Managing Director and Chief Financial Officer of TSG Consumer Partners Laura Felice Director since 2023 Executive Vice President and Chief Financial Officer of BJ’s Wholesale Club Holdings, Inc. (NYSE: BJ) Majority independent board All required committees are independent Elected to opt out of MUTA Significant equity investment by board members Minimum stock ownership requirements 44% of directors identify as female 56% of directors identify with underrepresented groups


GAAP RECONCILIATIONS Amount includes $1.5 million and $(1.4) million of unrealized and realized foreign exchange (gain) loss for the three months ended December 31, 2023, and September 30, 2023, respectively. Excludes 493,524 and 506,172 weighted average shares of unvested restricted common stock for the three months ended December 31, 2023, and September 30, 2023, respectively. Excludes $0.1 million from the numerator for the three months ended December 31, 2023, and September 30, 2023, respectively, related to dividends declared on shares of unvested restricted common stock. FUNDS FROM OPERATIONS (FFO), CORE FFO, AND ADJUSTED FUNDS FROM OPERATIONS (AFFO) Three Months Ended (in thousands) December 31,2023 September 30,2023 Net income $ 6,797 $ 52,145 Real property depreciation and amortization 39,115 38,496 Gain on sale of real estate (6,270 ) (15,163 ) Provision for impairment of investment in rental properties 29,801 — FFO $ 69,443 $ 75,478 Net write-offs of accrued rental income 4,161 — Severance and executive transition costs 218 740 Other income1 1,453 (1,464 ) Core FFO $ 75,275 $ 74,754 Straight-line rent adjustment (5,404 ) (6,785 ) Amortization of debt issuance costs 983 983 Loss on interest rate swaps and other non-cash interest expense 319 522 Amortization of lease intangibles (1,014 ) (1,056 ) Stock-based compensation 1,401 1,540 Deferred Taxes (282 ) — AFFO $ 71,278 $ 69,958 Diluted weighted average shares outstanding 2 196,373 196,372 Net earnings per diluted share 3 $ 0.03 $ 0.26 FFO per diluted share 3 0.35 0.39 Core FFO per diluted share 3 0.38 0.38 AFFO per diluted share 3 0.36 0.36

GAAP RECONCILIATIONS Reflects an adjustment to give effect to all acquisition during the quarter as if they had been acquired as of the beginning of the quarter. Reflects an adjustment to give effect to all dispositions during the quarter as if they had been sold as of the beginning of the quarter. Amounts include $0.2 million, $0.7 million and $0.2 million of employee severance and executive transition costs during the three months ended December 31, 2023, September 30, 2023, and June 30, 2023, respectively, and ($0.1) million of forfeited stock-based compensation for the three months ended December 31, 2023. Amounts include a combined $0.5 million of executive transition costs and accelerated amortization of stock-based compensation, related to the departure of our previous chief executive officer and $(1.5) million of accelerated amortization of lease intangibles for the three months ended March 31, 2023. EBITDA, EBITDAre, ADJUSTED EBITDAre, NET DEBT TO ANNUALIZED ADJUSTED EBITDAre As of (in thousands) December 31, 2023 September 30, 2023 June 30, 2023 March 31, 2023 December 31, 2022 Debt Unsecured revolving credit facility $ 90,434 $ 74,060 $ 122,912 $ 108,330 $ 197,322 Unsecured term loans, net 895,947 895,633 895,319 895,006 894,692 Senior unsecured notes, net 845,309 845,121 844,932 844,744 844,555 Mortgages, net 79,068 79,613 80,141 85,853 86,602 Debt issuance costs 8,848 9,360 9,872 10,390 10,905 Gross Debt $ 1,919,606 $ 1,903,787 $ 1,953,176 1,944,323 2,034,076 Cash and cash equivalents (19,494 ) (35,061) (20,763 ) (15,412 ) (21,789 ) Restricted cash (1,138 ) (15,436) (15,502 ) (3,898 ) (38,251 ) Net Debt $ 1,898,974 $ 1,853,290 $ 1,916,911 $ 1,925,013 $ 1,974,306 Three Months Ended (in thousands) December 31, 2023 September 30, 2023 June 30, 2023 March 31, 2023 December 31, 2022 Net income $ 6,797 $ 52,145 $ 62,996 $ 41,374 $ 36,773 Depreciation and amortization 39,278 38,533 39,031 41,784 45,606 Interest expense 18,972 19,665 20,277 21,139 23,773 Income taxes (268 ) 104 448 479 105 EBITDA $ 64,799 $ 110,447 $ 122,752 $ 104,776 $ 106,257 Provision for impairment of investment in rental properties 29,801 — — 1,473 — Gain on sale of real estate (6,270 ) (15,163 ) (29,462 ) (3,415 ) (10,625 ) EBITDAre $ 88,310 $ 95,284 $ 93,290 $ 102,834 $ 95,632 Adjustment for current quarter acquisition activity 1 153 26 342 406 1,283 Adjustment for current quarter disposition activity 2 (156 ) (400 ) (444 ) (365 ) (440) Adjustment to exclude non-recurring and other expenses3 128 740 183 (1,023) — Adjustment to exclude gain on insurance recoveries — — — — (341) Adjustment to exclude net write-offs of accrued rental income 4,161 — — 297 — Adjustment to exclude foreign exchange (gain) loss 1,453 (1,433 ) 1,681 18 796 Adjustment to exclude cost of debt extinguishments — — 3 — 77 Adjustment to exclude lease termination fees — — — (7,500 ) (1,678) Adjusted EBITDAre $ 94,049 $ 94,217 $ 95,055 $ 94,667 $ 95,329 Annualized Adjusted EBITDAre 376,196 376,868 380,220 378,668 381,315 Net Debt to Annualized Adjusted EBITDAre 5.0x 4.9x 5.0x 5.1x 5.2x