`
UNITED STATES
SECURITIES AND EXCHANGE COMMISSION
Washington, D.C. 20549
FORM 10-K
☒ |
ANNUAL REPORT PURSUANT TO SECTION 13 OR 15(d) OF THE SECURITIES EXCHANGE ACT OF 1934 |
For the fiscal year ended September 30, 2023
OR
☐ |
TRANSITION REPORT PURSUANT TO SECTION 13 OR 15(d) OF THE SECURITIES EXCHANGE ACT OF 1934 |
For the transition period from to
Commission File Number 001-39322
The AZEK Company Inc.
(Exact name of Registrant as specified in its Charter)
Delaware |
90-1017663 |
|
(State or other jurisdiction of incorporation or organization) |
(I.R.S. Employer Identification No.) |
|
|
1330 W Fulton Street, Suite 350, Chicago, Illinois |
60607 |
(Address of principal executive offices) |
(Zip Code) |
Registrant’s telephone number, including area code: (877) 275-2935
Securities registered pursuant to Section 12(b) of the Act:
|
Title of each class
|
|
Trading Symbol
|
|
Name of each exchange on which
|
Class A Common Stock, par value $0.001 per share |
|
AZEK |
|
The New York Stock Exchange |
Securities registered pursuant to Section 12(g) of the Act:
Indicate by check mark if the Registrant is a well-known seasoned issuer, as defined in Rule 405 of the Securities Act. YES ☒ NO ☐
Indicate by check mark if the Registrant is not required to file reports pursuant to Section 13 or 15(d) of the Act. YES ☐ NO ☒
Indicate by check mark whether the Registrant: (1) has filed all reports required to be filed by Section 13 or 15(d) of the Securities Exchange Act of 1934 during the preceding 12 months (or for such shorter period that the Registrant was required to file such reports), and (2) has been subject to such filing requirements for the past 90 days. YES ☒ NO ☐
Indicate by check mark whether the Registrant has submitted electronically every Interactive Data File required to be submitted pursuant to Rule 405 of Regulation S-T (§232.405 of this chapter) during the preceding 12 months (or for such shorter period that the Registrant was required to submit such files). YES ☒ NO ☐
Indicate by check mark whether the registrant is a large accelerated filer, an accelerated filer, a non-accelerated filer, smaller reporting company, or an emerging growth company. See the definitions of “large accelerated filer,” “accelerated filer,” “smaller reporting company,” and “emerging growth company” in Rule 12b-2 of the Exchange Act.
Large accelerated filer |
☒ |
|
Accelerated filer |
☐ |
|
|
|
|
|
Non-accelerated filer |
☐ |
|
Smaller reporting company |
☐ |
|
|
|
|
|
Emerging growth company |
☐ |
|
|
|
If an emerging growth company, indicate by check mark if the registrant has elected not to use the extended transition period for complying with any new or revised financial accounting standards provided pursuant to Section 13(a) of the Exchange Act. ☐
Indicate by check mark whether the registrant has filed a report on and attestation to its management’s assessment of the effectiveness of its internal control over financial reporting under Section 404(b) of the Sarbanes-Oxley Act (15 U.S.C. 7262(b)) by the registered public accounting firm that prepared or issued its audit report. ☒
If securities are registered pursuant to Section 12(b) of the Act, indicate by check mark whether the financial statements of the registrant included in the filing reflect the correction of an error to previously issued financial statements. ☐
Indicate by check mark whether any of those error corrections are restatements that required a recovery analysis of incentive-based compensation received by any of the registrant's executive officers during the relevant recovery period pursuant to §240.10D-1(b). ☐
Indicate by check mark whether the Registrant is a shell company (as defined in Rule 12b-2 of the Exchange Act). YES ☐ NO ☒
The aggregate market value of the registrant’s voting common equity held by non-affiliates of the registrant at March 31, 2023 (the last day of the registrant’s most recent second quarter) was $2,796,678,033 based on the closing price of the registrant’s Class A common stock as reported on the New York Stock Exchange on such date.
As of October 31, 2023, the registrant had 147,699,313 shares of Class A Common Stock, $0.001 par value per share, and 100 shares of Class B Common Stock, $0.001 par value per share, outstanding.
Portions of the registrant’s definitive proxy statement for its 2024 Annual Meeting of Stockholders to be filed with the Securities and Exchange Commission within 120 days after the end of the fiscal year ended September 30, 2023 are incorporated by reference into Part III of this Annual Report on Form 10-K.
Table of Contents
|
|
Page |
|
|
|
|
||
Item 1. |
3 |
|
Item 1A. |
14 |
|
Item 1B. |
34 |
|
Item 2. |
34 |
|
Item 3. |
34 |
|
Item 4. |
34 |
|
|
|
|
|
||
Item 5. |
35 |
|
Item 6. |
36 |
|
Item 7. |
Management’s Discussion and Analysis of Financial Condition and Results of Operations |
37 |
Item 7A. |
55 |
|
Item 8. |
57 |
|
Item 9. |
Changes in and Disagreements With Accountants on Accounting and Financial Disclosure |
57 |
Item 9A. |
57 |
|
Item 9B. |
58 |
|
|
|
|
|
||
Item 10. |
59 |
|
Item 11. |
59 |
|
Item 12. |
Security Ownership of Certain Beneficial Owners and Management and Related Stockholder Matters |
59 |
Item 13. |
Certain Relationships and Related Transactions, and Director Independence |
59 |
Item 14. |
59 |
|
|
|
|
|
||
Item 15. |
60 |
|
Item 16 |
60 |
|
2
PART I
Item 1. Business.
General
The AZEK Company Inc. (the Company, which may be referred to as AZEK, we or us) is an industry-leading designer and manufacturer of beautiful, low maintenance and environmentally sustainable outdoor living products, including TimberTech® decking, Versatex® and AZEK® Trim, and StruXureTM pergolas. Our predecessor was formed on August 15, 2013, and, in connection with our initial public offering, or our IPO, we became a Delaware corporation and changed our name to The AZEK Company Inc. on June 11, 2020. Our principal executive offices are located at 1330 W. Fulton Street, Suite 350, Chicago, Illinois 60607, and our telephone number is 877-275-2935. We operate highly automated manufacturing and recycling facilities in Ohio, Pennsylvania, Idaho, Georgia, Nevada, New Jersey, Michigan and Minnesota. Our website address is www.azekco.com. We use our investor relations website at investors.azekco.com as a means of disclosing material non-public information and for complying with our disclosure obligations under Regulation FD. Accordingly, investors should monitor our investor relations website, in addition to following our press releases, SEC filings, public conference calls and webcasts. We also make available free of charge on our investor relations website our Annual Reports on Form 10-K, Quarterly Reports on Form 10-Q, Current Reports on Form 8-K and amendments to those reports as soon as reasonably practicable after such materials are electronically filed with (or furnished to) the SEC at www.sec.gov. The contents of our websites and webcasts and information that can be accessed through our websites and webcasts are not incorporated by reference into this Annual Report on Form 10-K or in any other report or document we file with (or furnish to) the SEC, and any references to our websites and webcasts are intended to be inactive textual references only.
Business and Growth Strategies
We are an industry-leading designer and manufacturer of beautiful, low-maintenance and environmentally sustainable products focused on the highly attractive, large and fast-growing Outdoor Living market. Homeowners continue to invest in their homes and outdoor spaces and, we believe, are increasingly recognizing the significant advantages of engineered, long-lasting products, which convert demand away from traditional materials, particularly wood. Our products transform those outdoor spaces by combining highly appealing aesthetics with significantly lower maintenance costs compared to traditional materials. Our innovative portfolio of Outdoor Living products, including decking, railing, exterior trim, siding, cladding, pergolas and cabanas and accessories, inspires consumers to design outdoor spaces tailored to their unique lifestyle needs. In addition to our leading suite of Outdoor Living products, we sell a broad range of highly engineered products that are sold in commercial markets, including partitions, lockers and storage solutions. We are a leader in our product categories because of our significant scale, vertically-integrated manufacturing capabilities, extensive material science expertise and execution-focused management team.
Over our more than 30-year history, we have developed a reputation as a leading innovator in our markets by leveraging our differentiated manufacturing capabilities, material science and research and development, or R&D, expertise to capitalize on favorable secular growth trends that are accelerating material conversion from traditional materials such as wood, to sustainable, low-maintenance engineered materials, and to expand our markets. We believe our core competency of consistently launching new, high-quality products into the market, combined with our consistent investments in sales, marketing, R&D and manufacturing, will continue to solidify our position as a market leader and enable us to generate long-term demand for our products through various economic cycles. Throughout our history, we have introduced numerous disruptive products and demonstrated our ability to drive material conversion and extend our portfolio, addressing consumer needs across a wide range of price segments. We have achieved a premium brand reputation through our unwavering commitment to our customers and developing innovative new products that combine the latest style and design trends with our differentiated material science expertise and proprietary production technologies. Our competitive advantages enable us to create award-winning products and back them with some of the industry’s longest warranties, such as the 50-year fade & stain limited warranty and the lifetime product limited warranty that we offer on our TimberTech Advanced PVCTM decking product lines.
We have created an operating platform that is centered around sustainability, one of our core strategic pillars, which extends across our value chain from product design to raw material sourcing and manufacturing, and we increasingly utilize plastic waste, recycled wood and scrap in our products. We have also made significant investments in our recycling capabilities over the past few years, which further enhance the sustainability of our manufacturing operations and reduce our costs. In fiscal year 2019, we opened a new polyethylene recycling facility near our Wilmington, Ohio facility that utilizes advanced technologies to transform a broad range of plastic waste into raw material used in our products. Today, leveraging the output from this polyethylene recycling facility, our TimberTech CompositeTM decking lines offer high-quality products made from up to 85% recycled material. In fiscal year 2020, we acquired Return Polymers, which operates PVC recycling plants in Ashland, Ohio and Dowagiac, Michigan. During fiscal year 2023, we invested additional capital into Return Polymer’s operations which are expected to roughly triple our PVC recycling capacity since our acquisition of Return Polymers in 2020. Through our recycling programs, approximately 420 million pounds of waste and scrap were diverted from landfills in fiscal year 2023. Furthermore, approximately 99% of scrap generated is re-used, and the majority of our TimberTech, AZEK ExteriorsTM and Versatex products are recyclable at the end of their useful lives through our FULL-CIRCLETM recycling programs.
3
We believe our multi-faceted growth and margin expansion strategy positions us to drive profitable above-market growth in the markets we serve. This strategy includes initiatives to:
Our Brands and Products
We currently operate in two reportable segments: Residential and Commercial. Our Residential segment serves the high-growth Outdoor Living market by offering products that inspire consumers to design outdoor spaces tailored to their individual lifestyles. Our innovative portfolio of Outdoor Living products, including decking, railing, exterior trim, pergolas and cabanas and accessories, are sold under our TimberTech, AZEK Exteriors, VERSATEX, ULTRALOX®, StruXureTM and INTEX® brands. Our Commercial segment addresses demand for low-maintenance, highly engineered PVC and olefin sheet products for sale into a variety of commercial and industrial markets, including, under the Vycom business unit, the graphic displays and signage, educational and recreational markets, as well as, under the Scranton Products business unit, sustainable, low-maintenance privacy and storage solutions primarily for schools, stadium arenas and recreational and commercial facilities. On November 1, 2023, we divested our Vycom business within the Commercial segment. See Note 19 in the Consolidated Financial Statements for additional information.
Residential Segment
In our Residential segment, we design and manufacture engineered Outdoor Living products, including decking, railing, trim and moulding, siding and cladding, pergolas and cabanas and accessories that drive conversion away from wood and other traditional materials. These products are primarily manufactured using capped wood composites and PVC technology that are aesthetically similar, yet functionally superior, to finished wood, as they require less maintenance, do not rot or warp, are resistant to water, insects, stains, moisture, mold, mildew, scuffs and scratching, and do not require painting or staining for protection. Many of our products are also designed to ease installation for contractors and builders and reduce lifetime maintenance costs for consumers, without sacrificing aesthetics. We believe these factors, combined with some of the industry’s longest warranties and a comprehensive range of on-trend color palettes and styles, drive contractor loyalty and offer a compelling choice for consumers looking to reinvent their outdoor living spaces and the exteriors of their homes.
In fiscal year 2023, our Residential segment generated net sales of $1,223 million, representing approximately 89% of our total consolidated net sales. Our Residential segment consists of Deck, Rail & Accessories which is approximately 70% of Residential net sales and Exteriors which is approximately 30% of Residential net sales. Demand for our Residential segment products is largely driven by repair and remodel activity, which we estimate accounted for approximately 80% of our Residential segment net sales in fiscal year 2023 with the remaining sales attributable to new construction activity.
Decking
We offer a diverse portfolio of wood-alternative decking products and are one of the only decking manufacturers to offer both capped wood composite and advanced PVC decking products. Our decking products transform consumers’ outdoor areas into aesthetically appealing spaces, while reducing lifetime maintenance costs as compared to those made with traditional materials. These high-quality, innovative products are artfully crafted with a broad range of design options and distinguishing features, such as cascading or variegated tones to emulate the natural look and finish of wood. Our products are long lasting and often a more cost-effective alternative over time than products made of traditional materials such as wood, which can fade quickly, require frequent sanding, staining and maintenance and are prone to rot, splinter and crack. In addition, our decking products span a wide range of entry-level to premium price points and are covered by some of the industry’s longest warranties. We are also committed to sustainability and to manufacturing our products with recycled waste and scrap. The wood used in the core of our decking products is 100% recycled, and we do not use any virgin timber. We continue to expand our use of recycled materials in our products.
4
Through our primary decking product lines—TimberTech Advanced PVC and TimberTech Composite—we offer a broad range of colors, textures and styles to provide consumers with a myriad of design options at a variety of price points. Our TimberTech Advanced PVC line is our most advanced, premium capped polymer technology and offers single- and multi-color options, multiple form factors, including variable widths and a 1.5” thick profile version, and increased benefits with respect to durability, slip resistance, heat dissipation and fire resistance, as compared to both wood and capped composite products. TimberTech Advanced PVC products are made from up to 60% recycled content. Our TimberTech Composite lines are made from a combination of recycled plastics, 100% recycled wood and other additives, and are made from up to 85% recycled content. All of our decking lines are backed by our industry-leading warranties, ranging from 25-year limited fade and stain warranties on our TimberTech Composite Prime products to a lifetime product limited warranty and a 50-year fade and stain limited warranty on our TimberTech Advanced PVC products.
Our decking product lines are complemented by our porch collection as well as our broad range of decking accessories, including in-deck and riser lighting, risers for use on stairs, fascia, end coating, flashing and joist tape and our TimberTech Deck Cleaner. Our growing portfolio of porch board products leverages the same materials and production technologies as our industry-leading decking products and allows us to deliver similar design aesthetics and low-maintenance benefits across a variety of textures. We also offer a broad range of high-quality fasteners that enable an efficient installation, safe fastening and superior aesthetics, including traditional fasteners, which are color-matched to the decking product and are offered in both coated carbon steel and stainless steel; concealed fasteners, which are covered with a color-matching cap to blend into the associated decking product; and hidden fasteners, which are fastened out of sight under the decking boards.
Railing
Our railing solutions enable consumers to accent their outdoor living spaces with attractive, high-quality, low-maintenance composite, PVC and aluminum railing products, which we offer through our TimberTech, ULTRALOX and INTEX brands. Our railing products reduce the need for ongoing maintenance by eliminating many of the major functional disadvantages of traditional materials, such as warping and rust, and thus are often a more cost-effective alternative over time. For example, our TimberTech composite railing products are covered by a four-sided cap, which eliminates the need for annual sanding, staining, sealing and painting, and our TimberTech aluminum railing products feature a powder coated surface, which produces a long-lasting, color-durable, moisture-resistant finish. Our premium INTEX brand offers high-quality PVC railing solutions, including custom and kitted products.
Our railing products are available in various materials and in a broad range of colors, finishes and styles, including traditional, modern and minimalist designs, and we offer a wide selection of infill options, such as composite and aluminum balusters, cable rails and glass panel kits. Our aluminum railing products are lighter weight and easier to install than other metal railing materials, and their sleek, minimalistic designs allow unobstructed views, especially when coupled with a glass or cable infill option. Our railing products are diverse and highly customizable, and, in addition to complementing our decking product lines, they also appeal to a broader, stand-alone market, such as for use on decks constructed from traditional materials and in commercial applications.
We believe we are particularly well positioned to serve the fast growing aluminum railing market. Using Ultralox’s proprietary Interlocking Machine, a dealer or contractor can create a customized aluminum, pre-panelized, interlocking railing system on site. This facilitates faster and easier assembly and installation without special tools, mechanical fasteners or welding for both residential and commercial applications. Our TimberTech brand also sells a pre-panelized version that utilizes the Ultralox Interlocking® Technology branded as Impression Rail Express®.
To complement our railing products, we offer an array of functional and decorative accessories, including drink rails, structural mounting posts, a complete lighting package and gate kits. Our decking, railing and related accessory products are frequently used in combination in order to enable consumers to create their own highly customized and sustainable outdoor living spaces.
Exteriors
We are the leading designer and manufacturer of PVC trim and moulding products for the Outdoor Living market. We operate two large PVC trim manufacturing plants and offer a diverse portfolio of PVC trim and moulding products through our AZEK Exteriors and VERSATEX brands. Our trim and moulding products are aesthetically similar to wood and can be easily milled, routed or shaped for use in almost any application. Our products are moisture- and insect-resistant and are more durable and require less maintenance than traditional wood products. Contractors and homeowners can use our products in conventional applications, to express their creativity through unique home exteriors, and to complement our decking and railing products. For example, two-story decks are often paired with column wraps, canvas porch ceilings and other trim and moulding accents. Our trim and moulding products are also increasingly utilized within the home, including as wainscot trim or as shiplap, which originated to protect the exteriors of homes in harsh climates, but is now a popular way to create unique interior spaces. Our products are also used by mill shops and original equipment manufacturer, or OEM fabricators, who rely on our products due to their consistent formulation, dimensional accuracy and precision and high machinability, to manufacture a wide range of other Outdoor Living products such as pergolas, arbors and flowerbeds.
5
Our full line of AZEK Exteriors and VERSATEX products includes trim and moulding, value-added fabricated products, paintable trim and specialty siding solutions:
Trim Boards and Sheets |
|
Moulding and Tongue & Groove Products |
|
Value-Added Products |
|
Colors & Natural Visuals |
|
Specialty Siding |
|
• Boards—Manufactured with sealed edges and shipped with a protective film, our trim board is highly versatile and can be milled, routed, or heat formed to be used in many different applications. • Sheet—Our sheets provide a clean backdrop over an expansive area and can be used for large scale fabrication such as pergolas and arbors. • Skirt Boards—Designed to provide moisture resistance at ground contact and help direct water away from the structure. These products are easy to install with fiber cement, vinyl, or wood siding. |
|
• Moulding—Used to enable customizations, cover transitions or provide crisp, architectural style elements to home exteriors. • Tongue & Groove Profiles—Easily add the classic style of beadboard, nickel gap, and shiplap in horizontal or vertical orientation to complement housing exteriors.
|
|
• Column Wraps—Our column wraps are offered in multiple styles and can quickly and easily improve the aesthetics of a standard wood post with minimal labor. • Quick Corner Boards—Our one-piece corner boards are easy to install, feature smooth, outside edges and are aesthetically superior to two-piece corners, which can gather dirt along their edges. • J-Channel and Stealth Products—Designed to complement siding and for easy installation around windows and corners. |
|
• Canvas SeriesTM—Designed to add contrast to porch ceilings and interior trim projects, these products deliver the look of rich hardwoods without knots or labor intensive staining requirements. • PaintPro®— Innovative cellular PVC trim that has the same high- performance and low-maintenance benefits of traditional AZEK trim, but can be painted many colors. PaintPro trim offers quick drying times with no priming needed and superior paint adhesion.
|
|
• TimberTech Cladding—Combines premium natural hardwood aesthetics and the durability of advanced polymer technology for use as a cladding rain screen for premium curb appeal. • Shingle Siding—The most authentic looking shingle siding, with variable-width tabs and keyways, made with our moisture resistant advanced polymer in a panel format, making it easy for contractors to install. • Board & Batten—Combines different sizes of AZEK board and batten strips to create unique patterns that add texture and shadows to a home's exterior. |
In addition to the products described above, we offer custom milled solutions through our INTEX brand for builders and a number of accessories such as fastening systems, adhesives, sealants and bonding solutions.
Pergolas and Cabanas
Our pergola and cabana product offering primarily consists of high-quality and innovative pergolas and cabanas manufactured by our StruXure and INTEX brands. Our pergolas and cabanas add another element to homeowners’ creation of beautiful, low maintenance, and sustainable outdoor living spaces. These products are designed to provide shade and rain protection features while complementing our other outdoor living products, primarily our decking products, and open additional markets for us. StruXure’s products feature tech-enabled rotating louvers that allow consumers to enjoy their outdoor living spaces in virtually all environments, rain or shine. They are also made from up to 50% recycled aluminum and support our commitment to environmental stewardship. StruXure’s flagship pergola product, the Pergola XTM, is a fully customized pergola to fit each specific installation, while StruXure’s Cabana XTM product is a standardized, yet customizable, cabana for both residential and commercial applications. In addition, INTEX manufactures a portfolio of high-end pergolas and similar products made from PVC.
Commercial Segment
During the three years ended September 30, 2023, our Commercial segment included our Vycom and Scranton Products businesses. On November 1, 2023, we sold our Vycom business, and we retained our Scranton Products business. Demand for our Scranton Products business is driven primarily by commercial construction and repair and remodel activity, material conversion and favorable secular trends such as an increased emphasis on privacy. In fiscal year 2023, our Commercial segment generated net sales of $147 million, which represented approximately 11% of our total net sales.
6
Vycom
Through the date of the sale of our Vycom business, we offered, through our Vycom business, a comprehensive line of highly engineered polymer materials for a variety of commercial and industrial markets, including the markets for graphic displays and signage, recreation and playground equipment and marine and chemical industries.
Scranton Products
Scranton Products provides low-maintenance bathroom partitions, shower and dressing stalls, lockers and other storage solutions. Scranton Products markets its partitions under the Aria, Eclipse and Hiny Hiders brands and its lockers under the TuffTec and Duralife brands. Scranton Products' primary customers are schools, parks, recreational facilities, stadium arenas, industrial plants and retail and commercial facilities, and Scranton Products continues to expand rapidly into the commercial repair and remodel market primarily through sales of our high-privacy bathroom partitions. Products sold by Scranton Products are designed to replace traditional materials such as metal, wood and baked enamel with more durable, long-lasting, low-maintenance and more aesthetically pleasing materials. These products are highly resistant to rust, dents, scratches and graffiti and are easily cleaned. Scranton Products offers an extensive array of attractive colors, textures and finishes that replicate more traditional materials. As compared to metal and wood alternatives, Scranton Products' partitions and locker products sell at premium prices but deliver significantly reduced life-cycle costs through increased durability and lower maintenance expenses.
Product Research and Development
Over the past 30 years, we have built an R&D organization with significant expertise in material science and production process technologies. We leverage our R&D and U.S.-based manufacturing capabilities to deliver innovative new products to market that address evolving consumer needs. We have made substantial investments in our R&D organization, which, as of September 30, 2023, consisted of over 35 team members, including approximately 20 engineers. We are committed to continuing to invest in our R&D capabilities to further strengthen our ability to regularly introduce new products that set us apart from our competition and accelerate future growth.
Our product managers and marketing team actively analyze proprietary consumer research and work with architects, contractors and consumers to identify and develop new products that incorporate consumer feedback, expand our portfolio and extend the range of style and design options we offer. Our R&D team then designs, prototypes and tests these new products prior to full scale production. Our rigorous R&D process incorporates in-house analytical capabilities and comprehensive product testing with more than 260 distinct tests, such as accelerated weathering.
We believe our focus on innovation allows us to bring on-trend products to market rapidly. Our new product roadmap incorporates our sustainability objectives, consumer design and functionality trends as well as feedback from our channel partners to develop products that accelerate conversion away from wood to our type of low maintenance materials. Our technological and material science expertise enables us to deliver innovative outdoor living products such as wide-width and multi-width decking products as well as unique visuals such as those found in our Landmark Collection® decking that provide homeowners with a rustic aesthetic without the hassle of maintaining wood. More recently in fiscal year 2023, our technological and material science expertise enabled us to successfully introduce new TimberTech decking colors including Boardwalk®, an on-trend grey weathered wood color option within our Advanced PVC Landmark Collection, and Reclaimed ChestnutTM, a light tan-blonde weathered wood color option within our TimberTech Composite Reserve CollectionTM. We also launched two new high-performance PVC rail options, Statement RailTM and Pinnacle RailTM, adding high-end PVC railing as an option to our expansive portfolio of aluminum and composite offerings.
We have a broad portfolio of ongoing development projects across our core product categories as well as certain adjacent products and markets. We leverage our acquisitions to bring us new technologies and product applications. For example, we continue to leverage the Ultralox team to develop new aluminum and steel railing and fencing products and the INTEX team to introduce new premium PVC railing products to our customers. In addition, we are constantly evaluating opportunities to use our technological and U.S.-based manufacturing capabilities to expand into new markets where we believe there is an opportunity to drive material conversion or otherwise broaden our market reach.
Distribution
Within our Residential segment, we sell our products through a network of approximately 40 distributors with over 170 branch locations and more than 10,000 professional dealer and lumber locations and home improvement retail outlets, including both stocking and special order locations across the United States and Canada. We have exclusive relationships with our distributors with respect to specified geographies, and, although some legacy distributors are permitted to carry only certain of our products, many of our distributors are required to carry a comprehensive selection of our TimberTech and AZEK products. Our top ten distributors for the year ended September 30, 2023, accounted for a majority of our total net sales during that period, and Parksite Inc. accounted for approximately 19% of our net sales for that period.
7
Our dealers typically exhibit high brand loyalty and are incentivized to consolidate the manufacturers from which they purchase to maximize early buy discounts and annual volume rebates. Contractors purchase our products through dealers and retailers. We believe contractors are typically loyal to brands and products they trust because their reputations are often connected to the quality of the products they install and they are a direct point of contact for consumers to provide feedback. We consider the needs of and feedback from contractors in designing and manufacturing new products, and we invest in strengthening our relationships with these contractors as we believe they significantly influence decisions regarding material and brand selection for the types of products we produce. We allocate significant sales force resources to support our dealers, and we believe our strong relationships with dealers and contractors are driven by the trust and reliability that we have generated through product innovation, superior quality and performance and the continuing support that we offer.
Within our Commercial segment, we have sold our products through a widespread distribution network, as well as directly to OEMs. Our Scranton Products bathroom partition and locker systems are sold through a network of approximately 770 dealers who sell to industrial and commercial customers across the United States and in Canada. We market the benefits of our bathroom partition and locker systems directly to architects and facilities managers, who frequently specify products by name and material in their designs. Our Vycom products were sold through approximately 120 engineered product distributors across the United States, Canada and Latin America, who in turn sell full sheet and/or fabricated products that have been converted into a wide variety of components or items for various industrial uses primarily to OEMs. We also sold certain Vycom products directly to OEMs.
In fiscal year 2023, approximately 99% of our gross sales came from the United States and Canada. Our distributors in locations outside of the United States and Canada are responsible for marketing and selling our products in other countries to which our products are exported. We are continually evaluating our distribution strategy to ensure that we can meet the demands of our consumers in the most effective ways.
Operations and Manufacturing
We are a vertically integrated, U.S.-based manufacturer, delivering superior quality products with a competitive cost position. Our relatively low transportation costs resulting from being U.S.-based, provides us with a competitive freight advantage relative to imported products. Our versatile, process-oriented manufacturing operations are built on a foundation of extensive material and processing development. Our proprietary production technologies, material blending proficiency and range of extrusion capabilities enable innovation and facilitate expansion into new markets. We have deep experience working with multiple technologies that enable us to provide some of the industry’s most attractive visuals through advanced streaking and multi-color technologies. Our manufacturing footprint includes 14 manufacturing and recycling facilities across 13 geographic locations totaling approximately 3.4 million square feet, and we have made significant investments in people, processes and systems to increase our manufacturing scale and productivity.
We have integrated manufacturing operations and differentiated technical expertise in producing and utilizing recycled materials to include in our sustainable, cutting-edge products. Sustainability is one of our core strategic pillars, and we are committed to continually introducing sustainable products that help to reduce deforestation by utilizing recycled materials instead of wood, and materials that are versatile and recyclable at the end of their useful lives. We are dedicated to investing in and expanding our recycling capability in order to increase the use of reclaimed materials in our manufacturing processes.
In line with our core values of being “better today than yesterday” and “leading through innovation”, we use our continuous improvement program known as the AZEK Integrated Management System to manage and monitor operations, and we also utilize Lean Six Sigma tools and techniques at all our manufacturing facilities to reduce material waste and improve manufacturing efficiency.
Facilities Overview
We are headquartered in Chicago, Illinois and operate 14 manufacturing and recycling facilities in the United States, including our newest manufacturing facility in Boise, Idaho that began operations in fiscal year 2022. In alignment with our sustainability values, our Chicago corporate office is located in a 2019 LEED-Certified building. Currently, we produce our AZEK Exteriors and Scranton Products products primarily at our manufacturing facilities in Scranton, Pennsylvania, our TimberTech products primarily at our manufacturing facilities in Scranton, Pennsylvania and Wilmington, Ohio, all of our VERSATEX trim products at our manufacturing facility in Aliquippa, Pennsylvania, our StruXure products at our manufacturing facilities in and around Dahlonega, Georgia and Henderson, Nevada, our INTEX products at our manufacturing facility in Mays Landing, New Jersey and all of our ULTRALOX railing products through our manufacturing facility in Eagan, Minnesota. We operate our polyethylene recycling facility in Wilmington, Ohio, and, our PVC recycling operations are located in Ashland, Ohio and Dowagiac, Michigan.
8
Sales and Marketing
Residential Segment
Our Residential segment sales organization is organized under our AZEK Exteriors, TimberTech, StruXure, INTEX, VERSATEX and ULTRALOX product lines and is composed of a general sales organization, which is primarily geographically based, and also includes specialty sales organizations who focus on exterior trim, railing, retail and key accounts. Our sales organization is primarily focused on generating downstream demand with contractors, architects and builders as well as maintaining relationships with and educating influencers. We believe we can continue to leverage our downstream investments to accelerate material conversion in our markets, strengthen our position in the pro channel and enhance our retail presence.
We maintain comprehensive marketing campaigns using various media in support of our brands, targeted towards growing our dealer base, as well as acquisition and engagement of customer groups such as architects, builders, remodelers, contractors and consumers. We continue to invest in our marketing organization and prioritize demand generation and brand building amongst consumer and pro audiences. Our elevated brand positioning, diverse digital strategy, consistent media presence and experiences drive increased engagement with a variety of customer groups as well as affinity among consumer and professional influencers. Our digital platform facilitates the consumer journey from inspiration and design to installation. The experience educates consumers on the benefits of our products versus traditional materials, utilizes digital visualization tools to allow consumers to re-imagine their outdoor living spaces and directly connects users to pre-qualified local contractors and dealers. We also participate in a wide range of other marketing, promotional and public relations activities to increase brand awareness to consumers. These campaigns include media coverage and features in design, lifestyle, and specialty publications, as well as print advertising in brand-relevant publications such as Architectural Digest, Coastal Living, Elle Décor, Luxe Interiors + Designs, Real Simple, Southern Living, Veranda and others. We enjoy strong preference for our products among professional contractors, who typically purchase our products at dealers, and we are investing in improved merchandising at pro locations and retailers as the majority of consumers include visits to home improvement locations as they research decking and outdoor living projects. These consumer engagement strategies are focused on creating additional brand differentiation, pull-through demand and accelerating our growth. In addition, we have recently refreshed our TimberTech brand messaging to strengthen and reinforce our product difference unique to the decking industry: a combination of Timber + Tech. “Timber” is intended to capture the beauty, textures, and colors of real wood within a sustainable, composite or PVC material. “Tech” defines how our decking is engineered to perform far better than wood.
We also provide frequent demonstrations, education, product training and other sales and loyalty initiatives to help drive awareness, reinforce key selling points and installation best practices. We operate in-person and virtual AZEK University classes to educate distributors, dealers, contractors, architects and builders via classroom tutorials, hands-on sessions and plant tours. In addition, through our AZEK Pro Rewards program, we seek to secure preferred brand status with contractors by providing them with marketing tools, leads and various other rewards in connection with increased purchases of our products. We believe these efforts increase our market position because many buying decisions involve input from both the contractor and consumer, with consumers frequently relying on contractor recommendations.
Commercial Segment
Our Vycom sales organization focused on providing engineered polymer solutions for a wide variety of industries, including the graphic displays and signage, semiconductor, marine, chemical and corrosion, recreation and playground industries. Our Vycom products have historically been sold to plastics distributors in the United States, Canada and Latin America, who sell primarily to OEMs, and in certain cases were sold directly to OEMs. Our Vycom sales force was made up of a combination of direct territory managers and manufacturing representatives focused on increasing market penetration by working with printers, fabricators, OEMs and end-users to generate demand for Vycom materials.
Scranton Products utilizes direct sales and regional manufacturers’ sales representatives to provide coverage to a network of approximately 770 dealers who sell to institutional and commercial customers across the United States and in Canada. The Scranton Products’ sales force and agents service architects and facility managers to create pull-through demand in traditional institutional markets, such as schools, universities and stadium arenas, and in targeted new markets, such as retail stores, commercial and professional buildings and industrial facilities. Our Scranton Products sales force has leveraged a leading market position, enhanced promotional materials and specialized products to develop close relationships with architects and assist them in designing products and has enhanced awareness of the benefits of our products through targeted efforts to educate architects and designers.
Raw Materials and Suppliers
The primary raw materials used in our products are various petrochemical resins, including polyethylene, polypropylene and PVC resins, reclaimed polyethylene and PVC material, waste wood fiber and aluminum. We also utilize other additives, including modifiers, titanium dioxide, or TiO2, and pigments. Our contracts with key suppliers are typically short term in nature, with terms generally ranging from one to three years. We have not entered into hedges of our raw material costs at this time, but we may choose to enter into such hedges in the future, and our supply contracts with our major vendors do not contain obligations to sell raw materials to us at a fixed price.
9
Prices for spot market purchases are negotiated on a continuous basis in line with current market prices. Other than short term supply contracts for resins with indexed based pricing and occasional strategic purchases of larger quantities of certain raw materials, we generally buy materials on an as-needed basis.
The cost of petrochemical resins used in our manufacturing processes has historically varied significantly and has been affected by changes in supply and demand and in the price of crude oil, construction demand and macroeconomic conditions. Substantially all of our resins are purchased under supply contracts that average approximately one to two years, for which pricing is variable based on an industry benchmark price index. The resin supply contracts are negotiated annually and generally provide that we are obligated to purchase a minimum amount of resins from each supplier. In addition, the price of reclaimed polyethylene material, waste wood fiber, aluminum, other additives (including modifiers, TiO2 and pigments) and other raw materials fluctuates depending on, among other things, overall market supply and demand and general economic conditions. We seek to mitigate the effects of fluctuations in our raw material costs by broadening our supplier base, increasing our use of recycled material, increasing our use of scrap and reducing waste and exploring options for material substitution without sacrificing quality.
Although we do not rely on any single supplier for the majority of our raw materials, we do obtain certain raw materials from single or a limited number of suppliers. In particular, we rely on a single supplier for certain critical capped compounds used in our decking and railing products. If one or more suppliers were unable to satisfy our requirements for particular raw materials, we could experience a disruption to our operations as alternative suppliers are identified and qualified and new supply arrangements are entered into.
Competition
We compete with multiple companies, including divisions or subsidiaries of larger companies and foreign competitors. We compete on the basis of a number of considerations, including service, quality, performance, product characteristics, brand recognition and loyalty, marketing, product development, sales and distribution and price.
While we face significant competition, we also have several competitive advantages. We believe our key competitive advantages are:
Residential Segment
Our primary competition for our decking and railing products consists of wood products, which constitute a substantial majority of decking and railing sales, as measured by linear feet of lumber. Many of the conventional lumber suppliers with which we compete have established ties to the building and construction industry and have well-accepted products.
In addition to wood, we compete with other manufacturers of wood-alternative products, including Trex Company Inc., and Westlake Corp., including Westlake Royal Building Products and Kleer Lumber.
Commercial Segment
The bathroom partition and locker market is also highly fragmented and is addressed by manufacturers producing products in a variety of different materials and at varying price ranges. We compete on the basis of a number of considerations, including service, quality, performance, product characteristics, brand recognition and loyalty, marketing, product development, sales and distribution and price.
10
Seasonality
Although we generally experience demand for our products throughout the year, our sales have historically experienced some seasonality. We have typically experienced moderately higher levels of sales of our residential products in the second fiscal quarter of the year as a result of our “early buy” sales and extended payment terms typically available during the second fiscal quarter of the year. As a result of these extended payment terms, our accounts receivable have typically reached seasonal peaks at the end of the second fiscal quarter of the year, and our net cash provided by operating activities has typically been lower in the second fiscal quarter relative to other quarters. In addition, our sales are affected by the individual decisions of distributors and dealers on the levels of inventory they carry, their views on product demand, their financial condition and the manner in which they choose to manage inventory risk. Our sales are also generally impacted by the number of days in a quarter or a year that contractors and other professionals are able to install our products. This can vary dramatically based on, among other things, weather events such as rain, snow and extreme temperatures. We have generally experienced lower levels of sales of our residential products in the first fiscal quarter due to adverse weather conditions in certain markets, which typically reduces the construction and renovation activity during the winter season. In addition, we have experienced higher levels of sales of bathroom partition products and our locker products during the second half of our fiscal year, which includes the summer months during which schools are typically closed and are more likely to undergo remodel activities.
Intellectual Property
We rely on trademark and service mark protection to protect our brands, and we have registered or applied to register many of these trademarks and service marks. In particular, we believe the AZEK and AZEK Exteriors brands, the TimberTech brand, the VERSATEX brand, the StruXure brand, the Intex brand, the Ultralox brand and the FULL-CIRCLE brand, including FULL-CIRCLE PVC Recycling® and FULL-CIRCLE Recycling®, are important in the development of product awareness and for differentiating products from competitors . We also rely on a combination of unpatented proprietary know-how and trade secrets, and to a lesser extent, patents to preserve our position in the market. As of September 30, 2023, we had approximately 400 trademark registrations and 172 issued patents and pending patent applications in the United States and other countries. As of September 30, 2023, we had approximately 101 issued U.S. patents and 21 U.S. patent applications pending. We also had approximately 35 issued foreign patents and 15 foreign patent applications pending. As we develop technologies and processes that we believe are innovative, we intend to continually assess the patentability of new intellectual property. In addition, we employ various other methods, including confidentiality and nondisclosure agreements with third parties and employees who have access to trade secrets, to protect our trade secrets and know-how. Our intellectual property rights may be challenged by third parties and may not be effective in excluding competitors from using the same or similar technologies, brands or works.
Environmental, Social Responsibility and Corporate Governance
Through our FULL-CIRCLE ESG strategy, we are committed to pursuing initiatives that positively impact our products, our people and our planet. One of our core values is to “always do the right thing”. In furtherance of that value, we are focused on sustainability across our operations and have adopted strategies to enable us to meet the growing demand for environmentally friendly products. We are a signatory to the United Nations Global Compact, a global initiative focused on advancing sustainable and responsible business practices related to human rights, labor, the environment and anti-corruption.
Under the direction of our chief executive officer and the board of directors, we are focused on continually improving our high level of environmental and social responsibility and further strengthening our corporate governance. Our board of directors is responsible for overseeing our strategy on environmental, social and governance, or ESG, matters, including corporate responsibility and sustainability, and related policies and communications. Additionally, we have established an internal ESG Steering Committee comprised of cross-functional leaders from across our organization that is focused on implementing ESG strategies and policies and reports directly to our chief executive officer.
We operate our business in a manner that is centered on sustainability and promotes environmental stewardship and circularity across our value chain from product design to raw material sourcing and manufacturing to employee, customer and stakeholder communications and engagement. For example, we estimate that since 2015 more than two million trees have been saved because our customers chose our decking products over wood. As part of the building materials industry, we believe that we can play a role in advancing the circular economy to create a more sustainable future by increasing the recycling of wood, plastic, aluminum and water, measuring our product lifecycle impacts, measuring and committing to reduce our carbon footprint and encouraging those in our supply chain to do the same. For instance, the wood used in the core of our composite decking products is 100% recycled from sources that include, but are not limited to, facilities that manufacture wood mouldings, flooring, windows, doors and other products. Through our recycling programs, approximately 420 million pounds of scrap and waste were diverted from landfills in fiscal year 2023.
11
In 2022, we committed to setting science-based emissions reductions targets through the Science-Based Targets initiative, a partnership between CDP, the United Nations Global Compact, World Resources Institute and the World Wide Fund for Nature. Other actions we are committed to include investing in state-of-the-art polyethylene and PVC recycling facilities, continuing and expanding our innovative FULL-CIRCLE Recycling program, increasing the amount of recycled content in our products, which lowers the overall carbon footprint of our products, repurposing the scraps from our board-making process back into production – thereby diverting that material from the landfill, implementing water- and energy-efficient manufacturing processes at our manufacturing and recycling facilities and deliberately sourcing and reusing hard-to-recycle materials that would traditionally end up in landfills. AZEK has been broadly recognized for its leadership in sustainability and ESG, including receiving the Real Leaders 2023 Impact Award, being named one of USA Today’s 2023 Climate Leaders, being named one of U.S. News & World Report’s 2024 Best Companies to Work For as well as achieving +VantageVinyl verification from the Vinyl Sustainability Council for the third year in a row. Our products have also been recognized for sustainability leadership and innovation, including TimberTech Advanced PVC decking garnering Good Housekeeping’s 2023 Sustainable Innovation Award and Green Builder’s 2023 Sustainable Product of the Year Award and AZEK Exteriors Captivate Siding & Trim also earning Green Builder’s 2023 Sustainable Product of the Year Award.
We are also committed to social responsibility within our workforce and our community and have adopted human capital and human rights management policies to further our commitment to social responsibility. Our inclusive culture is comprised of innovative, growth-minded individuals committed to always doing the right thing, continuous improvement and solving problems for our customers and partners.
We compensate our employees according to our fair remuneration policies and believe deeply in paying for performance. We also provide attractive benefits that promote the health of our employees and their families including medical, dental and vision coverage, company-paid life insurance, short and long-term disability, health savings accounts, flexible spending accounts and an employee assistance program. We are also committed to the financial wellness of our employees and have launched several resources and policies in alignment with this, including a 401(k) plan with a company match, an employee stock purchase program with a company match, a parental leave policy and a military leave policy for our active military members.
The members of our management team and our board of directors come from diverse backgrounds, and we have implemented recruitment strategies that enable us to hire and retain diverse and highly talented employees that bring a diverse range of thought and skills to the business. In our employee selection process and the operation of our business we adhere to equal employment opportunity policies and are committed to including diverse candidates in any pool of candidates from which employees are chosen. Additionally, we work to build an inclusive culture of continued learning by offering a comprehensive training program which includes diversity-focused and leadership development trainings in order to provide employees opportunities to broaden their perspective and develop their skills in application to the business. In 2023, we launched several learning development programs that serve to increase employee understanding of business and industry knowledge as well as technical skills.
Our employees frequently hear from executive management, including the Chief Executive Officer, who leads monthly employee town halls where he provides business updates, aligns employees to our mission and values, and answers questions submitted directly from employees. We also regularly conduct small employee focus groups that are often led by members of executive management with our CHRO to receive their feedback on the business. On an annual basis, we distribute an employee engagement survey that allows us to identify areas of strength and opportunities for improvement to ensure continued engagement, satisfaction and retention of our employees. These results of these focus groups and surveys allow us to measure our achievement of our human capital objectives, including by helping us identify areas of strength and opportunities for improvement. As of September 30, 2023, we had 2,236 full-time employees. Our workforce is not unionized, and we are not a party to any collective bargaining agreements. We believe we have satisfactory relations with our employees.
We are also proud to develop a culture that celebrates the individuality of our employees while providing a supportive team environment. We host quarterly, diversity-focused engagement events frequently featuring employees themselves, and even members from our Board of Directors. We offer employee resource groups that provide resources and support to our employees and are active in our local communities. We also provide opportunities for employees to get involved in the community as volunteers, whether in support of sustainability or people-focused initiatives. We implemented an employee charitable match program that matched donations made by employees and contributes in recognition of volunteer hours served to eligible charitable organizations.
In recognition of creating a culture where employees feel highly engaged, appreciated and fulfilled, we were named one of Chicago Tribune’s Top Workplaces for the third year in a row in 2023. We were also named one of America’s Most Trusted Companies in 2022 by Newsweek and Statista in a survey of 50,000 participants including customers, investors and employees. We were included in Inc. Magazine’s first-annual Best-Led Companies. Finally, we were also recognized on the inaugural list of the Best Companies to Work For in the Construction and Materials industry by U.S. News & World Report.
12
As a company, we are committed to being responsible and respected citizens in the communities in which we live and work. We support organizations that help people live more productive, educated and enriched lives and encourage our employees to contribute their time to support various community and charitable activities in alignment with their values.
Our corporate governance policies set clear expectations and responsibilities for our leaders, employees and business partners to conduct our operations in a manner that is consistent with the highest standards of business ethics and accountability and is based on maintaining a close alignment of our interests with those of our stakeholders. Notable features of our corporate governance structure include the following:
In order to foster the highest standards of ethics and conduct in all business relationships, we have adopted a Code of Conduct and Ethics policy, or the Code of Conduct. This policy covers a wide range of business practices and procedures and applies to our officers, directors, employees, agents, representatives, and consultants. In addition and as a part of the Code of Conduct, we have implemented whistleblowing procedures that allow covered persons to report, on a confidential basis, concerns regarding, among other things, any questionable or unethical accounting, internal accounting controls or auditing matters with our Audit Committee as well as any potential Code of Conduct or ethics violations with our Nominating and Corporate Governance Committee or our Chief Legal Officer. We review all of these policies on a periodic basis with our employees.
Environmental Laws and Regulations; Health and Safety
Our Environmental, Health and Safety, or EHS, Policy outlines our management programs and expectations throughout our operations and businesses. We manage operational hazards and risks to provide workplaces that are safe and healthy for our employees, visitors, contractors, customers, and the communities in which we operate. We train our employees, so they have the awareness, knowledge and skills to work in a safe and environmentally responsible manner. We continually are reviewing and improving our EHS performance through ongoing training, objectives and management systems.
Our operations and properties are subject to extensive and frequently changing federal, state and local environmental protection laws, regulations and ordinances. These laws, regulations and ordinances, among other matters, govern activities and operations that may have adverse environmental effects, such as discharges to air, soil and water, and establish standards for the handling of hazardous and toxic substances and the handling and disposal of solid and hazardous wastes. We are also subject to permitting requirements under environmental, health and safety laws and regulations applicable in the jurisdictions in which we operate. Those requirements obligate us to obtain permits from one or more governmental agencies in order to conduct our operations. We believe we comply in all material respects with environmental laws and regulations and possess the permits required to operate our manufacturing and other facilities. Our environmental compliance costs in the future will depend, in part, on the nature and extent of our manufacturing activities, regulatory developments and future requirements that cannot presently be predicted.
We are also subject to workplace safety regulation by the U.S. Occupational Safety and Health Administration and state and local regulators. Our health and safety policies and practices include an employee training and competency development program to regularly train, verify and encourage compliance with health and safety procedures and regulations.
13
Item 1A. Risk Factors.
Investing in our Class A common stock involves a high degree of risk. You should carefully consider the following risks and uncertainties, together with all of the other information contained in this Annual Report on Form 10-K, or this Annual Report, including our Consolidated Financial Statements and related notes included elsewhere in this Annual Report, before making an investment decision. The occurrence of any of the following risks, or additional risks not presently known to us or that we currently believe to be immaterial, could materially and adversely affect our business, financial condition, results of operations and prospects. In such case, the trading price of our Class A common stock could decline, and you may lose all or part of your investment.
Summary Risk Factors
The risks described below include, but are not limited to, the following:
14
Risks Relating to Our Business and Industry
Demand for our products is significantly influenced by general economic conditions and trends in consumer spending on outdoor living and home exteriors, and adverse trends in, among other things, inflation, interest rates, the health of the economy, repair and remodel and new construction activity, industrial production, consumer confidence and discretionary spending and institutional funding constraints could have a material adverse effect on our business.
Demand for our products is significantly influenced by a number of economic factors affecting our customers, including distributors, dealers, contractors, architects, builders, homeowners and institutional and commercial consumers. Demand for our products depends on the level of residential and commercial improvement and renovation and new construction activity, and, in particular, the amount of spending on outdoor living spaces and home exteriors. Home and commercial renovation and improvement and new construction activity are affected by, among other things, interest rates, consumer confidence and spending habits, demographic trends, housing affordability levels, unemployment rates, institutional funding constraints, industrial production levels, tariffs, actual inflation levels and uncertainty with respect to future inflation levels and general economic conditions.
Demand for products in our Residential segment depends primarily on the level of repair and remodel activity and, to a lesser extent, new construction activity which are in turn impacted by interest rates and inflation. The recent and continued combination of high interest rates and high inflation have reduced the affordability of mortgages and increased the cost of home improvement projects. These trends have likely resulted in reduced levels of repair and remodel as well as new construction activity and demand for our products, and we expect these trends may continue for the foreseeable future. In addition, the residential repair and remodel market depends in part on home equity financing, and accordingly, the level of equity in homes will affect consumers' ability to obtain a home equity line of credit and engage in renovations that would result in purchases of our products. While home prices and equity levels of current homeowners have remained strong, higher interest rates could cause home prices to decrease and a weakness or reduction in home prices may result in a decreased demand for our residential products. We cannot predict if or when interest rates or inflation levels will decline or the impact that any such decline may have on home prices, repair and remodel activity, new construction activity, demand for our products, our business generally or our financial condition.
Many of our residential products are impacted by consumer demand for, and spending on, outdoor living spaces and home exteriors. For example, sales of our decking and railing products depend on lifestyle and architectural trends and the extent to which consumers prioritize spending to enhance outdoor living spaces for their homes. While we believe consumer preferences have increased spending on outdoor living and home exteriors in recent years, the level of spending could decrease in the future, including as a result of high interest rates and inflation levels and potential decreases in home prices as discussed above. Decreased spending on outdoor living spaces and home exteriors generally or as a percentage of repair and remodel activity may decrease demand for our outdoor living products.
Demand for our products in our Commercial segment is primarily affected by the level of commercial and governmental construction and renovation activity. The levels of commercial and governmental construction and renovation activity are affected by the levels of interest rates, availability of financing for commercial and industrial projects, the general business environment and the availability of governmental funding. Sales of products by our Commercial segment have included sales for use in institutions, such as universities and schools, and in federal, state and local government buildings, which depend on federal, state and local funding for construction and renovation projects. Sales to institutions that depend on public funding are affected by factors that may impose constraints on funding availability for construction and renovation projects, including increased operational costs, budget cuts by federal, state and local governments, including as a result of lower than anticipated tax revenues, increased limitations on federal spending or government shutdowns. Sales to commercial establishments depend on, among other things, general levels of industrial production and business growth and the performance of the various markets in which our commercial end customers operate.
Adverse trends in any of the foregoing factors could reduce our sales and have a material adverse effect on our business, financial condition and results of operations. Such factors could also alter the balance of our Residential and Commercial sales or the balance of our product sales within either such segment. In light of differing margins, changes in the relative amount and type of residential and commercial industrial activity or the mix of products sold may have an impact on our business and cause our revenues and profitability to fluctuate from period to period.
Shortages and disruptions in supply, price increases or deviations in the quality of the raw materials used to manufacture our products could adversely affect our sales and operating results.
The primary raw materials used in our products are various petrochemical resins, including polyethylene, polypropylene and PVC resins, reclaimed polyethylene and PVC material, waste wood fiber and aluminum. We also utilize other additives including modifiers, TiO2, and pigments. Our contracts with key suppliers are typically short term in nature, with terms generally ranging from one to three years. While we do not rely on any single supplier for the majority of our raw materials, we do obtain certain raw materials from single or a limited number of suppliers. In particular, we rely on a single supplier for certain critical capped compounds used in our decking and railing products.
15
We do not currently have arrangements in place for a redundant or second-source supply for those compounds. In the past, we have experienced disruptions and delays in our supply chain causing us to seek alternate suppliers for certain raw materials, and we may need to do so again in the future. Alternate suppliers may be more expensive, may encounter delays in shipments to us or may be unavailable, which would adversely affect our business, financial condition and results of operations.
In the event of an industry-wide general shortage of our raw materials, a shortage affecting or discontinuation in providing any such raw materials by one or more of our suppliers or a supplier's declaration of force majeure, we may not be able to arrange for alternative sources of such materials on a timely basis or on equally favorable terms. In recent years, we have increased the use of reclaimed polyethylene and PVC material in our products and we have also increased our production across our facilities. As we increase our use of such materials and introduce new materials into our manufacturing processes, we may be unable to obtain adequate quantities of such new raw materials in a timely manner. Any such shortage may materially adversely affect our production process as well as our competitive position as compared to companies that are able to source their raw materials more reliably or at lower cost.
In addition, increases in the market prices of raw materials used in the manufacture of our products could adversely affect our operating results as prices of our raw materials directly impact our cost of sales. The cost of some of the raw materials we use in the manufacture of our products is subject to significant price volatility and other drivers often outside of our control. For example, the cost of petrochemical resins used in our manufacturing processes has historically varied significantly and has been affected by changes in supply and demand and in the price of crude oil. In addition, the potential physical effects of climate change, such as increased frequency and severity of storms, floods and other climatic events, could disrupt our supply chain, and cause our suppliers to incur significant costs in preparing for or responding to these effects. In the past, we have faced price volatility for some of our raw materials as a result of extreme weather events and weather-related disruptions, particularly in the southern part of the United States where a significant portion of our raw materials are produced. To the extent such extreme weather events continue in the future or increase in frequency or severity, we may continue to face increased and/or unpredictable costs for our raw materials. Global economic uncertainty or conflict between or within nation states have also historically impacted global supply chains and raw material prices. For example, crude oil prices have fluctuated considerably in recent years, in large part due to the ongoing conflict between Russia and Ukraine. The recent escalation between Israel and Hamas may also have an impact on energy and commodity prices and on our raw materials and freight costs. We are unable to predict the impact that future supply and demand balances, weather events or conflicts may have on the global economy, our industry or our business, financial condition, results of operations or cash flows. We have not entered into hedges of our raw material costs, and our supply contracts with our major vendors generally do not contain obligations to sell raw materials to us at a fixed price.
We seek to mitigate the effects of increases in raw material costs by broadening our supplier base, increasing our use of recycled material and scrap, reducing waste and exploring options for material substitution and by increasing prices, however, we may not be able to recover the increases through corresponding increases in the prices of our products or the other mitigating actions noted above. Even if we are able to implement mitigating actions and/or increase prices over time, we may not be able to take such action or increase prices as rapidly as our costs increase. If we are unable to, or experience a delay in our ability to, recover such increases in our costs, our gross profit will suffer. In addition, increases in the price of our products to compensate for increased costs of raw materials may reduce demand for our products and adversely affect our competitive position as compared to products made of other materials, such as wood and metal, that are not affected by changes in the price of resins and some of the other raw materials that we use in the manufacture of our products.
We are dependent upon the ability of our suppliers to consistently provide raw materials that meet our specifications, quality standards and other applicable criteria. Our suppliers' failure to provide raw materials that meet such criteria could adversely affect production schedules and our product quality, which in turn could materially adversely affect our business, financial condition and results of operations.
We operate in a competitive business environment. If we are unable to compete effectively, our sales would suffer and our business, financial condition and operating results would be adversely affected.
We operate in a competitive business environment, and we compete with multiple companies with respect to each of our products. While we have longstanding business relationships with many of our distributors, dealers and contractors, we generally do not have long-term contracts with these customers. Accordingly, any failure to compete effectively, including as a result of the various factors described below, could cause our customers to cease purchasing our products or rapidly decrease our sales.
Our residential products compete primarily with wood products that comprise the majority of decking, railing, trim and related market sales. We also compete with metal products and with engineered products sold by other companies. Products made by Scranton Products compete with bathroom partitions, lockers and storage solutions sold at a wide range of prices and manufactured using a variety of materials.
16
Our ability to grow relies in part on the continued conversion in demand from traditional wood products to our engineered products, and our business could suffer if this conversion does not continue, or reverses, in the future. A number of suppliers of wood and wood composite decking, railing and trim products have established relationships with contractors, builders and large home improvement retailers, and, to compete successfully, we must expand and strengthen our relationships with those parties. We must also compete successfully with products from other manufacturers that offer alternatives to wood and wood composite products, including by developing competitive new products and by responding successfully to new products introduced, and pricing actions, including price reductions, and other competitive actions taken, by competitors. Some of our competitors have financial, production, marketing and other resources that are significantly greater than ours. Consolidation by industry participants could further increase their resources and result in competitors with expanded market share, larger customer bases, greater diversified product offerings and greater technological and marketing expertise, which may allow them to compete more effectively against us. Moreover, our competitors may develop products that are superior to our products (on a price-to-value basis or otherwise) or may adapt more quickly to new technologies or evolving customer requirements. Technological advances by our competitors may lead to new manufacturing techniques and make it more difficult for us to compete. If we are unable to compete successfully it could have a material adverse effect on our business, financial condition and results of operations.
Our business could be adversely affected if we fail to maintain product quality and product performance at an acceptable cost or if we incur significant losses, increased costs or harm to our reputation or brand as a result of product liability claims or product recalls.
In order to maintain and increase our net sales and sustain profitable operations we must produce high-quality products at acceptable manufacturing costs and yields. If we are unable to maintain the quality and performance of our products at acceptable costs, our brand, the market acceptance of our products and our results of operations would suffer. As we regularly modify our product lines and introduce changes to our manufacturing processes or incorporate new raw materials, we may encounter unanticipated issues with product quality or production delays. For example, we have disclosed our goal to continue to increase the proportions of recycled materials, primarily reclaimed polyethylene and PVC, into our products. While we engage in product testing in an effort to identify and address any product quality issues before we introduce products to market, unanticipated product quality or performance issues may be identified after a product has been introduced and sold.
In addition, we face the risk of exposure to product liability or other claims, including class action lawsuits, in the event our products are, or are alleged to be, defective or have resulted in harm to persons or to property. We may in the future incur significant liabilities if product liability lawsuits against us are successful. We may also have to recall and/or replace defective products, which would also result in adverse publicity and loss of sales, and would result in us incurring costs connected with the recall, which could be material. Any losses not covered by insurance could have a material adverse effect on our business, financial condition and results of operations. Real or perceived quality issues, including those arising in connection with product liability lawsuits, warranty claims or recalls, could also result in adverse publicity, which could harm our brand and reputation and cause our sales to decline rapidly. In addition, any such issues may be seized on by competitors in efforts to increase their market share.
We provide product warranties and, if our product warranty obligations were significantly in excess of our reserves, our business, financial condition and results of operations could be materially and adversely affected.
We provide various warranties on our products, ranging from five years to lifetime warranties depending on the product and subject to various limitations. Management estimates warranty reserves, based in part upon historical warranty costs, as a proportion of sales by product line. Management also considers various relevant factors, including our stated warranty policies and procedures, as part of the evaluation of our warranty liability. Because warranty issues may surface later in the life cycle of a product, management continues to review these estimates on a regular basis and considers adjustments to these estimates based on actual experience compared to historical estimates. Estimating the required warranty reserves requires a high level of judgment, especially as many of our products are at a relatively early stage in their product life cycles, and we cannot be sure that our warranty reserves will be adequate for all warranty claims that arise. We also regularly modify our product lines and introduce changes to our manufacturing processes or incorporate new raw materials. While we perform extensive testing in connection with new products and formulations, changes in our products may result in unanticipated product quality or performance issues and an increase in warranty claims for certain of our products. Material warranty obligations in excess of our reserves could have a material adverse effect on our business, financial condition and results of operations.
Our quarterly operating results may fluctuate as a result of seasonality, changes in weather conditions, inventory recalibration in our channel and changes in product mix.
We have typically experienced moderately higher levels of sales of our residential products in the second fiscal quarter of the year as a result of our “early buy” sales and extended payment terms typically available during that quarter. As a result of these extended payment terms, our accounts receivable have typically reached seasonal peaks at the end of the second fiscal quarter of the year, and our net cash provided by operating activities has typically been lower in that quarter relative to other quarters.
17
Our sales are also generally impacted by the number of days in a quarter or a year that contractors and other professionals are able to install our products. We have generally experienced lower levels of sales of residential products during the first fiscal quarter due to adverse weather conditions in certain markets, which typically reduce the construction and renovation activity during the winter season. Although our products can be installed year-round, unusually adverse weather conditions can negatively impact the timing of the sales of certain of our products, causing reduced sales and negatively impacting profitability when such conditions exist. Our residential products are generally purchased shortly before installation and used in outdoor environments. As a result, there is a correlation between the number of products we sell and weather conditions during the time they are to be installed. Adverse weather conditions, including the increased occurrence or strength of extreme weather events caused by climate change or otherwise, may interfere with ordinary construction, delay projects or lead to cessation of construction involving our products. Prolonged adverse weather conditions could significantly reduce our sales in one or more periods. These conditions may shift sales to subsequent reporting periods or decrease overall sales, given the limited outdoor construction season in many locations. In addition, we have experienced higher levels of sales of our engineered bathroom partition products and our locker products during the second half of our fiscal year, which includes the summer months during which schools are typically closed and therefore more likely to be undergoing remodel activities. These factors can cause our operating results to fluctuate on a quarterly basis.
Our operating results may also fluctuate due to changes in the quantity and type of inventory held from time to time in our distribution channel by our distributors and dealers, especially during periods of increased economic volatility and uncertainty. Demand signals and inventory recalibration decisions across our channel can become magnified as they move up the channel to us, potentially resulting in larger demand fluctuations for us than we are able to forecast. Such fluctuations can result in us having to increase or decrease our manufacturing output quickly, and we cannot be sure that we would be able to respond to such fluctuations at the appropriate time or in the appropriate manner, and our short-term results of operations may be negatively impacted. In addition, changes in the mix of products sold can affect our operating results. We sell products at different prices, composed of different materials and involving varying levels of manufacturing complexity. Changes in the mix of products sold from period to period may affect our average selling price, cost of sales and gross margins.
If we fail to develop new and improved products successfully, or if we fail to effectively manage the introduction of new products, our business will suffer.
Our continued success depends on our ability to predict the products that will be demanded by our customers and consumers, such as homeowners or commercial or industrial purchasers, and to continue to innovate and introduce improved products in our existing product lines and products in new product categories. We may not be successful in anticipating these needs or preferences or in developing new and improved products. If we do not respond effectively to changing market trends, demands and preferences and to actions by competitors by introducing competitive new products, our business, financial condition and results of operations would suffer.
Even if we do introduce new products, consumers may not choose our new products over existing products. In addition, competitors could introduce new or improved products that would replace or reduce demand for our products or develop proprietary changes in manufacturing technologies that may render our products obsolete or too expensive to compete effectively. In addition, when we introduce new products, we must effectively anticipate and manage the effect of new product introductions on sales of our existing products. If new products displace sales of existing products more broadly or rapidly than anticipated, we may have excess inventory of existing products and be required to reduce prices on existing products, which could adversely affect our results of operations. As we continue to introduce new products at varying price points to broaden our product offerings to compete with products made with wood or other traditional materials across a wide range of prices, our overall gross margins may vary from period to period as a result of changes in product mix.
Moreover, we may introduce new products with initially lower gross margins with the expectation that the gross margins associated with those products may improve over time as we improve our manufacturing efficiency for those products, and our results of operations would be adversely affected if we are unable to realize the anticipated improvements.
In the past we have devoted, and in the future we expect to continue to devote, significant resources to developing new products. However, we cannot be sure that we will successfully complete the development and testing of new products and be able to release the products when anticipated or at all. From time to time, we may make investments in the development of products we ultimately determine not to release resulting in write-downs of inventory and related assets.
18
Our business would suffer if we do not effectively manage our manufacturing processes, including adjusting production to meet demand, integrating new manufacturing facilities, achieving cost-savings initiatives and successfully introducing new technologies and products.
We continually review our manufacturing operations in an effort to achieve increased manufacturing efficiencies, to integrate new technologies and to address changes in our product lines and in market demand. Periodic manufacturing integrations, realignments and cost-savings programs and other changes have adversely affected, and could in the future adversely affect, our operating efficiency and results of operations during the periods in which such programs are being implemented. Such programs may include the addition of manufacturing lines and the consolidation, integration and upgrading of facilities, functions, systems and procedures, including the introduction of new manufacturing technologies and product innovations. These programs involve substantial planning, often require capital investments, and may result in charges for fixed asset impairments or obsolescence and substantial severance costs. Our ability to achieve cost savings or other benefits within the time frames we anticipate is subject to many estimates and assumptions, a number of which are subject to significant economic, competitive and other uncertainties. For example, we have made substantial investments to expand our recycling capabilities and to increase the use of reclaimed materials in our manufacturing processes. While we anticipate that enhancing these capabilities will ultimately decrease our costs, the introduction of these capabilities has required significant initial investment, and we cannot be certain we will realize the benefits of this initiative when anticipated or at all. If these investments and other changes are not effectively integrated into our manufacturing processes, we may suffer from production delays, lower efficiency and manufacturing yields, increased costs and reduced net sales.
We also face risks in starting up new manufacturing facilities, including with respect to expanding our overall production capacity as well as moving production to such new facilities, that could increase costs, divert management attention and reduce our operating results. For example, in 2022 we opened a new manufacturing facility in Boise, Idaho. The establishment and operation of that facility, and any capacity expansion project, involves significant risks and challenges, including, but not limited to, design and construction delays and cost overruns. There can be no assurance that our Boise facility will contribute the incremental production capacity that we anticipated and in a manner suitable to our goals or that any other expansion project will be operational on the timeline or contribute the incremental production capacity that we anticipate, and we cannot guarantee that any such facility will operate at costs acceptable to us or that demand for our products will remain at levels high enough to meet the return on investment necessary to justify our investment in these projects.
We must also effectively address changes to our manufacturing operations resulting from growth of our business generally, including as a result of acquisitions, and introduction of new products. As we increase our manufacturing capacity to meet market demand, integrate newly acquired manufacturing operations or begin to manufacture new products at scale, we may face unanticipated manufacturing challenges as production volumes increase, new processes are implemented and new supplies of raw materials used in these products are secured. Newly acquired businesses may not operate as efficiently as we do, and we may have to expend costs to increase their efficiency and generally integrate them into our processes. New products may initially be more costly and less efficient to produce than our existing products. In addition, we could experience delays in production as we increase our manufacturing capacity or begin to manufacture new products that may result in the products ordered by our customers being on back-order as initial production issues are addressed. As a result, increases in manufacturing capacity, integrating new operations or the introduction of new products may initially be associated with lower efficiency and manufacturing yields and increased costs, including shipping costs to fill back-orders. If we experience production delays or inefficiencies, a deterioration in the quality of our products or other complications in managing changes to our manufacturing processes, including those that are designed to increase capacity, enhance efficiencies and reduce costs or that relate to new products or technologies, we may not achieve the benefits that we anticipate from these actions when expected, or at all, and our operations could experience disruptions, our manufacturing efficiency could suffer and our business, financial condition and results of operations could be materially and adversely affected.
Our sales and results of operations may suffer if we do not maintain our relationships with, forecast the demand of and make timely deliveries to our key distributors or other customers.
Our operations depend upon our ability to maintain our strong relationships with our network of distributors and dealers. Our top ten distributors collectively accounted for a majority of our net sales for the year ended September 30, 2023. Our largest distributor, Parksite Inc., accounted for approximately 19% of our net sales for the year ended September 30, 2023. While we have long-standing business relationships with many of our key distributors and our distribution contracts generally provide for exclusive relationships with respect to certain products within certain geographies, these contracts typically permit the distributor to terminate for convenience on several months’ notice. The loss of, or a significant adverse change in, our relationships with one or more of our significant distributors could materially reduce our net sales.
Distributors and dealers that sell our products are sensitive to meeting the demands of their end customers on a timely basis. Dealers that sell our products typically place orders with our distributors that need to be filled in a short time frame, and these dealers typically do not have an exclusive relationship with us. Purchases by our distributors and dealers are affected by their individual decisions on the levels of inventory they carry, their views on product demand, their financial condition and the manner in which they choose to manage inventory risk.
19
In addition, purchases by distributors and dealers are affected by a variety of other factors, including general economic conditions, product pricing, increases in the number of competitive producers and the production capacity of other producers, new product introductions, changes in levels of home renovation and new construction activity, and weather-related fluctuations in demand. As a result, demand for our products can be difficult to predict. If we do not forecast and plan production effectively to manufacture sufficient products to meet demand or if we experience delays in our ability to manufacture products, dealers may seek alternative products, including those of our competitors. Failure to meet demand requirements on a timely basis may cause distributors or dealers to build up inventory as a precautionary measure, rapidly shift their product mix away from our products, harm our long-term relationships with distributors and dealers, harm our brand and reduce, or increase the variability of, our net sales.
We must continue to provide product offerings at price points that meet the needs of distributors and dealers and that they perceive to be competitive with the products on the market. If our key distributors or dealers are unwilling to continue to sell our products at existing or higher levels, or if they desire to sell competing products alongside our products, our ability to maintain or increase our sales could suffer. In addition, mergers or acquisitions involving our distributors or dealers and one of our competitors, or a distributor or dealer with a relationship with one of our competitors, could decrease or eliminate purchases of our product by that distributor or dealer. If a key distributor or dealer were to terminate its relationship with us or reduce purchases of our products, we may not be able to replace that relationship with a relationship with a new distributor or dealer in a timely manner or at all. In addition, any such new relationship may take time to develop and may not be as favorable to us as the relationship it is replacing. The loss of, or a reduction in orders from, any significant distributor or dealer, may have a material adverse effect on our business, financial condition or results of operations.
An interruption of our production capability at one or more of our manufacturing facilities from global health pandemics, accident, calamity or other causes, or events affecting the global economy, could adversely affect our business.
We manufacture our products at a limited number of manufacturing facilities, and we generally do not have redundant production capabilities that would enable us to shift production of a particular product rapidly to another facility in the event of a loss of one of or a portion of one of our manufacturing facilities. A catastrophic loss of the use of one or more of our manufacturing facilities due to global health pandemics, accident, fire, explosion, labor issues, tornado, other weather conditions, natural disasters, condemnation, cancellation or non-renewals of leases, terrorist attacks or other acts of violence or war or otherwise could have a material adverse effect on our production capabilities. In addition, unexpected failures, including as a result of power outages or similar disruptions outside of our control, of our equipment and machinery could result in production delays or the loss of raw materials or products in the equipment or machinery at the time of such failures. Any of these events could result in substantial revenue loss and repair costs. An interruption in our production capabilities could also require us to make substantial capital expenditures to replace damaged or destroyed facilities or equipment. There are a limited number of manufacturers that make some of the equipment we use in our manufacturing facilities, and we could experience significant delay in replacing manufacturing equipment necessary to resume production. An interruption in our production capability, particularly if it is of significant duration, could result in a permanent loss of customers who decide to seek alternate products.
Our business operations could be adversely affected by the loss of the services from members of our senior management team and other key employees.
Our success depends in part on the continued contributions of our senior management and other key employees. Our senior leadership team members have extensive sales and marketing, engineering, product development, manufacturing and finance backgrounds in our industry. This experience also includes specialized knowledge and expertise relating to the manufacturing and production of composite Outdoor Living products and recycled materials, a combination which may be particularly hard to replace considering the limited number of companies that produce such products in general and particularly with the breadth of our product offerings. The loss of any member of our senior management team or other key employees in the future could significantly impede our ability to successfully implement our business strategy, financial plans, product development goals, marketing initiatives and other objectives. Should we lose the services of any member of our senior management team or key personnel, replacing such personnel could involve a prolonged search and divert management time and attention and we may not be able to locate and hire a qualified replacement. We do not carry key person insurance to mitigate the financial effect of losing the services of any member of our management team.
Acquisitions, divestitures or joint ventures we may pursue in the future may be unsuccessful.
We may consider the acquisition of other manufacturers or product lines of other businesses that either complement or expand our existing business, or may enter into joint ventures. For example, we have acquired a number of companies in our recent history, including with respect to both manufacturing operations and recycling initiatives. While we believe those acquisitions were successful in improving our business, we cannot assure you that we will be able to consummate any other acquisitions or joint ventures or that any future acquisitions or joint ventures will be able to be consummated at acceptable prices and on acceptable terms.
20
Any future acquisitions or joint ventures we pursue may involve a number of risks, including some or all of the following:
In addition, acquisitions or joint ventures could result in significant increases in our outstanding indebtedness and debt service requirements or could involve the issuance of preferred stock or common stock that would be dilutive to existing stockholders. Incurring additional debt to fund an acquisition may result in higher debt service and a requirement to comply with financial and other covenants in addition to those contained in our Senior Secured Credit Facilities, including potential restrictions on future acquisitions and distributions. Funding an acquisition with our existing cash would reduce our liquidity. The terms of our existing and future debt agreements may limit the size and/or number of acquisitions we can pursue or our ability to enter into a joint venture.
We have also divested and may in the future divest certain assets or businesses that no longer fit with our strategic direction or growth targets. Divestitures also involve significant risks and uncertainties, including:
21
Any of these risks could have a material adverse effect on our business, financial condition or results of operations.
We depend on third parties for transportation services, and the lack of availability of and/or increases in the cost of transportation could have a material adverse effect on our business and results of operations.
Our business depends on the transportation of both finished goods to our distributors and other customers and the transportation of raw materials to us primarily through the use of flatbed trucks and rail transportation. We rely on third parties for transportation of these items. The availability of these transportation services is subject to various risks, including those associated with supply shortages, change in fuel prices, work stoppages, operating hazards and interstate transportation regulations. In particular, a significant portion of our finished goods are transported by flatbed trucks, which are occasionally in high demand (especially at the end of calendar quarters) and/or subject to price fluctuations based on market conditions and the price of fuel. Any material delays and challenges, including increases to freight and shipping costs and our ability to secure sufficient quantities of flatbed trucks and railcars necessary for our operations, both with respect to our procurement of raw materials and our delivery of our products, may result in a material adverse effect on our results of operations.
If the required supply of transportation services is unavailable when needed, we may be unable to sell our products when they are requested by our customers. In that event, we may be required to reduce the price of the affected products, seek alternative and, potentially more costly, transportation services or be unable to sell the affected products. Similarly, if any of these transportation providers were unavailable to deliver raw materials to us in a timely manner, we may be unable to manufacture our products in response to customer demand. In addition, a significant increase in transportation rates or fuel surcharges could adversely affect our profitability. Any of these events could have a material adverse effect on our business and results of operations.
Increases in labor costs, potential labor disputes and work stoppages or an inability to hire skilled manufacturing, sales and other personnel could adversely affect our business.
An increase in labor costs, work stoppages or disruptions at our facilities or those of our suppliers or transportation service providers, or other labor disruptions, could decrease our sales and increase our expenses. In addition, although our employees are not represented by a union, our labor force may become subject to labor union organizing efforts, which could cause us to incur additional labor costs and increase the related risks that we now face.
The competition for skilled manufacturing, sales and other personnel is often intense in the regions in which our manufacturing facilities are located. During 2021, the entire country experienced an overall tightening and increasingly competitive labor market, and the labor market has remained very competitive. A sustained labor shortage or increased turnover rates within our employee base, caused by global health pandemics or other national or international emergencies, increases in the salaries and wages paid by competing employers, as a result of general macroeconomic factors or otherwise, could lead to increased costs, such as increased overtime to meet demand and increased salaries and wage rates to attract and retain employees, and could negatively affect our ability to efficiently operate our manufacturing facilities and overall business. If we are unable to hire and retain employees capable of performing at a high-level, or if mitigation measures we may take to respond to a decrease in labor availability have unintended negative consequences, our business, financial condition and results of operations could be adversely affected. If we are unable to hire or retain skilled manufacturing, sales and other personnel for our new facilities, our ability to execute our business plan, and our results of operations, would suffer.
If we are unable to collect accounts receivable from one or more of our significant distributors, dealers or other customers, our financial condition and operating results could suffer.
We extend credit to our distributors and, to a lesser extent, dealers and other customers, based on an evaluation of their financial condition, and we generally do not require collateral to secure these extensions of credit. The financial health of many of our customers is affected by changes in the economy and the cyclical nature of the building industry. The effects of rising interest rates, reduced home prices and homeowner equity and prospective homebuyer purchasing power and any related economic downturn or protracted or severe economic declines and cyclical downturns from other causes in the building industry, including any long-term effects of global health pandemics, may cause our customers to be unable to satisfy their payment obligations, including their debts to us. While we maintain allowances for credit losses, these allowances may not be adequate to provide for actual losses, and our financial condition and results of operation could be materially and adversely affected if our credit losses significantly exceed our estimates.
22
If we fail to maintain an effective system of internal controls, our ability to produce timely and accurate financial statements or comply with applicable regulations could be impaired.
As a public company, we are subject to the reporting requirements of the Exchange Act, the Sarbanes-Oxley Act of 2002, or the Sarbanes-Oxley Act, and the rules and regulations and the listing standards of the NYSE.
The Sarbanes-Oxley Act requires, among other things, that we evaluate the effectiveness of our disclosure controls and procedures and internal control over financial reporting. While we were able to determine that our disclosure controls and procedures and internal control over financial reporting were effective as of September 30, 2023, we anticipate that we will continue to expend resources to further improve our internal control over financial reporting.
If we fail to maintain an effective system of internal control over financial reporting in the future, we may not be able to accurately or timely report our financial condition or results of operations or prevent fraud, which may adversely affect investor confidence in us and, as a result, the value of our Class A common stock. Any failure to maintain effective disclosure controls and procedures and internal control over financial reporting could have an adverse effect on our business and results of operations and financial condition. In addition, if we are unable to assert that our internal control over financial reporting is effective, or if our independent registered public accounting firm is unable to express an opinion on the effectiveness of our internal control, investors may lose confidence in the accuracy and completeness of our financial reports, which could cause the price of our Class A common stock to decline. In addition, if we are unable to continue to meet these requirements, we may not be able to remain listed on the NYSE.
Subjective estimates and judgments used by management in the preparation of our financial statements, including estimates and judgments that may be required by new or changed accounting standards, may impact our financial condition and results of operations.
The preparation of financial statements requires management to make estimates and judgments that affect the reported amounts of assets, liabilities, revenue and expenses, including the accounting for rebates, warranties and recovery of goodwill. Due to the inherent uncertainty in making estimates, results reported in future periods may be affected by changes in estimates reflected in our financial statements for earlier periods. Estimates and judgments are continually evaluated and are based on historical experience and other factors, including expectations of future events that are believed to be reasonable under the circumstances. For example, we review our goodwill and other intangibles not subject to amortization for impairment annually, or when events or circumstances indicate that it is more likely than not that the fair value of a reporting unit could be lower than its carrying value. Changes in economic or operating conditions impacting our estimates and assumptions could result in the impairment of our goodwill or long-lived assets, which may require us to record a significant charge to earnings in our financial statements that could have a material adverse effect on our results of operations. From time to time, there may be changes in the financial accounting and reporting standards that govern the preparation of our financial statements. These changes can materially impact how we record and report our financial condition and results of operations. In some instances, we could be required to apply a new or revised standard retrospectively. If the estimates and judgments we use in preparing our financial statements are subsequently found to be incorrect or if we are required to restate prior financial statements, our financial condition or results of operations could be significantly affected.
Our forecasts of market opportunity and market growth may prove to be inaccurate, and we cannot assure you our business will grow at rates similar to our overall markets, or at all.
Estimates and forecasts of market size and opportunity and of market growth are subject to significant uncertainty and are based on assumptions and estimates that may not prove to be accurate. Our estimates and forecasts of the size of the markets that we may be able to address and the growth in these markets are subject to many assumptions and may prove to be inaccurate. Further, recent increases in interest rates, reduced home prices and homeowner equity and prospective homebuyer purchasing power, as well as the global health pandemics, have affected and may continue to materially affect the growth of our markets, and we cannot predict the extent to which those estimates will be affected. Further, we may not be able to address fully the markets that we believe we can address, and we cannot be sure that these markets will grow at historical rates or the rates we expect for the future. Our growth is subject to many factors, including our success in implementing our business strategy, which is subject to many risks and uncertainties. Accordingly, even if we are able to address the markets that we believe represent our market opportunity and even if these markets experience the growth we expect, we may not be able to grow our business at similar rates, or at all.
23
We may be subject to significant compliance costs as well as liabilities under environmental, health and safety laws and regulations, including climate- and climate change-related regulations, which could materially and adversely affect our business, financial condition and operations.
Our past and present operations, assets and products are subject to regulation by extensive environmental laws and regulations at the federal, state and local levels. These laws regulate, among other things, air emissions, the discharge or release of materials into the environment, the handling and disposal of wastes, remediation of contaminated sites, worker health and safety and the impact of products on human health and safety and the environment. Under some of these laws, liability for contaminated property may be imposed on current or former owners or operators of the property or on parties that generated or arranged for waste sent to the property for disposal. Liability under these laws may be joint and several and may be imposed without regard to fault or the legality of the activity giving rise to the contamination. Our facilities are located on sites that have been used for manufacturing activities for an extended period of time, which increases the possibility of contamination being present. Despite our compliance efforts, we may still face material liability, limitations on our operations or fines or penalties for violations of environmental, health and safety laws and regulations, including releases of regulated materials and contamination by us or previous occupants at our current or former properties or at offsite disposal locations we use.
We are also subject to permitting requirements under environmental, health and safety laws and regulations applicable in the jurisdictions in which we operate. Those requirements obligate us to obtain permits from one or more governmental agencies in order to conduct our operations. Such permits are typically issued by state agencies, but permits and approvals may also be required from federal or local governmental agencies. The requirements for such permits vary depending on the location where our regulated activities are conducted. As with all governmental permitting processes, there is a degree of uncertainty as to whether a permit will be granted, the time it will take for a permit to be issued and the conditions that may be imposed in connection with the granting of the permit. Any failure to obtain or delay in obtaining a permit required for our operations, or the imposition of onerous conditions in any such permits, could adversely affect our business, financial condition and operations.
In addition, climate change and new or revised rules and regulations related thereto, including regulations with respect to greenhouse gas emissions and regulations enacted by the SEC, may impact our business in numerous ways. Climate change and its effects could lead to further increases in raw material prices or their reduced availability due to, for example, increased frequency and severity of extreme weather events and any supply chain disruptions resulting therefrom, and could cause increased incidence of disruption to the production and distribution of our products and an adverse impact on consumer demand and spending. In recent months, there have been substantial legislative and regulatory developments on climate-related issues, including proposed, issued or implemented legislation and rulemakings that would require companies to assess and/or disclose climate metrics, risks, opportunities, policies and practices. For example, in March 2022, the SEC proposed climate-related disclosure requirements that would require increased climate change-related disclosure in our periodic reports and other filings with the SEC. The potential impact to us of these legislative and regulatory developments is uncertain at this time, although we expect that the emerging legal and regulatory requirements on climate-related issues will result in additional compliance and may require us to spend significant resources and divert management attention. We cannot be sure that we will be able to successfully adapt our operations in response to any climate-related changes or comply with any increased reporting obligations in a cost-effective manner, and our business, financial condition and results of operations could be materially and adversely affected.
Applicable environmental, health and safety laws and regulations, and any changes to them or in their enforcement, may require us to make material expenditures with respect to ongoing compliance with, or remediation under, these laws and regulations or require that we modify our products or processes in a manner that increases our costs and/or reduces our profitability. For example, additional pollution control equipment, process changes or other environmental control measures may be needed at our facilities to meet future requirements. In addition, discovery of currently unknown or unanticipated soil or groundwater contamination or other investigations or remedial efforts relating to environmental properties at our properties could result in significant liabilities and costs. Accordingly, we are unable to predict the future costs of compliance with, or liability under, environmental, health and safety laws and regulations.
Our business operations could suffer if we fail to adequately protect our intellectual property rights, and we may experience claims by third parties that we are violating their intellectual property rights.
We rely on trademark and service mark protection to protect our brands, and we have registered or applied to register many of these trademarks and service marks. In particular, we believe the AZEK and AZEK Exteriors brands, the TimberTech brand, the VERSATEX brand, the StruXure brand and the FULL-CIRCLE brand, including FULL-CIRCLE PVC Recycling and FULL-CIRCLE Recycling, are significant to the success of our business. In the event that our trademarks or service marks are successfully challenged and we lose the rights to use those trademarks or service marks, or if we fail to prevent others from using them (or similar marks), we could be forced to rebrand our products and programs, requiring us to devote resources to advertising and marketing new brands. In addition, we cannot be sure that any pending trademark or service mark applications will be granted or will not be challenged or opposed by third parties or that we will be able to enforce our trademark rights against counterfeiters.
24
We generally rely on a combination of unpatented proprietary know-how and trade secrets, and to a lesser extent, patents to preserve our position in the market. Because of the importance of our proprietary know-how and trade secrets, we employ various methods to protect our intellectual property, such as entering into confidentiality agreements with third parties, and controlling access to, and distribution of, our proprietary information. We may not be able to deter current and former employees, contractors and other parties from breaching confidentiality obligations and misappropriating proprietary information. It is difficult for us to monitor unauthorized uses of our products and technology. Accordingly, these protections may not be adequate to prevent competitors from copying, imitating or reverse engineering our products or from developing and marketing products that are substantially equivalent to or superior to our own.
In addition, we have applied for patent protection relating to certain existing and proposed products, processes and services or aspects thereof. We cannot be sure that any of our pending patent applications will be granted or that any patents issued as a result of our patent applications will be of sufficient scope or strength to provide us with any meaningful protection or commercial advantage.
If third parties take actions that affect our rights or the value of our intellectual property or proprietary rights, or if we are unable to protect our intellectual property from infringement or misappropriation, other companies may be able to offer competitive products at lower prices, and we may not be able to effectively compete against these companies. In addition, if any third party copies or imitates our products in a manner that affects customer or consumer perception of the quality of our products, or of engineered products generally, our reputation and sales could suffer whether or not these violate our intellectual property rights.
In addition, we face the risk of claims that we are infringing third parties’ intellectual property rights. Any such claim, even if it is without merit, could be expensive and time-consuming to defend and could divert the time and attention of our management. An intellectual property claim against us that is successful could cause us to cease making or selling products that incorporate the disputed intellectual property, require us to redesign our products, which may not be feasible or cost effective, and require us to enter into costly royalty or licensing arrangements, any of which could have a material adverse effect on our business, financial condition and results of operations. Moreover, certain material technology and know-how we use to manufacture our products is licensed to us rather than owned by us, and our license is subject to termination in the event of uncured material breach, among other reasons.
Any major disruption or failure of our technology systems or our website, or our failure to successfully implement new technology effectively, could adversely affect our business and operations.
We rely on various technology systems, including information technology and operational technology systems, owned by us and third parties, to manage our operations, maintain books and records, record transactions, provide information to management and prepare our financial statements. In addition, we have made a significant investment in our website which we believe is critical for lead generation and is the primary forum through which we interact with end consumers. A failure of our technology systems or our website to operate as expected could disrupt our business and adversely affect our financial condition and results of operations. These systems and our website are vulnerable to damage from hardware failure; fire; power loss; data network and telecommunications failure; loss or corruption of data, cyber attacks and impacts of terrorism; natural disasters or other disasters. We may not have sufficient redundant operations to cover a loss or failure in a timely manner. In addition, the operation of these systems and our website are dependent upon third party technologies, systems and services, and support by third party vendors, and we cannot be sure that these third-party systems, services and support will continue to be available to us without interruption. Any damage to our technology systems or website could cause interruptions to our operations that materially adversely affect our ability to meet customers’ requirements, resulting in an adverse impact to our business, financial condition and results of operations. Periodically, these systems and our website need to be expanded, updated or upgraded as our business needs change. We may not be able to successfully implement changes in our technology systems and to our website without experiencing difficulties, which could require significant financial and human resources.
We face cybersecurity risks and risks arising from new regulations governing information security and privacy and may incur increasing costs in an effort to mitigate those risks.
The automated nature of our business and our reliance on digital technologies also makes us a target for, and potentially vulnerable to, cybersecurity attacks, computer malware, computer viruses, social engineering (including phishing and ransomware attacks), general hacking, physical or electronic break-ins, or similar disruptions. In addition, our hybrid working environment may exacerbate these and other operational risks. The techniques used to obtain unauthorized, improper or illegal access to our systems, or to disable or degrade service or sabotage systems, are constantly evolving, may be difficult to detect quickly, and often are not recognized until after they have been launched against a target. Attempts to gain access to our systems or facilities could occur through various means, including, among others, hacking into our or our vendors’ or consumers’ systems, or attempting to fraudulently induce our employees, partners, consumers or others into clicking on a malware link or disclosing usernames, passwords, or other sensitive information, which may in turn be used to access our technology systems. Such efforts may be state-sponsored and supported by significant financial and technological resources, making them even more difficult to detect and prevent. We may be unable to anticipate these techniques, react in a timely manner, or implement adequate preventative or remedial measures.
25
We are also subject to the risk that cybersecurity attacks on, or other security incidents affecting, our vendors may adversely affect our business even if an attack or breach does not directly impact our systems. Due to the evolving nature of cybersecurity threats, the scope and impact of any incident cannot be predicted. In addition, the rapid evolution and increased adoption of artificial intelligence technologies may intensify our cybersecurity risks. While we have implemented measures to safeguard our systems and mitigate potential risks, there is no assurance that such actions will be sufficient to prevent cybersecurity attacks or security breaches that damage or interrupt access to information systems or networks, compromise confidential or otherwise protected information, destroy or corrupt data, or otherwise disrupt our operations which could have a material adverse effect on our business, financial condition and reputation.
In addition to the various technology systems we rely on to manage our operations, maintain books and records, record transactions, provide information to management and prepare our financial statements as described above, we utilize systems and websites that allow for the secure storage and transmission of our proprietary or confidential information and proprietary or confidential information regarding our customers, employees and others, including personal information. All of these systems, including those owned and operated by third parties, are also potential targets for cybersecurity attacks. Data security breaches can occur as a result of a breach by us or our employees or by persons with whom we have commercial relationships that result in the unauthorized release of personal or confidential information. In addition to our own databases, we use third-party service providers to store, process and transmit confidential or sensitive information on our behalf. A data security breach could occur in the future either at their location or within their systems that could affect our personal or confidential information. A data security breach may expose us to a risk of loss or misuse of this information, and could result in significant costs to us, which may include, among others, fines and penalties, costs related to remediation, potential costs and liabilities arising from governmental or third-party investigations, proceedings or litigation, diversion of management attention and harm to our reputation. Any compromise or breach of our security could result in a violation of applicable privacy and other laws, significant legal and financial exposure, and a loss of confidence in our security measures, which could have an adverse effect on our business, financial condition and reputation.
The regulatory environment surrounding information security and privacy is increasingly demanding, with frequent imposition of new and changing requirements, which could cause us to incur substantial costs. In the United States, various laws and regulations apply to the collection, processing, disclosure and security of certain types of data, including the Electronic Communications Privacy Act, the Computer Fraud and Abuse Act, the Health Insurance Portability and Accountability Act of 1996, the Gramm Leach Bliley Act and various state laws relating to privacy and data security, including the California Consumer Privacy Act. Federal and state laws and regulations require notice of any data security breaches that involve personal information. These mandatory disclosures regarding a security breach are costly and often lead to widespread negative publicity, which may cause consumers to lose confidence in the effectiveness of our data security measures. We may incur significant costs and operational consequences in connection with investigating, mitigating, remediating, and putting in place additional tools and devices designed to prevent security incidents, as well as in connection with complying with any notification or other obligations resulting from any security incidents.
Any failure or perceived failure by us to comply with laws, regulations, policies or regulatory guidance relating to privacy or data security may result in governmental investigations and enforcement actions, litigation, fines and penalties or adverse publicity, and could cause our customers and consumers to lose trust in us, which could have an adverse effect on our reputation and business. While we maintain insurance to mitigate our exposure to these risks, our insurance policies carry retention and coverage limits, which may not be adequate to reimburse us for losses caused by security breaches or other cybersecurity events, and we may not be able to collect fully, if at all, under these insurance policies.
Changes to legislative and regulatory policies related to home ownership may have a material adverse effect on our business, financial condition and results of operations.
Our markets are affected by legislative and regulatory policies that promote or do not promote home ownership, such as U.S. federal and state legislative and regulatory policies enacted in response to the global health pandemics that provided various measures of relief for homeowners, primarily in the form of mortgage payment forbearance for homeowners with federally-backed mortgages, temporary moratoria on foreclosures and evictions and rental assistance. While those relief measures have largely lapsed, it remains uncertain how such relief measures and similar policies enacted in response to the global health pandemics and other events affecting the U.S. and global economies will continue to impact the U.S. real estate market and the U.S. and global economies generally, and our business, financial condition and results of operations may be materially and adversely affected as a result. Future changes to laws or policies relating to these or similar matters could reduce demand for our products and have a material adverse effect on our business, financial condition and results of operations.
26
Many of our products must comply with local building codes and ordinances and failure of our products to comply with such codes and ordinances may have an adverse effect on our business.
Many of our products must comply with local building codes and ordinances. These codes and ordinances are subject to future government review and interpretation. If our products fail to comply with such local building codes or ordinances, our ability to market and sell such products would be impaired. Also, should these codes and ordinances be amended or expanded, or should new laws and regulations be enacted, we could incur additional costs or become subject to requirements or restrictions that require us to modify our products or adversely affect our ability to market and sell our products. Furthermore, failure of our products to comply with such codes or ordinances could subject us to negative publicity or damage our reputation.
Our insurance coverage may be inadequate to protect against the potential hazards incident to our business.
We maintain customary insurance policies for businesses of our type, including property, business interruption, product liability and casualty insurance coverage, but such insurance may not provide adequate coverage against potential claims, including losses resulting from interruptions in our production capability or product liability claims relating to the products we manufacture. Consistent with market conditions in the insurance industry, premiums and deductibles for some of our insurance policies have been increasing, sometimes substantially, and may, in the future, increase further. In some instances, some types of insurance may become available only for reduced amounts of coverage, if at all. In addition, our insurers could deny coverage for claims. If we were to incur a significant liability for which we were not fully insured or that our insurers disputed, our business, financial condition or results of operations could be materially adversely affected.
We are subject to litigation and legal proceedings and may be subject to additional litigation, arbitration or legal proceedings in the future.
From time to time, we may be involved in litigation relating to claims arising out of our operations and businesses that cover a wide range of matters, including, among others, contract and employment claims, personal injury claims, product liability claims and warranty claims. The results of any current or future litigation cannot be predicted with certainty and, regardless of the outcome, we may incur significant costs and experience a diversion of management resources as a result of litigation. The results of any such litigation could have a material adverse impact on our business, financial condition, cash flows and results of operations.
We are in the early stages of implementing strategic initiatives related to the use of recycled materials. If we fail to implement these initiatives as expected, our business, financial condition and results of operations could be adversely affected.
We are dedicated to investing in and expanding our recycling capability in order to increase the use of reclaimed materials in our manufacturing processes. Our future financial performance depends in part on our management’s ability to successfully implement our strategic initiatives related to developing our recycling capabilities, increasing the recycle content of our products, and other cost savings measures, with an aim to reduce our material costs, improve net manufacturing productivity and enhance our business operations. We are still in the early stages of material substitution across our manufacturing network and realizing the benefits of our investments in recycling. To achieve such benefits, we must recycle materials on a cost-effective basis and efficiently convert these materials into high-quality finished goods. This strategy involves significant risks, including the risk that we are unable to meet our objectives with respect to recycle content and other recycle initiatives and our profitability may be negatively impacted as a result. In particular, the variability of our raw material sources can result in production issues causing a considerable reduction in our operating rates and yields, which may more than offset any savings we realize from the low purchase price of the materials. Our plants must convert our raw materials at high rates and net yields to generate the profit margins and cash flows necessary to achieve sustainable returns, and we may not produce a sustainable return on investment.
Our ability to achieve our environmental, social and governance and sustainability initiatives is subject to emerging risks and the outcomes may not achieve the anticipated benefits or align with new regulations and stakeholders’ expectations.
There has been an increasing focus from stakeholders and regulators related to ESG matters across all industries in recent years. ESG standard setting and stakeholder expectations continue to evolve. Criteria used to evaluate ESG practices and metrics often change rapidly and unexpectedly, which could result in uncertain expectations for public companies and may cause us to undertake costly initiatives to satisfy any new requirements, to the extent we are able and to the extent appropriate. Some investors may use ESG criteria to guide their investment strategies and, in some cases, may choose not to invest in us if they believe our policies relating to corporate responsibility do not align with their ESG criteria. In addition, different stakeholder groups have divergent views on ESG matters, which increases the risk that any action or lack thereof with respect to ESG matters will be perceived negatively by at least some stakeholders and could adversely affect our reputation, business, financial performance, and growth. Further, regulators across many jurisdictions, including those where we operate, continue to enact new or changed ESG-related regulations. Non-compliance with such regulations or a failure to address stakeholder and societal expectations may result in potential cost increases, litigation, fines, penalties, production and sales restrictions, brand or reputational damage, loss of customers, failure to retain and attract talent, lower valuation and increased investor activism.
27
We may, from time to time, communicate certain initiatives, targets, and goals regarding environmental matters, diversity, responsible sourcing and social investments and other ESG matters. These initiatives, targets, and goals could be difficult and expensive to implement, and we could be criticized for the accuracy, adequacy, or completeness of the disclosure thereof. Further, statements about our ESG initiatives, targets, and goals, and progress against those targets and goals, may be based on standards, both internal and external, for measuring progress that are still developing, as well as assumptions, estimates and climate scenarios that are subject to change in the future. In addition, we could be criticized or subject to litigation for the scope or nature of such initiatives, targets, or goals, or for any revisions to such targets or goals. If our ESG-related data, processes, and reporting are incomplete or inaccurate, or if we fail, or are perceived to fail, to achieve progress with respect to our ESG targets or goals on a timely basis, or at all, our reputation, business, financial performance, and growth could be adversely affected.
We, along with our customers and vendors, face uncertainty in the public and private credit markets and in general economic conditions in the United States and around the world.
In recent years there has been at times disruption and general slowdown of the public and private capital and credit markets in the United States and around the world. Such conditions can adversely affect our revenue, results of operations and overall financial growth. Additionally, many lenders and institutional investors, at times, have reduced funding to borrowers. A constriction on future lending by banks or investors could result in higher interest rates on future debt obligations, restrict our ability to obtain sufficient financing to meet our long-term operational and capital needs or limit our ability in the future to consummate strategic acquisitions. These factors could also negatively impact the ability of our customers and suppliers to finance their operations which, in turn, could result in a decline in our sales and in our ability to obtain necessary raw materials and components, thus potentially having an adverse effect on our business, financial condition, cash flows or results of operations.
Geopolitical unrest and armed conflicts may cause economic conditions in the United States or abroad to deteriorate and exacerbate certain risks we face.
The current conflicts in the Middle East and Russia/Ukraine have created substantial uncertainty in the global political and economic landscapes. While our manufacturing operations are all within North America and we have no operations in the Middle East, Russia or Ukraine, we continue to monitor and respond to any adverse impact that such events may have on the global economy in general, on our business and operations and on the businesses and operations of our suppliers and customers. For example, while we have no direct exposure to customers and vendors in Russia or Ukraine, we currently have and have had supplier relationships within Israel. While we do not currently expect a material adverse impact on our business or financial results, we are unable to fully predict the impact that current and future governmental actions and other events will have on the global economy, our industry or our business, financial condition, results of operations or cash flows. For example, these and similar conflicts have resulted in, and may in the future result in, increased inflation, escalating energy and commodity prices and constrained availability, and thus increasing costs, of raw materials and freight. Such conflicts and related events may also have the effect of heightening many of the other risks described in this annual report, such as those relating to our supply chain, volatility in prices of raw materials, scrap and other inputs, cybersecurity, demand for our products and market conditions, any of which could negatively affect our business, financial condition, results of operations or cash flows.
Changes in trade policies, including the imposition of tariffs, could negatively impact our business, financial condition and results of operations.
We procure certain of the raw materials we use in the manufacturing of our products directly or indirectly from outside of the United States. The United States has implemented certain tariffs on steel and aluminum imported into the country. In October 2023, certain industry groups within the United States petitioned the U.S. government to impose additional tariffs on the importation of aluminum. The imposition and continuation of tariffs and other potential changes in U.S. trade policy could increase the cost and/or limit the availability of raw materials, which could hurt our competitive position and adversely impact our business, financial condition and results of operations.
Risks Relating to Our Indebtedness
Our indebtedness could materially adversely affect our financial condition.
As of September 30, 2023, our total indebtedness was $594.0 million under our first lien credit facility, or the 2022 Term Loan Agreement, and, as described below, we may incur more debt. Our indebtedness could have important consequences to the holders of our Class A common stock, including the following:
28
In addition, the credit agreements that govern the Senior Secured Credit Facilities contain restrictive covenants that limit our ability to engage in activities that may be in our long-term best interest. Our failure to comply with those covenants could result in an event of default which, if not cured or waived, could result in the acceleration of all our debt.
The 2022 Term Loan Agreement will mature on April 28, 2029, and the Revolving Credit Facility will mature on March 31, 2026. We may need to refinance all or a portion of our indebtedness on or before the maturity thereof. We may not be able to obtain such financing on commercially reasonable terms or at all. Failure to refinance our indebtedness could have a material adverse effect on us.
We may not be able to generate sufficient cash to service all of our indebtedness and may be forced to take other actions to satisfy our obligations under our indebtedness, which may not be successful.
Our ability to make scheduled payments on or refinance our debt obligations depends on our financial condition and operating performance, which are subject to prevailing economic and competitive conditions and to financial, business, legislative, regulatory and other factors, some of which are beyond our control. We cannot be sure that our business will generate sufficient cash flows from operating activities, or that future borrowings will be available, to permit us to pay the principal, premium, if any, and interest on our indebtedness.
If our cash flows and capital resources are insufficient to fund our debt service obligations, we could face substantial liquidity problems and could be forced to reduce or delay investments and capital expenditures or to dispose of material assets or operations, seek additional debt or equity capital or restructure or refinance our indebtedness. We may not be able to effect any such alternative measures, if necessary, on commercially reasonable terms or at all and, even if successful, those alternative actions may not allow us to meet our scheduled debt service obligations. The credit agreements that govern the Senior Secured Credit Facilities restrict our ability to dispose of assets and use the proceeds from those dispositions and may also restrict our ability to raise debt or equity capital to be used to repay other indebtedness when it becomes due. We may not be able to consummate those dispositions or to obtain proceeds in an amount sufficient to meet any debt service obligations then due.
Our inability to generate sufficient cash flows to satisfy our debt obligations, or to refinance our indebtedness on commercially reasonable terms or at all, would have a material adverse effect on our financial condition and results of operations.
If we cannot make scheduled payments on our debt, we will be in default, and the lenders under the Senior Secured Credit Facilities could accelerate the debt, terminate their commitments to loan money, and/or foreclose against the assets securing their borrowings, and we could be forced into bankruptcy or liquidation.
We and our subsidiaries may be able to incur substantially more debt. This could further exacerbate the risks to our financial condition described herein.
We and our subsidiaries may be able to incur significant additional indebtedness in the future. Although the credit agreements that govern the Senior Secured Credit Facilities contain restrictions on the incurrence of additional indebtedness, these restrictions are subject to a number of qualifications and exceptions, and the additional indebtedness incurred in compliance with these restrictions could be substantial. These restrictions also will not prevent us from incurring obligations that do not constitute indebtedness. As of September 30, 2023, we had commitments available for borrowing under the Revolving Credit Facility of up to $150.0 million.
29
We also have the option to increase the commitments under the Revolving Credit Facility by up to $100.0 million, subject to certain conditions.
Because our borrowing capacity under the Revolving Credit Facility depends, in part, on inventory, accounts receivable and other assets that fluctuate from time to time, the amount of commitments may not reflect actual borrowing capacity. In addition, we also have the option to incur incremental term loans under the 2022 Term Loan Agreement in an amount that shall not exceed the sum of (i) the Fixed Incremental Amount, as defined in the 2022 Term Loan Agreement, and (ii) the Ratio Amount, as defined in the 2022 Term Loan Agreement, subject to certain other limitations and conditions set forth in the 2022 Term Loan Agreement. All of those borrowings would be secured by first-priority liens on our property.
The terms of the credit agreements that govern the Senior Secured Credit Facilities may restrict our current and future operations, including our ability to respond to changes or to take certain actions.
The credit agreements that govern the Senior Secured Credit Facilities contain a number of restrictive covenants that impose significant operating and financial restrictions on us and may limit our ability to engage in acts that may be in our long-term best interest. See “Management’s Discussion and Analysis of Financial Condition and Results of Operations—Indebtedness.” The restrictive covenants under the Senior Secured Credit Facilities include restrictions on our ability to:
As a result of these restrictions, we may be:
A breach of the covenants or restrictions under the credit agreements that govern the Senior Secured Credit Facilities could result in a default or an event of default. Such a default may allow the creditors to accelerate the related debt and may result in the acceleration of any other debt to which a cross-acceleration or cross-default provision applies. In addition, an event of default under the Senior Secured Credit Facilities would permit the lenders under the Revolving Credit Facility to terminate all commitments to extend further credit under such facility. Furthermore, if we were unable to repay the amounts due and payable under the Senior Secured Credit Facilities, those lenders under each facility could proceed against the collateral granted to them to secure that indebtedness. In the event our lenders were to accelerate the repayment of our indebtedness, we and our subsidiaries may not have sufficient assets to repay that indebtedness. In exacerbated or prolonged circumstances, one or more of these events could result in our bankruptcy or liquidation.
30
We rely on available borrowings under the Revolving Credit Facility for cash to operate our business, and the availability of credit under the Revolving Credit Facility may be subject to significant fluctuation.
In addition to cash we generate from our business, our principal existing source of cash is borrowings available under the Revolving Credit Facility. As of September 30, 2023, we had commitments available to be borrowed under the Revolving Credit Facility of up to $150.0 million. We also have the option to increase the commitments under the Revolving Credit Facility by up to $100.0 million, subject to certain conditions. There are limitations on our ability to incur the full $150.0 million of existing commitments under the Revolving Credit Facility. Availability will be limited to the lesser of a borrowing base and $150.0 million. The borrowing base is calculated on a monthly (or more frequent under certain circumstances) valuation of our inventory, accounts receivable and certain cash balances. As a result, our access to credit under the Revolving Credit Facility is potentially subject to significant fluctuation, depending on the value of the borrowing base-eligible assets as of any measurement date. Any inability to borrow under the Revolving Credit Facility may adversely affect our liquidity, financial position and results of operations.
Our variable rate indebtedness subjects us to interest rate risk, which could cause our debt service obligations to increase significantly.
Borrowings under the Senior Secured Credit Facilities are at variable rates of interest and expose us to interest rate risk. If interest rates were to increase, our debt service obligations on the variable rate indebtedness would increase even though the amount borrowed remained the same, and our net income and cash flows, including cash available for servicing our indebtedness, will correspondingly decrease. For example, the Board of Governors of the Federal Reserve System increased interest rates multiple times in 2022 and 2023 in response to concerns about inflation, and it may raise interest rates again in the future. Based on amounts outstanding as of September 30, 2023, unhedged, each 100 basis point change in interest rates would result in a $2.9 million change in annual interest expense on our indebtedness under the Senior Secured Credit Facilities. We have and may continue to enter into agreements such as floating for fixed-rate interest rate swaps and or other hedging contracts in order to hedge against interest rate volatility associated with our Senior Secured Credit Facilities. For example, we have entered into $300 million of interest rate swaps against our 2022 Term Loan Agreement, which was accruing interest at a rate based on SOFR, for fixed rates. However, we may not enter into additional interest rate swaps in the future and, even if we do enter into additional interest rate swaps, we may not maintain interest rate swaps with respect to all of our variable rate indebtedness. Moreover, any swaps or other instruments we have entered into or may enter into may not fully mitigate our interest rate risk. In addition, these agreements expose us to the risk that other parties to the agreements will not perform or that the agreements will be unenforceable.
Risks Relating to Ownership of Our Class A Common Stock
The market price of our Class A common stock may be volatile or may decline steeply or suddenly regardless of our operating performance, and we may not be able to meet investor or analyst expectations. You may not be able to resell your shares at or above the price you paid and may lose all or part of your investment.
If you purchase shares of Class A common stock, you may not be able to resell those shares at or above the price you paid. The market price of our Class A common stock may fluctuate or decline significantly in response to numerous factors, many of which are beyond our control, including:
31
In addition, extreme price and volume fluctuations in the stock markets have affected and continue to affect the stock prices of many companies. Often, their stock prices have fluctuated in ways unrelated or disproportionate to their operating performance. In the past, stockholders have filed securities class action litigation against companies following periods of market volatility. Such securities litigation, if instituted against us, could subject us to substantial costs, divert resources and the attention of management from our business and seriously harm our business.
Provisions in our certificate of incorporation and bylaws, could make a merger, tender offer or proxy contest difficult, thereby depressing the trading price of our Class A common stock.
Our certificate of incorporation and bylaws contain provisions that could depress the trading price of our Class A common stock by acting to discourage, delay or prevent a change of control of our company or changes in our management that our stockholders may deem advantageous. In particular, our certificate of incorporation and bylaws:
Any provision of our certificate of incorporation, our bylaws or Delaware law that has the effect of delaying or deterring a change in control could limit the opportunity for our stockholders to receive a premium for their shares of Class A common stock and could also affect the price that some investors are willing to pay for our Class A common stock.
32
We are a holding company and rely on dividends, distributions, and other payments, advances and transfers of funds from our subsidiaries to meet our obligations.
We are a holding company that does not conduct any business operations of our own. As a result, we are largely dependent upon cash distributions and other transfers from our direct and indirect subsidiaries to meet our obligations. The agreements governing the indebtedness of our subsidiaries impose restrictions on our subsidiaries’ ability to pay dividends or other distributions to us. See “Management’s Discussion and Analysis of Financial Condition and Results of Operations—Liquidity and Capital Resources—Liquidity Outlook—Holding Company Status.” Each of our subsidiaries is a distinct legal entity, and under certain circumstances legal and contractual restrictions may limit our ability to obtain cash from them and we may be limited in our ability to cause any future joint ventures to distribute their earnings to us. The deterioration of the earnings from, or other available assets of, our subsidiaries for any reason could impair their ability to make distributions to us.
We cannot guarantee that our share repurchase program will be fully implemented or that it will enhance long-term stockholder value.
In May 2022, our Board of Directors approved a share repurchase program authorizing the repurchase of up to $400 million of our Class A common stock. The repurchase program does not have an expiration date and we are not obligated to repurchase a specified number or dollar value of shares, on any particular timetable or at all. There can be no assurance that we will repurchase stock at favorable prices. The repurchase program may be suspended or terminated at any time and, even if fully implemented, may not enhance long-term stockholder value.
33
Item 1B. Unresolved Staff Comments.
None.
Item 2. Properties.
We own manufacturing properties throughout the United States. We also lease certain properties from third parties. We are headquartered in Chicago, Illinois and operate 14 manufacturing and recycling facilities in the United States. In alignment with our sustainability values, our Chicago corporate office is located in a 2019 LEED-Certified building. Our Residential segment products are produced primarily at our manufacturing facilities in Scranton, Pennsylvania; Wilmington, Ohio; Aliquippa, Pennsylvania; Boise, Idaho; Eagan, Minnesota; Dahlonega, Georgia; Henderson, Nevada and Mays Landing, New Jersey. Our Commercial segment products are produced primarily at our manufacturing facilities in Scranton, Pennsylvania.
The following table provides details of our properties as of September 30, 2023:
|
|
Owned |
|
|
Leased |
|
||
Location |
|
Square Feet |
|
|
Square Feet |
|
||
Scranton, PA |
|
|
617,760 |
|
|
|
316,400 |
|
Wilmington, OH |
|
|
500,000 |
|
|
|
334,422 |
|
Jeffersonville, OH |
|
|
— |
|
|
|
202,567 |
|
Aliquippa, PA |
|
|
134,153 |
|
|
|
62,400 |
|
Ashland, OH |
|
|
— |
|
|
|
171,950 |
|
Eagan, MN |
|
|
— |
|
|
|
92,958 |
|
Hudson, WI |
|
|
— |
|
|
|
20,000 |
|
Sarasota, FL |
|
|
— |
|
|
|
19,250 |
|
Chicago, IL |
|
|
— |
|
|
|
25,722 |
|
Boise, ID |
|
|
— |
|
|
|
355,426 |
|
Dowagiac, MI |
|
|
88,184 |
|
|
|
— |
|
Dahlonega, GA |
|
|
— |
|
|
|
76,684 |
|
Dawsonville, GA |
|
|
— |
|
|
|
57,300 |
|
Cumming, GA |
|
|
— |
|
|
|
82,460 |
|
Henderson, NV |
|
|
— |
|
|
|
55,218 |
|
Comstock Park, MI |
|
|
— |
|
|
|
6,000 |
|
Mays Landing, NJ |
|
|
— |
|
|
|
136,000 |
|
Item 3. Legal Proceedings.
From time to time, we may be involved in litigation relating to claims arising out of our operations and businesses that cover a wide range of matters, including, among others, contract and employment claims, personal injury claims, product liability claims and warranty claims. Currently, there are no claims or proceedings against us that we believe will have a material adverse effect on our business, financial condition, results of operations or cash flows. However, the results of any current or future litigation cannot be predicted with certainty and, regardless of the outcome, we may incur significant costs and experience a diversion of management resources as a result of litigation. For more information, see Note 17 "Commitments and Contingencies" to our Consolidated Financial Statements included elsewhere in this Annual Report.
Item 4. Mine Safety Disclosures.
Not applicable.
34
PART II
Item 5. Market for Registrant’s Common Equity, Related Stockholder Matters and Issuer Purchases of Equity Securities.
Our Class A common stock has been listed on the New York Stock Exchange under the symbol “AZEK” since June 12, 2020. Prior to that date, there was no public market for our Class A common stock. No established public trading market exists for our Class B common stock.
Holders of Record
As of October 31, 2023, there were approximately 16 stockholders of record of our Class A common stock, although we believe there is a significantly larger number of beneficial owners whose shares are held in street name by brokers and other nominees, and one holder of record of our Class B common stock.
Issuer Purchases of Equity Securities
The following table provides information with respect to our purchases of our Class A common stock in the quarter ended September 30, 2023:
Period |
|
Total number |
|
|
Average |
|
|
Total number of shares |
|
|
Maximum approximate |
|
||||
July 1, 2023 - July 31, 2023 |
|
|
— |
|
|
$ |
— |
|
|
|
— |
|
|
$ |
262,548,740 |
|
August 1, 2023 - August 31, |
|
|
1,086,545 |
|
|
|
32.54 |
|
|
|
1,086,545 |
|
|
|
227,188,253 |
|
September 1, 2023 - |
|
|
765,801 |
|
|
|
32.97 |
|
|
|
765,801 |
|
|
|
201,938,443 |
|
Total |
|
|
1,852,346 |
|
|
$ |
32.72 |
|
|
|
1,852,346 |
|
|
|
|
|
See Note 12 in the Notes to Consolidated Financial Statements for additional information on Share Repurchase Program.
Dividends
We did not pay any dividends on our common stock during the years ended September 30, 2023 and 2022. We currently intend to retain earnings to finance the growth and development of our business, and we do not expect to pay any cash dividends on our common stock in the foreseeable future. Payment of future dividends, if any, will be at the discretion of our board of directors and will depend on, among other things, our financial condition, results of operations, capital expenditure requirements, contractual restrictions, provisions of applicable law and other factors that our board of directors deems relevant.
Performance Graph
35
The following graph compares the cumulative total return on our Class A common stock since it began trading on the New York Stock Exchange on June 12, 2020 with the cumulative total return of the Russell 3000 Index and the S&P Composite 1500 Building Products Index. The graph assumes, in each case, an initial investment of $100 on June 12, 2020, based on the market price at the end of each month through and including September 30, 2023, and that all dividends paid by companies included in these indices have been reinvested. We did not pay any dividends during the period reflected in the graph.
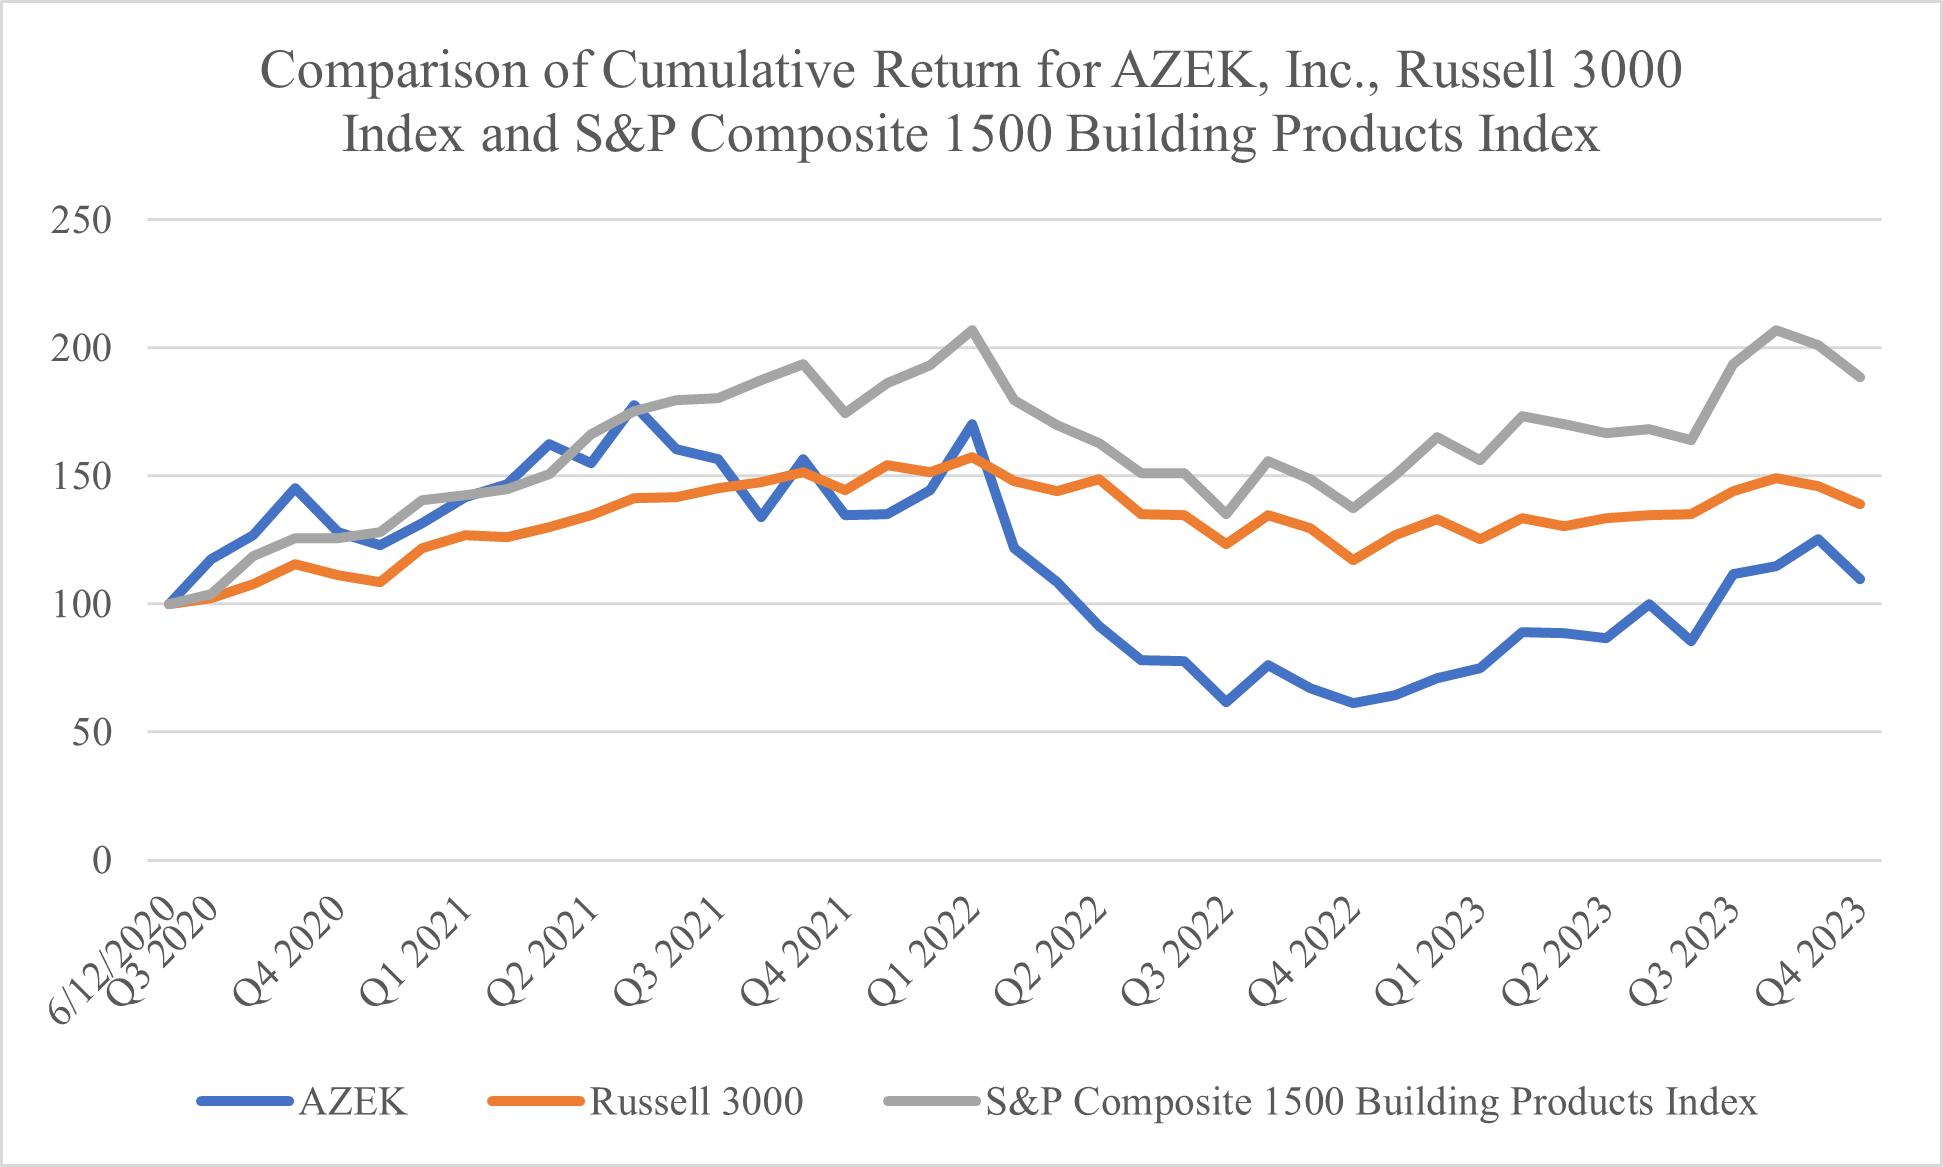
|
|
June 12, |
|
|
June 30, |
|
|
September 30, |
|
|
December 31, |
|
|
March 31, |
|
|
June 30, |
|
|
September 30, |
|
|
December 31, |
|
|
March 31, |
|
|
June 30, |
|
|
September 30, |
|
|
December 31, |
|
|
March 31, |
|
|
June 30, |
|
|
September 30, |
|
|||||||||||||||
The AZEK |
|
$ |
100.00 |
|
|
$ |
117.35 |
|
|
$ |
128.21 |
|
|
$ |
141.62 |
|
|
$ |
154.88 |
|
|
$ |
156.39 |
|
|
$ |
134.55 |
|
|
$ |
170.31 |
|
|
$ |
91.49 |
|
|
$ |
61.66 |
|
|
$ |
61.22 |
|
|
$ |
74.84 |
|
|
$ |
86.70 |
|
|
$ |
111.57 |
|
|
$ |
109.54 |
|
Russell 3000 Index |
|
|
100.00 |
|
|
|
102.16 |
|
|
|
111.12 |
|
|
|
126.95 |
|
|
|
134.54 |
|
|
|
145.15 |
|
|
|
144.53 |
|
|
|
157.43 |
|
|
|
148.60 |
|
|
|
123.28 |
|
|
|
117.31 |
|
|
|
125.19 |
|
|
|
133.61 |
|
|
|
144.24 |
|
|
|
139.02 |
|
S&P Composite |
|
|
100.00 |
|
|
|
103.85 |
|
|
|
125.90 |
|
|
|
142.65 |
|
|
|
166.16 |
|
|
|
180.29 |
|
|
|
174.68 |
|
|
|
206.96 |
|
|
|
162.81 |
|
|
|
135.22 |
|
|
|
137.47 |
|
|
|
156.10 |
|
|
|
166.89 |
|
|
|
193.49 |
|
|
|
188.68 |
|
The comparisons shown in the graph above are based on historical data, and are not indicative of, and are not intended to forecast, the potential future performance of our Class A common stock. The performance graph and other information furnished under this Part II Item 5 of this Annual Report shall not be deemed “soliciting material” or to be “filed” with the SEC or subject to Regulation 14A or 14C, or to the liabilities of Section 18 of the Exchange Act or otherwise subject to the liabilities under that Section, and shall not be deemed to be incorporated by reference into any filing of The AZEK Company Inc. under the Securities Act or the Exchange Act, whether made before or after the date hereof and irrespective of any general incorporation language in any such filing, unless we specifically incorporate it by reference into such filing.
Item 6. [Reserved]
36
Item 7. Management’s Discussion and Analysis of Financial Condition and Results of Operations.
The following discussion and analysis of our financial condition and results of operations should be read in conjunction with other sections of this Annual Report, including “Item 1. Business,” and our audited Consolidated Financial Statements and related Notes for the three years ended September 30, 2023, 2022 and 2021, included elsewhere in this Annual Report.
Forward-Looking Statements
This Annual Report contains forward-looking statements. All statements other than statements of historical facts contained in this Annual Report, including statements regarding future operations are forward-looking statements. In some cases, forward looking statements may be identified by words such as “believe,” “may,” “will,” “estimate,” “continue,” “anticipate,” “intend,” “could,” “would,” “expect,” “objective,” “plan,” “potential,” “seek,” “grow,” “target,” “if,” or the negative of these terms and similar expressions intended to identify forward-looking statements. In particular, statements about potential new products and product innovation, statements regarding the potential impact of climate change and extreme weather events, global health pandemics or geopolitical conflicts, such as the conflict between Russia and Ukraine and the conflict in the Middle East, statements about the markets in which we operate and the economy more generally, including inflation and interest rates, growth of our various markets and growth in the use of engineered products as well as our ability to share in such growth, statements about our ability to source our raw materials in line with our expectations, future pricing for our products or our raw materials and our ability to successfully manage market and interest rate risks and control or reduce costs, statements with respect to our ability to meet future goals and targets, including our environmental, social and governance targets, statements about potential share repurchases, and our expectations, beliefs, plans, strategies, objectives, prospects, assumptions or future events or performance contained in the Annual Report are forward-looking statements. We have based these forward-looking statements primarily on our current expectations and projections about future events and trends that we believe may affect our financial condition, results of operations, business strategy, short-term and long-term business operations and objectives and financial needs. These forward-looking statements are subject to a number of risks, uncertainties and assumptions, including those described in the section titled “Risk Factors” set forth in Part I, Item 1A of this Annual Report and in our other SEC filings. Moreover, we operate in a very competitive and rapidly changing environment. New risks emerge from time to time. It is not possible for our management to predict all risks, nor can we assess the impact of all factors on our business or the extent to which any factor, or combination of factors, may cause actual results to differ materially from those contained in any forward-looking statements we may make. In light of these risks, uncertainties and assumptions, the future events and trends discussed in this Annual Report may not occur and actual results may differ materially and adversely from those anticipated or implied in the forward-looking statements. You should read this Annual Report with the understanding that our actual future results, levels of activity, performance and events and circumstances may be materially different from what we expect. In addition, statements that “we believe” and similar statements reflect our beliefs and opinions on the relevant subject. These statements are based on information available to us as of the date of this Annual Report. While we believe that such information provides a reasonable basis for these statements, such information may be limited or incomplete. Our statements should not be read to indicate that we have conducted an exhaustive inquiry into, or review of, all relevant information. These statements are inherently uncertain, and investors are cautioned not to unduly rely on these statements.
Overview
We are an industry-leading designer and manufacturer of beautiful, low-maintenance and environmentally sustainable outdoor living products, including TimberTech decking, Versatex and AZEK Trim, and StruXure pergolas. Homeowners continue to invest in their homes and outdoor spaces and we believe are increasingly recognizing the significant advantages of engineered, long-lasting products, which convert demand away from traditional materials, particularly wood. Our products transform those outdoor spaces by combining highly appealing aesthetics with significantly lower maintenance costs compared to traditional materials. Our innovative portfolio of Outdoor Living products, including decking, railing, trim, siding, cladding, pergolas and cabanas and accessories, inspires consumers to design outdoor spaces tailored to their unique lifestyle needs. In addition to our leading suite of Outdoor Living products, we sell a broad range of highly engineered products that are sold in commercial markets, including partitions, lockers and storage solutions. One of our core values is to “always do the right thing”. In furtherance of that value, we are focused on sustainability across our operations and have adopted strategies to enable us to meet the growing demand for environmentally-friendly products.
We report our results in two segments: Residential and Commercial. In our Residential segment, our primary consumer brands, TimberTech and AZEK, are recognized by contractors and consumers for their premium aesthetics, uncompromising quality and performance, and diversity of style and design options. Prior to our divestiture of our Vycom business on November 1, 2023, our Commercial segment manufactured engineered sheet products and high-quality bathroom partitions and lockers. Following the divestiture of our Vycom business, our Commercial segment will continue to manufacture high-quality bathroom partitions and lockers. Over our history we have developed a reputation as a leading innovator in our markets by leveraging our differentiated manufacturing capabilities, material science expertise and product management proficiency to consistently introduce new products into the market.
37
This long-standing commitment has been critical to our ability to stay at the forefront of evolving industry trends and consumer demands, which in turn has allowed us to become a market leader across our core product categories.
Basis of Presentation
Our Consolidated Financial Statements in this Annual Report have been derived from our accounts and those of our wholly-owned subsidiaries. Our Consolidated Financial Statements are based on a fiscal year ending September 30.
In December 2021, we acquired StruXure Outdoor, LLC, and in August 2022, we acquired INTEX Millwork Solutions, LLC. The assets acquired and liabilities assumed in connection with these acquisitions were included in our consolidated balance sheet as of September 30, 2022 and in our consolidated statement of comprehensive income and statement of cash flow beginning from the effective date of the acquisition in December 2021 and August 2022, respectively. The results of operations of StruXure and INTEX are included in our Residential segment.
Secondary Offerings
On January 26, 2021, we completed an offering of 23,000,000 shares of Class A common stock, par value $0.001 per share, including the exercise in full by the underwriters of their option to purchase up to 3,000,000 additional shares of Class A common stock, at a public offering price of $40.00 per share. The shares were sold by certain of the Selling Stockholders. We did not receive any of the proceeds from the sale of the shares by those Selling Stockholders. In connection with the offering we incurred approximately $1.2 million in expenses.
On June 1, 2021, we completed an offering of 17,250,000 shares of Class A common stock, par value $0.001 per share, including the exercise in full by the underwriters of their option to purchase up to 2,250,000 additional shares of Class A common stock, at a public offering price of $43.50 per share. The shares were sold by certain of the Selling Stockholders. We did not receive any of the proceeds from the sale of the shares by those Selling Stockholders. In connection with the offering we incurred approximately $1.1 million in expenses.
During the three months ended June 30, 2023, we completed an offering of 16,100,000 shares of Class A common stock, par value $0.001 per share, including the exercise in full by the underwriter of its option to purchase up to 2,100,000 additional shares of Class A common stock. All of the shares were sold by certain of the Selling Stockholders to the underwriter at a price of $24.36 per share which the underwriter was then permitted to sell at variable prices to the public. We did not receive any of the proceeds from the sale of the shares by those Selling Stockholders. In connection with the offering, we incurred approximately $1.1 million in expenses. In connection with the secondary offering, we purchased from the underwriter 1,477,832 shares of its Class A common stock that were sold by the Selling Stockholders to the underwriter at a price per share of $24.36, which is equal to the price paid by the underwriter to the Selling Stockholders, representing an aggregate purchase price of approximately $36.0 million. The repurchase was made pursuant to our share repurchase program.
Key Factors Affecting Our Results of Operations
Our results of operations and financial condition are affected by the following factors, which reflect our operating philosophy and continued focus on driving material conversion to our low-maintenance, engineered products in each of our markets.
Volume of Products Sold
Our net sales depend primarily on the volume of products we sell during any given period, and volume is affected by the following items:
38
Pricing
In general, our pricing strategy is to price our products at a premium relative to competing materials based on the value proposition they provide, including lower maintenance and lifetime costs. Our pricing strategy differs between our two operating segments as follows:
Cost of Materials
Raw material costs, including costs of petrochemical resins, reclaimed polyethylene and PVC material, waste wood fiber and aluminum, represent a majority of our cost of sales. The cost of petrochemical resins used in our manufacturing processes has historically varied significantly and has been affected by changes in supply and demand and in the price of crude oil. In addition, the price of reclaimed polyethylene material, waste wood fiber, aluminum, other additives (including modifiers, TiO2 and pigments) and other raw materials fluctuates depending on, among other things, overall market supply and demand and general business conditions. We have long-standing relationships as well as guaranteed supply contracts with some of our key suppliers but, other than certain contracts with prices determined based on the current index price, we have no fixed-price contracts with any of our major vendors. Under our guaranteed supply contracts, the prices are either established annually based on a discount to the then-current market prices or, for purchase orders, based on market rates in effect when the orders become effective. Prices for spot market purchases are negotiated on a continuous basis in line with the market at the time. During fiscal year 2022, we experienced significant increases in the cost of our raw materials due to factors such as global and domestic supply chain disruptions, extreme weather events, the conflict in Ukraine, elevated inflation levels and the ongoing direct and indirect effects of global health pandemics. While raw material prices have declined during fiscal year 2023 as compared to fiscal year 2022, and even though we seek to mitigate the effects of increases in raw material costs by broadening our supplier base, increasing our use of recycled material and scrap, reducing waste and exploring options for material substitution without sacrificing quality, raw material prices and shortages of raw materials similar to what we experienced in fiscal year 2022 may reemerge from time to time.
39
We have not entered into hedges with respect to our raw material costs at this time, but we may choose to enter into such hedges in the future.
Product Mix
We offer a wide variety of products across numerous product lines within our Residential and Commercial segments, and these products are sold at different prices, are composed of different materials and involve varying levels of manufacturing complexity. In any particular period, changes in the volume of particular products sold and the prices of those products relative to other products will impact our average selling price and our cost of sales. For example, the gross margins of our Residential segment have historically exceed the gross margins of our Commercial segment. In addition to the impacts attributable to product mix as between the Residential and Commercial segments, our results of operations are impacted by the different margins associated with individual products. As we continue to introduce new products at varying price points to compete with products made with wood or other traditional materials across a wide range of prices, our overall gross margins may vary from period to period as a result of changes in product mix and different margins for our higher and lower price point offerings. We may choose to introduce new products with initially lower gross margins with the expectation that those margins will improve over time as we improve our manufacturing efficiency for those products. In addition, our product mix and our gross margins may be impacted by our marketing decisions in a particular period as well as the rebates and incentives that we may extend to our customers in a particular period. We also continue to seek to enhance our gross margins by improving manufacturing efficiency across our operations, including by investing in, and expanding, our recycling capabilities and implementing initiatives to more efficiently use scrap and to reduce waste. Our success in achieving margin improvements through these initiatives may vary due to changes in product mix as different products benefit to different degrees from these initiatives.
Seasonality
Although we generally have demand for our products throughout the year, our sales have historically experienced some seasonality. We have typically experienced moderately higher levels of sales of our residential products in the second fiscal quarter of the year as a result of our “early buy” sales and extended payment terms typically available during the second fiscal quarter of the year. As a result of these extended payment terms, our accounts receivable have typically reached seasonal peaks at the end of the second fiscal quarter of the year, and our net cash provided by operating activities has typically been lower in the second fiscal quarter relative to in other quarters. Our sales are also generally impacted by the number of days in a quarter or a year that contractors and other professionals are able to install our products. This can vary dramatically based on, among other things, weather events such as rain, snow and extreme temperatures. We have generally experienced lower levels of sales of our residential products in the first fiscal quarter due to adverse weather conditions in certain markets, which typically reduce the construction and renovation activity during the winter season. In addition, we have experienced higher levels of sales of our bathroom partition products and our locker products during the second half of our fiscal year, which includes the summer months when schools are typically closed and therefore are more likely to undergo remodel activities.
Economic Environment; Global Events
Our business and financial performance may be affected by the macroeconomic environment, including increased inflation and rising interest rates. For example, while inflationary pressures moderated throughout fiscal year 2023, we continued to be impacted by high raw material costs. Additionally, rising interest rates and elevated inflation levels may negatively impact the ability of consumers to purchase our products. Our business, financial condition and results of operations could be adversely affected if we are not able to pass any associated costs on to our customers or otherwise mitigate the impact of these pressures on us or our consumers.
During the first quarter of fiscal 2023, our Residential channel partners met demand partially through inventory drawdowns causing us to experience a recalibration of channel inventory and negatively impacting sales for the period. Our Commercial channel partners underwent a similar inventory drawdown during the third and fourth quarters of fiscal 2023. We believe the recalibration in our Residential segment is complete and will better position us and our channel partners to drive continued expansion of our market position. The recalibration in our Commercial segment channel inventory was primarily with respect to products sold by our Vycom business, which we divested on November 1, 2023.
Other global events may also affect our business and financial performance, including the direct and indirect adverse effects from global health pandemics and geopolitical conflicts. Supply chains continue to recover from global disruptions experienced over the last few years. The current conflicts between Russia and Ukraine and in the Middle East also continue to create substantial uncertainty in the global political and economic landscapes. While our manufacturing operations are all within North America and we have no operations in the Middle East, Russia or Ukraine, and we do not have direct exposure to customers and vendors in Russia and Ukraine, we have had supplier relationships within Israel. We do not currently expect a material adverse impact on our business as a result of these conflicts, but these conflicts remain fluid and additional conflicts may emerge, and our business may be impacted by further disruptions to global supply chains generally and our supply chain in particular, as well as increases to commodity and fuel prices, and, in turn, prices of our raw materials.
40
These conflicts could also lead to an increased threat of cyberattacks against U.S. companies. These increased threats could pose risks to the security of our information technology systems, as well as the confidentiality, availability and integrity of our or our customers’ data.
We are unable to fully predict the impact that the above events and conditions will have on the global economy, our industry or our business, financial condition, results of operations or cash flows. Looking ahead, we will continue proactively adjusting our operating plans, capital expenditures and expenses as necessary and appropriate and executing on our long-term strategy.
Acquisitions and Divestitures
Throughout our history, we have made select acquisitions, and we expect to continue to strategically pursue acquisitions to enhance our market position, supplement our product and technology portfolios and increase the diversity of our business. While we select acquisition targets that we think will eventually allow us to maintain or increase our gross and operating margins, acquisitions are often dilutive to margins initially and as we integrate the acquired companies into our overall business.
On December 29, 2021, we acquired StruXure Outdoor, LLC, a Georgia limited liability company, or StruXure, for a total purchase price of approximately $84.1 million, subject to customary post-closing working capital adjustments. StruXure is located in Dahlonega, Georgia and manufactures customizable outdoor pergolas and cabanas. We funded the acquisition with cash on hand.
On August 1, 2022, we acquired INTEX Millwork Solutions, LLC, a New Jersey LLC, or INTEX, for a total purchase price of approximately $25.9 million, subject to customary post-closing working capital adjustments. INTEX is located in Mays Landing, New Jersey and manufactures high-quality railing solutions, column wraps, and pergolas. We funded the acquisition with cash on hand.
We have also recently divested our Vycom business and may divest other portions of our business to the extent we deem advantageous. Strategic divestitures can allow us to focus on the highest value portions of our business and provide additional cash to finance our capital allocation priorities, but divestitures also can be time consuming and distracting for management and disruptive to our employees.
On November 1, 2023, we sold our Vycom business for a total sale price of $140.0 million.
Results of Operations
The following tables summarize certain financial information relating to our operating results that have been derived from our audited Consolidated Financial Statements for the years ended September 30, 2023, 2022 and 2021.
|
|
Years Ended September 30, |
|
|
2023 – 2022 Variance |
|
|
2022 – 2021 Variance |
|
|||||||||||||||||||
(U.S. dollars in thousands) |
|
2023 |
|
|
2022 |
|
|
2021 |
|
|
$ Variance |
|
|
% Variance |
|
|
$ Variance |
|
|
% Variance |
|
|||||||
Net sales |
|
$ |
1,370,316 |
|
|
$ |
1,355,586 |
|
|
$ |
1,178,974 |
|
|
$ |
14,730 |
|
|
|
1.1 |
% |
|
$ |
176,612 |
|
|
|
15.0 |
% |
Cost of sales |
|
|
932,663 |
|
|
|
946,266 |
|
|
|
789,023 |
|
|
|
(13,603 |
) |
|
|
(1.4 |
)% |
|
|
157,243 |
|
|
|
19.9 |
% |
Gross profit |
|
|
437,653 |
|
|
|
409,320 |
|
|
|
389,951 |
|
|
|
28,333 |
|
|
|
6.9 |
% |
|
|
19,369 |
|
|
|
5.0 |
% |
Selling, general and |
|
|
305,162 |
|
|
|
279,889 |
|
|
|
244,205 |
|
|
|
25,273 |
|
|
|
9.0 |
% |
|
|
35,684 |
|
|
|
14.6 |
% |
Other general expenses |
|
|
1,065 |
|
|
|
— |
|
|
|
2,592 |
|
|
|
1,065 |
|
|
N/M% |
|
|
|
(2,592 |
) |
|
|
(100.0 |
)% |
|
Loss on disposal of property, |
|
|
249 |
|
|
|
496 |
|
|
|
1,025 |
|
|
|
(247 |
) |
|
|
(49.8 |
)% |
|
|
(529 |
) |
|
|
(51.6 |
)% |
Operating income |
|
|
131,177 |
|
|
|
128,935 |
|
|
|
142,129 |
|
|
|
2,242 |
|
|
|
1.7 |
% |
|
|
(13,194 |
) |
|
|
(9.3 |
)% |
Interest expense, net |
|
|
39,293 |
|
|
|
24,956 |
|
|
|
20,311 |
|
|
|
14,337 |
|
|
|
57.4 |
% |
|
|
4,645 |
|
|
|
22.9 |
% |
Income tax expense |
|
|
23,929 |
|
|
|
28,754 |
|
|
|
28,668 |
|
|
|
(4,825 |
) |
|
|
(16.8 |
)% |
|
|
86 |
|
|
|
0.3 |
% |
Net income (loss) |
|
$ |
67,955 |
|
|
$ |
75,225 |
|
|
$ |
93,150 |
|
|
$ |
(7,270 |
) |
|
|
(9.7 |
)% |
|
$ |
(17,925 |
) |
|
|
(19.2 |
)% |
“N/M” indicates the variance as a percentage is not meaningful.
Year Ended September 30, 2023, Compared with Year Ended September 30, 2022
Net Sales
Net sales for the year ended September 30, 2023 increased by $14.7 million, or 1.1%, to $1,370.3 million from $1,355.6 million for the year ended September 30, 2022. The increase was primarily due to positive pricing and a $37.3 million net sales contribution from recent acquisitions, partially offset by an approximately 5.3% decline in volume as a result of the channel inventory reductions in the first part of the fiscal year to better calibrate channel inventory to historical average levels as discussed above.
41
Net sales for the year ended September 30, 2023 increased for our Residential segment by 4.6% and decreased for our Commercial segment by 21.1%, in each case as compared to the prior year. Within our Commercial segment, net sales for the year ended September 30, 2023 decreased for Vycom by 29.4% and decreased for Scranton Products by 9.4% in each case as compared to the prior year.
Cost of Sales
Cost of sales for the year ended September 30, 2023 decreased by $13.6 million, or 1.4%, to $932.7 million from $946.3 million for the year ended September 30, 2022, primarily due to decreased costs on lower sales volumes and lower raw material costs driven by certain commodity deflation, partially offset by underutilization of manufacturing capacity.
Gross Profit
Gross profit for the year ended September 30, 2023 increased by $28.3 million, or 6.9%, to $437.7 million from $409.3 million for the year ended September 30, 2022. Gross margin increased to 31.9% for the year ended September 30, 2023 compared to 30.2% for the year ended September 30, 2022. The increase in gross profit was driven by positive pricing and lower raw material costs.
Selling, General and Administrative Expenses
Selling, general and administrative expenses increased by $25.3 million, or 9.0%, to $305.2 million, or 22.3% of net sales, for the year ended September 30, 2023 from $279.9 million, or 20.6% of net sales, for the year ended September 30, 2022. The increase was primarily attributable to higher employee-related expenses and marketing expenses, partially offset by lower acquisition costs.
Other General Expenses
Other general expenses were $1.1 million during the year ended September 30, 2023, which related to our secondary offering in May 2023.
Interest Expense, net
Interest expense, net, increased by $14.3 million, or 57.4%, to $39.3 million for the year ended September 30, 2023 from $25.0 million for the year ended September 30, 2022. Interest expense increased due to higher interest rate on outstanding debt and a higher average principal balance outstanding during the year ended September 30, 2023, when compared to the year ended September 30, 2022. The higher interest expense was partially offset by refinancing fees related to our 2022 Term Loan in the year ended September 30, 2022 and interest income.
Income Tax Expense
Income tax expense decreased by $4.8 million to $23.9 million for the year ended September 30, 2023 compared to $28.8 million for the year ended September 30, 2022. The decrease in our income tax expense was primarily driven by decreased state tax expense.
Net Income (Loss)
Net income decreased by $7.3 million to $68.0 million for the year ended September 30, 2023 compared to net income of $75.2 million for the year ended September 30, 2022, due to the factors described above.
Year Ended September 30, 2022, Compared with Year Ended September 30, 2021
Net Sales
Net sales for the year ended September 30, 2022 increased by $176.6 million, or 15.0%, to $1,355.6 million from $1,179.0 million for the year ended September 30, 2021. The increase was primarily attributable to higher sales in both our Residential and Commercial segments. Net sales for the year ended September 30, 2022 increased for our Residential segment by 11.9% and increased for our Commercial segment by 38.6%, in each case as compared to the prior year.
Cost of Sales
Cost of sales for the year ended September 30, 2022 increased by $157.2 million, or 19.9%, to $946.3 million from $789.0 million for the year ended September 30, 2021, primarily due to increased costs on higher sales volumes and higher costs of raw materials and manufacturing.
During the fourth quarter of fiscal year 2022, we updated the process by which we estimate the value of our inventory. This included updating the assumptions that are used in determining and treating certain capitalized costs, primarily by incorporating the impacts of changes in the amount of recycled content introduced into our products since our last standard costing revaluation.
42
See Note 11 in the Consolidated Financial Statements for additional information.
Gross Profit
Gross profit for the year ended September 30, 2022 increased by $19.4 million, or 5.0%, to $409.3 million from $390.0 million for the year ended September 30, 2021. Gross margin decreased to 30.2% for the year ended September 30, 2022 compared to 33.1% for the year ended September 30, 2021. The decrease in gross margin was driven by higher costs of materials and manufacturing, partially offset by higher sales.
Selling, General and Administrative Expenses
Selling, general and administrative expenses increased by $35.7 million, or 14.6%, to $279.9 million, or 20.6% of net sales, for the year ended September 30, 2022 from $244.2 million, or 20.7% of net sales, for the year ended September 30, 2021. The increase was primarily attributable to higher employee related expenses and marketing expenses, partially offset by lower stock-based compensation expense.
Other General Expenses
Other general expenses were $2.6 million during the year ended September 30, 2021, which primarily related to our secondary offerings in January and June of 2021.
Interest Expense, net
Interest expense, net, increased by $4.6 million, or 22.9%, to $25.0 million for the year ended September 30, 2022 from $20.3 million for the year ended September 30, 2021. Interest expense increased due to refinancing fees related to our 2022 Term Loan Agreement and higher finance lease interest, partially offset by higher capitalized interest during the year ended September 30, 2022, when compared to the year ended September 30, 2021.
Income Tax Expense
Income tax expense increased by $0.1 million to $28.8 million for the year ended September 30, 2022 compared to $28.7 million for the year ended September 30, 2021. The increase in our income tax expense was primarily driven by additional state tax expense.
Net Income
Net income decreased by $17.9 million to $75.2 million for the year ended September 30, 2022 compared to net loss of $93.2 million for the year ended September 30, 2021, due to the factors described above.
Segment Results of Operations
We report our results in two segments: Residential and Commercial. The key segment measures used by our chief operating decision maker in deciding how to evaluate performance and allocate resources to each of the segments are Segment Adjusted EBITDA and Segment Adjusted EBITDA Margin. Depending on certain circumstances, Segment Adjusted EBITDA and Segment Adjusted EBITDA Margin may be calculated differently, from time to time, than our Adjusted EBITDA and Adjusted EBITDA Margin, which are further discussed under the heading “Selected Consolidated Financial Data—Non-GAAP Financial Measures.” Segment Adjusted EBITDA and Segment Adjusted EBITDA Margin represent measures of segment profit reported to our chief operating decision maker for the purpose of making decisions about allocating resources to a segment and assessing its performance and are determined as disclosed in our Consolidated Financial Statements included elsewhere in this Annual Report consistent with the requirements of the Financial Accounting Standards Board’s, or FASB, Accounting Standards Codification, or ASC, 280. We define Segment Adjusted EBITDA as a segment’s net income (loss) before income tax (benefit) expense and by adding to or subtracting therefrom interest expense, net, depreciation and amortization, stock-based compensation costs, asset impairment and inventory revaluation costs, business transformation costs, capital structure transaction costs, acquisition costs, initial public offering costs and certain other costs. Segment Adjusted EBITDA Margin is equal to a segment’s Segment Adjusted EBITDA divided by such segment’s net sales. Corporate expenses, which include selling, general and administrative costs related to our corporate offices, including payroll and other professional fees, are not included in computing Segment Adjusted EBITDA. Such corporate expenses increased by $7.0 million to $69.6 million for the year ended September 30, 2023 from $62.6 million for the year ended September 30, 2022, and increased by $2.9 million to $62.6 million for the year ended September 30, 2022 from $59.7 million for the year ended September 30, 2021.
43
Residential
The following table summarizes certain financial information relating to the Residential segment results that have been derived from our audited Consolidated Financial Statements for the years ended September 30, 2023, 2022 and 2021.
|
|
Years Ended September 30, |
|
|
2023 – 2022 Variance |
|
|
2022 – 2021 Variance |
|
|||||||||||||||||||
(U.S. dollars in thousands) |
|
2023 |
|
|
2022 |
|
|
2021 |
|
|
$ |
|
|
% |
|
|
$ |
|
|
% |
|
|||||||
Net sales |
|
$ |
1,222,866 |
|
|
$ |
1,168,751 |
|
|
$ |
1,044,126 |
|
|
$ |
54,115 |
|
|
|
4.6 |
% |
|
$ |
124,625 |
|
|
|
11.9 |
% |
Segment Adjusted EBITDA |
|
|
329,853 |
|
|
|
323,377 |
|
|
|
314,563 |
|
|
|
6,476 |
|
|
|
2.0 |
% |
|
|
8,814 |
|
|
|
2.8 |
% |
Segment Adjusted EBITDA Margin |
|
|
27.0 |
% |
|
|
27.7 |
% |
|
|
30.1 |
% |
|
N/A |
|
|
N/A |
|
|
N/A |
|
|
N/A |
|
||||
Net Sales
Net sales of the Residential segment for the year ended September 30, 2023 increased by $54.1 million, or 4.6%, to $1,222.9 million from $1,168.8 million for the year ended September 30, 2022. The increase was attributable to higher net sales related to our Deck, Rail & Accessories and Exteriors businesses. Acquisitions contributed $37.3 million of the increase in net sales for the year ended September 30, 2023.
Net sales of the Residential segment for the year ended September 30, 2022 increased by $124.6 million, or 11.9%, to $1,168.8 million from $1,044.1 million for the year ended September 30, 2021. The increase was attributable to higher net sales related to our Deck, Rail & Accessories and Exteriors businesses. Acquisitions contributed $67.1 million of the increase in net sales for the year ended September 30, 2022.
Segment Adjusted EBITDA
Segment Adjusted EBITDA of the Residential segment for the year ended September 30, 2023 increased by $6.5 million, or 2.0% to $329.9 million from $323.4 million for the year ended September 30, 2022. The increase was mainly driven by positive pricing and lower raw material costs, mostly offset by higher selling, general and administrative expenses and underutilization of manufacturing capacity.
Segment Adjusted EBITDA of the Residential segment for the year ended September 30, 2022 increased by $8.8 million, or 2.8%, to $323.4 million from $314.6 million for the year ended September 30, 2021. The increase was mainly driven by higher sales, increases in pricing and improved manufacturing productivity, mostly offset by higher raw material costs, manufacturing costs and selling, general and administrative expenses.
Commercial
The following table summarizes certain financial information relating to the Commercial segment results that have been derived from our audited Consolidated Financial Statements for the years ended September 30, 2023, 2022 and 2021.
|
|
Years Ended September 30, |
|
|
2023 – 2022 Variance |
|
|
2022 – 2021 Variance |
|
|||||||||||||||||||
(U.S. dollars in thousands) |
|
2023 |
|
|
2022 |
|
|
2021 |
|
|
$ |
|
|
% |
|
|
$ |
|
|
% |
|
|||||||
Net sales |
|
$ |
147,450 |
|
|
$ |
186,835 |
|
|
$ |
134,848 |
|
|
$ |
(39,385 |
) |
|
|
(21.1 |
)% |
|
$ |
51,987 |
|
|
|
38.6 |
% |
Segment Adjusted EBITDA |
|
|
31,008 |
|
|
|
40,255 |
|
|
|
19,323 |
|
|
|
(9,247 |
) |
|
|
(23.0 |
)% |
|
|
20,932 |
|
|
|
108.3 |
% |
Segment Adjusted EBITDA Margin |
|
|
21.0 |
% |
|
|
21.5 |
% |
|
|
14.3 |
% |
|
N/A |
|
|
N/A |
|
|
N/A |
|
|
N/A |
|
||||
Net Sales
Net sales of the Commercial segment for the year ended September 30, 2023 decreased by $39.4 million, or 21.1%, to $147.5 million from $186.8 million for the year ended September 30, 2022. Net sales for the year ended September 30, 2023 decreased for Vycom by 29.4% and decreased for Scranton Products by 9.4% in each case as compared to the prior year. The decrease was attributable to lower net sales in our Vycom and Scranton Products businesses as some of our channel partners met demand partially through inventory drawdowns which negatively impacted net sales.
Net sales of the Commercial segment for the year ended September 30, 2022 increased by $52.0 million, or 38.6%, to $186.8 million from $134.8 million for the year ended September 30, 2021. The increase was primarily attributable to higher net sales in both our Vycom and Scranton Products businesses.
44
Segment Adjusted EBITDA
Segment Adjusted EBITDA of the Commercial segment was $31.0 million for the year ended September 30, 2023, compared to $40.3 million for the year ended September 30, 2022. The decrease was primarily driven by lower net sales and underutilization of manufacturing capacity partially offset by lower material costs.
Segment Adjusted EBITDA of the Commercial segment was $40.3 million for the year ended September 30, 2022 compared to $19.3 million for the year ended September 30, 2021. The increase was driven by higher sales in both the Vycom and Scranton Products businesses.
Non-GAAP Financial Measures
To supplement our Consolidated Financial Statements prepared and presented in accordance with generally accepted accounting principles in the United States, or GAAP, we use certain non-GAAP performance financial measures, as described below, to provide investors with additional useful information about our financial performance, to enhance the overall understanding of our past performance and future prospects and to allow for greater transparency with respect to important metrics used by our management for financial and operational decision-making. We are presenting these non-GAAP financial measures to assist investors in seeing our financial performance from management’s view and because we believe they provide an additional tool for investors to use in comparing our core financial performance over multiple periods with other companies in our industry. Our GAAP financial results include significant expenses that are not indicative of our ongoing operations as detailed in the tables below.
However, non-GAAP financial measures have limitations in their usefulness to investors because they have no standardized meaning prescribed by GAAP and are not prepared under any comprehensive set of accounting rules or principles. In addition, non-GAAP financial measures may be calculated differently from, and therefore may not be directly comparable to, similarly titled measures used by other companies. As a result, non-GAAP financial measures should be viewed as supplementing, and not as an alternative or substitute for, our Consolidated Financial Statements prepared and presented in accordance with GAAP.
|
|
Years Ended September 30, |
|
|||||||||
(U.S. dollars in thousands, except per share amounts) |
|
2023 |
|
|
2022 |
|
|
2021 |
|
|||
GAAP Financial Measures: |
|
|
|
|
|
|
|
|
|
|||
Gross Profit |
|
$ |
437,653 |
|
|
$ |
409,320 |
|
|
$ |
389,951 |
|
Gross Profit Margin |
|
|
31.9 |
% |
|
|
30.2 |
% |
|
|
33.1 |
% |
Net Income |
|
$ |
67,955 |
|
|
$ |
75,225 |
|
|
$ |
93,150 |
|
Net Income Per Common Share - Diluted |
|
$ |
0.45 |
|
|
$ |
0.49 |
|
|
$ |
0.59 |
|
Net Profit Margin |
|
|
5.0 |
% |
|
|
5.5 |
% |
|
|
7.9 |
% |
Net Cash Provided By Operating Activities |
|
$ |
362,542 |
|
|
$ |
105,835 |
|
|
$ |
207,679 |
|
Net Cash Used In Investing Activities |
|
$ |
(88,504 |
) |
|
$ |
(280,176 |
) |
|
$ |
(175,073 |
) |
Net Cash Provided By (Used In) Financing Activities |
|
$ |
(116,541 |
) |
|
$ |
44,622 |
|
|
$ |
2,918 |
|
|
|
Years Ended September 30, |
|
|||||||||
(U.S. dollars in thousands, except per share amounts) |
|
2023 |
|
|
2022 |
|
|
2021 |
|
|||
Non-GAAP Financial Measures: |
|
|
|
|
|
|
|
|
|
|||
Adjusted Gross Profit |
|
$ |
533,597 |
|
|
$ |
512,598 |
|
|
$ |
457,926 |
|
Adjusted Gross Profit Margin |
|
|
38.9 |
% |
|
|
37.8 |
% |
|
|
38.8 |
% |
Adjusted Net Income |
|
$ |
111,733 |
|
|
$ |
149,268 |
|
|
$ |
152,933 |
|
Adjusted Diluted EPS |
|
$ |
0.74 |
|
|
$ |
0.97 |
|
|
$ |
0.98 |
|
Adjusted EBITDA |
|
$ |
291,223 |
|
|
$ |
301,040 |
|
|
$ |
274,187 |
|
Adjusted EBITDA Margin |
|
|
21.3 |
% |
|
|
22.2 |
% |
|
|
23.3 |
% |
Free Cash Flow |
|
$ |
273,997 |
|
|
$ |
(65,103 |
) |
|
$ |
32,560 |
|
Adjusted Gross Profit, Adjusted Gross Profit Margin, Adjusted Net Income, Adjusted Diluted EPS, Adjusted EBITDA and Adjusted EBITDA Margin
We define Adjusted Gross Profit as gross profit before depreciation and amortization, business transformation costs, acquisition costs and certain other costs as described below. Adjusted Gross Profit Margin is equal to Adjusted Gross Profit divided by net sales. We define Adjusted Net Income as net income (loss) before amortization, stock-based compensation costs, business transformation costs, acquisition costs, initial public offering costs, capital structure transaction costs and certain other costs as described below. We define Adjusted Diluted EPS as Adjusted Net Income divided by weighted average common shares outstanding—diluted, to reflect the conversion or exercise, as applicable, of all outstanding shares of restricted stock awards, restricted stock units and options to purchase shares of our common stock.
45
We define Adjusted EBITDA as net income (loss) before interest expense, net, income tax (benefit) expense and depreciation and amortization and by adding to or subtracting therefrom items of expense and income as described below. Adjusted EBITDA Margin is equal to Adjusted EBITDA divided by net sales. We believe Adjusted Gross Profit, Adjusted Gross Profit Margin, Adjusted Net Income, Adjusted Diluted EPS, Adjusted EBITDA and Adjusted EBITDA Margin are useful to investors because they help identify underlying trends in our business that could otherwise be masked by certain expenses that can vary from company to company depending on, among other things, its financing, capital structure and the method by which its assets were acquired, and can also vary significantly from period to period. We also add back depreciation and amortization and stock-based compensation because we do not consider them indicative of our core operating performance. We believe their exclusion facilitates comparisons of our operating performance on a period-to-period basis. Therefore, we believe that showing gross profit and net income, as adjusted to remove the impact of these expenses, is helpful to investors in assessing our gross profit and net income performance in a way that is similar to the way management assesses our performance. Additionally, EBITDA and EBITDA margin are common measures of operating performance in our industry, and we believe they facilitate operating comparisons. Our management also uses Adjusted Gross Profit, Adjusted Gross Profit Margin, Adjusted EBITDA and Adjusted EBITDA Margin in conjunction with other GAAP financial measures for planning purposes, including as a measure of our core operating results and the effectiveness of our business strategy, and in evaluating our financial performance. Management considers Adjusted Gross Profit and Adjusted Net Income and Adjusted Diluted EPS as useful measures because our cost of sales includes the depreciation of property, plant and equipment used in the production of products and the amortization of various intangibles related to our manufacturing processes.
Adjusted Gross Profit, Adjusted Gross Profit Margin, Adjusted Net Income, Adjusted Diluted EPS, Adjusted EBITDA and Adjusted EBITDA Margin have limitations as analytical tools, and you should not consider them in isolation or as a substitute for analysis of our results as reported under GAAP. Some of these limitations are:
Because of these limitations, none of these metrics should be considered indicative of discretionary cash available to us to invest in the growth of our business or as measures of cash that will be available to us to meet our obligations.
In addition, we provide Free Cash Flow, which is a non-GAAP financial measure that we define as net cash provided by (used in) operating activities less purchases of property, plant and equipment. We believe Free Cash Flow is useful to investors as an important liquidity measure of the cash that is available to us after capital expenditures. Free Cash Flow is used by our management as a measure of our ability to generate and use cash, including in order to invest in future growth, fund acquisitions, return capital to our stockholders and repay indebtedness. Our use of Free Cash Flow has limitations as an analytical tool and should not be considered in isolation or as a substitute for an analysis of our results under GAAP. Some of these limitations are:
46
The following table presents reconciliations of the most comparable financial measures calculated in accordance with GAAP to these non-GAAP financial measures for the periods indicated:
Adjusted Gross Profit and Adjusted Gross Profit Margin Reconciliation
|
|
Years Ended September 30, |
|
|||||||||
(U.S. dollars in thousands) |
|
2023 |
|
|
2022 |
|
|
2021 |
|
|||
Gross profit |
|
$ |
437,653 |
|
|
$ |
409,320 |
|
|
$ |
389,951 |
|
Depreciation and amortization (1) |
|
|
95,810 |
|
|
|
82,099 |
|
|
|
67,903 |
|
Inventories (2) |
|
|
— |
|
|
|
19,297 |
|
|
|
— |
|
Acquisition costs (3) |
|
|
— |
|
|
|
1,373 |
|
|
|
— |
|
Other costs (4) |
|
|
134 |
|
|
|
509 |
|
|
|
72 |
|
Adjusted Gross Profit |
|
$ |
533,597 |
|
|
$ |
512,598 |
|
|
$ |
457,926 |
|
|
|
Years Ended September 30, |
|
|||||||||
|
|
2023 |
|
|
2022 |
|
|
2021 |
|
|||
Gross margin |
|
|
31.9 |
% |
|
|
30.2 |
% |
|
|
33.1 |
% |
Amortization |
|
|
7.0 |
% |
|
|
6.1 |
% |
|
|
5.7 |
% |
Inventories |
|
|
0.0 |
% |
|
|
1.4 |
% |
|
|
0.0 |
% |
Acquisition costs |
|
|
0.0 |
% |
|
|
0.1 |
% |
|
|
0.0 |
% |
Other costs |
|
|
0.0 |
% |
|
|
0.0 |
% |
|
|
0.0 |
% |
Adjusted Gross Profit Margin |
|
|
38.9 |
% |
|
|
37.8 |
% |
|
|
38.8 |
% |
Adjusted Net Income and Adjusted Diluted EPS Reconciliation
|
|
Years Ended September 30, |
|
|||||||||
(U.S. dollars in thousands, except per share amounts) |
|
2023 |
|
|
2022 |
|
|
2021 |
|
|||
Net income |
|
$ |
67,955 |
|
|
$ |
75,225 |
|
|
$ |
93,150 |
|
Amortization |
|
|
46,338 |
|
|
|
50,537 |
|
|
|
49,802 |
|
Stock-based compensation costs (1) |
|
|
4,326 |
|
|
|
6,554 |
|
|
|
18,746 |
|
Acquisition and divestiture costs (2) |
|
|
6,890 |
|
|
|
13,406 |
|
|
|
— |
|
Secondary offering costs |
|
|
1,065 |
|
|
|
— |
|
|
|
2,592 |
|
Inventories (3) |
|
|
— |
|
|
|
19,297 |
|
|
|
— |
|
Other costs (4) |
|
|
843 |
|
|
|
2,764 |
|
|
|
5,192 |
|
Capital structure transaction costs (5) |
|
|
— |
|
|
|
5,112 |
|
|
|
— |
|
Tax impact of adjustments (6) |
|
|
(15,684 |
) |
|
|
(23,627 |
) |
|
|
(16,549 |
) |
Adjusted Net Income |
|
$ |
111,733 |
|
|
$ |
149,268 |
|
|
$ |
152,933 |
|
47
|
|
Years Ended September 30, |
|
|||||||||
|
|
2023 |
|
|
2022 |
|
|
2021 |
|
|||
Net income per common share — diluted |
|
$ |
0.45 |
|
|
$ |
0.49 |
|
|
$ |
0.59 |
|
Amortization |
|
|
0.30 |
|
|
|
0.33 |
|
|
|
0.32 |
|
Stock-based compensation costs |
|
|
0.03 |
|
|
|
0.05 |
|
|
|
0.12 |
|
Acquisition and divestiture costs |
|
|
0.04 |
|
|
|
0.08 |
|
|
|
— |
|
Secondary offering costs |
|
|
0.01 |
|
|
|
— |
|
|
|
0.02 |
|
Inventories |
|
|
— |
|
|
|
0.12 |
|
|
|
— |
|
Other costs |
|
|
0.01 |
|
|
|
0.02 |
|
|
|
0.03 |
|
Capital structure transaction costs |
|
|
— |
|
|
|
0.03 |
|
|
|
— |
|
Tax impact of adjustments |
|
|
(0.10 |
) |
|
|
(0.15 |
) |
|
|
(0.10 |
) |
Adjusted Diluted EPS (7) |
|
$ |
0.74 |
|
|
$ |
0.97 |
|
|
$ |
0.98 |
|
Adjusted EBITDA and Adjusted EBITDA Margin Reconciliation
|
|
Years Ended September 30, |
|
|||||||||
(U.S. dollars in thousands) |
|
2023 |
|
|
2022 |
|
|
2021 |
|
|||
Net income |
|
$ |
67,955 |
|
|
$ |
75,225 |
|
|
$ |
93,150 |
|
Interest expense, net |
|
|
39,293 |
|
|
|
24,956 |
|
|
|
20,311 |
|
Depreciation and amortization |
|
|
132,544 |
|
|
|
118,533 |
|
|
|
101,604 |
|
Tax expense |
|
|
23,929 |
|
|
|
28,754 |
|
|
|
28,668 |
|
Stock-based compensation costs |
|
|
18,704 |
|
|
|
18,105 |
|
|
|
22,670 |
|
Acquisition and divestiture costs (1) |
|
|
6,890 |
|
|
|
13,406 |
|
|
|
— |
|
Secondary offering costs |
|
|
1,065 |
|
|
|
— |
|
|
|
2,592 |
|
Inventories (2) |
|
|
— |
|
|
|
19,297 |
|
|
|
— |
|
Other costs (3) |
|
|
843 |
|
|
|
2,764 |
|
|
|
5,192 |
|
Total adjustments |
|
|
223,268 |
|
|
|
225,815 |
|
|
|
181,037 |
|
Adjusted EBITDA |
|
$ |
291,223 |
|
|
$ |
301,040 |
|
|
$ |
274,187 |
|
48
|
|
Years Ended September 30, |
|
|||||||||
|
|
2023 |
|
|
2022 |
|
|
2021 |
|
|||
Net profit margin |
|
|
5.0 |
% |
|
|
5.5 |
% |
|
|
7.9 |
% |
Interest expense, net |
|
|
2.9 |
% |
|
|
1.8 |
% |
|
|
1.7 |
% |
Depreciation and amortization |
|
|
9.6 |
% |
|
|
8.7 |
% |
|
|
8.6 |
% |
Tax expense |
|
|
1.7 |
% |
|
|
2.2 |
% |
|
|
2.5 |
% |
Stock-based compensation costs |
|
|
1.4 |
% |
|
|
1.4 |
% |
|
|
1.9 |
% |
Acquisition and divestiture costs |
|
|
0.5 |
% |
|
|
1.0 |
% |
|
|
0.0 |
% |
Secondary offering costs |
|
|
0.1 |
% |
|
|
0.0 |
% |
|
|
0.2 |
% |
Inventories |
|
|
0.0 |
% |
|
|
1.4 |
% |
|
|
0.0 |
% |
Other costs |
|
|
0.1 |
% |
|
|
0.2 |
% |
|
|
0.5 |
% |
Total adjustments |
|
|
16.3 |
% |
|
|
16.7 |
% |
|
|
15.4 |
% |
Adjusted EBITDA Margin |
|
|
21.3 |
% |
|
|
22.2 |
% |
|
|
23.3 |
% |
Free Cash Flow Reconciliation
|
|
Years Ended September 30, |
|
|||||||||
(U.S. dollars in thousands) |
|
2023 |
|
|
2022 |
|
|
2021 |
|
|||
Net cash provided by operating activities |
|
$ |
362,542 |
|
|
$ |
105,835 |
|
|
$ |
207,679 |
|
Less: Purchases of property, plant and equipment |
|
|
(88,545 |
) |
|
|
(170,938 |
) |
|
|
(175,119 |
) |
Free Cash Flow |
|
$ |
273,997 |
|
|
$ |
(65,103 |
) |
|
$ |
32,560 |
|
Net cash used in investing activities |
|
$ |
(88,504 |
) |
|
$ |
(280,176 |
) |
|
$ |
(175,073 |
) |
Net cash provided by (used in) financing activities |
|
$ |
(116,541 |
) |
|
$ |
44,622 |
|
|
$ |
2,918 |
|
Liquidity and Capital Resources
Liquidity Outlook
Our primary cash needs are to fund working capital, capital expenditures, debt service, share repurchases and any acquisitions we may undertake. As of September 30, 2023, we had cash and cash equivalents of $278.3 million and total indebtedness of $594.0 million. The AZEK Group LLC (f/k/a CPG International LLC), our direct, wholly owned subsidiary, had approximately $147.2 million available under the borrowing base of our Revolving Credit Facility for future borrowings as of September 30, 2023. The AZEK Group LLC has the option to increase the commitments under the Revolving Credit Facility by up to $100.0 million, subject to certain conditions.
We believe we will have adequate liquidity over the next 12 months to operate our business and to meet our cash requirements as a result of cash flows from operating activities, available cash balances and availability under our Revolving Credit Facility after consideration of our debt service and other cash requirements. In the longer term, our liquidity will depend on many factors, including our results of operations, our future growth, the timing and extent of our expenditures to develop new products and improve our manufacturing capabilities, the expansion of our sales and marketing activities and the extent to which we make acquisitions. Changes in our operating plans, material changes in anticipated sales, increased expenses, acquisitions or other events may cause us to seek additional equity and/or debt financing in future periods.
49
Holding Company Status
We are a holding company and do not conduct any business operations of our own. As a result, we are largely dependent upon cash dividends and distributions and other transfers from our subsidiaries to meet our obligations. The agreements governing the indebtedness of our subsidiaries impose restrictions on our subsidiaries’ ability to pay dividends or make other distributions to us.
The AZEK Group LLC is party to the Senior Secured Credit Facilities. The obligations under the Senior Secured Credit Facilities are secured by specified assets. The obligations under the Senior Secured Credit Facilities are guaranteed by The AZEK Company Inc. and the wholly owned domestic subsidiaries of The AZEK Group LLC other than certain immaterial subsidiaries and other excluded subsidiaries.
The Senior Secured Credit Facilities contain covenants restricting payments of dividends by The AZEK Group LLC unless certain conditions, as provided in the Senior Secured Credit Facilities, are met. The covenants under our Senior Secured Credit Facilities provide for certain exceptions for specific types of payments. However, other than restricted payments under the specified exceptions, the covenants under our 2022 Term Loan Agreement generally prohibit the payment of dividends unless the Total Net Leverage Ratio (as defined in the 2022 Term Loan Agreement) of The AZEK Group LLC, on a pro forma basis, is no greater than 4.25:1.00 and no event of default has occurred and is occurring.
Since the restricted net assets of the Company exceed 25% of our consolidated net assets, in accordance with Rule 12-04, Schedule 1 of Regulation S-X, refer to our Consolidated Financial Statements included elsewhere in this Annual Report for condensed parent company financial statements of the Company.
Cash Sources
We have historically relied on cash flows from operations generated by The AZEK Group LLC, borrowings under the credit facilities, issuances of notes and other forms of debt financing and capital contributions to fund our cash needs.
On September 30, 2013, our subsidiary, The AZEK Group LLC (as successor-in-interest to CPG Merger Sub LLC, a limited liability company formed to effect the acquisition of The AZEK Group LLC), Deutsche Bank AG New York Branch, as administrative agent and collateral agent, or the Revolver Administrative Agent, and the lenders party thereto entered into the Revolving Credit Facility. The Revolving Credit Facility provides for maximum aggregate borrowings of up to $150.0 million, subject to an asset-based borrowing base. The borrowing base is limited to a specified percentage of eligible accounts receivable and inventory, less reserves that may be established by the Revolver Administrative Agent in the exercise of its reasonable credit judgment. As of both September 30, 2023 and 2022, The AZEK Group LLC had no outstanding borrowings under the Revolving Credit Facility and had $2.8 million of outstanding letters of credit held against the Revolving Credit Facility. As of both September 30, 2023 and 2022, The AZEK Group LLC had approximately $147.2 million available under the borrowing base for future borrowings in addition to cash and cash equivalents on hand of $278.3 million and $120.8 million, respectively. Because our borrowing capacity under the Revolving Credit Facility depends, in part, on inventory, accounts receivable and other assets that fluctuate from time to time, the amount available under the borrowing base may not reflect actual borrowing capacity under the Revolving Credit Facility.
Cash Uses
Our principal cash requirements have included working capital, capital expenditures, payments of principal and interest on our debt, share repurchases, and, if market conditions warrant, making select acquisitions. We may elect to use cash from operations, debt proceeds, equity or a combination thereof to finance future acquisition opportunities.
Cash Flows
|
|
Years Ended September 30, |
|
|
2023 – 2022 Variance |
|
|
2022 – 2021 Variance |
|
|||||||||||||||||||
(U.S. dollars in thousands) |
|
2023 |
|
|
2022 |
|
|
2021 |
|
|
$ |
|
|
% |
|
|
$ |
|
|
% |
|
|||||||
Net cash provided by |
|
$ |
362,542 |
|
|
$ |
105,835 |
|
|
$ |
207,679 |
|
|
$ |
256,707 |
|
|
|
242.6 |
% |
|
$ |
(101,844 |
) |
|
|
(49.0 |
)% |
Net cash used in |
|
|
(88,504 |
) |
|
|
(280,176 |
) |
|
|
(175,073 |
) |
|
|
191,672 |
|
|
|
(68.4 |
)% |
|
|
(105,103 |
) |
|
|
60.0 |
% |
Net cash provided by (used in) |
|
|
(116,541 |
) |
|
|
44,622 |
|
|
|
2,918 |
|
|
|
(161,163 |
) |
|
|
(361.2 |
)% |
|
|
41,704 |
|
|
|
1,429.2 |
% |
Net increase (decrease) in cash |
|
$ |
157,497 |
|
|
$ |
(129,719 |
) |
|
$ |
35,524 |
|
|
$ |
287,216 |
|
|
N/M |
|
|
$ |
(165,243 |
) |
|
N/M |
|
||
50
“N/M” indicates the variance as a percentage is not meaningful.
Year Ended September 30, 2023, Compared with Year Ended September 30, 2022
Cash Provided by Operating Activities
Net cash provided by operating activities was $362.5 million and $105.8 million for the years ended September 30, 2023 and 2022, respectively. The $256.7 million increase in cash provided by operating activities is primarily related to the decrease in inventory and increased profitability due to positive pricing and lower raw material costs. During the first quarter of fiscal 2023, our channel partners met demand partially through inventory drawdowns causing us to lower production, which resulted in a decrease in inventory at September 30, 2023 as compared to September 30, 2022, while inventory levels at September 30, 2022 increased significantly from those at September 30, 2021.
Cash Used in Investing Activities
Net cash used in investing activities was $88.5 million and $280.2 million for the years ended September 30, 2023 and 2022, respectively. The $191.5 million decrease in cash used in investing activities is primarily related to acquisitions completed during the year ended September 30, 2022 as well as purchases of property, plant and equipment returning to normalized levels during the year ended September 30, 2023, as compared to the year ended September 30, 2022 which included purchases of property, plant and equipment to support our expansion of capacity in our manufacturing facilities.
Cash Provided by (Used in) Financing Activities
Net cash provided by (used in) financing activities was $(116.5) million and $44.6 million for the years ended September 30, 2023 and 2022, respectively. Net cash provided by (used in) financing activities for the year ended September 30, 2022 consisted of cash received from the 2022 Term Loan Agreement of $595.5 million, repayments for the Term Loan Agreement of $467.7 million and treasury stock repurchases of $81.5 million, as compared to the year ended September 30, 2023, which primarily consisted of $115.5 million of treasury stock repurchases and $15.0 million of proceeds from the exercise of stock options.
Year Ended September 30, 2022, Compared with Year Ended September 30, 2021
Cash Provided by Operating Activities
Net cash provided by operating activities was $105.8 million and $207.7 million for the years ended September 30, 2022 and 2021, respectively. The $101.8 million decrease in net cash provided by operating activities is primarily related to the increase in inventory and decrease in accounts payable for the year ended September 30, 2022, as compared to the year ended September 30, 2021.
Cash Used in Investing Activities
Net cash used in investing activities was $280.2 million and $175.1 million for the years ended September 30, 2022 and 2021, respectively. The $105.1 million increase in net cash used in investing activities is primarily related to acquisitions completed during the year ended September 30, 2022, as compared to the year ended September 30, 2021.
Cash Provided by Financing Activities
Net cash provided by financing activities was $44.6 million and $2.9 million for the years ended September 30, 2022 and 2021, respectively. Net cash provided by financing activities for the year ended September 30, 2022 consisted of cash received from the 2022 Term Loan Agreement of $595.5 million, repayments for the Term Loan Agreement of $467.7 million and treasury stock repurchases of $81.5 million, as compared to the year ended September 30, 2021, which primarily consisted of proceeds from the exercise of stock options.
Share Repurchase Program
On May 5, 2022, the Board of Directors authorized us to repurchase up to $400 million of our Class A common stock. The program allows us to repurchase our shares opportunistically from time to time. Purchases may be effected through one or more open market transactions, privately negotiated transactions, transactions structured through investment banking institutions, accelerated share repurchases or tender offers, some of which may be effected through Rule 10b5-1 plans, or a combination of the foregoing. The timing of repurchases will depend upon several factors, including market and business conditions, and repurchases may be discontinued at any time.
51
The table below summaries our repurchases of our Class A common stock during the year ended September 30, 2023 and 2022 (in thousands, except per share amount):
|
|
Year Ended September 30, |
|
|||||
|
|
2023 |
|
|
2022 |
|
||
Total number of shares repurchased |
|
|
4,152 |
|
|
|
4,117 |
|
Reacquisition cost (1), (2), (3) |
|
$ |
116,579 |
|
|
$ |
81,483 |
|
Average price per share |
|
$ |
28.08 |
|
|
$ |
19.79 |
|
As of September 30, 2023, we had approximately $201.9 million available for repurchases under the share repurchase program.
See Note 12 in the Notes to Condensed Consolidated Financial Statements for additional information.
Availability under our Revolving Credit Facility
The Revolving Credit Facility provides for maximum aggregate borrowings of up to $150.0 million, subject to an asset-based borrowing base. Subject to the following paragraph, outstanding revolving loans under the Revolving Credit Facility bear interest at a rate which equals, at our option, either (i) for alternative base rate, or ABR, borrowings, the highest of (a) the Federal Funds Rate plus 50 basis points, (b) the prime rate and (c) the LIBOR, as of such date for a deposit in U.S. dollars with a maturity of one month plus 100 basis points, plus, in each case, a spread of 25 to 75 basis points based on average historical availability, or (ii) for Eurocurrency borrowings, adjusted LIBOR plus a spread of 125 to 175 basis points, based on average historical availability. The maturity of the Revolving Credit Facility is the earlier of March 31, 2026 and the date that is 91 days prior to the maturity of the Term Loan Agreement or any permitted refinancing thereof.
On January 26, 2023, The AZEK Group LLC further amended the Revolving Credit Facility, replacing all LIBOR-based provisions with provisions reflecting SOFR, including, without limitation, the use of a new Adjusted Term SOFR benchmark rate equal to Term SOFR (as defined in the Revolving Credit Agreement) plus 0.10%.
A “commitment fee” accrues on any unused portion of the revolving commitments under the Revolving Credit Facility during the preceding three calendar month period. If the average daily used percentage is greater than 50%, the commitment fee equals 25 basis points, and if the average daily used percentage is less than or equal to 50%, the commitment fee equals 37.5 basis points.
The obligations under the Revolving Credit Facility are secured by a first priority security interest in certain assets, including substantially all of the accounts receivable, inventory, deposit accounts, securities accounts and cash assets of The AZEK Company Inc., The AZEK Group LLC and the subsidiaries of The AZEK Group LLC that are guarantors under the Revolving Credit Facility, and the proceeds thereof (subject to certain exceptions), or the Revolver Priority Collateral, plus a second priority security interest in all of the Term Loan Priority Collateral (as defined below). The obligations under the Revolving Credit Facility are guaranteed by The AZEK Company Inc. and the wholly owned domestic subsidiaries of The AZEK Group LLC other than certain immaterial subsidiaries and other excluded subsidiaries.
Revolving loans under the Revolving Credit Facility may be voluntarily prepaid in whole, or in part, in each case without premium or penalty. The AZEK Group LLC is also required to make mandatory prepayments (i) when aggregate borrowings exceed commitments or the applicable borrowing base and (ii) during “cash dominion,” which occurs if (a) the availability under the Revolving Credit Facility is less than the greater of (i) $12.5 million and (ii) 10% of the lesser of (x) $150.0 million and (y) the borrowing base, for five consecutive business days or (b) certain events of default have occurred and are continuing.
52
The Revolving Credit Facility contains affirmative covenants that are customary for financings of this type, including allowing the Revolver Administrative Agent to perform periodic field exams and appraisals to evaluate the borrowing base. The Revolving Credit Facility contains various negative covenants, including limitations on, subject to certain exceptions, the incurrence of indebtedness, the incurrence of liens, dispositions, investments, acquisitions, restricted payments, transactions with affiliates, as well as other negative covenants customary for financings of this type. The Revolving Credit Facility also includes a financial maintenance covenant, applicable only when the excess availability is less than the greater of (i) 10% of the lesser of the aggregate commitments under the Revolving Credit Facility and the borrowing base, and (ii) $12.5 million. In such circumstances, we would be required to maintain a minimum fixed charge coverage ratio (as defined in the Revolving Credit Facility) for the trailing four quarters equal to at least 1.0 to 1.0; subject to our ability to make an equity cure (no more than twice in any four quarter period and up to five times over the life of the facility). As of September 30, 2022 and 2021, The AZEK Group LLC was in compliance with the financial and nonfinancial covenants imposed by the Revolving Credit Facility. The Revolving Credit Facility also includes customary events of default, including the occurrence of a change of control.
We also have the option to increase the commitments under the Revolving Credit Facility by up to $100.0 million, subject to certain conditions.
2022 Term Loan Agreement
The 2022 Term Loan Agreement is a first lien term loan and will mature on April 28, 2029, subject to acceleration or prepayment. The 2022 Term Loan Agreement will amortize in equal quarterly installments of 0.25% of the aggregate principal amount of the loans outstanding, subject to reduction for certain prepayments.
The obligations under the 2022 Term Loan Agreement are secured by a first priority security interest in the membership interests of The AZEK Group LLC owned by us, the equity interests of The AZEK Group LLC’s domestic subsidiaries, other than certain immaterial subsidiaries and other excluded subsidiaries, and all remaining assets not constituting Revolver Priority Collateral (subject to certain exceptions) of the Company, The AZEK Group LLC and the subsidiaries of The AZEK Group LLC that are guarantors under the 2022 Term Loan Agreement, and a second priority security interest in the Revolver Priority Collateral. The obligations under the 2022 Term Loan Agreement are guaranteed by us and the wholly owned domestic subsidiaries of The AZEK Group LLC other than certain immaterial subsidiaries and other excluded subsidiaries.
The interest rate applicable to the outstanding principal under the 2022 Term Loan Agreement equals, at our option, (i) in the case of alternative base rate borrowings, the highest of (a) the Federal Funds Rate (as defined in the 2022 Term Loan Agreement) plus 0.50%, (b) the Prime Rate (as defined in the 2022 Term Loan Agreement) as in effect on such day and (c) the one-month Term SOFR (as defined in the 2022 Term Loan Agreement) plus 1.00% per annum, provided that in no event will the alternative base rate be less than 1.50% per annum, plus an applicable margin of 1.50% and (ii) in the case of SOFR borrowings, Term SOFR for the applicable interest period, plus an applicable margin of 2.50%.
Loans under the 2022 Term Loan Agreement may be voluntarily prepaid in whole, or in part, in each case without premium or penalty, subject to certain customary conditions. The 2022 Term Loan Agreement also requires mandatory prepayments of loans under the 2022 Term Loan Agreement from the proceeds of certain debt issuances and certain asset dispositions (subject to certain reinvestment rights) and, commencing with the fiscal year ended September 30, 2023, a percentage of excess cash flow (subject to step-downs upon The AZEK Group LLC achieving certain leverage ratios and other reductions in connection with other debt prepayments).
The 2022 Term Loan Agreement contains affirmative covenants, negative covenants and events of default, which are broadly consistent with those in the Revolving Credit Facility (with certain differences consistent with the differences between a revolving loan and term loan) and that are customary for facilities of this type. The 2022 Term Loan Agreement does not have any financial maintenance covenants. The 2022 Term Loan Agreement also includes customary events of default, including the occurrence of a change of control.
We have the right to arrange for incremental term loans under the 2022 Term Loan Agreement in an amount that shall not exceed the sum of (i) the Fixed Incremental Amount, as defined in the 2022 Term Loan Agreement, and (ii) the Ratio Amount, as defined in the 2022 Term Loan Agreement.
Restrictions on Dividends
The Senior Secured Credit Facilities each restrict payments of dividends unless certain conditions, as provided in the Revolving Credit Facility or the 2022 Term Loan Agreement, as applicable, are met.
53
Contingent Commitments
We have contractual commitments for purchases of certain minimum quantities of raw materials at index-based prices, and non-cancelable capital and operating leases, outstanding letters of credit and fixed asset purchase commitments. For a description of our contractual obligations and commitments, see Notes 7 “Debt”, 9 “Leases” and 17 “Commitments and Contingencies” to our Consolidated Financial Statements included elsewhere in this Annual Report.
Critical Accounting Policies, Estimates and Assumptions
A discussion of our significant accounting policies and significant accounting estimates and judgments is presented in the Summary of Significant Accounting Policies in the Notes to our Consolidated Financial Statements included elsewhere in this Annual Report. Throughout the preparation of the financial statements, we employ significant judgments in the application of accounting principles and methods. These judgments are primarily related to the assumptions used to arrive at various estimates. These significant accounting estimates and judgments include:
Revenue Recognition
Our Residential segment generates revenue from the sale of our innovative, low-maintenance, sustainable Outdoor Living products, including decking, railing, trim, moulding, pergolas and accessories. Our Commercial segment generates revenue from the sale of sustainable low-maintenance privacy and storage solution products and highly engineered plastic sheet products.
We recognize revenues when control of the promised goods is transferred to our customers in an amount that reflects the consideration we expect to be entitled to in exchange for those goods, at a point in time, when shipping occurs. Each product we transfer to the customer is considered one performance obligation. We have elected to account for shipping and handling costs as activities to fulfill the promise to transfer the goods. As a result of this accounting policy election, we do not consider shipping and handling activities as promised services to our customers.
Customer contracts are typically fixed price and short-term in nature. The transaction price is based on the product specifications and is determined at the time of order. We do not engage in contracts greater than one year, and therefore do not have any incremental costs capitalized as of September 30, 2023 or September 30, 2022.
We may offer various sales incentive programs throughout the year. We estimate the amount of sales incentive to allocate to each performance obligation, or product shipped, using the most-likely-amount method of estimation, based on sales to the direct customer or sell-through customer. The estimate is updated each reporting period and any changes are allocated to the performance obligations on the same basis as at inception. Changes in estimate allocated to a previously satisfied performance obligation are recognized as part of net revenue in the period in which the change occurs under the cumulative catch-up method. In addition to sales incentive programs, we may offer a payment discount, if payments are received within 30 days. We estimate the payment discount that we determine will be taken by the customer based on prior history and using the most-likely-amount method of estimation. We believe the most-likely-amount method best predicts the amount of consideration to which we will be entitled. The payment discounts are also reflected as part of net revenue. The total amount of incentives was $132.6 million, $105.8 million and $92.5 million for the years ended September 30, 2023, 2022 and 2021, respectively.
Customer program costs and incentives, such as rebates are a common practice in our business. We incur customer program costs to promote sales of products and to maintain competitive pricing. Customer program costs and incentives include annual programs related to volume growth as well as certain product-specific incentives. The program costs are accounted for at the time the revenue is recognized in net sales. Management’s estimates are based on historical and projected experience for each type of program or customer and in consideration of product specific incentives. Management periodically reviews accruals for these rebates and allowances, and adjusts accruals when circumstances indicate (typically as a result of a change in volume expectations).
Goodwill
We account for goodwill as the excess of the purchase price over the net amount of identifiable assets acquired and liabilities assumed in a business combination measured at fair value. We assign goodwill to six reporting units based on which reporting unit is expected to benefit from the business combination as of the acquisition date. We evaluate goodwill for impairment in the fourth quarter at the reporting unit level annually, or more frequently if an event occurs or circumstances change in the interim that would more likely than not reduce the fair value of the asset below the carrying amount. Goodwill is considered to be impaired when the net book value of the reporting unit exceeds its estimated fair value. Our evaluation may begin with a qualitative assessment of the factors that could impact the significant inputs used to estimate fair value to determine if it is more likely than not that the fair value of the reporting unit is less than its carrying amount or we may elect to bypass the qualitative assessment and proceed to a quantitative assessment to determine if goodwill is impaired.
54
In quantitative impairment tests, we first compare the fair value of the reporting unit to the carrying value. If the carrying value of a reporting unit exceeds its fair value, the goodwill of that reporting unit is impaired and an impairment loss is recognized for the excess up to the amount of goodwill allocated to the reporting unit.
We measure fair value of the reporting units to which goodwill is allocated using an income based approach, a generally accepted valuation methodology, using relevant data available through and as of the impairment testing date. Under the income approach, fair value is determined using a discounted cash flow method, projecting future cash flows of each reporting unit, as well as a terminal value, and discounting such cash flows at a rate of return that reflects the relative risk of the cash flows. The key assumptions and factors used in this approach include, but are not limited to, revenue growth rates and profit margins based on internal forecasts, discount rates, perpetuity growth rates, future capital expenditures, and working capital requirements, among others, and a review with comparable market multiples for the industry segment as well as our historical operating trends. Any impairment is increased to encompass the income tax effects of any tax deductible goodwill on the carrying amount of the reporting unit, so that the after-tax impairment loss is equivalent to the amount by which the carrying value of the reporting unit exceeds its fair value.
Our annual impairment testing as of August 1, 2023 resulted in fair values of our reporting units and indefinite-lived intangible assets in excess of carrying values. However, if our assumptions are not realized, it is possible that impairment charges may need to be recorded in the future. For example, changes in the discount rate assumption for a reporting unit or profit margin assumptions for certain reporting units which are within a reasonable range of historical rate fluctuations between test dates, would have had the following effects on the fair value cushion in excess of carrying value for the most sensitive reporting units, as of the August 1, 2023 test date:
Product Warranties
We provide product assurance warranties against certain defects to our customers based on standard terms and conditions for periods beginning as of the sale date and lasting from five years to a lifetime, depending on the product and subject to various limitations. We provide for the estimated cost of warranties by product line at the time revenue is recognized based on management’s judgment, considering such factors as cost per claim, historical experience, anticipated rates of claims, and other available information, including our stated warranty policies and procedures. Management reviews and adjusts these estimates, if necessary, based on the differences between actual experience and historical estimates. Because warranty issues may surface later in the product life cycle, management continues to review these estimates on a regular basis and considers adjustments to these estimates based on actual experience compared to historical estimates. Estimating the required warranty reserves requires a high level of judgment, especially as many of our products are at a relatively early stage in their product life cycles. The warranty obligation is reflected in other current and other non-current liabilities in the consolidated balance sheets.
Recently Adopted Accounting Pronouncements
On October 1, 2021, we adopted ASU No. 2019-12, Income Taxes (Topic 740)—Simplifying the Accounting for Income Taxes. This standard simplifies the accounting for income taxes by removing certain exceptions to general principles in Topic 740 and clarifying and amending existing guidance. The adoption of the standard did not have a material impact on our Consolidated Financial Statements.
Recently Issued Accounting Pronouncements
None.
Item 7A. Quantitative and Qualitative Disclosures About Market Risk.
Interest Rate Risk
We are subject to interest rate risk in connection with our long-term debt. Our principal interest rate risk relates to the Senior Secured Credit Facilities. To meet our seasonal working capital needs, we borrow periodically on our variable rate revolving line of credit under the Revolving Credit Facility. As of September 30, 2023 and 2022, we had $594.0 million and $600.0 million outstanding under the 2022 Term Loan Agreement, respectively, and no outstanding amounts under the Revolving Credit Facility at both dates. The 2022 Term Loan Agreement and Revolving Credit Facility bear interest at variable rates.
55
If interest rates were to increase, our debt service obligations on the variable rate indebtedness would increase even though the amount borrowed remained the same, and our net income and cash flows, including cash available for servicing our indebtedness, will correspondingly decrease. For example, the Board of Governors of the Federal Reserve System increased interest rates multiple times in 2022 and 2023 in response to concerns about inflation, and it may raise interest rates again in the future. An increase or decrease of 100 basis points in the floating rates on the amounts outstanding under the Senior Secured Credit Facilities, after giving effect to related derivatives, as of September 30, 2023, 2022 and 2021, would have increased or decreased, respectively, annual cash interest by approximately $2.9 million, $3.0 million and $4.7 million, respectively.
We have entered into and may continue to enter into, agreements such as floating for fixed-rate interest rate swaps and other hedging contracts in order to hedge against interest rate volatility associated with our Senior Secured Credit Facilities. For example, effective November 2022, we entered into interest rate swaps, which swapped interest at a rate based on SOFR on a notional amount of $300 million for a fixed rate. We do not intend or expect to enter into interest rate swaps or other derivative transactions for speculative purposes. In the future, in order to manage our interest rate risk, we may refinance our existing debt.
Credit Risk
As of September 30, 2023 and 2022, our cash and cash equivalents were maintained at major financial institutions in the United States, and our current deposits are likely in excess of insured limits. We believe these institutions have sufficient assets and liquidity to conduct their operations in the ordinary course of business with little or no credit risk to us.
Our accounts receivable primarily relate to revenue from the sale of products primarily to established distributors inside of the United States. To mitigate credit risk, ongoing credit evaluations of customers’ financial condition are performed. As of September 30, 2023, receivables from one customer represented 17.2% of gross trade receivables. As of September 30, 2022, two customers each represented more than 10% of gross trade receivables: Customer A was 10.6% and Customer B was 14.8%.
Foreign Currency Risk
Substantially all of our business is currently conducted in U.S. dollars. We do not believe that an immediate 10% increase or decrease in the relative value of the U.S. dollar as compared to other currencies would have a material effect on our operating results.
Inflation
Our cost of sales is subject to inflationary pressures and price fluctuations of the raw materials we use and other costs, including freight and labor costs. Global inflation has increased during 2023, and geopolitical tensions and economic uncertainties have exacerbated inflationary pressures, including causing increases in the prices for goods and services and exacerbating global supply chain disruptions, which have resulted in, and may continue to result in, shortages in materials and services and related issues. Historically, we have generally been able over time to offset, in whole or in part, the effects of inflation and price fluctuations through sales price increases and production efficiencies associated with technological enhancements and volume growth; however, we cannot reasonably estimate our ability to offset any increases in raw material prices or freight or labor costs or other inflationary pressures in the future. Such sustained inflationary pressures may have an adverse effect on our business, financial condition and results of operations if the selling prices of our products do not increase with these increased costs, or we cannot identify cost efficiencies.
Raw Materials
We rely upon the supply of certain raw materials in our production processes; however, we do not typically enter into fixed price contracts with our suppliers and currently have no fixed price contracts with our major vendors. The primary raw materials we use in the manufacture of our products are various petrochemical resins, including polyethylene, polypropylene and PVC resins, reclaimed polyethylene and PVC material, waste wood fiber and aluminum. In addition, we utilize a variety of other additives including modifiers, TiO2 and pigments. The exposures associated with these costs are primarily managed through terms of the sales and by maintaining relationships with multiple vendors. Prices for spot market purchases are negotiated on a continuous basis in line with the market at the time. We have not entered into hedges with respect to our raw material costs at this time, but we may choose to enter into such hedges in the future. Other than short term supply contracts for resins with indexed based pricing and occasional strategic purchases of larger quantities of certain raw materials, we generally buy materials on an as-needed basis.
The cost of some of the raw materials we use in the manufacture of our products is subject to significant price volatility. For example, the cost of petrochemical resins used in our manufacturing processes has historically varied significantly and has been affected by changes in supply and demand and in the price of crude oil. Substantially all of our resins are purchased under supply contracts that average approximately one to two years, for which pricing is variable based on an industry benchmark price index. The resin supply contracts are negotiated annually and generally provide that we are obligated to purchase a minimum amount of resins from each supplier.
56
In addition, the price of reclaimed polyethylene material, waste wood fiber, aluminum, other additives (including modifiers, TiO2 and pigments) and other raw materials fluctuates depending on, among other things, overall market supply and demand and general business conditions.
Item 8. Financial Statements and Supplementary Data.
The financial statements required by this Item are located beginning on page F-1 of this report.
Item 9. Changes in and Disagreements with Accountants on Accounting and Financial Disclosure.
None.
Item 9A. Controls and Procedures.
This Item 9A includes information concerning the controls and controls evaluation referred to in the certifications of our Chief Executive Officer and Chief Financial Officer required by Rule 13a – 14 of the Exchange Act included in this Annual Report as Exhibits 31.1 and 31.2.
Evaluation of Disclosure Controls and Procedures
Our management, with the participation of our Chief Executive Officer and our Chief Financial Officer, has evaluated the effectiveness of our disclosure controls and procedures as defined in Rules 13a-15(e) and 15d-15(e) under the Securities Exchange Act of 1934 (the “Exchange Act”) as of the end of the period covered by this Annual Report on Form 10-K. Disclosure controls and procedures are designed to provide reasonable assurance that information required to be disclosed by a company in the reports that it files or submits under the Exchange Act is recorded, processed, summarized and reported, within the time periods specified in the SEC’s rules and forms. Disclosure controls and procedures include, without limitation, controls and procedures designed to provide reasonable assurance that information required to be disclosed by a company in the reports that it files or submits under the Exchange Act is accumulated and communicated to the company’s management, including its principal executive and principal financial officers, or persons performing similar functions, as appropriate to allow timely decisions regarding required disclosure. Management recognizes that any controls and procedures, no matter how well designed and operated, can provide only reasonable assurance of achieving their objectives.
Based on this evaluation, our Chief Executive Officer and our Chief Financial Officer concluded that our disclosure controls and procedures were effective at the reasonable assurance level as of September 30, 2023.
Management’s Report on Internal Control Over Financial Reporting
Our management is responsible for establishing and maintaining adequate internal control over financial reporting. Internal control over financial reporting is defined in Rules 13a-15(f) and 15d-15(f) under the Exchange Act as a process designed by, or under the supervision of, the company’s principal executive and principal financial officers, and effected by the company’s board of directors, management and other personnel, to provide reasonable assurance regarding the reliability of financial reporting and the preparation of financial statements for external purposes in accordance with generally accepted accounting principles and includes those policies and procedures that:
Our management, under the supervision and with the participation of our Chief Executive Officer and Chief Financial Officer, assessed the effectiveness of our internal control over financial reporting as of September 30, 2023, using the criteria set forth in Internal Control — Integrated Framework (2013) issued by the Committee of Sponsoring Organizations of the Treadway Commission (COSO). Based on this assessment, our management concluded that, as of September 30, 2023, our internal control over financial reporting was effective to provide reasonable assurance regarding the reliability of financial reporting and the preparation of financial statements for external purposes in accordance with generally accepted accounting principles. The effectiveness of our internal control over financial reporting as of September 30, 2023 has been audited by PricewaterhouseCoopers LLP, an independent registered public accounting firm, as stated in their report which appears herein.
57
Changes in Internal Control over Financial Reporting
There were no changes in our internal control over financial reporting during the three months ended September 30, 2023 that have materially affected, or are reasonably likely to materially affect, our internal control over financial reporting.
Limitations on Effectiveness of Controls and Procedures
Our management does not expect that our disclosure controls and procedures or our internal control over financial reporting will prevent all errors and all fraud. A control system, no matter how well designed and operated, can provide only reasonable, not absolute, assurance that the objectives of the control system are met. Further, the design of a control system must reflect the fact that there are resource constraints, and the benefits of controls must be considered relative to their costs. Because of the inherent limitations in all control systems, no evaluation of controls can provide absolute assurance that all control issues and instances of fraud, if any, within our company have been detected.
Item 9B. Other Information.
None.
58
PART III
Item 10. Directors, Executive Officers and Corporate Governance.
The information required by this item will be included in our definitive proxy statement for our 2024 annual meeting of shareholders, or the Proxy Statement, which will be filed with the SEC pursuant to Regulation 14A not later than 120 days after the end of the 2023 fiscal year, and is herein incorporated by reference.
Code of Ethics
We have adopted a Code of Ethics for Senior Officers applicable to our Chief Executive Officer and senior financial officers. In addition, we have adopted a Code of Conduct and Ethics for all officers, directors and employees. Our Code of Ethics for Senior Officers and Code of Conduct and Ethics is posted on our website at azekco.com on the Governance Documents page of the Investor Relations section of the website. We intend to disclose future amendments to certain provisions of our Code of Ethics for Senior Officers, or waivers of such provisions applicable to any principal executive officer, principal financial officer, principal accounting officer or other persons performing similar functions on our website.
Insider Trading Policy
We have adopted an Insider Trading Policy that governs the purchase, sale and/or other dispositions of our securities by our directors, officers and employees, as well as their immediate family members and entities owned or controlled by them, and that is designed to promote compliance with insider trading laws, rules and regulations.
Item 11. Executive Compensation.
The information required by this item will be included in our definitive Proxy Statement, which will be filed with the SEC pursuant to Regulation 14A not later than 120 days after the end of the 2023 fiscal year, and is herein incorporated by reference.
Item 12. Security Ownership of Certain Beneficial Owners and Management and Related Stockholder Matters.
The information required by this item will be included in our definitive Proxy Statement, which will be filed with the SEC pursuant to Regulation 14A not later than 120 days after the end of the 2023 fiscal year, and is herein incorporated by reference.
The information required by this item will be included in our definitive Proxy Statement, which will be filed with the SEC pursuant to Regulation 14A not later than 120 days after the end of the 2023 fiscal year, and is herein incorporated by reference.
Item 14. Principal Accounting Fees and Services.
The information required by this item will be included in our definitive Proxy Statement, which will be filed with the SEC pursuant to Regulation 14A not later than 120 days after the end of the 2023 fiscal year, and is herein incorporated by reference.
59
PART IV
Item 15. Exhibits, Financial Statement Schedules.
Item 16. Form 10-K Summary
None.
60
Exhibit Index
|
|
|
|
Incorporated by Reference |
||||||
|
Exhibit No. |
|
Description |
|
Form |
|
Exhibit |
|
Filing Date |
|
File No. |
|
|
|
|
|
|
|
|
|
|
|
3.1 |
|
Second Restated Certificate of Incorporation of The AZEK Company Inc. |
|
8-K |
|
3.2 |
|
03/01/2023 |
|
001-39322 |
|
|
|
|
|
|
|
|
|
|
|
3.2 |
|
|
8-K |
|
3.3 |
|
03/10/2022 |
|
001-39322 |
|
|
|
|
|
|
|
|
|
|
|
|
4.1 |
|
|
10-Q |
|
4.2 |
|
08/14/2020 |
|
001-39322 |
|
|
|
|
|
|
|
|
|
|
|
|
4.2 |
|
|
10-K |
|
4.3 |
|
11/23/2021 |
|
001-39322 |
|
|
|
|
|
|
|
|
|
|
|
|
10.1 |
|
|
S-1 |
|
10.1 |
|
02/07/2020 |
|
333-236325 |
|
|
|
|
|
|
|
|
|
|
|
|
10.2 |
|
|
S-1/A |
|
10.45 |
|
06/08/2020 |
|
333-236325 |
|
|
|
|
|
|
|
|
|
|
|
|
10.3 |
|
|
|
S-1 |
|
10.3 |
|
09/08/2020 |
|
333-248660 |
|
|
|
|
|
|
|
|
|
|
|
10.4 |
|
|
10-Q |
|
10.2 |
|
05/14/2021 |
|
001-39322 |
|
|
|
|
|
|
|
|
|
|
|
|
10.5 |
|
|
10-Q |
|
10.3 |
|
02/09/2023 |
|
001-39322 |
|
|
|
|
|
|
|
|
|
|
|
|
10.6 |
|
|
S-1 |
|
10.2 |
|
02/07/2020 |
|
333-236325 |
|
|
|
|
|
|
|
|
|
|
|
|
10.7 |
|
|
8-K |
|
10.1 |
|
05/03/2022 |
|
001-39322 |
|
|
|
|
|
|
|
|
|
|
|
|
10.8 |
|
|
8-K |
|
10.2 |
|
05/03/2022 |
|
001-39322 |
|
|
|
|
|
|
|
|
|
|
|
|
10.9 |
|
|
8-K |
|
10.3 |
|
05/03/2022 |
|
001-39322 |
|
|
|
|
|
|
|
|
|
|
|
|
10.9† |
|
|
S-1 |
|
10.23 |
|
02/07/2020 |
|
333-236325 |
|
|
|
|
|
|
|
|
|
|
|
|
10.10† |
|
Employment Agreement, dated as of May 26, 2016, by and between CPG International LLC and Jesse Singh |
|
S-1 |
|
10.24 |
|
02/07/2020 |
|
333-236325 |
|
|
|
|
|
|
|
|
|
|
|
61
|
|
|
|
Incorporated by Reference |
||||||
|
Exhibit No. |
|
Description |
|
Form |
|
Exhibit |
|
Filing Date |
|
File No. |
10.11† |
|
|
S-1 |
|
10.27 |
|
02/07/2020 |
|
333-236325 |
|
|
|
|
|
|
|
|
|
|
|
|
10.12† |
|
|
8-K |
|
10.1 |
|
07/19/2021 |
|
001-39322 |
|
|
|
|
|
|
|
|
|
|
|
|
10.13† |
|
|
10-Q |
|
10.1 |
|
02/09/2023 |
|
001-39322 |
|
|
|
|
|
|
|
|
|
|
|
|
10.14† |
|
|
10-Q |
|
10.2 |
|
02/09/2023 |
|
001-39322 |
|
|
|
|
|
|
|
|
|
|
|
|
10.14† |
|
The AZEK Company Inc. 2020 Omnibus Incentive Compensation Plan |
|
S-1 |
|
10.36 |
|
09/08/2020 |
|
333-248660 |
|
|
|
|
|
|
|
|
|
|
|
10.15† |
|
Form of Restricted Stock Grant (Replacement Award for AOT Building Products, L.P. Profits Interests) |
|
S-1 |
|
10.37 |
|
09/08/2020 |
|
333-248660 |
|
|
|
|
|
|
|
|
|
|
|
10.16† |
|
|
S-1 |
|
10.38 |
|
09/08/2020 |
|
333-248660 |
|
|
|
|
|
|
|
|
|
|
|
|
10.17† |
|
Form of IPO Nonqualified Stock Option Award Agreement (Chair IPO Award) |
|
S-1 |
|
10.39 |
|
09/08/2020 |
|
333-248660 |
|
|
|
|
|
|
|
|
|
|
|
10.18† |
|
Form of Restricted Stock Unit Award Agreement for Non-Employee Directors |
|
10-K |
|
10.20 |
|
11/23/2021 |
|
001-39322 |
|
|
|
|
|
|
|
|
|
|
|
10.19† |
|
Form of Time-Based Restricted Stock Unit Award Agreement (Mr. Skelly IPO Award) |
|
S-1 |
|
10.39 |
|
02/07/2020 |
|
333-236325 |
|
|
|
|
|
|
|
|
|
|
|
10.20† |
|
Form of Time-Based Restricted Stock Unit Award Agreement (2021, 2022 and 2023 Awards) |
|
10-K |
|
10.24 |
|
11/23/2021 |
|
001-39322 |
|
|
|
|
|
|
|
|
|
|
|
10.21*† |
|
Form of Performance-Based Restricted Stock Unit Award Agreement (2021, 2022 and 2023 Awards) |
|
|
|
|
|
|
|
|
|
|
|
|
|
|
|
|
|
|
|
10.22† |
|
Form of Nonqualified Stock Option Award Agreement (2021, 2022 and 2023 Awards) |
|
10-K |
|
10.26 |
|
11/23/2021 |
|
001-39322 |
|
|
|
|
|
|
|
|
|
|
|
10.23† |
|
|
S-1 |
|
10.41 |
|
02/07/2020 |
|
333-236325 |
|
|
|
|
|
|
|
|
|
|
|
|
10.24† |
|
|
S-1/A |
|
10.42 |
|
05/29/2020 |
|
333-236325 |
|
|
|
|
|
|
|
|
|
|
|
|
10.25† |
|
|
S-1/A |
|
10.43 |
|
05/29/2020 |
|
333-236325 |
|
|
|
|
|
|
|
|
|
|
|
|
10.26† |
|
|
10-K |
|
10.31 |
|
11/23/2021 |
|
001-39322 |
|
|
|
|
|
|
|
|
|
|
|
|
10.27† |
|
Form of Non-Employee Director Compensation Deferral Election Form |
|
10-K |
|
10.32 |
|
11/23/2021 |
|
001-39322 |
|
|
|
|
|
|
|
|
|
|
|
21.1* |
|
|
|
|
|
|
|
|
|
|
|
|
|
|
|
|
|
|
|
|
|
23* |
|
Consent of PricewaterhouseCoopers LLP, independent registered public accounting firm |
|
|
|
|
|
|
|
|
|
|
|
|
|
|
|
|
|
|
|
31.1* |
|
|
|
|
|
|
|
|
|
|
|
|
|
|
|
|
|
|
|
|
|
31.2* |
|
|
|
|
|
|
|
|
|
|
|
|
|
|
|
|
|
|
|
|
|
32.1* |
|
|
|
|
|
|
|
|
|
|
|
|
|
|
|
|
|
|
|
|
|
32.2* |
|
|
|
|
|
|
|
|
|
|
|
|
|
|
|
|
|
|
|
|
|
62
|
|
|
|
Incorporated by Reference |
||||||
|
Exhibit No. |
|
Description |
|
Form |
|
Exhibit |
|
Filing Date |
|
File No. |
97* |
|
|
|
|
|
|
|
|
|
|
|
|
|
|
|
|
|
|
|
|
|
101.INS |
|
Inline XBRL Instance Document* |
|
|
|
|
|
|
|
|
|
|
|
|
|
|
|
|
|
|
|
101.SCH |
|
Inline XBRL Taxonomy Extension Schema Document* |
|
|
|
|
|
|
|
|
|
|
|
|
|
|
|
|
|
|
|
101.CAL |
|
Inline XBRL Taxonomy Extension Calculation Linkbase Document* |
|
|
|
|
|
|
|
|
|
|
|
|
|
|
|
|
|
|
|
101.DEF |
|
Inline XBRL Taxonomy Extension Definition Linkbase Document* |
|
|
|
|
|
|
|
|
|
|
|
|
|
|
|
|
|
|
|
101.LAB |
|
Inline XBRL Taxonomy Extension Label Linkbase Document* |
|
|
|
|
|
|
|
|
|
|
|
|
|
|
|
|
|
|
|
101.PRE |
|
Inline XBRL Taxonomy Extension Presentation Linkbase Document* |
|
|
|
|
|
|
|
|
|
|
|
|
|
|
|
|
|
|
|
104 |
|
Cover Page Interactive Data File (embedded within the Inline XBRL document) |
|
|
|
|
|
|
|
|
* Filed herewith.
† Management contract or compensatory plan.
63
SIGNATURES
Pursuant to the requirements of Section 13 or 15(d) of the Securities Exchange Act of 1934, as amended, the Registrant has duly caused this Report to be signed on its behalf by the undersigned, thereunto duly authorized.
|
|
The AZEK Company Inc. |
|
|
|
|
|
Date: November 29, 2023 |
|
By: |
/s/ Jesse Singh |
|
|
|
Jesse Singh |
|
|
|
Chief Executive Officer, President and Director |
|
|
|
(Principal Executive Officer) |
Pursuant to the requirements of the Securities Exchange Act of 1934, as amended, this Report has been signed below by the following persons on behalf of the Registrant in the capacities and on the dates indicated.
Signature |
|
Title |
|
Date |
|
|
|
|
|
/s/ Jesse Singh |
|
Chief Executive Officer, President and Director |
|
November 29, 2023 |
Jesse Singh |
|
(Principal Executive Officer) |
|
|
|
|
|
|
|
/s/ Peter Clifford |
|
Senior Vice President, Chief Operations Officer and Chief Financial Officer |
|
November 29, 2023 |
Peter Clifford |
|
(Principal Financial Officer) |
|
|
|
|
|
|
|
/s/ Randy Herth |
|
Vice President, Chief Accounting Officer and Treasurer |
|
November 29, 2023 |
Randy Herth |
|
(Principal Accounting Officer) |
|
|
|
|
|
|
|
/s/ Gary Hendrickson |
|
Chairman of the Board of Directors |
|
November 29, 2023 |
Gary Hendrickson |
|
|
|
|
|
|
|
|
|
/s/ Sallie B. Bailey |
|
Director |
|
November 29, 2023 |
Sallie B. Bailey |
|
|
|
|
|
|
|
|
|
/s/ Pamela Edwards |
|
Director |
|
November 29, 2023 |
Pamela Edwards |
|
|
|
|
|
|
|
|
|
/s/ Howard Heckes |
|
Director |
|
November 29, 2023 |
Howard Heckes |
|
|
|
|
|
|
|
|
|
/s/ Vernon J. Nagel |
|
Director |
|
November 29, 2023 |
Vernon J. Nagel |
|
|
|
|
|
|
|
|
|
/s/ Harmit Singh |
|
Director |
|
November 29, 2023 |
Harmit Singh |
|
|
|
|
|
|
|
|
|
/s/ Brian Spaly |
|
Director |
|
November 29, 2023 |
Brian Spaly |
|
|
|
|
64
INDEX TO CONSOLIDATED FINANCIAL STATEMENTS
F-1
Report of Independent Registered Public Accounting Firm
To the Board of Directors and Stockholders of The AZEK Company Inc.
Opinions on the Financial Statements and Internal Control over Financial Reporting
We have audited the accompanying consolidated balance sheets of The AZEK Company Inc. and its subsidiaries (the “Company”) as of September 30, 2023 and 2022, and the related consolidated statements of comprehensive income (loss), of stockholders’ equity and of cash flows for each of the three years in the period ended September 30, 2023, including the related notes (collectively referred to as the “consolidated financial statements”). We also have audited the Company's internal control over financial reporting as of September 30, 2023, based on criteria established in Internal Control - Integrated Framework (2013) issued by the Committee of Sponsoring Organizations of the Treadway Commission (COSO).
In our opinion, the consolidated financial statements referred to above present fairly, in all material respects, the financial position of the Company as of September 30, 2023 and 2022, and the results of its operations and its cash flows for each of the three years in the period ended September 30, 2023 in conformity with accounting principles generally accepted in the United States of America. Also in our opinion, the Company maintained, in all material respects, effective internal control over financial reporting as of September 30, 2023, based on criteria established in Internal Control - Integrated Framework (2013) issued by the COSO.
Basis for Opinions
The Company's management is responsible for these consolidated financial statements, for maintaining effective internal control over financial reporting, and for its assessment of the effectiveness of internal control over financial reporting, included in Management’s Report on Internal Control Over Financial Reporting appearing under Item 9A. Our responsibility is to express opinions on the Company’s consolidated financial statements and on the Company's internal control over financial reporting based on our audits. We are a public accounting firm registered with the Public Company Accounting Oversight Board (United States) (PCAOB) and are required to be independent with respect to the Company in accordance with the U.S. federal securities laws and the applicable rules and regulations of the Securities and Exchange Commission and the PCAOB.
We conducted our audits in accordance with the standards of the PCAOB. Those standards require that we plan and perform the audits to obtain reasonable assurance about whether the consolidated financial statements are free of material misstatement, whether due to error or fraud, and whether effective internal control over financial reporting was maintained in all material respects.
Our audits of the consolidated financial statements included performing procedures to assess the risks of material misstatement of the consolidated financial statements, whether due to error or fraud, and performing procedures that respond to those risks. Such procedures included examining, on a test basis, evidence regarding the amounts and disclosures in the consolidated financial statements. Our audits also included evaluating the accounting principles used and significant estimates made by management, as well as evaluating the overall presentation of the consolidated financial statements. Our audit of internal control over financial reporting included obtaining an understanding of internal control over financial reporting, assessing the risk that a material weakness exists, and testing and evaluating the design and operating effectiveness of internal control based on the assessed risk. Our audits also included performing such other procedures as we considered necessary in the circumstances. We believe that our audits provide a reasonable basis for our opinions.
Definition and Limitations of Internal Control over Financial Reporting
A company’s internal control over financial reporting is a process designed to provide reasonable assurance regarding the reliability of financial reporting and the preparation of financial statements for external purposes in accordance with generally accepted accounting principles. A company’s internal control over financial reporting includes those policies and procedures that (i) pertain to the maintenance of records that, in reasonable detail, accurately and fairly reflect the transactions and dispositions of the assets of the company; (ii) provide reasonable assurance that transactions are recorded as necessary to permit preparation of financial statements in accordance with generally accepted accounting principles, and that receipts and expenditures of the company are being made only in accordance with authorizations of management and directors of the company; and (iii) provide reasonable assurance regarding prevention or timely detection of unauthorized acquisition, use, or disposition of the company’s assets that could have a material effect on the financial statements.
Because of its inherent limitations, internal control over financial reporting may not prevent or detect misstatements. Also, projections of any evaluation of effectiveness to future periods are subject to the risk that controls may become inadequate because of changes in conditions, or that the degree of compliance with the policies or procedures may deteriorate.
F-2
Critical Audit Matters
The critical audit matter communicated below is a matter arising from the current period audit of the consolidated financial statements that was communicated or required to be communicated to the audit committee and that (i) relates to accounts or disclosures that are material to the consolidated financial statements and (ii) involved our especially challenging, subjective, or complex judgments. The communication of critical audit matters does not alter in any way our opinion on the consolidated financial statements, taken as a whole, and we are not, by communicating the critical audit matter below, providing a separate opinion on the critical audit matter or on the accounts or disclosures to which it relates.
Quantitative Goodwill Impairment Assessments - Certain Reporting Units
As described in Notes 1 and 5 to the consolidated financial statements, the Company’s consolidated goodwill balance was $994.3 million as of September 30, 2023. Management tests goodwill for impairment annually during the fourth fiscal quarter ended September 30 or more frequently if an event occurs or circumstances change in the interim that would more likely than not reduce the fair value of the asset below the carrying amount. The impairment evaluation may begin with a qualitative assessment, or the Company may proceed to a quantitative assessment to determine if goodwill is impaired. Management completed the annual goodwill impairment tests as of August 1, 2023, using a quantitative assessment for all six reporting units. In performing the quantitative test, management measures the fair value of the reporting units using an income-based approach and relevant data available through the testing date. Under the income approach, fair value is determined using a discounted cash flow method, projecting future cash flows of the reporting unit, as well as a terminal value, and discounting such cash flows at a rate of return that reflects the relative risk of the cash flows. The key assumptions and factors used in this approach include, but are not limited to, revenue growth rates and profit margins based on internal Company forecasts, discount rates, perpetuity growth rates, future capital expenditures, and working capital requirements.
The principal considerations for our determination that performing procedures relating to the quantitative goodwill impairment assessments for certain reporting units is a critical audit matter are (i) the significant judgment by management when developing the fair value estimate of the certain reporting units; (ii) a high degree of auditor judgment, subjectivity, and effort in performing procedures and evaluating management’s significant assumptions related to profit margins for the certain reporting units and the discount rate related to one of the reporting units and (iii) the audit effort involved the use of professionals with specialized skill and knowledge.
Addressing the matter involved performing procedures and evaluating audit evidence in connection with forming our overall opinion on the consolidated financial statements. These procedures included testing the effectiveness of controls relating to the quantitative goodwill impairment assessment, including controls over the valuation of the certain reporting units. These procedures also included, among others (i) testing management’s process for developing the fair value of the certain reporting units; (ii) evaluating the appropriateness of the discounted cash flow method; (iii) testing the completeness and accuracy of the underlying data used in the method; and (iv) evaluating the reasonableness of the significant assumptions used by management related to profit margins for the certain reporting units and the discount rate related to one of the reporting units. Evaluating management’s assumptions related to profit margins involved evaluating whether the assumptions were reasonable considering (i) the current and past performance of the certain reporting units; (ii) the consistency with external market and industry data; and (iii) whether these assumptions were consistent with evidence obtained in other areas of the audit. Professionals with specialized skill and knowledge were used to assist in evaluating (i) the appropriateness of the discounted cash flow model and (ii) the reasonableness of the discount rate assumption.
/s/ PricewaterhouseCoopers LLP
Chicago, Illinois
November 29, 2023
We have served as the Company’s auditor since 2010.
F-3
The AZEK Company Inc.
Consolidated Balance Sheets
(In thousands of U.S. dollars, except for share and per share amounts)
|
|
As of September 30, |
|
|||||
|
|
2023 |
|
|
2022 |
|
||
ASSETS: |
|
|
|
|
|
|
||
Current assets: |
|
|
|
|
|
|
||
Cash and cash equivalents |
|
$ |
278,314 |
|
|
$ |
120,817 |
|
Trade receivables, net of allowances |
|
|
57,660 |
|
|
|
90,159 |
|
Inventories |
|
|
221,101 |
|
|
|
299,905 |
|
Prepaid expenses |
|
|
13,595 |
|
|
|
17,212 |
|
Other current assets |
|
|
12,300 |
|
|
|
2,501 |
|
Total current assets |
|
|
582,970 |
|
|
|
530,594 |
|
Property, plant and equipment, net |
|
|
501,023 |
|
|
|
517,913 |
|
Goodwill |
|
|
994,271 |
|
|
|
993,995 |
|
Intangible assets, net |
|
|
199,497 |
|
|
|
245,835 |
|
Other assets |
|
|
87,793 |
|
|
|
94,754 |
|
Total assets |
|
$ |
2,365,554 |
|
|
$ |
2,383,091 |
|
LIABILITIES AND STOCKHOLDERS’ EQUITY: |
|
|
|
|
|
|
||
Current liabilities: |
|
|
|
|
|
|
||
Accounts payable |
|
$ |
56,015 |
|
|
$ |
48,987 |
|
Accrued rebates |
|
|
60,974 |
|
|
|
50,479 |
|
Accrued interest |
|
|
260 |
|
|
|
4,436 |
|
Current portion of long-term debt obligations |
|
|
6,000 |
|
|
|
6,000 |
|
Accrued expenses and other liabilities |
|
|
71,994 |
|
|
|
72,589 |
|
Total current liabilities |
|
|
195,243 |
|
|
|
182,491 |
|
Deferred income taxes |
|
|
56,330 |
|
|
|
65,195 |
|
Long-term debt — less current portion |
|
|
580,265 |
|
|
|
584,879 |
|
Other non-current liabilities |
|
|
104,073 |
|
|
|
106,083 |
|
Total liabilities |
|
$ |
935,911 |
|
|
$ |
938,648 |
|
Commitments and contingencies (Note 17) |
|
|
|
|
|
|
||
Stockholders’ equity: |
|
|
|
|
|
|
||
Preferred stock, $0.001 par value; 1,000,000 shares authorized and no shares issued |
|
|
— |
|
|
|
— |
|
Class A common stock, $0.001 par value; 1,100,000,000 shares authorized, |
|
|
156 |
|
|
|
155 |
|
Class B common stock, $0.001 par value; 100,000,000 shares authorized, 100 shares |
|
|
— |
|
|
|
— |
|
Additional paid-in capital |
|
|
1,662,322 |
|
|
|
1,630,378 |
|
Accumulated deficit |
|
|
(45,047 |
) |
|
|
(113,002 |
) |
Accumulated other comprehensive income (loss) |
|
|
1,878 |
|
|
|
— |
|
Treasury stock, at cost, 8,268,423 shares at September 30, 2023 and |
|
|
(189,666 |
) |
|
|
(73,088 |
) |
Total stockholders’ equity |
|
|
1,429,643 |
|
|
|
1,444,443 |
|
Total liabilities and stockholders’ equity |
|
$ |
2,365,554 |
|
|
$ |
2,383,091 |
|
The accompanying notes are an integral part of these Consolidated Financial Statements.
F-4
The AZEK Company Inc.
Consolidated Statements of Comprehensive Income
(In thousands of U.S. dollars, except for share and per share amounts)
|
|
Years Ended September 30, |
|
|||||||||
|
|
2023 |
|
|
2022 |
|
|
2021 |
|
|||
Net sales |
|
$ |
1,370,316 |
|
|
$ |
1,355,586 |
|
|
$ |
1,178,974 |
|
Cost of sales |
|
|
932,663 |
|
|
|
946,266 |
|
|
|
789,023 |
|
Gross profit |
|
|
437,653 |
|
|
|
409,320 |
|
|
|
389,951 |
|
Selling, general and administrative expenses |
|
|
305,162 |
|
|
|
279,889 |
|
|
|
244,205 |
|
Other general expenses |
|
|
1,065 |
|
|
|
— |
|
|
|
2,592 |
|
Loss on disposal of plant, property and equipment |
|
|
249 |
|
|
|
496 |
|
|
|
1,025 |
|
Operating income |
|
|
131,177 |
|
|
|
128,935 |
|
|
|
142,129 |
|
Other expenses: |
|
|
|
|
|
|
|
|
|
|||
Interest expense, net |
|
|
39,293 |
|
|
|
24,956 |
|
|
|
20,311 |
|
Total other expenses |
|
|
39,293 |
|
|
|
24,956 |
|
|
|
20,311 |
|
Income before income taxes |
|
|
91,884 |
|
|
|
103,979 |
|
|
|
121,818 |
|
Income tax expense |
|
|
23,929 |
|
|
|
28,754 |
|
|
|
28,668 |
|
Net income |
|
$ |
67,955 |
|
|
$ |
75,225 |
|
|
$ |
93,150 |
|
Other comprehensive income: |
|
|
|
|
|
|
|
|
|
|||
Unrealized gain due to change in fair value of derivatives, net of tax |
|
$ |
1,878 |
|
|
$ |
— |
|
|
$ |
— |
|
Total other comprehensive income |
|
|
1,878 |
|
|
|
— |
|
|
|
— |
|
Comprehensive income |
|
$ |
69,833 |
|
|
$ |
75,225 |
|
|
$ |
93,150 |
|
|
|
|
|
|
|
|
|
|
|
|||
Net income per common share: |
|
|
|
|
|
|
|
|
|
|||
Basic |
|
$ |
0.45 |
|
|
$ |
0.49 |
|
|
$ |
0.61 |
|
Diluted |
|
$ |
0.45 |
|
|
$ |
0.49 |
|
|
$ |
0.59 |
|
|
|
|
|
|
|
|
|
|
|
|||
Weighted average shares used in calculating net income |
|
|
|
|
|
|
|
|
|
|||
Basic |
|
|
150,162,256 |
|
|
|
153,510,110 |
|
|
|
153,777,859 |
|
Diluted |
|
|
150,849,896 |
|
|
|
154,517,843 |
|
|
|
156,666,394 |
|
The accompanying notes are an integral part of these Consolidated Financial Statements.
F-5
The AZEK Company Inc.
Consolidated Statements of Stockholders’ Equity
(In thousands of U.S. dollars, except for share amounts)
|
|
Common Stock |
|
|
Treasury Stock |
|
|
|
|
|
|
|
|
|
|
|
|
|
||||||||||||||||||||||
|
|
Class A |
|
|
Class B |
|
|
|
|
|
|
|
|
|
|
|
|
|
|
|
|
|
|
|
||||||||||||||||
|
|
Shares |
|
|
Amount |
|
|
Shares |
|
|
Amount |
|
|
Shares |
|
|
Amount |
|
|
Additional |
|
|
Accumulated |
|
|
Accumulated Other Comprehensive Income (Loss) |
|
|
Total |
|
||||||||||
Balance — September 30, 2020 |
|
|
154,637,240 |
|
|
$ |
155 |
|
|
|
100 |
|
|
$ |
— |
|
|
|
— |
|
|
$ |
— |
|
|
$ |
1,587,208 |
|
|
$ |
(283,475 |
) |
|
$ |
— |
|
|
$ |
1,303,888 |
|
Adoption of ASU 2016-02 |
|
|
— |
|
|
|
— |
|
|
|
— |
|
|
|
— |
|
|
|
— |
|
|
|
— |
|
|
|
— |
|
|
|
2,098 |
|
|
|
— |
|
|
|
2,098 |
|
Net income |
|
|
— |
|
|
|
— |
|
|
|
— |
|
|
|
— |
|
|
|
— |
|
|
|
— |
|
|
|
— |
|
|
|
93,150 |
|
|
|
— |
|
|
|
93,150 |
|
Stock-based compensation |
|
|
— |
|
|
|
— |
|
|
|
— |
|
|
|
— |
|
|
|
— |
|
|
|
— |
|
|
|
22,250 |
|
|
|
— |
|
|
|
— |
|
|
|
22,250 |
|
Vesting of restricted stock |
|
|
14,681 |
|
|
|
— |
|
|
|
— |
|
|
|
— |
|
|
|
— |
|
|
|
— |
|
|
|
— |
|
|
|
— |
|
|
|
— |
|
|
|
— |
|
Exercise of vested stock options |
|
|
260,338 |
|
|
|
— |
|
|
|
— |
|
|
|
— |
|
|
|
— |
|
|
|
— |
|
|
|
5,988 |
|
|
|
— |
|
|
|
— |
|
|
|
5,988 |
|
Cancellation of restricted stock awards |
|
|
(45,946 |
) |
|
|
— |
|
|
|
— |
|
|
|
— |
|
|
|
— |
|
|
|
— |
|
|
|
— |
|
|
|
— |
|
|
|
— |
|
|
|
— |
|
IPO costs |
|
|
— |
|
|
|
— |
|
|
|
— |
|
|
|
— |
|
|
|
— |
|
|
|
— |
|
|
|
(210 |
) |
|
|
— |
|
|
|
— |
|
|
|
(210 |
) |
Balance – September 30, 2021 |
|
|
154,866,313 |
|
|
$ |
155 |
|
|
|
100 |
|
|
$ |
— |
|
|
|
— |
|
|
$ |
— |
|
|
$ |
1,615,236 |
|
|
$ |
(188,227 |
) |
|
$ |
— |
|
|
$ |
1,427,164 |
|
Net income |
|
|
— |
|
|
|
— |
|
|
|
— |
|
|
|
— |
|
|
|
— |
|
|
|
— |
|
|
|
— |
|
|
|
75,225 |
|
|
|
— |
|
|
|
75,225 |
|
Stock-based compensation |
|
|
— |
|
|
|
— |
|
|
|
— |
|
|
|
— |
|
|
|
— |
|
|
|
— |
|
|
|
17,971 |
|
|
|
— |
|
|
|
— |
|
|
|
17,971 |
|
Exercise of vested stock options |
|
|
260,649 |
|
|
|
— |
|
|
|
— |
|
|
|
— |
|
|
|
— |
|
|
|
— |
|
|
|
5,995 |
|
|
|
— |
|
|
|
— |
|
|
|
5,995 |
|
Cancellation of restricted stock awards |
|
|
(16,425 |
) |
|
|
— |
|
|
|
— |
|
|
|
— |
|
|
|
— |
|
|
|
— |
|
|
|
— |
|
|
|
— |
|
|
|
— |
|
|
|
— |
|
Issuance of common stock under employee stock plan, net of shares withheld for taxes |
|
|
46,683 |
|
|
|
— |
|
|
|
— |
|
|
|
— |
|
|
|
— |
|
|
|
— |
|
|
|
(429 |
) |
|
|
— |
|
|
|
— |
|
|
|
(429 |
) |
Treasury stock purchases |
|
|
— |
|
|
|
— |
|
|
|
— |
|
|
|
— |
|
|
|
4,116,570 |
|
|
|
(73,088 |
) |
|
|
(8,395 |
) |
|
|
— |
|
|
|
— |
|
|
|
(81,483 |
) |
Balance – September 30, 2022 |
|
|
155,157,220 |
|
|
$ |
155 |
|
|
|
100 |
|
|
$ |
— |
|
|
|
4,116,570 |
|
|
$ |
(73,088 |
) |
|
$ |
1,630,378 |
|
|
$ |
(113,002 |
) |
|
$ |
— |
|
|
$ |
1,444,443 |
|
Net income |
|
|
— |
|
|
|
— |
|
|
|
— |
|
|
|
— |
|
|
|
— |
|
|
|
— |
|
|
|
— |
|
|
|
67,955 |
|
|
|
— |
|
|
|
67,955 |
|
Other comprehensive income |
|
|
— |
|
|
|
— |
|
|
|
— |
|
|
|
— |
|
|
|
— |
|
|
|
— |
|
|
|
— |
|
|
|
— |
|
|
|
1,878 |
|
|
|
1,878 |
|
Stock-based compensation |
|
|
— |
|
|
|
— |
|
|
|
— |
|
|
|
— |
|
|
|
— |
|
|
|
— |
|
|
|
18,518 |
|
|
|
— |
|
|
|
— |
|
|
|
18,518 |
|
Exercise of vested stock options |
|
|
650,138 |
|
|
|
1 |
|
|
|
— |
|
|
|
— |
|
|
|
— |
|
|
|
— |
|
|
|
14,954 |
|
|
|
— |
|
|
|
— |
|
|
|
14,955 |
|
Cancellation of restricted stock awards |
|
|
(19,306 |
) |
|
|
— |
|
|
|
— |
|
|
|
— |
|
|
|
— |
|
|
|
— |
|
|
|
— |
|
|
|
— |
|
|
|
— |
|
|
|
— |
|
Issuance of common stock under employee stock plan, net of shares withheld for taxes |
|
|
179,684 |
|
|
|
— |
|
|
|
— |
|
|
|
— |
|
|
|
— |
|
|
|
— |
|
|
|
(1,528 |
) |
|
|
— |
|
|
|
— |
|
|
|
(1,528 |
) |
Treasury stock purchases |
|
|
— |
|
|
|
— |
|
|
|
— |
|
|
|
— |
|
|
|
4,151,853 |
|
|
$ |
(116,578 |
) |
|
|
— |
|
|
|
— |
|
|
|
— |
|
|
|
(116,578 |
) |
Balance – September 30, 2023 |
|
|
155,967,736 |
|
|
$ |
156 |
|
|
|
100 |
|
|
$ |
— |
|
|
|
8,268,423 |
|
|
$ |
(189,666 |
) |
|
$ |
1,662,322 |
|
|
$ |
(45,047 |
) |
|
$ |
1,878 |
|
|
$ |
1,429,643 |
|
The accompanying notes are an integral part of these Consolidated Financial Statements.
F-1
The AZEK Company Inc.
Consolidated Statements of Cash Flows
(In thousands of U.S. dollars)
|
|
Years Ended September 30, |
|
|||||||||
|
|
2023 |
|
|
2022 |
|
|
2021 |
|
|||
Operating activities: |
|
|
|
|
|
|
|
|
|
|||
Net income |
|
$ |
67,955 |
|
|
$ |
75,225 |
|
|
$ |
93,150 |
|
Adjustments to reconcile net income to net cash flows provided by |
|
|
|
|
|
|
|
|
|
|||
Depreciation expense |
|
|
86,206 |
|
|
|
67,996 |
|
|
|
51,802 |
|
Amortization expense |
|
|
46,338 |
|
|
|
50,537 |
|
|
|
49,802 |
|
Non-cash interest expense |
|
|
1,647 |
|
|
|
5,638 |
|
|
|
3,110 |
|
Non-cash lease expense |
|
|
(251 |
) |
|
|
(275 |
) |
|
|
(88 |
) |
Deferred income tax expense (benefit) |
|
|
(9,487 |
) |
|
|
19,684 |
|
|
|
25,529 |
|
Non-cash compensation expense |
|
|
18,518 |
|
|
|
27,512 |
|
|
|
22,250 |
|
Loss on disposition of property, plant and equipment |
|
|
2,220 |
|
|
|
496 |
|
|
|
1,025 |
|
Bad debt provision |
|
|
731 |
|
|
|
290 |
|
|
|
342 |
|
Changes in operating assets and liabilities: |
|
|
|
|
|
|
|
|
|
|||
Trade receivables |
|
|
31,768 |
|
|
|
(8,545 |
) |
|
|
(6,772 |
) |
Inventories |
|
|
78,688 |
|
|
|
(97,459 |
) |
|
|
(58,819 |
) |
Prepaid expenses and other current assets |
|
|
(3,675 |
) |
|
|
(4,300 |
) |
|
|
(5,892 |
) |
Accounts payable |
|
|
22,596 |
|
|
|
(32,146 |
) |
|
|
16,071 |
|
Accrued expenses and interest |
|
|
17,416 |
|
|
|
(1,345 |
) |
|
|
14,910 |
|
Other assets and liabilities |
|
|
1,872 |
|
|
|
2,527 |
|
|
|
1,259 |
|
Net cash provided by operating activities |
|
|
362,542 |
|
|
|
105,835 |
|
|
|
207,679 |
|
Investing activities: |
|
|
|
|
|
|
|
|
|
|||
Purchases of property, plant and equipment |
|
|
(88,545 |
) |
|
|
(170,938 |
) |
|
|
(175,119 |
) |
Proceeds from sale of property, plant and equipment |
|
|
202 |
|
|
|
649 |
|
|
|
46 |
|
Purchases of intangible assets |
|
|
— |
|
|
|
(1,500 |
) |
|
|
— |
|
Acquisitions, net of cash acquired |
|
|
(161 |
) |
|
|
(108,387 |
) |
|
|
— |
|
Net cash used in investing activities |
|
|
(88,504 |
) |
|
|
(280,176 |
) |
|
|
(175,073 |
) |
Financing activities: |
|
|
|
|
|
|
|
|
|
|||
Proceeds under Revolving Credit Facility |
|
|
25,000 |
|
|
|
40,000 |
|
|
|
— |
|
Payments under Revolving Credit Facility |
|
|
(25,000 |
) |
|
|
(40,000 |
) |
|
|
— |
|
Payments of financing fees related to Term Loan Agreement |
|
|
— |
|
|
|
— |
|
|
|
(939 |
) |
Payments of Term Loan Agreement |
|
|
— |
|
|
|
(467,654 |
) |
|
|
— |
|
Proceeds from 2022 Term Loan Agreement |
|
|
— |
|
|
|
595,500 |
|
|
|
— |
|
Payments on 2022 Term Loan Agreement |
|
|
(6,000 |
) |
|
|
— |
|
|
|
— |
|
Payments of debt issuance costs related to 2022 Term Loan Agreement |
|
|
— |
|
|
|
(3,442 |
) |
|
|
— |
|
Repayments of finance lease obligations |
|
|
(2,619 |
) |
|
|
(3,865 |
) |
|
|
(1,921 |
) |
Payments of INTEX contingent consideration |
|
|
(5,850 |
) |
|
|
— |
|
|
|
— |
|
Payments of initial public offering related costs |
|
|
— |
|
|
|
— |
|
|
|
(210 |
) |
Exercise of vested stock options |
|
|
14,954 |
|
|
|
5,995 |
|
|
|
5,988 |
|
Cash paid for shares withheld for taxes |
|
|
(1,528 |
) |
|
|
(429 |
) |
|
|
— |
|
Purchases of treasury stock |
|
|
(115,498 |
) |
|
|
(81,483 |
) |
|
|
— |
|
Net cash provided by (used in) financing activities |
|
|
(116,541 |
) |
|
|
44,622 |
|
|
|
2,918 |
|
Net increase (decrease) in cash and cash equivalents |
|
|
157,497 |
|
|
|
(129,719 |
) |
|
|
35,524 |
|
Cash and cash equivalents at beginning of period |
|
|
120,817 |
|
|
|
250,536 |
|
|
|
215,012 |
|
Cash and cash equivalents at end of period |
|
$ |
278,314 |
|
|
$ |
120,817 |
|
|
$ |
250,536 |
|
Supplemental cash flow disclosure: |
|
|
|
|
|
|
|
|
|
|||
Cash paid for interest, net of amounts capitalized |
|
$ |
41,728 |
|
|
$ |
14,899 |
|
|
$ |
17,119 |
|
Cash paid for income taxes, net |
|
|
34,480 |
|
|
|
10,549 |
|
|
|
4,620 |
|
Supplemental non-cash investing and financing disclosure: |
|
|
|
|
|
|
|
|
|
|||
Capital expenditures in accounts payable at end of period |
|
$ |
7,703 |
|
|
$ |
29,562 |
|
|
$ |
16,177 |
|
Right-of-use operating and finance lease assets obtained in exchange for lease liabilities |
|
|
3,830 |
|
|
|
33,400 |
|
|
|
57,817 |
|
The accompanying notes are an integral part of these Consolidated Financial Statements.
F-1
The AZEK Company Inc.
Notes to Consolidated Financial Statements
(In thousands of U.S. dollars, unless otherwise specified)
1. ORGANIZATION AND SUMMARY OF SIGNIFICANT ACCOUNTING POLICIES
a. Organization
The AZEK Company Inc. (the “Company”) is a Delaware corporation that holds all of the limited liability company interests in The AZEK Group LLC (f/k/a CPG International LLC), the entity which directly and indirectly holds all of the equity interests in the operating subsidiaries and which changed its name from CPG International LLC to The AZEK Group LLC on August 1, 2023. The Company is an industry-leading designer and manufacturer of beautiful, low-maintenance and environmentally sustainable building products for residential, commercial and industrial markets. The Company’s products include decking, railing, trim, porch, moulding, pergolas, outdoor furniture, bathroom and locker systems, as well as extruded plastic sheet products and other non-fabricated products for special applications in industrial markets. The Company operates in various locations throughout the United States. The Company’s residential products are primarily branded under the brand names AZEK®, TimberTech®, VERSATEX®, ULTRALOX®, StruXure™ and INTEX®, while the commercial products are branded under the Vycom® brand names Celtec®, Playboard®, Seaboard®, Flametec®, Designboard®, Corrtec™, Timberline®, and Scranton Products® brand names including Aria Partitions®, Eclipse Partitions®, Hiny Hiders® partitions, Tufftec Lockers® and Duralife Lockers®.
Secondary Offerings
On January 26, 2021, the Company completed an offering of 23,000,000 shares of Class A common stock, par value $0.001 per share, including the exercise in full by the underwriters of their option to purchase up to 3,000,000 additional shares of Class A common stock, at a public offering price of $40.00 per share. The shares were sold by certain of the Selling Stockholders. The Company did not receive any of the proceeds from the sale of the shares by those Selling Stockholders. In connection with the offering, the Company incurred approximately $1.2 million in expenses.
On June 1, 2021, the Company completed an offering of 17,250,000 shares of Class A common stock, par value $0.001 per share, including the exercise in full by the underwriters of their option to purchase up to 2,250,000 additional shares of Class A common stock, at a public offering price of $43.50 per share. The shares were sold by certain of the Selling Stockholders. The Company did not receive any of the proceeds from the sale of the shares by those Selling Stockholders. In connection with the offering, the Company incurred approximately $1.1 million in expenses.
During the three months ended June 30, 2023, the Company completed an offering of 16,100,000 shares of Class A common stock, par value $0.001 per share, including the exercise in full by the underwriter of its option to purchase up to 2,100,000 additional shares of Class A common stock, at a public offering price of $24.36 per share. The shares were sold by certain of the Selling Stockholders. The Company did not receive any of the proceeds from the sale of the shares by those Selling Stockholders. In connection with the offering the Company incurred approximately $1.1 million in expenses.
In connection with the offering, the Company agreed to purchase from the underwriter 1,477,832 shares of its Class A common stock being sold by the Selling Stockholders to the underwriter at a price per share equal to the price being paid by the underwriter to the Selling Stockholders, resulting in an aggregate purchase price of approximately $36.0 million.
b. Summary of Significant Accounting Policies
Basis of Presentation
The Company operates on a fiscal year ending September 30. The accompanying Consolidated Financial Statements and notes have been prepared in accordance with accounting principles generally accepted in the United States of America (“U.S. GAAP”). The Consolidated Financial Statements include the assets, liabilities and results of operations of the Company and its wholly owned subsidiaries. All material intercompany transactions and balances have been eliminated in consolidation.
The Company’s financial condition and results of operations are affected by a number of factors, including, but not limited to, the cost to manufacture and distribute products, cost of raw materials, inflation, consumer spending and preferences, interest rates, the impact of any supply chain disruptions, economic conditions, and/or any adverse effects from global health pandemics, geopolitical conflicts and other factors beyond the Company’s control. Management cannot predict the degree to, or the period over, which the Company may be affected by such factors.
F-2
Use of Estimates
The preparation of financial statements in conformity with U.S. GAAP requires management to make estimates and assumptions that affect the reported amounts of assets and liabilities and disclosure of contingent assets and liabilities at the date of the financial statements and reported amounts of revenues and expenses during the reporting period. Significant estimates include revenue recognition, reserves for excess inventory, inventory obsolescence, inventory valuation, product warranties, customer rebates, stock-based compensation, litigation, income taxes, contingent consideration, goodwill and intangible asset valuation and accounting for long-lived assets. Management’s estimates and assumptions are evaluated on an ongoing basis and are based on historical experience, current conditions and available information. Actual results may differ from estimated amounts. Estimates are revised as additional information becomes available.
Seasonality
Although the Company generally has demand for its products throughout the year, its sales have historically experienced some seasonality. The Company has typically experienced higher levels of sales of its residential products in the second fiscal quarter of the year as a result of its “early buy” sales, which encourages dealers to stock its residential products. The Company has generally experienced lower levels of sales of residential products in the first fiscal quarter due to adverse weather conditions in certain markets during the winter season. Although its products can be installed year-round, weather conditions can impact the timing of the sales of certain products. In addition, the Company has experienced higher levels of sales of its bathroom partition products and its locker products during the second half of its fiscal year, which includes the summer months when schools are typically closed and therefore are more likely to undergo remodel activities.
Revenue Recognition
The Company sells its products to residential and commercial markets. The Company’s Residential segment principally generates revenue from the manufacture and sale of its premium, low-maintenance composite decking, railing, trim, moulding, pergolas and cabanas and accessories. The Company’s Commercial segment generates revenue from the sale of its partition and locker systems along with plastic sheeting and other non-fabricated products for special applications in industrial markets.
The Company recognizes revenues when control of the promised goods is transferred to the Company’s customers in an amount that reflects the consideration the Company expects to be entitled to in exchange for those goods, at a point in time, when shipping occurs. Each product the Company transfers to the customer is considered one performance obligation. The Company has elected to account for shipping and handling costs as activities to fulfill the promise to transfer the goods. As a result of this accounting policy election, the Company does not consider shipping and handling activities as promised services to its customers. Shipping and handling costs billed to customers are recorded in net sales. The Company records all shipping and handling costs as “Cost of sales”.
Customer contracts are typically fixed price and short-term in nature. The transaction price is based on the product specifications and is determined at the time of order. The Company does not engage in contracts greater than one year, and therefore does not have any incremental costs capitalized as of September 30, 2023 or September 30, 2022. The Company may offer various sales incentive programs throughout the year. It estimates the amount of sales incentive to allocate to each performance obligation, or product shipped, using the most-likely-amount method of estimation, based on sales to the direct customer or sell-through customer. The estimate is updated each reporting period and any changes are allocated to the performance obligations on the same basis as at inception. Changes in estimate allocated to a previously satisfied performance obligation are recognized as part of net revenue in the period in which the change occurs under the cumulative catch-up method. In addition to sales incentive programs, the Company may offer a payment discount, if payments are received within 30 days. The Company estimates the payment discount that it believes will be taken by the customer based on prior history and using the most-likely-amount method of estimation. The Company believes the most-likely-amount method best predicts the amount of consideration to which it will be entitled. The payment discounts are also reflected as part of net revenue. The total amount of incentives were $132.6 million, $105.8 million and $92.5 million for the years ended September 30, 2023, 2022 and 2021, respectively.
The Company records deferred revenue when cash payments are received or due in advance of the Company’s performance.
Earnings Per Share
Basic net income per common share is computed based on the weighted average number of common shares outstanding. Potentially dilutive shares are included in the diluted per-share calculations using the treasury stock method for the periods in fiscal year 2020 when the effect of their inclusion is dilutive. Refer to Note 15 for additional information.
F-3
Advertising Costs
Advertising costs primarily relate to trade publication advertisements, cooperative advertising, product brochures and samples. Such costs are expensed as incurred and are included in “Selling, general and administrative expenses” within the Consolidated Statements of Comprehensive Income. Total advertising expenses were approximately $62.2 million, $52.5 million and $37.8 million for the years ended September 30, 2023, 2022 and 2021, respectively.
Research and Development Costs
Research and development costs primarily relate to new product development, product claims support and manufacturing process improvements. Such costs are expensed as incurred and are included in “Selling, general and administrative expenses” within the Consolidated Statements of Comprehensive Income. Total research and development expenses were approximately $9.2 million, $9.5 million, and $7.4 million, for the years ended September 30, 2023, 2022 and 2021, respectively.
Cash and Cash Equivalents
The Company considers cash and highly liquid investments with an original maturity of three months or less to be cash and cash equivalents. Cash and cash equivalents are stated at cost, which approximates or equals fair value due to their short-term nature.
Concentrations and Credit Risk
The Company’s financial instruments that are exposed to concentrations of credit risk consist primarily of cash and cash equivalents and trade accounts receivable. As of September 30, 2023, cash and cash equivalents were maintained at major financial institutions in the United States, and current deposits are in excess of insured limits. The Company believes these institutions have sufficient assets and liquidity to conduct their operations in the ordinary course of business with little or no credit risk to the Company. The Company has not experienced any losses in such accounts.
Sales to certain Residential segment distributors accounted for 10% or more of the Company’s total net sales in 2023, 2022 and 2021 were as follows:
|
|
Years Ended September 30, |
|
|||||||||
|
|
2023 |
|
|
2022 |
|
|
2021 |
|
|||
Distributor A |
|
|
18.7 |
% |
|
|
19.3 |
% |
|
|
23.3 |
% |
At September 30, 2023, receivables from one customer represented 17.2% of gross trade receivables. At September 30, 2022, two customers each represented more than 10% of gross trade receivables: Customer A was 10.6% and Customer B was 14.8%.
For each year ended September 30, 2023, 2022 and 2021, approximately 17%, 16% and 18%, respectively, of the Company’s materials purchases were purchased from its largest supplier.
Allowance for losses
The Company routinely assesses the financial strength of its customers and believes that its trade receivables credit risk exposure is limited. The allowance for losses is our estimate of credit losses associated with trade receivables balances. An estimate of expected credit losses is recognized as a valuation allowance and adjusted each reporting period. The estimate is based on the current expected credit loss model and is determined by management in the course of regularly evaluating individual customer receivables. This evaluation takes into consideration a customer’s financial condition and credit history, as well as current economic conditions. Amounts are written-off if and when they are determined to be uncollectible.
Inventories
Inventories (mainly petrochemical resin in raw materials and finished goods), are valued at the lower of cost or net realizable value and are reduced for slow-moving and obsolete inventory. Management assesses the need for, and the amount of, obsolescence write-down based on customer demand of the item, the quantity of the item on hand and the length of time the item has been in inventory. Further, management also considers net realizable value in assessing inventory balances.
Inventory costs include those costs directly attributable to products, including all manufacturing overhead but excluding costs to distribute. The inventories cost is recorded at standard cost, which approximates actual cost, on the first-in first-out basis (“FIFO”).
F-4
During the fourth quarter of fiscal year 2022, the Company updated the process by which it estimates the value of its inventory. This included updating the assumptions that are used in determining and treating certain capitalized costs, primarily by incorporating the impacts of changes in the amount of recycled content introduced into the Company’s products since its last standard costing revaluation.
Vendor Rebates
Certain vendor rebates and incentives are earned by the Company only when specified levels of periodic purchases are achieved. These vendor rebates are recognized based on a systematic and rational allocation of the cash consideration offered in respect of each of the underlying transactions, provided the amounts are probable and reasonably estimable. The Company records the incentives as a reduction in the cost of inventory. The Company records such incentives during interim periods based on actual results achieved on a year-to-date basis and its expectation that purchase levels will be obtained to earn the rebate.
Customer Rebates
The Company offers rebates to customers based on total amounts purchased by each customer during each calendar year. The Company provides for the estimated cost of rebates at the time revenue is recognized based on rebate program rates and anticipated sales to each customer eligible for rebates and other available information. Management reviews and adjusts these estimates, if necessary, based on the differences between actual experience and historical estimates. Refer to Note 2 for additional information.
Product Warranties
The Company provides product assurance warranties of various lengths and terms to certain customers based on standard terms and conditions. The Company provides for the estimated cost of warranties at the time revenue is recognized based on management’s judgment, considering such factors as cost per claim, historical experience, anticipated rates of claims, and other available information. Management reviews and adjusts these estimates, if necessary, based on the differences between actual experience and historical estimates. Refer to Note 8 for additional information.
Property, Plant and Equipment, Net
Property, plant and equipment (“PP&E”) is recorded at cost, net of accumulated depreciation. Major additions and betterments are capitalized while repair and/or maintenance expenses are charged to operations when incurred. Construction in progress is also recorded at cost and includes capitalized interest, if material.
Depreciation for financial reporting purposes is computed using the straight-line method over the following estimated useful lives of the assets:
Land improvements |
|
10 years |
Building and improvements |
|
7-40 years |
Manufacturing equipment |
|
1-15 years |
Office furniture and equipment |
|
3-12 years |
Vehicles |
|
5 years |
Computer equipment |
|
3-7 years |
Leasehold improvements are recorded at cost and depreciated over the standard life of the type of asset or the remaining life of the lease, whichever is shorter. Equipment held under capital leases is stated at the lower of the fair value of the asset or the net present value of the future minimum lease payments at the inception of the lease. For equipment held under capital leases, depreciation is computed using the straight-line method over the shorter of the estimated useful lives of the leased assets or the related lease term and is included within depreciation expense.
PP&E is evaluated for impairment at the asset group level. If a triggering event suggests that a potential impairment has occurred, recoverability of these assets is assessed by evaluating whether or not future estimated undiscounted net cash flows are less than the carrying amount of the assets. If the estimated cash flows are less than the carrying amount, the assets are written down to their fair value through an impairment loss recognized as a non-cash component of “Operating income (loss)” within the Consolidated Statements of Comprehensive Income. The Company did not record an impairment charge for the years ended September 30, 2023, 2022 and 2021.
F-5
During the year ended September 30, 2023, 2022 and 2021, the Company recognized losses on disposal of fixed assets in the ordinary course of business of $0.2 million, $0.5 million and $1.0 million, respectively, the losses related to assets in the Residential segment. These losses are classified as “Loss on disposal of property, plant and equipment” in a separate caption within the Consolidated Statements of Comprehensive Income within “Operating income”.
Leases
Right-of-use (“ROU”) assets represent our right to use an underlying asset for the lease term and lease liabilities represent our obligation to make lease payments arising from the lease. ROU assets and lease liabilities are recognized at the lease commencement date based on the present value of lease payments over the lease term. The discount rate used to calculate the present value represents our incremental borrowing rate and is calculated based on the treasury yield curve commensurate with the term of each lease, and a spread representative of our borrowing costs. Our lease terms may include options to extend or terminate the lease when it is reasonably certain that we will exercise that option. Leases may be classified as either operating leases or finance leases. We have made an accounting policy election to not include leases with an initial term of 12 months or less on the balance sheet. See Note 9—Leases for additional information.
Goodwill
The Company accounts for goodwill as the excess of the purchase price over the net amount of identifiable assets acquired and liabilities assumed in a business combination measured at fair value. The Company assigns goodwill to six reporting units based on which reporting unit is expected to benefit from the business combination as of the acquisition date. Goodwill is not subject to amortization; rather, the Company tests goodwill for impairment annually during the fourth fiscal quarter ended September 30 or more frequently if an event occurs or circumstances change in the interim that would more likely than not reduce the fair value of the asset below the carrying amount. The impairment evaluation may begin with a qualitative assessment of the factors that could impact the significant inputs used to estimate fair value to determine if it is more likely than not that the fair value of the reporting unit is less than its carrying amount or the Company may elect to bypass the qualitative assessment and proceed to a quantitative assessment to determine if goodwill is impaired. In quantitative impairment tests, if the estimated fair value of a reporting unit exceeds the carrying value, the Company considers that goodwill is not impaired. If the carrying value exceeds estimated fair value, there is an impairment of goodwill and an impairment loss is recorded. The Company calculates the impairment loss by comparing the fair value of the reporting unit less the carrying amount, including goodwill. Goodwill impairment would be limited to the carrying value of the goodwill.
In performing the quantitative test, the Company measures the fair value of the reporting units to which goodwill is allocated using an income-based approach, a generally accepted valuation methodology, and relevant data available through the testing date. Under the income approach, fair value is determined using a discounted cash flow method, projecting future cash flows of each reporting unit, as well as a terminal value, and discounting such cash flows at a rate of return that reflects the relative risk of the cash flows. The key assumptions and factors used in this approach include, but are not limited to, revenue growth rates and profit margins based on internal Company forecasts, discount rates, perpetuity growth rates, future capital expenditures, and working capital requirements, among others, and a review of comparable market multiples for the industry segment as well as historical operating trends for the Company.
The Company completed the annual goodwill impairment tests as of August 1, 2023, 2022 and 2021, using a quantitative assessment for all six of the reporting units, a qualitative assessment for five reporting units and a quantitative assessment for one of the reporting units, and a qualitative assessment for three reporting units and a quantitative assessment for one of the reporting units, respectively. As a result of these respective annual assessments, the Company noted that the fair value of each reporting unit was determined to be in excess of the carrying value and as such, there were no impairment charges for the years ended September 30, 2023, 2022 and 2021. Refer to Note 5 for additional information.
Intangible Assets, Net
Amortizable intangible assets include proprietary knowledge, trademarks, customer relationships and other intangible assets. The Company does not have any indefinite lived intangible assets other than goodwill. The intangible assets are being amortized on an accelerated basis using the sum of the years’ digits method over their estimated useful lives, which range from 3 to 20 years, reflecting the pattern in which the economic benefits are consumed or otherwise used up. The Company evaluates whether events or circumstances have occurred that warrant a revision to the remaining useful lives of intangible assets. In cases where a revision is deemed appropriate, the remaining carrying amounts of the intangible assets are amortized over the revised remaining useful lives.
The Company evaluates amortizable intangible assets for potential impairment whenever events or changes in circumstances indicate that the carrying amounts of the assets may not be fully recoverable.
F-6
If a triggering event suggests that a potential impairment has occurred, recoverability of these assets is assessed by evaluating the probability that future estimated undiscounted net cash flows will be less than the carrying amount of the long-lived assets. If the estimated cash flows are less than the carrying amount of the long-lived assets, the assets are written down to their fair value through an impairment loss recognized as a non-cash component of “Operating income (loss)”. The Company did not record an impairment charge for the years ended September 30, 2023, 2022 and 2021. Refer to Note 5 for additional information.
Deferred Financing Costs, Net
The Company has recorded deferred financing costs incurred in conjunction with its debt obligations. The Company amortizes debt issuance costs over the remaining life of the related debt using the straight-line method for the Revolving Credit Facility and the effective interest method for other debt. Deferred financing costs, net of accumulated amortization, are presented as “Other assets” (non-current) in the Consolidated Balance Sheets, insofar as they relate to the Revolving Credit Facility. Deferred financing costs related to the 2022 Term Loan Agreement are recorded as a reduction of “Long-term debt – less current portion” in the Consolidated Balance Sheets. Refer to Note 7 for additional information.
Stock-Based Compensation
The Company determines the expense for all employee stock-based compensation awards by estimating their fair value and recognizing such value as an expense, on a straight-line, ratable or cliff basis, depending on the award, in the Consolidated Financial Statements over the requisite service period in which employees earn the awards. The Company estimates the fair value for service-based awards granted to employees using the Black Scholes pricing model. The fair value of performance-based awards that are expected to vest is recognized as compensation expense on a straight-line basis over the requisite service period. The fair value of service-based awards that are expected to vest is recognized as compensation expense on either (1) straight-line basis, (2) a ratable vesting basis or (3) a cliff vesting basis. The Company accounts for forfeitures as they occur.
To determine the fair value of a stock-based award using Black Scholes models, the Company makes assumptions regarding the risk-free interest rate, expected future volatility, expected dividend yield and performance period. The risk-free rate is based on the U.S. treasury yield curve in effect at the time of grant. The Company estimates the expected volatility of the share price by reviewing the estimated post-IPO volatility levels of its common stock in conjunction with the historical volatility levels of public companies that operate in similar industries or are similar in terms of stage of development or size and then projecting this information toward its future expected volatility. The Company exercises judgment in selecting these companies, as well as in evaluating the available historical and implied volatility for these companies. Dividend yield is determined based on the Company’s future plans to pay dividends. The Company calculates the performance period based on the specific market condition to be achieved and derived from estimates of future performance. The Company calculates the expected term in years for each stock option using a simplified method based on the average of each option’s vesting term and original contractual term. The simplified method is used due to the lack of sufficient historical data available to provide a reasonable basis upon which to estimate the expected term of each stock option.
Refer to Note 13 for additional information.
Estimated Fair Value of Financial Instruments
The carrying amounts for the Company’s financial instruments classified as current assets and liabilities, including cash and cash equivalents, trade accounts receivable and accrued expenses and accounts payable, approximate fair value due to their short maturities.
Fair value is estimated by applying the following hierarchy, which prioritizes the inputs used to measure fair value into three levels and bases the categorization within the hierarchy upon the lowest level of input that is available and significant to the fair value measurement:
Level 1—Quoted prices in active markets for identical assets or liabilities.
Level 2—Observable inputs other than quoted prices in active markets for identical assets and liabilities, quoted prices for identical or similar assets or liabilities in inactive markets, or other inputs that are observable or can be corroborated by observable market data for substantially the full term of the assets or liabilities.
Level 3—Inputs that are generally unobservable and typically reflect management’s estimate of assumptions that market participants would use in pricing the asset or liability.
Refer to Note 10 for additional information.
F-7
Derivatives
The Company uses interest rate swap agreements to hedge its exposure to interest rate risk on its senior secured credit facilities. The Company designates derivatives that meet specific accounting criteria as qualifying hedges at inception. These criteria require the Company to have the expectation that the derivative will be highly effective at offsetting changes in the fair value or expected cash flows of the hedged exposure, both at inception of the hedging relationship and on an ongoing basis.
The Company recognizes all derivative instruments at fair value and classifies them on the balance sheet as either Other current assets, Other assets, Accrued expenses and other liabilities or Other non-current liabilities. The interest rate swap agreements are designated as cash flow hedges. For cash flow hedges, the Company records the effective portion of the change in fair value of the derivative as part of Accumulated other comprehensive income and recognizes those changes in earnings in the period the hedged transaction affects earnings. The Company recognizes any ineffective portion of the change in the fair value of the derivative immediately in earnings.
See Note 10 for additional information.
Income Taxes
Income taxes are provided on income reported for financial statement purposes, adjusted for permanent differences between financial statement reporting and income tax regulations. A valuation allowance is established whenever management believes that it is more likely than not that deferred tax assets may not be realizable. Deferred tax assets and liabilities are measured using enacted tax rates expected to apply to taxable income in the year in which the deferred tax assets or liabilities are expected to be realized or settled.
The realization of the net deferred tax assets is primarily dependent on estimated future taxable income. A change in the Company’s estimate of future taxable income may require an increase or decrease in the valuation allowance.
A liability for uncertain tax positions is recorded whenever management believes it is not more-likely than-not the position will be sustained on examination based solely on its technical merits. Interest and penalties related to underpayment of income taxes are classified as income tax expense. It is inherently difficult and subjective to estimate such amounts, as the Company has to determine the probability of various possible outcomes. The Company reevaluates these uncertain tax positions on a quarterly basis. This evaluation is based on factors including, but not limited to, changes in facts or circumstances, changes in tax law, effectively settled issues under audit, voluntary settlements and new audit activity. Such a change in recognition or measurement would result in the recognition of a tax benefit or an additional charge to the tax provision.
Revision of Previously Filed Quarterly Reports
During the fourth quarter of fiscal year 2023, the Company identified an error in its statement of cash flows related to classification of contingent consideration payments in connection with a recent acquisition. In the six and nine month periods ended March 31, 2023 and June 30, 2023, the Company classified such payments made more than three months from the date of the acquisition of $1.0 million and $5.8 million, respectively, within the operating activities section as opposed to within the financing activities section of the statement of cash flows. The Company evaluated the impact of the errors individually and in the aggregate on its previously issued financial statements, from both a qualitative and a quantitative perspective, and concluded that the errors were not material to any of the prior periods or to the current period financial statements. The Company determined that it will be appropriate to revise the related historical periods within statement of cash flows in the quarterly reports to be filed for the six and nine month periods ending March 31, 2024 and June 30, 2024 to achieve comparability in the financial statements.
Recently Adopted Accounting Pronouncements
On October 1, 2021, the Company adopted ASU No. 2019-12, Income Taxes (Topic 740)—Simplifying the Accounting for Income Taxes. This standard simplifies the accounting for income taxes by removing certain exceptions to general principles in Topic 740 and clarifying and amending existing guidance. The adoption of the standard did not have a material impact on the Company’s Consolidated Financial Statements.
Recently Issued Accounting Pronouncements
None.
F-8
2. REVENUE
The Company sells its products to residential and commercial markets. The Company’s Residential segment principally generates revenue from the manufacture and sale of its premium, low-maintenance composite decking, railing, trim, moulding, pergolas and cabanas and accessories. The Company’s Commercial segment generates revenue from the sale of its partition and locker systems along with plastic sheeting and other non-fabricated products for special applications in industrial markets.
The Company recognizes revenues when control of the promised goods is transferred to the Company’s customers in an amount that reflects the consideration the Company expects to be entitled to in exchange for those goods, at a point in time, when shipping occurs. Each product the Company transfers to the customer is considered one performance obligation. The Company has elected to account for shipping and handling costs as activities to fulfill the promise to transfer the goods. As a result of this accounting policy election, the Company does not consider shipping and handling activities as promised services to its customers.
Customer contracts are typically fixed price and short-term in nature. The transaction price is based on the product specifications and is determined at the time of order. The Company may offer various sales incentive programs throughout the year. It estimates the amount of sales incentive to allocate to each performance obligation, or product shipped, using the most-likely-amount method of estimation, based on sales to the direct customer or sell-through customer. The estimate is updated each reporting period and any changes are allocated to the performance obligations on the same basis as at inception. Changes in estimate allocated to a previously satisfied performance obligation are recognized as part of net revenue in the period in which the change occurs under the cumulative catch-up method. In addition to sales incentive programs, the Company may offer a payment discount, if payments are received within thirty days. The Company estimates the payment discount that it believes will be taken by the customer based on prior history and using the most-likely-amount method of estimation. The Company believes the most-likely-amount method best predicts the amount of consideration to which it will be entitled. The payment discounts are also reflected as part of net revenue.
The Company also engages in customer rebates, which are recorded in “Net sales” in the Consolidated Statements of Comprehensive Income and in “Accrued rebates” and “Trade receivables” in the Consolidated Balance Sheets. The Company recorded accrued rebates of $61.0 million, $50.5 million and $44.3 million as of September 30, 2023, 2022 and 2021, respectively, and contra trade receivables of $6.0 million, $6.1 million and $3.3 million as of September 30, 2023, 2022 and 2021, respectively. The rebate activity was as follows (in thousands).
|
|
As of September 30, |
|
|||||||||
|
|
2023 |
|
|
2022 |
|
|
2021 |
|
|||
Beginning balance |
|
$ |
56,542 |
|
|
$ |
47,648 |
|
|
$ |
32,679 |
|
Rebate expense |
|
|
106,762 |
|
|
|
88,057 |
|
|
|
76,763 |
|
Rebate payments |
|
|
(96,346 |
) |
|
|
(79,163 |
) |
|
|
(61,794 |
) |
Ending balance |
|
$ |
66,958 |
|
|
$ |
56,542 |
|
|
$ |
47,648 |
|
The Company records deferred revenue when cash payments are received or due in advance of the Company’s performance.
3. INVENTORIES
Inventories are valued at the lower of cost or net realizable value, and are reduced for slow-moving and obsolete inventory. The inventories cost is recorded at standard cost, which approximates actual cost, on a first-in first-out (“FIFO”) basis. Inventories consisted of the following (in thousands):
|
|
As of September 30, |
|
|||||
|
|
2023 |
|
|
2022 |
|
||
Raw materials |
|
$ |
67,330 |
|
|
$ |
72,464 |
|
Work in process |
|
|
37,038 |
|
|
|
39,829 |
|
Finished goods |
|
|
116,733 |
|
|
|
187,612 |
|
Total inventories |
|
$ |
221,101 |
|
|
$ |
299,905 |
|
.
F-9
4. PROPERTY, PLANT AND EQUIPMENT — NET
Property, plant and equipment — net consisted of the following (in thousands):
|
|
As of September 30, |
|
|||||
|
|
2023 |
|
|
2022 |
|
||
Land and improvements |
|
$ |
4,829 |
|
|
$ |
3,350 |
|
Buildings and improvements |
|
|
129,031 |
|
|
|
110,300 |
|
Manufacturing equipment |
|
|
624,754 |
|
|
|
540,536 |
|
Computer equipment |
|
|
32,300 |
|
|
|
28,198 |
|
Furnitures and fixtures |
|
|
7,290 |
|
|
|
6,867 |
|
Vehicles |
|
|
1,105 |
|
|
|
941 |
|
Total property, plant and equipment |
|
|
799,309 |
|
|
|
690,192 |
|
Construction in progress |
|
|
94,422 |
|
|
|
140,566 |
|
|
|
|
893,731 |
|
|
|
830,758 |
|
Accumulated depreciation |
|
|
(392,708 |
) |
|
|
(312,845 |
) |
Total property, plant and equipment – net |
|
$ |
501,023 |
|
|
$ |
517,913 |
|
Depreciation expense was approximately $81.2 million, $64.5 million and $50.6 million in the years ended September 30, 2023, 2022 and 2021, respectively. During the years ended September 30, 2023, 2022 and 2021, $5.2 million, $5.6 million and $2.2 million of interest was capitalized, respectively.
5. GOODWILL AND INTANGIBLE ASSETS — NET
Goodwill
Goodwill consisted of the following (in thousands):
|
|
Residential |
|
|
Commercial |
|
|
Total |
|
|||
Goodwill before impairment as of September 30, 2022 |
|
$ |
953,606 |
|
|
$ |
72,589 |
|
|
$ |
1,026,195 |
|
Accumulated impairment losses as of September 30, 2022 |
|
|
— |
|
|
|
(32,200 |
) |
|
|
(32,200 |
) |
Goodwill, net as of September 30, 2022 |
|
$ |
953,606 |
|
|
$ |
40,389 |
|
|
$ |
993,995 |
|
Acquisitions |
|
|
276 |
|
|
|
— |
|
|
|
276 |
|
Goodwill before impairment as of September 30, 2023 |
|
$ |
953,882 |
|
|
$ |
72,589 |
|
|
$ |
1,026,471 |
|
Accumulated impairment losses as of September 30, 2023 |
|
|
— |
|
|
|
(32,200 |
) |
|
|
(32,200 |
) |
Goodwill, net as of September 30, 2023 |
|
$ |
953,882 |
|
|
$ |
40,389 |
|
|
$ |
994,271 |
|
Intangible assets, net
The Company does not have any indefinite lived intangible assets other than goodwill as of September 30, 2023 and 2022.
Finite-lived intangible assets consisted of the following (in thousands):
|
|
|
|
As of September 30, 2023 |
|
|||||||||
|
|
Lives in |
|
Gross |
|
|
Accumulated |
|
|
Net |
|
|||
Propriety knowledge |
|
10 — 15 |
|
$ |
300,400 |
|
|
$ |
(253,608 |
) |
|
$ |
46,792 |
|
Trademarks |
|
5 — 20 |
|
|
230,240 |
|
|
|
(164,759 |
) |
|
|
65,481 |
|
Customer relationships |
|
12 — 19 |
|
|
176,852 |
|
|
|
(92,268 |
) |
|
|
84,584 |
|
Patents |
|
9 — 10 |
|
|
8,500 |
|
|
|
(5,913 |
) |
|
|
2,587 |
|
Other intangible assets |
|
3 — 15 |
|
|
4,076 |
|
|
|
(4,023 |
) |
|
|
53 |
|
Total intangible assets |
|
|
|
$ |
720,068 |
|
|
$ |
(520,571 |
) |
|
$ |
199,497 |
|
F-10
|
|
|
|
As of September 30, 2022 |
|
|||||||||
|
|
Lives in |
|
Gross |
|
|
Accumulated |
|
|
Net |
|
|||
Propriety knowledge |
|
10 — 15 |
|
$ |
300,400 |
|
|
$ |
(236,024 |
) |
|
$ |
64,376 |
|
Trademarks |
|
5 — 20 |
|
|
230,240 |
|
|
|
(151,259 |
) |
|
|
78,981 |
|
Customer relationships |
|
12 — 19 |
|
|
176,852 |
|
|
|
(78,015 |
) |
|
|
98,837 |
|
Patents |
|
9 — 10 |
|
|
8,500 |
|
|
|
(4,950 |
) |
|
|
3,550 |
|
Other intangible assets |
|
3 — 15 |
|
|
4,076 |
|
|
|
(3,985 |
) |
|
|
91 |
|
Total intangible assets |
|
|
|
$ |
720,068 |
|
|
$ |
(474,233 |
) |
|
$ |
245,835 |
|
Amortization expense was approximately $46.3 million, $50.5 million and $49.8 million for the years September 30, 2023, 2022 and 2021, respectively. As of September 30, 2023, the remaining weighted average amortization period for acquired intangible assets was 11.2 years.
Amortization expense relating to these amortizable intangible assets as of September 30, 2023, is expected to be as follows (in thousands):
2024 |
|
$ |
40,748 |
|
2025 |
|
|
35,204 |
|
2026 |
|
|
29,660 |
|
2027 |
|
|
24,115 |
|
2028 |
|
|
18,572 |
|
Thereafter |
|
|
51,198 |
|
Total |
|
$ |
199,497 |
|
6. COMPOSITION OF CERTAIN BALANCE SHEET ACCOUNTS
Allowance for Losses
Allowance for losses consisted of the following (in thousands):
|
|
As of September 30, |
|
|||||||||
|
|
2023 |
|
|
2022 |
|
|
2021 |
|
|||
Beginning balance |
|
$ |
1,397 |
|
|
$ |
1,109 |
|
|
$ |
1,332 |
|
Provision |
|
|
731 |
|
|
|
290 |
|
|
|
342 |
|
Bad debt write-offs |
|
|
(355 |
) |
|
|
(2 |
) |
|
|
(565 |
) |
Ending balance |
|
$ |
1,773 |
|
|
$ |
1,397 |
|
|
$ |
1,109 |
|
F-11
Accrued Expenses and Other Liabilities
Accrued expenses consisted of the following (in thousands):
|
|
As of September 30, |
|
|||||
|
|
2023 |
|
|
2022 |
|
||
Employee related liabilities |
|
$ |
34,313 |
|
|
$ |
36,866 |
|
Taxes |
|
|
6,959 |
|
|
|
142 |
|
Lease liability operating |
|
|
4,180 |
|
|
|
5,223 |
|
Customer deposits |
|
|
4,152 |
|
|
|
2,494 |
|
Marketing |
|
|
3,868 |
|
|
|
4,272 |
|
Construction in progress |
|
|
2,863 |
|
|
|
9,032 |
|
Lease liability finance |
|
|
2,777 |
|
|
|
2,366 |
|
Warranty |
|
|
2,739 |
|
|
|
2,900 |
|
Utilities |
|
|
2,141 |
|
|
|
794 |
|
Professional fees |
|
|
2,073 |
|
|
|
2,089 |
|
Freight |
|
|
1,242 |
|
|
|
1,821 |
|
Commissions |
|
|
991 |
|
|
|
1,032 |
|
Other |
|
|
3,696 |
|
|
|
3,558 |
|
Total accrued expenses and other current liabilities |
|
$ |
71,994 |
|
|
$ |
72,589 |
|
7. DEBT
Debt consisted of the following (in thousands):
|
|
As of September 30, |
|
|||||
|
|
2023 |
|
|
2022 |
|
||
2022 Term Loan due April 28, 2029 — SOFR + 2.50% + 0.1% (7.92% at September 30, 2023 and 4.09% at September 30, 2022) |
|
$ |
594,000 |
|
|
$ |
600,000 |
|
Revolving Credit Facility through March 31, 2026 - SOFR + 0.1% |
|
|
— |
|
|
|
— |
|
Total |
|
|
594,000 |
|
|
|
600,000 |
|
Less unamortized deferred financing fees |
|
|
(3,996 |
) |
|
|
(4,712 |
) |
Less unamortized original issue discount |
|
|
(3,739 |
) |
|
|
(4,409 |
) |
Less current portion |
|
|
(6,000 |
) |
|
|
(6,000 |
) |
Long-term debt — less current portion and unamortized |
|
$ |
580,265 |
|
|
$ |
584,879 |
|
As of September 30, 2023, the Company scheduled fiscal year debt payment on the 2022 Term Loan Agreement as follows (in thousands):
2024 |
|
$ |
6,000 |
|
2025 |
|
|
6,000 |
|
2026 |
|
|
6,000 |
|
2027 |
|
|
6,000 |
|
2028 |
|
|
6,000 |
|
Thereafter |
|
|
564,000 |
|
Total |
|
$ |
594,000 |
|
Term Loan Agreements
The term loan agreement, as amended and restated from time to time (the “Term Loan Agreement”), was a first lien term loan originally entered into on September 30, 2013 by the Company’s wholly-owned subsidiary, The AZEK Group LLC (as successor-in-interest to CPG Merger Sub LLC), as the initial borrower with a syndicate of lenders party thereto. On April 28, 2022, the obligations under the Term Loan Agreement were paid off in full and the Term Loan Agreement was terminated.
F-12
On April 28, 2022, The AZEK Group LLC entered into a new $600.0 million first lien term loan credit agreement (the “2022 Term Loan Agreement”), the proceeds of which were applied, among other uses, to prepay the obligations of the Term Loan Agreement in full. The 2022 Term Loan Agreement is a first lien term loan and will mature on April 28, 2029, subject to acceleration or prepayment. The 2022 Term Loan Agreement will amortize in equal quarterly installments of 0.25% of the aggregate principal amount of the loans outstanding, subject to reduction for certain prepayments. The loans thereunder bear an interest rate equal to (i) in the case of ABR borrowings, the highest of (a) the Federal Funds Rate plus 0.50%, (b) the Prime Rate as in effect on such day and (c) the one-month Term Secured Overnight Financing Rate ("SOFR") plus 1.00% per annum, provided that in no event will the alternative base rate be less than 1.50% per annum, plus an applicable margin of 1.50% and (ii) in the case of SOFR borrowings, the Term SOFR rate for the applicable interest period, in each case, plus an applicable margin of 2.50%. As of September 30, 2023 and 2022, The AZEK Group LLC had $594.0 million and $600.0 million outstanding under the 2022 Term Loan Agreement.
The obligations under the 2022 Term Loan Agreement are secured by a first priority security interest in the membership interests of The AZEK Group LLC owned by the Company, the equity interests of The AZEK Group LLC’s domestic subsidiaries, other than certain immaterial subsidiaries and other excluded subsidiaries, and all remaining assets not constituting Revolver Priority Collateral (as defined below and subject to certain exceptions) of the Company, The AZEK Group LLC and the subsidiaries of The AZEK Group LLC that are guarantors under the 2022 Term Loan Agreement (the “Term Loan Priority Collateral”), and a second priority security interest in the Revolver Priority Collateral. The obligations under the 2022 Term Loan Agreement are guaranteed by the Company and the wholly owned domestic subsidiaries of The AZEK Group LLC other than certain immaterial subsidiaries and other excluded subsidiaries.
Loans under the 2022 Term Loan Agreement may be voluntarily prepaid in whole, or in part, in each case without premium or penalty, subject to certain customary conditions. The 2022 Term Loan Agreement also requires mandatory prepayments of loans under the 2022 Term Loan Agreement from the proceeds of certain debt issuances and certain asset dispositions (subject to certain reinvestment rights) and, commencing with the fiscal year ended September 30, 2023, a percentage of excess cash flow (subject to step-downs upon The AZEK Group LLC achieving certain leverage ratios and other reductions in connection with other debt prepayments).
The 2022 Term Loan Agreement contains affirmative covenants, negative covenants and events of default, which are broadly consistent with those in the Revolving Credit Facility (with certain differences consistent with the differences between a revolving loan and term loan) and that are customary for facilities of this type. The 2022 Term Loan Agreement does not have any financial maintenance covenants. The 2022 Term Loan Agreement also includes customary events of default, including the occurrence of a change of control.
In connection with the April 28, 2022 refinancing, the Company recognized $5.1 million in interest expense in the year ended September 30, 2022, of which $0.5 million is related to the write-off of unamortized debt discount and debt issuance costs and $4.6 million is related to third-party costs of debt modification. The Company incurred $4.5 million in lender fees which, together with $1.8 million in remaining unamortized debt discount and debt issuance costs and $3.4 million in third-party costs for new lenders, have been recorded as a reduction of long-term debt and are being amortized over the remaining contractual life of the 2022 Term Loan Agreement using the effective interest method.
As of September 30, 2023 and 2022, unamortized deferred financing fees related to the 2022 Term Loan Agreement were $4.0 million and $4.7 million.
Revolving Credit Facility
The AZEK Group LLC has also entered into a revolving credit facility, as amended and restated from time to time (the “Revolving Credit Facility”), with certain of our direct and indirect subsidiaries and certain lenders party thereto. The Revolving Credit Facility provides for maximum aggregate borrowings of up to $150.0 million, subject to an asset-based borrowing base. The borrowing base is limited to a set percentage of eligible accounts receivable and inventory, less reserves that may be established by the administrative agent and the collateral agent in the exercise of their reasonable credit judgment.
The AZEK Group LLC had no outstanding borrowings under the Revolving Credit Facility as of September 30, 2023 and September 30, 2022. In addition, The AZEK Group LLC had $2.8 million of outstanding letters of credit held against the Revolving Credit Facility as of both September 30, 2023 and September 30, 2022. The AZEK Group LLC had approximately $147.2 million available under the borrowing base for future borrowings as of September 30, 2023. The AZEK Group LLC also has the option to increase the commitments under the Revolving Credit Facility by up to $100.0 million, subject to certain conditions.
On March 31, 2021, The AZEK Group LLC amended the Revolving Credit Facility, resulting in a repricing and extension thereof.
F-13
Pursuant to such amendment, the interest rate has been reduced by 25 basis points to (i) for ABR borrowings, the highest of (a) the Federal Funds Rate plus 50 basis points, (b) the prime rate and (c) the LIBOR as of such date for a deposit in U.S. dollars with a maturity of one month plus 100 basis points, plus, in each case, a spread of 25 to 75 basis points, based on average historical availability, or (ii) for Eurocurrency borrowings, adjusted LIBOR plus a spread of 125 to 175 basis points, based on average historical availability. The maturity date for the Revolving Credit Facility was extended from May 9, 2022 to the earlier of March 31, 2026 and the date that is 91 days prior to the maturity of the Term Loan Agreement or any permitted refinancing thereof.
In connection with the March 31, 2021 amendment, the Company recognized $0.1 million in interest expense in the year ended September 30, 2021 related to the write-off of unamortized debt issuance costs. The Company incurred $0.9 million in lender and third-party fees which, together with $0.5 million in remaining unamortized debt issuance costs, have been recorded as other assets and are being amortized over the remaining contractual life of the facility on a straight-line basis. Deferred financing costs, net of accumulated amortization, related to the Revolving Credit Facility at September 30, 2023 and September 30, 2022 were $0.7 million and $0.9 million, respectively.
On January 26, 2023, The AZEK Group LLC further amended the Revolving Credit Facility, replacing all LIBOR-based provisions with provisions reflecting SOFR, including, without limitation, the use of a new Adjusted Term SOFR benchmark rate equal to Term SOFR (as defined in the Revolving Credit Agreement) plus 0.10%.
A “commitment fee” accrues on any unused portion of the commitments under the Revolving Credit Facility during the preceding three calendar month period. If the average daily used percentage is greater than 50%, the commitment fee equals 25 basis points, and if the average daily used percentage is less than or equal to 50%, the commitment fee equals 37.5 basis points. The commitment fees were $0.6 million, $0.5 million and $0.6 million for the years ended September 30, 2023, 2022 and 2021, respectively.
The obligations under the Revolving Credit Facility are guaranteed by the Company and its wholly owned domestic subsidiaries other than certain immaterial subsidiaries and other excluded subsidiaries. The obligations under the Revolving Credit Facility are secured by a first priority security interest in substantially all of the accounts receivable, inventory, deposit accounts, securities accounts and cash assets of the Company, The AZEK Group LLC and the subsidiaries of The AZEK Group LLC that are guarantors under the Revolving Credit Facility, and the proceeds thereof (subject to certain exceptions) (the “Revolver Priority Collateral”), plus a second priority security interest in all of the Term Loan Priority Collateral. The Revolving Credit Facility may be voluntarily prepaid in whole, or in part, in each case without premium or penalty. The AZEK Group LLC is also required to make mandatory prepayments (i) when aggregate borrowings exceed commitments or the applicable borrowing base and (ii) during “cash dominion,” which occurs if (a) the availability under the Revolving Credit Facility is less than the greater of (i) $12.5 million and (ii) 10% of the lesser of (x) $150.0 million and (y) the borrowing base, for five consecutive business days or (b) certain events of default have occurred and are continuing.
The Revolving Credit Facility contains affirmative covenants that are customary for financings of this type, including allowing the Revolver Administrative Agent to perform periodic field exams and appraisals to evaluate the borrowing base. The Revolving Credit Facility contains various negative covenants, including limitations on, subject to certain exceptions, the incurrence of indebtedness, the incurrence of liens, dispositions, investments, acquisitions, restricted payments, transactions with affiliates, as well as other negative covenants customary for financings of this type. The Revolving Credit Facility also includes a financial maintenance covenant, applicable only when the excess availability is less than the greater of (i) 10% of the lesser of the aggregate commitments under the Revolving Credit Facility and the borrowing base, and (ii) $12.5 million. In such circumstances, The AZEK Group LLC would be required to maintain a minimum fixed charge coverage ratio (as defined in the Revolving Credit Facility) for the trailing four quarters equal to at least 1.0 to 1.0; subject to The AZEK Group LLC’s ability to make an equity cure (no more than twice in any four quarter period and up to five times over the life of the facility). As of September 30, 2023, The AZEK Group LLC was in compliance with the financial and nonfinancial covenants imposed by the Revolving Credit Facility. The Revolving Credit Facility also includes customary events of default, including the occurrence of a change of control.
F-14
Interest expense consisted of the following (in thousands):
|
|
Years Ended September 30, |
|
|||||||||
|
|
2023 |
|
|
2022 |
|
|
2021 |
|
|||
Interest expense |
|
|
|
|
|
|
|
|
|
|||
2022 Term Loan Agreement |
|
$ |
41,936 |
|
|
$ |
10,640 |
|
|
$ |
— |
|
Term Loan Agreement |
|
|
— |
|
|
|
8,824 |
|
|
|
17,826 |
|
Revolving Credit Facility |
|
|
718 |
|
|
|
838 |
|
|
|
629 |
|
Other |
|
|
4,484 |
|
|
|
3,661 |
|
|
|
828 |
|
Amortization |
|
|
|
|
|
|
|
|
|
|||
Debt issue costs |
|
|
|
|
|
|
|
|
|
|||
2022 Term Loan Agreement |
|
|
716 |
|
|
|
4,892 |
|
|
|
— |
|
Term Loan Agreement |
|
|
— |
|
|
|
1,056 |
|
|
|
2,497 |
|
Revolving Credit Facility |
|
|
262 |
|
|
|
262 |
|
|
|
495 |
|
Original issue discounts |
|
|
|
|
|
|
|
|
|
|||
2022 Term Loan Agreement |
|
|
670 |
|
|
|
279 |
|
|
|
— |
|
Term Loan Agreement |
|
|
— |
|
|
|
126 |
|
|
|
193 |
|
Less capitalized interest |
|
|
(5,211 |
) |
|
|
(5,622 |
) |
|
|
(2,157 |
) |
Interest expense |
|
|
43,575 |
|
|
|
24,956 |
|
|
|
20,311 |
|
Less interest income |
|
|
(4,282 |
) |
|
|
— |
|
|
|
— |
|
Interest expense, net |
|
$ |
39,293 |
|
|
$ |
24,956 |
|
|
$ |
20,311 |
|
Refer to Note 10 for information pertaining to the fair value of the Company’s debt as of September 30, 2023 and 2022.
8. PRODUCT WARRANTIES
The Company provides product assurance warranties of various lengths ranging from 5 years to lifetime for limited coverage for a variety of material and workmanship defects based on standard terms and conditions between the Company and its customers. Warranty coverage depends on the product involved.
The warranty reserve activity was as follows (in thousands):
|
|
As of September 30, |
|
|||||
|
|
2023 |
|
|
2022 |
|
||
Beginning balance |
|
$ |
15,023 |
|
|
$ |
12,699 |
|
Adjustments to reserve |
|
|
3,657 |
|
|
|
5,030 |
|
Warranty claims payment |
|
|
(2,485 |
) |
|
|
(2,706 |
) |
Ending balance |
|
|
16,195 |
|
|
|
15,023 |
|
Current portion of accrued warranty |
|
|
(2,739 |
) |
|
|
(2,900 |
) |
Accrued warranty — less current portion |
|
$ |
13,456 |
|
|
$ |
12,123 |
|
9. LEASES
On October 1, 2020, the Company adopted ASU 2016-02, "Leases (Topic 842)," and the related amendments (collectively "ASC 842").
The Company leases vehicles, machinery, manufacturing facilities, office space, land, and equipment under both operating and finance leases. We sublease excess office real estate to a third-party tenant. The Company determines if an arrangement is a lease at inception. A contract is or contains a lease if the contract conveys the right to control the use of an identified asset for a period of time in exchange for consideration. As of both September 30, 2023 and 2022, amounts associated with leases are included in Other assets, Accrued expense and other liabilities and Other non-current liabilities in our consolidated balance sheet.
For leases with initial terms greater than 12 months, the Company considers these right-of-use assets and records the related asset and obligation at the present value of lease payments over the term. For leases with initial terms equal to or less than 12 months, we do not consider them as right-of-use assets and instead consider them short-term lease costs that are recognized on a straight-line basis over the lease term. Our leases may include escalation clauses, renewal options and/or termination options that are factored into our determination of lease term and lease payments when its reasonably certain the option will be exercised. Renewal options range from 1 year to 20 years. The options to extend or terminate a lease are at our discretion. We have elected to take the practical expedient and not separate lease and non-lease components of contracts.
F-15
We estimate our incremental borrowing rate to discount the lease payments based on information available at lease commencement because the implicit rate of the lease is generally not known. Our lease agreements do not contain any material residual value guarantees.
Lease assets and lease liabilities as of September 30, 2023 and 2022 were as follows:
|
|
|
As of September 30, |
|
|||||
Leases |
Classification on Balance Sheet |
|
2023 |
|
|
2022 |
|
||
Assets |
|
|
|
|
|
|
|
||
ROU operating lease assets |
Other assets |
|
$ |
15,423 |
|
|
$ |
19,724 |
|
Finance lease assets |
Other assets |
|
|
71,529 |
|
|
|
73,541 |
|
Total lease assets |
|
|
$ |
86,952 |
|
|
$ |
93,265 |
|
|
|
|
|
|
|
|
|
||
Liabilities |
|
|
|
|
|
|
|
||
Current |
|
|
|
|
|
|
|
||
Operating |
Accrued expenses and other liabilities |
|
$ |
4,180 |
|
|
$ |
5,223 |
|
Finance |
Accrued expenses and other liabilities |
|
|
2,777 |
|
|
|
2,366 |
|
Non-Current |
|
|
|
|
|
|
|
||
Operating |
Other non-current liabilities |
|
|
13,699 |
|
|
|
17,261 |
|
Finance |
Other non-current liabilities |
|
|
75,718 |
|
|
|
75,706 |
|
Total lease liabilities |
|
|
$ |
96,374 |
|
|
$ |
100,556 |
|
The components of lease expense for the years ended September 30, 2023, 2022 and 2021 were as follows:
|
|
Years Ended September 30, |
|
|||||||||
(in thousands) |
|
2023 |
|
|
2022 |
|
|
2021 |
|
|||
Operating lease expense |
|
$ |
5,920 |
|
|
$ |
5,669 |
|
|
$ |
4,007 |
|
Finance lease amortization of assets |
|
|
5,053 |
|
|
|
3,477 |
|
|
|
1,191 |
|
Finance lease interest on lease liabilities |
|
|
4,391 |
|
|
|
3,616 |
|
|
|
827 |
|
Short term |
|
|
392 |
|
|
|
574 |
|
|
|
133 |
|
Sublease income |
|
|
(293 |
) |
|
|
(347 |
) |
|
|
(428 |
) |
Total lease expense |
|
$ |
15,463 |
|
|
$ |
12,989 |
|
|
$ |
5,730 |
|
Cash flows related to leases for the years ended September 30, 2023, 2022 and 2021 were as follows:
|
|
Years Ended September 30, |
|
|||||||||
|
|
2023 |
|
|
2022 |
|
|
2021 |
|
|||
Cash paid for amounts included in the measurement of lease liabilities: |
|
|
|
|
|
|
|
|
|
|||
Operating leases - Operating cash flows |
|
$ |
6,171 |
|
|
$ |
5,973 |
|
|
$ |
4,096 |
|
Finance leases - Operating cash flows |
|
|
4,391 |
|
|
|
3,617 |
|
|
|
827 |
|
Finance leases - Financing cash flows |
|
|
2,619 |
|
|
|
249 |
|
|
|
1,921 |
|
Leased assets obtained in exchange for operating lease liabilities |
|
|
3,041 |
|
|
|
5,487 |
|
|
|
10,239 |
|
Leased assets obtained in exchange for finance lease liabilities |
|
|
789 |
|
|
|
27,438 |
|
|
|
47,578 |
|
The table below present supplemental information related to leases as of September 30, 2023 and 2022:
|
|
As of September 30, |
|
|||||
|
|
2023 |
|
|
2022 |
|
||
Weighted-average remaining lease term (years) |
|
|
|
|
|
|
||
Operating leases |
|
|
6.8 |
|
|
|
6.9 |
|
Finance leases |
|
|
25.4 |
|
|
|
26.5 |
|
Weighted-average discount rate |
|
|
|
|
|
|
||
Operating leases |
|
|
4.4 |
% |
|
|
4.1 |
% |
Finance leases |
|
|
5.8 |
% |
|
|
5.9 |
% |
F-16
Maturities of Lease Liabilities
The table below reconciles the undiscounted cash flows for each of the first five years and the total of the remaining years to the finance lease liabilities and operating lease liabilities recorded on the balance sheet as of September 30, 2023:
|
|
As of September 30, 2023 |
|
|||||||||
(in thousands) |
|
Operating Leases |
|
|
Finance Leases |
|
|
Total |
|
|||
2024 |
|
$ |
4,856 |
|
|
$ |
7,101 |
|
|
$ |
11,957 |
|
2025 |
|
|
3,919 |
|
|
|
6,998 |
|
|
|
10,917 |
|
2026 |
|
|
2,594 |
|
|
|
6,835 |
|
|
|
9,429 |
|
2027 |
|
|
1,906 |
|
|
|
6,368 |
|
|
|
8,274 |
|
2028 |
|
|
1,642 |
|
|
|
5,265 |
|
|
|
6,907 |
|
Thereafter |
|
|
6,070 |
|
|
|
117,013 |
|
|
|
123,083 |
|
Total lease payments |
|
|
20,987 |
|
|
|
149,580 |
|
|
|
170,567 |
|
Less: Interest |
|
|
(3,108 |
) |
|
|
(71,085 |
) |
|
|
(74,193 |
) |
Present Value of lease liability |
|
$ |
17,879 |
|
|
$ |
78,495 |
|
|
$ |
96,374 |
|
10. FAIR VALUE OF FINANCIAL INSTRUMENTS
The Company measures and records in its consolidated financial statements certain assets and liabilities at fair value. ASC Topic 820, Fair Value Measurement and Disclosures, establishes a fair value hierarchy for instruments measured at fair value that distinguishes between assumptions based on market data (observable inputs) and the Company’s own assumptions (unobservable inputs). This hierarchy consists of the following three levels:
Financial instruments with a fair value that approximates carrying value—The carrying amounts of cash and cash equivalents, trade receivables and payables, as well as financial instruments included in other current assets and other current liabilities, approximate fair values because of their short-term maturities.
Financial instruments with a fair value different from carrying value—The Company has, where appropriate, estimated the fair value of financial instruments for which the amortized cost carrying value may be significantly different than the fair value. As of September 30, 2023 and 2022, these instruments include outstanding debt. As described in Note 7 Debt, the Company records debt at amortized cost. The carrying values and the estimated fair values of the debt financial instruments (Level 2 measurements) consisted of the following (in thousands):
|
|
As of September 30, |
|
|||||||||||||
|
|
2023 |
|
|
2022 |
|
||||||||||
|
|
Principle Outstanding |
|
|
Estimated |
|
|
Principle Outstanding |
|
|
Estimated |
|
||||
2022 Term Loan Agreement due April 28, 2029 |
|
$ |
594,000 |
|
|
$ |
595,485 |
|
|
$ |
600,000 |
|
|
$ |
586,500 |
|
The fair values of the debt instrument were determined using trading prices between qualified institutional buyers; therefore, are classified as Level 2.
Financial instruments remeasure at fair value on a recurring basis – During the year ended September 30, 2022, the Company entered into an arrangement for a contingent payment to the former owner and employee of StruXure. The contingent payment is based on achievement of a minimum EBITDA amount and a multiple of EBITDA, for EBITDA exceeding a higher threshold for calendar year 2022. Based on the formula, the potential contingent payout can range from zero to $13.9 million. At the date of acquisition, the fair value was estimated to be $9.5 million. As of March 31, 2023, the fair value was increased to $12.7 million based on the actual EBITDA amount for StruXure.
F-17
Compensation expense of $9.5 million was recognized for the year ended September 30, 2022 and $3.2 million was recognized for the year ended September 30, 2023. The Company paid $12.7 million as settlement of the contingent liability in April, 2023.
In connection with the acquisition of INTEX on August 1, 2022, the Company entered into a contingent consideration arrangement with the former owner of INTEX. The contingent consideration is based on achievement of a minimum gross profit amount for calendar year 2022. Based on the formula, the potential contingent consideration can range from zero to $6.2 million. At the date of acquisition, the fair value was estimated to be $5.8 million. As of December 31, 2022, the fair value was increased to $6.2 million. Contingent payment of $5.8 million was included in the acquisition purchase price at the date of acquisition and the change in fair value of $0.4 million was recognized in selling, general and administrative expense for the year ended September 30, 2023. The Company paid $6.2 million as settlement of the contingent liability in fiscal year 2023.
Derivative Instruments - The Company’s objective in using interest rate derivative instruments is to hedge against interest rate volatility associated with its senior secured credit facilities by converting a portion of its floating rate debt to fixed rate debt. In November 2022, the Company entered into two interest rate swap agreements with Barclays Bank PLC (“Barclays”) to manage interest rate risk related to 2022 Term Loan. Each agreement has a notional amount of $150 million and will expire on October 31, 2025. One agreement swaps variable interest at a rate based on SOFR with a fixed rate of 4.39% and the second with a fixed rate of 4.48%.
At the inceptions of the swap agreements and as of September 30, 2023, both swaps were designated and qualified as cash flow hedges in accordance with ASC 815. Their gain (loss) is recorded in Accumulated other comprehensive income (loss) and then reclassified into Interest expense in the same period in which the hedged transaction affects earnings. As of September 30, 2023, the Company expects to reclass approximately $2.6 million ($1.9 million after-tax) as a reduction to interest expense in the next 12 months.
The following table provides the fair values of the interest rate derivative instruments as well as their classification on the Balance Sheet as of September 30, 2023 and 2022 (in thousands):
|
|
|
|
|
|
Fair Value as of |
|
|||||
|
|
Fair Value Hierarchy |
|
Balance Sheet Location |
|
September 30, 2023 |
|
|
September 30, 2022 |
|
||
Assets |
|
|
|
|
|
|
|
|
|
|
||
Interest rate swaps |
|
Level 2 |
|
Other current assets |
|
$ |
2,558 |
|
|
$ |
— |
|
Liabilities |
|
|
|
|
|
|
|
|
|
|
||
Interest rate swaps |
|
Level 2 |
|
Other non-current liabilities |
|
$ |
65 |
|
|
$ |
— |
|
The Company estimates the fair value of interest rate swaps using a valuation model based on observable market data, such as yield curves. Both swaps are classified as Level 2 measurement in the fair value hierarchy.
The following table summarizes the effects of the interest rate derivative instruments on Accumulated other comprehensive income (loss) as of September 30, 2023 (in thousands):
|
|
Before-tax Amount |
|
|
Income Tax Expense |
|
|
Net of Tax Amount |
|
|||
Balance - September 30, 2022 |
|
$ |
— |
|
|
$ |
— |
|
|
$ |
— |
|
Amount of gain recognized in other comprehensive income |
|
|
3,474 |
|
|
|
870 |
|
|
|
2,604 |
|
Amount of gain reclassified from accumulated other comprehensive income (loss) into net income |
|
|
(981 |
) |
|
|
(255 |
) |
|
|
(726 |
) |
Balance - September 30, 2023 |
|
$ |
2,493 |
|
|
$ |
615 |
|
|
$ |
1,878 |
|
The Company recognizes the reclassification of gain from Accumulated other comprehensive income (loss) to Net income in Interest expense, net within the Consolidated Statements of Comprehensive Income.
11. SEGMENTS
Operating segments for the Company are determined based on information used by the chief operating decision maker (“CODM”) in deciding how to evaluate performance and allocate resources to each of the segments. The CODM reviews Adjusted EBITDA and Adjusted EBITDA Margin as the key segment measures of performance.
F-18
Adjusted EBITDA is defined as segment operating income (loss) plus depreciation and amortization, adjusted by adding thereto or subtracting therefrom stock-based compensation costs, business transformation costs, acquisition costs, capital structure transaction costs, and certain other costs. Adjusted EBITDA Margin is defined as Adjusted EBITDA divided by net sales.
The Company has two reportable segments, Residential and Commercial. The reportable segments were determined primarily based on products and end markets as follows:
The accounting policies of the operating segments are the same as those described in Note 1, “Summary of Significant Accounting Policies”. Intercompany transactions between segments are excluded as they are not included in management’s performance review of the segments. Currently foreign revenue accounts for less than 10% of consolidated revenue. The Company does not disclose assets outside of the United States as they totaled less than 10% of the consolidated assets as of September 30, 2023, 2022 and 2021.
The segment data below includes data for Residential and Commercial for the years ended and as of September 30, 2023, 2022 and 2021 (in thousands).
|
|
Years Ended and As of September 30, |
|
|||||||||||||||||||||||||||||||||||||||||||||
|
|
Residential |
|
|
Commercial |
|
|
Corporate and |
|
|
Total |
|
||||||||||||||||||||||||||||||||||||
|
|
2023 |
|
|
2022 |
|
|
2021 |
|
|
2023 |
|
|
2022 |
|
|
2021 |
|
|
2023 |
|
|
2022 |
|
|
2021 |
|
|
2023 |
|
|
2022 |
|
|
2021 |
|
||||||||||||
Net Sales |
|
$ |
1,222,866 |
|
|
$ |
1,168,751 |
|
|
$ |
1,044,126 |
|
|
$ |
147,450 |
|
|
$ |
186,835 |
|
|
$ |
134,848 |
|
|
$ |
— |
|
|
$ |
— |
|
|
$ |
— |
|
|
$ |
1,370,316 |
|
|
$ |
1,355,586 |
|
|
$ |
1,178,974 |
|
Adjusted EBITDA |
|
|
329,853 |
|
|
|
323,377 |
|
|
|
314,563 |
|
|
|
31,008 |
|
|
|
40,255 |
|
|
|
19,323 |
|
|
|
(69,638 |
) |
|
|
(62,592 |
) |
|
|
(59,699 |
) |
|
|
291,223 |
|
|
|
301,040 |
|
|
|
274,187 |
|
Capital Expenditures |
|
|
81,592 |
|
|
|
162,739 |
|
|
|
169,490 |
|
|
|
4,321 |
|
|
|
5,645 |
|
|
|
3,473 |
|
|
|
2,632 |
|
|
|
2,554 |
|
|
|
2,156 |
|
|
|
88,545 |
|
|
|
170,938 |
|
|
|
175,119 |
|
Depreciation and |
|
|
119,466 |
|
|
|
105,421 |
|
|
|
88,732 |
|
|
|
8,789 |
|
|
|
9,332 |
|
|
|
9,127 |
|
|
|
4,289 |
|
|
|
3,780 |
|
|
|
3,745 |
|
|
|
132,544 |
|
|
|
118,533 |
|
|
|
101,604 |
|
Goodwill |
|
|
953,882 |
|
|
|
953,606 |
|
|
|
911,001 |
|
|
|
40,389 |
|
|
|
40,389 |
|
|
|
40,389 |
|
|
|
— |
|
|
|
— |
|
|
|
— |
|
|
|
994,271 |
|
|
|
993,995 |
|
|
|
951,390 |
|
Total Assets |
|
|
2,150,994 |
|
|
|
2,173,069 |
|
|
|
1,953,126 |
|
|
|
192,865 |
|
|
|
186,824 |
|
|
|
200,277 |
|
|
|
21,695 |
|
|
|
23,198 |
|
|
|
34,431 |
|
|
|
2,365,554 |
|
|
|
2,383,091 |
|
|
|
2,187,834 |
|
|
|
Years Ended September 30, |
|
|||||||||
|
|
2023 |
|
|
2022 |
|
|
2021 |
|
|||
Segment Adjusted EBITDA |
|
|
|
|
|
|
|
|
|
|||
Residential |
|
$ |
329,853 |
|
|
$ |
323,377 |
|
|
$ |
314,563 |
|
Commercial |
|
|
31,008 |
|
|
|
40,255 |
|
|
|
19,323 |
|
Total Adjusted EBITDA for reporting segments |
|
$ |
360,861 |
|
|
$ |
363,632 |
|
|
$ |
333,886 |
|
Unallocated net expenses |
|
|
(69,638 |
) |
|
|
(62,592 |
) |
|
|
(59,699 |
) |
Adjustments to income (loss) before income tax provision |
|
|
|
|
|
|
|
|
|
|||
Depreciation and amortization |
|
|
(132,544 |
) |
|
|
(118,533 |
) |
|
|
(101,604 |
) |
Stock-based compensation costs |
|
|
(18,704 |
) |
|
|
(18,105 |
) |
|
|
(22,670 |
) |
Acquisition and divestiture costs (1) |
|
|
(6,890 |
) |
|
|
(13,406 |
) |
|
|
— |
|
Secondary offering costs |
|
|
(1,065 |
) |
|
|
— |
|
|
|
(2,592 |
) |
Inventories (2) |
|
|
— |
|
|
|
(19,297 |
) |
|
|
— |
|
Other costs (3) |
|
|
(843 |
) |
|
|
(2,764 |
) |
|
|
(5,192 |
) |
Interest expense, net |
|
|
(39,293 |
) |
|
|
(24,956 |
) |
|
|
(20,311 |
) |
Income (loss) before income taxes |
|
$ |
91,884 |
|
|
$ |
103,979 |
|
|
$ |
121,818 |
|
F-19
12. CAPITAL STOCK
Secondary Offerings
On January 26, 2021, the Company completed an offering of 23,000,000 shares of Class A common stock, par value $0.001 per share, including the exercise in full by the underwriters of their option to purchase up to 3,000,000 additional shares of Class A common stock, at a public offering price of $40.00 per share. The shares were sold by certain of the Selling Stockholders. The Company did not receive any of the proceeds from the sale of the shares by those Selling Stockholders. In connection with the offering, the Company incurred approximately $1.2 million in expenses.
On June 1, 2021, the Company completed an offering of 17,250,000 shares of Class A common stock, par value $0.001 per share, including the exercise in full by the underwriters of their option to purchase up to 2,250,000 additional shares of Class A common stock, at a public offering price of $43.50 per share. The shares were sold by certain of the Selling Stockholders. The Company did not receive any of the proceeds from the sale of the shares by those Selling Stockholders. In connection with the offering, the Company incurred approximately $1.1 million in expenses.
During the three months ended June 30, 2023, the Company completed an offering of 16,100,000 shares of Class A common stock, par value $0.001 per share, including the exercise in full by the underwriter of its option to purchase up to 2,100,000 additional shares of Class A common stock. All of the shares were sold by the Selling Stockholders to the underwriter at a price of $24.36 per share which the underwriter was then permitted to sell at variable prices to the public. The Company did not receive any of the proceeds from the sale of the shares by those Selling Stockholders. In connection with the secondary offering, the Company incurred approximately $1.1 million in expenses. In connection with the secondary offering, the Company purchased from the underwriter 1,477,832 shares of its Class A common stock that were sold by the Selling Stockholders to the underwriter at a price per share of $24.36, which is equal to the price paid by the underwriter to the Selling Stockholders, resulting in an aggregate purchase price of approximately $36.0 million. The repurchase was made pursuant to the Company’s Share Repurchase Program (as defined below).
Share Repurchase Program
On May 5, 2022, the Board of Directors authorized the Company to repurchase up to $400 million of the Company’s Class A common stock (the “Share Repurchase Program”). The Share Repurchase Program allows the Company to repurchase its shares opportunistically from time to time. Purchases may be effected through one or more open market transactions, privately negotiated transactions, transactions structured through investment banking institutions, accelerated share repurchases or tender offers, some of which may be effected through Rule 10b5-1 plans, or a combination of the foregoing. The timing of repurchases will depend upon several factors, including market and business conditions, and repurchases may be discontinued at any time.
The table below summaries the Company's repurchases of its Class A common stock during the year ended September 30, 2023 and 2022 (in thousands, except per share amount):
|
|
Year Ended September 30, |
|
|||||
|
|
2023 |
|
|
2022 |
|
||
Total number of shares repurchased |
|
|
4,152 |
|
|
|
4,117 |
|
Reacquisition cost (1), (2), (3) |
|
$ |
116,579 |
|
|
$ |
81,483 |
|
Average price per share |
|
$ |
28.08 |
|
|
$ |
19.79 |
|
F-20
As of September 30, 2023, the Company had approximately $201.9 million available for repurchases under the Share Repurchase Program.
At September 30, 2023, the following amounts were issued and outstanding: 147,699,313 shares of Class A common stock and 100 shares of Class B common stock. The Company has not issued any shares of preferred stock.
13. STOCK-BASED COMPENSATION
The Company grants stock-based awards to attract, retain and motivate key employees and directors.
The 2020 Omnibus Incentive Compensation Plan (“2020 Plan”), provides for the grant of stock options, stock appreciation rights, restricted stock, restricted stock units, dividend equivalent rights, and performance-based or other equity-related awards to the Company’s employees and directors. The maximum aggregate number of shares that may be issued under the 2020 Plan is 15,852,319 shares with 2,759,532 shares remaining in the reserve. The total aggregate number of shares may be adjusted as determined by the Board of Directors.
On February 4, 2021, the Compensation Committee of the Board of Directors authorized certain changes to our Chief Financial Officer’s (“CFO”) stock-based awards which are expected to be effective in connection with his retirement and contingent on the successful transition to his successor. These changes contemplate a retirement eligibility provision which is expected to allow certain awards to continue to vest in due course following retirement and extend the exercisability of the outstanding and exercisable stock options to the end of the contractual term of the options. This resulted in a Type III Modification (improbable to probable) as defined in accounting guidance, accounted for as a cancellation of the original award and a new grant under the revised terms, resulting in $8.8 million of share-based compensation expense in the fiscal year 2021.
Stock-based compensation expense for the years ended September 30, 2023, 2022 and 2021 was $18.7 million, $18.1 million and $22.7 million, respectively, recognized in “Selling, general and administrative expenses” in the Consolidated Statements of Comprehensive Income. Total income tax benefit for the years ended September 30, 2023, 2022 and 2021 was $3.6 million, $4.1 million and $3.8 million, respectively. As of September 30, 2023, the Company had not yet recognized compensation cost on unvested stock-based awards of $23.5 million, with a weighted average remaining recognition period of 1.6 years.
The Company uses the Black Scholes pricing model to estimate the fair value of its service-based option awards as of the grant date. Under the terms of the 2020 Plan, all stock options will expire if not exercised within ten years of the grant date. The fair value of each restricted stock unit award is based on the closing price on the date of grant.
The following table sets forth the significant assumptions used for the service-based awards granted during the years ended September 30:
|
|
2023 |
|
|
2022 |
|
|
2021 |
|
|||
Weighted average grant date fair value |
|
$ |
9.02 |
|
|
$ |
16.98 |
|
|
$ |
12.49 |
|
Risk-free interest rate |
|
|
3.77 |
% |
|
|
1.34 |
% |
|
0.56%-0.81% |
|
|
Expected volatility |
|
|
40.00 |
% |
|
|
40.00 |
% |
|
|
35.00 |
% |
Expected term (in years) |
|
|
6.00 |
|
|
|
6.00 |
|
|
|
6.00 |
|
Expected dividend yield |
|
|
0.00 |
% |
|
|
0.00 |
% |
|
|
0.00 |
% |
F-21
Stock Options
The following table summarizes the performance-based stock option activity for the year ended September 30, 2023:
|
|
Number of |
|
|
Weighted |
|
|
Weighted |
|
|
Aggregate |
|
||||
|
|
|
|
|
|
|
|
(in years) |
|
|
(in thousands) |
|
||||
Outstanding at October 1, 2022 |
|
|
1,410,653 |
|
|
$ |
23.00 |
|
|
|
|
|
|
|
||
Granted |
|
|
— |
|
|
|
— |
|
|
|
|
|
|
|
||
Exercised |
|
|
(294,218 |
) |
|
|
23.00 |
|
|
|
|
|
|
|
||
Cancelled/Forfeited |
|
|
(2,174 |
) |
|
|
23.00 |
|
|
|
|
|
|
|
||
Outstanding at September 30, 2023 |
|
|
1,114,261 |
|
|
|
23.00 |
|
|
|
6.7 |
|
|
|
7,510 |
|
Vested and exercisable at September 30, 2023 |
|
|
1,114,261 |
|
|
$ |
23.00 |
|
|
|
6.7 |
|
|
|
7,510 |
|
The following table summarizes the service-based stock option activity for the year ended September 30, 2023 :
|
|
Number of |
|
|
Weighted |
|
|
Weighted |
|
|
Aggregate |
|
||||
|
|
|
|
|
|
|
|
(in years) |
|
|
(in thousands) |
|
||||
Outstanding at October 1, 2022 |
|
|
3,557,194 |
|
|
$ |
25.57 |
|
|
|
|
|
|
|
||
Granted |
|
|
250,477 |
|
|
|
20.18 |
|
|
|
|
|
|
|
||
Exercised |
|
|
(355,920 |
) |
|
|
23.00 |
|
|
|
|
|
|
|
||
Cancelled/Forfeited |
|
|
(90,044 |
) |
|
|
25.79 |
|
|
|
|
|
|
|
||
Outstanding at September 30, 2023 |
|
|
3,361,707 |
|
|
|
25.43 |
|
|
|
7.1 |
|
|
|
19,871 |
|
Vested and exercisable at September 30, 2023 |
|
|
2,400,930 |
|
|
$ |
24.59 |
|
|
|
6.8 |
|
|
|
14,561 |
|
The intrinsic value of the Company’s stock options exercised in the years ended September 30, 2023, 2022 and 2021 was $3.5 million, $3.0 million and $4.2 million, respectively. The tax benefit (expense) from stock options exercised during the years ended September 30, 2023, 2022 and 2021 was $2.0 million, $0.7 million and $(1.9) million, respectively.
Restricted Stock Awards
A summary of the service-based restricted stock awards activity for the year ended September 30, 2023 was as follows:
|
|
Number of |
|
|
Weighted |
|
||
Outstanding and unvested at October 1, 2022 |
|
|
275,628 |
|
|
$ |
23.00 |
|
Granted |
|
|
— |
|
|
|
— |
|
Vested |
|
|
(173,841 |
) |
|
|
23.00 |
|
Forfeited |
|
|
(19,306 |
) |
|
|
23.00 |
|
Outstanding and unvested at September 30, 2023 |
|
|
82,481 |
|
|
$ |
23.00 |
|
The total fair value of vested restricted stock awards for the years ended September 30, 2023, 2022 and 2021 was $2.6 million, $4.2 million and $2.7 million, respectively.
F-22
Restricted Stock Units
A summary of the service-based restricted stock unit awards activity for the year ended September 30, 2023 was as follows:
|
|
Number of |
|
|
Weighted |
|
||
Outstanding and unvested at October 1, 2022 |
|
|
574,499 |
|
|
$ |
31.14 |
|
Granted |
|
|
504,951 |
|
|
|
21.22 |
|
Vested |
|
|
(246,343 |
) |
|
|
29.74 |
|
Forfeited |
|
|
(47,011 |
) |
|
|
28.06 |
|
Outstanding and unvested at September 30, 2023 |
|
|
786,096 |
|
|
$ |
25.39 |
|
The total fair value of vested restricted stock units for the years ended September 30, 2023, 2022 and 2021 was $7.3 million, $2.3 million and $0.4 million, respectively.
Performance Restricted Stock Units
Performance restricted stock units were granted to officers and certain employees of the Company and represent the right to earn shares of Company common stock based on the achievement of company-wide non-GAAP performance conditions, including cumulative net sales, average return on net tangible assets and cumulative EBITDA during the three-year performance period. Compensation cost is amortized into expense over the performance period, which is generally three years, and is based on the probability of meeting performance targets. The fair value of each performance share award is based on the closing price on the date of grant.
A summary of the performance-based restricted stock unit awards activity for the year ended September 30, 2023 was presented at target was as follows:
|
|
Number of |
|
|
Weighted |
|
||
Outstanding and unvested at October 1, 2022 |
|
|
221,469 |
|
|
$ |
37.55 |
|
Granted |
|
|
319,263 |
|
|
|
20.18 |
|
Vested |
|
|
— |
|
|
|
— |
|
Forfeited |
|
|
(32,110 |
) |
|
|
35.09 |
|
Outstanding and unvested at September 30, 2023 |
|
|
508,622 |
|
|
$ |
26.73 |
|
14. EMPLOYEE BENEFIT PLANS
The Company has a 401(k) defined contribution plans (the “401(k) Plans”) for the benefit of its employees who meet certain eligibility requirements. The Company does not offer a defined benefit plan (pension plan) nor does the Company offer any other post-retirement benefits. The 401(k) Plans cover substantially all of the Company’s full-time employees. Each participant may contribute up to 85% of his or her salary, within dollar limitations set forth by the ERISA guidelines. The 401(k) Plans match employee pre-tax and Roth IRA contributions. The Company matches 100% of the first 1% of employee contributions, plus 50% of the next 5% of employee contributions.
The Company’s contributions to the plans totaled $4.9 million, $5.1 million and $4.0 million, for the years ended September 30, 2023, 2022 and 2021, respectively.
15. EARNINGS PER SHARE
The Company computes earnings per common share (“EPS”) under the two-class method which requires the allocation of all distributed and undistributed earnings attributable to the Company to common stock and other participating securities based on their respective rights to receive distributions of earnings or losses. The Company’s Class A common stock and Class B common stock equally share in distributed and undistributed earnings, therefore, no allocation to participating securities or dilutive securities is performed.
F-23
Basic EPS attributable to common stockholders is calculated by dividing net income (loss) attributable to common stockholders by the weighted average number of shares of common stock outstanding. Diluted EPS is calculated by adjusting weighted average shares outstanding for the dilutive effect of potential common shares, determined using the treasury-stock method. For purposes of the diluted EPS calculation, restricted stock awards, restricted stock units and options to purchase shares of common stock are considered to be potential common shares. The following table sets forth the computation of the Company’s basic and diluted EPS attributable to common stockholders (in thousands, except share and per share amounts):
|
|
Years Ended September 30, |
|
|||||||||
|
|
2023 |
|
|
2022 |
|
|
2021 |
|
|||
Numerator: |
|
|
|
|
|
|
|
|
|
|||
Net income |
|
$ |
67,955 |
|
|
$ |
75,225 |
|
|
$ |
93,150 |
|
Net income attributable to common |
|
$ |
67,955 |
|
|
$ |
75,225 |
|
|
$ |
93,150 |
|
Denominator: |
|
|
|
|
|
|
|
|
|
|||
Weighted average shares of common |
|
|
|
|
|
|
|
|
|
|||
Basic |
|
|
150,162,256 |
|
|
|
153,510,110 |
|
|
|
153,777,859 |
|
Diluted |
|
|
150,849,896 |
|
|
|
154,517,843 |
|
|
|
156,666,394 |
|
Net income attributable to common |
|
|
|
|
|
|
|
|
|
|||
Basic |
|
$ |
0.45 |
|
|
$ |
0.49 |
|
|
$ |
0.61 |
|
Diluted |
|
$ |
0.45 |
|
|
$ |
0.49 |
|
|
$ |
0.59 |
|
The following table includes the number of shares that may be dilutive common shares in the future, and were not included in the computation of diluted net income (loss) per share because the effect was anti-dilutive:
|
|
Years Ended September 30, |
|
|||||||||
|
|
2023 |
|
|
2022 |
|
|
2021 |
|
|||
Stock Options |
|
|
2,549,816 |
|
|
|
548,539 |
|
|
|
105,199 |
|
Restricted Stock Units |
|
|
113,622 |
|
|
|
268,526 |
|
|
|
3,256 |
|
16. INCOME TAXES
The Company’s operations are substantially all domestic. The components of income tax expense (benefit) consisted of the following (in thousands):
|
|
Years Ended September 30, |
|
|||||||||
|
|
2023 |
|
|
2022 |
|
|
2021 |
|
|||
Current: |
|
|
|
|
|
|
|
|
|
|||
Federal |
|
$ |
25,216 |
|
|
$ |
810 |
|
|
$ |
200 |
|
State and local |
|
|
8,200 |
|
|
|
8,260 |
|
|
|
2,939 |
|
Total current |
|
|
33,416 |
|
|
|
9,070 |
|
|
|
3,139 |
|
Deferred: |
|
|
|
|
|
|
|
|
|
|||
Federal |
|
|
(6,828 |
) |
|
|
19,302 |
|
|
|
26,240 |
|
State and local |
|
|
(2,659 |
) |
|
|
382 |
|
|
|
(711 |
) |
Total deferred |
|
|
(9,487 |
) |
|
|
19,684 |
|
|
|
25,529 |
|
Income tax expense |
|
$ |
23,929 |
|
|
$ |
28,754 |
|
|
$ |
28,668 |
|
F-24
The effective income tax rate was different from the statutory U.S. federal income tax rate of 21.0%, for the years ended September 30, 2023, 2022 and 2021, due to the following (in thousands):
|
|
2023 |
|
|
Rate |
|
|
2022 |
|
|
Rate |
|
|
2021 |
|
|
Rate |
|
||||||
Income tax expense / federal statutory rate |
|
$ |
19,296 |
|
|
|
21.0 |
% |
|
$ |
21,836 |
|
|
|
21.0 |
% |
|
$ |
25,583 |
|
|
|
21.0 |
% |
State and local taxes — net of federal expense |
|
|
3,218 |
|
|
|
3.5 |
% |
|
|
7,257 |
|
|
|
7.0 |
% |
|
|
2,329 |
|
|
|
1.9 |
% |
Change in valuation allowance |
|
|
597 |
|
|
|
0.6 |
% |
|
|
(350 |
) |
|
|
(0.3 |
)% |
|
|
(220 |
) |
|
|
(0.2 |
)% |
Stock-based compensation |
|
|
721 |
|
|
|
0.8 |
% |
|
|
145 |
|
|
|
0.1 |
% |
|
|
1,379 |
|
|
|
1.1 |
% |
Non-deductible transaction costs |
|
|
— |
|
|
|
0.0 |
% |
|
|
— |
|
|
|
0.0 |
% |
|
|
544 |
|
|
|
0.4 |
% |
Executive compensation |
|
|
608 |
|
|
|
0.7 |
% |
|
|
364 |
|
|
|
0.4 |
% |
|
|
704 |
|
|
|
0.6 |
% |
Federal research and development credit |
|
|
(746 |
) |
|
|
(0.8 |
)% |
|
|
(703 |
) |
|
|
(0.7 |
)% |
|
|
(1,829 |
) |
|
|
(1.4 |
)% |
Meals and entertainment |
|
|
284 |
|
|
|
0.3 |
% |
|
|
224 |
|
|
|
0.2 |
% |
|
|
267 |
|
|
|
0.2 |
% |
Other |
|
|
(49 |
) |
|
|
(0.1 |
)% |
|
|
(19 |
) |
|
|
0.0 |
% |
|
|
(89 |
) |
|
|
(0.1 |
)% |
Income tax expense / effective tax rate |
|
$ |
23,929 |
|
|
|
26.0 |
% |
|
$ |
28,754 |
|
|
|
27.7 |
% |
|
$ |
28,668 |
|
|
|
23.5 |
% |
The effective income tax rate was 26.0% for the year ended September 30, 2023 compared to 27.7% for the year ended September 30, 2022. The 2023 effective income tax rate was positively impacted by decreased State tax expense recognized in the current period partially offset by a net increase in valuation allowances and disallowed compensation costs.
The components of the deferred tax assets and liabilities consisted of the following (in thousands):
|
|
As of September 30, |
|
|||||
|
|
2023 |
|
|
2022 |
|
||
Deferred tax asset: |
|
|
|
|
|
|
||
State loss carryforwards and other benefits |
|
$ |
15,744 |
|
|
$ |
13,699 |
|
Inventory reserves |
|
|
14,203 |
|
|
|
13,852 |
|
Warranty reserves |
|
|
4,148 |
|
|
|
3,839 |
|
Accrued expenses |
|
|
11,996 |
|
|
|
10,607 |
|
Stock-based compensation |
|
|
13,502 |
|
|
|
12,185 |
|
Lease liabilities |
|
|
24,063 |
|
|
|
25,034 |
|
Valuation allowance |
|
|
(5,557 |
) |
|
|
(4,960 |
) |
Total deferred tax assets |
|
|
78,099 |
|
|
|
74,256 |
|
Deferred tax liabilities: |
|
|
|
|
|
|
||
Intangible assets — net |
|
|
37,272 |
|
|
|
42,197 |
|
Property, plant and equipment |
|
|
74,611 |
|
|
|
73,471 |
|
Right-of-use assets |
|
|
21,728 |
|
|
|
23,237 |
|
Unrealized gain in other comprehensive income |
|
|
615 |
|
|
|
— |
|
Indemnification receivable related to warranty reserves |
|
|
203 |
|
|
|
546 |
|
Total deferred tax liabilities |
|
|
134,429 |
|
|
|
139,451 |
|
Net deferred tax liability |
|
$ |
56,330 |
|
|
$ |
65,195 |
|
At September 30, 2023, the Company has no net operating loss carryforwards for federal income tax purposes. Additionally, the Company has approximately $83.9 million of net operating loss carryforwards for state and local tax purposes, which expire in varying amounts beginning in 2024 and through 2043. Furthermore, some net operating loss carry forwards for state and local purposes have indefinite carryforward periods. Utilization of the NOL carryforwards may be subject to a substantial annual limitation under Section 382 of the Internal Revenue Code of 1986, as amended (the Code), and similar state law due to ownership changes that could occur in the future. These ownership changes may limit the amount of carryforwards that can be utilized annually to offset future taxable income. The valuation allowance was determined in accordance with the provisions of ASC 740, Income Taxes, which requires that a valuation allowance be established and maintained when management’s analysis indicates it is “not more likely than not” that all or a portion of deferred tax assets will be realized. The valuation allowance for certain net deferred tax assets of $5.6 million and $5.0 million at September 30, 2023 and 2022, respectively, is attributable to the uncertainty as to the realization of state deferred tax assets related to Idaho tax credit carryforwards and Pennsylvania state tax loss carryforwards at certain U.S. subsidiaries of the Company (The AZEK Group LLC and Scranton Products, Inc.).
F-25
The activity in the valuation allowance consisted of the following (in thousands):
|
|
As of September 30, |
|
|||||
|
|
2023 |
|
|
2022 |
|
||
Beginning balance |
|
$ |
4,960 |
|
|
$ |
5,310 |
|
Expense |
|
|
597 |
|
|
|
(350 |
) |
Ending balance |
|
$ |
5,557 |
|
|
$ |
4,960 |
|
A reconciliation of the beginning and ending balances for liabilities associated with unrecognized tax benefits consisted of the following (in thousands):
|
|
As of September 30, |
|
|||||
|
|
2023 |
|
|
2022 |
|
||
Beginning balance |
|
$ |
780 |
|
|
$ |
955 |
|
Unrecognized tax benefits related to prior years |
|
|
70 |
|
|
|
(230 |
) |
Unrecognized tax benefits related to the current year |
|
|
50 |
|
|
|
55 |
|
Ending balance |
|
$ |
900 |
|
|
$ |
780 |
|
Unrecognized tax benefits of $0.9 million and $0.8 million are recorded at September 30, 2023 and 2022, respectively. The total liabilities associated with the unrecognized tax benefits that, if recognized, would impact the Company’s effective tax rate were $0.9 million and $0.8 million at September 30, 2023 and 2022, respectively.
When applicable, the Company’s practice is to recognize interest and penalties related to uncertain income tax positions in income tax expense. For the years ended September 30, 2023, 2022 and 2021 the amounts recognized by the Company for interest and penalties were not material. The corresponding liability recorded in the Consolidated Balance Sheets as of September 30, 2023 and 2022 was also not material.
The Company and its subsidiaries file U.S. federal income tax returns. The Company and its subsidiaries’ federal income tax returns for tax years 2020 and beyond are open tax years subject to examination by the Internal Revenue Service (“IRS”). The Company also has net operating loss carry-forwards from prior to 2020, which are subject to examination upon future utilization of such losses. The Company and its subsidiaries also file income tax returns in various state jurisdictions, as appropriate, with varying statutes of limitation. These returns are not material to the consolidated income tax provision.
17. COMMITMENTS AND CONTINGENCIES
Raw Material and Fixed Asset Purchase Commitments
The Company fulfills requirements for raw materials under both purchase orders and supply contracts. In the year ended September 30, 2023, the Company purchased substantially all of its raw materials, other than resins, under purchase orders which do not involve long-term supply commitments.
Substantially all of the Company’s resins are purchased under supply contracts that may average approximately one to two years, for which pricing is variable based on certain industry-based market indices. The resin supply contracts are negotiated annually and generally provide that the Company is obligated to purchase a minimum amount of resins from each supplier. As of September 30, 2023, the Company has no purchase commitments under material supply contracts through the calendar year ending December 31, 2023. As of September 30, 2023 and 2022, the Company had committed to purchase $0.4 million and $0.4 million of equipment, respectively.
Legal Proceedings
In the normal course of the Company’s business, it is at times subject to pending and threatened legal actions, in some cases for which the relief or damages sought may be substantial. Although the Company is not able to predict the outcome of such actions, after reviewing all pending and threatened actions with counsel and based on information currently available, management believes that the outcome of such actions, individually or in the aggregate, will not have a material adverse effect on the Company’s results of operations or financial position. However, it is possible that the ultimate resolution of such matters, if unfavorable, may be material to the Company’s results of operations in a particular future period as the time and amount of any resolution of such actions and its relationship to the future results of operations are not currently known.
F-26
In evaluating whether to accrue for losses associated with legal or environmental contingencies, it is our policy to take into consideration factors such as the facts and circumstances asserted, our historical experience with contingencies of a similar nature, the likelihood of our prevailing and the severity of any potential loss. For some matters, no accrual is established because we have assessed our risk of loss to be remote. Where we have determined that the risk of loss is probable and such losses are reasonably estimable, we record an accrual. While we regularly review the status of, and our estimates of potential liability associated with, the contingencies to determine the adequacy of any associated accruals and related disclosures, the ultimate amount of loss may differ from our estimates.
Loss Contingencies
During the year ended September 30, 2019, the Company was made aware of a worker’s compensation case that became reasonably possible to give rise to a liability. Discovery has been completed, and the Company filed motions for summary judgment in April 2023. On November 8, 2023, the court granted the Company's motions for summary judgment seeking to dismiss Scranton Products Inc. and The AZEK Company Inc. but denied the Company's motions for summary judgment seeking to dismiss The AZEK Group LLC and Vycom Corp. A trial date has been set for May 2024.
In the normal course of the Company’s business, it is at times subject to various other legal actions, in some cases for which the relief or damages sought may be substantial.
Although the Company is not able to predict the outcome of legal actions to which it may be subject, after reviewing all pending and threatened actions with counsel and based on information currently available, management believes that the outcome of such actions, individually or in the aggregate, will not have a material adverse effect on the Company’s results of operations or financial position. However, it is possible that the ultimate resolution of such matters, if unfavorable, may be material to the Company’s results of operations in a particular future period as the time and amount of any resolution of such actions and its relationship to the future results of operations are not currently known. The Company accrues for losses when they are probable of occurrence and such losses are reasonably estimable. Legal costs expected to be incurred are accounted for as they are incurred.
18. CONDENSED FINANCIAL INFORMATION OF REGISTRANT (PARENT COMPANY ONLY)
The AZEK Company Inc. (parent company only)
Balance Sheets
(In thousands of U.S. dollars, except for share and per share amounts)
|
|
As of September 30, |
|
|||||
|
|
2023 |
|
|
2022 |
|
||
ASSETS: |
|
|
|
|
|
|
||
Non-current assets: |
|
|
|
|
|
|
||
Investments in subsidiaries |
|
$ |
1,429,643 |
|
|
$ |
1,444,443 |
|
Total non-current assets |
|
|
1,429,643 |
|
|
|
1,444,443 |
|
Total assets |
|
$ |
1,429,643 |
|
|
$ |
1,444,443 |
|
LIABILITIES AND STOCKHOLDERS’ EQUITY: |
|
|
|
|
|
|
||
Total liabilities |
|
$ |
— |
|
|
$ |
— |
|
Stockholders’ equity: |
|
|
|
|
|
|
||
Preferred stock, $0.001 par value; 1,000,000 shares authorized and no shares issued |
|
|
— |
|
|
|
— |
|
Class A common stock, $0.001 par value; 1,100,000,000 shares authorized, |
|
|
156 |
|
|
|
155 |
|
Class B common stock, $0.001 par value; 100,000,000 shares authorized, 100 shares |
|
|
— |
|
|
|
— |
|
Additional paid-in capital |
|
|
1,662,322 |
|
|
|
1,630,378 |
|
Accumulated deficit |
|
|
(45,047 |
) |
|
|
(113,002 |
) |
Accumulated other comprehensive income (loss) |
|
|
1,878 |
|
|
|
— |
|
Treasury stock, at cost, 8,268,423 shares at September 30, 2023 and |
|
|
(189,666 |
) |
|
|
(73,088 |
) |
Total stockholders’ equity |
|
|
1,429,643 |
|
|
|
1,444,443 |
|
Total liabilities and stockholders’ equity |
|
$ |
1,429,643 |
|
|
$ |
1,444,443 |
|
F-27
The AZEK Company Inc. (parent company only)
Statements of Comprehensive Income
(In thousands of U.S. dollars)
|
|
Years Ended September 30, |
|
|||||||||
|
|
2023 |
|
|
2022 |
|
|
2021 |
|
|||
Net income of subsidiaries |
|
$ |
67,955 |
|
|
$ |
75,225 |
|
|
$ |
93,150 |
|
Net income of subsidiaries |
|
$ |
67,955 |
|
|
$ |
75,225 |
|
|
$ |
93,150 |
|
Comprehensive income |
|
$ |
69,833 |
|
|
$ |
75,225 |
|
|
$ |
93,150 |
|
The AZEK Company Inc. did not have any cash as of September 30, 2023, 2022 and 2021, accordingly a Statement of Cash Flows has not been presented.
Basis of Presentation
The parent company financial statements should be read in conjunction with the Company’s Consolidated Financial Statements and the accompanying notes thereto. For purposes of this condensed financial information, the Company’s wholly owned and majority owned subsidiaries are recorded based upon its proportionate share of the subsidiaries’ net assets (similar to presenting them on the equity method).
Since the restricted net assets of The AZEK Company Inc. and its subsidiaries exceed 25% of the consolidated net assets of the Company and its subsidiaries, the accompanying condensed parent company financial statements have been prepared in accordance with Rule 12-04, Schedule 1 of Regulation S-X. This information should be read in conjunction with the accompanying Consolidated Financial Statements.
Dividends from Subsidiaries
There were $115.5 million, $73.1 million and $0.0 million cash dividends paid to The AZEK Company Inc. from the Company’s consolidated subsidiaries during each of the years ended September 30, 2023, 2022 and 2021. Cash dividends of $115.5 million were used to fund the $36.0 million share repurchase from the underwriter upon completion of the secondary offering and $79.5 million share repurchase on the open market during the year ended September 30, 2023. Cash dividends of $73.1 million were used to fund the $50.0 million ASR and $23.1 million share repurchase on the open market during the year ended September 30, 2022.
Restricted Payments
The AZEK Group LLC is party to the Revolving Credit Facility and the Term Loan Agreement originally executed on September 30, 2013, both of which have been amended and extended from time to time. The obligations under the Revolving Credit Facility and Term Loan Agreement are secured by substantially all of the present and future assets of the borrowers and guarantors, including equity interests of their domestic subsidiaries, subject to certain exceptions.
The obligations under the Revolving Credit Facility and Term Loan Agreement are guaranteed by the Company and its wholly owned domestic subsidiaries other than certain immaterial subsidiaries and other excluded subsidiaries. The AZEK Group LLC is not permitted to make certain payments unless those payments are consistent with exceptions outlined in the agreements. These payments include repurchase of equity interests, fees associated with a public offering, income taxes due in other applicable payments. Further, the payments are only permitted if certain conditions are met related to availability and fixed charge coverage as defined in the Revolving Credit Facility and described in Note 7 to these Consolidated Financial Statements.
19. SUBSEQUENT EVENTS
On October 10, 2023, the Company entered into a definitive agreement to sell its Vycom business, a division of its Commercial segment, to Ohio-based Plaskolite, LLC. The transaction closed on November 1, 2023. As of September 30, 2023, the transaction did not meet the criteria to be classified as held for sale in our Consolidated Balance Sheet.
F-28
Exhibit 10.21
THE AZEK COMPANY INC.
2020 OMNIBUS INCENTIVE COMPENSATION PLAN
RESTRICTED STOCK UNIT AWARD AGREEMENT
This Restricted Stock Unit Award Agreement (this “Award Agreement”) evidences an award of restricted stock units (“RSUs”) by The AZEK Company Inc., a Delaware corporation (“AZEK”) under The AZEK Company Inc. 2020 Omnibus Incentive Compensation Plan (the “Plan”). Capitalized terms not defined in the Award Agreement have the meanings given to them in the Plan.
Name of Grantee: [Participant Name] (the “Grantee”).
Grant Date: [Grant Date] (the “Grant Date”).
Number of RSUs: [Number of Awards Granted]
Vesting Dates: The RSUs shall vest to the extent earned in accordance with Annex A attached hereto (the date on which the RSUs vest, the “Vesting Date”).
The RSUs will vest only if the Grantee is, and has been, continuously Employed by AZEK from the Grant Date through the Vesting Date, and any unvested RSUs will be forfeited upon any termination of Employment for any reason.
Notwithstanding the foregoing and any provision in the Plan:
Delivery Date: No later than 30 days after the Vesting Date (or, if earlier, the date of the Grantee’s termination of Employment without Cause or for Good Reason, as may be defined in the Employment Agreement, on or within 24 months following a Change in Control), AZEK will issue to the Grantee one share of common stock, par value $0.001 per share (each, a “Share”), of AZEK for each vested RSU, subject to applicable tax withholding as provided in Section 3.2 of the Plan (the date on which the Shares are so issued, the “Delivery Date”).
Dividend Equivalents
and Voting: On the Delivery Date, AZEK will pay to the Grantee a cash amount equal to the product of (x) all cash dividends or other distributions (other than cash dividends or other distributions pursuant to which the RSUs were adjusted pursuant to Section 1.6.3 of the Plan), if any, paid on a Share from the Grant Date to the Delivery Date and (y) the number of Shares delivered to the Grantee on the Delivery Date (including for this purpose any Shares which would have been delivered on the Delivery Date but for being withheld to satisfy tax withholding obligations). The Grantee will have no voting rights with respect to any of the Shares underlying any RSUs until such Shares are issued and delivered to the Grantee and the Grantee’s name is entered as a stockholder of record on the books of AZEK.
Section 409A: Payments under this Award Agreement are intended to be exempt from or comply with Section 409A of the Internal Revenue Code (“Section 409A”) to the extent applicable, and this Award Agreement shall be administered accordingly. Notwithstanding anything to the contrary contained in this Award Agreement or any employment agreement the Grantee has entered into with AZEK (“Employment Agreement”), to the extent that any payment under this Award Agreement is determined by AZEK to constitute “non-qualified deferred compensation” subject to Section 409A and is payable to the Grantee by reason of termination of the Grantee’s Employment, then (a) such payment shall be made to the Grantee only upon a “separation from service” as defined for purposes of Section 409A under applicable regulations and (b) if the Grantee is a “specified employee” (within the meaning of Section 409A and as determined by AZEK), such payment shall not be made before the date that is six months after the date of the Grantee’s separation from service (or the Grantee’s earlier death). Each payment under this Award Agreement shall be treated as a separate payment for purposes of Section 409A.
Tax Representations;
Withholding: The Grantee is advised to review with his/her own tax advisors the
federal, state and local tax consequences of receiving the RSUs. The Grantee hereby represents to AZEK that he/she is relying solely on such advisors and not on any statements or representations of AZEK, its Affiliates or any of their respective agents. If, in connection with the RSUs, AZEK is required to withhold any amounts by reason of any federal, state or local tax, such withholding shall be effected in accordance with Section 3.2 of the Plan. If the RSUs vest prior to payment, then the Grantee agrees to cooperate with AZEK to satisfy any tax withholding obligations, in such manner as determined by the Committee in its sole discretion.
Transfer Restrictions: The Grantee may not sell, exchange, transfer, assign, pledge, hypothecate or otherwise encumber the RSUs or the Shares underlying the RSUs, other than to the extent provided in Section 3.5 of the Plan.
Clawback: The RSUs will be subject to any clawback or recapture policy that the Company may adopt from time to time to the extent provided in such policy and, in accordance with such policy, may be subject to the requirement that the RSUs be repaid to the Company after they have been distributed to the Grantee.
Amendment: The Committee reserves the right at any time to amend the terms and conditions set forth in this Award Agreement, except that the Committee shall not make any amendment in a manner unfavorable to the Grantee (other than if immaterial), without the Grantee’s consent. Any amendment of this Award Agreement shall be in writing and signed by an authorized member of the Committee or a person or persons designated by the Committee.
Governing Law: This Award Agreement shall be deemed to be made under, and in all respects be interpreted, construed and governed by and in accordance with, the laws of the State of Delaware without regard to conflict of law principles.
All Other Terms: As set forth in the Plan.
The Plan is incorporated herein by reference. Except as otherwise set forth in the Award Agreement, the Award Agreement and the Plan constitute the entire agreement and understanding of the parties with respect to the RSUs. In the event that any provision of the Award Agreement is inconsistent with the Plan, the terms of the Plan will control. Except as specifically provided herein, in the event that any provision of this Award Agreement is inconsistent with any Employment Agreement, the terms of the Employment Agreement will control. By accepting this Award Agreement, the Grantee agrees to be subject to the terms and conditions of the Plan.
This Award Agreement may be executed in counterparts, which together will constitute one and the same original.
IN WITNESS WHEREOF, the parties have caused this Award Agreement to be duly executed and effective as of the Grant Date.
THE AZEK COMPANY INC.
By:
Name:
Title:
[Participant Name]
ANNEX A
[Intentionally Omitted]
Exhibit 19
THE AZEK COMPANY INC.
INSIDER TRADING POLICY
This Insider Trading Policy (this “Policy”) provides prohibitions and guidelines to Insiders (as defined below) of The AZEK Company Inc., and its subsidiaries (collectively, the “Company”) with respect to transacting in Company securities or derivatives thereof. This Policy has been adopted by the Company’s Board of Directors (the “Board”) and may only be amended by the Board.
Applicability of Policy
This Policy applies to all transactions in the Company’s common stock, as well as other securities that the Company may issue from time to time, and derivative securities relating to any such securities, whether issued by the Company (i.e., employee, director or consultant stock options, warrants or convertible preferred stock or debt) or issued by a third party (i.e., exchange-traded options). The Policy applies to: (i) all directors and officers of the Company and any employees of, or consultants to, the Company; (ii) all members of the immediate family or household of any person referred to in (i); and (iii) any entity owned or controlled by any such person (collectively, all such persons are referred to in this Policy as “Insiders”). The Company may also determine that other persons should be subject to this Policy, such as contractors who have access to Material Nonpublic Information (as defined in Annex A to this Policy).
This Policy imposes the following principal restrictions with respect to the trading activity of Insiders:
As further described below, Insiders are responsible for ensuring that the transaction of any securities complies with this Policy.
General Statement of Policy
Insiders are prohibited from using Material Nonpublic Information acquired by the Insider for their own personal or economic benefit and are further prohibited from disclosing any Material Nonpublic Information to any person who is not authorized by the Company to have access to such information. This Policy has been adopted to promote compliance with U.S. insider trading laws and regulations and avoid any appearance of impropriety. The U.S. Securities and Exchange Commission (the “SEC”), U.S. Attorneys and state law enforcement authorities investigate and pursue insider trading violations vigorously and have adopted sophisticated surveillance techniques to identify insider trading transactions. Under federal securities laws, individuals who engage in illegal insider trading or tipping can be liable for substantial criminal and civil penalties.
Prohibition Against Insider Trading
The only exceptions to this prohibition are described below under “Permitted Transactions”. During the period that the Insider possesses Material Nonpublic Information and absent an exception, an Insider will have to forgo a proposed transaction in Company securities, even though he or she may have planned to execute the transaction before learning of the Material Nonpublic Information and even though failure to execute the transaction may result in an economic loss to, or the nonrealization of anticipated profit by, the Insider.
-2-
Prohibited Transactions in Company Securities
-3-
Permitted Transactions
-4-
Special Trading Restrictions for Designated Persons
The list of Designated Persons will be reviewed periodically by the Company and updated as necessary and will be available upon request to the Chief Legal Officer. Given the nature of their jobs, senior members of the Finance, Accounting, Legal and Compliance, Investor Relations and Communications teams will always be considered Designated Persons. Any person designated a Designated Person shall be subject to the restrictions contained in this Policy applicable thereto as long as he or she holds that position unless notified in writing that he or she is no longer a Designated Person.
The Company has established its Black Out Period as the time period commencing 10 days prior to the end of a fiscal quarter until two full trading days following the issuance of the public disclosure of the Company’s financial results for the most recently completed fiscal quarter or financial year. Annex C to this Policy provides an illustration of a quarterly Black Out Period.
-5-
During this period, except in compliance with this Policy, Designated Persons are prohibited from purchasing or selling Company securities.
In rare circumstances, the Chief Legal Officer, in consultation with the Chief Executive Officer and the Chair of the Nominating and Corporate Governance Committee, may delay the commencement of the Black Out Period so long as (i) no Material Nonpublic Information exists, and (ii) exigent circumstances warrant a delay in the Blackout Period.
-6-
The Company may also find it necessary from time to time to require compliance with the preclearance process for employees of, and consultants to, the Company who are temporarily or regularly in possession of Material Nonpublic Information. The Company will notify each of these employees or consultants of the need to preclear their purchases and sales of Company securities as and when this is required.
Possible Criminal and Civil Liability and/or Disciplinary Action for Misuse of Material Nonpublic Information
-7-
Insider’s Responsibility for Compliance
Persons subject to this Policy have ethical and legal obligations to maintain the confidentiality of information about the Company and to not engage in transactions in Company securities while in possession of Material Nonpublic Information. Each individual is responsible for making sure that he or she complies with this Policy, and that any family member, household member or entity whose transactions are subject to this Policy, as discussed above, also comply with this Policy. In all cases, the responsibility for determining whether an individual is in possession of Material Nonpublic Information rests with that individual, and any action on the part of the Company, the Chief Legal Officer or any other employee or director pursuant to this Policy (or otherwise) does not in any way constitute legal advice or insulate an individual from liability under applicable securities laws. One could be subject to severe legal penalties and disciplinary action by the Company for any conduct prohibited by this Policy or applicable securities laws, as described above. If Insiders become aware of a violation of this Policy, Insiders should promptly report the violation by following the reporting guidelines in the Company’s Code of Conduct and Ethics, under the “Compliance, Reporting and Accountability” section thereof.
Acknowledgement and Certification
This Policy will be delivered to all directors, officers, employees and designated outsiders on an annual basis and to all new directors, officers, employees and designated outsiders at the start of their employment or relationship with the Company. Upon first receiving a copy of this Policy or any revised versions, each director, executive officer and other employee designated as a Designated Person must sign an acknowledgment that he or she has received a copy of this Policy and agrees to comply with its terms.
Further Inquiries
The Company encourages Insiders to reach out with any questions they may have with respect to any of the matters set forth in this Policy. All such questions should be directed to the Chief Legal Officer.
The Chief Legal Officer may consult with the Chair of the Nominating and Corporate Governance Committee as appropriate. The Chief Legal Officer may delegate any of his or her authority and/or responsibilities under this Policy to another member of the Company’s legal department at his or her discretion.
CERTIFICATION
[Intentionally Omitted]
The following Annexes are attached and should be reviewed in conjunction with this Policy:
Annex A – Definition of Material Nonpublic Information
Annex B – Requirements for Trading Plans
Annex C – Illustration of Black Out Period Annex A: Definition of Material Nonpublic Information
-8-
It is not possible to define all categories of material information concerning the Company. However, information should be treated as “Material Nonpublic Information” if:
In all cases in which an Insider is not certain that information in his or her possession is Material Nonpublic Information, the Insider should exercise caution and treat the information as if it is Material Nonpublic Information. There are, however, general categories of information that are particularly important to the Company and, as a general rule, should always be considered material, regardless of whether the information is considered to be positive or negative to a particular investment decision.
Examples of these types of information include, but are not limited to:
-9-
When securities transactions become the subject of inquiry, they are scrutinized after the fact, with the benefit of hindsight. As a result, before engaging in any transaction, all persons covered by this Policy should consider carefully how regulators and others might regard the transaction in hindsight. Although all transactions could be problematic in hindsight, sales or dispositions in particular have the potential to be very closely scrutinized after any adverse event that significantly impacts Company securities. Any person who is unsure whether the information that he or she possesses is material or nonpublic should consult the Chief Legal Officer for guidance before engaging in any transaction.
-10-
Annex B: Requirements for Trading Plans
All Trading Plans (and any amendment or modification thereto) must comply with Rule 10b5-1 of the Exchange Act, and must meet the following minimum conditions:
-11-
With respect to any purchase or sale under a Trading Plan, the third party effecting transactions on the behalf of the Insider should be instructed to send duplicative confirmations of all such transactions to the Chief Legal Officer (through email, duplicate confirmation directly from the broker, or otherwise) immediately, but no later than the day after execution of the transaction.
Subject to certain exceptions, no Insider may have more than one Trading Plan in effect at any given time. Any Insider that wishes to enter into more than one Trading Plan at the same time must first consult with the Chief Legal Officer.
All capitalized terms herein shall have the meanings assigned thereto in the Policy.
-12-
Annex C: Illustration of Black Out Period
[Intentionally Omitted]
-13-
Exhibit 21.1
The AZEK Company Inc.
List of Subsidiaries
|
|
|
|
|
Entity |
|
State |
|
Country |
CPG International LLC |
|
Delaware |
|
United States |
|
|
|
||
Scranton Products Inc. |
|
Delaware |
|
United States |
|
|
|
||
Sanatec Sub I Corporation |
|
Delaware |
|
United States |
|
|
|
||
Santana Products Inc. |
|
Delaware |
|
United States |
|
|
|
||
CPG Sub I Corporation |
|
Delaware |
|
United States |
|
|
|
||
CPG Building Products LLC |
|
Delaware |
|
United States |
|
|
|
||
WES, LLC |
|
Minnesota |
|
United States |
|
|
|
||
UltraLox Technology, LLC |
|
Minnesota |
|
United States |
|
|
|
||
Versatex Holdings, LLC |
|
Delaware |
|
United States |
|
|
|
||
Versatex Building Products, LLC |
|
Pennsylvania |
|
United States |
|
|
|
||
Return Polymers, Inc. |
|
Ohio |
|
United States |
|
|
|
|
|
StruXure Outdoor, LLC |
|
Georgia |
|
United States |
|
|
|
|
|
INTEX Millwork Solutions, LLC |
|
New Jersey |
|
United States |
Exhibit 23
CONSENT OF INDEPENDENT REGISTERED PUBLIC ACCOUNTING FIRM
We hereby consent to the incorporation by reference in the Registration Statements on Form S-8 (No. 333-239188 and No. 333-263533) and the Registration Statement on Form S-3 ASR (No. 333-271968) of The AZEK Company Inc. of our report dated November 29, 2023 relating to the financial statements and the effectiveness of internal control over financial reporting, which appears in this Form 10-K.
/s/ PricewaterhouseCoopers LLP
Chicago, Illinois
November 29, 2023
Exhibit 31.1
Certification of Chief Executive Officer pursuant to Rules 13a-14(a) and 15d-14(a) under the Securities and Exchange Act of 1934, as adopted pursuant to Section 302 of the Sarbanes-Oxley Act of 2002
I, Jesse Singh, certify that:
Date: November 29, 2023 |
|
By: |
/s/ Jesse Singh |
|
|
|
Jesse Singh |
|
|
|
Chief Executive Officer, President and Director |
|
|
|
(Principal Executive Officer) |
Exhibit 31.2
Certification of Chief Financial Officer pursuant to Rules 13a-14(a) and 15d-14(a) under the Securities and Exchange Act of 1934, as adopted pursuant to Section 302 of the Sarbanes-Oxley Act of 2002
I, Peter Clifford, certify that:
Date: November 29, 2023 |
|
By: |
/s/ Peter Clifford |
|
|
|
Peter Clifford |
|
|
|
Senior Vice President and Chief Financial Officer |
|
|
|
(Principal Financial Officer) |
Exhibit 32.1
Certification of Chief Executive Officer pursuant to 18 U.S.C. Section 1350, as adopted pursuant to Section 906 of the Sarbanes-Oxley Act of 2002
In connection with the Annual Report on Form 10-K of The AZEK Company Inc., (the “Company”) for the period ended September 30, 2023 as filed with the Securities and Exchange Commission on the date hereof (the “Report”), I certify, pursuant to 18 U.S.C. § 1350, as adopted pursuant to § 906 of the Sarbanes-Oxley Act of 2002, that:
Date: November 29, 2023 |
|
By: |
/s/ Jesse Singh
|
|
|
|
Jesse Singh |
|
|
|
Chief Executive Officer, President and Director (Principal Executive Officer) |
Exhibit 32.2
Certification of Chief Financial Officer pursuant to 18 U.S.C. Section 1350, as adopted pursuant to Section 906 of the Sarbanes-Oxley Act of 2002
In connection with the Annual Report on Form 10-K of The AZEK Company Inc., (the “Company”) for the period ended September 30, 2023 as filed with the Securities and Exchange Commission on the date hereof (the “Report”), I certify, pursuant to 18 U.S.C. § 1350, as adopted pursuant to § 906 of the Sarbanes-Oxley Act of 2002, that:
Date: November 29, 2023 |
|
By: |
/s/ Peter Clifford
|
|
|
|
Peter Clifford |
|
|
|
Senior Vice President and Chief Financial Officer (Principal Financial Officer) |
Exhibit 97
THE AZEK COMPANY INC.
COMPENSATION RECOVERY POLICY
Recovery of Compensation
In the event The AZEK Company Inc. (the “Company”) is required to prepare an accounting restatement due to the Company’s material noncompliance with any financial reporting requirement under applicable securities laws, the Company shall reasonably promptly recover from any Executive Officer the amount of erroneously awarded Incentive-Based Compensation in accordance with the rules of the New York Stock Exchange (the “NYSE”) and Rule 10D-1.
Amount of Compensation Subject to Recovery
The amount of erroneously awarded Incentive-Based Compensation subject to recovery under this Policy shall be the excess of (1) the Incentive-Based Compensation received by the Executive Officer during the three completed fiscal years immediately preceding the date on which the Company is required to prepare an accounting restatement over (2) the amount of Incentive-Based Compensation that otherwise would have been received had it been determined based on the accounting restatement, as determined by the Compensation Committee of the Board of Directors of the Company, or, in the absence of such a committee, by a majority of independent directors serving on the Board (the “Committee”) in its sole discretion. In addition, any amount to be recovered will be calculated without regard to any taxes previously paid.
Method of Recovery
The Committee shall determine, in its sole discretion, the method for recovering or cancelling, as the case may be, Incentive-Based Compensation hereunder, which may include, without limitation, any one or more of the following:
Exhibit 97
Exceptions to Mandatory Compensation Recovery
Recovery of Incentive-Based Compensation under this Policy is not required if the Committee in its sole discretion determines that the recovery of such Incentive-Based Compensation would be impracticable and either of the conditions below is deemed satisfied:
Definitions
For purposes of this Policy:
“Executive Officer” means any current or former “executive officer” of the Company, as determined for purposes of Rule16a-1 under the Securities Exchange Act of 1934, as amended.
“Incentive-Based Compensation” means any cash or equity-based compensation that is granted, earned or vested based wholly or in part upon the attainment of a Financial Reporting Measure.
“Financial Reporting Measure” means any measure that is determined and presented in accordance with the accounting principles used in preparing the Company’s financial statements, any measure that is derived wholly or in part from such measures, stock price and/or total shareholder return.
Acknowledgement by Executive Officers
The Company shall provide notice and seek written acknowledgement of this Policy in the form of Annex A from each Executive Officer, provided that failure to obtain such acknowledgement shall have no impact on the enforceability of this Policy.
No Indemnification
The Company shall not indemnify or agree to indemnify any Executive Officer against the loss of erroneously awarded compensation subject to this Policy nor shall the Company pay or agree to pay any insurance premium to cover the loss of erroneously awarded compensation.
Amendments
Exhibit 97
The Committee may amend, modify or terminate this Policy in whole or in part at any time in its sole discretion and may adopt such rules and procedures that it deems necessary or appropriate to implement this Policy or to comply with applicable laws and regulations.
Validity and Enforceability
The provisions in this Policy are intended to be applied to the fullest extent of the law. To the extent that any provision of this Policy is found to be unenforceable or invalid under any applicable law, such provision shall be applied to the maximum extent permitted, and shall automatically be deemed amended in a manner consistent with its objectives to the extent necessary to conform to applicable law. The invalidity or unenforceability of any provision of this Policy shall not affect the validity or enforceability of any other provision of this Policy.
Exhibit 97
Annex A
[Intentionally Omitted]