UNITED STATES SECURITIES AND EXCHANGE COMMISSION
Washington, D.C. 20549-1004
FORM 10-K
☒ ANNUAL REPORT PURSUANT TO SECTION 13 OR 15(d) OF THE
SECURITIES EXCHANGE ACT OF 1934
For the fiscal year ended August 31, 2023
or
☐ Transition Report Pursuant to Section 13 or 15(d)
of the Securities Exchange Act of 1934
for the transition period from ___________ to ___________
Commission File No. 1-13146
THE GREENBRIER COMPANIES, INC.
(Exact name of Registrant as specified in its charter)
|
Oregon (State of Incorporation) |
|
93-0816972 (I.R.S. Employer Identification No.) |
One Centerpointe Drive, Suite 200, Lake Oswego, OR 97035
(Address of principal executive offices)
(503) 684-7000
(Registrant’s telephone number, including area code)
|
Securities registered pursuant to Section 12(b) of the Act:
|
||
|
Title of Each Class Common Stock without par value |
Trading Symbol(s) GBX |
Name of Each Exchange on Which Registered New York Stock Exchange |
Securities registered pursuant to Section 12(g) of the Act: |
||
|
None |
|
Indicate by check mark if the registrant is a well-known seasoned issuer, as defined in Rule 405 of the Securities Act. Yes ☒ No ☐
Indicate by check mark if the registrant is not required to file reports pursuant to Section 13 or 15 (d) of the Act. Yes ☐ No ☒
Indicate by check mark whether the registrant (1) has filed all reports required to be filed by Section 13 or 15(d) of the Securities Exchange Act of 1934 during the preceding 12 months (or for such shorter period that the Registrant was required to file such reports), and (2) has been subject to such filing requirements for the past 90 days. Yes ☒ No ☐
Indicate by check mark whether the registrant has submitted electronically every Interactive Data File required to be submitted pursuant to Rule 405 of Regulation S-T (§ 232.405 of this chapter) during the preceding 12 months (or for such shorter period that the registrant was required to submit and post such files). Yes ☒ No ☐
Indicate by check mark whether the registrant is a large accelerated filer, an accelerated filer, a non-accelerated filer, a smaller reporting company or an emerging growth company. See definitions of “large accelerated filer,” “accelerated filer,” “smaller reporting company” and “emerging growth company” in Rule 12b-2 of the Exchange Act.
Large accelerated filer |
☒ |
Accelerated filer □ |
Non-accelerated filer □ |
Smaller reporting company ☐ |
Emerging growth company ☐ |
If an emerging growth company, indicate by check mark if the registrant has elected not to use the extended transition period for complying with any new or revised financial accounting standards provided pursuant to Section 13(a) of the Exchange Act. ☐
Indicate by check mark whether the registrant has filed a report on and attestation to its management’s assessment of the effectiveness of its internal control over financial reporting under Section 404(b) of the Sarbanes-Oxley Act (15 U.S.C. 7262(b)) by the registered public accounting firm that prepared or issued its audit report. ☒
If securities are registered pursuant to Section 12(b) of the Act, indicate by check mark whether the financial statements of the registrant included in the filing reflect the correction of an error to previously issued financial statements. ☐
Indicate by check mark whether any of those error corrections are restatements that required a recovery analysis of incentive- based compensation received by any of the registrant’s executive officers during the relevant recovery period pursuant to §240.10D-1(b). ☐
Indicate by check mark whether the registrant is a shell company (as defined in Rule 12b-2 of the Act). Yes ☐ No ☒
Aggregate market value of the registrant’s Common Stock held by non-affiliates as of February 28, 2023 (based on the closing price of such shares on such date) was $1,010,860,245.
The number of shares outstanding of the registrant’s Common Stock on October 20, 2023 was 31,128,446 without par value.
DOCUMENTS INCORPORATED BY REFERENCE
Certain portions of the registrant’s definitive Proxy Statement prepared in connection with the Annual Meeting of Shareholders to be held on January 5, 2024 are incorporated by reference into Part III of this Report.
THE GREENBRIER COMPANIES, INC.
FORM 10-K
TABLE OF CONTENTS
|
|
|
|
PAGE |
|
|
|
3 |
|
|
|
|
|
|
PART I |
|
|
|
|
|
|
|
|
|
Item 1. |
|
|
4 |
|
Item 1A. |
|
|
12 |
|
Item 1B. |
|
|
27 |
|
Item 2. |
|
|
27 |
|
Item 3. |
|
|
27 |
|
Item 4. |
|
|
27 |
|
|
|
|
28 |
|
|
|
|
|
|
PART II |
|
|
|
|
|
|
|
|
|
Item 5. |
|
|
29 |
|
Item 6. |
|
|
30 |
|
Item 7. |
|
MANAGEMENT'S DISCUSSION AND ANALYSIS OF FINANCIAL CONDITION AND RESULTS OF OPERATIONS |
|
31 |
Item 7A. |
|
|
46 |
|
Item 8. |
|
|
49 |
|
Item 9. |
|
CHANGES IN AND DISAGREEMENTS WITH ACCOUNTANTS ON ACCOUNTING AND FINANCIAL DISCLOSURE |
|
82 |
Item 9A. |
|
|
82 |
|
Item 9B. |
|
|
86 |
|
|
|
|
|
|
PART III |
|
|
|
|
|
|
|
|
|
Item 10. |
|
|
86 |
|
Item 11. |
|
|
86 |
|
Item 12. |
|
SECURITY OWNERSHIP OF CERTAIN BENEFICIAL OWNERS AND MANAGEMENT AND RELATED STOCKHOLDERS MATTERS |
|
86 |
Item 13. |
|
CERTAIN RELATIONSHIPS AND RELATED TRANSACTIONS AND DIRECTOR INDEPENDENCE |
|
86 |
Item 14. |
|
|
86 |
|
|
|
|
|
|
PART IV |
|
|
|
|
|
|
|
|
|
Item 15. |
|
|
87 |
|
Item 16. |
|
|
91 |
|
|
|
|
92 |
2
Forward-Looking Statements
This Annual Report on Form 10-K contains forward-looking statements. These statements involve known and unknown risks, uncertainties and other important factors that may cause our actual results, performance or achievements to be materially different from any future results, performance or achievements expressed or implied by the forward-looking statements.
Many of these risks and other factors are beyond our ability to control or predict. Words such as "ability," “allow,” “anticipate,” “believe,” “committed,” “can,” “continue,” “could,” “designed,” “estimate,” “expect,” “foreseeable”, “future,” “goal,” “intend,” “likely,” “may,” “periodically,” “plan,” “potential,” “provide,” “result,” “seek,” “should,” “strategy,” “will,” “would,” and similar expressions identify forward-looking statements. In addition, statements regarding expectations of cost savings or our ability to navigate current challenges, or any other statements that explicitly or implicitly draw trends in our performance or the markets in which we operate, or characterize future events or circumstances, are forward-looking statements.
These risks and uncertainties, as well as other risks and uncertainties that could cause our actual results to differ significantly from management’s expectations, are described in greater detail in Item 1A, “Risk Factors,” Item 1, “Business – Backlog,” Item 7, “Management’s Discussion and Analysis of Financial Condition and Results of Operations,” and Item 9A. “Controls and Procedures – Inherent Limitations on Effectiveness of Controls.” Forward-looking statements are based on currently available operating, financial and market information and are inherently uncertain. Investors should not place undue reliance on forward-looking statements, which speak only as of the date they are made and are not guarantees of future performance. Actual future results and trends may differ materially from such forward-looking statements. Except as otherwise required by law, we do not assume any obligation to update any forward-looking statements.
All references to years refer to the fiscal years ended August 31st unless otherwise noted.
3
PART I
Item 1. BUSINESS
Introduction
We are one of the leading designers, manufacturers and marketers of railroad freight car equipment in North America, Europe, South America and other geographies as opportunities arise. We offer railcar management, regulatory compliance services and leasing services to railcar owners or other users of railcars in North America. We are a leading provider of freight railcar wheel services, maintenance and parts in North America. Through unconsolidated affiliates we produce rail and industrial components and have an ownership stake in a railcar manufacturer in Brazil.
We operate an integrated business model in North America that combines freight car manufacturing, wheel services, railcar maintenance, component parts, leasing and fleet management services. Our model is designed to provide customers with a comprehensive set of freight car product and service solutions by utilizing our substantial engineering, mechanical and technical capabilities as well as our experienced commercial personnel. Our integrated model allows us to develop cross-selling opportunities and synergies among our various operating segments thereby enhancing our margins. We believe our integrated model is difficult to duplicate and provides greater value for our customers and investors.
We operate in three reportable segments: Manufacturing; Maintenance Services; and Leasing & Management Services. Financial information about our reportable segments as well as geographic information is located in Note 19 - Segment Information to our Consolidated Financial Statements.
The Greenbrier Companies, Inc., is incorporated in Oregon. Our principal executive offices are located at One Centerpointe Drive, Suite 200, Lake Oswego, Oregon 97035. Our telephone number is (503) 684-7000 and our Internet website is located at http://www.gbrx.com. Information contained on our website is not part of or incorporated into this Form 10-K or any other filings with the SEC.
Products and Services
Manufacturing Segment
North American Railcar Manufacturing - We manufacture most freight railcar types currently in use in the North American market (other than coal cars) and we continue to expand our product features and functionality. We have demonstrated an ability to capture high market shares in many of the car types we produce. The primary products we produce for the North American market are:
Freight Railcars - We produce a variety of covered hopper cars for food grade products, grain, fertilizer, cement, minerals and plastic pellets as well as gondolas and open top hoppers for steel, metals, scrap and aggregates. We also produce a wide range of boxcars, which are used in the transport of paper products, perishables and general merchandise. Our flat car products include center partition cars for the forest products industry and heavy-duty flat cars.
Tank Cars - We produce a variety of tank cars, including general purpose, pressurized, coiled, lined, insulated and stainless steel. These are designed for the transportation of hazardous and non-hazardous commodities such as petroleum products, ethanol, liquefied petroleum gas, petrochemicals, caustic soda, chlorine, fertilizers, vegetable oils, bio-diesel and various other products.
Intermodal Railcars - We manufacture a comprehensive portfolio of intermodal railcars. Our most popular intermodal product is our double-stack railcars called Maxi-Stack I and Maxi-Stack IV. The double-stack railcar is designed to transport containers stacked two-high on a single platform and provides significant operating and capital savings over other types of intermodal railcars.
Automotive - We manufacture a full line of railcar equipment specifically designed for the transportation of light vehicles. Our automotive offerings include the Auto-Max II, Multi-Max and Multi-Max Plus products, which are designed to carry automobiles, CUVs, SUVs, trucks and high sided vans efficiently.
4
Sustainable Conversions - We are a leading designer and manufacturer of sustainable conversions, which repurposes existing railcars into new equipment service. Our sustainable conversions are an efficient, environmentally sustainable and cost-savings option for railcar owners looking to diversify and optimize their fleets. We rebody or stretch covered hoppers into larger cubic service, re-rack or perform deck conversion on auto racks, and perform tank car retrofits to help customers manage pending regulations.
European Railcar Manufacturing - Our European manufacturing operations produce a variety of freight railcar types, including gondolas, hoppers, intermodal cars, automobile transport, coil steel and metals, flat cars, and sliding wall cars. In addition, our European manufacturing operations produce a comprehensive line of pressurized tank cars for liquid petroleum, LPG gas, chlorine and ammonia and non-pressurized tank cars for light oil, chemicals and other products.
Maintenance Services Segment
Wheel Services - We operate a wheel services network in North America. Our wheel shops provide complete wheel services including reconditioning of wheels and axles in addition to new axle machining, finishing and downsizing.
Railcar Maintenance - We operate a railcar maintenance network in North America including shops certified by the Association of American Railroads (AAR). Our shops perform routine railcar maintenance for third parties and for our leased and managed railcar fleets.
Component Parts Manufacturing - Our component parts facilities recondition and manufacture railcar cushioning units, couplers, yokes, side frames, bolsters and various other parts.
Leasing & Management Services Segment
Leasing - We operate a railcar leasing business in North America through a number of subsidiaries. Our relationships with financial institutions and operating lessors combined with our ownership of a lease fleet of approximately 13,400 railcars enables us to offer flexible financing programs to our customers including operating leases of varied intervals and “per diem” leases. The percentage of owned units on lease was 98.3% at August 31, 2023 with an average remaining lease term of 3.9 years and an average age of 7.5 years. We also originate leases of railcars, which are either newly built or refurbished by our operations. These may be held in the fleet or sold with attached leases to financial institutions or other investors, typically with multi-year management services agreements. As an equipment owner and an originator of leases, we participate principally in the operating lease segment of the market. Assets from our owned lease fleet are periodically sold to accommodate customer demand, manage risk and maintain liquidity.
Management Services - Our North American management services business offers a broad array of software and services that include railcar maintenance management, railcar accounting services (such as billing and revenue collection, car hire receivable and payable administration), total fleet management (including railcar tracking using proprietary software), fleet logistics, administration and railcar re-marketing. We currently provide management services for a fleet of railcars for railroads, shippers, carriers, institutional investors and other leasing and transportation companies in North America. In addition, our Regulatory Services Group offers regulatory, engineering, process consulting and advocacy support to the tank car owner and shipper community, among other services. Our management services business is responsible for the maintenance and administration of our fleet of railcars.
Unconsolidated Affiliates
U.S. Axle Manufacturing - We have a 41.9% interest in Axis, LLC (Axis), a joint venture that manufactures and sells axles to its joint venture partners for use and distribution both domestically and internationally.
Brazilian Railcar Manufacturing - We have a 60% ownership interest in Greenbrier Maxion-Equipamentos e Serviços Ferroviários S.A. (Greenbrier-Maxion), a leading railcar manufacturer in South America, based in Hortolandia, Brazil. Greenbrier-Maxion also assembles bogies and offers a range of aftermarket services including railcar overhaul and refurbishment.
Brazilian Castings and Component Parts Manufacturing - We have a 29.5% ownership interest in Amsted-Maxion Fundição e Equipamentos Ferroviários S.A. (Amsted-Maxion) based in Cruzeiro, Brazil. Amsted-Maxion is a manufacturer of various castings and wheel components for railcars and other heavy industrial equipment.
5
Amsted-Maxion has a 40% ownership position in Greenbrier-Maxion and is integrated with the operations of our Brazilian railcar manufacturer.
Other Unconsolidated Affiliates - We have other unconsolidated affiliates which primarily include joint ventures that produce rail and industrial components, all of which are presented in Investment in unconsolidated affiliates on the Consolidated Balance Sheets.
Backlog
The following table depicts our reported railcar backlog subject to third party sale or lease in number of railcars and estimated future revenue value attributable to such backlog, at the dates shown:
|
|
August 31, |
|
|||||||||
|
|
2023 |
|
|
2022 |
|
|
2021 |
|
|||
New railcar backlog units 1 |
|
|
30,900 |
|
|
|
29,500 |
|
|
|
26,600 |
|
Estimated future revenue value (in millions) 2 |
|
$ |
3,810 |
|
|
$ |
3,480 |
|
|
$ |
2,810 |
|
|
|
|
|
|
|
|
|
|
|
|||
1 Each platform of a railcar is treated as a separate unit.
2 Subject to change based on finalization of product mix.
Approximately 3% of backlog units and 2% of estimated value as of August 31, 2023 was associated with our Brazilian manufacturing operation which are accounted for under the equity method.
Based on current production schedules, approximately 21,500 units in the August 31, 2023 backlog are scheduled for delivery in 2024. The balance of the production is scheduled for delivery into 2026.
Our backlog includes $970 million of railcars intended for syndication which are supported by lease agreements with external customers and may be syndicated to third parties or held in our lease fleet depending on a variety of factors. Multi-year supply agreements are a part of rail industry practice. A portion of the orders included in backlog reflects an assumed product mix. Under terms of the orders, the exact mix and pricing will be determined in the future, which may impact backlog.
Our backlog of railcar units is not necessarily indicative of future results of operations. Certain orders in backlog are subject to customary documentation and completion of terms. Customers may attempt to cancel or modify orders in backlog. Historically, little variation has been experienced between the quantity ordered and the quantity actually delivered, though the timing of deliveries may be modified from time to time.
Customers
Customers across our segments include railroads, leasing companies, financial institutions, shippers, carriers and transportation companies. We have strong, long-term relationships with many of our customers. We believe that our customers’ preference for high quality products, our technological leadership in developing innovative products, our focus on being highly responsive to our customers' needs and competitive pricing of our railcars have helped us maintain our long-standing relationships with our customers.
In 2023, revenue from two customers in aggregate accounted for approximately 30% of total revenue which represented 33% of Manufacturing revenue, 16% of Maintenance Services revenue, and 5% of Leasing & Management Services revenue. No other customers accounted for greater than 10% of total revenue.
Raw Materials and Components
Our products require a supply of materials including steel and specialty components such as brakes, wheels and axles. Specialty components purchased from third parties represent a significant amount of the cost of most freight cars. Our customers often specify particular components and suppliers of such components. Although the number of alternative suppliers of certain specialty components has declined in recent years, there are at least two available suppliers for substantially all of our components.
6
Certain materials and components are periodically in short supply which could potentially impact production at our facilities. We experienced an increase in the price and shortages of certain materials and components during 2023. In an effort to mitigate shortages and reduce supply chain costs, we have entered into strategic alliances and multi-year arrangements for the global sourcing of certain materials and components. We operate a replacement parts business which aids in our vertical integration and we continue to pursue strategic opportunities to protect and enhance our supply chain. We periodically make advance purchases to avoid possible shortages of material due to capacity limitations of component suppliers, shipping and transportation delays and possible price increases.
In 2023, the top ten suppliers for all inventory purchases accounted for approximately 42% of total purchases. The top supplier accounted for 16% of total inventory purchases in 2023. No other suppliers accounted for more than 10% of total inventory purchases. We believe we maintain good relationships with our suppliers.
Competition
We are currently one of the two largest railcar manufacturers in North America. There are also a handful of specialty builders who focus on niche markets. We believe that in Europe we are in the top tier of railcar manufacturers. Through our 60% ownership interest in Greenbrier-Maxion, we are a leading railcar manufacturer in South America. The railcar manufacturing industry is becoming more global as customers are purchasing railcars from manufacturers outside of their geographic region. In all railcar markets that we serve, we compete on the basis of quality, price, timeliness of delivery, innovative product design, reputation and customer service.
Competition in the Maintenance Services businesses is dependent on the type of product or service provided. There are many competitors in these businesses. We compete primarily on the basis of quality, timeliness of delivery, customer service, location of shops, price and engineering expertise.
There are at least twenty institutions in North America that provide railcar leasing and/or services similar to ours. Many of them are also customers that buy new railcars from our manufacturing facilities and used railcars from our lease fleet, as well as utilize our management and maintenance services. We compete primarily on the basis of quality, price, timeliness of delivery, reputation, service offerings and deal structuring and syndication ability. We believe our strong servicing capability and our ability to sell railcars with a lease attached (syndicate railcars), integrated with our manufacturing, maintenance shops, railcar specialization and expertise in particular lease structures provides a strong competitive advantage.
Marketing and Product Development
In North America, we leverage an integrated marketing and sales effort to coordinate relationships in our various segments. We provide our customers with a diverse range of equipment, services and financing alternatives designed to satisfy each customer’s unique needs, whether the customer is buying new equipment, sustainable conversion of existing equipment or seeking to outsource the maintenance or management of equipment. These custom programs may involve a combination of railcar products, leasing, sustainable conversions and remarketing services. In addition, we provide customized maintenance management, equipment management, accounting and compliance services and proprietary software solutions.
In Europe and South America, we maintain relationships with customers through market-specific sales personnel. Our engineering and technical staff works closely with their customer counterparts on the design and certification of railcars. Many European railroads are state-owned and are subject to European Union (EU) regulations covering the tender of government contracts. In Brazil, the government grants long-term concession contracts to private companies to operate and invest in Brazil’s freight rail network.
Through our research and customer relationships, insights are derived into the potential need for new products and services. Marketing and engineering personnel collaborate to evaluate opportunities and develop new products and services that exceed customers’ expectations. Research and development costs incurred during the years ended August 31, 2023, 2022 and 2021 were $4.0 million, $5.4 million and $6.3 million, respectively.
7
Human Capital
With the oversight of the Board, our Chief Executive Officer and senior leadership are thoughtfully invested in our global workforce. We regularly review our priorities and progress in each of the areas highlighted below.
We depend on a highly skilled workforce of 13,800 of which approximately half reside in Mexico. Individuals across multiple locations who have technical skills, including experience in welding, engineering, and machine operating are necessary for us to succeed.
Approximately 6,000 employees are represented by unions, primarily in Mexico and Europe. At our Maintenance Services locations, approximately 50 employees are represented by a union. We believe we have good union relations.
Safety – Employee safety is a top priority and we remain dedicated to continuously improving our safety performance over time. Our safety performance is monitored regularly by our CEO, senior leadership and our Board. We are proud of our commitment to maintaining a safe workplace.
Employee Engagement – Building a successful human capital management strategy requires foresight, commitment and a willingness to embrace change. We are committed to creating a culture of feedback that supports our IDEAL Commitment (Inclusion, Diversity, Equity, Access and Leadership) and reinforces our Core Value of Respect for People.
To remain engaged and understand our employees’ priorities, in 2023 we expanded our employee engagement survey to include our Mexico facilities. Feedback from our surveys informed our decision to introduce additional communication and recognition opportunities.
Communication and Connections – In 2023, Greenbrier launched GBX RailDepot, a communication platform established to connect people and information, and further enhance our workplace culture. Employees can access company information and employee resources, recognize others for their contributions, and celebrate milestones together.
Development and Training – We recognize that a talented and diverse workforce is critical to our success. Our commitment to investing in our people includes providing training and development opportunities at all levels, including on-the-job learning, competency-based training, education assistance, tuition reimbursement, and leadership development. Beyond this, we believe succession planning is more than replacement planning. It is developing a strong talent base that provides a pipeline to grow our organization beyond what it is today. This includes having a clear picture of our talent across the organization, facilitating career conversations and creating growth paths.
Compensation and Employee Well-Being – To remain competitive globally, we regularly evaluate our compensation programs. This includes reviewing base pay levels for equity both internally and externally and assessing the effectiveness of our short and long-term incentive programs. In addition, we strive to provide competitive health and wellness programs to our employees.
Benefits and Wellness – We believe benefits programs are a key differentiator in attracting and retaining talent. We strive to provide competitive programs that meet the diverse needs of our employees and their families. This includes health and wellness as well as financial and income protection benefits.
Diversity and Inclusion – In 2023, we continued to build on our IDEAL Commitment through learning and education, building connections, and promoting an inclusive work environment. We implemented two new Employee Resource Groups (now totaling eight ERGs) to foster career development, broaden learning opportunities, and foster a sense of community among Greenbrier’s workforce. We hosted IDEAL Connect 2023, Greenbrier’s first-ever diversity, equity and inclusion summit, to further collaborate, collect feedback and enhance our IDEAL Commitment across the organization.
Our Environmental, Social & Governance Report (ESG) provides additional information regarding our ESG strategy and goals. It can be found on our website. Information contained on or accessible through our website is not incorporated into, and does not constitute a part of, this filing.
8
Patents and Trademarks
We have a proactive program aimed at protecting our intellectual property and the results from our research and development. We have obtained a number of U.S. and non-U.S. patents of varying duration, and pending patent applications, registered trademarks, copyrights and trade names. We believe that manufacturing expertise, the improvement of existing technology and the development of new products are important in addition to patent protection, in establishing and maintaining a competitive advantage in our market.
Environmental Matters
We are subject to national, state and local environmental laws and regulations concerning, among other matters, air emissions, wastewater discharge, solid and hazardous waste disposal and employee health and safety. Prior to acquiring facilities, we conduct investigations to evaluate the environmental condition of subject properties and may negotiate contractual terms for allocation of environmental exposure arising from prior uses. We operate our facilities in a manner designed to maintain compliance with applicable environmental laws and regulations. Environmental studies have been conducted on certain of our owned and leased properties that indicate additional investigation and some remediation on certain properties may be necessary.
Portland Harbor Superfund Site
Our former Portland, Oregon manufacturing facility (the Portland Property) is located adjacent to the Willamette River. In December 2000, the U.S. Environmental Protection Agency (EPA) classified portions of the Willamette River bed known as the Portland Harbor, including the portion fronting our manufacturing facility, as a federal "National Priority List" or "Superfund" site due to sediment contamination (the Portland Harbor Site). Our company and more than 140 other parties have received a "General Notice" of potential liability from the EPA relating to the Portland Harbor Site. The letter advised us that we may be liable for the costs of investigation and remediation (which liability may be joint and several with other potentially responsible parties) as well as for natural resource damages resulting from releases of hazardous substances to the site. Ten private and public entities, including our company (the Lower Willamette Group or LWG), signed an Administrative Order on Consent (AOC) to perform a remedial investigation/feasibility study (RI/FS) of the Portland Harbor Site under EPA oversight, and several additional entities did not sign such consent, but nevertheless contributed financially to the effort. The EPA-mandated RI/FS was produced by the LWG and cost over $110 million during a 17-year period. We bore a percentage of the total costs incurred by the LWG in connection with the investigation. Our aggregate expenditure during the 17-year period was not material. Some or all of any such outlay may be recoverable from other responsible parties. The EPA issued its Record of Decision (ROD) for the Portland Harbor Site on January 6, 2017 and accordingly on October 26, 2017, the AOC was terminated.
Separate from the process described above, which focused on the type of remediation to be performed at the Portland Harbor Site and the schedule for such remediation, 96 parties, including the State of Oregon and the federal government, are participating in a non-judicial, mediated allocation process to try to allocate costs associated with remediation of the Portland Harbor Site. We will continue to participate in the allocation process. Approximately 110 additional parties signed tolling agreements related to such allocations. On April 23, 2009, our company and the other AOC signatories filed suit against 69 other parties due to a possible limitations period for some such claims; Arkema Inc. et al v. A & C Foundry Products, Inc. et al, U.S. District Court, District of Oregon, Case #3:09-cv-453-PK. All but 12 of these parties elected to sign tolling agreements and be dismissed without prejudice, and the case has been stayed by the court until January 14, 2025.
The EPA's January 6, 2017 ROD identifies a clean-up remedy that the EPA estimates will take 13 years of active remediation, followed by 30 years of monitoring with an estimated undiscounted cost of $1.7 billion. The EPA typically expects its cost estimates to be accurate within a range of -30% to +50%, but this ROD states that changes in costs are likely to occur. The EPA has identified several Sediment Decision Units within the ROD cleanup area. One of the units, RM9W, includes the nearshore area of the river sediments offshore of the Portland Property as well as downstream of the facility. It also includes a portion of the Portland Property's riverbank. The ROD does not break down total remediation costs by Sediment Decision Unit. The EPA requested that potentially responsible parties enter AOCs during 2019 agreeing to conduct remedial design studies. Some parties have signed AOCs, including one party with respect to RM9W which includes the area offshore of the Portland Property. We have not signed an AOC in connection with remedial design, but we are assisting in funding a portion of the RM9W remedial design.
9
The ROD does not address responsibility for the costs of clean-up, nor does it allocate such costs among the potentially responsible parties. Responsibility for funding and implementing the EPA's selected cleanup remedy will be determined at an unspecified later date. Based on the investigation to date, we believe that we did not contribute in any material way to contaminants of concern in the river sediments or the damage of natural resources in the Portland Harbor Site and that the damage in the area of the Portland Harbor Site adjacent to the Portland Property precedes our ownership of the Portland Property. Because these environmental investigations are still underway, sufficient information is currently not available to determine our liability, if any, for the cost of any required remediation or restoration of the Portland Harbor Site or to estimate a range of potential loss. Based on the results of the pending investigations and future assessments of natural resource damages, we may be required to incur costs associated with additional phases of investigation or remedial action, and may be liable for damages to natural resources.
On January 30, 2017 the Confederated Tribes and Bands of Yakama Nation sued 33 parties including our company as well as the federal government and the State of Oregon for costs it incurred in assessing alleged natural resource damages to the Columbia River from contaminants deposited in Portland Harbor. Confederated Tribes and Bands of the Yakama Nation v. Air Liquide America Corp., et al., U.S. Court for the District of Oregon Case No. 3i17-CV-00164-SB. The complaint does not specify the amount of damages the plaintiff will seek. The case has been stayed until January 14, 2025.
Oregon Department of Environmental Quality (DEQ) Regulation of Portland Manufacturing Operations
We entered into a Voluntary Cleanup Agreement with the Oregon Department of Environmental Quality (DEQ) in which we agreed to conduct an investigation of whether, and to what extent, past or present operations at the Portland Property may have released hazardous substances into the environment. We have also signed an Order on Consent with the DEQ to finalize the investigation of potential onsite sources of contamination that may have a release pathway to the Willamette River. Our aggregate expenditure has not been material, however we could incur significant expenses for remediation. Some or all of any such outlay may be recoverable from other responsible parties.
Sale of Portland Property
We sold the Portland Property in May 2023, but remain potentially liable with respect to the above matters. Any of these matters could adversely affect our business and Consolidated Statements of Income. However, any contamination or exacerbation of contamination that occurs after the sale of the property will be the liability of the current and future owners and operators of the Portland Property.
Regulation
We must comply with the rules of the U.S. Department of Transportation (USDOT) and the administrative agencies it oversees including the Federal Railroad Administration (FRA), the Pipeline and Hazardous Materials Safety Administration (PHMSA), and the Department of Homeland Security (DHS) in the U.S. and Transport Canada (TC) in Canada, each of which administer and enforce laws and regulations relating to railroad safety. Products sold and leased by us in North America must meet AAR, TC, PHMSA and FRA standards. More specifically, the transportation of hazardous materials by rail is subject to rigorous oversight by FRA, PHMSA, and DHS. Railroads, acting through the AAR, work in partnership with these and other local, state, and federal entities on hazardous materials-related issues, including train routing, security, tank car design and emergency response. Railroads also require compliance with certain industry best practices that sometimes exceed federal requirements for trains carrying hazardous materials. These regulations govern equipment and safety appliance standards for freight cars and other rail equipment used in interstate and international commerce throughout North America. The AAR promulgates rules and regulations governing the safety and design of equipment, relationships among railroads and other railcar owners with respect to railcars in interchange, and other matters. The AAR also certifies railcar builders and component manufacturers that provide equipment for use on North American railroads. These regulations require maintaining certifications with the AAR as a railcar builder and maintenance provider and component manufacturer. In the next year, we expect new regulations related to recently passed laws that prescribe disclosure of the geographic origin of components of new railcars before new railcars are granted access to the rail interchange system in the United States.
Our operations are subject to regulation of health and safety matters by the U.S. Occupational Safety and Health Administration (OSHA) and the Secretaria del Trabajo y Prevision Social (STPS) in Mexico. We believe that we employ appropriate precautions to protect our employees and others from workplace injuries and harmful exposure to materials handled and managed at our facilities.
10
However, claims asserted against us for work-related illnesses or injury and the further adoption of occupational safety and health regulations in the U.S. or in foreign jurisdictions in which we operate could increase our operating costs. While we do not anticipate having to make material expenditures in order to remain in substantial compliance with health and safety laws and regulations, we are unable to predict the ultimate cost of compliance.
The regulatory environment in Europe consists of a combination of EU regulations and country specific regulations, including a harmonized set of Technical Standards for Interoperability of freight wagons throughout the EU. The regulatory environment in Brazil consists of oversight from the Ministry of Transportation and the National Agency of Ground Transportation. In all other countries, we conform to country specific regulations where applicable.
Additional Information
We are a public reporting company and file annual, quarterly, current and special reports, proxy statements and other information with the SEC. The SEC maintains an internet site that contains reports, proxy and information statements, and other information regarding issuers that file electronically with the SEC at http://www.sec.gov. Through a link on the Investor Relations section of our website, http://www.gbrx.com, we make available the following filings as soon as reasonably practicable after they are electronically filed with or furnished to the SEC: our Annual Report on Form 10-K; Quarterly Reports on Form 10-Q; Current Reports on Form 8-K; and any amendments to those reports filed or furnished pursuant to Section 13(a) or 15(d) of the Securities Exchange Act of 1934, as amended. All such filings are available free of charge. Copies of our Audit Committee Charter, Compensation Committee Charter, Nominating and Corporate Governance Committee Charter, Corporate Governance Guidelines and Code of Business Conduct and Ethics are also available on our website at http://www.gbrx.com. Information contained on our website is not part of or incorporated into this Form 10-K or any other filings with the SEC. In addition, each of the reports and documents listed above are available free of charge by contacting our Investor Relations Department at The Greenbrier Companies, Inc., One Centerpointe Drive, Suite 200, Lake Oswego, Oregon 97035.
11
Item 1A. RISK FACTORS
The following risks could materially and adversely affect our business, financial condition, operating results, liquidity and cash flows, prospects, and stock price. These risks do not identify all risks that we face; other factors, events, or uncertainties currently unknown to us or that we currently do not consider to present significant risks to our business or that emerge in the future could affect us adversely.
Risks Related to Our Business
An economic downturn and economic uncertainty may adversely affect demand for our products and services.
Our customers are often able to delay replacing rail equipment during economic downturns. Factors affecting the level of customer spending for our products and services include general economic conditions, such as inflation, and other factors such as business confidence in future economic conditions, fears of recession, and the availability and cost of efficient capital, among other factors. Worldwide economic conditions remain uncertain. As global economic conditions continue to be volatile or economic uncertainty increases, trends in business spending may become increasingly unpredictable and subject to reductions and fluctuations. Unfavorable economic conditions may lead our customers to delay or reduce purchases of our products and services, result in lower sales volumes, lower prices, lower lease utilization rates, and decreased revenues and profits.
Shortages of skilled labor, increased labor costs, or failure to maintain good relations with our workforce could adversely affect our operations.
We depend on skilled labor in all areas of our business. Some of our facilities are located in areas where demand for skilled labor often exceeds supply. Shortages of some types of skilled labor such as welders and machine operators could restrict our ability to maintain or increase production rates, lead to production inefficiencies and increase our labor costs. Due to the competitive nature of the labor markets in which we operate and the cyclical nature of the railcar industry, the resulting employment cycle increases our risk of not being able to recruit, train and retain the employees we require at efficient costs and on reasonable terms, particularly when the economy expands, production rates are high or competition for such skilled labor increases. We are a party to collective bargaining agreements with various labor unions at some of our operations. Disputes with regard to the terms and conditions of these agreements or our potential inability to negotiate acceptable contracts with these unions in the future could result in, among other things, strikes, work stoppages or other slowdowns by the affected workers. We cannot be assured that our relations with our workforce will remain positive. If our workers were to engage in a strike, work stoppage or other slowdown, or other employees were to become unionized or the terms and conditions in future labor agreements were renegotiated, or if union representation is implemented at such sites and we are unable to agree with the union on reasonable employment terms, including wages, benefits, and work rules, we could experience a significant disruption of our operations and incur higher ongoing labor costs. If we are unable to recruit, train and retain adequate numbers of qualified employees and third party labor providers on a timely basis or at a reasonable cost or on reasonable terms, our business and results of operations could be adversely affected.
Increases in the price of materials and components used in the production of our products could negatively impact our profit margin on the sale of our products.
A significant portion of our business depends on the adequate supply of steel, other raw materials, and energy, as well as numerous specialty parts and components, such as brakes, wheels, side frames, bolsters, and bearings for the railcar business, at cost-effective prices. During 2023, we experienced elevated commodity and supply chain costs including the costs of labor, raw materials, energy, fuel, materials and other inputs necessary for the production and distribution of our products, and elevated levels of inflation may continue in 2024. The cost of steel and all other materials used in the production of our railcars represents more than half of our direct manufacturing costs per railcar. If we are not able to purchase materials and energy at competitive prices, our ability to produce and sell our products on a cost-effective basis could be adversely impacted which, in turn, could adversely affect our revenue and profitability.
12
Disruptions in the supply of materials and components used in the production of our products could negatively impact our business and results of operations.
Supply chains were severely disrupted by the COVID-19 global pandemic. The war in Ukraine has also severely disrupted supply chains for the materials and components that we use in manufacturing our products. Certain materials for our products are currently available from a limited number of suppliers and, as a result, we may have limited control over pricing, availability, and delivery schedules. Additionally, factors beyond our control, including adverse political conditions, trade embargoes, increased tariffs or import duties, inclement weather, natural disasters, terrorism and labor disputes may adversely impact our supply chain, particularly if these conditions or disputes result in work slowdowns, lockouts, strikes, facility closures, or related disruptions. The inability to purchase a sufficient quantity of materials on a timely basis could create disruptions in our production and result in delays while we attempt to engage alternative suppliers. Any such disruption or conditions could harm our business and adversely impact our results of operations. The loss of suppliers or their inability to meet our price, quality, quantity and delivery requirements could have an adverse effect on our ability to manufacture and sell our products on a cost-effective basis.
If we or our joint ventures fail to complete capital expenditure projects on time and within budget, or if these projects, once completed, fail to operate as anticipated, or fail to improve the efficiencies of our operations, or to generate additional revenue as anticipated, such failure could adversely affect our business, financial condition and results of operations.
From time-to-time, we, or our joint ventures, undertake strategic capital projects in order to enhance, expand and/or upgrade facilities and operational capabilities including by insourcing production of certain components in our manufacturing operations. Our ability, and our joint ventures’ respective abilities, to complete these projects on time and within budget, and for us to realize the anticipated increased revenues or lower costs, as applicable, or otherwise realize acceptable returns on these investments or other strategic capital projects that may be undertaken are subject to a number of risks. Many of these risks are beyond our control, including a variety of market, operational, permitting, and labor related factors. In addition, the cost to implement any given strategic capital project ultimately may prove to be greater than originally anticipated. If we, or our joint ventures, are not able to achieve the anticipated results from the implementation of any of these strategic capital projects, or if unanticipated implementation costs are incurred, our business, financial condition and results of operations may be adversely affected. In addition, if we are unable to perform insourced functions better than, or at least as well as, our third-party providers, our business may be harmed.
Our business and operations could be materially and adversely impacted if we fail to adequately manage and respond to events that cause an interruption in our business operations.
Business resiliency is important to our success. Natural and human-made events and circumstances may delay our ability to deliver products and services to our customers. Such events include, but are not limited to, security breaches, disruptions or failures in our information-technology systems, physical damage to our facilities (including fires, structural failures, power outages or other events), or the unavailability of labor. The impact of such disruptions to our business and results of operations may vary based on the length and severity of the disruption. Our failure to create and implement systems for monitoring, mitigating, managing, and recovering from such events could increase the length and severity of such disruptions, and could subject us to losses including penalties, cancellation of orders, and/or other losses.
We face risks related to cybersecurity threats and incidents that increase our costs and could disrupt our business and operations.
We face attempts by malicious hackers, state-sponsored organizations, intruders and potentially terrorists, employees, and third-party service providers into our physical facilities to gain unauthorized access, or introduce malicious software to our network or those of our customers to, among other things, steal proprietary information related to our business, products, employees, and customers; interrupt our systems and services or those of our customers; corrupt the processes used to operate our businesses and to design and manufacture our products; or demand ransom to return control of such systems and services. Such attempts are increasing in number and in technical sophistication, and if successful, would expose us and the affected parties to risk of loss or misuse of proprietary or confidential information, and could significantly disrupt our business operations. Our information technology infrastructure also includes products and services provided by third parties, and these providers can experience breaches of their systems and products that affect the security of our systems and our proprietary or confidential information.
13
Our reliance on information technology increases to the extent working remotely increases among our employees.
The theft, loss, or misuse of third party data collected, used, stored, or transferred by us to run our business, and our attempts to address cybersecurity threats and incidents, whether or not successful, could result in our incurring significant costs related to, for example, disruptions in our operations, rebuilding internal systems, implementing additional threat protection measures, defending against litigation, responding to regulatory inquiries or actions, paying damages, or taking other remedial steps with respect to third parties, as well as reputational harm. In addition, these threats are constantly evolving, thereby increasing the difficulty of successfully defending against them or implementing adequate preventative measures. While we seek to detect and investigate unauthorized attempts and attacks against our network, products, and services, and to prevent their recurrence where practicable through changes to our internal processes and tools, we remain potentially vulnerable to additional known or unknown threats. In some instances, we, our customers, and the users of our products and services can be unaware of an incident or its magnitude and effects.
In addition, global privacy legislation, enforcement, and policy activity in this area are rapidly expanding and creating a complex regulatory compliance environment. Costs to comply with and implement these privacy-related and data protection measures could be significant, and noncompliance could expose us to significant monetary penalties, damage to our reputation, and even criminal sanctions. Even our inadvertent failure to comply with federal, state, or international privacy-related or data-protection laws and regulations could result in audits, regulatory inquiries, or proceedings against us by governmental entities or other third parties.
A material disruption in the movement of rail traffic could impair our ability to deliver railcars and other products to our customers in a timely manner which could prevent us from meeting customer demand, reduce our sales, and negatively impact our results of operations.
Once a railcar or other product is manufactured in one of our plants, it must be moved by rail to a customer delivery point. In many cases, the manufacturing plant and the delivery point are in different countries. Many different and unrelated factors could cause a delay in our ability to move our goods in a timely manner from the manufacturing plant to the delivery point including physical disruptions such as armed conflict, natural disasters and power outages, strikes, labor stoppages or shortages hindering the operation of railroads and related transportation infrastructure, regulatory and bureaucratic inefficiency and unresponsiveness, and other causes. In addition, our manufacturing facilities often purchase raw materials from different countries. The same factors affecting the movement of our completed railcars can disrupt the movement of these raw materials to our manufacturing facilities. A material disruption in the movement of our completed cars or raw materials, especially between countries and across borders, could negatively impact our business and results of operations.
Equipment failures, technological failures, costs and inefficiencies associated with changing of production lines, or transfer of production between facilities, could lead to production, delivery, or service curtailments or shutdowns, loss of revenue or higher expenses.
We operate a substantial amount of equipment at our production facilities. An interruption in production capabilities or maintenance and repair capabilities at our facilities, as a result of equipment or technology failure, acts of nature, terrorism, costs and inefficiencies associated with changing of production lines or transfer of production between facilities, could reduce or prevent our production, delivery, service, or repair of our products and increase our costs and expenses. A halt of production at any of our manufacturing facilities could severely affect delivery times to our customers. Any significant delay in deliveries not otherwise contractually mitigated could result in cancellation of all or a portion of our orders, the loss of future sales, and negatively affect our reputation and our results of operations.
14
An inability to successfully manage, maintain, update, and secure our information systems, and utilize these systems to produce, disseminate, and store relevant and reliable data and information pertaining to our business, could adversely affect our business and competitive position in the market.
We rely on information technology infrastructure and architecture, including hardware, network, software, people, processes and other infrastructure to provide useful and confidential information to conduct our business. In the ordinary course of business, we collect and store sensitive data and information, including our proprietary and regulated business information, that of our customers, suppliers and business partners, and personally identifiable information about our employees, as well as internal communications and exchanges with customers, suppliers, legal counsel, governmental agencies, and consultants. We depend on our information systems to successfully manage our business. We have taken steps to maintain adequate data security by implementing security technologies, internal controls, and network and data center resiliency and recovery processes.
In addition, we continually evaluate and implement upgrades and changes to our information technology systems. We could experience problems in connection with such implementations, including compatibility issues, training requirements, higher than expected implementation costs and other integration challenges and delays. A significant problem with an implementation, integration with other systems or ongoing management and operation of our systems could negatively impact our business by disrupting operations. Such a problem could also have an adverse effect on our ability to generate and interpret accurate management and financial reports and other information on a timely basis, which could have a material adverse effect on our financial reporting system and internal controls and adversely affect our ability to manage our business.
Furthermore, despite our efforts, our information systems and processes, like those of other companies, are susceptible to damage or interruption due to natural disasters, power loss, telecommunications failures, viruses, breaches of security, system upgrades or new system implementations, as well as the inability of these systems or processes to fulfill their intended purpose within our business. Any operational failure or breach of security could lead to the loss or disclosure of both our and our customers’ financial, product and other confidential information, result in regulatory actions and legal proceedings, and/or have an adverse effect on our business and reputation.
Our backlog is not necessarily indicative of the level of our future revenues.
Our manufacturing backlog represents future production for our customers, and estimated potential revenue attributable to such production. Our backlog of railcar units is not necessarily indicative of future results of operations. Some orders are subject to customary documentation, conditions, or completion of terms which may not occur. If a customer cancels an order, we may be unable to recover the entire amount we anticipated receiving from the order. The timing of converting backlog to revenue is also materially impacted by our decision whether to lease railcars, sell railcars, syndicate railcars with a lease attached to an investor, or contribute railcars to our lease fleet. Actual revenue may not equal our anticipated revenues based on our backlog.
The COVID-19 pandemic negatively impacted businesses globally, including our business. A resurgence or development of new strains or variants of COVID-19 or the occurrence of another widespread health crisis and the governmental reaction thereto could materially and adversely impact our business, liquidity and financial position, results of operations, and, in turn, the price of our common stock.
The COVID-19 pandemic negatively impacted businesses globally, including our business, due to changes in consumer behavior, pandemic fears and market downturns, and restrictions on business and individual activities. There were extraordinary actions taken by governmental authorities to contain and combat the outbreak and spread of COVID-19 in regions throughout the world, including travel bans, quarantines, “stay-at-home” orders, and similar mandates for many individuals to substantially restrict daily activities and for many businesses to curtail or cease normal operations. A resurgence or development of new strains or variants of COVID-19 or the occurrence of another widespread health crisis and the governmental reaction thereto may prevent us from operating our facilities due to the illness of our employees, “stay-at-home” regulations, and employee reluctance to appear for work for many different reasons including the implementation of any government-imposed vaccination or testing mandates. Extended closure of one or more of our facilities or a decrease in our available workforce could have a negative impact on our financial position and results of operations. Labor shortages in the geographies where we operate could prevent us from converting backlog to revenue. Similarly, the operations of our customers or suppliers may be disrupted. If our revenues decrease, our available cash would be reduced, and we may need to increase indebtedness to fund operations.
15
The impact from a widespread health crisis could materially and adversely affect our business, liquidity and financial position, and results of operations and, in turn, the price of our common stock.
We operate in highly competitive industries. We may not be able to sustain our market leadership positions, which may impact our financial results.
We face significant competition serving the markets and geographies our customers operate in. We face competition with respect to price, quality, timing, product performance, technological innovation, warranties, reliability of delivery, customer service, and other factors. The effects of this competition could reduce our revenues and operating profits, increase our expenses, limit our ability to grow, and otherwise affect our financial results.
We rely on limited suppliers for certain components and services needed in our production. If we are not able to procure specialty components or services on commercially reasonable terms or on a timely basis, our business, financial condition and results of operations would be adversely affected.
Our manufacturing operations depend in part on our ability to obtain timely deliveries of materials, components and services in acceptable quantities and quality from our suppliers. In 2023, the top ten suppliers for all inventory purchases accounted for approximately 42% of total purchases. The top supplier accounted for approximately 16% of total inventory purchases in 2023. No other suppliers accounted for more than 10% of total inventory purchases. Certain components of our products, particularly specialized components like castings, bolsters, trucks, wheels and axles, and certain services, such as lining capabilities, are currently only available from a limited number of suppliers. If any one or more of our suppliers cease to provide us with sufficient quantities of our components or services in a timely manner or on terms acceptable to us, or cease to provide services or manufacture components of acceptable quality, or go out of business, we could incur disruptions or be limited in our production of our products and may not be able to promptly identify alternative sources for these components or services.
In addition, we are increasing the number of components and services we manufacture or provide ourselves, directly or through joint ventures. If we are not successful at manufacturing such components or providing such services or have production problems after transitioning to self-produced supplies, we may not be able to replace such components or services from third party suppliers in a timely manner. Any resulting disruption in our supply, or increase in the cost of specialized components and services could harm our business and adversely affect our results of operations.
The timing of our asset sales and related revenue recognition could cause significant differences in our quarterly results and liquidity.
We may build products in anticipation of a customer order, or lease railcars to a customer with the aim of selling such railcars on lease to a third party. In such cases, the lag between production and sale results in uneven recognition of revenue and earnings over time. Our production during any given period may be concentrated in relatively few contracts, intensifying the amplitude and irregularity of our revenue streams. The timing of recognizing revenue on a railcar is also materially impacted by our decision whether to lease the railcar to a lessee, sell the railcar, or syndicate the railcar with a lease attached to an investor. In addition, we periodically sell railcars from our own lease fleet and the timing and volume of such sales are difficult to predict. As a result, comparisons of our Manufacturing or Leasing & Management Services revenue, deliveries, quarterly net gain on disposition of equipment, income and liquidity between quarterly periods within one year and between comparable periods in different years may not be meaningful and should not be relied upon as indicators of our future performance.
We depend on our senior management team and other key employees, and significant attrition within our management team or unsuccessful succession planning for members of our senior management team and other key employees who are at or nearing retirement age, could adversely affect our business.
Our success depends in part on our ability to attract, retain and motivate senior management and other key employees. Achieving this objective may be difficult due to many factors, including fluctuations in global economic and industry conditions, competitors’ hiring practices, cost reduction activities, and the effectiveness of our compensation programs. Competition for qualified personnel can be very intense. We must continue to recruit, retain and motivate senior management and other key employees sufficient to maintain our current business and support our future projects and growth objectives. We are vulnerable to attrition among our current senior management team and other key employees.
16
Some members of our senior management team and other key employees are at or nearing retirement age. If we are unsuccessful in our succession planning efforts, the continuity of our business and results of operations could be adversely affected. A loss of any such personnel, or the inability to recruit and retain qualified personnel in the future, could have an adverse effect on our business, financial condition and results of operations.
We derive a significant amount of our revenue from a limited number of customers, the loss of or reduction of business from one or more of which could have an adverse effect on our business.
A significant portion of our revenue is generated from a few major customers. In 2023, revenue from two customers accounted for approximately 30% of total revenue. No other customers accounted for greater than 10% of total revenue. Although we have some long-term contractual relationships with our major customers, we cannot be assured that we will continue to have good relations with our customers, or that our customers will continue to purchase or lease our products or services, or will continue to do so at historical levels, or will renew their existing contracts with us. A reduction in the purchasing or leasing of our products, a termination of our services by one or more of our major customers, a decline in the financial condition of a major customer, or our failure to replace expiring customer contracts with new customer contracts on satisfactory terms could result in a loss of business and have an adverse effect on our business and operating results.
Our business may be negatively impacted as a result of war in Ukraine.
In February 2022, the Russian Federation commenced a military invasion of Ukraine. We cannot predict the full impact of the war in Ukraine, the economic sanctions imposed on Russia, and the related economic and geopolitical instability, including instability in the manufacturing and freight rail markets. Some of our operations, particularly in Europe, have experienced higher energy costs, an increase in the price and decrease in the availability of steel and certain other materials and components, disruptions in transportation and supply chains, and higher manufacturing and borrowing costs. Not all of these costs are subject to escalation and related clauses which allow us to pass through costs to our customers, and there is a risk we will not be successful in renegotiating or managing the implementation of existing agreements to allow us to pass through these increased prices of manufacturing. These negative factors may continue to occur along with other risks to our business that may emerge which include, among others, prolonged heightened inflation, macroeconomic interventions in response to inflation, cyber disruptions or attacks, and disruptions in credit markets. These factors and others could disrupt our business directly and could disrupt the business of our customers thereby reducing or delaying orders of our goods and services. Prolonged civil unrest, political instability or uncertainty, military activities, or broad-based sanctions could have an adverse effect on our operations and business outlook.
Our debt could have negative consequences to our business or results of operations.
We face several risks due to our debt and debt service obligations including our potential inability to satisfy our financial obligations related to our consolidated indebtedness; potential breach of the covenants in our credit agreements (including our revolving credit facility, asset-backed facilities and other facilities); our ability to borrow additional amounts or refinance existing indebtedness in the future to fund operating needs may be limited or costly; our availability of cash flow may be inadequate because a portion of our cash flow is needed to pay principal and interest on our debt; we may be at a disadvantage relative to our competitors that have greater financial resources than us or more flexible capital structures than us; we face additional exposure to the risk of increased interest rates as certain of our borrowings are at variable rates of interest, which could result in higher interest expense in the event of an increase in interest rates; restrictions under debt agreements may adversely interfere with our financial and operating flexibility; and exposure to the possibility that we may suffer a material adverse effect on our business and financial condition if we are unable to service our debt or obtain additional financing, as needed.
We, our subsidiaries, and our joint ventures may incur additional indebtedness, including secured indebtedness, and other obligations and liabilities that do not constitute indebtedness. This could increase the risks associated with our debt. Some of our credit facilities and existing indebtedness use variable rates which may make the amount of interest we pay on our variable rate indebtedness difficult to predict.
17
A failure to design or manufacture products or technologies or to achieve timely certification or market acceptance of new products or technologies could have an adverse effect on our profitability.
We continue to introduce new railcar product innovations and technologies as well as develop and offer information-technology-based services. We occasionally accept orders prior to receiving railcar certification or proving our ability to manufacture a quality product that meets customer standards. We could be unable to successfully design or manufacture new railcar product innovations or technologies. Our software products and information-technology-based services may contain design defects, software errors, hardware failures or other computer system failures that are difficult to detect and correct. Our inability to develop and manufacture new products or technologies in a timely and profitable manner, or to obtain timely certification, or to achieve market acceptance, or to avoid quality problems in our new products, could have a material adverse effect on our revenue and results of operations and subject us to losses including penalties, cancellation of orders, rejection of railcars by a customer and/or other losses.
Our product and service warranties could expose us to significant claims.
We offer our customers limited warranties for many of our products and services. Accordingly, we may be subject to significant warranty claims in the future, such as multiple claims based on one defect repeated throughout our production or servicing processes, claims for which the cost of repairing the defective part is highly disproportionate to the original cost of the part or defects in railcars or services which we discover in the future resulting in increased warranty costs or litigation. Warranty and product support terms may expand beyond those which have traditionally prevailed in the rail supply industry. These types of warranty claims could result in costly product recalls, customers seeking monetary damages, significant repair costs and damage to our reputation. If warranty claims attributable to actions of third party component manufacturers are not recoverable from such parties due to their poor financial condition or other reasons, we could be liable for warranty claims and other risks for using these materials in our products.
Insurance coverage could be costly, unavailable or inadequate.
The ability to insure our businesses, facilities and rail assets is an important aspect of our ability to manage risk. As there are only limited providers of this insurance to the railcar industry, there is no guarantee that such insurance will be available on a cost-effective basis in the future. In addition, we cannot assure that our insurance carriers will be able to pay current or future claims. Additionally, the nature of our business subjects us to physical damage, business interruption and product liability claims, especially in connection with the repair and manufacture of products that carry hazardous or volatile materials. Although we maintain liability insurance coverage at commercially reasonable levels compared to similarly sized heavy equipment manufacturers, an unusually large physical damage, business interruption or product liability claim or a series of claims based on a failure repeated throughout our production process could exceed our insurance coverage or result in damage to our reputation, which could materially adversely impact our financial condition and results of operations.
If we are unable to protect our intellectual property or if third parties assert that our products or services infringe their intellectual property rights, our ability to compete in the market may be harmed, and our business and financial condition may be adversely affected.
If our intellectual property rights are not adequately protected, we may not be able to commercialize our technologies, products or services and our competitors could commercialize our technologies, which could result in a decrease in our sales and market share and could materially adversely affect our business, financial condition and results of operations. Conversely, third parties might assert that our products, services, or other business activities infringe their patents or other intellectual property rights. Infringement and other intellectual property claims and proceedings brought against us, whether successful or not, could result in substantial litigation and judgment costs and harm our reputation.
18
Our financial performance and market value could cause future write-downs of goodwill or intangibles or other long-lived assets in future periods.
We are required to perform an annual impairment test of goodwill and other indefinite lived assets which could result in an impairment charge if it is determined that the carrying value of the asset exceeds its fair value. We perform a goodwill impairment test at the reporting unit level annually or whenever events or circumstances indicate that the carrying value of these assets may exceed their fair value. In addition, we periodically review our intangible and other long-lived assets for impairment when events or changes in circumstances, such as a divestiture, indicate the carrying value may not be recoverable.
If indicators suggest it is more likely than not that the fair value of a reporting unit is less than its carrying value or that the carrying amount of intangible or long-lived assets may not be recoverable, it may result in an impairment. Impairment charges would impact our results of operations in the period in which they are identified. Further, write-downs of goodwill and other assets could affect certain of the financial covenants under debt instruments and could restrict our financial flexibility. In 2023, we recorded an impairment related to certain assets at our former Gunderson Facility which has since been disposed of. See Note 5 to our Consolidated Financial Statements for additional information.
Our business will suffer if we are unsuccessful in making, integrating, and maintaining acquisitions, joint ventures and other strategic investments.
We have acquired businesses and invested in or entered into joint ventures in past periods. We may in the future acquire other businesses or invest in or enter into other joint ventures. Our failure to identify future acquisition or joint venture opportunities, or to complete potential acquisitions or joint ventures on favorable terms, could hinder our ability to grow our business. These transactions create risks to our ongoing business, including loss of management focus on existing operations, the time and effort required to integrate new or acquired businesses into our existing business, and the challenges of coordinating geographically dispersed organizations, as well as risks to the new or acquired business, such as the retention of key personnel and unanticipated expenses. In addition, we might need to issue additional equity securities, spend our cash, or incur debt, contingent liabilities, or amortization expenses related to intangible assets in connection with effecting an acquisition or joint venture, any of which could reduce our profitability and harm our business or only be available on unfavorable terms, if at all.
Risks Related to Market and Economic Factors
Inflation as well as monetary and other policy interventions by governments and central banks in response to inflation, including the increase of interest rates, as well as uncertainly about governmental macroeconomic policies, could negatively impact our business and results of operations.
General inflation in the United States, Europe and other geographies has risen to levels not experienced in recent decades. General inflation also negatively impacts our business by decreasing the capital for our customers to deploy to purchase our goods and services. Inflation may cause our customers to reduce or delay orders for our goods and services thereby causing a decrease in sales of our goods and services. The United States Federal Reserve, the European Central Bank, and several other central banks, have undertaken or signaled increases in benchmark interest rates. Rising interest rates increases our borrowing costs potentially decreasing our profitability. Additionally, increased borrowing costs faced by our customers could result in decreased demand for our products. Monetary interventions also risk a sustained decline in aggregate demand, either globally or within one or more geographic markets. A decline in demand for our products would have a negative impact on our business and results of operations.
The types of rail equipment we sell and the services we provide significantly impact our revenue and our margin and are dependent on broad economic trends over which we have little or no control.
We manufacture, lease, maintain and refurbish a broad range of railcars and related rail equipment. The demand for specific types of railcars and the mix of repair and refurbishment work varies over time. Changes in the global economy and the industries and geographies that we serve cause shifts in demand for specific products and services. These shifts in demand could affect our results of operations and could have an adverse effect on our revenue and our profitability. Demand for specific types of railcars increases and decreases with the demand for goods such as grains, metals, construction aggregates, fertilizer, perishables and general merchandise, plastic pellets, oil and gas, bio-fuels, chemicals, and automobiles, among others, which is beyond our control.
19
Cyclical economic downturns in our industry usually result in decreased demand for our products and services and reduced revenue.
The industry in which we operate is subject to periodic economic cycles, and the purchasing trends of customers in our industry have a significant impact on demand for our products and services. As a result, during downturns, the rate at which we convert backlog to revenue usually decreases and we may slow down or halt production at some of our facilities. An economic downturn in our industry would impact the demand for our products and services, and would result in one or more of the following: lower sales volumes, lower prices, lower lease utilization rates and decreased revenues and profits.
Demand for our railcar equipment and services is dependent on the future of rail transportation and the manner in which railroads operate.
Demand for our rail equipment and services may decrease if freight rail decreases as a mode of freight transportation used by customers to ship their products, or if governmental policies favor modes of freight transportation other than rail. If rail freight transportation becomes more efficient or dwell times decrease, demand for our rail equipment and services may decrease. If the rail freight industry becomes oversupplied, prices for our railcars, lease rates, and demand for our products and services may decrease. The industries in which our customers operate are driven by dynamic market forces and trends, which are in turn influenced by economic, regulatory, and political factors. Features and functionality specific to certain railcar types could result in those railcars becoming obsolete as customer requirements for freight delivery change.
Risks related to our operations outside of the U.S. could adversely affect our operating results.
We own, lease, operate or have invested in businesses that have manufacturing facilities in Mexico, Brazil and Europe, and have customers and suppliers located outside the United States. Instability in the macroeconomic, political, military, legal, trade, financial, labor or market conditions in or relating to the countries where we, or our customers or suppliers, operate could negatively impact our business activities and operations. Some foreign countries in which we operate or may operate have authorities that regulate railroad safety and rail equipment design and manufacturing. If we do not have appropriate certifications, we could be unable to market and sell our rail equipment in those markets. Adverse changes in foreign regulations applicable to us or our customers, such as labor, environment, trade, tax, currency and price regulations, could limit our operations, make the manufacture and distribution of our products difficult, and delay or limit our ability to repatriate income derived from foreign markets.
Our business benefits from free trade agreements between the United States and foreign governments, and from various U.S. corporate tax provisions related to international commerce. Any changes in trade or tax policies by the U.S. or foreign governments in jurisdictions in which we do business, as well as any embargoes, quotas or tariffs imposed on our products and services, could adversely and significantly affect our financial condition and results of operations.
Among the political risks we face outside the U.S. are governments nationalizing our business or assets, or repudiating or renegotiating contracts with us, our customers or our suppliers. In our cross-border business activities, we could experience longer customer payment cycles, difficulty in collecting accounts receivable or an inability to protect our intellectual property. We could be adversely affected by violations of the U.S. Foreign Corrupt Practices Act and similar worldwide anti-corruption laws, which may conflict with local business customs in certain jurisdictions. The failure to comply with laws governing international business may result in substantial penalties and fines and reputational harm. Transactions with non-U.S. entities expose us to business practices, local customs, and legal processes with which we may not be familiar, as well as difficulty enforcing contracts and international political and trade tensions. If we are unable to successfully manage the risks associated with our foreign and cross-border business activities, our results of operations, financial condition, liquidity and cash flows could be negatively impacted.
20
Fluctuations in foreign currency exchange rates could lead to increased costs and lower profitability.
Outside of the U.S., we primarily conduct business in Mexico, Europe and Brazil and our non-U.S. businesses conduct their operations in local currencies. We also source materials worldwide. Fluctuations in exchange rates may affect demand for our products in foreign markets or our cost competitiveness and may adversely affect our profitability. Although we attempt to mitigate a portion of our exposure to changes in currency rates through currency rate hedge contracts and other activities, these efforts cannot fully eliminate the risks associated with the foreign currencies. In addition, some of our borrowings are in foreign currency, giving rise to risk from fluctuations in exchange rates. A material or adverse change in exchange rates could result in significant deterioration of profits or in losses for us.
The deterioration of conditions in the global capital markets, weakening of macroeconomic conditions and changes in the credit markets and the financial services industry could negatively impact our business, results of operations, financial condition or liquidity.
Our leasing subsidiaries' operations relies in large part upon banks and capital markets to fund their operations and contractual commitments and refinance existing debt. These markets can experience high levels of volatility and access to capital can be constrained for extended periods of time. In addition to conditions in the capital markets, a number of other factors could cause us to incur increased borrowing costs and have greater difficulty accessing public and private markets for both secured and unsecured debt. The credit markets and the financial services industry may experience volatility which can result in tighter availability of credit on more restrictive terms and limit our ability to sell railcar assets or to syndicate railcars to investors with leases attached. Our liquidity, financial condition and results of operations could be negatively impacted if our ability to borrow money to finance operations, obtain credit from trade creditors, obtain credit to maintain our hedging programs, offer leasing products to our customers or sell railcar assets were to be impaired. In addition, scarcity of capital could also adversely affect our customers’ ability to purchase, lease, or pay for products from us or adversely affect our suppliers’ ability to provide us with product. Any of these conditions or events could result in reductions in our revenues, increased price competition, or increased operating costs, which could adversely affect our business, financial condition and results of operations.
We could be unable to lease railcars at satisfactory rates, remarket leased railcars on favorable terms upon lease termination, or realize the expected residual values for end of life railcars due to changes in scrap prices, each of which could reduce our revenue and decrease our overall return or affect our ability to sell leased assets in the future.
The profitability of our railcar leasing business depends on our ability to lease railcars at satisfactory rates, sell railcars with sufficiently profitable leases to investors, and to remarket, sell or scrap railcars we own or manage upon the expiration of leases. The rent we receive during the initial railcar lease term typically covers only a small portion of the railcar acquisition or production costs. Thus, we are exposed to a remarketing risk throughout the life of the railcar because we must obtain lease rates or a sale price sufficient to cover our acquisition or production costs related to the railcar. Our ability to lease or remarket leased railcars profitably is dependent on several factors, including, but not limited to, market and industry conditions, cost of, and demand for, competing used or newer models, availability of credit and the credit-worthiness of potential customers, costs associated with the refurbishment of the railcars, the market demand or governmental mandates for refurbishment, customers not defaulting on their leases, as well as market perceptions of residual values and interest rates. A downturn in the industries in which our lessees operate and decreased demand for railcars could also increase our exposure to remarketing risks because lessees may demand shorter lease terms, requiring us to remarket leased railcars more frequently. Furthermore, the resale market for previously leased railcars has a limited number of potential buyers. Our inability to lease, remarket or sell leased railcars on favorable terms could result in an adverse impact to our consolidated financial statements or affect our ability to sell leased railcars to investors in the future. Additionally, when the price of scrap steel declines, our revenues and margins in such businesses decrease. Notwithstanding the terms of the leases we enter into, our lessees may misuse, abuse, improperly install components or improperly or inadequately maintain or repair the railcars we have leased to them. These actions could result in a diminution in the value of the railcars, as well as our potential exposure to claims that could increase our costs and weaken our financial condition.
A limited availability of financing or higher interest rates could increase the cost of, or potentially deter, new leasing arrangements with our customers, reduce our ability to syndicate railcars under lease to financial institutions, or impact the sales price we may receive on such syndications, any of which could materially adversely affect our business, financial condition and results of operations.
21
Some of our competitors are owned or financially supported by foreign governments and may sell products below cost or otherwise compete unfairly.
The markets in which we participate are intensely competitive and we expect them to remain intensely competitive into the foreseeable future. Some of our competitors are owned or financially supported by foreign governments or sovereign wealth funds, and may potentially sell products and services below cost, or otherwise compete unfairly, in order to gain market share. The relative competitiveness of our manufacturing facilities and products affects our performance. A number of competitive factors challenge or affect our ability to compete successfully including the introduction of competitive products and new entrants into our markets, a limited customer base and price pressures from unfair competition and increases in raw materials and labor costs. If we do not compete successfully, our market share, margin and results of operations may be adversely affected.
Fires, natural disasters, pandemics, terrorism, or severe or unusual weather conditions could disrupt our business and result in loss of revenue or higher expenses or decreased demand.
Any serious disruption at any of our facilities due to pandemic, terrorism, fire, hurricane, earthquake, flood, other severe weather events or any other natural disaster could impair our ability to use our facilities and have a material adverse impact on our revenues and increase our costs and expenses. If there is a natural disaster or other serious disruption at any of our facilities, particularly at any of our Mexican or Arkansas facilities, it could impair our ability to adequately supply our customers, cause a significant disruption to our operations, cause us to incur significant costs to relocate or reestablish these functions and negatively impact our operating results. While we insure against certain business interruption risks, such insurance may not adequately compensate us for any losses incurred as a result of natural or other disasters.
Additionally, seasonal fluctuations in weather conditions may lead to greater variation in our quarterly operating results as unusually mild weather conditions will generally lead to lower demand for our wheel-related products and services. Unusually mild weather conditions throughout the year may reduce overall demand for our wheel-related products and maintenance services. If occurring for prolonged periods, such weather could have an adverse effect on our business, results of operations and financial condition.
Risks Related to Legal, Compliance and Regulatory Matters
Train derailments or other accidents or claims could subject us to legal claims that adversely impact our business, financial condition and our results of operations.
We provide a number of services which include the manufacture and supply of new railcars, wheels, new and refurbished axles, components and parts and the lease and maintenance of railcars for our customers that transport a variety of commodities, including tank railcars that transport hazardous materials such as crude oil, ethanol, chlorine, anhydrous ammonia and other products. In addition, we have a Regulatory Services Group that offers regulatory, engineering, process consulting and advocacy support to the tank car and petrochemical rail shipper community, among other services. We could be subject to various legal claims, including claims of negligence, personal injury, physical damage and product or service liability, or in some cases strict liability, as well as potential penalties and liability under environmental laws and regulations, in the event of a derailment or other accident involving railcars, including tank railcars whether resulting from natural disasters, human error, terrorism, or other causes. If we become subject to any such claims and are unable to successfully resolve them or maintain inadequate insurance for such claims, our business, financial condition and results of operations could be materially adversely affected.
The products we manufacture are designed to work optimally when properly operated, installed, repaired, maintained and used to transport the intended cargo. Our products may be sold to third parties who may misuse, improperly install or improperly or inadequately maintain or repair such products, which may result in us being subjected to claims or litigation associated with product damage, injuries or property damage that could increase our costs and weaken our financial condition.
22
Risks related to potential misconduct by employees may adversely impact us.
Our employees may engage in misconduct, fraud or other improper activities, including noncompliance with our policies or regulatory standards and requirements, which could subject us to regulatory sanctions and reputational damage and materially harm our business. It is not always possible to deter employee misconduct, and the precautions we take to prevent and detect this activity may not be effective in controlling unknown or unmanaged risks or losses, including risks associated with harassment, as well as whistleblower complaints and litigation. There can be no assurance that we will succeed in preventing misconduct by employees in the future. In addition, the investigation of alleged misconduct disrupts our operations and may harm the public’s perception of our company, which may be costly. Any such events in the future may have a material adverse impact on our financial condition or results of operations.
Changes in, or failure to comply with, applicable regulations may adversely impact our business, financial condition and results of operations.
Our company and the other participants in our industry are subject to regulation by governmental agencies. These authorities establish, interpret, and enforce rules and regulations for the railcar industry. New rules and regulations and shifting enforcement priorities of regulators could increase our operating costs and the operating costs of our customers. Changes to the process for obtaining regulatory approval in Europe for the operation of new or modified railcars may make it more difficult for us to deliver products timely and to comply with our sales contracts.
We cannot guarantee that we or our suppliers will be in compliance at all times and compliance may prove to be more costly and limiting than we currently anticipate and compliance requirements could increase in future years. If we or our suppliers fail to comply with applicable requirements and regulations, we could face sanctions and penalties that could negatively affect our financial results.
We have potential exposure to environmental liabilities, which could increase our operating costs or have an adverse effect on our results of operations.
We are subject to extensive national, state, foreign, provincial and local environmental laws and regulations concerning, among other things, air emissions, water discharge, solid waste and hazardous substances handling and disposal and employee health and safety. These laws and regulations are complex and frequently change. We could incur unexpected costs, penalties and other civil and criminal liabilities if we, or in certain circumstances others, fail to comply with environmental laws or permits issued pursuant to those laws. We also could incur costs or liabilities related to off-site waste disposal or remediating soil or groundwater contamination at our properties, including as set forth in Item 3, “Legal Proceedings.” In addition, future environmental laws and regulations may require significant capital expenditures or changes to our operations, or may impose liability on us in the future for actions that complied with then applicable laws and regulations when the action was taken.
Business, regulatory, and legal developments regarding climate change may affect the demand for our products or the ability of our critical suppliers to meet our needs.
Scientific studies have suggested that emissions of certain gases, commonly referred to as greenhouse gases (GHGs) including carbon dioxide and methane, may be contributing to warming of the Earth’s atmosphere and other climate changes. Legislation and new rules to regulate emission of GHGs have been introduced in numerous state legislatures, the U.S. Congress, and by the EPA, as well as in Europe and other geographies in which we operate. Some of these proposals would require industries to meet stringent new standards that may require substantial reporting of GHGs and other carbon intensive activities in addition to potentially mandating reductions in our carbon emissions. While we cannot assess the direct impact of these or other potential regulations, we recognize that new climate change reporting or compliance protocols could affect our operating costs, the demand for our products and/or affect the price of materials, input factors and manufactured components which could impact our margins. Other adverse consequences of climate change could include an increased frequency of severe weather events and rising sea levels that could affect operations at our manufacturing facilities, the price of insuring company assets, or other unforeseen disruptions of our operations, systems, property or equipment.
23
We have identified a material weakness in our internal control over financial reporting. If we fail to properly remediate the material weakness or to maintain an effective system of internal controls, we may not be able to accurately report our financial results or prevent fraud.
During its evaluation of the effectiveness of disclosure controls and procedures as of August 31, 2023, management determined that our internal control over financial reporting was not effective, because we did not have effective controls in one IT environment as a result of deficiencies in change management, program development, and user access controls. The material weakness related primarily to the implementation of a new Enterprise Resource Planning (ERP) system. Management has determined that this deficiency constitutes a material weakness in our internal control over financial reporting. We are in the process of identifying and implementing remedial measures to address the control deficiencies that led to the material weakness. However, there can be no assurance that our remedial measures will correct the deficiency. If we are unable to remediate the material weakness, or are otherwise unable to maintain effective internal control over financial reporting or disclosure controls and procedures, it may result in material misstatements, as well as adversely affect the reliability of our financial statements, our reputation, our business, and the trading price of our common stock. During 2023, we began to implement in stages a new ERP system at our primary North America manufacturing and services businesses. We expect each implementation will impact our internal controls over financial reporting. More information regarding the material weakness and our remediation efforts is provided in “Item 9A. Controls and Procedures.”
Changes in or the implementation of accounting standards or inaccurate estimates or assumptions in the application of accounting policies could adversely affect our financial results.
Our accounting policies and methods are fundamental to how we record and report our financial condition and results of operations. Some of these policies require use of estimates and assumptions that may affect the reported value of our assets or liabilities and financial results and are critical because they require management to make difficult, subjective, and complex judgments about matters that are inherently uncertain. Estimates, judgments and assumptions underlying the accompanying consolidated financial statements include impairment of long-lived assets, goodwill, income taxes and environmental costs, among others. If our accounting policies, methods, judgments, assumptions, estimates and allocations prove to be incorrect, or if circumstances change, our business, financial condition, results of operations, liquidity, ability to pay dividends or stock price may be materially adversely affected.
Accounting standard setters and those who interpret the accounting standards (such as the Financial Accounting Standards Board, the SEC, and independent registered public accounting firms) may amend or even reverse their previous interpretations or positions on how these standards should be applied. In some cases, we could be required to apply a new or revised standard retrospectively, resulting in the revision of prior period financial statements. Changes in accounting standards can be hard to predict and can materially impact how we record and report our financial condition and results of operations.
Some of our customers place orders for our products in reliance on their ability to utilize tax benefits or tax credits any of which benefits or credits could be discontinued thereby reducing incentives for our customers to purchase our rail products.
There is no assurance that tax authorities will reauthorize, modify, or prevent the expiration of tax benefits, tax credits, or other policies aimed to incentivize the purchase of our products. If such incentives are discontinued or diminished, the demand for our products could decrease, thereby creating the potential for a material adverse effect on our financial condition or results of operations.
24
Risks Related to our Common Stock
Our stock price has been volatile and may continue to experience large fluctuations.
The price of our common stock has experienced rapid and significant price fluctuations. The price for our common stock is likely to continue to be volatile and subject to price and volume fluctuations in response to market and other factors, including the factors discussed elsewhere in these risk factors. A material decline in the price of our common stock may result in the assertion of certain claims against us, and/or the commencement of inquiries and/or investigations against us. A prolonged decline in the price of our common stock could result in a reduction in the liquidity of our common stock, a reduction in our ability to raise capital, and the inability of investors to obtain a favorable selling price for their shares. Following periods of volatility in the market price of their stock, historically many companies have been the subject of securities class action litigation. If we became involved in securities class action litigation in the future, it could result in substantial costs and diversion of our management’s attention and our resources and could harm our stock price, business, prospects, financial condition and results of operations.
Our business and operations could be negatively affected if we become subject to shareholder activism, which could cause us to incur significant expense, hinder execution of our business strategy and impact our stock price.
Shareholder activism, which could take many forms, including potential proxy contests and public information campaigns, continues to increase. Shareholder activism could result in substantial costs to the Company, give rise to perceived uncertainties as to our future, adversely affect our relationships with suppliers, customers, and regulators, make it more difficult to attract and retain qualified personnel, and adversely impact our stock price.
Our current shareholders could experience dilution.
We require substantial working capital to fund our business. If additional funds are raised through the issuance of equity securities or convertible securities, the percentage ownership held by our shareholders would be reduced and the equity securities we issue may have rights, preferences or privileges senior to those of our common stock. Additionally, we have the option to settle outstanding convertible notes in cash, although if we opt not to or do not have the ability to settle outstanding convertible notes in cash, the conversion of some or all of our convertible notes may dilute the ownership interests of existing shareholders. Any sales in the public market of the common stock issuable upon the conversion of the notes could adversely affect prevailing market prices of our common stock. In addition, the existence of the notes may encourage short selling by market participants because the conversion of the notes could depress the price of our common stock.
Certain provisions in our charter documents, Oregon law, and our debt instruments could make an acquisition of our company more difficult, limit attempts by our shareholders to replace or remove members of our Board of directors and may adversely affect the market price of our common stock.
Our Articles of Incorporation and Bylaws, Oregon law, and contracts and debt instruments to which we are a party, contain certain provisions that could delay, defer or prevent an acquisition proposal that some, or a majority, of our shareholders might believe to be in their best interests or in which shareholders might receive a premium for their common stock over the then-prevailing market price. These provisions could also dissuade shareholders or third parties from contesting director elections and could cause investors to view our securities as less attractive investments and reduce the market price of our common stock. Certain relevant provisions of our Articles of Incorporation and Bylaws, as well as Oregon law, are described in further detail in “Description of the Registrant’s Securities Under Section 12 of the Securities Exchange Act of 1934” annexed as Exhibit 4.3 to this Annual Report.
Payments of cash dividends on our common stock may be made only at the discretion of our Board of Directors and may be restricted by Oregon law.
Any decision to pay dividends will be at the discretion of our Board of Directors and will depend upon our operating results, strategic plans, capital requirements, financial condition, provisions of our borrowing arrangements and other factors our Board of Directors considers relevant. Furthermore, Oregon law imposes restrictions on our ability to pay dividends. Accordingly, we may not be able to continue to pay dividends in any given amount in the future, or at all.
25
Our share repurchase program is intended to enhance long-term shareholder value although we cannot guarantee this will occur and this program may be suspended or terminated at any time.
The Board of Directors has authorized our company to repurchase our common stock through a share repurchase program. Our share repurchase program may be modified, suspended or discontinued at any time without prior notice. Although the share repurchase program is intended to enhance long-term shareholder value, we cannot provide assurance that this will occur.
General Risk Factors
Unanticipated changes in our tax provisions or exposure to additional income tax liabilities could affect our financial condition and profitability and we may take tax positions that the Internal Revenue Service or other tax authorities may contest.
We are subject to income taxes in both the United States and foreign jurisdictions. Significant judgments and estimates are required to be made in determining our worldwide provision for income taxes. Changes in estimates of projected future operating results, loss of deductibility of items, recapture of prior deductions (including related to interest on convertible notes), limitations on our ability to utilize tax net operating losses in the future or changes in assumptions regarding our ability to generate future taxable income could result in significant increases to our tax expense and liabilities that could adversely affect our financial condition and profitability.
We have in the past and may in the future take tax positions that the Internal Revenue Service (IRS) or other tax authorities may contest. We are required by an IRS regulation to disclose particular tax positions to the IRS as part of our tax returns for that year and future years. If the IRS or other tax authorities successfully contests a tax position that we take, we may be required to pay additional taxes, interest or fines that may adversely affect our results of operations and financial position.
The use of social and other digital media to disseminate false, misleading and/or unreliable or inaccurate data and information could create unwarranted volatility in our stock price and losses to our shareholders and could adversely affect our reputation, products, business, and operating results.
A substantial number of people are relying on social and other digital media to receive news, data, and information. Social and other digital media can be used by anyone to publish data and information without regard for factual accuracy. The use of social and other digital media to publish inaccurate, offensive, and disparaging data and information coupled with the frequent use of strong language and hostile expression, may influence the public’s inability to distinguish between what is true and what is false and could obstruct an effective and timely response to correct inaccuracies or falsifications. Such use of social and other digital media could result in unexpected and unsubstantiated claims concerning our business in general or our products, our leadership or our reputation among customers and the public at large, thereby making it more difficult for us to compete effectively, and potentially having a material adverse effect on our business, operations, or financial condition.
26
Item 1B. UNRESOLVED STAFF COMMENTS
None.
Item 2. PROPERTIES
We operate at the following primary facilities as of August 31, 2023:
Description |
Location |
Status |
|
|
|
Manufacturing Segment |
|
|
|
|
|
Operating facilities: |
4 locations in the United States |
Owned |
|
3 locations in Mexico |
Owned – 2 locations Leased – 1 location |
|
3 locations in Poland |
Owned |
|
3 locations in Romania |
Owned |
|
|
|
Administrative offices: |
2 locations in the United States |
Leased |
|
|
|
Maintenance Services Segment |
|
|
|
|
|
Operating facilities: |
17 locations in the United States
|
Leased – 9 locations Owned – 8 locations |
|
|
|
Leasing & Management Services Segment |
|
|
|
|
|
Corporate offices, railcar marketing and leasing activities: |
Lake Oswego, Oregon |
Leased |
We believe that our facilities are in good condition and that the facilities, together with anticipated capital improvements and additions, are adequate to meet our operating needs for the foreseeable future. We continually evaluate our facilities in order to remain competitive and to take advantage of market opportunities.
Item 3. LEGAL PROCEEDINGS
There is hereby incorporated by reference the information disclosed in Note 22 - Commitments and Contingencies to Consolidated Financial Statements, Part II, Item 8 of this Form 10-K.
Item 4. MINE SAFETY DISCLOSURES Information about our Executive Officers
Not applicable.
27
Current information regarding our executive officers is presented below.
Lorie L. Tekorius, 56, is Chief Executive Officer (CEO) and President and serves on the Board of Directors. Ms. Tekorius has served as President since August 2019 and was promoted to Chief Executive Officer in March 2022. Ms. Tekorius was elected to the Board of Directors in March 2022. Ms. Tekorius has served in various management positions for the Company since 1995, most recently as Executive Vice President and Chief Operating Officer and prior to that, as Executive Vice President and Chief Financial Officer.
Martin R. Baker, 67, is Senior Vice President, Chief Legal and Compliance Officer. Mr. Baker has led Greenbrier's Legal and Compliance departments since joining the Company in May 2008. Prior to joining the Company, Mr. Baker served as General Counsel to Lattice Semiconductor Corporation, Altera Corporation and Vitelic Corporation.
Brian J. Comstock, 61, is Executive Vice President, Chief Commercial and Leasing Officer, a position he has held since January 2021. Mr. Comstock has served in various management positions for the Company since 1998, most recently as Executive Vice President, Sales and Marketing.
Laurie Dornan, 53, is Senior Vice President, Chief Human Resources Officer, a position she has held since November 2020. Ms. Dornan has served in various human resources leadership positions since joining the Company in 2014. Prior to Greenbrier, she served in various leadership roles with Lattice Semiconductor Corporation, Nautilus, Inc. and Electro Scientific Industries.
Adrian J. Downes, 60, is Senior Vice President, Chief Financial Officer, a position he has held since June 2019. In March 2013, Mr. Downes joined the Company as Senior Vice President and Chief Accounting Officer. In August 2018, Mr. Downes assumed the role of Acting Chief Financial Officer and in June 2019 was appointed Chief Financial Officer. Before joining the company, Mr. Downes served in executive leadership roles for Knowledge Universe, SUPERVALU Inc. and Albertsons, Inc.
Rick Galvan, 51, is Senior Vice President, Greenbrier Rail Services (GRS), a position he has held since January 2021. Prior to this role, Mr. Galvan served as the Senior Vice President of Operations for GRS. Mr. Galvan has over 30 years of experience in the railroad industry serving in various management functions including positions at Canadian National Railway, Kansas City Southern, and Burlington Northern Santa Fe.
William Krueger, 58, is Senior Vice President, President Greenbrier Manufacturing Operations, a position he has held since September 2022. Mr. Krueger joined Greenbrier in 2020 as Senior Vice President GMO. In that role, he led integration and transformation efforts at Greenbrier’s manufacturing operations in Arkansas and Missouri, acquired in 2019. As part of leading Greenbrier’s Manufacturing segment, Krueger also manages global railcar design, engineering, and quality functions. Before joining the Company, Mr. Krueger held a number of operations roles in the automotive industry including positions at General Motors, Toyota, and Nissan.
Matthew J. Meyer, 42, is Senior Vice President, Finance and Chief Accounting Officer and joined the Company in February 2023. Prior to joining the Company, Mr. Meyer was Chief Accounting Officer of Horizon Global Corporation from December 2019 to February 2023, and Corporate Controller from November 2018 to December 2019. Prior to that, Mr. Meyer has held various finance leadership roles.
Executive officers are designated by the Board of Directors. No director or executive officer has a family relationship with any other director or executive officer of the Company.
28
PART II
Item 5. MARKET FOR REGISTRANT’S COMMON EQUITY, RELATED STOCKHOLDER MATTERS AND ISSUER PURCHASES OF EQUITY SECURITIES
Our common stock has been traded on the New York Stock Exchange under the symbol GBX since July 14, 1994. There were approximately 550 holders of record of common stock as of October 20, 2023.
Issuer Purchases of Equity Securities
The Board of Directors has authorized the Company to repurchase shares of the Company’s common stock. On January 5, 2023, the expiration date of this share repurchase program was extended to January 31, 2025. Share repurchases under this program during the three months ended August 31, 2023 were as follows:
(in millions, except shares which are reflected in thousands, and per share amounts) |
|
Total |
|
|
Average |
|
|
Total Number of Shares Purchased |
|
|
Approximate Dollar Value of Shares that May Yet Be Purchased Under the Plans or Programs |
|
||||
June 1, 2023 - June 30, 2023 |
|
|
247 |
|
|
$ |
30.41 |
|
|
|
247 |
|
|
$ |
46.4 |
|
July 1, 2023 - July 31, 2023 |
|
|
— |
|
|
$ |
— |
|
|
|
— |
|
|
$ |
46.4 |
|
August 1, 2023 - August 31, 2023 |
|
|
— |
|
|
$ |
— |
|
|
|
— |
|
|
$ |
46.4 |
|
Performance Graph
The following graph demonstrates a comparison of cumulative total returns for the Company's Common Stock, the Dow Jones U.S. Industrial Transportation Index, the Standard & Poor’s (S&P) 500 Index, and the S&P SmallCap 600 Index. The S&P SmallCap 600 is included as it is used in measuring the Company's relative total stockholder return for purposes of determining the performance of certain stock awards granted beginning in 2023. The graph assumes an investment of $100 on August 31, 2018 in each of the Company's Common Stock and the stocks comprising the indices. Each of the indices assumes that all dividends were reinvested and that the investment was maintained to and including August 31, 2023, the end of the Company’s 2023 fiscal year.
29
The comparisons in this table are required by the SEC, and therefore, are not intended to forecast or be indicative of possible future performance of our Common Stock.
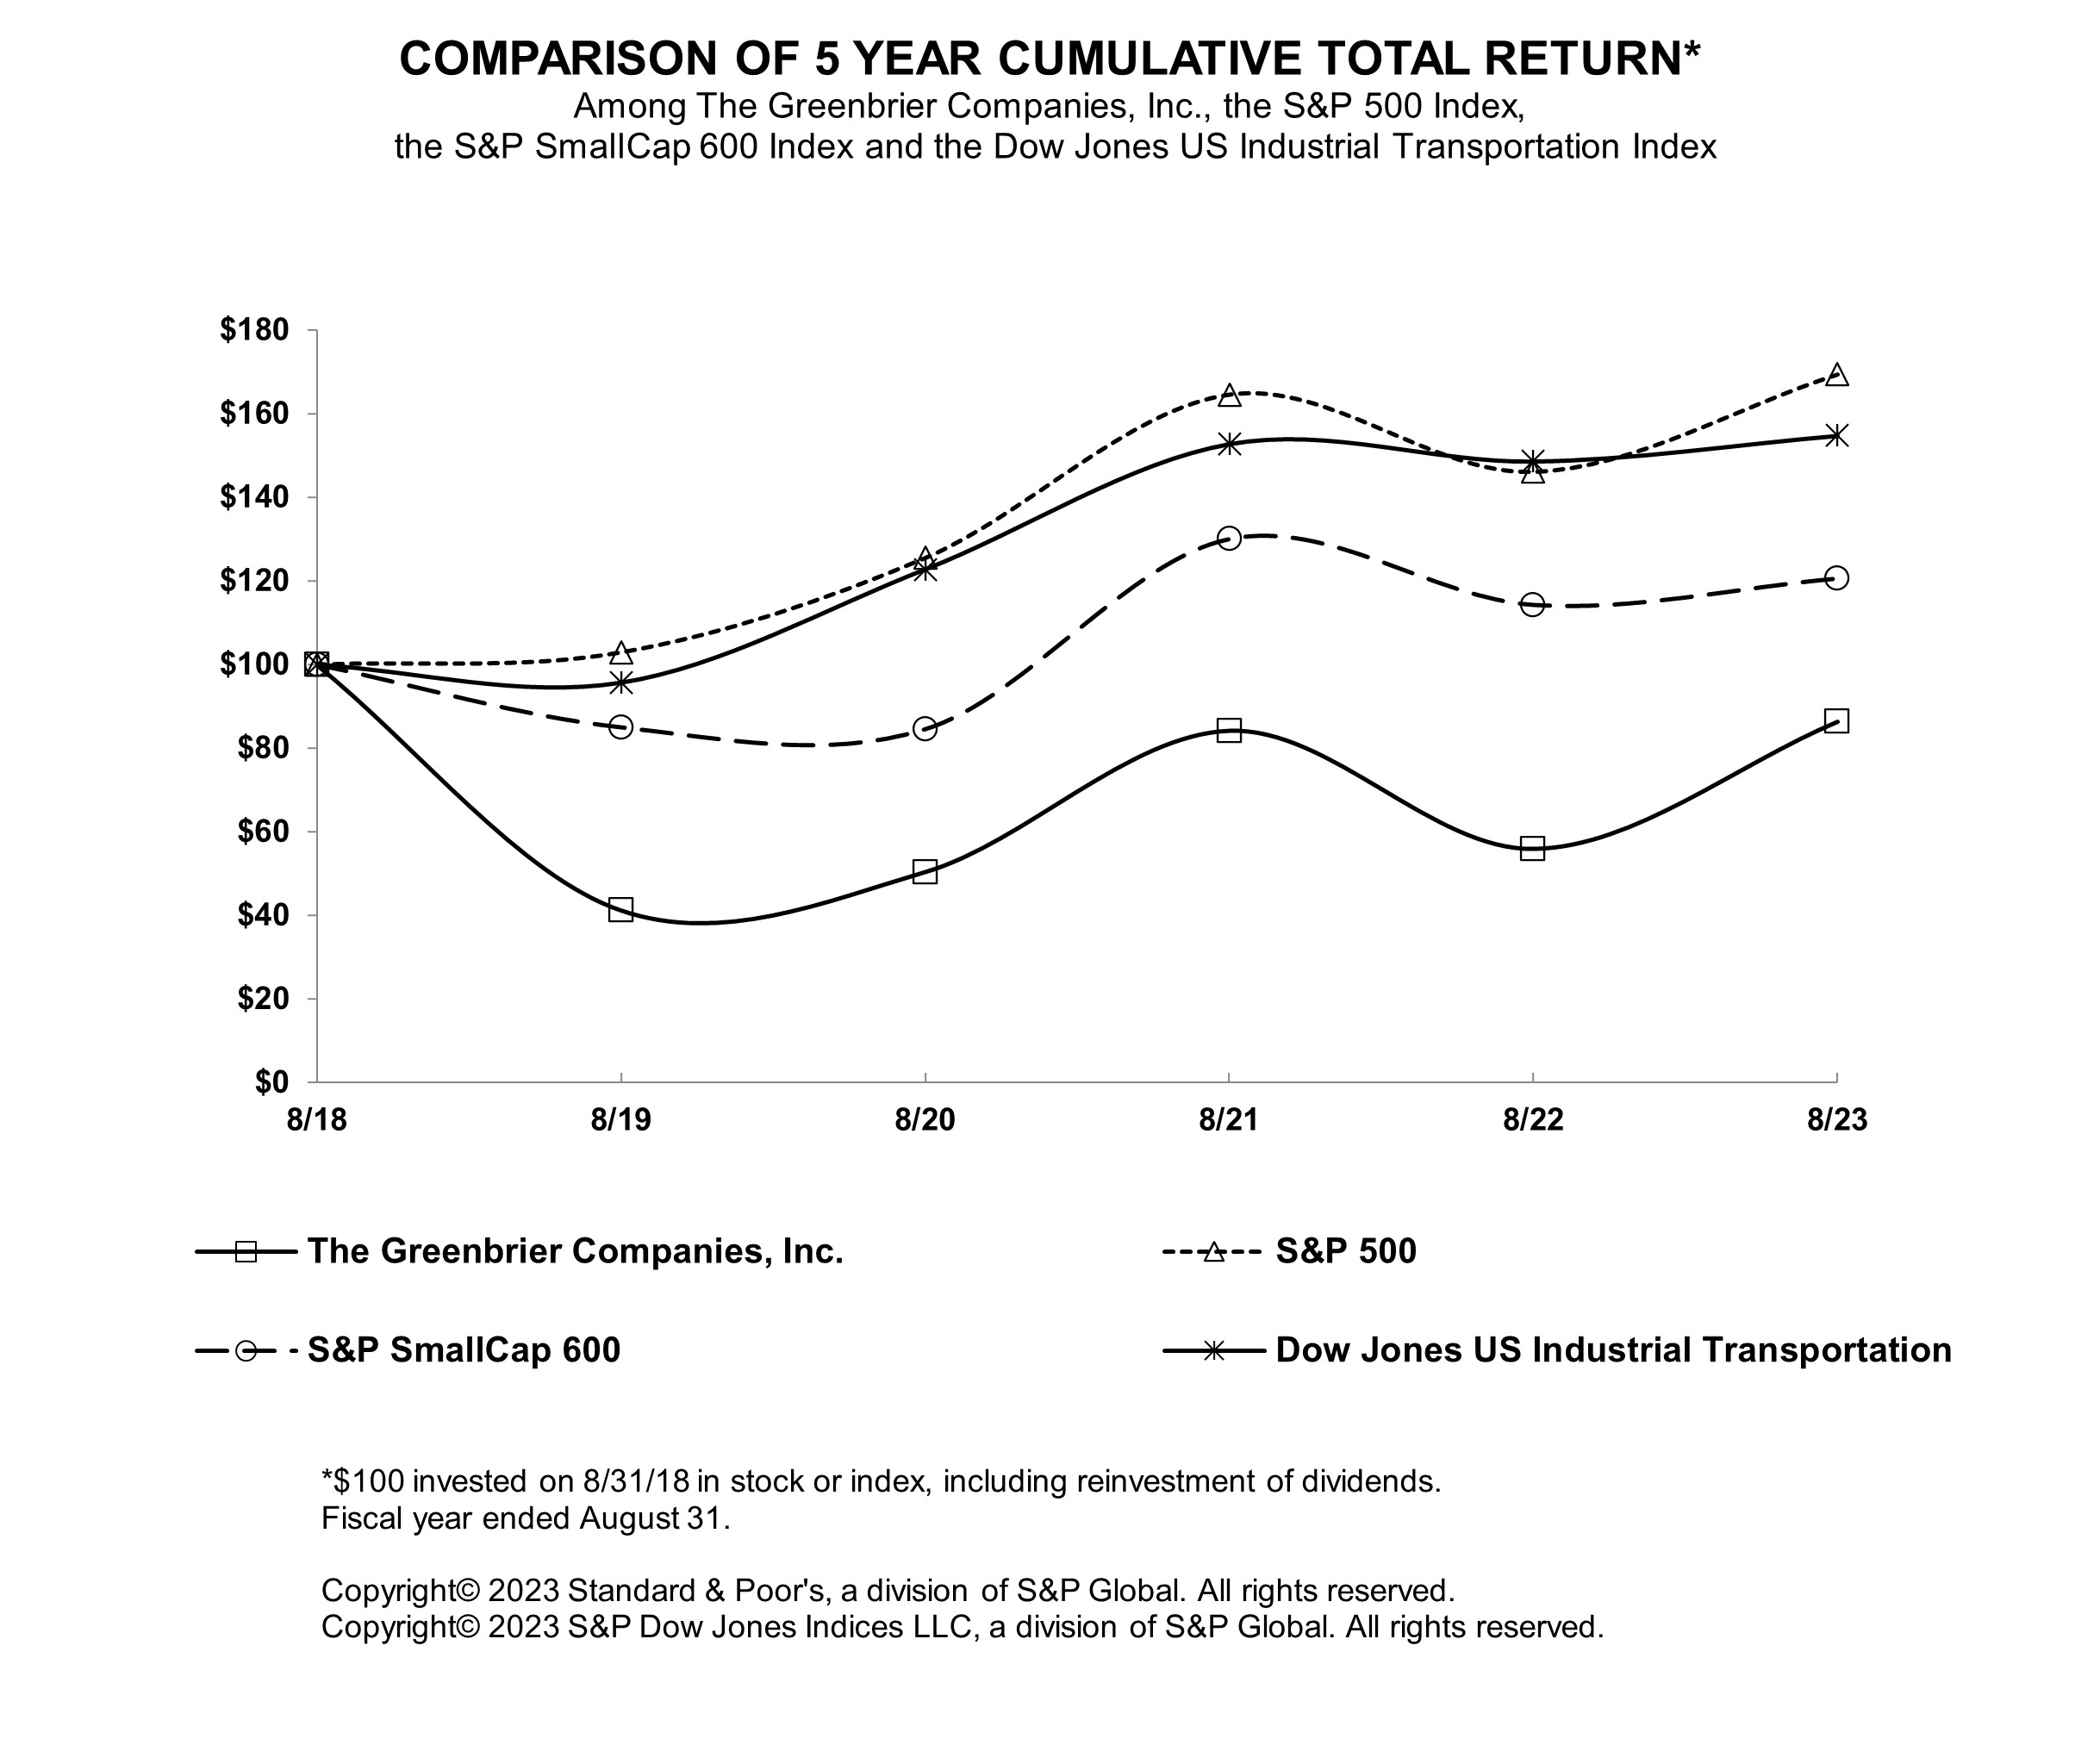
Item 6. RESERVED
30
Item 7. MANAGEMENT'S DISCUSSION AND ANALYSIS OF FINANCIAL CONDITION AND RESULTS OF OPERATIONS

Executive Summary
The financial results for 2023 reflect another year of transformation and profitable growth. We delivered strong results despite challenges that impacted our business throughout the year. We identified a few general trends that impacted our business, all of which we believe are reflected in our results for the year ended August 31, 2023. Overall, demand for our products and services remains strong in the marketplace. Supply chain challenges, inflation, rising interest rates, rail service congestion and labor shortages continued to impact our business and required focused attention from management. We were able to manage these factors to accomplish the following in 2023:
We also launched a multi-year strategy during the year which we outlined at our first-ever Investor Day in April 2023. The strategy has three basic tenets:
Our strategic focus aligns with three financial goals. Those are (a) increasing recurring revenue, (b) expanding our aggregate gross margin and (c) raising our return on invested capital.
As part of our strategic goal to optimize our footprint, during the year we launched a review of our global business capacity. This resulted in three divestitures, including our Gunderson Marine business and closure of our Gunderson Facility, Southwest Steel, a foundry business in Longview, Texas, and our interest in Rayvag, a manufacturing facility located in Turkey. Additionally, we acquired the minority interest in GBX Leasing from our partner, and now wholly own our lease fleet.
31
Business Highlights
Despite the challenging operating environment, we accomplished the following in 2023:
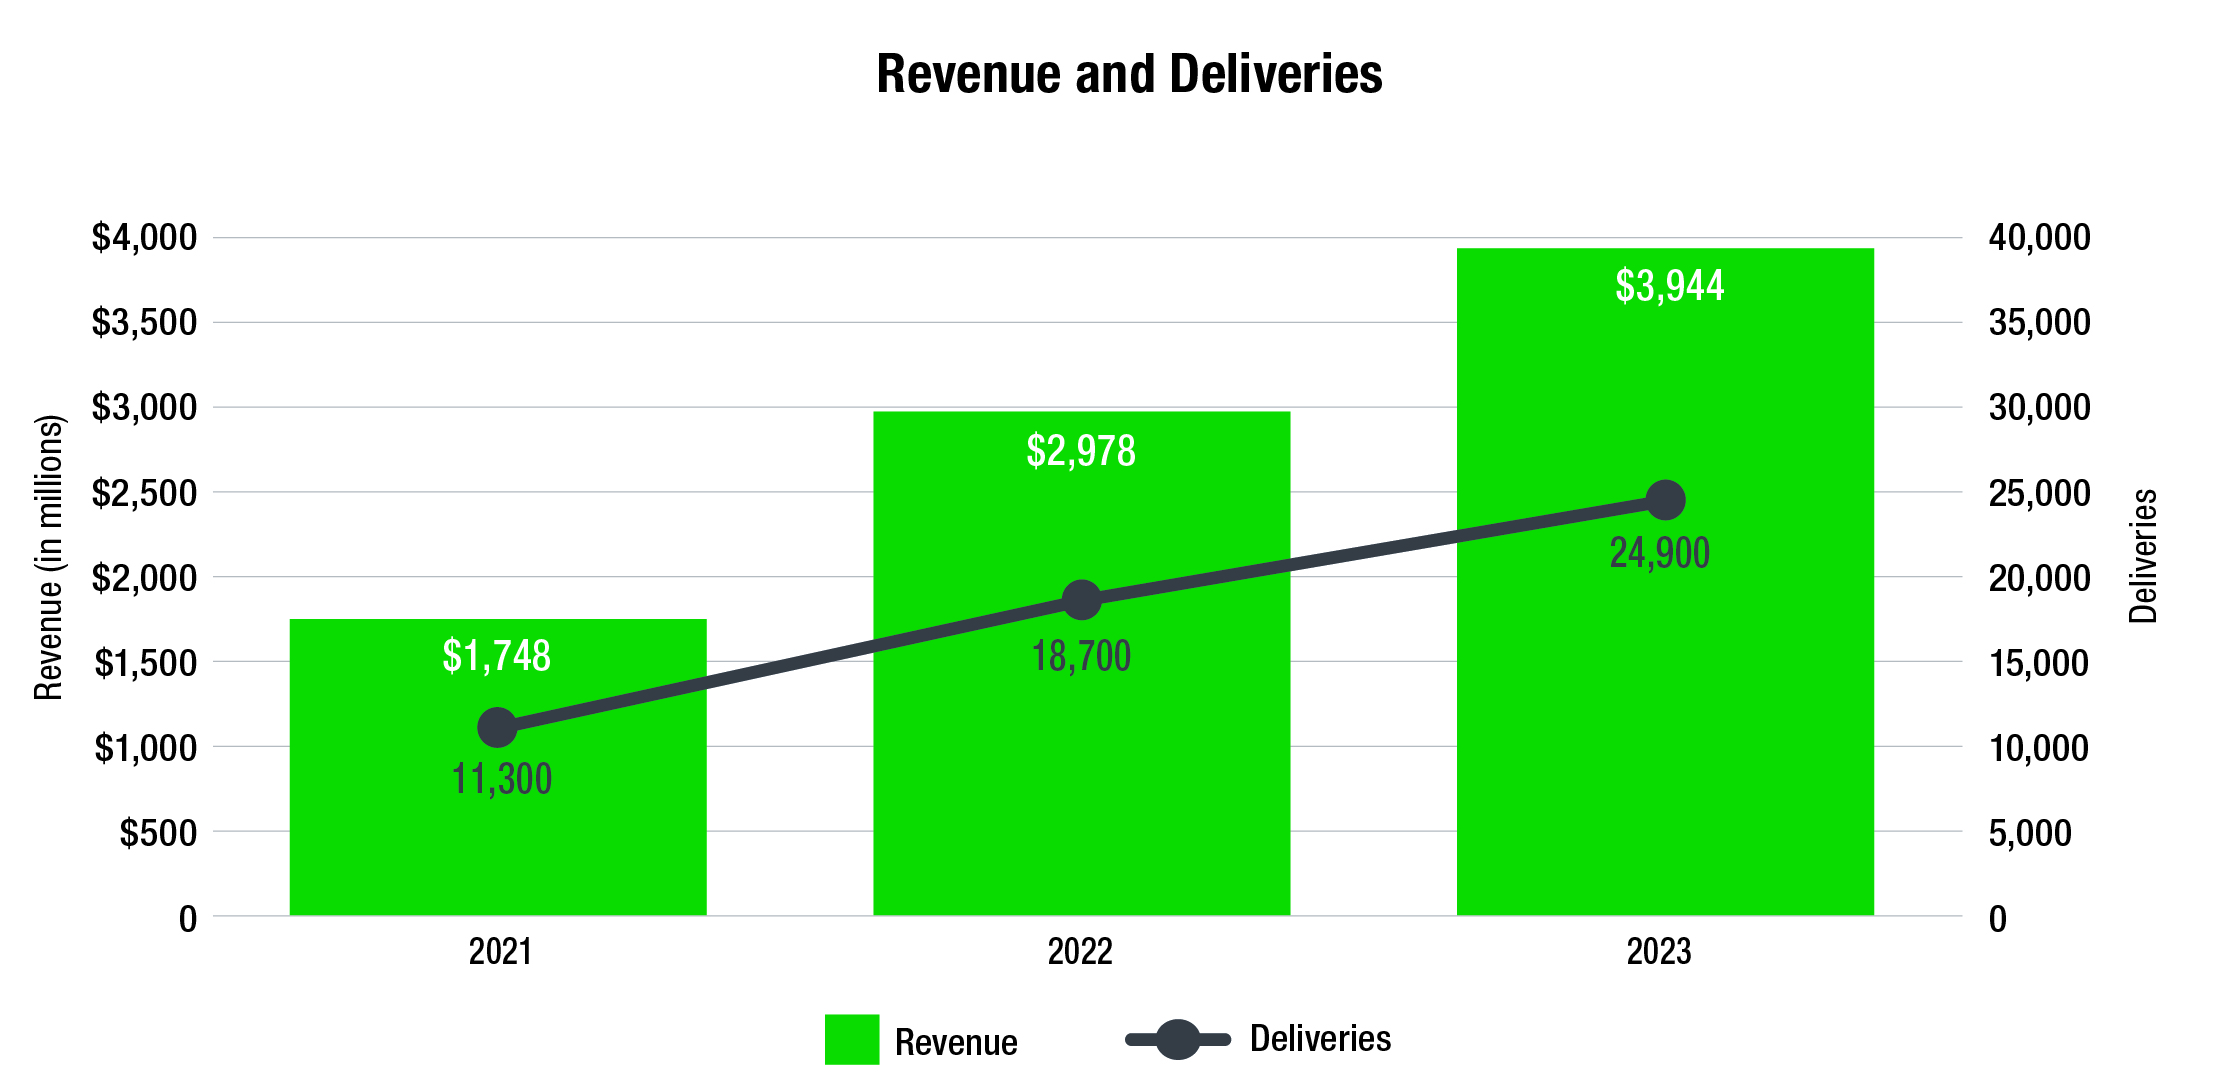
32
Manufacturing Backlog
Our backlog remains strong at August 31, 2023 and includes a diverse portfolio of railcar types, highlighted by the following:
Our backlog includes $970 million of railcars intended for syndication which are supported by lease agreements with external customers and may be syndicated to third parties or held in our lease fleet depending on a variety of factors. Multi-year supply agreements are a part of rail industry practice. A portion of the orders included in backlog reflects an assumed product mix. Under terms of the orders, the exact mix and pricing will be determined in the future, which may impact backlog. Approximately 3% of backlog units and 2% of estimated backlog value as of August 31, 2023 was associated with our Brazilian manufacturing operations which is accounted for under the equity method.
Our backlog of railcar units is not necessarily indicative of future results of operations. Certain orders in backlog are subject to customary documentation and completion of terms and conditions. Customers may attempt to cancel or modify orders in backlog. Historically, little variation has been experienced between the quantity ordered and the quantity actually delivered, though the timing of deliveries may be modified from time to time.
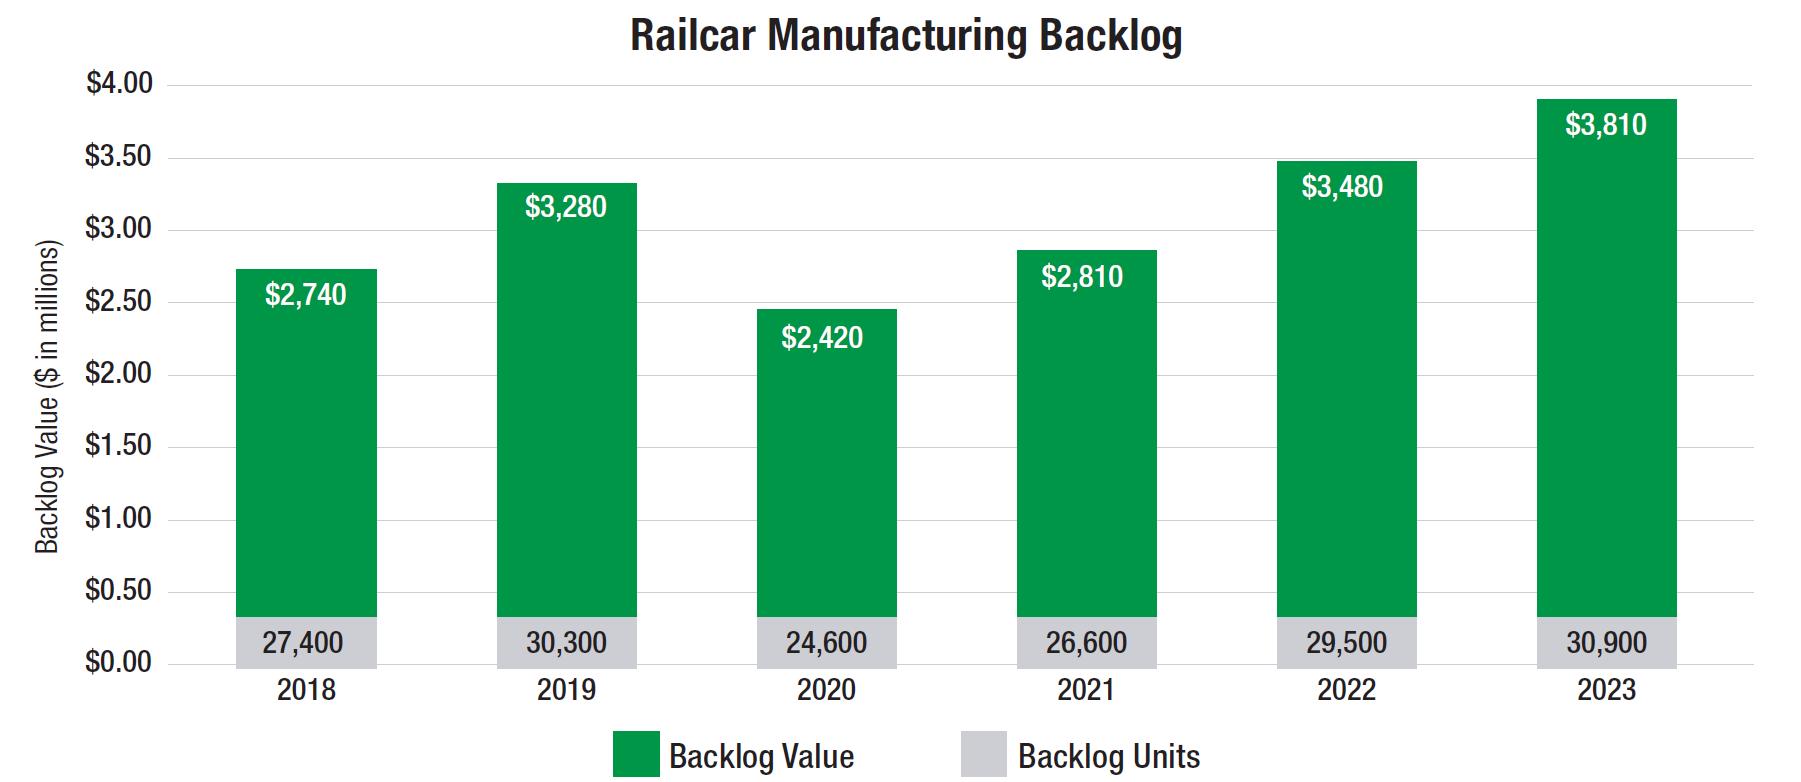
33
Financial Overview
Revenue, Cost of revenue, Margin and Earnings from operations (operating profit) presented below, include amounts from external parties and exclude intersegment activity that is eliminated in consolidation.
|
|
Year Ended August 31, |
|
|||||
(In millions, except per share amounts) |
|
2023 |
|
|
2022 |
|
||
Revenue: |
|
|
|
|
|
|
||
Manufacturing |
|
$ |
3,357.7 |
|
|
$ |
2,476.6 |
|
Maintenance Services |
|
|
406.4 |
|
|
|
347.7 |
|
Leasing & Management Services |
|
|
179.9 |
|
|
|
153.4 |
|
|
|
|
3,944.0 |
|
|
|
2,977.7 |
|
Cost of revenue: |
|
|
|
|
|
|
||
Manufacturing |
|
|
3,083.4 |
|
|
|
2,300.9 |
|
Maintenance Services |
|
|
364.0 |
|
|
|
322.0 |
|
Leasing & Management Services |
|
|
55.5 |
|
|
|
48.8 |
|
|
|
|
3,502.9 |
|
|
|
2,671.7 |
|
Margin: |
|
|
|
|
|
|
||
Manufacturing |
|
|
274.3 |
|
|
|
175.7 |
|
Maintenance Services |
|
|
42.4 |
|
|
|
25.7 |
|
Leasing & Management Services |
|
|
124.4 |
|
|
|
104.6 |
|
|
|
|
441.1 |
|
|
|
306.0 |
|
Selling and administrative |
|
|
235.3 |
|
|
|
225.2 |
|
Net gain on disposition of equipment |
|
|
(17.3 |
) |
|
|
(37.2 |
) |
Asset impairment, disposal, and exit costs |
|
|
46.7 |
|
|
|
— |
|
Earnings from operations |
|
|
176.4 |
|
|
|
118.0 |
|
Interest and foreign exchange |
|
|
85.4 |
|
|
|
57.4 |
|
Earnings before income tax and earnings from unconsolidated affiliates |
|
|
91.0 |
|
|
|
60.6 |
|
Income tax expense |
|
|
(24.6 |
) |
|
|
(18.1 |
) |
Earnings before earnings from unconsolidated affiliates |
|
|
66.4 |
|
|
|
42.5 |
|
Earnings from unconsolidated affiliates |
|
|
9.2 |
|
|
|
11.3 |
|
Net earnings |
|
|
75.6 |
|
|
|
53.8 |
|
Net earnings attributable to noncontrolling interest |
|
|
(13.1 |
) |
|
|
(6.9 |
) |
Net earnings attributable to Greenbrier |
|
$ |
62.5 |
|
|
$ |
46.9 |
|
Diluted earnings per common share |
|
$ |
1.89 |
|
|
$ |
1.40 |
|
|
|
|
|
|
|
|
||
Performance for our segments is evaluated based on operating profit. Corporate includes selling and administrative costs not directly related to goods and services and certain costs that are intertwined among segments due to our integrated business model. Management does not allocate Interest and foreign exchange or Income tax expense for either external or internal reporting purposes.
|
|
Year Ended August 31, |
|
|||||
(In millions) |
|
2023 |
|
|
2022 |
|
||
Operating profit (loss): |
|
|
|
|
|
|
||
Manufacturing |
|
$ |
140.9 |
|
|
$ |
97.2 |
|
Maintenance Services |
|
|
36.9 |
|
|
|
21.7 |
|
Leasing & Management Services |
|
|
103.3 |
|
|
|
108.3 |
|
Corporate |
|
|
(104.7 |
) |
|
|
(109.2 |
) |
|
|
$ |
176.4 |
|
|
$ |
118.0 |
|
|
|
|
|
|
|
|
||
34
Consolidated Results
|
|
Year Ended August 31, |
|
|
2023 vs 2022 |
|
||||||||||
(In millions) |
|
2023 |
|
|
2022 |
|
|
Increase |
|
|
% |
|
||||
Revenue |
|
$ |
3,944.0 |
|
|
$ |
2,977.7 |
|
|
$ |
966.3 |
|
|
|
32.5 |
% |
Cost of revenue |
|
$ |
3,502.9 |
|
|
$ |
2,671.7 |
|
|
$ |
831.2 |
|
|
|
31.1 |
% |
Margin (%) |
|
|
11.2 |
% |
|
|
10.3 |
% |
|
|
0.9 |
% |
|
* |
|
|
Net earnings attributable to Greenbrier |
|
$ |
62.5 |
|
|
$ |
46.9 |
|
|
$ |
15.6 |
|
|
|
33.3 |
% |
|
|
|
|
|
|
|
|
|
|
|
|
|
||||
* Not meaningful
Through our integrated business model, we provide a broad range of custom products and services in each of our segments, which have various average selling prices and margins. The demand for, and mix of, products and services delivered changes from period to period, which causes fluctuations in our results of operations.
The 32.5% increase in revenue for the year ended August 31, 2023 as compared to the prior year was primarily due to an 35.6% increase in Manufacturing revenue. The increase in Manufacturing revenue was primarily attributed to a 33.2% increase in railcar deliveries and higher syndication revenues.
The 31.1% increase in cost of revenue for the year ended August 31, 2023 as compared to the prior year was primarily due to a 34.0% increase in Manufacturing cost of revenue. The increase in Manufacturing cost of revenue was primarily attributed to a 33.2% increase in railcar deliveries and higher material and other input costs in the current year.
Margin as a percentage of revenue was 11.2% and 10.3% for the years ended August 31, 2023 and 2022, respectively. Consolidated Margin as a percentage of revenue was positively impacted by an increase in Manufacturing Margin from 7.1% to 8.2% primarily attributed to operating at consistently higher production levels during the current year.
The $15.6 million increase in Net earnings attributable to Greenbrier for the year ended August 31, 2023 as compared to the prior year was primarily due to an increase in margin dollars that was mainly attributable to higher railcar deliveries and syndications. This was partially offset by:
For discussion related to the results of operations and changes in financial condition for 2022 compared to 2021 refer to Part II, Item 7. Management's Discussion and Analysis of Financial Condition and Results of Operations in our 2022 Form 10-K, which was filed with the United States Securities and Exchange Commission on October 31, 2022.
35
Manufacturing Segment
|
|
Year Ended August 31, |
2023 vs 2022 |
|
||||||||||||
(In millions, except railcar deliveries) |
|
2023 |
|
|
2022 |
|
|
Increase |
|
|
% |
|
||||
Revenue |
|
$ |
3,357.7 |
|
|
$ |
2,476.6 |
|
|
$ |
881.1 |
|
|
|
35.6 |
% |
Cost of revenue |
|
$ |
3,083.4 |
|
|
$ |
2,300.9 |
|
|
$ |
782.5 |
|
|
|
34.0 |
% |
Margin (%) |
|
|
8.2 |
% |
|
|
7.1 |
% |
|
|
1.1 |
% |
|
* |
|
|
Operating profit ($) |
|
$ |
140.9 |
|
|
$ |
97.2 |
|
|
$ |
43.7 |
|
|
|
45.0 |
% |
Operating profit (%) |
|
|
4.2 |
% |
|
|
3.9 |
% |
|
|
0.3 |
% |
|
* |
|
|
Deliveries |
|
|
24,900 |
|
|
|
18,700 |
|
|
|
6,200 |
|
|
|
33.2 |
% |
|
|
|
|
|
|
|
|
|
|
|
|
|
||||
* Not meaningful
Our Manufacturing segment primarily generates revenue from manufacturing a wide range of freight railcars and from the conversion of existing railcars through our facilities in North America and Europe.
Manufacturing revenue increased $881.1 million or 35.6% for the year ended August 31, 2023 compared to the prior year. The increase in revenue was primarily attributed to a 33.2% increase in railcar deliveries, including syndications and higher average selling price.
Manufacturing cost of revenue increased $782.5 million or 34.0% for the year ended August 31, 2023 compared to the prior year. The increase in cost of revenue was primarily attributed to a 33.2% increase in the volume of railcar deliveries and higher material and other input costs during the year ended August 31, 2023.
Manufacturing Margin as a percentage of revenue increased 1.1% for the year ended August 31, 2023 compared to the prior year. The increase in Margin percentage for the year ended August 31, 2023 was primarily attributed to operating at consistently higher production levels. This was partially offset by increased costs associated with component outsourcing to support the higher production.
Manufacturing operating profit increased $43.7 million or 45.0% for the year ended August 31, 2023 compared to the prior year. The increase in operating profit was primarily attributed to an increase in railcar deliveries at improved margins and included the $46.7 million of net loss on divestitures in 2023.
36
Maintenance Services Segment
|
|
Year Ended August 31, |
|
|
2023 vs 2022 |
|
||||||||||
(In millions) |
|
2023 |
|
|
2022 |
|
|
Increase |
|
|
% |
|
||||
Revenue |
|
$ |
406.4 |
|
|
$ |
347.7 |
|
|
$ |
58.7 |
|
|
|
16.9 |
% |
Cost of revenue |
|
$ |
364.0 |
|
|
$ |
322.0 |
|
|
$ |
42.0 |
|
|
|
13.0 |
% |
Margin (%) |
|
|
10.4 |
% |
|
|
7.4 |
% |
|
|
3.0 |
% |
|
* |
|
|
Operating profit ($) |
|
$ |
36.9 |
|
|
$ |
21.7 |
|
|
$ |
15.2 |
|
|
|
70.0 |
% |
Operating profit (%) |
|
|
9.1 |
% |
|
|
6.2 |
% |
|
|
2.9 |
% |
|
* |
|
|
|
|
|
|
|
|
|
|
|
|
|
|
|
||||
* Not meaningful
Our Maintenance Services segment generates revenue from wheel and axle servicing, railcar maintenance and the production of a variety of component parts in North America.
Maintenance Services revenue increased $58.7 million or 16.9% for the year ended August 31, 2023 compared to the prior year. The increase was primarily attributed to improved pricing and higher volumes. This was partially offset by lower scrap metal pricing in the current year.
Maintenance Services cost of revenue increased $42.0 million or 13.0% for the year ended August 31, 2023 compared to the prior year. The increase was primarily due to higher costs associated with operating at higher volumes.
Maintenance Services Margin as a percentage of revenue increased 3.0% for the year ended August 31, 2023 compared to the prior year. The increase in Margin percentage was primarily attributed to improved pricing and operating efficiencies. This was partially offset by lower scrap metal pricing in the current year.
Maintenance Services operating profit increased $15.2 million or 70.0% for the year ended August 31, 2023 compared to the prior year. The increase was primarily attributed to the improved Margins discussed above and higher volumes. This was partially offset by lower scrap metal pricing in the current year.
37
Leasing & Management Services Segment
|
|
Year Ended August 31, |
2023 vs 2022 |
|
||||||||||||
(In millions) |
|
2023 |
|
|
2022 |
|
|
Increase |
|
|
% |
|
||||
Revenue |
|
$ |
179.9 |
|
|
$ |
153.4 |
|
|
$ |
26.5 |
|
|
|
17.3 |
% |
Cost of revenue |
|
$ |
55.5 |
|
|
$ |
48.8 |
|
|
$ |
6.7 |
|
|
|
13.7 |
% |
Margin (%) |
|
|
69.1 |
% |
|
|
68.2 |
% |
|
|
0.9 |
% |
|
|
|
* |
Operating profit ($) |
|
$ |
103.3 |
|
|
$ |
108.3 |
|
|
$ |
(5.0 |
) |
|
|
(4.6 |
)% |
Operating profit (%) |
|
|
57.4 |
% |
|
|
70.6 |
% |
|
|
(13.2 |
)% |
|
|
|
* |
|
|
|
|
|
|
|
|
|
|
|
|
|
||||
* Not meaningful
Our Leasing & Management Services segment generates revenue from leasing railcars from our lease fleet, providing various management services, syndication revenue associated with leases attached to new railcar sales, and interim rent on leased railcars for syndication.
Leasing & Management Services revenue increased $26.5 million or 17.3% for the year ended August 31, 2023 compared to the prior year. The increase was primarily attributed to higher lease rents due to higher lease rates and a larger fleet as well as higher interim rents on railcars for syndication.
Leasing & Management Services cost of revenue increased $6.7 million or 13.7% for the year ended August 31, 2023 compared to the prior year. The increase was primarily due to higher costs from owning a larger fleet.
Leasing & Management Services Margin as a percentage of revenue increased 0.9% for the year ended August 31, 2023 compared to the prior year. The increase in Margin percentage was primarily attributed to higher lease rates and growth of the lease fleet.
Leasing & Management Services operating profit decreased $5.0 million or 4.6% for the year ended August 31, 2023 compared to the prior year. The decrease was primarily attributed to lower Net gains on disposition of equipment for the year ended August 31, 2023, partially offset by higher Margin as a result of growth in the lease fleet.
38
Selling and Administrative
|
|
Year Ended August 31, |
2023 vs 2022 |
|
||||||||||||
(In millions) |
|
2023 |
|
|
2022 |
|
|
Increase |
|
|
% |
|
||||
Selling and Administrative |
|
$ |
235.3 |
|
|
$ |
225.2 |
|
|
$ |
10.1 |
|
|
|
4.5 |
% |
Selling and administrative expense was $235.3 million or 6.0% of revenue for the year ended August 31, 2023 and $225.2 million or 7.6% of revenue for the year ended August 31, 2022.
The $10.1 million increase was primarily attributed to higher employee related and IT support costs, partially offset by lower legal costs.
Net Gain on Disposition of Equipment
Net gain on disposition of equipment primarily includes the sale of assets from our lease fleet (Equipment on operating leases, net) and disposition of property, plant and equipment. Assets are periodically sold in the normal course of business in order to optimize our fleet and to manage risk and liquidity.
Net gain on disposition of equipment was $17.3 million and $37.2 million for the years ended August 31, 2023 and 2022, respectively. The decrease in Net gain on disposition of equipment was primarily attributed to fewer sales of assets from our lease fleet during the year ended August 31, 2023.
Asset Impairment, Disposal and Exit Costs
Asset impairment, disposal, and exit costs in the current year included total charges associated with the Gunderson Facility of $40.7 million and a divestiture of Southwest Steel of $9.7 million, partially offset by a gain on disposal of our majority ownership interest in the Rayvag joint venture of $3.7 million.
Interest and Foreign Exchange
Interest and foreign exchange expense was composed of the following:
|
|
Year Ended August 31, |
|
|
Increase (decrease) |
|
||||||
(In millions) |
|
2023 |
|
|
2022 |
|
|
2023 vs 2022 |
|
|||
Interest and foreign exchange: |
|
|
|
|
|
|
|
|
|
|||
Interest and other expense |
|
$ |
79.2 |
|
|
$ |
55.7 |
|
|
$ |
23.5 |
|
Foreign exchange loss |
|
|
6.2 |
|
|
|
1.7 |
|
|
|
4.5 |
|
|
|
$ |
85.4 |
|
|
$ |
57.4 |
|
|
$ |
28.0 |
|
|
|
|
|
|
|
|
|
|
|
|||
The $28.0 million increase in Interest and foreign exchange expense during the year ended August 31, 2023 compared to the prior year was primarily attributed to an increase in interest expense from higher interest rates and borrowings. The $4.5 million change in Foreign exchange loss was primarily attributed to the change in the Mexican Peso's exchange rate relative to the U.S. Dollar.
39
Income Tax
In 2023 our income tax expense was $24.6 million on $91.0 million of pre-tax earnings for an effective tax rate of 27.0%. The rate was higher than the U.S. statutory tax rate primarily due to the geographic mix of earnings and U.S. taxes on profits in foreign jurisdictions, offset by net favorable impacts related to changes in foreign currency exchange rates for our U.S. Dollar denominated foreign operations.
In 2022 our income tax expense was $18.1 million on $60.6 million of pre-tax earnings for an effective tax rate of 29.9%. The tax rate was primarily attributable to the geographic mix of earnings, partially offset by net favorable discrete items.
The effective tax rate can fluctuate year-to-year due to discrete items and changes in the mix of foreign and domestic pre-tax earnings. It can also fluctuate with changes in the proportion of pre-tax earnings attributable to our Mexican railcar manufacturing joint venture. The joint venture is treated as a partnership for tax purposes and, as a result, the partnership’s entire pre-tax earnings are included in Earnings before income taxes and earnings from unconsolidated affiliates, whereas only our 50% share of the tax is included in Income tax expense.
Earnings From Unconsolidated Affiliates
Through unconsolidated affiliates we produce rail and industrial components and have an ownership stake in a railcar manufacturer in Brazil. We record the after-tax results from these unconsolidated affiliates.
Earnings from unconsolidated affiliates was $9.2 million and $11.3 million for the years ended August 31, 2023 and 2022, respectively. The decrease was primarily related to lower sales volumes at our Brazil operations.
Net Earnings Attributable to Noncontrolling Interest
Net earnings attributable to noncontrolling interest was $13.1 million and $6.9 million for the years ended August 31, 2023 and 2022, respectively, which primarily represents our joint venture partner's share in the results of operations of our Mexican railcar manufacturing joint ventures, adjusted for intercompany sales, and our European partner’s share of the results of our European operations. The increase from the prior year is primarily a result of an increase in earnings due to improved operating results at our European operations and the gain on sale of Rayvag.
40
Liquidity and Capital Resources
|
|
Year Ended August 31, |
|
|||||
(In millions) |
|
2023 |
|
|
2022 |
|
||
Net cash provided by (used in) operating activities |
|
$ |
71.2 |
|
|
$ |
(150.4 |
) |
Net cash used in investing activities |
|
|
(280.0 |
) |
|
|
(224.0 |
) |
Net cash provided by (used in) financing activities |
|
|
(76.2 |
) |
|
|
244.9 |
|
Effect of exchange rate changes |
|
|
28.6 |
|
|
|
17.2 |
|
Net decrease in cash and cash equivalents and restricted cash |
|
$ |
(256.4 |
) |
|
$ |
(112.3 |
) |
|
|
|
|
|
|
|
||
We have been financed through cash generated from operations and borrowings. At August 31, 2023 cash and cash equivalents and restricted cash were $302.7 million, a decrease of $256.4 million from $559.1 million at the prior year end.
Cash Flows From Operating Activities
The change in cash provided by (used in) operating activities for 2023 compared to 2022 was primarily due to an increase in Net earnings and net favorable change in working capital driven by more efficient working capital usage when compared to the prior year.
Cash Flows From Investing Activities
Cash used in investing activities primarily relates to capital expenditures net of proceeds from the sale of assets, divestitures during the year and investment activity with our unconsolidated affiliates. The change in cash used in investing activities for 2023 compared to 2022 was primarily attributable to a decrease in proceeds from the sale of assets.
|
|
Year Ended August 31, |
|
|||||
(In millions) |
|
2023 |
|
|
2022 |
|
||
Capital expenditures: |
|
|
|
|
|
|
||
Leasing & Management Services |
|
$ |
(272.9 |
) |
|
$ |
(323.2 |
) |
Manufacturing |
|
|
(71.9 |
) |
|
|
(48.3 |
) |
Maintenance Services |
|
|
(17.3 |
) |
|
|
(9.2 |
) |
Total capital expenditures (gross) |
|
$ |
(362.1 |
) |
|
$ |
(380.7 |
) |
Proceeds from sale of equipment |
|
|
78.8 |
|
|
|
155.5 |
|
Total capital expenditures (net of proceeds) |
|
$ |
(283.3 |
) |
|
$ |
(225.2 |
) |
|
|
|
|
|
|
|
||
Capital expenditures primarily relate to additions to our lease fleet and on-going investments into our facilities, including the safety, productivity and efficiency of our facilities. Proceeds from the sale of assets primarily relate to sales of railcars from our lease fleet within Leasing & Management Services and divestitures previously discussed. Assets from our lease fleet are periodically sold in the normal course of business to accommodate customer demand and to manage risk and liquidity.
Capital expenditures for 2024 are expected to be approximately $280 million for Leasing & Management Services, approximately $190 million for Manufacturing and approximately $15 million for Maintenance Services. Capital expenditures for 2024 primarily relate to additions to our lease fleet and continued investments into the safety and productivity of our facilities. Proceeds from sales of assets are expected to be approximately $80 million for 2024.
Cash Flows From Financing Activities
The change in cash provided by (used in) financing activities for 2023 compared to 2022 was primarily attributed to lower net proceeds from the issuance of debt and higher share repurchases. During the year ended August 31, 2023 we paid off the North America credit facility, drew the remaining $75.0 million on our leasing term loan facility and drew $139.9 million on the GBXL warehouse credit facility as we continued to grow the fleet.
41
During 2022 we issued asset backed securities of $323.3 million, and used proceeds to pay down our warehouse credit facility for GBX Leasing. We also amended our $200 million term facility to provide an additional $75.0 million in term debt.
Dividend & Share Repurchase Program
A quarterly dividend of $0.30 per share was declared on October 18, 2023.
The Board of Directors has authorized our company to repurchase in aggregate up to $100.0 million of our common stock. The program may be modified, suspended, or discontinued at any time without prior notice. Under the share repurchase program, shares of common stock may be purchased from time to time on the open market or through privately negotiated transactions. The timing and amount of purchases is based upon market conditions, securities law limitations and other factors. The share repurchase program does not obligate us to acquire any specific number of shares in any period. The prior authorization was set to expire on January 31, 2023. On January 5, 2023, the Board of Directors authorized the extension of the existing share repurchase program to January 31, 2025.
During the year ended August 31, 2023, we purchased a total of 1.9 million shares for $56.9 million, of which 1.8 million shares for $53.6 million were purchased under the current authorization of the share repurchase program. As of August 31, 2023, the amount remaining for repurchase under the share repurchase program was $46.4 million. There were no shares repurchased under the share repurchase program during the year ended August 31, 2022.
Cash, Borrowing Availability and Credit Facilities
As of August 31, 2023, we had $281.7 million in Cash and cash equivalents and $364.4 million in available borrowings. Our current cash balance is part of our strategy to maintain strong liquidity to respond to current uncertainties.
Senior secured credit facilities, consisting of four components, aggregated to $1.4 billion as of August 31, 2023. We had an aggregate of $364.4 million available to draw down under credit facilities as of August 31, 2023. This amount consists of $273.8 million available on the North American credit facility, $25.6 million on the European credit facilities and $65.0 million on the Mexican credit facilities.
North America – As of August 31, 2023, a $600.0 million revolving line of credit, maturing August 2026, secured by substantially all of our U.S. assets not otherwise pledged as security for term loans, the warehouse credit facility or the railcar asset-backed securities, existed to provide working capital and interim financing of equipment, principally for our U.S. and Mexican operations. Advances under this North American credit facility bear interest at the Secured Overnight Financing Rate (SOFR) plus 1.50% plus 0.10% as a SOFR adjustment or Prime plus 0.50% depending on the type of borrowing. Available borrowings under the credit facility are generally based on defined levels of eligible inventory, receivables, property, plant and equipment and leased equipment, as well as total debt to consolidated capitalization and fixed charges coverage ratios.
GBX Leasing – As of August 31, 2023, a $550.0 million nonrecourse warehouse credit facility existed to support the operations of GBX Leasing. Advances under this facility bear interest at SOFR plus 1.85% plus 0.11% as a SOFR adjustment. Interest rate swap agreements cover 87% of the outstanding balance to swap the floating interest rate to a fixed rate. The warehouse credit facility converts to a term loan in August 2025 which matures in August 2027.
Europe – As of August 31, 2023, lines of credit totaling $72.8 million secured by certain of our European assets, with variable rates that range from Warsaw Interbank Offered Rate (WIBOR) plus 1.2% to WIBOR plus 1.6% and Euro Interbank Offered Rate (EURIBOR) plus 1.5% to EURIBOR plus 1.9%, were available for working capital needs of our European manufacturing operations. The European lines of credit include $35.9 million which are guaranteed by our Company. European credit facilities are regularly renewed. Currently, these European credit facilities have maturities that range from October 2023 through July 2025.
Mexico – As of August 31, 2023, our Mexican railcar manufacturing operations had three lines of credit totaling $175.0 million. The first line of credit provides up to $100.0 million and matures in June 2026. Advances under this facility bear interest at SOFR plus 4.25%. The second line of credit provides up to $45.0 million, of which we and our joint venture partner have each guaranteed 50%. Advances under this facility bear interest at SOFR plus 2.55%. The Mexican railcar manufacturing joint venture will be able to draw amounts available under this facility through February 2025.
42
The third line of credit provides up to $30.0 million, of which we and our joint venture partner have each guaranteed 50%. Advances under this facility bear interest at a variable rate. The Mexican railcar manufacturing joint venture will be able to draw amounts available under this facility through June 2024.
|
|
As of August 31, |
|
|||||
(In millions) |
|
2023 |
|
|
2022 |
|
||
Credit facility balances: |
|
|
|
|
|
|
||
North America |
|
$ |
— |
|
|
$ |
160.0 |
|
GBX Leasing |
|
|
139.9 |
|
|
|
— |
|
Europe |
|
|
47.2 |
|
|
|
51.6 |
|
Mexico |
|
|
110.0 |
|
|
|
85.0 |
|
Total Revolving notes |
|
$ |
297.1 |
|
|
$ |
296.6 |
|
|
|
|
|
|
|
|
||
As of August 31, 2023, outstanding commitments under the North American credit facility included letters of credit which totaled $4.9 million.
Other Information
The revolving and operating lines of credit, along with notes payable, contain covenants with respect to us and our various subsidiaries, the most restrictive of which, among other things, limit our ability to: incur additional indebtedness or guarantees; pay dividends or repurchase stock; enter into financing leases; create liens; sell assets; engage in transactions with affiliates, including joint ventures and non U.S. subsidiaries, including but not limited to loans, advances, equity investments and guarantees; enter into mergers, consolidations or sales of substantially all our assets; and enter into new lines of business. The covenants also require certain maximum ratios of debt to total capitalization and minimum levels of fixed charges (interest plus rent) coverage. As of August 31, 2023, we were in compliance with all such restrictive covenants.
From time to time, we may seek to repurchase or otherwise retire or exchange securities, including outstanding convertible notes, borrowings and equity securities, and take other steps to reduce our debt, extend the maturities of our debt or otherwise improve our balance sheet. These actions may include open market repurchases, unsolicited or solicited privately negotiated transactions or other retirements, repurchases or exchanges. Such retirements, repurchases or exchanges of one note or security for another note or security (now or hereafter existing), if any, will depend on a number of factors, including, but not limited to, prevailing market conditions, trading levels of our debt, our liquidity requirements and contractual restrictions, if applicable. The amounts involved in any such transactions may, individually or in the aggregate, be material and may involve all or a portion of a particular series of notes or other indebtedness which may reduce the float and impact the trading market of notes or other indebtedness which remain outstanding.
We have global operations that conduct business in their local currencies as well as other currencies. To mitigate the exposure to transactions denominated in currencies other than the functional currency of each entity, we enter into foreign currency forward exchange contracts with established financial institutions to protect the revenue or margin on a portion of forecasted foreign currency sales and expenses. Given the strong credit standing of the counterparties, no provision has been made for credit loss due to counterparty non-performance.
To mitigate the exposure to changes in interest rates, we have managed a portion of our variable rate debt with interest rate swap agreements, effectively converting $654.0 million of variable rate debt to fixed rate debt as of August 31, 2023.
We expect existing funds and cash generated from operations, together with proceeds from financing activities including borrowings under existing credit facilities and long-term financings, to be sufficient to fund expected debt repayments, working capital needs, planned capital expenditures, additional investments in our unconsolidated affiliates and dividends during the next twelve months.
43
The following table shows our estimated future contractual cash obligations as of August 31, 2023:
|
|
Year Ended August 31, |
|
|||||||||||||||||||||||||
(In millions) |
|
Total |
|
|
2024 |
|
|
2025 |
|
|
2026 |
|
|
2027 |
|
|
2028 |
|
|
Thereafter |
|
|||||||
Notes payable 1 |
|
$ |
1,329.9 |
|
|
$ |
86.5 |
|
|
$ |
39.3 |
|
|
$ |
262.0 |
|
|
$ |
308.7 |
|
|
$ |
385.2 |
|
|
$ |
248.2 |
|
Interest 2 |
|
|
305.0 |
|
|
|
56.1 |
|
|
|
51.9 |
|
|
|
48.6 |
|
|
|
39.3 |
|
|
|
18.5 |
|
|
|
90.6 |
|
Railcar & operating leases |
|
|
80.0 |
|
|
|
15.6 |
|
|
|
12.9 |
|
|
|
11.6 |
|
|
|
8.7 |
|
|
|
7.9 |
|
|
|
23.3 |
|
Revolving notes |
|
|
297.1 |
|
|
|
160.5 |
|
|
|
3.4 |
|
|
|
3.4 |
|
|
|
129.8 |
|
|
|
— |
|
|
|
— |
|
|
|
$ |
2,012.0 |
|
|
$ |
318.7 |
|
|
$ |
107.5 |
|
|
$ |
325.6 |
|
|
$ |
486.5 |
|
|
$ |
411.6 |
|
|
$ |
362.1 |
|
|
|
|
|
|
|
|
|
|
|
|
|
|
|
|
|
|
|
|
|
|
|
|||||||
1 The repayment of the $47.7 million of 2024 Convertible Notes due February 2024 and the $373.8 million of 2028 Convertible Notes due April 2028 is assumed to occur at the scheduled maturity instead of assuming an earlier conversion by the holders.
2 A portion of the estimated future cash obligation relates to interest on variable rate borrowings. Amounts are based on interest rates as of August 31, 2023.
We do not currently have off balance sheet arrangements that have or are likely to have a material current or future effect on our Consolidated Financial Statements.
Critical Accounting Estimates
The preparation of financial statements in conformity with accounting principles generally accepted in the U.S. requires judgment on the part of management to arrive at estimates and assumptions on matters that are inherently uncertain. These estimates may affect the amount of assets, liabilities, revenue and expenses reported in the financial statements and accompanying notes and disclosure of contingent assets and liabilities within the financial statements. Estimates and assumptions are periodically evaluated and may be adjusted in future periods. Actual results could differ from those estimates.
Impairment of long-lived assets - We review our long-lived assets for impairment whenever events or changes in circumstances indicate that the carrying amount of an asset group may not be recoverable. When such events or changes in circumstances occur, a recoverability test is performed based upon estimated undiscounted cash flows expected to be realized over the remaining useful life of the asset group. If the carrying amount of an asset group exceeds the estimated undiscounted future cash flows, an impairment would be measured as the difference between the fair value of the asset group and the carrying amount of the asset group.
An asset group is generally established by identifying the lowest level of cash flows generated by a group of assets that are largely independent of the cash flows of other assets. Determining whether a long-lived asset is impaired requires various estimates and assumptions, including whether a triggering event has occurred, the identification of asset groups, and the determination of the fair value of real and personal property. Estimates of future cash flows are by nature highly uncertain and contemplate factors that may change over time. For further information, see Note 5 to the Consolidated Financial Statements.
Goodwill - In accordance with Accounting Standards Codification (ASC) Topic 350, Intangibles–Goodwill and Other (ASC 350), we evaluate goodwill for possible impairment annually or more frequently if events or changes in circumstances indicate that the carrying amounts of our reporting units exceed their fair value. We determine the fair value of our reporting units based on a weighting of income and market approaches. Under the income approach, we calculate the fair value of a reporting unit based on the present value of estimated future cash flows which incorporates forecasted revenues, long-term growth rate, gross margin percentages, operating expenses, and the use of discount rates. Under the market approach, we estimate the fair value based on observed market multiples for comparable businesses. If the fair value of a reporting unit is lower than its carrying value, an impairment to goodwill is recorded, not to exceed the carrying amount of goodwill in the reporting unit.
We performed a quantitative assessment for our annual goodwill impairment test during the third quarter of 2023. Based on the results of our assessment, the estimated fair values of all reporting units with goodwill increased from our prior quantitative assessment, and exceeded their carrying values; therefore, we concluded that goodwill was not impaired. Pursuant to the authoritative guidance, we make certain estimates and assumptions to determine our reporting units and whether the fair value for each reporting unit is greater than its carry value. The above highlighted judgments contemplated estimates and effects of macroeconomic trends that are inherently uncertain. Changes in these estimates, which may include the effects of inflation and policy reactions thereto, increases in pricing of materials and components, changes in demand, or potential macroeconomic events may cause future assessment conclusions to differ.
44
For further information, see Note 8 to the Consolidated Financial Statements.
Income taxes - The asset and liability method is used to account for income taxes. We are required to estimate the timing of the recognition of deferred tax assets and liabilities, make assumptions about the future deductibility of deferred tax assets and assess deferred tax liabilities based on enacted law and tax rates for each tax jurisdiction to determine the amount of deferred tax assets and liabilities. Deferred income taxes are provided for the temporary effects of differences between assets and liabilities recognized for financial statement and income tax reporting purposes. Valuation allowances reduce deferred tax assets to an amount that will more likely than not be realized. We recognize a tax benefit from uncertain tax positions in the financial statements only when it is more likely than not the position will be sustained upon examination by relevant tax authorities.
Our annual tax rate is based on our income, statutory tax rates, and tax planning opportunities available to us in the various jurisdictions in which we operate. Judgment is required in determining our tax expense and in evaluating our tax positions, as tax laws are complex and subject to different interpretations by taxpayers and government taxing authorities. Our income tax rate is affected by the tax rates that apply to our foreign earnings and could be adversely impacted by higher or lower earnings than anticipated in a particular jurisdiction. In addition to local country tax laws and regulations, our income tax rate depends on the extent that our foreign earnings are taxed by the U.S. through provisions such as the global intangible low-taxed income (GILTI) tax and base erosion and anti-abuse tax (BEAT). We review our deferred tax assets and tax positions quarterly and adjust the balances as new information becomes available. For further information regarding income taxes, see Note 18 of the Consolidated Financial Statements.
Environmental costs - At times we may be involved in various proceedings related to environmental matters. We estimate future costs for known environmental remediation requirements and accrue for them when it is probable that we have incurred a liability and the related costs can be reasonably estimated based on currently available information. Adjustments to these liabilities are made when additional information becomes available that affects the estimated costs to study or remediate any environmental issues or when expenditures for which reserves are established are made.
Judgments used in determining if a liability is estimable are subjective and based on known facts and our historic experience. If further developments in or resolution of an environmental matter result in facts and circumstances that differ from those assumptions used to develop these reserves, the accrual for environmental remediation could be materially understated or overstated. Due to the uncertain nature of environmental matters, there can be no assurance that we will not become involved in future litigation or other proceedings or, if we were found to be responsible or liable in any litigation or proceeding, that such costs would not be material to us. For further information regarding our environmental costs, see Note 22 of the Consolidated Financial Statements.
45
Item 7A. QUANTITATIVE AND QUALITATIVE DISCLOSURES ABOUT MARKET RISK
Foreign Currency Exchange Risk
We have global operations that conduct business in their local currencies as well as other currencies. To mitigate the exposure to transactions denominated in currencies other than the functional currency of each entity, we enter into foreign currency forward exchange contracts to protect revenue or margin on a portion of forecasted foreign currency sales and expenses. At August 31, 2023 exchange rates, notional amounts of forward exchange contracts for the purchase of Polish Zlotys and the sale of Euros aggregated to $70.9 million. Because of the variety of currencies in which purchases and sales are transacted and the interaction between currency rates, it is not possible to predict the impact of a movement in a single foreign currency exchange rate would have on future operating results.
In addition to exposure to transaction gains or losses, we are also exposed to foreign currency exchange risk related to the net asset position of our foreign subsidiaries. At August 31, 2023, net assets of foreign subsidiaries aggregated to $149.5 million and a 10% strengthening of the U.S. Dollar relative to the foreign currencies would result in a decrease in equity of $14.9 million, or 1.2% of Total equity - Greenbrier. This calculation assumes that each exchange rate would change in the same direction relative to the U.S. Dollar.
Interest Rate Risk
We have managed a portion of our variable rate debt with interest rate swap agreements, effectively converting $654.0 million of variable rate debt to fixed rate debt. Notwithstanding these interest rate swap agreements, we are still exposed to interest rate risk relating to our revolving debt and a portion of term debt, which are at variable rates. At August 31, 2023, 85% of our outstanding debt had fixed rates and 15% had variable rates. At August 31, 2023, a uniform 10% increase in variable interest rates would result in approximately $1.2 million of additional annual interest expense.
46
Report of Independent Registered Public Accounting Firm
To the Stockholders and Board of Directors
The Greenbrier Companies, Inc.:
Opinion on the Consolidated Financial Statements
We have audited the accompanying consolidated balance sheets of The Greenbrier Companies, Inc. and subsidiaries (the Company) as of August 31, 2023 and 2022, the related consolidated statements of income, comprehensive income, equity, and cash flows for each of the years in the three-year period ended August 31, 2023, and the related notes (collectively, the consolidated financial statements). In our opinion, the consolidated financial statements present fairly, in all material respects, the financial position of the Company as of August 31, 2023 and 2022, and the results of its operations and its cash flows for each of the years in the three-year period ended August 31, 2023, in conformity with U.S. generally accepted accounting principles.
We also have audited, in accordance with the standards of the Public Company Accounting Oversight Board (United States) (PCAOB), the Company’s internal control over financial reporting as of August 31, 2023, based on criteria established in Internal Control – Integrated Framework (2013) issued by the Committee of Sponsoring Organizations of the Treadway Commission, and our report dated October 25, 2023 expressed an adverse opinion on the effectiveness of the Company’s internal control over financial reporting.
Change in Accounting Principle
As discussed in Note 2 to the consolidated financial statements, the Company has changed its method of accounting for convertible instruments and contracts in the Company’s own equity as of September 1, 2021 due to the adoption of Accounting Standards Update 2020-06, Accounting for Convertible Instruments and Contracts in an Entity’s Own Equity.
Basis for Opinion
These consolidated financial statements are the responsibility of the Company’s management. Our responsibility is to express an opinion on these consolidated financial statements based on our audits. We are a public accounting firm registered with the PCAOB and are required to be independent with respect to the Company in accordance with the U.S. federal securities laws and the applicable rules and regulations of the Securities and Exchange Commission and the PCAOB.
We conducted our audits in accordance with the standards of the PCAOB. Those standards require that we plan and perform the audit to obtain reasonable assurance about whether the consolidated financial statements are free of material misstatement, whether due to error or fraud. Our audits included performing procedures to assess the risks of material misstatement of the consolidated financial statements, whether due to error or fraud, and performing procedures that respond to those risks. Such procedures included examining, on a test basis, evidence regarding the amounts and disclosures in the consolidated financial statements. Our audits also included evaluating the accounting principles used and significant estimates made by management, as well as evaluating the overall presentation of the consolidated financial statements. We believe that our audits provide a reasonable basis for our opinion.
Critical Audit Matter
The critical audit matter communicated below is a matter arising from the current period audit of the consolidated financial statements that was communicated or required to be communicated to the audit committee and that: (1) relates to accounts or disclosures that are material to the consolidated financial statements and (2) involved our especially challenging, subjective, or complex judgments. The communication of a critical audit matter does not alter in any way our opinion on the consolidated financial statements, taken as a whole, and we are not, by communicating the critical audit matter below, providing a separate opinion on the critical audit matter or on the accounts or disclosures to which it relates.
47
Sufficiency of audit evidence within the North American manufacturing businesses
As discussed in Item 9A. Controls and Procedures, a material weakness was identified as of August 31, 2023 and included in management’s report on internal control over financial reporting. The description of the material weakness states that the Company did not effectively design and maintain controls over information technology (IT) general controls in one IT environment in its primary North America manufacturing businesses that are relevant to the preparation of the Company’s consolidated financial statements. The Company did not (i) maintain change management controls to ensure configuration data changes affecting the IT application were appropriate (ii) design and maintain program development controls to ensure the data migration, program testing and approval of new software development is aligned with business and IT requirements and (iii) maintain user access controls to ensure segregation of duties in the Company’s financial application. The control deficiencies resulted from incomplete risk assessment, inadequate training of personnel and ineffective control activities related primarily to the implementation of a new ERP system in the Company's primary North America manufacturing businesses. As a result, process level automated controls that are dependent on the affected IT environment and manual controls that rely on system-generated data or reports from the affected IT environment were ineffective because they could have been adversely impacted.
We identified the evaluation of the sufficiency of audit evidence over the Company’s primary North American manufacturing businesses as a critical audit matter. Evaluating the sufficiency of audit evidence obtained required especially subjective auditor judgment because of the pervasiveness of the material weakness noted above.
The following are the primary procedures we performed to address this critical audit matter. We applied auditor judgment to determine the nature and extent of procedures to be performed over the Company’s primary North American manufacturing businesses including evaluating our scoping thresholds and control risk assessments considering the material weakness noted above. For relevant financial statement account balances at the North America manufacturing businesses, we:
We evaluated the sufficiency of audit evidence obtained by assessing the results of procedures performed, including the appropriateness of the nature and extent of such evidence.
/s/ KPMG LLP
We have served as the Company’s auditor since 2011.
Portland, Oregon
October 25, 2023
48
Item 8. FINANCIAL STATEMENTS AND SUPPLEMENTARY DATA
Consolidated Balance Sheets
AS OF AUGUST 31,
(In millions, except number of shares which are reflected in thousands) |
|
2023 |
|
|
2022 |
|
||
Assets |
|
|
|
|
|
|
||
Cash and cash equivalents |
|
$ |
281.7 |
|
|
$ |
543.0 |
|
Restricted cash |
|
|
21.0 |
|
|
|
16.1 |
|
Accounts receivable, net |
|
|
529.9 |
|
|
|
501.2 |
|
Income tax receivable |
|
|
42.2 |
|
|
|
39.8 |
|
Inventories |
|
|
823.6 |
|
|
|
815.3 |
|
Leased railcars for syndication |
|
|
187.4 |
|
|
|
111.1 |
|
Equipment on operating leases, net |
|
|
1,000.0 |
|
|
|
770.9 |
|
Property, plant and equipment, net |
|
|
619.2 |
|
|
|
645.2 |
|
Investment in unconsolidated affiliates |
|
|
88.7 |
|
|
|
92.5 |
|
Intangibles and other assets, net |
|
|
255.8 |
|
|
|
189.1 |
|
Goodwill |
|
|
128.9 |
|
|
|
127.3 |
|
|
|
$ |
3,978.4 |
|
|
$ |
3,851.5 |
|
Liabilities and Equity |
|
|
|
|
|
|
||
Revolving notes |
|
$ |
297.1 |
|
|
$ |
296.6 |
|
Accounts payable and accrued liabilities |
|
|
743.5 |
|
|
|
725.1 |
|
Deferred income taxes |
|
|
114.1 |
|
|
|
68.6 |
|
Deferred revenue |
|
|
46.2 |
|
|
|
35.3 |
|
Notes payable, net |
|
|
1,311.7 |
|
|
|
1,269.1 |
|
Commitments and contingencies (Notes 21 & 22) |
|
|
|
|
|
|
||
Contingently redeemable noncontrolling interest |
|
|
55.6 |
|
|
|
27.7 |
|
Equity |
|
|
|
|
|
|
||
Greenbrier |
|
|
|
|
|
|
||
Preferred stock - without par value; 25,000 shares authorized; none |
|
|
— |
|
|
|
— |
|
Common stock - without par value; 50,000 shares authorized; 30,880 |
|
|
— |
|
|
|
— |
|
Additional paid-in capital |
|
|
364.4 |
|
|
|
424.8 |
|
Retained earnings |
|
|
897.5 |
|
|
|
897.7 |
|
Accumulated other comprehensive loss |
|
|
(7.3 |
) |
|
|
(45.6 |
) |
Total equity - Greenbrier |
|
|
1,254.6 |
|
|
|
1,276.9 |
|
Noncontrolling interest |
|
|
155.6 |
|
|
|
152.2 |
|
Total equity |
|
|
1,410.2 |
|
|
|
1,429.1 |
|
|
|
$ |
3,978.4 |
|
|
$ |
3,851.5 |
|
|
|
|
|
|
|
|
||
The accompanying notes are an integral part of these financial statements.
49
Consolidated Statements of Income
YEARS ENDED AUGUST 31,
(In millions, except number of shares which are reflected in thousands and per share amounts) |
|
2023 |
|
|
2022 |
|
|
2021 |
|
|||
Revenue |
|
|
|
|
|
|
|
|
|
|||
Manufacturing |
|
$ |
3,357.7 |
|
|
$ |
2,476.6 |
|
|
$ |
1,311.1 |
|
Maintenance Services |
|
|
406.4 |
|
|
|
347.7 |
|
|
|
298.3 |
|
Leasing & Management Services |
|
|
179.9 |
|
|
|
153.4 |
|
|
|
138.5 |
|
|
|
|
3,944.0 |
|
|
|
2,977.7 |
|
|
|
1,747.9 |
|
Cost of revenue |
|
|
|
|
|
|
|
|
|
|||
Manufacturing |
|
|
3,083.4 |
|
|
|
2,300.9 |
|
|
|
1,189.2 |
|
Maintenance Services |
|
|
364.0 |
|
|
|
322.0 |
|
|
|
280.4 |
|
Leasing & Management Services |
|
|
55.5 |
|
|
|
48.8 |
|
|
|
46.7 |
|
|
|
|
3,502.9 |
|
|
|
2,671.7 |
|
|
|
1,516.3 |
|
Margin |
|
|
441.1 |
|
|
|
306.0 |
|
|
|
231.6 |
|
Selling and administrative |
|
|
235.3 |
|
|
|
225.2 |
|
|
|
191.8 |
|
Net gain on disposition of equipment |
|
|
(17.3 |
) |
|
|
(37.2 |
) |
|
|
(1.2 |
) |
Asset impairment, disposal, and exit costs, net |
|
|
46.7 |
|
|
|
— |
|
|
|
— |
|
Earnings from operations |
|
|
176.4 |
|
|
|
118.0 |
|
|
|
41.0 |
|
Other costs |
|
|
|
|
|
|
|
|
|
|||
Interest and foreign exchange |
|
|
85.4 |
|
|
|
57.4 |
|
|
|
43.3 |
|
Net loss on extinguishment of debt |
|
|
— |
|
|
|
— |
|
|
|
6.3 |
|
Earnings (loss) before income tax and earnings from |
|
|
91.0 |
|
|
|
60.6 |
|
|
|
(8.6 |
) |
Income tax (expense) benefit |
|
|
(24.6 |
) |
|
|
(18.1 |
) |
|
|
40.2 |
|
Earnings before earnings from unconsolidated affiliates |
|
|
66.4 |
|
|
|
42.5 |
|
|
|
31.6 |
|
Earnings from unconsolidated affiliates |
|
|
9.2 |
|
|
|
11.3 |
|
|
|
3.5 |
|
Net earnings |
|
|
75.6 |
|
|
|
53.8 |
|
|
|
35.1 |
|
Net earnings attributable to noncontrolling interest |
|
|
(13.1 |
) |
|
|
(6.9 |
) |
|
|
(2.7 |
) |
Net earnings attributable to Greenbrier |
|
$ |
62.5 |
|
|
$ |
46.9 |
|
|
$ |
32.4 |
|
Basic earnings per common share |
|
$ |
1.95 |
|
|
$ |
1.44 |
|
|
$ |
0.99 |
|
Diluted earnings per common share |
|
$ |
1.89 |
|
|
$ |
1.40 |
|
|
$ |
0.96 |
|
Weighted average common shares |
|
|
|
|
|
|
|
|
|
|||
Basic |
|
|
31,983 |
|
|
|
32,569 |
|
|
|
32,648 |
|
Diluted |
|
|
33,799 |
|
|
|
33,631 |
|
|
|
33,665 |
|
|
|
|
|
|
|
|
|
|
|
|||
The accompanying notes are an integral part of these financial statements.
50
Consolidated Statements of Comprehensive Income
YEARS ENDED AUGUST 31,
(In millions) |
|
2023 |
|
|
2022 |
|
|
2021 |
|
|||
Net earnings |
|
$ |
75.6 |
|
|
$ |
53.8 |
|
|
$ |
35.1 |
|
Other comprehensive income (loss) |
|
|
|
|
|
|
|
|
|
|||
Translation adjustment |
|
|
25.3 |
|
|
|
(21.6 |
) |
|
|
4.0 |
|
Reclassification of derivative financial instruments recognized |
|
|
(9.1 |
) |
|
|
4.7 |
|
|
|
5.0 |
|
Unrealized gain (loss) on derivative financial instruments 2 |
|
|
23.1 |
|
|
|
15.7 |
|
|
|
(0.4 |
) |
Other (net of tax effect) |
|
|
(1.0 |
) |
|
|
(0.7 |
) |
|
|
0.5 |
|
|
|
|
38.3 |
|
|
|
(1.9 |
) |
|
|
9.1 |
|
Comprehensive income |
|
|
113.9 |
|
|
|
51.9 |
|
|
|
44.2 |
|
Comprehensive income attributable to noncontrolling interest |
|
|
(13.1 |
) |
|
|
(6.9 |
) |
|
|
(2.6 |
) |
Comprehensive income attributable to Greenbrier |
|
$ |
100.8 |
|
|
$ |
45.0 |
|
|
$ |
41.6 |
|
|
|
|
|
|
|
|
|
|
|
|||
1 Net of tax effect of $3.7 million, $(1.7) million and $(1.7) million for the years ended August 31, 2023, 2022 and 2021, respectively.
2 Net of tax effect of $(8.8) million, $(6.2) million and $1.0 million for the years ended August 31, 2023, 2022 and 2021, respectively.
The accompanying notes are an integral part of these financial statements.
51
Consolidated Statements of Equity
|
|
Attributable to Greenbrier |
|
|
|
|
|
|
||||||||
(In millions) |
|
Common |
|
Additional |
|
Retained |
|
Accumulated |
|
Total |
|
Noncontrolling |
|
Total |
|
Contingently |
Balance August 31, 2020 |
|
32.7 |
|
$460.4 |
|
$885.5 |
|
$(52.8) |
|
$1,293.1 |
|
$180.0 |
|
$1,473.1 |
|
$31.1 |
Cumulative effect adjustment due to |
|
— |
|
— |
|
(0.5) |
|
— |
|
(0.5) |
|
— |
|
(0.5) |
|
— |
Net earnings |
|
— |
|
— |
|
32.4 |
|
— |
|
32.4 |
|
4.1 |
|
36.5 |
|
(1.4) |
Other comprehensive income, net |
|
— |
|
— |
|
— |
|
9.1 |
|
9.1 |
|
— |
|
9.1 |
|
— |
Noncontrolling interest adjustments |
|
— |
|
— |
|
— |
|
— |
|
— |
|
2.2 |
|
2.2 |
|
— |
Joint venture partner distribution |
|
— |
|
— |
|
— |
|
— |
|
— |
|
(24.6) |
|
(24.6) |
|
— |
Investment by joint venture partner |
|
— |
|
— |
|
— |
|
— |
|
— |
|
7.0 |
|
7.0 |
|
— |
Restricted stock awards (net of |
|
0.2 |
|
13.5 |
|
— |
|
— |
|
13.5 |
|
— |
|
13.5 |
|
— |
Unamortized restricted stock |
|
— |
|
(16.8) |
|
— |
|
— |
|
(16.8) |
|
— |
|
(16.8) |
|
— |
Stock based compensation expense |
|
— |
|
14.7 |
|
— |
|
— |
|
14.7 |
|
— |
|
14.7 |
|
— |
Repurchase of stock |
|
(0.5) |
|
(20.0) |
|
— |
|
— |
|
(20.0) |
|
— |
|
(20.0) |
|
— |
2.875% Convertible senior notes, |
|
|
|
56.3 |
|
— |
|
— |
|
56.3 |
|
— |
|
56.3 |
|
— |
2.875% Convertible senior notes, |
|
— |
|
(1.8) |
|
— |
|
— |
|
(1.8) |
|
— |
|
(1.8) |
|
— |
2.875% Convertible senior notes, |
|
— |
|
(29.2) |
|
— |
|
— |
|
(29.2) |
|
— |
|
(29.2) |
|
— |
2.25% Convertible Senior Notes, |
|
— |
|
(7.4) |
|
— |
|
— |
|
(7.4) |
|
— |
|
(7.4) |
|
— |
Cash dividends ($1.08 per share) |
|
— |
|
— |
|
(35.7) |
|
— |
|
(35.7) |
|
— |
|
(35.7) |
|
— |
Balance August 31, 2021 |
|
32.4 |
|
$469.7 |
|
$881.7 |
|
$(43.7) |
|
$1,307.7 |
|
$168.7 |
|
$1,476.4 |
|
$29.7 |
Cumulative effect adjustment due to |
|
— |
|
(58.9) |
|
4.9 |
|
— |
|
(54.0) |
|
— |
|
(54.0) |
|
— |
Net earnings |
|
— |
|
— |
|
46.9 |
|
— |
|
46.9 |
|
8.9 |
|
55.8 |
|
(2.0) |
Other comprehensive loss, net |
|
— |
|
— |
|
— |
|
(1.9) |
|
(1.9) |
|
— |
|
(1.9) |
|
— |
Noncontrolling interest adjustments |
|
— |
|
2.2 |
|
— |
|
— |
|
2.2 |
|
(6.2) |
|
(4.0) |
|
— |
Joint venture partner distribution |
|
— |
|
— |
|
— |
|
— |
|
— |
|
(19.2) |
|
(19.2) |
|
— |
Restricted stock awards (net of |
|
0.2 |
|
11.3 |
|
— |
|
— |
|
11.3 |
|
— |
|
11.3 |
|
— |
Unamortized restricted stock |
|
— |
|
(15.0) |
|
— |
|
— |
|
(15.0) |
|
— |
|
(15.0) |
|
— |
Stock based compensation expense |
|
— |
|
15.5 |
|
— |
|
— |
|
15.5 |
|
— |
|
15.5 |
|
— |
Cash dividends ($1.08 per share) |
|
— |
|
— |
|
(35.8) |
|
— |
|
(35.8) |
|
— |
|
(35.8) |
|
— |
Balance August 31, 2022 |
|
32.6 |
|
$424.8 |
|
$897.7 |
|
$(45.6) |
|
$1,276.9 |
|
$152.2 |
|
$1,429.1 |
|
$27.7 |
Net earnings |
|
|
|
— |
|
62.5 |
|
— |
|
62.5 |
|
11.5 |
|
74.0 |
|
1.6 |
Other comprehensive income, net |
|
— |
|
— |
|
— |
|
38.3 |
|
38.3 |
|
— |
|
38.3 |
|
— |
Noncontrolling interest adjustments |
|
— |
|
(12.5) |
|
(26.3) |
|
— |
|
(38.8) |
|
2.8 |
|
(36.0) |
|
26.3 |
Joint venture partner distribution |
|
— |
|
— |
|
— |
|
— |
|
— |
|
(10.9) |
|
(10.9) |
|
— |
Restricted stock awards (net of |
|
0.2 |
|
8.8 |
|
— |
|
— |
|
8.8 |
|
— |
|
8.8 |
|
— |
Unamortized restricted stock |
|
— |
|
(11.4) |
|
— |
|
— |
|
(11.4) |
|
— |
|
(11.4) |
|
— |
Stock based compensation expense |
|
— |
|
12.1 |
|
— |
|
— |
|
12.1 |
|
— |
|
12.1 |
|
— |
Repurchase of stock |
|
(1.9) |
|
(57.4) |
|
— |
|
— |
|
(57.4) |
|
— |
|
(57.4) |
|
— |
Cash dividends ($1.11 per share) |
|
— |
|
— |
|
(36.4) |
|
— |
|
(36.4) |
|
— |
|
(36.4) |
|
— |
Balance August 31, 2023 |
|
30.9 |
|
$364.4 |
|
$897.5 |
|
$(7.3) |
|
$1,254.6 |
|
$155.6 |
|
$1,410.2 |
|
$55.6 |
The accompanying notes are an integral part of these financial statements.
52
Consolidated Statements of Cash Flows
YEARS ENDED AUGUST 31,
(In millions) |
|
2023 |
|
|
2022 |
|
|
2021 |
|
|||
Cash flows from operating activities |
|
|
|
|
|
|
|
|
|
|||
Net earnings |
|
$ |
75.6 |
|
|
$ |
53.8 |
|
|
$ |
35.1 |
|
Adjustments to reconcile net earnings to net cash provided by (used in) |
|
|
|
|
|
|
|
|
|
|||
Deferred income taxes |
|
|
7.2 |
|
|
|
12.9 |
|
|
|
51.1 |
|
Depreciation and amortization |
|
|
106.3 |
|
|
|
102.0 |
|
|
|
100.7 |
|
Net gain on disposition of equipment |
|
|
(17.3 |
) |
|
|
(37.2 |
) |
|
|
(1.2 |
) |
Stock based compensation expense |
|
|
12.1 |
|
|
|
15.5 |
|
|
|
14.7 |
|
Asset impairment, disposal, and exit costs, net |
|
|
46.7 |
|
|
|
— |
|
|
|
— |
|
Net loss on extinguishment of debt |
|
|
— |
|
|
|
— |
|
|
|
6.3 |
|
Accretion of debt discount |
|
|
— |
|
|
|
— |
|
|
|
7.1 |
|
Noncontrolling interest adjustments |
|
|
8.4 |
|
|
|
1.6 |
|
|
|
2.3 |
|
Other |
|
|
3.7 |
|
|
|
3.8 |
|
|
|
2.4 |
|
Decrease (increase) in assets: |
|
|
|
|
|
|
|
|
|
|||
Accounts receivable, net |
|
|
(14.6 |
) |
|
|
(198.2 |
) |
|
|
(82.1 |
) |
Income tax receivable |
|
|
(2.4 |
) |
|
|
72.3 |
|
|
|
(103.0 |
) |
Inventories |
|
|
(17.2 |
) |
|
|
(267.9 |
) |
|
|
(166.5 |
) |
Leased railcars for syndication |
|
|
(123.7 |
) |
|
|
(40.6 |
) |
|
|
(11.9 |
) |
Other assets |
|
|
(51.6 |
) |
|
|
(28.1 |
) |
|
|
(5.8 |
) |
Increase (decrease) in liabilities: |
|
|
|
|
|
|
|
|
|
|||
Accounts payable and accrued liabilities |
|
|
16.3 |
|
|
|
165.3 |
|
|
|
109.9 |
|
Deferred revenue |
|
|
21.7 |
|
|
|
(5.6 |
) |
|
|
0.4 |
|
Net cash provided by (used in) operating activities |
|
|
71.2 |
|
|
|
(150.4 |
) |
|
|
(40.5 |
) |
Cash flows from investing activities |
|
|
|
|
|
|
|
|
|
|||
Proceeds from sales of assets |
|
|
78.8 |
|
|
|
155.5 |
|
|
|
15.9 |
|
Capital expenditures |
|
|
(362.1 |
) |
|
|
(380.7 |
) |
|
|
(139.0 |
) |
Investment in and advances to unconsolidated affiliates |
|
|
(3.5 |
) |
|
|
(2.3 |
) |
|
|
— |
|
Cash distribution from unconsolidated affiliates and other |
|
|
6.8 |
|
|
|
3.5 |
|
|
|
5.3 |
|
Net cash used in investing activities |
|
|
(280.0 |
) |
|
|
(224.0 |
) |
|
|
(117.8 |
) |
Cash flows from financing activities |
|
|
|
|
|
|
|
|
|
|||
Net changes in revolving notes with maturities of 90 days or less |
|
|
29.8 |
|
|
|
(101.3 |
) |
|
|
197.4 |
|
Proceeds from revolving notes with maturities longer than 90 days |
|
|
220.0 |
|
|
|
35.0 |
|
|
|
112.0 |
|
Repayments of revolving notes with maturities longer than 90 days |
|
|
(255.0 |
) |
|
|
— |
|
|
|
(287.0 |
) |
Proceeds from issuance of notes payable |
|
|
75.0 |
|
|
|
398.3 |
|
|
|
391.9 |
|
Repayments of notes payable |
|
|
(36.8 |
) |
|
|
(23.4 |
) |
|
|
(337.8 |
) |
Debt issuance costs |
|
|
(0.6 |
) |
|
|
(7.3 |
) |
|
|
(22.0 |
) |
Repurchase of stock |
|
|
(56.9 |
) |
|
|
— |
|
|
|
(20.0 |
) |
Dividends |
|
|
(36.1 |
) |
|
|
(35.8 |
) |
|
|
(35.6 |
) |
Cash distribution to joint venture partner |
|
|
(13.0 |
) |
|
|
(16.9 |
) |
|
|
(25.3 |
) |
Investment by joint venture partner |
|
|
— |
|
|
|
— |
|
|
|
7.0 |
|
Tax payments for net share settlement of restricted stock |
|
|
(2.6 |
) |
|
|
(3.7 |
) |
|
|
(3.3 |
) |
Net cash provided by (used in) financing activities |
|
|
(76.2 |
) |
|
|
244.9 |
|
|
|
(22.7 |
) |
Effect of exchange rate changes |
|
|
28.6 |
|
|
|
17.2 |
|
|
|
10.3 |
|
Decrease in cash and cash equivalents and restricted cash |
|
|
(256.4 |
) |
|
|
(112.3 |
) |
|
|
(170.7 |
) |
Cash and cash equivalents and restricted cash |
|
|
|
|
|
|
|
|
|
|||
Beginning of period |
|
|
559.1 |
|
|
|
671.4 |
|
|
|
842.1 |
|
End of period |
|
$ |
302.7 |
|
|
$ |
559.1 |
|
|
$ |
671.4 |
|
Balance Sheet Reconciliation |
|
|
|
|
|
|
|
|
|
|||
Cash and cash equivalents |
|
$ |
281.7 |
|
|
$ |
543.0 |
|
|
$ |
646.8 |
|
Restricted cash |
|
|
21.0 |
|
|
|
16.1 |
|
|
|
24.6 |
|
Total cash and cash equivalents and restricted cash as presented above |
|
$ |
302.7 |
|
|
$ |
559.1 |
|
|
$ |
671.4 |
|
Cash (received) paid during the period for |
|
|
|
|
|
|
|
|
|
|||
Interest |
|
$ |
70.0 |
|
|
$ |
45.1 |
|
|
$ |
28.1 |
|
Income taxes, net |
|
$ |
23.0 |
|
|
$ |
(55.0 |
) |
|
$ |
11.1 |
|
Non-cash activity |
|
|
|
|
|
|
|
|
|
|||
Transfer from Leased railcars for syndication and Inventories to |
|
$ |
(40.0 |
) |
|
$ |
(11.6 |
) |
|
$ |
188.5 |
|
Capital expenditures accrued in Accounts payable and accrued liabilities |
|
$ |
22.0 |
|
|
$ |
10.9 |
|
|
$ |
5.2 |
|
Transfer from Property, plant and equipment, net to |
|
$ |
— |
|
|
$ |
3.5 |
|
|
$ |
— |
|
Change in Accounts payable and accrued liabilities associated with |
|
$ |
(0.3 |
) |
|
$ |
— |
|
|
$ |
— |
|
Change in Accounts payable and accrued liabilities associated with cash |
|
$ |
2.1 |
|
|
$ |
1.4 |
|
|
$ |
0.6 |
|
The accompanying notes are an integral part of these financial statements.
53
Notes to Consolidated Financial Statements
Note 1 — Nature of Operations
The Company operates in three reportable segments: Manufacturing; Maintenance Services; and Leasing & Management Services. The segments support the Company's integrated business model. The Manufacturing segment, which currently operates from facilities in the U.S., Mexico, Poland and Romania, produces double-stack intermodal railcars, tank cars, freight railcars, and automotive railcar products. The Maintenance Services segment performs wheel and axle servicing, railcar maintenance services and produces a variety of component parts for the rail industry in North America. The Leasing & Management Services segment owns approximately 13,400 railcars as of August 31, 2023. The Company also provides management services for railroads, shippers, carriers, institutional investors and other leasing and transportation companies in North America. Through unconsolidated affiliates the Company produces rail and industrial components and has an ownership stake in a railcar manufacturer in Brazil.
Note 2 — Summary of Significant Accounting Policies
Principles of consolidation - The financial statements include the accounts of the Company and its subsidiaries in which it has a controlling interest. All intercompany transactions and balances are eliminated upon consolidation.
Unclassified balance sheet - The balance sheets of the Company are presented in an unclassified format as a result of significant leasing activities for which the current or non-current distinction is not relevant. In addition, the activities of the Manufacturing; Maintenance Services; and Leasing & Management Services segments are so intertwined that in the opinion of management, any attempt to separate the respective balance sheet categories would not be meaningful and may lead to the development of misleading conclusions by the reader.
Foreign currency translation - Certain operations outside the U.S. prepare financial statements in currencies other than the U.S. Dollar. Revenues and expenses are translated at monthly average exchange rates during the year, while assets and liabilities are translated at year-end exchange rates. Translation adjustments are accumulated as a separate component of equity in other comprehensive income (loss).
Cash and cash equivalents - Cash may temporarily be invested primarily in money market funds. All highly-liquid investments with a maturity of three months or less at the date of acquisition are considered cash equivalents.
Restricted cash - Restricted cash relates to amounts held to support a target minimum rate of return on certain agreements, terms of our credit agreement, and a pass through account for activity related to management services provided for certain third party customers.
Accounts receivable - Accounts receivable consists of receivables from customers and receivables from related parties (see Note 17 - Related Party Transactions) and is stated net of allowance for doubtful accounts of $2.8 million and $2.3 million as of August 31, 2023 and 2022, respectively.
|
|
As of August 31, |
|
|||||||||
(In millions) |
|
2023 |
|
|
2022 |
|
|
2021 |
|
|||
Allowance for doubtful accounts |
|
|
|
|
|
|
|
|
|
|||
Balance at beginning of period |
|
$ |
2.3 |
|
|
$ |
2.4 |
|
|
$ |
2.7 |
|
Additions, net of reversals |
|
|
0.5 |
|
|
|
0.4 |
|
|
|
0.6 |
|
Usage |
|
|
(0.2 |
) |
|
|
(0.3 |
) |
|
|
(0.8 |
) |
Currency translation effect |
|
|
0.2 |
|
|
|
(0.2 |
) |
|
|
(0.1 |
) |
Balance at end of period |
|
$ |
2.8 |
|
|
$ |
2.3 |
|
|
$ |
2.4 |
|
|
|
|
|
|
|
|
|
|
|
|||
Inventories - Inventories are valued at the lower of cost or net realizable value using the first-in first-out method. Work-in-process includes material, labor and overhead. Finished goods includes completed wheels, parts and railcars in transit or not on lease.
54
Leased railcars for syndication - Leased railcars for syndication consist of newly-built railcars manufactured at one of the Company’s facilities or railcars purchased from third parties, which have been placed on lease to a customer and which the Company intends to sell to an investor with the lease attached. These railcars are generally anticipated to be sold within six months of delivery of the last railcar in a group or six months from when the Company acquires the railcar from a third party and are typically not depreciated during that period as the Company does not believe any economic value of a railcar is lost in the first six months. In the event the railcars are not sold in the first six months, the railcars are either held in Leased railcars for syndication and are depreciated or are transferred to Equipment on operating leases and are depreciated.
Equipment on operating leases, net - Equipment on operating leases is stated net of accumulated depreciation. Depreciation to estimated salvage value is provided on the straight-line method over the estimated useful lives of up to forty years. Management periodically reviews useful lives and salvage value estimates based on current scrap prices and what the Company expects to receive upon disposal.
Investment in unconsolidated affiliates - Investment in unconsolidated affiliates includes the Company’s interests in certain investees which are accounted for under the equity method of accounting as the Company has determined that the investment provides the Company with the ability to exercise significant influence, but not control, over the investee. Significant influence is generally deemed to exist if the Company has an ownership interest in the voting stock of the investee of at least 20%. Several factors are considered in determining whether the equity method of accounting is appropriate including the relative ownership interests and governance rights of the joint venture partners.
As of August 31, 2023, investments in unconsolidated affiliates include the Company’s 60% interest in Greenbrier-Maxion, 29.5% interest in Amsted-Maxion Cruzeiro (which owns 40% of Greenbrier-Maxion) and 41.9% interest in Axis, LLC.
Property, plant and equipment - Property, plant and equipment is stated at cost, net of accumulated depreciation. Depreciation is provided on the straight-line method over estimated useful lives which primarily are as follows:
|
|
Depreciable Life |
Buildings and improvements |
|
10 - 30 years |
Machinery and equipment |
|
3 - 20 years |
Other |
|
3 - 7 years |
Intangible and other assets, net - Intangible assets are recorded when a portion of the purchase price of an acquisition is allocated to assets such as customer contracts and relationships and trade names. Intangible assets with finite lives are amortized using the straight line method over their estimated useful lives which are up to 20 years. Other assets include operating lease right-of-use (ROU) assets, nonqualified savings plan investments, and revolving note fees which are capitalized and amortized as interest expense over the life of the related borrowings. Under the short term lease recognition exemption, the Company does not recognize ROU assets or lease liabilities for qualifying leases with terms of less than twelve months. The Company does not separate lease and non-lease components.
Impairment of long-lived assets - When changes in circumstances indicate the carrying amount of certain long-lived asset groups may not be recoverable, the assets are evaluated for impairment. If the forecasted undiscounted future cash flows are less than the carrying amount of the assets, an impairment charge to reduce the carrying value of the assets to estimated realizable value is recognized in the current period. The Company recorded $24.2 million as impairment of long-lived assets for the year ended August 31, 2023. No impairment of long-lived assets was recorded in the years ended August 31, 2022 and 2021. See Note 5 – Divestitures for additional information.
Goodwill - Goodwill is recorded when the purchase price of an acquisition exceeds the fair market value of the net assets acquired. Goodwill is not amortized and is tested for impairment at least annually and more frequently if indicators of impairment arise. The Company reviews goodwill for impairment annually using either a qualitative assessment or a quantitative goodwill impairment test. If the qualitative assessment is selected and the Company determines that fair value of each reporting unit more likely than not exceeds its carrying value, no further assessment is necessary. For reporting units where the Company performs the quantitative goodwill impairment test, an impairment loss is recorded to the extent that the reporting unit’s carrying amount exceeds the reporting unit’s fair value. An impairment loss cannot exceed the total amount of goodwill allocated to the reporting unit. No impairment of goodwill was recorded in the years ended August 31, 2023, 2022, and 2021.
55
See Note 8 – Goodwill for additional information.
Warranty accruals - Warranty costs are estimated and charged to operations to cover a defined warranty period. The estimated warranty cost is based on history of warranty claims for each particular product type. For new product types without a warranty history, preliminary estimates are based on historical information for similar product types. The warranty accruals, included in Accounts payable and accrued liabilities, are reviewed periodically and updated based on warranty trends.
Income taxes - The asset and liability method is used to account for income taxes. Deferred income taxes are provided for the temporary effects of differences between assets and liabilities recognized for financial statement and income tax reporting purposes. Valuation allowances reduce deferred tax assets to an amount that will more likely than not be realized. The Company recognizes a tax benefit from uncertain tax positions in the financial statements only when it is more likely than not the position will be sustained upon examination by relevant tax authorities. The Company reevaluates these uncertain tax positions on a quarterly basis. Changes in tax law or court interpretations may result in the recognition of a tax benefit or an additional charge to the tax provision.
Deferred revenue - Cash payments received prior to meeting revenue recognition criteria are recorded in Deferred revenue. Amounts are reclassified out of Deferred revenue once the revenue recognition criteria have been met.
Noncontrolling interest and Contingently redeemable noncontrolling interest - The Company has a joint venture with Grupo Industrial Monclova, S.A. (GIMSA) that manufactures new railroad freight cars for the North American marketplace at GIMSA’s existing manufacturing facility located in Frontera, Mexico. Each party owns a 50% interest in the joint venture. The financial results of this operation are consolidated for financial reporting purposes as the Company maintains a controlling interest as evidenced by the right to appoint the majority of the Board of Directors, control over accounting, financing, marketing and engineering and approval and design of products. The noncontrolling interest related to the partner’s 50% interest in the joint venture is included in Noncontrolling interest in the equity section of the Company’s Consolidated Balance Sheet.
Greenbrier-Astra Rail was formed in 2017 between the Company’s existing European operations headquartered in Swidnica, Poland and Astra Rail, based in Arad, Romania. Greenbrier-Astra Rail is controlled by the Company with an approximate 75% interest. Astra Rail also received a put option to sell its entire noncontrolling interest to Greenbrier at an exercise price equal to the higher of fair value or a defined EBITDA multiple as measured on the exercise date. During 2022, the option was extended to be exercisable 30 business days prior to and up until June 1, 2026. The Company consolidates Greenbrier-Astra Rail for financial reporting purposes and includes the noncontrolling interest in the mezzanine section of the Consolidated Balance Sheet in Contingently redeemable noncontrolling interest. The carrying value of the noncontrolling interest cannot be less than the maximum redemption amount, which is the amount Greenbrier will settle the put option for if exercised.
During 2023, the Company recorded a noncash $26.3 million redemption value adjustment to Contingently redeemable noncontrolling interest and Retained earnings to record the carrying value at the maximum redemption amount. The increase in maximum redemption amount is primarily attributed to the impact of industry and entity-specific indicators which positively impacted the estimated future cash flows of Greenbrier-Astra Rail.
In August 2023, Greenbrier-Astra Rail sold its approximately 68% ownership interest in Rayvag, a railcar manufacturing company based in Adana, Turkey. The Company no longer holds an ownership interest in Rayvag and has deconsolidated Rayvag and its noncontrolling interest for financial reporting purposes as of August 31, 2023. See Note 5 – Divestitures for additional information.
Net earnings attributable to noncontrolling interest on the Company’s Consolidated Statement of Income represents the Company’s partners’ share of results from operations.
56
Accumulated other comprehensive loss – Accumulated other comprehensive loss, net of tax as appropriate, consisted of the following:
(In millions) |
|
Unrealized |
|
|
Foreign |
|
|
Other |
|
|
Accumulated |
|
||||
Balance, August 31, 2022 |
|
$ |
13.0 |
|
|
$ |
(57.4 |
) |
|
$ |
(1.2 |
) |
|
$ |
(45.6 |
) |
Other comprehensive income (loss) before reclassifications |
|
|
23.1 |
|
|
|
25.3 |
|
|
|
(1.0 |
) |
|
|
47.4 |
|
Amounts reclassified from accumulated other |
|
|
(9.1 |
) |
|
|
— |
|
|
|
— |
|
|
|
(9.1 |
) |
Balance, August 31, 2023 |
|
$ |
27.0 |
|
|
$ |
(32.1 |
) |
|
$ |
(2.2 |
) |
|
$ |
(7.3 |
) |
|
|
|
|
|
|
|
|
|
|
|
|
|
||||
The amounts reclassified out of Accumulated other comprehensive loss into the Consolidated Statements of Income, with the financial statement caption, were as follows:
|
|
Year Ended August 31, |
|
|
|
|||||||||
(In millions) |
|
2023 |
|
|
2022 |
|
|
2021 |
|
|
Financial Statement Caption |
|||
(Gain) loss on derivative financial instruments: |
|
|
|
|
|
|
|
|
|
|
|
|||
Foreign exchange contracts |
|
$ |
(2.0 |
) |
|
$ |
1.2 |
|
|
$ |
1.4 |
|
|
Revenue and Cost of revenue |
Interest rate swap contracts |
|
|
(10.8 |
) |
|
|
4.9 |
|
|
|
5.3 |
|
|
Interest and foreign exchange |
|
|
|
(12.8 |
) |
|
|
6.1 |
|
|
|
6.7 |
|
|
Total before tax |
|
|
|
3.7 |
|
|
|
(1.4 |
) |
|
|
(1.7 |
) |
|
Tax expense (benefit) |
|
|
$ |
(9.1 |
) |
|
$ |
4.7 |
|
|
$ |
5.0 |
|
|
Net of tax |
|
|
|
|
|
|
|
|
|
|
|
|
|||
Revenue recognition – The Company measures revenue at the amounts that reflect the consideration to which it expects to be entitled in exchange for transferring control of goods and services to customers. The Company recognizes revenue either at the point in time or over the period of time that performance obligations to customers are satisfied. The Company treats shipping costs that occur after control is transferred as fulfillment costs. Payment terms vary by segment and product type and are generally due within normal commercial terms. The Company’s contracts with customers may include multiple performance obligations (e.g. railcars, maintenance, management services, etc.). For such arrangements, the Company allocates revenues to each performance obligation based on its relative standalone selling price. The Company has disaggregated revenue from contracts with customers into categories which describe the principal activities from which it generates revenues.
Manufacturing
Railcars are manufactured in accordance with contracts with customers. The Company recognizes revenue upon its customers’ acceptance of the completed railcars at a specified delivery point. From time to time, the Company enters into multi-year supply agreements. Each railcar delivery is considered a distinct performance obligation, such that the amounts that are recognized as revenue following railcar delivery are generally not subject to change.
Maintenance Services
The Company operates a network of facilities in North America that provide wheel and axle servicing and products, railcar maintenance services and produces a variety of component parts for the rail industry.
Wheels revenue is recognized when wheelsets are shipped to the customer. Parts revenue is recognized upon shipment of the parts to the customers.
Maintenance revenue is typically recognized over time using the cost input method, based on progress toward contract completion measured by actual costs incurred to date in relation to the estimate of total expected costs. This method best depicts the Company’s performance in servicing the railcars for the customer.
57
Maintenance services are typically completed in less than 90 days.
Leasing & Management Services
The Company owns a fleet of new and used railcars which are leased to third-party customers. Lease revenue is recognized over the lease-term in the period in which it is earned.
Syndication transactions represent new and used railcars which have been placed on lease to a customer and which the Company sells to an investor with the lease attached. At the time of such sale, revenue and cost of revenue is allocated between the Manufacturing segment and Leasing & Management Services segment based on the relative standalone selling price of the product and services provided. The Company utilizes both ASC 842, Leases and ASC 606, Revenue from Contracts with Customers when evaluating retained risk of services and other performance obligations in conjunction with selling railcars with a lease attached as part of the syndication model.
The Company enters into multi-year contracts to provide management and maintenance services to customers for which revenue is generally recognized on a straight-line basis over the contract term as a stand-ready obligation. Costs to fulfill these contracts are recognized as incurred.
Interest and foreign exchange - Interest includes amortization of debt issuance costs and external interest expense. Foreign exchange gains and losses includes the effects of remeasuring monetary assets and liabilities denominated in a currency other than the functional currency of the respective subsidiary.
|
|
Year Ended August 31, |
|
|||||||||
(In millions) |
|
2023 |
|
|
2022 |
|
|
2021 |
|
|||
Interest and foreign exchange: |
|
|
|
|
|
|
|
|
|
|||
Interest and other expense |
|
$ |
79.2 |
|
|
$ |
55.7 |
|
|
$ |
44.7 |
|
Foreign exchange (gain) loss |
|
|
6.2 |
|
|
|
1.7 |
|
|
|
(1.4 |
) |
|
|
$ |
85.4 |
|
|
$ |
57.4 |
|
|
$ |
43.3 |
|
|
|
|
|
|
|
|
|
|
|
|||
Forward exchange contracts - Foreign operations give rise to risks from fluctuations in foreign currency exchange rates. Forward exchange contracts with established financial institutions are used to hedge a portion of such risk. Realized and unrealized gains and losses on effective hedges are deferred in other comprehensive income (loss) and recognized in earnings concurrent with the hedged transaction or when the occurrence of the hedged transaction is no longer considered probable. Ineffectiveness is measured and any gain or loss is recognized in foreign exchange (gain) loss. Even though forward exchange contracts are entered into to mitigate the impact of currency fluctuations, certain exposure remains, which may affect operating results. In addition, there is risk for counterparty non-performance.
Interest rate instruments - Interest rate swap agreements are used to reduce the impact of changes in interest rates on certain debt. The net cash amounts paid or received under the agreements are recognized as an adjustment to interest expense.
Research and development - Research and development costs are expensed as incurred. Research and development costs incurred for new product development during the years ended August 31, 2023, 2022 and 2021 were $4.0 million, $5.4 million and $6.3 million, respectively, included in Selling and administrative expenses.
Net earnings per share - Basic earnings per common share (EPS) is calculated using weighted average basic common shares outstanding, which include restricted stock grants and restricted stock units that are considered participating securities when the Company is in a net earnings position.
Diluted EPS is calculated using the if-converted method, associated with shares underlying the 2024 and 2028 2.875% Convertible notes, and the treasury stock method associated with restricted stock units that are not considered participating securities and performance based restricted stock units subject to performance criteria.
Stock-based compensation – Stock based compensation expense consists of restricted stock units and restricted stock awards. Restricted stock units and restricted stock awards are accounted for as equity based awards (see Note 15 -Equity).
58
The value of stock-based compensation awards is amortized as compensation expense from the date of grant through the vesting period. Forfeitures are recognized as they occur.
Management estimates - The preparation of financial statements in conformity with accounting principles generally accepted in the U.S. requires judgment on the part of management to arrive at estimates and assumptions on matters that are inherently uncertain. These estimates may affect the amount of assets, liabilities, revenues and expenses reported in the financial statements and accompanying notes and disclosure of contingent assets and liabilities within the financial statements. Estimates and assumptions are periodically evaluated and may be adjusted in future periods. Actual results could differ from those estimates.
Reclassifications - Certain immaterial reclassifications have been made to the accompanying prior year Consolidated Financial Statements to conform to the current year presentation.
Initial Adoption of Accounting Policies
Measurement of Credit Losses on Financial Instruments
In June 2016, the FASB issued Accounting Standard Update 2016-13, Financial Instruments – Credit Losses (ASU 2016-13). The Company adopted this guidance using a modified retrospective approach through a cumulative effect adjustment, which decreased opening retained earnings by $0.5 million on September 1, 2020.
Convertible Instruments and Contracts in an Entity’s Own Equity
In August 2020, the FASB issued Accounting Standard Update 2020-06, Accounting for Convertible Instruments and Contracts in an Entity’s Own Equity (ASU 2020-06), which simplifies the accounting for certain convertible instruments, amends guidance on derivative scope exceptions for contracts in an entity’s own equity and modifies the guidance on diluted EPS calculations as a result of these changes. The Company adopted this guidance effective September 1, 2021 on a modified retrospective basis and recorded a cumulative effect adjustment to increase Retained earnings by $5 million. The impact of adoption also resulted in a reduction to Additional paid in capital of approximately $59 million related to amounts attributable to conversion options that had previously been recorded in equity and the associated derecognition of related deferred tax liabilities of $17 million. Additionally, the Company recorded an increase to its convertible notes balance by an aggregate amount of approximately $71 million as a result of derecognizing the debt discount. The adoption of this guidance also decreased the amount of non-cash interest expense to be recognized in future periods as a result of eliminating the discount associated with the equity component. The Company did not incur any impact to liquidity or cash flows. Beginning September 1, 2021, when calculating net earnings attributable to Greenbrier per share of common stock, the Company uses the if-converted method as required under ASU 2020-06 to determine the dilutive effect of its convertible notes.
59
Note 3 – Asset Backed Securities
GBX Leasing 2022-1 LLC (GBXL I) was formed as a wholly owned special purpose entity (SPE) of GBX Leasing to securitize the leasing assets of GBX Leasing. On February 9, 2022, GBXL I (Issuer) issued $323.3 million of term notes secured by a portfolio of railcars and associated operating leases and other assets, acquired and owned by GBXL I. Greenbrier Management Services, LLC (GMS) entered into certain agreements relating to the management and servicing of the Issuer’s assets. The Company evaluated the accounting for the transaction and concluded that, based on its equity investment in the Issuer combined with GMS’s capacity as servicer, the Company is the primary beneficiary of the SPE and therefore consolidates the SPE for financial reporting purposes.
Issued debt includes $302.6 million of GBXL I Series 2022-1 Class A Secured Railcar Equipment Notes (Class A Notes) and $20.7 million of GBXL I Series 2022-1 Class B Secured Railcar Equipment Notes (Class B Notes), collectively the GBXL Series 2022-1 Notes (the GBXL Notes). The GBXL Notes bear interest at fixed rates of 2.87% and 3.45% for the Class A Notes and Class B Notes, respectively. The GBXL Notes are payable monthly and have a legal maturity date of February 20, 2052. The Company incurred $5.0 million in debt issuance costs in 2022, which will be amortized to interest expense through the expected repayment period. Both Class A and Class B Notes have an anticipated repayment date of January 20, 2029 and a legal maturity date. While the legal maturity date is in 2052, the cash flows generated from the railcar assets will pay down the GBXL Notes in line with the agreement, which based on expected cash flow payments, would result in repayment in advance of the legal maturity date. If the principal amount of the GBXL Notes has not been repaid in full by the anticipated repayment date, then the Issuer will also be required to pay additional interest to the holders at a rate equal to 4.00% per annum.
The GBXL Notes are obligations of the Issuer only and are nonrecourse to Greenbrier. The GBXL Notes are subject to a Master Indenture between the Issuer and U.S. Bank Trust Company, National Association, as trustee, as supplemented by a Series 2022-1 Supplement dated February 9, 2022. The GBXL Notes may be subject to acceleration upon the occurrence of certain events of default.
The following table summarizes the Issuer's net carrying amount of the assets transferred and the related debt.
|
|
As of August 31, |
|
|||||
(In millions) |
|
2023 |
|
|
2022 |
|
||
Assets |
|
|
|
|
|
|
||
Restricted cash |
|
$ |
6.7 |
|
|
$ |
6.9 |
|
Equipment on operating leases, net |
|
|
388.9 |
|
|
|
401.8 |
|
Liabilities |
|
|
|
|
|
|
||
Notes payable, net |
|
$ |
302.1 |
|
|
$ |
312.8 |
|
60
Note 4 – Revenue Recognition
Contract balances
Contract assets primarily consist of work completed for railcar maintenance but not billed at the reporting date. Contract liabilities primarily consist of customer prepayments for manufacturing and other management services, for which the Company has not yet satisfied the related performance obligations. Contract assets in the August 31, 2022 balance also included unbilled receivables on marine vessel construction for which the respective contracts did not permit billing at the reporting date.
The opening and closing balances of the Company’s contract balances are as follows:
(In millions) |
|
Balance sheet |
|
August 31, 2023 |
|
|
August 31, 2022 |
|
|
$ change |
|
|||
Contract assets1 |
|
Accounts receivable, net |
|
$ |
0.1 |
|
|
$ |
13.0 |
|
|
$ |
(12.9 |
) |
Contract assets |
|
Inventories |
|
$ |
7.0 |
|
|
$ |
6.0 |
|
|
$ |
1.0 |
|
Contract liabilities 1 2 |
|
Deferred revenue |
|
$ |
43.3 |
|
|
$ |
30.5 |
|
|
$ |
12.8 |
|
1 August 31, 2022 balances include contract assets and liabilities associated with Gunderson Marine which was disposed of in May 2023. See Note 5 for further discussion.
2 Contract liabilities balance includes deferred revenue within the scope of Revenue from Contracts with Customers (Topic 606).
For the years ended August 31, 2023 and 2022 the Company recognized $13.0 million and $16.4 million of revenue, respectively, that was included in Contract liabilities as of August 31, 2022 and 2021.
Performance obligations
As of August 31, 2023, the Company has entered into contracts with customers for which revenue has not yet been recognized. The following table outlines estimated transaction prices related to performance obligations wholly or partially unsatisfied, that the Company anticipates will be recognized in future periods.
(In millions) |
|
August 31, 2023 |
|
|
Revenue type: |
|
|
|
|
Manufacturing – Railcar sales |
|
$ |
2,741.2 |
|
Manufacturing – Sustainable conversions |
|
$ |
9.2 |
|
Services |
|
$ |
137.0 |
|
Other |
|
$ |
7.6 |
|
Based on current production and delivery schedules and existing contracts, approximately $1.9 billion of the Railcar sales amount is expected to be recognized in the next 12 months while the remaining amount is expected to be recognized into 2026. The table above excludes estimated revenue to be recognized at the Company’s Brazilian manufacturing operations, as they are accounted for under the equity method.
Sustainable conversions represent orders to modernize existing railcars and are expected to be recognized in the next 12 months.
Services includes management and maintenance services of which approximately 57% are expected to be performed through 2028 and the remaining amount through 2037.
61
Note 5 – Divestitures
Gunderson
On November 17, 2022, as part of the Company's strategic review of the global business capacity footprint, the Company decided to permanently cease rail production at the Gunderson Facility and to explore alternatives to exit marine barge production. Due to the change in future use of the facility, management assessed recoverability of the Gunderson assets in accordance with the Company’s policy on impairment of long-lived assets. Based on an analysis of future undiscounted cash flows associated with these assets, management determined that the carrying value was not recoverable. The carrying amount of the Company’s long-lived assets at the Gunderson Facility was $44.0 million and the fair value was $19.8 million as of the impairment date. The Company concluded that an impairment charge was necessary and $24.2 million was recorded within the Manufacturing segment as Asset impairment, disposal and exit costs, net on the Consolidated Statements of Income for the year ended August 31, 2023.
In May 2023, the Company sold its ownership interest in Gunderson Marine and the Gunderson Facility assets (which includes the Portland Property) and recognized a $14.4 million loss on sale and $2.1 million severance, which are recorded within the Manufacturing segment as Asset impairment, disposal, and exit costs, net on the Consolidated Statements of Income for the year ended August 31, 2023.
Southwest Steel
In August 2023, the Company sold its ownership interest in Southwest Steel Castings Company, a steel foundry business in Longview, Texas, and recorded a $9.7 million loss on sale, which is recorded within the Manufacturing segment as Asset impairment, disposal, and exit costs, net on the Consolidated Statements of Income for the year ended August 31, 2023.
Rayvag
As discussed in Note 2 - Summary of Significant Accounting Policies, Greenbrier-Astra Rail sold its ownership interest in Rayvag in August 2023 and recorded a $3.7 million gain on sale, which is recorded within the Manufacturing segment as Asset impairment, disposal, and exit costs, net on the Consolidated Statements of Income for the year ended August 31, 2023.
The following table summarizes the Company's Asset impairment, disposal, and exit costs, net:
|
|
For the year ended August 31, |
|
|
(In millions) |
|
2023 |
|
|
Gunderson: |
|
|
|
|
Impairment of long-lived assets |
|
$ |
24.2 |
|
Loss on sale |
|
|
14.4 |
|
Severance and exit costs |
|
|
2.1 |
|
|
|
|
40.7 |
|
Southwest Steel loss on sale |
|
|
9.7 |
|
Rayvag gain on sale |
|
|
(3.7 |
) |
|
|
$ |
46.7 |
|
|
|
|
|
|
Note 6 — Inventories
|
|
As of August 31, |
|
|||||
(In millions) |
|
2023 |
|
|
2022 |
|
||
Manufacturing supplies and raw materials |
|
$ |
638.2 |
|
|
$ |
570.2 |
|
Work-in-process |
|
|
138.2 |
|
|
|
183.3 |
|
Finished goods |
|
|
64.4 |
|
|
|
75.9 |
|
Excess and obsolete adjustment |
|
|
(17.2 |
) |
|
|
(14.1 |
) |
|
|
$ |
823.6 |
|
|
$ |
815.3 |
|
|
|
|
|
|
|
|
||
62
|
|
As of August 31, |
|
|||||||||
(In millions) |
|
2023 |
|
|
2022 |
|
|
2021 |
|
|||
Excess and obsolete adjustment |
|
|
|
|
|
|
|
|
|
|||
Balance at beginning of period |
|
$ |
14.1 |
|
|
$ |
19.9 |
|
|
$ |
24.2 |
|
Charge to cost of revenue |
|
|
5.4 |
|
|
|
1.5 |
|
|
|
0.8 |
|
Disposition of inventory |
|
|
(2.7 |
) |
|
|
(6.9 |
) |
|
|
(5.0 |
) |
Currency translation effect |
|
|
0.4 |
|
|
|
(0.4 |
) |
|
|
(0.1 |
) |
Balance at end of period |
|
$ |
17.2 |
|
|
$ |
14.1 |
|
|
$ |
19.9 |
|
|
|
|
|
|
|
|
|
|
|
|||
Note 7 — Property, Plant and Equipment, net
|
|
As of August 31, |
|
|||||
(In millions) |
|
2023 |
|
|
2022 |
|
||
Land and improvements |
|
$ |
70.9 |
|
|
$ |
88.4 |
|
Machinery and equipment |
|
|
574.0 |
|
|
|
623.7 |
|
Buildings and improvements |
|
|
352.0 |
|
|
|
367.1 |
|
Construction in progress |
|
|
81.3 |
|
|
|
55.3 |
|
Other |
|
|
118.3 |
|
|
|
107.4 |
|
|
|
|
1,196.5 |
|
|
|
1,241.9 |
|
Accumulated depreciation |
|
|
(577.3 |
) |
|
|
(596.7 |
) |
|
|
$ |
619.2 |
|
|
$ |
645.2 |
|
|
|
|
|
|
|
|
||
Depreciation expense was $71.5 million, $70.7 million and $75.3 million for the years ended August 31, 2023, 2022 and 2021, respectively.
Note 8 — Goodwill
Changes in the carrying value of goodwill are as follows:
(In millions) |
|
Manufacturing |
|
|
Maintenance Services |
|
|
Leasing & Management Services |
|
|
Total |
|
||||
Balance August 31, 2022 |
|
$ |
84.3 |
|
|
$ |
43.0 |
|
|
$ |
— |
|
|
$ |
127.3 |
|
Translation and other adjustments |
|
|
1.6 |
|
|
|
— |
|
|
|
— |
|
|
|
1.6 |
|
Balance August 31, 2023 |
|
$ |
85.9 |
|
|
$ |
43.0 |
|
|
$ |
— |
|
|
$ |
128.9 |
|
|
|
|
|
|
|
|
|
|
|
|
|
|
||||
(In millions) |
|
Goodwill |
|
|
Gross goodwill balance before accumulated goodwill impairment losses and other |
|
$ |
292.3 |
|
Accumulated goodwill impairment losses |
|
|
(138.2 |
) |
Accumulated other reductions |
|
|
(25.2 |
) |
Balance August 31, 2023 |
|
$ |
128.9 |
|
|
|
|
|
|
The Company performed its annual goodwill impairment test during the third quarter of 2023. For the annual impairment test, the Company utilized the quantitative assessment under ASC 350 Intangibles – Goodwill and Other to determine whether the fair value of a reporting unit was less than its carrying value. The Company determined the fair value of the reporting units considering both the income and market approaches. Under the income approach, the Company calculates the fair value of a reporting unit based on the present value of estimated future cash flows which incorporates forecasted revenues, long-term growth rate, gross margin percentages, operating expenses, and the use of discount rates. Under the market approach, the Company estimates the fair value based on observed market multiples for comparable businesses, when appropriate. Based on the results of the annual goodwill impairment test, the fair values of the reporting units exceeded their carrying values and the Company concluded that goodwill was not impaired.
63
As of August 31, 2023, the Manufacturing segment includes the North America Manufacturing reporting unit with a goodwill balance of $56.3 million and the Europe Manufacturing reporting unit with a goodwill balance of $29.6 million. The Maintenance Services segment had a goodwill balance of $43.0 million related to the Wheels & Parts reporting unit.
Note 9 — Intangibles and Other Assets, net
Intangible assets that are determined to have finite lives are amortized over their useful lives. Intangible assets with indefinite useful lives are not amortized and are periodically evaluated for impairment.
The following table summarizes the Company’s identifiable intangible and other assets balance:
|
|
As of August 31, |
|
|||||
(In millions) |
|
2023 |
|
|
2022 |
|
||
Intangible assets subject to amortization: |
|
|
|
|
|
|
||
Customer and supplier relationships |
|
$ |
87.5 |
|
|
$ |
87.5 |
|
Accumulated amortization |
|
|
(69.1 |
) |
|
|
(66.1 |
) |
Other intangible assets |
|
|
43.0 |
|
|
|
42.4 |
|
Accumulated amortization |
|
|
(22.3 |
) |
|
|
(16.5 |
) |
|
|
|
39.1 |
|
|
|
47.3 |
|
Intangible assets not subject to amortization |
|
|
2.3 |
|
|
|
2.4 |
|
Prepaid and other assets |
|
|
56.4 |
|
|
|
32.4 |
|
Operating lease ROU assets |
|
|
70.6 |
|
|
|
54.2 |
|
Nonqualified savings plan investments |
|
|
47.7 |
|
|
|
40.3 |
|
Debt issuance costs, net |
|
|
6.3 |
|
|
|
8.7 |
|
Assets held for sale |
|
|
0.3 |
|
|
|
3.8 |
|
Deferred tax assets |
|
|
33.1 |
|
|
|
— |
|
|
|
$ |
255.8 |
|
|
$ |
189.1 |
|
|
|
|
|
|
|
|
||
Amortization expense for the years ended August 31, 2023, 2022 and 2021 was $8.0 million, $9.3 million and $11.6 million, respectively. As of August 31, 2023, amortizable intangible assets had a weighted-average remaining useful life of 7 years. Amortization expense for the years ending August 31, 2024, 2025, 2026, 2027 and 2028 is expected to be $7.6 million, $6.5 million, $6.1 million, $5.2 million and $3.8 million, respectively.
Note 10 — Revolving Notes
Senior secured credit facilities, consisting of four components, aggregated to $1.4 billion as of August 31, 2023. The Company had an aggregate of $364.4 million available to draw down under credit facilities as of August 31, 2023. This amount consists of $273.8 million available on the North American credit facility, $25.6 million on the European credit facilities and $65.0 million on the Mexican credit facilities.
North America – As of August 31, 2023, a $600.0 million revolving line of credit, maturing August 2026, secured by substantially all the Company’s U.S. assets not otherwise pledged as security for term loans, the warehouse credit facility or the railcar asset-backed securities, existed to provide working capital and interim financing of equipment, principally for the Company’s U.S. and Mexican operations. Advances under this North American credit facility bear interest at SOFR plus 1.50% plus 0.10% as a SOFR adjustment or Prime plus 0.50% depending on the type of borrowing. Available borrowings under the credit facility are generally based on defined levels of eligible inventory, receivables, property, plant and equipment and leased equipment, as well as total debt to consolidated capitalization and fixed charges coverage ratios.
GBX Leasing – As of August 31, 2023, a $550.0 million nonrecourse warehouse credit facility existed to support the operations of GBX Leasing. Advances under this facility bear interest at SOFR plus 1.85% plus 0.11% as a SOFR adjustment. Interest rate swap agreements cover 87% of the outstanding balance to swap the floating interest rate to a fixed rate. The warehouse credit facility converts to a term loan in August 2025 which matures in August 2027.
Europe – As of August 31, 2023, lines of credit totaling $72.8 million secured by certain of the Company’s European assets, with variable rates that range from Warsaw Interbank Offered Rate (WIBOR) plus 1.2% to WIBOR plus 1.6% and Euro Interbank Offered Rate (EURIBOR) plus 1.5% to EURIBOR plus 1.9%, were available for working capital needs of the Company’s European manufacturing operations.
64
The European lines of credit include $35.9 million which are guaranteed by the Company. European credit facilities are regularly renewed. Currently, these European credit facilities have maturities that range from October 2023 through July 2025.
Mexico – As of August 31, 2023, the Company’s Mexican railcar manufacturing operations had three lines of credit totaling $175.0 million. The first line of credit provides up to $100.0 million and matures in June 2026. Advances under this facility bear interest at SOFR plus 4.25%. The second line of credit provides up to $45.0 million, of which the Company and its joint venture partner have each guaranteed 50%. Advances under this facility bear interest at SOFR plus 2.55%. The Mexican railcar manufacturing joint venture will be able to draw amounts available under this facility through February 2025. The third line of credit provides up to $30.0 million, of which the Company and its joint venture partner have each guaranteed 50%. Advances under this facility bear interest at a variable rate. The Mexican railcar manufacturing joint venture will be able to draw amounts available under this facility through June 2024.
|
|
As of August 31, |
|
|||||
(In millions) |
|
2023 |
|
|
2022 |
|
||
Credit facility balances: |
|
|
|
|
|
|
||
North America |
|
$ |
— |
|
|
$ |
160.0 |
|
GBX Leasing |
|
|
139.9 |
|
|
|
— |
|
Europe |
|
|
47.2 |
|
|
|
51.6 |
|
Mexico |
|
|
110.0 |
|
|
|
85.0 |
|
Total Revolving notes |
|
$ |
297.1 |
|
|
$ |
296.6 |
|
|
|
|
|
|
|
|
||
In addition, outstanding commitments under the North American credit facility included letters of credit which totaled $4.9 million and $6.9 million as of August 31, 2023 and 2022, respectively.
Note 11 — Accounts Payable and Accrued Liabilities
|
|
As of August 31, |
|
|||||
(In millions) |
|
2023 |
|
|
2022 |
|
||
Trade payables |
|
$ |
396.8 |
|
|
$ |
401.5 |
|
Other accrued liabilities |
|
|
90.3 |
|
|
|
102.8 |
|
Operating lease liabilities |
|
|
72.2 |
|
|
|
56.4 |
|
Accrued payroll and related liabilities |
|
|
158.6 |
|
|
|
140.4 |
|
Accrued warranty |
|
|
25.6 |
|
|
|
24.0 |
|
|
|
$ |
743.5 |
|
|
$ |
725.1 |
|
|
|
|
|
|
|
|
||
Note 12 — Warranty Accrual
|
|
As of August 31, |
|
|||||||||
(In millions) |
|
2023 |
|
|
2022 |
|
|
2021 |
|
|||
Balance at beginning of period |
|
$ |
24.0 |
|
|
$ |
27.9 |
|
|
$ |
45.2 |
|
Charged to cost of revenue |
|
|
6.7 |
|
|
|
5.0 |
|
|
|
(8.0 |
) |
Payments |
|
|
(5.8 |
) |
|
|
(7.9 |
) |
|
|
(9.2 |
) |
Currency translation effect |
|
|
0.7 |
|
|
|
(1.0 |
) |
|
|
(0.1 |
) |
Balance at end of period |
|
$ |
25.6 |
|
|
$ |
24.0 |
|
|
$ |
27.9 |
|
|
|
|
|
|
|
|
|
|
|
|||
65
Note 13 — Notes Payable, net
|
|
As of August 31, |
|
|||||
(In millions) |
|
2023 |
|
|
2022 |
|
||
Term loans |
|
$ |
906.6 |
|
|
$ |
867.5 |
|
2.875% Convertible senior notes, due 2028 |
|
|
373.8 |
|
|
|
373.8 |
|
2.875% Convertible senior notes, due 2024 |
|
|
47.7 |
|
|
|
47.7 |
|
Other notes payable |
|
|
1.8 |
|
|
|
1.2 |
|
|
|
$ |
1,329.9 |
|
|
$ |
1,290.2 |
|
Debt discount and issuance costs |
|
|
(18.2 |
) |
|
|
(21.1 |
) |
|
|
$ |
1,311.7 |
|
|
$ |
1,269.1 |
|
|
|
|
|
|
|
|
||
Term loans are primarily composed of:
Convertible senior notes, due 2028 (2028 Convertible Notes), bear interest at a fixed rate of 2.875%, paid semiannually in arrears on April 15th and October 15th. Issuance costs are amortized using the effective interest rate method through 2028 and the amortization expense is included in Interest and Foreign exchange on the Company's Consolidated Statement of Income. As of August 31, 2023, the effective interest rate was 5.75%. The convertible notes mature on April 15, 2028, unless earlier repurchased, redeemed or converted in accordance with their terms prior to such date. The convertible notes are senior unsecured obligations and rank equally with other senior unsecured debt. The notes are convertible into shares of the Company’s common stock, at an initial conversion rate of 18.0317 shares of common stock per $1,000 principal amount which is equivalent to an initial conversion price of approximately $55.46 per share. The conversion rate and the resulting conversion price are subject to adjustment in certain events, such as distributions, dividends or stock splits. Conversion of the par value of the note will be settled in cash, with any premium convertible in cash or shares at the Company’s option. Upon a conversion of the notes, the Company may elect to pay or deliver, as the case may be, cash and, if applicable, shares of the Company’s common stock, as provided in the 2028 Notes Indenture (as defined below). As of August 31, 2023, the Company has reserved approximately 8.8 million shares for issuance upon conversion of these notes.
The 2028 Convertible Notes are subject to an indenture entered into on April 20, 2021 by the Company and Wells Fargo Bank, National Association, as trustee, as amended and restated by the first supplemental indenture dated June 1, 2021 (2028 Notes Indenture). The 2028 Convertible Notes are convertible at the option of the holders prior to January 15, 2028, under certain circumstances as described in the 2028 Notes Indenture. Additionally, the Company may elect to call the notes on or after April 15, 2025 and on or before the 40th trading day prior to April 15, 2028, at a cash redemption price described in the 2028 Notes Indenture if the stock price exceeds 130% of the conversion price during certain trading days as defined in the 2028 Notes Indenture. Calling any Convertible Note for redemption will constitute a make-whole fundamental change with respect to that Convertible Note, in which case the conversion rate applicable to the conversion of that Convertible Note will be increased in certain circumstances if it is converted after it is called for redemption.
66
Convertible senior notes, due 2024 (2024 Convertible Notes), bear interest at a fixed rate of 2.875%, paid semi-annually in arrears on February 1st and August 1st. Issuance costs are amortized using the effective interest rate method through 2024 and the amortization expense is included in Interest and Foreign exchange on the Company's Consolidated Statement of Income. As of August 31, 2023, the effective interest rate was 4.99%. The convertible notes mature on February 1, 2024, unless earlier repurchased by the Company or converted in accordance with their terms. Upon the satisfaction of certain conditions, holders may convert at their option at any time prior to the business day immediately preceding the stated maturity date. The convertible notes are senior unsecured obligations and rank equally with other senior unsecured debt. The convertible notes are convertible into shares of the Company’s common stock, at an initial conversion rate of 16.6234 shares per $1,000 principal amount of the notes (which is equal to an initial conversion price of $60.16 per share). The initial conversion rate and conversion price are subject to adjustment upon the occurrence of certain events, such as distributions, dividends or stock splits. As of August 31, 2023 the Company has reserved approximately 1.1 million shares for issuance upon conversion of these notes.
Other notes payable includes $1.8 million of unsecured debt with maturity dates ranging from November 2023 to March 2028.
The notes payable, along with the revolving and operating lines of credit, contain certain covenants with respect to the Company and various subsidiaries, the most restrictive of which, among other things, limit the ability to: incur additional indebtedness or guarantees; pay dividends or repurchase stock; enter into capital leases; create liens; sell assets; engage in transactions with affiliates, including joint ventures and non U.S. subsidiaries, including but not limited to loans, advances, equity investments and guarantees; enter into mergers, consolidations or sales of substantially all the Company’s assets; and enter into new lines of business. The covenants also require certain maximum ratios of debt to total capitalization and minimum levels of fixed charges (interest and rent) coverage.
As of August 31, 2023, principal payments on the notes payable are expected as follows:
(In millions) |
|
|
|
|
Year ending August 31, |
|
|
|
|
2024 1 |
|
$ |
86.5 |
|
2025 |
|
|
39.3 |
|
2026 |
|
|
262.0 |
|
2027 |
|
|
308.7 |
|
2028 1 |
|
|
385.2 |
|
Thereafter |
|
|
248.2 |
|
|
|
$ |
1,329.9 |
|
|
|
|
|
|
1 The repayment of the $47.7 million of 2024 Convertible Notes due February 2024 and the $373.8 million of 2028 Convertible Notes due April 2028 is assumed to occur at the scheduled maturity instead of assuming an earlier conversion by the holders.
Note 14 — Derivative Instruments
Foreign operations give rise to market risks from changes in foreign currency exchange rates. Foreign currency forward exchange contracts with established financial institutions are utilized to hedge a portion of that risk. Interest rate swap agreements are used to reduce the impact of changes in interest rates on certain debt. The Company’s foreign currency forward exchange contracts and interest rate swap agreements are designated as cash flow hedges, and therefore the effective portion of unrealized gains and losses is recorded in accumulated other comprehensive income or loss.
At August 31, 2023 exchange rates, notional amounts of forward exchange contracts for the purchase of Polish Zlotys and the sale of Euros aggregated to $70.9 million. The fair value of the contracts is included on the Consolidated Balance Sheets as Accounts payable and accrued liabilities when in a loss position, or as Accounts receivable, net when in a gain position. As the contracts mature at various dates through June 2025, any such gain or loss remaining will be recognized in manufacturing revenue or cost of revenue along with the related transactions. In the event that the underlying transaction does not occur or does not occur in the period designated at the inception of the hedge, the amount classified in accumulated other comprehensive loss would be reclassified to the results of operations in Interest and foreign exchange at the time of occurrence.
67
At August 31, 2023 exchange rates, approximately $1.6 million of gain would be reclassified to revenue or cost of revenue in the next year.
At August 31, 2023, interest rate swap agreements maturing from September 2023 through January 2032 had notional amounts that aggregated to $654.0 million. The fair value of the contracts are included on the Consolidated Balance Sheets in Accounts payable and accrued liabilities when in a loss position, or in Accounts receivable, net when in a gain position. As interest expense on the underlying debt is recognized, amounts corresponding to the interest rate swap are reclassified from Accumulated other comprehensive loss and charged or credited to interest expense. At August 31, 2023 interest rates, approximately $15.4 million would be credited to interest expense in the next year.
Fair Values of Derivative Instruments
|
|
Asset Derivatives |
|
|
Liability Derivatives |
|
||||||||||||||
|
|
|
|
August 31, |
|
|
|
|
August 31, |
|
||||||||||
|
|
|
|
2023 |
|
|
2022 |
|
|
|
|
2023 |
|
|
2022 |
|
||||
(In millions) |
|
Balance sheet |
|
Fair |
|
|
Fair |
|
|
Balance sheet |
|
Fair |
|
|
Fair |
|
||||
Derivatives designated as hedging instruments |
|
|
|
|
|
|
|
|
|
|||||||||||
Foreign forward |
|
Accounts |
|
$ |
2.5 |
|
|
$ |
0.6 |
|
|
Accounts payable |
|
$ |
0.1 |
|
|
$ |
2.9 |
|
Interest rate swap |
|
Accounts |
|
|
34.9 |
|
|
|
20.8 |
|
|
Accounts payable |
|
|
0.1 |
|
|
|
— |
|
|
|
|
|
$ |
37.4 |
|
|
$ |
21.4 |
|
|
|
|
$ |
0.2 |
|
|
$ |
2.9 |
|
Derivatives not designated as hedging instruments |
|
|
|
|
|
|
|
|
|
|
|
|
|
|
|
|
||||
Foreign forward |
|
Accounts |
|
$ |
0.5 |
|
|
$ |
— |
|
|
Accounts payable |
|
$ |
— |
|
|
$ |
0.1 |
|
The Effect of Derivative Instruments on the Consolidated Statements of Income
Derivatives in cash flow |
|
Location of gain (loss) |
|
Gain (loss) recognized in income on |
|
|||||
|
|
|
|
2023 |
|
|
2022 |
|
||
Foreign forward exchange contract |
|
Interest and foreign exchange |
|
$ |
— |
|
|
$ |
(0.3 |
) |
Derivatives in |
|
Gain (loss) |
|
|
Location of |
|
Gain (loss) |
|
|
Location of gain |
|
Gain (loss) |
|
|||||||||||||||
|
|
2023 |
|
|
2022 |
|
|
|
|
2023 |
|
|
2022 |
|
|
|
|
2023 |
|
|
2022 |
|
||||||
Foreign forward |
|
$ |
5.6 |
|
|
$ |
(4.7 |
) |
|
Revenue |
|
$ |
(0.2 |
) |
|
$ |
(1.5 |
) |
|
Revenue |
|
$ |
2.0 |
|
|
$ |
0.9 |
|
Foreign forward |
|
|
2.0 |
|
|
|
0.5 |
|
|
Cost of revenue |
|
|
2.2 |
|
|
|
0.3 |
|
|
Cost of revenue |
|
|
0.6 |
|
|
|
0.7 |
|
Interest rate swap |
|
|
24.8 |
|
|
|
26.1 |
|
|
Interest and |
|
|
10.8 |
|
|
|
(4.9 |
) |
|
Interest and |
|
— |
|
|
— |
|
||
|
|
$ |
32.4 |
|
|
$ |
21.9 |
|
|
|
|
$ |
12.8 |
|
|
$ |
(6.1 |
) |
|
|
|
$ |
2.6 |
|
|
$ |
1.6 |
|
|
|
|
|
|
|
|
|
|
|
|
|
|
|
|
|
|
|
|
|
|
|
|
||||||
68
The following table presents the amounts in the Consolidated Statements of Income in which the effects of the cash flow hedges are recorded and the effects of the cash flow hedge activity on these line items for the years ended August 31, 2023, 2022 and 2021:
|
|
For the Year Ended August 31, |
|
|||||||||||||||||||||
|
|
2023 |
|
|
2022 |
|
|
2021 |
|
|||||||||||||||
(In millions) |
|
Total |
|
|
Amount of gain |
|
|
Total |
|
|
Amount of gain |
|
|
Total |
|
|
Amount of gain |
|
||||||
Revenue |
|
$ |
3,944.0 |
|
|
$ |
(0.2 |
) |
|
$ |
2,977.7 |
|
|
$ |
(1.5 |
) |
|
$ |
1,747.9 |
|
|
$ |
(1.3 |
) |
Cost of revenue |
|
$ |
3,502.9 |
|
|
$ |
2.2 |
|
|
$ |
2,671.7 |
|
|
$ |
0.3 |
|
|
$ |
1,516.3 |
|
|
$ |
(0.1 |
) |
Interest and foreign exchange |
|
$ |
85.4 |
|
|
$ |
10.8 |
|
|
$ |
57.4 |
|
|
$ |
(4.9 |
) |
|
$ |
43.3 |
|
|
$ |
(5.3 |
) |
Note 15 — Equity
Stock Incentive Plan
The 2021 Stock Incentive Plan was approved by shareholders on January 6, 2021. The new plan replaced the 2014 Amended and Restated Stock Incentive Plan, which was amended and restated as the 2017 Amended and Restated Stock Incentive Plan on October 24, 2017 and approved by shareholders on January 5, 2018. The 2021 Stock Incentive Plan provides for the grant of incentive stock options, non-statutory stock options, restricted shares, restricted stock units and stock appreciation rights. In addition to the 1.5 million shares reserved for issuance under the 2021 Stock Incentive Plan, up to 0.5 million shares previously reserved for issuance, but not issued or subject to outstanding awards, are available for issuance under the 2021 Stock Incentive Plan, and up to 0.9 million shares that were subject to outstanding awards under the 2017 Amended and Restated Stock Incentive Plan as of the effective date of the 2021 Stock Incentive Plan will also become available for issuance under the 2021 Stock Incentive Plan to the extent such shares are not issued and cease to be subject to such awards following the effective date of the 2021 Stock Incentive Plan.
On August 31, 2023, there were 1.2 million shares available for grant compared to 1.4 million and 1.6 million shares available for grant as of the years ended August 31, 2022 and 2021, respectively. There are no stock options or stock appreciation rights outstanding as of August 31, 2023. The Company currently grants restricted stock units. Shares associated with restricted stock unit awards are not considered legally outstanding shares of common stock until they are issued following vesting. Restricted stock unit awards, including performance-based awards, are entitled to participate in dividends.
During the years ended August 31, 2023, 2022, and 2021, the Company awarded restricted share and restricted stock unit grants totaling 0.5 million, 0.4 million, and 0.5 million shares, respectively, which include performance-based grants and dividend equivalent rights. For performance-based awards granted in 2022 and 2021, the performance metrics included an earnings before interest, taxes, depreciation and amortization (EBITDA) metric, weighted 80%, and a return on invested capital (ROIC) metric, weighted 20%. For performance-based awards granted in 2023, the performance metrics included the Company’s total shareholder return relative to a designated peer group (Relative TSR), weighted 20%, in addition to an EBITDA metric, weighted 60%, and an ROIC metric, weighted 20%. Performance-based award share payouts depend on the extent to which the performance goal has been achieved. The number of shares that a participant receives is equal to the award granted multiplied by a payout factor, which ranges from 0% to a maximum of 200%.
69
The fair value of awards granted, including performance-based grants that did not contain a Relative TSR market condition, was determined based on the market closing price of the underlying shares on the date of grant. For the awards granted with a Relative TSR market condition, the Company estimates the fair value using a Monte-Carlo simulation model utilizing the following key assumptions for such awards granted in October 2022:
|
|
|
|
|
Expected share price volatility (GBX) |
|
|
54.0 |
% |
Risk-free rate of return |
|
|
4.4 |
% |
|
|
|
|
|
The fair value of awards granted was $12.4 million, $18.7 million, and $18.0 million for the years ended August 31, 2023, 2022 and 2021, respectively. The grant date fair value of stock awarded under restricted share grants and restricted stock unit grants is amortized as compensation expense over the vesting period of one to three years. Compensation expense recognized related to restricted share grants and restricted stock unit grants for the years ended August 31, 2023, 2022 and 2021 was $12.1 million, $15.5 million, and $14.7 million, respectively, and was recorded in Selling and administrative and Cost of revenue on the Consolidated Statements of Income. Unamortized compensation cost related to restricted stock unit grants was $11.8 million as of August 31, 2023, which is expected to be recognized over a weighted average period of approximately two years.
During the year ended August 31, 2023, a total of 0.3 million restricted stock units vested, including shares that were withheld on behalf of employees to satisfy the minimum statutory tax withholding requirements. The following table summarizes the activity for the Company’s restricted share and restricted stock unit grants, including performance-based grants, under the 2021 Stock Incentive Plan and the 2017 Amended and Restated Stock Incentive Plan:
(in thousands, except per unit amounts) |
|
Number of Units |
|
|
Weighted Average Grant Date Fair Value |
|
||
Outstanding as of August 31, 2022 |
|
|
1,042 |
|
|
$ |
37.90 |
|
Granted |
|
|
450 |
|
|
$ |
27.65 |
|
Vested |
|
|
(311 |
) |
|
$ |
39.32 |
|
Forfeited |
|
|
(209 |
) |
|
$ |
32.96 |
|
Outstanding as of August 31, 2023 |
|
|
972 |
|
|
$ |
33.75 |
|
|
|
|
|
|
|
|
||
Share Repurchase Program
The Board of Directors has authorized the Company to repurchase in aggregate up to $100.0 million of the Company’s common stock. The program may be modified, suspended, or discontinued at any time without prior notice. Under the share repurchase program, shares of common stock may be purchased from time to time on the open market or through privately negotiated transactions. The timing and amount of purchases is based upon market conditions, securities law limitations and other factors. The share repurchase program does not obligate the Company to acquire any specific number of shares in any period. The prior authorization was set to expire on January 31, 2023. On January 5, 2023, the Board of Directors authorized the extension of the existing share repurchase program to January 31, 2025.
During the year ended August 31, 2023, the Company purchased a total of 1.9 million shares for $56.9 million, of which 1.8 million shares for $53.6 million were purchased under the current authorization of the share repurchase program. For shares repurchased subsequent to December 31, 2022, the Company has accrued excise tax of $0.5 million to Additional paid-in capital for the year ended August 31, 2023. As of August 31, 2023, the amount remaining for repurchase under the share repurchase program was $46.4 million. There were no shares repurchased under the share repurchase program during the years ended August 31, 2022 and 2021.
Other Share Repurchases
The Company repurchased $20.0 million of its common stock during 2021. These shares were repurchased, in privately negotiated transactions, as part of the Company’s debt refinancing in April 2021 and were not associated with the Company’s publicly announced share repurchase program.
70
Note 16 — Earnings Per Share
The shares used in the computation of the Company’s basic and diluted earnings per common share are reconciled as follows:
|
|
Year Ended August 31, |
|
|||||||||
(In thousands) |
|
2023 |
|
|
2022 |
|
|
2021 |
|
|||
Weighted average basic common shares outstanding 1 |
|
|
31,983 |
|
|
|
32,569 |
|
|
|
32,648 |
|
Dilutive effect of 2.875% Convertible notes, due 2024 2 3 |
|
|
824 |
|
|
|
— |
|
|
|
— |
|
Dilutive effect of 2.875% Convertible notes, due 2028 4 |
|
|
— |
|
|
|
— |
|
|
|
— |
|
Dilutive effect of 2.25% Convertible notes, due 2024 5 |
|
n/a |
|
|
n/a |
|
|
|
— |
|
||
Dilutive effect of restricted stock units 6 |
|
|
992 |
|
|
|
1,062 |
|
|
|
1,017 |
|
Weighted average diluted common shares outstanding |
|
|
33,799 |
|
|
|
33,631 |
|
|
|
33,665 |
|
|
|
|
|
|
|
|
|
|
|
|||
Basic earnings per common share (EPS) is computed by dividing Net earnings attributable to Greenbrier by weighted average basic common shares outstanding, which includes restricted stock grants and restricted stock units that are considered participating securities when the Company is in a net earnings position.
The Company's approach for calculating diluted EPS was modified beginning September 1, 2021 upon the adoption of ASU 2020-06, Accounting for Convertible Instruments and Contracts in an Entity’s Own Equity. See Note 2 - Summary of Significant Accounting Policies for additional information.
For the year ended August 31, 2023 and 2022, diluted EPS was calculated using the more dilutive of two methods. The first method includes the dilutive effect, using the treasury stock method, associated with restricted stock units that are not considered participating securities and performance based restricted stock units subject to performance criteria, for which actual levels of performance above target have been achieved. The second method supplements the first by also including the “if converted” effect of the 2.875% Convertible notes due 2024 and shares underlying the 2.875% Convertible notes due 2028, when there is a conversion premium. Under the “if converted” method, debt issuance and interest costs, both net of tax, associated with the convertible notes due 2024 are added back to net earnings and the share count is increased by the shares underlying the convertible notes.
71
For the years ended August 31, 2022 and 2021, diluted EPS was calculated using the treasury stock method associated with shares underlying the 2.875% Convertible notes due 2024, 2.25% convertible notes due 2024, restricted stock units that are not considered participating securities and performance based restricted stock units subject to performance criteria, for which actual levels of performance above target have been achieved.
(In millions, except number of shares which are reflected in |
|
Year Ended August 31, |
|
|||||||||
thousands and per share amounts) |
|
2023 |
|
|
2022 |
|
|
2021 |
|
|||
Net earnings attributable to Greenbrier |
|
$ |
62.5 |
|
|
$ |
46.9 |
|
|
$ |
32.4 |
|
Weighted average basic common shares outstanding |
|
|
31,983 |
|
|
|
32,569 |
|
|
|
32,648 |
|
Basic earnings per share |
|
$ |
1.95 |
|
|
$ |
1.44 |
|
|
$ |
0.99 |
|
|
|
|
|
|
|
|
|
|
|
|||
Net earnings attributable to Greenbrier |
|
$ |
62.5 |
|
|
$ |
46.9 |
|
|
$ |
32.4 |
|
Add back: |
|
|
|
|
|
|
|
|
|
|||
Interest and debt issuance costs on the 2.875% |
|
|
1.2 |
|
|
n/a |
|
|
n/a |
|
||
Earnings before interest and debt issuance costs |
|
n/a |
|
|
n/a |
|
|
n/a |
|
|||
Weighted average diluted common shares outstanding |
|
|
33,799 |
|
|
|
33,631 |
|
|
|
33,665 |
|
Diluted earnings per share |
|
$ |
1.89 |
|
1 |
$ |
1.40 |
|
|
$ |
0.96 |
|
1 Diluted earnings per share was calculated as follows:
Earnings before interest and debt issuance costs on the 2.875% convertible notes due 2024
Weighted average diluted common shares outstanding
Note 17 — Related Party Transactions
The Company has a 41.9% interest in Axis, a joint venture. The Company purchased $8.7 million, $11.5 million and $13.5 million of railcar components from Axis during the years ended August 31, 2023, 2022 and 2021, respectively.
The Company held a 40% interest in the common equity of an unconsolidated affiliate that bought and sold railcar assets that are leased to third parties. Upon sale of railcars to this entity from Greenbrier, 60% of the related revenue and margin was recognized and 40% was deferred until the railcars were ultimately sold by the entity. The Company recognized $15.1 million and $9.3 million with railcars sold out of the leasing warehouse during the year ended August 31, 2023 and 2022, respectively. The Company had no material revenue with railcars sold out of the leasing warehouse during the year ended August 31, 2021. As of August 31, 2023, the Company no longer holds an investment in this entity.
72
Note 18 — Income Taxes
Components of income tax expense (benefit) were as follows:
|
|
Year Ended August 31, |
|
|||||||||
(In millions) |
|
2023 |
|
|
2022 |
|
|
2021 |
|
|||
Current |
|
|
|
|
|
|
|
|
|
|||
Federal |
|
$ |
7.4 |
|
|
$ |
(6.7 |
) |
|
$ |
(95.9 |
) |
State |
|
|
2.7 |
|
|
|
0.9 |
|
|
|
1.9 |
|
Foreign |
|
|
9.7 |
|
|
|
19.2 |
|
|
|
4.3 |
|
|
|
|
19.8 |
|
|
|
13.4 |
|
|
|
(89.7 |
) |
Deferred |
|
|
|
|
|
|
|
|
|
|||
Federal |
|
|
7.9 |
|
|
|
2.2 |
|
|
|
54.1 |
|
State |
|
|
0.6 |
|
|
|
1.4 |
|
|
|
(2.3 |
) |
Foreign |
|
|
(3.4 |
) |
|
|
1.6 |
|
|
|
(3.4 |
) |
|
|
|
5.1 |
|
|
|
5.2 |
|
|
|
48.4 |
|
Change in valuation allowance |
|
|
(0.3 |
) |
|
|
(0.5 |
) |
|
|
1.1 |
|
Income tax expense (benefit) |
|
$ |
24.6 |
|
|
$ |
18.1 |
|
|
$ |
(40.2 |
) |
|
|
|
|
|
|
|
|
|
|
|||
Earnings (loss) before income tax and earnings from unconsolidated affiliates for the years ended August 31, 2023, 2022 and 2021 were $32.2 million, $12.4 million and ($30.7 million), respectively, for our domestic U.S. operations and $58.8 million, $48.2 million and $22.1 million, respectively for our foreign operations.
Due to the enactment of the CARES Act, the Company filed a Federal claim to carryback fiscal year 2021 tax losses to the fiscal years 2016 through 2018, allowing the recovery of Federal income taxes previously paid at Federal rates of 35.0% or 25.7%, rather than the current Federal rate of 21.0% in effect beginning with the fiscal year 2019. The carryback resulted in a Federal tax benefit of $38.5 million.
On August 16, 2022, the Inflation Reduction Act (the “IRA”) was signed into law. In general, the provisions of the IRA was effective beginning with fiscal year 2023, with certain exceptions. The IRA includes a new 15% corporate minimum tax as well as a 1% excise tax on corporate stock repurchases applicable to repurchases after December 31, 2022. The IRA did not have a material impact on our effective tax rate.
The reconciliation between effective and statutory tax rates on operations is as follows:
|
|
Year Ended August 31, |
|
|||||||||
|
|
2023 |
|
|
2022 |
|
|
2021 |
|
|||
Federal statutory rate |
|
|
21.0 |
% |
|
|
21.0 |
% |
|
|
(21.0 |
)% |
State income taxes, net of federal benefit |
|
|
3.0 |
|
|
|
3.1 |
|
|
|
(15.0 |
) |
Foreign operations |
|
|
6.2 |
|
|
|
9.0 |
|
|
|
25.5 |
|
U.S. tax on foreign earnings |
|
|
4.5 |
|
|
|
1.8 |
|
|
|
— |
|
Carryback rate benefit |
|
|
— |
|
|
|
(3.2 |
) |
|
|
(379.1 |
) |
Permanent differences |
|
|
(5.8 |
) |
|
|
5.4 |
|
|
|
(45.6 |
) |
Base erosion and anti-avoidance tax (BEAT) |
|
|
1.6 |
|
|
|
— |
|
|
|
— |
|
Change in valuation allowance |
|
|
(0.5 |
) |
|
|
(0.8 |
) |
|
|
12.6 |
|
Uncertain tax positions |
|
|
1.4 |
|
|
|
(1.8 |
) |
|
|
(44.0 |
) |
Noncontrolling interest in flow-through entity |
|
|
(2.7 |
) |
|
|
(3.0 |
) |
|
|
(2.9 |
) |
Credits and Other |
|
|
(1.7 |
) |
|
|
(1.6 |
) |
|
|
0.7 |
|
Effective tax rate |
|
|
27.0 |
% |
|
|
29.9 |
% |
|
|
(468.8 |
)% |
|
|
|
|
|
|
|
|
|
|
|||
73
The tax effects of temporary differences that give rise to significant portions of deferred tax assets and deferred tax liabilities were as follows:
|
|
As of August 31, |
|
|||||
(In millions) |
|
2023 |
|
|
2022 |
|
||
Deferred tax assets: |
|
|
|
|
|
|
||
Accrued payroll and related liabilities |
|
$ |
37.1 |
|
|
$ |
27.6 |
|
Deferred revenue |
|
|
6.6 |
|
|
|
6.7 |
|
Inventories and other |
|
|
12.4 |
|
|
|
9.8 |
|
Maintenance and warranty accruals |
|
|
3.5 |
|
|
|
3.2 |
|
Lease liability |
|
|
16.5 |
|
|
|
12.4 |
|
Net operating losses |
|
|
18.4 |
|
|
|
19.6 |
|
Investment, asset tax credits and other |
|
|
0.9 |
|
|
|
1.5 |
|
|
|
|
95.4 |
|
|
|
80.8 |
|
Valuation allowance |
|
|
(9.6 |
) |
|
|
(9.9 |
) |
Deferred tax liabilities: |
|
|
|
|
|
|
||
Fixed assets |
|
|
(131.9 |
) |
|
|
(110.6 |
) |
Intangibles |
|
|
(5.1 |
) |
|
|
(5.3 |
) |
Right-of-use asset |
|
|
(16.0 |
) |
|
|
(11.9 |
) |
Other |
|
|
(13.8 |
) |
|
|
(11.7 |
) |
|
|
|
(166.8 |
) |
|
|
(139.5 |
) |
Net deferred tax liability |
|
$ |
(81.0 |
) |
|
$ |
(68.6 |
) |
|
|
|
|
|
|
|
||
As of August 31, 2023, the Company had $106.8 million of state net operating loss carryforwards that will begin to expire in 2024, $0.6 million of state credit carryforwards that begin to expire in 2025, $25.1 million of foreign net operating loss carryforwards that begin to expire in calendar 2023 and $26.1 million of foreign net operating loss carryforwards that do not expire. The Company has placed a valuation allowance of $9.6 million against the deferred tax assets for which no benefit is anticipated, including those for loss and credit carryforwards not likely to be used before their expiration dates or where the possibility of utilization is remote. The net decrease in the total valuation allowance was approximately $0.3 million for the year ended August 31, 2023.
The Company's cumulative undistributed foreign earnings, if repatriated, would be accompanied by foreign withholdings taxes. However, the Company does not intend to repatriate these foreign earnings and continues to assert that its foreign earnings are indefinitely reinvested. As a result, it has not recorded a liability for foreign withholding taxes associated with undistributed foreign earnings.
The following is a tabular reconciliation of the total amounts of unrecognized tax benefits:
|
|
Year Ended August 31, |
|
|||||||||
(In millions) |
|
2023 |
|
|
2022 |
|
|
2021 |
|
|||
Unrecognized Tax Benefit – Opening Balance |
|
$ |
0.4 |
|
|
$ |
1.6 |
|
|
$ |
5.5 |
|
Gross increases – tax positions in prior period |
|
|
1.3 |
|
|
|
— |
|
|
|
— |
|
Gross decreases – tax positions in prior period |
|
|
— |
|
|
|
(0.9 |
) |
|
|
(3.6 |
) |
Settlements |
|
|
— |
|
|
|
— |
|
|
|
— |
|
Lapse of statute of limitations |
|
|
— |
|
|
|
(0.3 |
) |
|
|
(0.3 |
) |
Unrecognized Tax Benefit – Ending Balance |
|
$ |
1.7 |
|
|
$ |
0.4 |
|
|
$ |
1.6 |
|
|
|
|
|
|
|
|
|
|
|
|||
The Company is subject to taxation in the U.S. and in various states and foreign jurisdictions. The Company is effectively no longer subject to U.S. Federal examination for fiscal years ending before 2016, to state and local examinations before 2015, or to foreign examinations before 2016. The Company currently has ongoing examinations in the United States, Poland, and Romania.
74
Unrecognized tax benefits, excluding interest, at August 31, 2023 and 2022 were $1.7 million and $0.4 million, respectively which if recognized, would affect the effective tax rate. Accrued interest on unrecognized tax benefits as of August 31, 2023 and August 31, 2022 was $0.6 million and $0.1 million, respectively. The Company recorded an increase in accrued interest expenses of approximately $0.5 million and a reduction of approximately $0.3 million for changes in unrecognized tax benefits during the years ended August 31, 2023 and 2022 respectively. The Company has not accrued any penalties on the reserves. The Company does not anticipate a significant decrease in the reserves for uncertain tax positions during the next twelve months.
Interest and penalties related to income taxes are classified as a component of income tax expense. Benefits from the realization of unrecognized tax benefits for deductible differences attributable to ordinary operations will be recognized as a reduction of income tax expense.
Note 19 — Segment Information
The Company operates in three reportable segments: Manufacturing; Maintenance Services; and Leasing & Management Services.
The accounting policies of the segments are the same as those described in the summary of significant accounting policies. Performance is evaluated based on Earnings from operations. Corporate includes selling and administrative costs not directly related to goods and services and certain costs that are intertwined among segments due to our integrated business model. The Company does not allocate Interest and foreign exchange or Income tax benefit (expense) for either external or internal reporting purposes. Intersegment sales and transfers are valued as if the sales or transfers were to third parties. Related revenue and margin are eliminated in consolidation and therefore are not included in consolidated results in the Company’s Consolidated Financial Statements.
The information in the following table is derived directly from the segments’ internal financial reports used for corporate management purposes.
For the year ended August 31, 2023:
|
|
Revenue |
|
|
Earnings (loss) from operations |
|
||||||||||||||||||
(In millions) |
|
External |
|
|
Intersegment |
|
|
Total |
|
|
External |
|
|
Intersegment |
|
|
Total |
|
||||||
Manufacturing |
|
$ |
3,357.7 |
|
|
$ |
307.1 |
|
|
$ |
3,664.8 |
|
|
$ |
140.9 |
|
|
$ |
28.7 |
|
|
$ |
169.6 |
|
Maintenance Services |
|
|
406.4 |
|
|
|
36.0 |
|
|
|
442.4 |
|
|
|
36.9 |
|
|
|
— |
|
|
|
36.9 |
|
Leasing & Management Services |
|
|
179.9 |
|
|
|
1.2 |
|
|
|
181.1 |
|
|
|
103.3 |
|
|
|
0.3 |
|
|
|
103.6 |
|
Eliminations |
|
|
— |
|
|
|
(344.3 |
) |
|
|
(344.3 |
) |
|
|
— |
|
|
|
(29.0 |
) |
|
|
(29.0 |
) |
Corporate |
|
|
— |
|
|
|
— |
|
|
|
— |
|
|
|
(104.7 |
) |
|
|
— |
|
|
|
(104.7 |
) |
|
|
$ |
3,944.0 |
|
|
$ |
— |
|
|
$ |
3,944.0 |
|
|
$ |
176.4 |
|
|
$ |
— |
|
|
$ |
176.4 |
|
|
|
|
|
|
|
|
|
|
|
|
|
|
|
|
|
|
|
|
||||||
For the year ended August 31, 2022:
|
|
Revenue |
|
|
Earnings (loss) from operations |
|
||||||||||||||||||
(In millions) |
|
External |
|
|
Intersegment |
|
|
Total |
|
|
External |
|
|
Intersegment |
|
|
Total |
|
||||||
Manufacturing |
|
$ |
2,476.6 |
|
|
$ |
191.6 |
|
|
$ |
2,668.2 |
|
|
$ |
97.2 |
|
|
$ |
11.9 |
|
|
$ |
109.1 |
|
Maintenance Services |
|
|
347.7 |
|
|
|
26.4 |
|
|
|
374.1 |
|
|
|
21.7 |
|
|
|
— |
|
|
|
21.7 |
|
Leasing & Management Services |
|
|
153.4 |
|
|
|
1.9 |
|
|
|
155.3 |
|
|
|
108.3 |
|
|
|
0.1 |
|
|
|
108.4 |
|
Eliminations |
|
|
— |
|
|
|
(219.9 |
) |
|
|
(219.9 |
) |
|
|
— |
|
|
|
(12.0 |
) |
|
|
(12.0 |
) |
Corporate |
|
|
— |
|
|
|
— |
|
|
|
— |
|
|
|
(109.2 |
) |
|
|
— |
|
|
|
(109.2 |
) |
|
|
$ |
2,977.7 |
|
|
$ |
— |
|
|
$ |
2,977.7 |
|
|
$ |
118.0 |
|
|
$ |
— |
|
|
$ |
118.0 |
|
|
|
|
|
|
|
|
|
|
|
|
|
|
|
|
|
|
|
|
||||||
75
For the year ended August 31, 2021:
|
|
Revenue |
|
|
Earnings (loss) from operations |
|
||||||||||||||||||
(In millions) |
|
External |
|
|
Intersegment |
|
|
Total |
|
|
External |
|
|
Intersegment |
|
|
Total |
|
||||||
Manufacturing |
|
$ |
1,311.1 |
|
|
$ |
92.4 |
|
|
$ |
1,403.5 |
|
|
$ |
48.3 |
|
|
$ |
6.9 |
|
|
$ |
55.2 |
|
Maintenance Services |
|
|
298.3 |
|
|
|
9.1 |
|
|
|
307.4 |
|
|
|
6.5 |
|
|
|
0.1 |
|
|
|
6.6 |
|
Leasing & Management Services |
|
|
138.5 |
|
|
|
1.1 |
|
|
|
139.6 |
|
|
|
68.9 |
|
|
|
0.2 |
|
|
|
69.1 |
|
Eliminations |
|
— |
|
|
|
(102.6 |
) |
|
|
(102.6 |
) |
|
— |
|
|
|
(7.2 |
) |
|
|
(7.2 |
) |
||
Corporate |
|
— |
|
|
|
— |
|
|
|
— |
|
|
|
(82.7 |
) |
|
|
— |
|
|
|
(82.7 |
) |
|
|
|
$ |
1,747.9 |
|
|
$ |
— |
|
|
$ |
1,747.9 |
|
|
$ |
41.0 |
|
|
$ |
— |
|
|
$ |
41.0 |
|
|
|
|
|
|
|
|
|
|
|
|
|
|
|
|
|
|
|
|
||||||
|
|
Year Ended August 31, |
|
|||||||||
(In millions) |
|
2023 |
|
|
2022 |
|
|
2021 |
|
|||
Assets: |
|
|
|
|
|
|
|
|
|
|||
Manufacturing |
|
$ |
1,847.0 |
|
|
$ |
1,853.9 |
|
|
$ |
1,493.5 |
|
Maintenance Services |
|
|
294.4 |
|
|
|
284.8 |
|
|
|
260.9 |
|
Leasing & Management Services |
|
|
1,458.1 |
|
|
|
1,152.2 |
|
|
|
949.4 |
|
Unallocated, including cash |
|
|
378.9 |
|
|
|
560.6 |
|
|
|
686.9 |
|
|
|
$ |
3,978.4 |
|
|
$ |
3,851.5 |
|
|
$ |
3,390.7 |
|
Depreciation and amortization: |
|
|
|
|
|
|
|
|
|
|||
Manufacturing |
|
$ |
60.3 |
|
|
$ |
61.7 |
|
|
$ |
67.8 |
|
Maintenance Services |
|
|
10.5 |
|
|
|
10.7 |
|
|
|
12.0 |
|
Leasing & Management Services |
|
|
35.5 |
|
|
|
29.6 |
|
|
|
20.9 |
|
|
|
$ |
106.3 |
|
|
$ |
102.0 |
|
|
$ |
100.7 |
|
Capital expenditures: |
|
|
|
|
|
|
|
|
|
|||
Manufacturing |
|
$ |
71.9 |
|
|
$ |
48.3 |
|
|
$ |
26.6 |
|
Maintenance Services |
|
|
17.3 |
|
|
|
9.2 |
|
|
|
8.6 |
|
Leasing & Management Services |
|
|
272.9 |
|
|
|
323.2 |
|
|
|
103.8 |
|
|
|
$ |
362.1 |
|
|
$ |
380.7 |
|
|
$ |
139.0 |
|
|
|
|
|
|
|
|
|
|
|
|||
The following table summarizes selected geographic information.
|
|
Year Ended August 31, |
|
|||||||||
(In millions) |
|
2023 |
|
|
2022 |
|
|
2021 |
|
|||
Revenue 1: |
|
|
|
|
|
|
|
|
|
|||
U.S. |
|
$ |
3,235.3 |
|
|
$ |
2,452.1 |
|
|
$ |
1,221.4 |
|
Foreign |
|
|
708.7 |
|
|
|
525.6 |
|
|
|
526.5 |
|
|
|
$ |
3,944.0 |
|
|
$ |
2,977.7 |
|
|
$ |
1,747.9 |
|
Assets: |
|
|
|
|
|
|
|
|
|
|||
U.S. |
|
$ |
2,593.4 |
|
|
$ |
2,689.6 |
|
|
$ |
2,506.1 |
|
Mexico |
|
|
1,084.3 |
|
|
|
948.4 |
|
|
|
656.6 |
|
Europe |
|
|
300.7 |
|
|
|
213.5 |
|
|
|
228.0 |
|
|
|
$ |
3,978.4 |
|
|
$ |
3,851.5 |
|
|
$ |
3,390.7 |
|
|
|
|
|
|
|
|
|
|
|
|||
1 Revenue is presented on the basis of geographic location of customers.
Reconciliation of Earnings from operations to Earnings (loss) before income tax and earnings from unconsolidated affiliates:
|
|
Year Ended August 31, |
|
|||||||||
(In millions) |
|
2023 |
|
|
2022 |
|
|
2021 |
|
|||
Earnings from operations |
|
$ |
176.4 |
|
|
$ |
118.0 |
|
|
$ |
41.0 |
|
Interest and foreign exchange |
|
|
85.4 |
|
|
|
57.4 |
|
|
|
43.3 |
|
Net loss on extinguishment of debt |
|
|
— |
|
|
|
— |
|
|
|
6.3 |
|
Earnings (loss) before income tax and earnings from |
|
$ |
91.0 |
|
|
$ |
60.6 |
|
|
$ |
(8.6 |
) |
|
|
|
|
|
|
|
|
|
|
|||
76
Note 20 — Customer Concentration
Customer concentration is defined as a single customer that accounts for more than 10% of total revenues or accounts receivable. In 2023, revenue from two customers represented 21% and 10% of total revenue. In 2022, revenue from three customers each represented 16%, 12% and 11% of total revenue. In 2021, revenue from two customers each represented 13% of total revenue. No other customers accounted for more than 10% of total revenues for the years ended August 31, 2023, 2022, or 2021. No customer had a balance that individually equaled or exceeded 10% of accounts receivable at August 31, 2023. One customer had a balance that represented 12% of the consolidated accounts receivable balance at August 31, 2022.
Note 21 — Lease Commitments
Lessor
Equipment on operating leases is reported net of accumulated depreciation of $68.0 million, $48.6 million and $34.4 million as of August 31, 2023, 2022, and 2021, respectively. Depreciation expense was $26.0 million, $22.0 million and $13.8 million as of August 31, 2023, 2022, and 2021 respectively. In addition, certain railcar equipment leased-in by the Company on operating leases is subleased to customers under non-cancelable operating leases with lease terms ranging from one to thirteen years. Operating lease rental revenues included in the Company’s Consolidated Statements of Income as of August 31, 2023, 2022, and 2021 was $91.9 million, $66.8 million and $69.4 million respectively, which included $19.3 million, $18.1 million, and $17.1 million respectively, of revenue as a result of daily, monthly or car hire utilization arrangements.
Aggregate minimum future amounts receivable under all non-cancelable operating leases and subleases at August 31, 2023, will mature as follows:
(In millions) |
|
|
|
|
2024 |
|
$ |
73.8 |
|
2025 |
|
|
66.2 |
|
2026 |
|
|
59.4 |
|
2027 |
|
|
52.1 |
|
2028 |
|
|
37.6 |
|
Thereafter |
|
|
81.8 |
|
|
|
$ |
370.9 |
|
|
|
|
|
|
Lessee
The Company leases railcars, real estate, and certain equipment under operating and, to a lesser extent, finance lease arrangements. As of and for the twelve months ended August 31, 2023, 2022, and 2021, finance leases were not a material component of the Company's lease portfolio. The Company’s real estate and equipment leases have remaining lease terms ranging from less than one year to 75 years, with some including options to extend up to 8 years. The Company recognizes a lease liability and corresponding right-of-use (ROU) asset based on the present value of lease payments. To determine the present value of lease payments, as most of its leases do not provide a readily determinable implicit rate, the Company’s incremental borrowing rate is used to discount the lease payments based on information available at the lease commencement date. The Company gives consideration to its recent debt issuances as well as publicly available data for instruments with similar characteristics when estimating its incremental borrowing rate.
The components of operating lease costs were as follows:
|
|
Twelve Months Ended August 31, |
|
|||||||||
(In millions) |
|
2023 |
|
|
2022 |
|
|
2021 |
|
|||
Operating lease expense |
|
$ |
13.6 |
|
|
$ |
10.7 |
|
|
$ |
13.2 |
|
Short-term lease expense |
|
|
9.3 |
|
|
|
6.0 |
|
|
|
5.3 |
|
Total |
|
$ |
22.9 |
|
|
$ |
16.7 |
|
|
$ |
18.5 |
|
77
Aggregate minimum future amounts payable under operating leases having initial or remaining non-cancelable terms at August 31, 2023 will mature as follows:
(In millions) |
|
|
|
|
2024 |
|
$ |
15.6 |
|
2025 |
|
|
12.9 |
|
2026 |
|
|
11.6 |
|
2027 |
|
|
8.7 |
|
2028 |
|
|
7.9 |
|
Thereafter |
|
|
23.3 |
|
Total lease payments |
|
$ |
80.0 |
|
Less: Imputed interest |
|
|
(7.8 |
) |
Total lease obligations |
|
$ |
72.2 |
|
|
|
|
|
|
The table below presents additional information related to the Company’s leases:
Weighted average remaining lease term |
|
|
|
|
Operating leases |
|
10.55 years |
|
|
Weighted average discount rate |
|
|
|
|
Operating leases |
|
|
2.5 |
% |
Supplemental cash flow information related to leases were as follows:
(In millions) |
|
Twelve months ended August 31, 2023 |
|
|
Cash paid for amounts included in the measurement of lease liabilities |
|
|
|
|
Operating cash flows from operating leases |
|
$ |
14.2 |
|
ROU assets obtained in exchange for new operating lease liabilities |
|
$ |
27.5 |
|
78
Note 22 — Commitments and Contingencies
Portland Harbor Superfund Site
The Company’s former Portland, Oregon manufacturing facility (the Portland Property) is located adjacent to the Willamette River. In December 2000, the U.S. Environmental Protection Agency (EPA) classified portions of the Willamette River bed known as the Portland Harbor, including the portion fronting the Company’s manufacturing facility, as a federal "National Priority List" or "Superfund" site due to sediment contamination (the Portland Harbor Site). The Company and more than 140 other parties have received a "General Notice" of potential liability from the EPA relating to the Portland Harbor Site. The letter advised the Company that it may be liable for the costs of investigation and remediation (which liability may be joint and several with other potentially responsible parties) as well as for natural resource damages resulting from releases of hazardous substances to the site. Ten private and public entities, including the Company (the Lower Willamette Group or LWG), signed an Administrative Order on Consent (AOC) to perform a remedial investigation/feasibility study (RI/FS) of the Portland Harbor Site under EPA oversight, and several additional entities did not sign such consent, but nevertheless contributed financially to the effort. The EPA-mandated RI/FS was produced by the LWG and cost over $110 million during a 17-year period. The Company bore a percentage of the total costs incurred by the LWG in connection with the investigation. The Company’s aggregate expenditure during the 17-year period was not material. Some or all of any such outlay may be recoverable from other responsible parties. The EPA issued its Record of Decision (ROD) for the Portland Harbor Site on January 6, 2017 and accordingly on October 26, 2017, the AOC was terminated.
Separate from the process described above, which focused on the type of remediation to be performed at the Portland Harbor Site and the schedule for such remediation, 96 parties, including the State of Oregon and the federal government, are participating in a non-judicial, mediated allocation process to try to allocate costs associated with remediation of the Portland Harbor Site. The Company will continue to participate in the allocation process. Approximately 110 additional parties signed tolling agreements related to such allocations. On April 23, 2009, the Company and the other AOC signatories filed suit against 69 other parties due to a possible limitations period for some such claims; Arkema Inc. et al v. A & C Foundry Products, Inc. et al, U.S. District Court, District of Oregon, Case #3:09-cv-453-PK. All but 12 of these parties elected to sign tolling agreements and be dismissed without prejudice, and the case has been stayed by the court until January 14, 2025.
The EPA's January 6, 2017 ROD identifies a clean-up remedy that the EPA estimates will take 13 years of active remediation, followed by 30 years of monitoring with an estimated undiscounted cost of $1.7 billion. The EPA typically expects its cost estimates to be accurate within a range of -30% to +50%, but this ROD states that changes in costs are likely to occur. The EPA has identified several Sediment Decision Units within the ROD cleanup area. One of the units, RM9W, includes the nearshore area of the river sediments offshore of the Portland Property as well as downstream of the facility. It also includes a portion of the Portland Property's riverbank. The ROD does not break down total remediation costs by Sediment Decision Unit. The EPA requested that potentially responsible parties enter AOCs during 2019 agreeing to conduct remedial design studies. Some parties have signed AOCs, including one party with respect to RM9W which includes the area offshore of the Portland Property. The Company has not signed an AOC in connection with remedial design, but is assisting in funding a portion of the RM9W remedial design.
The ROD does not address responsibility for the costs of clean-up, nor does it allocate such costs among the potentially responsible parties. Responsibility for funding and implementing the EPA's selected cleanup remedy will be determined at an unspecified later date. Based on the investigation to date, the Company believes that it did not contribute in any material way to contaminants of concern in the river sediments or the damage of natural resources in the Portland Harbor Site and that the damage in the area of the Portland Harbor Site adjacent to the Portland Property precedes the Company’s ownership of the Portland Property. Because these environmental investigations are still underway, sufficient information is currently not available to determine the Company’s liability, if any, for the cost of any required remediation or restoration of the Portland Harbor Site or to estimate a range of potential loss. Based on the results of the pending investigations and future assessments of natural resource damages, the Company may be required to incur costs associated with additional phases of investigation or remedial action, and may be liable for damages to natural resources.
79
On January 30, 2017 the Confederated Tribes and Bands of Yakama Nation sued 33 parties including the Company as well as the federal government and the State of Oregon for costs it incurred in assessing alleged natural resource damages to the Columbia River from contaminants deposited in Portland Harbor. Confederated Tribes and Bands of the Yakama Nation v. Air Liquide America Corp., et al., U.S. Court for the District of Oregon Case No. 3i17-CV-00164-SB. The complaint does not specify the amount of damages the plaintiff will seek. The case has been stayed until January 14, 2025.
Oregon Department of Environmental Quality (DEQ) Regulation of Portland Property
The Company entered into a Voluntary Cleanup Agreement with the Oregon Department of Environmental Quality (DEQ) in which the Company agreed to conduct an investigation of whether, and to what extent, past or present operations at the Portland Property may have released hazardous substances into the environment. The Company has also signed an Order on Consent with the DEQ to finalize the investigation of potential onsite sources of contamination that may have a release pathway to the Willamette River. The Company’s aggregate expenditure has not been material, however it could incur significant expenses for remediation. Some or all of any such outlay may be recoverable from other responsible parties.
Sale of Portland Property
The Company sold the Portland Property in May 2023, but remains potentially liable with respect to the above matters. Any of these matters could adversely affect the Company's business and Consolidated Financial Statements. However, any contamination or exacerbation of contamination that occurs after the sale of the property will be the liability of the current and future owners and operators of the Portland Property.
Other Litigation, Commitments and Contingencies
From time to time, Greenbrier is involved as a defendant in litigation in the ordinary course of business, the outcomes of which cannot be predicted with certainty. While the ultimate outcome of such legal proceedings cannot be determined at this time, the Company believes that the resolution of pending litigation will not have a material adverse effect on the Company's Consolidated Financial Statements.
As of August 31, 2023, the Company had outstanding letters of credit aggregating to $4.9 million associated with performance guarantees, facility leases and workers compensation insurance.
Note 23 – Fair Value Measures
Certain assets and liabilities are reported at fair value on either a recurring or nonrecurring basis. Fair value, for this disclosure, is defined as an exit price, representing the amount that would be received to sell an asset or paid to transfer a liability in an orderly transaction between market participants, under a three-tier fair value hierarchy which prioritizes the inputs used in measuring a fair value as follows:
Level 1 - observable inputs such as unadjusted quoted prices in active markets for identical instruments;
Level 2 - inputs, other than the quoted market prices in active markets for similar instruments, which are observable, either directly or indirectly; and
Level 3 - unobservable inputs for which there is little or no market data available, which require the reporting entity to develop its own assumptions.
Assets and liabilities measured at fair value on a recurring basis as of August 31, 2023 are:
(In millions) |
|
Total |
|
|
Level 1 |
|
|
Level 2(1) |
|
|
Level 3 |
|
||||
Assets: |
|
|
|
|
|
|
|
|
|
|
|
|
||||
Derivative financial instruments |
|
$ |
37.9 |
|
|
$ |
— |
|
|
$ |
37.9 |
|
|
$ |
— |
|
Nonqualified savings plan investments |
|
|
47.7 |
|
|
|
47.7 |
|
|
|
— |
|
|
|
— |
|
Cash equivalents |
|
|
51.2 |
|
|
|
51.2 |
|
|
|
— |
|
|
|
— |
|
|
|
$ |
136.8 |
|
|
$ |
98.9 |
|
|
$ |
37.9 |
|
|
$ |
— |
|
Liabilities: |
|
|
|
|
|
|
|
|
|
|
|
|
||||
Derivative financial instruments |
|
$ |
0.2 |
|
|
$ |
— |
|
|
$ |
0.2 |
|
|
$ |
— |
|
|
|
|
|
|
|
|
|
|
0 |
|
|
|
|
|||
80
Assets and liabilities measured at fair value on a recurring basis as of August 31, 2022 are:
(In millions) |
|
Total |
|
|
Level 1 |
|
|
Level 2(1) |
|
|
Level 3 |
|
||||
Assets: |
|
|
|
|
|
|
|
|
|
|
|
|
||||
Derivative financial instruments |
|
$ |
21.4 |
|
|
$ |
— |
|
|
$ |
21.4 |
|
|
$ |
— |
|
Nonqualified savings plan investments |
|
|
40.3 |
|
|
|
40.3 |
|
|
|
— |
|
|
|
— |
|
Cash equivalents |
|
|
119.4 |
|
|
|
119.4 |
|
|
|
— |
|
|
|
— |
|
|
|
$ |
181.1 |
|
|
$ |
159.7 |
|
|
$ |
21.4 |
|
|
$ |
— |
|
Liabilities: |
|
|
|
|
|
|
|
|
|
|
|
|
||||
Derivative financial instruments |
|
$ |
3.0 |
|
|
$ |
— |
|
|
$ |
3.0 |
|
|
$ |
— |
|
|
|
|
|
|
|
|
|
|
|
|
|
|
||||
1 Level 2 assets include derivative financial instruments which are valued based on significant observable inputs. See Note 14 - Derivative Instruments for further discussion.
Note 24 – Fair Value of Financial Instruments
The estimated fair values of financial instruments and the methods and assumptions used to estimate such fair values are as follows:
(In millions) |
|
Carrying |
|
|
Estimated |
|
||
Notes payable as of August 31, 2023 |
|
$ |
1,328.1 |
|
|
$ |
1,314.3 |
|
Notes payable as of August 31, 2022 |
|
$ |
1,289.0 |
|
|
$ |
1,231.2 |
|
1 Carrying amount disclosed in this table excludes other notes payable and debt discount and issuance costs.
The carrying amount of cash and cash equivalents, accounts receivable, revolving notes and accounts payable and accrued liabilities is a reasonable estimate of fair value of these financial instruments. Estimated rates currently available to the Company for debt with similar terms and remaining maturities and current market data are used to estimate the fair value of notes payable.
81
Item 9. CHANGES IN AND DISAGREEMENTS WITH ACCOUNTANTS ON ACCOUNTING AND FINANCIAL DISCLOSURE
None.
Item 9A. CONTROLS AND PROCEDURES
Evaluation of Disclosure Controls and Procedures
Our management has evaluated, under the supervision and with the participation of our Principal Executive Officer and Principal Financial Officer, the effectiveness of our disclosure controls and procedures (as defined in Rule 13a-15(e) and 15d-15(e) under the Securities Act of 1934, as amended (the Exchange Act)) as of the end of the period covered by this report. Based on that evaluation, our Principal Executive Officer and Principal Financial Officer have concluded that, as of the end of the period covered by this report, our disclosure controls and procedures were not effective at the reasonable assurance level, due to the material weakness in internal control over financial reporting, described below, in ensuring that information required to be disclosed in our Exchange Act reports is (1) recorded, processed, summarized and reported in a timely manner, and (2) accumulated and communicated to our management, including our Principal Executive Officer and Principal Financial Officer to allow timely decisions regarding required disclosure.
In light of the material weakness described below, management performed additional analysis and other procedures to ensure that our consolidated financial statements were prepared in accordance with accounting principles generally accepted in the United States of America (U.S. GAAP). Accordingly, management believes that the consolidated financial statements included in this Annual Report on Form 10-K fairly present, in all material respects, our financial position, results of operations, and cash flows as of and for the periods presented, in accordance with U.S. GAAP.
Management’s Report on Internal Control over Financial Reporting
Management is responsible for establishing and maintaining adequate internal control over financial reporting as defined in Rules 13a-15(f) and 15d-15(f) of the Exchange Act. Our internal control over financial reporting is a process designed under the supervision of our Principal Executive Officer and Principal Financial Officer to provide reasonable assurance regarding the reliability of financial reporting and the preparation of our financial statements for external reporting purposes in accordance with U.S. GAAP.
Management, under the oversight of the Audit Committee, conducted an assessment of the effectiveness of our internal control over financial reporting based on the framework established in Internal Control — Integrated Framework (2013) issued by the Committee of Sponsoring Organizations of the Treadway Commission. Based on this assessment, management has determined that our internal control over financial reporting was not effective as of August 31, 2023 because of a material weakness. Specifically, the Company did not effectively design and maintain controls over information technology (IT) general controls in one IT environment in our primary North America manufacturing businesses that are relevant to the preparation of our consolidated financial statements. We did not (i) maintain change management controls to ensure configuration data changes affecting the IT application were appropriate (ii) design and maintain program development controls to ensure the data migration, program testing and approval of new software development is aligned with business and IT requirements and (iii) maintain user access controls to ensure segregation of duties in our financial application. The control deficiencies resulted from incomplete risk assessment, inadequate training of personnel and ineffective control activities related primarily to the implementation of a new ERP system in our primary North America manufacturing businesses. As a result, process level automated controls that are dependent on the affected IT environment and manual controls that rely on system-generated data or reports from the affected IT environment were ineffective because they could have been adversely impacted.
The control deficiencies did not result in any material misstatements to the Consolidated Financial Statements and there were no changes to previously released financial results as a result of this material weakness. However, the control deficiencies described above created a reasonable possibility that a material misstatement to the Consolidated Financial Statements would not be prevented or detected on a timely basis. Therefore, we concluded that the deficiencies represent a material weakness in the Company’s internal control over financial reporting.
82
Our independent registered public accounting firm, KPMG LLP, who audited the Consolidated Financial Statements included in this Annual Report on Form 10-K issued an adverse opinion on the effectiveness of the Company’s internal control over financial reporting, which is included at the end of Part II, Item 9A of this Form 10-K.
Remediation Plans
The Company’s management, under the oversight of the Audit Committee, is in the process of designing controls to ensure that control deficiencies contributing to the material weakness are remediated, such that these controls are designed, implemented, and operating effectively. These remediation actions are ongoing and include or are expected to include:
As we continue to evaluate and enhance our internal control over financial reporting, we may determine that additional measures to address the material weaknesses or adjustments to the remediation plan may be required. Once controls are designed and implemented, the controls must be operating effectively for a sufficient period of time and be tested by management in order to consider them remediated and conclude that the design is effective to address the risks of material misstatement.
Changes in Internal Control Over Financial Reporting
During 2023, we began to implement in stages a new ERP system at our primary North America manufacturing and services businesses. Each implementation will impact our internal control over financial reporting. Except for the system implementation and the identification of the material weakness described above, there have been no changes in our internal control over financial reporting during the quarter ended August 31, 2023 that have materially affected, or are reasonably likely to materially affect, the Company’s internal control over financial reporting.
Inherent Limitations of Internal Controls
Our management, including the Principal Executive Officer and Principal Financial Officer, does not expect that our disclosure controls and procedures or our internal control over financial reporting will prevent or detect all error and all fraud. A control system, no matter how well designed and operated, can provide only reasonable, not absolute, assurance that the control system’s objectives will be met. Further, because of the inherent limitations in all control systems, no evaluation of controls can provide absolute assurance that misstatements due to error or fraud will not occur or that all control issues and instances of fraud, if any, within our company have been detected. These inherent limitations include the realities that judgments in decision-making can be faulty and that breakdowns can occur because of simple error or mistake. The design of any system of controls is based in part on certain assumptions about the likelihood of future events, and there can be no assurance that any design will succeed in achieving its stated goals under all potential future conditions. Projections of any evaluation of controls effectiveness to future periods are subject to risks. Over time, controls may become inadequate because of changes in conditions or deterioration in the degree of compliance with policies or procedures.
83
Report of Independent Registered Public Accounting Firm
To the Stockholders and Board of Directors
The Greenbrier Companies, Inc.:
Opinion on Internal Control Over Financial Reporting
We have audited The Greenbrier Companies, Inc. and subsidiaries' (the Company) internal control over financial reporting as of August 31, 2023, based on criteria established in Internal Control – Integrated Framework (2013) issued by the Committee of Sponsoring Organizations of the Treadway Commission. In our opinion, because of the effect of the material weakness, described below, on the achievement of the objectives of the control criteria, the Company has not maintained effective internal control over financial reporting as of August 31, 2023, based on criteria established in Internal Control – Integrated Framework (2013) issued by the Committee of Sponsoring Organizations of the Treadway Commission.
We also have audited, in accordance with the standards of the Public Company Accounting Oversight Board (United States) (PCAOB), the consolidated balance sheets of the Company as of August 31, 2023 and 2022, the related consolidated statements of income, comprehensive income, equity, and cash flows for each of the years in the three-year period ended August 31, 2023, and the related notes (collectively, the consolidated financial statements), and our report dated October 25, 2023 expressed an unqualified opinion on those consolidated financial statements.
A material weakness is a deficiency, or a combination of deficiencies, in internal control over financial reporting, such that there is a reasonable possibility that a material misstatement of the company’s annual or interim financial statements will not be prevented or detected on a timely basis. The following material weakness was identified and included in management’s assessment. The Company did not effectively design and maintain controls over information technology (IT) general controls in one IT environment in the Company’s primary North America manufacturing businesses that are relevant to the preparation of its consolidated financial statements. The Company did not (i) maintain change management controls to ensure configuration data changes affecting the IT application were appropriate (ii) design and maintain program development controls to ensure the data migration, program testing and approval of new software development is aligned with business and IT requirements and (iii) maintain user access controls to ensure segregation of duties in the Company’s financial application. The control deficiencies resulted from incomplete risk assessment, inadequate training of personnel and ineffective control activities related primarily to the implementation of a new ERP system in the Company’s primary North America manufacturing businesses. As a result, process level automated controls that are dependent on the affected IT environment and manual controls that rely on system-generated data or reports from the affected IT environment were ineffective because they could have been adversely impacted. The material weakness was considered in determining the nature, timing, and extent of audit tests applied in our audit of the 2023 consolidated financial statements, and this report does not affect our report on those consolidated financial statements.
Basis for Opinion
The Company’s management is responsible for maintaining effective internal control over financial reporting and for its assessment of the effectiveness of internal control over financial reporting, included in the accompanying Management's Report on Internal Control over Financial Reporting. Our responsibility is to express an opinion on the Company’s internal control over financial reporting based on our audit. We are a public accounting firm registered with the PCAOB and are required to be independent with respect to the Company in accordance with the U.S. federal securities laws and the applicable rules and regulations of the Securities and Exchange Commission and the PCAOB.
We conducted our audit in accordance with the standards of the PCAOB. Those standards require that we plan and perform the audit to obtain reasonable assurance about whether effective internal control over financial reporting was maintained in all material respects. Our audit of internal control over financial reporting included obtaining an understanding of internal control over financial reporting, assessing the risk that a material weakness exists, and testing and evaluating the design and operating effectiveness of internal control based on the assessed risk. Our audit also included performing such other procedures as we considered necessary in the circumstances. We believe that our audit provides a reasonable basis for our opinion.
84
Definition and Limitations of Internal Control Over Financial Reporting
A company’s internal control over financial reporting is a process designed to provide reasonable assurance regarding the reliability of financial reporting and the preparation of financial statements for external purposes in accordance with generally accepted accounting principles. A company’s internal control over financial reporting includes those policies and procedures that (1) pertain to the maintenance of records that, in reasonable detail, accurately and fairly reflect the transactions and dispositions of the assets of the company; (2) provide reasonable assurance that transactions are recorded as necessary to permit preparation of financial statements in accordance with generally accepted accounting principles, and that receipts and expenditures of the company are being made only in accordance with authorizations of management and directors of the company; and (3) provide reasonable assurance regarding prevention or timely detection of unauthorized acquisition, use, or disposition of the company’s assets that could have a material effect on the financial statements.
Because of its inherent limitations, internal control over financial reporting may not prevent or detect misstatements. Also, projections of any evaluation of effectiveness to future periods are subject to the risk that controls may become inadequate because of changes in conditions, or that the degree of compliance with the policies or procedures may deteriorate.
/s/ KPMG LLP
Portland, Oregon
October 25, 2023
85
Item 9B. OTHER INFORMATION
None
Item 9C. DISCLOSURE REGARDING FOREIGN JURISDICTIONS THAT PREVENT INSPECTIONS
Not Applicable
PART III
Item 10. DIRECTORS AND EXECUTIVE OFFICERS AND CORPORATE GOVERNANCE
Information required by this item will be included under the captions “Board Composition”, “Board Committees, Meetings and Charters” and “Our Code of Business Conduct and Ethics and FCPA Compliance” in our definitive Proxy Statement on Schedule 14A for the 2024 Annual Meeting of Shareholders to be filed with the Securities and Exchange Commission within 120 days after the year ended August 31, 2023 (as amended, updated, supplemented, or restated, “2024 Proxy Statement”) and is incorporated herein by reference. Information required by this item regarding the executive officers of the Company and family relationships is included under the caption “Information about our Executive Officers” in Part I of this 10-K and is incorporated herein by reference.
Item 11. EXECUTIVE COMPENSATION
The information required by this item will be included under the caption “2023 Executive Compensation”, “Compensation Committee Report”, “2023 Non-Employee Director Compensation” and “Risk Oversight” in the 2024 Proxy Statement and is incorporated herein by reference.
Item 12. SECURITY OWNERSHIP OF CERTAIN BENEFICIAL OWNERS AND MANAGEMENT AND RELATED STOCKHOLDERS MATTERS
The information required by this item will be included under the captions “Stock Ownership of Certain Beneficial Owners and Management” and “Equity Compensation Plan Information” in the 2024 Proxy Statement and is incorporated herein by reference.
The information required by this item will be included under the captions “Related Person Transactions” and “Board Independence” in the 2024 Proxy Statement and is incorporated herein by reference.
Item 14. PRINCIPAL ACCOUNTING FEES AND SERVICES
Our independent registered public accounting firm is KPMG LLP, Portland, OR, Auditor Firm ID: 185.
The information required by this item will be included under the caption “Ratification of Appointment of Independent Auditors” in the 2024 Proxy Statement and is incorporated herein by reference.
86
PART IV
Item 15. EXHIBITS AND FINANCIAL STATEMENT SCHEDULES
(1) Financial Statements
See Consolidated Financial Statements in Item 8
(a) (2) Financial Statements Schedule**
* * All other schedules have been omitted because they are inapplicable, not required or because the information is given in the Consolidated Financial Statements or notes thereto. This supplemental schedule should be read in conjunction with the Consolidated Financial Statements and notes thereto included in this report.
(a) |
(3) |
The following exhibits are filed herewith and this list is intended to constitute the exhibit index: |
|
|
|
|
3.1 |
|
|
|
|
|
3.2 |
|
|
|
|
|
3.3 |
|
|
|
|
|
4.1 |
|
|
|
|
|
4.2 |
|
|
|
|
|
4.3 |
|
|
|
|
|
4.4 |
|
|
|
|
|
4.5 |
|
|
|
|
|
10.1* |
|
|
|
|
|
10.2* |
|
|
|
|
87
|
|
|
|
10.3* |
|
|
|
|
|
10.4* |
|
|
|
|
|
10.5* |
|
|
|
|
|
10.6* |
|
|
|
|
|
10.7* |
Stock Incentive Grant Program for Non-Employee Directors under the 2021 Stock Incentive Plan. |
|
|
|
|
10.8* |
|
|
|
|
|
10.9* |
|
|
|
|
|
10.10* |
|
|
|
|
|
10.11* |
|
|
|
|
|
10.12* |
|
|
|
|
|
10.13* |
|
|
|
|
|
10.14* |
|
|
|
|
|
10.15* |
|
|
|
|
|
10.16* |
|
|
|
|
88
|
10.17* |
|
|
|
|
|
10.18* |
|
|
|
|
|
10.19 |
|
|
|
|
|
10.20
|
|
|
|
|
|
10.21 |
|
|
|
|
|
10.22 |
|
|
|
|
|
10.23 |
|
|
|
|
|
10.24
|
|
|
|
|
|
10.25 |
|
|
|
|
89
|
10.26 |
|
|
|
|
|
10.27 |
|
|
|
|
|
10.28 |
|
|
|
|
|
10.29 |
|
|
|
|
|
10.30 |
|
|
|
|
|
10.31* |
|
|
|
|
|
10.32* |
|
|
|
|
|
10.33 |
|
|
|
|
|
10.34 |
|
|
|
|
|
10.35 |
|
|
|
|
|
10.36 |
|
|
|
|
|
10.37 |
90
|
|
|
|
21.1 |
|
|
|
|
|
23.1 |
|
|
|
|
|
31.1 |
|
|
|
|
|
31.2 |
|
|
|
|
|
32.1 |
|
|
|
|
|
32.2 |
|
|
|
|
|
101.INS |
Inline XBRL Instance Document. |
|
|
|
|
101.SCH |
Inline XBRL Taxonomy Extension Schema Document. |
|
|
|
|
101.CAL |
Inline XBRL Taxonomy Extension Calculation Linkbase Document. |
|
|
|
|
101.DEF |
Inline XBRL Taxonomy Extension Definition Linkbase Document. |
|
|
|
|
101.LAB |
Inline XBRL Taxonomy Extension Label Linkbase Document. |
|
|
|
|
101.PRE |
Inline XBRL Taxonomy Extension Presentation Linkbase Document. |
|
|
|
|
104 |
Cover Page Interactive Data File (Formatted as inline XBRL and contained in Exhibit 101). |
|
|
|
* Management contract or compensatory plan or arrangement
Note: For all exhibits incorporated by reference, unless otherwise noted above, the SEC file number is 001-13146.
Item 16. FORM 10-K SUMMARY Pursuant to the requirements of Section 13 or 15(d) of the Securities and Exchange Act of 1934, the Registrant has duly caused this report to be signed on its behalf by the undersigned, thereunto duly authorized.
None.
91
SIGNATURES
THE GREENBRIER COMPANIES, INC.
Dated: October 25, 2023 |
By: /s/ Lorie L. Tekorius |
|
Lorie L. Tekorius |
|
Chief Executive Officer (Principal Executive Officer) |
Pursuant to the requirements of the Securities Exchange Act of 1934, this report has been signed below by the following persons on behalf of the Registrant and in the capacities and on the dates indicated.
Signature |
|
Date |
/s/ Lorie L. Tekorius |
October 25, 2023 |
Lorie Tekorius, President, |
|
Chief Executive Officer and Director |
|
/s/ Thomas B. Fargo |
October 25, 2023 |
Thomas B. Fargo, Chair of the Board |
|
/s/ Wanda F. Felton |
October 25, 2023 |
Wanda F. Felton, Director |
|
/s/ William A. Furman |
October 25, 2023 |
William A. Furman, Director |
|
/s/ Antonio Garza |
October 25, 2023 |
Antonio Garza, Director |
|
/s/ James R. Huffines |
October 25, 2023 |
James R. Huffines, Director |
|
/s/ Graeme A. Jack |
October 25, 2023 |
Graeme A. Jack, Director |
|
/s/ Patrick J. Ottensmeyer |
October 25, 2023 |
Patrick J. Ottensmeyer, Director |
|
/s/ Charles J. Swindells |
October 25, 2023 |
Charles J. Swindells, Director |
|
/s/ Wendy L. Teramoto |
October 25, 2023 |
Wendy L. Teramoto, Director |
|
/s/ Kelly M. Williams |
October 25, 2023 |
Kelly M. Williams, Director |
|
/s/ Adrian J. Downes |
October 25, 2023 |
Adrian J. Downes, Senior Vice President,
Chief Financial Officer (Principal Financial Officer)
/s/ Matthew J. Meyer |
October 25, 2023 |
|
Matthew J. Meyer, Senior Vice President, Chief Accounting Officer (Principal Accounting Officer) |
|
92
Exhibit 10.7
THE GREENBRIER COMPANIES, INC.
STOCK INCENTIVE GRANT PROGRAM FOR NON-EMPLOYEE DIRECTORS UNDER THE 2021 STOCK INCENTIVE PLAN
The following provisions set forth the terms of the Stock Incentive Grant Program (the "Program") for non-employee directors of The Greenbrier Companies, Inc. (the "Company") under the Company's 2021 Stock Incentive Plan (the "Plan"). In the event of any inconsistency between the terms contained in the Program and in the Plan, the Plan shall govern. All capitalized terms that are not defined in the Program have the meanings set forth in the Plan.
Section 1. Eligibility. Each member of the Board elected to the Board who is not otherwise an employee or officer of the Company or any Related Company (an "Eligible Director") shall be eligible to receive Awards as set forth in the Program, subject to the terms of the Program.
Section 2. Stock Incentive Grants
2.1 Initial Awards. Upon an Eligible Director's initial election to the Board as an Eligible Director, the Eligible Director shall automatically receive an award of Restricted Stock Units (the "Initial Award"). The Grant Date for an Initial Award to an Eligible Director is the date of that director’s first election to the Board. If such initial election occurs at an annual meeting of shareholders, the Initial Award shall be for a number of shares of Common Stock calculated by dividing $160,000 by the average closing price for the 30 trading days immediately preceding the Grant Date and rounding up to the nearest whole share. If such initial election occurs on another date, the Initial Award shall be for a number of shares of Common Stock calculated by dividing $160,000 by the average closing price for the 30 trading days immediately preceding the Grant Date and multiplying the resulting quotient by a fraction, the numerator of which is the difference obtained by subtracting from twelve the number of whole calendar months that elapse from the date such person first becomes an Eligible Director through the date of the first Annual Award (as defined below) immediately following the date he or she first becomes an Eligible Director and the denominator of which is twelve, and rounding up to the nearest whole share. A director who is also an employee of the Company or a Related Company but who subsequently ceases such employment status but remains a director shall not be eligible for an Initial Award.
2.2 Annual Awards. Immediately following each annual meeting of shareholders, each Eligible Director shall automatically receive an award of Restricted Stock Units for a number of shares of Common Stock calculated by dividing $160,000 by the average closing price for the 30 trading days immediately preceding the Grant Date and rounding up to the nearest whole share (the "Annual Award"). The Grant Date of an Annual Award will be the date of such annual meeting.
2.3 Vesting and Payment. Each Initial Award and Annual Award shall vest and become payable with respect to 100% of the shares of Common Stock subject to such Award on the earlier of (a) the one-year anniversary of the Grant Date and (b) the next annual meeting of shareholders that occurs prior to such one-year anniversary, but at least 50 weeks after the prior year’s annual meeting of shareholders. One share of Common Stock will be issuable for each Restricted Stock Unit that vests and becomes payable. As soon as practicable after vesting of an Award, the Company will settle the vested Restricted Stock Units by issuing to the Eligible Director one share of Common Stock for each vested Restricted Stock Unit. The Company will issue the shares of Common Stock by registering the shares of Common Stock in book entry form with the Company's transfer agent in the name of the Eligible Director and any applicable restrictions will be noted in the records of the Company's transfer agent and in the book entry system.
2.4 Termination of Service. In the event of an Eligible Director’s Termination of Service due to death, Disability or Retirement, or because such Eligible Director is not nominated or re-elected to serve an additional term as a director, any unvested portion of the Eligible Director’s Initial Award or Annual Award will become fully vested and no longer subject to forfeiture effective immediately prior to such Termination of Service. In the event of an Eligible Director’s Termination of Service due to such Eligible Director’s removal or resignation, any unvested portion of the Eligible Director’s Initial Award or Annual Award will automatically be forfeited.
2.5 Dividend Equivalent Rights. In the event that the Company pays an ordinary cash dividend on its Common Stock and the dividend record date occurs before all of the Restricted Stock Units subject to an Award held by an Eligible Director have either been settled or terminated, the Company will credit the Award with a dollar amount equal to (a) the per share cash dividend paid by the Company on its Common Stock on the dividend payment date, multiplied by (b) the total number of outstanding and unsettled Restricted Stock Units subject to the Award (including unvested Units) as of the dividend record date (the "Dividend Equivalent Rights"). Any Dividend Equivalent Rights credited shall be subject to the same vesting, payment and other terms, conditions and restrictions as the Restricted Stock Units to which they relate. The Dividend Equivalent Rights will be paid in the form of shares of the Common Stock calculated by dividing (a) the amount of the Dividend Equivalent Rights, without interest, by (b) the Fair Market Value of the Common Stock on the dividend payment date (rounded down to the nearest whole number of shares).
Section 3. Amendment, Suspension or Termination of Program. The Board may amend, suspend or terminate the Program or any portion of it at any time and in such respects as it deems advisable. Except as provided in the Plan, any such amendment, suspension or termination shall not, without the consent of the Participant, impair or diminish any rights of a Participant under an outstanding Award.
Section 4. Effective Date. The Program shall become effective on the Effective Date of the Plan and, unless sooner terminated by the Board, shall remain effective during the term of the Plan.
Section 5. Change of Control. Upon a Change in Control, all Awards outstanding and held by an Eligible Director as of the date of the Change of Control, and which are not then vested or no longer subject to forfeiture, will immediately become fully vested and no longer subject to forfeiture.
Section 6. General. Provisions of the Plan that are not discussed above, to the extent applicable to Eligible Directors, shall continue to govern the terms and conditions of Awards granted to Eligible Directors.
Exhibit 10.8
MANDATORY CLAWBACK POLICY
previously issued financial statements that is material to the previously issued financial statements, or that would result in a material misstatement if the error were corrected in the current period or left uncorrected in the current period.
required recovery under this Policy. This Policy shall not limit the rights of the Company to take any other actions or pursue other remedies that the Company may deem appropriate under the circumstances and under applicable law. To the maximum extent permitted under the Listing Rule, this Policy shall be administered in compliance with (or pursuant to an exemption from the application of) Section 409A of the Code.
ACKNOWLEDGEMENT FORM
By signing below, the undersigned acknowledges and confirms that the undersigned has received and reviewed a copy of The Greenbrier Companies, Inc. (the “Company”) Mandatory Clawback Policy (the “Policy”).
By signing this Acknowledgement Form, the undersigned acknowledges and agrees that the undersigned is and will continue to be subject to the Policy and that the Policy will apply both during and after the undersigned’s employment with the Company. Further, by signing below, the undersigned agrees to abide by the terms of the Policy, including, without limitation, by returning any Erroneously Awarded Compensation (as defined in the Policy) to the Company to the extent required by, and in a manner consistent with, the Policy. Further, by signing below, the undersigned agrees that the terms of the Policy shall govern in the event of any inconsistency between the Policy and the terms of any employment agreement to which the undersigned is a party, or the terms of any compensation plan, program or agreement under which any compensation has been granted, awarded, earned or paid.
EXECUTIVE OFFICER |
|
|
Signature |
|
|
Print Name |
|
|
Date |
Exhibit 21.1
THE GREENBRIER COMPANIES, INC.
LIST OF SUBSIDIARIES
As of August 31, 2023
|
|
|
|
|
Name |
|
State of Incorporation |
|
Names Under Which Does Business (if other than registered name) |
Alliance Castings Company, LLC |
|
DE |
|
|
Amsted-Maxion Fundição E Equipamentos Ferroviários S.A. |
|
Brazil |
|
|
Apromat S.A. |
|
Romania |
|
|
ARI Component Venture LLC |
|
DE |
|
|
Astra Rail Industries S.A. |
|
Romania |
|
|
Astra Rail Project s.r.o. |
|
Slovak Republic |
|
|
Autostack Company LLC |
|
OR |
|
|
Axis, LLC |
|
DE |
|
|
Axis Operating Company LLC |
|
DE |
|
|
Castings LLC |
|
DE |
|
|
GBX Leasing, LLC |
|
DE |
|
|
GBX Leasing 2022-1 LLC |
|
DE |
|
|
GBX Leasing 2022-1 (Canada) Ltd. |
|
Canada |
|
|
GBXL I (Canada) Ltd. |
|
Canada |
|
|
GBXL I, LLC |
|
DE |
|
|
GBXL Holdings, LLC |
|
DE |
|
|
GG Trailers, S.A. de C.V. |
|
Mexico |
|
|
GGSynergy, S.A. de C.V. |
|
Mexico |
|
|
Greenbrier-Astra Rail B.V. |
|
Netherlands |
|
|
Greenbrier Central, LLC |
|
OR |
|
|
Greenbrier – GIMSA, LLC |
|
OR |
|
|
Greenbrier do Brasil Participações Ltda. |
|
Brazil |
|
|
Greenbrier Europe B.V. |
|
Netherlands |
|
|
Greenbrier Europe Holdings, B.V. |
|
Netherlands |
|
|
Greenbrier Europe Holdings II B.V. |
|
Netherlands |
|
|
Greenbrier Europe Holdings II Subsidiary B.V. |
|
Netherlands |
|
|
Greenbrier Germany GmbH |
|
Germany |
|
|
Greenbrier Industries, S.A. de C.V. |
|
Mexico |
|
|
Greenbrier International Holdings II, LLC |
|
OR |
|
|
Greenbrier Leasing Company LLC |
|
OR |
|
Greenbrier Intermodal |
Greenbrier Leasing Europe B.V. |
|
Netherlands |
|
|
Greenbrier Leasing Ireland Limited |
|
Ireland |
|
|
Greenbrier Leasing Limited |
|
Nova Scotia, Canada |
|
|
Greenbrier Leasing Limited Partner, LLC |
|
DE |
|
|
Greenbrier Leasing, L.P. |
|
DE |
|
|
Greenbrier Management Services, LLC |
|
DE |
|
CIT Rail Services |
Greenbrier Maxion – Equipamentos e Serviços Ferroviários S.A. |
|
Brazil |
|
|
Greenbrier Maxion Funding I Ltda. |
|
Brazil |
|
|
Greenbrier Middle East Limited Company |
|
Saudi Arabia |
|
|
Greenbrier MUL Holdings I LLC |
|
OR |
|
|
Greenbrier Omaha LLC |
|
OR |
|
|
Greenbrier Rail Holdings I, LLC |
|
OR |
|
|
Greenbrier Rail Holdings II, LLC |
|
OR |
|
|
Greenbrier Rail Holdings III, LLC |
|
OR |
|
|
Greenbrier Railcar Leasing, Inc. |
|
WA |
|
|
Greenbrier Railcar LLC |
|
OR |
|
|
Greenbrier Railcar Sales Repair and Maintenance L.L.C. |
|
UAE |
|
|
Greenbrier S.A. de C.V. |
|
Mexico |
|
|
Greenbrier Tank Components, LLC |
|
OR |
|
|
Greenbrier Union Holdings I LLC |
|
OR |
|
|
Greenbrier Vagon Sanayi Ve Ticaret Limited Şirketi |
|
Turkey |
|
|
Greenbrier-Concarril, LLC |
|
DE |
|
|
Gunderson – GIMSA S.A. de C.V. |
|
Mexico |
|
|
Gunderson LLC |
|
OR |
|
|
Gunderson Rail Services LLC |
|
OR |
|
American Hydraulics GMO Parts Greenbrier Rail Services YSD Industries Greenbrier Castings |
Gunderson Specialty Products, LLC |
|
DE |
|
|
Gunderson-Concarril S.A. de C.V. |
|
Mexico |
|
|
I.C.P.V. S.A. |
|
Romania |
|
|
Meridian Rail Acquisition Corp. |
|
OR |
|
Greenbrier Rail Services |
Meridian Rail Holdings Corp. |
|
OR |
|
|
Meridian Rail Mexico City Corp. |
|
OR |
|
|
MGMS, LLC |
|
DE |
|
|
Ohio Castings Company, LLC |
|
DE |
|
|
WagonySwidnica sp. z o.o. |
|
Poland |
|
|
YSD Doors, S.A. de C.V |
|
Mexico |
|
|
Zaklad Transportu Kolejowego SIARKOPOL sp. z o.o. |
|
Poland |
|
|
Exhibit 23.1
Consent of Independent Registered Public Accounting Firm
We consent to the incorporation by reference in the registration statements (Nos. 333-187887, 333-195058, 333-223315, and 333-251916) on Form S-8 of our reports dated October 25, 2023, with respect to the consolidated financial statements of The Greenbrier Companies, Inc. and the effectiveness of internal control over financial reporting.
/s/ KPMG LLP
Portland, Oregon
October 25, 2023
Exhibit 31.1
CERTIFICATIONS
I, Lorie L. Tekorius, certify that:
Date: |
October 25, 2023 |
|
|
/s/ Lorie L. Tekorius |
|
Lorie L. Tekorius |
|
Chief Executive Officer |
|
Exhibit 31.2
CERTIFICATIONS (cont’d)
I, Adrian J. Downes, certify that:
Date: |
October 25, 2023 |
|
|
/s/ Adrian J. Downes |
|
Adrian J. Downes |
|
Senior Vice President, Chief Financial Officer |
|
(Principal Financial Officer) |
|
|
|
Exhibit 32.1
CERTIFICATION PURSUANT TO
18 U.S.C. SECTION 1350
AS ADOPTED PURSUANT TO
SECTION 906 OF THE SARBANES-OXLEY ACT OF 2002
In connection with the annual report of The Greenbrier Companies, Inc. (the Company) on Form 10-K for the annual period ended August 31, 2023 as filed with the Securities and Exchange Commission on the date therein specified (the Report), I, Lorie L. Tekorius, Chief Executive Officer of the Company, certify pursuant to 18 U.S.C. Section 1350, as adopted pursuant to Section 906 of the Sarbanes-Oxley Act of 2002, that:
Date: October 25, 2023
|
/s/ Lorie L. Tekorius |
|
|
Lorie L. Tekorius |
|
|
Chief Executive Officer |
|
Exhibit 32.2
CERTIFICATION PURSUANT TO
18 U.S.C. SECTION 1350
AS ADOPTED PURSUANT TO
SECTION 906 OF THE SARBANES-OXLEY ACT OF 2002
In connection with the annual report of The Greenbrier Companies, Inc. (the Company) on Form 10-K for the annual period ended August 31, 2023 as filed with the Securities and Exchange Commission on the date therein specified (the Report), I, Adrian J. Downes, Senior Vice President, Chief Financial Officer of the Company, certify pursuant to 18 U.S.C. Section 1350, as adopted pursuant to Section 906 of the Sarbanes-Oxley Act of 2002, that:
Date: October 25, 2023
|
/s/ Adrian J. Downes |
|
|
Adrian J. Downes |
|
|
Senior Vice President, Chief Financial Officer |
|
|
(Principal Financial Officer) |
|
|
|
|