UNITED STATES
SECURITIES AND EXCHANGE COMMISSION
WASHINGTON, DC 20549
FORM 10-Q
(Mark One)
☒ |
QUARTERLY REPORT PURSUANT TO SECTION 13 OR 15(d) OF THE SECURITIES EXCHANGE ACT OF 1934 |
For the quarterly period ended June 30, 2023
OR
☐ |
TRANSITION REPORT PURSUANT TO SECTION 13 OR 15(d) OF THE SECURITIES EXCHANGE ACT OF 1934 |
For the transition period from __________ to __________
Commission File Number: 001-40546
XOMETRY, INC.
(Exact Name of Registrant as Specified in its Charter)
Delaware |
32-0415449 |
|
(State or other jurisdiction of incorporation or organization) |
(I.R.S. Employer |
|
|
|
6116 Executive Blvd Suite 800 North Bethesda, MD |
20852 |
(Address of principal executive offices) |
(Zip Code) |
Registrant’s telephone number, including area code: (240) 335-7914
Securities registered pursuant to Section 12(b) of the Act:
Title of each class |
|
Trading Symbol(s) |
|
Name of each exchange on which registered |
Class A common stock, par value $0.000001 per share |
|
XMTR |
|
The Nasdaq Global Select Market |
Indicate by check mark whether the registrant (1) has filed all reports required to be filed by Section 13 or 15(d) of the Securities Exchange Act of 1934 during the preceding 12 months (or for such shorter period that the registrant was required to file such reports), and (2) has been subject to such filing requirements for the past 90 days. Yes ☑ No ☐
Indicate by check mark whether the registrant has submitted electronically every Interactive Data File required to be submitted pursuant to Rule 405 of Regulation S-T (§232.405 of this chapter) during the preceding 12 months (or for such shorter period that the registrant was required to submit such files). Yes ☑ No ☐
Indicate by check mark whether the registrant is a large accelerated filer, an accelerated filer, a non-accelerated filer, a smaller reporting company, or an emerging growth company. See the definitions of “large accelerated filer,” “accelerated filer,” “smaller reporting company,” and “emerging growth company” in Rule 12b-2 of the Exchange Act.
Large accelerated filer |
|
☑ |
|
Accelerated filer |
|
☐ |
|
|
|
|
|||
Non-accelerated filer |
|
☐ |
|
Smaller reporting company |
|
☐ |
|
|
|
|
|
|
|
Emerging growth company |
|
☐ |
|
|
|
|
If an emerging growth company, indicate by check mark if the registrant has elected not to use the extended transition period for complying with any new or revised financial accounting standards provided pursuant to Section 13(a) of the Exchange Act. ☐
Indicate by check mark whether the registrant is a shell company (as defined in Rule 12b-2 of the Exchange Act). Yes ☐ No ☒
As of August 1, 2023, the registrant had 45,292,345 shares of Class A common stock, $0.000001 par value per share, outstanding.
Table of Contents
|
|
Page |
PART I. |
|
|
Item 1. |
1 |
|
|
1 |
|
|
Condensed Consolidated Statements of Operations and Comprehensive Loss (Unaudited) |
2 |
|
Condensed Consolidated Statements of Changes in Stockholders' Equity (Unaudited) |
3 |
|
5 |
|
|
Notes to Condensed Consolidated Financial Statements (Unaudited) |
6 |
Item 2. |
Management’s Discussion and Analysis of Financial Condition and Results of Operations |
22 |
Item 3. |
40 |
|
Item 4. |
40 |
|
PART II. |
|
|
Item 1. |
42 |
|
Item 1A. |
42 |
|
Item 2. |
42 |
|
Item 3. |
42 |
|
Item 4. |
42 |
|
Item 5. |
42 |
|
Item 6. |
43 |
|
44 |
||
i
SPECIAL NOTE REGARDING FORWARD-LOOKING STATEMENTS
This Quarterly Report on Form 10-Q contains forward-looking statements within the meaning of Section 27A of the Securities Act of 1933, as amended (the “Securities Act”), and Section 21E of the Securities Exchange Act of 1934, as amended (the “Exchange Act”), which statements involve substantial risks and uncertainties. Forward-looking statements generally relate to future events or our future financial or operating performance. In some cases, you can identify forward-looking statements because they contain words such as “may,” “can,” “will,” “would,” “should,” “expects,” “plans,” “anticipates,” “could,” “intends,” “target,” “projects,” “contemplates,” “believes,” “estimates,” “predicts,” “forecasts,” “potential,” or “continue” or the negative of these words or other similar terms or expressions that concern our expectations, strategy, plans or intentions. Forward-looking statements contained in this Quarterly Report on Form 10-Q include, but are not limited to, statements about:
|
• |
|
our expectations regarding our revenue, expenses and other operating results; |
|
• |
|
the anticipated growth of our business, including our ability to effectively manage or sustain our growth and to achieve or sustain profitability; |
|
• |
|
the effects of public health crises or other macroeconomic factors and geopolitical tension, such as those associated with Russia's invasion of Ukraine, which may lead to periods of global economic uncertainty; |
|
• |
|
future investments in our business, our anticipated capital expenditures and our estimates regarding our capital requirements; |
|
• |
|
our ability to attract new buyers and suppliers and successfully engage new and existing buyers and suppliers; |
|
• |
|
the costs and success of our sales and marketing efforts, and our ability to promote our brand; |
|
• |
|
our reliance on key personnel and our ability to identify, recruit and retain skilled personnel; |
|
• |
|
our ability to effectively manage our growth, including any international expansion; |
|
• |
|
our ability to obtain, maintain, protect and enforce our intellectual property or other proprietary rights and any costs associated therewith; |
|
• |
|
our ability to effectively manage our costs and expenses, which may be impacted by inflationary pressures; |
|
• |
|
our ability to compete effectively with existing competitors and new market entrants; and |
|
• |
|
the growth rates of the markets in which we compete. |
You should not rely on forward-looking statements as predictions of future events. We have based the forward-looking statements contained in this Form 10-Q primarily on our current expectations and projections about future events and trends that we believe may affect our business, financial condition and operating results. The outcome of the events described in these forward-looking statements is subject to risks, uncertainties and other factors described in the section titled Risk Factors Part II, Item 1A, and elsewhere in this Form 10-Q. Moreover, we operate in a very competitive and rapidly changing environment. New risks and uncertainties emerge from time to time, and it is not possible for us to predict all risks and uncertainties that could have an impact on the forward-looking statements contained in this Form 10-Q. The results, events and circumstances reflected in the forward-looking statements may not be achieved or occur, and actual results, events or circumstances could differ materially from those described in the forward-looking statements.
In addition, statements that “we believe” and similar statements reflect our beliefs and opinions on the relevant subject. These statements are based on information available to us as of the date of this Form 10-Q. And while we believe that information provides a reasonable basis for these statements, that information may be limited or incomplete. Our statements should not be read to indicate that we have conducted an exhaustive inquiry into, or review of, all relevant information. These statements are inherently uncertain, and investors are cautioned not to unduly rely on these statements.
The forward-looking statements made in this Form 10-Q relate only to events as of the date on which the statements are made. We undertake no obligation to update any forward-looking statements made in this Form 10-Q to reflect events or circumstances after the date of this Form 10-Q or to reflect new information or the occurrence of unanticipated events, except as required by law. We may not actually achieve the plans, intentions or expectations disclosed in our forward-looking statements, and you should not place undue reliance on our forward-looking statements. Our forward-looking statements do not reflect the potential impact of any future acquisitions, mergers, dispositions, joint ventures or investments.
ii
PART I—FINANCIAL INFORMATION
Item 1. Financial Statements.
XOMETRY, INC. AND SUBSIDIARIES
Condensed Consolidated Balance Sheets (Unaudited)
(In thousands, except share and per share data)
|
|
June 30, |
|
|
December 31, |
|
||
|
|
2023 |
|
|
2022 |
|
||
|
|
|
|
|||||
Assets |
|
|
|
|
|
|
||
Current assets: |
|
|
|
|
|
|
||
Cash and cash equivalents |
|
$ |
56,738 |
|
|
$ |
65,662 |
|
Marketable securities |
|
|
229,411 |
|
|
|
253,770 |
|
Accounts receivable, less allowance for credit losses of $2.0 million and $2.0 million as of June 30, 2023 and December 31, 2022 |
|
|
57,658 |
|
|
|
49,188 |
|
Inventory |
|
|
1,339 |
|
|
|
1,571 |
|
Prepaid expenses |
|
|
5,831 |
|
|
|
7,591 |
|
Other current assets |
|
|
13,825 |
|
|
|
12,273 |
|
Total current assets |
|
|
364,802 |
|
|
|
390,055 |
|
Property and equipment, net |
|
|
23,990 |
|
|
|
19,079 |
|
Operating lease right-of-use assets |
|
|
14,401 |
|
|
|
25,923 |
|
Investment in unconsolidated joint venture |
|
|
4,271 |
|
|
|
4,068 |
|
Intangible assets, net |
|
|
37,589 |
|
|
|
39,351 |
|
Goodwill |
|
|
263,002 |
|
|
|
258,036 |
|
Other assets |
|
|
427 |
|
|
|
413 |
|
Total assets |
|
$ |
708,482 |
|
|
$ |
736,925 |
|
Liabilities and stockholders’ equity |
|
|
|
|
|
|
||
Current liabilities: |
|
|
|
|
|
|
||
Accounts payable |
|
$ |
12,592 |
|
|
$ |
12,437 |
|
Accrued expenses |
|
|
37,136 |
|
|
|
33,430 |
|
Contract liabilities |
|
|
9,999 |
|
|
|
8,509 |
|
Income taxes payable |
|
|
2,796 |
|
|
|
3,956 |
|
Operating lease liabilities, current portion |
|
|
6,504 |
|
|
|
5,471 |
|
Total current liabilities |
|
|
69,027 |
|
|
|
63,803 |
|
Convertible notes |
|
|
280,840 |
|
|
|
279,909 |
|
Operating lease liabilities, net of current portion |
|
|
14,372 |
|
|
|
16,940 |
|
Deferred income taxes |
|
|
385 |
|
|
|
429 |
|
Other liabilities |
|
|
1,382 |
|
|
|
1,011 |
|
Total liabilities |
|
|
366,006 |
|
|
|
362,092 |
|
Commitments and contingencies (Note 13) |
|
|
|
|
|
|
||
Stockholders’ equity |
|
|
|
|
|
|
||
Preferred stock, $0.000001 par value. Authorized; 50,000,000 shares; zero shares issued and outstanding as of June 30, 2023 and December 31, 2022, respectively |
|
|
— |
|
|
|
— |
|
Class A Common stock, $0.000001 par value. Authorized; 750,000,000 shares; 45,243,447 shares and 44,822,264 shares issued and outstanding as of June 30, 2023 and December 31, 2022, respectively |
|
|
— |
|
|
|
— |
|
Class B Common stock, $0.000001 par value. Authorized; 5,000,000 shares; 2,676,154 shares issued and outstanding as of June 30, 2023 and December 31, 2022, respectively |
|
|
— |
|
|
|
— |
|
Additional paid-in capital |
|
|
635,267 |
|
|
|
623,081 |
|
Accumulated other comprehensive income |
|
|
359 |
|
|
|
28 |
|
Accumulated deficit |
|
|
(294,264 |
) |
|
|
(249,366 |
) |
Total stockholders’ equity |
|
|
341,362 |
|
|
|
373,743 |
|
Noncontrolling interest |
|
|
1,114 |
|
|
|
1,090 |
|
Total equity |
|
|
342,476 |
|
|
|
374,833 |
|
Total liabilities and stockholders’ equity |
|
$ |
708,482 |
|
|
$ |
736,925 |
|
See accompanying notes to the unaudited condensed consolidated financial statements.
1
XOMETRY, INC. AND SUBSIDIARIES
Condensed Consolidated Statements of Operations and Comprehensive Loss
(Unaudited)
(In thousands, except share and per share data)
|
|
Three Months Ended |
|
|
Six Months Ended |
||||||||||||
|
|
2023 |
|
|
2022 |
|
|
2023 |
|
|
2022 |
|
|
||||
|
|
|
|
|
|
|
|
|
|
|
|||||||
Revenue |
|
$ |
111,008 |
|
|
$ |
95,615 |
|
|
$ |
216,334 |
|
|
$ |
179,286 |
|
|
Cost of revenue |
|
|
67,452 |
|
|
|
57,919 |
|
|
|
133,409 |
|
|
|
108,651 |
|
|
Gross profit |
|
|
43,556 |
|
|
|
37,696 |
|
|
|
82,925 |
|
|
|
70,635 |
|
|
Sales and marketing |
|
|
22,666 |
|
|
|
18,145 |
|
|
|
45,105 |
|
|
|
37,430 |
|
|
Operations and support |
|
|
14,220 |
|
|
|
12,180 |
|
|
|
26,828 |
|
|
|
24,538 |
|
|
Product development |
|
|
8,922 |
|
|
|
7,796 |
|
|
|
17,047 |
|
|
|
15,085 |
|
|
General and administrative |
|
|
25,582 |
|
|
|
15,057 |
|
|
|
41,539 |
|
|
|
28,017 |
|
|
Impairment of assets |
|
|
219 |
|
|
|
119 |
|
|
|
246 |
|
|
|
119 |
|
|
Total operating expenses |
|
|
71,609 |
|
|
|
53,297 |
|
|
|
130,765 |
|
|
|
105,189 |
|
|
Loss from operations |
|
|
(28,053 |
) |
|
|
(15,601 |
) |
|
|
(47,840 |
) |
|
|
(34,554 |
) |
|
Other income (expenses) |
|
|
|
|
|
|
|
|
|
|
|
|
|
||||
Interest expense |
|
|
(1,193 |
) |
|
|
(1,209 |
) |
|
|
(2,391 |
) |
|
|
(1,978 |
) |
|
Interest and dividend income |
|
|
2,959 |
|
|
|
474 |
|
|
|
5,654 |
|
|
|
570 |
|
|
Other expenses |
|
|
(576 |
) |
|
|
(482 |
) |
|
|
(559 |
) |
|
|
(1,444 |
) |
|
Income from unconsolidated joint venture |
|
|
237 |
|
|
|
269 |
|
|
|
303 |
|
|
|
303 |
|
|
Total other income (expenses) |
|
|
1,427 |
|
|
|
(948 |
) |
|
|
3,007 |
|
|
|
(2,549 |
) |
|
Loss before income taxes |
|
|
(26,626 |
) |
|
|
(16,549 |
) |
|
|
(44,833 |
) |
|
|
(37,103 |
) |
|
Benefit (provision) for income taxes |
|
|
67 |
|
|
|
— |
|
|
|
(69 |
) |
|
|
559 |
|
|
Net loss |
|
|
(26,559 |
) |
|
|
(16,549 |
) |
|
|
(44,902 |
) |
|
|
(36,544 |
) |
|
Net (loss) income attributable to noncontrolling interest |
|
|
(5 |
) |
|
|
4 |
|
|
|
(4 |
) |
|
|
21 |
|
|
Net loss attributable to common stockholders |
|
$ |
(26,554 |
) |
|
$ |
(16,553 |
) |
|
$ |
(44,898 |
) |
|
$ |
(36,565 |
) |
|
Net loss per share, basic and diluted, of Class A and Class B common stock |
|
$ |
(0.55 |
) |
|
$ |
(0.35 |
) |
|
$ |
(0.94 |
) |
|
$ |
(0.78 |
) |
|
Weighted-average number of shares outstanding used to compute |
|
|
47,865,990 |
|
|
|
47,074,246 |
|
|
|
47,783,235 |
|
|
|
46,932,702 |
|
|
|
|
|
|
|
|
|
|
|
|
|
|
|
|
||||
|
|
|
|
|
|
|
|
|
|
|
|
|
|
||||
Comprehensive loss: |
|
|
|
|
|
|
|
|
|
|
|
|
|
||||
Foreign currency translation |
|
$ |
224 |
|
|
$ |
14 |
|
|
$ |
359 |
|
|
$ |
(14 |
) |
|
Total other comprehensive income (loss) |
|
|
224 |
|
|
|
14 |
|
|
|
359 |
|
|
|
(14 |
) |
|
Net loss |
|
|
(26,559 |
) |
|
|
(16,549 |
) |
|
|
(44,902 |
) |
|
|
(36,544 |
) |
|
Comprehensive loss |
|
|
(26,335 |
) |
|
|
(16,535 |
) |
|
|
(44,543 |
) |
|
|
(36,558 |
) |
|
Comprehensive income attributable to noncontrolling interest |
|
|
19 |
|
|
|
37 |
|
|
|
24 |
|
|
|
71 |
|
|
Total comprehensive loss attributable to common stockholders |
|
$ |
(26,354 |
) |
|
$ |
(16,572 |
) |
|
$ |
(44,567 |
) |
|
$ |
(36,629 |
) |
|
See accompanying notes to the unaudited condensed consolidated financial statements.
2
XOMETRY, INC. AND SUBSIDIARIES
Condensed Consolidated Statements of Changes in Stockholders’ Equity
(Unaudited)
Three months ended June 30, 2023 and 2022
(In thousands, except share and per share data)
|
Class A - Common Stock |
|
|
Class B - Common Stock |
|
|
Additional Paid-In |
|
|
Accumulated Other Comprehensive |
|
|
Accumulated |
|
|
Total Stockholders' |
|
Noncontrolling |
|
Total |
|
||||||||||||||||
|
Shares |
|
|
Amount |
|
|
Shares |
|
|
Amount |
|
|
Capital |
|
|
Income (Loss) |
|
|
Deficit |
|
|
Equity |
|
Interest |
|
Equity |
|
||||||||||
Balance, March 31, 2023 |
|
45,098,314 |
|
|
$ |
— |
|
|
|
2,676,154 |
|
|
$ |
— |
|
|
$ |
628,808 |
|
|
$ |
159 |
|
|
$ |
(267,710 |
) |
|
$ |
361,257 |
|
$ |
1,095 |
|
$ |
362,352 |
|
Exercise of common stock options |
|
85,998 |
|
|
|
— |
|
|
|
— |
|
|
|
|
|
|
661 |
|
|
|
— |
|
|
|
— |
|
|
|
661 |
|
|
— |
|
|
661 |
|
|
Vesting of restricted stock units |
|
59,135 |
|
|
|
— |
|
|
|
— |
|
|
|
— |
|
|
|
— |
|
|
|
— |
|
|
|
— |
|
|
|
— |
|
|
— |
|
|
— |
|
Stock based compensation |
|
— |
|
|
|
— |
|
|
|
— |
|
|
|
— |
|
|
|
5,798 |
|
|
|
— |
|
|
|
— |
|
|
|
5,798 |
|
|
— |
|
|
5,798 |
|
Comprehensive income |
|
|
|
|
|
|
|
|
|
|
|
|
|
|
|
|
|
|
|
|
|
|
|
|
|
|
|
||||||||||
Foreign currency translation |
|
— |
|
|
|
— |
|
|
|
— |
|
|
|
— |
|
|
|
— |
|
|
|
200 |
|
|
|
— |
|
|
|
200 |
|
|
24 |
|
|
224 |
|
Net loss |
|
— |
|
|
|
— |
|
|
|
— |
|
|
|
— |
|
|
|
— |
|
|
|
— |
|
|
|
(26,554 |
) |
|
|
(26,554 |
) |
|
(5 |
) |
|
(26,559 |
) |
Total comprehensive (loss) income |
|
— |
|
|
|
— |
|
|
|
— |
|
|
|
— |
|
|
|
— |
|
|
|
— |
|
|
|
— |
|
|
|
(26,354 |
) |
|
19 |
|
|
(26,335 |
) |
Balance, June 30, 2023 |
|
45,243,447 |
|
|
$ |
— |
|
|
|
2,676,154 |
|
|
$ |
— |
|
|
$ |
635,267 |
|
|
$ |
359 |
|
|
$ |
(294,264 |
) |
|
$ |
341,362 |
|
$ |
1,114 |
|
$ |
342,476 |
|
|
|
|
|
|
|
|
|
|
|
|
|
|
|
|
|
|
|
|
|
|
|
|
|
|
|
|
|
||||||||||
Balance, March 31, 2022 |
|
44,244,667 |
|
|
$ |
— |
|
|
|
2,676,154 |
|
|
$ |
— |
|
|
$ |
602,360 |
|
|
$ |
104 |
|
|
$ |
(193,353 |
) |
|
$ |
409,111 |
|
$ |
1,068 |
|
$ |
410,179 |
|
Exercise of common stock options |
|
260,147 |
|
|
|
— |
|
|
|
— |
|
|
|
— |
|
|
|
1,207 |
|
|
|
— |
|
|
|
— |
|
|
|
1,207 |
|
|
— |
|
|
1,207 |
|
Donated common stock |
|
40,266 |
|
|
|
— |
|
|
|
— |
|
|
|
— |
|
|
|
1,285 |
|
|
|
— |
|
|
|
— |
|
|
|
1,285 |
|
|
— |
|
|
1,285 |
|
Stock based compensation |
|
— |
|
|
|
— |
|
|
|
— |
|
|
|
— |
|
|
|
5,479 |
|
|
|
— |
|
|
|
— |
|
|
|
5,479 |
|
|
— |
|
|
5,479 |
|
Comprehensive income |
|
|
|
|
|
|
|
|
|
|
|
|
|
|
|
|
|
|
|
|
|
|
|
|
|
|
|
||||||||||
Foreign currency translation |
|
— |
|
|
|
— |
|
|
|
— |
|
|
|
— |
|
|
|
— |
|
|
|
(19 |
) |
|
|
— |
|
|
|
(19 |
) |
|
33 |
|
|
14 |
|
Net (loss) income |
|
— |
|
|
|
— |
|
|
|
— |
|
|
|
— |
|
|
|
— |
|
|
|
— |
|
|
|
(16,553 |
) |
|
|
(16,553 |
) |
|
4 |
|
|
(16,549 |
) |
Total comprehensive (loss) income |
|
— |
|
|
|
— |
|
|
|
— |
|
|
|
— |
|
|
|
— |
|
|
|
— |
|
|
|
|
|
|
(16,572 |
) |
|
37 |
|
|
(16,535 |
) |
|
Balance, June 30, 2022 |
|
44,545,080 |
|
|
$ |
— |
|
|
|
2,676,154 |
|
|
$ |
— |
|
|
$ |
610,331 |
|
|
$ |
85 |
|
|
$ |
(209,906 |
) |
|
$ |
400,510 |
|
$ |
1,105 |
|
$ |
401,615 |
|
See accompanying notes to the unaudited condensed consolidated financial statements.
3
XOMETRY, INC. AND SUBSIDIARIES
Condensed Consolidated Statements of Changes in Stockholders’ Equity
(Unaudited)
Six months ended June 30, 2023 and 2022
(In thousands, except share and per share data)
|
|
|
|
|
|
|
|
|
|
|
|
|
|
|
|
|
||||||||||||||
|
Class A - Common Stock |
|
Class B - Common Stock |
|
Additional Paid-In |
|
Accumulated Other Comprehensive |
|
Accumulated |
|
Total Stockholders' |
|
Noncontrolling |
|
Total |
|
||||||||||||||
|
Shares |
|
Amount |
|
Shares |
|
Amount |
|
Capital |
|
Income (Loss) |
|
Deficit |
|
Equity |
|
Interest |
|
(Deficit) Equity |
|
||||||||||
Balance, December 31, 2022 |
|
44,822,264 |
|
$ |
— |
|
|
2,676,154 |
|
$ |
— |
|
$ |
623,081 |
|
$ |
28 |
|
$ |
(249,366 |
) |
|
373,743 |
|
$ |
1,090 |
|
|
374,833 |
|
Exercise of common stock options |
|
168,907 |
|
|
— |
|
|
— |
|
|
— |
|
|
1,144 |
|
|
— |
|
|
— |
|
|
1,144 |
|
|
— |
|
|
1,144 |
|
Vesting of restricted stock units |
|
228,581 |
|
|
— |
|
|
— |
|
|
— |
|
|
— |
|
|
— |
|
|
— |
|
|
— |
|
|
— |
|
|
— |
|
Shared issued in business combination |
|
3,562 |
|
|
— |
|
|
— |
|
|
— |
|
|
180 |
|
|
— |
|
|
— |
|
|
180 |
|
|
— |
|
|
180 |
|
Donated common stock |
|
20,133 |
|
|
— |
|
|
— |
|
|
— |
|
|
370 |
|
|
— |
|
|
— |
|
|
370 |
|
|
— |
|
|
370 |
|
Stock based compensation |
|
— |
|
|
— |
|
|
— |
|
|
— |
|
|
10,492 |
|
|
— |
|
|
— |
|
|
10,492 |
|
|
— |
|
|
10,492 |
|
Comprehensive loss |
|
|
|
|
|
|
|
|
|
|
|
|
|
|
|
|
|
|
|
|
||||||||||
Foreign currency translation |
|
— |
|
|
— |
|
|
— |
|
|
— |
|
|
— |
|
|
331 |
|
|
— |
|
|
331 |
|
|
28 |
|
|
359 |
|
Net loss |
|
— |
|
|
— |
|
|
— |
|
|
— |
|
|
— |
|
|
— |
|
|
(44,898 |
) |
|
(44,898 |
) |
|
(4 |
) |
|
(44,902 |
) |
Total comprehensive loss |
|
— |
|
|
— |
|
|
— |
|
|
— |
|
|
— |
|
|
— |
|
|
— |
|
|
(44,567 |
) |
|
24 |
|
|
(44,543 |
) |
Balance, June 30, 2023 |
|
45,243,447 |
|
$ |
— |
|
|
2,676,154 |
|
$ |
— |
|
$ |
635,267 |
|
$ |
359 |
|
$ |
(294,264 |
) |
$ |
341,362 |
|
$ |
1,114 |
|
$ |
342,476 |
|
|
|
|
|
|
|
|
|
|
|
|
|
|
|
|
|
|
|
|
|
|
||||||||||
Balance, December 31, 2021 |
|
43,998,404 |
|
$ |
— |
|
|
2,676,154 |
|
$ |
— |
|
$ |
597,641 |
|
$ |
149 |
|
$ |
(173,341 |
) |
$ |
424,449 |
|
$ |
1,034 |
|
$ |
425,483 |
|
Exercise of common stock options |
|
506,410 |
|
|
— |
|
|
— |
|
|
— |
|
|
2,470 |
|
|
— |
|
|
— |
|
|
2,470 |
|
|
— |
|
|
2,470 |
|
Donated common stock |
|
40,266 |
|
|
— |
|
|
— |
|
|
— |
|
|
1,285 |
|
|
— |
|
|
— |
|
|
1,285 |
|
|
— |
|
|
1,285 |
|
Stock based compensation |
|
— |
|
|
— |
|
|
— |
|
|
— |
|
|
8,935 |
|
|
— |
|
|
— |
|
|
8,935 |
|
|
— |
|
|
8,935 |
|
Comprehensive loss |
|
|
|
|
|
|
|
|
|
|
|
|
|
|
|
|
|
|
|
|
||||||||||
Foreign currency translation |
|
— |
|
|
— |
|
|
— |
|
|
— |
|
|
— |
|
|
(64 |
) |
|
— |
|
|
(64 |
) |
|
50 |
|
|
(14 |
) |
Net loss (income) |
|
— |
|
|
— |
|
|
— |
|
|
— |
|
|
— |
|
|
— |
|
|
(36,565 |
) |
|
(36,565 |
) |
|
21 |
|
|
(36,544 |
) |
Total comprehensive loss |
|
— |
|
|
— |
|
|
— |
|
|
— |
|
|
— |
|
|
— |
|
|
— |
|
|
(36,629 |
) |
|
71 |
|
|
(36,558 |
) |
Balance, June 30, 2022 |
|
44,545,080 |
|
$ |
— |
|
|
2,676,154 |
|
$ |
— |
|
$ |
610,331 |
|
$ |
85 |
|
$ |
(209,906 |
) |
$ |
400,510 |
|
$ |
1,105 |
|
$ |
401,615 |
|
See accompanying notes to the unaudited condensed consolidated financial statements.
4
XOMETRY, INC. AND SUBSIDIARIES
Condensed Consolidated Statements of Cash Flows
(Unaudited)
(In thousands)
|
|
Six Months Ended June 30, |
|||||||
|
|
2023 |
|
|
2022 |
|
|
||
Cash flows from operating activities: |
|
|
|
|
|||||
Net loss |
|
$ |
(44,902 |
) |
|
$ |
(36,544 |
) |
|
Adjustments to reconcile net loss to net cash used in operating activities: |
|
|
|
|
|
|
|
||
Depreciation and amortization |
|
|
5,461 |
|
|
|
3,807 |
|
|
Impairment of assets |
|
|
246 |
|
|
|
119 |
|
|
Reduction in carrying amount of right-of-use asset |
|
|
12,179 |
|
|
|
3,540 |
|
|
Stock based compensation |
|
|
10,492 |
|
|
|
8,935 |
|
|
Revaluation of contingent consideration |
|
|
187 |
|
|
|
434 |
|
|
Income from unconsolidated joint venture |
|
|
(203 |
) |
|
|
(103 |
) |
|
Donation of common stock |
|
|
370 |
|
|
|
1,285 |
|
|
Losses on marketable securities |
|
|
— |
|
|
|
1,190 |
|
|
Non-cash income tax benefit |
|
|
— |
|
|
|
(559 |
) |
|
Loss on sale of property and equipment |
|
|
92 |
|
|
|
71 |
|
|
Inventory write-off |
|
|
223 |
|
|
|
— |
|
|
Amortization of deferred costs on convertible notes |
|
|
930 |
|
|
|
781 |
|
|
Deferred taxes benefit |
|
|
(44 |
) |
|
|
(2 |
) |
|
Changes in other assets and liabilities: |
|
|
|
|
|
|
|
||
Accounts receivable, net |
|
|
(8,308 |
) |
|
|
(11,833 |
) |
|
Inventory |
|
|
5 |
|
|
|
272 |
|
|
Prepaid expenses |
|
|
1,417 |
|
|
|
(1,649 |
) |
|
Other assets |
|
|
(2,546 |
) |
|
|
(3,861 |
) |
|
Accounts payable |
|
|
(50 |
) |
|
|
1,873 |
|
|
Accrued expenses |
|
|
2,743 |
|
|
|
(2,041 |
) |
|
Contract liabilities |
|
|
1,470 |
|
|
|
2,862 |
|
|
Lease liabilities |
|
|
(2,369 |
) |
|
|
(2,773 |
) |
|
Net cash used in operating activities |
|
|
(22,607 |
) |
|
|
(34,196 |
) |
|
Cash flows from investing activities: |
|
|
|
|
|
|
|
||
Purchases of marketable securities |
|
|
(5,641 |
) |
|
|
(280,559 |
) |
|
Proceeds from sale of marketable securities |
|
|
30,000 |
|
|
|
4 |
|
|
Purchases of property and equipment |
|
|
(8,492 |
) |
|
|
(5,436 |
) |
|
Proceeds from sale of property and equipment |
|
|
223 |
|
|
|
165 |
|
|
Cash paid for business combination, net of cash acquired |
|
|
(3,349 |
) |
|
|
— |
|
|
Net cash provided by (used in) investing activities |
|
|
12,741 |
|
|
|
(285,826 |
) |
|
Cash flows from financing activities: |
|
|
|
|
|
|
|
||
Proceeds from stock options exercised |
|
|
1,144 |
|
|
|
2,470 |
|
|
Proceeds from issuance of convertible notes |
|
|
— |
|
|
|
287,500 |
|
|
Costs incurred in connection with issuance of convertible notes |
|
|
— |
|
|
|
(9,309 |
) |
|
Payments on finance lease obligations |
|
|
— |
|
|
|
(2 |
) |
|
Net cash provided by financing activities |
|
|
1,144 |
|
|
|
280,659 |
|
|
Effect of foreign currency translation on cash and cash equivalents |
|
|
(202 |
) |
|
|
(66 |
) |
|
Net decrease in cash and cash equivalents |
|
|
(8,924 |
) |
|
|
(39,429 |
) |
|
Cash and cash equivalents at beginning of the year |
|
|
65,662 |
|
|
|
86,262 |
|
|
Cash and cash equivalents at end of the period |
|
$ |
56,738 |
|
|
$ |
46,833 |
|
|
Supplemental cash flow information: |
|
|
|
|
|
|
|
||
Cash paid for interest |
|
$ |
1,438 |
|
|
$ |
— |
|
|
Non-cash investing and financing activities: |
|
|
|
|
|
|
|
||
Non-cash consideration in connection with business combination |
|
|
1,593 |
|
|
|
— |
|
|
See accompanying notes to the unaudited condensed consolidated financial statements.
5
XOMETRY, INC. AND SUBSIDIARIES
Notes to Unaudited Condensed Consolidated Financial Statements
(Unaudited)
(1) Organization and Description of Business
Xometry, Inc. (“Xometry”, the “Company”, “we”, or “our”) was incorporated in the State of Delaware in May 2013. Xometry is a global online marketplace connecting buyers with suppliers of manufacturing services, transforming one of the largest industries in the world. We use our proprietary technology to create a marketplace that enables buyers to efficiently source manufactured parts and assemblies, and empower suppliers of manufacturing services to grow their businesses. Xometry's corporate headquarters is located in North Bethesda, Maryland.
Our AI-enabled technology platform is powered by proprietary machine learning algorithms and a dataset, resulting in a sophisticated two-sided marketplace that is rapidly digitizing the manufacturing industry. As a result, buyers can procure the products they want on demand, and suppliers can source new manufacturing opportunities that match their specific capabilities and capacity. Interactions on our marketplace provide rich data insights that allow us to continuously improve our AI models and create new products and services, fueling powerful network effects as we scale.
We use proprietary technology to enable product designers, engineers, buyers, and supply chain professionals to instantly access the capacity of a global network of manufacturing facilities. The Company’s platform makes it possible for buyers to quickly receive pricing, expected lead times, manufacturability feedback and place orders on the Company’s platform. The network allows the Company to provide high volumes of unique parts, including custom components and aftermarket parts for its buyers.
Xometry’s suppliers’ capabilities include computer numerical control manufacturing, sheet metal forming, sheet cutting, 3D printing (including fused deposition modeling, direct metal laser sintering, PolyJet, stereolithography, selective laser sintering, binder jetting, carbon digital light synthesis, multi jet fusion and lubricant sublayer photo-curing), die casting, stamping, injection molding, urethane casting, tube cutting, tube bending, as well as finishing services, rapid prototyping and high-volume production.
We empower suppliers to grow their manufacturing businesses and improve machine uptime by providing access to an extensive, diverse base of buyers. We also offer suppliers supporting products and services to meet their unique needs. Our suite of supplier services includes a cloud-based manufacturing execution system (“Workcenter”) and financial service products to stabilize and enhance cash flow. In addition, we offer suppliers digital marketing and data solutions and SaaS based solutions to help suppliers optimize their productivity. In 2021, we acquired Thomas Publishing Company (“Thomas”) and Fusiform, Inc. (d/b/a FactoryFour) (“FactoryFour”), expanding our basket of supplier services to include marketing and advertising services and Workcenter to help suppliers optimize their productivity.
(2) Basis of Presentation and Summary of Significant Accounting Policies
The accompanying unaudited condensed consolidated financial statements have been prepared in accordance with generally accepted accounting principles in the United States of America (“U.S. GAAP”) and applicable rules and regulations of the Securities and Exchange Commission (“SEC”) regarding interim financial reporting. Certain information and note disclosures normally included in the financial statements prepared in accordance with U.S. GAAP have been condensed or omitted pursuant to such rules and regulations. Therefore, these condensed consolidated financial statements should be read in conjunction with the consolidated financial statements and notes included in the Company's Annual Report on Form 10-K filed with the SEC on March 16, 2023.
The condensed consolidated balance sheet as of December 31, 2022, included herein, was derived from the audited financial statements as of that date, but may not include all disclosures including certain notes required by U.S. GAAP on an annual reporting basis. In the opinion of management, the accompanying condensed consolidated financial statements reflect all normal recurring adjustments necessary to present fairly the financial position, results of operations, comprehensive loss, stockholders' equity and cash flows for the interim periods, but are not necessarily indicative of the results of operations to be anticipated for the full year 2023 or any future period. The Company has two reporting segments which are referred to as: (1) the United States (“U.S.”) and (2) International.
Foreign Operations and Comprehensive Loss
The U.S. dollar (“USD”) is the functional currency for Xometry’s consolidated subsidiary operating in the U.S. The primary functional currency for the Company's consolidated subsidiaries operating in Germany and to a lesser extent, United Kingdom, Turkey, China and Japan, is the Euro, British Pound Sterling, Turkish Lira, Yuan and the Yen, respectively. For the Company’s consolidated subsidiaries whose functional currencies are not the USD, the Company translates their financial statements into USD.
6
The Company translates assets and liabilities at the exchange rate in effect as of the financial statement date. Revenue and expense accounts are translated using an average exchange rate for the period. Gains and losses resulting from translation are included in accumulated other comprehensive income (“AOCI”), as a separate component of equity.
Noncontrolling Interest
We have a 66.67% ownership in Incom Co., LTD. As we have a controlling interest in Incom Co., LTD, we have consolidated Incom Co., LTD into our unaudited condensed consolidated financial statements. The portion of equity in Incom Co., LTD not owned by the Company is accounted for as a noncontrolling interest. We present the portion of any equity that we do not own in a consolidated entity as noncontrolling interest and classify their interest as a component of total equity, separate from total stockholders’ equity on our Condensed Consolidated Balance Sheets. We include net (loss) income attributable to the noncontrolling interests in net loss in our Condensed Consolidated Statements of Operations and Comprehensive Loss.
The preparation of the Company’s unaudited condensed consolidated financial statements in conformity with U.S. GAAP requires management to make estimates and assumptions, which affect the reported amounts in the financial statements and accompanying notes. Actual results could differ from those estimates.
The Company accounts for business combinations using the acquisition method of accounting, which requires, among other things, allocation of the fair value of purchase consideration to the tangible and intangible assets acquired and liabilities assumed at their estimated fair values on the acquisition date. The excess of the fair value of purchase consideration over the values of these identifiable assets and liabilities is recorded as goodwill. When determining the fair value of assets acquired and liabilities assumed, management makes significant estimates and assumptions, especially with respect to the valuation of intangible assets. Management’s estimates of fair value are based upon assumptions believed to be reasonable, but which are inherently uncertain and unpredictable and, as a result, actual results may differ from estimates. During the measurement period, not to exceed one year from the date of acquisition, the Company may record adjustments to the assets acquired and liabilities assumed, with a corresponding offset to goodwill if new information is obtained related to facts and circumstances that existed as of the acquisition date. Upon the conclusion of the measurement period or final determination of the fair value of assets acquired or liabilities assumed, whichever comes first, any subsequent adjustments are reflected in the consolidated statements of operations. Acquisition costs, such as legal and consulting fees, are expensed as incurred.
The Company measures certain assets and liabilities at fair value on a recurring basis based on an expected exit price, which represents the amount that would be received on the sale of an asset or paid to transfer a liability in an orderly transaction between market participants. As such, fair value may be based on assumptions that market participants would use in pricing an asset or liability.
The authoritative guidance on fair value measurements establishes a consistent framework for measuring fair value on either a recurring or nonrecurring basis, whereby inputs used in valuation techniques, are assigned a hierarchical level. The following are the hierarchical levels of inputs to measure fair value:
Level 1 - Observable inputs that reflect quoted prices (unadjusted) for identical assets or liabilities in active markets.
Level 2 - Inputs reflect quoted prices for identical assets or liabilities in markets that are not active; quoted prices for similar assets or liabilities in active markets; inputs other than quoted prices that are observable for the assets or liabilities; or inputs that are derived principally from or corroborated by observable market data by correlation or other means.
Level 3 - Unobservable inputs reflecting the Company’s own assumptions incorporated in valuation techniques used to determine fair value. These assumptions are required to be consistent with market participant assumptions that are reasonably available.
The carrying amounts of certain of the Company’s financial instruments, which include cash and cash equivalents, accounts receivable, prepaid expenses and other assets, accounts payable, accrued expenses and contract liabilities approximate their fair values due to their short maturities. The Company's marketable securities are recorded at fair value.
The Company measures its marketable securities at fair value and recognizes any changes in fair value in other expenses on the Condensed Consolidated Statements of Operations and Comprehensive Loss. The Company's marketable securities represent our investments in a short term money market fund. These marketable securities have maturities of three months or less. As of June 30, 2023 and December 31, 2022, the Company's marketable securities of $229.4 million and $253.8 million respectively, were recorded at fair value, within Level 1 of the fair value hierarchy. The fair value of the Company’s Level 1 financial instruments is based on quoted prices in active markets, total fair value is the published market price per unit multiplied by the number of units held without consideration of transaction costs, discounts or blockage factors.
7
No losses were recorded during the three and six months ended June 30, 2023. During the three and six months ended June 30, 2022, the Company recorded losses of $0.3 million and $1.2 million, respectively, related to these securities, which is recorded in other expenses on the Condensed Consolidated Statements of Operations and Comprehensive Loss.
Accounts receivable are stated at the amount the Company expects to collect from outstanding balances. The Company's accounts receivable do not bear interest. Amounts collected on accounts receivable are included in net cash used in operating activities in the Condensed Consolidated Statements of Cash Flows. For buyers for which the Company provides credit, the Company performs credit inquiries, including reference checks, and queries credit ratings services and other publicly available information. Management provides for probable uncollectible amounts through a provision for bad debt expense and an adjustment to a valuation allowance based on the age of the outstanding amounts, each customer’s expected ability to pay and collection history, current market conditions, and reasonable and supportable forecasts of future economic conditions to determine whether the allowance is appropriate. The Company reviews its valuation allowance monthly. Past due balances over 90 days and over a specified amount are reviewed individually for collectability. Balances that are still outstanding after management has used reasonable collection efforts are written off through a charge to the valuation allowance and a credit to accounts receivable.
Allowance For Credit Losses
The allowance for credit losses related to accounts receivable and changes were as follows (in thousands):
|
|
|
|
|
|
|
||
|
|
2023 |
|
|
2022 |
|
||
|
|
|
|
|
|
|
||
Allowance for credit losses |
|
|
|
|
|
|
||
Balance at beginning of year, January 1 |
|
$ |
1,988 |
|
|
$ |
809 |
|
Charge to provision accounts |
|
|
956 |
|
|
|
1,324 |
|
Write-offs or other |
|
|
(961 |
) |
|
|
(145 |
) |
Balance at period end, June 30 and December 31, respectively |
|
$ |
1,983 |
|
|
$ |
1,988 |
|
Property and equipment are stated at cost. Depreciation is calculated on the straight-line method over the estimated useful life of the assets, which range from three to seven years, or in the case of leasehold improvements, over the shorter of the remaining lease term or the useful life of the asset.
Property and equipment and intangible assets subject to amortization are reviewed for impairment whenever events or changes in circumstances indicate that the carrying amount of an asset may not be recoverable. If circumstances require a long-lived asset or asset group to be tested for possible impairment, the Company first compares undiscounted cash flows expected to be generated by that asset or asset group to its carrying amount. If the carrying amount of the long-lived asset or asset group is not recoverable on an undiscounted cash flow basis, an impairment is recognized to the extent that the carrying amount exceeds its fair value. Fair value is determined through various valuation techniques including discounted cash flow models, quoted market values and third-party independent appraisals, as considered necessary.
Property and equipment includes capitalized internal-use software development costs. Eligible internal-use software development costs are capitalized subsequent to the completion of the preliminary project stage. Such costs include internal and external direct development costs totaling $7.1 million for the six months ended June 30, 2023 and $11.5 million for the year ended December 31, 2022. After all substantial testing and deployment is completed and the software is ready for its intended use, capitalization is discontinued and the internal-use software costs are placed in service and amortized using the straight-line method over the estimated useful life of the software, generally three years.
Goodwill represents the excess purchase price over the estimated fair value of net assets acquired in a business combination. As of June 30, 2023, the Company's goodwill is attributable to both the U.S. and International reporting units. As of December 31, 2022, the Company's goodwill is attributable to the U.S. reporting unit. Goodwill is not amortized. The Company tests goodwill for impairment annually in the fourth quarter, or more frequently, if events or changes in circumstances indicate that the carrying value of a reporting unit, including goodwill, might be impaired.
In testing for goodwill impairment, we first assess qualitative factors to determine whether the existence of events or circumstances leads to a determination that it is more likely than not that the fair value of a reporting unit is less than its carrying amount. These qualitative factors assessed may include the following: (i) significant changes in the manner of our use of the assets or the strategy of our overall business, (ii) certain restructuring initiatives, (iii) significant negative industry or economic trends and (iv)
8
significant decline in our share price for a sustained period. If, after assessing the totality of events or circumstances, we determine it is not more likely than not that the fair value of a reporting unit is less than its carrying amount, then additional impairment testing is not required. However, if we conclude otherwise, we proceed to the quantitative assessment.
The Company derives the majority of its marketplace revenue in the U.S. and Europe from the sale of parts and assemblies fulfilled using a vast network of suppliers. The Company recognizes revenue from the sales to our customers pursuant to Financial Accounting Standard Board’s (“FASB”) Accounting Standards Codification (“ASC”) Topic 606, Revenue from Contracts with Customers (“ASC 606”).
The Company determines that a contract exists between the Company and the customer when the customer accepts the quote and places the order, all of which are governed by the Company’s standard terms and conditions or other agreed terms with Xometry’s buyers. Upon completion of an order through Xometry’s platform, the Company identifies the performance obligation(s) within that order to complete the sale of the manufactured part(s) or assembly. Using Xometry’s in-house technology, the Company determines the price for the manufactured part(s) or assembly on a stand-alone basis at order initiation. The Company recognizes revenue from sales to Xometry’s customers upon shipment, at which point control over the part(s) or assembly have transferred.
The Company has concluded that the Company is principal in the sale of part(s) and assemblies that use the Company’s network of third-party manufacturers because the Company controls the manufacturing by obtaining a right to direct a third-party manufacturer to fulfill the performance obligation Xometry has with the Company’s customers on Xometry’s behalf. The Company has considered the following conditions of the sale: (i) the Company has the obligation of providing the specified product to the customer, (ii) the Company has discretion with respect to establishing the price of the product and the price the Company pays the suppliers and the Company has margin risk on all of Xometry’s sales, (iii) the Company has discretion in determining how to fulfill each order, including selecting the supplier and (iv) Xometry bears certain risk for product quality to the extent the customer is not satisfied with the final product.
Xometry also derives revenue from its supplier services which is a suite of services offered to our suppliers. Revenue also includes the sale of marketing services which includes advertising. This revenue is generally recognized as control is transferred to the customer, in an amount reflecting the consideration we expect to be entitled to in exchange for such product or service. From time to time, a purchase order with a customer may involve multiple performance obligations, including a combination of some or all of our products. Judgment may be required in determining whether products are considered distinct performance obligations that should be accounted for separately or as one combined performance obligation. Revenue is recognized over the period or at the point in time in which the performance obligations are satisfied. Consideration is typically determined based on a fixed unit price for the quantity of product transferred. For purchase orders involving multiple performance obligations, the transaction price is allocated to each performance obligation based on relative standalone selling price, and recognized as revenue when each individual product or service is transferred to the customer.
Revenue is shown net of estimated returns, refunds, and allowances. At June 30, 2023 and December 31, 2022, the Company has a provision for estimated returns, refunds or allowances of $0.2 million and $0.3 million, respectively.
Sales tax, and if applicable duties and/or tariffs collected from customers and remitted to governmental authorities is excluded from revenue.
Contract Liabilities
Contract liabilities are primarily derived from payments received in advance or at the time an order is placed, for which the associated performance obligations have not been satisfied and revenue has not been recognized based on the Company’s revenue recognition criteria described above.
The following table presents contract liabilities as of December 31, 2022 and June 30, 2023 (in thousands):
Rollforward of contract liabilities: |
|
|
|
|
Contract liabilities at December 31, 2022 |
|
$ |
8,509 |
|
Revenue recognized |
|
|
(99,848 |
) |
Payments received in advance |
|
|
101,317 |
|
Acquired contract liabilities |
|
|
21 |
|
Contract liabilities at June 30, 2023 |
|
$ |
9,999 |
|
During the six months ended June 30, 2023, the Company recognized approximately $8.0 million of revenue related to its contract liabilities at December 31, 2022.
9
Sales Contract Acquisition Costs
The Company’s incremental costs to obtain a contract may include a sales commission which is generally determined on a per order basis. For contracts in excess of one year, the Company amortizes such costs on a straight-line basis over the average customer life of two years for new customers and over the renewal period for existing customers which is generally one year. Sales commissions are included in the Company's sales and marketing expenses in the Condensed Consolidated Statements of Operations and Comprehensive Loss. For the three and six months ended June 30, 2023 the Company recognized approximately $2.0 million and $4.0 million, respectively of amortization related to deferred sales commissions. For the three and six months ended June 30, 2022 the Company recognized approximately $(0.7) million and $1.4 million, respectively of amortization related to deferred sales commissions. During the three months ended June 30, 2022, the amount included a $1.9 million measurement period benefit related to the Company's acquisition of Thomas. As of June 30, 2023 and December 31, 2022, the Company had deferred sales contract acquisition costs of $4.0 million and $3.3 million, respectively which is classified in other current assets on the Condensed Consolidated Balance Sheets.
Cost of revenue for marketplace primarily consists of the cost of the products that are manufactured or produced by the Company’s suppliers for delivery to buyers on the Company's platform, internal and external production costs, shipping costs, and certain internal depreciation.
Cost of revenue for supplier services primarily consists of internal and external production costs and website hosting.
The Company determines if an arrangement contains a lease and the classification of that lease, if applicable, at its inception. Operating leases are included in operating lease right-of-use ("ROU") assets, operating lease liabilities, current portion and operating lease liabilities, net of current portion in the Condensed Consolidated Balance Sheets. The Company has finance leases as detailed in the Long-Lived Assets section above. For leases with terms of twelve months or less, the Company does not recognize ROU assets or lease liabilities on the Condensed Consolidated Balance Sheets. Additionally, the Company elected to use the practical expedient to not separate lease and non-lease components for leases of real estate, meaning that for these leases, the non-lease components are included in the associated ROU asset and lease liability balances on the Company’s Condensed Consolidated Balance Sheets.
ROU assets represent the Company’s right to use an underlying asset for the lease term and lease liabilities represent the Company’s obligation to make lease payments under the lease. Operating lease ROU assets and lease liabilities are recognized at the lease commencement date based on the present value of lease payments over the lease term. The implicit rate within the Company’s operating leases is generally not determinable, as such the Company uses its incremental borrowing rate at lease commencement to determine the present value of lease payments. The operating lease ROU asset also includes any lease prepayments, offset by lease incentives. Certain of the Company’s leases include options to extend or terminate the lease. The expected lease term includes options to extend or terminate the lease when it is reasonably certain the Company will exercise such option.
Lease expense is recognized on a straight-line basis over the term of the lease.
Sales and marketing expenses are expensed as incurred and include the costs of digital marketing strategies, branding costs and other advertising costs, certain depreciation and amortization expense, contract acquisition costs and compensation expenses, including stock-based compensation, to the Company’s sales and marketing employees. For the three and six months ended June 30, 2023, the Company's advertising cost were $7.5 million and $15.7 million, respectively. For the three and six months ended June 30, 2022, the Company's advertising costs were $7.9 million and $15.0 million, respectively.
Operations and support expenses are the costs the Company incurs in support of the customers and suppliers on Xometry’s platforms which are provided by phone, email and chat for purposes of resolving customer and supplier related matters. These costs primarily consist of compensation expenses of the support staff, including stock-based compensation, certain depreciation and amortization expense and software costs used in delivering customer and supplier services.
Product development costs which are not eligible for capitalization are expensed as incurred. This account also includes compensation expenses, including stock-based compensation to the Company’s employees performing these functions and certain depreciation and amortization expense.
10
General and administrative expenses primarily consist of compensation expenses, including stock-based compensation expenses, for executive, finance, legal and other administrative personnel, professional service fees and certain depreciation and amortization expense.
All stock-based compensation, including stock options and restricted stock units, are measured at the grant date fair value of the award. The Company estimates grant date fair value of stock options using the Black-Scholes option-pricing model. The fair value of stock options and restricted stock units is recognized as compensation expense on a straight-line basis over the requisite service period, which is typically four years. The fair value of the restricted stock units is determined using the fair value of the Company's Class A common stock on the date of grant. Forfeitures are recorded in the period in which they occur.
The Black-Scholes model considers several variables and assumptions in estimating the fair value of stock-based awards.
These variables include:
For all stock options granted, the Company calculated the expected term using the simplified method for “plain vanilla” stock option awards. The risk-free interest rate is based on the yield available on U.S. Treasury issuances similar in duration to the expected term of the stock-based award. The Company estimates its expected share price volatility based on the historical volatility of publicly traded peer companies and/or its own volatility and expects to continue to do so until such time as it has adequate historical data regarding the volatility of its own traded share price. The Company utilized a dividend yield of zero, as it had no history or plan of declaring dividends on its common stock.
The Company computes net loss per share using the two-class method required for multiple classes of common stock and participating securities. The two-class method requires income available to common stockholders for the period to be allocated between common stock and participating securities based upon their respective rights to receive dividends as if all income for the period had been distributed. Certain unvested share-based payment awards that contain nonforfeitable rights to dividends are treated as participating securities and therefore included in computing net income per share using the two-class method. The rights, including the liquidation and dividend rights, of the Class A common stock and Class B common stock are substantially identical, other than voting rights. Accordingly, the Class A common stock and Class B common stock shared proportionately in the Company’s net losses.
There are currently no other accounting standards that have been issued, but not yet adopted, that are expected to have a significant impact on the Company’s consolidated financial position, results of operations or cash flows upon adoption.
(3) Credit Concentrations
Financial instruments which potentially subject the Company to concentrations of credit risk consist primarily of cash and accounts receivable. The Company maintains its cash, which at times may exceed federally insured limits, in deposit accounts at major financial institutions. A majority of the Company’s buyers are located in the United States.
For the three and six months ended June 30, 2023 and 2022, no single buyer accounted for more than 10% of the Company's revenue. As of June 30, 2023, and December 31, 2022, no single buyer accounted for more than 10% of the Company’s accounts receivable.
11
(4) Inventory
Inventory consists of raw materials, work-in-process, tools inventory and finished goods. Raw materials (plastics and metals) become manufactured products in the additive and subtractive manufacturing processes. Work-in-progress represents manufacturing costs associated with customer orders that are not yet complete. The tools inventory primarily consists of small consumable machine tools, cutting devices, etc. Finished goods represents product awaiting shipment. Inventory consists of the following as of June 30, 2023 and December 31, 2022 (in thousands):
|
|
June 30, |
|
|
December 31, |
|
||
|
|
2023 |
|
|
2022 |
|
||
|
|
|
|
|
|
|
||
Raw materials |
|
$ |
111 |
|
|
$ |
119 |
|
Work-in-progress |
|
|
353 |
|
|
|
675 |
|
Tools inventory |
|
|
- |
|
|
|
477 |
|
Finished goods |
|
|
875 |
|
|
|
300 |
|
Total |
|
$ |
1,339 |
|
|
$ |
1,571 |
|
(5) Property and Equipment and Long-Lived Assets
Property and equipment consist of the following as of June 30, 2023 and December 31, 2022 (in thousands):
|
|
|
|
June 30, |
|
|
December 31, |
|
||
|
|
Useful Life |
|
2023 |
|
|
2022 |
|
||
|
|
|
|
|
|
|
|
|
||
Technology hardware |
|
3 years |
|
$ |
3,072 |
|
|
$ |
2,927 |
|
Manufacturing equipment |
|
5 years |
|
|
2,832 |
|
|
|
2,892 |
|
Capitalized software development |
|
3 years |
|
|
31,684 |
|
|
|
24,343 |
|
Leasehold improvements |
|
Shorter of useful |
|
|
1,402 |
|
|
|
1,345 |
|
Furniture and fixtures |
|
7 years |
|
|
2,790 |
|
|
|
1,705 |
|
Land |
|
Indefinite |
|
|
160 |
|
|
|
- |
|
Total |
|
|
|
|
41,940 |
|
|
|
33,212 |
|
Less accumulated depreciation |
|
|
|
|
(17,950 |
) |
|
|
(14,133 |
) |
Property and Equipment, net |
|
|
|
$ |
23,990 |
|
|
$ |
19,079 |
|
Depreciation expense for the three and six months ended June 30, 2023 and 2022 was as follows (in thousands):
|
Three Months Ended June 30, |
|
|
Six Months Ended June 30, |
||||||||||||
|
2023 |
|
|
2022 |
|
|
2023 |
|
|
2022 |
|
|
||||
Cost of revenue |
$ |
38 |
|
|
$ |
24 |
|
|
$ |
82 |
|
|
$ |
58 |
|
|
Sales and marketing |
|
4 |
|
|
|
- |
|
|
|
4 |
|
|
|
- |
|
|
Operations and support |
|
78 |
|
|
|
16 |
|
|
|
90 |
|
|
|
27 |
|
|
Product development |
|
1,351 |
|
|
|
723 |
|
|
|
2,620 |
|
|
|
1,428 |
|
|
General and administrative |
|
492 |
|
|
|
181 |
|
|
|
808 |
|
|
|
365 |
|
|
Total depreciation expense |
$ |
1,963 |
|
|
$ |
944 |
|
|
$ |
3,604 |
|
|
$ |
1,878 |
|
|
(6) Leases
Operating lease expense for the three and six months ended June 30, 2023 and 2022 was as follows (in thousands):
|
|
Three Months Ended June 30, |
|
|
Six Months Ended June 30, |
|
||||||||||
|
|
2023 |
|
|
2022 |
|
|
2023 |
|
|
2022 |
|
||||
|
|
|
|
|||||||||||||
Cost of revenue |
|
$ |
18 |
|
|
$ |
21 |
|
|
$ |
36 |
|
|
$ |
37 |
|
General and administrative |
|
|
10,417 |
|
|
|
1,428 |
|
|
|
12,631 |
|
|
|
2,928 |
|
Total operating lease expense |
|
$ |
10,435 |
|
|
$ |
1,449 |
|
|
$ |
12,667 |
|
|
$ |
2,965 |
|
12
During the first quarter of 2023, the Company entered into two new office leases in Lyon, France and Istanbul, Turkey. In connection with these leases, the Company recorded non-cash ROU assets and lease liabilities of $0.3 million. During the second quarter of 2023, the Company determined that it was reasonably certain to exercise an extension option in an existing lease and recorded a non-cash ROU asset and lease liability of $0.5 million.
During the second quarter of 2023, the Company assessed its lease portfolio. As a result, the Company abandoned certain leases and/or portions of its leases in New York, NY, Horsham, PA, Culver City, CA, Doraville, GA and Gaithersburg, MD. As a result of abandoning these leases, the Company ceased its use of these locations and accelerated the amortization of the ROU assets to reduce the ROU assets carrying values to zero. The Company recognized a one-time charge of $8.7 million of additional operating lease expense during the second quarter of 2023 in general and administrative on our Condensed Consolidated Statements of Operations and Comprehensive Loss. The Company will continue to pay the rent owed under the existing lease agreements.
(7) Acquisitions
Tridi
On January 2, 2023, the Company acquired Tridi Teknoloj A.S. (“Tridi”) located in Istanbul, Türkiye pursuant to a Share Purchase Agreement. The acquisition of Tridi extends the Company's marketplace capabilities in Europe and provides the Company with access to the Turkish market. The Company accounted for the acquisition as a business combination. The goodwill of $4.8 million arising from the acquisition of Tridi related to expected synergies including access to the Turkish market and an established supplier network. The goodwill is included in our International reporting segment and is not deductible for tax purposes. The aggregate non-contingent portion of the purchase price was approximately $3.8 million in cash, of which approximately $0.4 million was withheld and will be paid in a future period. In addition, the purchase price included a contingent consideration arrangement to the former owner of Tridi up to a maximum amount of $1.25 million (undiscounted) in shares of the Company’s Class A common stock in two installments on the first and second anniversary of the acquisition. The contingent consideration arrangement is tied to the achievement of revenue thresholds. The initial fair value of the contingent consideration of $0.9 million was estimated by applying an income valuation approach. The measurement is based on inputs that are not observable in the market (Level 3 inputs). Key assumptions made include (a) discount rate and (b) probability weighted assumptions about achieving revenue thresholds.
The Company has performed a preliminary valuation analysis of the fair market value of the acquired assets and liabilities of Tridi. The final purchase price allocation will be determined when the Company has completed and fully reviewed all information necessary to finalize the fair value of the acquired assets and liabilities. The final allocation could differ materially from the preliminary allocation and may include changes in allocations to current assets, current liabilities and goodwill.
During the three months ended June 30, 2023, the Company recognized measurement period adjustments related to the initial fair value of the intangible asset. The Company reduced the fair value of the intangible asset from $0.6 million to $0.1 million, which resulted in $0.5 million of additional goodwill.
The following table (in thousands) summarizes the consideration paid for Tridi and the preliminary fair value of the assets acquired and liabilities assumed on the acquisition date:
Consideration: |
|
|
|
|
Cash |
|
$ |
3,824 |
|
Settlement of preexisting relationship |
|
|
357 |
|
Fair value of contingent consideration |
|
|
860 |
|
Fair value of consideration |
|
|
5,041 |
|
|
|
|
|
|
Recognized amounts of identifiable assets acquired and liabilities assumed: |
|
|
|
|
Current assets |
|
|
460 |
|
Property and equipment |
|
|
22 |
|
Intangible asset |
|
|
96 |
|
Current liabilities |
|
|
(373 |
) |
Total identifiable net assets assumed |
|
|
205 |
|
Goodwill |
|
|
4,836 |
|
Total |
|
$ |
5,041 |
|
The estimated fair value of the intangible asset acquired was determined by the Company. The Company engaged a third‑party expert to assist with the valuation analysis. The Company used a cost method to estimate the fair value of the vendor relationship using Level 3 inputs. The useful life of the vendor relationship is 10 years.
Tridi’s results of operations were included in the Company's consolidated financial statements from the date of acquisition, January 2, 2023. The acquisition of Tridi was not considered material to the Company for the periods presented, and therefore, proforma information has not been presented.
13
(8) Disaggregated Revenue and Cost of Revenue Information
The following table present our revenue and cost of revenue disaggregated by line of business. Revenue from our marketplace primarily reflects the sales of parts and assemblies on our platform. Revenue from supplier services primarily includes the sale of advertising and to a lesser extent supplies, financial service products and SaaS products.
Revenue and cost of revenue is presented in the following tables for the three and six months ended June 30, 2023 and 2022, respectively (in thousands):
|
|
For the Three Months |
|
|
For the Three Months |
|
|
For The Six Months |
|
|
For The Six Months |
|
||||
Marketplace |
|
2023 |
|
|
2022 |
|
|
2023 |
|
|
2022 |
|
||||
Revenue |
|
$ |
93,511 |
|
|
$ |
75,598 |
|
|
$ |
180,191 |
|
|
$ |
140,013 |
|
Cost of revenue |
|
|
63,914 |
|
|
|
53,492 |
|
|
|
125,661 |
|
|
|
100,233 |
|
Gross Profit |
|
$ |
29,597 |
|
|
$ |
22,106 |
|
|
$ |
54,530 |
|
|
$ |
39,780 |
|
|
|
|
|
|
|
|
|
|
|
|
|
|
||||
Supplier Services |
|
|
|
|
|
|
|
|
|
|
|
|
||||
Revenue |
|
$ |
17,497 |
|
|
$ |
20,017 |
|
|
$ |
36,143 |
|
|
$ |
39,273 |
|
Cost of revenue |
|
|
3,538 |
|
|
|
4,427 |
|
|
|
7,748 |
|
|
|
8,418 |
|
Gross Profit |
|
$ |
13,959 |
|
|
$ |
15,590 |
|
|
$ |
28,395 |
|
|
$ |
30,855 |
|
(9) Investment in Unconsolidated Joint Venture
The Company has a 50% interest in Industrial Media, LLC ("IM, LLC") with the other 50% owned by Rich Media Group, LLC. IM, LLC primarily manages content creation, advertising sales, and marketing initiatives for the Industrial Engineering News brand, certain magazines, videos, website and associated electronic media products for industrial engineers.
During the three and six months ended June 30, 2023 and June 30, 2022 the Company received dividends from IM, LLC of $0.1 million and $0.2 million, respectively, which were recorded as a reduction to the Company's investment in unconsolidated joint venture on our Condensed Consolidated Balance Sheets. During the three and six months ended June 30, 2023 and June 30, 2022, the Company recorded an expense to IM, LLC of approximately $0.1 million and $0.1 million, respectively.
(10) Stock Based Compensation
In 2014, the Company adopted a stock compensation plan (the "2014 Equity Incentive Plan") pursuant to which the Company may grant stock options, stock purchase rights, restricted stock awards, or stock awards to employees, directors and consultants (including prospective employees, directors, and consultants). This plan was terminated in February 2016. No additional awards may be granted under the 2014 Equity Incentive Plan, however, outstanding awards continue in full effect in accordance with their existing terms.
In 2016, the Company adopted a stock compensation plan (the “2016 Equity Incentive Plan”) pursuant to which the Company may grant stock options, stock purchase rights, restricted stock awards, or stock awards to employees, directors and consultants (including prospective employees, directors, and consultants). No additional awards may be granted under the 2016 Equity Incentive Plan, however, outstanding awards continue in full effect in accordance with their existing terms.
In connection with the Company’s initial public offering on July 2, 2021, the Company's board of directors adopted the 2021 Equity Incentive Plan (the “2021 Equity Incentive Plan”). The 2021 Equity Incentive Plan provides for the grant of incentive stock options (“ISOs”), non-statutory stock options (“NSOs”), stock appreciation rights, restricted stock awards, restricted stock unit awards, performance-based awards and other awards, or collectively, awards. Awards may be granted to Xometry employees, Xometry’s non-employee directors and consultants/contractors and the employees and consultants/contractors of Xometry affiliates. ISOs may be granted only to Xometry employees and the employees of Xometry affiliates.
As of June 30, 2023, there were 5,983,834 shares available for the Company to grant under the 2021 Equity Incentive Plan.
14
Stock Options
The weighted average assumptions for the six months ended June 30, 2023 and 2022 are provided in the following table.
|
|
Six Months Ended June 30, |
|
|||||
|
|
2023 |
|
|
2022 |
|
||
Valuation assumptions: |
|
|
|
|
|
|
||
Expected dividend yield |
|
—% |
|
|
—% |
|
||
Expected volatility |
|
|
80 |
% |
|
|
66 |
% |
Expected term (years) |
|
|
6.3 |
|
|
|
6.0 |
|
Risk-free interest rate |
|
|
3.8 |
% |
|
|
1.9 |
% |
Fair value of share |
|
$ |
15.82 |
|
|
$ |
34.86 |
|
A summary of the status of the Company’s stock option activity and the changes during the six months ended June 30, 2023, are as follows (in millions, except share and per share amounts):
|
|
Number of |
|
|
Weighted |
|
|
Average |
|
|
Aggregate |
|
||||
|
|
|
|
|
|
|
|
|
|
|
|
|
||||
Exercisable at December 31, 2022 |
|
|
1,391,047 |
|
|
|
6.09 |
|
|
|
7.2 |
|
|
$ |
36.4 |
|
Balance at December 31, 2022 |
|
|
2,841,419 |
|
|
|
11.33 |
|
|
|
7.7 |
|
|
|
61.4 |
|
Granted |
|
|
428,278 |
|
|
|
15.82 |
|
|
|
— |
|
|
|
— |
|
Exercised |
|
|
(155,888 |
) |
|
|
6.91 |
|
|
|
— |
|
|
|
— |
|
Forfeited |
|
|
(109,247 |
) |
|
|
17.03 |
|
|
|
— |
|
|
|
— |
|
Expired |
|
|
(4,831 |
) |
|
|
19.84 |
|
|
|
— |
|
|
|
— |
|
Balance at June 30, 2023 |
|
|
2,999,731 |
|
|
|
11.98 |
|
|
|
7.5 |
|
|
|
33.2 |
|
Exercisable at June 30, 2023 |
|
|
1,680,820 |
|
|
|
8.21 |
|
|
|
6.8 |
|
|
|
23.4 |
|
The weighted average grant date fair value of options granted during the six months ended June 30, 2023 and 2022, was $11.37 and $21.08, respectively. The total intrinsic value of options exercised during the six months ended June 30, 2023 and 2022, was $2.1 million and $15.8 million, respectively.
At June 30, 2023, there was approximately $18.7 million of total unrecognized compensation cost related to unvested stock options. That cost is expected to be recognized over a weighted average period of approximately two years as of June 30, 2023.
The Company currently uses authorized and unissued shares to satisfy share award exercises.
Restricted Stock Units
A summary of the status of the Company’s restricted stock unit activity and the changes during the six months ended June 30, 2023 are as follows (in millions, except share and per share amounts):
|
|
Number of |
|
|
Weighted |
|
|
Aggregate |
|
|||
Unvested RSUs as of December 31, 2022 |
|
|
875,902 |
|
|
|
44.37 |
|
|
$ |
28.2 |
|
Granted |
|
|
1,242,169 |
|
|
|
15.59 |
|
|
|
— |
|
Vested |
|
|
(228,968 |
) |
|
|
41.83 |
|
|
|
— |
|
Forfeited and cancelled |
|
|
(222,648 |
) |
|
|
35.11 |
|
|
|
— |
|
Unvested RSUs as of June 30, 2023 |
|
|
1,666,455 |
|
|
|
24.51 |
|
|
|
35.3 |
|
At June 30, 2023, there was approximately $36.7 million of total unrecognized compensation cost related to unvested restricted stock units granted under the 2021 Equity Incentive Plan. That cost is expected to be recognized over a weighted average period of approximately three years as of June 30, 2023.
Total stock-based compensation cost for the three and six months ended June 30, 2023 and 2022 were as follows (in
15
thousands):
|
|
Three Months Ended June 30, |
|
|
Six Months Ended June 30, |
||||||||||||
|
|
2023 |
|
|
2022 |
|
|
2023 |
|
|
2022 |
|
|
||||
|
|
|
|
|
|
|
|
|
|
|
|||||||
Sales and marketing |
|
$ |
1,185 |
|
|
$ |
1,300 |
|
|
$ |
2,237 |
|
|
$ |
1,936 |
|
|
Operations and support |
|
|
2,038 |
|
|
|
1,741 |
|
|
|
3,735 |
|
|
|
3,164 |
|
|
Product development |
|
|
1,390 |
|
|
|
1,128 |
|
|
|
2,466 |
|
|
|
2,022 |
|
|
General and administrative |
|
|
1,185 |
|
|
|
1,310 |
|
|
|
2,054 |
|
|
|
1,813 |
|
|
Total stock compensation expense |
|
$ |
5,798 |
|
|
$ |
5,479 |
|
|
$ |
10,492 |
|
|
$ |
8,935 |
|
|
(11) Income Taxes
A full valuation allowance has been established against our net U.S. federal and state deferred tax assets and foreign deferred tax assets, including net operating loss carryforwards.
The Company had less than $0.1 million of income tax benefit for the three months ended June 30, 2023, as compared to zero income tax expense/benefit in the U.S. for the three months ended June 30, 2022. During the six months ended June 30, 2023, the Company had less than $0.1 million of income tax expense in the U.S. The Company had an approximate $0.6 million income tax benefit during the same time period in 2022. This estimated annual effective tax rate of (0.2%), differs from the U.S. federal statutory rate primarily due to the effects of certain permanent items, foreign tax rate differences, and increases in the valuation allowance against deferred tax assets.
Net Operating Loss and Credit Carryforwards
As of December 31, 2022, the Company has net operating loss (“NOL”) carryforwards for U.S. federal income tax purposes, and similar state amounts, of approximately $224.6 million available to reduce future income subject to income taxes before limitations. As of December 31, 2022, the Company had a net operating loss carryforward for tax purposes related to its foreign subsidiaries of $33.8 million. U.S. federal net operating carryforwards generated prior to 2018 in the approximate amount of $71.9 million will begin to expire, if not utilized, in 2023. Our non-U.S. net operating loss and U.S. federal net operating losses post 2017 have an indefinite life. Under the provisions of U.S. Internal Revenue Code Section 382, certain substantial changes in the Company’s ownership may result in a limitation in the amount of U.S. net operating loss carryforwards that can be utilized annually to offset future taxable income.
(12) Net Loss Per Share Attributable to Common Stockholders
The Company computes net loss per share of Class A common stock, Class B common stock and participating securities using the two-class method. Basic and diluted EPS are the same for each class of common stock and participating securities because they are entitled to the same liquidation and dividend rights. The following table sets forth the computation of basic and diluted net loss per share attributable to common stockholders (in thousands, except share and per share data):
|
|
Three Months Ended June 30, |
|
|
Six Months Ended June 30, |
|
||||||||||
|
|
2023 |
|
|
2022 |
|
|
2023 |
|
|
2022 |
|
||||
Net loss |
|
$ |
(26,559 |
) |
|
$ |
(16,549 |
) |
|
$ |
(44,902 |
) |
|
$ |
(36,544 |
) |
Net (loss) income attributable to noncontrolling interest |
|
|
(5 |
) |
|
|
4 |
|
|
|
(4 |
) |
|
|
21 |
|
Net loss attributable to common stockholders |
|
$ |
(26,554 |
) |
|
$ |
(16,553 |
) |
|
$ |
(44,898 |
) |
|
$ |
(36,565 |
) |
|
|
|
|
|
|
|
|
|
|
|
|
|
||||
Weighted-average number of shares outstanding used to compute net loss per share attributable to common stockholders, basic and diluted, of Class A and Class B common stock |
|
|
47,865,990 |
|
|
|
47,074,246 |
|
|
|
47,783,235 |
|
|
|
46,932,702 |
|
Net loss per share attributable to common stockholders, basic and diluted, of Class A and Class B common stock |
|
$ |
(0.55 |
) |
|
$ |
(0.35 |
) |
|
$ |
(0.94 |
) |
|
$ |
(0.78 |
) |
16
The following outstanding shares of potentially dilutive securities were excluded from the computation of diluted net loss per share because including them would have had an anti-dilutive effect, or issuance of such shares is contingent upon the occurrence of an event:
|
|
June 30, |
|
|||||
|
|
2023 |
|
|
2022 |
|
||
Stock options outstanding |
|
|
2,999,731 |
|
|
|
3,009,727 |
|
Unvested restricted stock units |
|
|
1,666,455 |
|
|
|
850,621 |
|
Warrants outstanding |
|
|
87,784 |
|
|
|
87,784 |
|
Shares reserved for charitable contribution |
|
|
281,860 |
|
|
|
322,126 |
|
Convertible notes |
|
|
5,123,624 |
|
|
|
5,123,624 |
|
Total shares |
|
|
10,159,454 |
|
|
|
9,393,882 |
|
(13) Debt Commitments and Contingencies
2027 Convertible Notes
In February 2022, we entered into a purchase agreement with certain counterparties for the sale of an aggregate of $287.5 million principal amount of convertible senior notes due in 2027 (the “2027 Notes”) in a private offering to qualified institutional buyers pursuant to Rule 144A under the Securities Act of 1933, as amended (the “Securities Act”). The 2027 Notes consisted of a $250 million initial placement and an over-allotment option that provided the initial purchasers of the 2027 Notes with the option to purchase an additional $37.5 million aggregate principal amount of the 2027 Notes, which was fully exercised. The 2027 Notes were issued pursuant to an indenture dated February 4, 2022. The net proceeds from the issuance of the 2027 Notes were $278.2 million, net of debt issuance costs. The debt issuance costs are amortized to interest expense using the effective interest rate method.
The 2027 Notes are unsecured obligations which bear regular interest at 1% per annum and for which the principal balance will not accrete. Interest payment are due on February 1 and August 1 of each year the Notes remain outstanding. The 2027 Notes will mature on February 1, 2027 unless repurchased, redeemed, or converted in accordance with their terms prior to such date.
The 2027 Notes are convertible into cash, shares of our Class A common stock, or a combination of cash and shares of our Class A common stock, at our election, at an initial conversion rate of 17.8213 shares of Class A common stock per $1,000 principal amount of 2027 Notes, which is equivalent to an initial conversion price of approximately $56.11 per share of our Class A common stock. The conversion rate is subject to customary adjustments for certain events as described in the indenture governing the 2027 Notes.
We may redeem for cash all or any portion of the 2027 Notes, at our option, on or after February 5, 2025 if the last reported sale price of our Class A common stock has been at least 130% of the conversion price then in effect for at least 20 trading days at a redemption price equal to 100% of the principal amount of the 2027 Notes to be redeemed, plus accrued and unpaid interest or additional interest, if any.
Holders of the 2027 Notes may convert all or a portion of their 2027 Notes at their option prior to November 1, 2026, in multiples of $1,000 principal amounts, only under the following circumstances:
On or after November 1, 2026, the 2027 Notes are convertible at any time until the close of business on the second scheduled trading day immediately preceding the maturity date.
Holders of the 2027 Notes who convert the 2027 Notes in connection with a make-whole fundamental change, as defined in the indenture governing the 2027 Notes, or in connection with a redemption are entitled to an increase in the conversion rate. Additionally, in the event of a fundamental change, holders of the 2027 Notes may require us to repurchase all or a portion of the 2027 Notes at a price equal to 100% of the principal amount of 2027 Notes, plus any accrued and unpaid special interest, if any.
17
We accounted for the issuance of the 2027 Notes as a single liability measured at its amortized cost, as no other embedded features require bifurcation and recognition as derivatives.
|
|
June 30, |
|
|
December 31, |
|
||
|
|
2023 |
|
|
2022 |
|
||
Principal |
|
$ |
287,500 |
|
|
|
287,500 |
|
Unamortized debt discount |
|
|
(6,181 |
) |
|
|
(7,044 |
) |
Unamortized debt issuance costs |
|
|
(479 |
) |
|
|
(547 |
) |
Net carrying value |
|
$ |
280,840 |
|
|
|
279,909 |
|
The annual effective interest rate for the 2027 Notes was approximately 1.6%. Interest expense related to the 2027 Notes for the periods presented below was as follows (in thousands):
|
|
Three Months Ended |
|
|
Three Months Ended |
|
|
Six Months Ended |
|
|
Six Months Ended |
|
||||
|
|
2023 |
|
|
2022 |
|
|
2023 |
|
|
2022 |
|
||||
Coupon interest |
|
$ |
719 |
|
|
$ |
719 |
|
|
$ |
1,438 |
|
|
$ |
1,168 |
|
Amortization of debt discount |
|
|
431 |
|
|
|
431 |
|
|
|
862 |
|
|
|
719 |
|
Amortization of transaction costs |
|
|
33 |
|
|
|
38 |
|
|
|
68 |
|
|
|
62 |
|
Total interest expense |
|
$ |
1,183 |
|
|
$ |
1,188 |
|
|
$ |
2,368 |
|
|
$ |
1,949 |
|
|
|
|
|
|
|
|
|
|
|
|
|
|
||||
The following table presents the carrying value and estimated fair value of the 2027 Notes as of the date indicated (in thousands):
|
|
June 30, 2023 |
|
|
December 31, 2022 |
|
||||||||||
|
|
Carrying Value |
|
|
Fair Value |
|
|
Carrying Value |
|
|
Fair Value |
|
||||
2027 Notes(1) |
|
$ |
280,840 |
|
|
$ |
265,334 |
|
|
$ |
279,909 |
|
|
$ |
257,671 |
|
(1) At December 31, 2022, the fair value is estimated using a discounted cash flow analysis, using interest rate that we believe are offered for similar borrowings (a Level 3 measurement). As of June 30, 2023, the fair value of the 2027 Notes was measured using Level 2 inputs based on the frequency of trading on our debt at the end of the quarter.
Contingencies
The Company from time to time may be subject to various claims and legal proceedings covering a range of matters that arise in the ordinary course of its business activities. In the opinion of the Company, although the outcome of any legal proceedings cannot be predicted with certainty, the ultimate liability of the Company in connection with its legal proceedings is not expected to have a material adverse effect on the Company’s financial position or operations.
Restructuring
In December 2022 and May 2023, the Company reduced its workforce to help manage its operating expenses. During the three months ended June 30, 2023, the Company incurred $0.7 million for employee termination costs related to the May 2023 restructuring.
The following table shows the total amount incurred and the liability, which was recorded in accrued expenses in the Condensed Consolidated Balance Sheets, for restructuring-related employee termination benefits as of December 31, 2022 and June 30, 2023 (in thousands):
|
|
Employee Termination Benefits |
|
|
|
|
|
|
|
Accrued restructuring costs as of December 31, 2022 |
|
$ |
1,549 |
|
Restructuring costs incurred during the six months ended June 30, 2023 |
|
|
738 |
|
Amount paid during the period ended June 30, 2023 |
|
|
(2,014 |
) |
Accrued restructuring costs as of June 30, 2023 |
|
$ |
273 |
|
18
The following table shows the total restructuring costs incurred during the three and six months ended June 30, 2023 and 2022 (in thousands):
|
|
Three Months Ended June 30, |
|
|
For the Six Months Ended June 30, |
|
||||||||||
|
|
2023 |
|
|
2022 |
|
|
2023 |
|
|
2023 |
|
||||
|
|
|
|
|
|
|
|
|
|
|
|
|
||||
Sales and marketing |
|
$ |
224 |
|
|
$ |
- |
|
|
$ |
224 |
|
|
$ |
- |
|
Operations and support |
|
|
230 |
|
|
|
- |
|
|
|
230 |
|
|
|
- |
|
Product development |
|
|
117 |
|
|
|
- |
|
|
|
117 |
|
|
|
- |
|
General and administrative |
|
|
167 |
|
|
|
- |
|
|
|
167 |
|
|
|
- |
|
Total restructure charge |
|
$ |
738 |
|
|
$ |
- |
|
|
$ |
738 |
|
|
$ |
- |
|
Exit from the Supplies Business
The Company previously provided suppliers with access to competitively priced tools, material and supplies in the U.S. As a result of exiting the supplies business during the second quarter of 2023, the Company recognized $0.6 million of costs associated with its closure, of which $0.2 million is recognized in cost of revenue and $0.4 million is recognized in operations and support on the Condensed Consolidated Statements of Operations and Comprehensive Loss.
Defined Contribution Plans
The Company sponsors a defined contribution plan for qualifying employees, including a 401(k) Plan in the United States to which it makes matching contributions of 50% of participating employee contributions up to 6% of eligible income. The Company's total matching contribution to the 401(k) Plan was $0.6 million and $0.4 million for the three months ended June 31, 2023 and 2022, respectively and was $1.2 million and $0.8 million for the six months ended June 30, 2023 and 2022, respectively.
(14) Segments
Xometry is organized in two segments referred to as: (1) the U.S. and (2) International. Xometry’s operating segments are also the Company’s reportable segments. Xometry’s reportable segments, whose products and offerings are generally the same, are managed separately based on geography. Xometry’s two segments are defined based on the reporting and review process used by the chief operating decision maker (“CODM”), the Chief Executive Officer. The Company evaluates the performance of the operating segments primarily based on revenue and segment “profits/loss” which is largely the results of the segment before income taxes. The Company has not allocated certain general and administrative expenses to the International segment. The Company’s CODM monitors assets of the consolidated Company, but does not use assets by operating segment when assessing performance or making operating segment resource decisions.
The following tables reflect certain segment information for the three and six months ended June 30, 2023 and 2022 (in thousands):
|
|
Three Months Ended June 30, |
|
|
Six Months Ended June 30, |
|
||||||||||
|
|
2023 |
|
|
2022 |
|
|
2023 |
|
|
2022 |
|
||||
Segment Revenue |
|
|
|
|
|
|
|
|
|
|
|
|
||||
U.S. |
|
$ |
95,433 |
|
|
$ |
87,675 |
|
|
$ |
189,336 |
|
|
$ |
163,724 |
|
International |
|
|
15,575 |
|
|
|
7,940 |
|
|
|
26,998 |
|
|
|
15,562 |
|
Total |
|
$ |
111,008 |
|
|
$ |
95,615 |
|
|
$ |
216,334 |
|
|
$ |
179,286 |
|
|
|
Three Months Ended June 30, |
|
|
Six Months Ended June 30, |
|
||||||||||
|
|
2023 |
|
|
2022 |
|
|
2023 |
|
|
2022 |
|
||||
Segment Losses |
|
|
|
|
|
|
|
|
|
|
|
|
||||
U.S. |
|
$ |
(22,912 |
) |
|
$ |
(11,222 |
) |
|
$ |
(35,849 |
) |
|
$ |
(26,245 |
) |
International |
|
|
(3,642 |
) |
|
|
(5,331 |
) |
|
|
(9,049 |
) |
|
|
(10,320 |
) |
Total |
|
$ |
(26,554 |
) |
|
$ |
(16,553 |
) |
|
$ |
(44,898 |
) |
|
$ |
(36,565 |
) |
19
(15) Goodwill and Intangible Assets
The following tables summarize the Company’s intangible assets (dollars in thousands):
|
|
June 30, 2023 |
|
|||||||||||||
|
|
Weighted |
|
|
Gross |
|
|
Accumulated |
|
|
Net |
|
||||
|
|
|
|
|||||||||||||
Intangible Assets |
|
|
|
|
|
|
|
|
|
|
|
|
||||
Amortizing intangible assets: |
|
|
|
|
|
|
|
|
|
|
|
|
||||
Customer Relationships |
|
|
15 |
|
|
$ |
36,652 |
|
|
$ |
3,863 |
|
|
$ |
32,789 |
|
Trade Names |
|
|
10 |
|
|
|
841 |
|
|
|
166 |
|
|
|
675 |
|
Developed Technology |
|
|
5 |
|
|
|
740 |
|
|
|
265 |
|
|
|
475 |
|
Vendor Relationships |
|
|
13 |
|
|
|
1,336 |
|
|
|
349 |
|
|
|
987 |
|
Database |
|
|
5 |
|
|
|
2,400 |
|
|
|
750 |
|
|
|
1,650 |
|
Patents |
|
|
17 |
|
|
|
157 |
|
|
|
47 |
|
|
|
110 |
|
Subtotal intangible assets |
|
|
|
|
|
42,126 |
|
|
|
5,440 |
|
|
|
36,686 |
|
|
In-place Lease Intangible Asset |
|
|
4 |
|
|
|
568 |
|
|
|
214 |
|
|
|
354 |
|
Above Market Lease Intangible Asset |
|
|
4 |
|
|
|
896 |
|
|
|
347 |
|
|
|
549 |
|
Total intangible assets |
|
|
|
|
$ |
43,590 |
|
|
$ |
6,001 |
|
|
$ |
37,589 |
|
|
|
|
December 31, 2022 |
|
|||||||||||||
|
|
Weighted |
|
|
Gross |
|
|
Accumulated |
|
|
Net |
|
||||
Intangible Assets |
|
|
|
|
|
|
|
|
|
|
|
|
||||
Amortizing intangible assets: |
|
|
|
|
|
|
|
|
|
|
|
|
||||
Customer Relationships |
|
|
15 |
|
|
$ |
36,652 |
|
|
$ |
2,638 |
|
|
$ |
34,014 |
|
Trade Names |
|
|
10 |
|
|
|
841 |
|
|
|
97 |
|
|
|
744 |
|
Developed Technology |
|
|
5 |
|
|
|
739 |
|
|
|
182 |
|
|
|
557 |
|
Vendor Relationships |
|
|
15 |
|
|
|
1,267 |
|
|
|
299 |
|
|
|
968 |
|
Database |
|
|
5 |
|
|
|
2,400 |
|
|
|
510 |
|
|
|
1,890 |
|
Patents |
|
|
17 |
|
|
|
157 |
|
|
|
42 |
|
|
|
115 |
|
Subtotal intangible assets |
|
|
|
|
|
42,056 |
|
|
|
3,768 |
|
|
|
38,288 |
|
|
In-place Lease Intangible Asset |
|
|
4 |
|
|
|
548 |
|
|
|
143 |
|
|
|
405 |
|
Above Market Lease Intangible Asset |
|
|
4 |
|
|
|
896 |
|
|
|
238 |
|
|
|
658 |
|
Total intangible assets |
|
|
|
|
$ |
43,500 |
|
|
$ |
4,149 |
|
|
$ |
39,351 |
|
|
The following tables provides a roll forward of the carrying amount of goodwill (in thousands):
|
|
|
|
|
|
|
||
|
|
2023 |
|
|
2022 |
|
||
|
|
|
|
|
|
|
||
Balance as of January 1: |
|
|
|
|
|
|
||
Gross goodwill |
|
$ |
261,110 |
|
|
$ |
257,746 |
|
Accumulated impairments |
|
|
(3,074 |
) |
|
|
(3,074 |
) |
Net goodwill as of January 1 |
|
|
258,036 |
|
|
|
254,672 |
|
Goodwill acquired during the year(1) |
|
|
4,836 |
|
|
|
3,364 |
|
Impact of foreign exchange |
|
|
130 |
|
|
|
— |
|
Net goodwill as of June 30, 2023, and December 31, 2022 |
|
$ |
263,002 |
|
|
$ |
258,036 |
|
(1) See Note 7 - Acquisitions.
As of June 30, 2023 and December 31, 2022, Xometry had $263.0 million and $258.0 million, respectively of goodwill. As of June 30, 2023, $258.0 million is part of Xometry's U.S. operating segment and $5.0 million is part of Xometry's International operating segment. As of December 31, 2022, $258.0 million is part of Xometry's U.S. operating segment.
20
As of June 30, 2023, estimated amortization expense for intangible assets for the remainder of 2023 and the next five years is: $1.8 million in 2023, $3.6 million in 2024, $3.6 million in 2025, $3.2 million in 2026, $2.6 million in 2027, $2.6 million in 2028 and $20.2 million thereafter.
Amortization expense for the three and six months ended June 30, 2023 and 2022 was as follows (in thousands):
|
|
Three Months Ended June 30, |
|
|
Six Months Ended June 30, |
|
||||||||||
|
|
2023 |
|
|
2022 |
|
|
2023 |
|
|
2022 |
|
||||
Sales and marketing |
|
$ |
789 |
|
|
|
776 |
|
|
$ |
1,580 |
|
|
|
1,550 |
|
Product development |
|
|
42 |
|
|
|
82 |
|
|
|
84 |
|
|
|
171 |
|
General and administrative (1) |
|
|
10 |
|
|
|
206 |
|
|
|
13 |
|
|
|
208 |
|
Total |
|
$ |
841 |
|
|
$ |
1,064 |
|
|
$ |
1,677 |
|
|
$ |
1,929 |
|
(1) Amortization of the lease related intangible assets is recorded as operating lease expense in general and administrative.
21
Item 2. Management’s Discussion and Analysis of Financial Condition and Results of Operations.
The following discussion and analysis should be read in conjunction with our unaudited condensed consolidated financial statements and the related notes thereto included elsewhere in this Quarterly Report on Form 10-Q. The discussion contains forward-looking statements that are based on the beliefs of management, as well as assumptions made by, and information currently available to, our management. Actual results could differ materially from those discussed in or implied by forward-looking statements as a result of various factors, including those discussed in Part II, Item 1A, "Risk Factors" in our Annual Report on Form 10-K for the year ended December 31, 2022. Our historical results are not necessarily indicative of the results that may be expected in the future and our current quarterly results are not necessarily indicative of the results expected for the full year or any other period.
Overview
Xometry, Inc. (“Xometry”, “Company”, “our” or “we”) was incorporated in the State of Delaware in May 2013. Xometry is a global online marketplace connecting buyers with suppliers of manufacturing services, transforming one of the largest industries in the world. We use our proprietary technology to create a marketplace that enables buyers to efficiently source manufactured parts and assemblies, and empower suppliers of manufacturing services to grow their businesses. Xometry's corporate headquarters is located in North Bethesda, Maryland.
Our AI-enabled technology platform is powered by proprietary machine learning algorithms and a dataset, resulting in a sophisticated marketplace for manufacturing. As a result, buyers can procure the products they want on demand and suppliers can source new manufacturing opportunities that match their specific capabilities and capacity. Interactions on our platform provide rich data insights that allow us to continuously improve our AI models and create new products and services, fueling powerful network effects as we scale.
We use proprietary technology to enable product designers, engineers, buyers, and supply chain professionals to instantly access the capacity of a global network of manufacturing facilities. The Company’s platform makes it possible for buyers to quickly receive pricing, expected lead times, manufacturability feedback and place orders on the Company’s platform. The network allows the Company to provide high volumes of unique parts, including custom components and aftermarket parts for its buyers.
Our mission is to accelerate innovation by providing real time, equitable access to global manufacturing capacity and demand. Our vision is to drive efficiency, sustainability and innovation for industries worldwide by lowering the barriers to entry to the manufacturing ecosystem.
Our business benefits from a virtuous network liquidity effect, because adding buyers to our platform generates greater demand on our marketplace which in turn attracts more suppliers to the platform, allowing us to rapidly scale and increase the number of manufacturing processes offered on our platform. In order to continue to meet the needs of buyers and remain highly competitive, we expect to continue to add suppliers to our platform that have new and innovative manufacturing processes. Thus, our platform is unbounded by the in-house manufacturing capacity and processes of our current suppliers.
We define “buyers” as individuals who have placed an order to purchase on-demand parts or assemblies on our marketplace. Our buyers include engineers, product designers, procurement and supply chain personnel, inventors and business owners from businesses of a variety of sizes, ranging from self-funded start-ups to Fortune 100 companies. We define “accounts” as an individual entity, such as a sole proprietor with a single buyer or corporate entities with multiple buyers, having purchased at least one part on our marketplace. We define “suppliers” as individuals or businesses who have been approved by us to either manufacture a product on our platform for a buyer or have utilized our supplier services, including our financial services or the purchase of supplies.
The majority of our revenue is derived from the sale of part(s) and assemblies to our customers on our marketplace, which we refer to as marketplace revenue. The suppliers on our platform offer a diversified mix of manufacturing processes. These manufacturing processes include computer numerical control (“CNC”) manufacturing, sheet metal forming, sheet cutting, 3D printing (including fused deposition modeling, direct metal laser sintering, PolyJet, stereolithography, selective laser sintering, binder jetting, carbon digital light synthesis, multi jet fusion and lubricant sublayer photo-curing), die casting, stamping, injection molding, urethane casting, tube cutting, tube bending, as well as finishing services, rapid prototyping and high-volume production. We enable buyers to source these processes to meet complex and specific design and order needs across several industries, including Aerospace, Healthcare, Robotics, Industrial, Energy, Automotive, Defense, Government, Education and Consumer Goods.
We empower suppliers to grow their manufacturing businesses and improve machine uptime by providing access to an extensive, diverse base of buyers. We also offer suppliers supporting products and services to meet their unique needs. Our suite of supplier services includes a cloud-based manufacturing execution system (“Workcenter”) to help suppliers optimize their productivity and financial service products to stabilize and enhance cash flow. In addition, we offer suppliers digital marketing and data solutions.
Our supplier services revenue primarily includes the sale of marketing services, which includes advertising, and to a lesser extent, financial service products that help our customers better manage cash flow at all stages of job production and supplies. Our financial services products, such as Xometry Pay, enable suppliers to stabilize and enhance their cash flows and resource management tools to optimize their businesses. In 2021, we acquired Thomas Publishing Company (“Thomas”) and Fusiform, Inc.
22
(d/b/a FactoryFour) (“FactoryFour”), expanding our basket of supplier services to include marketing and advertising services and to a lesser extent a SaaS based solutions to help suppliers optimize their productivity. Our revenue from Thomas is primarily advertising revenue.
On January 2, 2023, the Company acquired Tridi Teknoloj A.S. (“Tridi”) located in Istanbul, Türkiye pursuant to a Share Purchase Agreement. The acquisition of Tridi extends our marketplace capabilities in Europe and provides us access to the Turkish market.
In May 2023, the Company reduced its workforce by approximately 4% to help manage its operating expenses. During the three months ended June 30, 2023, the Company incurred $0.7 million for employee termination costs related to the May 2023 restructuring.
The following table shows the total restructuring costs incurred during the three months ended June 30, 2023 (in thousands):
|
|
Three Months Ended June 30, |
|
|
|
|
2023 |
|
|
Sales and marketing |
|
$ |
224 |
|
Operations and support |
|
|
230 |
|
Product development |
|
|
117 |
|
General and administrative |
|
|
167 |
|
Total restructure charge |
|
$ |
738 |
|
In addition, the Company previously provided suppliers with access to competitively priced tools, material and supplies in the U.S. As a result of exiting the supplies business during the second quarter of 2023, the Company recognized $0.6 million of costs associated with its closure, of which $0.2 million is recognized in cost of revenue and $0.4 million is recognized in operations and support on the Condensed Consolidated Statements of Operations and Comprehensive Loss.
Unfavorable conditions in the economy both in the United States and abroad may negatively affect the growth of our business and our results of operations. For example, macroeconomic events, including changes in inflation, the U.S. Federal Reserve raising interest rates, disruptions in access to bank deposits or lending commitments due to bank failures, the Russia-Ukraine war and the COVID-19 pandemic, have led to economic uncertainty globally. Historically, during periods of economic uncertainty and downturns, businesses may slow spending on information technology and manufacturing, which may impact our business and our customers’ businesses.
The effect of macroeconomic conditions may not be fully reflected in our results of operations until future periods. If, however, economic uncertainty increases or the global economy worsens, our business, financial condition and results of operations may be harmed. For further discussion of the potential impacts of macroeconomic events on our business, financial condition, and operating results.
23
Key Marketplace Operational and Business Metrics
In addition to the measures presented in our condensed consolidated financial statements included elsewhere in this Quarterly Report on Form 10-Q, we use the following key operational and business metrics to help us evaluate our marketplace business, measure our performance, identify trends affecting our business, formulate business plans and develop forecasts, and make strategic decisions:
Active Buyers
We define Active Buyers as the number of buyers who have made at least one purchase on our marketplace during the last twelve months. An increase or decrease in the number of Active Buyers is a key indicator of our ability to attract, retain and engage buyers on our platform.
Active Buyers has consistently grown over time. The number of Active Buyers on our platform reached 48,294 as of June 30, 2023, up 44% from 33,491 as of June 30, 2022. The key drivers of Active Buyer growth are continued account and buyer engagement and the success of our strategy to attract new buyers.
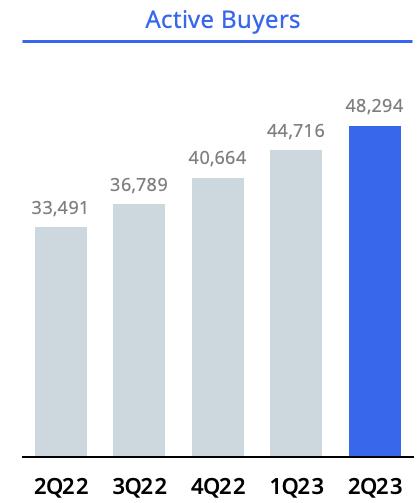
24
Percentage of Revenue from Existing Accounts
We define an existing account as an account where at least one buyer has made a purchase on our marketplace. We believe the efficiency and transparency of our business model leads to increasing account stickiness and spend over time. Buyers can utilize our marketplace for both one-off and recurring manufacturing opportunities. For example, a buyer may choose to utilize our marketplace’s CNC manufacturing processes to manufacture a discrete component for a prototype, and then may choose to later use our marketplace to mass produce that same component. A buyer may also recommend our marketplace to other engineers within their organizations who are designing other products and who may use an entirely different set of manufacturing processes, deepening our reach and stickiness with an account.
For the quarter ended June 30, 2023, 96% of our revenue was generated from existing accounts. We believe the repeat purchase activity from existing accounts reflects the underlying strength of our business and provides us with substantial revenue visibility and predictability.
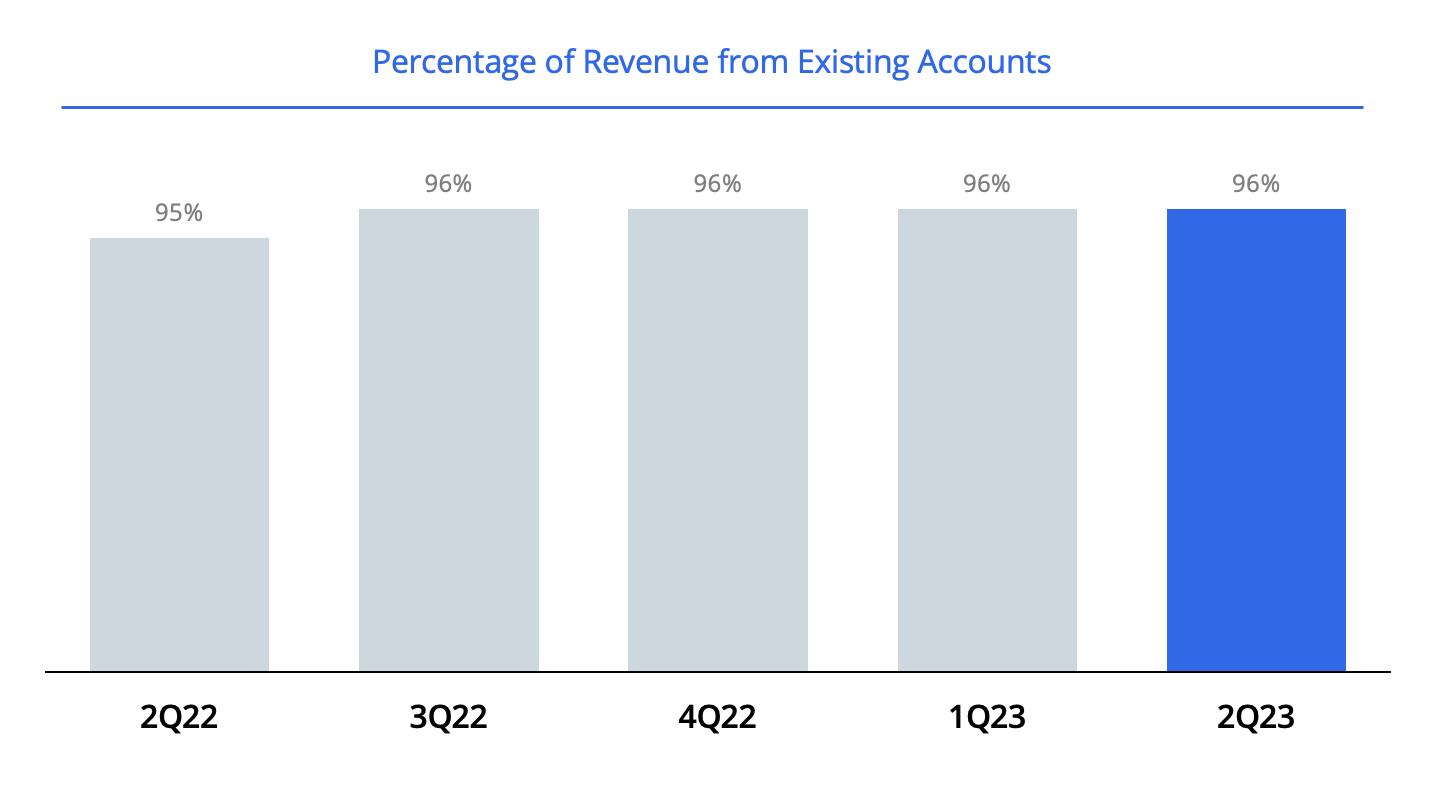
Accounts with Last Twelve-Month Spend of At Least $50,000
Accounts with Last Twelve-Month, or LTM, Spend of At Least $50,000 means an account that has spent at least $50,000 on our marketplace in the most recent twelve-month period. We view the acquisition of an account as a foundation for the addition of long-term buyers to our marketplace. Once an account joins our platform, we aim to expand the relationship and increase engagement and spending activities from that account over time. The number of accounts with LTM Spend of at least $50,000 on our platform reached 1,159 as of June 30, 2023, up 30% from 894 as of June 30, 2022.
25
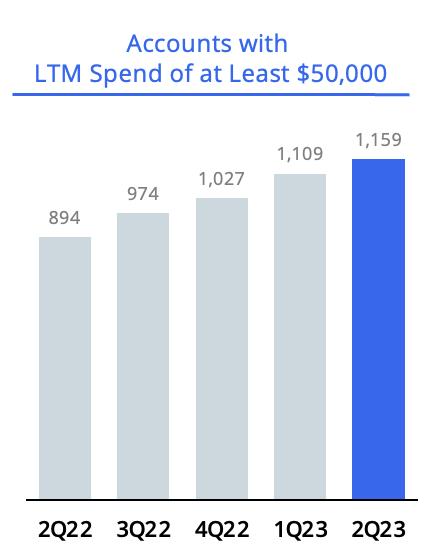
Active Paying Suppliers
We define Active Paying Suppliers as individuals or businesses who have purchased one or more of our supplier services, including digital marketing services, data services, financial services or supplies on our platforms during the last twelve months. An increase or decrease in the number of Active Paying Suppliers is a key indicator of our ability to engage suppliers on our platform.
Active Paying Suppliers has consistently grown over time. The number of Active Paying Suppliers on our platform reached 7,553 as of June 30, 2023, up 5% from 7,202 as of June 30, 2022. The key drivers of Active Paying Suppliers are continued supplier engagement and the success of our strategy to attract new suppliers.
Adjusted EBITDA
We define Adjusted EBITDA as net loss, adjusted for interest expense, interest and dividend income and other expenses, income tax provision (benefit), and certain other non-cash or non-recurring items impacting net loss from time to time, principally comprised of depreciation and amortization, amortization of lease intangible, stock-based compensation, charitable contributions of common stock, income from an unconsolidated joint venture, impairment of assets, lease abandonment, restructuring charges, costs to exit the supplies business and acquisition and other adjustments not reflective of the Company's ongoing business, such as adjustments related to purchase accounting, the revaluation of contingent consideration and transaction costs. Adjusted EBITDA is a performance measure that we use to assess our operating performance and the operating leverage in our business. Adjusted EBITDA Margin is calculated by dividing Adjusted EBITDA for a period by revenue for the same period.
For the three months ended June 30, 2023, Adjusted EBITDA loss increased to $(8.7) million, as compared to Adjusted EBITDA loss of $(8.3) million for the same quarter in 2022. For the quarter ended June 30, 2023, Adjusted EBITDA Margin decreased to (8)% of revenue, as compared to (9)% of revenue for the same quarter in 2022, driven primarily by increased operating efficiencies as we continue to grow our revenue and margins faster than our expenses.
26
For the six months ended June 30, 2023, Adjusted EBITDA loss increased to $(20.4) million, as compared to Adjusted EBITDA loss of $(21.0) million for the same period in 2022. For the six months ended June 30, 2023, Adjusted EBITDA Margin decreased to (9)% of revenue, as compared to (12)% of revenue for the same period in 2022, driven primarily by increased operating efficiencies as we continue to grow our revenue and margins faster than our expenses.
|
|
Three Months Ended June 30, |
|
|
Six Months Ended June 30, |
|
||||||||||
|
|
2023 |
|
|
2022 |
|
|
2023 |
|
|
2022 |
|
||||
Net loss |
|
$ |
(26,559 |
) |
|
$ |
(16,549 |
) |
|
$ |
(44,902 |
) |
|
$ |
(36,544 |
) |
Add (deduct) |
|
|
|
|
|
|
|
|
|
|
|
|
||||
Interest expense, interest and dividend income and other expenses |
|
|
(1,190 |
) |
|
|
1,217 |
|
|
|
(2,704 |
) |
|
|
2,852 |
|
Depreciation and amortization |
|
|
2,895 |
|
|
|
2,008 |
|
|
|
5,461 |
|
|
|
3,807 |
|
Amortization of lease intangible |
|
|
257 |
|
|
|
333 |
|
|
|
590 |
|
|
|
666 |
|
(Benefit) provision for income taxes |
|
|
(67 |
) |
|
|
— |
|
|
|
69 |
|
|
|
(559 |
) |
Stock based compensation |
|
|
5,798 |
|
|
|
5,479 |
|
|
|
10,492 |
|
|
|
8,935 |
|
Lease abandonment |
|
|
8,706 |
|
|
|
— |
|
|
|
8,706 |
|
|
|
— |
|
Acquisition and other |
|
|
196 |
|
|
|
(1,923 |
) |
|
|
226 |
|
|
|
(1,284 |
) |
Charitable contribution of common stock |
|
|
— |
|
|
|
1,285 |
|
|
|
370 |
|
|
|
1,285 |
|
Income from unconsolidated joint venture |
|
|
(237 |
) |
|
|
(269 |
) |
|
|
(303 |
) |
|
|
(303 |
) |
Impairment of assets |
|
|
219 |
|
|
|
119 |
|
|
|
246 |
|
|
|
119 |
|
Restructuring charge |
|
|
738 |
|
|
|
— |
|
|
|
738 |
|
|
|
— |
|
Costs to exit the supplies business |
|
|
586 |
|
|
|
— |
|
|
|
586 |
|
|
|
— |
|
Adjusted EBITDA |
|
$ |
(8,658 |
) |
|
$ |
(8,300 |
) |
|
$ |
(20,425 |
) |
|
$ |
(21,026 |
) |
Non-GAAP Net Loss
We define Non-GAAP net loss, as net loss adjusted for depreciation and amortization, stock-based compensation expense, amortization of lease intangible, amortization of deferred costs on convertible notes, losses on marketable securities, loss on sale of property and equipment, charitable contributions of common stock, impairment of assets, lease abandonment and termination, restructuring charges, costs to exit the supplies business and acquisition and other adjustments not reflective of the Company's ongoing business, such as adjustments related to purchase accounting, the revaluation of contingent consideration and transaction costs.
|
|
For the Three Months |
|
|
For the Six Months |
|
||||||||||
|
|
2023 |
|
|
2022 |
|
|
2023 |
|
|
2022 |
|
||||
Non-GAAP Net Loss: |
|
|
|
|
|
|
|
|
|
|
|
|
||||
Net loss |
|
$ |
(26,559 |
) |
|
$ |
(16,549 |
) |
|
$ |
(44,902 |
) |
|
$ |
(36,544 |
) |
Add (deduct): |
|
|
|
|
|
|
|
|
|
|
|
|
||||
Depreciation and amortization |
|
|
2,895 |
|
|
|
2,008 |
|
|
|
5,461 |
|
|
|
3,807 |
|
Stock-based compensation |
|
|
5,798 |
|
|
|
5,479 |
|
|
|
10,492 |
|
|
|
8,935 |
|
Amortization of lease intangible |
|
|
257 |
|
|
|
333 |
|
|
|
590 |
|
|
|
666 |
|
Amortization of deferred costs on convertible notes |
|
|
464 |
|
|
|
469 |
|
|
|
930 |
|
|
|
781 |
|
Loss on marketable securities |
|
|
— |
|
|
|
332 |
|
|
|
— |
|
|
|
1,190 |
|
Acquisition and other |
|
|
196 |
|
|
|
(1,923 |
) |
|
|
226 |
|
|
|
(1,284 |
) |
Loss on sale of property and equipment |
|
|
1 |
|
|
|
— |
|
|
|
92 |
|
|
|
71 |
|
Charitable contribution of common stock |
|
|
— |
|
|
|
1,285 |
|
|
|
370 |
|
|
|
1,285 |
|
Lease abandonment and termination |
|
|
8,778 |
|
|
|
— |
|
|
|
8,778 |
|
|
|
— |
|
Impairment of assets |
|
|
219 |
|
|
|
119 |
|
|
|
246 |
|
|
|
119 |
|
Restructuring charge |
|
|
738 |
|
|
|
— |
|
|
|
738 |
|
|
|
— |
|
Costs to exit the supplies business |
|
|
586 |
|
|
|
— |
|
|
|
586 |
|
|
|
— |
|
Non-GAAP Net Loss |
|
$ |
(6,627 |
) |
|
$ |
(8,447 |
) |
|
$ |
(16,393 |
) |
|
$ |
(20,974 |
) |
27
For the three months ended June 30, 2023, Non-GAAP net loss decreased to $(6.6) million, as compared to Non-GAAP net loss of $(8.4) million for the same quarter in 2022. For the quarter ended June 30, 2023, Non-GAAP net loss decreased to (6)% of revenue, as compared to (9)% of revenue for the same quarter in 2022.
For the six months ended June 30, 2023, Non-GAAP net loss decreased to $(16.4) million, as compared to Non-GAAP net loss of $(21.0) million for the same period in 2022. For the six months ended June 30, 2023, Non-GAAP net loss decreased to (8)% of revenue, as compared to (12)% of revenue for the same period in 2022.
Adjusted EBITDA and Non-GAAP net loss are non-GAAP financial measures that we use, in addition to our GAAP financial measures, to evaluate our business. We have included Adjusted EBITDA and Non-GAAP net loss in this filing because they are key measures used by our management to evaluate our operating performance. Accordingly, we believe that Adjusted EBITDA and Non-GAAP net loss provide useful information to investors and others in understanding and evaluating our operating results in the same manner as our management team and board of directors. Our calculation of Adjusted EBITDA and Non-GAAP net loss may differ from similarly titled non-GAAP measures, if any, reported by our peer companies and therefore may not serve as an accurate basis of comparison among companies. Adjusted EBITDA and Non-GAAP net loss should not be considered in isolation from, or as a substitute for, financial information prepared in accordance with GAAP.
Components of Results of Operations
Revenue
Our marketplace revenue is primarily comprised of sales to customers through our platform. Buyers purchase specialized CNC manufacturing, sheet metal manufacturing, 3D printing, injection molding, urethane casting, tube cutting, tube bending and finishing services. Customer purchases range from rapid prototyping of single parts to high-volume production on our marketplace. These products are primarily manufactured by our network of suppliers.
Supplier services revenue includes the sale of marketing and advertising services, and to a lesser extent financial service products, SaaS-based solutions and the sale of supplies.
Cost of Revenue
Marketplace cost of revenue primarily consists of the cost to us of the products that are manufactured or produced by us or our suppliers for delivery to buyers on our platform, internal and external production costs, shipping costs and certain internal depreciation. We expect cost of revenue to increase in absolute dollars to the extent our revenue increases and transaction volume increases. As we grow and add suppliers to our platform, we are able to improve our pricing efficiency, we expect cost of revenue to decline as a percentage of revenue over time.
Cost of revenue for supplier services primarily consists of internal and external production costs and website hosting.
Gross Profit
Gross profit, or revenue less cost of revenue, is primarily affected by the growth of our revenue. Our gross profit margin is primarily affected by liquidity of our suppliers’ network and the efficiency of our pricing and will be benefited by increasing the use of existing supplier services and the variety of supplier services offerings over time.
Operating Expenses
Our operating expenses consist of sales and marketing, operations and support, product development and general and administrative functions.
Sales and Marketing
Sales and marketing expenses are expensed as incurred and include the costs of our digital marketing strategies, branding costs and other advertising costs, certain depreciation and amortization expense, contract acquisition costs and compensation expenses, including stock-based compensation, to our sales and marketing employees. We intend to continue to invest in our sales and marketing capabilities in the future to continue to increase our brand awareness, add new accounts and further penetrate existing accounts. We expect sales and marketing expense to increase in absolute dollars in the future as we grow our business, though in the near-term sales and marketing expenses may fluctuate from period-to-period based on the timing of our investments in our sales and marketing functions as these investments may vary in scope and scale over future periods.
Operations and Support
Operations and support expenses are the costs we incur in support of the buyers and suppliers on our platform which are provided by phone, email and chat for purposes of resolving buyer and suppliers related matters. These costs primarily consist of compensation expenses of the support staff, including stock-based compensation, certain depreciation and amortization expense and software costs used in delivering buyer and suppliers services.
28
We expect operations and support expense to increase in absolute dollars in the future, though in the near-term operations and support expenses may fluctuate from period-to-period based on total revenue levels and the timing of our investments in our operations and support functions as these investments may vary in scope and scale over future periods.
Product Development
Product development costs which are not eligible for capitalization are expensed as incurred. This account also includes compensation expenses, including stock-based compensation expenses to our employees performing these functions and certain depreciation and amortization expense. We expect product development expense to increase in absolute dollars in the future, though in the near-term product development expenses may fluctuate from period-to-period based on total revenue levels and the timing of our investments in our product development functions as these investments may vary in scope and scale over future periods.
General and Administrative
General and administrative expenses primarily consist of compensation expenses, including stock-based compensation expenses, for executive, finance, legal and other administrative personnel, professional service fees and certain depreciation and amortization expense. We expect our general and administrative expenses to increase. We expect to incur additional general and administrative expenses as a result of operating as a public company, including as a result of increased legal, accounting, and other professional services.
Other (Expenses) Income
Interest Expense
Interest expense consists of interest incurred on our outstanding borrowings under our outstanding convertible notes or other borrowings.
Interest and Dividend Income
Interest and dividend income consists of interest and dividends on our cash, cash equivalents and marketable securities.
Other Expenses
Other expenses consist primarily of realized and/or unrealized losses and other expenses.
Income from Unconsolidated Joint Venture
Income from unconsolidated joint venture consists of our share of the joint venture's income.
29
Results of Operations
Comparison of the Three Months Ended June 30, 2023 and 2022
The following table sets forth our unaudited statements of operations data for the periods indicated:
|
|
Three Months Ended June 30, |
|
|||||
|
|
2023 |
|
|
2022 |
|
||
|
|
(in thousands) |
|
|||||
Revenue |
|
$ |
111,008 |
|
|
$ |
95,615 |
|
Cost of revenue |
|
|
67,452 |
|
|
|
57,919 |
|
Gross profit |
|
|
43,556 |
|
|
|
37,696 |
|
Operating expenses: |
|
|
|
|
|
|
||
Sales and marketing |
|
|
22,666 |
|
|
|
18,145 |
|
Operations and support |
|
|
14,220 |
|
|
|
12,180 |
|
Product development |
|
|
8,922 |
|
|
|
7,796 |
|
General and administrative |
|
|
25,582 |
|
|
|
15,057 |
|
Impairment of assets |
|
|
219 |
|
|
|
119 |
|
Total operating expenses |
|
|
71,609 |
|
|
|
53,297 |
|
Loss from operations |
|
|
(28,053 |
) |
|
|
(15,601 |
) |
Other income (expenses): |
|
|
|
|
|
|
||
Interest expense |
|
|
(1,193 |
) |
|
|
(1,209 |
) |
Interest and dividend income |
|
|
2,959 |
|
|
|
474 |
|
Other expenses |
|
|
(576 |
) |
|
|
(482 |
) |
Income from unconsolidated joint venture |
|
|
237 |
|
|
|
269 |
|
Total other income (expenses) |
|
|
1,427 |
|
|
|
(948 |
) |
Loss before income taxes |
|
|
(26,626 |
) |
|
|
(16,549 |
) |
Benefit for income taxes |
|
|
67 |
|
|
|
— |
|
Net loss |
|
|
(26,559 |
) |
|
|
(16,549 |
) |
Net (loss) income attributable to noncontrolling interest |
|
|
(5 |
) |
|
|
4 |
|
Net loss attributable to common stockholders |
|
$ |
(26,554 |
) |
|
$ |
(16,553 |
) |
30
The following table sets forth our unaudited statements of operations data expressed as a percentage of total revenue for the periods indicated:
|
|
Three Months Ended June 30, |
|
|||||
|
|
2023 |
|
|
2022 |
|
||
|
|
|
|
|
|
|
||
Revenue |
|
|
100.0 |
% |
|
|
100.0 |
% |
Cost of revenue |
|
|
60.8 |
% |
|
|
60.6 |
% |
Gross profit |
|
|
39.2 |
% |
|
|
39.4 |
% |
Operating expenses: |
|
|
|
|
|
|
||
Sales and marketing |
|
|
20.4 |
% |
|
|
19.0 |
% |
Operations and support |
|
|
12.8 |
% |
|
|
12.7 |
% |
Product development |
|
|
8.0 |
% |
|
|
8.2 |
% |
General and administrative |
|
|
23.0 |
% |
|
|
15.7 |
% |
Impairment of assets |
|
|
0.2 |
% |
|
|
0.1 |
% |
Total operating expenses |
|
|
64.4 |
% |
|
|
55.7 |
% |
Loss from operations |
|
|
(25.2 |
)% |
|
|
(16.3 |
)% |
Other income (expenses): |
|
|
|
|
|
|
||
Interest expense |
|
|
(1.1 |
)% |
|
|
(1.3 |
)% |
Interest and dividend income |
|
|
2.7 |
% |
|
|
0.5 |
% |
Other expenses |
|
|
(0.5 |
)% |
|
|
(0.5 |
)% |
Income from unconsolidated joint venture |
|
|
0.2 |
% |
|
|
0.3 |
% |
Total other income (expenses) |
|
|
1.3 |
% |
|
|
(1.0 |
)% |
Loss before income taxes |
|
|
(23.9 |
)% |
|
|
(17.3 |
)% |
Benefit for income taxes |
|
|
0.1 |
% |
|
|
— |
% |
Net loss attributable to common stockholders |
|
|
(23.8 |
)% |
|
|
(17.3 |
)% |
Net (loss) income attributable to noncontrolling interest |
|
|
— |
% |
|
|
— |
% |
Net loss attributable to common stockholders |
|
|
(23.8 |
)% |
|
|
(17.3 |
)% |
The following tables present our disaggregated revenue and cost of revenue. Revenue from our marketplace primarily reflects the sales of parts and assemblies on our platform. Revenue from supplier services primarily includes the sale of advertising and to a lesser extent financial service products, SaaS products and supplies.
Revenue and cost of revenue is presented in the following tables for the three months ended June 30, 2023 and 2022 (in thousands):
|
|
For the Three Months |
|
|||||
|
|
|
|
|||||
|
|
2023 |
|
|
2022 |
|
||
Marketplace |
|
|
|
|
|
|
||
Revenue |
|
$ |
93,511 |
|
|
$ |
75,598 |
|
Cost of revenue |
|
|
63,914 |
|
|
|
53,492 |
|
Gross Profit |
|
$ |
29,597 |
|
|
$ |
22,106 |
|
Gross Margin |
|
|
31.7 |
% |
|
|
29.2 |
% |
|
|
|
|
|
|
|
||
Supplier services |
|
|
|
|
|
|
||
Revenue |
|
$ |
17,497 |
|
|
$ |
20,017 |
|
Cost of revenue |
|
|
3,538 |
|
|
|
4,427 |
|
Gross Profit |
|
$ |
13,959 |
|
|
$ |
15,590 |
|
Gross Margin |
|
|
79.8 |
% |
|
|
77.9 |
% |
Revenue
Total revenue increased $15.4 million, or 16%, from $95.6 million for the three months ended June 30, 2022 to $111.0 million for the three months ended June 30, 2023. This growth was a result of an increase in marketplace revenue, partially offset by a decrease in supplier services revenue. Total revenue from marketplace and supplier services for the three months ended June 30, 2023 was $93.5 million and $17.5 million, respectively, as compared to $75.6 million and $20.0 million, respectively, for the three months ended June 30, 2022. Marketplace revenue increased $17.9 million, or 24% from $75.6 million for the three months ended June 30, 2022 to $93.5 million for the three months ended June 30, 2023.
31
The increase in marketplace revenue was primarily due increased buyer activity on the platform for the three months ended June 30, 2023, as compared to the prior year period.
Supplier services revenue decreased $2.5 million, or 13% from $20.0 million for the three months ended June 30, 2022 to $17.5 million for the three months ended June 30, 2023. The decrease in revenue was primarily due to our exit from the supplies business in the U.S. during the second quarter of 2023.
Total revenue for the three months ended June 30, 2023 and 2022, was $95.4 million and $87.7 million, respectively, for the U.S. operating segment, and $15.6 million and $7.9 million, respectively, for the International operating segment.
Cost of Revenue
Total cost of revenue increased $9.5 million, or 16%, from $57.9 million for the three months ended June 30, 2022 to $67.5 million for the three months ended June 30, 2023. This increase was primarily the result of an increase in marketplace cost of revenue offset by a decrease in supplier services costs of revenue. Total cost of revenue from marketplace and supplier services for the three months ended June 30, 2023 was $63.9 million and $3.5 million, respectively, as compared to $53.5 million and $4.4 million, respectively for the three months ended June 30, 2022.
Marketplace cost of revenue was driven by increased payments to suppliers on our platform due to order growth and increased activity on our marketplace.
Gross Profit and Margin
Gross profit increased $5.9 million, or 16%, from $37.7 million for the three months ended June 30, 2022 to $43.6 million for the three months ended June 30, 2023. The increase in gross profit was primarily due to increases in revenue from marketplace and improved marketplace gross margins as compared to the prior year period.
Gross margin for marketplace was 31.7% for the three months ended June 30, 2023, as compared to 29.2% for the three months ended June 30, 2022. The improvement over the prior year period was due in part to our AI-driven platform and increasing supplier selection. Pricing has become more efficient due to the increased number of orders over time, improving the data set and thus making our pricing decisions more accurate. Additionally, we continue to grow our active suppliers resulting in more competition for buyers’ orders and therefore a lower cost of revenue. Gross margin for our supplier services was 79.8% for the three months ended June 30, 2023, as compared to 77.9% for the three months ended June 30, 2022. The increase in gross margin for supplier services is primarily due to a higher mix of marketing services revenue and the exit from the lower margin supplies business. As marketplace revenue continues to grow, our aggregate gross margin will change.
Operating Expenses
Sales and Marketing
Sales and marketing expense increased $4.5 million, or 25%, from $18.1 million for the three months ended June 30, 2022 to $22.7 million for the three months ended June 30, 2023, primarily due to sales commissions resulting from sales growth combined with a measurement period benefit recognized during the second quarter of 2022. As a percent of total revenue, sales and marketing expenses increased to 20.4% for the three months ended June 30, 2023 from 19.0% for the three months ended June 30, 2022.
Operations and Support
Operations and support expense increased $2.0 million, or 17%, from $12.2 million for the three months ended June 30, 2022 to $14.2 million for the three months ended June 30, 2023, due to hiring of additional operations and support employees and their compensation costs including stock-based compensation and expenses incurred as part of our restructuring and exit from the supplies business. As a percent of total revenue, operations and support expenses increased slightly to 12.8% for the three months ended June 30, 2023 from 12.7% for the three months ended June 30, 2022.
Product Development
Product development expense increased $1.1 million, or 14%, from $7.8 million for the three months ended June 30, 2022 to $8.9 million for the three months ended June 30, 2023, primarily as result of increases in depreciation expense related to developed software assets, hiring additional product development employees and their compensation, including stock-based compensation and additional software costs. As a percent of total revenue, product development expenses decreased to 8.0% for the three months ended June 30, 2023 from 8.2% for the three months ended June 30, 2022.
General and Administrative
General and administrative expense increased $10.5 million, or 70%, from $15.1 million for the three months ended June 30, 2022 to $25.6 million for the three months ended June 30, 2023. The primary driver of the increase was due to the abandonment several leases resulting in a one-time $8.7 million increase in operating lease expense.
32
In addition, we incurred higher professional fees related to accounting and legal services, software and maintenance costs, and payroll and benefits. These increases were partially offset by a reduction in charitable contributions of Class A common stock. As a percent of total revenue, general and administrative expenses increased to 23.0% for the for the three months ended June 30, 2023 from 15.7% for the three months ended June 30, 2022.
Impairment of Assets
Impairment expense increased $0.1 million, or 84%, from $0.1 million for the three months ended June 30, 2022 to $0.2 million for the three months ended June 30, 2023. As a percent of total revenue, impairment expense increased to 0.2% for the for the three months ended June 30, 2023 from 0.1% for the three months ended June 30, 2022.
Other (Expenses) Income
Interest Expense
Interest expense remained flat from $1.2 million for the three months ended June 30, 2022 to $1.2 million for the three months ended June 30, 2023. Interest expense is primarily due to the interest on the 2027 convertible notes issued in February 2022.
33
Interest and Dividend Income
Interest and dividend income increased by $2.5 million, or 524%, from $0.5 million for the three months ended June 30, 2022 to $3.0 million for the three months ended June 30, 2023, primarily due to dividend income from our marketable securities.
Other Expenses
Other expenses increased by $0.1 million, or 20%, from $0.5 million for the three months ended June 30, 2022 to $0.6 for the three months ended June 30, 2023.
Income from Unconsolidated Joint Venture
Income from unconsolidated joint venture decreased $32,000 for the three months ended June 30, 2023 due to a decrease in income from our 50% interest in Industrial Media, LLC.
Additional Segment Considerations
Total segment loss from our U.S. operating segment for the three months ended June 30, 2023 and 2022, was $22.9 million and $11.2 million, respectively. Total segment loss from our International operating segment for the three months ended June 30, 2023 and 2022, was $3.6 million and $5.3 million, respectively.
Comparison of the Six Months Ended June 30, 2023 and 2022
The following table sets forth our unaudited statements of operations data for the periods indicated:
|
|
Six Months Ended June 30, |
|
|||||
|
|
2023 |
|
|
2022 |
|
||
|
|
(in thousands) |
|
|||||
Revenue |
|
$ |
216,334 |
|
|
$ |
179,286 |
|
Cost of revenue |
|
|
133,409 |
|
|
|
108,651 |
|
Gross profit |
|
|
82,925 |
|
|
|
70,635 |
|
Operating expenses: |
|
|
|
|
|
|
||
Sales and marketing |
|
|
45,105 |
|
|
|
37,430 |
|
Operations and support |
|
|
26,828 |
|
|
|
24,538 |
|
Product development |
|
|
17,047 |
|
|
|
15,085 |
|
General and administrative |
|
|
41,539 |
|
|
|
28,017 |
|
Impairment of assets |
|
|
246 |
|
|
|
119 |
|
Total operating expenses |
|
|
130,765 |
|
|
|
105,189 |
|
Loss from operations |
|
|
(47,840 |
) |
|
|
(34,554 |
) |
Other income (expenses): |
|
|
|
|
|
|
||
Interest expense |
|
|
(2,391 |
) |
|
|
(1,978 |
) |
Interest and dividend income |
|
|
5,654 |
|
|
|
570 |
|
Other expenses |
|
|
(559 |
) |
|
|
(1,444 |
) |
Income from unconsolidated joint venture |
|
|
303 |
|
|
|
303 |
|
Total other income (expenses) |
|
|
3,007 |
|
|
|
(2,549 |
) |
Loss before income taxes |
|
|
(44,833 |
) |
|
|
(37,103 |
) |
(Provision) benefit for income taxes |
|
|
(69 |
) |
|
|
559 |
|
Net loss |
|
|
(44,902 |
) |
|
|
(36,544 |
) |
Net (loss) income attributable to noncontrolling interest |
|
|
(4 |
) |
|
|
21 |
|
Net loss attributable to common stockholders |
|
$ |
(44,898 |
) |
|
$ |
(36,565 |
) |
34
The following table sets forth our unaudited statements of operations data expressed as a percentage of total revenue for the periods indicated:
|
|
Six Months Ended June 30, |
|
|||||
|
|
2023 |
|
|
2022 |
|
||
|
|
|
|
|||||
Revenue |
|
|
100.0 |
% |
|
|
100.0 |
% |
Cost of revenue |
|
|
61.7 |
% |
|
|
60.6 |
% |
Gross profit |
|
|
38.3 |
% |
|
|
39.4 |
% |
Operating expenses: |
|
|
|
|
|
|
||
Sales and marketing |
|
|
20.8 |
% |
|
|
20.9 |
% |
Operations and support |
|
|
12.4 |
% |
|
|
13.7 |
% |
Product development |
|
|
7.9 |
% |
|
|
8.4 |
% |
General and administrative |
|
|
19.2 |
% |
|
|
15.6 |
% |
Impairment of assets |
|
|
0.1 |
% |
|
|
0.1 |
% |
Total operating expenses |
|
|
60.4 |
% |
|
|
58.6 |
% |
Loss from operations |
|
|
(22.1 |
)% |
|
|
(19.2 |
)% |
Other income (expenses): |
|
|
|
|
|
|
||
Interest expense |
|
|
(1.1 |
)% |
|
|
(1.1 |
)% |
Interest and dividend income |
|
|
2.6 |
% |
|
|
0.3 |
% |
Other expenses |
|
|
(0.3 |
)% |
|
|
(0.8 |
)% |
Income from unconsolidated joint venture |
|
|
0.1 |
% |
|
|
0.2 |
% |
Total other income (expenses) |
|
|
1.3 |
% |
|
|
(1.4 |
)% |
Loss before income taxes |
|
|
(20.8 |
)% |
|
|
(20.6 |
)% |
(Provision) benefit for income taxes |
|
|
— |
% |
|
|
0.3 |
% |
Net loss |
|
|
(20.8 |
)% |
|
|
(20.3 |
)% |
Net (loss) income attributable to noncontrolling interest |
|
|
— |
% |
|
|
— |
% |
Net loss attributable to common stockholders |
|
|
(20.8 |
)% |
|
|
(20.3 |
)% |
The following tables present our disaggregated revenue and cost of revenue. Revenue from our marketplace primarily reflects the sales of parts and assemblies on our platform. Revenue from supplier services primarily includes the sale of advertising and to a lesser extent financial service products, SaaS products and supplies.
Revenue and cost of revenue is presented in the following tables for the six months ended June 30, 2023 and 2022 (in thousands):
|
|
For the Six Months |
|
|||||
|
|
2023 |
|
|
2022 |
|
||
Marketplace |
|
|
|
|
|
|
||
Revenue |
|
$ |
180,191 |
|
|
$ |
140,013 |
|
Cost of revenue |
|
|
125,661 |
|
|
|
100,233 |
|
Gross Profit |
|
$ |
54,530 |
|
|
$ |
39,780 |
|
Gross Margin |
|
|
30.3 |
% |
|
|
28.4 |
% |
|
|
|
|
|
|
|
||
Supplier services |
|
|
|
|
|
|
||
Revenue |
|
$ |
36,143 |
|
|
$ |
39,273 |
|
Cost of revenue |
|
|
7,748 |
|
|
|
8,418 |
|
Gross Profit |
|
$ |
28,395 |
|
|
$ |
30,855 |
|
Gross Margin |
|
|
78.6 |
% |
|
|
78.6 |
% |
Revenue
Total revenue increased $37.0 million, or 21%, from $179.3 million for the six months ended June 30, 2022 to $216.3 million for the six months ended June 30, 2023. This growth was a result of an increase in marketplace revenue, partially offset by a decrease in supplier services revenue. Marketplace revenue increased $40.2 million, or 29% from $140.0 million for the six months ended June 30, 2022 to $180.2 million for the six months ended June 30, 2023. The increase in marketplace revenue was primarily due increased buyers activity on the platform for the six months ended June 30, 2023, as compared to the prior year period.
35
Supplier services revenue decreased $3.1 million, or 8% from $39.3 million for the six months ended June 30, 2022 to $36.1 million for the six months ended June 30, 2023. The decrease in revenue was primarily due to our exit from the supplies business in the U.S. during the second quarter of 2023.
Total revenue for the six months ended June 30, 2023 and 2022, was $189.3 million and $163.7 million, respectively, for the U.S. operating segment, and $27.0 million and $15.6 million, respectively, for the International operating segment.
Cost of Revenue
Total cost of revenue increased $24.8 million, or 23%, from $108.7 million for the six months ended June 30, 2022 to $133.4 million for the six months ended June 30, 2023. This increase was primarily the result of an increase in marketplace cost of revenue offset by a decrease in supplier services costs of revenue. Total cost of revenue from marketplace and supplier services for the six months ended June 30, 2023 was $125.7 million and $7.7 million, respectively, as compared to $100.2 million and $8.4 million, respectively for the six months ended June 30, 2022.
Marketplace cost of revenue was driven by increased payments to suppliers on our platform due to order growth and increased activity on our marketplace.
Gross Profit and Margin
Gross profit increased $12.3 million, or 17%, from $70.6 million for the six months ended June 30, 2022 to $82.9 million for the six months ended June 30, 2023. The increase in gross profit was primarily due to increases in revenue from marketplace and improved marketplace gross margins as compared to the prior year period.
Gross margin for marketplace was 30.3% for the six months ended June 30, 2023, as compared to 28.4% for the six months ended June 30, 2022. The improvement over the prior year period was due in part to our AI-driven platform and increasing supplier selection. Pricing has become more efficient due to the increased number of orders over time, improving the data set and thus making our pricing decisions more accurate. Additionally, we continue to grow our active suppliers resulting in more competition for buyers’ orders and therefore a lower cost of revenue. Gross margin for our supplier services was constant at 78.6% for the six months ended June 30, 2023 and June 30, 2022. As marketplace revenue continues to grow, our aggregate gross margin will change.
Operating Expenses
Sales and Marketing
Sales and marketing expense increased $7.7 million, or 21%, from $37.4 million for the six months ended June 30, 2022 to $45.1 million for the six months ended June 30, 2023, primarily due to sales commissions resulting from sales growth combined with a measurement period benefit recognized during the second quarter of 2022. In addition, the increase was due to additional sales employees and compensation costs including stock-based compensation and increases in marketing and advertising spend. As a percent of total revenue, sales and marketing expenses decreased to 20.8% for the six months ended June 30, 2023 from 20.9% for the six months ended June 30, 2022.
Operations and Support
Operations and support expense increased $2.3 million, or 9%, from $24.5 million for the six months ended June 30, 2022 to $26.8 million for the six months ended June 30, 2023, primarily due to hiring of additional operations and support employees and their compensation costs including stock-based compensation and expenses incurred as part of the Company's restructuring and exit from the supplies business. As a percent of total revenue, operations and support expenses decreased to 12.4% for the six months ended June 30, 2023 from 13.7% for the six months ended June 30, 2022.
Product Development
Product development expense increased $2.0 million, or 13%, from $15.1 million for the six months ended June 30, 2022 to $17.0 million for the six months ended June 30, 2023, primarily as result of increases in depreciation expense related to developed software assets, hiring additional product development employees and their compensation, including stock-based compensation and additional software costs. As a percent of total revenue, product development expenses decreased to 7.9% for the six months ended June 30, 2023 from 8.4% for the six months ended June 30, 2022.
General and Administrative
General and administrative expense increased $13.5 million, or 48%, from $28.0 million for the six months ended June 30, 2022 to $41.5 million for the six months ended June 30, 2023. The primary driver of the increase was due to the abandonment of multiple company leases resulting in a one-time $8.7 million increase in operating lease expense. In addition, there were higher professional fees related to accounting and legal services, higher software and maintenance costs, additional administrative employees and their compensations costs including stock-based compensations and consulting expenses. These increases were partially offset by a reduction in non-cash charitable contributions of Class A common stock and insurance costs.
36
As a percent of total revenue, general and administrative expenses increased to 19.2% for the six months ended June 30, 2023 from 15.6% for the six months ended June 30, 2022.
Impairment of Assets
Impairment expense increased $0.1 million, or 107%, from $0.1 million for the six months ended June 30, 2022 to $0.2 million for the six months ended June 30, 2023. As a percent of total revenue, impairments expense remained flat at 0.1% for the for the six months ended June 30, 2023 and June 30, 2022.
Other (Expenses) Income
Interest Expense
Interest expense increased by $0.4 million, or 21%, from $2.0 million for the six months ended June 30, 2022 to $2.4 million for the six months ended June 30, 2023, primarily due to the interest on the 2027 convertible notes issued in February 2022.
Interest and Dividend Income
Interest and dividend income increased by $5.1 million, or 892%, from $0.6 million for the six months ended June 30, 2022 to $5.7 million for the six months ended June 30, 2023, primarily due to dividend income from our marketable securities.
Other Expenses
Other expenses decreased by $0.9 million, or 61%, from $1.4 million for the six months ended June 30, 2022 to $0.6 million for the six months ended June 30, 2023, primarily as a result of decreased losses on our marketable securities.
Income from Unconsolidated Joint Venture
Income from unconsolidated joint venture was flat at $0.3 million due to no material change in income from our 50% interest in Industrial Media, LLC.
Additional Segment Considerations
Total segment loss from our U.S. operating segment for the six months ended June 30, 2023 and 2022, was $35.8 million and $26.2 million, respectively. Total segment loss from our International operating segment for the six months ended June 30, 2023 and 2022, was $9.1 million and $10.3 million, respectively.
37
Liquidity and Capital Resources
General
We have financed our operations primarily through sales of our equity securities and borrowings under our convertible notes. As of June 30, 2023, our cash and cash equivalents and marketable securities totaled $286.1 million. We believe our existing cash and cash equivalents and marketable securities will be sufficient to support our working capital and capital expenditure requirements for at least the next twelve months and over the long-term. We believe we will meet our longer-term expected future cash requirements primarily from a combination of cash flow from operating activities and available cash and cash equivalents and marketable securities. We may also engage in equity or debt financings to secure additional funds. Our future capital requirements will depend on many factors, including our revenue growth rate, receivable and payable cycles, the timing and extent of investments in product development, sales and marketing, operations and support and general and administrative expenses.
Our capital expenditures consist primarily of internal-use software costs, manufacturing equipment, computers and peripheral equipment, furniture and fixtures and leasehold improvements and patents.
Convertible Notes due 2027
In February 2022, we entered into a purchase agreement with certain counterparties for the sale of an aggregate of $287.5 million principal amount of convertible senior notes due in 2027 (the “2027 Notes”) in a private offering to qualified institutional buyers pursuant to Rule 144A under the Securities Act of 1933, as amended (the “Securities Act”). The 2027 Notes consisted of a $250 million initial placement and an over-allotment option that provided the initial purchasers of the 2027 Notes with the option to purchase an additional $37.5 million aggregate principal amount of the 2027 Notes, which was fully exercised. The 2027 Notes were issued pursuant to an indenture dated February 4, 2022. The net proceeds from the issuance of the 2027 Notes were $278.2 million, net of debt issuance costs. The debt issuance costs are amortized to interest expense using the effective interest rate method.
The 2027 Notes are unsecured obligations which bear regular interest at 1% per annum and for which the principal balance will not accrete. Interest payment are due on February 1 and August 1 of each year the Notes remain outstanding. The 2027 Notes will mature on February 1, 2027 unless repurchased, redeemed, or converted in accordance with their terms prior to such date.
The 2027 Notes are convertible into cash, shares of our Class A common stock, or a combination of cash and shares of our Class A common stock, at our election, at an initial conversion rate of 17.8213 shares of Class A common stock per $1,000 principal amount of 2027 Notes, which is equivalent to an initial conversion price of approximately $56.11 per share of our Class A common stock. The conversion rate is subject to customary adjustments for certain events as described in the indenture governing the 2027 Notes.
We may redeem for cash all or any portion of the 2027 Notes, at our option, on or after February 5, 2025 if the last reported sale price of our Class A common stock has been at least 130% of the conversion price then in effect for at least 20 trading days at a redemption price equal to 100% of the principal amount of the 2027 Notes to be redeemed, plus accrued and unpaid interest or additional interest, if any.
Holders of the 2027 Notes may convert all or a portion of their 2027 Notes at their option prior to November 1, 2026, in multiples of $1,000 principal amounts, only under the following circumstances:
On or after November 1, 2026, the 2027 Notes are convertible at any time until the close of business on the second scheduled trading day immediately preceding the maturity date.
Holders of the 2027 Notes who convert the 2027 Notes in connection with a make-whole fundamental change, as defined in the indenture governing the 2027 Notes, or in connection with a redemption are entitled to an increase in the conversion rate. Additionally, in the event of a fundamental change, holders of the 2027 Notes may require us to repurchase all or a portion of the 2027 Notes at a price equal to 100% of the principal amount of 2027 Notes, plus any accrued and unpaid special interest, if any.
38
We accounted for the issuance of the 2027 Notes as a single liability measured at its amortized cost, as no other embedded features require bifurcation and recognition as derivatives.
Cash Flows
The following table presents a summary of our cash flows from operating, investing, and financing activities for the six months ended June 30, 2023 and 2022.
|
|
Six Months Ended June 30, |
|
|||||
|
|
2023 |
|
|
2022 |
|
||
|
|
(in thousands) |
|
|||||
Net cash used in operating activities |
|
$ |
(22,607 |
) |
|
$ |
(34,196 |
) |
Net cash provided by (used in) investing activities |
|
|
12,741 |
|
|
|
(285,826 |
) |
Net cash provided by financing activities |
|
|
1,144 |
|
|
|
280,659 |
|
Operating Activities
For the six months ended June 30, 2023, net cash used in operating activities was $22.6 million, primarily due to a net loss of $(44.9) million adjusted for non-cash charges of $29.9 million and a net decrease in our operating assets and liabilities of $(7.6) million. The non-cash adjustments primarily relate to $12.2 million of reduction to our right of use lease assets, stock-based compensation of $10.5 million, and depreciation and amortization of $5.5 million. The net decrease in operating assets and liabilities is primarily driven by an increase in accounts receivable of $8.3 million, an increase in other assets of $2.5 million, and a decrease in lease liabilities of $2.4 million. These decreases were offset by an increase in accrued expenses of $2.7 million and contract liabilities of $1.5 million.
Cash used in operating activities was $34.2 million during the six months ended June 30, 2022, primarily due to a net loss of $(36.5) million adjusted for non-cash charges of $19.5 million and a net decrease in our operating assets and liabilities of $(17.2) million. The non-cash adjustments primarily relate to stock-based compensation of $8.9 million, depreciation and amortization of $3.8 million, $1.2 million unrealized loss on marketable securities, $1.3 million donation of common stock and $3.5 million of reduction to our right of use lease assets. The net decrease in operating assets and liabilities is primarily driven by an increase in accounts receivable of $11.8 million primarily due to our continued revenue growth, and increase in other assets of $3.9 million, an increase in prepaid expenses of $1.6 million, a $1.9 million increase in accounts payable and increased contract liabilities of $2.9 million. These increases were offset by a decrease in lease liabilities of $2.8 million and a decrease in accrued expenses of $2.0 million.
Investing Activities
For the six months ended June 30, 2023, net cash provided by investing activities was $12.7 million, primarily due to the proceeds from the sale of marketable securities of $30.0 million offset by the purchase of property and equipment (which includes internal-use software development costs) of $8.5 million, $5.6 million for the purchase of marketable securities, and $3.3 million for the acquisition of Tridi.
Cash used in investing activities was $285.8 million during the six months ended June 30, 2022, primarily due to the purchase of marketable securities of $280.6 million and $5.4 million for purchases of property and equipment (which includes internal-use software development costs).
Financing Activities
For the six months ended June 30, 2023, net cash provided by financing activities was $1.1 million, all relating to proceeds from the exercise of stock options.
Cash provided by financing activities was $280.7 million during the six months ended June 30, 2022, reflecting $287.5 million of proceeds from the issuance of the 2027 convertible senior notes. These inflows were offset by $9.3 million of convertible note costs incurred in connection with these notes.
Critical Accounting Estimates
Our condensed consolidated financial statements and accompanying notes have been prepared in accordance with GAAP. The preparation of these condensed consolidated financial statements requires us to make estimates and assumptions that affect the reported amounts of assets, liabilities, revenue and expenses, and related disclosures. We base our estimates on historical experience and on various other assumptions that we believe are reasonable under the circumstances. We evaluate our estimates and assumptions on an ongoing basis. Actual results may differ from these estimates. To the extent that there are material differences between these estimates and our actual results, our future financial statements will be affected. For additional information about our critical accounting policies and estimates, see the disclosure included in our Annual Report on Form 10-K as well as Note 2 – Basis of Presentation and Summary of Significant Accounting Policies in the notes to the condensed consolidated financial statements included in Part I, Item 1, of this Quarterly Report on Form 10-Q.
39
Recent Accounting Pronouncements
For a description of our recently adopted accounting pronouncements and recently issued accounting standards not yet adopted, see Note 2 – Basis of Presentation and Summary of Significant Accounting Policies in the notes to the condensed consolidated financial statements included in Part I, Item 1, of this Quarterly Report on Form 10-Q.
Item 3. Quantitative and Qualitative Disclosures About Market Risk.
We are exposed to market risks in the ordinary course of our business. Market risk represents the risk of loss that may impact our financial position due to adverse changes in financial market prices and rates. Our market risk exposure is primarily a result of exposure to potential changes in interest rates. We do not enter into investments for trading or speculative purposes and have not used any derivative financial instruments to manage our interest rate risk exposure.
Foreign Currency Exchange Risk
Our U.S. revenue and costs are principally denominated in U.S. dollars and are not subject to foreign currency exchange risk. Our International operating segment generates revenue outside of the United States that is denominated in currencies other than the U.S. dollar. Our results of operations are impacted by changes in exchange rates.
Inflation Risk
We do not believe that inflation has had a material effect on our business, results of operations, or financial condition. If our costs were to become subject to significant inflationary pressures such as those caused by the conflict in Ukraine, we may not be able to fully offset such higher costs through price increases. Our inability or failure to do so could harm our business, results of operations and financial condition.
Item 4. Controls and Procedures.
Evaluation of Disclosure Controls and Procedures
We maintain “disclosure controls and procedures,” as defined in Rules 13a-15(e) and 15d-15(e) under the Securities Exchange Act of 1934, as amended (the “Exchange Act”), that are designed to ensure that information required to be disclosed in the reports that we file or submit under the Exchange Act is (i) recorded, processed, summarized and reported, within the time periods specified in the SEC's rules and forms and (ii) accumulated and communicated to our management, including our principal executive officer and principal financial officer, as appropriate, to allow timely decisions regarding required disclosure. Management recognizes that any controls and procedures, no matter how well designed and operated, can provide only reasonable assurance of achieving their objectives and management necessarily applies its judgment in evaluating the cost-benefit relationship of possible controls and procedures.
Pursuant to Rules 13a-15(e) and 15d-15(e) under the Exchange Act, our management, with the participation of our principal executive officer and principal financial officer, performed an evaluation of the effectiveness of our disclosure controls and procedures as of June 30, 2023. Based on such evaluation, our principal executive officer and principal financial officer concluded that our disclosure controls and procedures were not effective at a reasonable assurance level as a result of a material weakness that existed in our internal control over financial reporting as described below. While the Company has implemented remediation steps, the material weakness cannot be considered fully remediated until the controls have been in place and operate for a sufficient period of time.
Material Weakness in Internal Control Over Financial Reporting
In connection with the audit of our financial statements as of and for the fiscal year ended December 31, 2022, during our implementation of internal control over financial reporting (Sarbanes-Oxley Act of 2002, or “SOX”), we identified a material weakness in our internal control over financial reporting that existed as of December 31, 2022. A material weakness is a deficiency, or a combination of deficiencies, in internal control over financial reporting, such that there is a reasonable possibility that a material misstatement of our annual or interim financial statements will not be prevented or detected on a timely basis.
On December 9, 2021, we completed our acquisition of Thomas Publishing, Inc. (“Thomas”). The additional workload on our resources to integrate Thomas contributed to our inability to timely perform an effective risk assessment related to the achievement of its control objectives in certain processes, primarily revenue and costs of revenue. As a result, we were unable to design and operate effective process-level controls as of December 31, 2022.
Management’s Plan to Remediate the Material Weakness
40
During the first half of 2023, management implemented remediation steps to address the material weakness and to improve our internal control over financial reporting. Specifically, now that Thomas has been fully integrated, we have improved our review processes over risk assessment, which also includes the documentation to support the operating effectiveness of our controls. While we implemented remediation steps, the material weakness cannot be considered fully remediated until the improved controls have been in place and operate for a sufficient period of time. However, our management, including our principal executive officer and principal financial officer, has concluded that, notwithstanding the identified material weakness in our internal control over financial reporting, the financial statements in this filing fairly present, in all material respects, our financial condition, results of operations and cash flows for the periods presented in conformity with U.S. GAAP.
During the remainder of fiscal year 2023, management will test and evaluate the related internal controls to ascertain whether they are designed and operating effectively to provide reasonable assurance that they will prevent or detect a material error in the financial statements.
Changes in Internal Control over Financial Reporting
Other than as discussed above under “Management’s Plan to Remediate the Material Weakness”, there were no changes to our internal control over financial reporting that occurred during the quarter ended June 30, 2023, that have materially affected, or are reasonably likely to materially affect, our internal control over financial reporting.
Inherent Limitations on Effectiveness of Controls
Our management does not expect that our disclosure controls and procedures or our internal control over financial reporting will prevent all errors and all fraud. A control system, no matter how well conceived and operated, can provide only reasonable, not absolute, assurance that the objectives of the control system are met. Further, the design of a control system must reflect the fact that there are resource constraints, and the benefits of controls must be considered relative to their costs. Because of the inherent limitations in all control systems, no evaluation of controls can provide absolute assurance that all control issues and instances of fraud, if any, have been detected. These inherent limitations include the realities that judgments in decision making can be faulty, and that breakdowns can occur because of a simple error or mistake. Additionally, controls can be circumvented by the individual acts of some persons, by collusion of two or more people or by management override of the controls. The design of any system of controls also is based in part upon certain assumptions about the likelihood of future events, and there can be no assurance that any design will succeed in achieving its stated goals under all potential future conditions; over time, controls may become inadequate because of changes in conditions, or the degree of compliance with policies or procedures may deteriorate. Because of the inherent limitations in a cost-effective control system, misstatements due to error or fraud may occur and not be detected.
41
PART II—OTHER INFORMATION
Item 1. Legal Proceedings.
From time to time, we are involved in various claims and legal actions that arise in the ordinary course of business. We are not a party to any legal proceedings, that individually or in the aggregate, are reasonably expected to have a material adverse effect on our consolidated results of operations, financial condition or cash flows. However, the results of these matters cannot be predicted with certainty, and an unfavorable resolution of one or more matters could have a material adverse effect on our consolidated results of operations, financial condition or cash flows.
For the period ending June 30, 2023, there were no material legal proceedings brought against us nor were there any material developments to any ongoing legal proceedings which constituted reportable events.
Item 1A. Risk Factors.
Investing in our Class A common stock involves a high degree of risk. You should carefully consider the risks and uncertainties described in our Annual Report on Form 10‑K for the year ended December 31, 2022 under Part I, Item 1A, "Risk Factors,” together with all of the other information in this Quarterly Report on Form 10-Q, including the sections titled “Management’s Discussion and Analysis of Financial Condition and Results of Operations” and our condensed consolidated financial statements and related notes, before making a decision to invest in our Class A common stock. Our business, financial condition, results of operations, or prospects could also be harmed by risks and uncertainties not currently known to us or that we currently do not believe are material. If any of the risks actually occur, our business, financial condition, results of operations, and prospects could be adversely affected. In that event, the market price of our Class A common stock could decline, and you could lose part or all of your investment.
There have been no material changes to our risk factors as previously disclosed in Item 1A. contained in Part I of our Annual Report on Form 10‑K for the year ended December 31, 2022.
Item 2. Unregistered Sales of Equity Securities and Use of Proceeds.
Not applicable.
Item 3. Defaults Upon Senior Securities.
Not applicable.
Item 4. Mine Safety Disclosures.
Not applicable.
Item 5. Other Information.
Securities Trading Plans of Directors and Executive Officers
During our last fiscal quarter, our directors and officers (as defined in Rule 16a-1(f) under the Securities and Exchange Act of 1934, as amended) adopted or terminated the contracts instructions or written plans for the purchase or sale of the Company’s securities set forth in the table below.
Type of Trading Arrangement |
|||||||||||||
Name and Position |
Action |
Adoption/Termination Date |
Rule 10b5-1* |
Non-Rule 10b5-1** |
|
Total Shares of Class A Common Stock to be Sold |
|
Total Shares of Class A Common Stock to be Purchased |
|
Expiration Date |
|||
Bill Cronin Chief Revenue Officer |
Adopted |
5/17/2023 |
X |
|
- |
|
|
- |
|
|
7,626 |
|
7/1/2025 |
* Contract, instruction or written plan intended to satisfy the affirmative defense conditions of Rule 10b5-1(c) under the Exchange Act.
** “Non-Rule 10b5-1 trading arrangement” as defined in Item 408(c) of Regulation S-K under the Exchange Act.
42
Item 6. Exhibits.
The documents listed in the Exhibit Index of this Quarterly Report on Form 10-Q are herein incorporated by reference or are filed with this Quarterly Report on Form 10-Q, in each case as indicated therein (numbered in accordance with Item 601 of Regulation S-K).
|
Exhibit Number |
|
Description |
|
|
|
3.1 |
|
|
3.2 |
|
|
31.1* |
|
|
31.2* |
|
|
32.1** |
|
|
32.2** |
|
|
101.INS |
|
Inline XBRL Instance Document – the instance document does not appear in the Interactive Data File because XBRL tags are embedded within the Inline XBRL document. |
101.SCH |
|
Inline XBRL Taxonomy Extension Schema Document |
101.CAL |
|
Inline XBRL Taxonomy Extension Calculation Linkbase Document |
101.DEF |
|
Inline XBRL Taxonomy Extension Definition Linkbase Document |
101.LAB |
|
Inline XBRL Taxonomy Extension Label Linkbase Document |
101.PRE |
|
Inline XBRL Taxonomy Extension Presentation Linkbase Document |
104 |
|
Cover Page Interactive Data File (embedded within the Inline XBRL document) |
* Filed herewith.
** These certifications are being furnished solely to accompany this quarterly report pursuant to 18 U.S.C. Section 1350, and are not being filed for purposes of Section 18 of the Securities Exchange Act of 1934, as amended, and are not to be incorporated by reference into any filing of the registrant, whether made before or after the date hereof, regardless of any general incorporation language in such filing.
43
SIGNATURES
Pursuant to the requirements of the Securities Exchange Act of 1934, the registrant has duly caused this report to be signed on
its behalf by the undersigned thereunto duly authorized.
|
|
XOMETRY, INC. |
|
|
|
|
|
Date: August 9, 2023 |
|
By: |
/s/ Randolph Altschuler |
|
|
|
Randolph Altschuler |
|
|
|
Chief Executive Officer and Director |
|
|
|
|
Date: August 9, 2023 |
|
By: |
/s/ James Rallo |
|
|
|
James Rallo |
|
|
|
Chief Financial Officer |
44
Exhibit 31.1
CERTIFICATION PURSUANT TO
RULES 13a-14(a) AND 15d-14(a) UNDER THE SECURITIES EXCHANGE ACT OF 1934,
AS ADOPTED PURSUANT TO SECTION 302 OF THE SARBANES-OXLEY ACT OF 2002
I, Randolph Altschuler, certify that:
(a) Designed such disclosure controls and procedures, or caused such disclosure controls and procedures to be designed under our supervision, to ensure that material information relating to the registrant, including its consolidated subsidiaries, is made known to us by others within those entities, particularly during the period in which this report is being prepared;
(b) Designed such internal control over financial reporting, or caused such internal control over financial reporting to be designed under our supervision, to provide reasonable assurance regarding the reliability of financial reporting and the preparation of financial statements for external purposes in accordance with generally accepted accounting principles;
(c) Evaluated the effectiveness of the registrant's disclosure controls and procedures and presented in this report our conclusions about the effectiveness of the disclosure controls and procedures, as of the end of the period covered by this report based on such evaluation; and
(d) Disclosed in this report any change in the registrant's internal control over financial reporting that occurred during the registrant's most recent fiscal quarter (the registrant's fourth fiscal quarter in the case of an annual report) that has materially affected, or is reasonably likely to materially affect, the registrant's internal control over financial reporting; and
(a) All significant deficiencies and material weaknesses in the design or operation of internal control over financial reporting which are reasonably likely to adversely affect the registrant's ability to record, process, summarize and report financial information; and
(b) Any fraud, whether or not material, that involves management or other employees who have a significant role in the registrant's internal control over financial reporting.
Date: August 9, 2023 |
|
By: |
/s/ Randolph Altschuler |
|
|
|
Randolph Altschuler |
|
|
|
Chief Executive Officer and Director |
Exhibit 31.2
CERTIFICATION PURSUANT TO
RULES 13a-14(a) AND 15d-14(a) UNDER THE SECURITIES EXCHANGE ACT OF 1934,
AS ADOPTED PURSUANT TO SECTION 302 OF THE SARBANES-OXLEY ACT OF 2002
I, James Rallo, certify that:
(a) Designed such disclosure controls and procedures, or caused such disclosure controls and procedures to be designed under our supervision, to ensure that material information relating to the registrant, including its consolidated subsidiaries, is made known to us by others within those entities, particularly during the period in which this report is being prepared;
(b) Designed such internal control over financial reporting, or caused such internal control over financial reporting to be designed under our supervision, to provide reasonable assurance regarding the reliability of financial reporting and the preparation of financial statements for external purposes in accordance with generally accepted accounting principles;
(c) Evaluated the effectiveness of the registrant's disclosure controls and procedures and presented in this report our conclusions about the effectiveness of the disclosure controls and procedures, as of the end of the period covered by this report based on such evaluation; and
(d) Disclosed in this report any change in the registrant's internal control over financial reporting that occurred during the registrant's most recent fiscal quarter (the registrant's fourth fiscal quarter in the case of an annual report) that has materially affected, or is reasonably likely to materially affect, the registrant's internal control over financial reporting; and
(a) All significant deficiencies and material weaknesses in the design or operation of internal control over financial reporting which are reasonably likely to adversely affect the registrant's ability to record, process, summarize and report financial information; and
(b) Any fraud, whether or not material, that involves management or other employees who have a significant role in the registrant's internal control over financial reporting.
Date: August 9, 2023 |
|
By: |
/s/ James Rallo |
|
|
|
James Rallo |
|
|
|
Chief Financial Officer |
Exhibit 32.1
CERTIFICATION PURSUANT TO
18 U.S.C. SECTION 1350, AS ADOPTED PURSUANT TO
SECTION 906 OF THE SARBANES-OXLEY ACT OF 2002
In connection with the Quarterly Report of Xometry, Inc. (the “Company”) on Form 10-Q for the period ending June 30, 2023 as filed with the Securities and Exchange Commission on the date hereof (the “Report”), I certify, pursuant to 18 U.S.C. § 1350, as adopted pursuant to § 906 of the Sarbanes-Oxley Act of 2002, that:
(1) The Report fully complies with the requirements of section 13(a) or 15(d) of the Securities Exchange Act of 1934; and
(2) The information contained in the Report fairly presents, in all material respects, the financial condition and result of operations of the Company.
Date: August 9, 2023 |
|
By: |
/s/ Randolph Altschuler |
|
|
|
Randolph Altschuler |
|
|
|
Chief Executive Officer and Director |
Exhibit 32.2
CERTIFICATION PURSUANT TO
18 U.S.C. SECTION 1350, AS ADOPTED PURSUANT TO
SECTION 906 OF THE SARBANES-OXLEY ACT OF 2002
In connection with the Quarterly Report of Xometry, Inc. (the “Company”) on Form 10-Q for the period ending June 30, 2023 as filed with the Securities and Exchange Commission on the date hereof (the “Report”), I certify, pursuant to 18 U.S.C. § 1350, as adopted pursuant to § 906 of the Sarbanes-Oxley Act of 2002, that:
(1) The Report fully complies with the requirements of section 13(a) or 15(d) of the Securities Exchange Act of 1934; and
(2) The information contained in the Report fairly presents, in all material respects, the financial condition and result of operations of the Company.
Date: August 9, 2023 |
|
By: |
/s/ James Rallo |
|
|
|
James Rallo |
|
|
|
Chief Financial Officer |