UNITED STATES
SECURITIES AND EXCHANGE COMMISSION
Washington, D.C. 20549
FORM 10-Q
(Mark One)
☑ |
QUARTERLY REPORT PURSUANT TO SECTION 13 OR 15(d) OF THE SECURITIES EXCHANGE ACT OF 1934 |
For the quarterly period ended June 30, 2023
OR
☐ |
TRANSITION REPORT PURSUANT TO SECTION 13 OR 15(d) OF THE SECURITIES EXCHANGE ACT OF 1934 |
For the transition period from _________ to __________
Commission File Number: 1-32733

ACRES COMMERCIAL REALTY CORP.
(Exact name of registrant as specified in its charter)
Maryland |
|
|
|
20-2287134 |
(State or other jurisdiction of |
|
|
|
(I.R.S. Employer |
incorporation or organization) |
|
|
|
Identification No.) |
390 RXR Plaza, Uniondale, New York 11556 |
||||
(Address of principal executive offices) (Zip Code) |
||||
Registrant’s telephone number, including area code: 516-535-0015 |
||||
Securities registered pursuant to Section 12(b) of the Act: |
||||
|
|
|
|
|
Title of each class |
|
Trading Symbol(s) |
|
Name of each exchange on which registered |
Common Stock, $0.001 par value |
|
ACR |
|
New York Stock Exchange |
8.625% Fixed-to-Floating Series C Cumulative Redeemable Preferred Stock |
|
ACRPrC |
|
New York Stock Exchange |
7.875% Series D Cumulative Redeemable Preferred Stock |
|
ACRPrD |
|
New York Stock Exchange |
Indicate by check mark whether the registrant (1) has filed all reports required to be filed by Section 13 or 15(d) of the Securities Exchange Act of 1934 during the preceding 12 months (or for such shorter period that the registrant was required to file such reports), and (2) has been subject to such filing requirements for the past 90 days. Yes ☑ No ☐
Indicate by check mark whether the registrant has submitted electronically every Interactive Data File required to be submitted pursuant to Rule 405 of Regulation S-T (§ 232.405 of this chapter) during the preceding 12 months (or for such shorter period that the registrant was required to submit such files). Yes ☑ No ☐
Indicate by check mark whether the registrant is a large accelerated filer, an accelerated filer, a non-accelerated filer, a smaller reporting company, or an emerging growth company. See the definitions of “large accelerated filer,” “accelerated filer,” “smaller reporting company,” and “emerging growth company” in Rule 12b-2 of the Exchange Act.
Large accelerated filer |
☐ |
|
Accelerated filer |
☑ |
Non-accelerated filer |
☐ |
|
Smaller reporting company |
☑ |
|
|
|
Emerging growth company |
☐ |
If an emerging growth company, indicate by check mark if the registrant has elected not to use the extended transition period for complying with any new or revised financial accounting standards provided pursuant to Section 13(a) of the Exchange Act. ☐
Indicate by check mark whether the registrant is a shell company (as defined in Rule 12b-2 of the Exchange Act). ☐ Yes ☑ No
The number of outstanding shares of the registrant’s common stock on August 4, 2023 was 8,491,979 shares.
ACRES COMMERCIAL REALTY CORP. AND SUBSIDIARIES
INDEX TO QUARTERLY REPORT
ON FORM 10-Q
|
|
PAGE |
|
3 |
|
Item 1: |
3 |
|
|
Consolidated Balance Sheets – June 30, 2023 (unaudited) and December 31, 2022 |
3 |
|
5 |
|
|
6 |
|
|
7 |
|
|
Consolidated Statements of Cash Flows (unaudited) for the Six Months Ended June 30, 2023 and 2022 |
9 |
|
Notes to Consolidated Financial Statements – June 30, 2023 (unaudited) |
10 |
Item 2: |
Management’s Discussion and Analysis of Financial Condition and Results of Operations |
41 |
Item 3: |
74 |
|
Item 4: |
75 |
|
|
76 |
|
Item 1: |
76 |
|
Item 1A: |
76 |
|
Item 2: |
76 |
|
Item 5: |
76 |
|
Item 6: |
77 |
|
81 |
||
PART I
ITEM 1. FINANCIAL STATEMENTS
ACRES COMMERCIAL REALTY CORP. AND SUBSIDIARIES
CONSOLIDATED BALANCE SHEETS
(in thousands, except share and per share data)
|
|
June 30, 2023 |
|
|
December 31, 2022 |
|
||
|
|
(unaudited) |
|
|
|
|
||
ASSETS (1) |
|
|
|
|
|
|
||
Cash and cash equivalents |
|
$ |
57,112 |
|
|
$ |
66,232 |
|
Restricted cash |
|
|
15,251 |
|
|
|
38,579 |
|
Accrued interest receivable |
|
|
12,615 |
|
|
|
11,969 |
|
CRE loans |
|
|
1,963,740 |
|
|
|
2,057,590 |
|
Less: allowance for credit losses |
|
|
(25,651 |
) |
|
|
(18,803 |
) |
CRE loans, net |
|
|
1,938,089 |
|
|
|
2,038,787 |
|
Loan receivable - related party |
|
|
11,125 |
|
|
|
11,275 |
|
Investments in unconsolidated entities |
|
|
1,548 |
|
|
|
1,548 |
|
Properties held for sale |
|
|
61,565 |
|
|
|
53,769 |
|
Investments in real estate |
|
|
137,363 |
|
|
|
120,968 |
|
Right of use assets |
|
|
20,061 |
|
|
|
20,281 |
|
Intangible assets |
|
|
8,376 |
|
|
|
8,880 |
|
Other assets |
|
|
3,551 |
|
|
|
4,364 |
|
Total assets |
|
$ |
2,266,656 |
|
|
$ |
2,376,652 |
|
LIABILITIES (2) |
|
|
|
|
|
|
||
Accounts payable and other liabilities |
|
$ |
15,597 |
|
|
$ |
10,391 |
|
Management fee payable - related party |
|
|
261 |
|
|
|
898 |
|
Accrued interest payable |
|
|
7,181 |
|
|
|
6,921 |
|
Borrowings |
|
|
1,749,199 |
|
|
|
1,867,033 |
|
Lease liabilities |
|
|
43,988 |
|
|
|
43,695 |
|
Distributions payable |
|
|
3,262 |
|
|
|
3,262 |
|
Accrued tax liability |
|
|
142 |
|
|
|
113 |
|
Liabilities held for sale |
|
|
3,025 |
|
|
|
3,025 |
|
Total liabilities |
|
|
1,822,655 |
|
|
|
1,935,338 |
|
EQUITY |
|
|
|
|
|
|
||
Preferred stock, par value $0.001: 10,000,000 shares authorized 8.625% Fixed-to-Floating Series C Cumulative Redeemable Preferred Stock, liquidation preference $25.00 per share; 4,800,000 and 4,800,000 shares issued and outstanding |
|
|
5 |
|
|
|
5 |
|
Preferred stock, par value $0.001: 6,800,000 shares authorized 7.875% Series D Cumulative Redeemable Preferred Stock, liquidation preference $25.00 per share; 4,607,857 and 4,607,857 shares issued and outstanding |
|
|
5 |
|
|
|
5 |
|
Common stock, par value $0.001: 41,666,666 shares authorized; 8,517,595 and 8,708,100 shares issued and outstanding (including 416,675 and 583,333 unvested restricted shares) |
|
|
9 |
|
|
|
9 |
|
Additional paid-in capital |
|
|
1,174,094 |
|
|
|
1,174,202 |
|
Accumulated other comprehensive loss |
|
|
(5,604 |
) |
|
|
(6,394 |
) |
Distributions in excess of earnings |
|
|
(733,958 |
) |
|
|
(732,359 |
) |
Total stockholders’ equity |
|
|
434,551 |
|
|
|
435,468 |
|
Non-controlling interests |
|
|
9,450 |
|
|
|
5,846 |
|
Total equity |
|
|
444,001 |
|
|
|
441,314 |
|
TOTAL LIABILITIES AND EQUITY |
|
$ |
2,266,656 |
|
|
$ |
2,376,652 |
|
The accompanying notes are an integral part of these statements
3
ACRES COMMERCIAL REALTY CORP. AND SUBSIDIARIES
CONSOLIDATED BALANCE SHEETS - (Continued)
(in thousands, except share and per share data)
|
|
June 30, 2023 |
|
|
December 31, 2022 |
|
||
|
|
(unaudited) |
|
|
|
|
||
(1) Assets of consolidated variable interest entities (“VIEs”) included in total assets above: |
|
|
|
|
|
|
||
Restricted cash |
|
$ |
14,483 |
|
|
$ |
38,180 |
|
Accrued interest receivable |
|
|
9,144 |
|
|
|
8,184 |
|
CRE loans, pledged as collateral (3) |
|
|
1,481,255 |
|
|
|
1,456,649 |
|
Other assets |
|
|
83 |
|
|
|
119 |
|
Total assets of consolidated VIEs |
|
$ |
1,504,965 |
|
|
$ |
1,503,132 |
|
(2) Liabilities of consolidated VIEs included in total liabilities above: |
|
|
|
|
|
|
||
Accounts payable and other liabilities |
|
$ |
122 |
|
|
$ |
93 |
|
Accrued interest payable |
|
|
3,305 |
|
|
|
3,083 |
|
Borrowings |
|
|
1,234,303 |
|
|
|
1,233,556 |
|
Total liabilities of consolidated VIEs |
|
$ |
1,237,730 |
|
|
$ |
1,236,732 |
|
The accompanying notes are an integral part of these statements
4
ACRES COMMERCIAL REALTY CORP. AND SUBSIDIARIES
CONSOLIDATED STATEMENTS OF OPERATIONS
(in thousands, except share and per share data)
(unaudited)
|
|
For the Three Months Ended June 30, |
|
|
For the Six Months Ended June 30, |
|
||||||||||
|
|
2023 |
|
|
2022 |
|
|
2023 |
|
|
2022 |
|
||||
REVENUES |
|
|
|
|
|
|
|
|
|
|
|
|
||||
Interest income: |
|
|
|
|
|
|
|
|
|
|
|
|
||||
CRE loans |
|
$ |
46,351 |
|
|
$ |
26,964 |
|
|
$ |
90,821 |
|
|
$ |
49,621 |
|
Other |
|
|
797 |
|
|
|
55 |
|
|
|
1,656 |
|
|
|
74 |
|
Total interest income |
|
|
47,148 |
|
|
|
27,019 |
|
|
|
92,477 |
|
|
|
49,695 |
|
Interest expense |
|
|
32,442 |
|
|
|
15,745 |
|
|
|
63,817 |
|
|
|
30,652 |
|
Net interest income |
|
|
14,706 |
|
|
|
11,274 |
|
|
|
28,660 |
|
|
|
19,043 |
|
Real estate income |
|
|
8,879 |
|
|
|
8,777 |
|
|
|
15,950 |
|
|
|
11,915 |
|
Other revenue |
|
|
37 |
|
|
|
19 |
|
|
|
70 |
|
|
|
35 |
|
Total revenues |
|
|
23,622 |
|
|
|
20,070 |
|
|
|
44,680 |
|
|
|
30,993 |
|
OPERATING EXPENSES |
|
|
|
|
|
|
|
|
|
|
|
|
||||
General and administrative |
|
|
2,348 |
|
|
|
2,353 |
|
|
|
5,327 |
|
|
|
5,810 |
|
Real estate expenses |
|
|
10,492 |
|
|
|
9,162 |
|
|
|
19,352 |
|
|
|
13,956 |
|
Management fees - related party |
|
|
1,890 |
|
|
|
1,672 |
|
|
|
3,663 |
|
|
|
3,354 |
|
Equity compensation - related party |
|
|
719 |
|
|
|
991 |
|
|
|
1,613 |
|
|
|
1,735 |
|
Corporate depreciation and amortization |
|
|
23 |
|
|
|
21 |
|
|
|
46 |
|
|
|
43 |
|
Provision for (reversal of) credit losses, net |
|
|
2,700 |
|
|
|
524 |
|
|
|
7,796 |
|
|
|
(1,278 |
) |
Total operating expenses |
|
|
18,172 |
|
|
|
14,723 |
|
|
|
37,797 |
|
|
|
23,620 |
|
|
|
|
5,450 |
|
|
|
5,347 |
|
|
|
6,883 |
|
|
|
7,373 |
|
OTHER INCOME (EXPENSE) |
|
|
|
|
|
|
|
|
|
|
|
|
||||
Loss on extinguishment of debt |
|
|
— |
|
|
|
— |
|
|
|
— |
|
|
|
(460 |
) |
Gain on sale of real estate |
|
|
— |
|
|
|
— |
|
|
|
745 |
|
|
|
— |
|
Other income |
|
|
242 |
|
|
|
175 |
|
|
|
352 |
|
|
|
973 |
|
Total other income |
|
|
242 |
|
|
|
175 |
|
|
|
1,097 |
|
|
|
513 |
|
INCOME BEFORE TAXES |
|
|
5,692 |
|
|
|
5,522 |
|
|
|
7,980 |
|
|
|
7,886 |
|
Income tax expense |
|
|
(134 |
) |
|
|
— |
|
|
|
(129 |
) |
|
|
(280 |
) |
NET INCOME |
|
|
5,558 |
|
|
|
5,522 |
|
|
|
7,851 |
|
|
|
7,606 |
|
Net income allocated to preferred shares |
|
|
(4,856 |
) |
|
|
(4,856 |
) |
|
|
(9,711 |
) |
|
|
(9,711 |
) |
Net loss allocable to non-controlling interest, net of taxes |
|
|
115 |
|
|
|
24 |
|
|
|
261 |
|
|
|
24 |
|
NET INCOME (LOSS) ALLOCABLE TO COMMON SHARES |
|
$ |
817 |
|
|
$ |
690 |
|
|
$ |
(1,599 |
) |
|
$ |
(2,081 |
) |
NET INCOME (LOSS) PER COMMON SHARE - BASIC |
|
$ |
0.10 |
|
|
$ |
0.08 |
|
|
$ |
(0.19 |
) |
|
$ |
(0.23 |
) |
NET INCOME (LOSS) PER COMMON SHARE - DILUTED |
|
$ |
0.10 |
|
|
$ |
0.08 |
|
|
$ |
(0.19 |
) |
|
$ |
(0.23 |
) |
WEIGHTED AVERAGE NUMBER OF COMMON SHARES OUTSTANDING - BASIC |
|
|
8,451,973 |
|
|
|
8,888,461 |
|
|
|
8,476,059 |
|
|
|
8,992,142 |
|
WEIGHTED AVERAGE NUMBER OF COMMON SHARES OUTSTANDING - DILUTED |
|
|
8,534,558 |
|
|
|
8,914,172 |
|
|
|
8,476,059 |
|
|
|
8,992,142 |
|
The accompanying notes are an integral part of these statements
5
ACRES COMMERCIAL REALTY CORP. AND SUBSIDIARIES
CONSOLIDATED STATEMENTS OF COMPREHENSIVE INCOME (LOSS)
(in thousands)
(unaudited)
|
|
For the Three Months Ended June 30, |
|
|
For the Six Months Ended June 30, |
|
||||||||||
|
|
2023 |
|
|
2022 |
|
|
2023 |
|
|
2022 |
|
||||
Net income |
|
$ |
5,558 |
|
|
$ |
5,522 |
|
|
$ |
7,851 |
|
|
$ |
7,606 |
|
Other comprehensive income: |
|
|
|
|
|
|
|
|
|
|
|
|
||||
Reclassification adjustments associated with net unrealized losses from interest rate swaps included in net income |
|
|
397 |
|
|
|
461 |
|
|
|
790 |
|
|
|
917 |
|
Total other comprehensive income |
|
|
397 |
|
|
|
461 |
|
|
|
790 |
|
|
|
917 |
|
Comprehensive income before allocation to preferred shares |
|
|
5,955 |
|
|
|
5,983 |
|
|
|
8,641 |
|
|
|
8,523 |
|
Net loss allocated to non-controlling interests shares |
|
|
115 |
|
|
|
24 |
|
|
|
261 |
|
|
|
24 |
|
Net income allocated to preferred shares |
|
|
(4,856 |
) |
|
|
(4,856 |
) |
|
|
(9,711 |
) |
|
|
(9,711 |
) |
Comprehensive income (loss) allocable to common shares |
|
$ |
1,214 |
|
|
$ |
1,151 |
|
|
$ |
(809 |
) |
|
$ |
(1,164 |
) |
The accompanying notes are an integral part of these statements
6
ACRES COMMERCIAL REALTY CORP. AND SUBSIDIARIES
CONSOLIDATED STATEMENTS OF CHANGES IN EQUITY
(in thousands, except share and per share data)
(unaudited)
|
|
Common Stock |
|
|
|
|
|
|
|
|
|
|
|
|
|
|
|
|
|
|
|
|
|
|
|
|
|
|||||||||||||
|
|
Shares |
|
|
Amount |
|
|
Series C Preferred Stock |
|
|
Series D Preferred Stock |
|
|
Additional Paid-In Capital |
|
|
Accumulated Other Comprehensive Loss |
|
|
Retained Earnings (Distributions in Excess of Earnings) |
|
|
Total Stockholders’ Equity |
|
|
Non-Controlling Interest |
|
|
Total Equity |
|
||||||||||
Balance, December 31, 2022 |
|
|
8,708,100 |
|
|
$ |
9 |
|
|
$ |
5 |
|
|
$ |
5 |
|
|
$ |
1,174,202 |
|
|
$ |
(6,394 |
) |
|
$ |
(732,359 |
) |
|
$ |
435,468 |
|
|
$ |
5,846 |
|
|
$ |
441,314 |
|
Purchase and retirement of common stock |
|
|
(79,744 |
) |
|
|
— |
|
|
|
— |
|
|
|
— |
|
|
|
(756 |
) |
|
|
— |
|
|
|
— |
|
|
|
(756 |
) |
|
|
— |
|
|
|
(756 |
) |
Stock-based compensation |
|
|
17,780 |
|
|
|
— |
|
|
|
— |
|
|
|
— |
|
|
|
170 |
|
|
|
— |
|
|
|
— |
|
|
|
170 |
|
|
|
— |
|
|
|
170 |
|
Amortization of stock-based compensation |
|
|
— |
|
|
|
— |
|
|
|
— |
|
|
|
— |
|
|
|
894 |
|
|
|
— |
|
|
|
— |
|
|
|
894 |
|
|
|
— |
|
|
|
894 |
|
Contributions from non-controlling interests |
|
|
— |
|
|
|
— |
|
|
|
— |
|
|
|
— |
|
|
|
— |
|
|
|
— |
|
|
|
— |
|
|
|
— |
|
|
|
2,332 |
|
|
|
2,332 |
|
Net income |
|
|
— |
|
|
|
— |
|
|
|
— |
|
|
|
— |
|
|
|
— |
|
|
|
— |
|
|
|
2,439 |
|
|
|
2,439 |
|
|
|
(146 |
) |
|
|
2,293 |
|
Distributions and accrual of cumulative preferred stock dividends |
|
|
— |
|
|
|
— |
|
|
|
— |
|
|
|
— |
|
|
|
— |
|
|
|
— |
|
|
|
(4,855 |
) |
|
|
(4,855 |
) |
|
|
— |
|
|
|
(4,855 |
) |
Amortization of terminated derivatives |
|
|
— |
|
|
|
— |
|
|
|
— |
|
|
|
— |
|
|
|
— |
|
|
|
393 |
|
|
|
— |
|
|
|
393 |
|
|
|
— |
|
|
|
393 |
|
Balance, March 31, 2023 |
|
|
8,646,136 |
|
|
$ |
9 |
|
|
$ |
5 |
|
|
$ |
5 |
|
|
$ |
1,174,510 |
|
|
$ |
(6,001 |
) |
|
$ |
(734,775 |
) |
|
$ |
433,753 |
|
|
$ |
8,032 |
|
|
$ |
441,785 |
|
Purchase and retirement of common stock |
|
|
(135,416 |
) |
|
|
— |
|
|
|
— |
|
|
|
— |
|
|
|
(1,200 |
) |
|
|
— |
|
|
|
— |
|
|
|
(1,200 |
) |
|
|
— |
|
|
|
(1,200 |
) |
Stock-based compensation |
|
|
6,875 |
|
|
|
— |
|
|
|
— |
|
|
|
— |
|
|
|
65 |
|
|
|
— |
|
|
|
— |
|
|
|
65 |
|
|
|
— |
|
|
|
65 |
|
Amortization of stock-based compensation |
|
|
— |
|
|
|
— |
|
|
|
— |
|
|
|
— |
|
|
|
719 |
|
|
|
— |
|
|
|
— |
|
|
|
719 |
|
|
|
— |
|
|
|
719 |
|
Contributions from non-controlling interests |
|
|
— |
|
|
|
— |
|
|
|
— |
|
|
|
— |
|
|
|
— |
|
|
|
— |
|
|
|
— |
|
|
|
— |
|
|
|
1,533 |
|
|
|
1,533 |
|
Net income |
|
|
— |
|
|
|
— |
|
|
|
— |
|
|
|
— |
|
|
|
— |
|
|
|
— |
|
|
|
5,673 |
|
|
|
5,673 |
|
|
|
(115 |
) |
|
|
5,558 |
|
Distributions and accrual of cumulative preferred stock dividends |
|
|
— |
|
|
|
— |
|
|
|
— |
|
|
|
— |
|
|
|
— |
|
|
|
— |
|
|
|
(4,856 |
) |
|
|
(4,856 |
) |
|
|
— |
|
|
|
(4,856 |
) |
Amortization of terminated derivatives |
|
|
— |
|
|
|
— |
|
|
|
— |
|
|
|
— |
|
|
|
— |
|
|
|
397 |
|
|
|
— |
|
|
|
397 |
|
|
|
— |
|
|
|
397 |
|
Balance, June 30, 2023 |
|
|
8,517,595 |
|
|
$ |
9 |
|
|
$ |
5 |
|
|
$ |
5 |
|
|
$ |
1,174,094 |
|
|
$ |
(5,604 |
) |
|
$ |
(733,958 |
) |
|
$ |
434,551 |
|
|
$ |
9,450 |
|
|
$ |
444,001 |
|
The accompanying notes are an integral part of these statements
7
ACRES COMMERCIAL REALTY CORP. AND SUBSIDIARIES
CONSOLIDATED STATEMENTS OF CHANGES IN EQUITY - (Continued)
(in thousands, except share and per share data)
(unaudited)
|
|
Common Stock |
|
|
|
|
|
|
|
|
|
|
|
|
|
|
|
|
|
|
|
|
|
|
|
|
|
|||||||||||||
|
|
Shares |
|
|
Amount |
|
|
Series C Preferred Stock |
|
|
Series D Preferred Stock |
|
|
Additional Paid-In Capital |
|
|
Accumulated Other Comprehensive Loss |
|
|
Retained Earnings (Distributions in Excess of Earnings) |
|
|
Total Stockholders’ Equity |
|
|
Non-Controlling Interest |
|
|
Total Equity |
|
||||||||||
Balance, December 31, 2021 |
|
|
9,149,079 |
|
|
$ |
9 |
|
|
$ |
5 |
|
|
$ |
5 |
|
|
$ |
1,179,863 |
|
|
$ |
(8,127 |
) |
|
$ |
(723,560 |
) |
|
$ |
448,195 |
|
|
$ |
— |
|
|
$ |
448,195 |
|
Offering costs |
|
|
— |
|
|
|
— |
|
|
|
— |
|
|
|
— |
|
|
|
(37 |
) |
|
|
— |
|
|
|
— |
|
|
|
(37 |
) |
|
|
— |
|
|
|
(37 |
) |
Purchase and retirement of common stock |
|
|
(314,552 |
) |
|
|
— |
|
|
|
— |
|
|
|
— |
|
|
|
(3,885 |
) |
|
|
— |
|
|
|
— |
|
|
|
(3,885 |
) |
|
|
— |
|
|
|
(3,885 |
) |
Amortization of stock-based compensation |
|
|
— |
|
|
|
— |
|
|
|
— |
|
|
|
— |
|
|
|
744 |
|
|
|
— |
|
|
|
— |
|
|
|
744 |
|
|
|
— |
|
|
|
744 |
|
Net income |
|
|
— |
|
|
|
— |
|
|
|
— |
|
|
|
— |
|
|
|
— |
|
|
|
— |
|
|
|
2,084 |
|
|
|
2,084 |
|
|
|
— |
|
|
|
2,084 |
|
Distributions and accrual of cumulative preferred stock dividends |
|
|
— |
|
|
|
— |
|
|
|
— |
|
|
|
— |
|
|
|
— |
|
|
|
— |
|
|
|
(4,855 |
) |
|
|
(4,855 |
) |
|
|
— |
|
|
|
(4,855 |
) |
Amortization of terminated derivatives |
|
|
— |
|
|
|
— |
|
|
|
— |
|
|
|
— |
|
|
|
— |
|
|
|
456 |
|
|
|
— |
|
|
|
456 |
|
|
|
— |
|
|
|
456 |
|
Balance, March 31, 2022 |
|
|
8,834,527 |
|
|
$ |
9 |
|
|
$ |
5 |
|
|
$ |
5 |
|
|
$ |
1,176,685 |
|
|
$ |
(7,671 |
) |
|
$ |
(726,331 |
) |
|
$ |
442,702 |
|
|
$ |
— |
|
|
$ |
442,702 |
|
Offering costs |
|
|
— |
|
|
|
— |
|
|
|
— |
|
|
|
— |
|
|
|
(33 |
) |
|
|
— |
|
|
|
— |
|
|
|
(33 |
) |
|
|
— |
|
|
|
(33 |
) |
Purchase and retirement of common stock |
|
|
(237,730 |
) |
|
|
— |
|
|
|
— |
|
|
|
— |
|
|
|
(2,497 |
) |
|
|
— |
|
|
|
— |
|
|
|
(2,497 |
) |
|
|
— |
|
|
|
(2,497 |
) |
Stock-based compensation |
|
|
333,333 |
|
|
|
— |
|
|
|
— |
|
|
|
— |
|
|
|
— |
|
|
|
— |
|
|
|
— |
|
|
|
— |
|
|
|
— |
|
|
|
— |
|
Amortization of stock-based compensation |
|
|
— |
|
|
|
— |
|
|
|
— |
|
|
|
— |
|
|
|
991 |
|
|
|
— |
|
|
|
— |
|
|
|
991 |
|
|
|
— |
|
|
|
991 |
|
Contributions from non-controlling interests |
|
|
— |
|
|
|
— |
|
|
|
— |
|
|
|
— |
|
|
|
— |
|
|
|
— |
|
|
|
— |
|
|
|
— |
|
|
|
5,036 |
|
|
|
5,036 |
|
Net income |
|
|
— |
|
|
|
— |
|
|
|
— |
|
|
|
— |
|
|
|
— |
|
|
|
— |
|
|
|
5,546 |
|
|
|
5,546 |
|
|
|
(24 |
) |
|
|
5,522 |
|
Distributions and accrual of cumulative preferred stock dividends |
|
|
— |
|
|
|
— |
|
|
|
— |
|
|
|
— |
|
|
|
— |
|
|
|
— |
|
|
|
(4,856 |
) |
|
|
(4,856 |
) |
|
|
— |
|
|
|
(4,856 |
) |
Amortization of terminated derivatives |
|
|
— |
|
|
|
— |
|
|
|
— |
|
|
|
— |
|
|
|
— |
|
|
|
461 |
|
|
|
— |
|
|
|
461 |
|
|
|
— |
|
|
|
461 |
|
Balance, June 30, 2022 |
|
|
8,930,130 |
|
|
$ |
9 |
|
|
$ |
5 |
|
|
$ |
5 |
|
|
$ |
1,175,146 |
|
|
$ |
(7,210 |
) |
|
$ |
(725,641 |
) |
|
$ |
442,314 |
|
|
$ |
5,012 |
|
|
$ |
447,326 |
|
The accompanying notes are an integral part of these statements
8
ACRES COMMERCIAL REALTY CORP. AND SUBSIDIARIES
CONSOLIDATED STATEMENTS OF CASH FLOWS
(in thousands)
(unaudited)
|
|
For the Six Months Ended June 30, |
|
|||||
|
|
2023 |
|
|
2022 |
|
||
CASH FLOWS FROM OPERATING ACTIVITIES: |
|
|
|
|
|
|
||
Net income |
|
$ |
7,851 |
|
|
$ |
7,606 |
|
Adjustments to reconcile net income to net cash provided by operating activities: |
|
|
|
|
|
|
||
Provision for (reversal of) credit losses, net |
|
|
7,796 |
|
|
|
(1,278 |
) |
Depreciation, amortization and accretion |
|
|
2,683 |
|
|
|
5,364 |
|
Amortization of stock-based compensation |
|
|
1,613 |
|
|
|
1,735 |
|
Loss on the extinguishment of debt |
|
|
— |
|
|
|
460 |
|
Gain on sale of real estate |
|
|
(745 |
) |
|
|
— |
|
Changes in operating assets and liabilities: |
|
|
5,271 |
|
|
|
(170 |
) |
Net cash provided by operating activities |
|
|
24,469 |
|
|
|
13,717 |
|
CASH FLOWS FROM INVESTING ACTIVITIES: |
|
|
|
|
|
|
||
Origination and purchase of loans |
|
|
(66,885 |
) |
|
|
(392,121 |
) |
Principal payments received on loans and leases |
|
|
141,430 |
|
|
|
216,368 |
|
Investments in real estate |
|
|
(15,352 |
) |
|
|
(72,279 |
) |
Proceeds from sale of real estate |
|
|
14,309 |
|
|
|
— |
|
Purchase of furniture and fixtures |
|
|
— |
|
|
|
(20 |
) |
Principal payments received on loan - related party |
|
|
150 |
|
|
|
125 |
|
Net cash provided by (used in) investing activities |
|
|
73,652 |
|
|
|
(247,927 |
) |
CASH FLOWS FROM FINANCING ACTIVITIES: |
|
|
|
|
|
|
||
Repurchase of common stock |
|
|
(1,956 |
) |
|
|
(6,382 |
) |
Proceeds from issuance of preferred shares (net of $70 of underwriting discounts and offering costs) |
|
|
— |
|
|
|
(70 |
) |
Proceeds from borrowings: |
|
|
|
|
|
|
||
Senior secured financing facility |
|
|
— |
|
|
|
30,025 |
|
Warehouse financing facilities and repurchase agreements |
|
|
11,888 |
|
|
|
298,882 |
|
Mortgage payable |
|
|
144 |
|
|
|
18,710 |
|
Payments on borrowings: |
|
|
|
|
|
|
||
Securitizations |
|
|
(851 |
) |
|
|
(237,189 |
) |
Senior secured financing facility |
|
|
(40,554 |
) |
|
|
(10,150 |
) |
Warehouse financing facilities and repurchase agreements |
|
|
(89,606 |
) |
|
|
(38,150 |
) |
Convertible senior notes |
|
|
— |
|
|
|
(39,839 |
) |
Payment of debt issuance costs |
|
|
(3,787 |
) |
|
|
(646 |
) |
Proceeds received from non-controlling interests |
|
|
3,865 |
|
|
|
5,036 |
|
Distributions paid on preferred stock |
|
|
(9,711 |
) |
|
|
(9,711 |
) |
Net cash (used in) provided by financing activities |
|
|
(130,568 |
) |
|
|
10,516 |
|
NET DECREASE IN CASH AND CASH EQUIVALENTS AND RESTRICTED CASH |
|
|
(32,447 |
) |
|
|
(223,694 |
) |
CASH AND CASH EQUIVALENTS AND RESTRICTED CASH AT BEGINNING OF PERIOD |
|
|
104,810 |
|
|
|
283,931 |
|
CASH AND CASH EQUIVALENTS AND RESTRICTED CASH AT END OF PERIOD |
|
$ |
72,363 |
|
|
$ |
60,237 |
|
The accompanying notes are an integral part of these statements
9
ACRES COMMERCIAL REALTY CORP. AND SUBSIDIARIES
NOTES TO CONSOLIDATED FINANCIAL STATEMENTS
JUNE 30, 2023
(unaudited)
NOTE 1 - ORGANIZATION
ACRES Commercial Realty Corp., a Maryland corporation, along with its subsidiaries (collectively, the “Company”), is a real estate investment trust (“REIT”) that is primarily focused on originating, holding and managing commercial real estate (“CRE”) mortgage loans and equity investments in commercial real estate properties through direct ownership and joint ventures. The Company’s manager is ACRES Capital, LLC (the “Manager”), a subsidiary of ACRES Capital Corp. (collectively, “ACRES”), a private commercial real estate lender exclusively dedicated to nationwide middle market CRE lending with a focus on multifamily, student housing, hospitality, office and industrial property in top United States (“U.S.”) markets.
The Company has qualified, and expects to qualify in the current fiscal year, as a REIT.
The Company conducts its operations through the use of subsidiaries that it consolidates into its financial statements. The Company’s core assets are consolidated through its investment in ACRES Realty Funding, Inc. (“ACRES RF”), a wholly-owned subsidiary that holds CRE loans, investments in commercial real estate properties and investments in CRE securitizations, which are consolidated as VIEs as discussed in Note 3.
NOTE 2 - SUMMARY OF SIGNIFICANT ACCOUNTING POLICIES
Principles of Consolidation
The accompanying consolidated financial statements have been prepared in conformity with accounting principles generally accepted in the U.S. (“GAAP”). The consolidated financial statements include the accounts of the Company, majority-owned or controlled subsidiaries and VIEs for which the Company is considered the primary beneficiary. All inter-company transactions and balances have been eliminated in consolidation.
Basis of Presentation
All adjustments necessary to fairly present the Company’s financial position, results of operations and cash flows have been made.
Use of Estimates
The preparation of financial statements in conformity with GAAP requires management to make estimates and assumptions that affect the reported amounts of assets and liabilities and disclosure of contingent assets and liabilities at the date of the financial statements and within the period of financial results. Actual results could differ from those estimates. Estimates affecting the accompanying consolidated financial statements include, but are not limited to, the net realizable and fair values of the Company’s investments and derivatives, the estimated useful lives used to calculate depreciation, the expected lives over which to amortize premiums and accrete discounts, reversals of or provisions for expected credit losses and the disclosure of contingent liabilities.
Cash and Cash Equivalents
Cash and cash equivalents include cash on hand and all highly liquid investments with original maturities of three months or less at the time of purchase. At June 30, 2023 and December 31, 2022, $53.1 million and $63.3 million, respectively, of the reported cash balances exceeded the Federal Deposit Insurance Corporation and Securities Investor Protection Corporation deposit insurance limits of $250,000 per respective depository or brokerage institution. However, all of the Company’s cash deposits are held at multiple, established financial institutions, in multiple accounts associated with its parent and respective consolidated subsidiaries, to minimize credit risk exposure. The Company has not experienced, and does not expect, any losses on its cash and cash equivalents.
Restricted cash includes required account balance minimums primarily for the Company’s CRE debt securitizations as well as cash held in the syndicated corporate loan collateralized debt obligations (“CDOs”).
10
ACRES COMMERCIAL REALTY CORP. AND SUBSIDIARIES
NOTES TO CONSOLIDATED FINANCIAL STATEMENTS - (Continued)
JUNE 30, 2023
(unaudited)
The following table provides a reconciliation of cash, cash equivalents and restricted cash on the consolidated balance sheets to the total amount shown on the consolidated statements of cash flows (in thousands):
|
|
June 30, |
|
|||||
|
|
2023 |
|
|
2022 |
|
||
Cash and cash equivalents |
|
$ |
57,112 |
|
|
$ |
34,870 |
|
Restricted cash |
|
|
15,251 |
|
|
|
25,367 |
|
Total cash, cash equivalents and restricted cash shown on the Company’s consolidated statements of cash flows |
|
$ |
72,363 |
|
|
$ |
60,237 |
|
Investment in Real Estate
The Company depreciates investments in real estate and amortizes related intangible assets over the estimated useful lives of the assets as follows:
Category |
|
Term |
Building |
|
35 to 40 years |
Building improvements |
|
8 to 35 years |
Site improvements |
|
10 years |
Tenant improvements |
|
Shorter of lease term or expected useful life |
Furniture, fixtures and equipment |
|
3 to 12 years |
Right of use assets |
|
7 to 94 years |
Intangible assets |
|
90 days to 18 years |
Lease liabilities |
|
7 to 94 years |
Income Taxes
The Company recorded a full valuation allowance against its net deferred tax assets (tax effected expense of $21.0 million) at June 30, 2023, as the Company believes it is more likely than not that the deferred tax assets will not be realized. This assessment was based on the Company’s cumulative historical losses and uncertainties as to the amount of taxable income that would be generated in future years by the Company’s taxable REIT subsidiaries.
Earnings per Share
The Company presents both basic and diluted earnings per share (“EPS”). Basic EPS excludes dilution and is computed by dividing net income (loss) allocable to common shareholders by the weighted average number of shares outstanding for the period. Diluted EPS reflects the potential dilution that could occur if securities or other contracts to issue common stock were exercised or converted into common stock, where such exercise or conversion would result in a lower EPS amount.
Reference Rate Reform
Historically, the Company has used LIBOR as the benchmark interest rate for its floating-rate whole loans and the Company has been exposed to LIBOR through its floating-rate borrowings. In March 2021, the United Kingdom’s, or U.K.’s, Financial Conduct Authority (“FCA”) announced that it would cease publication of the one-week and the two-month USD LIBOR immediately after December 31, 2021 and cease publication of the remaining tenors immediately after June 30, 2023. In July 2021, the U.S. Federal Reserve, in conjunction with the Alternative Reference Rates Committee, a steering committee composed of large U.S. financial institutions, identified the Secured Overnight Financing Rate (“SOFR”) as its preferred alternative rate for LIBOR.
Following this announcement, the Company began to transition the contractual benchmark rates of existing floating-rate whole loans and borrowings to alternate rates. Additionally, beginning January 1, 2022, all variable rate loans originated by the Company and all variable rate borrowings acquired had been benchmarked to SOFR. At June 30, 2023, the Company's whole loan portfolio had a carrying value of $1.9 billion of floating rate loans, all of which have interest rates tied to SOFR. At June 30, 2023, the Company had $1.6 billion of outstanding floating rate borrowings, 3.2% or $51.5 million of which have interest rates tied to LIBOR and 96.8% or $1.5 billion of which have interest rates tied to SOFR.
11
ACRES COMMERCIAL REALTY CORP. AND SUBSIDIARIES
NOTES TO CONSOLIDATED FINANCIAL STATEMENTS - (Continued)
JUNE 30, 2023
(unaudited)
The Company expects to complete the process of converting its LIBOR-based borrowings to an applicable benchmark interest rate during 2023.
Recent Accounting Standards
Accounting Standards Adopted in 2023
In March 2022, the Financial Accounting Standards Board ("FASB") issued an amendment eliminating certain previously issued accounting guidance for troubled-debt restructurings (“TDRs”) and enhancing disclosure requirements surrounding refinancings, restructurings, and write-offs. Current GAAP provides an exception to the general recognition and measurement guidance for loan restructurings if they meet specific criteria to be considered TDRs. If a modification is a TDR, incremental expected losses are recorded in the allowance for credit losses upon modification and specific disclosures are required. The new amendment eliminates the TDR recognition and measurement guidance and requires the reporting entity to evaluate whether the modification represents a new loan or a continuation of an existing loan, consistent with accounting for other loan modifications. The amendment also requires public business entities to disclose current-period gross write-offs by year of origination for certain financing receivables and net investments in leases. The Company adopted this guidance during the six months ended June 30, 2023 and the adoption did not have a material impact on the Company's consolidated financial statements.
NOTE 3 - VARIABLE INTEREST ENTITIES
The Company has evaluated its loans, investments in unconsolidated entities, liabilities to subsidiary trusts issuing preferred securities (consisting of unsecured junior subordinated notes), securitizations, guarantees and other financial contracts in order to determine if they are variable interests in VIEs. The Company regularly monitors these legal interests and contracts and, to the extent it has determined that it has a variable interest, analyzes the related entity for potential consolidation.
Consolidated VIEs (the Company is the primary beneficiary)
Based on management’s analysis, the Company was the primary beneficiary of five VIEs at both June 30, 2023 and December 31, 2022 (collectively, the “Consolidated VIEs”).
The Consolidated VIEs are CRE securitizations and CDOs that were formed on behalf of the Company to invest in real estate-related securities, commercial mortgage-backed securities (“CMBS”), syndicated corporate loans and corporate bonds and were financed by the issuance of debt securities. By financing these assets with long-term borrowings through the issuance of debt securities, the Company seeks to generate attractive risk-adjusted equity returns and to match the term of its assets and liabilities. The primary beneficiary determination for each of these VIEs was made at each VIE’s inception and is continually assessed.
In April 2022, the Company contributed an initial investment of $13.0 million for a 72.1% interest in Charles Street-ACRES FSU Student Venture, LLC (the “FSU Student Venture”). The FSU Student Venture, a joint venture between the Company and two unrelated third parties, was formed for the purpose of developing a student housing project. The FSU Student Venture was determined not to be a VIE as there was sufficient equity at risk, it does not have disproportionate voting rights and its members all have the following characteristics: (1) the power to direct activities (2) the obligation to absorb losses and (3) the right to receive residual returns. However, the Company consolidated the FSU Student Venture due to its 72.1% interest that provides the Company with unilateral control over all major decisions of the joint venture. The portion of the joint venture that the Company does not own is presented as non-controlling interest at and for the periods presented in the Company’s consolidated financial statements.
12
ACRES COMMERCIAL REALTY CORP. AND SUBSIDIARIES
NOTES TO CONSOLIDATED FINANCIAL STATEMENTS - (Continued)
JUNE 30, 2023
(unaudited)
The Company has exposure to losses on its securitizations to the extent of its investments in the subordinated debt and preferred equity of each securitization. The Company is entitled to receive payments of principal and interest on the debt securities it holds and, to the extent revenues exceed debt service requirements and other expenses of the securitizations, distributions with respect to its preferred equity interests. As a result of consolidation, the debt and equity interests the Company holds in these securitizations have been eliminated; and the Company’s consolidated balance sheets reflect the assets held, debt issued by the securitizations to third parties and any accrued payables to third parties. The Company’s operating results and cash flows include the gross amounts related to the securitizations’ assets and liabilities as opposed to the Company’s net economic interests in the securitizations. Assets and liabilities related to the securitizations are disclosed, in the aggregate, on the Company’s consolidated balance sheets. For a discussion of the debt issued through the securitizations, see Note 10.
Creditors of the Company’s Consolidated VIEs have no recourse to the general credit of the Company, nor to each other. During the six months ended June 30, 2023 and 2022, the Company did not provide any financial support to any of its VIEs nor does it have any requirement to do so, although it may choose to do so in the future to maximize future cash flows on such investments by the Company. There are no explicit arrangements that obligate the Company to provide financial support to any of its Consolidated VIEs.
The following table shows the classification and carrying values of assets and liabilities of the Company’s Consolidated VIEs at June 30, 2023 (in thousands):
|
|
CRE Securitizations |
|
|
Other |
|
|
Total |
|
|||
ASSETS |
|
|
|
|
|
|
|
|
|
|||
Restricted cash |
|
$ |
14,201 |
|
|
$ |
282 |
|
|
$ |
14,483 |
|
Accrued interest receivable |
|
|
9,144 |
|
|
|
— |
|
|
|
9,144 |
|
CRE loans, pledged as collateral (1) |
|
|
1,481,255 |
|
|
|
— |
|
|
|
1,481,255 |
|
Other assets |
|
|
27 |
|
|
|
56 |
|
|
|
83 |
|
Total assets (2) |
|
$ |
1,504,627 |
|
|
$ |
338 |
|
|
$ |
1,504,965 |
|
|
|
|
|
|
|
|
|
|
|
|||
LIABILITIES |
|
|
|
|
|
|
|
|
|
|||
Accounts payable and other liabilities |
|
$ |
122 |
|
|
$ |
— |
|
|
$ |
122 |
|
Accrued interest payable |
|
|
3,305 |
|
|
|
— |
|
|
|
3,305 |
|
Borrowings |
|
|
1,234,303 |
|
|
|
— |
|
|
|
1,234,303 |
|
Total liabilities |
|
$ |
1,237,730 |
|
|
$ |
— |
|
|
$ |
1,237,730 |
|
Unconsolidated VIEs (the Company is not the primary beneficiary, but has a variable interest)
Based on management’s analysis, the Company is not the primary beneficiary of the VIEs discussed below since it does not have both (i) the power to direct the activities that most significantly impact the VIE’s economic performance and (ii) the obligation to absorb the losses of the VIE or the right to receive the benefits from the VIE, which could be significant to the VIE. Accordingly, the following VIEs are not consolidated in the Company’s financial statements at June 30, 2023. The Company continuously reassesses whether it is deemed to be the primary beneficiary of its unconsolidated VIEs. The Company’s maximum exposure to risk for each of these unconsolidated VIEs is set forth in the “Maximum Exposure to Loss” column in the table below.
13
ACRES COMMERCIAL REALTY CORP. AND SUBSIDIARIES
NOTES TO CONSOLIDATED FINANCIAL STATEMENTS - (Continued)
JUNE 30, 2023
(unaudited)
Unsecured Junior Subordinated Debentures
The Company has a 100% interest in the common shares of each of Resource Capital Trust I (“RCT I”) and RCC Trust II (“RCT II”), respectively, with a value of $1.5 million in the aggregate, or 3.0% of each trust, at June 30, 2023. RCT I and RCT II were formed for the purposes of providing debt financing to the Company. The Company completed a qualitative analysis to determine whether it is the primary beneficiary of each of the trusts and determined that it was not the primary beneficiary of either trust because it does not have the power to direct the activities most significant to the trusts, which include the collection of principal and interest through servicing rights. Accordingly, neither trust is consolidated into the Company’s consolidated financial statements.
The Company records its investments in RCT I and RCT II’s common shares of $774,000 each as investments in unconsolidated entities using the cost method, recording dividend income when declared by RCT I and RCT II. The trusts each hold subordinated debentures for which the Company is the obligor in the amount of $25.8 million for each of RCT I and RCT II. The debentures were funded by the issuance of trust preferred securities of RCT I and RCT II.
The following table shows the classification, carrying value and maximum exposure to loss with respect to the Company’s unconsolidated VIEs at June 30, 2023 (in thousands):
|
|
Unsecured Junior Subordinated Debentures |
|
|
Maximum Exposure to Loss |
|
||
ASSETS |
|
|
|
|
|
|
||
Accrued interest receivable |
|
$ |
12 |
|
|
$ |
— |
|
Investments in unconsolidated entities |
|
|
1,548 |
|
|
$ |
1,548 |
|
Total assets |
|
|
1,560 |
|
|
|
|
|
|
|
|
|
|
|
|
||
LIABILITIES |
|
|
|
|
|
|
||
Accrued interest payable |
|
|
404 |
|
|
N/A |
|
|
Borrowings |
|
|
51,548 |
|
|
N/A |
|
|
Total liabilities |
|
|
51,952 |
|
|
|
|
|
Net (liability) asset |
|
$ |
(50,392 |
) |
|
|
|
|
At June 30, 2023, there were no explicit arrangements or implicit variable interests that could require the Company to provide financial support to any of its unconsolidated VIEs.
NOTE 4 - SUPPLEMENTAL CASH FLOW INFORMATION
The following table summarizes the Company’s supplemental disclosure of cash flow information (in thousands):
|
|
For the Six Months Ended June 30, |
|
|||||
|
|
2023 |
|
|
2022 |
|
||
Supplemental cash flows: |
|
|
|
|
|
|
||
Interest expense paid in cash |
|
$ |
60,035 |
|
|
$ |
24,736 |
|
Income taxes paid in cash |
|
|
101 |
|
|
|
180 |
|
Non-cash investing activities include the following: |
|
|
|
|
|
|
||
Proceeds from the receipt of deed-in-lieu of foreclosure |
|
$ |
20,900 |
|
|
$ |
— |
|
Investment in properties held for sale related to the receipt of deed-in-lieu of foreclosure |
|
|
(20,900 |
) |
|
|
— |
|
Non-cash financing activities include the following: |
|
|
|
|
|
|
||
Incentive compensation paid in common stock |
|
$ |
234 |
|
|
$ |
— |
|
Distributions on preferred stock accrued but not paid |
|
|
3,262 |
|
|
|
3,262 |
|
14
ACRES COMMERCIAL REALTY CORP. AND SUBSIDIARIES
NOTES TO CONSOLIDATED FINANCIAL STATEMENTS - (Continued)
JUNE 30, 2023
(unaudited)
NOTE 5 - LOANS
The following is a summary of the Company’s CRE loans held for investment by asset type (dollars in thousands, except amounts in footnotes):
Description |
|
Quantity |
|
Principal |
|
|
Unamortized (Discount) Premium, net (1) |
|
|
Amortized Cost |
|
|
Allowance for Credit Losses |
|
|
Carrying Value |
|
|
Contractual Interest Rates (2) |
|
Maturity Dates (3)(4) |
|||||
At June 30, 2023: |
|
|
|
|
|
|
|
|
|
|
|
|
|
|
|
|
|
|
|
|
|
|||||
Whole loans (5)(6) |
|
77 |
|
$ |
1,968,322 |
|
|
$ |
(9,282 |
) |
|
$ |
1,959,040 |
|
|
$ |
(20,951 |
) |
|
$ |
1,938,089 |
|
|
1M BR plus 2.86% to 1M BR plus 8.61% |
|
July 2023 to July 2026 |
Mezzanine loan (5) |
|
1 |
|
|
4,700 |
|
|
|
— |
|
|
|
4,700 |
|
|
|
(4,700 |
) |
|
|
— |
|
|
10.00% |
|
June 2028 |
Total |
|
|
|
$ |
1,973,022 |
|
|
$ |
(9,282 |
) |
|
$ |
1,963,740 |
|
|
$ |
(25,651 |
) |
|
$ |
1,938,089 |
|
|
|
|
|
|
|
|
|
|
|
|
|
|
|
|
|
|
|
|
|
|
|
|
|
|
|
|||||
At December 31, 2022: |
|
|
|
|
|
|
|
|
|
|
|
|
|
|
|
|
|
|
|
|
|
|||||
Whole loans (5)(6) |
|
81 |
|
$ |
2,065,504 |
|
|
$ |
(12,614 |
) |
|
$ |
2,052,890 |
|
|
$ |
(14,103 |
) |
|
$ |
2,038,787 |
|
|
1M BR plus 2.85% to 1M BR plus 8.50% |
|
January 2023 to July 2026 |
Mezzanine loan (5) |
|
1 |
|
|
4,700 |
|
|
|
— |
|
|
|
4,700 |
|
|
|
(4,700 |
) |
|
|
— |
|
|
10.00% |
|
June 2028 |
Total |
|
|
|
$ |
2,070,204 |
|
|
$ |
(12,614 |
) |
|
$ |
2,057,590 |
|
|
$ |
(18,803 |
) |
|
$ |
2,038,787 |
|
|
|
|
|
15
ACRES COMMERCIAL REALTY CORP. AND SUBSIDIARIES
NOTES TO CONSOLIDATED FINANCIAL STATEMENTS - (Continued)
JUNE 30, 2023
(unaudited)
The following is a summary of the Company’s CRE loans held for investment by property type and geographic location (dollars in thousands):
|
|
June 30, 2023 |
|
|
December 31, 2022 |
|
||||||||||
Property Type |
|
Carrying Value |
|
|
% of Loan Portfolio |
|
|
Carrying Value |
|
|
% of Loan Portfolio |
|
||||
Multifamily |
|
$ |
1,460,600 |
|
|
|
75.4 |
% |
|
$ |
1,531,697 |
|
|
|
75.2 |
% |
Office (1)(2) |
|
|
254,503 |
|
|
|
13.1 |
% |
|
|
269,201 |
|
|
|
13.2 |
% |
Hotel |
|
|
146,099 |
|
|
|
7.5 |
% |
|
|
178,160 |
|
|
|
8.7 |
% |
Self-Storage |
|
|
68,862 |
|
|
|
3.6 |
% |
|
|
51,704 |
|
|
|
2.5 |
% |
Retail (3) |
|
|
8,025 |
|
|
|
0.4 |
% |
|
|
8,025 |
|
|
|
0.4 |
% |
Total |
|
$ |
1,938,089 |
|
|
|
100 |
% |
|
$ |
2,038,787 |
|
|
|
100 |
% |
|
|
June 30, 2023 |
|
|
December 31, 2022 |
|
||||||||||
Geographic Location |
|
Carrying Value |
|
|
% of Loan Portfolio |
|
|
Carrying Value |
|
|
% of Loan Portfolio |
|
||||
Southwest (1) |
|
$ |
458,573 |
|
|
|
23.6 |
% |
|
$ |
472,327 |
|
|
|
23.2 |
% |
Southeast |
|
|
410,732 |
|
|
|
21.2 |
% |
|
|
438,403 |
|
|
|
21.5 |
% |
Mountain |
|
|
274,289 |
|
|
|
14.2 |
% |
|
|
329,828 |
|
|
|
16.2 |
% |
Mid Atlantic |
|
|
251,757 |
|
|
|
13.0 |
% |
|
|
248,740 |
|
|
|
12.2 |
% |
Pacific |
|
|
170,986 |
|
|
|
8.8 |
% |
|
|
191,706 |
|
|
|
9.4 |
% |
Northeast (2) |
|
|
200,865 |
|
|
|
10.4 |
% |
|
|
170,236 |
|
|
|
8.3 |
% |
East North Central (3) |
|
|
106,969 |
|
|
|
5.5 |
% |
|
|
125,211 |
|
|
|
6.1 |
% |
West North Central |
|
|
63,918 |
|
|
|
3.3 |
% |
|
|
62,336 |
|
|
|
3.1 |
% |
Total |
|
$ |
1,938,089 |
|
|
|
100 |
% |
|
$ |
2,038,787 |
|
|
|
100 |
% |
16
ACRES COMMERCIAL REALTY CORP. AND SUBSIDIARIES
NOTES TO CONSOLIDATED FINANCIAL STATEMENTS - (Continued)
JUNE 30, 2023
(unaudited)
The following is a summary of the contractual maturities of the Company’s CRE loans held for investment, at amortized cost (in thousands, except amounts in the footnotes):
Description |
|
2023 |
|
|
2024 |
|
|
2025 and Thereafter |
|
|
Total |
|
||||
At June 30, 2023: |
|
|
|
|
|
|
|
|
|
|
|
|
||||
Whole loans (1) |
|
$ |
113,075 |
|
|
$ |
933,116 |
|
|
$ |
884,685 |
|
|
$ |
1,930,876 |
|
Mezzanine loan |
|
|
— |
|
|
|
— |
|
|
|
4,700 |
|
|
|
4,700 |
|
Total CRE loans (2) |
|
$ |
113,075 |
|
|
$ |
933,116 |
|
|
$ |
889,385 |
|
|
$ |
1,935,576 |
|
|
|
|
|
|
|
|
|
|
|
|
|
|
||||
Description |
|
2023 |
|
|
2024 |
|
|
2025 and Thereafter |
|
|
Total |
|
||||
At December 31, 2022: |
|
|
|
|
|
|
|
|
|
|
|
|
||||
Whole loans (1) |
|
$ |
268,120 |
|
|
$ |
882,175 |
|
|
$ |
851,031 |
|
|
$ |
2,001,326 |
|
Mezzanine loan |
|
|
— |
|
|
|
— |
|
|
|
4,700 |
|
|
|
4,700 |
|
Total CRE loans (2) |
|
$ |
268,120 |
|
|
$ |
882,175 |
|
|
$ |
855,731 |
|
|
$ |
2,006,026 |
|
At June 30, 2023 and December 31, 2022, no single loan or investment represented more than 10% of the Company’s total assets, and no single investment group generated over 10% of the Company’s revenue.
Principal Paydowns Receivable
Principal paydowns receivable represents loan principal payments that have been received by the Company’s servicers and trustees but have not been remitted to the Company. At both June 30, 2023 and December 31, 2022, the Company had no loan principal paydowns receivable.
NOTE 6 - FINANCING RECEIVABLES
The following table shows the activity in the allowance for credit losses for the six months ended June 30, 2023 and the year ended December 31, 2022 (in thousands):
|
|
Six Months Ended June 30, 2023 |
|
|
Year Ended December 31, 2022 |
|
||
Allowance for credit losses at beginning of period |
|
$ |
18,803 |
|
|
$ |
8,805 |
|
Provision for credit losses |
|
|
7,796 |
|
|
|
12,295 |
|
Charge offs |
|
|
(948 |
) |
|
|
(2,297 |
) |
Allowance for credit losses at end of period |
|
$ |
25,651 |
|
|
$ |
18,803 |
|
During the three and six months ended June 30, 2023, the Company recorded provisions for expected credit losses of $2.7 million and $7.8 million, respectively, primarily attributable to the impact from the near-term macroeconomic outlook of the commercial real estate market, including: forecasted increases in short-term interest rates, continued expected declines in commercial real estate pricing and forecasted higher unemployment rates, partially offset by improvements in property-level cash flows.
In June 2023, the Company received the deed-in-lieu of foreclosure on an office loan in the East North Central region with a principal balance of $22.8 million which resulted in a charge off of $948,000 against the allowance for credit losses (see Note 7).
17
ACRES COMMERCIAL REALTY CORP. AND SUBSIDIARIES
NOTES TO CONSOLIDATED FINANCIAL STATEMENTS - (Continued)
JUNE 30, 2023
(unaudited)
During the three months ended June 30, 2022, the Company recorded a provision for expected credit losses of approximately $524,000 primarily attributable to a decline in macroeconomic factors, offset by improvements in property-level cash flows. During the six months ended June 30, 2022, reversal of expected credit losses in the first quarter of 2022 outpaced the provision during the second quarter of 2022, resulting in a net reversal of $1.3 million in connection with resolutions of loans with specific reserves and continued improvements in property-level operations.
At June 30, 2023 and December 31, 2022, the Company individually evaluated the following loans:
Credit quality indicators
Commercial Real Estate Loans
CRE loans are collateralized by a diversified mix of real estate properties and are assessed for credit quality based on the collective evaluation of several factors, including but not limited to: collateral performance relative to underwritten plan, time since origination, current implied and/or re-underwritten loan-to-collateral value ("LTV") ratios, loan structure and exit plan. Depending on the loan’s performance against these various factors, loans are rated on a scale from 1 to 5, with loans rated 1 representing loans with the highest credit quality and loans rated 5 representing loans with the lowest credit quality. The factors evaluated provide general criteria to monitor credit migration in the Company’s loan portfolio; as such, a loan’s rating may improve or worsen, depending on new information received.
18
ACRES COMMERCIAL REALTY CORP. AND SUBSIDIARIES
NOTES TO CONSOLIDATED FINANCIAL STATEMENTS - (Continued)
JUNE 30, 2023
(unaudited)
The criteria set forth below should be used as general guidelines. Therefore, not every loan will have all of the characteristics described in each category below.
|
||
|
|
|
Risk Rating |
|
Risk Characteristics |
|
|
|
1 |
|
• Property performance has surpassed underwritten expectations. |
|
|
• Occupancy is stabilized, the property has had a history of consistently high occupancy, and the property has a diverse and high-quality tenant mix. |
|
|
|
2 |
|
• Property performance is consistent with underwritten expectations and covenants and performance criteria are being met or exceeded. |
|
|
• Occupancy is stabilized, near stabilized or is on track with underwriting. |
|
|
|
3 |
|
• Property performance lags behind underwritten expectations. |
|
|
• Occupancy is not stabilized and the property has some tenancy rollover. |
|
|
|
4 |
|
• Property performance significantly lags behind underwritten expectations. Performance criteria and loan covenants have required occasional waivers. |
|
|
• Occupancy is not stabilized and the property has a large amount of tenancy rollover. |
|
|
|
5 |
|
• Property performance is significantly worse than underwritten expectations. The loan is not in compliance with loan covenants and performance criteria and may be in default. Expected sale proceeds would not be sufficient to pay off the loan at maturity. |
|
|
• The property has a material vacancy rate and significant rollover of remaining tenants. |
|
|
• An updated appraisal is required upon designation and updated on an as-needed basis. |
All CRE loans are evaluated for any credit deterioration by debt asset management and certain finance personnel on at least a quarterly basis. Mezzanine loans may experience greater credit risks due to their nature as subordinated investments.
For the purpose of calculating the quarterly provision for credit losses under CECL, the Company pools CRE loans based on the underlying collateral property type and utilizes a probability of default and loss given default methodology for approximately one year after which it immediately reverts to a historical mean loss ratio.
Credit risk profiles of CRE loans at amortized cost were as follows (in thousands, except amounts in the footnote):
|
|
Rating 1 |
|
|
Rating 2 |
|
|
Rating 3 |
|
|
Rating 4 |
|
|
Rating 5 |
|
|
Total (1) |
|
||||||
At June 30, 2023: |
|
|
|
|
|
|
|
|
|
|
|
|
|
|
|
|
|
|
||||||
Whole loans, floating-rate |
|
$ |
— |
|
|
$ |
1,353,353 |
|
|
|
514,179 |
|
|
$ |
63,344 |
|
|
$ |
28,164 |
|
|
$ |
1,959,040 |
|
Mezzanine loan |
|
|
— |
|
|
|
— |
|
|
|
— |
|
|
|
— |
|
|
|
4,700 |
|
|
|
4,700 |
|
Total |
|
$ |
— |
|
|
$ |
1,353,353 |
|
|
$ |
514,179 |
|
|
$ |
63,344 |
|
|
$ |
32,864 |
|
|
$ |
1,963,740 |
|
|
|
|
|
|
|
|
|
|
|
|
|
|
|
|
|
|
|
|
||||||
|
|
|
|
|
|
|
|
|
|
|
|
|
|
|
|
|
|
|
||||||
At December 31, 2022: |
|
|
|
|
|
|
|
|
|
|
|
|
|
|
|
|
|
|
||||||
Whole loans, floating-rate |
|
$ |
— |
|
|
$ |
1,635,376 |
|
|
$ |
309,491 |
|
|
$ |
85,226 |
|
|
$ |
22,797 |
|
|
$ |
2,052,890 |
|
Mezzanine loan |
|
|
— |
|
|
|
— |
|
|
|
— |
|
|
|
— |
|
|
|
4,700 |
|
|
|
4,700 |
|
Total |
|
$ |
— |
|
|
$ |
1,635,376 |
|
|
$ |
309,491 |
|
|
$ |
85,226 |
|
|
$ |
27,497 |
|
|
$ |
2,057,590 |
|
19
ACRES COMMERCIAL REALTY CORP. AND SUBSIDIARIES
NOTES TO CONSOLIDATED FINANCIAL STATEMENTS - (Continued)
JUNE 30, 2023
(unaudited)
Credit risk profiles of CRE loans by origination year at amortized cost were as follows (in thousands, except amounts in the footnotes):
|
|
2023 |
|
|
2022 |
|
|
2021 |
|
|
2020 |
|
|
2019 |
|
|
Prior |
|
|
Total (1) |
|
|||||||
At June 30, 2023: |
|
|
|
|
|
|
|
|
|
|
|
|
|
|
|
|
|
|
|
|
|
|||||||
Whole loans, floating-rate: (2) |
|
|
|
|
|
|
|
|
|
|
|
|
|
|
|
|
|
|
|
|
|
|||||||
Rating 2 |
|
$ |
37,643 |
|
|
$ |
444,948 |
|
|
$ |
791,217 |
|
|
$ |
52,703 |
|
|
$ |
26,842 |
|
|
$ |
— |
|
|
$ |
1,353,353 |
|
Rating 3 |
|
|
— |
|
|
|
77,350 |
|
|
|
316,281 |
|
|
|
34,286 |
|
|
|
27,794 |
|
|
|
58,468 |
|
|
|
514,179 |
|
Rating 4 |
|
|
— |
|
|
|
19,348 |
|
|
|
43,996 |
|
|
|
— |
|
|
|
— |
|
|
|
— |
|
|
|
63,344 |
|
Rating 5 |
|
|
— |
|
|
|
— |
|
|
|
— |
|
|
|
— |
|
|
|
20,139 |
|
|
|
8,025 |
|
|
|
28,164 |
|
Total whole loans, floating-rate |
|
|
37,643 |
|
|
|
541,646 |
|
|
|
1,151,494 |
|
|
|
86,989 |
|
|
|
74,775 |
|
|
|
66,493 |
|
|
|
1,959,040 |
|
Mezzanine loan (rating 5) |
|
|
— |
|
|
|
— |
|
|
|
— |
|
|
|
— |
|
|
|
— |
|
|
|
4,700 |
|
|
|
4,700 |
|
Total |
|
$ |
37,643 |
|
|
$ |
541,646 |
|
|
$ |
1,151,494 |
|
|
$ |
86,989 |
|
|
$ |
74,775 |
|
|
$ |
71,193 |
|
|
$ |
1,963,740 |
|
|
|
|
|
|
|
|
|
|
|
|
|
|
|
|
|
|
|
|
|
|
|
|||||||
Current Period Gross Write-Offs |
|
$ |
— |
|
|
$ |
— |
|
|
$ |
— |
|
|
$ |
— |
|
|
$ |
(948 |
) |
|
$ |
— |
|
|
$ |
(948 |
) |
|
|
|
|
|
|
|
|
|
|
|
|
|
|
|
|
|
|
|
|
|
|
|||||||
|
|
2022 |
|
|
2021 |
|
|
2020 |
|
|
2019 |
|
|
2018 |
|
|
Prior |
|
|
Total (1) |
|
|||||||
At December 31, 2022: |
|
|
|
|
|
|
|
|
|
|
|
|
|
|
|
|
|
|
|
|
|
|||||||
Whole loans, floating-rate: (2) |
|
|
|
|
|
|
|
|
|
|
|
|
|
|
|
|
|
|
|
|
|
|||||||
Rating 2 |
|
$ |
526,606 |
|
|
$ |
1,003,060 |
|
|
$ |
64,944 |
|
|
$ |
26,977 |
|
|
$ |
13,789 |
|
|
$ |
— |
|
|
$ |
1,635,376 |
|
Rating 3 |
|
|
— |
|
|
|
192,490 |
|
|
|
44,657 |
|
|
|
27,881 |
|
|
|
44,463 |
|
|
|
— |
|
|
|
309,491 |
|
Rating 4 |
|
|
— |
|
|
|
— |
|
|
|
— |
|
|
|
20,742 |
|
|
|
64,484 |
|
|
|
— |
|
|
|
85,226 |
|
Rating 5 |
|
|
— |
|
|
|
— |
|
|
|
— |
|
|
|
22,797 |
|
|
|
— |
|
|
|
— |
|
|
|
22,797 |
|
Total whole loans, floating-rate |
|
|
526,606 |
|
|
|
1,195,550 |
|
|
|
109,601 |
|
|
|
98,397 |
|
|
|
122,736 |
|
|
|
— |
|
|
|
2,052,890 |
|
Mezzanine loan (rating 5) |
|
|
— |
|
|
|
— |
|
|
|
— |
|
|
|
— |
|
|
|
4,700 |
|
|
|
— |
|
|
|
4,700 |
|
Total |
|
$ |
526,606 |
|
|
$ |
1,195,550 |
|
|
$ |
109,601 |
|
|
$ |
98,397 |
|
|
$ |
127,436 |
|
|
$ |
— |
|
|
$ |
2,057,590 |
|
At both June 30, 2023 and December 31, 2022, the Company had one additional mezzanine loan included in other assets held for sale that had no carrying value.
20
ACRES COMMERCIAL REALTY CORP. AND SUBSIDIARIES
NOTES TO CONSOLIDATED FINANCIAL STATEMENTS - (Continued)
JUNE 30, 2023
(unaudited)
Loan Portfolio Aging Analysis
The following table presents the CRE loan portfolio aging analysis at the dates indicated for CRE loans at amortized cost (in thousands, except amounts in footnotes):
|
|
30-59 Days |
|
|
60-89 Days |
|
|
Greater than 90 |
|
|
Total Past Due |
|
|
Current (2) |
|
|
Total Loans Receivable (3) |
|
|
Total Loans > 90 Days and Accruing |
|
|||||||
At June 30, 2023: |
|
|
|
|
|
|
|
|
|
|
|
|
|
|
|
|
|
|
|
|
|
|||||||
Whole loans, floating-rate |
|
$ |
— |
|
|
$ |
— |
|
|
$ |
28,164 |
|
|
$ |
28,164 |
|
|
$ |
1,930,876 |
|
|
$ |
1,959,040 |
|
|
$ |
— |
|
Mezzanine loan (4) |
|
|
4,700 |
|
|
|
— |
|
|
|
— |
|
|
|
4,700 |
|
|
|
— |
|
|
|
4,700 |
|
|
|
— |
|
Total |
|
$ |
4,700 |
|
|
$ |
— |
|
|
$ |
28,164 |
|
|
$ |
32,864 |
|
|
$ |
1,930,876 |
|
|
$ |
1,963,740 |
|
|
$ |
— |
|
|
|
|
|
|
|
|
|
|
|
|
|
|
|
|
|
|
|
|
|
|
|
|||||||
At December 31, 2022: |
|
|
|
|
|
|
|
|
|
|
|
|
|
|
|
|
|
|
|
|
|
|||||||
Whole loans, floating-rate |
|
$ |
— |
|
|
$ |
— |
|
|
$ |
28,767 |
|
|
$ |
28,767 |
|
|
$ |
2,024,123 |
|
|
$ |
2,052,890 |
|
|
$ |
— |
|
Mezzanine loan (4) |
|
|
— |
|
|
|
— |
|
|
|
— |
|
|
|
— |
|
|
|
4,700 |
|
|
|
4,700 |
|
|
|
— |
|
Total |
|
$ |
— |
|
|
$ |
— |
|
|
$ |
28,767 |
|
|
$ |
28,767 |
|
|
$ |
2,028,823 |
|
|
$ |
2,057,590 |
|
|
$ |
— |
|
At June 30, 2023, the Company had two CRE whole loans, with total amortized costs of $28.2 million, and one mezzanine loan, with a total amortized cost of $4.7 million, in payment default. At December 31, 2022, the Company had three CRE whole loans, with total amortized costs of $51.6 million, in payment default.
Modifications
During the six months ended June 30, 2023, the Company did not enter into any loan modifications for borrowers that are experiencing financial difficulty. During the six months ended June 30, 2022, the Company entered into three agreements that extended one CRE whole loan for a borrower experiencing financial difficulty. At June 30, 2022, this loan had an amortized cost of $21.8 million, which represented 1.0% of the total amortized cost of the portfolio.
NOTE 7 - INVESTMENTS IN REAL ESTATE AND OTHER ACQUIRED ASSETS AND ASSUMED LIABILITIES
At June 30, 2023, the Company held investments in six real estate properties, four of which are included in investments in real estate, and two of which are included in properties held for sale on the consolidated balance sheets.
In February 2023, the Company sold a hotel property in the Northeast region that was previously designated as a property held for sale. The hotel property sold for $15.1 million with selling costs of $845,000, resulting in a gain of $745,000.
In June 2023, the Company received the deed-in-lieu of foreclosure on an office property in the East North Central region. The Company determined that the acquisition of the property should be accounted for as an asset acquisition, and the acquisition-date fair value of $20.9 million was determined using a third-party valuation. Additionally on the date of transfer, the Company acquired cash and receivables and assumed trade payables, resulting in a charge off of the loan against the Company's allowance for credit losses of $948,000. At June 30, 2023, the property was reported as property held for sale on the consolidated balance sheets.
21
ACRES COMMERCIAL REALTY CORP. AND SUBSIDIARIES
NOTES TO CONSOLIDATED FINANCIAL STATEMENTS - (Continued)
JUNE 30, 2023
(unaudited)
The following table summarizes the book value of the Company’s investments in real estate and properties held for sale (in thousands, except amounts in the footnotes):
|
|
June 30, 2023 |
|
|
December 31, 2022 |
|
||||||||||||||||||
|
|
Cost Basis |
|
|
Accumulated Depreciation & Amortization |
|
|
Carrying Value |
|
|
Cost Basis |
|
|
Accumulated Depreciation & Amortization |
|
|
Carrying Value |
|
||||||
Assets: |
|
|
|
|
|
|
|
|
|
|
|
|
|
|
|
|
|
|
||||||
Investments in real estate, equity: |
|
|
|
|
|
|
|
|
|
|
|
|
|
|
|
|
|
|
||||||
Investments in real estate (1) |
|
$ |
141,008 |
|
|
$ |
(3,645 |
) |
|
$ |
137,363 |
|
|
$ |
123,219 |
|
|
$ |
(2,251 |
) |
|
$ |
120,968 |
|
Right of use assets (2)(3) |
|
|
19,665 |
|
|
|
(342 |
) |
|
|
19,323 |
|
|
|
19,664 |
|
|
|
(205 |
) |
|
|
19,459 |
|
Intangible assets (4) |
|
|
11,474 |
|
|
|
(3,098 |
) |
|
|
8,376 |
|
|
|
11,474 |
|
|
|
(2,594 |
) |
|
|
8,880 |
|
Subtotal |
|
|
172,147 |
|
|
|
(7,085 |
) |
|
|
165,062 |
|
|
|
154,357 |
|
|
|
(5,050 |
) |
|
|
149,307 |
|
|
|
|
|
|
|
|
|
|
|
|
|
|
|
|
|
|
|
|
||||||
Investments in real estate from lending activities: |
|
|
|
|
|
|
|
|
|
|
|
|
|
|
|
|
|
|
||||||
Properties held for sale (5) |
|
|
61,565 |
|
|
|
— |
|
|
|
61,565 |
|
|
|
53,769 |
|
|
|
— |
|
|
|
53,769 |
|
Total |
|
|
233,712 |
|
|
|
(7,085 |
) |
|
|
226,627 |
|
|
|
208,126 |
|
|
|
(5,050 |
) |
|
|
203,076 |
|
|
|
|
|
|
|
|
|
|
|
|
|
|
|
|
|
|
|
|
||||||
Liabilities: |
|
|
|
|
|
|
|
|
|
|
|
|
|
|
|
|
|
|
||||||
Investments in real estate, equity: |
|
|
|
|
|
|
|
|
|
|
|
|
|
|
|
|
|
|
||||||
Mortgage payable |
|
|
18,233 |
|
|
|
259 |
|
|
|
18,492 |
|
|
|
18,089 |
|
|
|
155 |
|
|
|
18,244 |
|
Other liabilities |
|
|
247 |
|
|
|
(201 |
) |
|
|
46 |
|
|
|
247 |
|
|
|
(183 |
) |
|
|
64 |
|
Lease liabilities (3)(6) |
|
|
43,260 |
|
|
|
(54 |
) |
|
|
43,206 |
|
|
|
43,260 |
|
|
|
(393 |
) |
|
|
42,867 |
|
Subtotal (7) |
|
|
61,740 |
|
|
|
4 |
|
|
|
61,744 |
|
|
|
61,596 |
|
|
|
(421 |
) |
|
|
61,175 |
|
|
|
|
|
|
|
|
|
|
|
|
|
|
|
|
|
|
|
|
||||||
Investments in real estate from lending activities: |
|
|
|
|
|
|
|
|
|
|
|
|
|
|
|
|
|
|
||||||
Liabilities held for sale |
|
|
3,025 |
|
|
|
— |
|
|
|
3,025 |
|
|
|
3,025 |
|
|
|
— |
|
|
|
3,025 |
|
Total |
|
|
64,765 |
|
|
|
4 |
|
|
|
64,769 |
|
|
|
64,621 |
|
|
|
(421 |
) |
|
|
64,200 |
|
|
|
|
|
|
|
|
|
|
|
|
|
|
|
|
|
|
|
|
||||||
Total net investments in real estate and properties held for sale (8) |
|
$ |
168,947 |
|
|
|
|
|
$ |
161,858 |
|
|
$ |
143,505 |
|
|
|
|
|
$ |
138,876 |
|
||
22
ACRES COMMERCIAL REALTY CORP. AND SUBSIDIARIES
NOTES TO CONSOLIDATED FINANCIAL STATEMENTS - (Continued)
JUNE 30, 2023
(unaudited)
The Company acquired a ground lease with its equity investment in a hotel property in April 2022. This ground lease has an associated above-market lease intangible liability. The ground lease confers the Company the right to use the land on which its hotel operates, and the ground lease payments increase 3.00% per year until 2116. The Company acquired the original 99-year lease with 94 years remaining during the second quarter of 2022. At June 30, 2023, 93 years remain in its term.
The Company recorded lease payments of $426,000 and $852,000 for the three and six months ended June 30, 2023 and $413,000 for both the three and six months ended June 30, 2022. The Company recorded amortization of $51,000 and $102,000 during the three and six months ended June 30, 2023 related to the right of use asset and accretion of $615,000 and $1.2 million during the three and six months ended June 30, 2023 related to its ground lease liability. The Company recorded amortization of $51,000 during the three and six months ended June 30, 2022 related to the right of use asset and accretion of $114,000 during the three and six months ended June 30, 2022 related to its ground lease liability.
During the three and six months ended June 30, 2023, the Company recorded amortization expense of $251,000 and $503,000, respectively, on its intangible assets. During the three and six months ended June 30, 2022, the Company recorded amortization expense of $437,000 and $1.4 million, respectively, on its intangible assets. The Company expects to record additional amortization expense of $768,000 during the remainder of fiscal year 2023. The Company, also, expects to record amortization expense of $1.2 million, $1.1 million, $1.0 million, $748,000, and $748,000 during the 2024, 2025, 2026, 2027 and 2028 fiscal years, respectively, on its intangible assets.
NOTE 8 - LEASES
In addition to the ground lease discussed in Note 7, the Company has operating leases for office space and office equipment. The leases have terms that expire between January 2024 and September 2029. The leases on the office space and office equipment contain options for early termination granted to the Company and the lessor. Lease payments are determined as follows:
The following table summarizes the Company’s operating leases (in thousands):
|
|
June 30, 2023 |
|
|
December 31, 2022 |
|
||
Operating Leases: |
|
|
|
|
|
|
||
Right of use assets |
|
$ |
738 |
|
|
$ |
822 |
|
Lease liabilities |
|
$ |
(782 |
) |
|
$ |
(828 |
) |
|
|
|
|
|
|
|
||
Weighted average remaining lease term: |
|
6.2 years |
|
|
6.7 years |
|
||
Weighted average discount rate (1): |
|
|
8.70 |
% |
|
|
8.71 |
% |
23
ACRES COMMERCIAL REALTY CORP. AND SUBSIDIARIES
NOTES TO CONSOLIDATED FINANCIAL STATEMENTS - (Continued)
JUNE 30, 2023
(unaudited)
The following table summarizes the Company’s operating lease costs and cash payments for the periods presented (in thousands):
|
|
Three Months Ended June 30, 2023 |
|
|
Three Months Ended June 30, 2022 |
|
|
Six Months Ended June 30, 2023 |
|
|
Six Months Ended June 30, 2022 |
|
||||
Lease Cost: |
|
|
|
|
|
|
|
|
|
|
|
|
||||
Operating lease cost |
|
$ |
40 |
|
|
$ |
24 |
|
|
$ |
115 |
|
|
$ |
48 |
|
|
|
|
|
|
|
|
|
|
|
|
|
|
||||
Other Information: |
|
|
|
|
|
|
|
|
|
|
|
|
||||
Cash paid for amounts included in the measurement of lease liabilities |
|
|
|
|
|
|
|
|
|
|
|
|
||||
Operating cash flows from operating leases |
|
$ |
38 |
|
|
$ |
24 |
|
|
$ |
75 |
|
|
$ |
47 |
|
The following table summarizes the Company’s operating leases cash flow obligations on an undiscounted, annual basis (in thousands):
|
|
Operating Leases |
|
|
2023 |
|
$ |
77 |
|
2024 |
|
|
155 |
|
2025 |
|
|
159 |
|
2026 |
|
|
163 |
|
2027 |
|
|
167 |
|
Thereafter |
|
|
303 |
|
Subtotal |
|
|
1,024 |
|
Less: impact of discount |
|
|
(242 |
) |
Total |
|
$ |
782 |
|
NOTE 9 - INVESTMENTS IN UNCONSOLIDATED ENTITIES
The Company’s investments in unconsolidated entities at June 30, 2023 and December 31, 2022 comprised a 100% interest in the common shares of RCT I and RCT II with a value of $1.5 million in the aggregate, or 3.0% of each trust. The Company records its investments in RCT I’s and RCT II’s common shares as investments in unconsolidated entities using the cost method, recording dividend income when declared by RCT I and RCT II.
During the three and six months ended June 30, 2023, the Company recorded dividends from its investments in RCT I’s and RCT II’s common shares, reported in other revenue on the consolidated statement of operations, of $37,000 and $70,000, respectively. During the three and six months ended June 30, 2022, the Company recorded dividends of $19,000 and $35,000, respectively.
24
ACRES COMMERCIAL REALTY CORP. AND SUBSIDIARIES
NOTES TO CONSOLIDATED FINANCIAL STATEMENTS - (Continued)
JUNE 30, 2023
(unaudited)
NOTE 10 - BORROWINGS
The Company historically has financed the acquisition of its investments, including investment securities and loans, through the use of secured and unsecured borrowings. Certain information with respect to the Company’s borrowings is summarized in the following table (dollars in thousands, except amounts in the footnotes):
|
|
Principal Outstanding |
|
Unamortized Issuance Costs and Discounts |
|
Outstanding Borrowings |
|
Weighted Average Borrowing Rate |
|
Weighted Average Remaining Maturity |
|
Value of Collateral |
At June 30, 2023: |
|
|
|
|
|
|
|
|
|
|
|
|
ACR 2021-FL1 Senior Notes |
|
$674,372 |
|
$3,035 |
|
$671,337 |
|
6.70% |
|
13.0 years |
|
801,792 |
ACR 2021-FL2 Senior Notes |
|
567,000 |
|
4,034 |
|
562,966 |
|
7.02% |
|
13.6 years |
|
700,000 |
Senior secured financing facility |
|
50,995 |
|
3,298 |
|
47,697 |
|
8.87% |
|
4.5 years |
|
152,272 |
CRE - term warehouse financing facilities (1) |
|
253,131 |
|
1,869 |
|
251,262 |
|
7.77% |
|
1.3 years |
|
377,208 |
Mortgage payable |
|
18,854 |
|
362 |
|
18,492 |
|
8.95% |
|
1.8 years |
|
25,400 |
Construction loans |
|
— |
|
1,922 |
|
(1,922) |
|
— |
|
— |
|
— |
5.75% Senior Unsecured Notes |
|
150,000 |
|
2,181 |
|
147,819 |
|
5.75% |
|
3.1 years |
|
— |
Unsecured junior subordinated debentures |
|
51,548 |
|
— |
|
51,548 |
|
9.37% |
|
13.2 years |
|
— |
Total |
|
$1,765,900 |
|
$16,701 |
|
$1,749,199 |
|
7.04% |
|
10.3 years |
|
$2,056,672 |
|
|
|
|
|
|
|
|
|
|
|
|
|
|
|
Principal Outstanding |
|
Unamortized Issuance Costs and Discounts |
|
Outstanding Borrowings |
|
Weighted Average Borrowing Rate |
|
Weighted Average Remaining Maturity |
|
Value of Collateral |
At December 31, 2022: |
|
|
|
|
|
|
|
|
|
|
|
|
ACR 2021-FL1 Senior Notes |
|
$675,223 |
|
$3,826 |
|
$671,397 |
|
5.81% |
|
13.5 years |
|
802,643 |
ACR 2021-FL2 Senior Notes |
|
567,000 |
|
4,841 |
|
562,159 |
|
6.13% |
|
14.1 years |
|
700,000 |
Senior secured financing facility |
|
91,549 |
|
3,659 |
|
87,890 |
|
7.94% |
|
5.0 years |
|
196,837 |
CRE - term warehouse financing facilities (1) |
|
330,849 |
|
2,561 |
|
328,288 |
|
6.85% |
|
1.8 years |
|
453,550 |
Mortgage payable |
|
18,710 |
|
466 |
|
18,244 |
|
8.08% |
|
2.3 years |
|
25,400 |
5.75% Senior Unsecured Notes |
|
150,000 |
|
2,493 |
|
147,507 |
|
5.75% |
|
3.6 years |
|
— |
Unsecured junior subordinated debentures |
|
51,548 |
|
— |
|
51,548 |
|
8.52% |
|
13.7 years |
|
— |
Total |
|
$1,884,879 |
|
$17,846 |
|
$1,867,033 |
|
6.29% |
|
10.3 years |
|
$2,178,430 |
Securitizations
The following table sets forth certain information with respect to the Company’s consolidated securitizations at June 30, 2023 (in thousands, except amount in footnotes):
|
|
Closing Date |
|
Maturity Date |
|
Reinvestment Period End (1) |
|
Total Note Paydowns from Closing Date through June 30, 2023 |
|
|
ACR 2021-FL1 |
|
May 2021 |
|
June 2036 |
|
May 2023 |
|
$ |
851 |
|
ACR 2021-FL2 |
|
December 2021 |
|
January 2037 |
|
December 2023 |
|
$ |
— |
|
The investments held by the Company’s securitizations collateralize the securitizations’ borrowings and, as a result, are not available to the Company, its creditors, or stockholders. All senior notes of the securitizations held by the Company at both June 30, 2023 and December 31, 2022 were eliminated in consolidation.
25
ACRES COMMERCIAL REALTY CORP. AND SUBSIDIARIES
NOTES TO CONSOLIDATED FINANCIAL STATEMENTS - (Continued)
JUNE 30, 2023
(unaudited)
XAN 2020-RSO8
In March 2020, the Company closed Exantas Capital Corp. 2020-RSO8, Ltd. (“XAN 2020-RSO8”), a $522.6 million CRE debt securitization transaction that provided financing for CRE loans. In March 2022, the Company exercised the optional redemption of XAN 2020-RSO8, and all of the outstanding senior notes were paid off from the sales proceeds of certain of the securitization’s assets.
XAN 2020-RSO9
In September 2020, the Company closed Exantas Capital Corp. 2020-RSO9, Ltd. (“XAN 2020-RSO9”), a $297.0 million CRE debt securitization transaction that provided financing for CRE loans. In February 2022, the Company exercised the optional redemption of XAN 2020-RSO9, and all of the outstanding senior notes were paid off from the sales proceeds of certain of the securitization’s assets.
ACR 2021-FL1
In May 2021, the Company closed ACRES Commercial Realty 2021-FL1 Issuer, Ltd. (“ACR 2021-FL1”), a $802.6 million CRE debt securitization transaction that provided financing for CRE loans. ACR 2021-FL1 issued a total of $675.2 million of non-recourse, floating-rate notes to third parties at par. Additionally, ACRES RF retained 100% of the Class F and Class G notes and a subsidiary of ACRES RF retained 100% of the outstanding preference shares. The preference shares are subordinated in right of payment to all other securities issued by ACR 2021-FL1. ACR 2021-FL1 included a reinvestment period, which ended in May 2023, that allowed it to acquire CRE loans for reinvestment into the securitization using uninvested principal proceeds. All of the notes issued mature in June 2036, although the Company has the right to call the notes beginning on the payment date in May 2023 and thereafter. The non-recourse, floating-rate notes initially charged one-month Term LIBOR but converted to one-month Term SOFR in June 2023.
ACR 2021-FL2
In December 2021, the Company closed ACRES Commercial Realty 2021-FL2 Issuer, Ltd. (“ACR 2021-FL2”), a CRE debt securitization transaction that can finance up to $700.0 million of CRE loans. ACR 2021-FL2 issued a total of $567.0 million of non-recourse, floating-rate notes to third parties at par. Additionally, ACRES RF retained 100% of the Class F and Class G notes and a subsidiary of ACRES RF retained 100% of the outstanding preference shares. The preference shares are subordinated in right of payment to all other securities issued by ACR 2021-FL2. ACR 2021-FL2 included a 180-day ramp up acquisition period that allowed it to acquire CRE loans using unused proceeds from the issuance of the non-recourse floating-rate notes. Additionally, ACR 2021-FL2 includes a reinvestment period, which ends in December 2023, that allows it to acquire CRE loans for reinvestment into the securitization using uninvested principal proceeds. All of the notes issued mature in January 2037, although the Company has the right to call the notes beginning on the payment date in December 2023 and thereafter. The non-recourse, floating-rate notes initially charged one-month Term LIBOR but converted to one-month Term SOFR in June 2023.
26
ACRES COMMERCIAL REALTY CORP. AND SUBSIDIARIES
NOTES TO CONSOLIDATED FINANCIAL STATEMENTS - (Continued)
JUNE 30, 2023
(unaudited)
Financing Arrangements
Borrowings under the Company’s senior secured financing facility, term warehouse financing facilities, mortgage payable and construction loans are guaranteed by the Company or one or more of its subsidiaries. The following table sets forth certain information with respect to the Company’s financing arrangements (dollars in thousands, except amounts in footnotes):
|
|
June 30, 2023 |
|
December 31, 2022 |
||||||||||||||||||||||||
|
|
Outstanding Borrowings |
|
|
Value of Collateral |
|
|
Number of Positions as Collateral |
|
|
Weighted Average Interest Rate |
|
Outstanding Borrowings |
|
|
Value of Collateral |
|
|
Number of Positions as Collateral |
|
|
Weighted Average Interest Rate |
||||||
Senior Secured Financing Facility |
|
|
|
|
|
|
|
|
|
|
|
|
|
|
|
|
|
|
|
|
|
|
||||||
Massachusetts Mutual Life Insurance Company (1) |
|
$ |
47,697 |
|
|
$ |
152,272 |
|
|
|
7 |
|
|
8.87% |
|
$ |
87,890 |
|
|
$ |
196,837 |
|
|
|
8 |
|
|
7.94% |
|
|
|
|
|
|
|
|
|
|
|
|
|
|
|
|
|
|
|
|
|
|
|
||||||
CRE - Term Warehouse Financing Facilities (2) |
|
|
|
|
|
|
|
|
|
|
|
|
|
|
|
|
|
|
|
|
|
|
||||||
JPMorgan Chase Bank, N.A. (3) |
|
|
118,569 |
|
|
|
185,862 |
|
|
|
8 |
|
|
7.73% |
|
|
186,783 |
|
|
|
255,095 |
|
|
|
11 |
|
|
6.74% |
Morgan Stanley Mortgage Capital Holdings LLC (4) |
|
|
132,693 |
|
|
|
191,346 |
|
|
|
9 |
|
|
7.81% |
|
|
141,505 |
|
|
|
198,455 |
|
|
|
10 |
|
|
7.00% |
|
|
|
|
|
|
|
|
|
|
|
|
|
|
|
|
|
|
|
|
|
|
|
||||||
Mortgage Payable |
|
|
|
|
|
|
|
|
|
|
|
|
|
|
|
|
|
|
|
|
|
|
||||||
Readycap Commercial, LLC (5) |
|
|
18,492 |
|
|
|
25,400 |
|
|
|
1 |
|
|
8.95% |
|
|
18,244 |
|
|
|
25,400 |
|
|
|
1 |
|
|
8.08% |
|
|
|
|
|
|
|
|
|
|
|
|
|
|
|
|
|
|
|
|
|
|
|
||||||
Construction Loans |
|
|
|
|
|
|
|
|
|
|
|
|
|
|
|
|
|
|
|
|
|
|
||||||
Oceanview Life and Annuity Company (6) |
|
|
(1,922 |
) |
|
N/A |
|
|
N/A |
|
|
—% |
|
|
— |
|
|
|
— |
|
|
|
— |
|
|
—% |
||
Total |
|
$ |
315,529 |
|
|
$ |
554,880 |
|
|
|
|
|
|
|
$ |
434,422 |
|
|
$ |
675,787 |
|
|
|
|
|
|
||
The following table shows information about the amount at risk under the Company's financing arrangements (dollars in thousands):
|
|
Amount at Risk |
|
|
Weighted Average Remaining Maturity |
|
Weighted Average Interest Rate |
|
At June 30, 2023: |
|
|
|
|
|
|
|
|
Senior Secured Financing Facility (1) |
|
|
|
|
|
|
|
|
Massachusetts Mutual Life Insurance Company |
|
$ |
101,490 |
|
|
4.5 years |
|
8.87% |
CRE - Term Warehouse Financing Facilities (1) |
|
|
|
|
|
|
|
|
JPMorgan Chase Bank, N. A. |
|
$ |
67,749 |
|
|
1.3 years |
|
7.73% |
Morgan Stanley Mortgage Capital Holdings LLC |
|
$ |
58,965 |
|
|
1.3 years |
|
7.81% |
Mortgage Payable (2) |
|
|
|
|
|
|
|
|
Readycap Commercial, LLC |
|
$ |
6,452 |
|
|
1.8 years |
|
8.95% |
27
ACRES COMMERCIAL REALTY CORP. AND SUBSIDIARIES
NOTES TO CONSOLIDATED FINANCIAL STATEMENTS - (Continued)
JUNE 30, 2023
(unaudited)
The Company was in compliance with all financial covenants in each of the respective agreements at June 30, 2023 and December 31, 2022.
Senior Secured Financing Facility
On July 31, 2020, an indirect, wholly owned subsidiary (“Holdings”), along with its direct wholly owned subsidiary (the “Borrower”), of the Company entered into a $250.0 million Loan and Servicing Agreement (the “MassMutual Loan Agreement”) with MassMutual and the other lenders party thereto (the “Lenders”). The asset-based revolving loan facility (the “MassMutual Facility”) provided under the MassMutual Loan Agreement has been used to finance the Company’s core CRE lending business. The MassMutual Facility initially had an interest rate of 5.75% per annum payable monthly and initially matured on July 31, 2027.
In December 2022, Holdings, the Borrower and the Lenders entered into an Amended and Restated Loan and Servicing Agreement, which amends and restates the MassMutual Loan Agreement, and reflects a senior secured term loan facility, not to exceed $500.0 million, composed of individual loan series issued upon mutual agreement of the Borrower and Lenders. Each loan series will be available for three months after the closing date agreed upon by the Borrower and Lender (“Commitment Period”), subject to the maximum dollar amount agreed upon for that series. The Commitment Period is subject to immediate termination upon the occurrence of an event of default. Each loan series will have a final maturity of five years from the issuance date for the loan series unless an additional time is mutually agreed upon by the Lenders and Borrower. The advance rate on portfolio assets will be mutually agreed upon by the Lenders and Borrower. Each loan series will have its own mutually agreed upon interest rate equal to one-month Term SOFR plus the applicable spread.
CRE - Term Warehouse Financing Facilities
In April 2018, an indirect, wholly-owned subsidiary of the Company entered into a master repurchase agreement (the “Barclays Facility”) with Barclays Bank PLC (“Barclays”) to finance the origination of CRE loans. In February 2022, such subsidiary entered into the Third Amendment to Master Repurchase Agreement (the “Barclays Amendment”) with Barclays, which amended the Barclays Facility to add market terms regarding the replacement of LIBOR upon determination of a benchmark transition event. In October 2022, the Barclays Facility matured.
In October 2018, an indirect, wholly-owned subsidiary of the Company entered into a master repurchase agreement (the “JPMorgan Chase Facility”) with JP Morgan Chase to finance the origination of CRE loans. At June 30, 2023, this facility has been amended five times to amend various terms. The JPMorgan Chase Facility has a maximum facility amount of $250.0 million, charges interest of one-month benchmark plus market spreads and had an initial maturity date of October 2024. In July 2023, this facility was amended to extend the maturity date to July 2026, as well as to extend the amendments to (i) EBITDA to interest expense ratio, (ii) maximum ratio of total indebtedness to its total equity and (iii) minimum unencumbered liquidity requirement, each through December 2024.
In November 2021, an indirect, wholly-owned subsidiary of the Company entered into a master repurchase and securities contract agreement (the “Morgan Stanley Facility”) with Morgan Stanley Mortgage Capital Holdings LLC (“Morgan Stanley”) to finance the origination of CRE loans. At June 30, 2023, this facility has been amended two times to amend various terms. The Morgan Stanley Facility has a maximum facility amount of $250.0 million, charges interest of one-month Term SOFR plus market spreads and matures in November 2024. The Company also has the right to request a one-year extension.
Mortgage Payable
In April 2022, Chapel Drive West, LLC, a wholly owned subsidiary of the FSU Student Venture, entered into a Loan Agreement (the “Mortgage”) with Readycap Commercial, LLC (“Readycap”) to finance the acquisition of a student housing complex. The Mortgage is interest only and has a maximum principal balance of $20.4 million, of which, $18.7 million was advanced in the initial funding. Initially, the Mortgage charged interest of 30-day average SOFR plus a spread of 3.80%. In October 2022, the Mortgage was amended to charge interest of one-month Term SOFR plus a spread of 3.80%. The Mortgage matures in April 2025, subject to two one-year extension options.
The Mortgage contains events of default, subject to certain materiality thresholds and grace periods, customary for this type of financing arrangement. The remedies for such events of default are also customary for this type of transaction.
28
ACRES COMMERCIAL REALTY CORP. AND SUBSIDIARIES
NOTES TO CONSOLIDATED FINANCIAL STATEMENTS - (Continued)
JUNE 30, 2023
(unaudited)
Construction Loans
In January 2023, Chapel Drive East, LLC, a wholly owned subsidiary of the FSU Student Venture, entered into a loan agreement (the "Construction Loan Agreement") with Oceanview Life and Annuity Company ("Oceanview") to finance the construction of a student housing complex (the "Construction Loan"). The Construction Loan is interest only and has a maximum principal balance of $48.0 million. The Construction Loan charges one-month Term SOFR plus a spread of 6.00% and matures in February 2025, subject to three one-year extension options.
In addition to the Construction Loan, Chapel Drive East, LLC, entered into a financing agreement with Florida Pace Funding Agency to fund energy efficient building improvements and has a maximum principal balance of $15.5 million. This agreement charges fixed interest of 7.26% and matures in July 2053. The Company does not guarantee this financing agreement.
In connection with the Company's investment in the student housing complex, ACRES RF entered into guarantees related to the Construction Loan. Pursuant to the guarantees, Jason Pollack, Frank Dellaglio and ACRES RF (collectively, the "Guarantors"), for the benefit of Oceanview, provided limited "bad boy" guaranties to Oceanview pursuant to the Construction Loan Agreement until the earlier of the payment in full of the indebtedness or the date of a sale of the property pursuant to a foreclosure of the mortgage or deed or other transfer in lieu of foreclosure is accepted by Oceanview. The Guarantors also entered into a Completion Guaranty Agreement for the benefit of Oceanview to guaranty the timely completion of the project in accordance with the Construction Loan Agreement, as well as a Carry Guaranty Agreement, for the benefit of Oceanview to guaranty and unconditional payment by Chapel Drive East, LLC of all customary or necessary costs and expenses incurred in connection with the operation, maintenance and management of the property and an Environmental Indemnity Agreement jointly and severally in favor of Oceanview whereby the Guarantors serving as Indemnitors provided environmental representations and warranties, covenants and indemnifications (collectively the "Guaranties"). The Guaranties include certain financial covenants required of ACRES RF, including required net worth and liquidity requirements.
Corporate Debt
4.50% Convertible Senior Notes
The Company issued $143.8 million aggregate principal of its 4.50% convertible senior notes due 2022 (“4.50% Convertible Senior Notes”) in August 2017, of which $55.8 million was repurchased in 2021.
During the six months ended June 30, 2022, the Company repurchased $39.8 million of its 4.50% Convertible Senior Notes, resulting in a charge to earnings of $574,000, comprising an extinguishment of debt charge of $460,000 in connection with the acceleration of the market discount and interest expense of $114,000 in connection with the acceleration of deferred debt issuance costs. In August 2022, the remaining $48.2 million of the 4.50% Convertible Senior Notes were paid off upon maturity at par.
5.75% Senior Unsecured Notes Due 2026
On August 16, 2021, the Company issued $150.0 million of its 5.75% senior unsecured notes due 2026 (the “5.75% Senior Unsecured Notes”) pursuant to its Indenture, dated August 16, 2021 (the “Base Indenture”), between it and Wells Fargo, now Computershare Trust Company, N.A. (“CTC”), as trustee (the “Trustee”), as supplemented by the First Supplemental Indenture, dated August 16, 2021, between it and Wells Fargo, now CTC, (the “Supplemental Indenture” and, together with the Base Indenture, the “Indenture”). Prior to May 15, 2026, the Company may at its option redeem the 5.75% Senior Unsecured Notes, in whole or in part, at a redemption price equal to the sum of (i) 100% of the principal amount of the notes to be redeemed, plus accrued and unpaid interest to, but not including, the redemption date, and (ii) a make-whole premium. On or after May 15, 2026, the Company may at its option redeem the 5.75% Senior Unsecured Notes, at any time, in whole or in part, on not less than 15 nor more than 60 days’ prior notice, at a redemption price equal to 100% of the principal amount of the 5.75% Senior Unsecured Notes to be redeemed, plus accrued and unpaid interest to, but not including, the redemption date.
Unsecured Junior Subordinated Debentures
During 2006, the Company formed RCT I and RCT II for the sole purpose of issuing and selling capital securities representing preferred beneficial interests. RCT I and RCT II are not consolidated into the Company’s consolidated financial statements because the Company is not deemed to be the primary beneficiary of these entities. In connection with the issuance and sale of the capital securities, the Company issued junior subordinated debentures to RCT I and RCT II of $25.8 million each, representing the Company’s maximum exposure to loss.
29
ACRES COMMERCIAL REALTY CORP. AND SUBSIDIARIES
NOTES TO CONSOLIDATED FINANCIAL STATEMENTS - (Continued)
JUNE 30, 2023
(unaudited)
The debt issuance costs associated with the junior subordinated debentures for RCT I and RCT II were included in borrowings and were amortized into interest expense on the consolidated statements of operations using the effective yield method over a ten year period.
There were no unamortized debt issuance costs associated with the junior subordinated debentures for RCT I and RCT II outstanding at June 30, 2023 and December 31, 2022. The interest rates for RCT I and RCT II, at June 30, 2023, were 9.49% and 9.25%, respectively. The interest rates for RCT I and RCT II, at December 31, 2022, were 8.68% and 8.36%, respectively.
Contractual maturity dates of the Company’s borrowings’ principal outstanding by category and year are presented in the table below (in thousands):
|
|
Total |
|
|
2024 |
|
|
2025 |
|
|
2026 |
|
|
2027 |
|
|
2028 and Thereafter |
|
||||||
At June 30, 2023: |
|
|
|
|
|
|
|
|
|
|
|
|
|
|
|
|
|
|
||||||
CRE securitizations |
|
$ |
1,241,372 |
|
|
$ |
— |
|
|
$ |
— |
|
|
$ |
— |
|
|
$ |
— |
|
|
$ |
1,241,372 |
|
Senior Secured Financing Facility |
|
|
50,995 |
|
|
|
— |
|
|
|
— |
|
|
|
— |
|
|
|
50,995 |
|
|
|
— |
|
CRE - term warehouse financing facilities (1) |
|
|
253,131 |
|
|
|
253,131 |
|
|
|
— |
|
|
|
— |
|
|
|
— |
|
|
|
— |
|
Mortgage payable |
|
|
18,854 |
|
|
|
— |
|
|
|
18,854 |
|
|
|
— |
|
|
|
— |
|
|
|
— |
|
5.75% Senior Unsecured Notes |
|
|
150,000 |
|
|
|
— |
|
|
|
— |
|
|
|
150,000 |
|
|
|
— |
|
|
|
— |
|
Unsecured junior subordinated debentures |
|
|
51,548 |
|
|
|
— |
|
|
|
— |
|
|
|
— |
|
|
|
— |
|
|
|
51,548 |
|
Total |
|
$ |
1,765,900 |
|
|
$ |
253,131 |
|
|
$ |
18,854 |
|
|
$ |
150,000 |
|
|
$ |
50,995 |
|
|
$ |
1,292,920 |
|
NOTE 11 - SHARE ISSUANCE AND REPURCHASE
In May 2021, and subsequently in June 2021, the Company issued a total of 4.6 million shares of 7.875% Series D Cumulative Redeemable Preferred Stock (“Series D Preferred Stock”) at a public offering price of $25.00 per share. The Company received net proceeds of $110.4 million after $4.6 million of underwriting discounts and other offering expenses. Dividends are payable quarterly in arrears at the end of January, April, July and October. The Series D Preferred Stock has no maturity date and the Company is not required to redeem the Series D Preferred Stock at any time. On or after May 21, 2026, the Company may, at its option, redeem the Series D Preferred Stock, in whole or part, at any time and from time to time, for cash at $25.00 per share, plus accrued and unpaid dividends, if any, to the redemption date.
On October 4, 2021, the Company and the Manager entered into an Equity Distribution Agreement with JonesTrading Institutional Services LLC, as placement agent (“JonesTrading”), pursuant to which the Company may issue and sell from time to time up to 2.2 million shares of the Series D Preferred Stock. Sales of the Series D Preferred Stock may be made in transactions that are deemed to be “at the market” offerings, as defined in Rule 415 of the Securities Act of 1933, as amended, including without limitation, sales made directly on the New York Stock Exchange, on any other existing trading market for the shares or to or through a market maker. Subject to the terms of the Company’s notice, JonesTrading may also sell the shares by any other method permitted by law, including but not limited to in privately negotiated transactions. The Company will pay JonesTrading a commission up to 3.0% of the gross proceeds from the sales of the Series D Preferred Stock pursuant to the agreement. The terms and conditions of the agreement include various representations and warranties, conditions to closing, indemnification rights and obligations of the parties and termination provisions. During the six months ended June 30, 2023, the Company did not issue any Series D Preferred Stock through this agreement. During the year ended December 31, 2022, the Company did not issue any Series D Preferred Stock through this agreement.
30
ACRES COMMERCIAL REALTY CORP. AND SUBSIDIARIES
NOTES TO CONSOLIDATED FINANCIAL STATEMENTS - (Continued)
JUNE 30, 2023
(unaudited)
On or after July 30, 2024, the Company may, at its option, redeem its 8.625% Fixed-to-Floating Series C Cumulative Redeemable Preferred Stock (“Series C Preferred Stock”), in whole or in part, at any time and from time to time, for cash at $25.00 per share, plus accrued and unpaid dividends, if any, to the redemption date. Effective July 30, 2024 and thereafter, the Company will pay cumulative dividends on the Series C Preferred Stock at a floating rate equal to three-month LIBOR plus 5.927% per annum based on the $25.00 liquidation preference, provided that such floating rate shall not be less than the initial rate of 8.625% at any date of determination.
At June 30, 2023, the Company had 4.8 million shares of Series C Preferred Stock and 4.6 million shares of Series D Preferred Stock outstanding, with weighted average issuance prices, excluding offering costs, of $25.00.
In March 2016, the board of directors (the “Board”) approved a securities repurchase plan, and in November 2020, the Board reauthorized and approved the continued use of this plan to repurchase up to $20.0 million of the outstanding shares of the Company’s common stock. Additionally, the Board authorized the Company to enter into written trading plans under Rule 10b5-1 of the Securities Exchange Act of 1934 (the “Exchange Act”). In July 2021, the authorized amount was fully utilized.
In November 2021, the Board authorized and approved the continued use of its existing share repurchase plan to repurchase an additional $20.0 million of the outstanding shares of the Company's common stock. Under the share repurchase plan, the Company intends to repurchase shares through open market purchases, privately negotiated transactions, block purchases or otherwise in accordance with applicable federal securities laws, including Rule 10b-18 and 10b5-1 of the Exchange Act.
During the six months ended June 30, 2023 and 2022, the Company repurchased $2.0 million and $6.4 million of its common stock, respectively, representing 215,160 and 552,282 shares, respectively. At June 30, 2023, $5.3 million remains available under the November 2021 repurchase plan.
On July 31, 2020, the Company entered into a Note and Warrant Purchase Agreement (the “Note and Warrant Purchase Agreement”) with Oaktree Capital Management, L.P. (“Oaktree”) and Massachusetts Mutual Life Insurance Company (“MassMutual”) pursuant to which the Company could issue to Oaktree and MassMutual from time to time up to $125.0 million aggregate principal amount of 12.00% Senior Unsecured Notes. In connection with the Note and Warrant Purchase Agreement, the 12.00% Senior Unsecured Notes give Oaktree and MassMutual warrants to purchase an aggregate of up to 1,166,653 shares of common stock at an exercise price of $0.03 per share, subject to certain potential adjustments.
On July 31, 2020, concurrently with the issuance of the 12.00% Senior Unsecured Notes, the Company issued to Oaktree warrants to purchase 391,995 shares of common stock for an aggregate purchase price of $42.0 million and issued to MassMutual warrants to purchase 74,666 shares of common stock for an aggregate purchase price of $8.0 million. The warrants are recorded in additional paid-in capital on the consolidated balance sheets at their fair value of $3.1 million at issuance. The warrants are immediately exercisable on issuance and expire seven years from the issuance date. The warrants can be exercised with cash or as a net exercise. In July 2022, MassMutual exercised their warrants to purchase 74,666 shares. At June 30, 2023, the Oaktree warrants have not been exercised.
NOTE 12 - SHARE-BASED COMPENSATION
In June 2021, the Company’s shareholders approved the ACRES Commercial Realty Corp. Third Amended and Restated Omnibus Equity Compensation Plan (the “Omnibus Plan”) and the ACRES Commercial Realty Corp. Manager Incentive Plan (the “Manager Plan” and together with the Omnibus Plan, the “Plans”). The Omnibus Plan was amended to (i) increase the number of shares authorized for issuance by an additional 1,100,000 shares of common stock, less any shares of common stock issued or subject to awards granted under the Manager Plan; and (ii) extend the expiration date of the Omnibus Plan from June 2029 to June 2031. The maximum number of shares that may be subject to awards granted under the Plans, determined on a combined basis, is 1,700,817 shares of common stock.
The Company recognized stock-based compensation expense of $719,000 and $1.6 million, respectively, during the three and six months ended June 30, 2023 and $991,000 and $1.7 million, respectively, during the three and six months ended June 30, 2022.
31
ACRES COMMERCIAL REALTY CORP. AND SUBSIDIARIES
NOTES TO CONSOLIDATED FINANCIAL STATEMENTS - (Continued)
JUNE 30, 2023
(unaudited)
The following table summarizes the Company’s restricted common stock transactions:
|
|
Manager |
|
|
Directors |
|
|
Total Number of Shares |
|
|
Weighted-Average Grant-Date Fair Value |
|
||||
Unvested shares at January 1, 2023 |
|
|
524,999 |
|
|
|
58,334 |
|
|
|
583,333 |
|
|
$ |
14.22 |
|
Issued |
|
|
24,655 |
|
|
|
— |
|
|
|
24,655 |
|
|
|
9.00 |
|
Vested |
|
|
(174,653 |
) |
|
|
(16,660 |
) |
|
|
(191,313 |
) |
|
|
13.90 |
|
Forfeited |
|
|
— |
|
|
|
— |
|
|
|
— |
|
|
|
— |
|
Unvested shares at June 30, 2023 |
|
|
375,001 |
|
|
|
41,674 |
|
|
|
416,675 |
|
|
$ |
14.07 |
|
The unvested restricted common stock shares are expected to vest during the following years:
|
|
Shares |
|
|
2023 |
|
|
— |
|
2024 |
|
|
166,658 |
|
2025 |
|
|
166,671 |
|
2026 |
|
|
83,346 |
|
Total |
|
|
416,675 |
|
At June 30, 2023, total unrecognized compensation costs relating to unvested restricted stock was $2.9 million based on the grant date fair value of shares granted. The cost is expected to be recognized over a weighted average period of 2.5 years.
Under the Company’s Fourth Amended and Restated Management Agreement, as amended (“Management Agreement”), incentive compensation is paid quarterly. Up to 75% of the incentive compensation may be paid in cash and at least 25% must be paid in the form of an award of common stock, recorded in management fees on the consolidated statements of operations. During the three and six months ended June 30, 2023, the Company incurred incentive compensation expense payable to the Manager of $255,000 and $384,000, respectively, of which 50% was payable in cash and 50% was payable in common stock. At June 30, 2023, $255,000 was included in Management fee payable - related party on the consolidated balance sheets. No incentive compensation was paid to the Manager for the three and six months ended June 30, 2022.
The Company issued 24,655 shares of common stock during the six months ended June 30, 2023, pertaining to the portion of the fourth quarter 2022 and the first quarter 2023 incentive compensation that was payable in shares. In August 2023, the Company issued 14,226 shares of common stock pertaining to the portion of the second quarter incentive compensation that was payable at June 30, 2023. Shares of common stock issued under the Management Agreement for incentive compensation vest immediately upon issuance.
The Omnibus Plan and the Manager Plan are administered by the compensation committee of the Company's Board (the “Compensation Committee”). In 2020, the Compensation Committee and the Board created parameters for equity awards, whereby they are no longer discretionary but are now based upon the Company’s achievement of performance parameters using book value of the common stock as the appropriate benchmark. See Note 16 for a description of awards made under the Manager Plan.
32
ACRES COMMERCIAL REALTY CORP. AND SUBSIDIARIES
NOTES TO CONSOLIDATED FINANCIAL STATEMENTS - (Continued)
JUNE 30, 2023
(unaudited)
NOTE 13 - EARNINGS PER SHARE
The following table presents a reconciliation of basic and diluted losses per common share for the periods presented (dollars in thousands, except per share amounts):
|
|
For the Three Months Ended June 30, |
|
|
For the Six Months Ended June 30, |
|
||||||||||
|
|
2023 |
|
|
2022 |
|
|
2023 |
|
|
2022 |
|
||||
Net income |
|
$ |
5,558 |
|
|
$ |
5,522 |
|
|
$ |
7,851 |
|
|
$ |
7,606 |
|
Net income allocated to preferred shares |
|
|
(4,856 |
) |
|
|
(4,856 |
) |
|
|
(9,711 |
) |
|
|
(9,711 |
) |
Net loss allocable to non-controlling interest, net of taxes |
|
|
115 |
|
|
|
24 |
|
|
|
261 |
|
|
|
24 |
|
Net income (loss) allocable to common shares |
|
$ |
817 |
|
|
$ |
690 |
|
|
$ |
(1,599 |
) |
|
$ |
(2,081 |
) |
|
|
|
|
|
|
|
|
|
|
|
|
|
||||
Weighted average number of common shares outstanding: |
|
|
|
|
|
|
|
|
|
|
|
|
||||
Weighted average number of common shares outstanding - basic |
|
|
8,059,978 |
|
|
|
8,421,800 |
|
|
|
8,084,064 |
|
|
|
8,525,481 |
|
Weighted average number of warrants outstanding (1) |
|
|
391,995 |
|
|
|
466,661 |
|
|
|
391,995 |
|
|
|
466,661 |
|
Total weighted average number of common shares outstanding - basic |
|
|
8,451,973 |
|
|
|
8,888,461 |
|
|
|
8,476,059 |
|
|
|
8,992,142 |
|
Effect of dilutive securities - unvested restricted stock |
|
|
82,585 |
|
|
|
25,711 |
|
|
|
— |
|
|
|
— |
|
Weighted average number of common shares outstanding - diluted |
|
|
8,534,558 |
|
|
|
8,914,172 |
|
|
|
8,476,059 |
|
|
|
8,992,142 |
|
|
|
|
|
|
|
|
|
|
|
|
|
|
||||
Net income (loss) per common share - basic |
|
$ |
0.10 |
|
|
$ |
0.08 |
|
|
$ |
(0.19 |
) |
|
$ |
(0.23 |
) |
Net income (loss) per common share - diluted |
|
$ |
0.10 |
|
|
$ |
0.08 |
|
|
$ |
(0.19 |
) |
|
$ |
(0.23 |
) |
NOTE 14 - DISTRIBUTIONS
In order to qualify as a REIT, the Company must currently distribute at least 90% of its taxable income. In addition, the Company must distribute 100% of its taxable income in order to not be subject to corporate federal income taxes on retained income. The Company anticipates it will distribute substantially all of its taxable income to its stockholders. Because taxable income differs from cash flow from operations due to non-cash revenues or expenses (such as provisions for loan and lease losses and depreciation) and tax loss carryforwards, in certain circumstances the Company may generate operating cash flow in excess of its distributions or, alternatively, may be required to borrow funds to make sufficient distribution payments.
The Company’s 2023 distributions are, and will be, determined by the Company's Board, which will also consider the composition of any distributions declared, including the option of paying a portion in cash and the balance in additional shares of common stock.
For the three and six months ended June 30, 2023 and 2022, the Company did not pay any common share distributions.
33
ACRES COMMERCIAL REALTY CORP. AND SUBSIDIARIES
NOTES TO CONSOLIDATED FINANCIAL STATEMENTS - (Continued)
JUNE 30, 2023
(unaudited)
The following tables present distributions declared (on a per share basis) for the six months ended June 30, 2023 and the year ended December 31, 2022 with respect to the Company's Series C Preferred Stock and Series D Preferred Stock:
|
|
Series C Preferred Stock |
|
|
Series D Preferred Stock |
|
||||||||||||||
|
|
Date Paid |
|
Total Distribution Paid |
|
|
Distribution Per Share |
|
|
Date Paid |
|
Total Distribution Paid |
|
|
Distribution Per Share |
|
||||
|
|
|
|
(in thousands) |
|
|
|
|
|
|
|
(in thousands) |
|
|
|
|
||||
2023 |
|
|
|
|
|
|
|
|
|
|
|
|
|
|
|
|
||||
June 30 |
|
July 31 |
|
$ |
2,588 |
|
|
$ |
0.5390625 |
|
|
July 31 |
|
$ |
2,268 |
|
|
$ |
0.4921875 |
|
March 31 |
|
May 1 |
|
|
2,587 |
|
|
|
0.5390625 |
|
|
May 1 |
|
|
2,268 |
|
|
|
0.4921875 |
|
2022 |
|
|
|
|
|
|
|
|
|
|
|
|
|
|
|
|
||||
December 31 |
|
January 30, 2023 |
|
$ |
2,587 |
|
|
$ |
0.5390625 |
|
|
January 30, 2023 |
|
$ |
2,268 |
|
|
$ |
0.4921875 |
|
September 30 |
|
October 31 |
|
|
2,587 |
|
|
|
0.5390625 |
|
|
October 31 |
|
|
2,268 |
|
|
|
0.4921875 |
|
June 30 |
|
August 1 |
|
|
2,588 |
|
|
|
0.5390625 |
|
|
August 1 |
|
|
2,268 |
|
|
|
0.4921875 |
|
March 31 |
|
May 2 |
|
|
2,588 |
|
|
|
0.5390625 |
|
|
May 2 |
|
|
2,268 |
|
|
|
0.4921875 |
|
NOTE 15 - ACCUMULATED OTHER COMPREHENSIVE LOSS
The following table presents the changes in net unrealized loss on derivatives, the sole component of accumulated other comprehensive loss, for the six months ended June 30, 2023 (in thousands):
|
|
Accumulated Other Comprehensive Loss - Net Unrealized Loss on Derivatives |
|
|
Balance at January 1, 2023 |
|
$ |
(6,394 |
) |
Amounts reclassified from accumulated other comprehensive loss (1) |
|
|
790 |
|
Balance at June 30, 2023 |
|
$ |
(5,604 |
) |
NOTE 16 - RELATED PARTY TRANSACTIONS
Relationship with ACRES Capital Corp. and certain of its Subsidiaries. The Manager is a subsidiary of ACRES Capital Corp., of which Andrew Fentress, the Company’s Chairman, serves as Managing Partner and Mark Fogel, the Company’s President, Chief Executive Officer and Director, serves as Chief Executive Officer and President. Mr. Fentress and Mr. Fogel are also shareholders and board members of ACRES Capital Corp.
Effective on July 31, 2020, the Company has a Management Agreement with the Manager pursuant to which the Manager provides the day-to-day management of the Company’s operations and receives management fees. On July 31, 2023, this agreement was automatically renewed for a one year term pursuant to the agreement. For the three and six months ended June 30, 2023, the Manager earned base management fees of $1.7 million and $3.3 million, respectively. For the three and six months ended June 30, 2022, the Manager earned base management fees of $1.7 million and $3.4 million, respectively.
For the three and six months ended June 30, 2023, the Manager earned incentive management fees of $255,000 and $384,000, of which 50% was payable in cash and 50% was payable in common stock. No incentive compensation was earned for the three and six months ended June 30, 2022.
At June 30, 2023 and December 31, 2022, $7,000 and $558,000, respectively, of base management fees were payable by the Company to the Manager. At June 30, 2023 and December 31, 2022, $255,000 and $340,000, respectively, of incentive management fees were payable by the Company to the Manager.
34
ACRES COMMERCIAL REALTY CORP. AND SUBSIDIARIES
NOTES TO CONSOLIDATED FINANCIAL STATEMENTS - (Continued)
JUNE 30, 2023
(unaudited)
The Manager and its affiliates provided the Company with a Chief Financial Officer and a sufficient number of additional accounting, finance, tax and investor relations professionals. The Company reimbursed the Manager’s expenses for (a) the wages, salaries and benefits of the Chief Financial Officer, and (b) a portion of the wages, salaries and benefits of accounting, finance, tax, legal and investor relations professionals, in proportion to such personnel’s percentage of time allocated to the Company’s operations. The Company reimbursed out-of-pocket expenses and certain other costs incurred by the Manager that related directly to the Company’s operations.
For the three and six months ended June 30, 2023, the Company reimbursed the Manager $1.4 million and $2.3 million, respectively, for all such compensation and costs. For the three and six months ended June 30, 2022, the Company reimbursed the Manager $1.0 million and $3.0 million, respectively, for all such compensation and costs. At June 30, 2023, the Company did not have any payables to the Manager pursuant to the Management Agreement related to such compensation and costs. At December 31, 2022, the Company had payables to the Manager totaling $179,000 related to such compensation and costs. The Company’s base management fee payable and expense reimbursements payable were recorded in management fee payable and accounts payable and other liabilities on the consolidated balance sheets, respectively.
On July 31, 2020, ACRES RF, a direct, wholly owned subsidiary of the Company, provided a $12.0 million loan (the “ACRES Loan”) to ACRES Capital Corp. evidenced by the promissory note from ACRES Capital Corp.
The ACRES Loan accrues interest at 3.00% per annum payable monthly. The monthly amortization payment is $25,000. The ACRES Loan matures in July 2026, subject to two one-year extensions (at ACRES Capital Corp.’s option) subject to the payment of a 0.5% extension fee to ACRES RF on the outstanding principal amount of the ACRES Loan.
During the three and six months ended June 30, 2023, the Company recorded interest income of $85,000 and $169,000, respectively, on the ACRES Loan in other income (expense) on the consolidated statements of operations. During the three and six months ended June 30, 2022, the Company recorded interest income of $87,000 and $174,000, respectively, on the ACRES Loan in other income (expense) on the consolidated statements of operations At June 30, 2023 and December 31, 2022, the ACRES Loan had a principal balance of $11.1 million and $11.3 million, respectively, recorded in loan receivable - related party on the consolidated balance sheets. At June 30, 2023 and December 31, 2022, the ACRES Loan had no accrued interest receivable.
During the year ended December 31, 2022, the Company originated one CRE whole loan with a par value of $38.6 million that was refinanced from a loan originated by affiliates of the Manager. The Company did not originate any loans that were refinanced from loans originated by affiliates of the Manager during the six months ended June 30, 2023. During the year ended December 31, 2022, the Company acquired 100% equity in one property for $38.6 million, that previously served as collateral for a loan held by an affiliate of the Manager prior to the acquisition.
At June 30, 2023, the Company retained equity in two securitization entities that were structured for the Company by the Manager. Under the Management Agreement, the Manager was not separately compensated by the Company for executing these transactions and was not separately compensated for managing the securitization entities and their assets.
During the year ended December 31, 2022, the Company co-originated and entered into joint funding agreements with ACRES Loan Origination, LLC, an affiliate of ACRES Capital Corp. and the Manager, on four loan originations, with total initial fundings of $97.2 million.
Relationship with ACRES Capital Servicing LLC. Under the MassMutual Loan Agreement, ACRES Capital Servicing LLC (“ACRES Capital Servicing”), an affiliate of ACRES Capital Corp. and the Manager, serves as the portfolio servicer. Additionally, ACRES Capital Servicing served as the special servicer of XAN 2020-RSO8 and XAN 2020-RSO9 and serves as special servicer of ACRES Commercial Realty 2021-FL1 Issuer, Ltd. (“ACR 2021-FL1”) and ACRES Commercial Realty 2021-FL2 Issuer, Ltd. (“ACR 2021-FL2”).
During the three and six months ended June 30, 2023, ACRES Capital Servicing received no portfolio servicing fees and earned $20,000 and $65,000, respectively, in special servicing fees, of which $12,000 and $47,000, respectively, was recorded as a reduction to interest income in the consolidated statement of operations. During the three and six months ended June 30, 2022, ACRES Capital Servicing received no portfolio servicing fees and $23,000 in special servicing fees, recorded as a reduction to interest income in the consolidated statement of operations.
35
ACRES COMMERCIAL REALTY CORP. AND SUBSIDIARIES
NOTES TO CONSOLIDATED FINANCIAL STATEMENTS - (Continued)
JUNE 30, 2023
(unaudited)
Relationship with ACRES Commercial Mortgage, LLC. During the three months ended June 30, 2023, the Company purchased a participation for $22.5 million in one CRE whole loan from ACRES Commercial Mortgage, LLC.
Relationship with ACRES Collateral Manager, LLC. ACRES Collateral Manager, LLC, an affiliate of ACRES Capital Corp. and the Manager, serves as the collateral manager of ACR 2021-FL1 and ACR 2021-FL2, a role for which it waived its fee.
Relationship with ACRES Development Management, LLC. ACRES Development Management, LLC (“DevCo”) is a wholly owned subsidiary of ACRES Capital Corp., the parent of the Manager. DevCo acts in various capacities as a co-developer or owner’s representative for direct equity investments within the Company’s portfolio. In November 2021, December 2021 and April 2022, the joint venture entities of the three CRE equity investments acquired through direct investment entered into development agreements with DevCo (the “Development Agreements”).
Pursuant to the Development Agreements, DevCo agreed to manage the development of the projects associated with each equity investment in accordance with a development standard in exchange for fees equal to between 1.25% and 1.5% of all project costs. During the three and six months ended June 30, 2023, $91,000 and $145,000 in fees were incurred and paid to DevCo for services rendered under the Development Agreements. During the three and six months ended June 30, 2022, $16,000 in fees were incurred and paid to DevCo for services rendered under the Development Agreements.
Relationship with ACRES Share Holdings, LLC. During the three and six months ended June 30, 2023, the Company issued 6,875 and 24,655 shares, respectively, to ACRES Share Holdings, LLC in connection with the fourth quarter 2022 and the first quarter 2023 incentive compensation. In August 2023, the Company issued 14,226 shares to ACRES Share Holdings, LLC in connection with the second quarter 2023 incentive compensation. The shares vested fully upon issuance pursuant to the Management Agreement.
In June 2021, the Company’s Manager Plan was approved by its shareholders, which authorized up to 1,100,000 shares of common stock for issuance to the Manager (less shares of common stock issued or subject to awards under the Omnibus Plan). There were no shares issued under this plan for the six months ended June 30, 2023. During the year ended December 31, 2022, the Company issued 299,999 restricted shares to ACRES Share Holdings, LLC under the Manager Plan that will vest 25% each year on the anniversary of the issuance date over four years. See Note 12 for additional details.
NOTE 17 - FAIR VALUE OF FINANCIAL INSTRUMENTS
The Company had no financial instruments carried at fair value on a recurring basis at June 30, 2023 and December 31, 2022.
In June 2023, the Company received the deed-in-lieu of foreclosure on a property that formerly collateralized a CRE whole loan. The property was appraised and determined to have a fair value of $20.9 million at the time of acquisition.
The Company is required to disclose the fair value of financial instruments for which it is practicable to estimate that value. The fair values of the Company’s short-term financial instruments such as cash and cash equivalents, restricted cash, accrued interest receivable, principal paydowns receivable, accrued interest payable and distributions payable approximate their carrying values on the consolidated balance sheets. The fair values of the Company’s assets and liabilities are estimated as follows:
CRE whole loans. The fair values of the Company’s loans held for investment are measured by discounting the expected future cash flows using the current interest rates at which similar loans would be made to borrowers with similar credit ratings and for the same remaining maturities. Par values of loans with variable interest rates are expected to approximate fair value unless evidence of credit deterioration exists, in which case the fair value approximates the par value less the loan’s allowance estimated through individual evaluation. Fair values of loans with fixed rates are calculated using the net present values of future cash flows, discounted at market rates. The Company’s floating-rate CRE loans had interest rates from 8.04% to 13.79% and 7.03% to 12.67% at June 30, 2023 and December 31, 2022, respectively.
CRE mezzanine loan. Historically, this was measured by discounting the expected remaining cash flows using the current interest rates at which similar instruments would be originated for the same remaining maturity. The Company’s mezzanine loan was discounted at a rate of 10.00%. The Company's mezzanine loan had no carrying or fair value at June 30, 2023 or December 31, 2022.
Loan receivable- related party. This is estimated using a discounted cash flow model.
36
ACRES COMMERCIAL REALTY CORP. AND SUBSIDIARIES
NOTES TO CONSOLIDATED FINANCIAL STATEMENTS - (Continued)
JUNE 30, 2023
(unaudited)
Senior notes in CRE securitizations, 5.75% Senior Unsecured Notes and junior subordinated notes. These are estimated using a discounted cash flow model with implied yields based on trades for similar securities.
Senior secured financing facility, warehouse financing facilities, mortgage payable and construction loan. These are variable-rate debt instruments indexed to either LIBOR or Term SOFR that reset periodically and as a result, their carrying value approximates their fair value, excluding deferred debt issuance costs. As of June 30, 2023, all variable-rate debt instruments are indexed to SOFR.
The fair values of the Company’s remaining financial and non-financial assets that are not reported at fair value on the consolidated balance sheets are reported in the following table (in thousands):
|
|
|
|
|
Fair Value Measurements |
|
||||||||||||||
|
|
Carrying Value |
|
|
Fair Value |
|
|
Quoted Prices in Active Markets for Identical Assets of Liabilities |
|
|
Significant Other Observable Inputs |
|
|
Significant Unobservable Inputs |
|
|||||
At June 30, 2023: |
|
|
|
|
|
|
|
|
|
|
|
|
|
|
|
|||||
Assets: |
|
|
|
|
|
|
|
|
|
|
|
|
|
|
|
|||||
CRE whole loans |
|
$ |
1,938,089 |
|
|
$ |
1,968,322 |
|
|
$ |
— |
|
|
$ |
— |
|
|
$ |
1,968,322 |
|
Loan receivable - related party |
|
|
11,125 |
|
|
|
8,096 |
|
|
|
— |
|
|
|
— |
|
|
|
8,096 |
|
Liabilities: |
|
|
|
|
|
|
|
|
|
|
|
|
|
|
|
|||||
Senior notes in CRE securitizations |
|
|
1,234,303 |
|
|
|
1,185,091 |
|
|
|
— |
|
|
|
— |
|
|
|
1,185,091 |
|
Senior secured financing facility |
|
|
47,697 |
|
|
|
50,995 |
|
|
|
— |
|
|
|
— |
|
|
|
50,995 |
|
Warehouse financing facilities |
|
|
251,262 |
|
|
|
253,131 |
|
|
|
— |
|
|
|
— |
|
|
|
253,131 |
|
Mortgage payable |
|
|
18,492 |
|
|
|
18,854 |
|
|
|
— |
|
|
|
— |
|
|
|
18,854 |
|
Construction loan (1) |
|
|
(1,922 |
) |
|
|
— |
|
|
|
— |
|
|
|
— |
|
|
|
— |
|
5.75% Senior Unsecured Notes |
|
|
147,819 |
|
|
|
129,615 |
|
|
|
— |
|
|
|
— |
|
|
|
129,615 |
|
Junior subordinated notes |
|
|
51,548 |
|
|
|
32,364 |
|
|
|
— |
|
|
|
— |
|
|
|
32,364 |
|
At December 31, 2022: |
|
|
|
|
|
|
|
|
|
|
|
|
|
|
|
|||||
Assets: |
|
|
|
|
|
|
|
|
|
|
|
|
|
|
|
|||||
CRE whole loans |
|
$ |
2,038,787 |
|
|
$ |
2,065,504 |
|
|
$ |
— |
|
|
$ |
— |
|
|
$ |
2,065,504 |
|
Loan receivable - related party |
|
|
11,275 |
|
|
|
9,672 |
|
|
|
— |
|
|
|
— |
|
|
|
9,672 |
|
Liabilities: |
|
|
|
|
|
|
|
|
|
|
|
|
|
|
|
|||||
Senior notes in CRE securitizations |
|
|
1,233,556 |
|
|
|
1,179,313 |
|
|
|
— |
|
|
|
— |
|
|
|
1,179,313 |
|
Senior secured financing facility |
|
|
87,890 |
|
|
|
91,549 |
|
|
|
— |
|
|
|
— |
|
|
|
91,549 |
|
Warehouse financing facilities |
|
|
328,288 |
|
|
|
330,848 |
|
|
|
— |
|
|
|
— |
|
|
|
330,848 |
|
Mortgage payable |
|
|
18,244 |
|
|
|
18,710 |
|
|
|
— |
|
|
|
— |
|
|
|
18,710 |
|
5.75% Senior Unsecured Notes |
|
|
147,507 |
|
|
|
138,435 |
|
|
|
— |
|
|
|
— |
|
|
|
138,435 |
|
Junior subordinated notes |
|
|
51,548 |
|
|
|
35,821 |
|
|
|
— |
|
|
|
— |
|
|
|
35,821 |
|
NOTE 18 - MARKET RISK AND DERIVATIVE INSTRUMENTS
The Company is affected by changes in certain market conditions. These changes in market conditions may adversely impact the Company’s financial performance and are referred to as “market risks.” When deemed appropriate, the Company used derivatives as a risk management tool to mitigate the potential impact of certain market risks. The primary market risks managed by the Company through the use of derivative instruments were interest rate risk and market price risk.
The Company also historically managed its interest rate risk with interest rate swaps. Interest rate swaps are contracts between two parties to exchange cash flows based on specified underlying notional amounts, assets and/or indices.
37
ACRES COMMERCIAL REALTY CORP. AND SUBSIDIARIES
NOTES TO CONSOLIDATED FINANCIAL STATEMENTS - (Continued)
JUNE 30, 2023
(unaudited)
The Company seeks to manage the extent to which net income changes as a function of changes in interest rates by matching adjustable-rate assets with variable-rate borrowings.
The Company classified its interest rate swap contracts as cash flow hedges, which are hedges that eliminate the risk of changes in the cash flows of a financial asset or liability.
The Company terminated all of its interest rate swap positions associated with its financed CMBS portfolio in April 2020. At termination, the Company realized a loss of $11.8 million. At June 30, 2023 and December 31, 2022, the Company had losses of $5.8 million and $6.6 million, respectively, recorded in accumulated other comprehensive loss, which will be amortized into earnings over the remaining life of the debt. During the three and six months ended June 30, 2023, the Company recorded amortization expense of $420,000 and $835,000, reported in interest expense on the consolidated statements of operations. During the three and six months ended June 30, 2022, the Company recorded amortization expense of $484,000 and $963,000, reported in interest expense on the consolidated statements of operations.
At June 30, 2023 and December 31, 2022, the Company had an unrealized gain of $210,000 and $256,000, respectively, attributable to two terminated interest rate swaps in accumulated other comprehensive loss on the consolidated balance sheets, to be accreted into earnings over the remaining life of the debt. For each of the three months ended June 30, 2023 and 2022, the Company recorded accretion income, reported in interest expense on the consolidated statements of operations, of $23,000 to accrete the accumulated other comprehensive income on the terminated swap agreements. For each of the six months ended June 30, 2023 and 2022, the Company recorded accretion income, reported in interest expense on the consolidated statements of operations, of $45,000 to accrete the accumulated other comprehensive income on the terminated swap agreements.
The Company’s prior origination of fixed-rate CRE whole loans exposed it to market pricing risk in connection with the fluctuations of market interest rates. As market interest rates increase or decrease, the fair value of the fixed-rate CRE whole loans will decrease or increase accordingly. In order to mitigate this market price risk, the Company entered into interest rate swap contracts in which it pays a fixed rate of interest in exchange for a variable rate of interest, usually three-month LIBOR. Unrealized gains and losses on the value of these swap contracts were recorded in other income (expense) on the consolidated statements of operations. In December 2020, these interest rate swap contracts were terminated.
The following table presents the effect of the derivative instruments on the consolidated statements of operations for the six months ended June 30, 2023 and 2022 (in thousands):
|
|
|
|
Realized and Unrealized Gain (Loss) (1) |
|
|||||
|
|
Consolidated Statements of Operations Location |
|
Six Months Ended June 30, 2023 |
|
|
Six Months Ended June 30, 2022 |
|
||
Interest rate swap contracts, hedging |
|
Interest expense |
|
$ |
(790 |
) |
|
$ |
(917 |
) |
38
ACRES COMMERCIAL REALTY CORP. AND SUBSIDIARIES
NOTES TO CONSOLIDATED FINANCIAL STATEMENTS - (Continued)
JUNE 30, 2023
(unaudited)
NOTE 19 - OFFSETTING OF FINANCIAL ASSETS AND LIABILITIES
The following table presents a summary of the Company’s offsetting of financial liabilities and derivative liabilities (in thousands, except amounts in footnotes):
|
|
(i) |
|
|
(ii) |
|
|
(iii) = (i) - (ii) |
|
|
(iv) |
|
|
|
|
|||||||||
|
|
of Recognized Liabilities |
|
|
Consolidated Balance Sheets |
|
|
Consolidated Balance Sheets |
|
|
Financial Instruments (1) |
|
|
Cash Collateral Pledged |
|
|
(v) = (iii) - (iv) |
|
||||||
At June 30, 2023: |
|
|
|
|
|
|
|
|
|
|
|
|
|
|
|
|
|
|
||||||
Term warehouse financing facilities (2) |
|
$ |
251,262 |
|
|
$ |
— |
|
|
$ |
251,262 |
|
|
$ |
251,262 |
|
|
$ |
— |
|
|
$ |
— |
|
At December 31, 2022: |
|
|
|
|
|
|
|
|
|
|
|
|
|
|
|
|
|
|
||||||
Term warehouse financing facilities (2) |
|
$ |
328,288 |
|
|
$ |
— |
|
|
$ |
328,288 |
|
|
$ |
328,288 |
|
|
$ |
— |
|
|
$ |
— |
|
All balances associated with warehouse financing facilities are presented on a gross basis on the Company’s consolidated balance sheets.
Certain of the Company’s warehouse financing facilities are governed by underlying agreements that generally provide for a right of offset in the event of default or in the event of a bankruptcy of either party to the transaction.
NOTE 20 - COMMITMENTS AND CONTINGENCIES
The Company may become involved in litigation on various matters due to the nature of the Company’s business activities. The resolution of these matters may result in adverse judgments, fines, penalties, injunctions and other relief against the Company as well as monetary payments or other agreements and obligations. In addition, the Company may enter into settlements on certain matters in order to avoid the additional costs of engaging in litigation. Except as discussed below, the Company is unaware of any contingencies arising from such litigation that would require accrual or disclosure in the consolidated financial statements at June 30, 2023.
Primary Capital Mortgage, LLC (“PCM”) is subject to potential litigation related to claims for repurchases or indemnifications on loans that PCM has sold to third parties. At both June 30, 2023 and December 31, 2022, no such litigation demand was outstanding. Reserves for such potential litigation demands are included in the reserve for mortgage repurchases and indemnifications that totaled $1.1 million and $1.2 million at June 30, 2023 and December 31, 2022, respectively. The reserves for mortgage repurchases and indemnifications are included in liabilities held for sale on the consolidated balance sheets.
The Company did not have any general litigation reserve at June 30, 2023 or December 31, 2022.
Other Contingencies
PCM is subject to additional claims for repurchases or indemnifications on loans that PCM has sold to investors. At June 30, 2023 and December 31, 2022, outstanding demands for indemnification, repurchase or make whole payments totaled $3.3 million. The Company’s estimated exposure for such outstanding claims, as well as unasserted claims, is included in its reserve for mortgage repurchases and indemnifications.
39
ACRES COMMERCIAL REALTY CORP. AND SUBSIDIARIES
NOTES TO CONSOLIDATED FINANCIAL STATEMENTS - (Continued)
JUNE 30, 2023
(unaudited)
Other Guarantees
In January 2023, Chapel Drive East, LLC, a wholly owned subsidiary of the FSU Student Venture, entered into a loan agreement (the "Construction Loan Agreement") with Oceanview Life and Annuity Company ("Oceanview") to finance the construction of a student housing complex (the "Construction Loan").
In connection with the Company's investment in the student housing complex, ACRES RF entered into guarantees related to the Construction Loan. Pursuant to the guarantees, Jason Pollack, Frank Dellaglio and ACRES RF (collectively, the "Guarantors"), for the benefit of Oceanview, provided limited "bad boy" guaranties to Oceanview pursuant to the Construction Loan Agreement until the earlier of the payment in full of the indebtedness or the date of a sale of the property pursuant to a foreclosure of the mortgage or deed or other transfer in lieu of foreclosure is accepted by Oceanview. The Guarantors also entered into a Completion Guaranty Agreement for the benefit of Oceanview to guaranty the timely completion of the project in accordance with the Construction Loan Agreement, as well as a Carry Guaranty Agreement, for the benefit of Oceanview to guaranty and unconditional payment by Chapel Drive East, LLC of all customary or necessary costs and expenses incurred in connection with the operation, maintenance and management of the property and an Environmental Indemnity Agreement jointly and severally in favor of Oceanview whereby the Guarantors serving as Indemnitors provided environmental representations and warranties, covenants and indemnifications (collectively the "Guaranties"). The Guaranties include certain financial covenants required of ACRES RF, including required net worth and liquidity requirements.
Unfunded Commitments
Unfunded commitments on the Company’s originated CRE loans generally fall into two categories: (1) pre-approved capital improvement projects and (2) new or additional construction costs subject, in each case, to the borrower meeting specified criteria. Upon completion of the improvements or construction, the Company would receive additional interest income on the advanced amount. Whole loans had $128.7 million and $158.2 million in unfunded loan commitments at June 30, 2023 and December 31, 2022, respectively.
Additionally, the Company and its JV partner have commitments related to its construction of a student housing complex. The Company and JV partner committed to a total funding of $31.2 million, of which $4.1 million was unfunded at June 30, 2023.
NOTE 21 - SUBSEQUENT EVENTS
The Company has evaluated subsequent events through the filing of this report and determined that there have not been any events, other than those described in Note 10, Note 12 and Note 16 that have occurred that would require adjustments to or disclosures in the consolidated financial statements.
40
ITEM 2. MANAGEMENT’S DISCUSSION AND ANALYSIS OF FINANCIAL CONDITION AND RESULTS OF OPERATIONS
References in this quarterly report to “we,” “us” or the “Company” refer to ACRES Commercial Realty Corp. The following discussion and analysis of the Company’s financial condition and results of operations should be read in conjunction with the consolidated financial statements and accompanying notes appearing elsewhere in this report. Certain information contained in the discussion and analysis set forth below includes forward-looking statements that involve risks and uncertainties.
Special Note Regarding Forward-Looking Statements
This report contains certain forward-looking statements within the meaning of Section 27A of the Securities Act of 1933, as amended, and Section 21E of the Securities Exchange Act of 1934, as amended. Such forward-looking statements can generally be identified by our use of forward-looking terminology such as “may,” “will,” “continue,” “expect,” “intend,” “anticipate,” “estimate,” “believe,” “look forward” or other similar words or terms. Because such statements include risks, uncertainties and contingencies, actual results may differ materially from the expectations, intentions, beliefs, plans or predictions of the future expressed or implied by such forward-looking statements. For information identifying important factors that could cause actual results to differ materially from those anticipated in the forward-looking statements, including, without limitation, factors impacting whether we will be able to maintain our sources of liquidity and whether we will be able to identify sufficient suitable investments to increase our originations, please refer to the Risk Factors section of the Company’s Annual Report on Form 10-K for the year ended December 31, 2022 filed with the U.S. Securities and Exchange Commission (the “SEC”). Except as expressly required by applicable securities law, the Company disclaims any intention or obligation to update or revise any forward-looking statements whether as a result of new information, future events or otherwise.
Overview
We are a Maryland corporation and an externally managed real estate investment trust (“REIT”) that is primarily focused on originating, holding and managing commercial real estate (“CRE”) mortgage loans and equity investments in commercial real estate properties through direct ownership and joint ventures. Our manager is ACRES Capital, LLC (our “Manager”), a subsidiary of ACRES Capital Corp. (collectively, “ACRES”), a private commercial real estate lender exclusively dedicated to nationwide middle market CRE lending with a focus on multifamily, student housing, hospitality, office and industrial property in top United States (“U.S.”) markets. Our Manager draws upon the management team of ACRES and its collective investment experience to provide its services. Our objective is to provide our stockholders with total returns over time, including quarterly distributions and capital appreciation, while seeking to manage the risks associated with our investment strategies as well as to maximize long-term stockholder value by maintaining stability through our available liquidity and diversified CRE loan portfolio.
Currently, markets are grappling with inflation, rising interest rates, bank failures and the lingering impact of the COVID-19 pandemic. These market pressures have caused continued disruption in many market segments, including the financial services, real estate and credit markets and these disruptions have affected the availability and the cost of capital. The increase in the cost of capital is expected to cause short-term dislocations in various investment and financing markets in which we participate as we and other market participants adjust to the new financing environment.
The U.S. Federal Reserve has raised the Federal Funds rate by 5.25% in 11 rate hikes between March 2022 and July 2023 to combat inflation. A rising interest rate environment generally correlates to increases in our net income. However, increases in interest rates may adversely affect our existing borrowers and could lead to nonperformance, i.e. the borrower’s ability to pay debt service. Additionally, rising rates and increasing costs may discourage consumer spending and slow corporate profit growth, which may negatively impact the collateral underlying our loans and impact our borrowers' ability to sell or refinance in the current market.
In response, we continue to manage corporate liquidity actively and responsibly, manage our CRE assets and manage our daily operations in light of changing macroeconomic circumstances. Our Manager also continuously monitors for new capital opportunities and executes on agreements that are expected to enhance our returns.
We target originating transitional floating-rate CRE loans between $10.0 million and $100.0 million. During the year ended December 31, 2022, we originated 19 floating-rate CRE whole loans with total commitments of $610.8 million. Loan payoffs during the year ended December 31, 2022 were $399.6 million and net unfunded commitments were $21.2 million, producing a net increase to the portfolio of $190.0 million. During the six months ended June 30, 2023, we originated two floating-rate CRE whole loans, with total commitments of $38.5 million. Loan payoffs during the six months ended June 30, 2023 were $141.4 million and net funded commitments were $28.5 million, producing a net decrease to the portfolio of $74.4 million.
41
Our CRE loan portfolio, which had carrying values of $1.9 billion and $2.0 billion at June 30, 2023 and December 31, 2022, respectively, comprised:
We generate our income primarily from the spread between the revenues we receive from our assets and the cost to finance our ownership of those assets, including corporate debt.
While the CRE whole loans included in the CRE loan portfolio are substantially composed of floating-rate loans benchmarked to the Secured Overnight Financing Rate (“SOFR”), asset yields are protected through the use of benchmark floors and minimum interest periods that typically range from 12 to 18 months at the time of a loan’s origination. Our benchmark floors provide asset yield protection when the benchmark rate falls below an in-place benchmark floor. Our net investment returns are enhanced by a decline in the cost of our floating-rate liabilities that do not have benchmark floors. Our net investment returns will be negatively impacted by the rising cost of our floating-rate liabilities that do not have floors until the benchmark rate is above the benchmark floor, at which point our floating-rate loans and floating-rate liabilities will be match funded, effectively locking in our net interest margin until the benchmark floor rate is activated again or the floating-rate loan is paid off or refinanced.
In a business environment where benchmark interest rates are increasing significantly, cash flows of the CRE assets underlying our loans may not be sufficient to pay debt service on our loans, which could result in non-performance or default. We partially mitigate this risk by generally requiring our borrowers to purchase interest rate cap agreements with non-affiliated, well-capitalized third parties and by selectively requiring our borrowers to have and maintain debt service reserves. These interest rate caps generally mature prior to the maturity date of the loan and the borrowers are required to pay to extend them. In most cases the sponsors will need to fund additional equity into the properties to cover these costs as the property may not generate sufficient cash flow to pay these costs. At June 30, 2023, 94.5% of the par value of our CRE loan portfolio had interest rate caps in place with a weighted-average maturity of nine months.
At June 30, 2023, our $2.0 billion floating-rate CRE loan portfolio, at par, had a weighted average benchmark floor of 0.68%. At December 31, 2022, our par-value $2.1 billion floating-rate CRE loan portfolio, which included one loan without a benchmark floor, had a weighted average benchmark floor of 0.68%. With the trend of rising benchmark interest rates in 2022 and 2023, we have seen the coupons on all of our floating-rate assets and debt rise accordingly. Because we have equity invested in each floating-rate loan, and because in all instances the benchmark interest rates are above our loan floors, the rise in interest rates expected by the market will result in an increase in our net interest income. See “Interest Rate Risk” in “Item 3: Quantitative and Qualitative Disclosures About Market Risk.”
42
Our portfolio comprises loans with a diverse array of collateral types. Multifamily continues to comprise the majority of our portfolio, with 75.4% of our portfolio allocated to multifamily at June 30, 2023 and 75.2% at December 31, 2022. The following charts show our portfolio allocation by property type at June 30, 2023 and December 31, 2022:
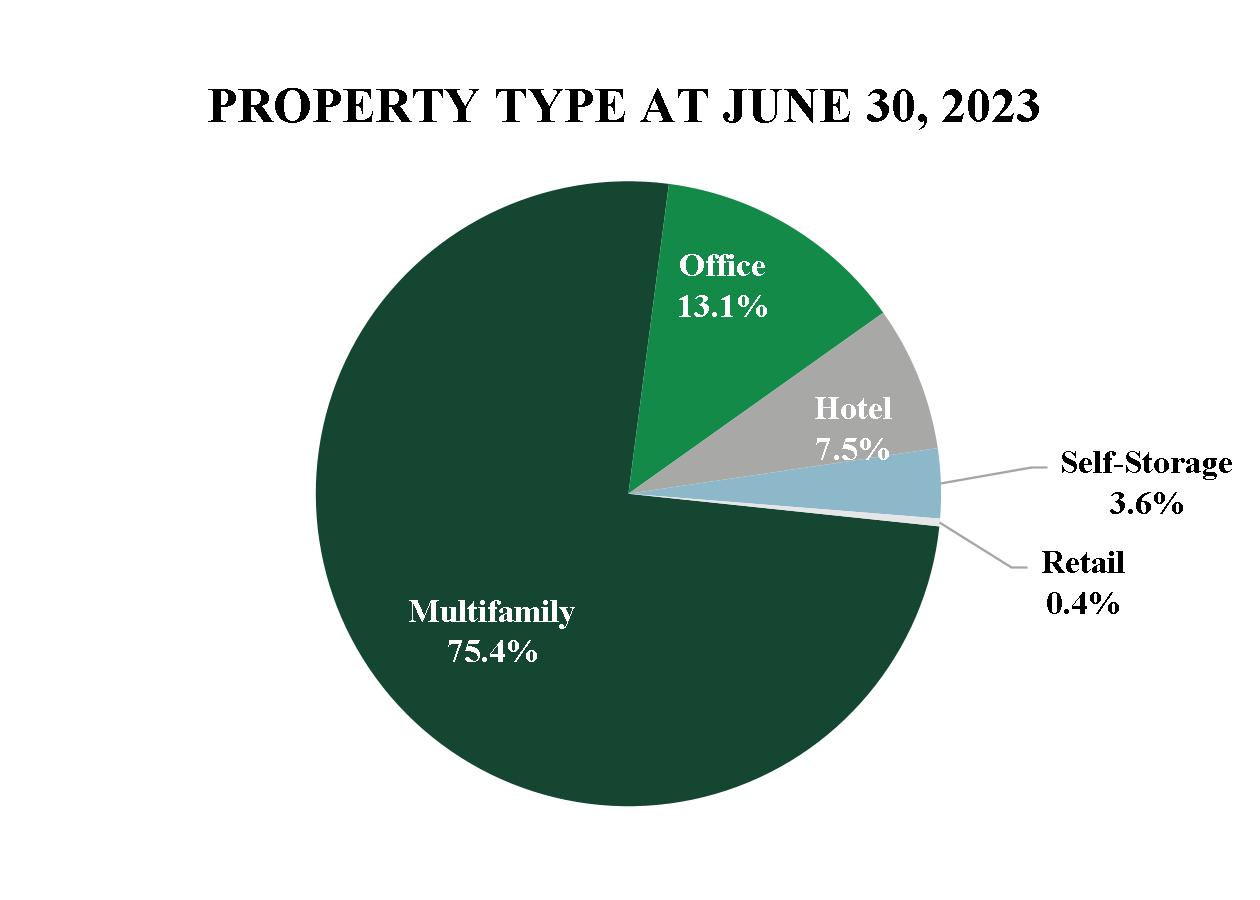
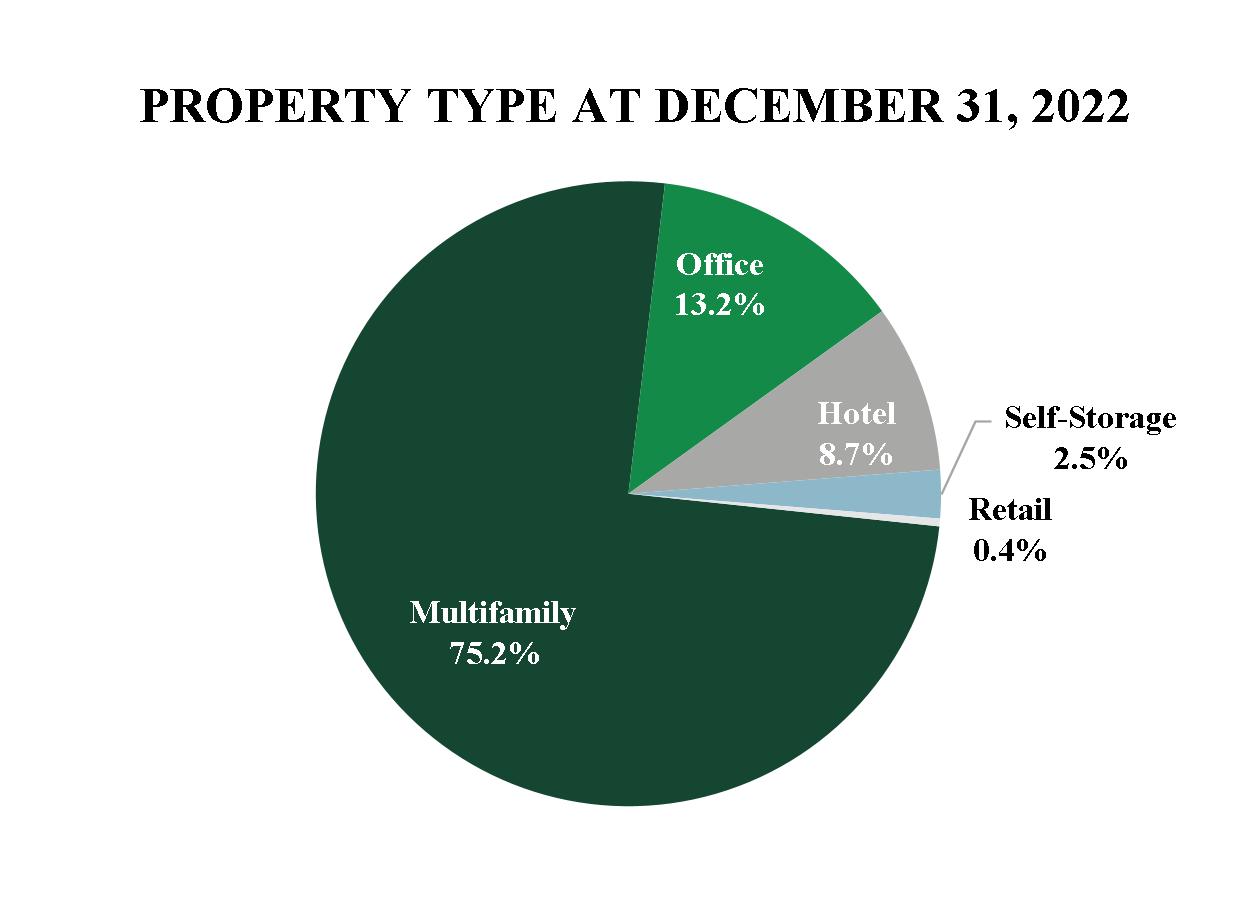
From time to time, we may acquire real estate property through direct equity investments or as a result of our lending activities. At June 30, 2023, the total carrying value of our net real estate-related assets and liabilities was $161.9 million on six properties owned, four of which are included in investments in real estate and two of which are included in properties held for sale. The existence of net capital loss carryforwards available until December 31, 2025, allows for potential future capital gains on certain of these investments to be shielded from income taxes.
We use leverage to enhance our returns. The cost of borrowings to finance our investments is a significant part of our expenses. Our net interest income depends on our ability to control these expenses relative to our revenue. Our CRE loans may initially be financed with term facilities, such as CRE loan warehouse financing facilities, in anticipation of their ultimate securitization. We ultimately seek to finance our CRE loans through the use of non-recourse long-term, match-funded CRE debt securitizations.
43
Our asset-specific borrowings comprised CRE debt securitizations, term warehouse financing facilities, senior secured financing facility, mortgage payable and construction loans. In May 2021, we closed ACRES Commercial Realty 2021-FL1 Issuer, Ltd. (“ACR 2021-FL1”), a CRE debt securitization financing $802.6 million of CRE loans with $675.2 million of non-recourse, floating-rate notes at a weighted average cost of one-month LIBOR plus 1.49%. In December 2021, we closed ACRES Commercial Realty 2021-FL2 Issuer, Ltd. (“ACR 2021-FL2”), a CRE debt securitization financing $700.0 million of CRE loans with $567.0 million of non-recourse, floating-rate notes at a weighted average cost of one-month LIBOR plus 1.80%. In June 2023, we converted one-month LIBOR to one-month Term SOFR for both ACR 2021-FL1 and ACR 2021-FL2. Each of these 2021 CLOs initially provided for a two-year reinvestment period that allowed us to reinvest CRE loan payoffs and principal paydown proceeds into the securitizations, pending certain eligibility criteria are met and rating agency approval is obtained. The reinvestment feature of the securitizations would allow us to extend the securitizations’ financing lives at favorable interest rates through the reinvestment of loan payoff proceeds into new loans. The reinvestment period on ACR 2021-FL1 ended in May 2023 and the reinvestment period on ACR 2021-FL2 will end in December 2023.
In February 2022 and March 2022, we exercised the optional redemptions of Exantas Capital Corp. 2020-RSO8, Ltd. (“XAN 2020-RSO8”) and Exantas Capital Corp. 2020-RSO9, Ltd. (“XAN 2020-RSO9”), respectively, and all of the outstanding senior notes were paid off from the sales proceeds of certain of the securitizations’ assets.
At June 30, 2023 and December 31, 2022, we had an outstanding balance of $1.2 billion on CRE debt securitizations, or 70.6% and 66.1%, respectively, of total outstanding borrowings. At June 30, 2023 and December 31, 2022, we had outstanding balances on our term warehouse financing facilities of $251.3 million and $328.3 million, respectively, or 14.4% and 17.6%, respectively, of total outstanding borrowings. At June 30, 2023 and December 31, 2022, we had outstanding borrowings on our senior secured financing facility of $47.7 million and $87.9 million, respectively, or 2.7% and 4.7%, respectively, of total outstanding borrowings. At June 30, 2023 and December 31, 2022, we had $18.5 million and $18.2 million, respectively, of outstanding borrowings on our mortgage payable, or 1.1% and 1.0%, respectively, of total outstanding borrowings. At June 30, 2023, we had two construction loans that have not been drawn upon.
In February 2022, we repurchased $39.8 million par value of our 4.50% convertible senior notes due 2022 (“4.50% Convertible Senior Notes”). In conjunction with the repurchase, we accelerated $460,000 of the convertible note discount, which was recorded as an extinguishment of debt cost, and $114,000 of deferred debt issuance costs, which were recorded in interest expense. In August 2022, the remaining $48.2 million of outstanding notes were paid off upon maturity at par.
In January 2020, we adopted updated accounting guidance that replaced the incurred loss approach with the CECL model for the determination of our allowance for loan losses. We reevaluate our CECL allowance quarterly, incorporating our current expectations of macroeconomic factors considered in the determination of our CECL reserves.
At June 30, 2023, the CECL allowance on our CRE loan portfolio was $25.7 million, or 1.3% of our $2.0 billion loan portfolio. At December 31, 2022, the CECL allowance on our CRE loan portfolio was $18.8 million, or 0.9% of our $2.1 billion loan portfolio.
During the six months ended June 30, 2023, we recorded a provision for credit losses primarily attributable to the impact from the near-term macroeconomic outlook of the commercial real estate market, including: forecasted increases in short-term interest rates, continued expected declines in commercial real estate pricing and forecasted higher unemployment rates, partially offset by improvements in property-level cash flows. In June 2023, we received the deed-in-lieu of foreclosure to an office loan in the East North Central region with a principal balance of $22.8 million which resulted in a charge off of $948,000 against the allowance for credit losses.
For the year ended December 31, 2022, we recorded a net provision for credit losses, which at the time, reflected changes in macroeconomic conditions and a specific, full reserve on one mezzanine loan with a par value of $4.7 million, which was delinquent with respect to debt service.
Additionally, the steady decline in our CECL reserves from our highest reserve balance in June 30, 2020 of $61.1 million, or 3.4% of the par balance of our CRE loan portfolio, to our current reserve balance at June 30, 2023 of $25.7 million, or 1.3% of the par balance of our CRE loan portfolio, has been due to the following: the successful resolution of our individually evaluated loans with specific reserves, the overall newer vintage of our CRE loan portfolio (with 10.6% of the portfolio, at June 30, 2023, being originated prior to the fourth quarter of 2020) as well as the increased percentage allocation of our CRE loan portfolio to multifamily loans over time. Multifamily loans have historically had our lowest credit losses of any asset class and in the sample population in the third-party model that we use to support our CECL reserves. Our percentage allocation of our CRE loan portfolio to multifamily has grown from 58.4% at June 30, 2020 to 75.4% at June 30, 2023.
44
We historically used derivative financial instruments, including interest rate swaps, to hedge a portion of the interest rate risk associated with our borrowings. In April 2020, we terminated all interest rate hedges in conjunction with the disposition of our financed commercial mortgage-backed securities (“CMBS”) portfolio. At June 30, 2023 and December 31, 2022, we had unrealized losses in connection with the terminated hedges of $5.8 million and $6.6 million, respectively, which will be amortized into interest expense over the remaining life of the debt. During the three and six months ended June 30, 2023, we recognized amortization expense on these terminated contracts of $420,000 and $835,000, respectively.
Common stock book value was $24.50 per share at June 30, 2023, a $0.04 per share decrease from December 31, 2022.
Impact of Reference Rate Reform
Historically, we have used LIBOR as the benchmark interest rate for our floating-rate whole loans and we have been exposed to LIBOR through our floating-rate borrowings. In March 2021, the United Kingdom’s Financial Conduct Authority announced that it would cease publication of the one-week and two-month USD LIBOR immediately after December 31, 2021 and cease publication of the remaining tenors immediately after June 30, 2023. In July 2021, the U.S. Federal Reserve, in conjunction with the Alternative Reference Rates Committee, a steering committee comprised of large U.S. financial institutions, has identified SOFR as its preferred alternative rate for LIBOR.
Following this announcement, we began to transition the contractual benchmark rates of existing floating-rate whole loans and borrowings to alternate rates. Additionally, beginning January 1, 2022, all variable rate loans we originated and all variable rate borrowings acquired had been benchmarked to SOFR. At June 30, 2023, our loan portfolio had a carrying value of $1.9 billion of floating rate loans, all of which have interest rates tied to SOFR. At June 30, 2023, we had $1.6 billion of floating rate borrowings, 96.8% or $1.5 billion of which have interest rates tied to SOFR and 3.2% or $51.5 million of which have interest rates tied to LIBOR.
We expect to complete the process of converting our LIBOR-based borrowings to an applicable benchmark interest rate during 2023.
Results of Operations
Our net income allocable to common shares for the three months ended June 30, 2023 was $817,000 or $0.10 per share-basic ($0.10 per share-diluted) and our net loss allocable to common shares for the six months ended June 30, 2023 was $1.6 million or $(0.19) per share-basic ($(0.19) per share-diluted), respectively, as compared to net income allocable to common shares for the three months ended June 30, 2022 of $690,000, or $0.08 per share-basic ($0.08 per share-diluted) and net loss allocable to common shares for the six months ended June 30, 2022 of $2.1 million, or $(0.23) per share-basic ($(0.23) per share-diluted).
45
Net Interest Income
The following tables analyze the change in interest income and interest expense for the comparative three and six months ended June 30, 2023 and 2022 by changes in volume and changes in rates. The changes attributable to the combined changes in volume and rate have been allocated proportionately, based on absolute values, to the changes due to volume and changes due to rates (dollars in thousands, except amounts in footnotes):
|
|
Three Months Ended June 30, 2023 Compared to Three Months Ended June 30, 2022 |
|
|||||||||||||
|
|
|
|
|
|
|
|
Due to Changes in |
|
|||||||
|
|
Net Change |
|
|
Percent Change (1) |
|
|
Volume |
|
|
Rate |
|
||||
Increase (decrease) in interest income: |
|
|
|
|
|
|
|
|
|
|
|
|
||||
CRE whole loans (2) |
|
$ |
19,505 |
|
|
|
73 |
% |
|
$ |
(1,118 |
) |
|
$ |
20,623 |
|
CRE mezzanine loan |
|
|
(118 |
) |
|
|
(100 |
)% |
|
|
— |
|
|
|
(118 |
) |
Other |
|
|
742 |
|
|
|
1,349 |
% |
|
|
28 |
|
|
|
714 |
|
Total increase in interest income |
|
|
20,129 |
|
|
|
74 |
% |
|
|
(1,090 |
) |
|
|
21,219 |
|
|
|
|
|
|
|
|
|
|
|
|
|
|
||||
Increase (decrease) in interest expense: |
|
|
|
|
|
|
|
|
|
|
|
|
||||
Securitized borrowings: (3) |
|
|
|
|
|
|
|
|
|
|
|
|
||||
ACR 2021-FL1 Senior Notes |
|
|
7,185 |
|
|
|
168 |
% |
|
|
(3 |
) |
|
|
7,188 |
|
ACR 2021-FL2 Senior Notes |
|
|
6,040 |
|
|
|
147 |
% |
|
|
— |
|
|
|
6,040 |
|
Senior secured financing facility (3) |
|
|
870 |
|
|
|
178 |
% |
|
|
867 |
|
|
|
3 |
|
CRE - term warehouse financing facilities (3) |
|
|
3,099 |
|
|
|
125 |
% |
|
|
(92 |
) |
|
|
3,191 |
|
4.50% Convertible Senior Notes (3) |
|
|
(891 |
) |
|
|
(100 |
)% |
|
|
(891 |
) |
|
|
— |
|
5.75% Senior Unsecured Notes (3) |
|
|
10 |
|
|
|
0 |
% |
|
|
10 |
|
|
|
— |
|
12.00% Senior Unsecured Notes (3) |
|
|
(96 |
) |
|
|
(100 |
)% |
|
|
(96 |
) |
|
|
— |
|
Unsecured junior subordinated debentures |
|
|
544 |
|
|
|
85 |
% |
|
|
— |
|
|
|
544 |
|
Hedging |
|
|
(64 |
) |
|
|
(14 |
)% |
|
|
(64 |
) |
|
|
— |
|
Total increase in interest expense |
|
|
16,697 |
|
|
|
106 |
% |
|
|
(269 |
) |
|
|
16,966 |
|
Net increase in net interest income |
|
$ |
3,432 |
|
|
|
|
|
$ |
(821 |
) |
|
$ |
4,253 |
|
|
46
|
|
Six Months Ended June 30, 2023 Compared to Six Months Ended June 30, 2022 |
|
|||||||||||||
|
|
|
|
|
|
|
|
Due to Changes in |
|
|||||||
|
|
Net Change |
|
|
Percent Change (1) |
|
|
Volume |
|
|
Rate |
|
||||
Increase (decrease) in interest income: |
|
|
|
|
|
|
|
|
|
|
|
|
||||
CRE whole loans (2) |
|
$ |
41,452 |
|
|
|
84 |
% |
|
$ |
931 |
|
|
$ |
40,521 |
|
Legacy CRE loan |
|
|
(29 |
) |
|
|
(100 |
)% |
|
|
(29 |
) |
|
|
— |
|
CRE mezzanine loan |
|
|
(223 |
) |
|
|
(94 |
)% |
|
|
— |
|
|
|
(223 |
) |
Other |
|
|
1,582 |
|
|
|
2,138 |
% |
|
|
17 |
|
|
|
1,565 |
|
Total increase in interest income |
|
|
42,782 |
|
|
|
86 |
% |
|
|
919 |
|
|
|
41,863 |
|
|
|
|
|
|
|
|
|
|
|
|
|
|
||||
Increase (decrease) in interest expense: |
|
|
|
|
|
|
|
|
|
|
|
|
||||
Securitized borrowings: (3) |
|
|
|
|
|
|
|
|
|
|
|
|
||||
XAN 2020-RSO8 Senior Notes |
|
|
(1,208 |
) |
|
|
(100 |
)% |
|
|
(1,208 |
) |
|
|
— |
|
XAN 2020-RSO9 Senior Notes |
|
|
(956 |
) |
|
|
(100 |
)% |
|
|
(956 |
) |
|
|
— |
|
ACR 2021-FL1 Senior Notes |
|
|
14,538 |
|
|
|
195 |
% |
|
|
(7 |
) |
|
|
14,545 |
|
ACR 2021-FL2 Senior Notes |
|
|
12,215 |
|
|
|
168 |
% |
|
|
— |
|
|
|
12,215 |
|
Senior secured financing facility (3) |
|
|
1,913 |
|
|
|
191 |
% |
|
|
1,886 |
|
|
|
27 |
|
CRE - term warehouse financing facilities (3) |
|
|
8,174 |
|
|
|
232 |
% |
|
|
2,207 |
|
|
|
5,967 |
|
4.50% Convertible Senior Notes (3) |
|
|
(2,247 |
) |
|
|
(100 |
)% |
|
|
(2,247 |
) |
|
|
— |
|
5.75% Senior Unsecured Notes (3) |
|
|
18 |
|
|
|
0 |
% |
|
|
18 |
|
|
|
— |
|
12.00% Senior Unsecured Notes (3) |
|
|
(274 |
) |
|
|
(100 |
)% |
|
|
(274 |
) |
|
|
— |
|
Unsecured junior subordinated debentures |
|
|
1,120 |
|
|
|
95 |
% |
|
|
— |
|
|
|
1,120 |
|
Hedging |
|
|
(128 |
) |
|
|
(14 |
)% |
|
|
(128 |
) |
|
|
— |
|
Total increase in interest expense |
|
|
33,165 |
|
|
|
108 |
% |
|
|
(709 |
) |
|
|
33,874 |
|
Net increase in net interest income |
|
$ |
9,617 |
|
|
|
|
|
$ |
1,628 |
|
|
$ |
7,989 |
|
|
Net Change in Interest Income for the Comparative three and six months ended June 30, 2023 and 2022:
Aggregate interest income increased by $20.1 million and $42.8 million for the comparative three and six months ended June 30, 2023 and 2022, respectively. We attribute the changes to the following:
CRE whole loans. The increases of $19.5 million and $41.5 million for the comparative three and six months ended June 30, 2023 and 2022, respectively, were primarily attributable to an increase in the benchmark rate over the comparative periods.
Net Change in Interest Expense for the Comparative three and six months ended June 30, 2023 and 2022:
Aggregate interest expense increased by $16.7 million and $33.2 million for the comparative three and six months ended June 30, 2023 and 2022. We attribute the changes to the following:
Securitized borrowings. The net increases of $13.2 million and $24.6 million for the comparative three and six months ended June 30, 2023 and 2022, respectively, were primarily attributable to an increase in the benchmark rate over the comparative periods. The increase for the comparative six months ended June 30, 2023 and 2022 was partially offset by the 2022 liquidations of XAN 2020-RSO8 and XAN 2020-RSO9.
Senior secured financing facility. The increases of $870,000 and $1.9 million for the comparative three and six months ended June 30, 2023 and 2022, respectively, were primarily attributable to increased utilization of the senior secured financing facility.
CRE - term warehouse financing facilities. The increases of $3.1 million and $8.2 million for the comparative three and six months ended June 30, 2023 and 2022, respectively, were primarily attributable to an increase in the benchmark rate over the comparative periods. The increase for the comparative six months ended June 30, 2023 and 2022 was also attributable to the increased utilization of these facilities over the comparative periods.
47
4.50% Convertible Senior Notes. The decreases of $891,000 and $2.2 million for the comparative three and six months ended June 30, 2023 and 2022, respectively, were primarily attributable to the redemption of the remaining $88.0 million of these notes during the year ended December 31, 2022.
Unsecured junior subordinated debentures. The increases of $544,000 and $1.1 million for the comparative three and six months ended June 30, 2023 and 2022, respectively, were attributable to an increase in the benchmark rate over the comparative periods.
Average Net Yield and Average Cost of Funds:
The following tables present the average net yield and average cost of funds for the three and six months ended June 30, 2023 and 2022 (dollars in thousands, except amounts in footnotes):
|
|
Three Months Ended June 30, 2023 |
|
|
Three Months Ended June 30, 2022 |
|
||||||||||||||||||
|
|
Average Amortized Cost |
|
|
Interest Income (Expense) |
|
|
Average Net Yield (Cost of Funds) (1) |
|
|
Average Amortized Cost |
|
|
Interest Income (Expense) |
|
|
Average Net Yield (Cost of Funds) (1) |
|
||||||
Interest-earning assets |
|
|
|
|
|
|
|
|
|
|
|
|
|
|
|
|
|
|
||||||
CRE whole loans, floating-rate (2) |
|
$ |
1,974,604 |
|
|
$ |
46,351 |
|
|
|
9.41 |
% |
|
$ |
1,953,740 |
|
|
$ |
26,846 |
|
|
|
5.51 |
% |
CRE mezzanine loan |
|
|
4,700 |
|
|
|
— |
|
|
|
— |
% |
|
|
4,700 |
|
|
|
118 |
|
|
|
9.96 |
% |
Other |
|
|
70,238 |
|
|
|
797 |
|
|
|
4.55 |
% |
|
|
51,135 |
|
|
|
55 |
|
|
|
0.43 |
% |
Total interest income/average net yield |
|
|
2,049,542 |
|
|
|
47,148 |
|
|
|
9.22 |
% |
|
|
2,009,575 |
|
|
|
27,019 |
|
|
|
5.39 |
% |
Interest-bearing liabilities |
|
|
|
|
|
|
|
|
|
|
|
|
|
|
|
|
|
|
||||||
Collateralized by: |
|
|
|
|
|
|
|
|
|
|
|
|
|
|
|
|
|
|
||||||
CRE whole loans (3) |
|
|
1,555,911 |
|
|
|
(28,546 |
) |
|
|
(7.36 |
)% |
|
|
1,494,037 |
|
|
|
(11,352 |
) |
|
|
(3.00 |
)% |
General corporate debt: |
|
|
|
|
|
|
|
|
|
|
|
|
|
|
|
|
|
|
||||||
Unsecured junior subordinated debentures |
|
|
51,548 |
|
|
|
(1,186 |
) |
|
|
(9.10 |
)% |
|
|
51,548 |
|
|
|
(642 |
) |
|
|
(4.93 |
)% |
4.50% Convertible Senior Notes (4) |
|
|
— |
|
|
|
— |
|
|
|
— |
% |
|
|
47,823 |
|
|
|
(891 |
) |
|
|
(7.37 |
)% |
5.75% Senior Unsecured Notes (5) |
|
|
147,741 |
|
|
|
(2,313 |
) |
|
|
(6.28 |
)% |
|
|
147,132 |
|
|
|
(2,303 |
) |
|
|
(6.28 |
)% |
12.00% Senior Unsecured Notes (6)(7) |
|
|
— |
|
|
|
— |
|
|
|
— |
% |
|
|
— |
|
|
|
(96 |
) |
|
|
— |
% |
Hedging (8) |
|
|
— |
|
|
|
(397 |
) |
|
|
— |
% |
|
|
— |
|
|
|
(461 |
) |
|
|
— |
% |
Total interest expense/average cost of funds |
|
|
1,755,200 |
|
|
|
(32,442 |
) |
|
|
(7.32 |
)% |
|
|
1,740,540 |
|
|
|
(15,745 |
) |
|
|
(3.45 |
)% |
Total net interest income |
|
|
|
|
$ |
14,706 |
|
|
|
|
|
|
|
|
$ |
11,274 |
|
|
|
|
||||
48
|
|
Six Months Ended June 30, 2023 |
|
|
Six Months Ended June 30, 2022 |
|
||||||||||||||||||
|
|
Average Amortized Cost |
|
|
Interest Income (Expense) |
|
|
Average Net Yield (Cost of Funds) (1) |
|
|
Average Amortized Cost |
|
|
Interest Income (Expense) |
|
|
Average Net Yield (Cost of Funds) (1) |
|
||||||
Interest-earning assets |
|
|
|
|
|
|
|
|
|
|
|
|
|
|
|
|
|
|
||||||
CRE whole loans, floating-rate (2) |
|
$ |
1,993,000 |
|
|
$ |
90,808 |
|
|
|
9.19 |
% |
|
$ |
1,918,678 |
|
|
$ |
49,356 |
|
|
|
5.19 |
% |
Legacy CRE loan |
|
|
— |
|
|
|
— |
|
|
|
— |
% |
|
|
318 |
|
|
|
29 |
|
|
|
18.08 |
% |
CRE mezzanine loan |
|
|
4,700 |
|
|
|
13 |
|
|
|
0.54 |
% |
|
|
4,700 |
|
|
|
236 |
|
|
|
9.96 |
% |
Other |
|
|
90,565 |
|
|
|
1,656 |
|
|
|
3.69 |
% |
|
|
93,667 |
|
|
|
74 |
|
|
|
0.16 |
% |
Total interest income/average net yield |
|
|
2,088,265 |
|
|
|
92,477 |
|
|
|
8.93 |
% |
|
|
2,017,363 |
|
|
|
49,695 |
|
|
|
4.97 |
% |
Interest-bearing liabilities |
|
|
|
|
|
|
|
|
|
|
|
|
|
|
|
|
|
|
||||||
Collateralized by: |
|
|
|
|
|
|
|
|
|
|
|
|
|
|
|
|
|
|
||||||
CRE whole loans (3) |
|
|
1,588,306 |
|
|
|
(56,102 |
) |
|
|
(7.12 |
)% |
|
|
1,487,428 |
|
|
|
(21,426 |
) |
|
|
(2.82 |
)% |
General corporate debt: |
|
|
|
|
|
|
|
|
|
|
|
|
|
|
|
|
|
|
||||||
Unsecured junior subordinated debentures |
|
|
51,548 |
|
|
|
(2,301 |
) |
|
|
(8.88 |
)% |
|
|
51,548 |
|
|
|
(1,181 |
) |
|
|
(4.56 |
)% |
4.50% Convertible Senior Notes (4) |
|
|
— |
|
|
|
— |
|
|
|
— |
% |
|
|
57,396 |
|
|
|
(2,247 |
) |
|
|
(7.79 |
)% |
5.75% Senior Unsecured Notes (5) |
|
|
147,664 |
|
|
|
(4,624 |
) |
|
|
(6.31 |
)% |
|
|
147,060 |
|
|
|
(4,606 |
) |
|
|
(6.31 |
)% |
12.00% Senior Unsecured Notes (6)(7) |
|
|
— |
|
|
|
— |
|
|
|
— |
% |
|
|
— |
|
|
|
(274 |
) |
|
|
— |
% |
Hedging (8) |
|
|
— |
|
|
|
(790 |
) |
|
|
— |
% |
|
|
— |
|
|
|
(918 |
) |
|
|
— |
% |
Total interest expense/average cost of funds |
|
|
1,787,518 |
|
|
|
(63,817 |
) |
|
|
(7.10 |
)% |
|
|
1,743,432 |
|
|
|
(30,652 |
) |
|
|
(3.33 |
)% |
Total net interest income |
|
|
|
|
$ |
28,660 |
|
|
|
|
|
|
|
|
$ |
19,043 |
|
|
|
|
||||
Real Estate Income and Other Revenue
The following table sets forth information relating to our real estate income and other revenue for the periods presented (dollars in thousands):
|
|
For the Three Months Ended June 30, |
|
|
|
|
|
|
|
|||||||
|
|
2023 |
|
|
2022 |
|
|
Dollar Change |
|
|
Percent Change |
|
||||
Real estate income and other revenue: |
|
|
|
|
|
|
|
|
|
|
|
|
||||
Real estate income |
|
$ |
8,879 |
|
|
$ |
8,777 |
|
|
$ |
102 |
|
|
|
1 |
% |
Other revenue |
|
|
37 |
|
|
|
19 |
|
|
|
18 |
|
|
|
95 |
% |
Total |
|
$ |
8,916 |
|
|
$ |
8,796 |
|
|
$ |
120 |
|
|
|
1 |
% |
|
|
For the Six Months Ended June 30, |
|
|
|
|
|
|
|
|||||||
|
|
2023 |
|
|
2022 |
|
|
Dollar Change |
|
|
Percent Change |
|
||||
Real estate income and other revenue: |
|
|
|
|
|
|
|
|
|
|
|
|
||||
Real estate income |
|
$ |
15,950 |
|
|
$ |
11,915 |
|
|
$ |
4,035 |
|
|
|
34 |
% |
Other revenue |
|
|
70 |
|
|
|
35 |
|
|
|
35 |
|
|
|
100 |
% |
Total |
|
$ |
16,020 |
|
|
$ |
11,950 |
|
|
$ |
4,070 |
|
|
|
34 |
% |
Aggregate real estate income and other revenue increased by $120,000 and $4.1 million for the comparative three and six months ended June 30, 2023 and 2022, respectively. The increase in real estate income for the comparative six months ended was primarily attributable to the acquisition of two properties, a hotel and a student housing facility, in April 2022, as well as increased real estate income at our hotel property acquired in 2020 that benefited from increased personal and business travel resulting from lifted COVID-19 restrictions that occurred late in the spring of 2022. The increase for the comparative six months was partially offset by the sale of an office property in September 2022, as well as decreased revenue on an office property acquired in October 2021.
49
Operating Expenses
The following tables set forth information relating to our operating expenses for the periods presented (dollars in thousands):
|
|
For the Three Months Ended June 30, |
|
|
|
|
|
|
|
|||||||
|
|
2023 |
|
|
2022 |
|
|
Dollar Change |
|
|
Percent Change |
|
||||
Operating expenses: |
|
|
|
|
|
|
|
|
|
|
|
|
||||
General and administrative |
|
$ |
2,348 |
|
|
$ |
2,353 |
|
|
$ |
(5 |
) |
|
|
(0 |
)% |
Real estate expenses |
|
|
10,492 |
|
|
|
9,162 |
|
|
|
1,330 |
|
|
|
15 |
% |
Management fees - related party |
|
|
1,890 |
|
|
|
1,672 |
|
|
|
218 |
|
|
|
13 |
% |
Equity compensation - related party |
|
|
719 |
|
|
|
991 |
|
|
|
(272 |
) |
|
|
(27 |
)% |
Corporate depreciation and amortization |
|
|
23 |
|
|
|
21 |
|
|
|
2 |
|
|
|
10 |
% |
Provision for credit losses, net |
|
|
2,700 |
|
|
|
524 |
|
|
|
2,176 |
|
|
|
415 |
% |
Total |
|
$ |
18,172 |
|
|
$ |
14,723 |
|
|
$ |
3,449 |
|
|
|
23 |
% |
|
|
For the Six Months Ended June 30, |
|
|
|
|
|
|
|
|||||||
|
|
2023 |
|
|
2022 |
|
|
Dollar Change |
|
|
Percent Change |
|
||||
Operating expenses: |
|
|
|
|
|
|
|
|
|
|
|
|
||||
General and administrative |
|
$ |
5,327 |
|
|
$ |
5,810 |
|
|
$ |
(483 |
) |
|
|
(8 |
)% |
Real estate expenses |
|
|
19,352 |
|
|
|
13,956 |
|
|
|
5,396 |
|
|
|
39 |
% |
Management fees - related party |
|
|
3,663 |
|
|
|
3,354 |
|
|
|
309 |
|
|
|
9 |
% |
Equity compensation - related party |
|
|
1,613 |
|
|
|
1,735 |
|
|
|
(122 |
) |
|
|
(7 |
)% |
Corporate depreciation and amortization |
|
|
46 |
|
|
|
43 |
|
|
|
3 |
|
|
|
7 |
% |
Provision for (reversal of) credit losses, net |
|
|
7,796 |
|
|
|
(1,278 |
) |
|
|
9,074 |
|
|
|
710 |
% |
Total |
|
$ |
37,797 |
|
|
$ |
23,620 |
|
|
$ |
14,177 |
|
|
|
60 |
% |
Aggregate operating expenses increased by $3.4 million and $14.2 million for the comparative three and six months ended June 30, 2023 and 2022, respectively. We attribute the changes to the following:
General and administrative. General and administrative expenses decreased by $5,000 and $483,000 for the comparative three and six months ended June 30, 2023 and 2022, respectively. The following table summarizes the information relating to our general and administrative expenses for the periods presented (dollars in thousands):
|
|
For the Three Months Ended June 30, |
|
|
|
|
|
|
|
|||||||
|
|
2023 |
|
|
2022 |
|
|
Dollar Change |
|
|
Percent Change |
|
||||
General and administrative |
|
|
|
|
|
|
|
|
|
|
|
|
||||
Professional services |
|
$ |
961 |
|
|
$ |
1,157 |
|
|
$ |
(196 |
) |
|
|
(17 |
)% |
Wages and benefits |
|
|
350 |
|
|
|
290 |
|
|
|
60 |
|
|
|
21 |
% |
D&O insurance |
|
|
322 |
|
|
|
360 |
|
|
|
(38 |
) |
|
|
(11 |
)% |
Operating expenses |
|
|
239 |
|
|
|
266 |
|
|
|
(27 |
) |
|
|
(10 |
)% |
Dues and subscriptions |
|
|
229 |
|
|
|
186 |
|
|
|
43 |
|
|
|
23 |
% |
Director fees |
|
|
206 |
|
|
|
76 |
|
|
|
130 |
|
|
|
171 |
% |
Tax penalties, interest & franchise tax |
|
|
20 |
|
|
|
1 |
|
|
|
19 |
|
|
|
1,900 |
% |
Travel |
|
|
21 |
|
|
|
17 |
|
|
|
4 |
|
|
|
24 |
% |
Total |
|
$ |
2,348 |
|
|
$ |
2,353 |
|
|
$ |
(5 |
) |
|
|
(0 |
)% |
50
|
|
For the Six Months Ended June 30, |
|
|
|
|
|
|
|
|||||||
|
|
2023 |
|
|
2022 |
|
|
Dollar Change |
|
|
Percent Change |
|
||||
General and administrative |
|
|
|
|
|
|
|
|
|
|
|
|
||||
Professional services |
|
$ |
2,481 |
|
|
$ |
3,049 |
|
|
$ |
(568 |
) |
|
|
(19 |
)% |
Wages and benefits |
|
|
741 |
|
|
|
649 |
|
|
|
92 |
|
|
|
14 |
% |
D&O insurance |
|
|
641 |
|
|
|
716 |
|
|
|
(75 |
) |
|
|
(10 |
)% |
Operating expenses |
|
|
506 |
|
|
|
425 |
|
|
|
81 |
|
|
|
19 |
% |
Dues and subscriptions |
|
|
433 |
|
|
|
392 |
|
|
|
41 |
|
|
|
10 |
% |
Director fees |
|
|
412 |
|
|
|
413 |
|
|
|
(1 |
) |
|
|
(0 |
)% |
Tax penalties, interest & franchise tax |
|
|
86 |
|
|
|
140 |
|
|
|
(54 |
) |
|
|
(39 |
)% |
Travel |
|
|
27 |
|
|
|
26 |
|
|
|
1 |
|
|
|
4 |
% |
Total |
|
$ |
5,327 |
|
|
$ |
5,810 |
|
|
$ |
(483 |
) |
|
|
(8 |
)% |
The decrease in general and administrative expense for the comparative six months ended June 30, 2023 and 2022 was primarily attributable to a decrease in professional services in connection with (i) legal expenses incurred during the six months ended June 30, 2022 pertaining to the liquidation of 2020-RSO8 and 2020-RSO9 compounded by reimbursement from a borrower for legal costs during the six months ended June 30, 2023, (ii) a decrease in marketing expenses over the comparative periods and (iii) the timing of CRE valuations for the year end audit.
Real estate expenses. The increase of $1.3 million and $5.4 million for the comparative three and six months ended June 30, 2023 and 2022, respectively, was primarily attributable to the acquisition of two properties, a hotel in April 2022 and an office property on which we received the deed-in-lieu of foreclosure in June 2023. The increase for the comparative three and six months ended was partially offset by the sale of an office property in September 2022. The increase for the comparative six months ended was also attributable to the acquisition of a student housing complex in April 2022, partially offset by a decrease in depreciation expense on an office property acquired in October 2021 over the comparative periods.
Provision for credit losses, net. The increase of $2.2 million and $9.1 million for the comparative three and six months ended June 30, 2023 and 2022, respectively, was primarily attributable to the impact from the near-term macroeconomic outlook of the commercial real estate market, including: forecasted increases in short-term interest rates, continued expected declines in commercial real estate pricing and forecasted higher unemployment rates, partially offset by improvements in property-level cash flows.
Other Income (Expense)
The following table sets forth information relating to our other income (expense) incurred for the periods presented (dollars in thousands):
|
|
For the Three Months Ended June 30, |
|
|
|
|
|
|
|
|||||||
|
|
2023 |
|
|
2022 |
|
|
Dollar Change |
|
|
Percent Change |
|
||||
Other income (expense): |
|
|
|
|
|
|
|
|
|
|
|
|
||||
Other income |
|
|
242 |
|
|
|
175 |
|
|
|
67 |
|
|
|
38 |
% |
Total |
|
$ |
242 |
|
|
$ |
175 |
|
|
$ |
67 |
|
|
|
38 |
% |
|
|
For the Six Months Ended June 30, |
|
|
|
|
|
|
|
|||||||
|
|
2023 |
|
|
2022 |
|
|
Dollar Change |
|
|
Percent Change |
|
||||
Other income (expense): |
|
|
|
|
|
|
|
|
|
|
|
|
||||
Loss on extinguishment of debt |
|
$ |
— |
|
|
$ |
(460 |
) |
|
$ |
460 |
|
|
|
(100 |
)% |
Gain on sale of real estate |
|
|
745 |
|
|
|
— |
|
|
|
745 |
|
|
|
100 |
% |
Other income |
|
|
352 |
|
|
|
973 |
|
|
|
(621 |
) |
|
|
(64 |
)% |
Total |
|
$ |
1,097 |
|
|
$ |
513 |
|
|
$ |
584 |
|
|
|
114 |
% |
51
Aggregate other income increased $67,000 and $584,000 for the comparative three and six months ended June 30, 2023 and 2022, respectively. We attribute the changes to the following:
Loss on extinguishment of debt. There were no losses on extinguishment of debt in the three and six months ended June 30, 2023. The loss of $460,000 for the six months ended June 30, 2022 was attributable to non-cash losses in connection with the ratable acceleration of the 4.50% Convertible Senior Notes' market discount due to the partial redemption of our 4.50% Convertible Senior Notes in February 2022.
Gain on sale of real estate. The gain of $745,000 for the six months ended June 30, 2023 was attributed to the sale of a hotel property in the Northeast region in February 2023 that generated non-recurring gains. There were no sales of property during the three and six months ended June 30, 2022.
Other Income. The decrease of $621,000 during the comparative six months ended June 30, 2023 and 2022 was primarily attributable to a loan recovery received during the six months ended June 30, 2022 on a middle market loan that was previously charged off in a prior quarter. During the three and six months ended June 30, 2023, no loan recoveries occurred.
52
Financial Condition
Summary
Our total assets were $2.3 billion and $2.4 billion at June 30, 2023 and December 31, 2022, respectively.
Investment Portfolio
The tables below summarize the amortized cost and net carrying amount of our investment portfolio, classified by asset type, at June 30, 2023 and December 31, 2022 as follows (dollars in thousands, except amounts in footnotes):
At June 30, 2023 |
|
Amortized Cost |
|
|
Net Carrying Amount (1) |
|
|
Percent of Portfolio |
|
|
Weighted Average Coupon |
|||
Loans held for investment: |
|
|
|
|
|
|
|
|
|
|
|
|||
CRE whole loans, floating-rate |
|
$ |
1,959,040 |
|
|
$ |
1,938,089 |
|
|
|
92.22 |
% |
|
9.16% |
CRE mezzanine loan |
|
|
4,700 |
|
|
|
— |
|
|
|
0.00 |
% |
|
10.00% |
|
|
|
1,963,740 |
|
|
|
1,938,089 |
|
|
|
92.22 |
% |
|
|
Other investments: |
|
|
|
|
|
|
|
|
|
|
|
|||
Investments in unconsolidated entities |
|
|
1,548 |
|
|
|
1,548 |
|
|
|
0.07 |
% |
|
N/A (4) |
Investments in real estate (2) |
|
|
103,318 |
|
|
|
103,318 |
|
|
|
4.92 |
% |
|
N/A (4) |
Property held for sale (3) |
|
|
58,540 |
|
|
|
58,540 |
|
|
|
2.79 |
% |
|
N/A (4) |
|
|
|
163,406 |
|
|
|
163,406 |
|
|
|
7.78 |
% |
|
|
|
|
|
|
|
|
|
|
|
|
|
|
|||
Total investment portfolio |
|
$ |
2,127,146 |
|
|
$ |
2,101,495 |
|
|
|
100.00 |
% |
|
|
|
|
|
|
|
|
|
|
|
|
|
|
|||
|
|
|
|
|
|
|
|
|
|
|
|
|||
At December 31, 2022 |
|
Amortized Cost |
|
|
Net Carrying Amount (1) |
|
|
Percent of Portfolio |
|
|
Weighted Average Coupon |
|||
Loans held for investment: |
|
|
|
|
|
|
|
|
|
|
|
|||
CRE whole loans, floating-rate |
|
$ |
2,052,890 |
|
|
$ |
2,038,787 |
|
|
|
93.56 |
% |
|
7.99% |
CRE mezzanine loan |
|
|
4,700 |
|
|
|
— |
|
|
|
0.00 |
% |
|
10.00% |
|
|
|
2,057,590 |
|
|
|
2,038,787 |
|
|
|
93.56 |
% |
|
|
Other investments: |
|
|
|
|
|
|
|
|
|
|
|
|||
Investments in unconsolidated entities |
|
|
1,548 |
|
|
|
1,548 |
|
|
|
0.07 |
% |
|
N/A (4) |
Investments in real estate (2) |
|
|
88,132 |
|
|
|
88,132 |
|
|
|
4.04 |
% |
|
N/A (4) |
Property held for sale (3) |
|
|
50,744 |
|
|
|
50,744 |
|
|
|
2.33 |
% |
|
N/A (4) |
|
|
|
140,424 |
|
|
|
140,424 |
|
|
|
6.44 |
% |
|
|
|
|
|
|
|
|
|
|
|
|
|
|
|||
Total investment portfolio |
|
$ |
2,198,014 |
|
|
$ |
2,179,211 |
|
|
|
100.00 |
% |
|
|
CRE loans. During the six months ended June 30, 2023, we originated $38.5 million of floating-rate CRE whole loan commitments. Loan payoffs during the six months ended June 30, 2023 were $141.4 million and net funded commitments were $28.5 million, producing a net decrease to the portfolio of $74.4 million.
53
The following is a summary of our loans (dollars in thousands, except amounts in footnotes):
Description |
|
Quantity |
|
Principal |
|
|
Unamortized (Discount) Premium, net (1) |
|
|
Amortized Cost |
|
|
Allowance for Credit Losses |
|
|
Carrying Value |
|
|
Contractual Interest Rates (2) |
|
Maturity Dates (3)(4) |
|||||
At June 30, 2023: |
|
|
|
|
|
|
|
|
|
|
|
|
|
|
|
|
|
|
|
|
|
|||||
Whole loans (5)(6) |
|
77 |
|
$ |
1,968,322 |
|
|
$ |
(9,282 |
) |
|
$ |
1,959,040 |
|
|
$ |
(20,951 |
) |
|
$ |
1,938,089 |
|
|
1M BR plus 2.86% to 1M BR plus 8.61% |
|
July 2023 to July 2026 |
Mezzanine loan (5) |
|
1 |
|
|
4,700 |
|
|
|
— |
|
|
|
4,700 |
|
|
|
(4,700 |
) |
|
|
— |
|
|
10.00% |
|
June 2028 |
Total |
|
|
|
$ |
1,973,022 |
|
|
$ |
(9,282 |
) |
|
$ |
1,963,740 |
|
|
$ |
(25,651 |
) |
|
$ |
1,938,089 |
|
|
|
|
|
|
|
|
|
|
|
|
|
|
|
|
|
|
|
|
|
|
|
|
|
|
|
|||||
At December 31, 2022: |
|
|
|
|
|
|
|
|
|
|
|
|
|
|
|
|
|
|
|
|
|
|||||
Whole loans (5)(6) |
|
81 |
|
$ |
2,065,504 |
|
|
$ |
(12,614 |
) |
|
$ |
2,052,890 |
|
|
$ |
(14,103 |
) |
|
$ |
2,038,787 |
|
|
1M BR plus 2.85% to 1M BR plus 8.50% |
|
January 2023 to July 2026 |
Mezzanine loan (5) |
|
1 |
|
|
4,700 |
|
|
|
— |
|
|
|
4,700 |
|
|
|
(4,700 |
) |
|
|
— |
|
|
10.00% |
|
June 2028 |
Total |
|
|
|
$ |
2,070,204 |
|
|
$ |
(12,614 |
) |
|
$ |
2,057,590 |
|
|
$ |
(18,803 |
) |
|
$ |
2,038,787 |
|
|
|
|
|
At June 30, 2023, 23.6%, 21.2% and 14.2% of our CRE loan portfolio was concentrated in the Southwest, Southeast and Mountain regions, respectively, based on carrying value, as defined by the NCREIF. At December 31, 2022, 23.2%, 21.5% and 16.2% of our CRE loan portfolio was concentrated in the Southwest, Southeast and Mountain regions, respectively, based on carrying value. At June 30, 2023 and December 31, 2022, no single loan or investment represented more than 10% of our total assets and no single investment group generated over 10% of our revenue.
Investments in unconsolidated entities. Our investments in unconsolidated entities at June 30, 2023 and December 31, 2022 comprised a 100% interest in the common shares of Resource Capital Trust I (“RCT I”) and RCC Trust II (“RCT II”), with a value of $1.5 million in the aggregate, or 3.0% of each trust. We record our investments in RCT I’s and RCT II’s common shares as investments in unconsolidated entities using the cost method, recording dividend income when declared by RCT I and RCT II.
We recorded dividends from our investments in RCT I’s and RCT II’s common shares, reported in other revenue on the consolidated statement of operations, of $37,000 and $70,000, respectively, during the three and six months ended June 30, 2023. During the three and six months ended June 30, 2022, we recorded dividends of $19,000 and $35,000, respectively.
Investments in real estate and property held for sale. At June 30, 2023, we held investments in six real estate properties, four of which are included in investments in real estate and two of which are included in properties held for sale on the consolidated balance sheets.
In February 2023, we sold a hotel property in the Northeast region that we previously designated as a property held for sale. The hotel property sold for $15.1 million with selling costs of $845,000, resulting in a gain of $745,000.
54
In June 2023, we received the deed-in-lieu of foreclosure on an office property in the East North Central region. We determined that the acquisition of the property should be accounted for as an asset acquisition, and the acquisition-date fair value of $20.9 million was determined using a third-party valuation. Additionally on the date of transfer, we also acquired cash and receivables, and assumed trade payables, resulting in a charge off of the loan against our allowance for credit losses of $948,000. At June 30, 2023, the property was reported as property held for sale on the consolidated balance sheets.
The following table summarizes the book value of our investments in real estate and related intangible assets at June 30, 2023 and December 31, 2022 (in thousands, except amounts in the footnotes):
|
|
June 30, 2023 |
|
|
December 31, 2022 |
|
||||||||||||||||||
|
|
Cost Basis |
|
|
Accumulated Depreciation & Amortization |
|
|
Carrying Value |
|
|
Cost Basis |
|
|
Accumulated Depreciation & Amortization |
|
|
Carrying Value |
|
||||||
Assets: |
|
|
|
|
|
|
|
|
|
|
|
|
|
|
|
|
|
|
||||||
Investments in real estate, equity: |
|
|
|
|
|
|
|
|
|
|
|
|
|
|
|
|
|
|
||||||
Investments in real estate (1) |
|
$ |
141,008 |
|
|
$ |
(3,645 |
) |
|
$ |
137,363 |
|
|
$ |
123,219 |
|
|
$ |
(2,251 |
) |
|
$ |
120,968 |
|
Right of use assets (2)(3) |
|
|
19,665 |
|
|
|
(342 |
) |
|
|
19,323 |
|
|
|
19,664 |
|
|
|
(205 |
) |
|
|
19,459 |
|
Intangible assets (4) |
|
|
11,474 |
|
|
|
(3,098 |
) |
|
|
8,376 |
|
|
|
11,474 |
|
|
|
(2,594 |
) |
|
|
8,880 |
|
Subtotal |
|
|
172,147 |
|
|
|
(7,085 |
) |
|
|
165,062 |
|
|
|
154,357 |
|
|
|
(5,050 |
) |
|
|
149,307 |
|
|
|
|
|
|
|
|
|
|
|
|
|
|
|
|
|
|
|
|
||||||
Investments in real estate from lending activities: |
|
|
|
|
|
|
|
|
|
|
|
|
|
|
|
|
|
|
||||||
Properties held for sale (5) |
|
|
61,565 |
|
|
|
— |
|
|
|
61,565 |
|
|
|
53,769 |
|
|
|
— |
|
|
|
53,769 |
|
Total |
|
|
233,712 |
|
|
|
(7,085 |
) |
|
|
226,627 |
|
|
|
208,126 |
|
|
|
(5,050 |
) |
|
|
203,076 |
|
|
|
|
|
|
|
|
|
|
|
|
|
|
|
|
|
|
|
|
||||||
Liabilities: |
|
|
|
|
|
|
|
|
|
|
|
|
|
|
|
|
|
|
||||||
Investments in real estate, equity: |
|
|
|
|
|
|
|
|
|
|
|
|
|
|
|
|
|
|
||||||
Mortgage payable |
|
|
18,233 |
|
|
|
259 |
|
|
|
18,492 |
|
|
|
18,089 |
|
|
|
155 |
|
|
|
18,244 |
|
Other liabilities |
|
|
247 |
|
|
|
(201 |
) |
|
|
46 |
|
|
|
247 |
|
|
|
(183 |
) |
|
|
64 |
|
Lease liabilities (3)(6) |
|
|
43,260 |
|
|
|
(54 |
) |
|
|
43,206 |
|
|
|
43,260 |
|
|
|
(393 |
) |
|
|
42,867 |
|
Subtotal (7) |
|
|
61,740 |
|
|
|
4 |
|
|
|
61,744 |
|
|
|
61,596 |
|
|
|
(421 |
) |
|
|
61,175 |
|
|
|
|
|
|
|
|
|
|
|
|
|
|
|
|
|
|
|
|
||||||
Investments in real estate from lending activities: |
|
|
|
|
|
|
|
|
|
|
|
|
|
|
|
|
|
|
||||||
Liabilities held for sale |
|
|
3,025 |
|
|
|
— |
|
|
|
3,025 |
|
|
|
3,025 |
|
|
|
— |
|
|
|
3,025 |
|
Total |
|
|
64,765 |
|
|
|
4 |
|
|
|
64,769 |
|
|
|
64,621 |
|
|
|
(421 |
) |
|
|
64,200 |
|
|
|
|
|
|
|
|
|
|
|
|
|
|
|
|
|
|
|
|
||||||
Total net investments in real estate and properties held for sale (8) |
|
$ |
168,947 |
|
|
|
|
|
$ |
161,858 |
|
|
$ |
143,505 |
|
|
|
|
|
$ |
138,876 |
|
||
55
Financing Receivables
The following tables show the activity in the allowance for credit losses for the six months ended June 30, 2023 and year ended December 31, 2022 (in thousands):
|
|
Six Months Ended June 30, 2023 |
|
|
Year Ended December 31, 2022 |
|
||
Allowance for credit losses at beginning of period |
|
$ |
18,803 |
|
|
$ |
8,805 |
|
Provision for credit losses |
|
|
7,796 |
|
|
|
12,295 |
|
Charge offs |
|
|
(948 |
) |
|
|
(2,297 |
) |
Allowance for credit losses at end of period |
|
$ |
25,651 |
|
|
$ |
18,803 |
|
During the three and six months ended June 30, 2023, we recorded provisions for expected credit losses of $2.7 million and $7.8 million, respectively, primarily attributable to the impact from the near-term macroeconomic outlook of the commercial real estate market, including: forecasted increases in short-term interest rates, continued expected declines in commercial real estate pricing and forecasted higher unemployment rates, partially offset by improvements in property-level cash flows.
In June 2023, we received the deed-in-lieu of foreclosure on an office loan in the East North Central region with a principal balance of $22.8 million which resulted in a charge off of $948,000 against the allowance for credit losses.
During the three months ended June 30, 2022, we recorded a provision for expected credit losses of approximately $524,000 primarily attributable to a decline in macroeconomic factors, offset by improvements in property-level cash flows. During the six months ended June 30, 2022, reversal of expected credit losses in the first quarter of 2022 outpaced the provision during the second quarter of 2022, resulting in a net reversal of $1.3 million in connection with resolutions of loans with specific reserves and continued improvements in property-level operations.
At June 30, 2023 and December 31, 2022, we individually evaluated the following loans:
Credit quality indicators
Commercial Real Estate Loans
CRE loans are collateralized by a diversified mix of real estate properties and are assessed for credit quality based on the collective evaluation of several factors, including but not limited to: collateral performance relative to underwritten plan, time since origination, current implied and/or re-underwritten loan-to-collateral value (“LTV”) ratios, loan structure and exit plan. Depending on the loan’s performance against these various factors, loans are rated on a scale from 1 to 5, with loans rated 1 representing loans with the highest credit quality and loans rated 5 representing loans with the lowest credit quality. Loans are rated a 2 at origination. The factors evaluated provide general criteria to monitor credit migration in our loan portfolio; as such, a loan’s rating may improve or worsen, depending on new information received.
56
The criteria set forth below should be used as general guidelines and, therefore, not every loan will have all of the characteristics described in each category below.
Risk Rating |
|
Risk Characteristics |
|
|
|
1 |
|
• Property performance has surpassed underwritten expectations. |
|
|
• Occupancy is stabilized, the property has had a history of consistently high occupancy, and the property has a diverse and high quality tenant mix. |
|
|
|
2 |
|
• Property performance is consistent with underwritten expectations and covenants and performance criteria are being met or exceeded. |
|
|
• Occupancy is stabilized, near stabilized or is on track with underwriting. |
|
|
|
3 |
|
• Property performance lags behind underwritten expectations. |
|
|
• Occupancy is not stabilized and the property has some tenancy rollover. |
|
|
|
4 |
|
• Property performance significantly lags behind underwritten expectations. Performance criteria and loan covenants have required occasional waivers. |
|
|
• Occupancy is not stabilized and the property has a large amount of tenancy rollover. |
|
|
|
5 |
|
• Property performance is significantly worse than underwritten expectations. The loan is not in compliance with loan covenants and performance criteria and may be in default. Expected sale proceeds would not be sufficient to pay off the loan at maturity. |
|
|
• The property has a material vacancy rate and significant rollover of remaining tenants. |
|
|
• An updated appraisal is required upon designation and updated on an as-needed basis. |
All CRE loans are evaluated for any credit deterioration by debt asset management and certain finance personnel on at least a quarterly basis. Mezzanine loans may experience greater credit risks due to their nature as subordinated investments.
For the purpose of calculating the quarterly provision for credit losses under CECL, we pool CRE loans based on the underlying collateral property type and utilize a probability of default and loss given default methodology for approximately one year after which we immediately revert to a historical mean loss ratio.
Credit risk profiles of CRE loans at amortized cost were as follows (in thousands, except amounts in the footnotes):
|
|
Rating 1 |
|
|
Rating 2 |
|
|
Rating 3 |
|
|
Rating 4 |
|
|
Rating 5 |
|
|
Total (1) |
|
||||||
At June 30, 2023: |
|
|
|
|
|
|
|
|
|
|
|
|
|
|
|
|
|
|
||||||
Whole loans, floating-rate |
|
$ |
— |
|
|
$ |
1,353,353 |
|
|
|
514,179 |
|
|
$ |
63,344 |
|
|
$ |
28,164 |
|
|
$ |
1,959,040 |
|
Mezzanine loan |
|
|
— |
|
|
|
— |
|
|
|
— |
|
|
|
— |
|
|
|
4,700 |
|
|
|
4,700 |
|
Total |
|
$ |
— |
|
|
$ |
1,353,353 |
|
|
$ |
514,179 |
|
|
$ |
63,344 |
|
|
$ |
32,864 |
|
|
$ |
1,963,740 |
|
|
|
|
|
|
|
|
|
|
|
|
|
|
|
|
|
|
|
|
||||||
|
|
|
|
|
|
|
|
|
|
|
|
|
|
|
|
|
|
|
||||||
At December 31, 2022: |
|
|
|
|
|
|
|
|
|
|
|
|
|
|
|
|
|
|
||||||
Whole loans, floating-rate |
|
$ |
— |
|
|
$ |
1,635,376 |
|
|
$ |
309,491 |
|
|
$ |
85,226 |
|
|
$ |
22,797 |
|
|
$ |
2,052,890 |
|
Mezzanine loan |
|
|
— |
|
|
|
— |
|
|
|
— |
|
|
|
— |
|
|
|
4,700 |
|
|
|
4,700 |
|
Total |
|
$ |
— |
|
|
$ |
1,635,376 |
|
|
$ |
309,491 |
|
|
$ |
85,226 |
|
|
$ |
27,497 |
|
|
$ |
2,057,590 |
|
57
Credit risk profiles of CRE loans by origination year at amortized cost were as follows (in thousands, except amounts in footnotes):
|
|
2023 |
|
|
2022 |
|
|
2021 |
|
|
2020 |
|
|
2019 |
|
|
Prior |
|
|
Total (1) |
|
|||||||
At June 30, 2023: |
|
|
|
|
|
|
|
|
|
|
|
|
|
|
|
|
|
|
|
|
|
|||||||
Whole loans, floating-rate: (2) |
|
|
|
|
|
|
|
|
|
|
|
|
|
|
|
|
|
|
|
|
|
|||||||
Rating 2 |
|
$ |
37,643 |
|
|
$ |
444,948 |
|
|
$ |
791,217 |
|
|
$ |
52,703 |
|
|
$ |
26,842 |
|
|
$ |
— |
|
|
$ |
1,353,353 |
|
Rating 3 |
|
|
— |
|
|
|
77,350 |
|
|
|
316,281 |
|
|
|
34,286 |
|
|
|
27,794 |
|
|
|
58,468 |
|
|
|
514,179 |
|
Rating 4 |
|
|
— |
|
|
|
19,348 |
|
|
|
43,996 |
|
|
|
— |
|
|
|
— |
|
|
|
— |
|
|
|
63,344 |
|
Rating 5 |
|
|
— |
|
|
|
— |
|
|
|
— |
|
|
|
— |
|
|
|
20,139 |
|
|
|
8,025 |
|
|
|
28,164 |
|
Total whole loans, floating-rate |
|
|
37,643 |
|
|
|
541,646 |
|
|
|
1,151,494 |
|
|
|
86,989 |
|
|
|
74,775 |
|
|
|
66,493 |
|
|
|
1,959,040 |
|
Mezzanine loan (rating 5) |
|
|
— |
|
|
|
— |
|
|
|
— |
|
|
|
— |
|
|
|
— |
|
|
|
4,700 |
|
|
|
4,700 |
|
Total |
|
$ |
37,643 |
|
|
$ |
541,646 |
|
|
$ |
1,151,494 |
|
|
$ |
86,989 |
|
|
$ |
74,775 |
|
|
$ |
71,193 |
|
|
$ |
1,963,740 |
|
|
|
|
|
|
|
|
|
|
|
|
|
|
|
|
|
|
|
|
|
|
|
|||||||
Current Period Gross Write-Offs |
|
$ |
— |
|
|
$ |
— |
|
|
$ |
— |
|
|
$ |
— |
|
|
$ |
(948 |
) |
|
$ |
— |
|
|
$ |
(948 |
) |
|
|
|
|
|
|
|
|
|
|
|
|
|
|
|
|
|
|
|
|
|
|
|||||||
|
|
2022 |
|
|
2021 |
|
|
2020 |
|
|
2019 |
|
|
2018 |
|
|
Prior |
|
|
Total (1) |
|
|||||||
At December 31, 2022: |
|
|
|
|
|
|
|
|
|
|
|
|
|
|
|
|
|
|
|
|
|
|||||||
Whole loans, floating-rate: (2) |
|
|
|
|
|
|
|
|
|
|
|
|
|
|
|
|
|
|
|
|
|
|||||||
Rating 2 |
|
$ |
526,606 |
|
|
$ |
1,003,060 |
|
|
$ |
64,944 |
|
|
$ |
26,977 |
|
|
$ |
13,789 |
|
|
$ |
— |
|
|
$ |
1,635,376 |
|
Rating 3 |
|
|
— |
|
|
|
192,490 |
|
|
|
44,657 |
|
|
|
27,881 |
|
|
|
44,463 |
|
|
|
— |
|
|
|
309,491 |
|
Rating 4 |
|
|
— |
|
|
|
— |
|
|
|
— |
|
|
|
20,742 |
|
|
|
64,484 |
|
|
|
— |
|
|
|
85,226 |
|
Rating 5 |
|
|
— |
|
|
|
— |
|
|
|
— |
|
|
|
22,797 |
|
|
|
— |
|
|
|
— |
|
|
|
22,797 |
|
Total whole loans, floating-rate |
|
|
526,606 |
|
|
|
1,195,550 |
|
|
|
109,601 |
|
|
|
98,397 |
|
|
|
122,736 |
|
|
|
— |
|
|
|
2,052,890 |
|
Mezzanine loan (rating 5) |
|
|
— |
|
|
|
— |
|
|
|
— |
|
|
|
— |
|
|
|
4,700 |
|
|
|
— |
|
|
|
4,700 |
|
Total |
|
$ |
526,606 |
|
|
$ |
1,195,550 |
|
|
$ |
109,601 |
|
|
$ |
98,397 |
|
|
$ |
127,436 |
|
|
$ |
— |
|
|
$ |
2,057,590 |
|
At both June 30, 2023 and December 31, 2022, we had one additional mezzanine loan included in other assets held for sale that had no carrying value.
58
Loan Portfolio Aging Analysis
The following table presents the CRE loan portfolio aging analysis as of the dates indicated for CRE loans at amortized cost (in thousands, except amounts in footnotes):
|
|
30-59 Days |
|
|
60-89 Days |
|
|
Greater than 90 |
|
|
Total Past Due |
|
|
Current (2) |
|
|
Total Loans Receivable (3) |
|
|
Total Loans > 90 Days and Accruing |
|
|||||||
At June 30, 2023: |
|
|
|
|
|
|
|
|
|
|
|
|
|
|
|
|
|
|
|
|
|
|||||||
Whole loans, floating-rate |
|
$ |
— |
|
|
$ |
— |
|
|
$ |
28,164 |
|
|
$ |
28,164 |
|
|
$ |
1,930,876 |
|
|
$ |
1,959,040 |
|
|
$ |
— |
|
Mezzanine loan (4) |
|
|
4,700 |
|
|
|
— |
|
|
|
— |
|
|
|
4,700 |
|
|
|
— |
|
|
|
4,700 |
|
|
|
— |
|
Total |
|
$ |
4,700 |
|
|
$ |
— |
|
|
$ |
28,164 |
|
|
$ |
32,864 |
|
|
$ |
1,930,876 |
|
|
$ |
1,963,740 |
|
|
$ |
— |
|
|
|
|
|
|
|
|
|
|
|
|
|
|
|
|
|
|
|
|
|
|
|
|||||||
At December 31, 2022: |
|
|
|
|
|
|
|
|
|
|
|
|
|
|
|
|
|
|
|
|
|
|||||||
Whole loans, floating-rate |
|
$ |
— |
|
|
$ |
— |
|
|
$ |
28,767 |
|
|
$ |
28,767 |
|
|
$ |
2,024,123 |
|
|
$ |
2,052,890 |
|
|
$ |
— |
|
Mezzanine loan (4) |
|
|
— |
|
|
|
— |
|
|
|
— |
|
|
|
— |
|
|
|
4,700 |
|
|
|
4,700 |
|
|
|
— |
|
Total |
|
$ |
— |
|
|
$ |
— |
|
|
$ |
28,767 |
|
|
$ |
28,767 |
|
|
$ |
2,028,823 |
|
|
$ |
2,057,590 |
|
|
$ |
— |
|
At June 30, 2023, we had two CRE whole loans, with total amortized costs of $28.2 million, and one mezzanine loan, with a total amortized cost of $4.7 million, in payment default. During the twelve months ended June 30, 2023, one of the CRE whole loans, with an amortized value of $20.1 million at June 30, 2023, had been extended three times due to the borrower experiencing financial difficulty. At June 30, 2022, this loan had an amortized cost of $21.8 million, which represented 1.0% of the total amortized cost of the portfolio.
During the six months ended June 30, 2023, we did not enter into any loan modifications for borrowers that are experiencing financial difficulty.
Restricted Cash
At June 30, 2023, we had restricted cash of $15.3 million, which consisted of $14.5 million of restricted cash held within our five consolidated securitization entities and $768,000 held in escrow for deposits or tax payments at our real estate properties. At December 31, 2022, we had restricted cash of $38.6 million, which consisted of $38.2 million held within our five consolidated securitization entities and $400,000 held in escrow for deposits or tax payments at our real estate properties or pledged with minimum reserve balance requirements. The decrease of $23.3 million was primarily attributable to reinvesting the proceeds in one of our securitizations prior to the end of the reinvestment period.
59
Accrued Interest Receivable
The following table summarizes our accrued interest receivable at June 30, 2023 and December 31, 2022 (in thousands):
|
|
June 30, 2023 |
|
|
December 31, 2022 |
|
|
Net Change |
|
|||
Accrued interest receivable from loans |
|
$ |
12,602 |
|
|
$ |
11,936 |
|
|
$ |
666 |
|
Accrued interest receivable from promissory note, escrow, sweep and reserve accounts |
|
|
13 |
|
|
|
33 |
|
|
|
(20 |
) |
Total |
|
$ |
12,615 |
|
|
$ |
11,969 |
|
|
$ |
646 |
|
The increase of $646,000 in accrued interest receivable was primarily attributable to rising benchmark rates.
Other Assets
The following table summarizes our other assets at June 30, 2023 and December 31, 2022 (in thousands):
|
|
June 30, 2023 |
|
|
December 31, 2022 |
|
|
Net Change |
|
|||
Tax receivables and prepaid taxes |
|
$ |
197 |
|
|
$ |
224 |
|
|
$ |
(27 |
) |
Other receivables |
|
|
355 |
|
|
|
1,086 |
|
|
|
(731 |
) |
Other prepaid expenses |
|
|
2,066 |
|
|
|
2,181 |
|
|
|
(115 |
) |
Fixed assets - non real estate |
|
|
328 |
|
|
|
326 |
|
|
|
2 |
|
Other assets, miscellaneous |
|
|
605 |
|
|
|
547 |
|
|
|
58 |
|
Total |
|
$ |
3,551 |
|
|
$ |
4,364 |
|
|
$ |
(813 |
) |
The decrease of $813,000 in other assets was primarily attributable to receivables held at our real estate properties and miscellaneous receivables from our real estate properties acquired in 2022 and 2023 offset by the purchase of other assets at our real estate properties.
Deferred Tax Assets
At June 30, 2023 and December 31, 2022, our net deferred tax asset was zero, resulting from a full valuation allowance of $21.0 million and $21.2 million, respectively, on our deferred tax asset as we believed it was more likely than not that some or all of the deferred tax assets would not be realized. We will continue to evaluate our ability to realize the tax benefits associated with deferred tax assets by analyzing forecasted taxable income using both historical and projected future operating results, the reversal of existing temporary differences, taxable income in prior carry back years (if permitted) and the availability of tax planning strategies.
Derivative Instruments
Historically, we sought to mitigate the potential impact on net income (loss) of adverse fluctuations in interest rates incurred on our borrowings by entering into hedging agreements. We classified our interest rate hedges as cash flow hedges, which are hedges that eliminate the risk of changes in the cash flows of a financial asset or liability.
We terminated interest rate swap positions associated with our prior financed CMBS portfolio in April 2020. At termination, we realized a loss of $11.8 million. At June 30, 2023 and December 31, 2022, we had a loss of $5.8 million and $6.6 million, respectively, recorded in accumulated other comprehensive loss, which will be amortized into earnings over the remaining life of the debt. During the three and six months ended June 30, 2023, we recorded amortization expense of $420,000 and $835,000, respectively, reported in interest expense on the consolidated statements of operations. During the three and six months ended June 30, 2022, we recorded amortization expense of $484,000 and $963,000, respectively, reported in interest expense on the consolidated statements of operations.
60
At June 30, 2023 and December 31, 2022, we had unrealized gains of $210,000 and $256,000, respectively, attributable to two terminated interest rate swaps, in accumulated other comprehensive loss on the consolidated balance sheets, to be accreted into earnings over the remaining life of the debt. During both the three months ended June 30, 2023 and 2022, we recorded accretion income, reported in interest expense on the consolidated statements of operations, of $23,000, to accrete the accumulated other comprehensive income on the terminated swap agreements. During both the six months ended June 30, 2023 and 2022, we recorded accretion income, reported in interest expense on the consolidated statements of operations, of $45,000, to accrete the accumulated other comprehensive income on the terminated swap agreements.
The following tables present the effect of derivative instruments on our consolidated statements of operations for the six months ended June 30, 2023 and 2022 (in thousands):
|
|
|
|
Realized and Unrealized Gain (Loss) (1) |
|
|||||
|
|
Consolidated Statements of Operations Location |
|
Six Months Ended June 30, 2023 |
|
|
Six Months Ended June 30, 2022 |
|
||
Interest rate swap contracts, hedging |
|
Interest expense |
|
$ |
(790 |
) |
|
$ |
(917 |
) |
Financing Arrangements
Borrowings under our senior secured financing facility, term warehouse financing facilities, mortgage payable and construction loans are guaranteed by us or one or more of our subsidiaries. The following table sets forth certain information with respect to our financing arrangements (dollars in thousands, except amounts in footnotes):
|
|
June 30, 2023 |
|
December 31, 2022 |
||||||||||||||||||||||||
|
|
Outstanding Borrowings |
|
|
Value of Collateral |
|
|
Number of Positions as Collateral |
|
|
Weighted Average Interest Rate |
|
Outstanding Borrowings |
|
|
Value of Collateral |
|
|
Number of Positions as Collateral |
|
|
Weighted Average Interest Rate |
||||||
Senior Secured Financing Facility |
|
|
|
|
|
|
|
|
|
|
|
|
|
|
|
|
|
|
|
|
|
|
||||||
Massachusetts Mutual Life Insurance Company (1) |
|
$ |
47,697 |
|
|
$ |
152,272 |
|
|
|
7 |
|
|
8.87% |
|
$ |
87,890 |
|
|
$ |
196,837 |
|
|
|
8 |
|
|
7.94% |
|
|
|
|
|
|
|
|
|
|
|
|
|
|
|
|
|
|
|
|
|
|
|
||||||
CRE - Term Warehouse Financing Facilities (2) |
|
|
|
|
|
|
|
|
|
|
|
|
|
|
|
|
|
|
|
|
|
|
||||||
JPMorgan Chase Bank, N.A. (3) |
|
|
118,569 |
|
|
|
185,862 |
|
|
|
8 |
|
|
7.73% |
|
|
186,783 |
|
|
|
255,095 |
|
|
|
11 |
|
|
6.74% |
Morgan Stanley Mortgage Capital Holdings LLC (4) |
|
|
132,693 |
|
|
|
191,346 |
|
|
|
9 |
|
|
7.81% |
|
|
141,505 |
|
|
|
198,455 |
|
|
|
10 |
|
|
7.00% |
|
|
|
|
|
|
|
|
|
|
|
|
|
|
|
|
|
|
|
|
|
|
|
||||||
Mortgage Payable |
|
|
|
|
|
|
|
|
|
|
|
|
|
|
|
|
|
|
|
|
|
|
||||||
Readycap Commercial, LLC (5) |
|
|
18,492 |
|
|
|
25,400 |
|
|
|
1 |
|
|
8.95% |
|
|
18,244 |
|
|
|
25,400 |
|
|
|
1 |
|
|
8.08% |
|
|
|
|
|
|
|
|
|
|
|
|
|
|
|
|
|
|
|
|
|
|
|
||||||
Construction Loans |
|
|
|
|
|
|
|
|
|
|
|
|
|
|
|
|
|
|
|
|
|
|
||||||
Oceanview Life and Annuity Company (6) |
|
|
(1,922 |
) |
|
N/A |
|
|
N/A |
|
|
—% |
|
|
— |
|
|
|
— |
|
|
|
— |
|
|
—% |
||
Total |
|
$ |
315,529 |
|
|
$ |
554,880 |
|
|
|
|
|
|
|
$ |
434,422 |
|
|
$ |
675,787 |
|
|
|
|
|
|
||
We were in compliance with all covenants in the respective agreements at June 30, 2023 and December 31, 2022.
61
Senior Secured Financing Facility
In July 2020, an indirect, wholly-owned subsidiary of ours (“Holdings”), along with its direct wholly-owned subsidiary (the “Borrower”), entered into a $250.0 million loan and servicing agreement (the “MassMutual Loan Agreement”) with Massachusetts Mutual Life Insurance Company (“MassMutual”) and the other lenders party thereto (the “Lenders”) to form an asset-based revolving loan facility ("MassMutual Facility") to finance our core CRE lending business. The MassMutual Facility initially had an interest rate of 5.75% per annum payable monthly and initially matured on July 31, 2027.
In December 2022, Holdings, the Borrower and the Lenders entered into an Amended and Restated Loan and Servicing Agreement, which amends and restates the MassMutual Loan Agreement, and reflects a senior secured term loan facility, not to exceed $500.0 million, composed of individual loan series issued upon mutual agreement of the Borrower and Lenders. Each loan series will be available for three months after the closing date agreed upon by the Borrower and Lender (“Commitment Period”), subject to the maximum dollar amount agreed upon for that series. The Commitment Period is subject to immediate termination upon the occurrence of an event of default. Each loan series will have a final maturity of five years from the issuance date for the loan series unless an additional time is mutually agreed upon by the Lenders and Borrower. The advance rate on portfolio assets will be mutually agreed upon by the Lenders and Borrower. Each loan series will have its own mutually agreed upon interest rate equal to one-month Term SOFR plus the applicable spread.
CRE - Term Warehouse Financing Facilities
In April 2018, an indirect, wholly-owned subsidiary of ours entered into a master repurchase agreement (the “Barclays Facility”) with Barclays Bank PLC (“Barclays”) to finance the origination of CRE loans. In February 2022, such subsidiary entered into the Third Amendment to Master Repurchase Agreement (the “Barclays Amendment”) with Barclays, which amended the Barclays Facility to add market terms regarding the replacement of LIBOR upon determination of a benchmark transition event. In October 2022, the Barclays Facility matured.
In October 2018, an indirect, wholly-owned subsidiary of ours entered into a master repurchase agreement (the “JPMorgan Chase Facility”) with JP Morgan Chase to finance the origination of CRE loans. At June 30, 2023, this facility has been amended five times to amend various terms. The JPMorgan Chase Facility has a maximum facility amount of $250.0 million, charges interest of one-month benchmark plus market spreads and had an initial maturity date of October 2024. In July 2023, this facility was amended to extend the maturity date to July 2026, as well as to extend the amendments to (i) EBITDA to interest expense ratio, (ii) maximum ratio of total indebtedness to its total equity and (iii) minimum unencumbered liquidity requirement, each through December 2024.
In November 2021, an indirect, wholly-owned subsidiary of ours entered into a master repurchase and securities contract agreement (the “Morgan Stanley Facility”) with Morgan Stanley Mortgage Capital Holdings LLC (“Morgan Stanley”) to finance the origination of CRE loans. At June 30, 2023, this facility has been amended two times to amend various terms. The Morgan Stanley Facility has a maximum facility amount of $250.0 million, charges interest of one-month Term SOFR plus market spreads and matures in November 2024. We also have the right to request a one-year extension.
Mortgage Payable
In April 2022, Chapel Drive West, LLC, a wholly owned subsidiary of Charles Street – ACRES FSU Student Venture, LLC entered into a Loan Agreement (the “Mortgage”) with Readycap Commercial, LLC (“Readycap”) to finance the acquisition of a student housing complex. The Mortgage is interest only and has a maximum principal balance of $20.4 million, of which, $18.7 million was advanced in the initial funding. The Mortgage charges interest of one-month Term SOFR plus a spread of 3.80% and matures in April 2025, subject to two one-year extension options.
The Mortgage contains events of default, subject to certain materiality thresholds and grace periods, customary for this type of financing arrangement. The remedies for such events of default are also customary for this type of transaction.
Construction Loans
In January 2023, Chapel Drive East, LLC, a wholly owned subsidiary of the FSU Student Venture, entered into a loan agreement (the "Construction Loan Agreement") with Oceanview Life and Annuity Company ("Oceanview") to finance the construction of a student housing complex (the "Construction Loan"). The Construction Loan is interest only and has a maximum principal balance of $48.0 million. The Construction Loan charges one-month Term SOFR plus a spread of 6.00% and matures in February 2025, subject to three one-year extension options.
62
In addition to the Construction Loan, Chapel Drive East, LLC, entered into a financing agreement with Florida Pace Funding Agency to fund energy efficient building improvements and has a maximum principal balance of $15.5 million. This agreement charges fixed interest of 7.26% and matures in July 2053. We do not guarantee this financing agreement.
In connection with our investment in the student housing complex, ACRES RF entered into guarantees related to the Construction Loan. Pursuant to the guarantees, Jason Pollack, Frank Dellaglio and ACRES RF (collectively, the "Guarantors"), for the benefit of Oceanview, provided limited "bad boy" guaranties to Oceanview pursuant to the Construction Loan Agreement until the earlier of the payment in full of the indebtedness or the date of a sale of the property pursuant to a foreclosure of the mortgage or deed or other transfer in lieu of foreclosure is accepted by Oceanview. The Guarantors also entered into a Completion Guaranty Agreement for the benefit of Oceanview to guaranty the timely completion of the project in accordance with the Construction Loan Agreement, as well as a Carry Guaranty Agreement, for the benefit of Oceanview to guaranty and unconditional payment by Chapel Drive East, LLC of all customary or necessary costs and expenses incurred in connection with the operation, maintenance and management of the property and an Environmental Indemnity Agreement jointly and severally in favor of Oceanview whereby the Guarantors serving as Indemnitors provided environmental representations and warranties, covenants and indemnifications (collectively the "Guaranties"). The Guaranties include certain financial covenants required of ACRES RF, including required net worth and liquidity requirements.
Securitizations
At June 30, 2023, we retained equity in two CRE loan securitizations that we executed, as follows:
ACR 2021-FL1
In May 2021, we closed ACR 2021-FL1, an $802.6 million CRE debt securitization transaction that provided financing for CRE loans. ACR 2021-FL1 included a reinvestment period, which ended in May 2023, that allowed it to acquire CRE loans for reinvestment into the securitization using uninvested principal proceeds. ACR 2021-FL1 issued a total of $675.2 million of non-recourse, floating-rate notes to third parties at par. We retained 100% of the Class F and Class G notes in addition to 100% of the outstanding preference shares. The preference shares are subordinated in right of payment to all other securities issued by ACR 2021-FL1. All notes issued mature in June 2036, although we have the right to call the notes beginning on the payment date in May 2023 and thereafter. The non-recourse, floating-rate notes initially charged one-month Term LIBOR, but converted to one-month Term SOFR in June 2023.
ACR 2021-FL2
In December 2021, we closed ACR 2021-FL2, a CRE debt securitization transaction that can finance up to $700.0 million of CRE loans. ACR 2021-FL2 includes a reinvestment period, which ends in December 2023, that allows it to acquire CRE loans for reinvestment into the securitization using uninvested principal proceeds. The reinvestment period included a 180-day ramp-up acquisition period that allowed it to acquire CRE loans using unused proceeds from the issuance of the non-recourse floating-rate notes. ACR 2021-FL2 issued a total of $567.0 million of non-recourse, floating-rate notes to third parties at par. We retained 100% of the Class F and Class G notes in addition to 100% of the outstanding preference shares. The preference shares are subordinated in right of payment to all other securities issued by ACR 2021-FL2. All notes issued mature in January 2037, although we have the right to call the notes beginning on the payment date in December 2023 and thereafter. The non-recourse, floating-rate notes initially charged one-month Term LIBOR, but converted to one-month Term SOFR in June 2023.
Corporate Debt
4.50% Convertible Senior Notes
We issued $143.8 million aggregate principal of our 4.50% Convertible Senior Notes in August 2017, of which $55.8 million was repurchased in 2021.
In February 2022, we repurchased $39.8 million of our 4.50% Convertible Senior Notes, resulting in a charge to earnings of $574,000, comprising an extinguishment of debt charge of $460,000 in connection with the acceleration of the market discount and interest expense of $114,000 in connection with the acceleration of deferred debt issuance costs. In August 2022, the remaining $48.2 million of the 4.50% Convertible Senior Notes were paid off upon maturity at par.
5.75% Senior Unsecured Notes Due 2026
On August 16, 2021, we issued $150.0 million of our 5.75% senior unsecured notes due 2026 (the “5.75% Senior Unsecured Notes”) pursuant to our Indenture, dated August 16, 2021 (the “Base Indenture”), between Wells Fargo, now Computershare Trust Company, N.A. (“CTC”), as trustee (the “Trustee”), and us as supplemented by the First Supplemental Indenture, dated August 16, 2021, between Wells Fargo, now CTC, and us (the “Supplemental Indenture” and, together with the Base Indenture, the “Indenture”).
63
Prior to May 15, 2026, we may at our option redeem the 5.75% Senior Unsecured Notes, in whole or in part, at a redemption price equal to the sum of (i) 100% of the principal amount of the notes to be redeemed, plus accrued and unpaid interest to, but not including, the redemption date, and (ii) a make-whole premium.
Unsecured Junior Subordinated Debentures
During 2006, we formed RCT I and RCT II for the sole purpose of issuing and selling capital securities representing preferred beneficial interests. RCT I and RCT II are not consolidated into our consolidated financial statements because we are not deemed to be the primary beneficiary of these entities. In connection with the issuance and sale of the capital securities, we issued junior subordinated debentures to RCT I and RCT II of $25.8 million each, representing our maximum exposure to loss. The debt issuance costs associated with the junior subordinated debentures for RCT I and RCT II were included in borrowings and were amortized into interest expense on the consolidated statements of operations using the effective yield method over a ten year period.
There were no unamortized debt issuance costs associated with the junior subordinated debentures for RCT I and RCT II outstanding at June 30, 2023 and December 31, 2022. The interest rates for RCT I and RCT II, at June 30, 2023, were 9.49% and 9.25%, respectively. The interest rates for RCT I and RCT II, at December 31, 2022, were 8.68% and 8.36%, respectively.
Equity
Total equity at June 30, 2023 was $444.0 million and gave effect to $5.6 million of net unrealized losses on our terminated cash flow hedges, shown as a component of accumulated other comprehensive loss. Equity at December 31, 2022 was $441.3 million and gave effect to $6.4 million of net unrealized losses on our terminated cash flow hedges, shown as a component of accumulated other comprehensive loss. The increase in stockholders’ equity during the six months ended June 30, 2023 was primarily attributable to contributions from non-controlling interests, partially offset by distributions on our preferred stock in excess of earnings as well as common stock repurchases.
Balance Sheet - Book Value Reconciliation
The following table rolls forward our common stock book value for the three and six months ended June 30, 2023 (in thousands, except per share data and amounts in footnotes):
|
|
Three Months Ended June 30, 2023 |
|
|
Six Months Ended June 30, 2023 |
|
||||||||||
|
|
Total Amount |
|
|
Per Share Amount |
|
|
Total Amount |
|
|
Per Share Amount |
|
||||
Common stock book value at beginning of period (1) |
|
$ |
207,263 |
|
|
$ |
24.51 |
|
|
$ |
208,976 |
|
|
$ |
24.54 |
|
Net income (loss) allocable to common shares (2) |
|
|
817 |
|
|
|
0.10 |
|
|
|
(1,599 |
) |
|
|
(0.19 |
) |
Change in other comprehensive income on derivatives |
|
|
397 |
|
|
|
0.05 |
|
|
|
790 |
|
|
|
0.09 |
|
Repurchase of common stock (3) |
|
|
(1,200 |
) |
|
|
0.25 |
|
|
|
(1,955 |
) |
|
|
0.40 |
|
Net impact to equity of share-based compensation |
|
|
783 |
|
|
|
(0.41 |
) |
|
|
1,848 |
|
|
|
(0.34 |
) |
Total net increase (decrease) |
|
|
797 |
|
|
|
(0.01 |
) |
|
|
(916 |
) |
|
|
(0.04 |
) |
Common stock book value at end of period (4) |
|
$ |
208,060 |
|
|
$ |
24.50 |
|
|
$ |
208,060 |
|
|
$ |
24.50 |
|
|
|
|
|
|
|
|
|
|
|
|
|
|
||||
Management Agreement Equity
Our monthly base management fee, as defined in our Management Agreement, is equal to 1/12 of the amount of our equity multiplied by 1.50% and is calculated and paid monthly in arrears.
64
The following table summarizes the calculation of equity, as defined in the Management Agreement (in thousands):
|
|
Amount |
|
|
At June 30, 2023: |
|
|
|
|
Proceeds from capital stock issuances, net (1) |
|
$ |
1,330,472 |
|
Retained earnings, net (2) |
|
|
(651,502 |
) |
Payments for repurchases of capital stock |
|
|
(241,631 |
) |
Total |
|
$ |
437,339 |
|
Earnings Available for Distribution
Earnings Available for Distribution (“EAD”) is a non-GAAP financial measure intended to supplement our financial results computed in accordance with accounting principles generally accepted in the United States of America (“GAAP”), and we believe EAD will serve as a useful indicator for investors in evaluating our performance and ability to pay dividends.
EAD excludes the effects of certain transactions and adjustments in accordance with GAAP that we believe are not necessarily indicative of our current CRE loan portfolio and other CRE-related investments and operations. EAD excludes income (loss) from all non-core assets such as commercial finance, middle market lending, residential mortgage lending, certain legacy CRE loans and other non-CRE assets designated as assets held for sale at the initial measurement date of December 31, 2016.
EAD, for reporting purposes, is defined as GAAP net income (loss) allocable to common shares, excluding (i) non-cash equity compensation expense, (ii) unrealized gains and losses, (iii) non-cash provisions for credit losses, (iv) non-cash impairments on securities, (v) non-cash amortization of discounts or premiums associated with borrowings, (vi) net income or loss from a limited partnership interest owned at the initial measurement date, (vii) net income or loss from non-core assets, (viii) real estate depreciation and amortization, (ix) foreign currency gains or losses and (x) income or loss from discontinued operations. EAD may also be adjusted periodically to exclude certain one-time events pursuant to changes in GAAP and certain non-cash items.
Although pursuant to the Management Agreement we calculate incentive compensation using EAD that excludes incentive compensation payable to our Manager, we include incentive compensation payable to our Manager in calculating EAD for reporting purposes.
65
The following table provides a reconciliation from GAAP net income (loss) allocable to common shares to EAD allocable to common shares for the periods presented (in thousands, except per share data and amounts in the footnotes):
|
|
For the Three Months Ended June 30, |
|
|
For the Six Months Ended June 30, |
|
||||||||||||||||||||||||||
|
|
2023 |
|
|
Per Share |
|
|
2022 |
|
|
Per Share |
|
|
2023 |
|
|
Per Share |
|
|
2022 |
|
|
Per Share |
|
||||||||
Net income (loss) allocable to common shares - GAAP |
|
$ |
817 |
|
|
$ |
0.10 |
|
|
$ |
690 |
|
|
$ |
0.08 |
|
|
$ |
(1,599 |
) |
|
$ |
(0.19 |
) |
|
$ |
(2,081 |
) |
|
$ |
(0.23 |
) |
|
|
|
|
|
|
|
|
|
|
|
|
|
|
|
|
|
|
|
|
|
|
|
|
|
||||||||
Reconciling items from continuing operations: |
|
|
|
|
|
|
|
|
|
|
|
|
|
|
|
|
|
|
|
|
|
|
|
|
||||||||
Non-cash equity compensation expense |
|
|
719 |
|
|
|
0.08 |
|
|
|
991 |
|
|
|
0.11 |
|
|
|
1,613 |
|
|
|
0.19 |
|
|
|
1,735 |
|
|
|
0.19 |
|
Non-cash provision for (reversal of) CRE credit losses |
|
|
2,700 |
|
|
|
0.31 |
|
|
|
524 |
|
|
|
0.06 |
|
|
|
7,796 |
|
|
|
0.90 |
|
|
|
(1,278 |
) |
|
|
(0.14 |
) |
Real estate depreciation and amortization |
|
|
946 |
|
|
|
0.11 |
|
|
|
1,564 |
|
|
|
0.18 |
|
|
|
1,900 |
|
|
|
0.22 |
|
|
|
2,955 |
|
|
|
0.32 |
|
Non-cash amortization of discounts or premiums associated with borrowings |
|
|
— |
|
|
|
— |
|
|
|
280 |
|
|
|
0.03 |
|
|
|
— |
|
|
|
— |
|
|
|
1,126 |
|
|
|
0.13 |
|
Net income from non-core assets (1) |
|
|
(26 |
) |
|
|
— |
|
|
|
(76 |
) |
|
|
(0.01 |
) |
|
|
(52 |
) |
|
|
— |
|
|
|
(730 |
) |
|
|
(0.08 |
) |
|
|
|
|
|
|
|
|
|
|
|
|
|
|
|
|
|
|
|
|
|
|
|
|
|
||||||||
Reconciling items from CRE assets: |
|
|
|
|
|
|
|
|
|
|
|
|
|
|
|
|
|
|
|
|
|
|
|
|
||||||||
Net interest income on legacy CRE assets (1) |
|
|
— |
|
|
|
— |
|
|
|
— |
|
|
|
— |
|
|
|
— |
|
|
|
— |
|
|
|
(29 |
) |
|
|
— |
|
Earnings Available for Distribution allocable to common shares |
|
$ |
5,156 |
|
|
$ |
0.60 |
|
|
$ |
3,973 |
|
|
$ |
0.45 |
|
|
$ |
9,658 |
|
|
$ |
1.12 |
|
|
$ |
1,698 |
|
|
$ |
0.19 |
|
|
|
|
|
|
|
|
|
|
|
|
|
|
|
|
|
|
|
|
|
|
|
|
|
|
||||||||
Weighted average common shares - diluted on Earnings Available for Distribution allocable to common shares |
|
|
8,535 |
|
|
|
|
|
|
8,914 |
|
|
|
|
|
|
8,618 |
|
|
|
|
|
|
8,992 |
|
|
|
|
||||
|
|
|
|
|
|
|
|
|
|
|
|
|
|
|
|
|
|
|
|
|
|
|
|
|
||||||||
Earnings Available for Distribution per common share - diluted |
|
$ |
0.60 |
|
|
|
|
|
$ |
0.45 |
|
|
|
|
|
$ |
1.12 |
|
|
|
|
|
$ |
0.19 |
|
|
|
|
||||
For the three and six months ended June 30, 2023, EAD in accordance with the Management Agreement, which excludes incentive compensation payable, was $5.4 million and $10.0 million, respectively, or $0.63 and $1.17, respectively, per common share outstanding. Incentive compensation payable was $255,000 and $384,000 for the three and six months ended June 30, 2023, respectively.
Incentive Compensation Hurdle
Prior to the quarter ended December 31, 2022, in accordance with the Management Agreement, incentive compensation was earned by our Manager when our EAD (as defined in the Management Agreement) for such quarter exceeded an amount equal to: (1) the weighted average of (a) book value (as defined in the Management Agreement) as of the end of such quarter divided by 10,293,783 shares and (b) the price per share (including the conversion price, if applicable) paid for common shares in each offering (or issuance, upon the conversion of convertible securities) by us subsequent to September 30, 2017, in each case at the time of issuance, multiplied by (2) the greater of (a) 1.75% and (b) 0.4375% plus one-fourth of the ten year treasury rate, as defined in the Management Agreement, for such quarter (the “Incentive Compensation Hurdle”).
Commencing with the quarter ended December 31, 2022, incentive compensation was calculated and payable in arrears in an amount, not less than zero, equal to:
66
The following table summarizes the calculation of the Incentive Compensation Hurdle for the three months ended June 30, 2023 (dollars in thousands, except per share data):
Book Value Equity |
|
Amount |
|
|
Stockholders' equity less equity attributable to any outstanding preferred stock at September 30, 2022 |
|
$ |
216,026 |
|
Cumulative EAD from and after October 1, 2022 to the end of the most recently completed calendar quarter |
|
|
15,601 |
|
Amount paid to repurchase common stock after October 1, 2022 |
|
|
(2,889 |
) |
Incentive Compensation paid after October 1, 2022 |
|
|
(469 |
) |
Book value equity at June 30, 2023 |
|
$ |
228,269 |
|
Incentive Compensation Hurdle (1) |
|
$ |
11,984 |
|
|
|
|
|
|
Average closing price of 30 day period ending three days prior to issuance date |
|
$ |
8.95 |
|
The amount by which EAD (as defined in the Management Agreement) for the calendar quarters following September 30, 2022 exceeds the Incentive Compensation Hurdle is multiplied by 20% to arrive at incentive compensation for the quarter.
Liquidity and Capital Resources
Liquidity is a measurement of our ability to meet potential cash requirements, including ongoing commitments to pay dividends, fund investments, repay borrowings and provide for other general business needs, including payment of our base management fee and incentive compensation. Our ability to meet our on-going liquidity needs is subject to our ability to generate cash from operating activities, which was $24.5 million for the six months ended June 30, 2023, and our ability to maintain and/or obtain additional debt financing and equity capital together with the funds referred to below.
During the six months ended June 30, 2023, our principal sources of liquidity were: (i) gross proceeds of $95.0 million from CRE whole loan purchases by our managed CRE securitization ACR 2021-FL1, (ii) net proceeds of $30.6 million from repayments on our CRE portfolio, (iii) gross proceeds of $14.3 million from the sale of a real estate property, (iv) proceeds of $12.3 million from the purchase of loan advances by our managed CRE securitizations ACR 2021-FL1 and ACR 2021-FL2 and, (v) gross proceeds of $12.1 million from our CRE - term financing facilities. These sources of liquidity were offset by our paydowns on our senior secured and term warehouse facilities, deployments in CRE whole loans and real estate investments, repurchases of common stock, distributions on our preferred stock and ongoing operating expenses and substantially resulted in the $57.1 million of unrestricted cash we held at June 30, 2023.
The outstanding balance of our loan to ACRES Capital Corp., the parent of our Manager, was $11.1 million and $11.3 million at June 30, 2023 and December 31, 2022, respectively. The note bears interest at 3.00% per annum, payable monthly, and matures in July 2026, subject to two one-year extensions, at ACRES Capital Corp.’s option, and amortizes at a rate of $25,000 per month.
67
We utilize a variety of financing arrangements to finance certain assets. We generally utilize the following five types of financing arrangements:
The issuances of ACR 2021-FL1 and ACR 2021-FL2 included 24-month reinvestment periods ending in May 2023 and December 2023, respectively, that allowed us to reinvest CRE loan payoffs and paydowns into the securitizations upon the satisfaction of certain eligibility and reinvestment criteria along with rating agency approval. The reinvestment features of the securitizations allowed us to extend the securitizations’ financing capabilities at attractive weighted-average rates by increasing the useful lives of the senior notes through the reinvestment of loan proceeds into new loans. We were also able to acquire future funding participations of the collateral in the securitizations during the reinvestment period.
We were in compliance with all of our covenants at June 30, 2023 in accordance with the terms provided in agreements with our lenders.
68
At June 30, 2023, we had a senior secured financing facility, term warehouse financing facilities, mortgage payable and construction loans as summarized below (in thousands, except amounts in footnotes):
|
|
Execution Date |
|
Maturity Date |
|
Maximum Capacity |
|
|
Facility Principal |
|
|
Availability |
|
|||
Senior Secured Financing Facility (1) |
|
|
|
|
|
|
|
|
|
|
|
|
|
|||
Massachusetts Mutual Life Insurance Company |
|
July 2020 |
|
December 2027 |
|
$ |
500,000 |
|
|
$ |
50,995 |
|
|
$ |
449,005 |
|
CRE - Term Warehouse Financing Facilities (2) |
|
|
|
|
|
|
|
|
|
|
|
|
|
|||
JPMorgan Chase Bank, N.A. |
|
October 2018 |
|
October 2024 |
|
|
250,000 |
|
|
|
119,021 |
|
|
|
130,979 |
|
Morgan Stanley Mortgage Capital Holdings LLC |
|
November 2021 |
|
November 2024 |
|
|
250,000 |
|
|
|
133,437 |
|
|
|
116,563 |
|
Mortgage Payable (3) |
|
|
|
|
|
|
|
|
|
|
|
|
|
|||
Readycap Commercial, LLC |
|
April 2022 |
|
April 2025 |
|
|
20,375 |
|
|
|
18,854 |
|
|
|
1,521 |
|
Construction Loans (4) |
|
|
|
|
|
|
|
|
|
|
|
|
|
|||
Oceanview Life and Annuity Company |
|
January 2023 |
|
February 2025 |
|
|
48,000 |
|
|
|
— |
|
|
|
48,000 |
|
Florida Pace Funding Agency |
|
January 2023 |
|
January 2053 |
|
|
15,500 |
|
|
|
— |
|
|
|
15,500 |
|
Total |
|
|
|
|
|
|
|
|
$ |
322,307 |
|
|
|
|
||
The following table summarizes the average principal outstanding during the three months ended June 30, 2023 and December 31, 2022 and the principal outstanding on our financing arrangements at June 30, 2023 and December 31, 2022 (in thousands, except amounts in footnotes):
|
|
Three Months Ended June 30, 2023 |
|
|
June 30, 2023 |
|
|
Three Months Ended December 31, 2022 |
|
|
December 31, 2022 |
|
||||
|
|
Average Principal Outstanding |
|
|
Principal Outstanding (1)(2) |
|
|
Average Principal Outstanding |
|
|
Principal Outstanding (1)(2) |
|
||||
Financing Arrangement |
|
|
|
|
|
|
|
|
|
|
|
|
||||
Senior secured financing facility |
|
$ |
53,054 |
|
|
$ |
50,995 |
|
|
$ |
88,795 |
|
|
$ |
91,549 |
|
Term warehouse financing facilities - CRE loans |
|
|
273,931 |
|
|
|
252,458 |
|
|
|
359,829 |
|
|
|
329,955 |
|
Total |
|
$ |
326,985 |
|
|
$ |
303,453 |
|
|
$ |
448,624 |
|
|
$ |
421,504 |
|
69
The following table summarizes the maximum month-end principal outstanding on our financing arrangements during the periods presented (in thousands):
|
|
Maximum Month-End Principal Outstanding During the |
|
|||||
|
|
Six Months Ended June 30, 2023 |
|
|
Year Ended December 31, 2022 |
|
||
Financing Arrangement |
|
|
|
|
|
|
||
Senior secured financing facility |
|
$ |
63,314 |
|
|
$ |
94,549 |
|
Term warehouse financing facilities - CRE loans |
|
|
333,834 |
|
|
|
392,716 |
|
Historically, we have financed the acquisition of our investments through collateralized debt obligations ("CDO") and securitizations that essentially match the maturity and repricing dates of these financing vehicles with the maturities and repricing dates of our investments. In the past, we have derived substantial operating cash from our equity investments in our CDOs and securitizations, which will cease if the CDOs and securitizations fail to meet certain tests. Through June 30, 2023, we did not experience difficulty in maintaining our existing CDO and securitization financing and passed all of the critical tests required by these financings.
The following table sets forth the distributions received by us and coverage test summaries for our active securitizations for the periods presented (in thousands, except amount in the footnotes):
|
|
Cash Distributions |
|
|
Overcollateralization Cushion (1) |
|
|
Annualized Interest Coverage Cushion (2)(3) |
|
|
|
|||||||||||
Name |
|
For the Six Months Ended June 30, 2023 |
|
|
For the Year Ended December 31, 2022 |
|
|
At June 30, 2023 |
|
|
At the Initial Measurement Date |
|
|
At June 30, 2023 |
|
|
Reinvestment Period End (4) |
|||||
ACR 2021-FL1 |
|
$ |
12,310 |
|
|
$ |
21,141 |
|
|
$ |
6,961 |
|
|
$ |
6,758 |
|
|
$ |
20,922 |
|
|
May 2023 |
ACR 2021-FL2 |
|
|
9,541 |
|
|
|
14,537 |
|
|
|
5,652 |
|
|
|
5,652 |
|
|
|
15,437 |
|
|
December 2023 |
The following table sets forth the distributions received by us and liquidation details for our liquidated securitizations for the periods presented (in thousands):
|
|
Cash Distributions |
|
|
Liquidation Details |
|
||||||||
Name |
|
For the Six Months Ended June 30, 2023 |
|
|
For the Year Ended December 31, |
|
|
Liquidation Date |
|
Remaining Assets at the Liquidation Date (1) |
|
|||
XAN 2020-RSO9 (2) |
|
$ |
— |
|
|
$ |
14,308 |
|
|
February 2022 |
|
$ |
111,335 |
|
XAN 2020-RSO8 |
|
|
— |
|
|
|
1,628 |
|
|
March 2022 |
|
|
171,225 |
|
At June 30, 2023, our liquidity consisted of $57.1 million of unrestricted cash and cash equivalents, $14.0 million of reinvestment cash at our CRE securitizations and $20.1 million of unlevered financeable CRE loans.
Our leverage ratio, defined as the ratio of borrowings to total equity, may vary as a result of the various funding strategies we use. At June 30, 2023 and December 31, 2022, our leverage ratio was 3.9 and 4.2 times, respectively. The leverage ratio decreased during the period due to the net decrease in borrowings in combination with a net increase to total equity.
70
Net Operating Losses and Loss Carryforwards
The following table sets forth the net operating losses and loss carryforwards for the periods presented (in millions):
|
|
Tax Year Recognized |
|
REIT (QRS) Tax Loss Carryforwards |
|
|
TRS Tax Loss Carryforwards |
|
||||||||||
Tax Asset Item |
|
|
|
Operating |
|
|
Capital |
|
|
Operating |
|
|
Capital |
|
||||
Net Operating Loss Carryforwards: |
|
|
|
|
|
|
|
|
|
|
|
|
|
|
||||
Cumulative as of 2021 |
|
2021 Return |
|
$ |
46.6 |
|
|
$ |
— |
|
|
$ |
60.1 |
|
|
$ |
— |
|
Estimated - realized in 2023 |
|
2022 Return |
|
|
— |
|
|
|
— |
|
|
|
0.1 |
|
|
|
— |
|
Estimated - generated in 2023 |
|
2023 Return |
|
|
— |
|
|
|
— |
|
|
|
0.8 |
|
|
|
— |
|
|
|
|
|
|
|
|
|
|
|
|
|
|
|
|
||||
Net Capital Loss Carryforwards: |
|
|
|
|
|
|
|
|
|
|
|
|
|
|
||||
Cumulative as of 2021 |
|
2021 Return |
|
|
— |
|
|
|
121.9 |
|
|
|
— |
|
|
|
1.0 |
|
Total tax asset estimates |
|
|
|
$ |
46.6 |
|
|
$ |
121.9 |
|
|
$ |
61.0 |
|
|
$ |
1.0 |
|
Useful life |
|
|
|
Unlimited |
|
|
5 years |
|
|
Various |
|
|
5 years |
|
||||
During the year ended December 31, 2021, we generated $1.1 million of taxable income which was offset by our cumulative net operating losses (“NOL”), leaving $46.6 million to carry forward to future years. NOL can generally be carried forward to offset both ordinary taxable income and capital gains in future years. The Tax Cuts and Jobs Act (“TCJA”) along with revisions made by the Coronavirus Aid, Relief, and Economic Security (“CARES”) Act reduced the deduction for NOLs to 80% of taxable income and granted an indefinite carryforward period.
Additionally, $15.0 million of net capital gains was reported on our tax return for the year ended December 31, 2021. This was offset with our cumulative total net capital losses, leaving $121.9 million to carry forward to future years. No capital losses expired during 2022 or 2021.
We also have tax assets in our taxable REIT subsidiaries (“TRS”). These tax assets are analyzed and disclosed quarterly in our financial statements. At June 30, 2023, our TRSs have $39.8 million of pre-TCJA NOLs, some of which are set to expire beginning in 2044, $21.2 million of NOLs with an indefinite carryforward period and $1.0 million of net capital losses.
Distributions
We did not pay distributions on our common shares during the six months ended June 30, 2023 as we were focused on prudently retaining and managing sufficient liquidity. As a result of losses during 2020, we received significant NOL carryforwards and net capital loss carryforwards, as finalized in our 2020 tax return. We intend to retain taxable income by utilizing our NOL carryforwards and expect to generate capital gains to use a portion of our net capital loss carryforwards, thereby growing book value and our investable equity base. As we continue to take steps necessary to stabilize our earnings available for distribution, our Board will establish a plan for the prudent resumption of the payment of common share distributions. No assurance, however, can be given as to the amounts or timing of future distributions as such distributions are subject to our earnings, financial condition, capital requirements and such other factors as our Board deems relevant.
We intend to continue to make regular quarterly distributions to holders of our preferred stock.
U.S. federal income tax law generally requires that a REIT distribute at least 90% of its REIT taxable income annually, determined without regard to the deduction for dividends paid and excluding net capital gains, and that it pay tax at regular corporate rates to the extent that it annually distributes less than 100% of its taxable income. Before we pay any dividend, whether for U.S. federal income tax purposes or otherwise, we must first meet both our operating and debt service requirements on our repurchase agreements and other debt payable. If our cash available for distribution is less than our taxable income, we could be required to sell assets or borrow funds to make cash distributions, or we may make a portion of the required distribution in the form of a taxable stock distribution or distribution of debt securities.
71
Contractual Obligations and Commitments
|
|
Contractual Commitments |
|
|||||||||||||||||
|
|
(dollars in thousands, except amounts in footnotes) |
|
|||||||||||||||||
|
|
Payments due by Period |
|
|||||||||||||||||
|
|
Total |
|
|
Less than 1 year |
|
|
1 - 3 years |
|
|
3 - 5 years |
|
|
More than 5 years |
|
|||||
At June 30, 2023: |
|
|
|
|
|
|
|
|
|
|
|
|
|
|
|
|||||
CRE securitizations |
|
$ |
1,241,372 |
|
|
$ |
— |
|
|
$ |
— |
|
|
$ |
— |
|
|
$ |
1,241,372 |
|
Senior secured financing facility (1) |
|
|
50,995 |
|
|
|
— |
|
|
|
— |
|
|
|
50,995 |
|
|
|
— |
|
CRE - term warehouse financing facilities (2) |
|
|
253,131 |
|
|
|
— |
|
|
|
253,131 |
|
|
|
— |
|
|
|
— |
|
Mortgage payable (3) |
|
|
18,854 |
|
|
|
— |
|
|
|
18,854 |
|
|
|
— |
|
|
|
— |
|
5.75% Senior Unsecured Notes (4) |
|
|
150,000 |
|
|
|
— |
|
|
|
— |
|
|
|
150,000 |
|
|
|
— |
|
Unsecured junior subordinated debentures (5) |
|
|
51,548 |
|
|
|
— |
|
|
|
— |
|
|
|
— |
|
|
|
51,548 |
|
Lease liabilities (6) |
|
|
855,337 |
|
|
|
1,608 |
|
|
|
5,572 |
|
|
|
6,088 |
|
|
|
842,069 |
|
Unfunded commitments on CRE loans (7) |
|
|
128,749 |
|
|
|
31,154 |
|
|
|
97,595 |
|
|
|
— |
|
|
|
— |
|
Unfunded commitments on construction loan (8) |
|
|
4,055 |
|
|
|
4,055 |
|
|
|
— |
|
|
|
— |
|
|
|
— |
|
Base management fees (9) |
|
|
6,560 |
|
|
|
6,560 |
|
|
|
— |
|
|
|
— |
|
|
|
— |
|
Total |
|
$ |
2,760,601 |
|
|
$ |
43,377 |
|
|
$ |
375,152 |
|
|
$ |
207,083 |
|
|
$ |
2,134,989 |
|
Off-Balance Sheet Arrangements
General
At June 30, 2023, we did not maintain any relationships with unconsolidated entities or financial partnerships that were established for the purpose of facilitating off-balance sheet arrangements or contractually narrow or limited purposes, although we do have interests in unconsolidated entities not established for those purposes. Except as set forth below, at June 30, 2023, we had not guaranteed obligations of any unconsolidated entities or entered into any commitment or letter of intent to provide additional funding to any such entities.
Unfunded Commitments
In the ordinary course of business, we make commitments to borrowers whose loans are in our CRE loan portfolio to provide additional loan funding in the future. Disbursement of funds pursuant to these commitments is subject to the borrower meeting pre-specified criteria. These commitments are subject to the same underwriting requirements and ongoing portfolio maintenance as are the on-balance sheet financial investments that we hold. Since these commitments may expire without being drawn upon, the total commitment amount does not necessarily represent future cash requirements. Whole loans had $128.7 million and $158.2 million in unfunded loan commitments at June 30, 2023 and December 31, 2022, respectively. Unfunded commitments are not considered in the CECL reserve if they are unconditionally cancellable.
Additionally, we and our JV partner have commitments related to our construction of a student housing complex. We and our JV partner committed to a total funding of $31.2 million, of which $4.1 million was unfunded at June 30, 2023.
72
Guarantees and Indemnifications
In the ordinary course of business, we may provide guarantees and indemnifications that contingently obligate us to make payments to the guaranteed or indemnified party based on changes in the value of an asset, liability or equity security of the guaranteed or indemnified party. As such, we may be obligated to make payments to a guaranteed party based on another entity’s failure to perform or achieve specified performance criteria, or we may have an indirect guarantee of the indebtedness of others.
In January 2023, Chapel Drive East, LLC, a wholly owned subsidiary of the FSU Student Venture, entered into a loan agreement (the "Construction Loan Agreement") with Oceanview Life and Annuity Company ("Oceanview") to finance the construction of a student housing complex (the "Construction Loan").
In connection with our investment in the student housing complex, ACRES RF entered into guarantees related to the Construction Loan. Pursuant to the guarantees, Jason Pollack, Frank Dellaglio and ACRES RF (collectively, the "Guarantors"), for the benefit of Oceanview, provided limited "bad boy" guaranties to Oceanview pursuant to the Construction Loan Agreement until the earlier of the payment in full of the indebtedness or the date of a sale of the property pursuant to a foreclosure of the mortgage or deed or other transfer in lieu of foreclosure is accepted by Oceanview. The Guarantors also entered into a Completion Guaranty Agreement for the benefit of Oceanview to guaranty the timely completion of the project in accordance with the Construction Loan Agreement, as well as a Carry Guaranty Agreement, for the benefit of Oceanview to guaranty and unconditional payment by Chapel Drive East, LLC of all customary or necessary costs and expenses incurred in connection with the operation, maintenance and management of the property and an Environmental Indemnity Agreement jointly and severally in favor of Oceanview whereby the Guarantors serving as Indemnitors provided environmental representations and warranties, covenants and indemnifications (collectively the "Guaranties"). The Guaranties include certain financial covenants required of ACRES RF, including required net worth and liquidity requirements.
73
ITEM 3. QUANTITATIVE AND QUALITATIVE DISCLOSURES ABOUT MARKET RISK
At June 30, 2023, the primary components of our market risk were credit risk, counterparty risk, financing risk, and interest rate risk, as described below. While we do not seek to avoid risk completely, we do seek to assume risk that can be quantified from historical experience, to actively manage that risk, to earn sufficient compensation to justify assuming that risk and to maintain capital levels consistent with the risk we undertake or to which we are exposed.
Credit Risks
Our loans and investments are subject to credit risk. The performance and value of our loans and investments depend upon the sponsors’ ability to operate the properties that serve as our collateral so that they produce cash flows adequate to pay interest and principal due to us. To monitor this risk, ACRES Capital, LLC’s asset management team reviews our investment portfolios and in certain instances is in regular contact with our borrowers, monitoring performance of the collateral and enforcing our rights as necessary.
In addition, we are exposed to the risks generally associated with the commercial real estate (“CRE”) market, including variances in occupancy rates, capitalization rates, absorption rates, and other macroeconomic factors beyond our control. We seek to manage these risks through our underwriting and asset management processes.
In a business environment where benchmark interest rates are increasing significantly, cash flows of the CRE assets underlying our loans may not be sufficient to pay debt service on our loans, which could result in non-performance or default. We partially mitigate this risk by generally requiring our borrowers to purchase interest rate cap agreements with non-affiliated, well-capitalized third parties and by selectively requiring our borrowers to have and maintain debt service reserves. These interest rate caps generally mature prior to the maturity date of the loan and the borrowers are required to pay to extend them. In most cases the sponsors will need to fund additional equity into the properties to cover these costs as the property may not generate sufficient cash flow to pay these costs. At June 30, 2023, 94.5% of the par value of our CRE loan portfolio had interest rate caps in place with a weighted-average maturity of nine months.
These macroeconomic conditions may persist into the future and impair our borrowers’ ability to comply with the terms under our loan agreements. We maintain a robust asset management relationship with our borrowers and have utilized these relationships to address the rising interest rates, lingering impacts of the COVID-19 pandemic, and other macroeconomic factors on our loans secured by properties experiencing cash flow pressure. While we believe the principal amounts of our loans are generally adequately protected by underlying collateral value, there is a risk that we will not realize the entire principal value of certain investments. In order to mitigate that risk, we have proactively engaged with our borrowers, particularly with those with near-term maturities, in order to maximize recovery.
Counterparty Risk
The nature of our business requires us to hold our cash and cash equivalents and obtain financing from with various financial institutions. This exposes us to the risk that these financial institutions may not fulfill their obligations to us under these various contractual arrangements. We mitigate this exposure by depositing our cash and cash equivalents and entering into financing agreements with high credit-quality institutions.
Financing Risk
We finance our target assets using our CRE debt securitizations, a senior secured financing facility and warehouse financing facilities. Over time, as market conditions change, we may use other forms of leverage in addition to these methods of financing. Weakness or volatility in the financial markets, the CRE and mortgage markets or the economy generally could adversely affect one or more of our lenders or potential lenders and could cause one or more of our lenders or potential lenders to be unwilling or unable to provide us with financing, or to decrease the amount of our available financing, or to increase the costs of that financing.
74
Interest Rate Risk
Our business model is such that rising interest rates will increase our net income, while declining interest rates will decrease net income, subject to the impact of interest rate floors. At June 30, 2023, 99.8% of our CRE loan portfolio by par value earned a floating rate of interest and may be financed with liabilities that both pay interest at floating rates and that are fixed. Floating-rate loans financed with fixed rate liabilities have a negative correlation with declining interest rates to the extent of our financing. The remaining 0.2% of our CRE loan portfolio by par value earned a fixed rate of interest. To the extent that interest rate floors on our floating-rate CRE loans are in the money, our net interest will have a negative correlation with rising interest rates to the extent of those interest rate floors. Our floating-rate loan portfolio of $2.0 billion had a weighted-average benchmark floor of 0.68% at June 30, 2023.
The following table estimates the hypothetical impact on our net interest income assuming an immediate increase or decrease of 100 basis points in the applicable interest rate benchmark (in thousands, except per share data):
|
|
|
Three Months Ended June 30, 2023 |
|
||||||||||||||
At June 30, 2023 |
|
|
100 Basis Point Decrease (4) |
|
|
100 Basis Point Increase |
|
|||||||||||
Net Assets Subject to Interest Rate Sensitivity (1)(2)(3) |
|
|
Decrease to Net Interest Income |
|
|
Decrease to Net Interest Income Per Share |
|
|
Increase to Net Interest Income |
|
|
Increase to Net Interest Income Per Share |
|
|||||
$ |
371,949 |
|
|
$ |
(924 |
) |
|
$ |
(0.11 |
) |
|
$ |
943 |
|
|
$ |
0.11 |
|
Risk Management
To the extent consistent with maintaining our status as a REIT, we seek to manage our interest rate risk exposure to protect our variable rate debt against the effects of major interest rate changes. We generally seek to manage our interest rate risk by monitoring and adjusting, if necessary, the reset index and interest rate related to our borrowings.
ITEM 4. CONTROLS AND PROCEDURES
Disclosure Controls and Procedures
We maintain disclosure controls and procedures that are designed to ensure that information required to be disclosed in our Securities Exchange Act of 1934 reports is recorded, processed, summarized and reported within the time periods specified in the Securities and Exchange Commission’s rules and forms, and that such information is accumulated and communicated to our management, including our Chief Executive Officer and our Chief Financial Officer, as appropriate, to allow timely decisions regarding required disclosure. In designing and evaluating the disclosure controls and procedures, our management recognized that any controls and procedures, no matter how well designed and operated, can provide only reasonable assurance of achieving the desired control objectives, and our management necessarily was required to apply its judgment in evaluating the cost-benefit relationship of possible controls and procedures.
Under the supervision of our Chief Executive Officer and Chief Financial Officer, we have carried out an evaluation of the effectiveness of our disclosure controls and procedures as of the end of the period covered by this report. Based upon that evaluation, our Chief Executive Officer and Chief Financial Officer concluded that our disclosure controls and procedures are effective at the reasonable assurance level.
Changes in Internal Control over Financial Reporting
There were no changes in our internal control over financial reporting during the quarter ended June 30, 2023 that have materially affected, or are reasonably likely to materially affect, our internal control over financial reporting.
75
PART II
ITEM 1. LEGAL PROCEEDINGS
We may become involved in litigation on various matters due to the nature of our business activities. The resolution of these matters may result in adverse judgments, fines, penalties, injunctions and other relief against us as well as monetary payments or other agreements and obligations. In addition, we may enter into settlements on certain matters in order to avoid the additional costs of engaging in litigation. Except as discussed below, we are unaware of any contingencies arising from such litigation that would require accrual or disclosure in the consolidated financial statements at June 30, 2023.
Our subsidiary, Primary Capital Mortgage, LLC (“PCM”), is subject to potential litigation related to claims for repurchases or indemnifications on loans that PCM has sold to third parties. At June 30, 2023 and December 31, 2022, no such litigation demand was outstanding. Reserves for such litigation demands are included in the reserve for mortgage repurchases and indemnifications that totaled $1.1 million and $1.2 million at June 30, 2023 and December 31, 2022, respectively. The reserves for mortgage repurchases and indemnifications are included in liabilities held for sale on the consolidated balance sheets. At June 30, 2023, we have substantially completed disposing of PCM’s business.
ITEM 1A. RISK FACTORS
As of the date of this report, there have been no material changes to the risk factors disclosed in our Annual Report on Form 10-K for the year ended December 31, 2022 filed with the Securities and Exchange Commission (“SEC”), except we may disclose changes to such factors or disclose additional factors from time to time in our future filings with the SEC.
ITEM 2. UNREGISTERED SALES OF EQUITY SECURITIES AND USE OF PROCEEDS
Issuer Purchases of Equity Securities
In March 2016, our Board approved our securities repurchase program. In November 2020, our Board authorized and approved the continued use of our existing share repurchase program in order to repurchase up to $20.0 million of our outstanding shares of common stock. In July 2021, the authorized amount was fully utilized and in November 2021, our Board authorized and approved the continued use of our existing share repurchase program to repurchase an additional $20.0 million of our outstanding common stock.
The following table presents information about our common stock repurchases made during the six months ended June 30, 2023 in accordance with our repurchase program (dollars in thousands, except per share data):
|
|
Common Stock |
|
|||||||||||||
|
|
Total Number of Shares Purchased |
|
|
Average Price Paid per Share (1) |
|
|
Total Number of Shares Purchased as Part of Publicly Announced Plans or Programs |
|
|
Approximate Dollar Value of Shares that may yet be Purchased under the Plans or Programs |
|
||||
January 19, 2023 - January 31, 2023 |
|
|
9,822 |
|
|
$ |
9.78 |
|
|
|
9,822 |
|
|
$ |
7,121 |
|
February 1, 2023 - February 28, 2023 |
|
|
24,754 |
|
|
|
9.48 |
|
|
|
24,754 |
|
|
|
6,887 |
|
March 1, 2023 - March 31, 2023 |
|
|
45,168 |
|
|
|
9.39 |
|
|
|
45,168 |
|
|
|
6,464 |
|
April 3, 2023 - April 28, 2023 |
|
|
45,645 |
|
|
|
9.48 |
|
|
|
45,645 |
|
|
|
6,032 |
|
May 1, 2023 - May 31, 2023 |
|
|
62,001 |
|
|
|
8.61 |
|
|
|
62,001 |
|
|
|
5,499 |
|
June 1, 2023 - June 30, 2023 |
|
|
27,770 |
|
|
|
8.41 |
|
|
|
27,770 |
|
|
|
5,266 |
|
ITEM 5. OTHER INFORMATION
During the three months ended June 30, 2023, no director or officer of the Company adopted or terminated a “Rule 10b5-1 trading arrangement” or “non-Rule 10b5-1 trading arrangement,” as each term is defined in Item 408(a) of Regulation S-K.
76
ITEM 6. EXHIBITS
77
10.4(c) |
|
|
10.4(d) |
|
|
10.4(e) |
|
|
10.4(f) |
|
|
10.4(g) |
|
|
10.4(h) |
|
|
10.4(i) |
|
|
10.4(j) |
|
|
10.4(k) |
|
|
10.4(l) |
|
|
10.4(m) |
|
|
10.4(n) |
|
|
10.5(a) |
|
|
10.5(b) |
|
|
10.5(c) |
|
|
10.6 |
|
|
10.7(a) |
|
|
10.7(b) |
|
Form of Stock Award Agreement Under the Manager Incentive Plan. (26) |
10.8 |
|
|
10.9(a) |
|
|
10.9(b) |
|
|
10.9(c) |
|
|
10.9(d) |
|
|
10.9(e) |
|
|
31.1 |
|
Rule 13a-14(a)/Rule 15d-14(a) Certification of Chief Executive Officer. |
31.2 |
|
Rule 13a-14(a)/Rule 15d-14(a) Certification of Chief Financial Officer. |
32.1 |
|
|
32.2 |
|
|
99.1(a) |
|
|
99.1(b) |
|
|
99.1(c) |
|
|
99.1(d) |
|
78
99.1(e) |
|
|
99.1(f) |
|
|
99.1(g) |
|
|
99.1(h) |
|
|
99.1(i) |
|
|
99.1(j) |
|
|
99.2(a) |
|
|
99.2(b) |
|
|
99.2(c) |
|
|
99.2(d) |
|
|
99.3 |
|
|
101.INS |
|
Inline XBRL Instance Document - the instance document does not appear in the Interactive Data File because its XBRL tags are embedded within the Inline XBRL document. |
101.SCH |
|
Inline XBRL Taxonomy Extension Schema Document. |
101.CAL |
|
Inline XBRL Taxonomy Extension Calculation Linkbase Document. |
101.DEF |
|
Inline XBRL Taxonomy Extension Definition Linkbase Document. |
101.LAB |
|
Inline XBRL Taxonomy Extension Label Linkbase Document. |
101.PRE |
|
Inline XBRL Taxonomy Extension Presentation Linkbase Document. |
104 |
|
Cover Page Interactive Data File. |
79
(1) |
|
Filed previously as an exhibit to the Company’s Registration Statement on Form S-11, Registration No. 333-126517. |
(2) |
|
Filed previously as an exhibit to the Company’s Quarterly Report on Form 10-Q for the quarter ended June 30, 2006. |
(3) |
|
Filed previously as an exhibit to the Company’s Quarterly Report on Form 10-Q for the quarter ended September 30, 2006. |
(4) |
|
Filed previously as an exhibit to the Company’s Quarterly Report on Form 10-Q for the quarter ended September 30, 2013. |
(5) |
|
Filed previously as an exhibit to the Company’s Current Report on Form 8-K filed on June 26, 2014. |
(6) |
|
Filed previously as an exhibit to the Company’s Quarterly Report on Form 10-Q for the quarter ended September 30, 2009. |
(7) |
|
Filed previously as an exhibit to the Company’s Registration Statement on Form 8-A filed on June 9, 2014. |
(8) |
|
Filed previously as an exhibit to the Company’s Quarterly Report on Form 10-Q for the quarter ended June 30, 2014. |
(9) |
|
Filed previously as an exhibit to the Company’s Current Report on Form 8-K filed on September 1, 2015. |
(10) |
|
Filed previously as an exhibit to the Company’s Current Report on Form 8-K filed on June 8, 2017. |
(11) |
|
Filed previously as an exhibit to the Company’s Quarterly Report on Form 10-Q for the quarter ended June 30, 2017. |
(12) |
|
Filed previously as an exhibit to the Company’s Current Report on Form 8-K filed on May 25, 2018. |
(13) |
|
Filed previously as an exhibit to the Company’s Current Report on Form 8-K filed on October 30, 2018. |
(14) |
|
Filed previously as an exhibit to the Company’s Proxy Statement filed on April 18, 2019. |
(15) |
|
Filed previously as an exhibit to the Company’s Quarterly Report on Form 10-Q for the quarter ended March 31, 2020. |
(16) |
|
Filed previously as an exhibit to the Company’s Current Report on Form 8-K filed on August 3, 2020. |
(17) |
|
Filed previously as an exhibit to the Company’s Quarterly Report on Form 10-Q for the quarter ended June 30, 2020. |
(18) |
|
Filed previously as an exhibit to the Company’s Current Report on Form 8-K filed on September 22, 2020. |
(19) |
|
Filed previously as an exhibit to the Company’s Current Report on Form 8-K filed on October 7, 2020. |
(20) |
|
Filed previously as an exhibit to the Company’s Quarterly Report on Form 10-Q for the quarter ended September 30, 2020. |
(21) |
|
Filed previously as an exhibit to the Company’s Current Report on Form 8-K filed on February 18, 2021. |
(22) |
|
Filed previously as an exhibit to the Company’s Annual Report on Form 10-K for the year ended December 31, 2020. |
(23) |
|
Filed previously as an exhibit to the Company’s Proxy Statement filed on April 12, 2021. |
(24) |
|
Filed previously as an exhibit to the Company’s Current Report on Form 8-K filed on May 21, 2021. |
(25) |
|
Filed previously as an exhibit to the Company’s Current Report on Form 8-K filed on June 1, 2021. |
(26) |
|
Filed previously as an exhibit to the Company’s Current Report on Form 8-K filed on June 9, 2021. |
(27) |
|
Filed previously as an exhibit to the Company’s Quarterly Report on Form 10-Q for the quarter ended June 30, 2021. |
(28) |
|
Filed previously as an exhibit to the Company’s Current Report on Form 8-K filed on August 17, 2021. |
(29) |
|
Filed previously as an exhibit to the Company’s Current Report on Form 8-K filed on August 20, 2021. |
(30) |
|
Filed previously as an exhibit to the Company’s Current Report on Form 8-K filed on September 2, 2021. |
(31) |
|
Filed previously as an exhibit to the Company’s Current Report on Form 8-K filed on October 7, 2021. |
(32) |
|
Filed previously as an exhibit to the Company’s Current Report on Form 8-K filed on October 29, 2021. |
(33) |
|
Filed previously as an exhibit to the Company’s Quarterly Report on Form 10-Q for the quarter ended September 30, 2021. |
(34) |
|
Filed previously as an exhibit to the Company’s Current Report on Form 8-K filed on February 3, 2022. |
(35) |
|
Filed previously as an exhibit to the Company’s Annual Report on Form 10-K for the year ended December 31, 2021. |
(36) |
|
Filed previously as an exhibit to the Company’s Quarterly Report on Form 10-Q for the quarter ended March 31, 2022. |
(37) |
|
Filed previously as an exhibit to the Company’s Current Report on Form 8-K filed on July 27, 2022. |
(38) |
|
Filed previously as an exhibit to the Company’s Current Report on Form 8-K filed on August 30, 2022. |
(39) |
|
Filed previously as an exhibit to the Company’s Current Report on Form 8-K filed on January 25, 2023. |
(40) |
|
Filed previously as an exhibit to the Company’s Current Report on Form 8-K filed on December 22, 2022. |
(41) |
|
Filed previously as an exhibit to the Company’s Current Report on Form 8-K filed on November 18, 2022. |
(42) |
|
Filed previously as an exhibit to the Company’s Annual Report on Form 10-K for the year ended December 31, 2022. |
(43) |
|
Filed previously as an exhibit to the Company’s Current Report on Form 8-K filed on July 25, 2023. |
80
SIGNATURES
Pursuant to the requirements of the Securities Exchange Act of 1934, the registrant has duly caused this report to be signed on its behalf by the undersigned thereunto duly authorized.
|
|
|
ACRES COMMERCIAL REALTY CORP. |
|
|
|
(Registrant) |
|
|
|
|
August 7, 2023 |
|
By: |
/s/ Mark Fogel |
|
|
|
Mark Fogel |
|
|
|
President & Chief Executive Officer |
|
|
|
|
August 7, 2023 |
|
By: |
/s/ David J. Bryant |
|
|
|
David J. Bryant |
|
|
|
Senior Vice President |
|
|
|
Chief Financial Officer and Treasurer |
|
|
|
|
August 7, 2023 |
|
By: |
/s/ Eldron C. Blackwell |
|
|
|
Eldron C. Blackwell |
|
|
|
Vice President |
|
|
|
Chief Accounting Officer |
81
Exhibit 31.1
CERTIFICATION
I, Mark Fogel, certify that:
1. I have reviewed this report on Form 10-Q for the quarter ended June 30, 2023 of ACRES Commercial Realty Corp.;
2. Based on my knowledge, this report does not contain any untrue statement of a material fact or omit to state a material fact necessary to make the statements made, in light of the circumstances under which such statements were made, not misleading with respect to the period covered by this report;
3. Based on my knowledge, the financial statements, and other financial information included in this report, fairly present in all material respects the financial condition, results of operations and cash flows of the registrant as of, and for, the periods presented in this report;
4. The registrant’s other certifying officer(s) and I are responsible for establishing and maintaining disclosure controls and procedures (as defined in Exchange Act Rules 13a-15(e) and 15d-15(e)) and internal control over financial reporting (as defined in Exchange Act Rules 13a-15(f) and 15d-15(f)) for the registrant and have:
a. Designed such disclosure controls and procedures, or caused such disclosure controls and procedures to be designed under our supervision, to ensure that material information relating to the registrant, including its consolidated subsidiaries, is made known to us by others within those entities, particularly during the period in which this report is being prepared;
b. Designed such internal control over financial reporting, or caused such internal control over financial reporting to be designed under our supervision, to provide reasonable assurance regarding the reliability of financial reporting and the preparation of financial statements for external purposes in accordance with generally accepted accounting principles;
c. Evaluated the effectiveness of the registrant’s disclosure controls and procedures and presented in this report our conclusions about the effectiveness of the disclosure controls and procedures, as of the end of the period covered by this report based on such evaluation; and
d. Disclosed in this report any change in the registrant’s internal control over financial reporting that occurred during the registrant’s most recent fiscal quarter (the registrant’s fourth fiscal quarter in the case of an annual report) that has materially affected, or is reasonably likely to materially affect, the registrant’s internal control over financial reporting; and
5. The registrant’s other certifying officer(s) and I have disclosed, based on our most recent evaluation of internal control over financial reporting, to the registrant’s auditors and the audit committee of the registrant’s board of directors (or persons performing the equivalent functions):
a. All significant deficiencies and material weaknesses in the design or operation of internal control over financial reporting which are reasonably likely to adversely affect the registrant’s ability to record, process, summarize and report financial information; and
b. Any fraud, whether or not material, that involves management or other employees who have a significant role in the registrant’s internal control over financial reporting.
August 7, 2023 |
/s/ Mark Fogel |
|
Mark Fogel |
|
President & Chief Executive Officer |
Exhibit 31.2
CERTIFICATION
I, David J. Bryant, certify that:
1. I have reviewed this report on Form 10-Q for the quarter ended June 30, 2023 of ACRES Commercial Realty Corp.;
2. Based on my knowledge, this report does not contain any untrue statement of a material fact or omit to state a material fact necessary to make the statements made, in light of the circumstances under which such statements were made, not misleading with respect to the period covered by this report;
3. Based on my knowledge, the financial statements, and other financial information included in this report, fairly present in all material respects the financial condition, results of operations and cash flows of the registrant as of, and for, the periods presented in this report;
4. The registrant’s other certifying officer(s) and I are responsible for establishing and maintaining disclosure controls and procedures (as defined in Exchange Act Rules 13a-15(e) and 15d-15(e)) and internal control over financial reporting (as defined in Exchange Act Rules 13a-15(f) and 15d-15(f)) for the registrant and have:
a. Designed such disclosure controls and procedures, or caused such disclosure controls and procedures to be designed under our supervision, to ensure that material information relating to the registrant, including its consolidated subsidiaries, is made known to us by others within those entities, particularly during the period in which this report is being prepared;
b. Designed such internal control over financial reporting, or caused such internal control over financial reporting to be designed under our supervision, to provide reasonable assurance regarding the reliability of financial reporting and the preparation of financial statements for external purposes in accordance with generally accepted accounting principles;
c. Evaluated the effectiveness of the registrant’s disclosure controls and procedures and presented in this report our conclusions about the effectiveness of the disclosure controls and procedures, as of the end of the period covered by this report based on such evaluation; and
d. Disclosed in this report any change in the registrant’s internal control over financial reporting that occurred during the registrant’s most recent fiscal quarter (the registrant’s fourth fiscal quarter in the case of an annual report) that has materially affected, or is reasonably likely to materially affect, the registrant’s internal control over financial reporting; and
5. The registrant’s other certifying officer(s) and I have disclosed, based on our most recent evaluation of internal control over financial reporting, to the registrant’s auditors and the audit committee of the registrant’s board of directors (or persons performing the equivalent functions):
a. All significant deficiencies and material weaknesses in the design or operation of internal control over financial reporting which are reasonably likely to adversely affect the registrant’s ability to record, process, summarize and report financial information; and
b. Any fraud, whether or not material, that involves management or other employees who have a significant role in the registrant’s internal control over financial reporting.
August 7, 2023 |
/s/ David J. Bryant |
|
David J. Bryant |
|
Chief Financial Officer |
Exhibit 32.1
CERTIFICATION PURSUANT TO
18 U.S.C. SECTION 1350,
AS ADOPTED PURSUANT TO
SECTION 906 OF THE SARBANES-OXLEY ACT OF 2002
In connection with the Quarterly Report of ACRES Commercial Realty Corp. (the “Company”) on Form 10-Q for the quarter ended June 30, 2023 as filed with the Securities and Exchange Commission on the date hereof (the “Report”), I, Mark Fogel, Chief Executive Officer of the Company, certify, pursuant to 18 U.S.C. Section 1350, as adopted pursuant to Section 906 of the Sarbanes-Oxley Act of 2002, that:
(1) The Report fully complies with the requirements of section 13(a) or 15(d) of the Securities Exchange Act of 1934, and
(2) The information contained in the Report fairly presents, in all material respects, the financial condition and results of operations of the Company.
August 7, 2023 |
/s/ Mark Fogel |
|
Mark Fogel |
|
President & Chief Executive Officer |
This certification is being furnished and shall not be deemed filed by the Company for purposes of Section 18 of the Securities Exchange Act of 1934, as amended.
A signed original of this certification required by Section 906 has been provided to the Company and will be retained by the Company and furnished to the Securities and Exchange Commission or its staff upon request.
Exhibit 32.2
CERTIFICATION PURSUANT TO
18 U.S.C. SECTION 1350,
AS ADOPTED PURSUANT TO
SECTION 906 OF THE SARBANES-OXLEY ACT OF 2002
In connection with the Quarterly Report of ACRES Commercial Realty Corp. (the “Company”) on Form 10-Q for the quarter ended June 30, 2023 as filed with the Securities and Exchange Commission on the date hereof (the “Report”), I, David J. Bryant, Chief Financial Officer of the Company, certify, pursuant to 18 U.S.C. Section 1350, as adopted pursuant to Section 906 of the Sarbanes-Oxley Act of 2002, that:
(1) The Report fully complies with the requirements of section 13(a) or 15(d) of the Securities Exchange Act of 1934, and
(2) The information contained in the Report fairly presents, in all material respects, the financial condition and results of operations of the Company.
August 7, 2023 |
/s/ David J. Bryant |
|
David J. Bryant |
|
Chief Financial Officer |
This certification is being furnished and shall not be deemed filed by the Company for purposes of Section 18 of the Securities Exchange Act of 1934, as amended.
A signed original of this certification required by Section 906 has been provided to the Company and will be retained by the Company and furnished to the Securities and Exchange Commission or its staff upon request.