mt
UNITED STATES
SECURITIES AND EXCHANGE COMMISSION
Washington, D.C. 20549
FORM 10-K
☒ Annual Report Pursuant to Section 13 or 15(d) of the Securities Exchange Act of 1934
For the fiscal year ended February 28, 2023
OR
☐ Transition Report Pursuant to Section 13 or 15(d) of the Securities Exchange Act of 1934
For the transition period from __________ to __________
Commission File Number 1-5807
ENNIS, INC.
(Exact Name of Registrant as Specified in Its Charter)
Texas |
|
75-0256410 |
(State or Other Jurisdiction of Incorporation or Organization) |
|
(I.R.S. Employer Identification No.) |
2441 Presidential Pkwy., Midlothian, Texas |
|
76065 |
(Address of Principal Executive Offices) |
|
(Zip code) |
(Registrant’s Telephone Number, Including Area Code) (972) 775-9801
Securities registered pursuant to Section 12(b) of the Act:
Title of each class |
|
Trading Symbol(s) |
|
Name of each exchange on which registered |
Common Stock, par value $2.50 per share |
|
EBF |
|
New York Stock Exchange |
Securities registered pursuant to Section 12(g) of the Act: None
Indicate by check mark if the Registrant is a well-known seasoned issuer, as defined in Rule 405 of the Securities Act. Yes ☐ No ☒
Indicate by check mark if the Registrant is not required to file reports pursuant to Section 13 or Section 15(d) of the Act. Yes ☐ No ☒
Indicate by check mark whether the Registrant (1) has filed all reports required to be filed by Section 13 or 15(d) of the Securities Exchange Act of 1934 during the preceding 12 months (or for such shorter period that the Registrant was required to file such reports), and (2) has been subject to such filing requirements for the past 90 days. Yes ☒ No ☐
Indicate by check mark whether the registrant has submitted electronically every Interactive Data File required to be submitted pursuant to Rule 405 of Regulation S-T (§232.405 of this chapter) during the preceding 12 months (or for such shorter period that the registrant was required to submit such files). Yes ☒ No ☐
Indicate by check mark whether the registrant is a large accelerated filer, an accelerated filer, a non-accelerated filer, a smaller reporting company or an emerging growth company. See the definitions of “large accelerated filer,” “accelerated filer,” “smaller reporting company” and “emerging growth company” in Rule 12b-2 of the Exchange Act.
Large accelerated Filer |
☐ |
|
|
Accelerated filer |
☒ |
Non-accelerated filer |
☐ |
|
|
Smaller reporting company |
☐ |
Emerging growth company. |
☐ |
|
|
|
|
If an emerging growth company, indicate by check mark if the registrant has elected not to use the extended transition period for complying with any new or revised financial accounting standards provided pursuant to Section 13(a) of the Exchange Act. ☐
Indicate by check mark whether the registrant has filed a report on and attestation to its management’s assessment of the effectiveness of internal control over financial reporting under Section 404(b) of the Sarbanes-Oxley Act (15 U.S.C. 7262(b)) by the registered public accounting firm that prepared or issued its audit report. ☒
Indicate by check mark whether the Registrant is a shell company (as defined in Rule 12b-2 of the Exchange Act). Yes ☐ No ☒
The aggregate market value of voting stock held by non-affiliates of the Registrant as of August 31, 2022 was approximately $530 million. Shares of voting stock held by executive officers, directors and holders of more than 10% of the outstanding voting stock have been excluded from this calculation because such persons may be deemed to be affiliates. Exclusion of such shares should not be construed to indicate that any of such persons possesses the power, direct or indirect, to control the Registrant, or that any such person is controlled by or under common control with the Registrant.
The number of shares of the Registrant’s Common Stock, par value $2.50, outstanding at May 9, 2023 was 25,853,027.
DOCUMENTS INCORPORATED BY REFERENCE
Portions of the Registrant’s Proxy Statement for the 2023 Annual Meeting of Shareholders are incorporated by reference into Part III of this Report.
ENNIS, INC. AND SUBSIDIARIES
FORM 10-K
FOR THE PERIOD ENDED FEBRUARY 28, 2023
TABLE OF CONTENTS
|
|
|
Item 1 |
4 |
|
Item 1A |
8 |
|
Item 1B |
13 |
|
Item 2 |
13 |
|
Item 3 |
15 |
|
Item 4 |
15 |
|
|
|
|
|
|
|
Item 5 |
15 |
|
Item 7 |
Management’s Discussion and Analysis of Financial Condition and Results of Operations |
17 |
Item 7A |
24 |
|
Item 8 |
24 |
|
Item 9 |
Changes in and Disagreements with Accountants on Accounting and Financial Disclosure |
24 |
Item 9A |
24 |
|
Item 9B |
25 |
|
|
|
|
|
|
|
Item 10 |
26 |
|
Item 11 |
26 |
|
Item 12 |
Security Ownership of Certain Beneficial Owners and Management and Related |
26 |
Item 13 |
Certain Relationships and Related Transactions, and Director Independence |
26 |
Item 14 |
26 |
|
|
|
|
|
|
|
Item 15 |
27 |
|
|
28 |
Cautionary Statements Regarding Forward-Looking Statements
All of the statements in this Annual Report on Form 10-K, other than historical facts, are forward-looking statements, including, without limitation, the statements made in the “Management’s Discussion and Analysis of Financial Condition and Results of Operations,” particularly under the caption “Overview.” As a general matter, forward-looking statements are those focused upon anticipated events or trends, expectations, and beliefs relating to matters that are not historical in nature. The words “could,” “should,” “feel,” “anticipate,” “aim,” “preliminary,” “expect,” “believe,” “estimate,” “intend,” “intent,” “plan,” “will,” “foresee,” “project,” “forecast,” or the negative thereof or variations thereon, and similar expressions identify forward-looking statements.
The Private Securities Litigation Reform Act of 1995 provides a “safe harbor” for these forward-looking statements. In order to comply with the terms of the safe harbor, Ennis, Inc. notes that forward-looking statements are subject to known and unknown risks, uncertainties and other factors relating to its operations and business environment, all of which are difficult to predict and many of which are beyond the control of Ennis, Inc. These known and unknown risks, uncertainties and other factors could cause actual results to differ materially from those matters expressed in, anticipated by or implied by such forward-looking statements.
These statements reflect the current views and assumptions of management with respect to future events. Ennis, Inc. does not undertake, and hereby disclaims, any duty to update these forward-looking statements, even though its situation and circumstances may change in the future. Readers are cautioned not to place undue reliance on forward-looking statements, which speak only as of the date of this report. The inclusion of any statement in this report does not constitute an admission by Ennis, Inc. or any other person that the events or circumstances described in such statement are material.
We believe these forward-looking statements are based upon reasonable assumptions. All such statements involve risks and uncertainties, and as a result, actual results could differ materially from those projected, anticipated or implied by these statements. Such forward-looking statements involve known and unknown risks, including but not limited to, general economic, business and labor conditions, including the potential adverse effects of potential recessionary concerns, inflationary issues and supply chain disruptions; and the potential impact on our operations; our ability to implement our strategic initiatives and control our operational costs; dependence on a limited number of key suppliers; our ability to recover the rising cost of raw materials and other costs (including energy, freight, labor, and benefit costs) in markets that are highly price competitive and volatile; uninsured losses, including those from natural disasters, catastrophes, pandemics, theft or sabotage; the impact of the novel coronavirus (COVID-19) pandemic or future pandemics on the U.S. and local economies, our business operations, our workforce, our supply chain and our customer base; our ability to timely or adequately respond to technological changes in the industry; cybersecurity risks; the impact of the internet and other electronic media on the demand for forms and printed materials; the impact of foreign competition, tariffs, trade regulations and import restrictions; customer credit risk; competitors’ pricing strategies; a decline in business volume and profitability could result in an impairment in our reported goodwill negatively impacting our operational results; our ability to retain key management personnel; and our ability to identify, manage or integrate acquisitions.
3
PART I
ITEM 1. BUSINESS
Overview
Ennis, Inc. (formerly Ennis Business Forms, Inc.) (collectively with its subsidiaries, the “Company,” “Registrant,” “Ennis,” or “we,” “us,” or “our”) was organized under the laws of Texas in 1909. We and our subsidiaries print and manufacture a broad line of business forms and other business products. We distribute business products and forms throughout the United States primarily through independent distributors. This distributor channel encompasses independent print distributors, commercial printers, direct mail, fulfillment companies, payroll and accounts payable software companies, and advertising agencies, among others. We also sell products to many of our competitors to satisfy their customers’ needs.
Business Overview
Our management believes we are the largest provider of business forms, pressure-seal forms, labels, tags, envelopes, and presentation folders to independent distributors in the United States.
We are in the business of manufacturing, designing and selling business forms and other printed business products primarily to distributors located in the United States. We operate 54 manufacturing plants throughout the United States in 20 strategically located states as one reportable segment. Approximately 95% of the business products we manufacture are custom and semi-custom products, constructed in a wide variety of sizes, colors, number of parts and quantities on an individual job basis, depending upon the customers’ specifications.
The products we sell include snap sets, continuous forms, laser cut sheets, tags, labels, envelopes, integrated products, jumbo rolls and pressure sensitive products in short, medium and long runs under the following labels: Ennis®, Royal Business Forms®, Block Graphics®, 360º Custom LabelsSM, ColorWorx®, Enfusion®, Uncompromised Check Solutions®, VersaSeal®, Ad ConceptsSM, FormSource LimitedSM, Star Award Ribbon Company®, Witt Printing®, B&D Litho®, Genforms®, PrintGraphics®, Calibrated Forms®, PrintXcel®, Printegra®, Forms ManufacturersSM, Mutual Graphics®, TRI-C Business FormsSM, Major Business SystemsSM, Independent PrintingSM, Hoosier Data Forms®, Hayes Graphics®, Wright Business GraphicsSM, Wright 360SM, Integrated Print & GraphicsSM, the Flesh CompanySM, Impressions DirectSM and AmeriPrintSM; We also sell the Adams McClure® brand (which provides Point of Purchase advertising); the Admore®, Folder Express®, and Independent Folders® brands (which provide presentation folders and document folders); Ennis Tag & LabelSM (which provides custom printed, high performance labels and custom and stock tags); Allen-Bailey Tag & LabelSM, Atlas Tag & Label®, Kay Toledo Tag®, and Special Service Partners® (SSP) (which provides custom and stock tags and labels); Trade Envelopes®, Block Graphics®, Wisco®, and National Imprint Corporation® (which provide custom and imprinted envelopes) and Northstar® and General Financial Supply® (which provide financial and security documents); InfosealSM and PrintXcel® (which provide custom and stock pressure seal documents). School Photo Marketing is a one-stop shop for over 1,400 school portrait photographers and professional photo labs nationwide, providing them with a complete array of products and services that reach over 15 million families and 30,000 schools, primarily in the K-8 market. We sell predominantly through independent distributors, as well as to many of our competitors. Northstar Computer Forms, Inc., one of our wholly-owned subsidiaries, also sells direct to a small number of customers, generally large banking organizations (where a distributor is not acceptable or available to the end-user). Adams McClure, LP, a wholly-owned subsidiary, also sells direct to a small number of customers, where sales are generally through advertising agencies.
The printing industry generally sells its products either predominantly to end users, a market dominated by a few large manufacturers, such as R.R. Donnelley and Sons, Staples, Inc., Standard Register Co. (a subsidiary of Taylor Corporation), and Cenveo, Inc., or, like the Company, through a variety of independent distributors and distributor groups. While it is not possible, because of the lack of adequate public statistical information, to determine the Company’s share of the total business products market, management believes the Company is the largest producer of business forms, pressure-seal forms, labels, tags, envelopes, and presentation folders in the United States distributing primarily through independent distributors.
4
There are a number of competitors that operate in this segment, ranging in size from single employee-owned operations to multi-plant organizations. We believe our strategic locations and buying power permit us to compete on a favorable basis within the distributor market on competitive factors, such as service, quality, and price.
Distribution of business forms and other business products throughout the United States is primarily done through independent distributors, including business forms distributors, resellers, direct mail, commercial printers, payroll and accounts payable software companies, and advertising agencies.
Raw materials principally consist of a wide variety of weights, widths, colors, sizes, and qualities of paper for business products purchased primarily from one major supplier at favorable prices based on the volume of business.
Business products usage in the printing industry is generally not seasonal. General economic conditions and contraction of the traditional business forms industry are the predominant factors in quarterly volume fluctuations.
Recent Acquisitions
We have completed a number of acquisitions in recent years.
On November 30, 2022, the Company acquired the assets and business from School Photo Marketing ("SPM") in Morganville, New Jersey, which prior to the acquisition generated approximately $5.9 million in sales for its fiscal year ended December 31, 2021. SPM provides printing, yearbook publishing and marketing related services to over 1,400 school and sports photographers servicing schools around the country.
On June 1, 2021, the Company acquired the assets and business from AmeriPrint Corporation ("AmeriPrint") in Harvard, Illinois, which prior to the acquisition generated approximately $6.5 million in sales for its fiscal year ended December 31, 2020, adding capabilities and expertise to our expanding product offering including barcoding and variable imaging.
On December 31, 2020, we acquired the assets of Infoseal LLC (“Infoseal”) in Roanoke, Virginia. The acquisition of Infoseal, which prior to the acquisition generated approximately $19.2 million in sales for its fiscal year ended December 31, 2020, creates additional capabilities and expertise to our product offering including our existing VersaSeal pressure seal product line.
Patents, Licenses, Franchises and Concessions
Other than the patent for our VersaSeal® product, we do not have any significant patents, licenses, franchises, or concessions.
5
Intellectual Property
We market our products under a number of trademarks and trade names. The protection of our trademarks is important to our business. We believe that our registered and common law trademarks have significant value and these trademarks are important to our ability to create and sustain demand for our products. We have registered trademarks in the United States for Ennis®, EnnisOnlineSM, B&D Litho of AZ®, B&D Litho®, ACR®, Block Graphics®, Enfusion®, 360º Custom LabelsSM, Admore®, CashManagementSupply.comSM, Securestar®, Northstar®, MICRLink®, MICR ConnectionTM, Ennisstores.comTM, General Financial Supply®, Calibrated Forms®, PrintXcel®, Printegra®, Trade Envelopes®, Witt Printing®, Genforms®, Royal Business Forms®, Crabar/GBFSM, BF&SSM, Adams McClure®, Advertising ConceptsTM, ColorWorx®, Allen-Bailey Tag & LabelSM, Atlas Tag & Label®, PrintgraphicsSM, Uncompromised Check Solutions®, VersaSeal®, VersaSeal SecureX®, Folder Express®, Wisco®, National Imprint Corporation®, Star Award Ribbon®, Kay Toledo Tag®, Falcon Business FormsSM, Forms ManufacturersSM, Mutual Graphics®, TRI-C Business FormsSM, SSP®, EOSTouchpoint®, Printersmall®, Check Guard®, Envirofolder®, Independent®, Independent Checks®, Independent Folders®, Independent Large Format Solutions®, Wright Business GraphicsSM, Wright 360SM, Integrated Print & GraphicsSM, the Flesh CompanySM, Impressions DirectSM, MegaformSM, Safe®, InfosealSM, and variations of these brands as well as other trademarks. We have similar trademark registrations internationally for certain trademarks.
Customers
No single customer accounts for as much as five percent of our consolidated net sales or accounts receivable.
Backlog
At February 28, 2023, our backlog of firm orders was approximately $46.7 million, compared to approximately $38.4 million at February 28, 2022.
Research and Development
While we seek new products to sell through our distribution channel, there have been no material amounts spent on research and development in fiscal years 2023, 2022 or 2021.
Environment
We are subject to various federal, state, and local environmental laws and regulations concerning, among other things, wastewater discharges, air emissions and solid waste disposal. Our manufacturing processes do not emit substantial foreign substances into the environment. We do not believe that our compliance with federal, state, or local statutes or regulations relating to the protection of the environment has any material effect upon capital expenditures, earnings or our competitive position. There can be no assurance, however, that future changes in federal, state, or local regulations, interpretations of existing regulations or the discovery of currently unknown problems or conditions will not require substantial additional expenditures. Similarly, the extent of our liability, if any, for past failures to comply with laws, regulations, and permits applicable to our operations cannot be determined.
Environmental Stewardship
Ennis respects the environment and makes all attempts to protect our natural resources. We believe we comply with all laws and regulations regarding the use and preservation of our land, air, and water. This principle has been part of our Code of Conduct since 2005. Our goal of operating in an environmentally responsible manner aligns with our goals of operating a profitable and responsible business. For example, we recycle waste material generated in our printing processes to generate income from selling the scrap material. We recycled 23.1 million pounds of paper and 2.2 million pounds of cardboard and cores in 2023. Additionally, the use of soy based inks allows us to avoid cleaning solutions that may pose environmental hazards. We use environmentally friendly cleaning agents to insure that our waste water is not contaminated and does not require special disposal.
Many of our plants engage with local energy suppliers to ask for recommendations on lowering energy usage. Participation in these energy audits generally results in replacing old lighting with more efficient LED lighting. Additionally, newer digital technology, which we have implemented in several of our locations, relies on less energy than older web-based presses due to shorter runs and ink jet technology.
6
Another aspect of our business model which reduces carbon emissions is the reduction in transportation costs for our employees, as well as our customers. Approximately 80% of our facilities are located in small towns where the employees are less than 10 miles from the plant, and travel time is minimal. Our geographical dispersion reduces the amount of transportation time and distance associated with delivering our products to our customers. Likewise we use third party transportation and logistical companies to pick up and deliver our products. Partnering with larger shipping organizations that have the scale to be more resourceful and implement more energy efficient delivery methods enables us to ship our products in an efficient and effective manner.
Our primary supplier of paper is vital to our business as they supply raw materials that are minimally altered during the production process. Our primary supplier is SFI, FSC and PEFC certified. The SFI Forest Management Standard covers key values such as protection of biodiversity, species at risk and wildlife habitat; sustainable harvest levels; protection of water quality; and prompt regeneration. FSC certification ensures that products come from responsibly-managed forests that provide environmental, social and economic benefits. PEFC cares for forests globally and locally. They work to protect our forests by promoting sustainable forest management through certification. This means that all can benefit from the many products that forests provide now, while ensuring these forests will be around for generations to come. The Company’s primary paper supplier ensures that all of their supply chain materials are sourced with similar accredited suppliers allowing for more transparency and a more trustworthy supplier commitment to quality, safety and the protection of our natural resources.
Additionally, we use material safety sheets which outline potential hazardous materials so as to minimize the use of more hazardous materials. Given the low and de minimus use of these potentially hazardous materials, our plants generally fit in the lowest category of reporting standards to various state and local environmental agencies. The Company requires facility managers to minimize the use or site storage of any hazardous chemicals. Two thirds of our facilities are categorized as Very Small Quantity Generators and one third are considered Small Quantity Generators under the Environmental Protection Agency’s (“EPA”) hazardous waste regulations. Any hazardous waste generated is stored and properly disposed of in compliance with all EPA regulations and permits.
Two of our largest facilities have solvent recovery systems which allows recovery of press plate washing solutions for re-use. These systems result in a substantial reduction of any hazardous waste. The Company ensures that we are in compliance with applicable state and federal environmental laws on hazardous materials including Proposition 65 in California and federal Conflict Minerals compliance.
Attention to choice of material suppliers, transportation partners, energy usage and avoidance of hazardous wastes that might impact waste water disposal, are part of the business model that improves or avoids damage to the environment we live and work in.
Human Capital
At February 28, 2023, we had 1,919 employees. 167 employees are represented by labor unions under collective bargaining agreements, which are subject to periodic negotiations. We believe we have a good working relationship with all of the unions that represent our employees.
Social Responsibility
Equal Employment Opportunity: Ennis promotes a cooperative and productive work environment by supporting the cultural and ethnic diversity of its workforce and is committed to providing equal employment opportunity to all qualified employees and applicants. Pursuant to our Code of Conduct adopted in 2005 and reviewed at least annually, we do not unlawfully discriminate on the basis of race, color, sex, sexual orientation, religion, national origin, marital status, age, disability, or veteran status in any personnel practice, including recruitment, hiring, training, promotion, and discipline. We are an Equal Opportunity Employer and we comply with all employment laws including Title VII of the Civil Rights Act of 1964, Immigration and Nationality Act, and the Immigration Reform and Control Act. We take allegations of harassment and unlawful discrimination seriously and address all such concerns that are raised regarding our Code of Conduct.
Safety and Health: A safe and clean work environment is important to the well-being of all Ennis employees. Ennis complies with applicable safety and health regulations and appropriate practices. Throughout the year facilities are reviewed monthly to determine if the accidents/injuries that occurred could have been avoided. Incidents are reviewed to determine measures that can be taken to prevent reoccurrence of claims at that facility or another facility. A monthly Facility Report is sent to all facilities reminding them about safety issues and certain claims that have occurred in other locations. Annually, facilities are required to submit an audit of compliance with mandated OSHA safety programs.
7
Facilities that have higher than normal claims are worked with directly or visited by a business director or a representative from our workers’ compensation carrier. Protocols and trainings are in place to protect the health and safety of all our employees. Safety audits are completed throughout the organization. The Company strictly monitors safety issues in all of our facilities, and each facility has someone in charge of review and training of employees on safety issues. Consistent with our culture of promoting workplace safety, our plants take pride in detailing the amount of time since the last safety incident and strive to maintain the lack of an occurrence.
Ennis is dedicated to ensuring that business is conducted ethically. All Ennis management must read, agree with, and sign a Code of Conduct and Ethics policy at least annually.
Each of our locations support local non-profit organizations, educational institutions and youth sport teams based on their local community needs. The majority of our locations are located in suburban or rural communities where the plant is a major employer and supporter of the local economy. Some examples include Midlothian Educational Foundation (Ennis is a founding member), Project Graduation, Toys for Tots, Angel Trees, United Way fundraisers, and youth sport team sponsorships. Additional support includes in-kind donations, volunteer hours and financial support for various local organizations.
Available Information
Our annual report on Form 10-K, quarterly reports on Form 10-Q, current reports on Form 8-K, and amendments to reports filed or furnished pursuant to Section 13(a) or 15(d) of the Securities Exchange Act of 1934 are available free of charge under the Investors Relations page on our website, www.ennis.com, as soon as reasonably practicable after such reports are electronically filed with, or furnished to, the Securities and Exchange Commission (“SEC”). Information on our website is not included as a part of, or incorporated by reference into, this report. Our SEC filings are also available through the SEC’s website, www.sec.gov.
ITEM 1A. RISK FACTORS
You should carefully consider the risks described below, as well as the other information included or incorporated by reference in this Annual Report on Form 10-K, before making an investment in our common stock. The risks described below are not the only ones we face in our business. Additional risks and uncertainties not presently known to us or that we currently believe to be immaterial may also impair our business operations. If any of the following risks occur, our business, financial condition or operating results could be materially harmed. In such an event, our common stock could decline in price and you may lose all or part of your investment.
Risks related to our business and operations
Our results and financial condition are affected by global and local market conditions, and competitors’ pricing strategies, which can adversely affect our sales, margins, and net income.
Our results of operations can be affected by local, national and worldwide market conditions. The consequences of domestic and international economic uncertainty or instability, volatility in commodity markets, and domestic or international policy uncertainty, all of which we have seen in the past, can all impact economic activity. Unfavorable conditions can depress the demand for our products and thus sales in a given market and may prompt competitor’s pricing strategies that adversely affect our margins or constrain our operating flexibility. Certain macroeconomic events, such as crises in the financial markets, could have a more wide-ranging and prolonged impact on the general business environment, which could also adversely affect us. In particular, the COVID-19 pandemic negatively impacted local, national and worldwide economies, and introduced market volatility. Whether we can manage these risks effectively depends on several factors, including (i) our ability to manage movements in commodity prices and the impact of government actions to manage national economic conditions such as consumer spending, inflation rates and unemployment levels, particularly given the past volatility in the global financial markets, (ii) the impact on our margins of labor costs given our labor-intensive business model, the trend toward higher wages in both mature and developing markets and the potential impact of union organizing efforts on day-to-day operations of our manufacturing facilities and (iii) other factors, which may be beyond our control.
8
Digital technologies will continue to erode the demand for our printed business documents.
The increasing sophistication of software, internet technologies, and digital equipment combined with our customers’ general preference, as well as governmental influences for paperless business environments will continue to reduce the number of traditional printed documents sold. Moreover, the documents that will continue to coexist with software applications will likely contain less value-added print content.
Many of our custom-printed documents help companies control their internal business processes and facilitate the flow of information. These applications will increasingly be conducted over the internet or through other electronic payment systems. The predominant method of our customers’ communication to their customers is by printed information. As their customers become more accepting of internet communications, our clients may increasingly opt for what is perceived to be a less costly electronic option, which would reduce our revenue. The pace of these trends is difficult to predict. These factors will tend to reduce the industry-wide demand for printed documents and require us to gain market share to maintain or increase our current level of print-based revenue which could place pressure on our operating margins.
In response to the gradual obsolescence of our standardized forms business, we continue to develop our capability to provide custom and full-color products. If new printing capabilities and new product introductions do not continue to offset the obsolescence of our standardized business forms products, and we are unable to increase our market share, our sales and profits will be affected. Decreases in sales of our standardized business forms and products due to obsolescence could also reduce our gross margins or impact the value of our recorded goodwill and intangible assets. This reduction could in turn adversely impact our profits, unless we are able to offset the reduction through the introduction of new high margin products and services or realize cost savings in other areas.
We obtain our raw materials from a limited number of suppliers, and any disruption in our relationships with these suppliers, or any substantial increase in the price of raw materials or material shortages could have a material adverse effect on us.
We currently purchase the majority of our paper products from one major supplier at favorable costs based on the volume of business, and traditionally we have purchased our paper products from a limited number of suppliers, all of which must meet stringent quality and on-time delivery standards under long-term contracts. Fluctuations in the quality of our paper, unexpected price changes or other factors that relate to our suppliers could have a material adverse effect on our operating results. In particular, the COVID-19 pandemic made it more expensive or more difficult to source raw materials for our products, whether from our existing suppliers or new suppliers. Paper supply and other raw materials were limited, and due to tight demand and supply there was a significant amount of upward pressure on prices.
Paper is a commodity that is subject to frequent increases or decreases in price, and these fluctuations are sometimes significant. The prices for paper and many of our raw materials have been volatile and may continue to increase due to overall inflationary pressure and global market conditions. We believe there is no effective market of derivative instruments to insulate us against unexpected changes in price of paper in a cost-effective manner, and negotiated purchase contracts provide only limited protection against price increases. Generally, when paper prices increase, we attempt to recover the higher costs by raising the prices of our products to our customers. In the price-competitive marketplaces in which we operate, however, we may not always be able to pass through any or all of the higher costs. As such, any significant increase in the price of paper or shortage in its availability could have a material adverse effect on our results of operations.
Challenging financial market conditions and changes in long-term interest rates could adversely impact the funded status of our pension plan.
We maintain a noncontributory defined benefit retirement plan (the “Pension Plan”) covering approximately 13% of our employees. As of February 28, 2023, the Pension Plan was 99% funded on a projected benefit obligation (PBO) basis and 105% on an accumulated benefit obligation (ABO) basis. Included in our financial results are Pension Plan costs that are measured using actuarial valuations. The actuarial assumptions used may differ from actual results. In addition, as our Pension Plan assets are invested in marketable securities, fluctuations in market values can negatively impact our funded status, recorded pension liability, and future required minimum contribution levels. A decline in long-term debt interest rates puts downward pressure on the discount rate used by plan sponsors to determine their pension liabilities. Each 10 basis point change in the discount rate impacts our computed pension liability by approximately $525,000.
9
Similar to fluctuations in market values, a drop in the discount rate can negatively impact our funded status, recorded pension liability and future contribution levels. Also, continued changes in the mortality assumptions can impact our funded status. Additionally, as we experienced in recent months, the number of retirees taking lump sum distributions could be sufficiently high as to cause a settlement charge, which would impact current earnings of the Pension Plan.
We may be unable to identify or to complete acquisitions or to successfully integrate the businesses we acquire.
We have evaluated, and may continue to evaluate, potential acquisition transactions. We attempt to address the potential risks inherent in assessing the attractiveness of acquisition candidates, as well as other challenges such as retaining the employees and integrating the operations of the businesses we acquire. Integrating acquired operations involves significant risks and uncertainties, including maintenance of uniform standards, controls, policies and procedures; diversion of management’s attention from normal business operations during the integration process; unplanned expenses associated with integration efforts; and unidentified issues not discovered in due diligence, including legal contingencies. Due to these risks and others, there can be no guarantee that the businesses we acquire will lead to the cost savings or increases in net sales that we expect or desire. Additionally, there can be no assurance that suitable acquisition opportunities will be available in the future, which could harm our strategic business plan as acquisitions are part of our strategy to offset normal print attrition.
Our distributor customers may be acquired by other manufacturers who redirect business within their plants.
Some of our customers are being absorbed by the distribution channels of some of our manufacturing competitors. However, we do not believe this will significantly impact our business model. We have continued to sell to some of these customers even after they were absorbed by our competition because of the breadth of our product line and our geographic diversity.
Our distributors face increased competition from various sources, such as office supply superstores. Increased competition may require us to reduce prices or to offer other incentives in order to enable our distributors to attract new customers and retain existing customers.
Low price, high value office supply chain stores offer standardized business forms, checks and related products. Because of their size, these superstores have the buying power to offer many of these products at competitive prices. These superstores also offer the convenience of “one-stop” shopping for a broad array of office supplies that our distributors do not offer. In addition, superstores have the financial strength to reduce prices or increase promotional discounts to expand market share. This could result in us reducing our prices or offering incentives in order to enable our distributors to attract new customers and retain existing customers, which could reduce our profits.
We could experience labor disputes, labor shortages and increases in cost of labor that could disrupt our business in the future and impact operating results.
As of February 28, 2023, approximately 8% of our employees are represented by labor unions under collective bargaining agreements, which are subject to periodic negotiations. While we believe we have a good working relationship with all of the unions, there can be no assurance that any future labor negotiations will prove successful, which may result in a significant increase in the cost of labor, or may break down and result in the disruption of our business or operations.
Conditions caused by the COVID-19 pandemic and other economic factors have contributed to tightening and increased competitiveness in the labor market, increasing labor costs. A prolonged labor shortage could potentially adversely affect our business operations and further increase labor costs.
We face intense competition to gain market share, which may lead some competitors to sell substantial amounts of goods at prices against which we cannot profitably compete.
Our marketing strategy is to differentiate ourselves by providing quality service and quality products to our customers. Even if this strategy is successful, the results may be offset by reductions in demand or price declines due to competitors’ pricing strategies or other micro or macro-economic factors. We face the risk of our competition following a strategy of selling its products at or below cost in order to cover some amount of fixed costs, especially in stressed economic times.
10
Environmental regulations may impact our future operating results.
We are subject to extensive and changing federal, state and foreign laws and regulations establishing health and environmental quality standards, concerning, among other things, wastewater discharges, air emissions and solid waste disposal, and may be subject to liability or penalties for violations of those standards. We are also subject to laws and regulations governing remediation of contamination at facilities currently or formerly owned or operated by us or to which we have sent hazardous substances or wastes for treatment, recycling or disposal. We may be subject to future liabilities or obligations as a result of new or more stringent interpretations of existing laws and regulations. In addition, we may have liabilities or obligations in the future if we discover any environmental contamination or liability at any of our facilities, or at facilities we may acquire.
We are subject to taxation related risks.
We are subject to U.S. federal income tax as well as income tax of multiple state jurisdictions. Applicable tax rates and the jurisdictions within which we operate can vary and therefore our effective tax rate may be adversely affected by changes in the mix of our earnings by jurisdiction. We may be subject to audits of our income, sales and other transaction taxes by U.S. federal and state authorities. Outcomes from these audits could have an adverse effect on our financial condition and results of operations.
Income, sales or other tax laws are dynamic and subject to change as new laws are passed and new interpretations of the law are applied. Most recently, on August 16, 2022, legislation commonly known as the Inflation Reduction Act (the "IRA") was signed into law. Among other things, the IRA includes a 1% excise tax on corporate stock repurchases, applicable to repurchases after December 31, 2022, and also a new minimum tax based on book income. The Tax Cuts and Jobs Act enacted on December 22, 2017 resulted in changes in our federal corporate tax rate, our deferred income taxes and limitations on the deductibility of interest expense and executive compensation and the transition of U.S. international taxation from a worldwide tax system to a modified territorial tax system. There may be changes in tax legislation, including a repeal or modification of the Tax Cuts and Jobs Act of 2017, changes in tax rates and tax base such as limiting, phasing-out or eliminating deductions, revising tax law interpretations in jurisdictions, and changes in other tax laws. The U.S. government has proposed changes to increase the tax rates on corporations. All of these factors and uncertainties may adversely affect our results of operations, financial position and cash flows.
We are exposed to the risk of non-payment by our customers on a significant amount of our sales.
Our extension of credit involves considerable judgment and is based on an evaluation of each customer’s financial condition and payment history. We monitor our credit risk exposure by periodically obtaining credit reports and updated financials on our customers. We generally see a heightened amount of bankruptcies by our customers during economic downturns. In particular, the COVID-19 pandemic, and its impact on our customers, could have a negative impact on our collection efforts. While we maintain an allowance for doubtful receivables for potential credit losses based upon our historical trends and other available information, in times of economic turmoil, there is heightened risk that our historical indicators may prove to be inaccurate. The inability to collect on sales to significant customers or a group of customers could have a material adverse effect on our results of operations.
Our business incurs significant freight and transportation costs.
We incur transportation expenses to ship our products to our customers. Significant increases in the costs of freight and transportation could have a material adverse effect on our results of operations, as there can be no assurance that we could pass on these increased costs to our customers. Government regulations can and have impacted the availability of drivers, which will be a significant challenge to the transportation industry. Costs to employ drivers have increased and transportation shortages have become more prevalent. Additionally, the challenge of employing new drivers for the increasingly larger web-based economy could create shortages in trucks and drivers which could impact our sales. During fiscal year 2023, we experienced significantly higher freight and transportation costs as a result of overall inflationary pressures, and transportation and logistics constraints resulting from the COVID-19 pandemic.
11
A natural disaster, catastrophe, pandemic or other unexpected events could adversely affect our operations.
The occurrence of one or more unexpected events, including war, acts of terrorism or violence, civil unrest, epidemics or pandemics, fires, tornadoes, hurricanes, earthquakes, floods and other forms of severe weather in the United States could adversely affect our operations and financial performance. Although we maintain third party insurance against various liability risks and risks of property loss for items we believe are economically reasonable to insure, we could incur uninsured losses and liabilities arising from such events which would adversely affect our results of operations and financial condition.
The COVID-19 pandemic has had and may continue to have adverse effects on our results of operations, financial condition and stock price.
The COVID-19 pandemic caused a significant downturn in global economic activity and subsequently caused significant market volatility and operational challenges. The COVID-19 pandemic and the measures taken by many countries in response have adversely affected and could in the future have a material adverse effect on our business, results of operations, financial condition and stock price. Our sales were significantly impacted by economic conditions driven by the COVID-19 pandemic and resulted in a decrease in sales volume and earnings in fiscal year 2021. While the demand for our products appears to have recovered in 2022 and 2023, economic uncertainties could continue to affect customer demand for our products and services, and the longer term effects of the pandemic, including supply chain disruptions and inflationary pressures are unknown and could have a material adverse effect on our results of operations.
We depend on the reliability of our IT and network infrastructure as well as those of third parties. If these systems fail, our operations may be adversely affected.
We depend on information technology and data processing systems to operate our business, and a significant malfunction or disruption in the operation of our systems may disrupt our business and adversely affect our ability to operate and compete in the markets we serve. This could take various forms, including through the injection of ransomware on our IT infrastructure rendering it inoperable without the payment of some form of cyber currency. These systems include systems that we own and operate, as well as systems of our vendors or other third parties. Such systems are susceptible to ransomware attacks, malfunctions, interruptions and phishing scams, for example. We also periodically upgrade and install new systems, which if installed or programmed incorrectly, may cause significant disruptions. These disruptions could interrupt our operations and adversely affect our results of operations, financial condition and cash flows.
Increasing global cybersecurity attacks and regulatory focus on privacy and security issues could impact our business, expose us to increased liability, subject us to lawsuits, investigations and other liabilities and restrictions on our operations that could significantly and adversely affect our business.
Along with our own data and information in the normal course of our business, we and our customers and partners collect and retain significant volumes of certain types of data, some of which are subject to specific laws and regulations. Complying with varying jurisdictional requirements is becoming increasingly complex and could increase the costs and difficulty of compliance, and violations of applicable data protection laws. Many of our clients provide us with information they consider confidential or sensitive, and many of our client’s industries have established standards for safeguarding the confidentiality, integrity and availability of information relating to their businesses and customers. Data stored in our systems or available through web portals is susceptible to cybercrime or intentional disruption, which have increased globally across all industries in terms of sophistication and frequency. Disclosure of data maintained on our network, a security breach of our systems or other similar events may damage our reputation, subject us to regulatory enforcement action, third party litigation and cause significant reputational or financial harm for our clients and partners. Any of these outcomes may adversely affect our results of operations, financial condition and cash flows.
As previously disclosed, the Company was targeted with an encryption ransomware attack on November 30, 2022. The attack was discovered while it was in process and immediate action was taken to isolate our network to limit the scope of any damage. The attack resulted in a brief disruption to the operation of our systems as we took our servers offline to eradicate the ransomware and restore our data and applications from secure backups. The Company did not communicate with the ransomware threat actor and never considered paying any ransom demand.
12
Instead, the Company eliminated the ransomware and immediately proceeded to restore its critical files and functions. The Company incurred no material expense in connection with the ransomware attack. Based on the information currently known to date, the incident has not had a significant financial impact and the Company does not believe the incident will have a material impact on its business, results of operations or financial condition. Despite us improving our Information Technology General Controls, we cannot give any assurances that the Company will not become the subject of a future more sophisticated, or more harmful attack.
Increases in the cost of employee benefits could impact our financial results and cash flow.
Our expenses relating to employee health benefits are significant. Unfavorable changes in the cost of such benefits could impact our financial results and cash flow. Healthcare costs have risen significantly in recent years, and recent legislative and private sector initiatives regarding healthcare reform could result in significant changes to the U.S. healthcare system. Additionally, the COVID-19 pandemic may result in temporary or permanent healthcare reform measures, would could result in significant cost increases and other negative impacts to our business. While the Company has various cost control measures in place and employs an outside oversight review on larger claims, employee health benefits have been and are expected to continue to be a significant cost to us and may increase due to factors outside the Company’s control.
Risks related to our securities
Because of the volatility in the stock market in general, the market price of our Common Stock will also likely be volatile.
The stock markets have historically experienced price and volume fluctuations that at times have been extreme and have affected, and continue to affect, the market prices of equity securities of many companies. These fluctuations have often been unrelated or disproportionate to the operating performance of those companies. Broad market and industry fluctuations, as well as general economic, political, regulatory and market conditions, may negatively impact the market price of our common stock. If the market price of our Class A common stock falls below your investment price, you may lose some or all of your investment. In the past, companies that have experienced volatility in the marker price of their securities have been subject to securities class action litigation. We may be the target of this type of litigation in the future, which could result in substantial costs and divert our management's attention.
ITEM 1B. UNRESOLVED STAFF COMMENTS
There are no unresolved SEC staff comments.
ITEM 2. PROPERTIES
Our corporate headquarters are located in Midlothian, Texas, and we operate manufacturing facilities throughout the United States. See the table below for additional information regarding our locations.
All of our properties are used for the production, warehousing and shipping of business products, including the following: business forms, flexographic printing, and advertising specialties (Wolfe City, Texas); presentation products (Macomb, Michigan; De Pere, Wisconsin and Columbus, Kansas); printed and electronic promotional media (Denver, Colorado); envelopes (Portland, Oregon; Columbus, Kansas; Tullahoma, Tennessee and Claysburg, Pennsylvania); financial forms (Minneapolis/St. Paul, Minnesota; Nevada, Iowa and Bridgewater, Virginia); and pressure seal products (Visalia, California; Chino, California; Roanoke, Virginia and Clarksville, Tennessee).
Our plants are operated at production levels required to meet our forecasted customer demands. Production levels fluctuate with market demands and depend upon the product mix at any given point in time. Equipment is added as existing machinery becomes obsolete or not repairable, and as new equipment becomes necessary to meet market demands; however, at any given time, these additions and replacements are not considered to be material additions to property, plant and equipment, although such additions or replacements may increase a plant’s efficiency or capacity.
13
All of our facilities are believed to be in good condition. We do not anticipate that substantial expansion, refurbishing, or re-equipping of our facilities will be required in the near future.
All of our rented property is held under leases with original terms of one or more years, expiring at various times through August 2028. Generally, we are able to maintain or renew leases as they expire without significant difficulty, but leases in certain markets may be subject to significant rent increases that necessitate consolidating operations to maintain profitability.
|
|
|
|
Approximate Square Footage |
|
|||||
Location |
|
General Use |
|
Owned |
|
|
Leased |
|
||
Fairhope, Alabama |
|
Manufacturing |
|
|
65,000 |
|
|
|
— |
|
Chino, California |
|
Manufacturing |
|
|
— |
|
|
|
63,016 |
|
Sun City, California |
|
Two Manufacturing Facilities |
|
|
52,617 |
|
|
|
— |
|
Denver, Colorado |
|
One Manufacturing Facility |
|
|
60,000 |
|
|
|
|
|
Lithia Springs, Georgia |
|
Manufacturing |
|
|
— |
|
|
|
40,050 |
|
Harvard, Illinois |
|
Manufacturing and Warehouse |
|
|
42,000 |
|
|
|
|
|
South Elgin, Illinois |
|
Manufacturing |
|
|
— |
|
|
|
70,500 |
|
Indianapolis, Indiana |
|
Two Manufacturing Facilities |
|
|
— |
|
|
|
38,000 |
|
DeWitt, Iowa |
|
Two Manufacturing Facilities |
|
|
95,000 |
|
|
|
— |
|
Nevada, Iowa |
|
Two Manufacturing Facilities |
|
|
232,000 |
|
|
|
— |
|
Columbus, Kansas |
|
Two Manufacturing Facilities and Warehouse |
|
|
174,089 |
|
|
|
— |
|
Ft. Scott, Kansas |
|
Manufacturing |
|
|
86,660 |
|
|
|
— |
|
Girard, Kansas |
|
Manufacturing |
|
|
69,474 |
|
|
|
— |
|
Parsons, Kansas |
|
Manufacturing & One Warehouse |
|
|
122,740 |
|
|
|
40,000 |
|
Macomb, Michigan |
|
Manufacturing |
|
|
56,350 |
|
|
|
— |
|
Brooklyn Park, Minnesota |
|
Manufacturing |
|
|
94,800 |
|
|
|
— |
|
Coon Rapids, Minnesota |
|
Warehouse |
|
|
— |
|
|
|
4,800 |
|
El Dorado Springs, Missouri |
|
Manufacturing |
|
|
70,894 |
|
|
|
— |
|
Fenton, Missouri |
|
Manufacturing |
|
|
— |
|
|
|
26,847 |
|
Marlboro, New Jersey |
|
Manufacturing and Warehouse |
|
|
|
|
|
7,450 |
|
|
Caledonia, New York |
|
Manufacturing and one vacant |
|
|
191,730 |
|
|
|
— |
|
Fairport, New York |
|
Two Manufacturing Facilities |
|
|
40,800 |
|
|
|
— |
|
Coshocton, Ohio |
|
Manufacturing |
|
|
24,750 |
|
|
|
— |
|
Toledo, Ohio |
|
Three Manufacturing Facilities |
|
|
120,947 |
|
|
|
— |
|
Portland, Oregon |
|
Two Manufacturing Facilities |
|
|
— |
|
|
|
261,765 |
|
Claysburg, Pennsylvania |
|
Manufacturing |
|
|
— |
|
|
|
69,000 |
|
Clarksville, Tennessee |
|
Manufacturing |
|
|
51,900 |
|
|
|
— |
|
Powell, Tennessee |
|
Manufacturing |
|
|
43,968 |
|
|
|
— |
|
Tullahoma, Tennessee |
|
Two Manufacturing Facilities |
|
|
142,061 |
|
|
|
— |
|
Arlington, Texas |
|
Two Manufacturing Facilities |
|
|
69,935 |
|
|
|
— |
|
Ennis, Texas |
|
Three Manufacturing Facilities * |
|
|
325,118 |
|
|
|
— |
|
Houston, Texas |
|
Manufacturing |
|
|
— |
|
|
|
29,668 |
|
Wolfe City, Texas |
|
Two Manufacturing Facilities |
|
|
119,259 |
|
|
|
— |
|
Bridgewater, Virginia |
|
Manufacturing |
|
|
— |
|
|
|
25,730 |
|
Chatham, Virginia |
|
Two Manufacturing Facilities |
|
|
127,956 |
|
|
|
— |
|
Roanoke, Virginia |
|
Manufacturing |
|
|
|
|
|
110,000 |
|
|
DePere, Wisconsin |
|
Manufacturing & One Warehouse |
|
|
— |
|
|
|
142,347 |
|
Mosinee, Wisconsin |
|
Manufacturing |
|
|
— |
|
|
|
5,400 |
|
Neenah, Wisconsin |
|
Two Manufacturing Facilities & One Warehouse |
|
|
72,354 |
|
|
|
97,161 |
|
|
|
|
|
|
2,552,402 |
|
|
|
1,031,734 |
|
Corporate Offices |
|
|
|
|
|
|
|
|
||
|
|
|
|
|
|
|
|
|
||
|
|
|
|
|
|
|
|
|
||
Ennis, Texas |
|
Administrative Offices |
|
|
9,300 |
|
|
|
— |
|
Midlothian, Texas |
|
Executive and Administrative Offices |
|
|
28,000 |
|
|
|
— |
|
|
|
|
|
|
37,300 |
|
|
|
— |
|
|
|
Totals |
|
|
2,589,702 |
|
|
|
1,031,734 |
|
* 22,000 square feet of Ennis, Texas location leased From time to time we are involved in various litigation matters arising in the ordinary course of our business.
14
ITEM 3. LEGAL PROCEEDINGS
We do not believe the disposition of any current matter will have a material adverse effect on our consolidated financial position or results of operations.
In April 2023, Crabar/GBF, Inc., a subsidiary of Ennis, was awarded $5.0 million in actual and punitive damages in a case against Wright Printing Company, its owner Mark Wright, and CEO Mardra Sikora. The impact of the Judgment has not been reflected in the accompanying consolidated financial statements as of February 28, 2023.
ITEM 4. MINE SAFETY DISCLOSURES
Not applicable.
PART II
ITEM 5. MARKET FOR REGISTRANT’S COMMON EQUITY, RELATED STOCKHOLDER MATTERS AND ISSUER PURCHASES OF EQUITY SECURITIES
Our common stock is traded on the New York Stock Exchange (“NYSE”) under the trading symbol “EBF”. The following table sets forth the high and low sales prices, the common stock trading volume as reported by the NYSE and dividends per share paid by the Company for the periods indicated:
|
|
|
|
|
|
|
|
Common Stock |
|
|
Dividends |
|
||||
|
|
|
|
|
|
|
|
Trading Volume |
|
|
per share of |
|
||||
|
|
Common Stock Price Range |
|
|
(number of shares |
|
|
Common |
|
|||||||
|
|
High |
|
|
Low |
|
|
in thousands) |
|
|
Stock |
|
||||
Fiscal Year Ended February 28, 2023 |
|
|
|
|
|
|
|
|
|
|
|
|
||||
First Quarter |
|
$ |
19.24 |
|
|
$ |
16.94 |
|
|
|
6,424 |
|
|
$ |
0.250 |
|
Second Quarter |
|
|
22.67 |
|
|
|
16.55 |
|
|
|
7,768 |
|
|
$ |
0.250 |
|
Third Quarter |
|
|
23.44 |
|
|
|
19.81 |
|
|
|
6,238 |
|
|
$ |
0.250 |
|
Fourth Quarter |
|
|
23.48 |
|
|
|
20.55 |
|
|
|
6,131 |
|
|
$ |
0.250 |
|
Fiscal Year Ended February 28, 2022 |
|
|
|
|
|
|
|
|
|
|
|
|
||||
First Quarter |
|
$ |
22.24 |
|
|
$ |
19.99 |
|
|
|
2,703 |
|
|
$ |
0.225 |
|
Second Quarter |
|
|
21.85 |
|
|
|
19.26 |
|
|
|
2,842 |
|
|
$ |
0.250 |
|
Third Quarter |
|
|
20.08 |
|
|
|
17.65 |
|
|
|
5,703 |
|
|
$ |
0.250 |
|
Fourth Quarter |
|
|
20.26 |
|
|
|
18.07 |
|
|
|
5,685 |
|
|
$ |
0.250 |
|
On May 9, 2023, the last reported sale price of our common stock on the NYSE was $19.44, and there were approximately 655 shareholders of record. Cash dividends may be paid, or repurchases of our common stock may be made, from time to time as our Board of Directors (“Board”) deems appropriate, after considering our growth rate, operating results, financial condition, cash requirements, restrictive lending covenants, and such other factors as the Board may deem appropriate.
A dividend of $0.225 per share of our common stock was paid in each quarter of fiscal year 2021 and in the first quarter of fiscal year 2022. A dividend of $0.25 per share of our common stock was paid in each subsequent quarter of fiscal year 2022 and in each quarter of fiscal year 2023.
Dividends are declared at the discretion of the Board and future dividends will depend on our future earnings, cash flow, financial requirements and other factors. The Board does view the dividend as an important aspect of owning Ennis stock and continues to rank it high in priority in allocating the Company's earnings.
Our Board has authorized the repurchase of the Company’s outstanding common stock through a stock repurchase program, which authorized amount is currently up to $40.0 million in the aggregate. Under the repurchase program, purchases may be made from time to time in the open market or through privately-negotiated transactions, depending on market conditions, share price, trading volume and other factors. Repurchases may be commenced or suspended at any time or from time to time without prior notice, provided that any purchases must be made in accordance with applicable insider trading rules and securities laws and regulations. Since the program’s inception in October 2008, we have repurchased 2,213,111 common shares under the program at an average price of $16.25 per share.
15
During our fiscal year 2023, we repurchased 64,082 shares of common stock at an average price of $17.46 per share. As of February 28, 2023, $23.9 million remained available to repurchase shares of common stock under the program.
Stock Performance Graph
The graph below matches Ennis, Inc.'s cumulative 5-Year total shareholder return on common stock with the cumulative total returns of the S&P 500 index and the Russell 2000 index. The graph tracks the performance of a $100 investment in our common stock and in each index (with the reinvestment of all dividends) from 2/28/2018 to 2/28/2023.
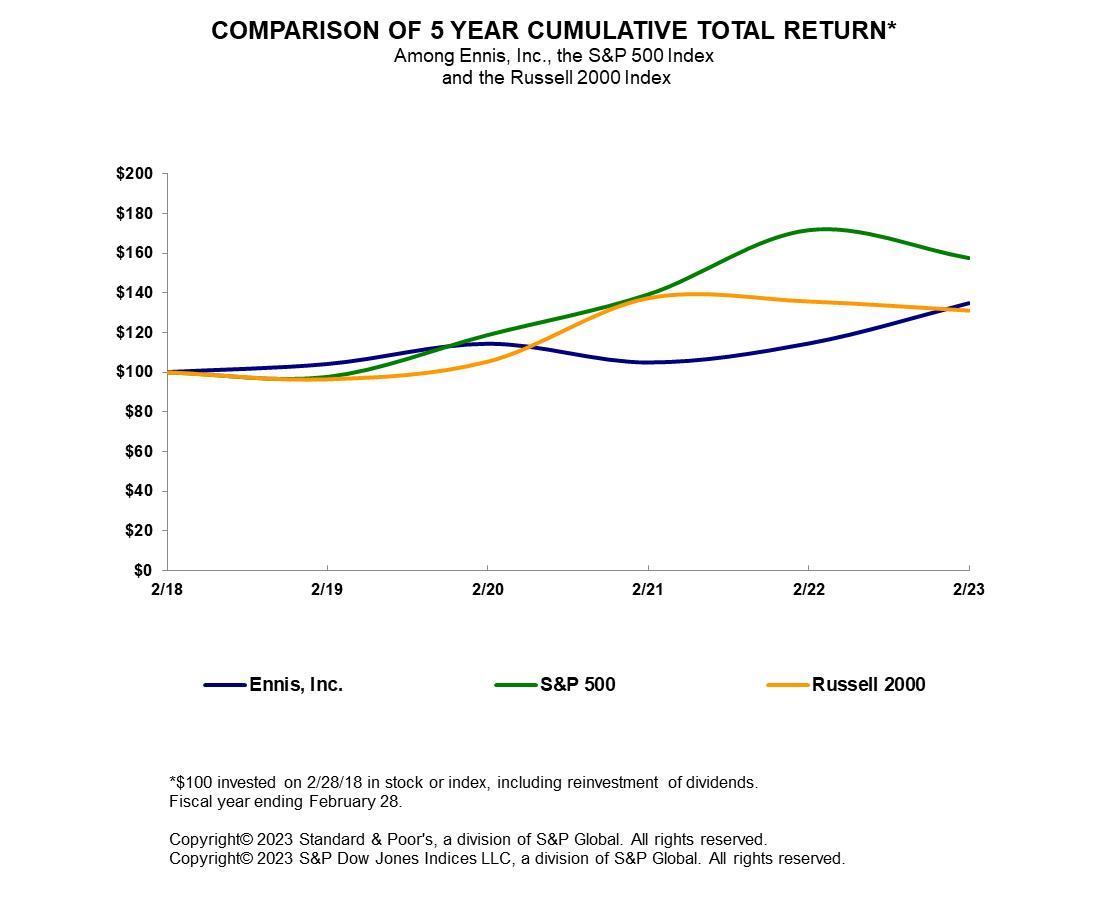
|
|
|
2018 |
|
|
|
2019 |
|
|
|
2020 |
|
|
|
2021 |
|
|
|
2022 |
|
|
|
2023 |
|
Ennis, Inc. |
|
$ |
100.00 |
|
|
$ |
104.14 |
|
|
$ |
114.43 |
|
|
$ |
104.91 |
|
|
$ |
114.56 |
|
|
$ |
135.05 |
|
S&P 500 |
|
|
100.00 |
|
|
|
97.69 |
|
|
|
118.87 |
|
|
|
139.37 |
|
|
|
171.83 |
|
|
|
157.71 |
|
Russell 2000 |
|
|
100.00 |
|
|
|
96.48 |
|
|
|
105.36 |
|
|
|
137.15 |
|
|
|
135.50 |
|
|
|
130.92 |
|
The stock price performance included in this graph is not necessarily indicative of future stock price performance.
16
ITEM 6. [Reserved]
Not applicable.
ITEM 7. MANAGEMENT’S DISCUSSION AND ANALYSIS OF FINANCIAL CONDITION AND RESULTS OF OPERATIONS
This Management’s Discussion and Analysis provides material historical and prospective disclosures intended to enable investors and other users to assess our financial condition and results of operations. Statements that are not historical are forward-looking and involve risk and uncertainties, including those discussed under the caption “Risk Factors” in Item 1A of this Annual Report on Form 10-K and elsewhere in this Report. You should read this discussion and analysis in conjunction with our Consolidated Financial Statements and the related notes appearing elsewhere in this Report. The words “anticipate,” “preliminary,” “expect,” “believe,” “intend” and similar expressions identify forward-looking statements. We believe these forward-looking statements are based upon reasonable assumptions. All such statements involve risks and uncertainties, and as a result, actual results could differ materially from those projected, anticipated, or implied by these statements.
In view of such uncertainties, investors should not place undue reliance on our forward-looking statements since such statements may prove to be inaccurate and speak only as of the date when made. We undertake no obligation to publicly update or revise any forward-looking statements, whether as a result of new information, future events or otherwise.
This Management’s Discussion and Analysis covers the continuing operations of the Company, which are comprised of the production and sale of business forms and other business products. This Management’s Discussion and Analysis includes the following sections:
References to 2023, 2022 and 2021 refer to the fiscal years ended February 28, 2023, February 28, 2022 and February 28, 2021, respectively.
Overview
The Company – Our management believes we are the largest provider of business forms, pressure-seal forms, labels, tags, envelopes, and presentation folders to independent distributors in the United States.
Our Business Challenges – Our industry is currently experiencing consolidation of traditional supply channels, product obsolescence, paper supplier capacity adjustments, and increased pricing and potential supply allocations due to demand/supply curve imbalance. Technology advances have made electronic distribution of documents, internet hosting, digital printing and print-on-demand valid, cost-effective alternatives to traditional custom-printed documents and customer communications. Improved equipment has become more accessible to our competitors. We face highly competitive conditions throughout our supply chain in an already over-supplied, price-competitive print industry. In addition to the risk factors discussed under the caption “Risk Factors” in Item 1A of this Annual Report, some of the key challenges of our business include the following:
17
COVID-19 Pandemic – Our sales were significantly impacted by economic conditions driven by the COVID-19 pandemic and resulted in a decrease in sales volume and earnings in fiscal year 2021. The demand for our products strengthened in fiscal year 2022 and fiscal year 2023, and our sales increased. We were also confronted with rising raw material and logistics costs, delayed delivery times and labor shortages. Despite these challenges, our disciplined cost management and pricing strategies contributed to our improved performance in fiscal year 2022 and 2023. While the markets appear to have recovered from the more direct negative impacts of the pandemic, the longer term effects of the pandemic, including supply chain disruptions and inflationary pressures, are unknown and could have a material adverse effect on our business, results of operations and financial results.
Transformation of our portfolio of products – While traditional business documents are essential in order to conduct business, many are being replaced through the use of cheaper paper grades or imported paper, or devalued with advances in digital technologies, causing steady declines in demand for a portion of our current product line. In addition, the impact of COVID-19 on the speed of this transformation is unknown, but it is expected to accelerate the decline for some of our products. Transforming our product offerings in order to continue to provide innovative, valuable solutions through lower labor and fixed charges to our customers on a proactive basis will require us to make investments in new and existing technology and to develop key strategic business relationships, such as print-on-demand services and product offerings that assist customers in their transition to digital business environments. In addition, we will continue to look for new market opportunities and niches through acquisitions, such as the addition of our envelope offerings, tag offerings, folder offerings, healthcare wristbands, specialty packaging, direct mail, pressure seal products, secure document solutions, innovative in-mold label offerings and long-run integrated products with high color web printing, which provide us with an opportunity for growth and differentiate us from our competition. The ability to make investments in new and existing technology and/or to acquire new market opportunities through acquisitions is dependent on the Company’s liquidity and operational results.
Production capacity and price competition within our industry – Changes in the value of the U.S. dollar can have a significant impact on the pricing and supply of paper. The weakening of the U.S. dollar will usually result in the dissipation of any pricing advantage that foreign imports have over domestic suppliers, which typically results in lower levels of imported papers and an increase in domestic exports. With increased pricing power, domestic paper producers can better control the supply of paper by eliminating capacity or changing the products produced on their large paper machines. The strengthening of the U.S. dollar usually has the opposite effect: more cheap imported paper; less domestic exports; and lower pricing power in the hands of domestic paper producers. Domestic paper suppliers typically seek to balance supply and demand, including by (if possible) taking capacity out of the market, whether by taking production off-line or switching production to alternative paper products. Generally, if mills are running at high capacity, suppliers are able to raise prices. Increased foreign imports and demand declines have currently stabilized price increases of North American printing & writing paper. The extent to which import pressures remain in place will likely play a major role in price stability or decreases. We intend to continue to focus on effectively managing and controlling our product costs through the use of forecasting, production and costing models, as well as working closely with our domestic suppliers to reduce our procurement costs, in order to minimize effects on our operational results. In addition, we will continue to look for ways to reduce and leverage our fixed costs.
Continued consolidation of our customers – Our customers are distributors, many of which are consolidating or are being acquired by competitors. We continue to maintain a majority of the business we have had with our customers historically, but it is possible that these consolidations and acquisitions, which we expect to continue in the future, ultimately will impact our margins and sales.
Critical Accounting Estimates
In preparing our consolidated financial statements, we are required to make estimates and assumptions that affect the disclosures and reported amounts of assets and liabilities at the date of the consolidated financial statements and the reported amounts of revenues and expenses during the reporting period. We evaluate our estimates and judgments on an ongoing basis, including those related to allowance for doubtful receivables, inventory valuations, property, plant and equipment, intangible assets, pension plan obligations, accrued liabilities and income taxes. We base our estimates and judgments on historical experience and on various other factors that we believe to be reasonable under the circumstances. Actual results may differ materially from these estimates under different assumptions or conditions.
18
We believe the following accounting policies are the most critical due to their effect on our more significant estimates and judgments used in preparation of our consolidated financial statements.
Pension Plan – We maintain the Pension Plan for employees. Included in our financial results are Pension Plan costs that are measured using actuarial valuations and requires the use of a number of assumptions. Changes in these assumptions can result in different expense and liability amounts and future actual experience may differ significantly from current expectations.
As our Pension Plan assets are invested in marketable securities, fluctuations in market values could potentially impact our funding status and associated liability recorded. The expected rate of return on assets was unchanged from the 6.50% at February 28, 2022.
Similar to fluctuations in market values, a drop in the discount rate could potentially negatively impact our funded status, recorded pension liability and future contribution levels with the opposite impact occurring for an increase in the discount rate. During fiscal year 2023, the discount rate used to determine the net pension obligations for purposes of our Consolidated Financial Statements increased to 5.00% from 3.10% in fiscal year 2022. The discount rate is reviewed by management annually and is adjusted to reflect movements in the average Mercer and FTSE (formerly Citigroup) pension yield curves for mature pension plans with duration of about 12-15 years. The Company estimated the duration of its pension benefit obligation (PBO) to be approximately 12-15 years. Each 10 basis point change in the discount rate impacts our computed pension liability by about $0.53 million.
Also, continued changes in the mortality assumptions could potentially impact our funded status. For the February 28, 2023 measurement, no change was made to the mortality assumption. While U.S. mortality has been higher in the last couple of years due to the pandemic and other related factors, the mortality assumption is used to estimate the future lifetime of plan participants. Any actual impact on the Pension Plan from the higher than expected mortality has already been recognized in the underlying participant data used to measure the pension liability. The impact on future longevity is still being studied, and there is a general expectation that the current population is a healthier cohort such that mortality rates may return to pre-pandemic levels. This assumption will continue to be monitored.
Goodwill and Other Intangible Assets – Amounts allocated to intangibles and goodwill are determined based on valuation analyses for our acquisitions. Amortizable intangibles are amortized over their expected useful lives. We evaluate these amounts periodically (at least once a year) to determine whether a triggering event has occurred during the year that would indicate potential impairment.
We assess goodwill for impairment annually as of December 1, or more frequently if impairment indicators are present. The Company uses qualitative factors to determine whether it is more likely than not (likelihood of more than 50%) that the fair value of a reporting unit exceeds its carrying amount, including goodwill. Some of the qualitative factors considered in applying this test include consideration of macroeconomic conditions, industry and market conditions, cost factors affecting business, overall financial performance of the business, and performance of the share price of the Company. If qualitative factors are not deemed sufficient to conclude that it is more likely than not that the fair value of the reporting unit exceeds its carrying value, then a one-step approach is applied in making an evaluation. The evaluation utilizes multiple valuation methodologies, including a market approach (market price multiples of comparable companies) and an income approach (discounted cash flow analysis). The computations require management to make significant estimates and assumptions, including, among other things, selection of comparable publicly traded companies, the discount rate applied to future earnings reflecting a weighted average cost of capital, and earnings growth assumptions. A discounted cash flow analysis requires management to make various assumptions about future sales, operating margins, capital expenditures, working capital and growth rates. If the evaluation results in the fair value of the reporting unit being lower than the carrying value, an impairment charge is recorded. A goodwill impairment charge was not required for the fiscal years ended February 28, 2023 or February 28, 2022.
Revenue Recognition – Net sales consist of gross sales invoiced to customers, less certain related charges, including discounts, returns and other allowances. Our allowance for credit losses is based on an analysis that estimates the amount of our total customers receivable balance that is not collectible. This analysis includes assessing a default probability to customers’ receivable balances, which is influenced by several factors including (i) current market conditions, (ii) periodic review of customer credit worthiness, and (iii) review of customer receivable aging and payment trends. While we believe we have exercised prudent judgment and applied reasonable assumptions, there can be no assurance that in the future, changes in economic conditions or other factors would not cause changes in the financial health of our customers.
19
If the financial health of our customers deteriorates, the timing and level of payments received could be impacted and therefore, could result in a change to our estimated losses. Returns, discounts and other allowances have historically been insignificant. In some cases and upon customer request, we print and store custom print product for customer specified future delivery, generally within twelve months. In this case, risk of loss from obsolescence passes to the customer, the customer is invoiced under normal credit terms and revenue is recognized when manufacturing is complete. Approximately $17.1 million, $14.6 million, and $12.5 million of revenue were recognized under these agreements during fiscal years ended 2023, 2022 and 2021, respectively.
Inventories – Our inventories are valued at the lower of cost or net realizable value. We regularly review inventory values on hand, using specific aging categories, and write down inventory deemed obsolete and/or slow-moving based on historical usage and estimated future usage to its estimated net realizable value. As actual future demand or market conditions may vary from those projected by management, adjustments to inventory valuations may be required.
Results of Operations
The following discussion provides information which we believe is relevant to understanding our results of operations and financial condition. The discussion and analysis should be read in conjunction with the accompanying consolidated financial statements and notes thereto. Unless otherwise indicated, this financial overview is for the continuing operations of the Company, which are comprised of the production and sales of business forms and other business products. The operating results of the Company for fiscal year 2023 and the comparative fiscal years 2022 and 2021 are included in the tables below.
Consolidated Summary
Consolidated Statements of |
|
Fiscal years ended |
|
|||||||||||||||||||||
Operations - Data (in thousands) |
|
2023 |
|
|
2022 |
|
|
2021 |
|
|||||||||||||||
Net sales |
|
$ |
431,837 |
|
|
|
100.0 |
% |
|
$ |
400,014 |
|
|
|
100.0 |
% |
|
$ |
357,973 |
|
|
|
100.0 |
% |
Cost of goods sold |
|
|
300,787 |
|
|
|
69.7 |
|
|
|
285,291 |
|
|
|
71.3 |
|
|
|
254,207 |
|
|
|
71.0 |
|
Gross profit margin |
|
|
131,050 |
|
|
|
30.3 |
|
|
|
114,723 |
|
|
|
28.7 |
|
|
|
103,766 |
|
|
|
29.0 |
|
Selling, general and administrative |
|
|
70,793 |
|
|
|
16.4 |
|
|
|
71,410 |
|
|
|
17.9 |
|
|
|
68,270 |
|
|
|
19.1 |
|
Gain from disposal of assets |
|
|
(5,896 |
) |
|
|
(1.4 |
) |
|
|
(271 |
) |
|
|
(0.1 |
) |
|
|
(405 |
) |
|
|
(0.1 |
) |
Income from operations |
|
|
66,153 |
|
|
|
15.3 |
|
|
|
43,584 |
|
|
|
10.9 |
|
|
|
35,901 |
|
|
|
10.0 |
|
Other expense |
|
|
(1,223 |
) |
|
|
(0.3 |
) |
|
|
(1,640 |
) |
|
|
(0.4 |
) |
|
|
(2,614 |
) |
|
|
(0.7 |
) |
Earnings before income taxes |
|
|
64,930 |
|
|
|
15.0 |
|
|
|
41,944 |
|
|
|
10.5 |
|
|
|
33,287 |
|
|
|
9.3 |
|
Provision for income taxes |
|
|
17,630 |
|
|
|
4.1 |
|
|
|
12,962 |
|
|
|
3.2 |
|
|
|
9,193 |
|
|
|
2.6 |
|
Net earnings |
|
$ |
47,300 |
|
|
|
11.0 |
% |
|
$ |
28,982 |
|
|
|
7.2 |
% |
|
$ |
24,094 |
|
|
|
6.7 |
% |
Net Sales. Our net sales increased from $400.0 million for fiscal year 2022 to $431.8 million for fiscal year 2023, an increase of 8%. The increase was attributable to $3.3 million in revenues from our recent acquisitions as well as price and volume increases that were partially offset by reduced volumes in the fourth quarter. The acquisition of AmeriPrint, and School Photo Marketing, is an integral part of our strategy to offset normal industry revenue declines due to print attrition and other changes.
Our net sales increased from $358.0 million for fiscal year 2021 to $400.0 million for fiscal year 2022, an increase of 11.7%. Our sales for the period partially rebounded from the impact on economic conditions driven by the COVID-19 pandemic and resulted in an increase in sales volume. The acquisition of AmeriPrint, which was completed in June 2021, is an integral part of our strategy to offset normal industry revenue declines due to print attrition and other changes. Our acquisitions during fiscal years 2021 and 2022 positively impacted our net sales by approximately $23.9 million during fiscal year 2022 compared to 2021.
Cost of Goods Sold. Our manufacturing costs increased from $285.3 million for fiscal year 2022 to $300.8 million for fiscal year 2023, or 5.4%. Our gross profit margin (“margin”) increased from 28.7% for fiscal year 2022 to 30.3% for fiscal year 2023. Improved operational efficiencies and pricing adjustments to cover inflationary costs, primarily of paper, supplies and labor, contributed to improve our gross profit margin as a percentage of sales.
20
Our manufacturing costs increased from $254.2 million for fiscal year 2021 to $285.3 million for fiscal year 2022, or 12.2%. Our margin decreased slightly from 29.0% for fiscal year 2021 to 28.7% for fiscal year 2022. Paper supply has grown more limited and due to tight demand and supply, there has been a significant amount of upward pressure on prices. We have been adjusting our pricing to cover paper inflation during the year, but the increased backlog of unproduced orders created timing issues which had an impact on our gross profit margins.
Selling, general, and administrative expenses. Our selling, general, and administrative (“SG&A”) expenses decreased approximately 0.9%, from $71.4 million for fiscal year 2022 to $70.8 million for fiscal year 2023. As a percentage of sales, SG&A expenses declined from 17.9% in fiscal year 2022 to 16.4% for fiscal year 2023. Our SG&A expense decreased as a result of operational efficiencies and intangible assets fully amortized in fiscal year 2022 partially offset by increased bonus expense.
Our SG&A expenses increased approximately 4.5%, from $68.3 million for fiscal year 2021 to $71.4 million for fiscal year 2022. As a percentage of sales, SG&A expenses declined from 19.1% in fiscal year 2021 to 17.9% for fiscal year 2022. Our acquisitions negatively impacted our SG&A expenses by approximately $2.3 million SG&A during fiscal year 2022.
(Gain) loss from disposal of assets. The $5.9 million gain from disposal of assets for fiscal 2023 is primarily from the sale of an unused manufacturing facility, $5.8 million, and $0.1 million of manufacturing equipment. The $0.3 million gain from disposal of assets for fiscal year 2022 is primarily related to the sale of an unused manufacturing facility and manufacturing equipment. The $0.4 million gain from disposal of assets for fiscal year 2021 is primarily attributed to the $.5 million gain on the sale of land and manufacturing facilities offset by approximately a $0.1 million loss in the sale of manufacturing equipment.
Income from operations. Primarily due to factors described above, our income from operations for fiscal year 2023 increased 51.8% to $66.2 million, or 15.3% of net sales, from $43.6 million, or 10.9% of net sales in 2022, and increased 21.4% to $43.6 million, or 10.9% of net sales, compared to $35.9 million, or 10.0% of net sales, for fiscal year 2021.
Other income (expense). Other expense was $1.2 million for fiscal year 2023 compared to $1.6 million for fiscal year 2022. The decrease in expense was primarily related to higher non-service cost components of net periodic benefit costs relating to pension expense offset by an increase in interest income from higher interest rates in fiscal year 2023. Other expense was $1.6 million for fiscal year 2022 compared to expense of $2.6 million for fiscal year 2021. The decrease in expense was primarily related to decrease in pension expense.
Provision for income taxes. Our effective tax rates for fiscal years 2023, 2022 and 2021 were 27.2%, 30.9%, and 27.6%, respectively. The higher effective tax rate for fiscal year 2022 was primarily the result of distributions during the year from our deferred compensation plan which was terminated in fiscal year 2021.
Net earnings. Net earnings were $47.3 million, or $1.82 per diluted share for fiscal year 2023, as compared to $29.0 million, or $1.11 per diluted share for fiscal year 2022. Net earnings were impacted by increased revenues and a $5.8 million gain from disposal of assets that added $0.17 per share. Net earnings were $29.0 million, or $1.11 per diluted share for fiscal year 2022, as compared to $24.1 million, or $0.93 per share for fiscal year 2021. Our acquisitions of Infoseal and AmeriPrint added $23.9 million in revenues and $0.08 in diluted earnings per share for the fiscal year compared to the corresponding prior year.
Liquidity and Capital Resources
We rely on our cash flows generated from operations to meet cash requirements of our business. The primary cash requirements of our business are payments to vendors in the normal course of business, capital expenditures, contributions to our noncontributory defined benefit plan and the payment of dividends to our shareholders. We expect to generate sufficient cash flows from operations to cover our operating and capital requirements for the foreseeable future.
21
|
|
Fiscal Years Ended |
|
|||||||||
(Dollars in thousands) |
|
2023 |
|
|
2022 |
|
|
2021 |
|
|||
Working Capital |
|
$ |
155,379 |
|
|
$ |
127,839 |
|
|
$ |
113,022 |
|
Cash |
|
$ |
93,968 |
|
|
$ |
85,606 |
|
|
$ |
75,190 |
|
Working Capital. Our working capital increased by approximately $27.5 million, or 21.5%, from $127.8 million at February 28, 2022 to $155.4 million at February 2023. Our current ratio, calculated by dividing our current assets by our current liabilities, increased from 4.4 to 1.0 for fiscal year 2022 to 4.8 to 1.0 for fiscal year 2023. Our increase in working capital primarily reflects the increase in cash, $8.4 million, accounts receivable $14.5 million, and inventory $8.3 million, offset by the increase in our accounts payable and accrued expense.
Our working capital increased by approximately $14.8 million, or 13.1%, from $113.0 million at February 28, 2021 to $127.8 million at February 28, 2022. Our current ratio, calculated by dividing our current assets by our current liabilities, increased from 4.2-to-1.0 for fiscal year 2021 to 4.4-to-1.0 for fiscal year 2022. Our increase in working capital primarily reflects the increase in cash, $10.4 million, accounts receivable $1.1 million and inventory $5.6 million offset by the increase in our accounts payable, $1.9 million.
Cash Flow Components
|
|
Fiscal years ended |
|
|||||||||
(Dollars in thousands) |
|
2023 |
|
|
2022 |
|
|
2021 |
|
|||
Net cash provided by operating activities |
|
$ |
46,776 |
|
|
$ |
50,678 |
|
|
$ |
52,817 |
|
Net cash used in investing activities |
|
$ |
(11,457 |
) |
|
$ |
(10,052 |
) |
|
$ |
(21,183 |
) |
Net cash used in financing activities |
|
$ |
(26,957 |
) |
|
$ |
(30,210 |
) |
|
$ |
(24,702 |
) |
Cash flows from operating activities. Cash provided by operating activities was $46.8 million for fiscal year 2023 (a decrease of $3.9 million compared to fiscal year 2022), $50.7 million for fiscal year 2022 (a decrease of $2.1 million compared to fiscal year 2021) and $52.8 million for fiscal year 2021.
Our decreased operational cash flows in fiscal year 2023 compared to fiscal year 2022 was primarily the result of a $3.4 million decrease from inventories, $8.2 million decrease from our accounts receivable, $5.9 million gain from disposal of assets and a $5.0 million decrease from deferred tax liability offset by $18.3 million in increased earnings.
Our decreased operational cash flows in fiscal year 2022 compared to fiscal year 2021 was primarily the result of a $7.6 million decrease from inventories and a $7.2 million decrease from our accounts receivable offset by a $4.9 million increase from our accounts payable and accrued expenses, and a $4.9 million increase in net earnings.
Cash flows from investing activities. Cash used in investing activities was $11.5 million in fiscal year 2023 compared to $10.1 million in fiscal year 2022, and $21.2 million in fiscal year 2021. The $1.4 million decrease in cash used in fiscal year 2023 compared to fiscal year 2022 was primarily due to a $2.2 million decrease in capital expenditures and $0.8 million increase in proceeds from disposal of plant and property, offset by a $4.4 million increase in costs to acquire businesses The $11.1 million increase in cash used in fiscal year 2022 compared to fiscal year 2021 was primarily due to a $14.9 million decrease in costs to acquire businesses offset by $2.9 million increase in capital expenditures.
Cash flows from financing activities. Cash used in financing activities was $27.0 million in fiscal year 2023 compared to $30.2 million in fiscal year 2022 and $24.7 million used in fiscal year 2021.
The decrease in our cash used in financing activities in fiscal year 2023 was primarily due to a $3.7 million decrease of common stock repurchases. The increase in our cash used in financing activities in fiscal year 2022 compared to fiscal year 2021 resulted from two factors: (i) an increase of $3.6 million of common stock repurchases; and (ii) the payment of $2.0 million more in dividends in fiscal year 2022 compared to fiscal year 2021.
22
Stock Repurchase – The Board has authorized the repurchase of the Company’s outstanding common stock through a stock repurchase program, which authorized amount is currently up to $40.0 million in the aggregate. Under the repurchase program, purchases may be made from time to time in the open market or through privately-negotiated transactions, depending on market conditions, share price, trading volume and other factors. Repurchases may be commenced or suspended at any time or from time to time without prior notice, provided that any purchases must be made in accordance with applicable insider trading rules and securities laws and regulations. Since the program’s inception in October 2008, we have repurchased 2,213,111 common shares under the program at an average price of $16.25 per share. During our fiscal year 2023, we repurchased 64,082 shares of common stock at an average price of $17.46 per share. As of February 28, 2023, $23.9 million remained available to repurchase shares of the Company’s common stock under the program. The Company expects to continue to repurchase its shares under the repurchase program during fiscal year 2024 provided that the Board determines such repurchases to be in the best interests of the Company and its shareholders.
Credit Facility – We did not renew our Credit Agreement, which expired November 11, 2021. We have had no outstanding long-term debt under the revolving credit line, since paid in August 2019. As of February 28, 2023, we had $0.6 million outstanding under a standby letter of credit arrangement secured by a cash collateral bank account. It is anticipated that our cash and funds from operating cash flows will be sufficient to fund anticipated future expenditures.
Pension Plan – The funded status of our Pension Plan is dependent on many factors, including returns on invested assets, the level of market interest rates and the level of funding. The assumptions used to calculate the pension funding deficit are different from the assumption used to determine the net pension obligations for purposes of our Consolidated Financial Statements. The funding of our Pension Plan is governed by the Employee Retirement Income Security Act of 1974 (“ERISA”), as amended, and the Internal Revenue Code and is also subject to the Moving Ahead for Progress in the 21st Century Act, the Highway and Transportation Funding Act of 2014, the Bipartisan Budget Act of 2015, and the American Rescue Plan Act of 2021. Under these regulations, the liabilities are discounted using 25-year average corporate bond rates within a specified corridor. For the period ended February 28, 2023, the specified corridor around the 25-year average was 5%. We made a contribution of $2.0 million to our Pension Plan in fiscal year 2023 and $1.0 million in fiscal year 2022. There was no contribution required or made in fiscal year 2021. Given our funding status as of February 28, 2023 and absent any significant negative event, we anticipate that our future contributions will be between $1.0 million and $3.0 million per year, depending on our Pension Plan’s funding.
Inventories – We believe our current inventory levels are sufficient to satisfy our customer demands and we anticipate having adequate sources of raw materials to meet future business requirements. We have long-term contracts in effect with paper suppliers that govern prices, but do not require minimum purchase commitments. Certain of our rebate programs do, however, require minimum purchase volumes. Management anticipates meeting the required volumes.
Capital Expenditures – We expect our capital expenditure requirements for fiscal year 2024, exclusive of capital required for possible acquisitions, will be in line with our historical levels of between $3.0 million and $5.0 million. We expect to fund these expenditures through existing cash flows. We expect to generate sufficient cash flows from our operating activities to cover our operating and other normal capital requirements for the foreseeable future.
Contractual Obligations – There have been no significant changes in our contractual obligations since February 28, 2023 that have, or that are reasonably likely to have, a material impact on our results of operations or financial condition. The following table represents our contractual commitments as of February 28, 2023 (in thousands).
|
|
|
|
|
Due in less |
|
|
Due in |
|
|
Due in |
|
|
Due in more |
|
|||||
|
|
Total |
|
|
than 1 year |
|
|
1-3 years |
|
|
4-5 years |
|
|
than 5 years |
|
|||||
Estimated pension benefit payments to Pension Plan participants |
|
$ |
36,100 |
|
|
$ |
3,000 |
|
|
$ |
6,700 |
|
|
$ |
6,500 |
|
|
$ |
19,900 |
|
Letters of credit |
|
|
583 |
|
|
|
583 |
|
|
|
— |
|
|
|
— |
|
|
|
— |
|
Operating leases |
|
|
14,174 |
|
|
|
5,349 |
|
|
|
7,504 |
|
|
|
1,321 |
|
|
|
— |
|
Total |
|
$ |
50,857 |
|
|
$ |
8,932 |
|
|
$ |
14,204 |
|
|
$ |
7,821 |
|
|
$ |
19,900 |
|
23
ITEM 7A. QUANTITATIVE AND QUALITATIVE DISCLOSURES ABOUT MARKET RISK
Market Risk
Interest Rates
From time to time, we are exposed to interest rate risk on short-term and long-term financial instruments carrying variable interest rates. We may from time to time utilize interest rate swaps to manage overall borrowing costs and reduce exposure to adverse fluctuations in interest rates. We do not use derivative instruments for trading purposes. While we had no outstanding debt at February 28, 2023, we will be exposed to interest rate risk if we borrow under a credit facility in the future.
This market risk discussion contains forward-looking statements. Actual results may differ materially from this discussion based upon general market conditions and changes in domestic and global financial markets.
ITEM 8. CONSOLIDATED FINANCIAL STATEMENTS AND SUPPLEMENTARY DATA
Our Consolidated Financial Statements and Supplementary Data required by this Item 8 are set forth following the signature page of this report and are incorporated herein by reference.
ITEM 9. CHANGES IN AND DISAGREEMENTS WITH ACCOUNTANTS ON ACCOUNTING AND FINANCIAL DISCLOSURE
None.
ITEM 9A. CONTROLS AND PROCEDURES
Disclosure Controls and Procedures
A review and evaluation was carried out under the supervision and with the participation of our management, including our Chief Executive Officer and our Chief Financial Officer, of the effectiveness of the design and operation of our “disclosure controls and procedures” (as such term is defined in Rules 13a-15(e) and 15d-15(e) of the Securities Exchange Act of 1934, as amended (the “Exchange Act”)) as of February 28, 2023. Based upon that review and evaluation, we have concluded that our disclosure controls and procedures were effective as of February 28, 2023.
Management’s Report on Internal Control over Financial Reporting
The financial statements, financial analysis and all other information in this Annual Report on Form 10-K were prepared by management, who is responsible for their integrity and objectivity and for establishing and maintaining adequate internal controls over financial reporting.
The Company’s internal control over financial reporting is designed to provide reasonable assurance regarding the reliability of financial reporting and the preparation of financial statements for external purposes in accordance with accounting principles generally accepted in the United States of America. The Company’s internal control over financial reporting includes those policies and procedures that:
i. Pertain to the maintenance of records that, in reasonable detail, accurately and fairly reflect the transactions and dispositions of assets of the Company;
ii. Provide reasonable assurance that transactions are recorded as necessary to permit preparation of financial statements in accordance with generally accepted accounting principles, and that receipts and expenditures of the Company are being made only in accordance with authorizations of management and directors of the Company; and
iii. Provide reasonable assurance regarding prevention or timely detection of unauthorized acquisition, use, or disposition of the Company’s assets that could have a material effect on the financial statements.
There are inherent limitations in the effectiveness of any internal control, including the possibility of human error and the circumvention or overriding of controls. Accordingly, even effective internal controls can provide only reasonable assurances with respect to financial statement preparation. Further, because of changes in conditions, the effectiveness of internal controls may vary over time.
24
Management assessed the design and effectiveness of the Company’s internal control over financial reporting as of February 28, 2023. In making this assessment, management used the criteria set forth by the Committee of Sponsoring Organizations of the Treadway Commission (“COSO”) in the 2013 Internal Control—Integrated Framework (“2013 COSO framework”). Based on management’s assessment using those criteria, we believe that, as of February 28, 2023, the Company’s internal control over financial reporting is effective.
In conducting our evaluation, we excluded the assets and liabilities and results of operations of SPM, which we acquired on November 30, 2022, in accordance with the SEC’s guidance concerning the reporting of internal controls over financial reporting in connection with a material acquisition. The assets and revenues resulting from this acquisition constituted less than 1 and 1 percent, respectively, of the related consolidated financial statement amounts as of and for the year ended February 28, 2023.
Changes in Internal Controls
As previously disclosed in Item 4 of our Quarterly Report on Form 10-Q for the quarter ended November 30, 2022, management identified there were deficiencies in certain aspects of our information technology controls that permitted a threat actor to gain access to the Company's network on November 30, 2022 and subsequently launch a ransomware attack that resulted in the encryption of some of the Company's servers and desktop computers. While the encryption attack did not result in any impairment of the Company's financial data in its ERP system, the deficiencies in our network access IT controls that made our network vulnerable to the ransomware attack constituted a material weakness. Subsequently, the Company has taken corrective action to remediate and address the network access IT control deficiencies that permitted the cyber-attack. The Company added in its systems various new controls to strengthen our cybersecurity. Based on testing performed by management, implemented controls are designed and operating effectively and the material weakness has been remediated as of February 28, 2023.
Except for the changes noted above in connection with the initiatives to remediate the material weakness, there have been no changes in our internal control over financial reporting identified in connection with the evaluation required by paragraph (d) of Exchange Act Rules 13a-15 or 15d-15 that occurred during our last fiscal quarter that have materially affected, or are reasonably likely to materially affect, our internal control over financial reporting.
CohnReznick, an independent registered public accounting firm, has audited the consolidated financial statements of the Company for the fiscal year ended February 28, 2023 and has attested to the effectiveness of the Company’s internal control over financial reporting as of February 28, 2023. Their report on the effectiveness of internal control over financial reporting is presented on page F-3 of this Annual Report on Form 10-K.
ITEM 9B. OTHER INFORMATION
None.
ITEM 9C. DISCLOSURE REGARDING FOREIGN JURISDICTION THAT PREVENT INSPECTIONS
Not Applicable.
25
PART III
ITEM 10. DIRECTORS, EXECUTIVE OFFICERS AND CORPORATE GOVERNANCE
Except as set forth below, the information required by Item 10 is incorporated herein by reference to the definitive Proxy Statement for our 2023 Annual Meeting of Shareholders, including “Election of Directors”, “Corporate Governance”, “Executive Officers” and “Delinquent Section 16(a) Reports.”
The SEC and the NYSE have issued multiple regulations requiring policies and procedures in the corporate governance area. In complying with these regulations, it has been the goal of the Company’s Board and senior leadership to do so in a way which does not inhibit or constrain the Company’s unique culture, and which does not unduly impose a bureaucracy of forms and checklists. Accordingly, formal, written policies and procedures have been adopted in the simplest possible way, consistent with legal requirements, including a Code of Ethics applicable to the Company’s principal executive officer, principal financial officer, and principal accounting officer or controller. The Company’s Corporate Governance Guidelines, its charters for each of its Audit, Compensation, Nominating and Corporate Governance Committees and its Code of Ethics covering all employees are available on the Company’s website, www.ennis.com, and a copy will be mailed upon request to Investor Relations at 2441 Presidential Parkway, Midlothian, TX 76065. If we make any substantive amendments to the Code of Ethics, or grant any waivers to the Code of Ethics for any of our senior officers or directors, we will disclose such amendment or waiver on our website and in a report on Form 8-K.
ITEM 11. EXECUTIVE COMPENSATION
The information required by Item 11 is hereby incorporated herein by reference to the definitive Proxy Statement for our 2023 Annual Meeting of Shareholders.
ITEM 12. SECURITY OWNERSHIP OF CERTAIN BENEFICIAL OWNERS AND MANAGEMENT AND RELATED STOCKHOLDER MATTERS
The information required by Item 12, as to certain beneficial owners and management, is hereby incorporated by reference to the definitive Proxy Statement for our 2023 Annual Meeting of Shareholders.
The information required by Item 13 is hereby incorporated herein by reference to the definitive Proxy Statement for our 2023 Annual Meeting of Shareholders.
ITEM 14. PRINCIPAL ACCOUNTANT FEES AND SERVICES
The information required by Item 14 is hereby incorporated herein by reference to the definitive Proxy Statement for our 2023 Annual Meeting of Shareholders.
26
PART IV
ITEM 15. EXHIBITS AND FINANCIAL STATEMENT SCHEDULES
The following documents are filed as part of this report.
An “Index to Consolidated Financial Statements” has been filed as a part of this Report beginning on page F-1 hereof.
Exhibit Number |
|
Description |
|
|
|
Exhibit 3.1(a) |
|
|
|
|
|
Exhibit 3.1(b) |
|
|
|
|
|
Exhibit 3.2 |
|
|
|
|
|
Exhibit 4.1 |
|
Description of Ennis, Inc. Securities Registered under Section 12 of the Exchange Act of 1934.* |
|
|
|
Exhibit 10.1 |
|
|
|
|
|
Exhibit 10.2 |
|
|
|
|
|
Exhibit 10.3 |
|
|
|
|
|
Exhibit 21 |
|
|
|
|
|
Exhibit 23.1 |
|
|
|
|
|
Exhibit 23.2 |
|
|
|
|
|
Exhibit 31.1 |
|
Certification Pursuant to Rule 13a-14(a) of Chief Executive Officer.* |
|
|
|
Exhibit 31.2 |
|
Certification Pursuant to Rule 13a-14(a) of Chief Financial Officer.* |
|
|
|
Exhibit 32.1 |
|
|
|
|
|
Exhibit 32.2 |
|
|
|
|
|
Exhibit 101 |
|
The following information from Ennis, Inc.’s Annual Report on Form 10-K for the year ended February 28, 2023, filed on May 12, 2023, formatted as Inline XBRL: (i) Consolidated Balance Sheets, (ii) Consolidated Statements of Operations, (iii) Consolidated Statements of Comprehensive Income, (iv) Consolidated Statements of Changes in Shareholders’ Equity, (v) Consolidated Statements of Cash Flows, and (vi) the Notes to Consolidated Financial Statements, tagged as blocks of text and in detail. |
|
|
|
Exhibit 104 |
|
Cover Page Interactive Data File (formatted as Inline XBRL and contained in Exhibit 101). |
* Filed herewith.
** Furnished herewith.
+ Represents a management contract or a compensatory plan or arrangement.
27
SIGNATURES
Pursuant to the requirements of Section 13 or 15(d) of the Securities Exchange Act of 1934, the Registrant has duly caused this report to be signed on its behalf by the undersigned, thereunto duly authorized.
|
ENNIS, INC. |
|
|
|
|
Date: May 12, 2023 |
|
/s/ KEITH S. WALTERS |
|
|
Keith S. Walters, Chairman of the Board, |
|
|
Chief Executive Officer and President |
|
|
|
Date: May 12, 2023 |
|
/s/ VERA BURNETT |
|
|
Vera Burnett |
|
|
Chief Financial Officer, Treasurer and Principal Financial and Accounting Officer |
Pursuant to the requirements of the Securities Exchange Act of 1934, this report has been signed below by the following persons on behalf of the Registrant and in the capacities and on the dates indicated.
Date: May 12, 2023 |
|
/s/ KEITH S. WALTERS |
|
|
Keith S. Walters, Chairman of the Board, Chief Executive Officer and President |
|
|
|
Date: May 12, 2023 |
|
/s/ JOHN R. BLIND |
|
|
John R. Blind, Director |
|
|
|
Date: May 12, 2023 |
|
/s/ AARON CARTER |
|
|
Aaron Carter, Director |
|
|
|
Date: May 12, 2023 |
|
/s/ BARBARA T. CLEMENS |
|
|
Barbara T. Clemens, Director |
|
|
|
Date: May 12, 2023 |
|
/s/ MARGARET A. WALTERS |
|
|
Margaret A. Walters, Director |
|
|
|
Date: May 12, 2023 |
|
/s/ GARY S. MOZINA |
|
|
Gary S. Mozina, Director |
|
|
|
Date: May 12, 2023 |
|
/s/ TROY L. PRIDDY |
|
|
Troy L. Priddy, Director |
|
|
|
Date: May 12, 2023 |
|
/s/ ALEJANDRO QUIROZ |
|
|
Alejandro Quiroz, Director |
|
|
|
Date: May 12, 2023 |
|
/s/ MICHAEL J. SCHAEFER |
|
|
Michael J. Schaefer, Director |
|
|
|
Date: May 12, 2023 |
|
/s/ VERA BURNETT |
|
|
Vera Burnett, Principal Financial and Accounting Officer |
28
ENNIS, INC. AND SUBSIDIARIES
Index to Consolidated Financial Statements
F-1
REPORT OF INDEPENDENT REGISTERED PUBLIC ACCOUNTING FIRM
Board of Directors and Shareholders
Ennis, Inc.
Opinion on the financial statements
We have audited the accompanying consolidated balance sheet of Ennis, Inc. and subsidiaries (the “Company”) as of February 28, 2023, and the related consolidated statements of operations, comprehensive income, changes in shareholders’ equity, and cash flows for the year then ended, and the related notes (collectively referred to as the “consolidated financial statements”). In our opinion, the financial statements present fairly, in all material respects, the financial position of the Company as of February 28, 2023, and the results of its operations and its cash flows for the year then ended in conformity with accounting principles generally accepted in the United States of America.
We also have audited, in accordance with the standards of the Public Company Accounting Oversight Board (United States) (“PCAOB”), the Company’s internal control over financial reporting as of February 28, 2023, based on criteria established in Internal Control—Integrated Framework (2013) issued by the Committee of Sponsoring Organizations of the Treadway Commission (“COSO”), and our report dated May 12, 2023 expressed an unqualified opinion.
Basis for opinion
These financial statements are the responsibility of the Company’s management. Our responsibility is to express an opinion on the Company’s financial statements based on our audit. We are a public accounting firm registered with the PCAOB and are required to be independent with respect to the Company in accordance with the U.S. federal securities laws and the applicable rules and regulations of the Securities and Exchange Commission and the PCAOB.
We conducted our audit in accordance with the standards of the PCAOB. Those standards require that we plan and perform the audit to obtain reasonable assurance about whether the financial statements are free of material misstatement, whether due to error or fraud. Our audit included performing procedures to assess the risks of material misstatement of the financial statements, whether due to error or fraud, and performing procedures that respond to those risks. Such procedures included examining, on a test basis, evidence regarding the amounts and disclosures in the financial statements. Our audit also included evaluating the accounting principles used and significant estimates made by management, as well as evaluating the overall presentation of the financial statements. We believe that our audit provides a reasonable basis for our opinion.
Critical audit matter
Critical audit matters are matters arising from the current period audit of the financial statements that were communicated or required to be communicated to the audit committee and that: (1) relate to accounts or disclosures that are material to the financial statements and (2) involved our especially challenging, subjective, or complex judgments. We determined that there are no critical audit matters.
/s/ CohnReznick LLP
We have served as the Company’s auditor since November 2022.
Dallas, Texas
May 12, 2023
F-2
REPORT OF INDEPENDENT REGISTERED PUBLIC ACCOUNTING FIRM
Board of Directors and Shareholders
Ennis, Inc.
Opinion on Internal Control Over Financial Reporting
We have audited the internal control over financial reporting of Ennis, Inc. and subsidiaries (the “Company”) as of February 28, 2023, based on criteria established in Internal Control—Integrated Framework (2013) issued by the Committee of Sponsoring Organizations of the Treadway Commission (“COSO”). In our opinion, the Company maintained, in all material respects, effective internal control over financial reporting as of February 28, 2023, based on criteria established in Internal Control—Integrated Framework (2013) issued by COSO.
As indicated in the accompanying Management’s Report on Internal Control over Financial Reporting, management’s assessment of and conclusion on the effectiveness of internal control over financial reporting did not include the internal controls of School Photo Marketing (“SPM”), which is consolidated starting the acquisition date November 30, 2022 in the consolidated financial statements of the Company and constituted less than 1% of net sales for the year then ended February 28, 2023. Our audit of internal control over financial reporting of the Company also did not include an evaluation of the internal control over financial reporting of SPM.
We also have audited, in accordance with the standards of the Public Company Accounting Oversight Board (United States) (“PCAOB”), the consolidated balance sheet and the related consolidated statements of operations, comprehensive income, changes in shareholders’ equity, and cash flows of the Company and our report dated May 12, 2023 expressed and unqualified opinion.
Basis for opinion
The Company’s management is responsible for maintaining effective internal control over financial reporting, and for its assessment of the effectiveness of internal control over financial reporting, included in the accompanying Management’s Report on Internal Control over Financial Reporting. Our responsibility is to express an opinion on the entity’s internal control over financial reporting based on our audit. We are a public accounting firm registered with the PCAOB and are required to be independent with respect to the Company in accordance with the U.S. federal securities laws and the applicable rules and regulations of the Securities and Exchange Commission and the PCAOB.
We conducted our audit in accordance with the standards of the PCAOB. Those standards require that we plan and perform the audit to obtain reasonable assurance about whether effective internal control over financial reporting was maintained in all material respects. Our audit of internal control over financial reporting included obtaining an understanding of internal control over financial reporting, assessing the risk that a material weakness exists, and testing and evaluating the design and operating effectiveness of internal control based on the assessed risk. Our audit also included performing such other procedures as we considered necessary in the circumstances. We believe that our audit provides a reasonable basis for our opinion.
Definition and limitations of internal control over financial reporting
An entity’s internal control over financial reporting is a process designed to provide reasonable assurance regarding the reliability of financial reporting and the preparation of financial statements for external purposes in accordance with accounting principles generally accepted in the United States of America. An entity’s internal control over financial reporting includes those policies and procedures that (1) pertain to the maintenance of records that, in reasonable detail, accurately and fairly reflect the transactions and dispositions of the assets of the entity; (2) provide reasonable assurance that transactions are recorded as necessary to permit preparation of financial statements in accordance with accounting principles generally accepted in the United States of America, and that receipts and expenditures of the entity are being made only in accordance with authorizations of management and directors of the entity; and (3) provide reasonable assurance regarding prevention or timely detection of unauthorized acquisition, use, or disposition of the entity’s assets that could have a material effect on the financial statements.
F-3
Because of its inherent limitations, internal control over financial reporting may not prevent or detect misstatements. Also, projections of any evaluation of effectiveness to future periods are subject to the risk that controls may become inadequate because of changes in conditions, or that the degree of compliance with the policies or procedures may deteriorate.
/s/ CohnReznick LLP
Dallas, Texas
May 12, 2023
F-4
REPORT OF INDEPENDENT REGISTERED PUBLIC ACCOUNTING FIRM
Board of Directors and Shareholders
Ennis, Inc.
Opinion on the financial statements
We have audited the accompanying consolidated balance sheets of Ennis, Inc. (a Texas corporation) and subsidiaries (the “Company”) as of February 28, 2022, the related consolidated statements of operations, comprehensive income, changes in shareholders’ equity, and cash flows for the years ended February 28, 2022 and 2021, and the related notes (collectively referred to as the “financial statements”). In our opinion, the financial statements present fairly, in all material respects, the financial position of the Company as of February 28, 2022, and the results of its operations and its cash flows for the years ended February 28, 2022 and 2021, in conformity with accounting principles generally accepted in the United States of America.
Basis for opinion
These financial statements are the responsibility of the Company’s management. Our responsibility is to express an opinion on the Company’s financial statements based on our audit. We are a public accounting firm registered with the Public Company Accounting Oversight Board (United States) (“PCAOB”) and are required to be independent with respect to the Company in accordance with the U.S. federal securities laws and the applicable rules and regulations of the Securities and Exchange Commission and the PCAOB.
We conducted our audit in accordance with the standards of the PCAOB. Those standards require that we plan and perform the audit to obtain reasonable assurance about whether the financial statements are free of material misstatement, whether due to error or fraud. Our audit included performing procedures to assess the risks of material misstatement of the financial statements, whether due to error or fraud, and performing procedures that respond to those risks. Such procedures included examining, on a test basis, evidence regarding the amounts and disclosures in the financial statements. Our audit also included evaluating the accounting principles used and significant estimates made by management, as well as evaluating the overall presentation of the financial statements. We believe that our audit provides a reasonable basis for our opinion.
/s/ GRANT THORNTON LLP
We served as the Company’s auditor from 2005 to 2022.
Dallas, Texas
May 9, 2022
F-5
ENNIS, INC. AND SUBSIDIARIES
CONSOLIDATED BALANCE SHEETS
(in thousands)
|
|
|
|
February 28, |
|
|
||
|
|
2023 |
|
|
2022 |
|
||
Assets |
|
|
|
|
|
|
||
Current assets |
|
|
|
|
|
|
||
Cash |
|
$ |
93,968 |
|
|
$ |
85,606 |
|
Accounts receivable, net |
|
|
53,507 |
|
|
|
39,022 |
|
Inventories, net |
|
|
46,834 |
|
|
|
38,538 |
|
Prepaid expenses |
|
|
2,317 |
|
|
|
1,863 |
|
Total current assets |
|
|
196,626 |
|
|
|
165,029 |
|
Property, plant and equipment |
|
|
|
|
|
|
||
Plant, machinery and equipment |
|
|
153,074 |
|
|
|
151,126 |
|
Land and buildings |
|
|
59,163 |
|
|
|
59,642 |
|
Computer equipment and software |
|
|
18,832 |
|
|
|
18,368 |
|
Other |
|
|
4,292 |
|
|
|
4,275 |
|
Total property, plant and equipment |
|
|
235,361 |
|
|
|
233,411 |
|
Less accumulated depreciation |
|
|
187,572 |
|
|
|
179,778 |
|
Net property, plant and equipment |
|
|
47,789 |
|
|
|
53,633 |
|
Operating lease right-of-use assets, net |
|
|
13,133 |
|
|
|
15,544 |
|
Goodwill |
|
|
91,819 |
|
|
|
88,677 |
|
Intangible assets, net |
|
|
44,088 |
|
|
|
45,569 |
|
Other assets |
|
|
380 |
|
|
|
392 |
|
Total assets |
|
$ |
393,835 |
|
|
$ |
368,844 |
|
See accompanying notes to consolidated financial statements.
F-6
ENNIS, INC. AND SUBSIDIARIES
CONSOLIDATED BALANCE SHEETS-continued
(in thousands, except for par value and share amounts)
|
|
|
|
February 28, |
|
|
||
|
|
2023 |
|
|
2022 |
|
||
Liabilities and Shareholders’ Equity |
|
|
|
|
|
|
||
Current liabilities |
|
|
|
|
|
|
||
Accounts payable |
|
$ |
18,333 |
|
|
$ |
16,678 |
|
Accrued expenses |
|
|
18,067 |
|
|
|
15,422 |
|
Current portion of operating lease liabilities |
|
|
4,847 |
|
|
|
5,090 |
|
Total current liabilities |
|
|
41,247 |
|
|
|
37,190 |
|
Liability for pension benefits |
|
|
646 |
|
|
|
5,729 |
|
Deferred income taxes |
|
|
11,098 |
|
|
|
11,405 |
|
Operating lease liabilities, net of current portion |
|
|
8,162 |
|
|
|
10,241 |
|
Other liabilities |
|
|
1,250 |
|
|
|
464 |
|
Total liabilities |
|
|
62,403 |
|
|
|
65,029 |
|
Shareholders’ equity |
|
|
|
|
|
|
||
Common stock $2.50 par value, authorized 40,000,000 shares; issued 30,053,443 shares at February 28, 2023 and 2022 |
|
|
75,134 |
|
|
|
75,134 |
|
Additional paid-in capital |
|
|
125,887 |
|
|
|
123,990 |
|
Retained earnings |
|
|
219,459 |
|
|
|
197,998 |
|
Accumulated other comprehensive loss: |
|
|
|
|
|
|
||
Minimum pension liability, net of taxes |
|
|
(14,104 |
) |
|
|
(18,587 |
) |
Treasury stock |
|
|
(74,944 |
) |
|
|
(74,720 |
) |
Total shareholders’ equity |
|
|
331,432 |
|
|
|
303,815 |
|
Total liabilities and shareholders' equity |
|
$ |
393,835 |
|
|
$ |
368,844 |
|
See accompanying notes to consolidated financial statements.
F-7
ENNIS, INC. AND SUBSIDIARIES
CONSOLIDATED STATEMENTS OF OPERATIONS
(in thousands, except share and per share amounts)
|
|
Fiscal Years Ended |
|
|||||||||
|
|
2023 |
|
|
2022 |
|
|
2021 |
|
|||
Net sales |
|
$ |
431,837 |
|
|
$ |
400,014 |
|
|
$ |
357,973 |
|
Cost of goods sold |
|
|
300,787 |
|
|
|
285,291 |
|
|
|
254,207 |
|
Gross profit |
|
|
131,050 |
|
|
|
114,723 |
|
|
|
103,766 |
|
Selling, general and administrative |
|
|
70,793 |
|
|
|
71,410 |
|
|
|
68,270 |
|
Gain from disposal of assets |
|
|
(5,896 |
) |
|
|
(271 |
) |
|
|
(405 |
) |
Income from operations |
|
|
66,153 |
|
|
|
43,584 |
|
|
|
35,901 |
|
Other income (expense) |
|
|
|
|
|
|
|
|
|
|||
Interest expense |
|
|
- |
|
|
|
(9 |
) |
|
|
(11 |
) |
Other, net |
|
|
(1,223 |
) |
|
|
(1,631 |
) |
|
|
(2,603 |
) |
Total other income (expense) |
|
|
(1,223 |
) |
|
|
(1,640 |
) |
|
|
(2,614 |
) |
Earnings from operations before income taxes |
|
|
64,930 |
|
|
|
41,944 |
|
|
|
33,287 |
|
Income tax expense |
|
|
17,630 |
|
|
|
12,962 |
|
|
|
9,193 |
|
Net earnings |
|
$ |
47,300 |
|
|
$ |
28,982 |
|
|
$ |
24,094 |
|
Weighted average common shares outstanding |
|
|
|
|
|
|
|
|
|
|||
Basic |
|
|
25,818,737 |
|
|
|
26,026,477 |
|
|
|
25,995,127 |
|
Diluted |
|
|
25,951,141 |
|
|
|
26,109,341 |
|
|
|
25,995,127 |
|
Earnings per share |
|
|
|
|
|
|
|
|
|
|||
Basic |
|
$ |
1.83 |
|
|
$ |
1.11 |
|
|
$ |
0.93 |
|
Diluted |
|
$ |
1.82 |
|
|
$ |
1.11 |
|
|
$ |
0.93 |
|
Cash dividends per share |
|
$ |
1.00 |
|
|
$ |
0.975 |
|
|
$ |
0.90 |
|
See accompanying notes to consolidated financial statements.
F-8
ENNIS, INC. AND SUBSIDIARIES
CONSOLIDATED STATEMENTS OF COMPREHENSIVE INCOME
(in thousands)
|
|
Fiscal Years Ended |
|
|||||||||
|
|
2023 |
|
|
2022 |
|
|
2021 |
|
|||
Net earnings |
|
$ |
47,300 |
|
|
$ |
28,982 |
|
|
$ |
24,094 |
|
Adjustment to pension, net of taxes |
|
|
4,483 |
|
|
|
1,695 |
|
|
|
4,924 |
|
Comprehensive income |
|
$ |
51,783 |
|
|
$ |
30,677 |
|
|
$ |
29,018 |
|
See accompanying notes to consolidated financial statements.
F-9
ENNIS, INC. AND SUBSIDIARIES
FOR THE FISCAL YEARS ENDED 2021, 2022, AND 2023
(in thousands, except share and per share amounts)
|
|
|
|
|
|
|
|
|
|
|
|
|
Accumulated |
|
|
|
|
|
|
|
|
|
|
||||||||
|
|
|
|
|
|
|
Additional |
|
|
|
|
|
Other |
|
|
|
|
|
|
|
|
|
|
||||||||
|
Common Stock |
|
|
Paid-in |
|
|
Retained |
|
|
Comprehensive |
|
|
Treasury Stock |
|
|
|
|
||||||||||||||
|
Shares |
|
|
Amount |
|
|
Capital |
|
|
Earnings |
|
|
Income (Loss) |
|
|
Shares |
|
|
Amount |
|
|
Total |
|
||||||||
Balance March 1, 2020 |
|
30,053,443 |
|
|
$ |
75,134 |
|
|
$ |
123,052 |
|
|
$ |
193,809 |
|
|
$ |
(25,206 |
) |
|
|
(4,136,286 |
) |
|
$ |
(72,460 |
) |
|
$ |
294,329 |
|
Net earnings |
|
— |
|
|
|
— |
|
|
|
— |
|
|
|
24,094 |
|
|
|
— |
|
|
|
— |
|
|
|
— |
|
|
|
24,094 |
|
Adjustment to pension, net of deferred tax of $1,641 |
|
— |
|
|
|
— |
|
|
|
— |
|
|
|
— |
|
|
|
4,924 |
|
|
|
— |
|
|
|
— |
|
|
|
4,924 |
|
Dividends paid ($0.90 per share) |
|
— |
|
|
|
— |
|
|
|
— |
|
|
|
(23,467 |
) |
|
|
— |
|
|
|
— |
|
|
|
— |
|
|
|
(23,467 |
) |
Stock based compensation |
|
— |
|
|
|
— |
|
|
|
1,243 |
|
|
|
— |
|
|
|
— |
|
|
|
— |
|
|
|
— |
|
|
|
1,243 |
|
Exercise of stock options and restricted stock |
|
— |
|
|
|
— |
|
|
|
(1,278 |
) |
|
|
— |
|
|
|
— |
|
|
|
110,652 |
|
|
|
1,939 |
|
|
|
661 |
|
Common stock repurchases |
|
— |
|
|
|
— |
|
|
|
— |
|
|
|
— |
|
|
|
— |
|
|
|
(77,996 |
) |
|
|
(1,235 |
) |
|
|
(1,235 |
) |
Balance February 28, 2021 |
|
30,053,443 |
|
|
$ |
75,134 |
|
|
$ |
123,017 |
|
|
$ |
194,436 |
|
|
$ |
(20,282 |
) |
|
|
(4,103,630 |
) |
|
$ |
(71,756 |
) |
|
$ |
300,549 |
|
Net earnings |
|
— |
|
|
|
— |
|
|
|
— |
|
|
|
28,982 |
|
|
|
— |
|
|
|
— |
|
|
|
— |
|
|
|
28,982 |
|
Adjustment to pension, net of deferred tax of $565 |
|
— |
|
|
|
— |
|
|
|
— |
|
|
|
— |
|
|
|
1,695 |
|
|
|
— |
|
|
|
— |
|
|
|
1,695 |
|
Dividends paid ($0.975 per share) |
|
— |
|
|
|
— |
|
|
|
— |
|
|
|
(25,420 |
) |
|
|
— |
|
|
|
— |
|
|
|
— |
|
|
|
(25,420 |
) |
Stock based compensation |
|
— |
|
|
|
— |
|
|
|
2,799 |
|
|
|
— |
|
|
|
— |
|
|
|
— |
|
|
|
— |
|
|
|
2,799 |
|
Exercise of stock options and restricted stock |
|
— |
|
|
|
— |
|
|
|
(1,826 |
) |
|
|
— |
|
|
|
— |
|
|
|
104,485 |
|
|
|
1,826 |
|
|
|
— |
|
Common stock repurchases |
|
— |
|
|
|
— |
|
|
|
— |
|
|
|
— |
|
|
|
— |
|
|
|
(254,679 |
) |
|
|
(4,790 |
) |
|
|
(4,790 |
) |
Balance February 28, 2022 |
|
30,053,443 |
|
|
$ |
75,134 |
|
|
$ |
123,990 |
|
|
$ |
197,998 |
|
|
$ |
(18,587 |
) |
|
|
(4,253,824 |
) |
|
$ |
(74,720 |
) |
|
$ |
303,815 |
|
Net earnings |
|
— |
|
|
|
— |
|
|
|
— |
|
|
|
47,300 |
|
|
|
— |
|
|
|
— |
|
|
|
— |
|
|
|
47,300 |
|
Adjustment to pension, net of deferred tax of $1,494 |
|
— |
|
|
|
— |
|
|
|
— |
|
|
|
— |
|
|
|
4,483 |
|
|
|
— |
|
|
|
— |
|
|
|
4,483 |
|
Dividends paid ($1.00 per share) |
|
— |
|
|
|
— |
|
|
|
— |
|
|
|
(25,839 |
) |
|
|
— |
|
|
|
— |
|
|
|
— |
|
|
|
(25,839 |
) |
Stock based compensation |
|
— |
|
|
|
— |
|
|
|
2,791 |
|
|
|
— |
|
|
|
— |
|
|
|
— |
|
|
|
— |
|
|
|
2,791 |
|
Exercise of stock options and restricted stock |
|
— |
|
|
|
— |
|
|
|
(894 |
) |
|
|
— |
|
|
|
— |
|
|
|
51,071 |
|
|
|
894 |
|
|
|
— |
|
Common stock repurchases |
|
— |
|
|
|
— |
|
|
|
— |
|
|
|
— |
|
|
|
— |
|
|
|
(64,082 |
) |
|
|
(1,118 |
) |
|
|
(1,118 |
) |
Balance February 28, 2023 |
|
30,053,443 |
|
|
$ |
75,134 |
|
|
$ |
125,887 |
|
|
$ |
219,459 |
|
|
$ |
(14,104 |
) |
|
|
(4,266,835 |
) |
|
$ |
(74,944 |
) |
|
$ |
331,432 |
|
See accompanying notes to consolidated financial statements.
F-10
ENNIS, INC. AND SUBSIDIARIES
CONSOLIDATED STATEMENTS OF CASH FLOWS
(in thousands)
|
|
Fiscal Years Ended |
||||
|
|
2023 |
|
2022 |
|
2021 |
Cash flows from operating activities: |
|
|
|
|
|
|
Net earnings |
|
$47,300 |
|
$28,982 |
|
$24,094 |
Adjustments to reconcile net earnings to net |
|
|
|
|
|
|
Depreciation |
|
10,180 |
|
10,396 |
|
9,922 |
Amortization of intangible assets |
|
7,176 |
|
8,381 |
|
8,115 |
Gain from disposal of assets |
|
(5,896) |
|
(271) |
|
(405) |
Bad debt expense, net of recoveries |
|
663 |
|
429 |
|
1,044 |
Stock based compensation |
|
2,791 |
|
2,799 |
|
1,243 |
Deferred income taxes |
|
(1,801) |
|
3,162 |
|
(2,713) |
Net pension expense |
|
894 |
|
1,690 |
|
3,928 |
Changes in operating assets and liabilities, net of the effects |
|
|
|
|
|
|
Accounts receivable, net of non-cash item discussed in Note 15 in 2023 |
|
(9,245) |
|
(1,036) |
|
6,117 |
Prepaid expenses and income taxes |
|
(370) |
|
(257) |
|
2,100 |
Inventories |
|
(7,780) |
|
(4,400) |
|
3,187 |
Other assets |
|
(563) |
|
(19) |
|
(124) |
Accounts payable and accrued expenses |
|
3,334 |
|
1,533 |
|
(3,340) |
Other liabilities |
|
93 |
|
(711) |
|
(351) |
Net cash provided by operating activities |
|
46,776 |
|
50,678 |
|
52,817 |
Cash flows from investing activities: |
|
|
|
|
|
|
Capital expenditures |
|
(4,332) |
|
(6,537) |
|
(3,679) |
Purchase of businesses, net of cash acquired |
|
(8,767) |
|
(4,340) |
|
(19,202) |
Proceeds from disposal of plant and property |
|
1,642 |
|
825 |
|
1,698 |
Net cash used in investing activities |
|
(11,457) |
|
(10,052) |
|
(21,183) |
Cash flows from financing activities: |
|
|
|
|
|
|
Dividends paid |
|
(25,839) |
|
(25,420) |
|
(23,467) |
Common stock repurchases |
|
(1,118) |
|
(4,790) |
|
(1,235) |
Net cash used in financing activities |
|
(26,957) |
|
(30,210) |
|
(24,702) |
Net change in cash |
|
8,362 |
|
10,416 |
|
6,932 |
Cash at beginning of period |
|
85,606 |
|
75,190 |
|
68,258 |
Cash at end of period |
|
$93,968 |
|
$85,606 |
|
$75,190 |
See accompanying notes to consolidated financial statements.
F-11
ENNIS, INC. AND SUBSIDIARIES
NOTES TO CONSOLIDATED FINANCIAL STATEMENTS
(1) Significant Accounting Policies and General Matters
Nature of Operations. Ennis, Inc. and its wholly owned subsidiaries (collectively, the “Company”) are principally engaged in the production of and sale of business forms and other printed products to customers primarily located in the United States.
Basis of Consolidation. The consolidated financial statements include the accounts of the Company and its wholly owned subsidiaries. All significant intercompany accounts and transactions have been eliminated. The Company’s last three fiscal years ended on the following days: February 28, 2023, February 28, 2022 and February 28, 2021 (fiscal years ended 2023, 2022 and 2021, respectively).
Segment Reporting. The Company operates as one segment, in which management uses one measure of profitability, and all of the Company’s assets are located in the United States of America. The Company does not operate separate lines of business or separate business entities. Accordingly, the Company does not have separately reportable segments.
Accounts Receivable. Trade receivables are uncollateralized customer obligations due under normal trade terms requiring payment generally within 30 days from the invoice date. The Company’s allowance for doubtful receivables reserve is based on an analysis that estimates the amount of its total customer receivable balance that is not collectible. This analysis includes assessing a default probability to customers’ receivable balances, which is influenced by several factors including (i) current market conditions, (ii) periodic review of customer credit worthiness, and (iii) review of customer receivable aging and payment trends.
Inventories. With the exception of approximately 6.1% and 7.9% of its inventories valued at the lower of last-in, first-out ("LIFO") for fiscal years 2023 and 2022, respectively, the Company values its inventories at the lower of first-in, first-out ("FIFO") cost or net realizable value. The Company regularly reviews inventories on hand, using specific aging categories, and writes down the carrying value of its inventories for excess and potentially obsolete inventories based on historical usage and estimated future usage. In assessing the ultimate realization of its inventories, the Company is required to make judgments as to future demand requirements. As actual future demand or market conditions may vary from those projected by the Company, adjustments to inventories may be required. The Company provides reserves for excess and obsolete inventory when necessary based upon analysis of quantities on hand, recent sales volumes and reference to market prices.
Long-Lived Assets. Long-lived assets are reviewed for impairment whenever events or changes in circumstances indicate that the carrying amount of an asset may not be recoverable. Recoverability of assets to be held and used is measured by a comparison of the carrying amount of an asset to future undiscounted net cash flows expected to be generated by the asset. If such assets are considered to be impaired, the impairment to be recognized is based upon the fair value of assets.
Property, Plant and Equipment. Depreciation and amortization of property, plant and equipment is calculated using the straight-line method over a period considered adequate to amortize the total cost over the useful lives of the assets, which range from 3 to 11 years for machinery and equipment and 10 to 33 years for buildings and improvements. Leasehold improvements are amortized over the shorter of the lease term or the estimated useful life of the improvements. Repairs and maintenance are expensed as incurred. Renewals and betterments are capitalized and depreciated over the remaining life of the specific property unit. The Company capitalizes all leases that are in substance acquisitions of property.
Goodwill and Other Intangible Assets. Goodwill is the excess of the purchase price paid over the value of net assets of businesses acquired and is not amortized. Intangible assets are amortized on a straight-line basis over their estimated useful lives. Goodwill is evaluated for impairment on an annual basis, or more frequently if impairment indicators arise, using a quantitative or qualitative fair-value-based test that compares the fair value of the related business unit to its carrying value.
F-12
ENNIS, INC. AND SUBSIDIARIES
NOTES TO CONSOLIDATED FINANCIAL STATEMENTS
Fair Value of Financial Instruments. Certain assets and liabilities are required to be recorded at fair value on a recurring basis. Fair value is determined based on the exchange price that would be received for an asset or transferred for a liability (an exit price) in the principal or most advantageous market for the asset or liability in an orderly transaction between market participants. The carrying amounts of cash, accounts receivables, and accounts payable approximate fair value because of the short maturity and/or variable rates associated with these instruments. The Company categorizes each of its fair value measurements in one of these three levels based on the lowest level input that is significant to the fair value measurement in its entirety. These levels are:
Level 1 - Inputs utilize quoted prices (unadjusted) in active markets for identical assets or liabilities that the Company has the ability to access.
Level 2 - Inputs utilize data points that are observable such as quoted prices, interest rates and yield curves.
Level 3 - Inputs are unobservable data points for the asset or liability, and include situations where there is little, if any, market activity for the asset or liability.
Treasury Stock. The Company accounts for repurchases of common stock using the cost method with common stock in treasury classified in the consolidated balance sheets as a reduction of shareholders’ equity.
Revenue Recognition.
Nature of Revenues
Substantially all of the Company’s revenue from contracts with customers consist of the sale of commercial printing products in the continental United States and is primarily recognized at a point in time in an amount that reflects the consideration the Company expects to be entitled to in exchange for those goods. Revenue from the sale of commercial printing products, including shipping and handling fees billed to customers, is recognized upon the transfer of control to the customer, which is generally upon shipment to the customer when the terms of the sale are FOB shipping point, or, to a lesser extent, upon delivery to the customer if the terms of the sale are FOB destination. Net sales represent gross sales invoiced to customers, less certain related charges, including sales tax, discounts, returns and other allowances. Returns, discounts and other allowances have historically been insignificant.
In a small number of cases and upon customer request, the Company prints and stores commercial printing product for customer specified future delivery, generally within the same year as the product is manufactured. In this case, revenue is recognized upon the transfer of control when manufacturing is complete and title and risk of ownership is passed to the customer. Approximately $17.1 million, $14.6 million and $12.5 million of revenue was recognized under these arrangements during fiscal years 2023, 2022 and 2021, respectively.
Storage revenue for certain customers may be recognized over time rather than at a point in time. The amount of storage revenue is immaterial to the consolidated financial statements. As the output method for measure of progress is determined to be appropriate, the Company recognizes revenue in the amount for which it has the right to invoice for revenue that is recognized over time and for which it demonstrates that the invoiced amount corresponds directly with the value to the customer for the performance completed to date.
The Company does not disaggregate revenue and operates in one sales category consisting of commercial printed product revenue, which is reported as net sales on the consolidated statements of operations. The Company does not have material contract assets and contract liabilities as of February 28, 2023.
Significant Judgments
Generally, the Company’s contracts with customers are comprised of a written quote and customer purchase order or statement of work, and governed by the Company’s trade terms and conditions. In certain instances, it may be further supplemented by separate pricing agreements and customer incentive arrangements, which typically only affect the contract’s transaction price. Contracts do not contain a significant financing component as payment terms on invoiced amounts are typically between 30 to 90 days, based on the Company’s credit assessment of individual customers, as well as industry expectations.
F-13
ENNIS, INC. AND SUBSIDIARIES
NOTES TO CONSOLIDATED FINANCIAL STATEMENTS
Product returns are not significant.
From time to time, the Company may offer incentives to its customers considered to be variable consideration including volume-based rebates or early payment discounts. Customer incentives considered to be variable consideration are recorded as a reduction to revenue as part of the transaction price at contract inception when there is a basis to reasonably estimate the amount of the incentive and only to the extent that it is probable that a significant reversal of any incremental revenue will not occur. Customer incentives are allocated entirely to the single performance obligation of transferring printed product to the customer and are not considered material.
For customers with terms of FOB shipping point, the Company accounts for shipping and handling activities performed after the control of the printed product has been transferred to the customer as a fulfillment cost. The Company accrues for the costs of shipping and handling activities if revenue is recognized before contractually agreed shipping and handling activities occur.
The Company’s contracts with customers are generally short-term in nature. Accordingly, the Company does not disclose the value of unsatisfied performance obligations nor the timing of revenue recognition.
Advertising Expenses. The Company expenses advertising costs as incurred. Catalog and brochure preparation and printing costs, which are considered direct response advertising, are amortized to expense over the life of the catalog, which typically ranges from three to twelve months. Advertising expense was approximately $0.6 million, $0.9 million and $0.8 million during the fiscal years ended 2023, 2022 and 2021, respectively, and is included in selling, general and administrative expenses in the Consolidated Statements of Operations.
Income Taxes. Deferred tax assets and liabilities are recognized for the estimated future tax consequences attributable to differences between the financial statement carrying amounts of existing assets and liabilities and their respective tax bases and operating loss and tax credit carry forwards. Deferred tax assets and liabilities are measured using enacted tax rates expected to apply to taxable income in the years in which those temporary differences are expected to be recovered or settled. The effect on deferred tax assets and liabilities of a change in tax rates is recognized in income in the period that includes the enactment date. In the event the Company determines that its deferred tax assets, more likely than not, will not be realized in the future, the valuation adjustment to the deferred tax assets will be charged to earnings in the period in which the Company makes such a determination.
Earnings Per Share. Basic earnings per share is computed by dividing net earnings by the weighted average number of common shares outstanding during the period. Diluted earnings per share is computed by dividing net earnings by the weighted average number of common shares outstanding, and then adding the number of additional shares that would have been outstanding if potentially dilutive securities had been issued. This is calculated using the treasury stock method. No options were outstanding at the end of fiscal years 2023, 2022 and 2021. The dilutive shares for restricted stock grants are included in the computation for basic and diluted earnings per share.
Accumulated Other Comprehensive Loss. Accumulated other comprehensive loss is defined as the change in equity resulting from transactions from non-owner sources. Other comprehensive income consisted of changes in the funded status of the Company’s pension plan.
Estimates. The preparation of financial statements in conformity with accounting principles generally accepted in the United States of America requires management to make estimates and assumptions that affect the reported amounts of assets and liabilities and disclosure of contingent assets and liabilities at the date of the financial statements and the reported amounts of revenue and expenses during the reporting period. Actual results could differ from these estimates.
Shipping and Handling Costs. The Company records amounts billed to customers for shipping and handling costs in net sales and related costs are included in cost of goods sold.
Stock Based Compensation. The Company recognizes stock based compensation expense over the requisite service period of the individual grants, which generally equals the vesting period. Actual forfeitures are recorded when they occur. The fair value of all share based awards is estimated on the date of grant.
F-14
ENNIS, INC. AND SUBSIDIARIES
NOTES TO CONSOLIDATED FINANCIAL STATEMENTS
Recent Accounting Pronouncements
There are no recent accounting pronouncements that are anticipated to have a material impact on the Company's consolidated financial statements.
(2) Accounts Receivable and Allowance for Doubtful Receivables
Accounts receivable are reduced by an allowance for an estimate of amounts that are uncollectible. Substantially all of the Company’s receivables are due from customers in North America. The Company extends credit to its customers based upon its evaluation of the following factors: (i) the customer’s financial condition, (ii) the amount of credit the customer requests, and (iii) the customer’s actual payment history (which includes disputed invoice resolution). The Company does not typically require its customers to post a deposit or supply collateral. The Company’s allowance for doubtful receivables is based on an analysis that estimates the amount of its total customer receivable balance that is not collectible. This analysis includes assessing a default probability to customers’ receivable balances, which is influenced by several factors including (i) current market conditions, (ii) periodic review of customer credit worthiness, and (iii) review of customer receivable aging and payment trends.
The Company writes off accounts receivable when they become uncollectible, and payments subsequently received on such receivables are credited to the allowance in the period the payment is received. Credit losses from continuing operations have consistently been within management’s expectations.
The following table represents the activity in the Company’s allowance for doubtful receivables for the fiscal years ended (in thousands):
|
|
2023 |
|
|
2022 |
|
|
2021 |
|
|||
Balance at beginning of period |
|
$ |
1,200 |
|
|
$ |
961 |
|
|
$ |
715 |
|
Bad debt expense, net of recoveries |
|
|
663 |
|
|
|
429 |
|
|
|
1,044 |
|
Accounts written off |
|
|
(153 |
) |
|
|
(190 |
) |
|
|
(798 |
) |
Balance at end of period |
|
$ |
1,710 |
|
|
$ |
1,200 |
|
|
$ |
961 |
|
Accounts receivable at February 28, 2023 includes a $4.5 million receivable related to the sale of an unused manufacturing facility. The note is structured to be paid in 12 consecutive monthly installments, with a fixed interest rate of 5.95% per annum. The payments are amortized over a period of 360 months, with a balloon payment due upon completion of the final payment.
|
|
February 28, |
|
|
February 28, |
|
||
|
|
2023 |
|
|
2022 |
|
||
Trade Receivables, net of allowance for doubtful receivables |
|
$ |
44,645 |
|
|
$ |
37,295 |
|
Vendor Rebates |
|
|
4,354 |
|
|
|
1,727 |
|
Notes Receivable |
|
|
4,508 |
|
|
|
- |
|
|
|
$ |
53,507 |
|
|
$ |
39,022 |
|
(3) Inventories
The following table summarizes the components of inventories at the different stages of production as of February 28, 2023 and February 28, 2022 (in thousands):
|
|
2023 |
|
|
2022 |
|
||
Raw material |
|
$ |
30,308 |
|
|
$ |
25,276 |
|
Work-in-process |
|
|
6,174 |
|
|
|
5,547 |
|
Finished goods |
|
|
10,352 |
|
|
|
7,715 |
|
|
|
$ |
46,834 |
|
|
$ |
38,538 |
|
F-15
ENNIS, INC. AND SUBSIDIARIES
NOTES TO CONSOLIDATED FINANCIAL STATEMENTS
Reserves for excess and obsolete inventory at fiscal years ended 2023 and 2022 were $1.6 million and $1.5 million, respectively.
The excess of current costs at FIFO over LIFO stated values was approximately $6.7 million and $5.9 million as of fiscal years ended 2023 and 2022, respectively. During both fiscal year 2023 and 2022, as inventory quantities were reduced, this resulted in a liquidation of LIFO inventory quantities carried at lower costs prevailing in prior years compared with the cost of fiscal years 2022 and 2021, as applicable. The effect decreased cost of sales by approximately $0.3 million, $0.9 million and $0.1 million for fiscal years 2023, 2022 and 2021, respectively. Cost includes materials, labor and overhead related to the purchase and production of inventories.
(4) Acquisitions
The Company applies the acquisition method of accounting for business combinations. Under the acquisition method, the acquiring entity in a business combination recognizes 100% of the assets acquired and liabilities assumed at their acquisition date fair values. Management utilizes valuation techniques appropriate for the asset or liability being measured in determining these fair values. Any excess of the purchase price over amounts allocated to assets acquired, including identifiable intangible assets, and liabilities assumed is recorded as goodwill. Where amounts allocated to assets acquired and liabilities assumed is greater than the purchase price, a bargain purchase gain is recognized. Acquisition-related costs are expensed as incurred.
Acquisition of School Photo Marketing
On November 30, 2022, the Company acquired the assets and business from School Photo Marketing ("SPM"), which is based in Morganville, New Jersey, for $8.8 million (with additional potential earn-out consideration of up to $1,000,000 over a four-year period upon the attainment of specified financial benchmarks) plus the assumption of trade payables, subject to certain adjustments. At February 28, 2023 and 2022, the contingent earn-out liability amounted to $0.8 million and zero, respectively. The seller shall receive fifty percent (50%) of Purchaser's annual earnings from the business, before interest and taxes in excess of $1.4 million. The Company performed an allocation of the total estimated consideration and recorded the underlying assets acquired (including certain identified intangible assets) and liabilities assumed based on their estimated fair values using our best estimates and assumptions as of the acquisition date. All goodwill of $3.1 million recognized as a part of this acquisition is deductible for tax purposes. The Company also recorded intangible assets with definite lives of approximately $5.1 million in connection with the transaction, which are also deductible for tax purposes. The acquisition of SPM brings printing, yearbook publishing and marketing related services to over 1,400 school and sports photographers servicing schools around the country.
The following table summarizes the Company's aggregate purchase price allocation for SPM as of the acquisition date (in thousands):
Accounts receivable |
|
$ |
1,403 |
|
Inventories |
|
|
516 |
|
Other assets |
|
|
84 |
|
Right-of-use asset |
|
|
487 |
|
Property, plant & equipment |
|
|
250 |
|
Goodwill and intangibles |
|
|
8,262 |
|
Accounts payable and accrued liabilities |
|
|
(1,748 |
) |
Operating lease liability |
|
|
(487 |
) |
|
|
$ |
8,767 |
|
Acquisition of AmeriPrint Corporation
On June 1, 2021, the Company acquired the assets and business from AmeriPrint Corporation ("AmeriPrint"), which is based in Harvard, Illinois, for $3.9 million in cash plus the assumption of trade payables, subject to certain adjustments. Goodwill of $0.5 million recognized as a part of the acquisition is deductible for tax purposes. The Company also recorded intangible assets with definite lives of approximately $1.1 million in connection with the transaction.
F-16
ENNIS, INC. AND SUBSIDIARIES
NOTES TO CONSOLIDATED FINANCIAL STATEMENTS
The acquisition of AmeriPrint, which prior to the acquisition generated approximately $6.5 million in sales for its fiscal year ended December 31, 2020, brings added capabilities and expertise to our expanding product offering including barcoding and variable imaging.
The following is a summary of the purchase price allocation for AmeriPrint (in thousands):
Accounts receivable |
|
$ |
417 |
|
Inventories |
|
|
732 |
|
Property, plant & equipment |
|
|
2,000 |
|
Goodwill and intangibles |
|
|
1,607 |
|
Accounts payable and accrued liabilities |
|
|
(834 |
) |
|
|
$ |
3,922 |
|
Acquisition of Infoseal LLC
On December 31, 2020, the Company acquired the assets of Infoseal LLC (“Infoseal”), which is based in Roanoke, Virginia, for $19.2 million in cash plus the assumption of trade payables, subject to certain adjustments. Since the acquisition, the Company has incurred approximately $0.3 million of costs (including legal and accounting fees) related to the acquisition. Goodwill of $6.1 million recognized as a part of the acquisition is deductible for tax purposes. The Company also recorded intangible assets with definite lives of approximately $4.3 million in connection with the transaction. The acquisition of Infoseal, which prior to the acquisition generated approximately $19.2 million in sales for its fiscal year ended December 31, 2020, creates additional capabilities within in our pressure seal and tax form products.
The following is a summary of the purchase price allocation for Infoseal (in thousands):
Accounts receivable |
|
$ |
1,966 |
|
Inventories |
|
|
1,757 |
|
Right-of-use asset |
|
|
3,865 |
|
Property, plant & equipment |
|
|
7,000 |
|
Goodwill and intangibles |
|
|
9,890 |
|
Accounts payable and accrued liabilities |
|
|
(1,411 |
) |
Operating lease liability |
|
|
(3,865 |
) |
|
|
$ |
19,202 |
|
The results of operations for Infoseal, AmeriPrint and SPM are included in the Company’s consolidated financial statements from the respective dates of acquisition. The following table sets forth certain operating information on a pro forma basis as though the respective acquisition had occurred as of the beginning of the comparable prior period. The following pro forma information for fiscal years 2023 and 2022 includes AmeriPrint and SPM, and fiscal year 2021 includes AmeriPrint and Infoseal. The pro forma information includes the estimated impact of adjustments such as amortization of intangible assets, depreciation expense and interest expense and related tax effects (in thousands, except per share amounts).
|
|
Unaudited |
|
|
Unaudited |
|
|
Unaudited |
|
|||
|
|
2023 |
|
|
2022 |
|
|
2021 |
|
|||
Pro forma net sales |
|
$ |
440,416 |
|
|
$ |
408,323 |
|
|
$ |
380,513 |
|
Pro forma net earnings |
|
|
48,459 |
|
|
|
29,509 |
|
|
|
24,502 |
|
Pro forma earnings per share - diluted |
|
|
1.87 |
|
|
|
1.13 |
|
|
|
0.94 |
|
The pro forma results are not necessarily indicative of what would have occurred if the acquisition had been in effect for the period presented.
F-17
ENNIS, INC. AND SUBSIDIARIES
NOTES TO CONSOLIDATED FINANCIAL STATEMENTS
(5) Leases
The Company leases certain of its facilities and equipment under operating leases, which are recorded as right-of-use assets and lease liabilities. The Company’s leases generally have terms of 1 - 5 years, with certain leases including renewal options to extend the leases for additional periods at the Company’s discretion. At lease inception, all renewal options reasonably certain to be exercised are considered when determining the lease term. The Company currently does not have leases that include options to purchase or provisions that would automatically transfer ownership of the leased property to the Company.
Operating lease expense is recognized on a straight-line basis over the lease term, and variable lease payments are expensed as incurred. The Company had no variable lease costs for the fiscal years ended 2022 and 2023.
The Company determines whether a contract is or contains a lease at the inception of the contract. A contract will be deemed to be or contain a lease if the contract conveys the right to control and direct the use of identified property, plant, or equipment for a period of time in exchange for consideration. The Company generally must also have the right to obtain substantially all of the economic benefits from the use of the property, plant, and equipment.
Operating lease assets and liabilities are recognized at the lease commencement date based on the present value of lease payments over the lease term. To determine the present value of lease payments not yet paid, the Company estimates incremental borrowing rates based on the information available at lease commencement date as rates are not implicitly stated in most leases.
Lease expense is recognized in cost of sales and selling, general and administrative expense within the Consolidated Statements of Operations, based on the underlying nature of the leased asset.
Components of lease expense for the three fiscal years ended (in thousands):
|
|
|
|
|
|
|
|
|
|
|||
|
|
2023 |
|
|
2022 |
|
|
2021 |
|
|||
Operating lease cost |
|
$ |
5,974 |
|
|
$ |
6,217 |
|
|
$ |
6,461 |
|
|
|
|
|
|
|
|
|
|
|
|||
Supplemental cash flow information related to leases was as follows: |
|
|
|
|
|
|
|
|
|
|||
Cash paid for amounts included in the measurement of operating lease liabilities |
|
$ |
5,987 |
|
|
$ |
6,196 |
|
|
$ |
6,432 |
|
Right-of-use assets obtained in exchange for operating lease obligations |
|
$ |
3,065 |
|
|
$ |
3,441 |
|
|
$ |
5,367 |
|
|
|
|
|
|
|
|
|
|
|
|||
Weighted Average Remaining Lease Terms |
|
|
|
|
|
|
|
|
|
|||
Operating leases |
|
3 Years |
|
|
3 Years |
|
|
4 Years |
|
|||
|
|
|
|
|
|
|
|
|
|
|||
Weighted Average Discount Rate |
|
|
|
|
|
|
|
|
|
|||
Operating leases |
|
|
3.86 |
% |
|
|
3.63 |
% |
|
|
3.74 |
% |
F-18
ENNIS, INC. AND SUBSIDIARIES
NOTES TO CONSOLIDATED FINANCIAL STATEMENTS
Future minimum lease commitments under non-cancelable operating leases for each of the fiscal years ending are as follows (in thousands):
|
|
Operating |
|
|
|
|
Lease |
|
|
|
|
Commitments |
|
|
2024 |
|
$ |
4,938 |
|
2025 |
|
|
4,611 |
|
2026 |
|
|
2,893 |
|
2027 |
|
|
1,168 |
|
2028 |
|
|
153 |
|
Thereafter |
|
|
- |
|
Total future minimum lease payments |
|
$ |
13,763 |
|
Less imputed interest |
|
|
754 |
|
Present values of lease liabilities |
|
$ |
13,009 |
|
(6) Goodwill and Intangible Assets
Goodwill represents the excess of the purchase price over the fair value of net assets of acquired businesses and is not amortized. Goodwill and other intangible assets are tested for impairment at a reporting unit level. The annual impairment test of goodwill and intangible assets is performed as of December 1 of each fiscal year.
The Company uses qualitative factors to determine whether it is more likely than not (likelihood of more than 50%) that the fair value of a reporting unit exceeds its carrying amount, including goodwill. Some of the qualitative factors considered in applying this test include consideration of macroeconomic conditions, industry and market conditions, cost factors affecting the business, overall financial performance of the business, and performance of the share price of the Company.
If qualitative factors are not deemed sufficient to conclude that the fair value of the reporting unit more likely than not exceeds its carrying value, then a one-step approach is applied in making an evaluation. The evaluation utilizes multiple valuation methodologies, including a market approach (market price multiples of comparable companies) and an income approach (discounted cash flow analysis). The computations require management to make significant estimates and assumptions, including, among other things, selection of comparable publicly traded companies, the discount rate applied to future earnings reflecting a weighted average cost of capital, and earnings growth assumptions. A discounted cash flow analysis requires management to make various assumptions about future sales, operating margins, capital expenditures, working capital, and growth rates. If the evaluation results in the fair value of the goodwill for the reporting unit being lower than the carrying value, an impairment charge is recorded. A goodwill impairment charge was not required for fiscal years 2023 or 2022.
Definite-lived intangible assets are amortized over their estimated useful lives and tested for impairment if events or changes in circumstances indicate that the asset may be impaired.
F-19
ENNIS, INC. AND SUBSIDIARIES
NOTES TO CONSOLIDATED FINANCIAL STATEMENTS
The carrying amount and accumulated amortization of the Company’s intangible assets at each balance sheet date are as follows (in thousands):
|
|
Weighted |
|
|
|
|
|
|
|
|
|
|
||||
|
|
Average |
|
|
|
|
|
|
|
|
|
|
||||
|
|
Remaining |
|
|
Gross |
|
|
|
|
|
|
|
||||
|
|
Life |
|
|
Carrying |
|
|
Accumulated |
|
|
|
|
||||
As of February 28, 2023 |
|
(in years) |
|
|
Amount |
|
|
Amortization |
|
|
Net |
|
||||
Amortized intangible assets |
|
|
|
|
|
|
|
|
|
|
|
|
||||
Trademarks and trade names |
|
|
10.1 |
|
|
$ |
28,977 |
|
|
$ |
12,294 |
|
|
$ |
16,683 |
|
Customer lists |
|
|
5.4 |
|
|
|
80,733 |
|
|
|
54,020 |
|
|
|
26,713 |
|
Non-compete |
|
|
2.7 |
|
|
|
210 |
|
|
|
145 |
|
|
|
65 |
|
Technology |
|
|
6.7 |
|
|
|
650 |
|
|
|
23 |
|
|
|
627 |
|
Total |
|
|
7.2 |
|
|
$ |
110,570 |
|
|
$ |
66,482 |
|
|
$ |
44,088 |
|
|
|
|
|
|
|
|
|
|
|
|
|
|
||||
|
|
|
|
|
|
|
|
|
|
|
|
|
||||
As of February 28, 2022 |
|
|
|
|
|
|
|
|
|
|
|
|
||||
Amortized intangible assets |
|
|
|
|
|
|
|
|
|
|
|
|
||||
Trademarks and trade names |
|
|
11.0 |
|
|
$ |
28,207 |
|
|
$ |
10,301 |
|
|
$ |
17,906 |
|
Customer lists |
|
|
6.1 |
|
|
|
76,458 |
|
|
|
48,903 |
|
|
|
27,555 |
|
Non-compete |
|
|
3.3 |
|
|
|
877 |
|
|
|
769 |
|
|
|
108 |
|
Total |
|
|
8.0 |
|
|
$ |
105,542 |
|
|
$ |
59,973 |
|
|
$ |
45,569 |
|
Aggregate amortization expense for each of the fiscal years 2023, 2022 and 2021 was approximately $7.2 million, $8.4 million and $8.1 million, respectively.
The Company’s estimated amortization expense for the next five fiscal years is as follows (in thousands):
2024 |
|
$ |
7,546 |
|
2025 |
|
|
7,373 |
|
2026 |
|
|
6,757 |
|
2027 |
|
|
5,674 |
|
2028 |
|
|
4,178 |
|
Changes in the net carrying amount of goodwill for fiscal years 2023 and 2022 are as follows (in thousands):
Balance as of March 1, 2021 |
|
$ |
88,647 |
|
Goodwill acquired |
|
|
30 |
|
Balance as of February 28, 2022 |
|
|
88,677 |
|
Goodwill acquired |
|
|
3,142 |
|
Balance as of February 28, 2023 |
|
$ |
91,819 |
|
During fiscal year 2023, $3.1 million was added to goodwill related to the acquisition of SPM. During fiscal year 2022, an adjustment of $0.5 million to reduce goodwill related to the Infoseal acquisition, and $0.5 million and less than $0.1 million was added to goodwill related to the acquisition of AmeriPrint and Superior Copies, respectively.
F-20
ENNIS, INC. AND SUBSIDIARIES
NOTES TO CONSOLIDATED FINANCIAL STATEMENTS
(7) Accrued Expenses
The following table summarizes the components of other accrued expenses for the fiscal years ended (in thousands):
|
|
February 28, |
|
February 28, |
|
|
2023 |
|
2022 |
Employee compensation and benefits |
|
$14,823 |
|
$11,587 |
Taxes other than income |
|
1,154 |
|
947 |
Accrued legal and professional fees |
|
376 |
|
251 |
Accrued utilities |
|
129 |
|
108 |
Income taxes payable |
|
552 |
|
1,606 |
Other accrued expenses |
|
1,033 |
|
923 |
|
|
$18,067 |
|
$15,422 |
(8) Long-Term Debt
The Company did not renew its Credit Agreement which expired November 11, 2021. The Company has had no outstanding long term debt under the revolving credit line since paid in August 2019. As of November 30, 2021, the Company had $0.6 million outstanding under a standby letters of credit arrangement secured by a cash collateral bank account.
(9) Shareholders’ Equity
The Board has authorized the repurchase of the Company’s outstanding common stock through a stock repurchase program, which authorized amount is currently up to $40.0 million in the aggregate. Under the repurchase program, purchases may be made from time to time in the open market or through privately negotiated transactions depending on market conditions, share price, trading volume and other factors. Such purchases, if any, will be made in accordance with applicable insider trading and other securities laws and regulations. These repurchases may be commenced or suspended at any time or from time to time without prior notice.
During the fiscal years ended February 28, 2023 and 2022, the Company repurchased 64,082 and 254,679 shares of common stock under the program at an average price of $17.46 and $18.81 per share, respectively. Since the program’s inception in October 2008, there have been 2,213,111 common shares repurchased at an average price of $16.25 per share. As of February 28, 2023, there was $23.9 million available to repurchase shares of the Company’s common stock under the program.
(10) Stock Option Plan and Stock Based Compensation
The Company grants stock options and restricted stock to key executives and managerial employees and non-employee directors. Prior to June 30, 2021, the Company had one stock incentive plan, the 2004 Long-Term Incentive Plan of Ennis, Inc., as amended and restated as of May 18, 2008 and was further amended on June 30, 2011 (the "Old Plan"). The Old Plan expired June 30, 2021 and all remaining unused shares expired. Subject to the affirmative vote of the shareholders, the Board adopted the 2021 Long-Term Incentive Plan of Ennis, Inc. (the "New Plan") on April 16, 2021 authorizing 1,033,648 shares of common stock for awards. The New Plan was approved by the shareholders at the Annual Meeting on July 15, 2021 by a majority vote. The New Plan expires June 30, 2031 and all unissued stock will expire on that date. At fiscal year ended February 28, 2023, the Company has 890,044 shares of unissued common stock reserved under the New Plan for issuance and uses treasury stock to satisfy option exercises and restricted stock awards.
The Company recognizes compensation expense for stock options and restricted stock grants on a straight-line basis over the requisite service period. For the fiscal years ended 2023, 2022 and 2021, the Company included in selling, general and administrative expenses, compensation expense related to share based compensation of $2.8 million, $2.8 million and $1.4 million, respectively.
F-21
ENNIS, INC. AND SUBSIDIARIES
NOTES TO CONSOLIDATED FINANCIAL STATEMENTS
Stock Options
No stock options were granted during fiscal years 2023, 2022 or 2021.
The Company had no unvested stock options outstanding at any time during the fiscal year ended February 28, 2023.
Restricted Stock
The following occurred with respect to the Company’s restricted stock awards for each of the three fiscal years ended February 28, 2023:
|
|
|
|
Weighted |
|
||
|
|
|
|
Average |
|
||
|
Number of |
|
|
Grant Date |
|
||
|
Shares |
|
|
Fair Value |
|
||
Outstanding at March 1, 2020 |
|
143,926 |
|
|
$ |
19.79 |
|
Granted |
|
59,315 |
|
|
|
17.09 |
|
Terminated |
|
(10,098 |
) |
|
|
19.00 |
|
Vested |
|
(73,414 |
) |
|
|
19.16 |
|
Outstanding at February 28, 2021 |
|
119,729 |
|
|
$ |
18.90 |
|
Granted |
|
51,920 |
|
|
|
20.30 |
|
Terminated |
|
— |
|
|
|
19.00 |
|
Vested |
|
(104,485 |
) |
|
|
19.70 |
|
Outstanding at March 1, 2022 |
|
67,164 |
|
|
$ |
18.73 |
|
Granted |
|
22,000 |
|
|
|
19.78 |
|
Terminated |
|
— |
|
|
|
— |
|
Vested |
|
(39,381 |
) |
|
|
19.00 |
|
Outstanding at February 28, 2023 |
|
49,783 |
|
|
$ |
18.99 |
|
As of February 28, 2023, the total remaining unrecognized compensation cost related to unvested restricted stock was approximately $0.6 million. The weighted average remaining requisite service period of the unvested restricted stock awards was 1.4 years. As of February 28, 2023, the Company’s outstanding restricted stock had an underlying fair value of $0.9 million at date of grant.
Restricted Stock Units
During the fiscal year ended February 28, 2023, 93,532 performance-based RSUs and 9,893 time-based RSUs were granted under the New Plan. The fair value of the time-based RSUs was estimated based on the fair market value of the Company’s stock on the date of grant of $19.47 per unit. The fair value of the performance-based RSUs, using a Monte Carlo valuation model, was $23.17 per unit. The performance measures include a threshold, target and maximum performance level providing the grantees an opportunity to receive more or less shares than targeted depending on actual financial performance. The award will be based on the Company’s return on equity, EBITDA and adjusted for the Company’s Relative Shareholder Return as measured against a defined peer group.
The performance-based RSUs will vest no later than March 15, 2024, which is the deadline for the Compensation Committee to determine the extent of the Company’s attainment of the Performance Goals during the Performance Period that ends on February 29, 2024.
F-22
ENNIS, INC. AND SUBSIDIARIES
NOTES TO CONSOLIDATED FINANCIAL STATEMENTS
The time-based RSUs vest ratably over two to three years from the date of grant.
The following occurred with respect to the Company’s restricted stock units ("RSUs") for each of the three fiscal years ended February 28:
|
Time-based |
|
|
Performance-based |
|
||||||||||
|
|
|
|
Weighted |
|
|
|
|
|
Weighted |
|
||||
|
|
|
|
Average |
|
|
|
|
|
Average |
|
||||
|
Number of |
|
|
Grant Date |
|
|
Number of |
|
|
Grant Date |
|
||||
|
Shares |
|
|
Fair Value |
|
|
Shares |
|
|
Fair Value |
|
||||
Outstanding at February 28, 2021 |
|
— |
|
|
$ |
— |
|
|
|
— |
|
|
$ |
— |
|
Granted |
|
44,494 |
|
|
|
20.38 |
|
|
|
177,977 |
|
|
|
23.17 |
|
Terminated |
|
(9,423 |
) |
|
|
20.38 |
|
|
|
(37,690 |
) |
|
|
23.17 |
|
Vested |
|
— |
|
|
|
— |
|
|
|
— |
|
|
|
— |
|
Outstanding at March 1, 2022 |
|
35,071 |
|
|
$ |
20.38 |
|
|
|
140,287 |
|
|
$ |
23.17 |
|
Granted |
|
9,893 |
|
|
|
19.47 |
|
|
|
93,532 |
|
|
|
23.17 |
|
Terminated |
|
— |
|
|
|
— |
|
|
|
— |
|
|
|
— |
|
Vested |
|
(11,690 |
) |
|
|
20.38 |
|
|
|
— |
|
|
|
— |
|
Outstanding at February 28, 2023 |
|
33,274 |
|
|
$ |
20.11 |
|
|
|
233,819 |
|
|
$ |
23.17 |
|
As of February 28, 2023, the total remaining unrecognized compensation cost of time-based RSUs was approximately $0.4 million over a weighted average remaining requisite service period of 1.5 years. The total remaining unrecognized compensation of performance-based RSUs was approximately $2.2 million over a weighted average remaining requisite service period of 1.8 years. As of February 28, 2023, the Company’s outstanding RSUs had an underlying fair value of $6.1 million at date of grant.
(11) Benefit Plans
Pension Plan
The Company and certain subsidiaries have a noncontributory defined benefit retirement plan (the “Pension Plan”), covering approximately 13% of aggregate employees. Benefits are based on years of service and the employee’s average compensation for the highest five compensation years preceding retirement or termination. Effective January 1, 2009, the Company amended the Pension Plan to exclude any new employees from participation in the Pension Plan. Eligible employees who were hired before January 1, 2009 are still eligible to participate and participating employees continue to accrue benefit service. The Company’s funding policy is to contribute annually an amount in accordance with the requirements of the Employee Retirement Income Security Act of 1974 (“ERISA”).
The Company’s Pension Plan asset allocation, by asset category, is as follows for the fiscal years ended:
|
|
2023 |
|
|
2022 |
|
||
Equity securities |
|
|
52 |
% |
|
|
57 |
% |
Debt securities |
|
|
44 |
% |
|
|
40 |
% |
Cash and cash equivalents |
|
|
4 |
% |
|
|
3 |
% |
Total |
|
|
100 |
% |
|
|
100 |
% |
F-23
ENNIS, INC. AND SUBSIDIARIES
NOTES TO CONSOLIDATED FINANCIAL STATEMENTS
The Company adopted a dynamic asset allocation plan ("Glide Path") which assists in optimizing the volatility of the Pension Plan's funded status over the long term. Glide Path is a schedule of planned asset allocation shifts, dependent upon changes in the Pension Plan's funded status. It is expected that the allocation to Liability Hedge Assets (Fixed Income) will increase as the funded status of the Pension Plan improves. The Company’s target asset allocation percentage, by asset class, for the year ended February 28, 2023 is as follows:
Asset Class |
|
Target |
Cash |
|
1 – 5% |
Fixed Income |
|
44 – 64% |
Equity |
|
34 – 54% |
The Company estimates the long-term rate of return on Pension Plan assets will be 6.5% based upon target asset allocation. Expected returns are developed based upon the information obtained from the Company’s investment advisors. The advisors provide ten-year historical and five-year expected returns on the fund in the target asset allocation. The return information is weighted based upon the asset allocation at the end of the fiscal year. The expected rate of return at the beginning of fiscal year ended 2023 was 6.5%. The rate used in the calculation of fiscal year ended 2022 pension expense was 6.5%.
The following tables present the Pension Plan’s fair value hierarchy for those assets measured at fair value as of February 28, 2023 and February 28, 2022 (in thousands):
|
|
February 28, 2023 |
|
|||||||||||||
Description |
|
Total |
|
|
(Level 1) |
|
|
(Level 2) |
|
|
(Level 3) |
|
||||
Cash and cash equivalents |
|
$ |
2,093 |
|
|
$ |
2,093 |
|
|
$ |
— |
|
|
$ |
— |
|
Government bonds |
|
|
9,793 |
|
|
|
— |
|
|
|
9,793 |
|
|
|
— |
|
Corporate bonds |
|
|
15,797 |
|
|
|
— |
|
|
|
15,797 |
|
|
|
— |
|
Domestic equities |
|
|
16,833 |
|
|
|
16,833 |
|
|
|
— |
|
|
|
— |
|
Foreign equities |
|
|
4,726 |
|
|
|
4,726 |
|
|
|
— |
|
|
|
— |
|
|
|
$ |
49,242 |
|
|
$ |
23,652 |
|
|
$ |
25,590 |
|
|
$ |
— |
|
|
|
|
|
|
|
|
|
|
|
|
|
|
||||
|
|
February 28, 2022 |
|
|||||||||||||
Description |
|
Total |
|
|
(Level 1) |
|
|
(Level 2) |
|
|
(Level 3) |
|
||||
Cash and cash equivalents |
|
$ |
2,172 |
|
|
$ |
2,172 |
|
|
$ |
— |
|
|
$ |
— |
|
Government bonds |
|
|
8,623 |
|
|
|
— |
|
|
|
8,623 |
|
|
|
— |
|
Corporate bonds |
|
|
14,941 |
|
|
|
— |
|
|
|
14,941 |
|
|
|
— |
|
Domestic equities |
|
|
26,582 |
|
|
|
26,582 |
|
|
|
— |
|
|
|
— |
|
Foreign equities |
|
|
6,705 |
|
|
|
6,705 |
|
|
|
— |
|
|
|
— |
|
|
|
$ |
59,023 |
|
|
$ |
35,459 |
|
|
$ |
23,564 |
|
|
$ |
— |
|
Fair value estimates are made at a specific point in time, based on available market information and judgments about the financial asset, including estimates of timing, amount of expected future cash flows, and the credit standing of the issuer. In some cases, the fair value estimates cannot be substantiated by comparison to independent markets. The disclosed fair value may not be realized in the immediate settlement of the financial asset. In addition, the disclosed fair values do not reflect any premium or discount that could result from offering for sale at one time an entire holding of a particular financial asset. Potential taxes and other expenses that would be incurred in an actual sale or settlement are not reflected in amounts disclosed.
F-24
ENNIS, INC. AND SUBSIDIARIES
NOTES TO CONSOLIDATED FINANCIAL STATEMENTS
Pension expense is composed of the following components included in cost of goods sold and selling, general and administrative expenses in the Company’s consolidated statements of operations for fiscal years ended (in thousands):
|
|
2023 |
|
|
2022 |
|
|
2021 |
|
|||
Components of net periodic benefit cost |
|
|
|
|
|
|
|
|
|
|||
Service cost |
|
$ |
944 |
|
|
$ |
1,075 |
|
|
$ |
1,271 |
|
Interest cost |
|
|
1,967 |
|
|
|
1,682 |
|
|
|
1,754 |
|
Expected return on plan assets |
|
|
(3,699 |
) |
|
|
(3,723 |
) |
|
|
(4,074 |
) |
Amortization of: |
|
|
|
|
|
|
|
|
|
|||
Unrecognized net loss |
|
|
2,409 |
|
|
|
2,558 |
|
|
|
3,358 |
|
Settlement charge |
|
|
1,273 |
|
|
|
1,097 |
|
|
|
1,619 |
|
Net periodic benefit cost |
|
|
2,894 |
|
|
|
2,689 |
|
|
|
3,928 |
|
|
|
|
|
|
|
|
|
|
|
|||
Other changes in Plan Assets and Projected |
|
|
|
|
|
|
|
|
|
|||
Recognized in Other comprehensive Income |
|
|
|
|
|
|
|
|
|
|||
Net actuarial loss (gain) |
|
|
(2,295 |
) |
|
|
1,396 |
|
|
|
(1,588 |
) |
Amortization of net actuarial loss |
|
|
(3,682 |
) |
|
|
(3,655 |
) |
|
|
(4,977 |
) |
|
|
|
(5,977 |
) |
|
|
(2,259 |
) |
|
|
(6,565 |
) |
Total recognized in net periodic pension cost and |
|
$ |
(3,083 |
) |
|
$ |
430 |
|
|
$ |
(2,637 |
) |
The following table represents the assumptions used to determine benefit obligations and net periodic pension cost for fiscal years ended:
|
|
2023 |
|
|
2022 |
|
|
2021 |
|
|||
Weighted average discount rate (net periodic |
|
|
3.10 |
% |
|
|
2.65 |
% |
|
|
2.65 |
% |
Earnings progression (net periodic pension cost) |
|
|
3.00 |
% |
|
|
3.00 |
% |
|
|
3.00 |
% |
Expected long-term rate of return on plan assets |
|
|
6.50 |
% |
|
|
6.50 |
% |
|
|
6.50 |
% |
Weighted average discount rate (benefit |
|
|
5.00 |
% |
|
|
3.10 |
% |
|
|
2.65 |
% |
Earnings progression (benefit obligations) |
|
|
3.00 |
% |
|
|
3.00 |
% |
|
|
3.00 |
% |
During the fiscal year ended 2023, the Company adopted the MP-2021 improvement scale (mortality rate assumption) to determine their benefit obligations under the Pension Plan. The accumulated benefit obligation (“ABO”), change in projected benefit obligation (“PBO”), change in Pension Plan assets, funded status, and reconciliation to amounts recognized in the consolidated balance sheets are as follows (in thousands):
F-25
ENNIS, INC. AND SUBSIDIARIES
NOTES TO CONSOLIDATED FINANCIAL STATEMENTS
|
|
2023 |
|
|
2022 |
|
||
Change in benefit obligation |
|
|
|
|
|
|
||
Projected benefit obligation at beginning of year |
|
$ |
64,752 |
|
|
$ |
66,018 |
|
Service cost |
|
|
944 |
|
|
|
1,075 |
|
Interest cost |
|
|
1,967 |
|
|
|
1,682 |
|
Actuarial (gain) loss |
|
|
(12,824 |
) |
|
|
(151 |
) |
Other assumption change |
|
|
69 |
|
|
|
155 |
|
Benefits paid |
|
|
(4,885 |
) |
|
|
(4,148 |
) |
Settlement |
|
|
(135 |
) |
|
|
121 |
|
Projected benefit obligation at end of year |
|
$ |
49,888 |
|
|
$ |
64,752 |
|
Change in plan assets: |
|
|
|
|
|
|
||
Fair value of plan assets at beginning of year |
|
$ |
59,023 |
|
|
$ |
59,719 |
|
Company contributions |
|
|
2,000 |
|
|
|
1,000 |
|
Gain on plan assets |
|
|
(6,896 |
) |
|
|
2,452 |
|
Benefits paid |
|
|
(4,885 |
) |
|
|
(4,148 |
) |
Fair value of plan assets at end of year |
|
$ |
49,242 |
|
|
$ |
59,023 |
|
Funded (unfunded) status |
|
$ |
(646 |
) |
|
$ |
(5,729 |
) |
Accumulated benefit obligation at end of year |
|
$ |
46,904 |
|
|
$ |
60,216 |
|
The measurement dates of actuarial valuations used to determine pension and other postretirement benefits is the Company’s fiscal year end. In the third quarter of fiscal years 2023 and 2022, lump sum distributions of $2.1 million and $1.9 million were made to plan participants and resulted in a non-cash settlement charge of $0.8 million and $0.8 million, respectively. The Company made a $2.0 million contribution to the Pension Plan during fiscal year 2023. Depending on the Pension Plan’s projected funding status, the Company expects to contribute between $1.0 million and $3.0 million to the Pension Plan during fiscal year 2024.
Estimated future benefit payments which reflect expected future service, as appropriate, are expected to be paid to the Pension Plan participants in the fiscal years ended (in thousands):
Year |
|
Projected Payments |
|
|
2024 |
|
$ |
3,000 |
|
2025 |
|
|
3,000 |
|
2026 |
|
|
3,700 |
|
2027 |
|
|
3,500 |
|
2028 |
|
|
3,000 |
|
2029 – 2033 |
|
|
19,900 |
|
401(k) Plan
Effective February 1, 1994, the Company adopted a Defined Contribution 401(k) Plan (the “401(k) Plan”) for its United States employees. The 401(k) Plan covers substantially all full-time employees who have completed sixty days of service and attained the age of eighteen. United States employees can contribute up to 100 percent of their annual compensation, but are limited to the maximum annual dollar amount allowable under the Internal Revenue Code. The 401(k) Plan provides for employer matching contributions or discretionary employer contributions for certain employees not enrolled in the Pension Plan for employees of the Company. Eligibility for employer contributions, matching percentage, and limitations depends on the participant’s employment location and whether the employees are covered by the Pension Plan, among other factors. The Company’s matching contributions are immediately vested. The Company made matching 401(k) contributions in the amount of $1.9 million, $2.0 million and $1.9 million in fiscal years ended 2023, 2022 and 2021, respectively.
F-26
ENNIS, INC. AND SUBSIDIARIES
NOTES TO CONSOLIDATED FINANCIAL STATEMENTS
(12) Income Taxes
The following table represents components of the provision for income taxes for fiscal years ended (in thousands):
|
|
2023 |
|
|
2022 |
|
|
2021 |
|
|||
Current: |
|
|
|
|
|
|
|
|
|
|||
Federal |
|
$ |
15,784 |
|
|
$ |
7,284 |
|
|
$ |
9,627 |
|
State and local |
|
|
3,647 |
|
|
|
2,516 |
|
|
|
2,279 |
|
Total current |
|
|
19,431 |
|
|
|
9,800 |
|
|
|
11,906 |
|
Deferred: |
|
|
|
|
|
|
|
|
|
|||
Federal |
|
|
(1,341 |
) |
|
|
3,004 |
|
|
|
(2,217 |
) |
State and local |
|
|
(460 |
) |
|
|
158 |
|
|
|
(496 |
) |
Total deferred |
|
|
(1,801 |
) |
|
|
3,162 |
|
|
|
(2,713 |
) |
Total provision for income taxes |
|
$ |
17,630 |
|
|
$ |
12,962 |
|
|
$ |
9,193 |
|
The Company’s effective tax rate on earnings from operations for the year ended February 28, 2023, was 27.2%, compared to 30.9% and 27.6% in 2022 and 2021, respectively. The following summary reconciles the statutory U.S. federal income tax rate to the Company’s effective tax rate for the fiscal years ended:
|
|
2023 |
|
|
2022 |
|
|
2021 |
|
|
|||
Statutory rate |
|
|
21.0 |
|
% |
|
21.0 |
|
% |
|
21.0 |
|
% |
Provision for state income taxes, net of federal |
|
|
3.9 |
|
|
|
5.8 |
|
|
|
4.4 |
|
|
Federal true-up |
|
|
1.5 |
|
|
|
0.3 |
|
|
|
0.8 |
|
|
Stock compensation and Section 162(m) limitation |
|
|
0.8 |
|
|
|
3.8 |
|
|
|
1.5 |
|
|
|
|
|
27.2 |
|
% |
|
30.9 |
|
% |
|
27.6 |
|
% |
Deferred taxes are recorded to give recognition to temporary differences between the tax basis of assets and liabilities and their reported amounts in the financial statements. The tax effects of these temporary differences are recorded as deferred tax assets and deferred tax liabilities. Deferred tax assets generally represent items that can be used as a tax deduction or credit in future years. Deferred tax liabilities generally represent items that have been deducted for tax purposes, but have not yet been recorded in the consolidated statements of operations. To the extent there are deferred tax assets that are more likely than not to be realized, a valuation allowance would be recorded. Management does not expect to be able to utilize the foreign tax credit before it expires in 2026. Therefore, a full valuation allowance was established in fiscal year 2020. IRS code Section 162(m) limits the amount of deductible compensation for tax purposes paid to certain covered employees. The components of deferred income tax assets and liabilities are summarized as follows (in thousands) for fiscal years ended:
F-27
ENNIS, INC. AND SUBSIDIARIES
NOTES TO CONSOLIDATED FINANCIAL STATEMENTS
Deferred tax assets |
|
2023 |
|
|
2022 |
|
||
Allowance for doubtful receivables |
|
$ |
345 |
|
|
$ |
280 |
|
Inventories |
|
|
1,170 |
|
|
|
1,032 |
|
Employee compensation and benefits |
|
|
833 |
|
|
|
659 |
|
Pension and noncurrent employee compensation |
|
|
1,009 |
|
|
|
1,827 |
|
Property tax |
|
|
161 |
|
|
|
- |
|
Operating lease liabilities |
|
|
3,274 |
|
|
|
3,870 |
|
Net operating loss and foreign tax credits |
|
|
996 |
|
|
|
1,033 |
|
Other |
|
|
277 |
|
|
|
274 |
|
Total deferred tax assets |
|
|
8,065 |
|
|
|
8,975 |
|
Less: valuation allowance |
|
|
(1,242 |
) |
|
|
(408 |
) |
Total deferred tax assets, net |
|
$ |
6,823 |
|
|
$ |
8,567 |
|
Deferred tax liabilities |
|
|
|
|
|
|
||
Property, plant and equipment |
|
$ |
4,902 |
|
|
$ |
6,167 |
|
Goodwill and other intangible assets |
|
|
9,683 |
|
|
|
9,889 |
|
Right-of-use assets |
|
|
3,204 |
|
|
|
3,797 |
|
Property tax |
|
|
- |
|
|
|
40 |
|
Other |
|
|
132 |
|
|
|
79 |
|
Total deferred tax liabilities |
|
$ |
17,921 |
|
|
$ |
19,972 |
|
Net deferred income tax liabilities |
|
$ |
11,098 |
|
|
$ |
11,405 |
|
At fiscal year ended 2023, the Company had federal net operating loss (“NOL”) carry forwards of approximately $2.9 million. This NOL is related to the acquisitions of Flesh and Impressions Direct. The NOL is subject to a Section 382 limitation of $0.2 million per year and expiring in 2040. Based on historical earnings and expected sufficient future taxable income, management believes it will be able to fully utilize the NOL.
Accounting standards require a two-step approach to determine how to recognize tax benefits in the financial statements where recognition and measurement of a tax benefit must be evaluated separately. A tax benefit will be recognized only if it meets a “more-likely-than-not” recognition threshold. For tax positions that meet this threshold, the tax benefit recognized is based on the largest amount of tax benefit that is greater than 50 percent likely of being realized upon ultimate settlement with the taxing authority.
At fiscal years ended 2023 and 2022, unrecognized tax benefits related to uncertain tax positions, including accrued interest and penalties of $0.1 million and $0.1 million, respectively, are included in other liabilities on the consolidated balance sheets and would impact the effective rate if recognized. The interest expense associated with the unrecognized tax benefit is not material. A reconciliation of the change in the unrecognized tax benefits for fiscal years ended 2023 and 2022 is as follows (in thousands):
|
|
2023 |
|
|
2022 |
|
||
Balance at March 1, 2022 |
|
$ |
166 |
|
|
$ |
130 |
|
Additions based on tax positions |
|
|
66 |
|
|
|
66 |
|
Reductions due to lapses of statues of limitations |
|
|
(30 |
) |
|
|
(30 |
) |
Balance at February 28, 2023 |
|
$ |
202 |
|
|
$ |
166 |
|
The Company is subject to U.S. federal income tax as well as income tax of multiple state jurisdictions. The Company has concluded all U.S. federal income tax matters for years through 2019. All material state and local income tax matters have been concluded for years through 2016.
The Company recognizes interest expense on underpayments of income taxes and accrued penalties related to unrecognized non-current tax benefits as part of the income tax provision. Other than amounts included in the unrecognized tax benefits, the Company did not recognize any interest or penalties for the fiscal years ended 2023, 2022 and 2021.
F-28
ENNIS, INC. AND SUBSIDIARIES
NOTES TO CONSOLIDATED FINANCIAL STATEMENTS
(13) Earnings per Share
Basic earnings (loss) per share have been computed by dividing net earnings (loss) by the weighted average number of common shares outstanding during the applicable period. Diluted earnings (loss) per share reflect the potential dilution that could occur if stock options or other contracts to issue common shares were exercised or converted into common stock.
The following table sets forth the computation for basic and diluted earnings (loss) per share for the fiscal years ended:
|
|
2023 |
|
|
2022 |
|
|
2021 |
|
|||
Basic weighted average common shares outstanding |
|
|
25,818,737 |
|
|
|
26,026,477 |
|
|
|
25,995,127 |
|
Effect of dilutive RSUs |
|
|
132,404 |
|
|
|
82,864 |
|
|
|
- |
|
Diluted weighted average common shares outstanding |
|
|
25,951,141 |
|
|
|
26,109,341 |
|
|
|
25,995,127 |
|
Earnings per share |
|
|
|
|
|
|
|
|
|
|||
Basic |
|
$ |
1.83 |
|
|
$ |
1.11 |
|
|
$ |
0.93 |
|
Diluted |
|
$ |
1.82 |
|
|
$ |
1.11 |
|
|
$ |
0.93 |
|
Cash dividends |
|
$ |
1.00 |
|
|
$ |
0.975 |
|
|
$ |
0.90 |
|
The Company treats unvested share-based payment awards that contain non-forfeitable rights to dividends or dividend equivalents (whether paid or unpaid) as participating securities, which are included in the computation of earnings per share. Our unvested restricted shares participate on an equal basis with common shares; therefore, there is no difference in undistributed earnings allocated to each participating security. Accordingly, the presentation above is prepared on a combined basis. No options were outstanding at the end of fiscal years 2023, 2022 and 2021.
(14) Commitments and Contingencies
In the ordinary course of business, the Company also enters into real property leases, which require the Company as lessee to indemnify the lessor from liabilities arising out of the Company’s occupancy of the properties. The Company’s indemnification obligations are generally covered under the Company’s general insurance policies.
From time to time, the Company is involved in various litigation matters arising in the ordinary course of business. The Company does not believe the disposition of any current matter will have a material adverse effect on its consolidated financial position or results of operations.
(15) Supplemental Cash and Non-Cash Flow Information
Net cash flows from operating activities that reflect cash payments for interest and income taxes, are as follows for the three fiscal years ended (in thousands):
|
|
|
2023 |
|
|
|
2022 |
|
|
|
2021 |
|
Supplemental disclosure of cash flow information |
|
|
|
|
|
|
|
|
|
|||
Interest paid, net |
|
$ |
- |
|
|
$ |
57 |
|
|
$ |
10 |
|
Income taxes paid, net of refunds |
|
$ |
17,966 |
|
|
$ |
11,626 |
|
|
$ |
9,498 |
|
|
|
|
|
|
|
|
|
|
|
|||
In fiscal year 2023, the Company recorded a non-cash transaction of a $4.5 million note receivable in connection with the sale of an unused manufacturing facility.
(16) Related Party Transactions
The Company leases a facility and sells product to an entity controlled by a board member who was the former owner of a business that the Company acquired. The total right-of-use asset and related lease liability as of February 28, 2023 was $0.8 million and $0.8 million, respectively. During fiscal year 2023, total lease payments made to, and sales made to, the related party were approximately $0.4 million and $3.5 million, respectively.
F-29
ENNIS, INC. AND SUBSIDIARIES
NOTES TO CONSOLIDATED FINANCIAL STATEMENTS
(17) Concentrations of Risk
Financial instruments that potentially subject the Company to a concentration of credit risk principally consist of cash and trade receivables. Cash is placed with high-credit quality financial institutions. The Company believes its credit risk with respect to trade receivables is limited due to industry and geographic diversification. As disclosed on the Consolidated Balance Sheets, the Company maintains an allowance for doubtful receivables to cover the Company’s estimate of credit losses associated with accounts receivable.
No single customer accounts for as much as five percent of the Company’s consolidated net sales or accounts receivable.
The Company, for quality and pricing reasons, purchases its paper products from a limited number of suppliers. For fiscal years 2023, 2022 and 2021, the Company purchased 50%, 51%, and 43%, respectively, of its materials from one third party vendor. As of February 28, 2023 and February 28, 2022, the net amount due to the vendor was $3.3 million and $4.9 million, respectively. While other sources may be available to the Company to purchase these products, they may not be available at the cost or at the quality the Company has come to expect.
For the purposes of the Consolidated Statements of Cash Flows, the Company considers cash to include cash on hand and in bank accounts. The Federal Deposit Insurance Corporation insures accounts up to $250,000. At February 28, 2023, cash balances included $93.0 million that was not federally insured because it represented amounts in individual accounts above the federally insured limit for each such account. This at-risk amount is subject to fluctuation on a daily basis. While management does not believe there is significant risk with respect to such deposits as we have not experienced any losses in such accounts and we believe that we have placed our cash on deposit with financial institutions which are financially stable, we cannot be assured that we will not experience losses on our deposits.
F-30
Exhibit 4.1
DESCRIPTION OF ENNIS, INC. CAPITAL STOCK
The following description of the terms of Ennis’ capital stock is a summary only and is qualified by reference to the relevant provisions of Texas law and the Ennis restated certificate of incorporation and by-laws.
Authorized Capital Stock
Under the Ennis restated certificate of incorporation, Ennis’ authorized capital stock consists of forty million (40,000,000) shares of common stock, with $2.50 par value, and one million (1,000,000) shares of preferred stock, with $10 par value.
Description of Common Stock
Voting Rights. Each holder of Ennis common stock is entitled to one vote for each share of Ennis common stock held of record on the applicable record date on all matters submitted to a vote of shareholders. Shareholders of common stock can use cumulative voting to aggregate director votes.
Dividend Rights. Holders of Ennis common stock are entitled to receive such dividends as may be declared from time to time by Ennis’ board of directors out of funds legally available therefor, subject to any preferential dividend rights granted to the holders of any outstanding Ennis’ preferred stock.
Rights upon Liquidation. Holders of Ennis common stock are entitled to share pro rata, upon any liquidation, dissolution or winding up of Ennis, in all remaining assets available for distribution to shareholders after payment of or provision for Ennis’ liabilities and the liquidation preference of any outstanding Ennis preferred stock.
Preemptive Rights. Holders of Ennis common stock have no preemptive rights to purchase, subscribe for or otherwise acquire any unissued or treasury shares or other securities.
Description of Preferred Stock
Preferred Stock Outstanding. As of the date of this filing, no shares of Ennis preferred stock were issued and outstanding.
Designation and Amount. Shares of Preferred Stock may be issued from time to time in one or more series, each such series to have such designations as may be fixed by the Board of Directors prior to the issuance of any shares thereof. In November of 1998 the board created a new series of Preferred Stock pursuant to the adoption of a Shareholder Rights Plan. The shares of such series shall be designated as “Series A Junior Participating Preferred Stock” (the “Series A Preferred Stock”) and the number of shares constituting the Series A Preferred Stock shall be 25,000.The Series A Preferred Stock shall rank, with respect to the payment of dividends and the distribution of assets, junior to all series of any other class of the Company’s Preferred Stock. Such number of shares may be increased or decreased by resolution of the Board of Directors; provided, that no decrease shall reduce the number of shares of Series A Preferred Stock to a number less than the number of shares then outstanding plus the number of shares reserved for issuance upon the exercise of outstanding options, rights or warrants or upon the conversion of any outstanding securities issued by the Company convertible into Series A Preferred Stock. This Shareholders Rights Plan expired on November 8, 2008.
Dividend Rights. Holders of Ennis Series A Preferred Stock shall be entitled to receive dividends (which may be cumulative or noncumulative) as may be declared from time to time by Ennis’ board of directors out of funds legally available therefor.
Transfer Agent and Registrar
Computershare Trust Company, N.A. is the transfer agent and registrar for Ennis common stock.
Exhibit 21
Subsidiaries of the Registrant
The Registrant directly or indirectly owns 100 percent of the outstanding voting securities of the following subsidiary companies.
Name of Company |
|
Jurisdiction |
Ennis, Inc. |
|
Texas |
Ennis Business Forms of Kansas, Inc. |
|
Kansas |
Calibrated Forms Co., Inc. |
|
Kansas |
Print Your Marketing, Inc. |
|
Delaware |
Admore, Inc. |
|
Texas |
PFC Products, Inc.(1) |
|
Delaware |
Ennis Acquisitions, Inc. |
|
Nevada |
Texas EBF, LP |
|
Texas |
Ennis Sales, LP |
|
Texas |
Ennis Management, LP |
|
Texas |
Adams McClure, LP |
|
Texas |
American Forms I, LP |
|
Texas |
Northstar Computer Forms, Inc. |
|
Minnesota |
General Financial Supply, Inc. (2) |
|
Iowa |
Crabar/GBF, Inc. |
|
Delaware |
Royal Business Forms, Inc. |
|
Texas |
Tennessee Business Forms Company |
|
Tennessee |
TBF Realty, LLC (3) |
|
Delaware |
Specialized Printed Forms, Inc. |
|
New York |
SPF Realty, LLC (4) |
|
Delaware |
Block Graphics, Inc. |
|
Oregon |
B&D Litho of Arizona, Inc. |
|
Delaware |
Skyline Business Forms, Inc. |
|
Delaware |
Skyline Business Properties, LLC (5) |
|
Delaware |
Kay Toledo Tag |
|
Ohio |
Specialized Service Partners |
|
Wisconsin |
American Paper Converting LLC |
|
Ohio |
Independent Printing Company, Inc. |
|
Delaware |
Wright Business Graphics LLC |
|
Oregon |
Integrated Print and Graphics |
|
Delaware |
The Flesh Company |
|
Missouri |
Impressions Direct, Inc. (6) |
|
Missouri |
SPM Marketing LLC |
|
Texas |
(1) A wholly-owned subsidiary of Admore, Inc.
(2) A wholly-owned subsidiary of Northstar Computer Forms, Inc.
(3) A wholly-owned subsidiary of Tennessee Business Forms, Inc.
(4) A wholly-owned subsidiary of Specialized Printed Forms, Inc.
(5) A wholly-owned subsidiary of Skyline Business Forms, Inc.
(6) A wholly-owned subsidiary of The Flesh Company We consent to the incorporation by reference in the following Registration Statements:
Exhibit 23.1
CONSENT OF INDEPENDENT REGISTERED PUBLIC ACCOUNTING FIRM
of our reports dated May 12, 2023, with respect to the consolidated financial statements of Ennis, Inc. as of February 28, 2023 and the fiscal year then ended and the effectiveness of internal control over financial reporting of Ennis, Inc. as of February 28, 2023 included in this Annual Report (Form 10-K) of Ennis, Inc. for the year ended February 28, 2023.
/s/ CohnReznick LLP
Dallas, Texas
May 12, 2023
Exhibit 23.2
CONSENT OF INDEPENDENT REGISTERED PUBLIC ACCOUNTING FIRM
We have issued our report dated May 9, 2022, with respect to the consolidated financial statements included in the Annual Report of Ennis, Inc. on Form 10-K for the year ended February 28, 2023. We consent to the incorporation by reference of said report in the Registration Statements of Ennis, Inc. on Forms S-8 (File No. 333-38100, File No. 333-44624, File No. 333-175261 and File No. 333-260034).
/s/ GRANT THORNTON LLP
Dallas, Texas
May 12, 2023
Exhibit 31.1
RULE 13a-14(a)/15d-14(a) CERTIFICATION OF CHIEF EXECUTIVE OFFICER
I, Keith S. Walters, certify that:
/S/ KEITH S. WALTERS
Keith S. Walters
Chairman of the Board, Chief Executive Officer and President
May 12, 2023
Exhibit 31.2
RULE 13a-14(a)/15d-14(a) CERTIFICATION OF CHIEF FINANCIAL OFFICER
I, Vera Burnett, certify that:
/S/ VERA BURNETT
Vera Burnett
Chief Financial Officer
May 12, 2023
Exhibit 32.1
SECTION 1350 CERTIFICATION OF CHIEF EXECUTIVE OFFICER
I, Keith S. Walters, Chairman of the Board and Chief Executive Officer of Ennis, Inc. (the “Company”), certify, that pursuant to Section 1350 of Chapter 63 of Title 18 of the United States Code:
/S/ KEITH S. WALTERS
Keith S. Walters
Chairman of the Board, Chief Executive Officer and President
May 12, 2023
The foregoing Certification is being furnished solely pursuant to 18 U.S.C. Section 1350; it is not being filed for purposes of Section 18 of the Securities Exchange Act, and is not to be incorporated by reference into any filing of the Company, whether made before or after the date hereof, regardless of any general incorporation languages in such filing.
Exhibit 32.2
SECTION 1350 CERTIFICATION OF CHIEF FINANCIAL OFFICER
I, Vera Burnett, Chief Financial Officer of Ennis, Inc. (the “Company”), certify, that pursuant to Section 1350 of Chapter 63 of Title 18 of the United States Code:
/S/ VERA BURNETT
Vera Burnett
Chief Financial Officer
May 12, 2023
The foregoing Certification is being furnished solely pursuant to 18 U.S.C. Section 1350; it is not being filed for purposes of Section 18 of the Securities Exchange Act, and is not to be incorporated by reference into any filing of the Company, whether made before or after the date hereof, regardless of any general incorporation languages in such filing.