株探米国株
英語
エドガーで原本を確認する
6-K 1 form6-k.htm REPORT OF FOREIGN PRIVATE ISSUER

UNITED STATES
SECURITIES AND EXCHANGE COMMISSION
WASHINGTON, DC 20549


FORM 6-K


REPORT OF FOREIGN PRIVATE ISSUER
PURSUANT TO RULE 13a-16 OR 15d-16 UNDER
THE SECURITIES EXCHANGE ACT OF 1934

For the month of November 2023

Commission File Number 001-41815


AngloGold Ashanti plc
(Translation of registrant’s name into English)


4th Floor, Communications House
South Street
Staines-Upon-Thames, Surrey TW18 4PR
United Kingdom
(Address of principal executive office)

Indicate by check mark whether the registrant files or will file annual reports under cover of Form 20-F or Form 40-F.

Form 20-F ☒      Form 40-F ☐


Enclosure: AngloGold Ashanti Investor Presentation (November 2023)


 INVESTOR  PRESENTATION  NOVEMBER 2023  Silicon, USA 
 

 DISCLAIMER  Certain statements contained in this document, other than statements of historical fact, including, without limitation, those concerning the economic outlook for the gold mining industry, expectations regarding gold prices, production, total cash costs, all-in sustaining costs, all-in costs, cost savings and other operating results, return on equity, productivity improvements, growth prospects and outlook of AngloGold Ashanti plc’s (the “Company”, “AngloGold Ashanti” or “AGA”) operations, individually or in the aggregate, including the achievement of project milestones, commencement and completion of commercial operations of certain of AngloGold Ashanti’s exploration and production projects and the completion of acquisitions, dispositions or joint venture transactions, AngloGold Ashanti’s liquidity and capital resources and capital expenditures, the consequences of the COVID-19 pandemic and the outcome and consequences of any potential or pending litigation or regulatory proceedings or environmental, health and safety issues, are forward-looking statements regarding AngloGold Ashanti’s financial reports, operations, economic performance and financial condition. These forward-looking statements or forecasts are not based on historical facts, but rather reflect our current beliefs and expectations concerning future events and generally may be identified by the use of forward-looking words, phrases and expressions such as “believe”, “expect”, “aim”, “anticipate”, “intend”, “foresee”, “forecast”, “predict”, “project”, “estimate”, “likely”, “may”, “might”, “could”, “should”, “would”, “seek”, “plan”, “scheduled”, “possible”, “continue”, “potential”, “outlook”, “target” or other similar words, phrases, and expressions; provided that the absence thereof does not mean that a statement is not forward-looking. Similarly, statements that describe our objectives, plans or goals are or may be forward-looking statements. These forward- looking statements or forecasts involve known and unknown risks, uncertainties and other factors that may cause AngloGold Ashanti’s actual results, performance, actions or achievements to differ materially from the anticipated results, performance, actions or achievements expressed or implied in these forward-looking statements. Although AngloGold Ashanti believes that the expectations reflected in such forward-looking statements and forecasts are reasonable, no assurance can be given that such expectations will prove to have been correct. Accordingly, results, performance, actions or achievements could differ materially from those set out in the forward-looking statements as a result of, among other factors, changes in economic, social, political and market conditions, including related to inflation or international conflicts, the success of business and operating initiatives, changes in the regulatory environment and other government actions, including environmental approvals, fluctuations in gold prices and exchange rates, the outcome of pending or future litigation proceedings, any supply chain disruptions, any public health crises, pandemics or epidemics (including the COVID-19 pandemic), and other business and operational risks and challenges and other factors, including mining accidents. For a discussion of such risk factors, refer to AngloGold Ashanti Limited’s annual report on Form 20-F for the year ended 31 December 2022 filed with the United States Securities and Exchange Commission (“SEC”) and AngloGold Ashanti’s registration statement on Form F-4 initially filed with the SEC on 23 June 2023. These factors are not necessarily all of the important factors that could cause AngloGold Ashanti’s actual results, performance, actions or achievements to differ materially from those expressed in any forward-looking statements. Other unknown or unpredictable factors could also have material adverse effects on AngloGold Ashanti’s future results, performance, actions or achievements. Consequently, readers are cautioned not to place undue reliance on forward-looking statements. AngloGold Ashanti undertakes no obligation to update publicly or release any revisions to these forward-looking statements to reflect events or circumstances after the date hereof or to reflect the occurrence of unanticipated events, except to the extent required by applicable law. All subsequent written or oral forward-looking statements attributable to AngloGold Ashanti or any person acting on its behalf are qualified by the cautionary statements herein.  The information included in this presentation has not been 
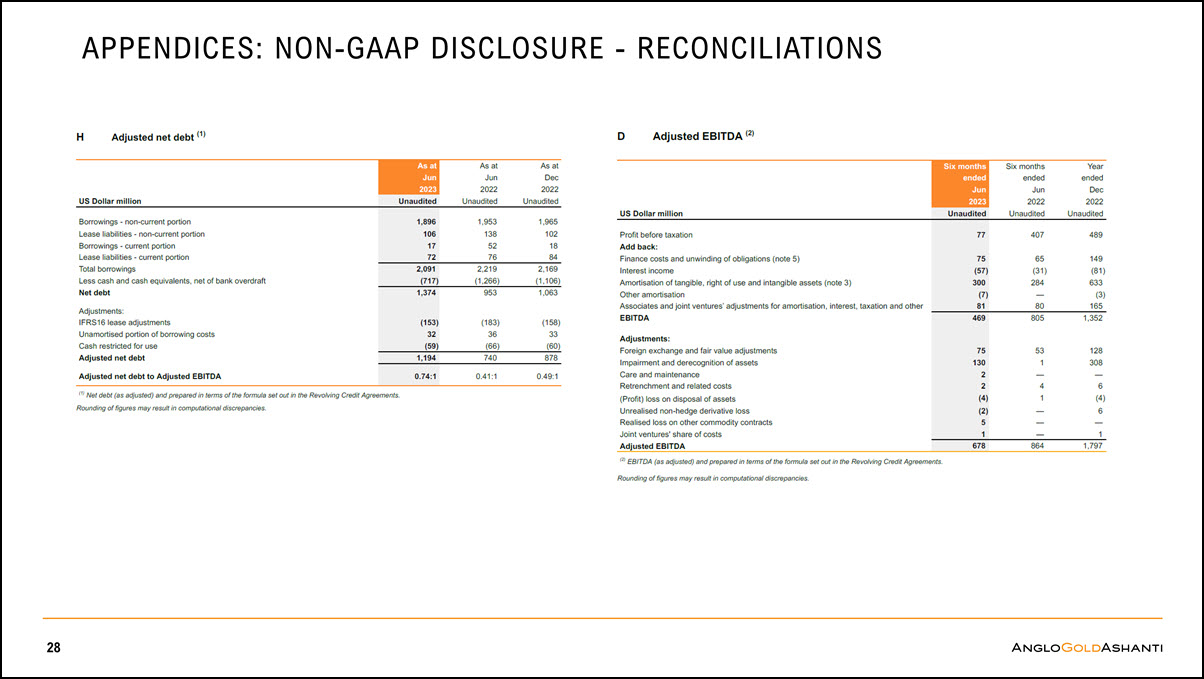
reviewed or reported on by AngloGold Ashanti’s external auditors.  Non-GAAP financial measures  This communication may contain certain “Non-GAAP” financial measures. AngloGold Ashanti utilises certain Non-GAAP performance measures and ratios in managing its business. Non-GAAP financial measures should be viewed in addition to, and not as an alternative for, the reported operating results or cash flow from operations or any other measures of performance prepared in accordance with IFRS. In addition, the presentation of these measures may not be comparable to similarly titled measures other companies may use.  Website: www.anglogoldashanti.com  2 
 

 LICENCE TO OPERATE 
 

 0  1  2  3  4  2011  2012  2013  2014  2015  2016  2017  2018  2019  2020  2021  2022  9M YTD 2023  Total Recordable Injury Frequency Rate*  injuries per million hours worked  5  LICENSE TO OPERATE: WORKING TOWARD ZERO HARM  *Total Recordable Injury Frequency Rate ("TRIFR"), previously known as the All-Injury Frequency Rate (“AIFR”), the broadest measure of workplace safety, measures workplace safety in terms of the total number of recordable injuries and fatalities that occur per million hours worked (by employees and contractors)  2022 member companies’ avg. 2.66  1.16  -74%  4 
 

 5  LICENSE TO OPERATE: CLEAR EMISSIONS REDUCTION TARGETS  Our commitment  A 30% reduction in greenhouse gas (GHG) emissions* from energy use by 2030**  Net zero Scope 1 and 2 GHG emissions by 2050 using renewable- energy technology  Collaboration with targeted suppliers to reduce material Scope 3 GHG emissions  Using 2021 GHG emissions as our baseline:  2  1.4 Mt CO e  Targeting a  30%  absolute reduction by 2030 requires a  46%  reduction from our forecast emissions levels  *Emissions from the consumption of fossil fuel-based energy is the material source of GHG emissions for the AngloGold Ashanti Group  ** 2021 baseline: Combined Scope 1 & Scope 2 
 

 CLOSING THE VALUE GAP 
 

 CLOSING THE VALUE GAP BETWEEN OUR SIZE AND RATING  7  - 2,000 4,000 6,000 8,000 10,000  FY23 / 24E Production (Koz)  Newmont Barrick Agnico-Eagle  Polyus AngloGold Ashanti  Gold Fields  Kinross Northern Star  -  10,000 20,000 30,000 40,000 50,000  Newmont  Barrick Agnico-Eagle  Polyus Gold Fields Northern Star AngloGold Kinross  Market Capitalisation ($m)  COMMITTED TO SUPERIOR RETURNS  STRONG  INDUSTRY POSITION  Zero fatalities in the first nine months of 2023; lowest industry injury rates1  Proven ability to replenish mineral inventory  Improving grade profile  FOCUS ON  IMPROVED OUTCOMES  Deliver what we promise – guidance achieved 2022, on track 2023  Taking clear steps to improve portfolio  Full Asset Potential underway to close cost gap  Cash conversion improving  Primary listing on NYSE, HQ to Denver  Clear Capital Allocation framework  Executing on low risk, low-cost growth options  Company reports, Newmont production estimates on pro-forma basis following Newcrest acquisition  1 TRIFR of 1.16 per million hours worked at 30 September 2023  2 Premium over South Africa primary listed gold producers; North American companies include: Newmont, Barrick, Agnico Eagle and Kinross, FactSet 20 November 2023  0%  10%  20%  30%  40%  50%  60%  Current  1-year avg  3-year avg  5-year avg  10-year avg  North American EV/EBITDA Premium2 
 

 CLOSING THE VALUE GAP: TAKING CLEAR STEPS TO UNLOCK VALUE  Kibali legacy cash cleared  Climate (GHG) targets set  Corvus Gold acquisition  Maiden Nevada Silicon Mineral Resource (3.4Moz)  Proposed Iduapriem  -Tarkwa JV announced  Coeur Sterling acquisition  Dividend ca.$120m  Dividend ca.$76m  8  CORPORATE  ESG  OPERATIONS  CAPITAL  GROWTH  Obuasi Phase 2 complete; annual guidance achieved  Safety Record TRIFR -31%  Obuasi restart  2023   2022   New Operating Model complete  CFO joins; Leadership in place  Corporate restructuring  A2X Listing  Full Asset Potential programme starts  New Values launched  Nevada Mineral Resource update (8.4Moz)  Group Mine Life extended to ca.11 years  NYSE Primary listing approved  CdS C&M Gramalote sale  Merlin Exploration target 6.0 – 8.0Moz  Tropicana Renewable Energy Project  Dividend ca.$17m 
 

 Argentina  Cerro Vanguardia (92.5%)  Guinea  Siguiri (85%)  Ghana Iduapriem Obuasi  DRC  Kibali (45%)  Tanzania Geita  1 Last twelve months (July 2022 – June 2023) data  2 Data at H1 2023  3 FY2022 – excludes Quebradona, Gramalote and Nevada  4 Córrego do Sítio was placed on care and maintenance in August 2023  CLOSING THE VALUE GAP: DEVELOPING A CLEAR VIEW OF A COMPETITIVE BUSINESS  9  Australia Sunrise Dam Tropicana (70%)  Colombia  Quebradona  Other  Córrego do Sítio4 ● Serra Grande  Gold1  158koz  TCC2  $1,913/oz  AISC2  $2,672/oz  Mineral Resource3 8Moz  Mineral Reserve3 1Moz  Mature, high cost, mine-specific challenges, flexibility constraints; require decision on future course  TIER 1  OPER AT ING AS S ETS  5  assets account for ca.60% of group gold production1; ca.75% of Mineral Reserve and ca.80% of adjusted EBITDA1  TIER 1  PROJECT PIPELINE  2  advancing projects in US and Colombia, forecast to add lower cost and higher margin ounces to the portfolio  Brazil  Serra Grande AGA Mineração  Cuiabá  Córrego do Sítio (C&M)  United States of America North Bullfrog  Silicon Merlin Mother Lode Sterling  Tier 1 Assets  Tier 2 Assets  Geita ● Obuasi ● Kibali ● Iduapriem ● Tropicana  Sunrise Dam ● Siguiri ● Cerro Vanguardia ● Cuiabá  Gold1  1,696koz  TCC2  $1,044/oz  AISC2  $1,334/oz  Mineral Resource3 53Moz  Mineral Reserve3 20Moz  Gold1  890koz  TCC2  $1,293/oz  AISC2  $1,714/oz  Mineral Resource3 23Moz  Mineral Reserve3 6Moz  Longer life, lower cost, scale and/or potential to lift production;  >ca.60% of gold production, >ca.80% of earnings  Steady performers, reliable cash generators; shorter life, FP focus - opportunities to improve cost competitiveness  AISC - World Gold Council guidance  NEV ADA T IER 1 PROJECT  8.4Moz Mineral Resource 6Moz – 8Moz Exploration target at Merlin 
 

 GROWTH 
 

 GROWTH: TARKWA/IDUAPRIEM JV POTENTIALLY CREATING AFRICA'S LARGEST GOLD MINE  Estimated average annual production ~900koz first five years1  Estimated life of mine at least 18 years  PROPOSED COMBINATION OF TWO PARTS OF THE SAME WORLD-CLASS ORE BODY  Tarkwa  Kobada  Iduapriem  Approximate lease  World Class Tier 1 Asset Expectations:  Leverage Tarkwa processing efficiency to unlock higher gold grades at Iduapriem  Maximise production across both processing plants  Committed partners - long history in Ghana working to operate a world-class gold mine  Ability to realise organic growth opportunities  1 Average annual production ~600koz over the estimated life of operation (100% basis)  11  The combination is expected to provide the ability to optimise mining and infrastructure across the combined footprint, allowing significant flexibility in mine planning and scale 
 

 Large, growing discovery in world’s top gold district - Mineral Resource 8.4Moz already declared  North Bullfrog Project tracking permit schedule; first production anticipated in 2025  Expanded Silicon Project (Silicon + Merlin deposits) emerging as focal point of the district:  Silicon 4.22Moz Mineral Resource + Merlin ca.6Moz – ca.8Moz exploration target  First-time Mineral Resource at Merlin on track for expected declaration in early 2024  Higher grade domains discovered at Merlin will warrant large-scale milling  Conceptual Study anticipated to wrap up in December 2023; PFS expected to start immediately afterwards  Drilling indicates Merlin’s true tier 1 potential - studies to be accelerated to analyse:  Open Pit and Underground approaches for Merlin  Project staging options for potentially faster start-up  Drilling to bring components of the first-time Mineral Resource at Merlin to Indicated  THE LARGEST RECENT DISCOVERY IN THE US IS GROWING, WITH HIGH GRADES IDENTIFIED  12 
 

 BEATTY DISTRICT EMERGING AS POTENTIALLY THE LARGEST NEW GOLD DISCOVERY IN THE US  SNA  Sterling  Legend  Project area with Declared Resource Project area  Historic Producing Mine AGA Claims  Silicon  4.22Moz  Mineral Resource (157.6Mt @ 0.83g/t)  Mother Lode  1.73Moz  Mineral Resource (70.1Mt @ 0.77g/t)  Sterling & Crown  0.91Moz  Mineral Resource (33.4Mt @ 0.85g/t)  Mother Lode  Secret Pass  Crown  Daisy  North Bullfrog  1.54Moz  Mineral Resource (155.6Mt @ 0.31g/t)  Merlin  Silicon  North Bullfrog  Beatty District  Merlin  Exploration Target ca.6.0 – ca.8.0Moz (230 - 250Mt  @ 0.8 - 1.0g/t)  A detailed breakdown of our Mineral Resource and Mineral Reserve and backup detail is available on the AngloGold Ashanti website and www.reports.anglogoldashanti.com. Further detail on the exploration target and exploration results reported is available in the Merlin Exploration Target H1 2023 report on the AngloGold Ashanti website.  13 
 

 As at  30 June 2023  Category  Tonnes million  Grade  g/t  Contained gold  Moz  Merlin Open pit  Exploration Target  230 — 250  0.8 — 1.0  6.0 — 8.0  GROWTH: EXPANDED SILICON GEOLOGY, MERLIN DEPOSIT  >200 AGA, 51 Corvus (Lynnda Strip) and 118 Coeur (C-Horst) drill holes  Infill, metallurgy, hydrology, extension programs  Growth potential to the Northwest  Exploration Target (H1 2023)  Note: The ranges of tonnage and grade of the exploration target are conceptual in nature and could change as the proposed exploration activities are completed  14 
 

 GROWTH: EXPANDED SILICON PROJECT LAYOUT  Conceptual Mining  2 pits, 2 overburden storage areas  Conceptual Processing  Gravity CIL milling facility  3-stage crushed leach facility  ROM leach extension  Combined ADR Facility  Conceptual Support Infrastructure  Pit dewatering system  Fresh water supply system (incl. pipeline & pump stations)  Electrical energy supply system  Access, and Haul Roads and Road upgrades  Mine and Process maintenance facilities  Administration and Technical Services Building  15 
 

 GROWTH: SECTOR-LEADING ORGANIC MINERAL RESERVE ADDITIONS AND GROWTH  16  4.4  4.2  3.7  6.0  2.7  3.5  24.5  25.6  26.8  29.7  29.8  30.4  0  5  10  15  20  24.2  25  30  2017  2020  Total  2018 2019  Mineral Reserve Additions*  2021 2022  Published Mineral Reserve**  Moz  35  +26%  growth  *pre-depletion  **restated to exclude South Africa and Mali  EXPLORATION SUCCESS DRIVES 26% INCREASE IN MINERAL RESERVE SINCE 2017 – 24.5Moz at a cost of $67/oz 
 

 BALANCE SHEET: LOW GEARING, STRONG LIQUIDITY, NO NEAR-TERM MATURITIES  17  0.74x  ca.$1.2bn  GEARING*  NET DEBT**  LIQUIDITY  ca.$2.3bn  *Adjusted Net Debt/Adjusted EBITDA at 30 June 2023  **Adjusted Net Debt at 30 June 2023  Long-term balance sheet improvement achieved through disciplined capital allocation – without equity issuance  Post the Corporate Restructure – leverage is expected to remain close to the 1.0x target through the cycle 
 

 OBUASI 
 

 OBUASI: SAFELY RAMPING UP TO BE OUR NEXT TIER ONE GOLD MINE  Large high-grade orebody in one of Africa’s top mining jurisdictions  ca.9g/t average grade  ca.25Moz Mineral Resource  ca.8Moz Mineral Reserve  Ramping up to a highly efficient, long-life mechanized mine  >20-year life  >400Koz/year  Production estimated at:  ca.250Koz in 2023  ca.300Koz in 2024  Strong license to operate  98% Ghanaian workforce; >70% from Obuasi  >70% project capital expenditure spent locally  World class hospital and schools  Successful malaria control programme covering >1m people in 16 districts  19 
 

 OBUASI: A LONG-LIFE, HIGH-GRADE MINE WITH WORLD-CLASS INFRASTRUCTURE  4,100  3,200  5,000  Obuasi Development Decline (ODD)  Adansi  BSVS  KRS KVMS  Block 11  1.78Moz @ 17.14g/t  Block 10  2.07 Moz @ 8.35g/t  KMS  2,600  Block 8  1.82Moz @ 7.47g/t  Improved flexibility through successful debottlenecking of Obuasi Development Decline…  …and continued progress of refurbishment of the KMS Shaft to access high-grade Block 11.  Block 1  0.45Moz @ 7.02g/t  ca.8km strike  Block 2  0.62Moz @ 8.32g/t  Adansi  0.44Moz @  19.70g/t  Sansu  0.5Moz @ 7.30g/t  Block positions are approximate and for illustrative purposes only  20  Block 14*  1.01Moz @ 7.70g/t  Cote d’Or  5.96Moz @  8.58g/t 
 

 OBUASI: UNDERHAND DRIFT AND FILL TO COMPLEMENT SUB LEVEL OPEN STOPING  geotechnical risk.  Trial underway in Block 8 to:  Refine the process and understand constraints  Define costs and productivities  21  We anticipate the first full UHDF* production area to be in Block 8 Lower….  Poor ground conditions associated with weak graphite shears in very high-grade zones have caused:  delayed stope turnover  increased dilution/overbreak  ore loss due to lower ore recovery in high grade stopes  UHDF to complement Sub-level Open Stoping (SLOS) in deeper, high grade, narrow ore zones to better manage  … and to integrate the method into the mine plan to target deeper ore bodies in Block 10 Lower and Block 11.  In-house and contractor experience with UHDF mining  Sufficient, existing paste-fill capacity – ca.2,000m3/day  *Underhand Drift and Fill (UHDF) is also referred to as Underhand Cut and Fill. 
 

 OBUASI: UHDF IN HIGH GRADE ORE BODIES WITH POOR GROUND CONDITIONS  Highly selective mining method with high mining recovery (ca.100% UHDF vs 80% SLOS) lower dilution (ca.5% vs ca.20% for SLOS)  Efficient extraction ratio of close to 100% with UHDF; SLOS requires stability pillars to be left behind sterilizing ca.15% of ore body  Top-down mining method undertaken by lateral development as opposed to vertical open stoping currently used; stope development backfilled with engineered paste fill improves ground stability and safety  Similar development from decline as used for SLOS employed elsewhere in the mine  22  Graphic source: Cemented Paste Backfill Geomechanics at the Lucky Friday Mine UHDF = Underhand Drift & Fill. SLOS = Sub-level Open Stoping  Desktop studies show an expected 30% increase in mined grade through the use of UHDF, which is anticipated to more than offset a ca.20% increase in mining costs per tonne due to the use of this method; consequently, these studies show that the use of UHDF in high grade areas is expected to result in a ca.5% improvement in costs per ounce versus SLOS. 
 

 Top level  Top level  Bottom level  Bottom level  V30 raise hole  760mm ø  Long hole slot rises  252mm ø  OBUASI: WIDER REAMING FOR MORE EFFICIENT SET-UP OF CONVENTIONAL SLOS STOPES  A near-term solution is to drill larger raise holes…  …to successfully open stopes.  23  ITH V30 drill bit  Larger raise hole  Majority of mining will continue with SLOS  UHDF for high grade areas with poor ground conditions  In SLOS areas, V30 reamer will drill 3X wider raise holes within the slot to limit blast damage and improve overall ore extraction  Key focus is to improve stoping performance:  Move slot raise into more stable hanging wall  Wider reaming means less initial blasting required  Already showing benefits  During October and November 2023, tonnages have improved by ca.30% relative to Q3 2023  UHDF = Underhand Drift & Fill. SLOS = Sub-level Open Stoping. 
 

 OBUASI: UHDF ANIMATION  24  UHDF = Underhand Drift & Fill. SLOS = Sub-level Open Stoping. 
 

 CONCLUSION 
 

 DECISIVE STEPS TAKEN TO STRENGTHEN OUR INVESTMENT CASE  AngloGold Ashanti Comp group range  Company reports, Comp group: Barrick, Newmont  26  STRONG  INDUSTRY POSITION  TRIFR 1.16 (9M YTD 2023) vs ICMM 2.66 (2022)  Mineral Reserve growth ~26% over six years  Recovered grades improved ~50% over four years  Decarbonisation strategy initiated; projects commenced  FOCUS ON  IMPROVED OUTCOMES  On track to achieve 2023 guidance  Obuasi ramping-up; Geita LOM up from 2 to 7 years; proposed Iduapriem-Tarkwa JV; CdS placed on C&M  Full Potential: Sunrise Dam ore tonnes +10% y-on-y in H1 2023  Completed sale of 50% stake in Gramalote to B2Gold  COMMITTED TO SUPERIOR RETURNS  Pursuing re-rating through improved fundamentals  Primary listing in largest capital markets  Low leverage, dividends 20% of FCF pre-growth capex  Significant growth expected in Nevada projects  140  130  120  110  100  90  80  150  Q1 2021  Q2 2021  Q3 2021  Q4 2021  Q1 2022  Q2 2022  Q3 2022  Q4 2022  Q1 2023  Q2 2023  Q3 2023  AISC trend vs. Comp group (Index Q1 2021 = 100) – cost increases below industry peers  160 


 28  APPENDICES: NON-GAAP DISCLOSURE - RECONCILIATIONS 
 

 APPENDICES: NON-GAAP DISCLOSURE - RECONCILIATIONS  Geita  Obuasi  Iduapriem  Tropicana  Sub-total  Kibali JV  Tier 1  All-in sustaining costs  Cost of sales per segmental information  293  157  195  202  847  181  1,028  By-product revenue  (1)  -  -  (1)  (2)  -  (2)  Cost of sales  292  157  195  201  845  181  1,026  Realised other commodity contracts  -  -  -  -  -  -  -  Amortisation of tangible, intangible and right of use assets  (41)  (30)  (66)  (40)  (177)  (45)  (222)  Adjusted for decommissioning and inventory amortisation  -  -  -  -  -  -  -  Corporate administration, marketing and related expenses  -  1  (1)  -  -  -  -  Lease payment sustaining  12  (1)  2  5  18  (1)  17  Sustaining exploration and study costs  5  -  -  -  5  -  5  Total sustaining capital expenditure  57  47  43  21  168  28  196  All-in sustaining costs  325  174  173  187  859  163  1,022  Adjusted for non-controlling interests and non-gold producing companies(1)  -  -  -  -  -  -  -  All-in sustaining costs adjusted for non-controlling interest and non-gold producing companies  325  174  173  187  859  163  1,022  All-in sustaining costs  325  174  173  187  859  163  1,022  Non-sustaining project capital expenditure  19  28  27  30  104  16  120  Non-sustaining lease payments  1  -  -  -  1  -  1  Non-sustaining exploration and study costs  4  -  1  3  8  -  8  Care and maintenance  -  -  -  -  -  -  -  Closure and social responsibility costs not related to current operations  -  -  -  -  -  2  2  Other provisions  -  -  -  -  -  -  -  All-in costs  349  202  201  220  972  181  1,153  Adjusted for non-controlling interests and non-gold producing companies(1)  -  -  -  -  -  -  -  All-in costs adjusted for non-controlling interest and non-gold producing companies  349  202  201  220  972  181  1,153  Gold sold - oz (000)(2)  226  125  124  137  612  154  766  All-in sustaining cost per ounce - $/oz(3)  1,436  1,392  1,396  1,363  1,404  1,060  1,334  All-in cost per ounce - $/oz(3)  1,544  1,613  1,618  1,608  1,588  1,174  1,505  Sunrise Dam  Siguiri  Cerro Vanguardia  Cuiabá (5)  Tier 2  196  234  151  146  727  (1)  (1)  (37)  (1)  (40)  195  233  114  145  687  -  -  -  -  -  (25)  (15)  (19)  (37)  (96)  -  -  -  7  7  -  -  -  -  -  6  1  -  13  20  2  3  4  -  9  22  11  33  59  125  200  233  132  187  752  -  (35)  (10)  -  (45)  200  198  122  187  707  200  233  132  187  752  -  4  -  -  4  -  -  -  -  -  1  3  4  2  10  -  -  -  -  -  -  -  -  45  45  -  -  -  -  -  201  240  136  234  811  -  (36)  (10)  -  (46)  201  204  126  234  765  129  114  76  93  412  1,541  1,747  1,607  2,001  1,714  1,553  1,798  1,649  2,469  1,857  Serra Grande  CdS (5)  Other  80  76  156  -  -  -  80  76  156  -  -  -  (19)  (5)  (24)  -  -  -  -  -  -  3  5  8  -  -  -  27  15  42  91  91  182  -  -  -  91  91  182  91  91  182  -  -  -  -  -  -  1  -  1  -  -  -  5  4  9  -  -  -  97  95  192  -  -  -  97  95  192  38  30  68  2,432  3,031  2,672  2,587  3,160  2,824  Corporate (4)  Africa other  Australia other  Americas other  Corporate and other  PROJECTS  1  -  16  2  19  -  -  -  -  -  -  -  1  -  16  2  19  -  5  -  -  -  5  -  (2)  -  (1)  -  (3)  -  -  -  -  -  -  -  44  -  -  -  44  -  -  -  1  -  1  -  -  -  -  -  -  1  -  -  -  -  -  -  48  -  16  2  66  1  -  -  -  -  -  -  48  -  16  2  66  1  48  -  16  2  66  1  -  -  -  -  -  10  -  -  -  -  -  -  -  -  9  -  9  70  -  -  -  -  -  2  3  -  -  -  3  -  16  -  -  -  16  -  67  -  25  2  94  83  -  -  -  -  -  -  67  -  25  2  94  83  -  -  -  -  -  -  -  -  -  -  -  -  -  -  -  -  -  -  JOINT VENTURES  SUBSIDIARIES  181  1,749  -  (42)  181  1,707  -  5  (45)  (300)  -  7  -  44  (1)  47  -  15  28  335  163  1,860  -  (45)  163  1,815  163  1,860  16  118  -  1  -  98  -  2  2  57  -  16  181  2,152  -  (46)  181  2,106  154  1,092  1,060  1,661  1,180  1,927  Corporate and other  (in $ millions, except as otherwise noted)  For the six months ended 30 June 2023  Adjusting for non-controlling interest of items included in calculation, to disclose the attributable portions only.  Attributable portion.  In addition to the operational performances of the mines, “all-in sustaining cost per ounce”, “all-in cost per ounce” and “total cash costs per ounce” are affected by fluctuations in the currency exchange rate. AngloGold Ashanti reports “all- in sustaining cost per ounce” and “all-in cost per ounce” calculated to the nearest US Dollar amount and gold sold in ounces. AngloGold Ashanti reports “total cash costs per ounce” calculated to the nearest US Dollar amount and gold produced in ounces.  Corporate includes non-gold producing subsidiaries.   (5) In Q3 2022, in line with AngloGold Ashanti's reinvestment strategy, strategic options were considered for the CdS mining complex that resulted in the disaggregation of the AngloGold Ashanti Mineração cash generating unit (CGU) into separate CdS and Cuiabá CGUs. As a result of the different strategic options for the two CGUs they have been classified in different Tiers. In Q3 2023, the CdS CGU was placed in care and maintenance.  29 
 

 30  Geita  Obuasi  Iduapriem  Tropicana  Sub-total  Kibali JV  Tier 1  Total cash costs  Cost of sales per segmental information  293  157  195  202  847  181  1,028  - By-product revenue  (1)  -  -  (1)  (2)  -  (2)  - Inventory change  (10)  (5)  (9)  3  (21)  (1)  (22)  - Amortisation of tangible assets  (29)  (30)  (64)  (36)  (159)  (44)  (203)  - Amortisation of right of use assets  (12)  -  (2)  (4)  (18)  (1)  (19)  - Amortisation of intangible assets  -  -  -  -  -  -  -  - Rehabilitation and other non- cash costs  (1)  (3)  (1)  (1)  (6)  (2)  (8)  - Retrenchment costs  -  -  -  -  -  -  -  Total cash costs net of by- product revenue  240  119  119  163  641  133  774  Adjusted for non-controlling interests and non-gold producing companies (1)  -  -  -  -  -  -  -  Total cash costs adjusted for non-controlling interests and non-gold producing companies  240  119  119  163  641  133  774  Gold produced - oz (000)(2)  217  117  118  138  590  151  741  Total cash costs per ounce -  $/oz(3)  1,107  1,020  1,004  1,182  1,086  880  1,044  Sunrise Dam  Siguiri  Cerro Vanguardia  Cuiabá (5)  Tier 2  196  234  151  146  727  (1)  (1)  (37)  (1)  (40)  (5)  (8)  3  13  3  (20)  (15)  (19)  (27)  (81)  (5)  -  -  (10)  (15)  -  -  -  -  -  1  (2)  (2)  -  (3)  -  -  -  (1)  (1)  166  208  96  120  590  -  (31)  (7)  -  (38)  166  177  89  120  552  127  110  79  112  428  1,304  1,621  1,128  1,077  1,293  Serra Grande  CdS (5)  Other  80  76  156  -  -  -  -  -  -  (16)  (3)  (19)  (3)  (2)  (5)  -  -  -  -  (3)  (3)  (1)  -  (1)  60  68  128  -  -  -  60  68  128  37  30  67  1,620  2,278  1,913  Corporate (4)  Africa other  Australia other  Americas other  Corporate and other  1  -  16  2  19  -  -  -  -  -  -  -  -  -  -  (2)  -  -  -  (2)  -  -  (1)  -  (1)  -  -  -  -  -  -  -  -  (1)  (1)  -  -  -  -  -  (1)  -  15  1  15  -  -  -  -  -  (1)  -  15  1  15  -  -  -  -  -  -  -  -  -  -  JOINT VENTURES  SUBSIDIARIES  181  1,749  -  (42)  (1)  (18)  (44)  (261)  (1)  (39)  -  -  (2)  (13)  -  (2)  133  1,374  -  (38)  133  1,336  151  1,085  880  1,232  Corporate and other  (in $ millions, except as otherwise noted)  Adjusting for non-controlling interest of items included in calculation, to disclose the attributable portions only.  Attributable portion.  In addition to the operational performances of the mines, “all-in sustaining cost per ounce”, “all-in cost per ounce” and “total cash costs per ounce” are affected by fluctuations in the currency exchange rate. AngloGold Ashanti reports “all-in sustaining cost per ounce” and “all-in cost per ounce” calculated to the nearest US Dollar amount and gold sold in ounces. AngloGold Ashanti reports “total cash costs per ounce” calculated to the nearest US Dollar amount and gold produced in ounces.  Corporate includes non-gold producing subsidiaries.  In Q3 2022, in line with AngloGold Ashanti's reinvestment strategy, strategic options were considered for the CdS mining complex that resulted in the disaggregation of the AngloGold Ashanti Mineração cash generating unit (CGU) into separate CdS and Cuiabá CGUs. As a result of the different strategic options for the two CGUs they have been classified in different Tiers. In Q3 2023, the CdS CGU was placed in care and maintenance.  For the six months ended 30 June 2023  APPENDICES: NON-GAAP DISCLOSURE - RECONCILIATIONS 


SIGNATURES


Pursuant to the requirements of the Securities Exchange Act of 1934, the registrant has duly caused this report to be signed on its behalf by the undersigned, thereunto duly authorized.


AngloGold Ashanti plc
Date: November 28, 2023


By:
/s/ HC Grantham
 
   
Name:
HC Grantham  
   
Title:
Interim Company Secretary