UNITED STATES
SECURITIES AND EXCHANGE COMMISSION
Washington, D.C. 20549
FORM 6-K
REPORT OF FOREIGN PRIVATE ISSUER PURSUANT TO RULE 13a-16 OR 15d-16 UNDER THE SECURITIES EXCHANGE ACT OF 1934
For the month of March, 2025
Commission File Number: 001-35129
Arcos Dorados Holdings Inc.
(Exact name of registrant as specified in its charter)
Río Negro 1338, First Floor
Montevideo, Uruguay, 11100
(Address of principal executive office)
Indicate by check mark whether the registrant files or will file annual reports under cover of Form 20-F or Form 40-F:
| Form 20-F | X |
Form 40-F |
ARCOS DORADOS HOLDINGS INC.
TABLE OF CONTENTS
| ITEM | |
| 1. | Press Release dated March 12, 2025 titled “Arcos Dorados Reports Fourth Quarter and Full Year 2024 Financial Results” |
SIGNATURE
Pursuant to the requirements of the Securities Exchange Act of 1934, the registrant has duly caused this report to be signed on its behalf by the undersigned, thereunto duly authorized.
| Arcos Dorados Holdings Inc. | |||||
| By: | /s/ Juan David Bastidas | ||||
| Name: | Juan David Bastidas | ||||
| Title: | Chief Legal Counsel | ||||
Date: March 12, 2025
Item 1
|
Arcos Dorados 4Q & Full Year 2024 Results 
|
 |
March 12, 2025


|
ARCOS DORADOS REPORTS FOURTH QUARTER AND FULL YEAR 2024 FINANCIAL RESULTS |

|
| • | Total revenues reached $1.1 billion in the fourth quarter and $4.5 billion for the full year 2024, its highest annual result in US dollars. |
| • | Digital channel sales (from Mobile App, Delivery and Self-order Kiosks) rose 18% year-over-year and contributed 57% of systemwide sales in the full year 2024. |
| • | The Loyalty Program had 15.8 million registered members at year-end 2024, adding 12.6 million members versus the prior year-end. |
| • | Consolidated Adjusted EBITDA1 in the fourth quarter and full year were $147.4 million and $500.1 million, respectively, the Company’s strongest US dollar results for each period. |
| • | Net Income in the fourth quarter was $58.4 million, or $0.28 per share, and $148.8 million for the full year, or $0.71 per share. |
| • | Net Debt to Adjusted EBITDA leverage ratio was 1.1x at year-end 2024. |
| • | The Board of Directors declared a cash dividend of $0.24 per share for 2025. |
Montevideo, Uruguay, March 12, 2025 – Arcos Dorados Holdings Inc. (NYSE: ARCO) (“Arcos Dorados” or the “Company”), Latin America and the Caribbean’s largest restaurant chain and the world’s largest independent McDonald’s franchisee, today reported unaudited results for the three months, and audited results for the twelve months, ended December 31, 2024.
|
| • | Consolidated revenues totaled $1.1 billion, driven by strong local currency revenue growth. |
| • | Systemwide comparable sales1 increased 21.5%, about in-line with blended inflation. |
| • | The Loyalty Program continued to grow, reaching 15.8 million registered members at the end of the quarter, up 22% sequentially. |
| • | Consolidated Adjusted EBITDA reached $147.4 million, rising 11.1% in US dollars year-over-year. |
| • | Consolidated Adjusted EBITDA margin was 12.9%, up 160 basis points versus the prior year quarter. |
| • | Net Income was $58.4 million, with a 5.1% margin. |
| • | The Company opened 29 Experience of the Future (EOTF) restaurants in the quarter, including 26 free-standing locations and 15 new units in Brazil. |
________________
1 For definitions, please refer to page 16 of this document.
|

|
| • | Consolidated revenues totaled $4.5 billion, driven by strong local currency growth in all divisions. |
| • | Systemwide comparable sales rose 32.8% on a consolidated basis, or 0.9x blended inflation. |
| • | Systemwide comparable were up 7.8%, or 1.7x blended inflation, excluding Argentina. |
| • | Consolidated Adjusted EBITDA was $500.1 million, up 5.9% in US dollars versus the prior year, reaching this important milestone for the first time. |
| • | Consolidated Adjusted EBITDA margin was 11.2% for the year, up 30 basis points versus 2023. |
| • | Net Income was $148.8 million, with a 3.3% margin. |
| • | Restaurant openings reached 85 new units, including 79 free-standing restaurants and 47 openings in Brazil. |
| • | Capital expenditures totaled $327.6 million, for openings, modernizations, maintenance and other capital investments. |
|
The resilience of the Arcos Dorados business model has been an important theme over the last couple of years. Perhaps 2024 is the best example of how the Company’s geographic, economic and operating diversity allow us to outperform in just about any environment.
Full year 2024 total revenue of $4.5 billion was our highest ever, despite a more discerning consumer and challenging macroeconomic conditions, including currency headwinds, in many of our largest markets. Revenue was supported by systemwide comparable sales growth of 1.7x blended inflation, excluding Argentina, with positive contributions from both average check and guest volume growth in all three divisions.
Additionally, Adjusted EBITDA for the full year reached $500 million, including an 11.2% margin, both representing new highs for Arcos Dorados. This is a notable achievement given the challenging macroeconomic environment we faced in 2024, especially in the second half of the year, when two of the most important currencies in our footprint, the Brazilian real and Mexican peso, depreciated strongly. Not to mention the material reduction in US dollar EBITDA generated in Argentina due to that country’s significant economic correction. We are very proud to have reached these important milestones.
The Four D’s Strategy (Digital, Delivery, Drive-thru and Development) leveraged our structural competitive advantages, and each pillar of the strategy still has plenty of potential to drive sales and operating efficiencies into the future. All of this is supported by a strong and stable balance sheet, with a healthy leverage ratio and no significant debt maturities in the next four years.
We are operating from a position of strength in Latin America, with significant market share leadership, an industry benchmark Digital platform, and the most modernized restaurant portfolio in the region’s QSR industry. This gives us the strategic flexibility to pull the levers necessary to adapt to any operating environment and to changing consumer preferences.
Arcos Dorados and McDonald’s share a long-term vision for the future of the Brand in Latin America and the Caribbean, and we are aligned strategically in terms of how to best realize that vision for decades to come.
|
1 |
Consolidated Results
|
|
|
Figure 1. AD Holdings Inc Consolidated: Key Financial Results
(In millions of U.S. dollars, except as noted)
| 4Q23 (a) |
Currency
Translation (b) |
Constant Currency Growth (c) |
4Q24 (a+b+c) |
% As Reported | % Constant Currency | |
| Total Restaurants (Units) | 2,361 | 2,428 | ||||
| Sales by Company-operated Restaurants | 1,121.5 | (330.4) | 300.1 | 1,091.2 | -2.7% | 26.8% |
| Revenues from franchised restaurants | 54.0 | (13.5) | 12.6 | 53.1 | -1.7% | 23.3% |
| Total Revenues | 1,175.5 | (343.9) | 312.7 | 1,144.2 | -2.7% | 26.6% |
| Systemwide Comparable Sales | 21.5% | |||||
| Adjusted EBITDA | 132.6 | (32.1) | 46.9 | 147.4 | 11.1% | 35.4% |
| Adjusted EBITDA Margin | 11.3% | 12.9% | 1.6 p.p. | |||
| Net income (loss) attributable to AD | 55.8 | (23.9) | 26.5 | 58.4 | 4.7% | 47.5% |
| Net income attributable to AD Margin | 4.7% | 5.1% | 0.4 p.p. | |||
| No. of shares outstanding (thousands) | 210,655 | 210,663 | ||||
| EPS (US$/Share) | 0.26 | 0.28 |
Arcos Dorados’ total revenues reached $1.1 billion, down 2.7% in US dollars versus the prior year quarter, due to the strong depreciation of local currencies and the challenging macroeconomic and consumer environments in the region. The Company’s systemwide comparable sales rose 21.5% in the quarter, driving strong constant currency growth in total revenues. Excluding Argentina, systemwide comparable sales grew 1.1x blended inflation for the period.
The Four-D’s strategy, drove market share gains all year. According to the Company’s proprietary research, in 2024 McDonald’s value share expanded across its footprint compared with the prior year, reinforcing its market share leadership in the region’s quick service restaurant (QSR) industry.
The convenience of its Digital platform, including McDelivery, Mobile App and Self-order Kiosks, represents an important competitive advantage for Arcos Dorados. Digital channel sales reached new quarterly and full year records of $863.5 million and $3.3 billion, respectively, up 7% and 18% versus the prior year. By the end of fourth quarter, digital sales represented 58% of systemwide sales, including 25% identified sales.
The Loyalty Program continues to grow, reaching 15.8 million registered members at the end of 2024, up from 3.2 million at the end of 2023. Available in Brazil, Costa Rica and Uruguay last year, the program generated higher guest frequency and average check among members, accounting for 18% of total sales in these markets in the fourth quarter.
In line with its plan to reach substantially all markets by year-end 2025, during the first quarter of 2025, Arcos Dorados launched its Loyalty Program in Argentina and Colombia, with encouraging initial results among guests in those countries.
As of the end of December 2024, the Company’s customer relationship management (CRM) platform had approximately 99 million unique registered users, and its Mobile App registered about 20.8 million monthly active users in the fourth quarter.
|
|
($ million)
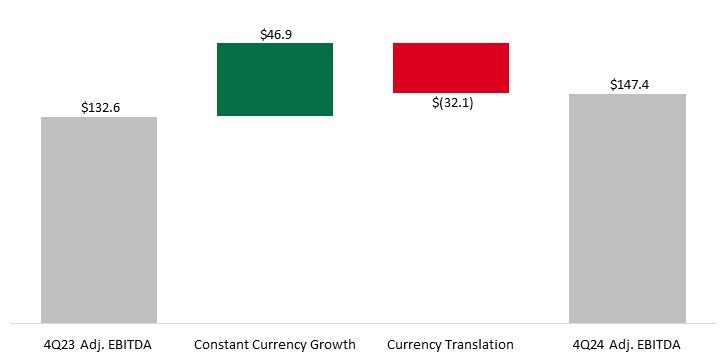
Fourth quarter consolidated Adjusted EBITDA reached $147.4 million, up 11.1% in US dollars over the prior year quarter, with continued strong local currency growth partially offset by an unfavorable exchange rate environment. This result included the benefit of $13.6 million related to payroll tax credits in Brazil.
Net income attributable to the Company totaled $58.4 million, compared to net income of $55.8 million in the same period of 2023. In addition to the abovementioned impacts on Adjusted EBITDA, the result included a depreciation and amortization expense of $43.7 million, a net interest expense of $8.2 million (including $8.0 million in interest on the payroll tax credits in Brazil), and a $1.0 million gain from non-cash foreign exchange and derivative instruments. The result also included an income tax expense of $33.2 million.
Consolidated Adjusted EBITDA margin reached 12.9%, up 160 basis points year-over-year, or up 40 basis points excluding the payroll tax credit in Brazil. This included lower Food and Paper (F&P) costs as a percentage of revenue, driven by a better gross margin in NOLAD and SLAD, coupled with lower Payroll expenses and General and Administrative expenses (G&A). These effects were partially offset by slightly higher Occupancy & Other Operating expenses as a percentage of revenue versus the prior year period.
Net income margin attributable to the Company was 5.1%, up from 4.7% in the fourth quarter of 2023. In addition to the abovementioned impacts on the Adjusted EBITDA margin, there were higher net interest and income tax expenses, partially offset by a gain from non-cash foreign exchange and derivative instruments versus a loss in these lines in the prior year quarter.
Arcos Dorados recorded earnings of $0.28 per share in the fourth quarter of 2024 compared to $0.26 per share in the prior year period. Total weighted average shares amounted to 210,663,057 in the fourth quarter compared to 210,654,969 in the prior year’s quarter.
|
Included in Adjusted EBITDA: Brazil’s result in the fourth quarter of 2024 included a $13.6 million positive impact from payroll tax credits.
Excluded from Adjusted EBITDA: In the fourth quarter of 2024 and in the fourth quarter of 2023, other operating income/(expense) included a total of $3.0 million and $7.4 million, respectively, in non-cash expenses, primarily related to impairments and write-offs of long-lived assets.
|
2 |
Divisional Results
|

|
|
Figure 2. Brazil Division: Key Financial Results
(In millions of U.S. dollars, except as noted)
| 4Q23 (a) |
Currency
Translation |
Constant Currency Growth (c) |
4Q24 (a+b+c) |
% As Reported | % Constant Currency | |
| Total Restaurants (Units) | 1,130 | 1,173 | ||||
| Total Revenues | 482.9 | (81.3) | 44.3 | 445.9 | -7.7% | 9.2% |
| Systemwide Comparable Sales | 5.5% | |||||
| Adjusted EBITDA | 93.7 | (18.2) | 23.9 | 99.4 | 6.0% | 25.5% |
| Adjusted EBITDA Margin | 19.4% | 22.3% | 2.9 p.p. |
Brazil’s revenues totaled $445.9 million, down 7.7% in US dollars due to the depreciation of the Brazilian real. Systemwide comparable sales rose 5.5% year-over-year, or 1.1x the country’s inflation in the period, supporting strong local currency growth in total revenues.
The McDonald’s brand ended the year with its highest ever “Top of Mind” score and a substantial growth in “Favorite Brand” metrics in the country. In terms of market share, the Company maintained its leadership position, with more than twice the value share of its main competitor.
Digital channels generated almost 70% of total sales, including 30% identified sales in the quarter. The Loyalty Program “Meu Méqui” helped drive this result and continues to evolve in the country as a key driver of customer engagement, enabling the Company to elevate guests’ emotional connection with the Brand and drive higher guest frequency through personalized marketing campaigns.
Marketing initiatives in the fourth quarter included new menu items such as the new “Tasty Turbo” platform, strengthening the premium beef category, as well as a campaign leveraging the iconic nature of the Big Mac. The Company introduced the “McFlurry KitKat Triple Chocolate” to enhance sales in the dessert category, while the family business benefited from powerful Happy Meal licenses such as “Wiltopia” and “Sonic 3”. In addition, “Méqui Friday” (a play on Black Friday) and the interactive retrospective campaign “Meu Méqui do Ano” were huge successes among guests. The latter was a data-driven, personalized campaign available on the Company’s Mobile App that celebrated the Méqui Lovers’ consumption habits throughout the year offering a unique experience and strong user engagement.
As reported Adjusted EBITDA in the division totaled $99.4 million in the quarter, rising 6.0% in US dollars versus the prior year. Strong local currency results were partially offset by a depreciation of the Brazilian real. Adjusted EBITDA margin was 22.3%, expanding 290 basis points versus the fourth quarter of 2023. Excluding the payroll tax credits, Brazil’s Adjusted EBITDA margin was close to flat, with operating leverage in all expense line items offsetting higher Food & Paper costs in the period.
|
|
|
Figure 3. NOLAD Division: Key Financial Results
(In millions of U.S. dollars, except as noted)
| 4Q23 (a) |
Currency
Translation (b) |
Constant Currency Growth (c) |
4Q24 (a+b+c) |
% As Reported | % Constant Currency | |
| Total Restaurants (Units) | 647 | 654 | ||||
| Total Revenues | 300.4 | (13.8) | 16.6 | 303.1 | 0.9% | 5.5% |
| Systemwide Comparable Sales | 4.1% | |||||
| Adjusted EBITDA | 31.1 | (1.3) | 0.9 | 30.8 | -1.1% | 3.0% |
| Adjusted EBITDA Margin | 10.4% | 10.2% | -0.2 p.p. |
As reported revenues in NOLAD totaled $303.1 million, rising 0.9% versus the prior year quarter, overcoming the depreciation of the Mexican peso and the challenging economic environment in the region. Systemwide comparable sales rose 4.1% year-over-year, or 1.7x the division’s blended inflation in the period, with particularly strong traffic growth in Mexico, Panama and French Guiana.
Digital channel sales rose 17% versus the prior year and represented about 40% of systemwide sales in the fourth quarter. The Company’s continued investment in the modernization and digitalization of its restaurants drove a significant increase in Delivery and Self-Order Kiosk sales versus the previous year.
New and improved Mobile App functionalities as well as the launch of the Loyalty Program in Costa Rica, also contributed to leverage NOLAD’s digital sales growth in 2024. Eight months after its launch, the Loyalty Program had over 600 thousand registered members in Costa Rica at year end. As it did in Brazil and Uruguay, the Loyalty Program boosted guest frequency and identified sales penetration in the market, with the latter reaching 33% of total sales in the fourth quarter.
NOLAD’s key marketing activities featured menu innovations across the region, including the launch of the “Cheddar Jalapeño” campaign in Mexico, a vertical initiative across menu favorites such as Quarter Pounder, McCrispy Chicken and the indulgent “GRANDS” sandwiches, all served with a bowl of melted cheddar cheese with jalapeño. In Panama, the value platform remained an important pillar, while innovations in the “McCrispy Legend” platform and the launch of the “Cheddar McMelt” also contributed to strong traffic and sales growth in the country. The Puerto Rico business strengthened the McDonald’s brand with a new chicken sandwich on the “My Combo” value platform and the introduction of a new burrito for the breakfast value menu, while also leveraging the Best Burger platform with the launch of the “Quarter Pounder Western BBQ.”
As reported Adjusted EBITDA in the division was $30.8 million in the quarter, down 1.1% versus the prior year in US dollars, mainly due to a 20 basis point lower margin. The margin decline resulted from lower F&P and G&A expenses offset by higher Occupancy & Other Operating expenses as a percentage of revenue. Payroll expenses remained relatively flat as a percentage of revenue versus the previous year.
|
|
Figure 4. SLAD Division: Key Financial Results
(In millions of U.S. dollars, except as noted)
| 4Q23 (a) |
Currency
Translation (b) |
Constant Currency Growth (c) |
4Q24 (a+b+c) |
% As Reported | % Constant Currency | |
| Total Restaurants (Units) | 584 | 601 | ||||
| Total Revenues | 392.1 | (248.8) | 251.8 | 395.2 | 0.8% | 64.2% |
| Systemwide Comparable Sales | 61.8% | |||||
| Adjusted EBITDA | 41.0 | (29.9) | 31.5 | 42.7 | 4.1% | 76.9% |
| Adjusted EBITDA Margin | 10.5% | 10.8% | 0.3 p.p. |
As reported revenues in SLAD totaled $395.2 million, driven by a 61.8% increase in systemwide comparable sales versus the prior year, which includes the effect of Argentina and Venezuela’s high inflation rates. SLAD’s systemwide comparable sales grew 0.8x the division’s blended inflation in the quarter.
The Company continued to focus on leveraging its competitive advantages and investing in its digital platform to strengthen value perception and brand preference among guests. This led to an expansion of brand equity scores and visit share against the main competitors in the division.
Digital sales penetration expanded significantly and accounted for 57% of systemwide sales, compared with 51% in the prior year quarter, due to the strong performance of Delivery and consistent increases in sales through the Mobile Order and Pay functionality on the Mobile App. The Loyalty Program launched in Uruguay at the end of April, drove digital sales growth in the country, with improvements in guest frequency, average check and profitability.
Marketing initiatives focused on promotions and limited time offers to strengthen the uniqueness of the brand as well as its quality and taste perception with menu favorites such as McChicken, Big Mac and desserts. This included the launch of the “McCrispy Chicken Legend” sandwich in Chile and a Big Mac platform extension in Colombia. The dessert category brought innovation to several markets with the launch of the Oreo cone in Argentina and new McFlurry flavors such as “Rolls” in Chile, “Piazza” in Colombia, “Tres Leches” in Peru and “Cri Cri” in Venezuela. The Company also ran special editions of the Quarter Pounder to support the regional sponsorship of Formula One and strengthen sales in the core menu. Finally, the introduction of a new affordability platform in Argentina and Colombia reinforced the brand’s value for money proposition.
As reported Adjusted EBITDA totaled $42.7 million in the fourth quarter, up 4.1% despite the significant devaluation of the Argentine peso. Adjusted EBITDA margin expanded 30 basis points versus the prior year quarter. The division’s Adjusted EBITDA margin was positively impacted by lower F&P costs and Payroll expenses as a percentage of revenue. These were partially offset by higher Occupancy & Other Operating expenses as a percentage of revenue.
|
|
Figure 5. Total Restaurants (end of period)*
| December 2024 |
September 2024 |
June 2024 |
March 2024 |
December 2023 |
|
| Brazil | 1,173 | 1,160 | 1,150 | 1,141 | 1,130 |
| NOLAD | 654 | 649 | 649 | 647 | 647 |
| SLAD | 601 | 601 | 596 | 593 | 584 |
| TOTAL | 2,428 | 2,410 | 2,395 | 2,381 | 2,361 |
*Considers Company-operated and franchised restaurants at period-end
Figure 6. Footprint as of December 31, 2024
| Store Type* | Total Restaurants | Ownership | McCafes | Dessert Centers | ||||
| FS | IS | MS & FC | Company Operated | Franchised | ||||
| Brazil | 625 | 91 | 457 | 1,173 | 723 | 450 | 138 | 2,011 |
| NOLAD | 411 | 47 | 196 | 654 | 497 | 157 | 19 | 525 |
| SLAD | 260 | 124 | 217 | 601 | 505 | 96 | 220 | 732 |
| TOTAL | 1,296 | 262 | 870 | 2,428 | 1,725 | 703 | 377 | 3,268 |
FS: Free-Standing; IS: In-Store; MS: Mall Store; FC: Food Court.
During the fourth quarter of 2024, Arcos Dorados opened 29 EOTF restaurants, including 26 free-standing units. For the full year, the Company opened 85 restaurants, 79 of which were free-standing restaurants. In Brazil, the Company opened 15 EOTF locations in the quarter and 47 restaurants in the full year 2024, including 46 free-standing units.
Arcos Dorados continued modernizing existing restaurants and, as of the end of December 2024, there were 1,629 EOTF restaurants offering guests the most modern and complete restaurant experience and making up 67% of the Company’s total footprint.
|
|
Figure 7. Consolidated Debt and Financial Ratios
(In thousands of U.S. dollars, except ratios)
| December 31, | December 31, | |
| 2024 | 2023 | |
| Total cash & cash equivalents (i) | 138,593 | 246,767 |
| Total Financial Debt (ii) | 707,649 | 728,093 |
| Net Financial Debt (iii) | 569,056 | 481,326 |
| LTM Adjusted EBITDA | 500,100 | 472,304 |
| Total Financial Debt / LTM Adjusted EBITDA ratio | 1.4 | 1.5 |
| Net Financial Debt / LTM Adjusted EBITDA ratio | 1.1 | 1.0 |
| LTM Net income attributable to AD | 148,759 | 181,274 |
| Total Financial Debt / LTM Net income attributable to AD ratio | 4.8 | 4.0 |
| Net Financial Debt / LTM Net income attributable to AD ratio | 3.8 | 2.7 |
| (i) | Total cash & cash equivalents include short-term investment. |
| (ii) | Total financial debt includes short-term debt, long-term debt, accrued interest payable and derivative instruments (including the asset portion of derivatives amounting to $80.3 million and $46.5 million as a reduction of financial debt as of December 31, 2024 and December 31, 2023, respectively). |
| (iii) | Net financial debt equals total financial debt less total cash & cash equivalents. |
As of December 31, 2024, total cash and cash equivalents were $138.6 million and total financial debt (including the net derivative instrument position) was $707.6 million. Net debt (total financial debt minus total cash and cash equivalents) was $569.1 million, up from $481.3 million at the end of 2023, due to the lower cash balance.
The net debt to Adjusted EBITDA leverage ratio ended the quarter at 1.1x, nearly unchanged from year-end 2023.
Net cash generated from operating activities for the full year 2024, totaled $266.8 million. Cash used in net investing activities totaled $280.3 million, including capital expenditures of $327.6 million, partially compensated by $46.1 million in net proceeds from financial investments. Net cash used in financing activities was $37.2 million.
|
Arcos Dorados reiterates its guidance, of 90 to 100 restaurants openings and total capital expenditures of $300 million to $350 million expected for the full year 2025.
|
3 |
Recent Developments |

|
|
Fitch Rating Action
In January 2025, Fitch Ratings upgraded Arcos Dorados’ corporate and senior debt rating to BBB- (investment grade) from BB+. To support the upgrade, Fitch cited the Company's continued strong performance and robust liquidity. The upgrade was also based on the improvement in Arcos Dorados’ leverage metrics and comfortable debt maturity profile, supporting the execution of its growth strategy, with strong geographic diversification and increasing EBITDA generation from investment grade countries.
2027 Notes Tender Offer and Redemption
On January 15, 2025, the Company launched a cash tender offer to purchase the outstanding amount of its 2027 Notes, at a redemption price equal to 100% of the outstanding principal amount of the Notes. The offer expired on January 23, 2025, and, as a consequence, on January 29, 2025, the Company redeemed 35.3% of the outstanding 2027 Notes for $136.1 million plus accrued and unpaid interest.
On February 28, 2025, the Company announced the redemption of the untendered portion of the 2027 Notes, at a price equal to 100% of the outstanding principal amount of the Notes plus accrued and unpaid interest from October 4, 2024, to April 4, 2025, the redemption date.
2032 Notes Issuance
On January 24, 2025, the Company announced the pricing of $600 million of Senior Notes due in 2032, issued by its subsidiary Arcos Dorados B.V. The 2032 Notes bear interest of 6.375% per year to be paid semiannually, in January and July, commencing on July 29, 2025.
The proceeds from the 2032 Notes are being used to fund the aforementioned 2027 Notes Tender Offer and Redemption as well as for general corporate purposes.
2025 Dividend
On March 11, 2025, the Board of Directors of Arcos Dorados Holdings Inc. approved a cash dividend for 2025. As such, the Company will pay $0.24 per share to all Class A and Class B shareholders of the Company in four installments of $0.06 per share to be made on March 27, 2025, June 27, 2025, September 26, 2025, and December 26, 2025. The payments will be made to shareholders of record as of March 24, 2025, June 24, 2025, September 23, 2025, and December 22, 2025, respectively.
2025 Annual General Shareholders Meeting (AGM)
On March 07, 2025, the Company’s Board of Directors set the date for its AGM, which will be held on April 25, 2025, in Willemstad, Curaçao, at 4:00 p.m. (local time), for all shareholders of record as of March 31, 2025.
|
A webcast to discuss the information contained in this press release will be held today, March 12, 2025, at 10:00 a.m. ET. In order to access the webcast, members of the investment community should follow this link: Arcos Dorados Fourth Quarter 2024 Earnings Webcast.
A replay of the webcast will be available later today in the investor section of the Company’s website: https://ir.arcosdorados.com/.
|
Investor Relations Contact Dan Schleiniger VP of Investor Relations Arcos Dorados daniel.schleiniger@mcd.com.uy |
Media Contact David Grinberg VP of Corporate Communications Arcos Dorados david.grinberg@mcd.com.uy |
Follow us on: 


|
|
In analyzing business trends, management considers a variety of performance and financial measures which are considered to be non-GAAP including: Adjusted EBITDA, Constant Currency basis, Systemwide sales, and Systemwide comparable sales growth.
Adjusted EBITDA: In addition to financial measures prepared in accordance with the general accepted accounting principles (GAAP), this press release and the accompanying tables use a non-GAAP financial measure titled ‘Adjusted EBITDA’. Management uses Adjusted EBITDA to facilitate operating performance comparisons from period to period.
Adjusted EBITDA is defined as the Company’s operating income plus depreciation and amortization plus/minus the following losses/gains: gains from sale or insurance recovery of property and equipment, write-offs of long-lived assets, and impairment of long-lived assets.
Management believes Adjusted EBITDA facilitates company-to-company operating performance comparisons by backing out potential differences caused by variations such as capital structures (affecting net interest expense and other financing results), taxation (affecting income tax expense) and the age and book depreciation of facilities and equipment (affecting relative depreciation expense), which may vary for different companies for reasons unrelated to operating performance. Figure 8 of this earnings release includes a reconciliation for Adjusted EBITDA. For more information, please see Adjusted EBITDA reconciliation in Note 21 – Segment and geographic information – of our financial statements (6-K Form) filed today with the S.E.C.
Constant Currency basis: refers to amounts calculated using the same exchange rate over the periods under comparison to remove the effects of currency fluctuations from this trend analysis. To better discern underlying business trends, this release uses non-GAAP financial measures that segregate year-over-year growth into two categories: (i) currency translation and (ii) constant currency growth. (i) Currency translation reflects the impact on growth of the appreciation or depreciation of the local currencies in which the Company conducts its business against the US dollar (the currency in which the Company’s financial statements are prepared). (ii) Constant currency growth reflects the underlying growth of the business excluding the effect from currency translation. The Company also calculates variations as a percentage in constant currency, which are also considered to be non-GAAP measures, to provide a more meaningful analysis of its business by identifying the underlying business trends, without distortion from the effect of foreign currency fluctuations.
Systemwide sales: Systemwide sales represent measures for both Company-operated and sub-franchised restaurants. While sales by sub-franchisees are not recorded as revenues by the Company, management believes the information is important in understanding its financial performance because these sales are the basis on which it calculates and records sub-franchised restaurant revenues and are indicative of the financial health of its sub-franchisee base.
Systemwide comparable sales growth: this non-GAAP measure, refers to the change, on a constant currency basis, in Company-operated and sub-franchised restaurant sales in one period from a comparable period for restaurants that have been open for thirteen months or longer (year-over-year basis) including those temporarily closed. Management believes it is a key performance indicator used within the retail industry and is indicative of the success of the Company’s initiatives as well as local economic, competitive and consumer trends. Sales by sub-franchisees are not recorded as revenues by the Company.
|
|
Arcos Dorados is the world’s largest independent McDonald’s franchisee, operating the largest quick service restaurant chain in Latin America and the Caribbean. It has the exclusive right to own, operate and grant franchises of McDonald’s restaurants in 20 Latin American and Caribbean countries and territories with more than 2,400 restaurants, operated by the Company or by its sub-franchisees, that together employ more than 100 thousand people (as of 12/31/2024). The Company is also committed to the development of the communities in which it operates, to providing young people their first formal job opportunities and to utilize its Recipe for the Future to achieve a positive environmental impact. Arcos Dorados is listed for trading on the New York Stock Exchange (NYSE: ARCO). To learn more about the Company, please visit the Investors section of our website: www.arcosdorados.com/ir.
|
This press release contains forward-looking statements. The forward-looking statements contained herein include statements about the Company’s business prospects, its ability to attract customers, its expectation for revenue generation, its outlook and guidance for 2025 and the renewal of its Master Franchise Agreement with McDonald’s. These statements are subject to the general risks inherent in Arcos Dorados' business. These expectations may or may not be realized. Some of these expectations may be based upon assumptions or judgments that prove to be incorrect. In addition, Arcos Dorados' business and operations involve numerous risks and uncertainties, many of which are beyond the control of Arcos Dorados, which could result in Arcos Dorados' expectations not being realized or otherwise materially affect the financial condition, results of operations and cash flows of Arcos Dorados. Additional information relating to the uncertainties affecting Arcos Dorados' business is contained in its filings with the Securities and Exchange Commission. The forward-looking statements are made only as of the date hereof, and Arcos Dorados does not undertake any obligation to (and expressly disclaims any obligation to) update any forward-looking statements to reflect events or circumstances after the date such statements were made, or to reflect the occurrence of unanticipated events.
|
|
Figure 8. Fourth Quarter and Full Year 2024 Consolidated Results
(In thousands of U.S. dollars, except per share data)
| For Three-Months ended | For Twelve-Months ended | |||
| December 31, | December 31, | |||
| 2024 | 2023 | 2024 | 2023 | |
| REVENUES | ||||
| Sales by Company-operated restaurants | 1,091,170 | 1,121,463 | 4,266,748 | 4,137,675 |
| Revenues from franchised restaurants | 53,050 | 53,992 | 203,414 | 194,203 |
| Total Revenues | 1,144,220 | 1,175,455 | 4,470,162 | 4,331,878 |
| OPERATING COSTS AND EXPENSES | ||||
| Company-operated restaurant expenses: | ||||
| Food and paper | (383,765) | (396,086) | (1,498,853) | (1,457,720) |
| Payroll and employee benefits | (194,228) | (209,756) | (797,620) | (790,042) |
| Occupancy and other operating expenses | (308,038) | (311,158) | (1,238,220) | (1,154,334) |
| Royalty fees | (66,855) | (68,961) | (265,382) | (249,278) |
| Franchised restaurants - occupancy expenses | (20,670) | (23,306) | (83,665) | (83,359) |
| General and administrative expenses | (70,177) | (82,076) | (279,859) | (285,000) |
| Other operating income / (expense), net | 2,433 | (2,325) | 17,952 | 1,894 |
| Total operating costs and expenses | (1,041,300) | (1,093,668) | (4,145,647) | (4,017,839) |
| Operating income | 102,920 | 81,787 | 324,515 | 314,039 |
| Net interest expense and other financing results | (8,179) | (5,315) | (47,238) | (32,275) |
| Gain / (Loss) from derivative instruments | 208 | 37 | 941 | (13,183) |
| Foreign currency exchange results | 760 | (11,457) | (15,063) | 10,774 |
| Other non-operating expenses, net | (3,979) | (1,138) | (3,873) | (1,238) |
| Income before income taxes | 91,730 | 63,914 | 259,282 | 278,117 |
| Income tax expense, net | (33,208) | (7,780) | (109,903) | (95,702) |
| Net income | 58,522 | 56,134 | 149,379 | 182,415 |
| Net income attributable to non-controlling interests | (118) | (356) | (620) | (1,141) |
| Net income attributable to Arcos Dorados Holdings Inc. | 58,404 | 55,778 | 148,759 | 181,274 |
| Net income attributable to Arcos Dorados Holdings Inc. Margin as % of total revenues | 5.1% | 4.7% | 3.3% | 4.2% |
| Earnings per share information ($ per share): | ||||
| Basic net income per common share | $ 0.28 | $ 0.26 | $ 0.71 | $ 0.86 |
| Weighted-average number of common shares outstanding-Basic | 210,663,057 | 210,654,969 | 210,660,590 | 210,632,812 |
| Adjusted EBITDA Reconciliation | ||||
| Net income attributable to Arcos Dorados Holdings Inc. | 58,404 | 55,778 | 148,759 | 181,274 |
| Net income attributable to non-controlling interests | 118 | 356 | 620 | 1,141 |
| Income tax expense, net | 33,208 | 7,780 | 109,903 | 95,702 |
| Other non-operating expenses, net | 3,979 | 1,138 | 3,873 | 1,238 |
| Foreign currency exchange results | (760) | 11,457 | 15,063 | (10,774) |
| Gain / (Loss) from derivative instruments | (208) | (37) | (941) | 13,183 |
| Net interest expense and other financing results | 8,179 | 5,315 | 47,238 | 32,275 |
| Depreciation and amortization | 43,650 | 43,462 | 177,354 | 149,268 |
| Operating charges excluded from EBITDA computation | 814 | 7,375 | (1,769) | 8,997 |
| Adjusted EBITDA | 147,384 | 132,624 | 500,100 | 472,304 |
| Adjusted EBITDA Margin as % of total revenues | 12.9 % | 11.3 % | 11.2 % | 10.9 % |
|
|
Figure 9. Fourth Quarter and Full Year 2024 Consolidated Results by Division
(In thousands of U.S. dollars)
| For Three-Months ended | as | Constant | For Twelve-Months ended | as | Constant | |||
| December 31, | reported | Currency | December 31, | reported | Currency | |||
| 2024 | 2023 | Incr/(Decr)% | Incr/(Decr)% | 2024 | 2023 | Incr/(Decr)% | Incr/(Decr)% | |
| Revenues | ||||||||
| Brazil | 445,911 | 482,937 | -7.7% | 9.2% | 1,768,311 | 1,701,547 | 3.9% | 12.4% |
| NOLAD | 303,141 | 300,415 | 0.9% | 5.5% | 1,225,751 | 1,132,912 | 8.2% | 8.6% |
| SLAD | 395,168 | 392,103 | 0.8% | 64.2% | 1,476,100 | 1,497,419 | -1.4% | 94.7% |
| TOTAL | 1,144,220 | 1,175,455 | -2.7% | 26.6% | 4,470,162 | 4,331,878 | 3.2% | 39.8% |
| Operating Income (loss) | ||||||||
| Brazil | 82,626 | 73,648 | 12.2% | 32.8% | 269,019 | 230,024 | 17.0% | 27.4% |
| NOLAD | 18,901 | 19,101 | -1.0% | 4.6% | 67,412 | 73,237 | -8.0% | -7.5% |
| SLAD | 29,070 | 24,582 | 18.3% | 107.1% | 87,406 | 121,683 | -28.2% | 44.5% |
| Corporate and Other | (27,677) | (35,544) | 22.1% | 27.6% | (99,322) | (110,905) | -10.4% | 73.2% |
| TOTAL | 102,920 | 81,787 | 25.8% | 50.8% | 324,515 | 314,039 | 3.3% | 9.7% |
| Adjusted EBITDA | ||||||||
| Brazil | 99,381 | 93,727 | 6.0% | 25.5% | 340,002 | 300,177 | 13.3% | 23.1% |
| NOLAD | 30,810 | 31,146 | -1.1% | 3.0% | 116,256 | 115,364 | 0.8% | 1.0% |
| SLAD | 42,675 | 41,010 | 4.1% | 76.9% | 133,692 | 160,380 | -16.6% | 64.6% |
| Corporate and Other | (25,482) | (33,259) | 23.4% | 28.3% | (89,850) | (103,617) | -13.3% | 73.7% |
| TOTAL | 147,384 | 132,624 | 11.1% | 35.4% | 500,100 | 472,304 | 5.9% | 20.8% |
Figure 10. Average Exchange Rate per Quarter*
| Brazil | Mexico | Argentina | |
| 4Q24 | 5.84 | 20.08 | 999.57 |
| 4Q23 | 4.95 | 17.54 | 445.71 |
* Local $ per 1 US$
|
|
Figure 11. Summarized Consolidated Balance Sheet
(In thousands of U.S. dollars)
| December 31, | December 31, | ||
| 2024 | 2023 | ||
| ASSETS | |||
| Current assets | |||
| Cash and cash equivalents | 135,064 | 196,661 | |
| Short-term investments | 3,529 | 50,106 | |
| Accounts and notes receivable, net | 119,441 | 147,980 | |
| Other current assets (1) | 209,953 | 210,531 | |
| Derivative instruments | 416 | — | |
| Total current assets | 468,403 | 605,278 | |
| Non-current assets | |||
| Property and equipment, net | 1,127,042 | 1,119,885 | |
| Net intangible assets and goodwill | 66,644 | 70,026 | |
| Deferred income taxes | 90,287 | 98,163 | |
| Derivative instruments | 79,874 | 46,486 | |
| Equity method investments | 14,346 | 18,111 | |
| Leases right of use asset | 949,977 | 954,564 | |
| Other non-current assets (2) | 96,081 | 106,725 | |
| Total non-current assets | 2,424,251 | 2,413,960 | |
| Total assets | 2,892,654 | 3,019,238 | |
| LIABILITIES AND EQUITY | |||
| Current liabilities | |||
| Accounts payable | 347,895 | 374,986 | |
| Taxes payable (3) | 118,466 | 163,143 | |
| Accrued payroll and other liabilities | 113,259 | 142,487 | |
| Royalties payable to McDonald’s Corporation | 20,860 | 21,292 | |
| Provision for contingencies | 1,199 | 1,447 | |
| Interest payable | 7,798 | 7,447 | |
| Financial debt (4) | 64,167 | 37,361 | |
| Operating lease liabilities | 92,280 | 93,507 | |
| Total current liabilities | 765,924 | 841,670 | |
| Non-current liabilities | |||
| Accrued payroll and other liabilities | 20,928 | 27,513 | |
| Provision for contingencies | 29,157 | 49,172 | |
| Financial debt (5) | 715,974 | 729,771 | |
| Deferred income taxes | 2,084 | 1,166 | |
| Operating lease liabilities | 849,158 | 853,107 | |
| Total non-current liabilities | 1,617,301 | 1,660,729 | |
| Total liabilities | 2,383,225 | 2,502,399 | |
| Equity | |||
| Class A shares of common stock | 389,967 | 389,907 | |
| Class B shares of common stock | 132,915 | 132,915 | |
| Additional paid-in capital | 8,659 | 8,719 | |
| Retained earnings | 664,390 | 566,188 | |
| Accumulated other comprehensive loss | (668,484) | (563,081) | |
| Common stock in treasury | (19,367) | (19,367) | |
| Total Arcos Dorados Holdings Inc shareholders’ equity | 508,080 | 515,281 | |
| Non-controlling interest in subsidiaries | 1,349 | 1,558 | |
| Total equity | 509,429 | 516,839 | |
| Total liabilities and equity | 2,892,654 | 3,019,238 | |
| (1) | Includes "Other receivables", "Inventories" and "Prepaid expenses and other current assets”. |
| (2) | Includes "Miscellaneous" and "Collateral deposits". |
| (3) | Includes "Income taxes payable" and "Other taxes payable". |
| (4) | Includes "Short-term debt”, “Current portion of long-term debt" and "Derivative instruments”. |
| (5) | Includes "Long-term debt, excluding current portion" and "Derivative instruments". |
|
Thank you!
|
|
