UNITED STATES
SECURITIES AND EXCHANGE COMMISSION
Washington, D.C. 20549
FORM 6-K
REPORT OF FOREIGN PRIVATE ISSUER PURSUANT TO RULE 13a-16 OR 15d-16 UNDER THE SECURITIES EXCHANGE ACT OF 1934
For the month of February 2024
Commission File Number: 001-39155
XP Inc.
(Exact name of registrant as specified in its charter)
20, Genesis Close
Grand Cayman, George Town
Cayman Islands KY-1-1208
+55 (11) 3075-0429
(Address of principal executive office)
Indicate by check mark whether the registrant files or will file annual reports under cover of Form 20-F or Form 40-F:
| Form 20-F |
X |
Form 40-F |
Indicate by check mark if the registrant is submitting the Form 6-K in paper as permitted by Regulation S-T Rule 101(b)(1):
| Yes | No |
X |
Indicate by check mark if the registrant is submitting the Form 6-K in paper as permitted by Regulation S-T Rule 101(b)(7):
| Yes | No |
X |
SIGNATURE
Pursuant to the requirements of the Securities Exchange Act of 1934, the registrant has duly caused this report to be signed on its behalf by the undersigned, thereunto duly authorized.
| XP Inc. | |||||
| By: | /s/ Bruno Constantino Alexandre dos Santos | ||||
| Name: | Bruno Constantino Alexandre dos Santos | ||||
| Title: | Chief Financial Officer | ||||
Date: February 27, 2024
EXHIBIT INDEX
| Exhibit No. | Description |
| 99.1 | Press Release dated February 27, 2024 – XP Inc. Reports 4Q23 Financial Results. |
| 99.2 | XP Inc. – 4Q23 Earnings Presentation. |
Exhibit 99.1

|
| 4Q23 Earnings Release |
| February 27th, 2024 |

|
XP Inc. Reports Fourth Quarter 2023 Results
São Paulo, Brazil, February 27, 2024 – XP Inc. (NASDAQ: XP) (“XP” or the “Company”), a leading tech-enabled platform and a trusted pioneer in providing low-fee financial products and services in Brazil, reported today its financial results for the fourth quarter of 2023.
To our shareholders
As we reflect on the journey of 2023, it's evident that the year was both challenging and transformative for XP Inc. In an environment marked by ongoing macroeconomic uncertainties and the evolving needs of our clients, we kept our commitment to innovation, quality, and growth. This year was a demonstration of our resilience, agility, and the enduring strength of our business model.
Business Model Resilience
Despite the still challenging macroeconomic environment mentioned beforehand, 2023 was a year of significant achievements that continued to prove the resilience of our business model. On the second quarter of 2023, we were happy to celebrate the monumental milestone of surpassing R$1 trillion in Client Assets, a clear indicator of our growing market presence and the trust our clients place on us. This achievement underscores our position as a leader in the Brazilian financial services industry and highlights our potential for further growth, given our market share of less than 12% in investments for individuals.
Our resilience was further demonstrated through our financial performance. Despite the macroeconomic headwinds, we reported record quarterly revenues and profitability, showcasing our ability to capitalize on market opportunities and maintain cost discipline. Our Earnings Before Tax (EBT) and Net Income saw year-over-year growth, reflecting our operational efficiency and the successful execution of our strategic initiatives.
Execution of Strategic Initiatives
Throughout the year, we continued to focus on our three key strategic pillars: 1. Leadership in investments, 2. Enhancement of our ability to cross-sell superior products and 3. Wholesale synergies. Central to these pillars is our commitment to a culture of quality – our third wave of differentiation. Also, during the year, we had the acquisition and subsequent integration of Banco Modal, which marked a significant step in our journey, expanding our capabilities and enhancing our product suite. This integration is almost complete by now, delivering revenue synergies and cost efficiencies.
Our New Verticals and Corporate & SMB initiatives continued to thrive, contributing significantly to our revenue diversification efforts, already contributing to more than 17% of our total gross revenue for the year, if we consider all the New Verticals, as we did on our Investor Day – including Retirement Plans, Cards, Credit, Insurance, FX, Global Investments and Digital Account. The recognition of our credit card as the Best in Brazil, recognized by Melhores Cartões, is evidence of our commitment to offer superior products and services.
Also, 2023 was marked by a strong focus on efficiency and cost discipline throughout the whole company, as we achieved an Efficiency Ratio of 36.3%, the lowest level since our IPO.
Distribution Channels Evolution
In our efforts to expand and diversify, we have positioned ourselves as a hub for entrepreneurs, consistently pioneering in our distribution channel efforts. Our strategy encompasses a broad spectrum of distribution channels, including B2B, B2C, wealth managers, broker as a service, and consultants, enabling us to reach a diverse client base and cater to their unique needs. This diversification allows us to be at the forefront of the financial services industry, adapting to changes and seizing opportunities with agility and foresight.
Democratizing Access to Premium Quality Services
A cornerstone of our mission this year has been to focus more on the quality of what we offer to our clients. We are dedicated to democratizing access to premium services which were previously available only to private clients. By extending these high-quality offerings to affluent clients, we are breaking down barriers and creating a more inclusive financial ecosystem with scalability. This initiative mirrors our past successes in making top-tier investment products accessible to a broader audience, underscoring our commitment to excellence in financial services.
Investing in Our People and Culture
Our success is linked to the dedication and talent of our team. In 2023, we focused on nurturing our culture of excellence and innovation. We made significant strides in expanding and empowering our network of Financial Advisors. Our commitment to providing our advisors with the best tools and technology has not only enhanced our service quality but also reinforced XP Inc. as the premier platform for financial advisors in Brazil.
While we are proud of our accomplishments, we acknowledge that there is still much to be done. Our efforts to increase penetration and provide the best banking experience to our clients and advisors continue to be a top priority. We are committed to enhancing our offerings and services to meet and exceed the expectations of those we serve.
Looking Forward
As we look to the future, we remain optimistic about our growth trajectory and the opportunities that lie ahead. While we recognize that there may be a delay for retail investors to shift their behavior in a more favorable market environment, we are confident that this positive cycle will come eventually. In the meantime, we will maintain our cost discipline and stay focused on delivering the quality and service excellence that our clients expect from us.
The initiation of the monetary easing cycle by the Central Bank and the improving market conditions are positive signals for our core investments business. We remain committed to driving our Return on Equity (ROE) growth through strategic earnings expansion and capital distributions to our shareholders.
In closing, I extend my deepest gratitude to our clients, executive partners, team members, and you, our shareholders, for your continued trust and support. Together, we are not only navigating the complexities of the present but also shaping a promising future for XP Inc. and the financial services industry in Brazil.
Thiago Maffra
CEO, XP Inc.
Summary
| Operating Metrics (unaudited) | 4Q23 | 4Q22 | YoY | 3Q23 | QoQ | 2023 | 2022 | YoY | |
| Total Client Assets (in R$ bn) | 1,122 | 946 | 19% | 1,080 | 4% | 1,122 | 946 | 19% | |
| Total Net Inflow (in R$ bn) | 19 | 31 | -40% | 48 | -61% | 104 | 155 | -33% | |
| Annualized Retail Take Rate | 1.27% | 1.22% | 5 bps | 1.34% | -7 bps | 1.28% | 1.29% | -1 bps | |
| Active Clients (in '000s) | 4,531 | 3,877 | 17% | 4,413 | 3% | 4,531 | 3,877 | 17% | |
| Headcount (EoP) | 6,669 | 6,928 | -4% | 6,699 | 0% | 6,669 | 6,928 | -4% | |
| IFAs (in '000s) | 14.3 | 12.3 | 16% | 14.3 | 0% | 14.3 | 12.3 | 16% | |
| Retail DATs (in mn) | 2.2 | 2.7 | -19% | 2.1 | 3% | 2.4 | 2.4 | 0% | |
| Retirement Plans Client Assets (in R$ bn) | 73 | 61 | 21% | 68 | 8% | 73 | 61 | 21% | |
| Cards TPV (in R$ bn) | 11.8 | 8.2 | 44% | 10.7 | 10% | 40.9 | 24.9 | 64% | |
| Credit Portfolio (in R$ bn) | 21.0 | 17.1 | 23% | 19.9 | 6% | 21.0 | 17.1 | 23% | |
| Financial Metrics (in R$ mn) | 4Q23 | 4Q22 | YoY | 3Q23 | QoQ | 2023 | 2022 | YoY | |
| Gross revenue | 4,309 | 3,337 | 29% | 4,364 | -1% | 15,726 | 14,036 | 12% | |
| Retail | 3,152 | 2,549 | 24% | 3,179 | -1% | 11,791 | 10,157 | 16% | |
| Institutional | 413 | 357 | 16% | 386 | 7% | 1,516 | 1,919 | -21% | |
| Corporate & Issuer Services | 508 | 275 | 85% | 519 | -2% | 1,576 | 1,295 | 22% | |
| Other | 236 | 156 | 52% | 281 | -16% | 842 | 666 | 27% | |
| Net Revenue | 4,046 | 3,177 | 27% | 4,132 | -2% | 14,860 | 13,348 | 11% | |
| Gross Profit | 2,753 | 2,067 | 33% | 2,896 | -5% | 10,100 | 9,382 | 8% | |
| Gross Margin | 68.1% | 65.1% | 299 bps | 70.1% | -202 bps | 68.0% | 70.3% | -232 bps | |
| EBT | 995 | 738 | 35% | 1,157 | -14% | 3,936 | 3,445 | 14% | |
| EBT Margin | 24.6% | 23.2% | 136 bps | 28.0% | -341 bps | 26.5% | 25.8% | 68 bps | |
| Net Income | 1,040 | 783 | 33% | 1,087 | -4% | 3,899 | 3,580 | 9% | |
| Net Margin | 25.7% | 24.6% | 107 bps | 26.3% | -59 bps | 26.2% | 26.8% | -58 bps | |
| Basic EPS (in R$) | 1.90 | 1.43 | 33% | 1.99 | -4% | 7.22 | 6.44 | 12% | |
| Diluted EPS (in R$) | 1.88 | 1.39 | 36% | 1.96 | -4% | 7.16 | 6.25 | 15% | |
| ROAE¹ | 21.1% | 18.1% | 293 bps | 22.6% | -152 bps | 21.4% | 22.8% | -139 bps | |
| ROAA² | 2.4% | 2.4% | 5 bps | 2.6% | -19 bps | 2.5% | 3.2% | -66 bps |
_______________
1 – Annualized Return on Average Equity.
2 – Annualized Return on Average Adjusted Assets. Adjusted Assets excludes Retirement Plans Liabilities and Float Balance.
Discussion of Results
Total Gross Revenue
Gross Revenue was R$4.3 billion in 4Q23, down 1% QoQ and up 29% YoY, primarily driven by growth in our Retail revenue year-over-year. In 2023, Gross Revenue totaled R$15.7 billion, up 12% YoY, also led by Retail.
Retail Revenue
| (in R$ mn) | 4Q23 | 4Q22 | YoY | 3Q23 | QoQ | 2023 | 2022 | YoY | |
| Retail Revenue | 3,152 | 2,549 | 24% | 3,179 | -1% | 11,791 | 10,157 | 16% | |
| Equities | 1,180 | 995 | 19% | 1,131 | 4% | 4,444 | 4,276 | 4% | |
| Fixed Income | 690 | 393 | 76% | 718 | -4% | 2,318 | 1,886 | 23% | |
| Funds Platform | 334 | 311 | 7% | 323 | 3% | 1,311 | 1,259 | 4% | |
| Retirement Plans | 94 | 93 | 1% | 98 | -4% | 365 | 333 | 10% | |
| Cards | 306 | 234 | 30% | 259 | 18% | 1,001 | 593 | 69% | |
| Credit | 46 | 47 | -4% | 49 | -8% | 180 | 160 | 12% | |
| Insurance | 46 | 31 | 46% | 36 | 28% | 149 | 97 | 53% | |
| Other Retail | 457 | 443 | 3% | 565 | -19% | 2,023 | 1,553 | 30% | |
| Annualized Retail Take Rate | 1.27% | 1.22% | 5 bps | 1.34% | -7 bps | 1.28% | 1.29% | -1 bps |
Retail revenue was R$3.2 billion in 4Q23, down 1% QoQ and up 29% YoY. Sequential Retail revenue was impacted by a positive seasonality in Cards revenue, which increased 18% QoQ, partially offset by sequential decline in the quarter in Fixed Income revenue, and lack of Expert event related revenue in the quarter.
In 2023, Retail revenue totaled R$11.8 billion, up 16% YoY. Annual growth was mainly led by:
1) Other Retail Revenue, especially due to Float and Digital Account revenue;
2) Fixed Income, after a strong recovery in DCM activity in the second semester; and
3) Cards, with a 69% revenue growth YoY.
Retail-related revenue in 4Q23 represented 76% of consolidated Net Income from Financial Instruments, as per the Accounting Income Statement. For 2023, Retail-related revenue represented 76% of consolidated Net Income from Financial Instruments, as per the Accounting Income Statement.
Take Rate
Annualized Retail Take Rate was 1.27% in 4Q23, down 7bps QoQ. Retail Take Rate for 2023 was 1.28%, down 1bps YoY.
Institutional Revenue
Institutional revenue was R$413 million in 4Q23, up 7% QoQ and 16% YoY. For 2023, Institutional revenue decreased 21% to R$1.5 billion, mainly driven by lower trading volumes in B3.
Institutional revenue in 4Q23 accounted for 6% of consolidated Net Income from Financial Instruments, as per the Accounting Income Statement. For 2023, Institutional revenue accounted for 8% of consolidated Net Income from Financial Instruments, as per the Accounting Income Statement.
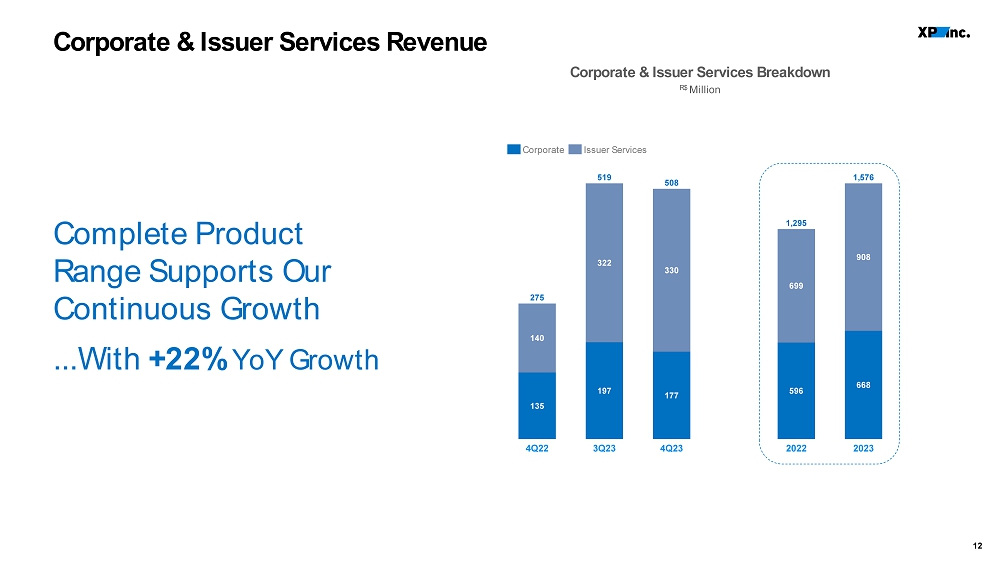
Corporate & Issuer Services Revenue
Corporate & Issuer Services revenue totaled R$508 million in 4Q23, down 2% QoQ and up 85% YoY, supported by another strong quarter of DCM activity and also a strong contribution of M&A.
In 2023, Corporate and Issuer Services revenue increased 22% YoY to R$1.6 billion. Year-over-year growth was led by a strong pick-up in DCM activity in the second half of the year, and the continuous expansion of our Corporate franchise.
Corporate and Issuer Services related revenues in 4Q23 represented 7% of consolidated Net Income from Financial Instruments, as per the Accounting Income Statement. In 2023, Corporate and Issuer Services related revenues represented 7% of consolidated Net Income from Financial Instruments, as per the Accounting Income Statement.
Other Revenue
Other revenue was R$236 million in 4Q23, down 16% QoQ and up 52% YoY.
Other revenue in 4Q23 accounted for 11% of consolidated Net Income from Financial Instruments, as per the Accounting Income Statement. In 2023, Other revenue accounted for 10% of consolidated Net Income from Financial Instruments, as per the Accounting Income Statement.
Costs of Goods Sold and Gross Margin
Gross Margin was 68.1% in 4Q23 versus 70.1% in 3Q23 and 65.1% in 4Q22. Sequential decrease in gross margin was mainly related to revenue mix between products and channels in the quarter. In 2023, Gross Margin was 68.0%, a 232bps decrease YoY mainly related to change in revenue mix between products and channels and relative increase in expected credit losses due to ongoing growth of our Cards business.
SG&A Expenses2
| (in R$ mn) | 4Q23 | 4Q22 | YoY | 3Q23 | QoQ | 2023 | 2022 | YoY | |
| Total SG&A | (1,553) | (1,377) | 13% | (1,547) | 0% | (5,391) | (5,602) | -4% | |
| People | (1,022) | (892) | 15% | (1,048) | -2% | (3,728) | (3,943) | -5% | |
| Salary and Taxes | (393) | (337) | 17% | (396) | -1% | (1,510) | (1,432) | 5% | |
| Bonuses | (462) | (379) | 22% | (486) | -5% | (1,705) | (1,764) | -3% | |
| Share Based Compensation | (166) | (176) | -6% | (166) | 0% | (513) | (747) | -31% | |
| Non-people | (532) | (485) | 10% | (499) | 7% | (1,663) | (1,659) | 0% | |
| LTM Compensation Ratio | 25.1% | 29.5% | -446 bps | 25.7% | -63 bps | 25.1% | 29.5% | -446 bps | |
| LTM Efficiency Ratio | 36.3% | 42.0% | -569 bps | 37.3% | -99 bps | 36.3% | 42.0% | -569 bps | |
| Headcount (EoP) | 6,669 | 6,928 | -4% | 6,699 | 0% | 6,669 | 6,928 | -4% |
_______________
3 - Total SG&A and non-people SG&A exclude revenue from incentives from Tesouro Direto, B3.
4 - Compensation ratio is calculated as People SG&A (Salary and Taxes, Bonuses and Share Based Compensation) divided by Net Revenue.
5 - Efficiency ratio is calculated as SG&A ex-revenue from incentives from Tesouro Direto, B3, and others divided by Net Revenue.
SG&A3 expenses totaled R$1.6 billion in 4Q23, relatively flat QoQ and up 13% YoY. Total SG&A³ for 2023 stood at R$5.4 billion, within our annual guidance from R$5.0 to 5.5 billion, even after Modal’s inclusion in the second half of the year.
Our last twelve months (LTM) compensation ratio4 in 4Q23 was 25.1%, an improvement from 29.5% and 25.7% in 4Q22 and 3Q23, respectively. Also, our LTM efficiency ratio5 reached 36.3% in 4Q23, the lowest level since IPO, reinforcing once again our focus on cost discipline.
Earnings Before Taxes
EBT, a good proxy for earnings power, was R$995 million in 4Q23, down 14% QoQ and up 35% YoY. EBT Margin was 24.6%, down 341bps QoQ and up 136 bps YoY. In 2023, EBT stood at R$3.9 billion, up 14% YoY, and annual EBT Margin stood at 26.5%, in line with our medium-term annual guidance of 26% to 32% between 2023 and 2025.
Net Income and EPS
In 4Q23, Net Income was R$1.0 billion, down 4% QoQ and up 33% YoY. Basic EPS was R$1.90, down 4% QoQ and up 33% YoY. Fully diluted EPS was R$1.88 for the quarter, down 4% QoQ and up 36% YoY.
In 2023, Net Income totaled R$3.9 billion, up 9% YoY. Basic EPS was R$7.22, up 12% YoY, while fully diluted EPS was R$7.16, up 15% YoY.
ROTE6 and ROAE7
Starting this quarter, we now present Return on Tangible Equity, which excludes Intangibles and Goodwill. We believe this is a more accurate reflection of our company’s true operations, allowing investors more meaningful comparisons with our peers.
In 4Q23, ROTE6 was 25.5%, down 19bps QoQ and up 570bps YoY. Our ROTE6 for 2023 stood at 25.0%, down 23bps YoY. Our ROAE7 in 4Q23 was 21.1%, down 152bps QoQ and up 293bps YoY. Our ROAE7 for 2023 stood at 21.4%, down 139bps YoY.
_______________
6 – Annualized Return on Tangible Common Equity, calculated as Annualized Net Income over Tangible Common Equity, which excludes Intangibles and Goodwill, net of deferred taxes.
7 – Annualized Return on Average Equity.
Other Information
Webcast and Conference Call Information
The Company will host a webcast to discuss its fourth quarter financial results on Tuesday, February 27th, 2024, at 5:00 pm ET (7:00 pm BRT). To participate in the earnings webcast please subscribe at 4Q23 Earnings Web Meeting. The replay will be available on XP’s investor relations website at https://investors.xpinc.com/
Investor Relations Contact
ir@xpi.com.br
Important Disclosure
In reviewing the information contained in this release, you are agreeing to abide by the terms of this disclaimer. This information is being made available to each recipient solely for its information and is subject to amendment. This release is prepared by XP Inc. (the “Company,” “we” or “our”), is solely for informational purposes. This release does not constitute a prospectus and does not constitute an offer to sell or the solicitation of an offer to buy any securities. In addition, this document and any materials distributed in connection with this release are not directed to, or intended for distribution to or use by, any person or entity that is a citizen or resident or located in any locality, state, country or other jurisdiction where such distribution, publication, availability or use would be contrary to law or regulation or which would require any registration or licensing within such jurisdiction.
This release was prepared by the Company. Neither the Company nor any of its affiliates, officers, employees or agents, make any representation or warranty, express or implied, in relation to the fairness, reasonableness, adequacy, accuracy or completeness of the information, statements or opinions, whichever their source, contained in this release or any oral information provided in connection herewith, or any data it generates and accept no responsibility, obligation or liability (whether direct or indirect, in contract, tort or otherwise) in relation to any of such information. The information and opinions contained in this release are provided as at the date of this release, are subject to change without notice and do not purport to contain all information that may be required to evaluate the Company. The information in this release is in draft form and has not been independently verified. The Company and its affiliates, officers, employees and agents expressly disclaim any and all liability which may be based on this release and any errors therein or omissions therefrom. Neither the Company nor any of its affiliates, officers, employees or agents makes any representation or warranty, express or implied, as to the achievement or reasonableness of future projections, management targets, estimates, prospects or returns, if any.
The information contained in this release does not purport to be comprehensive and has not been subject to any independent audit or review. Certain of the financial information as of and for the periods ended of December 31, 2021 and December 31, 2020, 2019, 2018 and 2017 has been derived from audited financial statements and all other financial information has been derived from unaudited interim financial statements. A significant portion of the information contained in this release is based on estimates or expectations of the Company, and there can be no assurance that these estimates or expectations are or will prove to be accurate. The Company’s internal estimates have not been verified by an external expert, and the Company cannot guarantee that a third party using different methods to assemble, analyze or compute market information and data would obtain or generate the same results.
Statements in the release, including those regarding the possible or assumed future or other performance of the Company or its industry or other trend projections, constitute forward-looking statements. These statements are generally identified by the use of words such as “anticipate,” “believe,” “could,” “expect,” “should,” “plan,” “intend,” “estimate” and “potential,” among others. By their nature, forward-looking statements are necessarily subject to a high degree of uncertainty and involve known and unknown risks, uncertainties, assumptions and other factors because they relate to events and depend on circumstances that will occur in the future whether or not outside the control of the Company. Such factors may cause actual results, performance or developments to differ materially from those expressed or implied by such forward-looking statements and there can be no assurance that such forward-looking statements will prove to be correct. These risks and uncertainties include factors relating to: (1) general economic, financial, political, demographic and business conditions in Brazil, as well as any other countries we may serve in the future and their impact on our business; (2) fluctuations in interest, inflation and exchange rates in Brazil and any other countries we may serve in the future; (3) competition in the financial services industry; (4) our ability to implement our business strategy; (5) our ability to adapt to the rapid pace of technological changes in the financial services industry; (6) the reliability, performance, functionality and quality of our products and services and the investment performance of investment funds managed by third parties or by our asset managers; (7) the availability of government authorizations on terms and conditions and within periods acceptable to us; (8) our ability to continue attracting and retaining new appropriately-skilled employees; (9) our capitalization and level of indebtedness; (10) the interests of our controlling shareholders; (11) changes in government regulations applicable to the financial services industry in Brazil and elsewhere; (12) our ability to compete and conduct our business in the future; (13) the success of operating initiatives, including advertising and promotional efforts and new product, service and concept development by us and our competitors; (14) changes in consumer demands regarding financial products, customer experience related to investments and technological advances, and our ability to innovate to respond to such changes; (15) changes in labor, distribution and other operating costs; (16) our compliance with, and changes to, government laws, regulations and tax matters that currently apply to us; (17) other factors that may affect our financial condition, liquidity and results of operations.
Accordingly, you should not place undue reliance on forward-looking statements. The forward-looking statements included herein speak only as at the date of this release and the Company does not undertake any obligation to update these forward-looking statements. Past performance does not guarantee or predict future performance. Moreover, the Company and its affiliates, officers, employees and agents do not undertake any obligation to review, update or confirm expectations or estimates or to release any revisions to any forward-looking statements to reflect events that occur or circumstances that arise in relation to the content of the release. You are cautioned not to unduly rely on such forward-looking statements when evaluating the information presented and we do not intend to update any of these forward-looking statements.
Market data and industry information used throughout this release are based on management’s knowledge of the industry and the good faith estimates of management. The Company also relied, to the extent available, upon management’s review of industry surveys and publications and other publicly available information prepared by a number of third-party sources. All of the market data and industry information used in this release involves a number of assumptions and limitations, and you are cautioned not to give undue weight to such estimates. Although the Company believes that these sources are reliable, there can be no assurance as to the accuracy or completeness of this information, and the Company has not independently verified this information.
The contents hereof should not be construed as investment, legal, tax or other advice and you should consult your own advisers as to legal, business, tax and other related matters concerning an investment in the Company. The Company is not acting on your behalf and does not regard you as a customer or a client. It will not be responsible to you for providing protections afforded to clients or for advising you on the relevant transaction.
This release includes our Float, Adjusted Gross Financial Assets, Net Asset Value, and Adjustments to Reported Net Income, which are non-GAAP financial information. We believe that such information is meaningful and useful in understanding the activities and business metrics of the Company’s operations. We also believe that these non-GAAP financial measures reflect an additional way of viewing aspects of the Company’s business that, when viewed with our International Financial Reporting Standards (“IFRS”) results, as issued by the International Accounting Standards Board, provide a more complete understanding of factors and trends affecting the Company’s business. Further, investors regularly rely on non-GAAP financial measures to assess operating performance and such measures may highlight trends in the Company’s business that may not otherwise be apparent when relying on financial measures calculated in accordance with IFRS. We also believe that certain non-GAAP financial measures are frequently used by securities analysts, investors and other interested parties in the evaluation of public companies in the Company’s industry, many of which present these measures when reporting their results. The non-GAAP financial information is presented for informational purposes and to enhance understanding of the IFRS financial statements. The non-GAAP measures should be considered in addition to results prepared in accordance with IFRS, but not as a substitute for, or superior to, IFRS results. As other companies may determine or calculate this non-GAAP financial information differently, the usefulness of these measures for comparative purposes is limited. A reconciliation of such non-GAAP financial measures to the nearest GAAP measure is included in this release.
For purposes of this release:
“Active Clients” means the total number of retail clients served through our XP Investimentos, Rico, Clear, XP Investments and XP Private (Europe) brands, with Client Assets above R$100.00 or that have transacted at least once in the last thirty days. For purposes of calculating this metric, if a client holds an account in more than one of the aforementioned entities, such client will be counted as one “active client” for each such account. For example, if a client holds an account in each of XP Investimentos and Rico, such client will count as two “active clients” for purposes of this metric.
“Client Assets” means the market value of all client assets invested through XP’s platform and that is related to reported Retail Revenue, including equities, fixed income securities, mutual funds (including those managed by XP Gestão de Recursos Ltda., XP Advisory Gestão de Recursos Ltda. and XP Vista Asset Management Ltda., as well as by third-party asset managers), pension funds (including those from XP Vida e Previdência S.A., as well as by third-party insurance companies), exchange traded funds, COEs (Structured Notes), REITs, and uninvested cash balances (Float Balances), among others. Although Client Assets includes custody from Corporate Clients that generate Retail Revenue, it does not include custody from institutional clients (asset managers, pension funds and insurance companies).
Rounding
We have made rounding adjustments to some of the figures included in this release. Accordingly, numerical figures shown as totals in some tables may not be an arithmetic aggregation of the figures that preceded them.
Unaudited Managerial Income Statement (in R$ mn)
| Managerial Income Statement | 4Q23 | 4Q22 | YoY | 3Q23 | QoQ | 2023 | 2022 | YoY | |
| Total Gross Revenue | 4,309 | 3,337 | 29% | 4,364 | -1% | 15,726 | 14,036 | 12% | |
| Retail | 3,152 | 2,549 | 24% | 3,179 | -1% | 11,791 | 10,157 | 16% | |
| Equities | 1,180 | 995 | 19% | 1,131 | 4% | 4,444 | 4,276 | 4% | |
| Fixed Income | 690 | 393 | 76% | 718 | -4% | 2,318 | 1,886 | 23% | |
| Funds Platform | 334 | 311 | 7% | 323 | 3% | 1,311 | 1,259 | 4% | |
| Retirement Plans | 94 | 93 | 1% | 98 | -4% | 365 | 333 | 10% | |
| Cards | 306 | 234 | 30% | 259 | 18% | 1,001 | 593 | 69% | |
| Credit | 46 | 47 | -4% | 49 | -8% | 180 | 160 | 12% | |
| Insurance | 46 | 31 | 46% | 36 | 28% | 149 | 97 | 53% | |
| Other | 457 | 443 | 3% | 565 | -19% | 2,023 | 1,553 | 30% | |
| Institutional | 413 | 357 | 16% | 386 | 7% | 1,516 | 1,919 | -21% | |
| Corporate & Issuer Services | 508 | 275 | 85% | 519 | -2% | 1,576 | 1,295 | 22% | |
| Other | 236 | 156 | 52% | 281 | -16% | 842 | 666 | 27% | |
| Net Revenue | 4,046 | 3,177 | 27% | 4,132 | -2% | 14,860 | 13,348 | 11% | |
| COGS | (1,292) | (1,110) | 16% | (1,236) | 5% | (4,760) | (3,965) | 20% | |
| Gross Profit | 2,753 | 2,067 | 33% | 2,896 | -5% | 10,100 | 9,382 | 8% | |
| Gross Margin | 68.1% | 65.1% | 299 bps | 70.1% | -202 bps | 68.0% | 70.3% | -232 bps | |
| SG&A | (1,539) | (1,135) | 36% | (1,541) | 0% | (5,368) | (5,317) | 1% | |
| People | (1,022) | (892) | 15% | (1,048) | -2% | (3,728) | (3,943) | -5% | |
| Non-People | (517) | (243) | 112% | (493) | 5% | (1,639) | (1,374) | 19% | |
| D&A | (82) | (46) | 81% | (71) | 16% | (252) | (206) | 23% | |
| Interest expense on debt | (167) | (150) | 12% | (135) | 23% | (617) | (402) | 53% | |
| Share of profit in joint ventures and associates | 30 | 1 | n.a. | 9 | 102% | 74 | (12) | -704% | |
| EBT | 995 | 738 | 35% | 1,157 | -14% | 3,936 | 3,445 | 14% | |
| EBT Margin | 24.6% | 23.2% | 136 bps | 28.0% | -341 bps | 26.5% | 25.8% | 68 bps | |
| Tax Expense (Accounting) | 45 | 44 | 1% | (71) | -163% | (37) | 136 | -127% | |
| Tax expense (Tax Withholding in Funds)6 | (175) | (192) | -9% | (169) | 4% | (659) | (754) | -13% | |
| Effective tax rate (Normalized) | (11.1%) | (15.8%) | 470 bps | (18.1%) | 693 bps | (15.1%) | (14.7%) | -41 bps | |
| Net Income | 1,040 | 783 | 33% | 1,087 | -4% | 3,899 | 3,580 | 9% | |
| Net Margin | 25.7% | 24.6% | 107 bps | 26.3% | -59 bps | 26.2% | 26.8% | -58 bps | |
| Adjustments | 109 | 110 | -2% | 92 | 18% | 309 | 494 | -37% | |
| Adjusted Net Income7 | 1,149 | 893 | 29% | 1,179 | -3% | 4,209 | 4,075 | 3% | |
| Adjusted Net Margin | 28.4% | 28.1% | 28 bps | 28.5% | -14 bps | 28.3% | 30.5% | -221 bps |
_______________
6 - Tax adjustments are related to tax withholding expenses that are recognized net in gross revenue.
7 - See appendix for a reconciliation of Adjusted Net Income.
Accounting Income Statement (in R$ mn)
| Accounting Income Statement | 4Q23 | 4Q22 | YoY | 3Q23 | QoQ | 2023 | 2022 | YoY | |
| Net revenue from services rendered | 1,881 | 1,565 | 20% | 1,822 | 3% | 6,532 | 5,940 | 10% | |
| Brokerage commission | 485 | 544 | -11% | 525 | -8% | 1,992 | 2,103 | -5% | |
| Securities placement | 687 | 361 | 90% | 637 | 8% | 1,979 | 1,631 | 21% | |
| Management fees | 414 | 412 | 0% | 414 | 0% | 1,628 | 1,581 | 3% | |
| Insurance brokerage fee | 48 | 47 | 2% | 43 | 12% | 175 | 153 | 14% | |
| Commission Fees | 220 | 237 | -7% | 206 | 7% | 790 | 564 | 40% | |
| Other services | 214 | 108 | 98% | 169 | 26% | 589 | 476 | 24% | |
| Sales Tax and contributions on Services | (187) | (145) | 29% | (173) | 9% | (622) | (568) | 9% | |
| Net income from financial instruments at amortized cost | 311 | 14 | n.a. | 142 | 119% | 1,573 | 1,146 | 37% | |
| Net income from financial instruments at fair value through profit or loss | 1,854 | 1,598 | 16% | 2,168 | -14% | 6,756 | 6,261 | 8% | |
| Total revenue and income | 4,046 | 3,177 | 27% | 4,132 | -2% | 14,860 | 13,347 | 11% | |
| Operating costs | (1,169) | (1,071) | 9% | (1,122) | 4% | (4,399) | (3,871) | 14% | |
| Selling expenses | (59) | (48) | 25% | (50) | 19% | (169) | (139) | 22% | |
| Administrative expenses | (1,547) | (1,368) | 13% | (1,544) | 0% | (5,461) | (5,641) | -3% | |
| Other operating revenues (expenses), net | (14) | 235 | n.a. | (18) | -21% | 11 | 257 | n.a. | |
| Expected credit losses | (124) | (38) | n.a. | (115) | 8% | (361) | (94) | n.a. | |
| Interest expense on debt | (167) | (150) | 12% | (135) | 23% | (617) | (402) | 53% | |
| Share of profit or (loss) in joint ventures and associates | 30 | 1 | n.a. | 9 | 215% | 74 | (12) | n.a. | |
| Income before income tax | 995 | 738 | 35% | 1,157 | -14% | 3,936 | 3,445 | 14% | |
| Income tax expense | 45 | 44 | 1% | (71) | n.a. | (37) | 136 | n.a. | |
| Net income for the period | 1,040 | 783 | 33% | 1,087 | -4% | 3,899 | 3,580 | 9% |
Balance Sheet (in R$ mn)
| Assets | 4Q23 | 3Q23 | |||
| Cash | 3,943 | 3,822 | |||
| Financial assets | 229,197 | 214,838 | |||
| Fair value through profit or loss | 127,016 | 120,854 | |||
| Securities | 103,282 | 101,039 | |||
| Derivative financial instruments | 23,733 | 19,815 | |||
| Fair value through other comprehensive income | 44,063 | 38,486 | |||
| Securities | 44,063 | 38,486 | |||
| Evaluated at amortized cost | 58,119 | 55,498 | |||
| Securities | 6,855 | 6,175 | |||
| Securities purchased under agreements to resell | 14,889 | 12,252 | |||
| Securities trading and intermediation | 2,932 | 3,569 | |||
| Accounts receivable | 681 | 620 | |||
| Loan Operations | 28,552 | 26,645 | |||
| Other financial assets | 4,209 | 6,236 | |||
| Other assets | 7,812 | 7,586 | |||
| Recoverable taxes | 245 | 302 | |||
| Rights-of-use assets | 282 | 204 | |||
| Prepaid expenses | 4,418 | 4,401 | |||
| Other | 2,867 | 2,679 | |||
| Deferred tax assets | 2,104 | 2,023 | |||
| Investments in associates and joint ventures | 3,109 | 2,261 | |||
| Property and equipment | 373 | 348 | |||
| Goodwill & Intangible assets | 2,502 | 2,551 | |||
| Total Assets | 249,041 | 233,427 |
| Liabilities | 4Q23 | 3Q23 | |||
| Financial liabilities | 171,237 | 158,537 | |||
| Fair value through profit or loss | 45,208 | 32,888 | |||
| Securities | 20,423 | 14,342 | |||
| Derivative financial instruments | 24,785 | 18,546 | |||
| Evaluated at amortized cost | 126,029 | 125,649 | |||
| Securities sold under repurchase agreements | 33,341 | 39,517 | |||
| Securities trading and intermediation | 16,944 | 17,062 | |||
| Financing instruments payable | 60,366 | 53,094 | |||
| Accounts payables | 948 | 604 | |||
| Borrowings | 2,199 | 1,260 | |||
| Other financial liabilities | 12,231 | 14,112 | |||
| Other liabilities | 58,266 | 54,793 | |||
| Social and statutory obligations | 1,146 | 711 | |||
| Taxes and social security obligations | 560 | 488 | |||
| Retirement plans liabilities | 56,409 | 53,280 | |||
| Provisions and contingent liabilities | 98 | 110 | |||
| Other | 54 | 204 | |||
| Deferred tax liabilities | 86 | 74 | |||
| Total Liabilities | 229,590 | 213,404 | |||
| Equity attributable to owners of the Parent company | 19,449 | 20,014 | |||
| Issued capital | 0 | 0 | |||
| Capital reserve | 19,190 | 18,745 | |||
| Other comprehensive income | 376 | 107 | |||
| Treasury | (117) | (117) | |||
| Retained earnings | - | 1,279 | |||
| Non-controlling interest | 1 | 9 | |||
| Total equity | 19,451 | 20,023 | |||
| Total liabilities and equity | 249,041 | 233,427 |
Float, Adjusted Gross Financial Assets and Net Asset Value (in R$ mn)
We present Adjusted Gross Financial Assets because we believe this metric captures the liquidity that is, in fact, available to us, net of the portion of liquidity that is related to our Float Balance (and therefore attributable to clients). We calculate Adjusted Gross Financial Assets as the sum of (1) Cash and Financial Assets (comprised of Cash plus Securities – Fair value through profit or loss, plus Securities – Fair value through other comprehensive income, plus Securities – Evaluated at amortized cost, plus Derivative financial instruments, plus Securities (purchased under agreements to resell), plus Loans and Foreign exchange portfolio (assets) less (2) Financial Liabilities (comprised of the sum of Securities loaned, Derivative financial instruments, Securities sold under repurchase agreements and Private pension liabilities), Deposits, Structured Operation Certificates (COE), Financial Bills, Foreign exchange portfolio (liabilities), Credit cards operations and (3) less Float Balance.
It is a measure that we track internally daily, and it more intuitively reflects the effect of the operational profits we generate and the variations between working capital assets and liabilities (cash flows from operating activities), investments in fixed and intangible assets and investments in the IFA Network (cash flows from investing activities) and inflows and outflows related to equity and debt securities in our capital structure (cash flows from financing activities). Our management treats all securities and financial instrument assets, net of financial instrument liabilities, as balances that compose our total liquidity, with subline items (such as, for example, “securities at fair value through profit and loss” and “securities at fair value through other comprehensive income”) expected to fluctuate substantially from quarter to quarter as our treasury manages and allocates our total liquidity to the most suitable financial instruments.
In order to explain how we measure our cash position or generation internally, we are introducing the Net Asset Value concept. Since we are a financial institution, we hold several types of financial instruments with different characteristics, hence the definition of net cash that makes more sense from a business perspective is the Net Asset Value. It is basically the adjusted gross financial assets net of debt instruments.
| Adjusted Gross Financial Assets | 4Q23 | 3Q23 | |||
| Assets | 231,903 | 216,300 | |||
| (+) Cash | 3,943 | 3,822 | |||
| (+) Securities - Fair value through profit or loss | 103,282 | 101,039 | |||
| (+) Securities - Fair value through OCI | 44,063 | 38,486 | |||
| (+) Securities - Evaluated at amortized cost | 6,855 | 6,175 | |||
| (+) Derivative financial instruments | 23,733 | 19,815 | |||
| (+) Securities purchased under agreements to resell | 14,889 | 12,252 | |||
| (+) Loans and credit card operations | 28,552 | 26,645 | |||
| (+) Foreign exchange portfolio | 1,022 | 4,240 | |||
| (+) Energy | 2,606 | 2,105 | |||
| (+) Central Bank Deposits | 2,957 | 1,722 | |||
| Liabilities | (198,386) | (183,729) | |||
| (-) Securities | (20,423) | (14,342) | |||
| (-) Derivative financial instruments | (24,785) | (18,546) | |||
| (-) Securities sold under repurchase agreements | (33,341) | (39,517) | |||
| (-) Retirement Plans Liabilities | (56,409) | (53,280) | |||
| (-) Deposits | (27,494) | (22,635) | |||
| (-) Structured Operations | (18,015) | (16,241) |
| (-) Financial Bills | (9,020) | (7,812) | |||
| (-) Foreign exchange portfolio | (1,362) | (4,562) | |||
| (-) Credit card operations | (7,234) | (6,442) | |||
| (-) Other Funding | (303) | (352) | |||
| (-) Float | (14,011) | (13,493) | |||
| (=) Adjusted Gross Financial Assets | 19,506 | 19,078 |
| Net Asset Value | 4Q23 | 3Q23 | |||
| (=) Adjusted Gross Financial Assets | 19,506 | 19,078 | |||
| Gross Debt | (9,575) | (9,428) | |||
| (-) Borrowings | (2,199) | (1,260) | |||
| (-) Debentures | (2,212) | (2,656) | |||
| (-) Structured financing | (1,842) | (2,114) | |||
| (-) Bonds | (3,322) | (3,398) | |||
| (=) Net Asset Value | 9,931 | 9,650 |
| Float (=net uninvested clients' deposits) | 4Q23 | 3Q23 | |||
| Assets | (2,932) | (3,569) | |||
| (-) Securities trading and intermediation | (2,932) | (3,569) | |||
| Liabilities | 16,944 | 17,062 | |||
| (+) Securities trading and intermediation | 16,944 | 17,062 | |||
| (=) Float | 14,011 | 13,493 |
Reconciliation of Adjusted Net Income (in R$ mn)
| Adjusted Net Income | 4Q23 | 4Q22 | YoY | 3Q23 | QoQ | 2023 | 2022 | YoY | |
| Net Income | 1,040 | 783 | 33% | 1,087 | -4% | 3,899 | 3,580 | 9% | |
| (+) Share Based Compensation | 181 | 181 | 0% | 151 | 20% | 541 | 793 | -32% | |
| (+/-) Taxes | (72) | (71) | 2% | (59) | 23% | (232) | (299) | -22% | |
| Adj. Net Income | 1,149 | 893 | 29% | 1,179 | -3% | 4,209 | 4,075 | 3% |
Exhibit 99.2

1 4Q23 Earnings Presentation
2 Important Disclosure IN REVIEWING THE INFORMATION CONTAINED IN THIS PRESENTATION, YOU ARE AGREEING TO ABIDE BY THE TERMS OF THIS DISCLAIMER . THIS INFORMATION IS BEING MADE AVAILABLE TO EACH RECIPIENT SOLELY FOR ITS INFORMATION AND IS SUBJECT TO AMENDMENT . This presentation is prepared by XP Inc . (the “Company,” “we” or “our”), is solely for informational purposes . This presentation does not constitute a prospectus and does not constitute an offer to sell or the solicitation of an offer to buy any securities . In addition, this document and any materials distributed in connection with this presentation are not directed to, or intended for distribution to or use by, any person or entity that is a citizen or resident or located in any locality, state, country or other jurisdiction where such distribution, publication, availability or use would be contrary to law or regulation or which would require any registration or licensing within such jurisdiction . This presentation was prepared by the Company . Neither the Company nor any of its affiliates, officers, employees or agents, make any representation or warranty, express or implied, in relation to the fairness, reasonableness, adequacy, accuracy or completeness of the information, statements or opinions, whichever their source, contained in this presentation or any oral information provided in connection herewith, or any data it generates and accept no responsibility, obligation or liability (whether direct or indirect, in contract, tort or otherwise) in relation to any of such information . The information and opinions contained in this presentation are provided as at the date of this presentation, are subject to change without notice and do not purport to contain all information that may be required to evaluate the Company . The information in this presentation is in draft form and has not been independently verified . The Company and its affiliates, officers, employees and agents expressly disclaim any and all liability which may be based on this presentation and any errors therein or omissions therefrom . Neither the Company nor any of its affiliates, officers, employees or agents makes any representation or warranty, express or implied, as to the achievement or reasonableness of future projections, management targets, estimates, prospects or returns, if any . The information contained in this presentation does not purport to be comprehensive and has not been subject to any independent audit or review . Certain of the financial information as of and for the periods ended December 31 , 2019 , 2018 and 2017 has been derived from audited financial statements and all other financial information has been derived from unaudited interim financial statements . A significant portion of the information contained in this presentation is based on estimates or expectations of the Company, and there can be no assurance that these estimates or expectations are or will prove to be accurate . The Company’s internal estimates have not been verified by an external expert, and the Company cannot guarantee that a third party using different methods to assemble, analyze or compute market information and data would obtain or generate the same results . Statements in the presentation, including those regarding the possible or assumed future or other performance of the Company or its industry or other trend projections, constitute forward - looking statements . These statements are generally identified by the use of words such as “anticipate,” “believe,” “could,” “expect,” “should,” “plan,” “intend,” “estimate” and “potential,” among others . By their nature, forward - looking statements are necessarily subject to a high degree of uncertainty and involve known and unknown risks, uncertainties, assumptions and other factors because they relate to events and depend on circumstances that will occur in the future whether or not outside the control of the Company . Such factors may cause actual results, performance or developments to differ materially from those expressed or implied by such forward - looking statements and there can be no assurance that such forward - looking statements will prove to be correct . These risks and uncertainties include factors relating to : ( 1 ) general economic, financial, political, demographic and business conditions in Brazil, as well as any other countries we may serve in the future and their impact on our business ; ( 2 ) fluctuations in interest, inflation and exchange rates in Brazil and any other countries we may serve in the future ; ( 3 ) competition in the financial services industry ; ( 4 ) our ability to implement our business strategy ; ( 5 ) our ability to adapt to the rapid pace of technological changes in the financial services industry ; ( 6 ) the reliability, performance, functionality and quality of our products and services and the investment performance of investment funds managed by third parties or by our asset managers ; ( 7 ) the availability of government authorizations on terms and conditions and within periods acceptable to us ; ( 8 ) our ability to continue attracting and retaining new appropriately - skilled employees ; ( 9 ) our capitalization and level of indebtedness ; ( 10 ) the interests of our controlling shareholders ; ( 11 ) changes in government regulations applicable to the financial services industry in Brazil and elsewhere ; ( 12 ) our ability to compete and conduct our business in the future ; ( 13 ) the success of operating initiatives, including advertising and promotional efforts and new product, service and concept development by us and our competitors ; ( 14 ) changes in consumer demands regarding financial products, customer experience related to investments and technological advances, and our ability to innovate to respond to such changes ; ( 15 ) changes in labor, distribution and other operating costs ; ( 16 ) our compliance with, and changes to, government laws, regulations and tax matters that currently apply to us ; ( 17 ) the negative impacts of the COVID - 19 pandemic on global, regional and national economies and the related market volatility and protracted economic downturn ; and ( 18 ) other factors that may affect our financial condition, liquidity and results of operations . Accordingly, you should not place undue reliance on forward - looking statements . The forward - looking statements included herein speak only as at the date of this presentation and the Company does not undertake any obligation to update these forward - looking statements . Past performance does not guarantee or predict future performance . Moreover, the Company and its affiliates, officers, employees and agents do not undertake any obligation to review, update or confirm expectations or estimates or to release any revisions to any forward - looking statements to reflect events that occur or circumstances that arise in relation to the content of the presentation . You are cautioned not to unduly rely on such forward - looking statements when evaluating the information presented and we do not intend to update any of these forward - looking statements . Market data and industry information used throughout this presentation are based on management’s knowledge of the industry and the good faith estimates of management . The Company also relied, to the extent available, upon management’s review of industry surveys and publications and other publicly available information prepared by a number of third party sources . All of the market data and industry information used in this presentation involves a number of assumptions and limitations, and you are cautioned not to give undue weight to such estimates . Although the Company believes that these sources are reliable, there can be no assurance as to the accuracy or completeness of this information, and the Company has not independently verified this information . The contents hereof should not be construed as investment, legal, tax or other advice and you should consult your own advisers as to legal, business, tax and other related matters concerning an investment in the Company . The Company is not acting on your behalf and does not regard you as a customer or a client . It will not be responsible to you for providing protections afforded to clients or for advising you on the relevant transaction . This presentation also includes certain non - GAAP financial information . We believe that such information is meaningful and useful in understanding the activities and business metrics of the Company’s operations . We also believe that these non - GAAP financial measures reflect an additional way of viewing aspects of the Company’s business that, when viewed with our International Financial Reporting Standards (“IFRS”) results, as issued by the International Accounting Standards Board, provide a more complete understanding of factors and trends affecting the Company’s business . Further, investors regularly rely on non - GAAP financial measures to assess operating performance and such measures may highlight trends in the Company’s business that may not otherwise be apparent when relying on financial measures calculated in accordance with IFRS . We also believe that certain non - GAAP financial measures are frequently used by securities analysts, investors and other interested parties in the evaluation of public companies in the Company’s industry, many of which present these measures when reporting their results . The non - GAAP financial information is presented for informational purposes and to enhance understanding of the IFRS financial statements . The non - GAAP measures should be considered in addition to results prepared in accordance with IFRS, but not as a substitute for, or superior to, IFRS results . As other companies may determine or calculate this non - GAAP financial information differently, the usefulness of these measures for comparative purposes is limited . A reconciliation of such non - GAAP financial measures to the nearest GAAP measure is included in this presentation . For purposes of this presentation : “Active Clients” means the total number of retail clients served through our XP Investimentos, Rico, Clear, XP Investments and XP Private (Europe) brands, with Client Assets above R $ 100 . 00 or that have transacted at least once in the last thirty days . For purposes of calculating this metric, if a client holds an account in more than one of the aforementioned entities, such client will be counted as one “active client” for each such account . For example, if a client holds an account in each of XP Investimentos and Rico, such client will count as two “active clients” for purposes of this metric . “Client Assets” means the market value of all client assets invested through XP’s platform, including equities, fixed income securities, mutual funds (including those managed by XP Gestão de Recursos Ltda . , XP Advisory Gestão Recursos Ltda . and XP Vista Asset Management Ltda . , as well as by third - party asset managers), pension funds (including those from XP Vida e Previdência S . A . , as well as by third - party insurance companies), exchange traded funds, COEs (Structured Notes), REITs, and uninvested cash balances (Floating Balances), among others .

3 Index 4Q23 and 2023 Financials 02 Final Remarks 03 01 Key Highlights Q&A 04 Appendix 05

1 Key Highlights
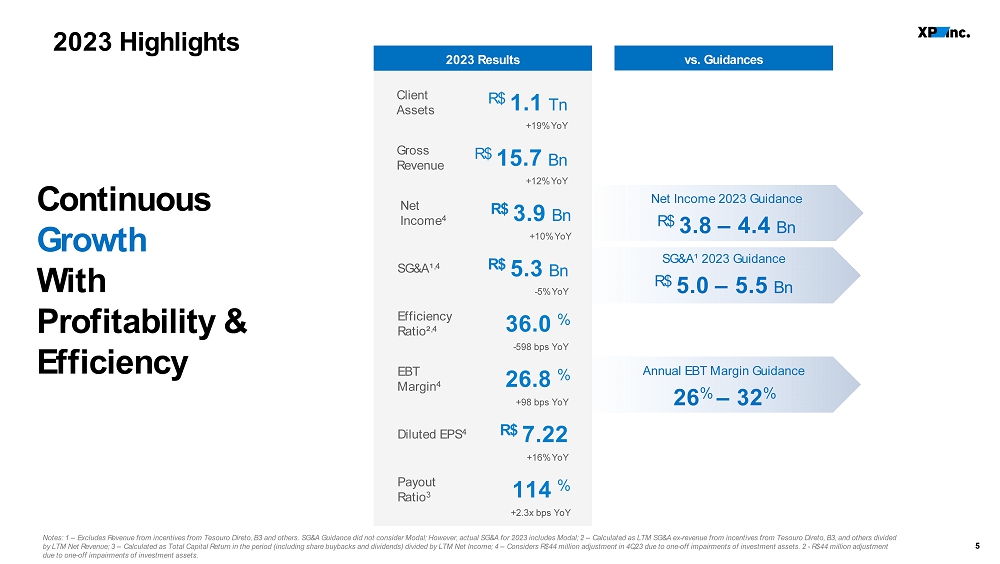
5 2023 Highlights Continuous Growth With Profitability & Efficiency Notes: 1 – Excludes Revenue from incentives from Tesouro Direto, B3 and others. SG&A Guidance did not consider Modal; However, actual SG&A for 2023 includes Modal; 2 – Calculated as LTM SG&A ex - revenue from incentives from Tesouro Direto, B3, and others divided by LTM Net Revenue; 3 – Calculated as Total Capital Return in the period (including share buybacks and dividends) divided by LTM Net Income; 4 – Cons iders R$44 million adjustment in 4Q23 due to one - off impairments of investment assets. 2 - R$44 million adjustment due to one - off impairments of investment assets. vs.
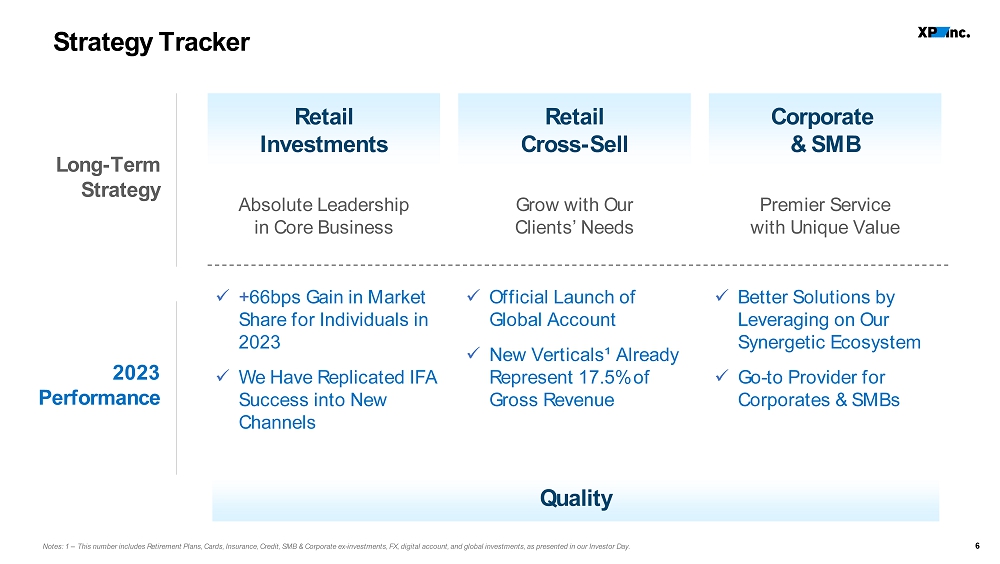
Guidances 2023 Results R$ 1.1 Tn Client Assets +19% YoY R$ 7.22 Diluted EPS 4 +16% YoY 36.0 % Efficiency Ratio² ,4 - 598 bps YoY R$ 3.9 Bn Net Income 4 +10% YoY R$ 3.8 – 4.4 Bn Net Income 2023 Guidance 26.8 % EBT Margin 4 +98 bps YoY 26 % – 32 % Annual EBT Margin Guidance R$ 5.0 – 5.5 Bn SG&A¹ 2023 Guidance R$ 5.3 Bn SG&A¹ ,4 - 5% YoY 114 % Payout Ratio 3 +2.3x bps YoY R$ 15.7 Bn Gross Revenue +12% YoY 6 Strategy Tracker Retail Investments Retail Cross - Sell Corporate & SMB Absolute Leadership in Core Business Grow with Our Clients’ Needs Premier Service with Unique Value Long - Term Strategy 2023 Performance x + 66bps Gain in Market Share for Individuals in 2023 x We Have Replicated IFA Success into New Channels x Official Launch of Global Account x New Verticals¹ Already Represent 17.5% of Gross Revenue x Better Solutions by Leveraging on Our Synergetic Ecosystem x Go - to Provider for Corporates & SMBs Notes: 1 – This number includes Retirement Plans, Cards, Insurance, Credit, SMB & Corporate ex - investments, FX, digital account, and global investments, as presented in our Investor Day.
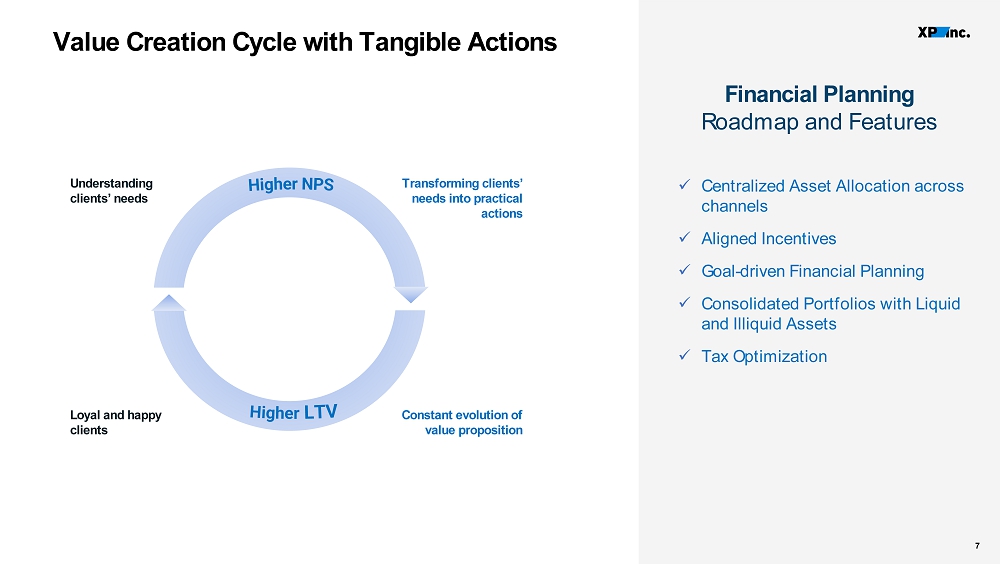
Quality 7 Value Creation Cycle with Tangible Actions 7 Understanding clients’ needs Transforming clients’ needs into practical actions Loyal and happy clients Constant evolution of value proposition Financial Planning Roadmap and Features x Centralized Asset Allocation across channels x Aligned Incentives x Goal - driven Financial Planning x Consolidated Portfolios with Liquid and Illiquid Assets x Tax Optimization 2 4Q23 and 2023 Financials
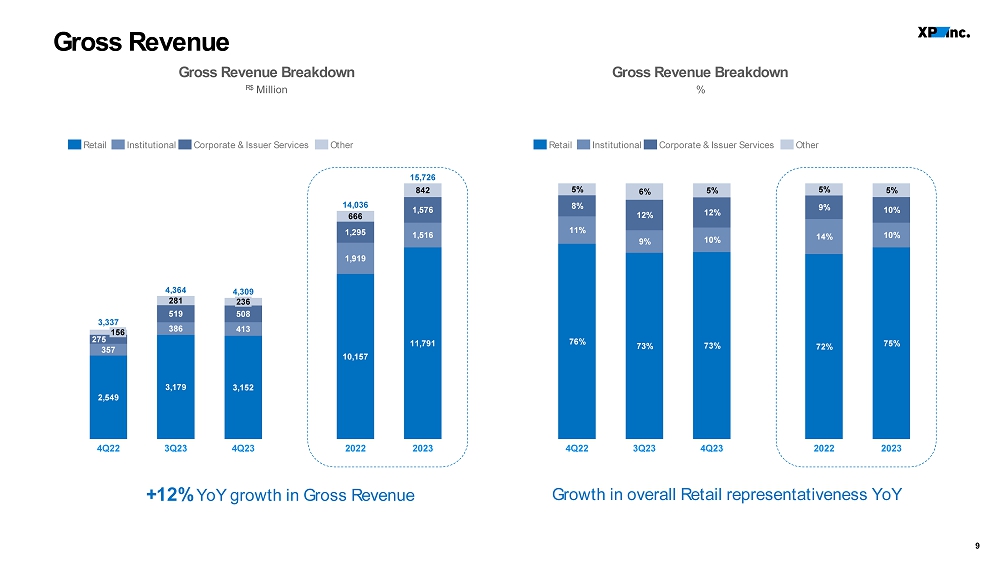
9 Gross Revenue 2,549 3,179 3,152 357 386 413 275 519 508 281 156 4Q22 3Q23 236 4Q23 3,337 4,364 4,309 Retail Institutional Corporate & Issuer Services Other 76% 73% 73% 11% 9% 10% 8% 12% 12% 5% 6% 5% 4Q22 3Q23 4Q23 Retail Institutional Corporate & Issuer Services Other +12% YoY growth in Gross Revenue Growth in overall Retail representativeness YoY Gross Revenue Breakdown % Gross Revenue Breakdown R$ Million 10,157 11,791 1,919 1,516 1,295 1,576 666 842 2022 2023 14,036 15,726 72% 75% 14% 10% 9% 10% 5% 5% 2022 2023 10 Retail Revenue – New Verticals¹ New Verticals¹ Growth of 43% YoY 93 98 94 234 259 306 47 49 46 31 36 46 4Q22 3Q23 4Q23 406 442 491 Retirement Plans Cards Credit Insurance Retail Revenue Breakdown – New Verticals¹ R$ Million 227 333 365 180 593 1,001 104 160 180 60 97 149 2022 2023 1,183 1,695 2021 571 Notes: 1 – This number is consistent with our previous disclosure of New Verticals within Retail.
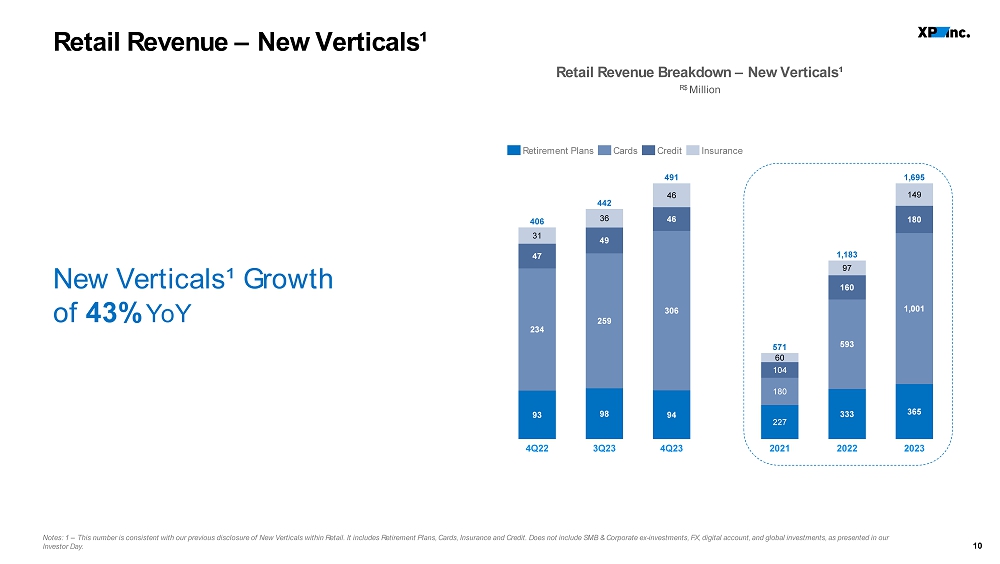
It includes Retirement Plans, Cards, Insurance and Credit. Does not include SMB & Corporate ex - investments, FX, digital account, and global investments, as pr esented in our Investor Day.
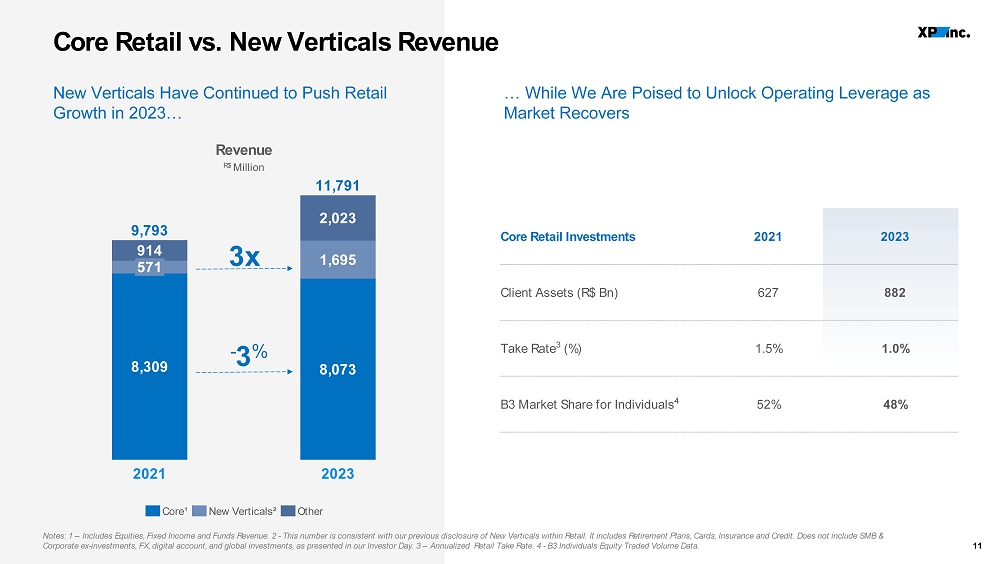
11 Core Retail vs. New Verticals Revenue Notes: 1 – Includes Equities, Fixed Income and Funds Revenue. 2 - This number is consistent with our previous disclosure of New Verticals within Retail. It includes Retirement Plans, Cards, Insurance and Credit. Does not include SMB & Corporate ex - investments, FX, digital account, and global investments, as presented in our Investor Day. 3 – Annualized Retail Take Rate. 4 - B3 Individuals Equity Traded Volume Data. 914 571 2021 2023 9,793 11,791 8,309 8,073 1,695 2,023 Revenue R$ Million - 3 % Core¹ New Verticals² Other 3x Core Retail Investments 2021 2023 Client Assets (R$ Bn) 627 882 Take Rate 3 (%) 1.5% 1.0% B3 Market Share for Individuals 4 52% 48% … While We Are Poised to Unlock Operating Leverage as Market Recovers New Verticals Have Continued to Push Retail Growth in 2023… 12 Corporate & Issuer Services Revenue Complete Product Range Supports Our Continuous Growth ...With +22% YoY Growth 135 197 177 140 322 330 4Q22 3Q23 4Q23 275 519 508 Corporate Issuer Services Corporate & Issuer Services Breakdown R$ Million 596 668 699 908 2022 2023 1,295 1,576
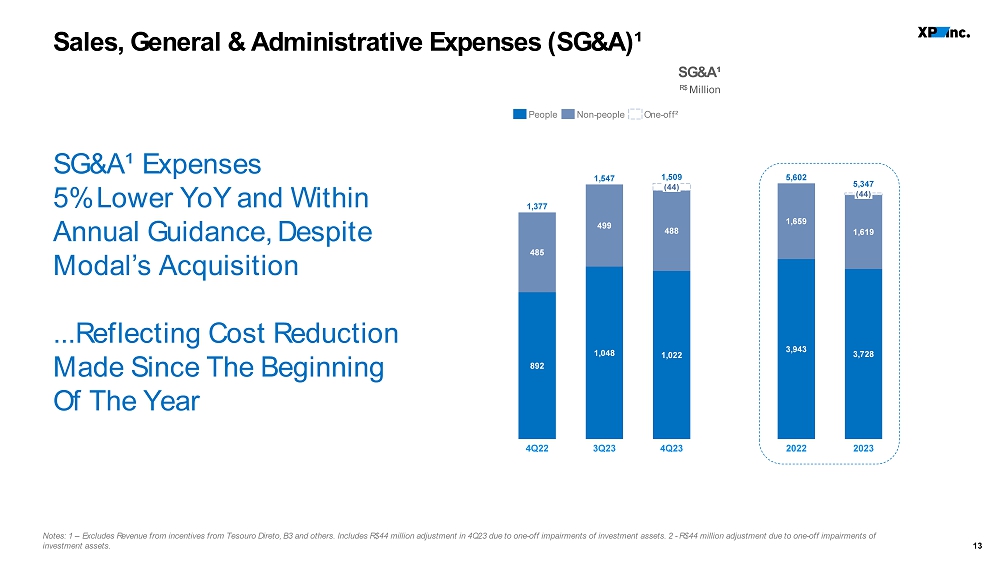
13 Sales, General & Administrative Expenses (SG&A)¹ Notes: 1 – Excludes Revenue from incentives from Tesouro Direto, B3 and others. Includes R$44 million adjustment in 4Q23 due to one - off impairments of investment assets. 2 - R$44 million adjustment due to one - off impairments of investment assets. 892 485 499 488 4Q22 1,048 3Q23 1,022 (44) 4Q23 1,377 1,547 1,509 People Non - people One - off² SG&A¹ Expenses 5% Lower YoY and Within Annual Guidance, Despite Modal’s Acquisition ...Reflecting Cost Reduction Made Since The Beginning Of The Year SG&A¹ R$ Million 3,943 1,659 2022 3,728 1,619 (44) 2023 5,602 5,347 14 Efficiency & Compensation Ratios Notes: 1 – Calculated as SG&A ex - revenue from incentives from Tesouro Direto, B3, and others divided by Net Revenue.
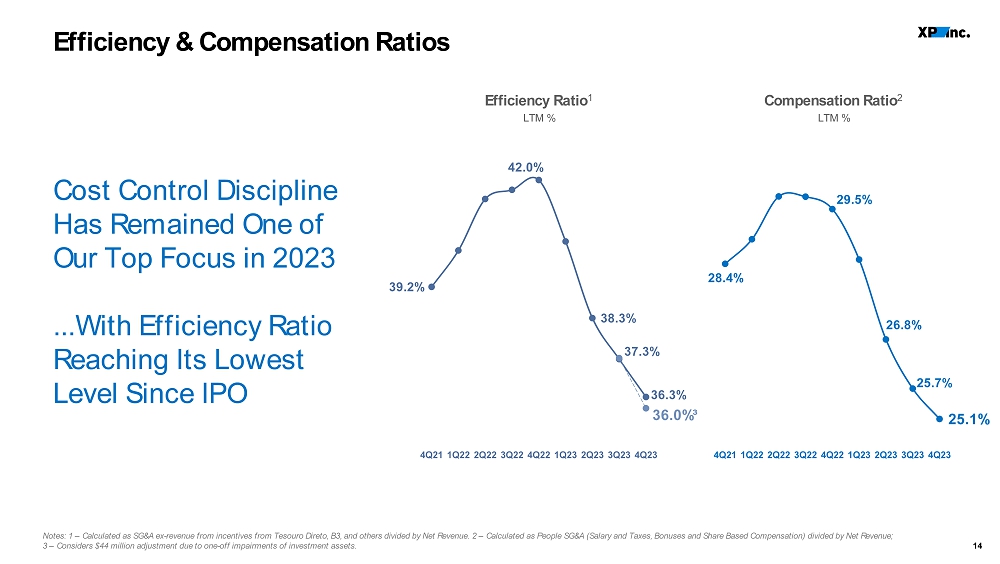
2 – Calcula ted as People SG&A (Salary and Taxes, Bonuses and Share Based Compensation) divided by Net Revenue; 3 – Considers $44 million adjustment due to one - off impairments of investment assets. Compensation Ratio 2 LTM % Efficiency Ratio 1 LTM % 4Q21 1Q22 2Q22 3Q22 4Q22 1Q23 2Q23 3Q23 36.0% ³ 4Q23 39.2% 42.0% 38.3% 37.3% 36.3% 4Q21 1Q22 2Q22 3Q22 4Q22 1Q23 2Q23 3Q23 4Q23 28.4% 29.5% 26.8% 25.7% 25.1% Cost Control Discipline Has Remained One of Our Top Focus in 2023 ...With Efficiency Ratio Reaching Its Lowest Level Since IPO 15 23.2% 28.0% 24.6% 25.7% Earning Before Taxes (EBT) 738 1,157 995 44 4Q22 3Q23 4Q23 1,039 Notes: 1 – Includes R$44 million adjustment due to one - off impairments of investment assets.
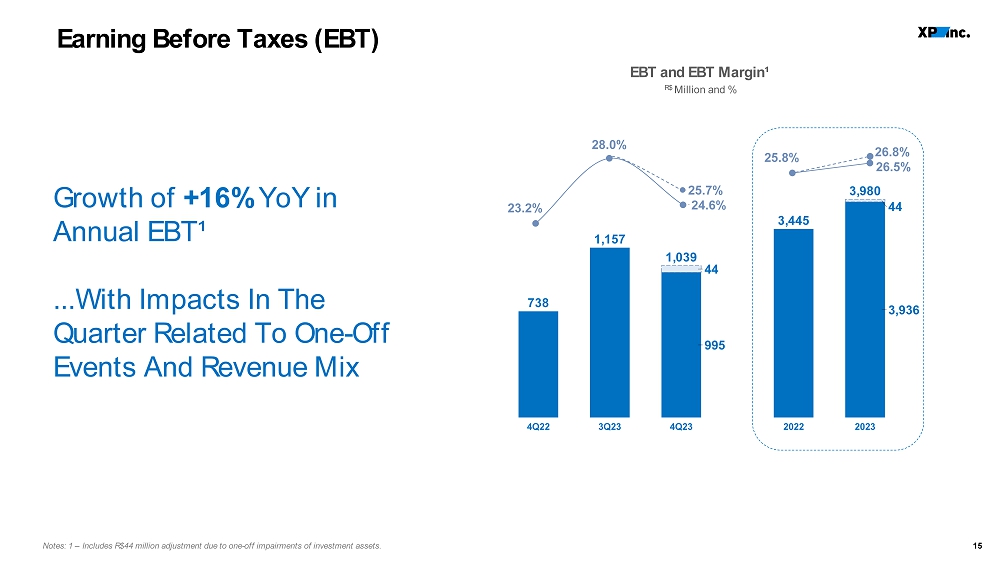
Growth of +16% YoY in Annual EBT¹ ...With Impacts In The Quarter Related To One - Off Events And Revenue Mix EBT and EBT Margin¹ R$ Million and % 3,445 3,936 44 2022 2023 3,980 25.8% 26.5% 26.8% 16 Net Income Notes: 1 - Includes R$32 million adjustment related to one - off impairments of investment assets, net of taxes.
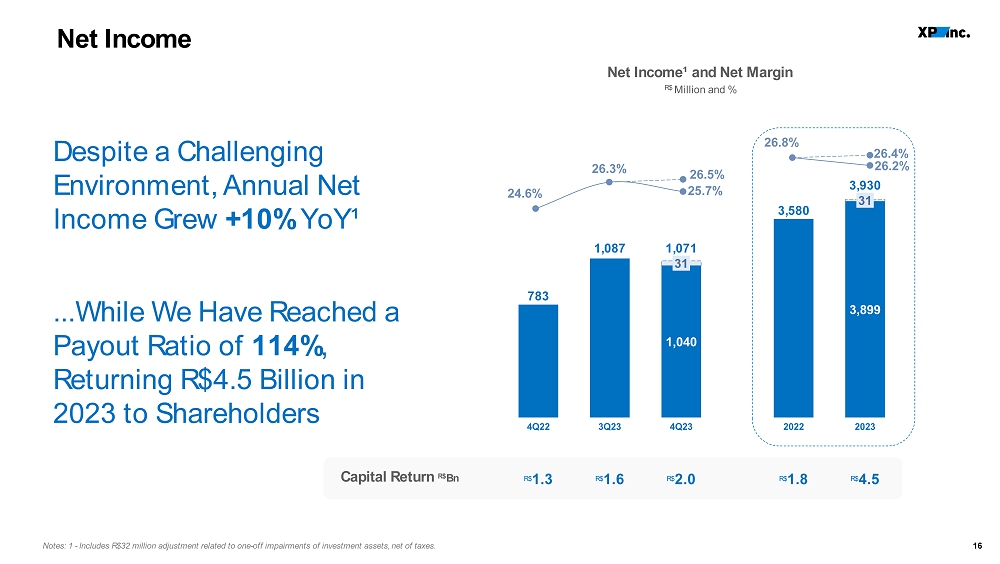
783 4Q22 3Q23 31 4Q23 1,071 1,087 1,040 24.6% 26.3% 25.7% 26.5% Despite a Challenging Environment, Annual Net Income Grew +10% YoY¹ ...While We Have Reached a Payout Ratio of 114% , Returning R$4.5 Billion in 2023 to Shareholders Net Income¹ and Net Margin R$ Million and % 2022 31 2023 3,930 3,580 3,899 26.4% 26.8% 26.2% Capital Return R$ Bn R$ 1.3 R$ 1.6 R$ 2.0 R$ 1.8 R$ 4.5 17 Return on Tangible Equity Notes: 1 – Annualized Return on Average Tangible Equity.
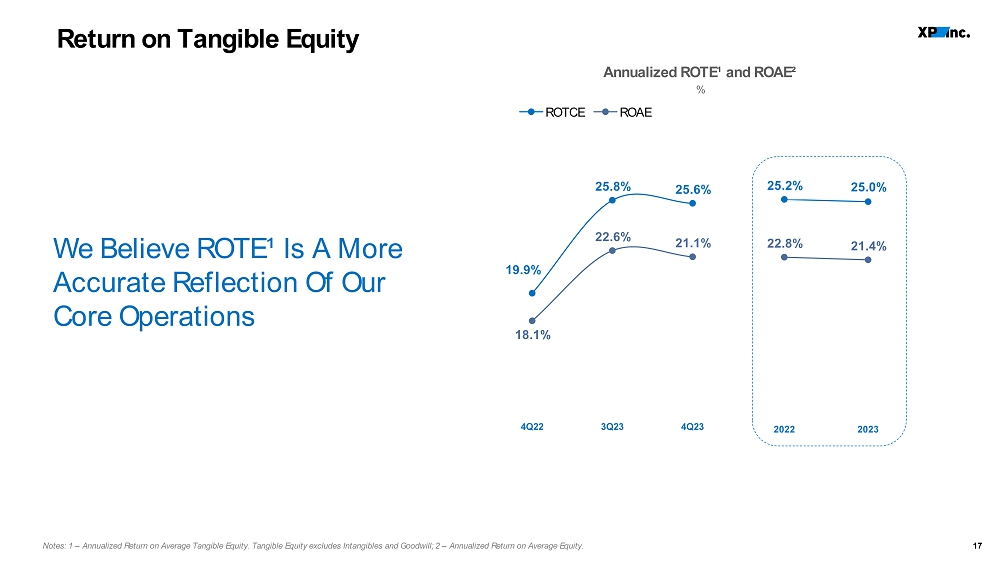
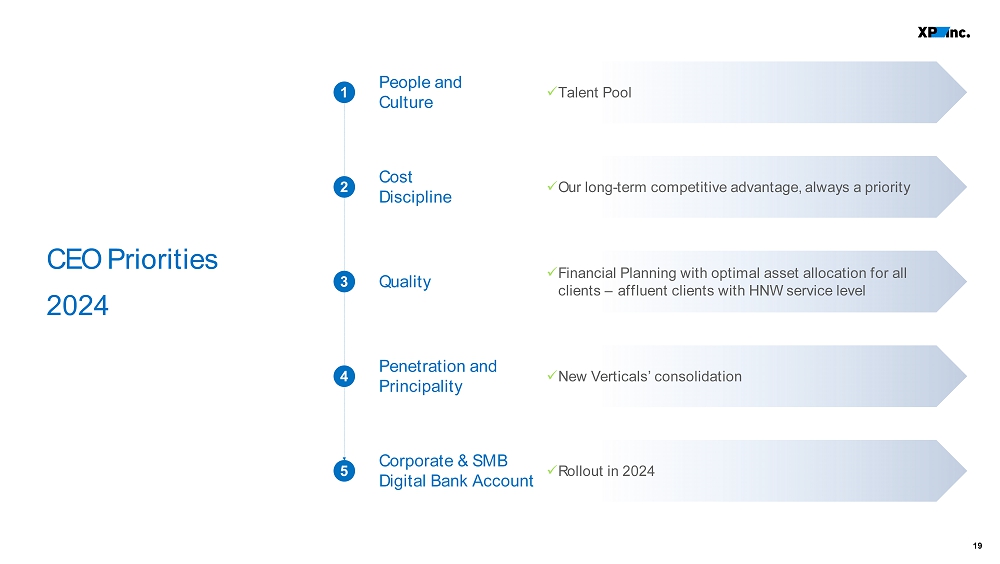
Tangible Equity excludes Intangibles and Goodwill; 2 – Annualized Retur n on Average Equity. We Believe ROTE¹ Is A More Accurate Reflection Of Our Core Operations Annualized ROTE¹ and ROAE² % 19.9% 25.8% 25.6% 18.1% 22.6% 4Q22 3Q23 4Q23 21.1% 25.2% 22.8% 2022 2023 21.4% 25.0% ROTCE ROAE 19 People and Culture x Talent Pool 1 2 x Our long - term competitive advantage, always a priority Cost Discipline 3 x Financial Planning with optimal asset allocation for all clients – affluent clients with HNW service level Quality 4 x New Verticals’ consolidation Penetration and Principality 5 x Rollout in 2024 Corporate & SMB Digital Bank Account CEO Priorities 2024

3 Final Remarks

4 Q&A

5 Appendix
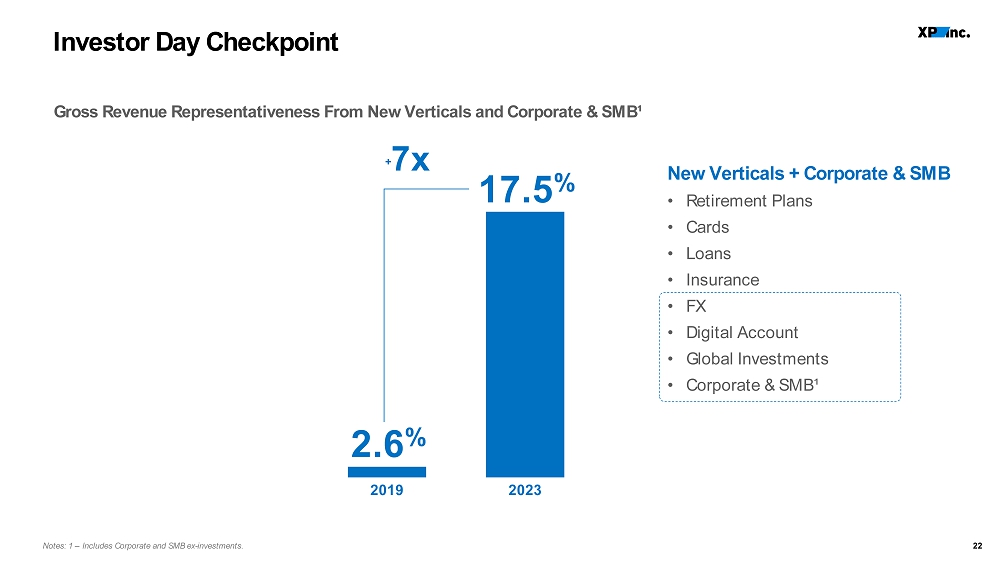
22 Investor Day Checkpoint Notes: 1 – Includes Corporate and SMB ex - investments. New Verticals + Corporate & SMB • Retirement Plans • Cards • Loans • Insurance • FX • Digital Account • Global Investments • Corporate & SMB¹ 2.6 % 2019 2023 + 7x 17.5 % Gross Revenue Representativeness From New Verticals and Corporate & SMB¹ 23 Total Loan Portfolio¹ Note: 1 – Gross of Expected Credit Losses.
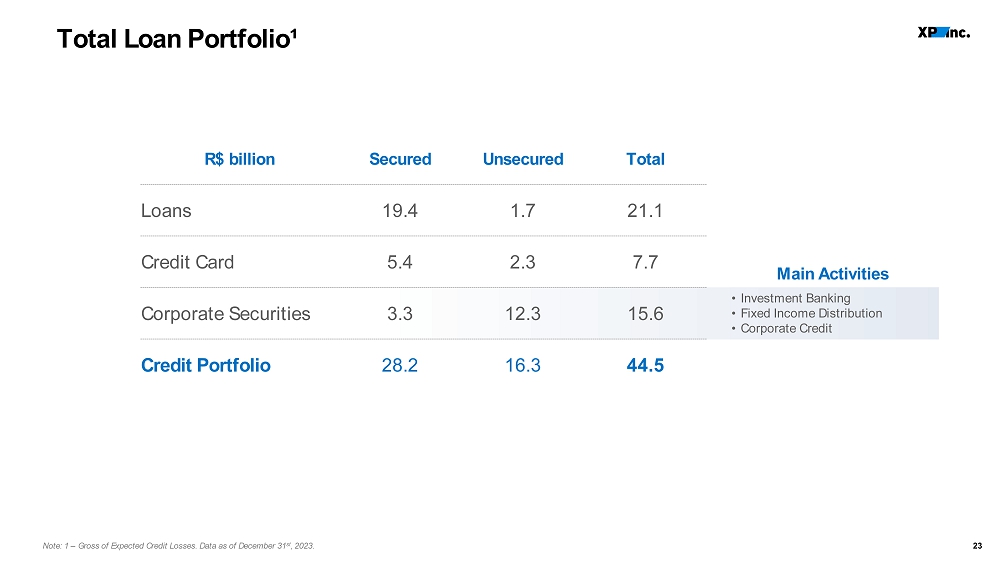
Data as of December 31 st , 2023.
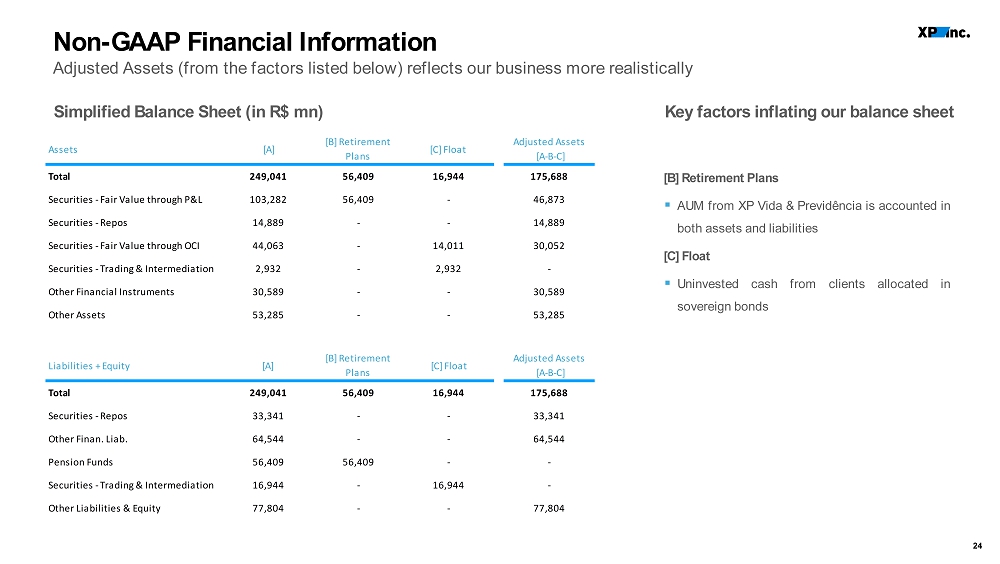
R$ billion Secured Unsecured Total Loans 19.4 1.7 21.1 Credit Card 5.4 2.3 7.7 Corporate Securities 3.3 12.3 15.6 Credit Portfolio 28.2 16.3 44.5 Main Activities • Investment Banking • Fixed Income Distribution • Corporate Credit 24 Non - GAAP Financial Information Adjusted Assets (from the factors listed below) reflects our business more realistically [B] Retirement Plans ▪ AUM from XP Vida & Previdência is accounted in both assets and liabilities [C] Float ▪ Uninvested cash from clients allocated in sovereign bonds Key factors inflating our balance sheet Simplified Balance Sheet (in R $ mn) Assets [A] [B] Retirement Plans [C] Float Adjusted Assets [A-B-C] Total 249,041 56,409 16,944 175,688 Securities - Fair Value through P&L 103,282 56,409 - 46,873 Securities - Repos 14,889 - - 14,889 Securities - Fair Value through OCI 44,063 - 14,011 30,052 Securities - Trading & Intermediation 2,932 - 2,932 - Other Financial Instruments 30,589 - - 30,589 Other Assets 53,285 - - 53,285 Liabilities + Equity [A] [B] Retirement Plans [C] Float Adjusted Assets [A-B-C] Total 249,041 56,409 16,944 175,688 Securities - Repos 33,341 - - 33,341 Other Finan. Liab. 64,544 - - 64,544 Pension Funds 56,409 56,409 - - Securities - Trading & Intermediation 16,944 - 16,944 - Other Liabilities & Equity 77,804 - - 77,804 25 Net Asset Value 25 (in R $ mn ) Adj.
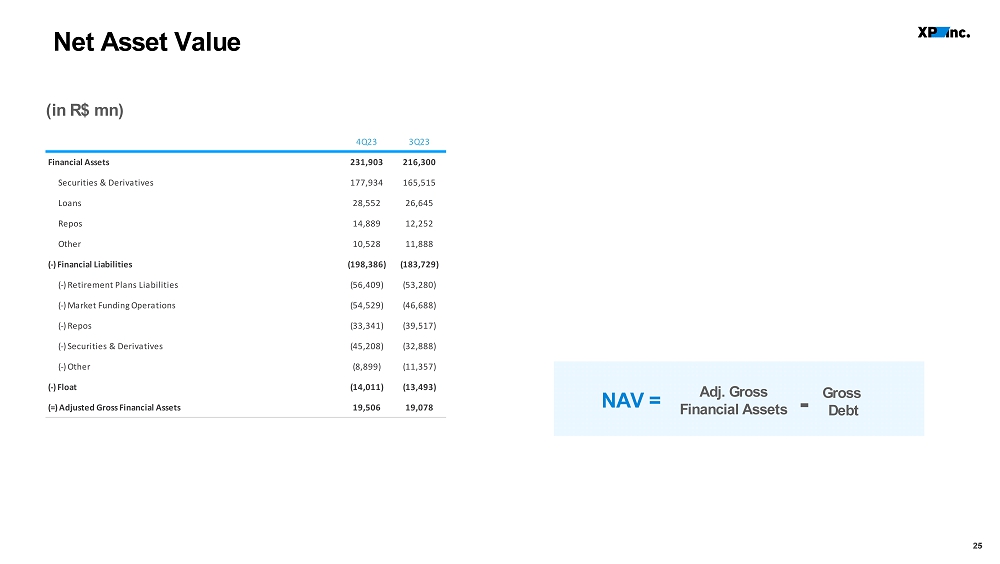
Gross Financial Assets NAV = Gross Debt - 4Q23 3Q23 Financial Assets 231,903 216,300 Securities & Derivatives 177,934 165,515 Loans 28,552 26,645 Repos 14,889 12,252 Other 10,528 11,888 (-) Financial Liabilities (198,386) (183,729) (-) Retirement Plans Liabilities (56,409) (53,280) (-) Market Funding Operations (54,529) (46,688) (-) Repos (33,341) (39,517) (-) Securities & Derivatives (45,208) (32,888) (-) Other (8,899) (11,357) (-) Float (14,011) (13,493) (=) Adjusted Gross Financial Assets 19,506 19,078 26 Investor Relations ir@xpi.com.br https://investors.xpinc.com/