UNITED STATES
SECURITIES AND EXCHANGE COMMISSION
Washington, D.C. 20549
FORM 6-K
REPORT OF FOREIGN PRIVATE ISSUER PURSUANT TO RULE 13a-16 OR 15d-16 UNDER THE SECURITIES EXCHANGE ACT OF 1934
For the month of January 2024.
Commission File Number: 001-40627
SOPHiA GENETICS SA
(Exact name of registrant as specified in its charter)
La Pièce 12
CH-1180 Rolle
Switzerland
(Address of principal executive office)
Indicate by check mark whether the registrant files or will file annual reports under cover of Form 20-F or Form 40-F:
| Form 20-F | ☒ |
Form 40-F |
SIGNATURE
Pursuant to the requirements of the Securities Exchange Act of 1934, the registrant has duly caused this report to be signed on its behalf by the undersigned, thereunto duly authorized.
| SOPHiA GENETICS SA | ||
| Date: January 10, 2024 | ||
| By: | /s/ Daan van Well | |
| Name: | Daan van Well | |
| Title: | Chief Legal Officer | |
EXHIBIT INDEX
Exhibit 99.1

SOPHiA GENETICS Highlights Near-Term Growth Strategy at 42nd Annual J.P. Morgan Healthcare Conference
Strong SOPHiA DDM™ adoption and analysis volume contributes to continued revenue growth
Liquid biopsy and HRD on SOPHiA DDM™ Platform continue to grow year-over-year, with Tennessee Oncology, Dasa and The Royal Marsden announced today
Boston, MA and Rolle, Switzerland, January 10, 2023 – SOPHiA GENETICS (Nasdaq: SOPH), a cloud-native software company and a leader in data-driven medicine, will share an overview of its near-term growth strategy, fueled by strong adoption and opportunity for the SOPHiA DDM™ Platform, in a presentation at the 42nd annual J.P. Morgan Healthcare Conference on Thursday, January 11, 2024 at 9:00 a.m. PST.
Highlights include:
| · | Continued adoption of SOPHiA DDM™ in clinical markets globally has enabled analysis volume for the full year of 2023 to grow to a record 315,000+ analyses globally1. |
| · | Since inception, the Platform has analyzed over 1.5 million genomic profiles worldwide. |
| · | New customer count for 2023 includes 87 core genomics customers globally2, resulting in a current network of 750+ customers using SOPHiA DDM™ globally3. |
| · | New U.S.-based customer Tennessee Oncology exploring MSK-ACCESS® powered with SOPHiA DDM™, as well as Latin American healthcare network Dasa expanding to incorporate the liquid biopsy application. |
| · | The Royal Marsden, a world leader in cancer care based in the U.K., is live on the SOPHiA DDM™ Platform to support HRD testing and research. |
CEO Commentary
“We have witnessed the market demand for a global, decentralized technology platform that will power the precision medicine space at-scale – a $40 billion total addressable market between clinical and biopharma markets. The continued adoption of SOPHiA DDM™ and the record number of analyses performed on the platform, increasing year-over-year, reflects how SOPHiA DDM™ is positioned to fulfill that need for those markets. We are especially positioned for growth with our HRD and Liquid Biopsy applications, which have both grown significantly year-over-year. I could not be more excited about the opportunities that lie ahead and SOPHiA GENETICS’ ability to capitalize,” said Jurgi Camblong, PhD., Chief Executive Officer and Co-founder of SOPHiA GENETICS. “With our commitment to financial discipline and our strategic vision that will help us
________________
| 1 | Analysis volume reported as of December 31, 2023. Figure includes volumes related to COVID-19. |
| 2 | New signed core genomics customers as of December 31, 2023. |
| 3 | Total customer count reported from the 12-month period ending November 30, 2023. |
Webcast Information
Jurgi Camblong, PhD., CEO and Co-founder, will present at the J.P. Morgan 2024 Healthcare Conference on Thursday, January 11, 2024, at 9:00 a.m. PST at the Westin St. Francis in San Francisco.
Live, listen-only webcasts of this presentation can be accessed by visiting the Investors section of the SOPHiA GENETICS website at ir.sophiagenetics.com. A replay of the webcast will be available shortly after the conclusion of the presentation.
New Additions to the SOPHiA DDM™ Network
MSK-ACCESS® powered with SOPHiA DDM™, the new liquid biopsy offering from SOPHiA GENETICS, combines the sophisticated analytics, state-of-the-art algorithms and global network of the SOPHiA DDM™ Platform, with the scientific and clinical expertise of Memorial Sloan Kettering in cancer genomics.
MSK-ACCESS® powered with SOPHiA DDM™ will be tested at Tennessee Oncology, a U.S.-based patient-centered community oncology practice with over 35 locations, today announced as an early adopter of the advanced liquid biopsy testing. Tennessee Oncology, which is part of OneOncology, a network of leading oncology practices and experts driving the future of community-based cancer care, provides access to high-quality, innovative cancer care for its patients and increases access to advanced cancer testing in underserved areas.
Additionally, Dasa, the largest integrated healthcare network in Latin America that serves more than 20 million patients per year – including approximately 10% of the Brazilian population – also expanded its use of the SOPHiA DDM™ Platform to offer liquid biopsy via MSK-ACCESS® powered with SOPHiA DDM™.
The SOPHiA DDM™ Homologous Recombination Deficiency (HRD) Solution continues to be a strong driver of growth just two years after launch. Today, SOPHiA GENETICS announced that The Royal Marsden, a world leader in cancer care, pioneering treatment and ground-breaking research, is live on the SOPHiA DDM™ Platform to support HRD testing and research in the United Kingdom.
Full Year 2023 Preliminary Estimated Results
Based on information currently available, for the full year ending December 31, 2023, the Company expects to report FY results in line with guidance provided at Q3 earnings:
| · | Full-year reported revenue growth expected to be at or above 30%; |
| · | Full year constant currency revenue growth excluding COVID-19-related revenue to be between 30% and 35%; and |
| · | 2023 operating losses to be below 2022 levels. |
The foregoing figures are preliminary and unaudited and reflect the Company’s estimated financial results. In preparing this information, management made a number of complex and subjective judgments and estimates about the appropriateness of certain reported amounts and disclosures. The Company’s actual financial results for the year ended December 31, 2023 have not yet been finalized by management or audited by the Company’s independent auditors. The preliminary financial information is not a comprehensive statement of all financial results for the year ended December 31, 2023. Subsequent information or events may lead to material differences between the foregoing preliminary financial results and those reported in the Company’s subsequent SEC filings. Accordingly, investors should not place undue reliance on these preliminary financial results.
Constant currency revenue growth excluding COVID-19-related revenue is a non-IFRS measure. See “Presentation of Constant Currency Excluding COVID-19-Related Revenue” below for a description of its calculation. The Company is unable to provide a reconciliation of forward-looking Constant currency revenue growth excluding COVID-19-related revenue to Revenue, the most comparable IFRS financial measure, due to the inherent difficulty in forecasting and quantifying the impact of foreign currency translation.
About SOPHiA GENETICS
SOPHiA GENETICS (Nasdaq: SOPH) is a software company dedicated to establishing the practice of data-driven medicine as the standard of care and for life sciences research. It is the creator of the SOPHiA DDM™ Platform, a cloud-native platform capable of analyzing data and generating insights from complex multimodal data sets and different diagnostic modalities. The SOPHiA DDM™ Platform and related solutions, products and services are currently used by a broad network of hospital, laboratory, and biopharma institutions globally. For more information, visit SOPHiAGENETICS.COM, or connect on X, LinkedIn, Facebook, and Instagram. Where others see data, we see answers.
Presentation of Constant Currency Excluding COVID-19-Related Revenue
We present constant currency revenue excluding COVID-19-related revenue to remove the effects of changes in foreign currency exchange rates on revenue as well as revenues that we derived from sales of COVID-19-related offerings. We believe that this non-IFRS measure provides useful information to investors and others in understanding and evaluating our revenue growth.
We operate internationally, and our revenues are generated primarily in the U.S. dollar, the euro and Swiss franc and, to a lesser extent, British pound, Australian dollar, Brazilian real, Turkish lira and Canadian dollar depending on our customers’ geographic locations. Changes in revenue include the impact of changes in foreign currency exchange rates. Under IFRS, revenues received in local (non-U.S. dollar) currencies are translated into U.S. dollars at the average monthly exchange rate for the month in which the transaction occurred. When we use the term “constant currency”, it means that we have translated local currency revenues for the current reporting period into U.S. dollars using the same average foreign currency exchange rates for the conversion of revenues into U.S. dollars that we used to translate local currency revenues for the comparable reporting period of the prior year. We then calculate the difference between the IFRS revenue and the constant currency revenue to yield the “constant currency impact” for the current period. The exclusion of the impact of exchange rate fluctuations provides comparability across reporting periods and reflects the effects of our customer acquisition efforts and land-and-expand strategy.
We derive certain revenue from sales of COVID-19-related offerings, including a NGS assay for COVID-19 that leverages our SOPHiA DDMTM Platform and related products and solutions analytical capabilities and COVID-19 bundled access products. We do not believe that these revenues reflect our core business of commercializing our platform because our COVID-19 solution was offered to address specific market demand by our customers for analytical capabilities to assist with their testing operations. We do not anticipate additional development of our COVID-19-related solution as the pandemic transitions into a more endemic phase and as customer demand continues to decline. Further, COVID-19-related revenues did not constitute, and we do not expect COVID-19-related revenues to constitute in the future, a significant part of our revenue.
Our management and board of directors use constant currency revenue excluding COVID-19-related revenue growth to evaluate our growth and generate future operating plans. Accordingly, we believe that this non-IFRS measure provides useful information to investors and others in understanding and evaluating our revenue growth in the same manner as our management and board of directors. However, this non-IFRS measure has limitations, particularly as the exchange rate effects that are eliminated could constitute a significant element of our revenue and could significantly impact our performance and prospects. Because of these limitations, you should consider this non-IFRS measure alongside other financial performance measures, including revenue and revenue growth presented in accordance with IFRS and our other IFRS results.
Forward-Looking Statements
This press release contains statements that constitute forward-looking statements. All statements other than statements of historical facts contained in this press release, including FY 2023 expected financial results and statements regarding our future results of operations and financial position, business strategy, products and technology, partnerships, and collaborations, as well as plans and objectives of management for future operations, are forward-looking statements. Forward-looking statements are based on our management’s beliefs and assumptions and on information currently available to our management. Such statements are subject to risks and uncertainties, and actual results may differ materially from those expressed or implied in the forward-looking statements due to various factors, including those described in our filings with the U.S. Securities and Exchange Commission. No assurance can be given that such future results will be achieved. Such forward-looking statements contained in this document speak only as of the date of this press release. We expressly disclaim any obligation or undertaking to update these forward-looking statements contained in this press release to reflect any change in our expectations or any change in events, conditions, or circumstances on which such statements are based, unless required to do so by applicable law. No representations or warranties (expressed or implied) are made about the accuracy of any such forward-looking statements.
# # #
Investor
Contact:
Kellen Sanger
ir@sophiagenetics.com
Media Contact:
Kelly Katapodis
media@sophiagenetics.com
Exhibit 99.2

J.P. Morgan Healthcare Conference January 2024 Jurgi Camblong CEO and Co - Founder at SOPHiA GENETICS Cautionary notices 2 This presentation contains statements that constitute forward - looking statements.

All statements other than statements of historical facts contained in this presentation, including statements regarding our future results of operations and financial position, business strategy, products and technology, as well as plans and objectives of management for future operations, are forward - looking statements. Forward - looking statements are based on our management’s beliefs and assumptions and on information currently available to our management. Such statements are subject to risks and uncertainties, and actual results may differ materially from those expressed or implied in the forward - looking statements due to various factors, including those described in our filings with the U.S. Securities and Exchange Commission. No assurance can be given that such future results will be achieved. Such forward - looking statements contained in this document speak only as of the date of this presentation. We expressly disclaim any obligation or undertaking to update these forward - looking statements contained in this presentation to reflect any change in our expectations or any change in events, conditions, or circumstances on which such statements are based, unless required to do so by applicable law. No representations or warranties (expressed or implied) are made about the accuracy of any such forward - looking statements. No offer to sell or buy This presentation does not constitute an offer to sell or a solicitation of an offer to buy any securities in any jurisdiction in which such offer, solicitation or sale would be unlawful. Other material information This presentation does not contain all material information about SOPHiA GENETICS SA and its subsidiaries. No representations or warranties (expressed or implied) are made regarding the completeness of the information contained in this presentation. Refer to our Securities and Exchange Commission filings for additional information about us. Market and industry data This presentation contains industry, market and competitive position data that are based on general and industry publications, surveys and studies conducted by third parties, some of which may not be publicly available, and our own internal estimates and research. Third - party publications, surveys and studies generally state that they have obtained information from sources believed to be reliable, but do not guarantee the accuracy and completeness of such information. While we are not aware of any misstatements regarding the industry, market and competitive position data presented herein, these data involve a number of assumptions and limitations and contain projections and estimates of the future performance of the industries in which we operate that are subject to a high degree of uncertainty Research use only SOPHiA GENETICS products are for Research Use Only and not for use in diagnostic procedures, unless specified otherwise. The information included in this presentation is about products that may or may not be available in different countries and, if applicable, may or may not have received approval or market clearance by a governmental regulatory body for different indications for use. Please contact support@sophiagenetics.com to obtain the appropriate product information for your country of residence. Preliminary financial information This presentation includes preliminary and unaudited results of operations. In preparing this information, management made a number of complex and subjective judgments and estimates about the appropriateness of certain reported amounts and disclosures. Our actual financial results for the quarter and year ended December 31, 2023 have not yet been finalized by management or audited or reviewed by the Company's independent auditors. The preliminary financial information is not a comprehensive statement of all financial results for the quarter or year ended December 31, 2023. Subsequent information or events may lead to material differences between the preliminary financial results and those reported in our subsequent SEC filings. Accordingly, you should not place undue reliance on these preliminary financial results. © SOPHiA GENETICS 2024 iven medicine i A DD tv1 Œ


© SOPHiA GENETICS 2024 Rapid expansion of precision medicine with data at the core 4 2012 F o un d a t i o n O n e ® launch Pioneered a centralized approach to pan - cancer NGS with IT expertise 2015 Tempus and Caris emerge 2011 Illumina MiSeq TM launch Initiated the broad adoption of NGS by hospitals and labs 2003 First human genome sequenced First full sequencing of the human genome by the Human Genome Project 2014 G uar d an t 360 ® launch Breakthrough in New leaders in centralized cancer treatment with NGS gain prominence first - in - kind blood test with data and AI bias T o d a y 2018 Illumina TSO500 TM launch Major step towards a decentralized world focused on tumor profiling SOURCE: Big Data in Health Care: Applications and Challenges, Data and Information Management; The Human Genome Project; Company websites of Illumina, Foundation Medicine, Guardant, Tempus, and Caris.

Explosion of healthcare data over time Increasing market demand for a scalable technology platform that powers precision medicine with a collective intelligence © SOPHiA GENETICS 2024 We are targeting a sizeable addressable market 5 Clinical market Generating insights from multimodal data to help Clinicians with screening, early detection, diagnosis, therapy selection, and monitoring $25B BioPharma market Generating insights from multimodal data to help BioPharma companies with drug discovery, development, and deployment $1 5B The decentralized, cloud - based analytics platform at the center of it all $40B market opportunity Note: This slide presents our estimated addressable market for 2023. These estimates are primarily based on epidemiological data, including incidence and prevalence estimates of addressable populations for each application, as well as a range of price assumptions for our products taking into account difference in panel sizes.
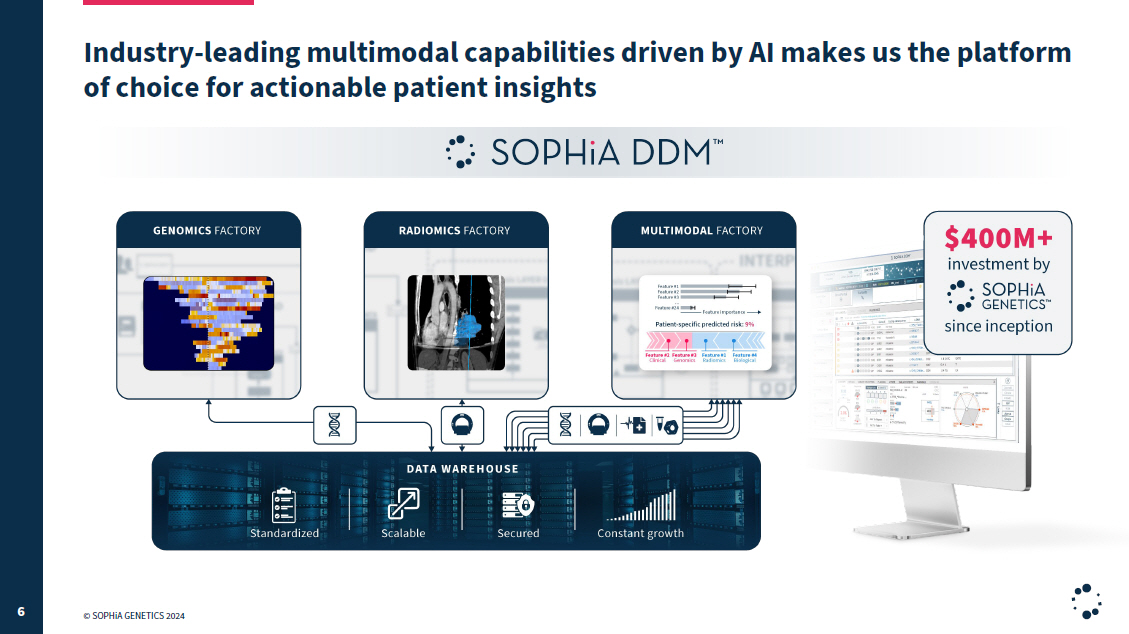
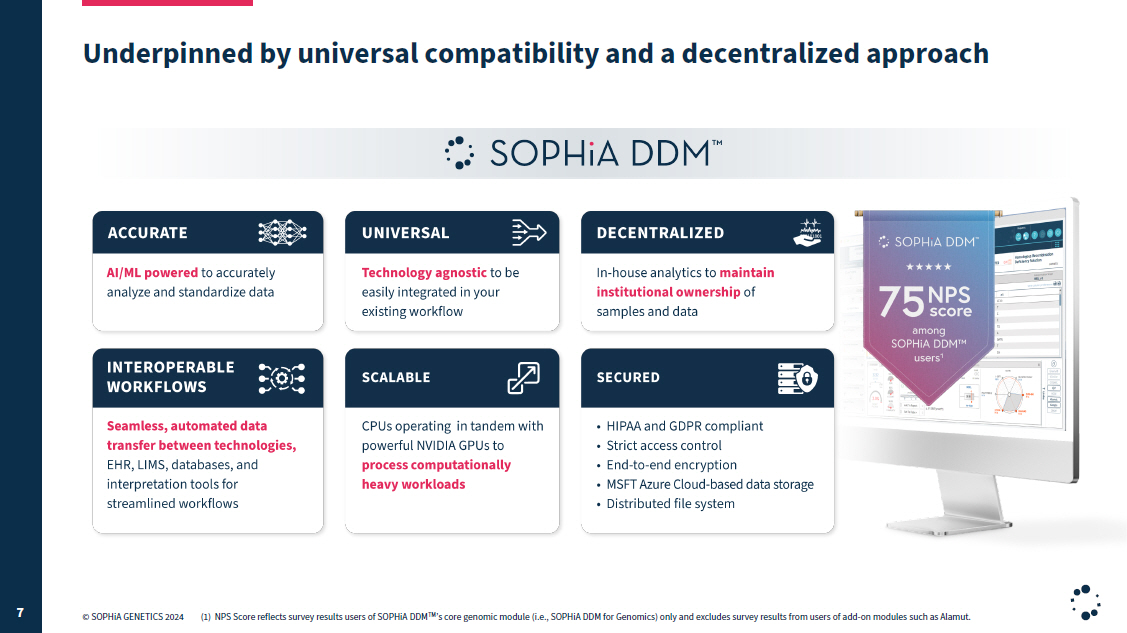
© SOPHiA GENETICS 2024 Industry - leading multimodal capabilities driven by AI makes us the platform of choice for actionable patient insights 6 © SOPHiA GENETICS 2024 Underpinned by universal compatibility and a decentralized approach 7 (1) NPS Score reflects survey results users of SOPHiA DDM TM ’s core genomic module (i.e., SOPHiA DDM for Genomics) only and excludes survey results from users of add - on modules such as Alamut.
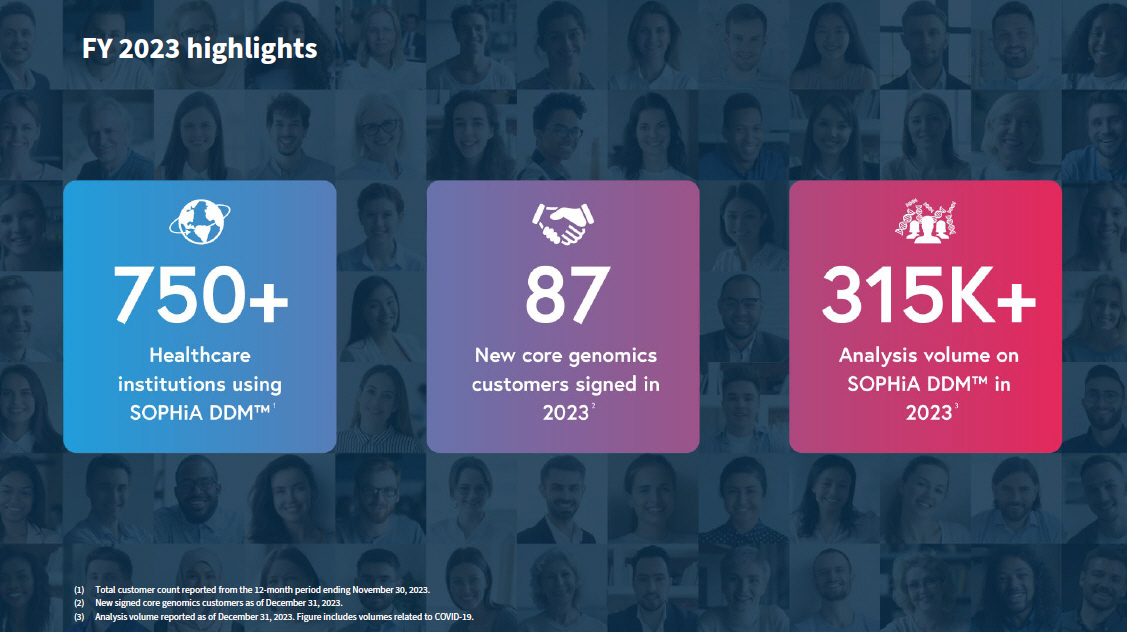
FY 2023 highlights (1) Total customer count reported from the 12 - month period ending November 30, 2023. (2) New signed core genomics customers as of December 31, 2023. (3) Analysis volume reported as of December 31, 2023. Figure includes volumes related to COVID - 19.

Q4 2023 highlights (1) New signed core genomics customers as of December 31, 2023. (2) Analysis volume reported as of December 31, 2023. Figure includes volumes related to COVID - 19.
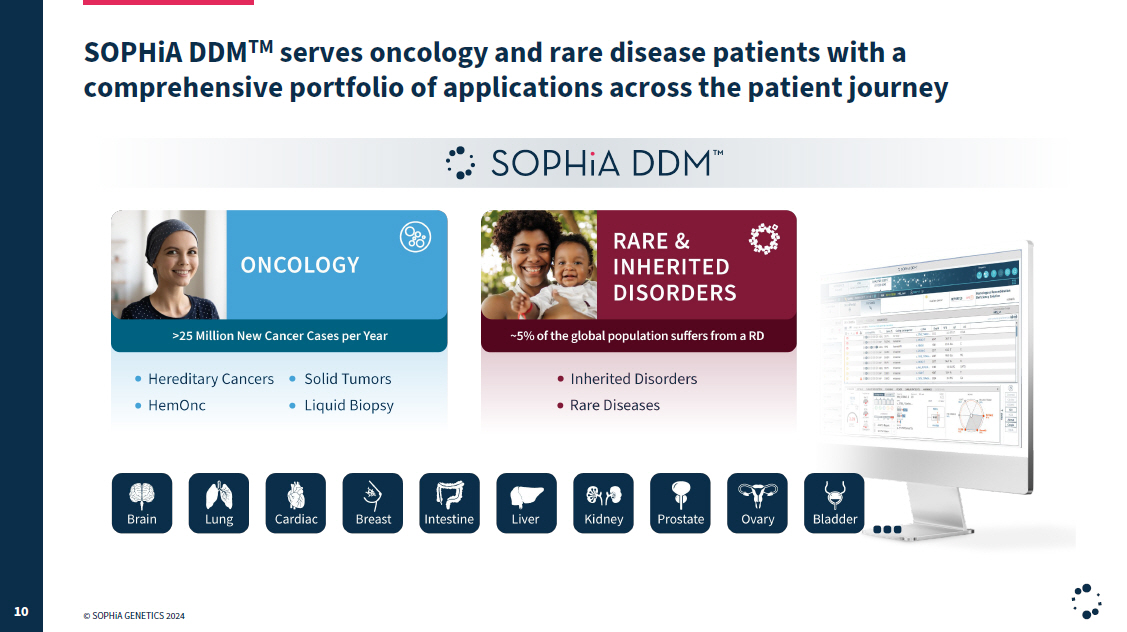
© SOPHiA GENETICS 2024 SOPHiA DDM TM serves oncology and rare disease patients with a comprehensive portfolio of applications across the patient journey 10 © SOPHiA GENETICS 2024 Analysis volume on SOPHiA DDM TM is growing rapidly across all applications 11 (1) Year - over - year analysis volume as of December 31, 2023.

Analysis volume growth is presented excluding COVID - related volumes.

© SOPHiA GENETICS 2024 Platform consumption driving strong revenue growth in 2023 and beyond 12 FY results expected to be in line with guidance provided at Q3 earnings: > Reported revenue growth: Full - year growth at or above 30% > Constant currency revenue growth excluding COVID - 19 revenue: Full - year growth between 30% and 35% > Operating loss: FY 2023 below FY 2022 operating Loss levels Key growth drivers in 2024: > Solid tumors: Increasing complexity of signatures including HRD > Liquid biopsy (LBx): Growing demand on MSK - ACCESS® powered with SOPHiA DDM TM > US: Significant momentum mounting with recent wins (1) Year - over - year revenue presented as of Q3 2023. Gradient area of 2023 bar chart is illustrative only and does not reflect Q4 2023 results. (1 )

© SOPHiA GENETICS 2024 SOPHiA DDM TM ’s best - in - class HRD application 13 (1) HRD analysis volume growth and customer counts as of December 31, 2023. other cancer types © SOPHiA GENETICS 2024 Expanding our success in oncology with a world - class application in LBx 14


© SOPHiA GENETICS 2024 Significant momentum in the US market 15

© SOPHiA GENETICS 2024 16 The Clinical and BioPharma flywheel © SOPHiA GENETICS 2024 18 Data processed on SOPHiA DDM TM has exploded over the years (1) Figures represent an estimate of total data processed on SOPHiA DDM TM as of December 31, 2023.


© SOPHiA GENETICS 2024 SOPHiA DDM TM connects multimodal data globally to enable the age of data - driven medicine 19 © SOPHiA GENETICS 2024 But we are not alone in this mission 20


© SOPHiA GENETICS 2024 We are committed to achieve profitability over the next 2+ years 21 Backed by a consistent track - record of strong top - and bottom - line improvement 40% YoY IFRS revenue growth in Q3 2023 37% YoY revenue growth constant currency, ex - COVID in Q3 2023 73% Adjusted gross margin in Q3 2023 1 9,300bps YoY adjusted operating margin improvement in Q3 2023 2 42% YoY cash burn improvement with cash balance of $132.8M as of Q3 2023 3 5 quarters out of 7 of continued adj. operating margin improvement from Q1 2022 to Q3 2023 (1) IFRS gross margin in Q3 2023 of 69%. (2) IFRS operating margin improvement in Q3 2023 of 10,200 bps. (3) Cash burn represents the change in cash and cash equivalents during the quarter.

22
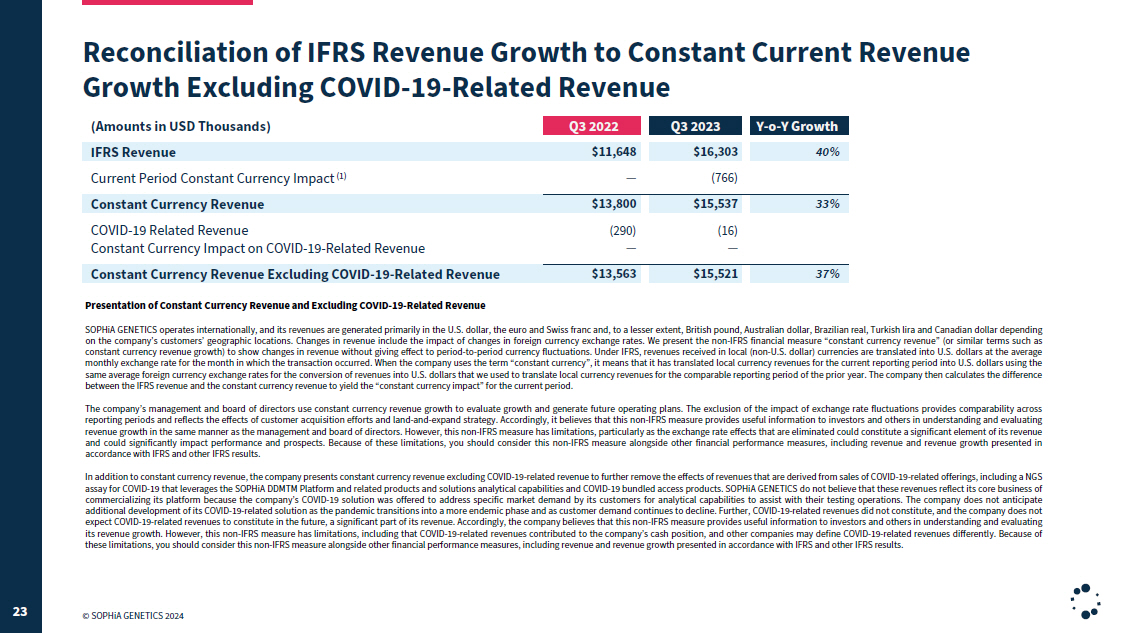
(4) IFRS operating loss of $16.5M (5) IFRS operating loss improvement of $7.1M from $23.6M © SOPHiA GENETICS 2024 Reconciliation of IFRS Revenue Growth to Constant Current Revenue Growth Excluding COVID - 19 - Related Revenue 23 Q3 2022 Q3 2023 Y - o - Y Growth $1 1 , 648 $1 6 , 303 40% — ( 766) $13,800 $15,537 33% ( 290) ( 16) — — $1 3 , 563 $1 5 , 521 37% (Amounts in USD Thousands) IFRS Revenue Current Period Constant Currency Impact (1) Constant Currency Revenue COVID - 19 Related Revenue Constant Currency Impact on COVID - 19 - Related Revenue Constant Currency Revenue Excluding COVID - 19 - Related Revenue Presentation of Constant Currency Revenue and Excluding COVID - 19 - Related Revenue SOPHiA GENETICS operates internationally, and its revenues are generated primarily in the U . S . dollar, the euro and Swiss franc and, to a lesser extent, British pound, Australian dollar, Brazilian real, Turkish lira and Canadian dollar depending on the company’s customers’ geographic locations . Changes in revenue include the impact of changes in foreign currency exchange rates . We present the non - IFRS financial measure “constant currency revenue” (or similar terms such as constant currency revenue growth) to show changes in revenue without giving effect to period - to - period currency fluctuations . Under IFRS, revenues received in local (non - U . S . dollar) currencies are translated into U . S . dollars at the average monthly exchange rate for the month in which the transaction occurred . When the company uses the term “constant currency”, it means that it has translated local currency revenues for the current reporting period into U . S . dollars using the same average foreign currency exchange rates for the conversion of revenues into U . S . dollars that we used to translate local currency revenues for the comparable reporting period of the prior year . The company then calculates the difference between the IFRS revenue and the constant currency revenue to yield the “constant currency impact” for the current period . The company’s management and board of directors use constant currency revenue growth to evaluate growth and generate future operating plans . The exclusion of the impact of exchange rate fluctuations provides comparability across reporting periods and reflects the effects of customer acquisition efforts and land - and - expand strategy . Accordingly, it believes that this non - IFRS measure provides useful information to investors and others in understanding and evaluating revenue growth in the same manner as the management and board of directors . However, this non - IFRS measure has limitations, particularly as the exchange rate effects that are eliminated could constitute a significant element of its revenue and could significantly impact performance and prospects . Because of these limitations, you should consider this non - IFRS measure alongside other financial performance measures, including revenue and revenue growth presented in accordance with IFRS and other IFRS results . In addition to constant currency revenue, the company presents constant currency revenue excluding COVID - 19 - related revenue to further remove the effects of revenues that are derived from sales of COVID - 19 - related offerings, including a NGS assay for COVID - 19 that leverages the SOPHiA DDMTM Platform and related products and solutions analytical capabilities and COVID - 19 bundled access products . SOPHiA GENETICS do not believe that these revenues reflect its core business of commercializing its platform because the company’s COVID - 19 solution was offered to address specific market demand by its customers for analytical capabilities to assist with their testing operations . The company does not anticipate additional development of its COVID - 19 - related solution as the pandemic transitions into a more endemic phase and as customer demand continues to decline . Further, COVID - 19 - related revenues did not constitute, and the company does not expect COVID - 19 - related revenues to constitute in the future, a significant part of its revenue . Accordingly, the company believes that this non - IFRS measure provides useful information to investors and others in understanding and evaluating its revenue growth . However, this non - IFRS measure has limitations, including that COVID - 19 - related revenues contributed to the company’s cash position, and other companies may define COVID - 19 - related revenues differently . Because of these limitations, you should consider this non - IFRS measure alongside other financial performance measures, including revenue and revenue growth presented in accordance with IFRS and other IFRS results .
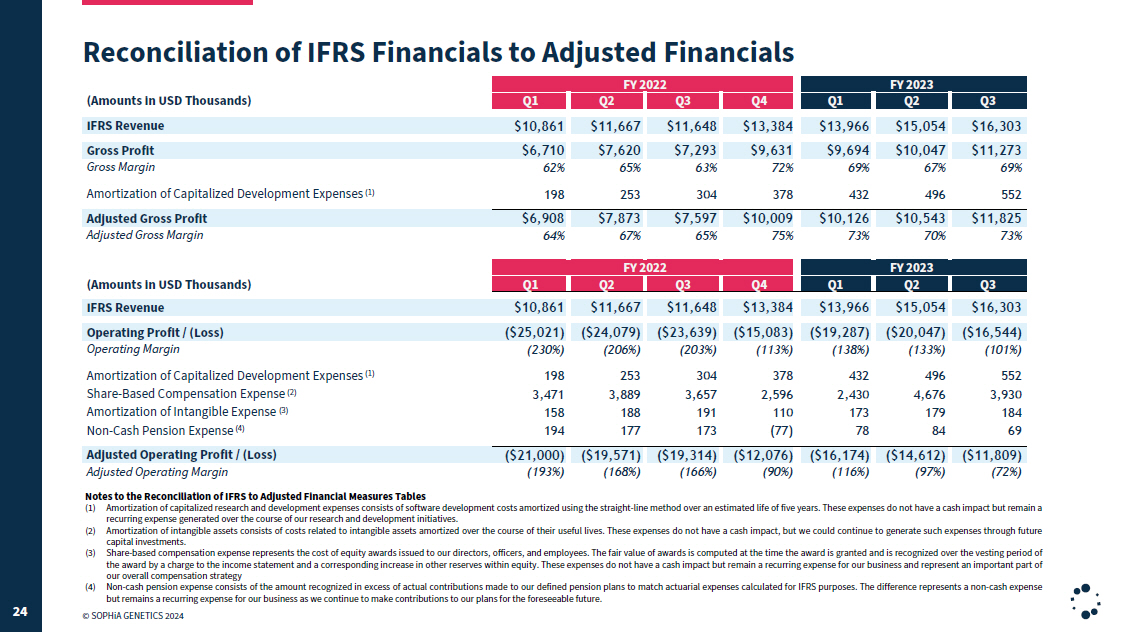
Reconciliation of IFRS Financials to Adjusted Financials 24 FY 2022 FY 2023 Q1 Q2 Q3 Q4 Q1 Q2 Q3 $10, 8 6 1 $11, 6 6 7 $11, 6 4 8 $13, 3 8 4 $13, 9 6 6 $15, 0 5 4 $16, 3 0 3 $6,7 10 62% $7,6 20 65% $7,2 93 63% $9,6 31 72% $9,6 94 69% $10, 0 4 7 67% $11, 2 7 3 69% 198 253 304 378 432 496 552 $6,9 08 $7,8 73 $7,5 97 $10, 0 0 9 $10, 1 2 6 $10, 5 4 3 $11, 8 2 5 64% 67% 65% 75% 73% 70% 73% FY 2022 FY 2023 Q1 Q2 Q3 Q4 Q1 Q2 Q3 $10, 8 6 1 $11, 6 6 7 $11, 6 4 8 $13, 3 8 4 $13, 9 6 6 $15, 0 5 4 $16, 3 0 3 ($25, 021) ($24, 079) ($23, 639) ($15, 083) ($19, 287) ($20, 047) ($16, 544) ( 230%) ( 206%) ( 203%) ( 113%) ( 138%) ( 133%) ( 101%) 198 253 304 378 432 496 552 3 , 471 3 , 889 3 , 657 2 , 596 2 , 430 4 , 676 3 , 930 158 188 191 110 173 179 184 194 177 173 ( 77) 78 84 69 ($21, 00 0) ($19, 57 1) ($19, 314) ($12, 076) ($16, 174) ($14, 612) ($11, 809) ( 193%) ( 168%) ( 166%) ( 90%) ( 116%) ( 97%) ( 72%) (Amounts in USD Thousands) IFRS Revenue Gross Profit Gross Margin Amortization of Capitalized Development Expenses (1) Adjusted Gross Profit Adjusted Gross Margin (Amounts in USD Thousands) IFRS Revenue Operating Profit / (Loss) Operating Margin Amortization of Capitalized Development Expenses (1) Share - Based Compensation Expense (2) Amortization of Intangible Expense (3) Non - Cash Pension Expense (4) Adjusted Operating Profit / (Loss) Adjusted Operating Margin Notes to the Reconciliation of IFRS to Adjusted Financial Measures Tables (1) Amortization of capitalized research and development expenses consists of software development costs amortized using the straight - line method over an estimated life of five years . These expenses do not have a cash impact but remain a recurring expense generated over the course of our research and development initiatives . (2) Amortization of intangible assets consists of costs related to intangible assets amortized over the course of their useful lives . These expenses do not have a cash impact, but we could continue to generate such expenses through future capital investments . (3) Share - based compensation expense represents the cost of equity awards issued to our directors, officers, and employees . The fair value of awards is computed at the time the award is granted and is recognized over the vesting period of the award by a charge to the income statement and a corresponding increase in other reserves within equity . These expenses do not have a cash impact but remain a recurring expense for our business and represent an important part of our overall compensation strategy (4) Non - cash pension expense consists of the amount recognized in excess of actual contributions made to our defined pension plans to match actuarial expenses calculated for IFRS purposes . The difference represents a non - cash expense but remains a recurring expense for our business as we continue to make contributions to our plans for the foreseeable future . © SOPHiA GENETICS 2024