UNITED STATES
SECURITIES AND EXCHANGE COMMISSION
Washington, D.C. 20549
FORM 6-K
REPORT OF FOREIGN PRIVATE ISSUER PURSUANT TO RULE 13a-16 OR 15d-16 UNDER THE SECURITIES EXCHANGE ACT OF 1934
For the month of November 2023
Commission File Number: 001-41635
Lavoro Limited
(Exact name of registrant as specified in its charter)
Av. Dr. Cardoso de Melo, 1450, 4th floor, office
401
São Paulo — SP, 04548-005, Brazil
+55 (11) 4280-0709
(Address of principal executive office)
Indicate by check mark whether the registrant files or will file annual reports under cover of Form 20-F or Form 40-F:
| Form 20-F |
X |
Form 40-F |
TABLE OF CONTENTS
SIGNATURE
Pursuant to the requirements of the Securities Exchange Act of 1934, the registrant has duly caused this report to be signed on its behalf by the undersigned, thereunto duly authorized.
| Lavoro Limited | |||||
| By: | /s/ Ruy Cunha | ||||
| Name: | Ruy Cunha | ||||
| Title: | Chief Executive Officer | ||||
Date: November 1, 2023
Exhibit 99.1

Lavoro Reports Fiscal Fourth Quarter 2023 Earnings Results
| • | Lavoro’s revenue reached $1.8 billion for the FY2023, marking a 24% increase compared to the previous year |
| • | FY2023 gross profit was $332 million, up 34% y/y, with gross margins expanding 140 bps to 18.5% |
| • | Lavoro successfully completed the acquisition of Referência Agroinsumos on July 31, 2023, further expanding its retail presence in the State of Rio Grando do Sul in the South of Brazil. Referência serves over 2,000 farmers, and brings an additional 25 technical sales representatives (RTVs) to the Lavoro family |
| • | On June 30, 2023, Lavoro announced a partnership with Stenon, which will enable us to offer accurate real-time soil analysis to our farmer clients, helping their decision-making and leading to improved agronomic outcomes |
| • | Lavoro provides its FY2024 outlook, expecting consolidated revenue in the range of $2.0 to $2.3 billion, consolidated Inputs revenue in the range of $1.7 to $2.0 billion, and consolidated Adjusted EBITDA in the range of $135 million to $165 million. |
SÃO PAULO – November 1, 2023 (GLOBE NEWSWIRE) — Lavoro Limited (Nasdaq: LVRO; LVROW), the first U.S.-listed pure-play agricultural inputs distributor in Latin America, today announced its financial results for the fiscal fourth quarter, ended on June 30, 2023.
“In recent months, we saw a further worsening in pricing trends in crop protection and fertilizers, as significant global pricing declines were exacerbated by excess channel inventories in Brazil, particularly in herbicides. While we are seeing signs of stabilization of the pricing trends, our expectation is for the retail ag inputs in Brazil to see overall decline of approximately -20% for our fiscal year 2024, led by these pricing headwinds. With that said, our view is that the fundamental long-term secular growth drivers for our Brazil Ag Retail segment have not changed. What we have been witnessing in the past few quarters is simply the normalization of input prices that overshot in ’21-’22 as a result of temporary factors that have now waned, namely the impact of COVID-led plant shutdowns on Chinese agrochemical production, and the effects of the War in Ukraine. We view this as a temporary effect that we expect should not persist beyond the end of this our fiscal year, and should not affect our long-term growth algorithm,” commented Ruy Cunha, CEO of Lavoro.
“Our scale, regional and product diversification, vertical integration with Crop Care, strong balance sheet, M&A capabilities, and ability to invest in technology and new services, sets us apart relative to the rest of industry. We believe we are uniquely positioned to capitalize on the current environment, accelerate our market share gains and improve our financial performance as market conditions normalize,” added Mr. Cunha.
4Q23 Financial Highlights
| • | Consolidated revenue increased by 17% to $265.6 million in 4Q23 compared to the same period in 2022, mainly driven by higher input sales from Brazil Ag Retail1, attributable to (i) increased unit volumes of fertilizers, crop protection and specialties, (ii) growth in corn seeds price and volumes, partly offset by (iii) price declines in crop protection and fertilizer product categories. Once again, Latam Ag Retail revenue was affected by the depreciation of the Colombian Peso, with a -3% y/y decline. On a constant-currency basis, Latam grew 10%. Crop Care segment revenue decreased -21% y/y, driven by phasing effects at Union Agro, though gross profit grew 60% driven by strong performance of our biologicals product line. For FY23, Lavoro consolidated revenue increased by 24% to reach $1.8 billion, with Crop Care being a notable contributor as revenue growth exceeded 90%. |
| • | Gross Profit increased by 27% to $46.9 million in 4Q23, with gross margin expanding by 140bps to 17.6%. This was mainly attributable to (i) positive segment mix shifts, led by Crop Care (ii) improved product mix in our retail distribution, as sales of specialties products as a percentage of Inputs revenue improved by nearly 300bps to 9% in 4Q22, and (iii) strong performance from biologicals, our highest margin product line which grew |
1 Our segments herein have been renamed to Brazil Ag Retail (Brazil Cluster), Latam Ag Retail (LatAm Cluster) and Crop Care (Crop Care Cluster), to be clearer with the region and business function they are performing. There is no change to the scope of their operations.

over 80% versus the prior year quarter. These positive drivers more than offset headwinds from steep price declines in crop protection and fertilizers, which in turn were partially alleviated by a $12 million benefit from planned successful renegotiation with our suppliers. For FY23, gross profit reached $331.9 million, up 34% y/y, with gross margin expanding by 140 bps to 18.5%, owing to both segment and product mix shifts.
| • | Adjusted EBITDA in 4Q23 was $2.4 million, improving by $18.7 million y/y, with positive incremental contribution from all three segments. The key drivers are similar to those outlined above for gross profit, with the addition of the benefit of an improved SG&A expense ratio vs. last year. For FY23, Adjusted EBITDA grew 64% to $149.8 million, and Adjusted EBITDA margin rose 200 bps to 8.3%. Crop Care yet again was a strong contributor, with segment Adjusted EBITDA expanding 280% y/y, resulting in Crop Care now accounting for nearly 19% of total Adjusted EBITDA in FY23, a jump from 8% in the previous year. |
| • | Non-recurring expenses increased by $4.6 million to $6.0 million in 4Q23, due to (i) IPO-related consultancy services expenses throughout fiscal year 2023 recognized as non-recurring in 4Q23 ($3.8 million); (ii) the remainder of a one-time DeSPAC bonus to employees paid in 4Q23 ($0.9 million) and (iii) M&A accounting and tax due diligence expenses ($0.8 million). For FY23, non-recurring items other than our Nasdaq listing expense, increased to $14.3 million, with key drivers being (i) $2.8 million impact from stock-based compensation; (ii) $ 5.8 million of one-time DeSPAC bonus; (iii) $3.8 million from IPO-related consultancy services, and (iv) $5.2 of M&A expenses. |
| • | Financial costs were $11.1 million higher in 4Q23 vs. the prior year, attributable to losses on fair value of commodity forward contracts, and an increase in the benchmark interest rate in Brazil. On a full fiscal year basis, financial results were $76.9 million higher than the previous year, owing to the same drivers |

Summary of 4Q23 and FY23 Results¹
| Key Financial Metrics | 4Q22 | 4Q23 | Chg. % | FY22 | FY23 | Chg. % | ||
| (in millions of US dollars)2 | ||||||||
| Revenue by Segment | 227.8 | 265.5 | 17 % | 1,447.9 | 1,794.9 | 24 % | ||
| Brazil Ag Retail | 149.5 | 197.2 | 32 % | 1,184.2 | 1,502.1 | 27 % | ||
| Latam Ag Retail | 63.7 | 61.8 | -3 % | 220.2 | 233.1 | 6 % | ||
| Crop Care | 13.5 | 10.6 | -21 % | 62.4 | 120.8 | 94 % | ||
| Intercompany3 | 1.1 | (4.1) | (18.9) | (61.1) | ||||
| Revenue by Category | 227.8 | 265.6 | 17 % | 1,448.0 | 1,794.8 | 24 % | ||
| Inputs revenue | 180.7 | 217.0 | 20 % | 1,310.5 | 1,664.6 | 27 % | ||
| Grains revenue | 47.1 | 48.6 | 3 % | 137.5 | 130.2 | -5 % | ||
| Gross Profit | 37.0 | 46.9 | 27 % | 247.5 | 332.0 | 34 % | ||
| Brazil Ag Retail | 21.6 | 26.3 | 22 % | 188.8 | 246.1 | 30 % | ||
| Latam Ag Retail | 10.3 | 9.4 | -9 % | 35.9 | 38.0 | 6 % | ||
| Crop Care | 5.1 | 8.1 | 59 % | 22.7 | 53.8 | 137 % | ||
| Intercompany | – | 3.1 | 0.1 | (5.9) | ||||
| Gross Margin | 16.2 % | 17.7 % | 150 bps | 17.1 % | 18.5 % | 140 bps | ||
| Gross Margin (% of Inputs) | 20.5 % | 21.6 % | 110 bps | 18.9 % | 19.9 % | 100 bps | ||
| SG&A excl. D&A | (59.1) | (55.5) | (166.6) | (205.1) | ||||
| Other operating income (expense) | 4.4 | 5.0 | 10.5 | (53.0) | ||||
| EBITDA | (17.7) | (3.6) | -80 % | 91.4 | 73.9 | -19 % | ||
| (+) Nasdaq listing expenses4 | – | – | – | 61.5 | ||||
| (+) Other non-recurring items | 1.4 | 6.0 | 0.2 | 14.5 | ||||
| Adjusted EBITDA | (16.3) | 2.4 | n.m. | 91.6 | 149.8 | 64 % | ||
| Adjusted EBITDA Margin % | -7.2 % | 0.9 % | 810 bps | 6.3 % | 8.3 % | 200 bps | ||
| Adjusted EBITDA Margin (% of Inputs) | -9.0 % | 1.1 % | 1,010 bps | 7.0 % | 9.0 % | 200 bps | ||
| D&A | (6.9) | (8.1) | (27.3) | (32.4) | ||||
| Finance income (costs) | (17.0) | (28.2) | (42.4) | (119.2) | ||||
| Income taxes, current and deferred | 14.6 | 20.6 | (4.6) | 34.0 | ||||
| Net profit | (27.0) | (19.3) | n.m. | 17.1 | (43.7) | n.m. | ||
| Adjusted net profit | (25.6) | (13.3) | n.m. | 17.3 | 32.3 | 87 % |
1 USD/BRL average period exchange rate used to translate our results to USD throughout this document for illustration purposes: 4.952 for FY4Q23, 5.193 for FY3Q23, 5.280 for FY1H23, 4.924 for FY4Q22, 5.226 for FY3Q22, 5.570 for FY1H22.
2 Represents sales between Crop Care and Brazil Ag Retail.
3 Represents expenses related to the business combination with TPB Acquisition Corp I.

Segment Results for 4Q23 and FY235
Brazil Ag Retail
Segment revenue increased by 45% to $197 million in 4Q23, with strong unit volume growth in crop protection, fertilizer and specialty sales, more than offsetting steep price declines that the industry witnessed over the past few months. Gross margin decreased by 110 bps to 13.3%, owing to these pricing headwinds, partly offset by a previously planned $12 million supplier renegotiation benefit.
| Brazil Ag Retail | 4Q22 | 4Q23 | Chg. % | FY22 | FY23 | Chg. % | ||
| (in millions of US dollars) | ||||||||
| Inputs revenue | 102.7 | 148.7 | 45 % | 1,025.5 | 1,367.9 | 33 % | ||
| Grains revenue | 46.8 | 48.5 | 4 % | 158.8 | 134.1 | -16 % | ||
| Revenue | 149.5 | 197.2 | 32 % | 1,184.3 | 1,502.0 | 27 % | ||
| Gross Profit | 21.6 | 26.3 | 22 % | 188.8 | 246.0 | 30 % | ||
| Gross Margin | 14.4 % | 13.3 % | -110 bps | 15.9 % | 16.4 % | 50 bps | ||
| Gross Margin (% of Inputs) | 21.0 % | 17.7 % | -330 bps | 18.4 % | 18.0 % | -40 bps | ||
| Adjusted EBITDA | (19.3) | (4.0) | n.m. | 69.9 | 111.9 | 60 % | ||
| Adjusted EBITDA Margin | -12.9 % | -2.0 % | 1,090 bps | 5.9 % | 7.5 % | 160 bps | ||
| Adjusted EBITDA Margin (% of Inputs) | -18.8 % | -2.7 % | 1,610 bps | 6.8 % | 8.2 % | 140 bps |
Latam Ag Retail
The segment grew 10% on a constant currency basis (Colombian peso), primarily due to strong sales in specialties and corn seeds, partly offset by headwinds resulting from the removal of Paraquat, a financially relevant herbicide, from the product lineup one of our suppliers.The devaluation of the peso was a -13% y/y negative contributor, with revenue declining -3% on a US dollar basis. Gross Margin contracted by 100 bps in 4Q23, reflecting the deflationary pricing trends in crop protection and fertilizers.
| Latam Ag Retail | 4Q22 | 4Q23 | Chg. % | FY22 | FY23 | Chg. % | ||
| (in millions of US dollars) | ||||||||
| Inputs revenue | 63.3 | 61.7 | -3 % | 207.5 | 223.0 | 7 % | ||
| Grains revenue | 0.4 | 0.1 | -75 % | 12.7 | 10.1 | -20 % | ||
| Revenue | 63.7 | 61.8 | -3 % | 220.2 | 233.1 | 6 % | ||
| Gross Profit | 10.3 | 9.4 | -9 % | 35.9 | 38.0 | 6 % | ||
| Gross Margin | 16.2 % | 15.2 % | -100 bps | 16.3 % | 16.3 % | 0 bps | ||
| Gross Margin (% of Inputs) | 16.3 % | 15.2 % | -110 bps | 17.3 % | 17.0 % | -30 bps | ||
| Adjusted EBITDA | 2.5 | 3.3 | 32 % | 14.4 | 17.4 | 300 % | ||
| Adjusted EBITDA Margin | 3.9 % | 5.3 % | 140 bps | 6.5 % | 7.5 % | 100 bps | ||
| Adjusted EBITDA Margin (% of Inputs) | 3.9 % | 5.3 % | 140 bps | 6.9 % | 7.8 % | 90 bps |
4 USD/BRL average period exchange rate used to translate our results to USD: 4.952 for FY4Q23, 5.193 for FY3Q23, 5.280 for FY1H23, 4.924 for FY4Q22, 5.226 for FY3Q22, 5.570 for FY1H22.

Crop Care
Crop Care segment revenue for 4Q23 saw a -21% decline, resulting from the phasing effects at Union Agro, our specialty fertilizer company, which had some sales pull-forward into 3Q23. Biologicals product sales grew over 80% y/y, partly driven from phasing shift from 3Q23 to 4Q23, as a result of postponement of the timing of biopesticide input purchases by farmers. The strong growth in biologicals, which are the highest gross margin products for Lavoro, led the gross margin expansion to 76.4%, from 37.8% a year ago.
| Crop Care | 4Q22 | 4Q23 | Chg. % | FY22 | FY23 | Chg. % | ||
| (in millions of US dollars) | ||||||||
| Revenue | 13.5 | 10.6 | -21 % | 62.4 | 120.8 | 94 % | ||
| Gross Profit | 5.1 | 8.1 | 22 % | 22.7 | 53.8 | 30 % | ||
| Gross Margin | 37.8 % | 76.4 % | 3,860 bps | 36.4 % | 44.5 % | 810 bps | ||
| Adjusted EBITDA | 0.5 | 1.2 | 140 % | 7.4 | 28.1 | 280 % | ||
| Adjusted EBITDA Margin | 3.7 % | 11.3 % | 760 bps | 11.9 % | 23.3 % | 1,140 bps |
Recent Business and Commercial Updates
Partnership with Stenon
On June 30, 2023, Lavoro announced a partnership with Stenon. Stenon is a step-change evolution in soil chemistry testing, with its FarmLab solution, which is a portable sensor-based devices enabling accurate real-time analysis of Nitrogen and other agronomically relevant soil indicators. With Stenon, as a practical example, our RTVs will be able to provide clients with timely recommendations for nitrogen application across their corn planting area, resulting in improved costs and crop yields. We are planning to sample 100,000 acres in the coming crop season across the state of Parana, where 100 RTVs have been trained and are ready to execute on this service.
Recent M&As Updates
Closed agreements
Referência Agroinsumos
On July 31, Lavoro successfully completed the acquisition of a controlling interest in Referência Agroinsumos. Founded in 2006, Referência has nine distribution locations and more than 80 employees, serving approximately 2,000 customers in the South of Brazil.

Pro forma Financial Information6
| Highlights of Pro Forma Results | 4Q22 | 4Q23 | Chg. % | FY22 | FY23 | Chg. % | ||
| (in millions of US dollars) | ||||||||
| Pro forma Revenue by Segment | 331.8 | 338.8 | 2 % | 1,756.5 | 1,938.4 | 10 % | ||
| Pro forma Gross Profit | 58.3 | 63.0 | 8 % | 306.1 | 359.4 | 17 % | ||
| Pro forma Gross Margin | 17.6 % | 18.6 % | 100 bps | 17.4 % | 18.5 % | 110 bps | ||
| Pro forma Adjusted EBITDA | 4.5 | 13.4 | 298 % | 131.5 | 167.9 | 1% | ||
| Pro forma Adjusted EBITDA Margin % | 1.4 % | 4.0 % | 260 bps | 7.5 % | 8.7 % | 120 bps |
Full Fiscal Year 2024 Consolidated Outlook7
| FY2024 | |||
| Consolidated Financials Outlook | Low | High | |
| (in millions of US dollars) | |||
| Revenue | 2,000 | 2,300 | |
| Inputs revenue | 1,700 | 2,000 | |
| Adjusted EBITDA | 135 | 165 | |
Conference Call Details
The Company will host a conference call and webcast to review its fiscal fourth quarter 2023 results on Wednesday, November 1, 2023, at 8:30 am ET / 9:30 am BRT.
Participant Numbers: 1-877-407-9716 (U.S.), 1-201-493-6779 (International)
The live audio webcast will be accessible in the Events section on the Company's Investor Relations website at https://ir.lavoroagro.com/disclosure-and-documents/events/.
Non-IFRS Financial Measures
This press release contains certain non-IFRS financial measures, including Adjusted EBITDA, Adjusted EBITDA Margin, Pro Forma Adjusted EBITDA and Pro Forma Adjusted EBITDA Margin. A non-IFRS financial measure is generally defined as a numerical measure of historical or future financial performance, financial position, or cash flow that purports to measure financial performance but excludes or includes amounts that would not be so adjusted in the most comparable IFRS measure. The Company believes these non-IFRS financial measures provide meaningful supplemental information as they are used by the Company's management to evaluate the Company's performance, and provide additional information about trends in our operating performance prior to considering the impact of capital structure, depreciation, amortization and taxation on our results, as well as the effects of certain items or events that vary widely among similar companies, and therefore may hamper comparability across periods, although these measures are not explicitly defined under IFRS. Management believes that these measures enhance a reader's understanding of the operating and financial performance of the Company and facilitate a better comparison between fiscal periods. Adjusted EBITDA is defined as profit for the period, adjusted for finance income (cost), net, income
5 Pro Forma financial information is calculated assuming the acquisitions occurred at the beginning of the period presented and the prior year (rather than just the partial “stub period” contribution). Pro Forma Revenues represent fully combined revenues, which include revenues from non-controlling minority shareholders.
6 USD/BRL average period exchange rate used to translate our results to USD: 4.88 for FY1Q24, and 5.02 for FY2Q24 to FY3Q24 taxes current and deferred, depreciation and amortization, M&A expenses that in management’s judgment do not necessarily occur on a regular basis, fair value of inventories sold from acquired companies, minus gain on bargain purchases, to provide further meaningful information to evaluate the Company’s performance.

Adjusted EBITDA Margin is calculated as Adjusted EBITDA as a percentage of revenue for the period. Pro Forma Adjusted EBITDA is defined as pro forma profit for the period, adjusted for pro forma finance income (costs), net, pro forma income taxes current and deferred, pro forma depreciation and amortization, fair value on inventories sold from acquired companies, and M&A expenses that in management’s judgment do not necessarily occur on a regular basis, minus gain on bargain purchases. Pro Forma Adjusted EBITDA Margin is calculated as Pro Forma Adjusted EBITDA as a percentage of pro forma revenue for the period.
The Company does not intend for the non-IFRS financial measures contained in this release to be a substitute for any IFRS financial information. Readers of this press release should use these non-IFRS financial measures only in conjunction with comparable IFRS financial measures. Reconciliations of the non-IFRS financial measures, Adjusted EBITDA, and Pro Forma Adjusted EBITDA, to their most comparable IFRS measures, are provided in the table below.
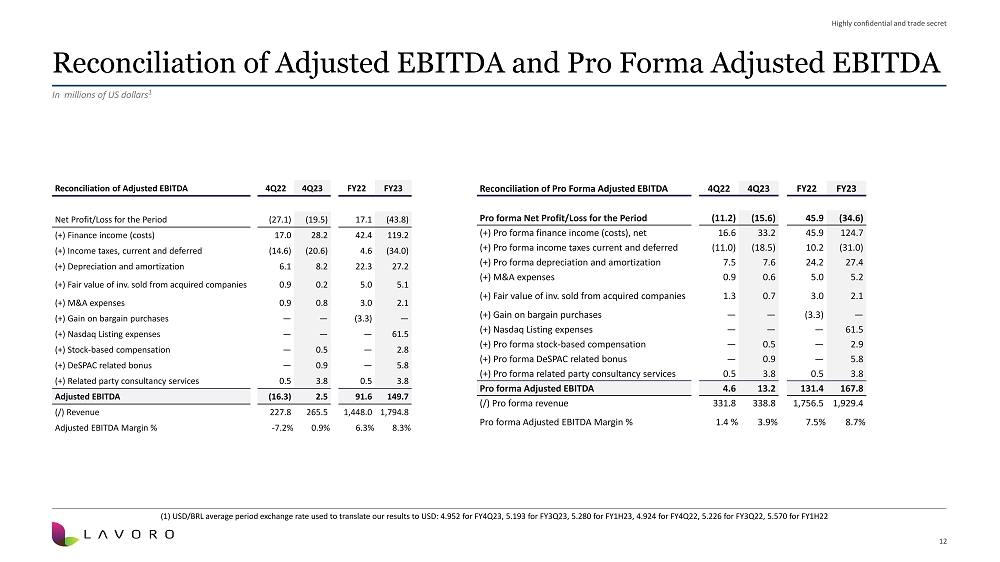
Reconciliation of Adjusted EBITDA and Adjusted EBITDA Pro forma
| Reconciliation of Adjusted EBITDA | 4Q22 | 4Q23 | FY22 | FY23 | ||
| (in millions of US dollars) | ||||||
| Net Profit/Loss for the Period | (27.1) | (19.5) | 17.1 | (43.8) | ||
| (+) Finance income (costs) | 17.0 | 28.2 | 42.4 | 119.2 | ||
| (+) Income taxes, current and deferred | (14.6) | (20.6) | 4.6 | (34.0) | ||
| (+) Depreciation and amortization | 6.1 | 8.2 | 22.3 | 27.2 | ||
| (+) Fair value of inventories sold from acquired companies | 0.9 | 0.2 | 5.0 | 5.1 | ||
| (+) M&A expenses | 0.9 | 0.8 | 3.0 | 2.1 | ||
| (+) Gain on bargain purchases | — | — | (3.3) | — | ||
| (+) Nasdaq Listing expenses | — | — | — | 61.5 | ||
| (+) Stock-based compensation | — | 0.5 | — | 2.8 | ||
| (+) DeSPAC related bonus | — | 0.9 | — | 5.8 | ||
| (+) Related party consultancy services | 0.5 | 3.8 | 0.5 | 3.8 | ||
| Adjusted EBITDA | (16.3) | 2.5 | 91.6 | 149.7 | ||
| (/) Revenue | 227.8 | 265.5 | 1,448.0 | 1,794.8 | ||
| Adjusted EBITDA Margin % | -7.2 % | 0.9 % | 6.3 % | 8.3 % |

| Reconciliation of Pro Forma Adjusted EBITDA | 4Q22 | 4Q23 | FY22 | FY23 | ||
| (in millions of US dollars) | ||||||
| Pro forma Net Profit/Loss for the Period | (11.2) | (15.6) | 45.9 | (34.6) | ||
| (+) Pro forma finance income (costs), net | 16.6 | 33.2 | 45.9 | 124.7 | ||
| (+) Pro forma income taxes current and deferred | (11.0) | (18.5) | 10.2 | (31.0) | ||
| (+) Pro forma depreciation and amortization | 7.5 | 7.6 | 24.2 | 27.4 | ||
| (+) M&A expenses | 0.9 | 0.6 | 5.0 | 5.2 | ||
| (+) Fair value of inventories sold from acquired companies | 1.3 | 0.7 | 3.0 | 2.1 | ||
| (+) Gain on bargain purchases | — | — | (3.3) | — | ||
| (+) Nasdaq Listing expenses | — | — | — | 61.5 | ||
| (+) Pro forma stock-based compensation | — | 0.5 | — | 2.9 | ||
| (+) Pro forma DeSPAC related bonus | — | 0.9 | — | 5.8 | ||
| (+) Pro forma related party consultancy services | 0.5 | 3.8 | 0.5 | 3.8 | ||
| Pro forma Adjusted EBITDA | 4.6 | 13.2 | 131.4 | 167.8 | ||
| (/) Pro forma revenue | 331.8 | 338.8 | 1,756.5 | 1,929.4 | ||
| Pro forma Adjusted EBITDA Margin % | 1.4 % | 3.9 % | 7.5 % | 8.7 % |
Reconciliation of Adjusted Profit (Loss)
| Reconciliation of Adjusted Net Profit | 4Q22 | 4Q23 | FY22 | FY23 | ||
| (in millions of US dollars) | ||||||
| Profit/Loss for the Period | (27.0) | (19.3) | 17.1 | (43.7) | ||
| (+) M&A expenses[8] | 0.9 | 0.8 | 3.0 | 2.1 | ||
| (-) Gain on bargain purchases[9] | — | — | (3.3) | — | ||
| (+) Nasdaq Listing expenses[10] | — | — | — | 61.5 | ||
| (+) Stock Option Plan | — | 0.5 | — | 2.8 | ||
| (+) DeSPAC bonus | — | 0.9 | — | 5.8 | ||
| (+) Related party consultancy services | 0.5 | 3.8 | 0.5 | 3.8 | ||
| Adjusted Net Profit/Loss | (25.6) | (13.3) | 17.3 | 32.3 | ||
| (/) Revenue | 227.8 | 265.5 | 1,448.0 | 1,794.8 | ||
| Adjusted Net Profit/Loss Margin % | -11.2 % | -5.0 % | 1.2 % | 1.8 % |
About Lavoro
Lavoro is Brazil's largest agricultural inputs retailer and a leading producer of agricultural biological products. Lavoro's shares and warrants are listed on the Nasdaq stock exchange under the tickers "LVRO" and "LVROW." Through its comprehensive portfolio of products and services, the company empowers small and medium-size farmers to adopt the latest emerging agricultural technologies and enhance their productivity. Since its founding in 2017, Lavoro has broadened its reach across Latin America, serving 72,000 customers in Brazil, Colombia, and Uruguay, via its team of over 1,000 technical sales representatives (RTVs), its network of over 210 retail locations, and its digital marketplace and solutions. Lavoro's RTVs are local trusted advisors to farmers, regularly meeting them to provide agronomic recommendations throughout the crop cycle to drive optimized outcomes. Learn more about Lavoro at ir.lavoroagro.com.
7 M&A expenses primarily include M&A accounting and tax due diligence expenses.
8 Difference between the fair value of the Union Agro`s net assets and the price paid by the Company, recorded as a gain.
9 Represents expenses related to the business combination with TPB Acquisition Corp I.

Reportable Segments
Lavoro’s reportable segments are the following:
Brazil Cluster (Brazil Ag Retail): comprises companies dedicated to the distribution of agricultural inputs such as crop protection, seeds, fertilizers, and specialty products, in Brazil.
LatAm Cluster (Latam Ag Retail): includes companies dedicated to the distribution of agricultural inputs outside Brazil (currently primarily in Colombia).
Crop Care Cluster (Crop Care): includes companies that produce and import our own portfolio of private label products including specialty products (e.g., biologicals and specialty fertilizers) and off-patent crop protection.
Lavoro’s Fiscal Year
Lavoro follows the crop year, which means that its fiscal year comprises July 1st of each year, until June 30th of the following year. Given this, Lavoro’s quarters have the following format:
1Q – quarter starting on July 1 and ending on September 30.
2Q – quarter starting on October 1 and ending on December 31.
3Q – quarter starting on January 1 and ending on March 31.
4Q – quarter starting on April 1 and ending on June 30.
Definitions
RTVs: refer to Lavoro’s technical sales representatives (Representante Técnico de Vendas), who are linked to its retail stores, and who develop commercial relationships with farmers.
Forward-Looking Statements
The contents of any website mentioned or hyperlinked in this press release are for informational purposes and the contents thereof are not part of or incorporated into this press release.
Certain statements made in this press release are “forward-looking statements” within the meaning of the “safe harbor” provisions of the United States Private Securities Litigation Reform Act of 1995. Forward-looking statements may be identified by the use of words such as “aims,” “estimate,” “plan,” “project,” “forecast,” “intend,” “will,” “expect,” “anticipate,” “believe,” “seek,” “target” or other similar expressions that predict or indicate future events or trends or that are not statements of historical matters. These forward-looking statements include, but are not limited to, statements regarding the expectations regarding the growth of Lavoro’s business and its ability to realize expected results, grow revenue from existing customers, and consummate acquisitions; opportunities, trends, and developments in the agricultural input industry, including with respect to future financial performance in the industry. These forward-looking statements are provided for illustrative purposes only and are not intended to serve as and must not be relied on by any investor as, a guarantee, an assurance, a prediction, or a definitive statement of fact or probability. Actual events and circumstances are difficult or impossible to predict and will differ from assumptions. Many actual events and circumstances are beyond the control of Lavoro.
These forward-looking statements are subject to a number of risks and uncertainties, including but not limited to, the outcome of any legal proceedings that may be instituted against Lavoro related to the business combination agreement or the transaction; the ability to maintain the listing of Lavoro’s securities on Nasdaq; the price of Lavoro’s securities may be volatile due to a variety of factors, including changes in the competitive and regulated industries in which Lavoro operates, variations in operating performance across competitors, changes in laws and regulations affecting Lavoro’s business; Lavoro’s inability to meet or exceed its financial projections and changes in the consolidated capital structure; changes in general economic conditions, including as a result of the COVID-19 pandemic; the ability to implement business plans, forecasts, and other expectations, changes in domestic and foreign business, market, financial, political and legal conditions; the outcome of any potential litigation, government and regulatory proceedings, investigations and inquiries; costs related to the business combination and being a public company and other risks and uncertainties indicated from time to time in the proxy statement/prospectus filed by Lavoro relating to the business combination or in the future, including those under “Risk Factors” therein, and in TPB Acquisition Corp.’s or Lavoro’s other filings with the SEC. If any of these risks materialize or our assumptions prove incorrect, actual results could differ materially from the results implied by these forward-looking statements.

There may be additional risks that Lavoro currently believes are immaterial that could also cause actual results to differ from those contained in the forward-looking statements.
In addition, forward-looking statements reflect Lavoro’s expectations, plans, or forecasts of future events and views as of the date of this press release. Lavoro anticipates that subsequent events and developments will cause Lavoro’s assessments to change. However, while Lavoro may elect to update these forward-looking statements at some point in the future, Lavoro specifically disclaims any obligation to do so. These forward-looking statements should not be relied upon as representing Lavoro’s assessments as of any date subsequent to the date of this press release. Accordingly, undue reliance should not be placed upon the forward-looking statements.
Contact
Julian Garrido
julian.garrido@lavoroagro.com
Tigran Karapetian
tigran.karapetian@lavoroagro.com
Fernanda Rosa
fernanda.rosa@lavoroagro.com
Exhibit 99.2

4Q23 and FY23 Earnings Presentation November 1, 2023

2 Highly confidential and trade secret Disclaimer The contents of any website mentioned or hyperlinked in this presentation are for informational purposes and the contents thereof are not part of or incorporated into this presentation . Certain statements made in this presentation are “forward - looking statements” within the meaning of the “safe harbor” provisions of the United States Private Securities Litigation Reform Act of 1995 . Forward - looking statements may be identified by the use of words such as “aims,” “estimate,” “plan,” “project,” “forecast,” “intend,” “will,” “expect,” “anticipate,” “believe,” “seek,” “target” or other similar expressions that predict or indicate future events or trends or that are not statements of historical matters . These forward - looking statements include, but are not limited to, statements regarding the expectations regarding the growth of Lavoro's business and its ability to realize expected results, grow revenue from existing customers, and consummate acquisitions ; opportunities, trends, and developments in the agricultural input industry, including with respect to future financial performance in the industry . These forward - looking statements are provided for illustrative purposes only and are not intended to serve as and must not be relied on by any investor as, a guarantee, an assurance, a prediction, or a definitive statement of fact or probability . Actual events and circumstances are difficult or impossible to predict and will differ from assumptions . Many actual events and circumstances are beyond the control of Lavoro . These forward - looking statements are subject to a number of risks and uncertainties, including but not limited to, the outcome of any legal proceedings that may be instituted against Lavoro related to the business combination agreement or the transaction ; the ability to maintain the listing of Lavoro's securities on Nasdaq ; the price of Lavoro's securities may be volatile due to a variety of factors, including changes in the competitive and regulated industries in which Lavoro operates, variations in operating performance across competitors, changes in laws and regulations affecting Lavoro's business ; Lavoro's inability to meet or exceed its financial projections and changes in the consolidated capital structure ; changes in general economic conditions, including as a result of the COVID - 19 pandemic ; the ability to implement business plans, forecasts, and other expectations, changes in domestic and foreign business, market, financial, political and legal conditions ; the outcome of any potential litigation, government and regulatory proceedings, investigations and inquiries ; costs related to the business combination and being a public company and other risks and uncertainties indicated from time to time in the proxy statement/prospectus filed by Lavoro relating to the business combination or in the future, including those under “Risk Factors” therein, and in Lavoro's other filings with the SEC . If any of these risks materialize or our assumptions prove incorrect, actual results could differ materially from the results implied by these forward - looking statements . There may be additional risks that Lavoro currently believes are immaterial that could also cause actual results to differ from those contained in the forward - looking statements . In addition, forward - looking statements reflect Lavoro's expectations, plans, or forecasts of future events and views as of the date of this presentation . Lavoro anticipates that subsequent events and developments will cause Lavoro's assessments to change . However, while Lavoro may elect to update these forward - looking statements at some point in the future, Lavoro specifically disclaims any obligation to do so . These forward - looking statements should not be relied upon as representing Lavoro's assessments as of any date subsequent to the date of this presentation . Accordingly, undue reliance should not be placed upon the forward - looking statements . We have prepared this presentation solely for informational purposes . The information in this presentation does not constitute or form part of, and should not be construed as, an offer or invitation to subscribe for, underwrite or otherwise acquire, any of our securities or securities of our subsidiaries or affiliates, not should it or any part of it form the basis of, or be relied on, in connection with any contract to purchase or subscribe for any of our securities or securities of any of our subsidiaries or affiliates, nor shall it or any part of it form the basis of, or be relied on, in connection with any contract or commitment whatsoever . This presentation also includes certain non - IFRS financial information . We believe that such information is meaningful and useful in understanding the activities and business metrics of our operations . We also believe that these non - IFRS financial measures reflect an additional way of viewing aspects of our business that, when viewed with our International Financial Reporting Standards (“IFRS”) results, as issued by the International Accounting Standards Board, provide a more complete understanding of factors and trends affecting our business . Further, investors regularly rely on non - IFRS financial measures to assess operating performance and such measures may highlight trends in our business that may not otherwise be apparent when relying on financial measures calculated in accordance with IFRS . We also believe that non - IFRS financial measures are frequently used by securities analysts, investors and other interested parties in the evaluation of public companies in our industry, many of which present these measures when reporting their results . The non - IFRS financial information is presented for informational purposes and to enhance understanding of the IFRS financial statements . The non - IFRS measures should be considered in addition to results prepared in accordance with IFRS, but not as a substitute for, or superior to, IFRS results . As other companies may determine or calculate this non - IFRS financial information differently, the usefulness of these measures for comparative purposes is limited . A reconciliation of such non - IFRS financial measures to the nearest IFRS measure is included in this presentation .
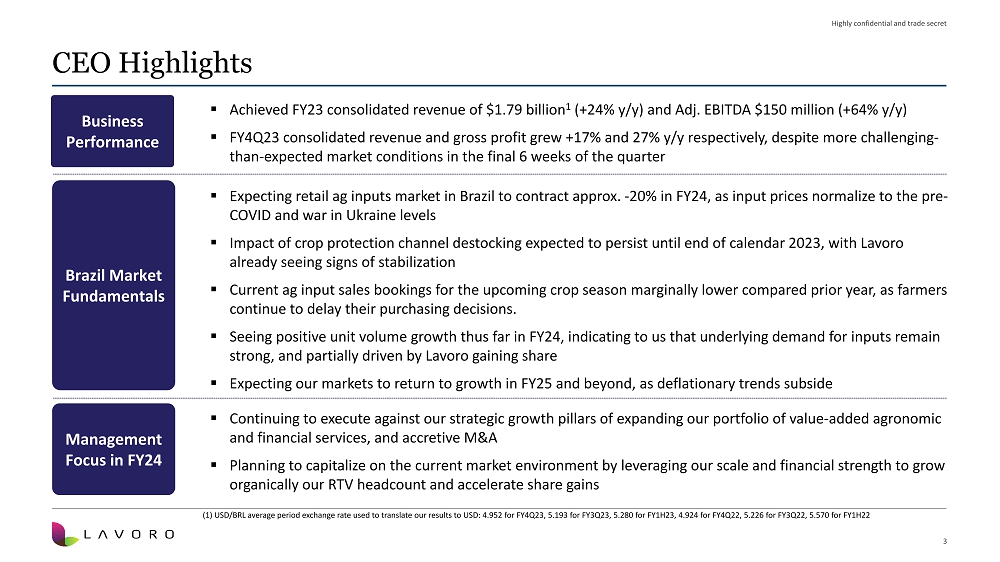
3 Highly confidential and trade secret Brazil Market Fundamentals ▪ Expecting retail ag inputs market in Brazil to contract approx. - 20% in FY24, as input prices normalize to the pre - COVID and war in Ukraine levels ▪ Impact of crop protection channel destocking expected to persist until end of calendar 2023, with Lavoro already seeing signs of stabilization ▪ Current ag input sales bookings for the upcoming crop season marginally lower compared prior year, as farmers continue to delay their purchasing decisions. ▪ Seeing positive unit volume growth thus far in FY24, indicating to us that underlying demand for inputs remain strong, and partially driven by Lavoro gaining share ▪ Expecting our markets to return to growth in FY25 and beyond, as deflationary trends subside Business Performance ▪ Achieved FY23 consolidated revenue of $1.79 billion 1 (+24% y/y) and Adj. EBITDA $150 million (+64% y/y) ▪ FY4Q23 consolidated revenue and gross profit grew +17% and 27% y/y respectively, despite more challenging - than - expected market conditions in the final 6 weeks of the quarter Management Focus in FY24 CEO Highlights ( 1 ) USD/BRL average period exchange rate used to translate our results to USD : 4 . 952 for FY 4 Q 23 , 5 . 193 for FY 3 Q 23 , 5 . 280 for FY 1 H 23 , 4 . 924 for FY 4 Q 22 , 5 . 226 for FY 3 Q 22 , 5 .

570 for FY 1 H 22 ▪ Continuing to execute against our strategic growth pillars of expanding our portfolio of value - added agronomic and financial services, and accretive M&A ▪ Planning to capitalize on the current market environment by leveraging our scale and financial strength to grow organically our RTV headcount and accelerate share gains 4 Highly confidential and trade secret 4Q23 Financial Performance In millions of US dollars 1 Note: Intercompany results represent sales between Crop Care and Brazil Ag Retail segments (1) USD/BRL average period exchange rate used to translate our results to USD: 4.952 for FY4Q23, 4.924 for FY4Q22 180.7 217.0 47.1 48.6 4Q22 4Q23 227.8 265.5 +17% Inputs Grains 21.6 26.3 10.3 9.4 5.1 8.1 3.1 4Q22 4Q23 37.0 46.9 +27% 3.3 - 19.3 - 4.0 2.5 0.5 4Q22 1.2 1.9 4Q23 - 16.3 2.4 149.5 197.2 63.7 61.8 13.5 1.1 4Q22 10.6 - 4.1 4Q23 227.8 265.5 +17% Intercompany / Corporate Crop Care Latam Ag Retail Brazil Ag Retail Revenue Gross Profit Adjusted EBITDA As % of Inputs revenue 20.5% 21.6% Highlights ▪ Impact from crop protection channel destocking led to more challenging - than - expected market conditions in the final 6 weeks of the quarter ▪ In spite of this, Lavoro gross profit growth of +27% y/y, led by seed and specialty sales growth, high double - digit growth in biologicals, and the $12 million benefit from agrochemical supplier renegotiations ▪ Gross Margins expanded due to segment and product mix improvements, partially offset by the deflationary impact in agrochemicals and fertilizers on our distribution margins ▪ Adj.
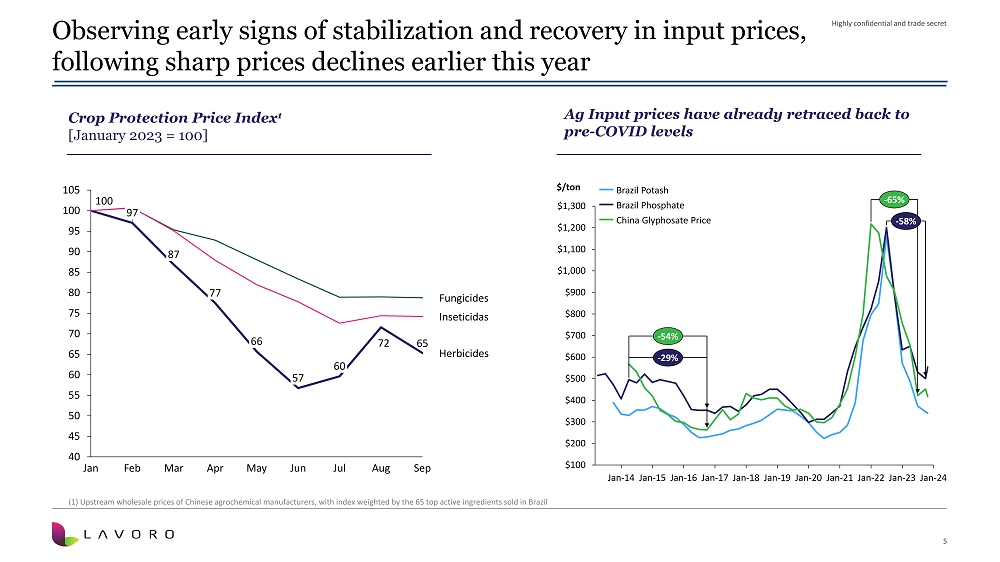
EBITDA also benefited from $4 million y/y decline in operating expenses, driven by overhead savings initiatives 5 Highly confidential and trade secret Ag Input prices have already retraced back to pre - COVID levels Crop Protection Price Index 1 [January 2023 = 100] 100 72 65 40 45 50 55 60 65 70 75 80 85 90 95 100 105 Jan 97 Feb 87 Mar 77 Apr 66 May 57 Jun 60 Jul Aug Sep Herbicides Fungicides Inseticidas $100 $200 $300 $400 $500 $600 $700 $800 $900 $1,000 $1,100 $1,200 $1,300 Jan - 16 Jan - 17 Jan - 18 Jan - 19 Jan - 20 Jan - 21 Jan - 22 Jan - 23 Jan - 14 Jan - 15 Jan - 24 $/ton - 54% - 29% - 65% - 58% Brazil Potash Brazil Phosphate China Glyphosate Price Observing early signs of stabilization and recovery in input prices, following sharp prices declines earlier this year ( 1 ) Upstream wholesale prices of Chinese agrochemical manufacturers, with index weighted by the 65 top active ingredients sold in Brazil 6 Highly confidential and trade secret $0 $500 $1,000 $1,500 $2,000 Crop Year USD / ha 11/12 12/13 13/14 14/15 15/16 16/17 17/18 18/19 19/20 20/21 21/22 22/23 23/24 24/25 Ø $ 628 - 40% - 43% Brazilian farmer profitability remains high Note : Lavoro analysis based on data from AgroConsult Mato Grosso (North) Parana (West) Goias (West) Minas Gerais (Northwest) Average of 5 major states Forecast 37% 31% 26% 31% 31% 34% 45% 51% 28% 30% Crop Year 11/12 12/13 13/14 14/15 15/16 25% 16/17 17/18 30% 18/19 19/20 20/21 43% 21/22 25% 22/23 23/24 24/25 Farmer Operating Margins (Avg.


of 5 major states) Brazil farmer profitability decline of similar magnitude as 2012 - 2014, albeit from a higher base such that we are back to 10 - year average Farmer profit margins hover around 25%, higher than most regions of the world, and forecasted by ag consultancies to improve this Crop Year ‘23/’24 Forecast 7 Highly confidential and trade secret Financial Outlook for Fiscal Year 2024 Note : USD/BRL average period exchange rate used to translate our results to USD : 4 . 88 for FY 1 Q 24 , and 5 . 02 for FY 2 Q 24 to FY 3 Q 24 FY2024 Consolidated Financials Outlook Low High (in millions of US dollars) Revenue 2,000 2,300 Inputs revenue 1,700 2,000 Adjusted EBITDA 135 165 ▪ We anticipate 40 - 50% of our FY24 Adjusted EBITDA be delivered in 2H ▪ Expect 1Q results to be low point for the year for Adjusted EBITDA ▪ Meaningful deviaition from seasonality from patterns seen in previous years is driven by: ▪ phasing effect of Crop Care and Specialty sales shifted from 1Q to 2Q - 4Q ▪ Change in farmer purchasing patterns ▪ And anticipation for improved crop protection margins in 2H as the effects from destocking of agrochemicals dissipate 9 Highly confidential and trade secret FY23 Financial Performance In millions of US dollars 1 Note: Intercompany results represent sales between Crop Care and Brazil Ag Retail segments (1) USD/BRL average period exchange rate used to translate our results to USD: 4.952 for FY4Q23, 5.193 for FY3Q23, 5.280 for FY1H 23, 4.924 for FY4Q22, 5.226 for FY3Q22, 5.570 for FY1H22 1,310 1,665 138 130 FY22 FY23 1,448 1,795 +24% Inputs Grains 188.8 246.0 35.9 37.9 22.7 53.8 FY22 - 5.9 FY23 247.5 331.9 +34% 69.9 111.9 14.4 17.4 7.3 28.1 - 7.7 FY22 FY23 91.6 149.8 +64% 1,184 1,502 220 233 121 62 - 19 FY22 - 61 FY23 1,448 1,795 +24% Intercompany / Corporate² Crop Care Latam Ag Retail Brazil Ag Retail As % of Inputs revenue 18.9% 19.9% 6.3% 8.3% Revenue Gross Profit Adjusted EBITDA

Appendix


10 Highly confidential and trade secret Summary of Financial Results for 4Q23 and FY23 ( 1 ) USD/BRL average period exchange rate used to translate our results to USD : 4 . 952 for FY 4 Q 23 , 5 . 193 for FY 3 Q 23 , 5 . 280 for FY 1 H 23 , 4 . 924 for FY 4 Q 22 , 5 . 226 for FY 3 Q 22 , 5 . 570 for FY 1 H 22 Key Financial Metrics 4Q22 4Q23 Chg. % FY22 FY23 Chg. % Revenue by Segment 227.8 265.5 17 % 1,447.9 1,794.9 24 % Brazil Ag Retail 149.5 197.2 32 % 1,184.2 1,502.1 27 % Latam Ag Retail 63.7 61.8 - 3 % 220.2 233.1 6 % Crop Care 13.5 10.6 - 21 % 62.4 120.8 94 % Intercompany 1.1 (4.1) (18.9) (61.1) Revenue by Category 227.8 265.6 17 % 1,448.0 1,794.8 24 % Inputs revenue 180.7 217.0 20 % 1,310.5 1,664.6 27 % Grains revenue 47.1 48.6 3 % 137.5 130.2 - 5 % Gross Profit 37.0 46.9 27 % 247.5 332.0 34 % Brazil Ag Retail 21.6 26.3 22 % 188.8 246.1 30 % Latam Ag Retail 10.3 9.4 - 9 % 35.9 38.0 6 % Crop Care 5.1 8.1 59 % 22.7 53.8 137 % Intercompany – 3.1 0.1 (5.9) Gross Margin 16.2 % 17.7% 150 bps 17.1 % 18.5 % 140 bps Gross Margin (% of Inputs) 20.5 % 21.6% 110 bps 18.9 % 19.9 % 100 bps SG&A excl. D&A (59.1) (55.5) (166.6) (205.1) Other operating income (expense) 4.4 5.0 10.5 (53.0) EBITDA (17.7) (3.6) - 80 % 91.4 73.9 - 19 % (+) Nasdaq listing expenses – – – 61.5 (+) Other non - recurring items 1.4 6.0 0.2 14.5 Adjusted EBITDA (16.3) 2.4 n.m. 91.6 149.8 64 % Adjusted EBITDA Margin % - 7.2 % 0.9 % 810 bps 6.3 % 8.3 % 200 bps Adjusted EBITDA Margin (% of Inputs) - 9.0 % 1.1 % 1,010 bps 7.0 % 9.0 % 200 bps D&A (6.9) (8.1) (27.3) (32.4) Finance income (costs) (17.0) (28.2) (42.4) (119.2) Income taxes, current and deferred 14.6 20.6 (4.6) 34.0 Net profit (27.0) (19.3) n.m. 17.1 (43.7) n.m. Adjusted net profit (25.6) (13.3) n.m. 17.3 32.3 87 % In millions of US dollars 1 11 Highly confidential and trade secret Pro Forma Financial Results 1 Highlights of Pro Forma Results 4Q22 4Q23 Chg.
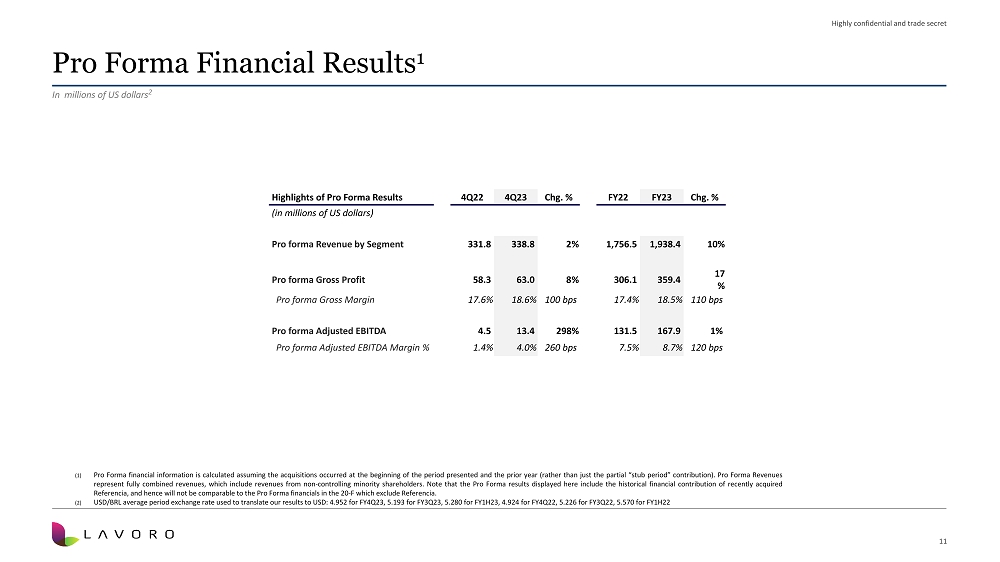
% FY22 FY23 Chg. % (in millions of US dollars) Pro forma Revenue by Segment 331.8 338.8 2 % 1,756.5 1,938.4 10% Pro forma Gross Profit 58.3 63.0 8 % 306.1 359.4 17 % Pro forma Gross Margin 17.6% 18.6% 100 bps 17.4% 18.5% 110 bps Pro forma Adjusted EBITDA 4.5 13.4 298% 131.5 167.9 1% Pro forma Adjusted EBITDA Margin % 1.4% 4.0% 260 bps 7.5% 8.7% 120 bps (1) Pro Forma financial information is calculated assuming the acquisitions occurred at the beginning of the period presented and the prior year (rather than just the partial “stub period” contribution) . Pro Forma Revenues represent fully combined revenues, which include revenues from non - controlling minority shareholders . Note that the Pro Forma results displayed here include the historical financial contribution of recently acquired Referencia , and hence will not be comparable to the Pro Forma financials in the 20 - F which exclude Referencia . (2) USD/BRL average period exchange rate used to translate our results to USD : 4 . 952 for FY 4 Q 23 , 5 . 193 for FY 3 Q 23 , 5 . 280 for FY 1 H 23 , 4 . 924 for FY 4 Q 22 , 5 . 226 for FY 3 Q 22 , 5 .
570 for FY 1 H 22 In millions of US dollars 2 12 Highly confidential and trade secret Reconciliation of Adjusted EBITDA and Pro Forma Adjusted EBITDA Reconciliation of Adjusted EBITDA 4Q22 4Q23 FY22 FY23 Net Profit/Loss for the Period (27.1) (19.5) 17.1 (43.8) (+) Finance income (costs) 17.0 28.2 42.4 119.2 (+) Income taxes, current and deferred (14.6) (20.6) 4.6 (34.0) (+) Depreciation and amortization 6.1 8.2 22.3 27.2 (+) Fair value of inv. sold from acquired companies 0.9 0.2 5.0 5.1 (+) M&A expenses 0.9 0.8 3.0 2.1 (+) Gain on bargain purchases — — (3.3) — (+) Nasdaq Listing expenses — — — 61.5 (+) Stock - based compensation — 0.5 — 2.8 (+) DeSPAC related bonus — 0.9 — 5.8 (+) Related party consultancy services 0.5 3.8 0.5 3.8 Adjusted EBITDA (16.3) 2.5 91.6 149.7 (/) Revenue 227.8 265.5 1,448.0 1,794.8 Adjusted EBITDA Margin % - 7.2% 0.9% 6.3% 8.3% Reconciliation of Pro Forma Adjusted EBITDA 4Q22 4Q23 FY22 FY23 Pro forma Net Profit/Loss for the Period (11.2) (15.6) 45.9 (34.6) (+) Pro forma finance income (costs), net 16.6 33.2 45.9 124.7 (+) Pro forma income taxes current and deferred (11.0) (18.5) 10.2 (31.0) (+) Pro forma depreciation and amortization 7.5 7.6 24.2 27.4 (+) M&A expenses 0.9 0.6 5.0 5.2 (+) Fair value of inv. sold from acquired companies 1.3 0.7 3.0 2.1 (+) Gain on bargain purchases — — (3.3) — (+) Nasdaq Listing expenses — — — 61.5 (+) Pro forma stock - based compensation — 0.5 — 2.9 (+) Pro forma DeSPAC related bonus — 0.9 — 5.8 (+) Pro forma related party consultancy services 0.5 3.8 0.5 3.8 Pro forma Adjusted EBITDA 4.6 13.2 131.4 167.8 (/) Pro forma revenue 331.8 338.8 1,756.5 1,929.4 Pro forma Adjusted EBITDA Margin % 1.4 % 3.9% 7.5% 8.7% ( 1 ) USD/BRL average period exchange rate used to translate our results to USD : 4 . 952 for FY 4 Q 23 , 5 . 193 for FY 3 Q 23 , 5 . 280 for FY 1 H 23 , 4 . 924 for FY 4 Q 22 , 5 . 226 for FY 3 Q 22 , 5 .
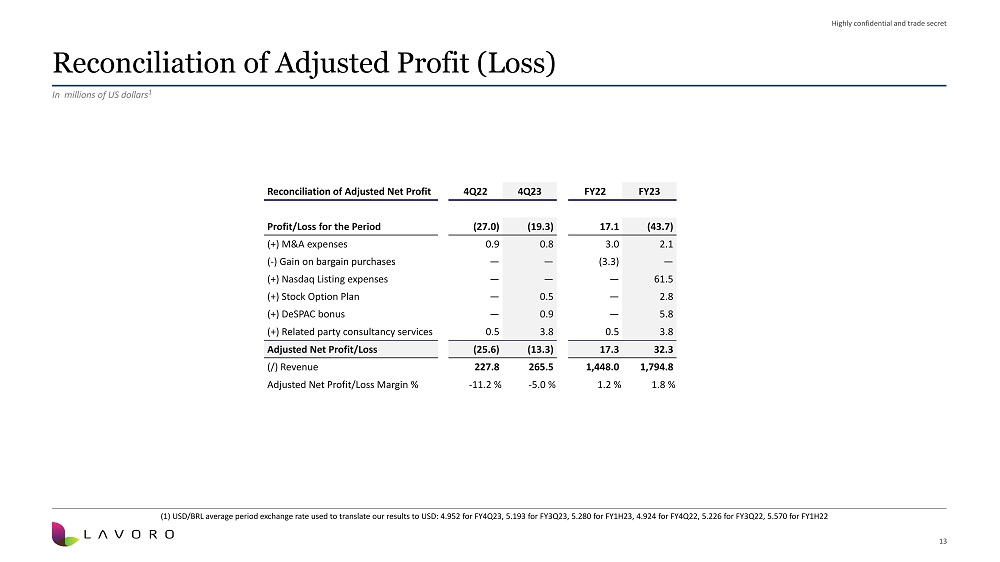
570 for FY 1 H 22 In millions of US dollars 1 13 Highly confidential and trade secret Reconciliation of Adjusted Profit (Loss) Reconciliation of Adjusted Net Profit 4Q22 4Q23 FY22 FY23 Profit/Loss for the Period (27.0) (19.3) 17.1 (43.7) (+) M&A expenses 0.9 0.8 3.0 2.1 ( - ) Gain on bargain purchases — — (3.3) — (+) Nasdaq Listing expenses — — — 61.5 (+) Stock Option Plan — 0.5 — 2.8 (+) DeSPAC bonus — 0.9 — 5.8 (+) Related party consultancy services 0.5 3.8 0.5 3.8 Adjusted Net Profit/Loss (25.6) (13.3) 17.3 32.3 (/) Revenue 227.8 265.5 1,448.0 1,794.8 Adjusted Net Profit/Loss Margin % - 11.2 % - 5.0 % 1.2 % 1.8 % ( 1 ) USD/BRL average period exchange rate used to translate our results to USD : 4 . 952 for FY 4 Q 23 , 5 . 193 for FY 3 Q 23 , 5 . 280 for FY 1 H 23 , 4 . 924 for FY 4 Q 22 , 5 . 226 for FY 3 Q 22 , 5 . 570 for FY 1 H 22 In millions of US dollars 1
Exhibit 99.3

Content
Report of Independent Registered Public Accounting Firm
To the Shareholders and the Board of Directors of
Lavoro Limited
Opinion on the Financial Statements
We have audited the accompanying consolidated statement of financial position of Lavoro Limited (Lavoro or the Company) as of June 30, 2023 and 2022, the related consolidated statement of profit or loss, comprehensive income or loss, changes in equity and cash flows for each of the three years in the period ended June 30, 2023, and the related notes (collectively referred to as the “consolidated financial statements”). In our opinion, the consolidated financial statements present fairly, in all material respects, the financial position of the Company at June 30, 2023 and 2022, and the results of its operations and its cash flows for each of the three years in the period ended June 30, 2023, in conformity with International Financial Reporting Standards (IFRS), as issued by the International Accounting Standards Board (IASB).
Basis for Opinion
These financial statements are the responsibility of the Company's management. Our responsibility is to express an opinion on the Company’s financial statements based on our audits. We are a public accounting firm registered with the Public Company Accounting Oversight Board (United States) (PCAOB) and are required to be independent with respect to the Company in accordance with the U.S. federal securities laws and the applicable rules and regulations of the Securities and Exchange Commission and the PCAOB.
We conducted our audits in accordance with the standards of the PCAOB. Those standards require that we plan and perform the audit to obtain reasonable assurance about whether the financial statements are free of material misstatement, whether due to error or fraud. The Company is not required to have, nor were we engaged to perform, an audit of its internal control over financial reporting. As part of our audits we are required to obtain an understanding of internal control over financial reporting but not for the purpose of expressing an opinion on the effectiveness of the Company's internal control over financial reporting. Accordingly, we express no such opinion.
Our audits included performing procedures to assess the risks of material misstatement of the financial statements, whether due to error or fraud, and performing procedures that respond to those risks. Such procedures included examining, on a test basis, evidence regarding the amounts and disclosures in the financial statements. Our audits also included evaluating the accounting principles used and significant estimates made by management, as well as evaluating the overall presentation of the financial statements. We believe that our audits provide a reasonable basis for our opinion.
Critical Audit Matters
The critical audit matters communicated below are matters arising from the current period audit of the financial statements that were communicated or required to be communicated to the audit committee and that: (1) relate to accounts or disclosures that are material to the financial statements and (2) involved our especially challenging, subjective or complex judgments. The communication of critical audit matters does not alter in any way our opinion on the consolidated financial statements, taken as a whole, and we are not, by communicating the critical audit matters below, providing separate opinions on the critical audit matters or on the accounts or disclosures to which they relate.
SPAC Transaction
Description of the Matter
As discussed in Notes 1(a) and 22 to the consolidated financial statements, the Company consummated on February 28, 2023, a corporate reorganization as a result of the SPAC Transaction between Lavoro and TPB Acquisition Corp. The transaction was accounted for as a capital reorganization in accordance with IFRS 2, Share-based Payment, being TPB Acquisition Corp. identified as the “acquired” company and Lavoro as the accounting “acquirer”. As a result, on the date the corporate reorganization was consummated Lavoro received assets and assumed liabilities to certain of its shareholders of TPB Acquisition Corp. The amount of R$319,554 thousand representing the excess of fair value of Lavoro’s ordinary shares issued over the fair value of TPB Acquisition Corp identifiable net assets acquired represents a compensation for the service of a stock exchange listing for its shares and was registered in the statement of profit and loss as listing expenses incurred.
Auditing this transaction was specially challenging due to the complexity of the transaction in determining the accounting acquirer and assess it as a corporate reorganization, the significant amounts involved in the determination of the value of the listing expenses, including the Monte Carlo simulation used by management to determine the fair value of equity instruments, and accounting treatment of the financial instruments related to this transaction.
How We Addressed the Matter in Our Audit
Our audit procedures included, among others, assessing the terms of the agreements related to the SPAC transaction, assessing management`s evaluation for determining the accounting acquirer, assessing the classification and valuation of financial instruments such as warrants and forward purchase agreement and the Company's calculations of listing expense. We also involved our valuation specialists to assist in evaluating the Company's use of a Monte Carlo simulation for valuing the vesting and unvested founder shares.
We also evaluated the corresponding disclosures in Notes 1(a) and 22.
Goodwill impairment test
Description of the Matter
As of June 30, 2023, the carrying amount of goodwill in the Company’s statement of financial position is R$546,665 thousand. As discussed in Note 16 to the consolidated financial statements, the Company performs goodwill impairment testing at the cash generating unit (CGU) level annually to assess whether there is an indicator of impairment.
Auditing the Company’s annual goodwill impairment test was complex and highly judgmental due to the significant estimation required to determine the value in use of the CGUs utilizing a discounted cash flows model. In particular, the value in use estimate was sensitive to significant assumptions, such as changes in the revenue growth rate, operating margin and discount rate, which are affected by expectations about future market or economic conditions and those related to sales of each of the Company’s CGUs.
How We Addressed the Matter in Our Audit
We evaluated management’s assumptions by performing audit procedures that included, among others, comparing the significant assumptions used by management to current market and economic trends and evaluated whether changes to the Company’s assumptions would affect the value in use. We assessed the historical accuracy of management’s estimates and performed sensitivity analyses of significant assumptions, such as revenue growth rate and discount rate, to evaluate the changes in the value in use of the cash generating units that would result from changes in the assumptions. We also involved our valuation specialists in assessing valuation methodology used by the Company, to assist in testing the discount rate used and to recalculate the discounted cash flows.
We also assessed the adequacy of the related disclosures in Note 16.
/s/ ERNST & YOUNG Auditores Independentes S/S Ltda.
ERNST & YOUNG
Auditores Independentes S/S Ltda.
We have served as the Company's auditor since 2020. São Paulo, Brazil
October 31, 2023
|
Consolidated statement of financial position |

|
|
As of June 30, 2023 and 2022 (In thousands of Brazilian reais - R$, except if otherwise indicated) |
| Notes | 2023 | 2022 | ||||
| Assets | ||||||
| Current assets | ||||||
| Cash equivalents | 5 | 564,294 | 254,413 | |||
| Trade receivables | 6 | 2,667,057 | 1,794,602 | |||
| Inventories | 9 | 1,868,204 | 1,749,041 | |||
| Taxes recoverable | 10 | 57,001 | 93,725 | |||
| Derivative financial instruments | 8 | 40,410 | 7,677 | |||
| Commodity forward contracts | 11 | 114,861 | 32,800 | |||
| Advances to suppliers | 12 | 192,119 | 383,257 | |||
| Other assets | 32,701 | 60,165 | ||||
| Total current assets | 5,536,646 | 4,375,680 | ||||
| Non-current assets | ||||||
| Restricted cash | 22 | 139,202 | 1,344 | |||
| Trade receivables | 6 | 41,483 | 39,751 | |||
| Other assets | 8,390 | 2,473 | ||||
| Judicial deposits | 8,820 | 3,887 | ||||
| Right-of-use assets | 13 | 173,679 | 140,179 | |||
| Taxes recoverable | 10 | 282,903 | 50,937 | |||
| Deferred tax assets | 23 | 329,082 | 200,986 | |||
| Property, plant and equipment | 14 | 196,588 | 146,205 | |||
| Intangible assets | 15 | 807,192 | 724,321 | |||
| Total non-current assets | 1,987,339 | 1,310,083 | ||||
| Total assets | 7,523,984 | 5,685,763 |
The accompanying notes are an integral part of the consolidated financial statements.

|
|
|
|
|
As of June 30, 2023 and 2022 (In thousands of Brazilian reais - R$, except if otherwise indicated) |
| Notes | 2023 | 2022 | ||||
| Liabilities | ||||||
| Current liabilities | ||||||
| Trade payables | 17 | 2,575,701 | 2,301,700 | |||
| Trade payables – Supplier finance | 17(c) | 26,157 | - | |||
| Lease liabilities | 13 | 85,865 | 69,226 | |||
| Borrowings | 18 | 922,636 | 681,217 | |||
| Obligations to FIAGRO quota holders | 19 | 150,018 | - | |||
| Payables for the acquisition of subsidiaries | 20 | 221,509 | 111,684 | |||
| Derivative financial instruments | 8 | 44,008 | 7,121 | |||
| Commodity forward contracts | 11 | 207,067 | 27,038 | |||
| Salaries and social charges | 223,376 | 187,285 | ||||
| Taxes payable | 37,105 | 34,216 | ||||
| Dividends payable | 1,619 | 411 | ||||
| Warrant liabilities | 22 | 36,446 | - | |||
| Advances from customers | 25 | 488,578 | 320,560 | |||
| Other liabilities | 34,388 | 95,893 | ||||
| Total current liabilities | 5,054,473 | 3,836,351 | ||||
| Non-current liabilities | ||||||
| Trade payables | 17 | 2,547 | - | |||
| Lease liabilities | 13 | 98,554 | 86,027 | |||
| Borrowings | 18 | 42,839 | 29,335 | |||
| Payables for the acquisition of subsidiaries | 20 | 53,700 | 52,747 | |||
| Provision for contingencies | 24 | 8,845 | 2,966 | |||
| Liability for FPA Shares | 22 | 139,133 | - | |||
| Other liabilities | 223 | 1,119 | ||||
| Taxes payable | 963 | - | ||||
| Deferred tax liabilities | 23 | 12,351 | 7,491 | |||
| Total non-current liabilities | 359,155 | 179,685 | ||||
| Equity / Net investment | 27 | |||||
| Net investment from the parent | - | 1,451,647 | ||||
| Share Capital | 591 | - | ||||
| Additional Paid-in Capital | 2,134,339 | - | ||||
| Capital reserve | 14,533 | - | ||||
| Other comprehensive loss | (28,634) | - | ||||
| Accumulated losses | (260,710) | - | ||||
| Equity attributable to shareholders of the Parent Company / Parent Company's Net investment | 1,860,119 | 1,451,647 | ||||
| Non-controlling interests | 250,238 | 218,080 | ||||
| Total equity / net investment | 2,110,357 | 1,669,727 | ||||
| Total liabilities and equity / net investment | 7,523,984 | 5,685,763 |
The accompanying notes are an integral part of the consolidated financial statements.
|
|
|
|
|
|
|
For the years ended June 30, 2023, 2022 and 2021 (In thousands of Brazilian reais - R$, except if otherwise indicated) |
| Notes | 2023 | 2022 | 2021 | |||||
| Revenue | 28 | 9,347,413 | 7,746,534 | 5,098,545 | ||||
| Cost of goods sold | 29 | (7,616,606) | (6,421,037) | (4,362,657) | ||||
| Gross profit | 1,730,807 | 1,325,497 | 735,888 | |||||
| Operating expenses | ||||||||
| Sales, general and administrative expenses | 29 | (1,228,128) | (1,022,388) | (619,506) | ||||
|
Other operating
(expenses) income, net
|
31 | (275,810) | 56,759 | 15,618 | ||||
| Operating profit | 226,869 | 359,868 | 132,000 | |||||
| Finance Income (costs) | ||||||||
| Finance income | 30 | 371,060 | 426,933 | 227,099 | ||||
| Finance costs | 30 | (988,867) | (646,377) | (312,892) | ||||
| Profit (loss) before income taxes | (390,938) | 140,424 | 46,207 | |||||
| Income taxes | ||||||||
| Current | 23 | 37,499 | (111,409) | (61,676) | ||||
| Deferred | 23 | 134,757 | 78,747 | 37,000 | ||||
| Profit (loss) for the year | (218,682) | 107,762 | 21,531 | |||||
| Attributable to: | ||||||||
| Net investment of the parent/ Equity holders of the parent | (260,710) | 78,170 | 38,390 | |||||
| Non-controlling interests | 42,028 | 29,592 | (16,859) | |||||
| Earnings (loss) per share | ||||||||
| Basic, profit (loss) for the year attributable to net investment of the parent/ equity holders of the parent | 27 | (2.29) | 0.69 | 0.34 | ||||
| Diluted, profit (loss) for the year attributable to net investment of the parent/ equity holders of the parent | 27 | (2.29) | 0.69 | 0.34 |
The accompanying notes are an integral part of the consolidated financial statements.
|
|
|
|
|
|
|
For the years ended June 30, 2023, 2022 and 2021 (In thousands of Brazilian reais - R$, except if otherwise indicated) |
| 2023 | 2022 | 2021 | ||||
| Profit (loss) for the year | (218,682) | 107,762 | 21,531 | |||
| Items that may be reclassified to profit or loss in subsequent years | ||||||
| Exchange differences on translation of foreign operations | (30,600) | (34,263) | (16,436) | |||
| Total comprehensive (loss) income for the year | (249,282) | 73,499 | 5,095 | |||
| Attributable to: | ||||||
| Net investment of the parent/ equity holders of the parent | (289,344) | 45,630 | 22,346 | |||
| Non-controlling interests | 40,062 | 27,869 | (17,251) |
The accompanying notes are an integral part of the consolidated financial statements.
|
|
|
|
|
|
|
For the years ended June 30, 2023, 2022 and 2021 (In thousands of Brazilian reais - R$, except if otherwise indicated) |
| Notes | Net investment of the Parent | Share Capital | Additional
Paid-in Capital |
Share-Based Compensation reserve | Acumulated gain/losses | Foreign
currency translation reserve |
Total | Non-controlling interest | Total Equity/ Net Investment |
|||||||||
| At June 30, 2020 | 787,707 | - | - | - | - | - | 787,707 | 68,922 | 856,629 | |||||||||
| Capital contributions | 27 | 554,735 | - | - | - | - | - | 554,735 | 100,350 | 655,085 | ||||||||
| Acquisition of non-controlling interests | 27 | (22,071) | - | - | - | - | - | (22,071) | (57,422) | (79,493) | ||||||||
| Acquisition of subsidiaries | 21 | 2,789 | - | - | - | - | - | 2,789 | 28,065 | 30,854 | ||||||||
| Profit for the year | 38,390 | - | - | - | - | - | 38,390 | (16,859) | 21,531 | |||||||||
| Exchange differences on translation of foreign operations | (16,436) | - | - | - | - | - | (16,436) | - | (16,436) | |||||||||
| At June 30, 2021 | 1,345,114 | - | - | - | - | - | 1,345,114 | 123,056 | 1,468,170 | |||||||||
| Capital contributions | 27 | 190,003 | - | - | - | - | - | 190,003 | 12,422 | 202,425 | ||||||||
| Dividends paid | (131,979) | - | - | - | - | - | (131,979) | (1,090) | (133,069) | |||||||||
| Acquisition of non-controlling interests | 27 | (3,257) | - | - | - | - | - | (3,257) | (31,094) | (34,351) | ||||||||
| Acquisition of subsidiaries | 21 | 6,136 | - | - | - | - | - | 6,136 | 86,917 | 93,053 | ||||||||
| Profit for the year | 78,170 | - | - | - | - | - | 78,170 | 29,592 | 107,762 | |||||||||
| Exchange differences on translation of foreign operations | (32,540) | - | - | - | - | - | (32,540) | (1,723) | (34,263) | |||||||||
| At June 30, 2022 | 1,451,647 | - | - | - | - | - | 1,451,647 | 218,080 | 1,669,727 | |||||||||
| Capital contributions | 27 | 60,880 | - | - | - | - | - | 60,880 | - | 60,880 | ||||||||
| Acquisition of non-controlling interests | 27 | (64,711) | - | - | - | - | - | (64,711) | (36,176) | (100,887) | ||||||||
| Non-controlling dilution on capital contributions | 27 | (7,475) | - | - | - | - | - | (7,475) | 7,475 | - | ||||||||
| Dividends paid | - | - | - | - | - | - | - | (3,485) | (3,485) | |||||||||
| Acquisition of subsidiaries | 21 | 8,809 | - | - | - | - | - | 8,809 | 14,389 | 23,198 | ||||||||
| Share-based payments | 27 | 12,112 | - | - | - | - | - | 12,112 | - | 12,112 | ||||||||
| Profit for the period | 209,310 | - | - | - | - | - | 209,310 | 54,579 | 263,889 | |||||||||
| Exchange differences on translation of foreign operations | (27,481) | - | - | - | - | - | (27,481) | (1,007) | (28,488) | |||||||||
| Pre reorganization | 1,643,091 | - | - | - | - | - | 1,643,091 | 253,855 | 1,896,946 | |||||||||
| Changes in parent company's net investment | 27 | (1,643,091) | 514 | 1,464,083 | 12,112 | 209,310 | (42,928) | - | - | |||||||||
| SPAC merger transaction | 22 | - | 77 | 670,256 | - | - | - | 670,333 | 670,333 | |||||||||
| Exchange differences on translation of foreign operations | - | - | - | - | - | 14,294 | 14,294 | 763 | 15,057 | |||||||||
| Loss for the period | - | - | - | - | (470,020) | - | (470,020) | (12,550) | (482,570) | |||||||||
| Share-based payment | 27 | - | - | - | 2,421 | - | - | 2,421 | 2,421 | |||||||||
| Acquisition of subsidiaries | 21 | - | - | - | - | - | - | - | 8,169 | 8,169 | ||||||||
| At June 30, 2023 | - | 591 | 2,134,339 | 14,533 | (260,710) | (28,634) | 1,860,119 | 250,238 | 2,110,357 |
The accompanying notes are an integral part of the consolidated financial statements.
|
|
|
|
|
|
|
For the years ended June 30, 2023, 2022 and 2021 (In thousands of Brazilian reais - R$, except if otherwise indicated) |
| Notes | 2023 | 2022 | 2021 | |||||
| Operating activities: | ||||||||
| Profit (loss) before income taxes | (390,938) | 140,424 | 46,207 | |||||
| Adjustments to reconcile profit (loss) for the year to net cash flow: | ||||||||
| Allowance for expected credit losses | 29 | 36,769 | 27,393 | 11,094 | ||||
| Listing expense | 31 | 319,554 | - | - | ||||
| Foreign exchange diferences | (10,955) | 1,957 | (12,759) | |||||
| Accrued interest expenses | 30 | 844,885 | 594,076 | 295,169 | ||||
| Interest arising from revenue contracts | 30 | (250,337) | (407,449) | (204,744) | ||||
| Loss (gain) on derivatives | 30 | (79,375) | 26,323 | 4,883 | ||||
| Interest from tax benefits | 30 | (27,153) | - | - | ||||
| Other finance loss, net | 30 | 24,122 | 22,440 | 12,042 | ||||
| Fair value on commodity forward contracts | 30 | 98,674 | (9,200) | (6,337) | ||||
| Amortization of intangibles | 29 | 67,927 | 57,607 | 29,717 | ||||
| Amortization of right-of-use assets | 29 | 56,236 | 51,203 | 17,997 | ||||
| Depreciation | 29 | 16,408 | 9,697 | 5,717 | ||||
| Losses and damages of inventories | 29 | 19,127 | 23,339 | 9,808 | ||||
| Gain on bargain purchase | - | (18,295) | - | |||||
| Provisions for contingencies | 5,879 | (11,998) | (3,564) | |||||
| Share-based payment expense | 27 | 14,533 | - | - | ||||
| Others | (2,681) | (26,495) | (7,484) | |||||
| Changes in operating assets and liabilities: | ||||||||
| Assets | ||||||||
| Trade receivables | (608,550) | 19,563 | 262,671 | |||||
| Inventories | 49,745 | (721,602) | 5,745 | |||||
| Advances to suppliers | 191,138 | 74,542 | (201,351) | |||||
| Derivative financial instruments | (32,732) | (7,677) | - | |||||
| Taxes recoverable | (66,345) | (41,685) | (23,374) | |||||
| Other receivables | 77,567 | (6,765) | 4,493 | |||||
| Liabilities | ||||||||
| Trade payables | (117,567) | 273,611 | (316,575) | |||||
| Advances from customers | 106,903 | (207,440) | 187,035 | |||||
| Derivative financial instruments | 116,262 | (24,328) | (14,250) | |||||
| Salaries and social charges | 36,091 | 91,540 | 46,363 | |||||
| Taxes payable | (3,360) | (39,463) | 25,518 | |||||
| Other payables | (66,051) | (2,237) | 25,051 | |||||
| Interest paid on borrowings | 18 | (95,739) | (7,401) | (30,424) | ||||
| Interest paid on trade payables and lease liabilities | (346,749) | (360,665) | (208,938) | |||||
| Interest paid on acquisition of subsidiary | (4,875) | (14,907) | (2,797) | |||||
| Interest received from revenue contracts | 206,430 | 310,967 | 179,796 | |||||
| Income taxes paid | (76,775) | (76,546) | (85,682) | |||||
| Net cash flows from (used in) operating activities | 108,068 | (259,471) | 51,027 | |||||
| Investing activities: | ||||||||
| Acquisition of subsidiary, net of cash acquired | 20 and 21 | (157,442) | (198,305) | (280,374) | ||||
| Additions to property, plant and equipment and intangible assets | (65,376) | (47,697) | (34,940) | |||||
| Proceeds from the sale of property, plant and equipment | 2,084 | 1,309 | 4,242 | |||||
| Net cash flows used in investing activities | (220,734) | (244,693) | (311,072) | |||||
| Financing activities: | ||||||||
| Proceeds from borrowings | 18 | 1,449,445 | 615,984 | 466,280 | ||||
| Repayment of borrowings | 18 | (1,456,017) | (299,613) | (472,909) | ||||
| Payment of principal portion of lease liabilities | 13 | (60,570) | (45,814) | (7,957) | ||||
| Proceeds from FIAGRO quota holders, net of transaction costs | 19 | 150,018 | - | - | ||||
| Trade payables – Supplier finance | 17(c) | 16,569 | - | - | ||||
| Dividend payments | (2,277) | (139,512) | - | |||||
| Proceeds from SPAC merger, net | 22 | 391,572 | - | - | ||||
| Acquisition of non-controlling interests | 27 | (100,887) | (34,351) | (79,493) | ||||
| Capital contributions | 27 | 60,880 | 202,425 | 655,085 | ||||
| Net cash flows provided by financing activities | 448,733 | 299,119 | 561,006 | |||||
| Net increase (decrease) in cash equivalents | 336,068 | (205,045) | 300,961 | |||||
| Net foreign exchange difference | (26,187) | - | - | |||||
| Cash equivalents at beginning of year | 254,413 | 459,458 | 158,497 | |||||
| Cash equivalents at end of year | 564,294 | 254,413 | 459,458 |
The accompanying notes are an integral part of the consolidated financial statements
|
|
|
|
Notes to the consolidated financial statements |
|
|
(In thousands of Brazilian reais - R$, except if otherwise indicated) |
| 1. | Background information |
Lavoro Limited is a Cayman Island exempted company incorporated on August 22, 2022.
Lavoro Limited is a public company listed with the US Securities and Exchange Commission (“SEC”) and its shares are traded on Nasdaq Global Select Market under ticker symbol “LVRO”.
Lavoro Limited (“Lavoro” and collectively with its subsidiaries, the “Group”) is one of the main agricultural input distribution platforms in Latin America, with relevant agricultural input distribution operations in Brazil and Colombia, and an early stage agricultural input trading company in Uruguay. Also, as a result of a verticalization strategy, the Group produces agricultural biological and special fertilizers products through its own facilities. The Group offers farmers a complete portfolio of products and services with the goal of helping farmer customers succeed by providing multi-channel support.
As of June 30, 2023, the Group is controlled by investment funds, managed by general partners which are ultimately controlled by Patria Investments Limited (the “Parent” or “Patria”), a manager of alternative assets with its shares listed on the NASDAQ.
| (a) | The SPAC Transaction |
On September 14, 2022, Lavoro and TPB Acquisition Corporation I (“TPB Acquisition Corp.”), a special purpose acquisition company sponsored by The Production Board LLC, signed an agreement pursuant to which they entered into a definitive business combination agreement (the “Business Combination Agreement”) that resulted in Lavoro becoming a U.S. publicly listed company on the NASDAQ Global Market.
The SPAC Transaction was approved at an extraordinary general meeting of TPB Acquisition Corp’s shareholders on February 22, 2023.
On February 28, 2023, as a result of the SPAC Transaction Lavoro and TPB Acquisition Corp consummated a corporate reorganization, as further explained below, pursuant to which (i) Lavoro Agro Limited’s shareholders contributed their shares in Lavoro Agro Limited to Lavoro in exchange of Lavoro’s shares at a pre-determined exchange ratio, becoming Lavoro’s controlling shareholders (ii) TPB Acquisition Corp’s shareholders contributed the net assets of TPB Acquisition Corp, which primarily consisted of cash and marketable securities held in the trust account and certain public and private warrants liabilities in exchange of Lavoro’s shares, becoming Lavoro’s non-controlling shareholders.
See Note 22 for further information.
|
|
|
|
|
Notes to the consolidated financial statements (In thousands of Brazilian reais - R$, except if otherwise indicated) |
| (b) | Corporate reorganizations |
The Group’s operations include the operations of the following entities (i) Lavoro Agro Holding S.A. and its subsidiaries (“Lavoro Holding”) which was incorporated in 2017 and is domiciled in the city of São Paulo, Brazil, (ii) Crop Care Holding S.A., and its subsidiaries (“Crop Care”) which was incorporated in 2018 and is domiciled in the city of São Paulo, Brazil and (iii) Lavoro Colombia S.A.S. and its subsidiaries (“Lavoro Colombia”) which was incorporated in 2021 and is domiciled in the city of Bogotá, Colombia.
In January 2023, as part of the SPAC Transaction, a corporate reorganization was completed whereby Lavoro Brazil, Crop Care and Lavoro Colombia were contributed to, and became subsidiaries of Lavoro Agro Limited, a Cayman Islands exempted company with limited liability which was incorporated on November 21, 2021, to become the holding company of all the operations of the Group.
As mentioned above, following the consummation of the SPAC Transaction, Lavoro became the parent company of Lavoro Agro Limited and the holding company of all the operations of the Group.
| (c) | The Group’s business |
The Group initiated its operations in 2017 and has expanded mainly through mergers and acquisitions in the distribution of agricultural inputs such as crop protection products, fertilizers, seeds and specialty inputs (foliar fertilizers, biologicals, adjuvants and organominerals) and its production through its proprietary portfolio of products under the crop care segment.
Through Crop Care, the Group operates as an importer of post-patent agricultural inputs and producer of specialties products through its own factories’ manufacturing plants. The inputs produced are delivered through the Group’s own distribution channels and by means of direct sales to customers.
The Group operates in Brazil, Colombia and Uruguay in the agricultural input distribution market through its own stores and sells agricultural inputs and products, in particular fertilizers, seeds and pesticides. The Group’s customers are rural producers that operate in the production of cereals, mainly soybeans and corn, in addition to cotton, citrus and fruit and vegetable crops, among others.
Seasonality
Agribusiness is subject to seasonality throughout the year, especially due to the crop cycles that depend on specific weather conditions. Operations, especially in Brazil, have unique weather conditions compared to other countries producing agricultural commodities, making it possible to harvest two to three crops in the same area per year. Thus, considering that the activities of the Group’s customers are directly related to crop cycles, which are seasonal in nature, revenues and cash flows from sales may also be substantially seasonal.
The sale of our products is dependent upon planting and growing seasons, which vary from year to year, and are expected to result in both highly seasonal patterns and substantial fluctuations in quarterly sales and profitability. Demand for our products is typically strongest between October and December, with a second period of strong demand between January and March. The seasonality of agricultural inputs results in our sales volumes and net sales typically being the highest during the period between September to February and our working capital and total debt requirements typically being the highest just after the end of this period.
|
|
|
|
|
Notes to the consolidated financial statements (In thousands of Brazilian reais - R$, except if otherwise indicated) |
| (d) | Other relevant events |
| · | Acquisitions |
The Group concluded several business acquisitions during the year ended June, 30, 2023, for which the total consideration was R$302,468 including cash, amounts payable in installments and issuance of shares. These acquisitions are further described in Note 21. Additionally, the Group completed an acquisition subsequent to June 30, 2023, which are described in note 33.
| · | Ongoing armed conflict between Russia and Ukraine |
As a result of the current geopolitical tensions and conflict between Russia and Ukraine, and the recent recognition by Russia of the independence of the self-proclaimed republics of Donetsk and Luhansk in the Donbas region of Ukraine, the governments of the United States, the European Union, Japan and other jurisdictions have recently announced the imposition of sanctions on certain industry sectors and parties in Russia, Belarus and the regions of Donetsk and Luhansk, as well as enhanced export controls on certain products and industries. These and any additional sanctions and export controls, as well as any counter responses by the governments of Russia or other jurisdictions, could adversely affect, directly or indirectly, the global supply chain, with negative implications on the availability and prices of agricultural commodities and raw materials (including petrol, which would affect the price of agricultural inputs), energy prices, and Group’s customers, as well as the global financial markets and financial services industry and the global supply chain in general.
From a supply point of view, Brazil is highly dependent on fertilizer imports, and Russia and Belarus hold a market share in Brazilian soil fertilizer imports of approximately 26% to 30%, respectively (a share which is higher for potash-based products). The Group currently buys all of the Group’s fertilizers from suppliers based in Brazil, but most of the Group’s fertilizer suppliers import or have imported, to some degree, from sources in Russia and Belarus. Fertilizers represented approximately 21% of Group’s net revenues in the year ended June 30, 2023 (and 20% of Group’s net revenues in the year ended June 30, 2022). In addition, fertilizer prices, which had already risen before the conflict, have continued to rise, which has led producers to delay purchase negotiations. Despite such supply risk, the Group does not expect material shortages of fertilizers.
The Group does not believe that fertilizer supply challenges will cause any material adverse effects on the Group's business during the upcoming crop year, given that the Group has already delivered substantially all soy and corn fertilizer for the crop year.
| 2. | Significant accounting policies |
| (a) | Basis for preparation of consolidated financial statements - Predecessor method |
Lavoro became the Group’s legal holding company through the corporate reorganization described in Note 1 (b). Such corporate reorganization was recorded at book value since it is a transaction under common control.
Under IFRS there is no specific guidance applicable to business combinations of entities under common control, as IFRS 3 excludes business combinations between such entities from its scope.
|
|
|
|
|
Notes to the consolidated financial statements (In thousands of Brazilian reais - R$, except if otherwise indicated) |
Due to the lack of specific guidance the Group has established an accounting policy as required by IAS 8 — Accounting Policies, Changes in Accounting Estimates and Errors. In doing so, the Group considered guidance of other standards-setting bodies that use a similar conceptual framework to develop accounting standards as well as the accounting practices of entities subject to those standards such as the United States of America and the United Kingdom.
As a result, the Group accounted for the corporate reorganizations using the predecessor method of accounting, and the consolidated financial statements are presented “as if” the historical consolidated operations of Lavoro Brazil, Crop Care and Lavoro Colombia were the predecessor of Lavoro. Under the predecessor method, the historical operations of the Group prior to the corporate reorganizations are deemed to be those of Lavoro. Thus, these consolidated financial statements reflect:
| · | the historical operating results and financial position of Lavoro Brazil, Crop Care and Lavoro Colombia on a combined basis prior to the corporate reorganizations |
| · | the assets and liabilities of Lavoro Brazil, Crop Care and Lavoro Colombia at their historical cost; and |
| · | Lavoro’s earnings per share for all years presented. The number of ordinary shares issued by Lavoro, as a result of the corporate reorganization, is reflected retroactively for the purposes of calculating earnings per share in all prior years presented. |
The consolidated financial statements as of June 30, 2023 and 2022 and for the year ended June 30, 2023, 2022 and 2021 have been prepared in accordance with International Financial Reporting Standards (IFRS) as issued by the International Accounting Standards Board (“IASB”).
The Group has prepared the financial statements on the basis that it will continue to operate as a going concern. The Directors consider that there are no material uncertainties that may cast significant doubt over this assumption. They have formed a judgement that there is a reasonable expectation that the Group has adequate resources to continue in operational existence for the foreseeable future, and not less than 12 months from the end of the reporting period.
The consolidated financial statements have been prepared under the historical cost basis, except for financial assets and financial liabilities (including commodity forward contracts and derivative instruments) at fair value through profit or loss.
The consolidated financial statements are presented in Brazilian reais (“BRL” or “R$”), which is the Group’s functional and presentation currency. All amounts are rounded to the nearest thousand (R$000), except when otherwise indicated.
On October 31, 2023, the issuance of the consolidated financial statements was approved by the Group’s Board of Directors.
|
|
|
|
|
Notes to the consolidated financial statements (In thousands of Brazilian reais - R$, except if otherwise indicated) |
| (b) | Significant accounting judgments, estimates and assumptions |
Use of critical accounting estimates and judgments
The preparation of financial statements requires management to make judgments, estimates and assumptions that affect the application of the Group’s accounting policies and the reported amounts of assets, liabilities, revenues, income and expenses. These estimates are based on management’s experience and knowledge, information available at the reporting date and other factors, including expectations of future events that are believed to be reasonable under normal circumstances. Any changes in facts and circumstances may lead to a revision of these estimates. Actual results could differ from these estimates.
The estimates and assumptions are revised on an ongoing basis. Revisions to estimates are recognized on a forward-looking basis. The significant estimates and judgments applied by the Group in the preparation of these consolidated financial statements are presented in the following notes:
| Note | Significant estimates and judgments |
| 11 | Commodity forward contract |
| 16 | Impairment testing of non-financial assets |
| 21 | Business combination |
| 22 | SPAC Transaction |
| 23 | Deferred income taxes recoverability |
| (c) | Basis of combination/consolidation procedures |
Lavoro’s fiscal year end is June 30. The consolidated financial statements are prepared for the same reporting periods, using consistent accounting policies.
All unrealized intra-group and intercompany balances, transactions, gains and losses relating to transactions between group companies were eliminated in full.
The consolidated financial statements include the following subsidiaries of Lavoro Limited:
| Equity interest | |||||
| Name | Core activities | Location | 2023 | 2022 | 2021 |
| Corporate: | |||||
| Lavoro Agro Limited (i) | Holding | George Town – Cayman Island | 100% | - | - |
| Lavoro America Inc. (i) | Holding | California - USA | 100% | ||
|
|
|
|
|
Notes to the consolidated financial statements (In thousands of Brazilian reais - R$, except if otherwise indicated) |
| Lavoro Merger Sub II Limited (i) | Holding | George Town – Cayman Island | 100% | - | - |
| Lavoro Agro Cayman II (i) | Holding | George Town – Cayman Island | 100% | - | - |
| Lavoro Latam SL (i) | Holding | Madrid - Spain | 100% | - | - |
| Malinas S.A. (i) | Holding | Montevideu – Uruguay | 100% | - | - |
| Lavoro Brazil: | |||||
| Lavoro Agro Holding S.A. | Holding | São Paulo – Brazil | 100% | 100% | 100% |
| Lavoro Agrocomercial S.A. (viii) | Distributor of agricultural inputs | Rondonópolis – Brazil | 97.42% | 97.42% | 91.65% |
| Agrocontato Comércio e Representações de Produtos Agropecuários S.A. (viii) | Distributor of agricultural inputs | Sinop – Brazil | 97.42% | 97.42% | 91.65% |
| PCO Comércio, Importação, Exportação e Agropecuária Ltda. (viii) | Distributor of agricultural inputs | Campo Verde – Brazil | 97.42% | 97.42% | 91.65% |
| Agrovenci Distribuidora de Insumos Agrícolas Ltda. (MS) (ii) (v) | Distributor of agricultural inputs | Chapadão do Sul – Brazil | 93.11% | 86.22% | - |
| Produtiva Agronegócios Comércio e Representação Ltda. (v) | Distributor of agricultural inputs | Paracatu – Brazil | 87.40% | 87.40% | - |
| Facirolli Comércio e Representação S.A. (Agrozap) (v) | Distributor of agricultural inputs | Uberaba – Brazil | 62.61%- | 62.61% | - |
| Agrovenci Comércio, Importação, Exportação e Agropecuária Ltda. (viii) | Distributor of agricultural inputs | Campo Verde – Brazil | 97.42% | 97.42% | 91.65% |
| Central Agrícola Rural Distribuidora de Defensivos Ltda. (viii) | Distributor of agricultural inputs | Vilhena – Brazil | 97.42% | 97.42% | 91.65% |
| Distribuidora Pitangueiras de Produtos Agropecuários S.A. (viii) | Distributor of agricultural inputs | Ponta Grossa – Brazil | 93.11% | 86.22% | 86.22% |
| Produtec Comércio e Representações S.A. (viii) | Distributor of agricultural inputs | Cristalina – Brazil | 87.4% | 87.40% | 72.42% |
| Qualiciclo Agrícola S.A. (viii) | Distributor of agricultural inputs | Limeira – Brazil | 66.75% | 61.00% | 61.00% |
| Desempar Participações Ltda. (viii) | Distributor of agricultural inputs | Palmeira – Brazil | 93.11% | 86.20% | 86.20% |
| Denorpi Distribuidora de Insumos Agrícolas Ltda. (viii) | Distributor of agricultural inputs | Palmeira – Brazil | 93.11% | 86.20% | 86.20% |
|
|
|
|
|
Notes to the consolidated financial statements (In thousands of Brazilian reais - R$, except if otherwise indicated) |
| Deragro Distribuidora de Insumos Agrícolas Ltda. (viii) | Distributor of agricultural inputs | Palmeira – Brazil | 93.11% | 86.20% | 86.20% |
| Desempar Tecnologia Ltda. (viii) | Holding | Palmeira – Brazil | 93.11% | 86.20% | 86.20% |
| Futuragro Distribuidora de Insumos Agrícolas Ltda. (viii) | Distributor of agricultural inputs | Palmeira – Brazil | 93.11% | 86.20% | 86.20% |
| Plenafértil Distribuidora de Insumos Agrícolas Ltda. (viii) | Distributor of agricultural inputs | Palmeira – Brazil | 93.11% | 86.20% | 86.20% |
| Realce Distribuidora de Insumos Agrícolas Ltda. (viii) | Distributor of agricultural inputs | Palmeira – Brazil | 93.11% | 86.20% | 86.20% |
| Cultivar Agrícola Comércio, Importação e Exportação S.A. (viii) | Distributor of agricultural inputs | Chapadão do Sul – Brazil | 93.11% | 63.47% | 63.47% |
| América Insumos Agrícolas Ltda. (iii) | Distributor of agricultural inputs | Sorriso – Brazil | - | 97.42% | 91.65% |
| Integra Soluções Agrícolas Ltda. (iv) | Distributor of agricultural inputs | Catalão – Brazil | - | 87.4% | 72.42% |
| Nova Geração (v) (viii) | Distributor of agricultural inputs | Pinhalzinho – Brazil | 66.75% | 61.00% | - |
| Floema Soluções Nutricionais de Cultivos Ltda. (v) | Distributor of agricultural inputs | Uberaba – Brazil | 62.61% | - | - |
| Casa Trevo Participações S.A. (v) | Holding | Nova Prata – Brazil | 79.14% | - | - |
| Casa Trevo Comercial Agrícola LTDA. (v) | Distributor of agricultural inputs | Nova Prata – Brazil | 79.14% | - | - |
| CATR Comercial Agrícola LTDA (v) | Distributor of agricultural inputs | Nova Prata – Brazil | 79.14% | - | - |
| Sollo Sul Insumos Agrícolas Ltda (v) | Distributor of agricultural inputs | Pato Branco – Brazil | 93.11% | - | - |
| Dissul Insumos Agrícolas Ltda. (v) | Distributor of agricultural inputs | Pato Branco – Brazil | 93.11% | - | - |
| Lavoro Agro Fundo de Investimento nas Cadeias Produtivas Agroindustriais (vi) | FIAGRO | São Paulo – Brazil | 5% | - | - |
| Lavoro Colômbia: | |||||
| Lavoro Colombia S.A.S. (viii) | Holding | Bogota – Colombia | 94.90% | 94.90% | - |
| Crop Care Colombia (viii) | Distributor of agricultural inputs | Bogota - Colombia | 94.90% | 94.90% | 100% |
|
|
|
|
|
Notes to the consolidated financial statements (In thousands of Brazilian reais - R$, except if otherwise indicated) |
| Agricultura y Servicios S.A.S. (viii) | Distributor of agricultural inputs | Ginebra - Colombia | 94.90% | 94.90% | 97.61% |
| Fertilizantes Liquidos y Servicios S.A.S. (vii) | Distributor of agricultural inputs | Cali - Colombia | - | - | 97.61% |
| Grupo Cenagro S.A.S. (v) | Distributor of agricultural inputs | Yumbo – Colombia | 94.90% | 94.90% | - |
| Cenagral S.A.S (v) | Distributor of agricultural inputs | Yumbo – Colombia | 94.90% | 94.90% | - |
| Grupo Gral S.A.S. (viii) | Distributor of agricultural inputs | Bogota - Colombia | 94.90% | 94.90% | 100% |
| Agrointegral Andina S.A.S. (viii) | Distributor of agricultural inputs | Bogota – Colombia | 94.90% | 94.90% | 100% |
| Servigral Praderas S.A.S. (viii) | Distributor of agricultural inputs | Bogota – Colombia | 94.90% | 94.90% | 100% |
| Agroquímicos para la Agricultura Colombiana S.A.S. (viii) | Distributor of agricultural inputs | Bogota – Colombia | 94.90% | 94.90% | 100% |
| Provecampo S.A.S. (v) | Distributor of agricultural inputs | Envigado – Colombia | 94.90% | - | - |
| Crop Care: | |||||
| Crop Care Holding S.A. | Holding | São Paulo – Brazil | 100% | 100% | 100% |
| Perterra Insumos Agropecuários S.A. | Private label products | São Paulo – Brazil | 100% | 100% | 100% |
| Araci Administradora de Bens S.A. | Private label products | São Paulo – Brazil | 100% | 100% | 100% |
| Union Agro S.A. (v) | Private label products | Pederneiras – Brazil | 73% | 73.00% | - |
| Agrobiológica Sustentabilidade S.A. | Private label products | São Paulo – Brazil | 65.13% | 65.13% | 65.13% |
| Agrobiológica Soluções Naturais Ltda. | Private label products | Leme – Brazil | 65.13% | 65.13% | 65.13% |
| Cromo Indústria Química LTDA. (v) | Private label products | Estrela - Brasil | 70% | - | - |
| Perterra Trading S.A. | Private label products | Montevideu - Uruguay | 100% | 100% | - |
| (i) | Refers to entities of the reorganization, see note 1.b. |
| (ii) | Agrovenci Distribuidora de Insumos Agrícolas Ltda. was incorporated in August 2021. |
| (iii) | América Insumos Agrícolas Ltda. was merged with another entity within the Group in November 2022. |
| (iv) | Integra Soluções Agrícolas Ltda. was merged with another entity within the Group in May 2023. |
| (v) | See note 21 of Acquisitions of subsidiaries. |
| (vi) | Lavoro Agro Fundo de Investimentos nas Cadeias Produtivas Agroindustriais - Direitos Creditórios was incorporated in July 2022. (see Note 19). |
| (vii) | Fertilizantes Liquidos y Servicios S.A.S. was merged with another entity within the Group in May 2022. |
| (viii) | Changes in non-controlling interests were described in note 27 of Equity. |
|
|
|
|
|
Notes to the consolidated financial statements (In thousands of Brazilian reais - R$, except if otherwise indicated) |
| 3. | Summary of significant accounting policies |
The significant accounting policies applied in the preparation of the consolidated financial statements have been included in the related explanatory notes and are consistent in all reporting years.
| (a) | New accounting standards, interpretations and amendments adopted starting July 1, 2020: |
The following new accounting standards, interpretations and amendments were adopted starting July 1, 2020:
| ● | Reference to the Conceptual Framework – Amendments to IFRS 3; |
| ● | Property, Plant and Equipment: Proceeds before Intended Use – Amendments to IAS 16; |
| ● | IFRS 1 First-time Adoption of International Financial Reporting Standards – Subsidiary as a first-time Adopter; |
| ● | IFRS 9 Financial Instruments – Fees in the ’10 per cent’ test for derecognition of financial liabilities; |
| ● | IAS 41 Agriculture – Taxation in fair value measurements; and |
| ● | Onerous Contracts – Costs of Fulfilling a Contract – Amendments to IAS 37. |
The adoption of these new standards and interpretations did not have a material effect on the consolidated financial statements.
| (b) | New accounting standards, interpretations and amendments issued but not yet effective |
Some accounting standards and interpretations have been issued, but are not yet effective.
The Group has not early adopted any of these standards and does not expect these standards to have a material impact on the financial statements in subsequent periods.
New and amended standards and interpretations issued, but not yet effective up to the date of the issuance of the Group’s consolidated financial statements are as follows:
| ● | Amendments to IAS 1: Classification of Liabilities as Current or Non-current; |
| ● | Definition of Accounting Estimates - Amendments to IAS 8; |
| ● | Disclosure of Accounting Policies - Amendments to IAS 1 and IFRS Practice Statement 2. |
| ● | Deferred Tax related to Assets and Liabilities arising from a Single Transaction - Amendments to IAS 12: requires the recognition of deferred tax on transactions that, on initial recognition, give rise to equal amounts of taxable and deductible temporary differences. It will apply to transactions such as leases of lessees and decommissioning obligations and will require the recognition of additional deferred tax assets and liabilities. The amendment should be applied to transactions that occur on or after the beginning of the earliest comparative period presented. |
|
|
|
|
|
Notes to the consolidated financial statements (In thousands of Brazilian reais - R$, except if otherwise indicated) |
The Group intends to adopt these new standards, amendments and interpretations, if applicable, when they become effective; and the Group does not expect them to have a material impact on the financial statements, except for the Amendment to IAS 12, which the Group is currently evaluating.
| (c) | Foreign currency |
| (i) | Functional currency and presentation |
The consolidated financial statements are presented in Brazilian reais (“R$”), which is the Group’s functional currency.
The Group determines the functional currency of each of the consolidated entities. Items included in the financial statements of each entity are measured using that functional currency. The functional currency for the majority of the Group’s entities is the Brazilian real (Brazil Cluster and Crop Care Cluster – see Note 4), except for the companies in Colombia, whose functional currency is the Colombian peso (COP$).
| For | consolidation, the operations in Colombia are translated into Brazilian reais, as follows: |
| (i) | Assets and liabilities are translated into Reais at the closing exchange as of the reporting date; |
| (ii) | Profit or loss items are translated at the average monthly exchange rate; and |
| (iii) | Exchange differences arising on translation are recognized in other comprehensive income. |
On disposal of a foreign operation, the component of other comprehensive income relating to that particular foreign operation is reclassified to profit or loss. Any goodwill arising on the acquisition of a foreign operation and any fair value adjustments to the carrying amounts of assets and liabilities arising from the acquisition are treated as assets and liabilities of the foreign operation and translated at the spot rate of exchange as of the reporting date.
| (j) | Transactions and balances |
Transactions in foreign currencies are initially recorded by the Group’s entities at their respective functional currency spot rates at the date the transaction first qualifies for recognition.
Monetary assets and liabilities denominated in foreign currencies are translated at the functional currency spot rates of exchange as of the reporting date. Differences arising on settlement or translation of monetary items are recognized in the statement of profit or loss.
Non-monetary items that are measured in terms of historical cost in a foreign currency are translated using the exchange rates at the dates of the initial transactions. Non-monetary items measured at fair value in a foreign currency are translated using the exchange rates at the date when the fair value is determined. The gain or loss arising on translation of non-monetary items measured at fair value is treated in line with the recognition of the gain or loss on the change in fair value of the item (i.e., translation differences on items whose fair value gain or loss is recognized in other comprehensive income or profit or loss are also recognized in other comprehensive income or profit or loss, respectively).
|
|
|
|
|
Notes to the consolidated financial statements (In thousands of Brazilian reais - R$, except if otherwise indicated) |
| (d) | Current versus non-current classification |
The Group presents assets and liabilities in the statement of financial position based on current/non-current classification. An asset is current when it is:
| ● | Expected to be realized or intended to be sold or consumed in the normal operating cycle; |
| ● | Held primarily for the purpose of trading; |
| ● | Expected to be realized within twelve months after the reporting period; or |
| ● | Cash or cash equivalent unless restricted from being exchanged or used to settle a liability for at least twelve months after the reporting period. |
All other assets are classified as non-current.
A liability is current when:
| ● | It is expected to be settled in the normal operating cycle; |
| ● | It is held primarily for the purpose of trading; |
| ● | It is due to be settled within twelve months after the reporting period; or |
| ● | There is no unconditional right to defer the settlement of the liability for at least twelve months after the reporting period. |
The terms of the liability that could, at the option of the counterparty, result in its settlement by the issue of equity instruments do not affect its classification.
The Group classifies all other liabilities as non-current. Deferred tax assets and liabilities are classified as non-current assets and liabilities.
| (e) | Statement of cash flows |
In 2023, cash outflows related to acquisitions of non-controlling interests are classified under net cash flows provided by financing activities and interest paid on acquisitions of subsidiary is classified under net cash flows from (used in) operating activities. In 2022 and 2021, both amounts were classified under net cash flows used in investing activities.
While the effect of the change in classification of those cash flows from investing to financing and operating activities is not material, management has retrospectively revised those periods for comparison purposes.
|
|
|
|
|
Notes to the consolidated financial statements (In thousands of Brazilian reais - R$, except if otherwise indicated) |
The retrospective changes in the comparative periods can be summarized as follows:
| 2022 | ||||||
|
Originally presented |
Effects of Change in classification |
After change in classification |
||||
| Acquisition of subsidiary, net of cash acquired | (213,212) | 14,907 | (198,305) | |||
| Acquisition of non-controlling interests | (34,351) | 34,351 | - | |||
| Net cash flows used in investing activities | (293,951) | 49,258 | (244,693) | |||
| Acquisition of non-controlling interests | - | (34,351) | (34,351) | |||
| Net cash flows provided by financing activities | 333,470 | (34,351) | 299,119 | |||
| Interest paid on acquisition of subsidiary | - | (14,907) | (14,907) | |||
| Net cash flows used in operating activities | (244,564) | (14,907) | (259,471) | |||
| 2021 | ||||||
|
Originally presented |
Effects of Change in classification |
After change in classification |
||||
| Acquisition of subsidiary, net of cash acquired | (283,171) | 2,797 | (280,374) | |||
| Acquisition of non-controlling interests | (79,493) | 79,493 | - | |||
| Net cash flows used in investing activities | (393,362) | 82,290 | (311,072) | |||
| Acquisition of non-controlling interests | - | (79,493) | (79,493) | |||
| Net cash flows provided by financing activities | 640,499 | (79,493) | 561,006 | |||
| Interest paid on acquisition of subsidiary | - | (2,797) | (2,797) | |||
| Net cash flows from operating activities | 53,824 | (2,797) | 51,027 | |||
| 4. | Segment information |
| (a) | Reportable segments by management |
The chief operating decision-maker of the Group (the “CODM”) is the board of directors which is responsible for allocating resources among operating segments and assessing their performance and for making strategic decisions.
The determination of the reportable segments is based on internal reports reviewed by the CODM, which include considerations in relation to risks and returns, organizational structure, etc. Certain expenses across segments are allocated based on reasonable allocation criteria, such as revenues or historical trends.
The Group’s reportable segments are the following:
| • | Brazil Cluster: includes companies located in Brazil that sell agricultural inputs; |
| • | LATAM Cluster: includes companies located in Colombia that sell agricultural inputs; |
| • | Crop Care Cluster: includes companies that produce and import their own portfolio of proprietary products including off-patent crop protection and specialty products (e.g, biologicals and special fertilizers). |
The CODM used information on a pro forma basis giving effect of the acquisitions completed during the year to assess the segment performance. Starting March 31, 2023, the CODM used historical segment financial information. Segment information for prior years has been recast for comparative purposes.
|
|
|
|
|
Notes to the consolidated financial statements (In thousands of Brazilian reais - R$, except if otherwise indicated) |
| (b) | Financial information by segment |
Segment assets and liabilities as of June 30, 2023:
| Description | Brazil | LATAM | Crop Care | Total reportable segments |
Corporate (i) |
Eliminations between segments (ii) |
Consolidated | |||||||
| Certain assets | ||||||||||||||
| Cash equivalents | 207,744 | 22,003 | 95,585 | 325,332 | 238,962 | - | 564,294 | |||||||
| Trade receivables | 2,194,853 | 343,745 | 242,391 | 2,780,989 | - | (72,449) | 2,708,540 | |||||||
| Inventories | 1,547,384 | 202,239 | 151,289 | 1,900,912 | - | (32,708) | 1,868,204 | |||||||
| Advances to suppliers | 176,831 | 2,266 | 13,088 | 192,185 | - | (66) | 192,119 | |||||||
| Total assets | 5,926,380 | 683,894 | 680,294 | 7,290,568 | 449,779 | (216,363) | 7,523,984 | |||||||
| Certain liabilities | ||||||||||||||
| Trade payables | 2,304,043 | 309,828 | 46,506 | 2,660,377 | 455 | (56,427) | 2,604,405 | |||||||
| Borrowings | 824,868 | 71,562 | 69,045 | 965,475 | - | - | 965,475 | |||||||
| Advances from customers | 478,313 | 7,020 | 3,245 | 488,578 | - | - | 488,578 | |||||||
| Total liabilities and equity | 5,926,380 | 683,894 | 680,294 | 7,290,568 | 449,779 | (216,361) | 7,523,984 |
| (i) | Corporate items refer to balances and expenses with certain corporate demands not directly related to any operating segment. |
| (ii) | Transactions between the Crop Care segment and the Brazil segment. |
Statement of profit or loss data for the year ended June 30, 2023:
| Description | Brazil | LATAM | Crop Care | Total reportable segments |
Corporate (i) |
Eliminations between segments (ii) |
Consolidated | |||||||
| Revenue | 7,829,305 | 1,206,341 | 632,819 | 9,668,465 | - | (321,052) | 9,347,413 | |||||||
| Cost of goods sold | (6,543,315) | (1,009,721) | (351,914) | (7,904,950) | - | 288,344 | (7,616,606) | |||||||
| Sales, general and administrative expenses (iii) | (951,888) | (120,936) | (151,741) | (1,224,565) | (3,563) | - | (1,228,128) | |||||||
| Other operating income, net | 48,135 | (1,640) | 1,511 | 48,007 | (323,817) | - | (275,810) | |||||||
| Financial (costs) income | (525,056) | (15,371) | (48,415) | (588,842) | (28,965) | - | (617,807) | |||||||
| Income taxes | 208,331 | (22,263) | (24,932) | 161,136 | - | 11,120 | 172,256 | |||||||
| Profit (loss) for the year | 65,512 | 36,410 | 57,328 | 159,250 | (356,344) | (21,588) | (218,682) | |||||||
| Depreciation and amortization | (142,139) | (11,792) | (13,555) | (167,486) | - | - | (167,486) |
| (i) | Corporate items refer to balances and expenses with certain corporate demands not directly related to any operating segment. |
| (ii) | Sales between the Crop Care segment and the Brazil segment. |
| (iii) | Sales, general and administrative expenses include Depreciation and amortization. |
|
|
|
|
|
Notes to the consolidated financial statements (In thousands of Brazilian reais - R$, except if otherwise indicated) |
Segment assets and liabilities as of June 30, 2022:
| Description | Brazil | LATAM | Crop Care | Total reportable segments |
Eliminations between segments (i) |
Combined | ||||||
| Certain assets | ||||||||||||
| Cash equivalents | 195,343 | 16,951 | 42,119 | 254,413 | - | 254,413 | ||||||
| Trade receivables | 1,379,808 | 324,152 | 170,868 | 1,874,828 | (40,475) | 1,834,353 | ||||||
| Inventories | 1,451,541 | 174,532 | 122,968 | 1,749,041 | - | 1,749,041 | ||||||
| Advances to suppliers | 354,163 | 1,202 | 30,799 | 386,164 | (2,907) | 383,257 | ||||||
| Total assets | 4,602,679 | 619,238 | 508,331 | 5,730,248 | (44,485) | 5,685,763 | ||||||
| Certain liabilities | ||||||||||||
| Trade payables | 1,988,518 | 311,612 | 42,035 | 2,342,165 | (40,465) | 2,301,700 | ||||||
| Borrowings | 588,403 | 39,755 | 82,394 | 710,552 | - | 710,552 | ||||||
| Advances from customers | 318,404 | 164 | 3,502 | 322,070 | (1,510) | 320,560 | ||||||
| Total liabilities and equity | 4,602,679 | 619,238 | 508,332 | 5,730,248 | (44,485) | 5,685,763 |
| (i) | Transactions between the Crop Care segment and the Brazil segment. |
Statement of profit or loss data for the year ended June 30, 2022:
| Description | Brazil | LATAM | Crop Care | Total reportable segments |
Eliminations between segments (i) |
Combined | ||||||
| Revenue | 6,351,223 | 1,166,415 | 332,239 | 7,849,877 | (103,343) | 7,746,534 | ||||||
| Cost of goods sold | (5,336,991) | (975,756) | (211,633) | (6,524,380) | 103,343 | (6,421,037) | ||||||
| Sales, general and administrative expenses (ii) | (809,144) | (120,902) | (92,342) | (1,022,388) | - | (1,022,388) | ||||||
| Other operating income, net | 42,608 | (6,081) | 20,232 | 56,759 | - | 56,759 | ||||||
| Financial (costs) income | (217,277) | (9,639) | 7,472 | (219,444) | - | (219,444) | ||||||
| Income taxes | 3,973 | (20,865) | (15,770) | (32,662) | - | (32,662) | ||||||
| Profit for the year | 34,392 | 33,172 | 40,198 | 107,762 | - | 107,762 | ||||||
| Depreciation and amortization | (127,675) | (11,295) | (6,543) | (145,513) | - | (145,513) |
| (i) | Sales between the Crop Care segment and the Brazil segment. |
| (ii) | Sales, general and administrative expenses include Depreciation and amortization. |
|
|
|
|
|
Notes to the consolidated financial statements (In thousands of Brazilian reais - R$, except if otherwise indicated) |
Statement of profit or loss data for year ended June 30, 2021:
| Description | Brazil | LATAM | Crop Care | Total reportable segments |
Eliminations between segments (i) |
Combined | ||||||
| Revenue | 4,198,570 | 858,837 | 46,850 | 5,104,257 | (5,712) | 5,098,545 | ||||||
| Cost of goods sold | (3,653,813) | (704,738) | (9,818) | (4,368,369) | 5,712 | (4,362,657) | ||||||
| Sales, general and administrative expenses (ii) | (476,578) | (101,081) | (41,847) | (619,506) | - | (619,506) | ||||||
| Other operating income, net | 13,363 | 184 | 2,071 | 15,618 | - | 15,618 | ||||||
| Financial (costs) income | (68,772) | (13,524) | (3,497) | (85,793) | - | (85,793) | ||||||
| Income taxes | (8,412) | (15,538) | (726) | (24,676) | - | (24,676) | ||||||
| Profit for the year | 4,358 | 24,140 | (6,967) | 21,531 | - | 21,531 | ||||||
| Depreciation and amortization | (85,518) | (4,519) | (2,930) | (92,967) | - | (92,967) |
| (i) | Sales between the Crop Care segment and the Brazil segment. |
| (ii) | Sales, general and administrative expenses include Depreciation and amortization. |
Revenues from external customers for each product and service are disclosed in Note 28. Further breakdown in relation to products and services provided by the Group is not available and such information cannot be produced without unreasonable effort.
|
|
|
|
|
Notes to the consolidated financial statements (In thousands of Brazilian reais - R$, except if otherwise indicated) |
| 5. | Cash equivalents |
Accounting policy
Cash equivalents are comprised of short-term highly liquid investments with a maturity of three months or less, that are readily convertible to a known amount of cash and subject to an insignificant risk of changes in value.
| Annual yield | 2023 | 2022 | ||||
| Cash equivalents (R$) | 77% CDI (i) | 304,292 | 237,462 | |||
| Cash equivalents (COP) | 13,25% DTF(ii) | 22,003 | 16,951 | |||
| Cash equivalents (US$) | 3.65% a year(iii) | 237,999 | - | |||
| Total cash equivalents | 564,294 | 254,413 |
| (i) | Represents the Brazilian interbank deposit rate, which is an average of the overnight interbank rates in Brazil (the "CDI"). |
| (ii) | Colombian investment rate, which is an average of interbank and corporate finance ("DTF"). |
| (iii) | Average annualized yield obtained in the last year from overseas bank accounts. |
| 6. | Trade receivables |
Accounting policy
Trade receivables correspond to amounts receivable from customers for the sale of goods or services in the ordinary course of the Group’s business.
A receivable is recognized if an amount of consideration that is unconditional is due from the customer (i.e., only the passage of time is required before payment of the consideration is due). Refer to accounting policies of financial assets in Note 7.
| 2023 | 2022 | |||
| Trade receivables (Brazil) | 2,525,845 | 1,639,637 | ||
| Trade receivables (Colombia) | 370,767 | 345,830 | ||
| (-) Allowance for expected credit losses | (188,072) | (151,114) | ||
| Total | 2,708,540 | 1,834,353 | ||
| Current | 2,667,057 | 1,794,602 | ||
| Non-current | 41,483 | 39,751 | ||
The average effective interest rate used to discount trade receivables for the year ended June 30, 2023 was 0.96% per month (1.00% as of June 30, 2022). The Group does not have any customer that represents more than 10% of its trade receivables or revenues.
|
|
|
|
|
Notes to the consolidated financial statements (In thousands of Brazilian reais - R$, except if otherwise indicated) |
As of June 30, 2023, the Group also transferred trade receivables to the FIAGRO in the amount of R$167,278. There were no trade receivables transferred as of June 30, 2022.
As the Group has retained the risks and rewards of ownership, these amounts were not derecognized from trade receivables. Consequently, the liability resulting from these operations is recorded as obligations to FIAGRO quota holders (note 19).
Allowance for expected credit losses
| 2023 | 2022 | 2021 | ||||
| Opening balance | (151,114) | (111,969) | (89,173) | |||
| Increase in allowance | (36,769) | (27,393) | (11,094) | |||
| Allowance for credit losses from acquisitions | (11,702) | (16,274) | (12,623) | |||
| Trade receivables write-off | 9,500 | 3,492 | 3,058 | |||
| Exchange rate translation adjustment | 2,013 | 1,030 | (2,137) | |||
| Ending balance (i) | (188,072) | (151,114) | (111,969) |
| (i) | The credit risk of the Group is described in note 8.b. |
The aging analysis of trade receivables is as follow:
| 2023 | 2022 | |||
| Not past due | 2,089,543 | 1,534,224 | ||
| Overdue | ||||
| 1 to 60 days | 169,556 | 93,436 | ||
| 61 to 180 days | 359,958 | 240,320 | ||
| 181 to 365 days | 90,734 | 7,157 | ||
| Over 365 days | 186,821 | 110,398 | ||
| Allowance for expected credit losses | (188,072) | (151,182) | ||
| 2,708,540 | 1,834,353 |
| 7. | Financial instruments |
Accounting policy
Initial recognition and measurement
(i) Financial assets
Financial assets are classified at initial recognition and subsequently measured at amortized cost or fair value through profit or loss.
|
|
|
|
|
Notes to the consolidated financial statements (In thousands of Brazilian reais - R$, except if otherwise indicated) |
The classification of financial assets at initial recognition depends on the financial asset’s contractual cash flow characteristics and the Group’s business model for managing them. The Group initially measures a financial asset at its fair value plus, in the case of a financial asset not at fair value through profit or loss, transaction costs.
In order for a financial asset to be classified and measured at amortized cost, it needs to give rise to cash flows that are ‘solely payments of principal and interest (SPPI)’ on the principal amount outstanding. This assessment is referred to as the SPPI test and is performed at an instrument level. Financial assets with cash flows that are not SPPI are classified and measured at fair value through profit or loss, irrespective of the business model.
The Group’s business model for managing financial assets refers to how it manages its financial assets in order to generate cash flows. The business model determines whether cash flows will result from collecting contractual cash flows, selling the financial assets, or both. Financial assets classified and measured at amortized cost are held within a business model with the objective to hold financial assets in order to collect contractual cash flows.
Subsequent measurement
For purposes of subsequent measurement, Group’s financial assets are classified in following categories:
• Financial assets at amortized cost
• Financial assets at fair value through profit or loss
Financial assets at amortized cost
Financial assets at amortized cost are subsequently measured using the effective interest method and are subject to impairment. Gains and losses are recognized in profit or loss when the asset is derecognized, modified or impaired.
Financial assets at fair value through profit or loss
Financial assets at fair value through profit or loss are carried in the statement of financial position at fair value with net changes in fair value recognized in the statement of profit or loss.
Derecognition
A financial asset is primarily derecognized when the rights to receive cash flows from the asset have expired.
Impairment
The Group recognizes an allowance for expected credit losses for trade receivables, which is the only debt instrument not held at fair value through profit or loss.
|
|
|
|
|
Notes to the consolidated financial statements (In thousands of Brazilian reais - R$, except if otherwise indicated) |
(ii) Financial liabilities:
The Group classifies its financial liabilities in the following categories: (i) measured at amortized cost and (ii) fair value through profit or loss. Financial liabilities classified as fair value through profit or loss include financial liabilities held for trading and financial liabilities designated upon initial recognition as fair value through profit or loss. Financial liabilities are derecognized when contractual obligations are withdrawn, canceled, or expired. The difference between the extinguished book value and the consideration paid (including transferred assets or assumed liabilities) is recognized in the statement of income.
The Group’s financial instruments were classified according to the following categories:
| 2023 | ||||
| Amortized cost | Fair value through profit or loss | |||
| Assets: | ||||
| Trade receivables | 2,708,540 | - | ||
| Commodity forward contracts | - | 114,861 | ||
| Derivative financial instruments | - | 40,410 | ||
| Restricted cash | 139,202 | - | ||
| Total | 2,847,742 | 155,271 | ||
| Liabilities: | ||||
| Trade payables | 2,578,248 | - | ||
| Lease liabilities | 184,419 | - | ||
| Borrowings | 965,475 | - | ||
| Obligations to FIAGRO quota holders | 150,018 | - | ||
| Payables for the acquisition of subsidiaries | 275,209 | - | ||
| Derivative financial instruments | - | 44,008 | ||
| Salaries and social charges | 223,376 | - | ||
| Commodity forward contracts | - | 207,067 | ||
| Dividends payable | 1,619 | - | ||
| Warrant liabilities | - | 36,446 | ||
| Liability for FPA Shares | 139,133 | - | ||
| Total | 4,517,497 | 287,521 | ||
| 2022 | ||||
| Amortized cost | Fair value through profit or loss | |||
| Assets: | ||||
| Trade receivables | 1,834,353 | - | ||
| Commodity forward contracts | - | 32,800 | ||
| Derivative financial instruments | - | 7,677 | ||
| Restricted cash | 1,344 | - | ||
| Total | 1,835,697 | 40,477 | ||
| Liabilities: | ||||
| Trade payables | 2,301,700 | - | ||
| Lease liabilities | 155,253 | - | ||
| Borrowings | 710,552 | - | ||
| Payables for the acquisition of subsidiaries | 164,431 | - | ||
| Derivative financial instruments | - | 7,121 | ||
| Salaries and social charges | 187,285 | - | ||
| Commodity forward contracts | - | 27,038 | ||
| Dividends payable | 411 | - | ||
| Total | 3,519,632 | 34,159 | ||
The Group considers that assets and liabilities measured at amortized cost, have a carrying value approximate to their fair value and, therefore, information on their fair values is not presented.
| (a) | Hierarchy of fair value |
The Group uses various methods to measure and determine fair value (including market approaches and income or cost approaches) and to estimate the value that market participants would use to price the asset or liability. Financial assets and liabilities carried at fair value are classified and disclosed within the following fair value hierarchy levels:
Level 1 - Quoted prices (unadjusted) in active, liquid and visible markets, for identical assets and liabilities that are readily available at the measurement date;
Level 2 - Valuation techniques for which the lowest level input that is significant to the fair value measurement is directly or indirectly observable; and
Level 3 – Valuation techniques for which the lowest level input that is significant to the fair value measurement is unobservable.
For assets and liabilities that are recognized in the financial statements at fair value on a recurring basis, the Group determines whether transfers have occurred between levels in the hierarchy by re-assessing categorization (based on the lowest level input that is significant to the fair value measurement as a whole) at the end of each reporting period.
All financial instruments accounted for at fair value are classified as level 2, except for the Warrant liability which is classified as level 1. On June 30, 2023 and June 30, 2022, there were no changes in the fair value methodology of the financial instruments and, therefore, there were no transfers between levels.
|
|
|
|
|
Notes to the consolidated financial statements (In thousands of Brazilian reais - R$, except if otherwise indicated) |
| 8. | Financial and capital risk management |
| (a) | Considerations on risk factors that may affect the business of the Group |
The Group is exposed to several market risk factors that might impact its business. The Group’s board of directors is responsible for monitoring these risk factors, as well as establishing policies and procedures to address them. The Group’s risk management structure considers the size and complexity of its activities, which allows for a better understanding of how such risks could impact Group’s strategy through committees and other internal meetings.
Currently, the Group is focused on action plans relating to risks that could have a significant impact on its strategic goals, including those required by applicable regulations. To efficiently manage and mitigate these risks, its risk management structure conducts risk identification and assessments to prioritize the risks that are key to pursuing potential opportunities that may prevent value from being created or that may compromise existing value, with the possibility of impacting its results, capital, liquidity, customer relationships and/or reputation.
The Group’s risk management strategies were developed to mitigate and/or reduce the financial market risks which it is exposed to, which are as follows:
• credit risk
• liquidity risk
• capital risk
• interest rate risk
• exchange rate risk
• commodity price risk in barter transactions
| (b) | Credit risk |
Credit risk is the risk of financial losses if a customer or a counterparty to a financial instrument fails to fulfill its contractual obligations, which arise mainly from the Group’s trade receivables. The Group maintains short-term investments and derivatives with financial institutions approved by its management according to objective criteria for diversification of such risk.
The Group seeks to mitigate its credit risk related to trade receivables by setting forth credit limits for each counterparty based on the analysis of its credit management process. Such credit exposure determination is performed considering the qualitative and quantitative information of each counterparty. The Group also focuses on the diversification of its portfolio and monitors different solvency and liquidity indicators of its counterparties. In addition, primarily for receivables in installments, the Group monitors the balance of allowances for expected credit losses. (see Note 6)
|
|
|
|
|
Notes to the consolidated financial statements (In thousands of Brazilian reais - R$, except if otherwise indicated) |
The main strategies on credit risks management are listed below:
| · | creating credit approval policies and procedures for new and existing customers. |
| · | extending credit to qualified customers through a review of credit agency reports, financial statements and/or credit references, when available. |
| · | reviewing existing customer accounts every twelve months based on the credit limit amounts. |
| · | evaluating customer and regional risks. |
| · | obtaining guarantees through the endorsement of rural producer notes (“CPR”), which give physical ownership of the relevant agricultural goods in the event of the customer’s default. |
| · | establishing credit approval for suppliers in case of payments in advance. |
| · | setting up provisions using the lifetime expected credit loss method considering all possible default events over the expected life of a financial instrument. Receivables are categorized based on the number of overdue days and/or a customer’s credit risk profile. Estimated losses on receivables are based on known troubled accounts and historical losses. Receivables are considered to be in default and are written off against the allowance for credit losses when it is probable that all remaining contractual payments due will not be collected in accordance with the terms of the agreement. |
| · | requiring minimum acceptable counterparty credit ratings from financial counterparties. |
| · | setting limits for counterparties or credit exposure; and |
| · | developing relationships with investment-grade counterparties. |
|
|
|
|
|
Notes to the consolidated financial statements (In thousands of Brazilian reais - R$, except if otherwise indicated) |
The current credit policy sets forth credit limits for customers based on credit score analysis made by the Group’s credit management area. Such score is determined considering the qualitative and quantitative information related to each customer, resulting in a rating classification and a level of requirement of guarantees as follows:
| % Of guarantees required on sales | ||||||||
| Credit rating | % Customers | Risk classification | Medium-sized farmers (i) | Other | ||||
| AA & A | 18% | Very small | 80-90% | 0% | ||||
| B | 49% | Medium | 100% | 30% | ||||
| C & D | 15% | High | 100% | 60% | ||||
| Simplified | 18% | Small farmers | N/A | N/A | ||||
| (i) | Medium-sized farmers ranging between 100 and 10,000 hectares in planted acreage that are typically not serviced directly by agricultural input producers. |
For Colombia there is a similar credit scoring process, however, guarantees are not required based on credit ratings but instead based on qualitative factors such as relationships and past experiences with customers.
Maximum exposure to credit risk as of June 30, 2023 and June 30, 2022:
| 2023 | 2022 | |||
| Trade receivables (current and non-current) | 2,708,539 | 1,834,353 | ||
| Advances to suppliers | 192,119 | 383,257 | ||
| 2,900,658 | 2,217,610 |
| (c) | Liquidity risk |
The Group defines liquidity risk as the risk of financial losses if it is unable to comply with its payment obligations in connection with financial liabilities settled in cash or other financial assets in a timely manner as they become due. The Group’s approach to managing this risk is to ensure that it has sufficient cash available to settle its obligations without incurring losses or affecting the operations. Management is ultimately responsible for managing liquidity risk, which relies on a liquidity risk management model to manage funding requirements and liquidity in the short, medium and long term.
|
|
|
|
|
Notes to the consolidated financial statements (In thousands of Brazilian reais - R$, except if otherwise indicated) |
The Group’s cash position is monitored by its senior management, through management reports and periodic performance meetings. The Group also manages its liquidity risk by maintaining reserves, bank credit facilities and other borrowing facilities deemed appropriate, through ongoing monitoring of forecast and actual cash flows, as well as through the combination of maturity profiles of financial assets and liabilities.
The following maturity analysis of the Group’s financial liabilities and gross settled derivative financial instruments contracts (for which the cash flows are settled simultaneously) is based on the expected undiscounted contractual cash flows from the year end date to the contractual maturity date:
| 2023 | |||||
| Up to 1 year | From 1 to 5 years | Total | |||
| Trade payables | 2,765,354 | 2,547 | 2,767,901 | ||
| Lease liabilities | 91,419 | 111,304 | 202,723 | ||
| Borrowings | 982,318 | 48,382 | 1,030,700 | ||
| Obligations to FIAGRO quota holders | 159,722 | - | 159,722 | ||
| Payables for the acquisition of subsidiaries | 224,689 | 55,242 | 279,931 | ||
| Commodity forward contracts | 210,040 | - | 210,040 | ||
| Derivative financial instruments | 44,639 | - | 44,639 | ||
| Salaries and social charges | 226,583 | - | 226,583 | ||
| Dividends payable | 1,642 | - | 1,642 | ||
| Warrant liabilities | 36,446 | - | 36,446 | ||
| Liability for FPA Shares | - | 139,133 | 139,133 | ||
| 4,742,851 | 356,608 | 5,099,459 | |||
| 2022 | |||||
| Up to 1 year | From 1 to 5 years | Total | |||
| Trade payables | 2,377,256 | - | 2,377,256 | ||
| Lease liabilities | 72,228 | 93,487 | 165,715 | ||
| Borrowings | 709,266 | 31,751 | 741,017 | ||
| Payables for the acquisition of subsidiaries | 114,540 | 55,444 | 169,984 | ||
| Commodity forward contracts | 27,729 | - | 27,729 | ||
| Derivative financial instruments | 7,303 | - | 7,303 | ||
| Salaries and social charges | 188,083 | - | 188,083 | ||
| Dividends payable | 422 | - | 422 | ||
| 3,496,827 | 180,682 | 3,677,509 | |||
| (d) | Capital risk |
The Group manages its capital risk through its leverage policy to ensure its ability to continue as a going concern and to maximize the return of its stakeholders by optimizing its balances of debt and equity.
|
|
|
|
|
Notes to the consolidated financial statements (In thousands of Brazilian reais - R$, except if otherwise indicated) |
The Group's strategy is to maintain the net debt up to 2.2 times the adjusted EBITDA which was achieved by the Group as of June 30, 2023 and 2022.
| (e) | Interest rate risk |
Fluctuations in interest rates, such as the Brazilian interbank deposit rate, which is an average of interbank overnight rates in Brazil, and Colombian investment rate, which is an average of interbank and financial corporation loans, may have an effect on the cost of the Group’s borrowings and new borrowings.
The Group periodically monitors the effects of market changes in interest rates on its financial instruments portfolio. Funds raised by the Group are used to finance working capital for each crop season and are typically raised at short term conditions.
As of June 30, 2023 and June 30, 2022, the Group had no derivative financial instruments used to mitigate interest rate risks.
(i) Sensitivity analysis – exposure to interest rates
To mitigate its exposure to interest rate risk, the Group uses different scenarios to evaluate the sensitivity of variations transactions impacted by the CDI Rate and IBR Rate. The Scenario 1 represents the impact on booked amounts considering the most current (September 2023) CDI Rate and IBR Rate and reflects management’s best estimates. The Scenario 2 and Scenario 3 consider an appreciation of 25% and 50% in such market interest rates, before taxes, which represents a significant change in the probable scenario for sensitivity purposes.
The following table sets forth the potential impacts on the statements of profit or loss:
| 2023 | |||||||
| Expense on profit or loss | |||||||
| Current Index | Scenario 1 | Scenario 2 | Scenario 3 | ||||
| Floating rate borrowings in Brazil | CDI Rate (12.65%) | 149,124 | 177,153 | 205,183 | |||
| Floating rate borrowings in Colombia | IBR Rate (12.75%) | 11,503 | 13,685 | 15,866 | |||
| 160,627 | 190,838 | 221,049 | |||||
| (f) | Exchange rate risk |
The Group is exposed to foreign exchange risk arising from its operations related to agricultural inputs, mainly related to the U.S. dollar, which significantly impacts global prices of agricultural inputs in general. Although all purchases and sales are conducted locally, certain purchase and sales contracts are indexed to the U.S. dollar.
|
|
|
|
|
Notes to the consolidated financial statements (In thousands of Brazilian reais - R$, except if otherwise indicated) |
The Group’s current commercial department seeks to reduce this exposure. Its marketing department is responsible for managing pricing tables and commercial strategies to seek a natural hedge between purchases and sales and to match currency and terms to the greatest extent possible.
The Group’s corporate treasury department is responsible for monitoring the forecasted cash flow exposure to the U.S. dollar, and whenever any mismatches as to terms and currencies are identified, non-deliverable forwards derivative financial instruments are purchased to offset these exposures, and therefore fulfill internal policy requirements. U.S. dollar exposure is managed by macro hedging through the analysis of the forecasted cash flow for the next two harvests. The Group may not have any leveraged derivative position.
The Group’s exchange rate exposure monitoring committee meets periodically across the commercial, treasury and corporate business departments. There are also committees on purchase valuation and business intelligence for the main goods traded by the Group.
The Group does not adopt hedge accounting. Therefore, gains and losses from derivative operations are fully recognized in the statements of profit or loss, as disclosed in Note 30.
(i) Sensitivity analysis – exposure to exchange rates
To gauge its exposure to exchange rate risk, the Group uses different scenarios to evaluate its asset and liability positions in foreign currency and their potential effects on its results.
The Scenario 1 below represents the impact on carrying amounts of the most current (October 2023) market rates for the U.S. dollar (R$5.73 to US$ 1.00). This analysis assumes that all other variables, particularly interest rates, remain constant. The Scenario 2 e Scenario 3 consider the appreciation of the Brazilian real against the US dollar at the rates of 25% and 50%, before taxes, which represents a significant change in the probable scenario for sensitivity purposes.
The following table set forth the potential impacts on the statements of profit or loss:
| 2023 | |||||||
| Effect on profit or loss and | |||||||
| Current Index | Scenario 1 | Scenario 2 | Scenario 3 | ||||
| Trade receivables in U.S. Dollars | 4,7362 | (3,692) | 48,980 | 101,652 | |||
| Trade payables in U.S. Dollars | 4,7362 | 5,747 | (76,243) | (158,233) | |||
| Borrowings in U.S. Dollars | 4,7362 | (2,752) | 36,501 | 75,753 | |||
| Net impacts on commercial operations | (697) | 9,238 | 19,172 | ||||
| Derivative financial instruments | 4,7362 | 646 | (8,557) | (17,760) | |||
| Total impact, net of derivatives | (51) | 681 | 1,412 | ||||
|
|
|
|
|
Notes to the consolidated financial statements (In thousands of Brazilian reais - R$, except if otherwise indicated) |
| (g) | Commodity prices risk in barter transactions |
In all barter transactions mentioned in Note 11, the Group uses future commodity market price as the reference to value the quantities of commodities included in the forward contracts to be delivered by the customers as payment for the Group’s products into currency. The Group uses prices quoted by commodity trading companies to value the grain purchase contracts from farmers. Lavoro enters into grain sale contracts with trading companies or forward derivatives with financial institutions to sell those same grains, at the same price of the purchased contracts with farmers. As such, the Group strategy to manage its exposure to those commodity prices by entering into the purchase and sale contracts at similar conditions.
These transactions are conducted by a corporate department which manages and controls such contracts as well as the compliance of Group’s policies.
(i) Sensitivity analysis – exposure to commodity price
To gauge its exposure to commodity price risk, the Group uses different scenarios to evaluate its asset and liability positions on commodity forward contracts in soybean and corn and their potential effects on its results.
The “current risk” scenario below represents the impact on carrying amounts as of June 30, 2023, with assumptions described in Note 11. The other scenarios consider the appreciation of main assumptions at the rates of 25% and 50%, before taxes, which represents a significant change in the probable scenario for sensitivity purposes.
As of June 30, 2023:
| Tons | Position | Current Risk (i) | Average of contract prices | Current Market (R$/bag) | +25% current | +50% current | |||||||||||
| Position | Market | Impact | Market | Impact | |||||||||||||
| Corn 2023 | 248,796 | Purchased | (140,542) | 67.42 | 35.34 | 44.18 | (35,136) | 53.01 | (70,271) | ||||||||
| Corn 2023 | (248,999) | Sold | 54,190 | 48.39 | 34.96 | 43.70 | 13,548 | 52.44 | 27,095 | ||||||||
| Soybean 2024 | 449,847 | Purchased | (634) | 127.86 | 127.95 | 159.94 | (159) | 191.93 | (317) | ||||||||
| Soybean 2024 | (145,915) | Sold | 4,449 | 143.80 | 145.71 | 182.14 | 1,112 | 218.57 | 2,225 | ||||||||
| Corn 2024 | 54,433 | Purchased | (9,499) | 55.35 | 43.11 | 53.89 | (2,375) | 64.67 | (4,750) | ||||||||
| Corn 2024 | (6,500) | Sold | (170) | 47.44 | 49.28 | 61.60 | (43) | 73.92 | (85) | ||||||||
| Net exposure on grain contracts | 351,662 | Net purchased | (92,206) | (23,053) | (46,103) | ||||||||||||
| Soybean 2024 | (319,271) | Sold on derivatives | (2,761) | 13.25 | 16,56 | (690) | 19,86 | (1,377) | |||||||||
| Corn 2024 | (55,645) | Sold on derivatives | 11,598 | 60.24 | 75,30 | 2,900 | 90,36 | 5,799 | |||||||||
| Net exposure on derivatives | (374,917) | Net sold | 8,837 | 2,210 | 4,422 | ||||||||||||
| Net exposure | (23,255) | (83,369) | (20,843) | (41,681) | |||||||||||||
| (i) | The mismatch on current fair value of Commodity forward contracts for Corn 2023 is related to derivatives contracts that were settled in advance for cash management purposes resulting in an income of R$ 80,990 recognized as finance income. |
|
|
|
|
|
Notes to the consolidated financial statements (In thousands of Brazilian reais - R$, except if otherwise indicated) |
| (h) | Derivative financial investments |
The Group is exposed to market risks mainly related to fluctuations in exchange rates and commodity prices. The Group maintains operations with financial instruments of protection to mitigate exposure to these risks. The Group has been implementing and improving the internal controls to identify and measure the effects of transactions with trading companies and with financial institutions, so that such transactions are captured, recognized and disclosed in the consolidated financial statements. The Group does not carry out investments of a nature speculative in derivatives or any other risk assets. Trading derivatives are classified as current assets or liabilities.
|
|
|
|
|
Notes to the consolidated financial statements (In thousands of Brazilian reais - R$, except if otherwise indicated) |
| June 30, 2023 | June 30, 2022 | |||
| Options (put/call of commodities) | (513) | (5,662) | ||
| Forwards (R$/US$) (i) | 8,837 | (224) | ||
| Swap (R$/US$) | (11,922) | 6,442 | ||
| Derivative financial instruments, net | (3,598) | 556 |
(i) See note 8 (g) that describe the exposure to commodity prices and volume.
| 9. | Inventories |
Accounting policy
Inventories are valued at the lower of cost and net realizable value. The costs of individual items of inventory are determined using weighted average costs less any losses, when applicable.
Net realizable value is the estimated selling price in the ordinary course of business, less estimated costs of completion (when applicable) and the estimated costs necessary to make the sale.
An inventory loss is recognized for inventories that are close to their expiration date and there is no expectation that they will be sold.
| 2023 | 2022 | |||
| Goods for resale | 1,885,941 | 1,759,227 | ||
| (-) Allowance for inventory losses | (17,737) | (10,186) | ||
| Total | 1,868,204 | 1,749,041 |
| 10. | Taxes recoverable |
| 2023 | 2022 | |||
| State VAT (“ICMS”) (i) | 78,805 | 63,671 | ||
| Brazilian federal contributions (ii) | 239,815 | 59,975 | ||
| Colombian federal contributions | 21,284 | 21,016 | ||
| Total | 339,904 | 144,662 | ||
| Current | 57,001 | 93,725 | ||
| Non-current | 282,903 | 50,937 |
| (ii) | Refers to the Brazilian value-added tax on sales and services. The Group’s ICMS relates mainly to the purchase of inputs and the Group has the benefit of a reduced ICMS tax rate. |
| (iii) | Includes: a) credits arising from the Brazilian government’s taxes charged for the social integration program (PIS) and the social security program (COFINS), and Brazilian corporate income tax and social contributions. These credits, which are recognized as current assets, will be used by the Group to offset other Federal taxes; b) withholding and overpaid taxes which can be used to settle overdue or future payable federal taxes; c) withholding income tax on cash equivalents which can be used to offset taxes owed at the end of the calendar year, in case of taxable profit, or are carried forward in case of tax loss; and |
|
|
|
|
|
Notes to the consolidated financial statements (In thousands of Brazilian reais - R$, except if otherwise indicated) |
Income tax Benefits arising from ICMS deduction
During 2022/2023 the Group obtained the benefit of deducting the ICMS benefit explained in item (i) in the income tax calculation. This was applied for the current year tax calculation and for the prior years and generated an income tax credit recorded in the year ended June 30, 2023 in the amount of R$244,717, recorded under “Brazilian federal contributions”.
In accordance with Article 30 of Law No. 12,973/2014, the amount of ICMS benefits must be allocated to the fiscal incentive reserve category when there is sufficient profit in each subsidiary. Additionally, under the same law, these tax benefits must be included in the calculation base for Corporate Income Tax (IRPJ) and Social Contribution on Net Profits (CSLL) when dividends are distributed or capital is refunded to the shareholders of the subsidiaries.
As of June 30, 2023, the amount of fiscal incentive reserve in the subsidiaries is R$358,834 and the balance of the fiscal benefit not yet allocated due to insufficient profits for this allocation stands at R$680,396. The Group has no intention to make our subsidiaries to distribute the incentive amounts to the parent. In the event of dividend distribution taxation will apply, as per the provisions of tax laws.
| 11. | Commodity forward contracts – Barter transactions |
For certain contracts with customers, the Group carries out term sales of agricultural inputs (e.g., fertilizers, crop chemicals, seeds) in exchange for future delivery of grains, mainly soybeans and corn, at the time of their harvest (“Barter transactions").
A contract (grain purchase agreement) is signed between the Group and the customer, pursuant to which Lavoro and the customer agree on an amount of commodity, to be delivered at harvesting, which is equivalent to the total sales price based on the future commodity price on the date in which the contract with the customer is entered into. The customers’ main obligation under this contract is to deliver the agreed upon volume of commodities as payment at a future date.
Contemporaneously, the Group enters into a future grain sale agreement with a commodity trading company, pursuant to which the Group is committed to deliver the commodity to be received by the customer under the inputs sales transaction. The Group strategy is to sign this agreement for the same quantity and the same terms of the contract between the Group and its customer. While this physical sale of the grains is not concluded with trading companies, the Group may enter into a derivative contract on commodity and futures exchanges such as CBOT, ICE, or B3, in an equivalent term associated with the physical grain purchases. This aims to mitigate exposure to price fluctuations. Consequently, the Group maintains these derivative contracts to naturally hedge against market volatility. As soon as the physical sale of the grains is concluded, the derivative contracts are promptly liquidated to realize the hedging gains or losses.
|
|
|
|
|
Notes to the consolidated financial statements (In thousands of Brazilian reais - R$, except if otherwise indicated) |
In the event the customer fails to deliver the committed commodity amount upon harvesting, for example due to a significant increase in the commodity price the Group is required to:
• purchase the commodity in the spot market and deliver it to the commodity trading company; or
• pay compensation to the commodity trading company in an amount equal to the difference between the commodity price between the time of delivery and the time of closing of the agreement (“washout risk”).
The Group is entitled to charge its customers for any losses arising from the settlement of its obligations above with the commodity trading companies.
Even though these agreements are settled physically (grains purchase and sale), under IFRS 9, the Group designates, at initial recognition, such forward contracts as measured at fair value through profit and losses (FVTPL).
The fair value of the commodity forward contracts, entered into with the customer and the commodity trading company is estimated based on information available in the market and specific valuation methodologies, and discounted to present value, considering the contractual terms and the current market prices for such commodities. Such contracts are disclosed on a gross basis in the statement of financial position.
Critical accounting estimates and judgments
Fair value of commodity forward contracts is estimated on a regional basis, and they are based on the commodity prices available at exchange future markets, over the counter premium data quoted by market players and the expected freight costs estimated by the Group considering historical inland freight data.
As of June 30, fair value of commodity forward contracts is as follows:
| 2023 | 2022 | |||
| Fair value of commodity forward contracts: | ||||
| Assets | ||||
| Purchase contracts | 53,695 | 16,054 | ||
| Sale contracts | 61,166 | 16,746 | ||
| 114,861 | 32,800 | |||
| Liabilities | ||||
| Purchase contracts | (206,881) | (14,995) | ||
| Sale contracts | (186) | (12,043) | ||
| (207,067) | (27,038) |
|
|
|
|
|
Notes to the consolidated financial statements (In thousands of Brazilian reais - R$, except if otherwise indicated) |
The changes in fair value recognized in the statements of profit or loss are in note 30.
The main assumptions used in the fair value calculation are as follows:
|
Outstanding Volume (tons)
|
Average of contract prices R$/Bag |
Average Market Prices (Corn R$/bag (ii); Soybean US$/bu(i)) |
Soybean market premium (US$/bu) |
Freight (R$/ton)
|
|
| Purchase Contracts | |||||
| Soybean | |||||
| As of June 30, 2022 | 81,379 | 147.65 | 14.52 | 0.4 | 358.55 |
| As of June 30, 2023 | 449,847 | 127.95 | 13.16 | (0.3) | 293.65 |
| Corn | |||||
| As of June 30, 2022 | 181,475 | 67.47 | 86.95 | N/A | 381.00 |
| As of June 30, 2023 | 303,432 | 65.25 | 56.04 | N/A | 282.23 |
| Selling Contracts | |||||
| Soybean | |||||
| As of June 30, 2022 | 70,191 | 147.46 | 14.56 | 0.5 | 367.46 |
| As of June 30, 2023 | 145,915 | 145.71 | 13.16 | 0.0 | 0.0 |
| Corn | |||||
| As of June 30, 2022 | 114,063 | 67.45 | 87.06 | N/A | 451.83 |
| As of June 30, 2023 | 255,499 | 48.36 | 56.04 | N/A | 284.59 |
| (i) | Market price published by Chicago Board of Trade which is a futures and options exchange in United States. |
| (ii) | Market price published by B3 – Brasil, Bolsa, Balcão which is a futures, options and stock exchange in Brazil. |
| 12. | Advances to suppliers |
Advances to suppliers arise from the “Cash purchases” modality, in which the Group advances payments to suppliers of agricultural inputs at the beginning of a harvest and before the actual physical delivery of the products. These advances are short-term and are part of the strategy of formation of margins and guarantee of quality and product supply.
| 13. | Right-of-use assets and lease liabilities |
Accounting policy
The Group leases commercial buildings for its administrative functions, retail stores, equipment, and vehicles. In general, lease agreements have a term of three years to eight years, but they may include extension options.
Lease terms are individually negotiated and contain differentiated terms and conditions. The lease contracts do not contain restrictive clauses, but the leased assets cannot be used as collateral for loans.
|
|
|
|
|
Notes to the consolidated financial statements (In thousands of Brazilian reais - R$, except if otherwise indicated) |
Right of use assets:
The Group recognizes right-of-use assets at the commencement date of the lease. Right-of-use assets are measured at cost, less any accumulated depreciation and impairment losses, and adjusted for any remeasurement of ease liabilities. The cost of right-of-use assets includes the amount of lease liabilities recognized, initial direct costs incurred, and lease payments made at or before the commencement date less any lease incentives received. Right-of-use assets are depreciated on a straight-line basis over the shorter of the lease term and the estimated useful lives of the assets, as follows:
| Vehicles | 3.4 years |
| Buildings | 4.9 years |
| Machines and equipment | 3 years |
Lease liabilities:
At the commencement date of the lease, the Group recognizes lease liabilities measured at the present value of lease payments to be made over the lease term. The lease payments include:
| ● | fixed payments (including fixed payments in essence, less any incentives from |
| ● | amounts expected to be paid by the lessee in accordance with residual value guarantees; |
| ● | payments of fines for lease termination if the lease term reflects the lessee exercising the option to terminate the lease. |
Lease payments are discounted using the lessee's incremental borrowing rate, which is the rate a lessee would have to pay on a loan to obtain the funds necessary to acquire an asset of similar value in a similar economic environment with equivalent terms and conditions.
In determining the incremental borrowing rate, the Group:
| ● | whenever possible, uses as a starting point rates from recent financing contracts third-party financing, adjusted to reflect changes in financing conditions since such third-party financing was received; |
| ● | uses a progressive approach that starts from a risk-free interest rate adjusted for credit risk |
| ● | uses a progressive approach that takes a risk-free interest rate adjusted for credit risk for leases held by the Group with no recent third-party financing; and |
| ● | makes specific adjustments to the rate, such as to term, country, currency and collateral. |
Lease payments are allocated between principal and finance expense. Finance expense is recognized in the statement of profit or loss over the lease term to produce a constant periodic rate of interest on the remaining balance of the liability for each year.
|
|
|
|
|
Notes to the consolidated financial statements (In thousands of Brazilian reais - R$, except if otherwise indicated) |
Payments associated with short-term leases of equipment and vehicles and all and leases of low-value assets are recognized as incurred as an expense in income statement. Short-term leases are those with a term of 12 months or less. Low-value assets include IT equipment, small items of office furniture and other contracts of small value.
As of June 30, 2023 and 2022, the Group had no lease agreements with variable lease payments.
|
|
|
|
|
Notes to the consolidated financial statements (In thousands of Brazilian reais - R$, except if otherwise indicated) |
| (a) | Right-of-use assets |
| Vehicles | Buildings | Machinery and equipment | Total | |||||
| Cost | 74,604 | 124,594 | 46,110 | 245,308 | ||||
| Accumulated depreciation | (28,756) | (60,564) | (15,809) | (105,129) | ||||
| Balance at June 30, 2022 | 45,848 | 64,030 | 30,301 | 140,179 | ||||
| Cost | 120,052 | 141,915 | 73,236 | 335,203 | ||||
| Accumulated depreciation | (54,560) | (77,732) | (29,232) | (161,524) | ||||
| Balance at June 30, 2023 | 65,492 | 64,183 | 44,004 | 173,679 |
5% of the accumulated cost of right-of-use assets as of June 30, 2023 come from business acquisitions occurred during the year ended June 30, 2023.
Right-of-use assets amortization expense for the year ended June 30, 2023 was R$ 56,236 (R$50,171 for the year ended June 30, 2022)
| (b) | Lease liabilities |
| 2023 | 2022 | |||
| Vehicles | 68,420 | 49,588 | ||
| Buildings | 85,839 | 80,768 | ||
| Machinery and equipment | 30,160 | 24,897 | ||
| Total | 184,419 | 155,253 | ||
| Current | 85,865 | 69,226 | ||
| Non-current | 98,554 | 86,027 |
Total interest on lease liabilities incurred for the year ended June 30, 2023 was R$16,977 (R$13,217 for the year ended June 30, 2022).
|
|
|
|
|
Notes to the consolidated financial statements (In thousands of Brazilian reais - R$, except if otherwise indicated) |
| 14. | Property, plant and equipment |
Accounting policy
Items of property, plant and equipment are measured at historical cost of acquisition or construction, less accumulated depreciation. When significant parts of an item of property, plant and equipment have different useful lives, they are recorded as separate items (major components) of property, plant and equipment. Any gains and losses on the disposal of an item of property, plant and equipment are recognized in the statement of profit or loss. Subsequent costs are capitalized only when it is probable that future economic benefits associated with the expenditure will be earned by the Group.
Depreciation is calculated and its residual values estimated, using the straight-line method based on the estimated useful lives of the items. Depreciation is recognized in the statement of profit or loss. Land is not depreciated. The estimated useful lives of property, plant and equipment are as follows:
| Vehicles | 5 years |
| Building and Improvements | 25 years |
| Machines, equipment and facilities | 10 years |
| Furnitures and fixtures | 10 years |
| Computer equipments | 5 years |
The Group uses an estimated useful life of the assets to depreciate property, plant and equipment. At the end of each fiscal year, this estimate is reviewed and, if necessary, adjusted prospectively.
An asset's carrying amount is written down immediately to its recoverable amount when the asset's carrying amount is higher than its estimated recoverable value.
Gains and losses on disposals are determined by comparing the proceeds from the sale with the carrying amount and are recognized under "Other (expenses) income, net" in the statement of profit or loss.
|
|
|
|
|
Notes to the consolidated financial statements (In thousands of Brazilian reais - R$, except if otherwise indicated) |
| (a) | Property, plant and equipment balance is as follows: |
| Vehicles | Lands, buildings and improvements | Machines, equipment and facilities | Furniture and fixtures | Computer equipment | Total | |||||||
| Cost | 36,316 | 99,541 | 53,699 | 11,892 | 4,372 | 205,820 | ||||||
| Accumulated depreciation | (26,208) | (7,968) | (18,581) | (5,031) | (1,827) | (59,615) | ||||||
| Balance at June 30, 2022 | 10,108 | 91,573 | 35,118 | 6,861 | 2,545 | 146,205 | ||||||
| Cost | 40,851 | 142,561 | 75,134 | 15,610 | 10,015 | 284,171 | ||||||
| Accumulated depreciation | (31,349) | (14,698) | (26,817) | (7,198) | (7,521) | (87,583) | ||||||
| Balance at June 30, 2023 | 9,502 | 127,863 | 48,317 | 8,412 | 2,494 | 196,588 |
Depreciation expense of property, plant and equipment for the year ended June 30, 2023 was R$16,408 (R$9,697 for the year ended June 30, 2022).
|
|
|
|
|
Notes to the consolidated financial statements (In thousands of Brazilian reais - R$, except if otherwise indicated) |
| 15. | Intangible assets |
Accounting policy
Intangible assets are recorded at acquisition cost or at the fair value of intangible assets acquired in a business combination and, for finite useful life intangibles, less accumulated amortization calculated using the straight-line method. These intangible assets have useful lives defined based on the useful economic life.
The goodwill arising on a business combination is initially measured as the excess of the consideration transferred over the fair value of the net assets acquired (net identifiable assets acquired and liabilities assumed). Subsequent to initial recognition, goodwill is measured at cost, less any accumulated impairment losses, as described in Note 16.
The useful lives and methods of amortization of intangibles are reviewed at each balance sheet date and adjusted prospectively, if appropriate.
The estimated useful lives of intangible assets for the years ended June 30, 2023 and 2022 are as follows:
| Customer relationship | 9 years |
| Purchase contacts | 4 years |
| Software and other | 5 years |
An intangible asset is derecognized upon disposal or when no future economic benefits are expected, and any gain or loss is recognized in the statement of profit or loss when the asset is derecognized.
The impairment policy for intangibles is described in note 16.
|
|
|
|
|
Notes to the consolidated financial statements (In thousands of Brazilian reais - R$, except if otherwise indicated) |
| (b) | Intangible assets balance is as follows: |
| Goodwill | Customer relationship | Purchase contracts and brands | Software and other | Total | |
| Cost: | |||||
| At June 30, 2020 | 259,526 | 138,179 | 204 | 4,599 | 402,508 |
| Additions | - | - | - | 32,015 | 32,015 |
| Business combinations | 137,190 | 118,046 | 14,827 | 1,966 | 272,029 |
| At June 30, 2021 | 396,716 | 256,225 | 15,031 | 38,580 | 706,552 |
| Additions | - | - | - | 17,793 | 17,793 |
| Business combinations (i) | 71,348 | 45,922 | 8,764 | - | 126,034 |
| Translation adjustment | (1,559) | (670) | (1,949) | - | (4,178) |
| Other (ii) | (14,531) | - | - | - | (14,531) |
| At June 30, 2022 | 451,974 | 301,477 | 21,846 | 56,373 | 831,670 |
| Additions | - | - | - | 5,025 | 5,025 |
| Business combinations (i) | 98,890 | 50,600 | 1,207 | - | 150,698 |
| Other (iii) | (3,201) | - | - | - | (3,201) |
| Translation adjustment | (998) | (666) | (48) | (10) | (1,722) |
| At June 30, 2023 | 546,665 | 351,412 | 23,005 | 61,388 | 982,470 |
| Amortization: | |||||
| At June 30, 2020 | - | 19,344 | 4 | 676 | 20,024 |
| Amortization for the year | - | 26,416 | 1,081 | 2,221 | 29,718 |
| At June 30, 2021 | 45,760 | 1,085 | 2,897 | 49,742 | |
| Amortization for the year | - | 43,742 | 5,844 | 8,021 | 57,607 |
| At June 30, 2022 | - | 89,502 | 6,929 | 10,918 | 107,349 |
| Amortization for the year | - | 50,263 | 8,983 | 8,682 | 67,928 |
| At June 30, 2023 | - | 139,765 | 15,912 | 19,600 | 175,277 |
| At June 30, 2022 | 451,974 | 211,975 | 14,917 | 45,455 | 724,321 |
| At June 30, 2023 | 546,665 | 211,646 | 7,093 | 41,788 | 807,192 |
(i) Balances arising from business combinations (Note 21).
(ii) Balances arising from the adjustment in the purchase price from acquisition of Desempar and Cultivar, which occurred in the year ended June 30, 2021. The consideration for each acquisition was subject to post-closing price adjustments, based on the working capital variations of the purchased company.
(iii) Balance arising from the adjustment in the purchase price from acquisition of Agrozap, which occurred in the year ended June 30, 2022. The consideration for the acquisition was subject to post-closing price adjustment, based on the working capital variations of the purchased company.
|
|
|
|
|
Notes to the consolidated financial statements (In thousands of Brazilian reais - R$, except if otherwise indicated) |
| 16. | Impairment testing of non-financial assets |
Accounting policy
The carrying amount of the Group’s non-financial assets are reviewed at each reporting date to assess whether there is an indication of impairment. This indication may be due to internal factors arising from the operational efficiency of the assets or external factors due to the macroeconomic scenario and the behavior of the commodity prices and the U.S. dollar. If there is such indication, the recoverable amount of the asset is estimated. The recoverable amount of an asset is defined as the higher of the fair value of the asset and the value in use of its CGU, unless the asset does not generate cash inflows that are largely independent of those from other assets or groups of assets.
When the carrying amount of an asset or CGU exceeds its recoverable amount, the asset is considered impaired and a provision for impairment is recognized to adjust the carrying amount to its recoverable amount. In assessing value in use, the estimated future cash flow is discounted to present value using a pre-tax discount rate that reflects current market assessments of the time value of money and the risks specific to the asset.
Impairment losses are recognized in the statement of profit or loss in expense categories consistent with the function of the impaired asset, when applicable. A previously recognized impairment loss is reversed only if there has been a change in the assumptions used to determine the asset’s recoverable amount since the last impairment loss was recognized, except in the case of goodwill that cannot be reversed in future periods.
The Group assessed its business segments by grouping the assets of each region into independent cash-generating units (“CGUs”), which represent the smallest identifiable group of assets that generates cash inflows that are largely independent of the cash inflows from other assets or groups of assets.
Critical accounting estimates and judgments
The Group determines its cash flows based on the budgets approved by its management, which use the following assumptions: (i) revenue growth rate (ii) margins applied to the cost of sale of its products; and (iii) discount rates that reflect specific risks of each CGU. These assumptions are subject to risks and uncertainties. Therefore, it is possible that changes in circumstances may alter these projections, which may affect the recoverable amount of the assets.
Business segments are composed by certain CGUs as follows:
| Segment | Identified CGUs | |
| LATAM Cluster | Colombia CGU | |
| Brazil Cluster | North CGU, East CGU, South CGU | |
| Crop Care Cluster | Biological products and special fertilizers CGU |
|
|
|
|
|
Notes to the consolidated financial statements (In thousands of Brazilian reais - R$, except if otherwise indicated) |
Goodwill arising from business combinations are allocated to the CGUs that benefited from the acquisition and are tested for impairment at that level.
The Group consistently monitors whether new CGUs are identified, and whether they are justifiable.
The main assumptions used in the impairment test are as follows:
| Cash-generating unit | Revenue growth rate | Operating margin average | Pre Tax discount rate | Recoverable amount |
| Colombia CGU | 15.2% | 16.0% | 12.0% | 854,088 |
| North CGU | 11.5% | 15.1% | 13.2% | 1,034,123 |
| East CGU | 13.4% | 11.6% | 13.2% | 2,053,650 |
| South CGU | 15.6% | 21.9% | 13.2% | 2,212,679 |
| Biological products and special fertilizers CGU | 21.2% | 24.7% | 13.2% | 1,643,008 |
As a result of this analysis, the Group did not record any impairment loss. As the value in use of these assets is significantly higher than their carrying amount, there was no reasonably possible change in a key assumption that would trigger any impairment recognition.
| 17. | Trade payables |
Accounting policy
Trade payables related to the purchase of goods for resale of agricultural inputs are financial liabilities (see Note 7) initially recognized at fair value and subsequently stated at amortized cost using the effective interest rate method.
| (a) | Trade payables |
| 2023 | 2022 | |||
| Trade payables – Brazil | 2,268,420 | 1,990,089 | ||
| Trade payables – Colombia | 309,828 | 311,611 | ||
| Total | 2,578,248 | 2,301,700 | ||
| Current | 2,575,701 | 2,301,700 | ||
| Non-current | 2,547 | - |
|
|
|
|
|
Notes to the consolidated financial statements (In thousands of Brazilian reais - R$, except if otherwise indicated) |
The average effective interest rate used to discount trade payables for the year ended June 30, 2023 was 1.58% per month (1.18% as of June 30, 2022).
| (b) | Guarantees |
The Group acquires guarantees with financial institutions in connection with installment purchases of agricultural inputs from certain suppliers. These guarantees are represented by short-term bank guarantees and endorsement to the supplier of CPRs obtained from customers in the sale process. The amount of these guarantees as of June 30, 2023 was R$920,870 (R$506,750 as of June 30, 2022).
| (c) | Trades payable — Supplier finance |
During the year ended June, 30, 2023, the Group signed agreements with financial institutions to negotiate with suppliers to extend the payment terms and discounting of trade receivable from its suppliers, with interest rates ranging from 1 and 1.5 per month. When trade payable is included in this transaction, such amount is transferred from “Trade Payables” to “Trades payable — Supplier finance”. The Group did not sign supplier finance agreements for the year ended June 30, 2022.
| 18. | Borrowings |
Accounting policy
Borrowings are financial liabilities initially recognized at fair value, net of transaction costs incurred in the transaction and are subsequently stated at amortized cost.
Any difference between the borrowed amounts (net of transaction costs) and total payments is recognized in the statement of profit or loss over the year during which the borrowings are outstanding using the effective interest rate method.
| 2023 | 2022 | |||
| Borrowing in Colombia | 71,562 | 39,755 | ||
| Borrowings in Brazil | 893,913 | 670,797 | ||
| Total borrowings | 965,475 | 710,552 |
The Group’s borrowings are contracted for the purpose of strengthening the working capital and have repayment terms scheduled in conjunction with the operating cycles of each harvest.
|
|
|
|
|
Notes to the consolidated financial statements (In thousands of Brazilian reais - R$, except if otherwise indicated) |
| (a) | Debt composition |
| Average interest rate 2023 (i) | 2023 |
Average interest rate 2022(i) |
2022 | ||||
| Debt contracts in Brazil in: | |||||||
| R$, indexed to CDI (ii) (iv) | 16.62% | 725,563 | 14,45% | 525,099 | |||
| R$, with fixed interest (iv) | 8.76% | 8,590 | - | - | |||
| U.S. Dollars, with fixed interest (iv) | 4.03% | 159,760 | 3,16% | 145,698 | |||
| Debt contracts in Colombia in: | |||||||
| COP, indexed to IBR (iii) / (iv) | 15.43% | 69,862 | 14,26% | 39,755 | |||
| COP, with fixed interest (iv) | 15.72% | 1,700 | - | - | |||
| Total | 965,475 | 710,552 | |||||
| Current | 922,636 | 681,217 | |||||
| Non-current | 42,839 | 29,335 |
| (i) | In order to determine the average interest rate for debt contracts with floating rates, the Group used the rates prevailing during the years. |
| (ii) | Brazilian reais denominated debt that bears interest at the CDI Rate (see Note 8 for a definition of those indexes), plus spread. |
| (iii) | Colombian peso-denominated debt that bears interest at the IBR rate (see Note 8 for a definition of those indexes), plus spread. |
| (iv) | The borrowings are guaranteed by R$822 of transferred credit rights (see note 6). |
| (b) | Movement in borrowings |
| At June 30, 2020 | 168,571 |
| Proceeds from borrowings | 466,280 |
| Repayment of principal amount | (472,909) |
| Accrued interest | 33,971 |
| Borrowings from acquired companies | 76,915 |
| Interest payment | (30,424) |
| At June 30, 2021 | 242,404 |
| Proceeds from borrowings | 615,984 |
| Repayment of principal amount | (299,613) |
| Accrued interest | 74,081 |
| Borrowings from acquired companies | 85,097 |
| Interest payment | (7,401) |
| At June 30, 2022 | 710,552 |
| Proceeds from borrowings | 1,449,445 |
| Repayment of principal amount | (1,456,017) |
| Accrued interest | 319,557 |
| Borrowings from acquired companies | 25,756 |
| Exchange rate translation | 11,921 |
| Interest payment | (95,739) |
| At June 30, 2023 | 965,475 |
|
|
|
|
|
Notes to the consolidated financial statements (In thousands of Brazilian reais - R$, except if otherwise indicated) |
| (c) | Schedule of maturity of noncurrent portion of borrowings |
The installments are distributed by maturity year:
| 2023 | 2022 | |
| 2023 | - | 4,509 |
| 2024 | 726 | 23,842 |
| 2025 | 15,452 | 929 |
| 2026 | 1,376 | 55 |
| 2027 | 25,285 | - |
| Total | 42,839 | 29,335 |
| (d) | Covenants |
The Group has no financial covenants as of June 30, 2023.
On July 22, 2022, the Group entered into an agreement to transfer receivables in the aggregate amount of R$160,000 to FIAGRO, a structured entity, as defined by IFRS 10, established under Brazilian law designed specifically for investing in agribusiness credit rights receivables. The acquisition of such receivables by the FIAGRO investment fund enables the Group to anticipate the receipt of funds from such receivables.
The Group holds all subordinated quotas issued by the FIAGRO, representing approximately 5% of the total outstanding quotas in an aggregate amount of R$8,100 while other parties hold all senior and mezzanine quotas, representing approximately 95% of the total outstanding quotas, which includes certain of Patria’s related parties that acquired the mezzanine quotas of FIAGRO in an aggregate amount of R$56,000. Under the terms of the FIAGRO, we are not liable in case there is a default on the credit rights acquired by the fund, but any such default may adversely affect our stake in FIAGRO quotas. Our agreement to assign certain credit rights to FIAGRO will expire when all assigned receivables have been liquidated.
The bylaws of the FIAGRO were established by the Group at their inception, and grant the Group significant decision-making authority over these entities, such as the right to determine which credits rights are eligible to be acquired by the FIAGRO.
|
|
|
|
|
Notes to the consolidated financial statements (In thousands of Brazilian reais - R$, except if otherwise indicated) |
In addition, senior and mezzanine quota holders receive interest at a benchmark rate of return ranging from the CDI rate + 2.45% per year up to the CDI rate + 8.0% per year. Residual returns from the FIAGRO fund, if any, are paid on the subordinated quotas, which do not bear interest and are not otherwise entitled to any pre-established rate of return. Senior and mezzanine quotas amortize annually over a three-year period after an initial 24-month grace period, whereas subordinated quotas amortize at the end of the fifth annual period.
In accordance with IFRS 10, we concluded we control FIAGRO and, therefore, it is consolidated in our financial statements. The senior and mezzanine quotas are accounted for as a financial liability under “Obligations to FIAGRO quota holders” and the remuneration paid to senior and mezzanine quota holders is recorded as interest expense.
The purchase agreements for acquisition of subsidiaries include payments to the seller in the event of successful collection, after the acquisition date of outstanding receivables and certain tax credits subject to administrative proceedings. See Note 21.
Consideration paid during the year ended June 30, 2023, net of cash acquired, was R$157,442 which includes installment payments for acquisitions completed in previous years in the amount of R$101,889 (R$198,305 on June 30, 2022, which includes payments for acquisitions made in previous years in the amount of R$125,439 and R$280,374 on June 30, 2021 which includes acquisitions made in previous years in amount of R$81,396). All these payments are included in the “Acquisition of subsidiary, net of cash acquired” in the cash flows.
Accounting policy
The acquisition method is used to account for each business combination carried out by the Group, which consists of the following:
• Determining the acquisition date;
• Determining the acquirer and the acquiree;
• Determining the consideration transferred for the acquisition of control;
• Determining the fair value of separately identifiable assets and liabilities; and
• Determining the residual goodwill or gain on bargain purchase.
The acquisition date is typically the date on which the Group assumes the control of the business.
Consideration transferred is measured at the acquisition date at the fair value of the assets transferred, including cash, the liabilities incurred, and the equity instruments issued by the Group at the acquisition date.
For each business combination, the Group measures the non-controlling interests in the acquiree based on its share of the subsidiary’s identifiable net assets. Acquisition-related costs are expensed as incurred.
|
|
|
|
|
Notes to the consolidated financial statements (In thousands of Brazilian reais - R$, except if otherwise indicated) |
When the Group acquires a business, it assesses the fair value of the assets and liabilities assumed in order to allocate them according to the contractual terms, economic circumstances and pertinent conditions at the acquisition date.
Any contingent consideration to be transferred by the acquirer is recognized at the acquisition date fair value. Subsequent changes in the fair value of the contingent consideration, considered an asset or a liability, shall be recognized in accordance with IFRS 9 Financial Instruments, in the statement of profit or loss.
Goodwill or a gain on bargain purchase is the difference between the fair value of the assets acquired and liabilities assumed, and the consideration transferred. When the consideration transferred is higher than the fair value of the net assets acquired goodwill is recognized for the difference, and it is subsequently tested for impairment. When the consideration transferred is lower that the fair value of net assets acquired, a gain on bargain purchase is recognized in the statement of profit or loss.
Intangible assets recognized within the scope of a business combination are accounted for in accordance with the accounting policy described in Note 15.
Critical accounting estimates and judgments
Accounting for business combination requires the Group to exercise critical judgment in determining the fair value of the assets and liabilities of the businesses being acquired. Accordingly, the Group makes certain assumptions about future conditions that are uncertain, including future commodity prices, interest rates, inflation and weather conditions.
Changes in some of these assumptions may impact the Group’s business and expected results may differ materially from the estimated amounts at the acquisition date.
The Group entered into several agreements to acquire groups of companies to expand its business into new markets or territories, add additional facilities, bolster its competitive edge, or acquire and access new technologies and skillsets.
|
|
|
|
|
Notes to the consolidated financial statements (In thousands of Brazilian reais - R$, except if otherwise indicated) |
| (a) | Acquisitions in the year ended June 30, 2023 |
The fair value of the identifiable assets and liabilities, consideration transferred and goodwill as of the date of each acquisition was:
| Fair value as of the acquisition date | |||||||||||
| Assets | Floema (e) |
Casa Trevo (f) |
Provecampo (g) |
Sollo Sul and Dissul (h) |
Cromo (i) |
Total | |||||
| Cash equivalents | 24,167 | 12,306 | 10,479 | 16,307 | 8,735 | 71,994 | |||||
| Trade receivables | 19,892 | 32,106 | 7,499 | 132,467 | 11,907 | 203,871 | |||||
| Inventories | 52,133 | 61,734 | 11,320 | 84,226 | 5,311 | 214,724 | |||||
| Other assets | 11,739 | 4,750 | 23 | 46,663 | 664 | 63,839 | |||||
| Property, plant and equipment | 1,152 | 867 | 983 | 2,372 | 3,151 | 8,525 | |||||
| Intangible assets | 14,879 | 1,676 | 12,117 | 2,083 | 2,722 | 33,477 | |||||
| 123,962 | 113,439 | 42,421 | 284,118 | 32,490 | 596,430 | ||||||
| Liabilities | |||||||||||
| Trade payables | 88,902 | 48,070 | 10,980 | 80,811 | 1,200 | 229,963 | |||||
| Borrowings | - | - | - | 25,756 | - | 25,756 | |||||
| Provision for contingencies | - | 10,245 | - | - | - | 10,245 | |||||
| Other liabilities | 1,543 | 13,659 | 6,910 | 87,921 | 4,056 | 114,089 | |||||
| 90,445 | 71,974 | 17,890 | 194,488 | 5,256 | 380,053 | ||||||
| Total identifiable net assets at fair value | 33,517 | 41,465 | 24,531 | 89,630 | 27,233 | 216,376 | |||||
| Non-controlling interests (1) | (6,220) | - | - | (8,169) | (14,389) | ||||||
| Goodwill arising on acquisition | 25,796 | 9,625 | 2,010 | 57,719 | 5,331 | 100,481 | |||||
| Consideration transferred | 59,313 | 44,870 | 26,541 | 147,349 | 24,395 | 302,468 | |||||
| Cash paid | 25,294 | 23,619 | 17,682 | 52,832 | 8,120 | 127,547 | |||||
| Shares issued (1) | 12,296 | - | - | - | - | 12,296 | |||||
| Payable in installments | 21,723 | 21,251 | 8,859 | 94,517 | 16,275 | 162,625 | |||||
(1) The total of non-controlling interests and shares issued represents the acquisition of subsidiaries presented in the statement of changes in equity.
|
|
|
|
|
Notes to the consolidated financial statements (In thousands of Brazilian reais - R$, except if otherwise indicated) |
| (b) | Acquisitions in the year ended June 30, 2022 |
The fair value of the identifiable assets and liabilities, consideration transferred and goodwill as of the date of each acquisition was:
| Fair value as of the acquisition date | |||||||||||||
| Assets | Produtiva (j) | Cenagro (k) | Cenagral (l) | Union Agro (m) | Agrozap (n) | Nova Geração (o) | Total | ||||||
| Cash and cash equivalents | 53,699 | 2,142 | 1,064 | 66,256 | 9,028 | 1,617 | 133,806 | ||||||
| Trade receivables | 27,610 | 11,792 | 7,492 | 117,882 | 98,201 | 47,978 | 310,955 | ||||||
| Inventories | 46,261 | 22,670 | 5,833 | 42,435 | 85,683 | 9,631 | 212,513 | ||||||
| Other assets | 8,472 | 12,225 | 1,023 | 4,524 | 22,204 | 2,893 | 51,341 | ||||||
| Property, plant and equipment | 1,223 | 1,266 | 363 | 26,659 | 2,642 | 585 | 32,738 | ||||||
| Intangible assets | 26,074 | 2,602 | 7,437 | 8,293 | 6,015 | 4,265 | 54,686 | ||||||
| 163,339 | 52,697 | 23,212 | 266,049 | 223,773 | 66,969 | 796,039 | |||||||
| Liabilities | |||||||||||||
| Trade payables | 77,063 | 17,008 | 2,097 | 24,750 | 136,086 | 37,532 | 294,536 | ||||||
| Borrowings | - | 3,045 | - | 25,157 | 50,701 | 6,194 | 85,097 | ||||||
| Provision for contingencies | - | - | - | 11,362 | - | 11,362 | |||||||
| Other liabilities | 8,898 | 18,410 | 5,750 | 9,923 | 25,029 | 743 | 68,753 | ||||||
| 85,961 | 38,463 | 7,847 | 71,192 | 211,816 | 44,469 | 459,748 | |||||||
| Total identifiable net assets at fair value | 77,378 | 14,234 | 15,365 | 194,857 | 11,957 | 22,500 | 336,291 | ||||||
| Non-controlling interests (1) | - | (2,847) | (3,073) | (52,611) | (4,215) | - | (62,746) | ||||||
| Goodwill arising on acquisition | 9,491 | 11,468 | 9,003 | - | 33,218 | 8,168 | 71,348 | ||||||
| Gain on bargain purchase | - | - | - | (18,295) | - | (18,295) | |||||||
| Consideration transferred | 86,869 | 22,855 | 21,295 | 123,951 | 40,960 | 30,668 | 326,598 | ||||||
| Cash paid | 36,385 | 16,724 | 15,376 | 103,800 | 18,813 | 15,574 | 206,672 | ||||||
| Shares issued (1) | 22,500 | - | - | - | - | 7,807 | 30,307 | ||||||
| Payable in installments | 27,984 | 6,131 | 5,919 | 20,151 | 22,147 | 7,287 | 89,619 | ||||||
(1) The total of non-controlling interests and shares issued represents the acquisition of subsidiaries presented in the statement of changes in net investment.
|
|
|
|
|
Notes to the consolidated financial statements (In thousands of Brazilian reais - R$, except if otherwise indicated) |
| (c) | Acquisitions in the year ended June 30, 2021 |
The fair value of the identifiable assets and liabilities, consideration transferred and goodwill as of the date of each acquisition were:
| Fair value as of the acquisition date in 2021 | |||||||||||||
| Assets |
Integra (p) |
Quali Ciclo (q) |
América (r) |
Culti Var (s) |
Desem Par (t) |
Agrobi Ológica (u) |
Total | ||||||
| Cash and cash equivalents | 19,905 | 42,259 | 7,576 | 44,223 | 59,428 | 2,064 | 175,455 | ||||||
| Trade receivables | 21,543 | 81,377 | 76,123 | 231,784 | 251,002 | 30,154 | 691,983 | ||||||
| Inventories | 30,774 | 110,946 | 58,188 | 68,471 | 178,697 | 2,789 | 449,865 | ||||||
| Other assets | 5,489 | 31,940 | 3,840 | 11,505 | 34,119 | 69 | 86,962 | ||||||
| Property, plant and equipment | 832 | 9,914 | 603 | 2,770 | 7,652 | 4,083 | 25,854 | ||||||
| Intangible assets | 8,398 | 16,648 | 40,816 | 8,375 | 55,579 | 11,446 | 141,262 | ||||||
| 86,941 | 293,084 | 187,146 | 367,128 | 586,477 | 50,605 | 1,571,381 | |||||||
| Liabilities | |||||||||||||
| Trade payables | 47,082 | 205,861 | 114,474 | 217,486 | 348,213 | 1,256 | 934,372 | ||||||
| Borrowings | 48 | 5,518 | - | 50,870 | 17,231 | 3,248 | 76,915 | ||||||
| Other liabilities | 6,287 | 4,873 | 18,871 | 16,795 | 45,966 | 102 | 92,894 | ||||||
| 53,417 | 216,252 | 133,345 | 285,151 | 411,410 | 4,606 | 1,104,181 | |||||||
| Total identifiable net assets at fair value | 33,524 | 76,832 | 53,801 | 81,977 | 175,067 | 45,999 | 467,200 | ||||||
| Non-controlling interests (1) | - | (22,458) | - | (13,706) | - | - | (36,164) | ||||||
| Goodwill arising on acquisition | 22,259 | 19,231 | 7,841 | 6,467 | 72,933 | 7,004 | 135,735 | ||||||
| Consideration transferred | 55,783 | 73,605 | 61,642 | 74,738 | 248,000 | 53,003 | 566,771 | ||||||
| Cash paid | 27,723 | 34,021 | 42,505 | 54,184 | 188,000 | 28,000 | 374,433 | ||||||
| Shares issued (1) | 12,848 | - | - | - | - | 18,006 | 30,854 | ||||||
| Payable in installments | 15,212 | 39,584 | 19,137 | 20,554 | 60,000 | 6,997 | 161,484 | ||||||
(1) The total of non-controlling interests and shares issued represents the acquisition of subsidiaries presented in the statement of changes in net investment.
|
|
|
|
|
Notes to the consolidated financial statements (In thousands of Brazilian reais - R$, except if otherwise indicated) |
| (d) | Fair value of assets acquired |
The Group estimated the fair value of significant assets acquired using the following valuation methods:
| Item | 2023 | 2022 | 2021 | Nature | Valuation method |
| Customer relationship | 33,477 | 45,922 | 119,466 | A loyal relationship between the acquirees and its customers, which translates into recurring purchases of products and services | Multi Period Excess Earnings Method (MPEEM) |
| Inventories | 214,724 | 212,513 | 449,865 | Inventories | Selling price less all expenses related to the distribution of that good |
| Purchase Contracts | - | - | 8,598 | Favorable purchase contract with suppliers | Multi Period Excess Earnings Method (MPEEM) |
| Brand | - | 8,764 | 5,930 | Private label products (Produtiva, Union and Cenagral) | Relief from Royalty method |
| 252,883 | 267,199 | 583,859 |
There were no differences between accounting basis and tax basis on fair value adjustments, and therefore no deferred taxes were recorded, except for Provecampo, Cenagro and Cenagral, where the Group recorded a corresponding deferred tax liability of R$5,298 since the Group does not have a viable tax plan that will permit that the accounting basis and tax basis be the same after the acquisition.
| (e) | Acquisition of Floema |
On March 22, 2022, the Group signed an agreement for the acquisition of Floema Soluções Nutricionais de Cultivos Ltda. (“Floema”), establishing the terms and other conditions for its acquisition.
The fair value of the shares issued to this acquisition was based on an equity transaction with third parties close to the acquisition date.
The acquisition was completed on August 4, 2022 and the Group currently owns a 62.61% interest.
| (f) | Acquisition of Casa Trevo Participações S.A. |
On May 5, 2022, the Group signed an agreement for the acquisition of Casa Trevo Participações S.A. (“Casa Trevo”), establishing the terms and other conditions for its acquisition.
The acquisition was completed on August 31, 2022 and the Group currently owns a 79.14% interest.
| (g) | Acquisition of Provecampo |
On June 16, 2022, the Group signed an agreement for the acquisition of Provecampo S.A.S. (“Provecampo”), an entity incorporated in Colombia, establishing the terms and other conditions for its acquisition.
|
|
|
|
|
Notes to the consolidated financial statements (In thousands of Brazilian reais - R$, except if otherwise indicated) |
The acquisition was completed on July 29, 2022 and the Group currently owns a 94.90% interest.
| (h) | Acquisition of Sollo Sul e Dissul |
On July 22, 2022, the Group signed an agreement for the acquisition of Sollo Sul Insumos Agrícolas Ltda (“Sollo Sul”) and Dissul Insumos Agrícolas Ltda. ("Dissul"), establishing the terms and other conditions for its acquisition.
The acquisition was completed on November 30, 2022 and the Group currently owns a 93.11% interest.
| (i) | Acquisition of Cromo |
On January 13, 2023, the Group signed an agreement for the acquisition of Cromo Indústria Química Ltda. (“Cromo”), establishing the terms and other conditions for its acquisition.
The acquisition was completed on May 31, 2023 and the Group currently owns a 70% interest.
| (j) | Acquisition of Produtiva |
On June 23, 2021, an agreement was signed between Produtec Comércio e Representações S.A. (“Produtec”), a subsidiary of Lavoro Brazil, to acquire Produtiva Agronegócios Comércio e Representações S.A. (“Produtiva”), establishing the terms and other conditions for its acquisition.
The fair value of the shares issued to this acquisition was based on an equity transaction with third parties close to the acquisition date.
The acquisition was completed on September 2, 2021, and the Group currently indirectly owns an 87.40% interest.
Under the terms of the acquisition agreement the Group is committed to repaying the sellers an amount of R$4,733 related to the successful collection of receivables past due as of the acquisition date.
| (k) | Acquisition of Cenagro |
On July 28, 2021, the Group signed an agreement to acquire Grupo Cenagro SAS (“Cenagro”), an entity incorporated in Colombia, establishing the terms and other conditions for its acquisition.
The acquisition was completed on August 31, 2021 and the Group currently owns an 94.90% interest in Cenagro.
|
|
|
|
|
Notes to the consolidated financial statements (In thousands of Brazilian reais - R$, except if otherwise indicated) |
| (l) | Acquisition of Cenagral |
On July 28, 2021, the Group signed an agreement to acquire Cenagral SAS (“Cenagral”), an entity incorporated in Colombia, establishing the terms and other conditions for its acquisition.
The acquisition was completed on August 31, 2021 and the Group currently owns an 94.90% interest in Cenagral.
| (m) | Acquisition of Union Agro |
On July 26, 2021, the Group signed an agreement to acquire Union Agro S.A. (“Union Agro”), establishing the terms and other conditions for its acquisition.
The acquisition was completed on October 28, 2021 and the Group currently owns a 73% interest.
A gain on bargain purchase in the amount of R$18,295 was recognized on the acquisition date. This gain is recorded under other operating income, net, as discussed in Note 31.
| (n) | Acquisition of Agrozap |
On August 5, 2021, the Group signed an agreement for the acquisition of Facirolli Comércio e Representações Ltda. (“AgroZap”), establishing the terms and other conditions for its acquisition.
The acquisition was completed on January 7, 2022 and the Group currently owns a 62.61% interest.
Under the terms of the acquisition agreement, the Group is committed to repaying the sellers an amount of R$4,029 related to the successful collection of receivables past due as of the acquisition date.
| (o) | Acquisition of Nova Geração |
On December 24, 2021, the Group signed an agreement for the acquisition of Nova Geração Comércio de Produtos Agrícolas Ltda. (“Nova Geração”), establishing the terms and other conditions for its acquisition.
The acquisition was completed on April 6, 2022 and the Group currently owns a 66.75% interest.
Total consideration transferred amounted to R$30,668 of which R$10,930 was paid in cash on the closing date of the acquisition, which occurred on April 6, 2022 and R$7,807 was paid in shares. The remaining R$11,931 was paid in cash in April 2023.
| (p) | Acquisition of Integra |
On June 18, 2020, an agreement was signed between a subsidiary of Lavoro Brazil, Produtec Comércio e Representações S.A. (“Produtec”), and the shareholders of Integra Soluções Agrícolas Ltda. (“Integra”), establishing the terms and other conditions for its acquisition.
|
|
|
|
|
Notes to the consolidated financial statements (In thousands of Brazilian reais - R$, except if otherwise indicated) |
Consideration transferred to the acquisition was composed of 70.3% to be paid in cash and 29.7% settled in shares issued by Produtec to the selling shareholders, representing 8.4% of its capital. The fair value of these shares was R$12,848 and was based on an equity transaction with third parties close to the acquisition date.
The acquisition was completed on September 1, 2020, and the Group currently indirectly owns 72.42% interest at Integra through Produtec, which directly owns 100% of Integra.
| (q) | Acquisition of Qualiciclo |
On July 17, 2020, an agreement was signed between the Group and the shareholders of Qualiciclo Agrícola S.A. (“Qualiciclo”), establishing the terms and other conditions for its acquisition.
The acquisition was completed on November 17, 2020. The Group currently owns a 66.75% interest.
Under the terms of the agreement, the Group is committed the repay the sellers amounts related to the successful collection of administrative proceeding on tax credits with the RFB in the amount of R$13,844. The Group recognizes an account payable for the amounts of probable disbursements as of the acquisition date.
| (r) | Acquisition of América |
On September 11, 2020, an agreement was signed between the Group and the shareholders of América Insumos Agrícolas Ltda. (“América”), establishing the terms and other conditions for its acquisition.
The acquisition was completed on December 30, 2020. The Group currently owns a 100% interest.
| (p) | Acquisition of Cultivar |
On November 12, 2020, an agreement was signed between Distribuidora Pitangueiras de Produtos Agropecuários S.A, a subsidiary Lavoro Agro, and the current shareholders of Cultivar Agrícola e Comércio, Importação e Exportação Ltda. (“Cultivar”), establishing the terms and other conditions for its acquisition.
Pitangueiras became the parent company of Cultivar, holding 63.47% of its capital on the deal’s closing date, April 1, 2021. The contract guarantees the payment of installment in the event of successful collection of receivables past due at the acquisition date in the amount of R$5,752. The Group recognizes an account payable for the amounts for which there are probable disbursements. The Group currently owns a 93.11% interest.
|
|
|
|
|
Notes to the consolidated financial statements (In thousands of Brazilian reais - R$, except if otherwise indicated) |
| (q) | Acquisition of Desempar |
On December 4, 2020, an agreement was signed by the Group for the acquisition of Desempar Participações Ltda. (“Desempar”), establishing the terms and other conditions for its acquisition.
The acquisition was completed on March 31, 2021. The Group currently owns 93.11% interest.
| (r) | Acquisition of Agrobiológica |
On July 21, 2020, an agreement was signed by Agrobiológica Sustentabilidade S.A. (formerly Maneogene Agrociência S.A.) (“Agrobiológica Sustentabilidade”), a subsidiary Lavoro Brazil, to acquire Agrobiológica Soluções Naturais Ltda. (“Agrobiológica”), establishing the terms and other conditions for its acquisition.
Consideration transferred to the acquisition was composed of 55.2% to be paid in cash and 44.8% settled in shares issued by Agrobiológica Sustentabilidade to the selling shareholders, representing 34.9% of its capital. The fair value of the shares issued was R$18,006 and was based on discounted cash flow methodology.
The acquisition was completed on August 28, 2020. The Group currently indirectly owns 65.13% interest at Agrobiológica through Agrobiológica Sustentabilidade, which directly owns 100% interest at Agrobiológica.
| (s) | Pro forma information (unaudited) |
The following tables discloses the Group’s revenues and profit or loss for the year assuming all of the acquisitions completed during the year were completed at the beginning of such year:
| 2023 | 2022 | 2021 | ||||
| Revenues | 9,697,932 | 8,163,196 | 6,231,988 | |||
| Profit (loss) for the year | (187,082) | 151,235 | 81,742 |
| (t) | Revenues and results from new subsidiaries |
The revenues and profit or loss of the acquisitions from the acquisition date through the end of the fiscal year in which the acquisition was completed and included in the consolidated statement of profit or loss are as follows:
Acquisitions in the year ended June 30, 2023:
| Revenues | Profit (loss) | Period from | ||||
| Provecampo | 37,291 | 1,656 | August 2022 | |||
| Floema | 205,451 | 12,628 | August 2022 | |||
| Casa Trevo | 136,003 | 20,787 | September 2022 | |||
| Sollo Sul | 182,385 | (10,064) | December 2022 | |||
| Cromo | 210 | (719) | May 2023 | |||
| Total | 561,340 | 24,288 |
|
|
|
|
|
Notes to the consolidated financial statements (In thousands of Brazilian reais - R$, except if otherwise indicated) |
Acquisitions in the year ended June 30, 2022:
| Revenues | Profit | Period from | ||||
| Produttiva | 175,335 | 14,152 | September, 2021 | |||
| Cenagro | 156,722 | 6,372 | September, 2021 | |||
| Cenagral | 26,267 | (1,013) | September, 2021 | |||
| Union Agro | 156,000 | 23,428 | November, 2021 | |||
| Agrozap | 132,911 | 1,632 | January, 2022 | |||
| Nova Geração | 7,179 | (3,828) | January, 2022 | |||
| Total | 654,414 | 40,743 |
Acquisitions in the year ended June 30, 2021:
| Revenues | Profit | Period from | ||||
| Integra | 144,087 | (4,773) | September, 2020 | |||
| Agrobiológica | 39,839 | 17,217 | September, 2020 | |||
| Qualiciclo | 210,521 | (12,571) | December, 2020 | |||
| América | 74,446 | 9,304 | January, 2021 | |||
| Cultiva | 15,263 | (9,185) | April, 2021 | |||
| Desempar | 130,771 | (13,409) | April, 2021 | |||
| Total | 614,927 | (13,417) |
| (u) | Signed agreement for future acquisitions |
| · | Acquisition of NS Agro S.A. (“NS Agro”) |
The Group signed an agreement on August 25, 2022, for the acquisition of 82% interest in NS Agro S.A. (“NS Agro”), establishing the terms and other conditions for its acquisition. Consideration to be transferred for the acquisition amounted to R$664,210 to be paid in cash in three installments. The completion of this acquisition is subject to the usual precedent conditions for this type of transaction, including the approval by the regulatory authorities in Brazil, and has not been completed by the Group as of the issuance date of these financial statements.
| 22. | Accounting considerations related to the SPAC Transaction |
On February 28, 2023, Lavoro and TPB Acquisition Corp. consummated a capital reorganization transaction as described in note 1.b.
|
|
|
|
|
Notes to the consolidated financial statements (In thousands of Brazilian reais - R$, except if otherwise indicated) |
The SPAC Transaction was accounted for as a capital reorganization in accordance with IFRS 2, Share-based Payment. Under this method of accounting, TPB Acquisition Corp. is treated as the “acquired” company for financial reporting purposes and Lavoro as the accounting “acquirer”. The net assets of TPB Acquisition Corp were stated at historical cost, with no goodwill or other intangible assets recorded. The SPAC Transaction, which is not within the scope of IFRS 3, since TPB Acquisition Corp. did not meet the definition of a “business” pursuant to IFRS 3, was accounted for within the scope of IFRS 2 — Share-Based Payments, or IFRS 2. Any excess of fair value of Lavoro’s ordinary shares issued over the fair value of TPB Acquisition Corp identifiable net assets acquired represents compensation for the service of a stock exchange listing for its shares and is expensed as incurred.
Critical accounting estimates and judgments
Accounting of SPAC transaction is considered a critical accounting estimate primarily due to the complex nature of the transaction, including the determination the accounting acquirer and assess it as a corporate reorganization, the calculation of the listing expenses and the determination of the accounting treatment of the financial instruments.
Changes in some of these assumptions could impact the consolidated financial statements.
Accordingly, the Group recorded a listing expense as follows:
| As of February 27, 2023 | |
| Deemed cost of shares issued to TPB Acquisition Corp shareholders (i) | 893,613 |
| Less: Net assets of TPB Acquisition Corp at historical cost | (574,059) |
| Listing expense | 319,554 |
| (i) | The key assumption for the estimated fair value is the opening quoted market price of $9.55 per share as of March 1, 2023 translated considering the foreign exchange rate reported by the Brazilian Central Bank of $1.00 to R$5.21. |
Warrants
TPB Acquisition Corp. issued 10,083,606 public and private warrants to certain of its shareholders and its maturity is February 28, 2028. Such public and private warrants were assumed by Lavoro as a result of the SPAC Transaction. The outstanding warrants as of June 30, 2023, is 10,083,592 and aggregate fair value of the private and public warrants is R$36,446, and the warrants are reported in the consolidated statement of financial position as warrant liabilities under non-current liabilities. For the year ended June 30, 2023, the Group recognized a gain of R$3,756 related to changes to the fair value of public warrants and private warrants. The fair value of the warrants was calculated based on the listed market price of such warrants.
Vesting founder shares and unvested founder shares
As part of the SPAC Transaction certain TPB Acquisition Corp.’s shareholders were issued a number of Lavoro ordinary shares tin exchange of TPB Acquisition Corp.’s Class B Ordinary Share that they held prior to the completion of the SPAC Transaction, of which (i) Two-thirds (3,006,050) of such Lavoro ordinary share were deemed to be vesting founder share, and (ii) one-third (1,503,025) of such Lavoro ordinary share were issued to those shareholders.
|
|
|
|
|
Notes to the consolidated financial statements (In thousands of Brazilian reais - R$, except if otherwise indicated) |
Vesting founder shares will be subject to certain vesting conditions. If at any time during the 3-year period following the close of the SPAC Transaction, for over any 20 trading days within any consecutive 30 trading day period, the closing share price of Lavoro ordinary share is greater than or equal to:
- $12.50, then one-half of the vesting founder shares will vest; and
- $15.00, then an additional one-half of the vesting founder shares will vest.
Lavoro’s ordinary share price targets will be equitably adjusted for stock splits, stock dividends, cash dividends, reorganizations, combinations, recapitalizations and similar transactions affecting Lavoro’s ordinary shares. Any vesting founder shares that will not vest during the 3-year period following the closing of the SPAC Transaction will be forfeited after the 3-year period.
The vesting founder shares are considered equity classified contingent considerations under IFRS 2 and are reported as additional paid-in capital under equity.
In order to determine the fair value of the Vesting Founder Shares as of the closing of the SPAC Transaction, a Monte Carlo simulation was used, where the future stock price was modeled such that it follows a geometric Brownian motion with constant drift and volatility, where volatility was based on quoted prices of comparable companies. A volatility rate of 54.4% and a risk-free rate of 4.51% were used in the model. Value per share was $9.53 and $8.53 for the shares vesting at $12.50 and $15.00, respectively. In order to determine the fair value of the Unvested Founder Shares as of the closing of the SPAC Transaction, the shares were discounted using a Finnerty put model, assuming a risk-free rate of 4.88%, volatility rate of 54.4%, and a restricted term of 3 months (the estimated time to complete a registration statement). Value per share was determined to be $10.08.
Forward share purchase agreements
TPB Acquisition Corp. entered into certain Forward Share Purchase Agreements with certain shareholders of TPB Acquisition Corp., in which TPB Acquisition Corp. agreed to purchase, in the aggregate, up to 2,830,750 of TPB Acquisition Corp.’s Class A Ordinary Shares held by those equity holders, either after 24 months after closing of the SPAC Transaction or after meeting certain criteria as defined in the Forward Share Purchase Agreements. Such Forward Share Purchase Agreements were assumed by Lavoro, whereby Lavoro agreed to purchase the same number of Lavoro’s ordinary shares under the same conditions as defined in those Forward Share Purchase Agreements. Lavoro placed a designated balance of funds into an escrow account at the closing of the SPAC Transaction for the purpose acquiring such shares.
Lavoro’s Ordinary Shares subject to the Forward Share Purchase Agreement are considered financial liabilities and are recorded in the consolidated statement of financial position as Liability for FPA Shares in non-current liabilities at the amounts deposited in the escrow account. The designated balance of funds in the escrow account is reported in the consolidated statement of financial position as restricted cash. The amount of Liability for FPA Shares and the restricted cash was R$139,133 as of June 30, 2023.
|
|
|
|
|
Notes to the consolidated financial statements (In thousands of Brazilian reais - R$, except if otherwise indicated) |
Accounting policy
| a) | Current income tax |
Current income tax assets and liabilities are measured at the amount expected to be recovered from or paid to the taxation authorities. The tax rates and tax laws used to compute the amount are those that are enacted or substantively enacted at the reporting date in the countries where the Group operates and generates taxable income. Current income tax relating to items recognized directly in equity is recognized in equity and not in the statement of profit or loss.
Management periodically evaluates positions taken in the tax returns with respect to situations in which applicable tax regulations are subject to interpretation and establishes provisions where appropriate.
Income taxes in Brazil and Colombia are paid by each legal entity on a stand alone basis.
| b) | Deferred tax |
Deferred taxes is provided using the liability method on temporary differences between the carrying amount of assets and liabilities and their tax basis.
Deferred tax liabilities are recognized for all taxable temporary differences, except:
• When the deferred tax liability arises from the initial recognition of goodwill or an asset or liability in a transaction that is not a business combination and, at the time of the transaction, affects neither the accounting profit nor taxable profit or loss;
• With respect to taxable temporary differences associated with investments in subsidiaries, associates and interests in joint arrangements, when the timing of the reversal of the temporary differences can be controlled and it is probable that the temporary differences will not reverse in the foreseeable future.
Deferred tax assets are recognized for all deductible temporary differences, the carry forward of unused tax credits and any unused tax losses. Deferred tax assets are recognized to the extent that it is probable that taxable profit will be available against which the deductible temporary differences, and the carry forward of unused tax credits and unused tax losses can be utilized, except:
|
|
|
|
|
Notes to the consolidated financial statements (In thousands of Brazilian reais - R$, except if otherwise indicated) |
• When the deferred tax asset relating to the deductible temporary difference arises from the initial recognition of an asset or liability in a transaction that is not a business combination and, at the time of the transaction, affects neither the accounting profit nor taxable profit or loss
• In respect of deductible temporary differences associated with investments in subsidiaries, deferred tax assets are recognized only to the extent that it is probable that the temporary differences will reverse in the foreseeable future and taxable profit will be available against which the temporary differences can be utilized.
The carrying amount of deferred tax assets is reviewed at each reporting date and reduced to the extent that it is no longer probable that sufficient taxable profit will be available to allow all or part of the deferred tax asset to be utilized.
Unrecognized deferred tax assets are re-assessed at each reporting date and are recognized to the extent that it has become probable that future taxable profits will allow the deferred tax asset to be recovered. In assessing the recoverability of deferred tax assets, the Group relies on the same forecast assumptions used elsewhere in the financial statements and in other management reports.
The benefits of uncertain tax positions are recorded only after determining, based on the position of its internal and external legal advisors, a more-likely-than-not probability that the uncertain tax positions will withstand challenge, if any, from taxing authorities.
Deferred tax assets and liabilities are offset where there is a legally enforceable right to offset current tax assets and liabilities and where the deferred tax balances relate to the same taxation authority.
Critical accounting estimates and judgments
Significant judgements, estimates and assumptions are required to determine the amount of deferred tax assets that are recognized based on the likely timing and future taxable profits. Deferred tax assets arising from tax losses carryforward and temporary differences are recognized considering assumptions and projected cashflows. Deferred tax assets may be affected by factors including, but not limited to: (i) internal assumptions on the projected taxable income, which are based on sales planning, operational costs and planned capital costs; (ii) macroeconomic environment; and (iii) trade and tax scenarios.
The Group applies significant judgement in identifying uncertainties over income tax treatments, which could impact the consolidated financial statements. The Group operates in multiple jurisdictions where uncertainties arise in the application of complex tax regulations. The Group and its subsidiaries are subject to reviews of income tax filings and other tax payments, and disputes can arise with the taxing authorities over the interpretation of the applicable laws and regulations.
|
|
|
|
|
Notes to the consolidated financial statements (In thousands of Brazilian reais - R$, except if otherwise indicated) |
| (a) | Reconciliation of income taxes expense |
| 2023 | 2022 | 2021 | ||||
| Profit (loss) before income taxes | (390,937) | 140,424 | 46,207 | |||
| Statutory rate (i) | 34% | 34% | 34% | |||
| Income taxes at statutory rate | 132,919 | (47,744) | (15,710) | |||
| Unrecognized deferred tax asset (ii) | (193,898) | (7,055) | (11,755) | |||
| Difference from income taxes calculation based on taxable profit computed as a percentage of gross revenue | 10,822 | 7,080 | 5,375 | |||
| Deferred income taxes over goodwill tax recoverable | (3,897) | - | - | |||
| Tax benefit (iii) | 244,718 | 15,066 | - | |||
| Other | (18,407) | (9) | (2,586) | |||
| Income tax expense | 172,256 | (32,662) | (24,676) | |||
| Income tax and social contribution effective rate | (44%) | 23% | 52% | |||
| Current income taxes | 37,499 | (111,409) | (61,676) | |||
| Deferred income taxes | 134,757 | 78,747 | 37,000 |
| (i) | The effective tax rate reconciliation considers the statutory income taxes rates in Brazil, due to the significance of the Brazilian operation when compared to Colombia. The difference to reconcile the effective rate to the Colombian statutory rate (32%) is included in others. |
| (ii) | The Group did not recognize deferred tax assets on accumulated tax losses from certain subsidiaries in a total amount of unrecognized credits on tax losses of R$187,310 (R$7,055 for June 30, 2022 and R$11,755 for June 30, 2021). The Group assessed that is unlikely that these subsidiaries will generate future taxable income in the foreseeable future. |
| (iii) | This amount reflects the tax benefit from the deduction of the ICMS tax benefits in the calculation of the income tax (see note 10). |
|
|
|
|
|
Notes to the consolidated financial statements (In thousands of Brazilian reais - R$, except if otherwise indicated) |
| (b) | Deferred income taxes balances |
| 2023 | 2022 | ||
| Deferred assets and liabilities: | |||
| Amortization of fair value adjustment | 66,065 | 32,787 | |
| Tax losses | 123,072 | 49,332 | |
| Allowance for expected credit losses | 49,026 | 51,379 | |
| Adjustment to present value | 14,222 | 40,639 | |
| Provision for management bonuses | 22,182 | 26,738 | |
| Allowance for inventory losses | 3,841 | 3,463 | |
| Financial effect on derivatives | (1,468) | 2,001 | |
| Fair value of commodity forward contracts | 31,343 | (1,959) | |
| Unrealized exchange gains or losses | (7,618) | (1,803) | |
| Unrealized profit in Inventories | (11,121) | - | |
| Gain on bargain purchase | - | (6,221) | |
| Amortized right-of-use assets | 6,273 | 2,617 | |
| Deferred tax on goodwill | (2,067) | - | |
| Other provisions | 22,981 | (5,478) | |
| Deferred income tax assets, net | 329,082 | 200,986 | |
| Deferred income tax liabilities, net | (12,351) | (7,491) | |
| Deferred income tax assets, net | 316,731 | 193,495 |
| Deferred income tax and social contribution | |
| At June 30, 2021 | 114,748 |
| Recognized in the statement of profit or loss | 78,747 |
| At June 30, 2022 | 193,495 |
| Recognized in the statement of profit or loss | 128,362 |
| Deferred tax from acquired companies | (5,126) |
| At June 30, 2023 | 316,731 |
The aging analysis of net deferred income tax is as follow:
| 2023 | |
| Up to 1 year | 185,123 |
| Over 1 year | 131,608 |
| Total | 316,731 |
|
|
|
|
|
Notes to the consolidated financial statements (In thousands of Brazilian reais - R$, except if otherwise indicated) |
| 24. | Provisions for contingencies |
Provisions are recognized when the Group has a present legal or constructive obligation as a result of past events, it is probable that an outflow of resources will be required to settle the obligation, and the amount can be reliably estimated. Provisions are reviewed and adjusted to reflect management’s best estimate at the reporting dates.
Probable losses
The balance of probable losses from civil, tax and labor contingencies recognized by the Group was R$8,845 and R$2,966 respectively as of June 30, 2023 and June 30, 2022.
Possible losses
The Group is a party to various proceedings involving tax, environmental and civil matters that were assessed by management, under advice of legal counsel, as possibly leading to losses. Possible losses from contingencies amounted to R$ 77,724 and R$11,600 as of June 30, 2023 and June 30, 2022, respectively.
Advances from customers arise from the “Cash sale” modality, in which rural producers advance payments to the Group at the beginning of a harvest, before the billing of agricultural inputs. These advances are settled in the short term.
| (a) | Movement in the year |
| 2023 | 2022 | 2021 | |||
| Balance as of the beginning of the year | 320,560 | 509,403 | 218,699 | ||
| Revenue recognized that was included in the contract liability balance at the beginning of the year | (320,560) | (509,403) | (218,699) | ||
| Increase in advances | 427,463 | 301,963 | 390,809 | ||
| Advances from acquired companies | 61,115 | 18,597 | 118,594 | ||
| Balance at the end of the year | 488,578 | 320,560 | 509,403 |
|
|
|
|
|
Notes to the consolidated financial statements (In thousands of Brazilian reais - R$, except if otherwise indicated) |
| 26. | Related parties |
Related parties of the Group that have receivable, payable or other balances are either (i) Non-controlling shareholders, (ii) Patria Investments Limited, which manages the funds that control the Group, or (iii) Key management personnel.
| (a) | Breakdown of assets and liabilities: |
| 2023 | 2022 | ||
| Assets | |||
| Trade receivables (i) | 24,487 | 11,677 | |
| Advances to suppliers (i) | - | 67 | |
| Total assets | 24,487 | 11,744 | |
| Liabilities | |||
| Trade payables (i) | 1,675 | 274 | |
| Advances from customers (i) | - | 1,097 | |
| Payables for the acquisition of subsidiaries (ii) | 100,287 | 63,930 | |
| Total liabilities | 101,962 | 65,301 |
| (i) | Refer to commercial transactions in the ordinary course of business with non-controlling shareholders of subsidiaries. Such transactions are carried at the same commercial terms as non-related parties customers. |
| (ii) | Payments in installments to the non-controlling shareholders related to certain business combinations as described in Note 20. |
| (b) | Statement of profit or loss |
| 2023 | 2022 | 2021 | |||
| Revenue from sales of products (i) | 33,032 | 13,046 | 5,592 | ||
| Monitoring expenses (ii) | (18,681) | (2,504) | - | ||
| Interest on payables for the acquisition of subsidiaries | (4,841) | - | - | ||
| Other expenses | (2,374) | (1,417) | - | ||
| Total | 7,137 | 9,125 | 5,592 |
| (i) | Refer to commercial transactions in the ordinary course of business with non-controlling shareholders of subsidiaries. Such transactions are carried at the same commercial terms as non-related party customers. |
| (ii) | Expenses paid to the Parent in relation to management support services for acquisition transactions by Gestão e Transformação S.A. |
|
|
|
|
|
Notes to the consolidated financial statements (In thousands of Brazilian reais - R$, except if otherwise indicated) |
| (c) | Key management personnel compensation |
| 2023 | 2022 | 2021 | |||
| Wages | 14,268 | 11,164 | 6,540 | ||
| Direct and indirect benefits | 690 | 427 | 551 | ||
| Variable compensation (bonuses) | 25,479 | 3,992 | 6,148 | ||
| Short-term benefits | 40,437 | 15,583 | 13,239 | ||
| Share-based payment benefits | 14,533 | - | - | ||
| Total | 54,970 | 15,583 | 13,239 |
Key management personnel compensation includes payments to Group board of directors and the executive officers.
| 27. | Equity |
| (a) | Prior reorganization |
The financial statements were prepared in accordance with principles described in Note 2. No share capital is presented. The net investment and the profit for the year is derived by aggregating the net assets and business activities of the Group.
Acquisitions of non-controlling interests in the year ended June 30, 2023:
In 2022, the Group acquired an additional 26.24% stake of Cultivar for R$42,500. The carrying amount of the 26.24% non-controlling interest was R$16,607. The Group recognized a decrease in non-controlling interest of R$16,607 and a decrease in net investment of the Parent of R$25,893. In 2022, the Group acquired an additional 6.89% stake of Pitangueiras for R$45,000. The carrying amount of the 6.89% non-controlling interest was R$19,569. The Group recognized a decrease in non-controlling interest of R$19,569 and a decrease in net investment of the Parent of R$25,431. Agrovenci, Qualiciclo, Desempar Participações, Denorpi, Deragro, Desempar Tecnologia, Futuragro, Plenafértil, Realce, Cultivar and Nova Geração are direct or indirect controlled by Pitangueiras and the equity interest of each subsidiary were changed on the consolidated financial statements as described in note 2.c. Additionally, the Group paid R$13,387 related to non-controlling interests on Produtec.
The effect on the total net investment during the period is summarized as follow:
Pre reorganization:
| Carrying amount of non-controlling interests acquired | 36,176 |
| Consideration paid to non-controlling interests | (100,887) |
| Excess of consideration paid recognized in net investment of the Parent | (64,711) |
|
|
|
|
|
Notes to the consolidated financial statements (In thousands of Brazilian reais - R$, except if otherwise indicated) |
Acquisitions of non-controlling interests in the year ended June 30, 2022:
In December 2021, the Group acquired an additional 20% stake of Group Cenagro through the exchange of shares of Lavoro Colombia SAS representing a 2.68% interest. No cash consideration was paid. The fair value of such shares was R$6,480 and the carrying amount of the 20% non-controlling interest was R$4,602. The fair value of the consideration was based on an equity transaction with third partiesclose to the acquisition date.The Group recognized an increase in non-controlling interest of R$1,878 and a decrease in net investment of the Parent of R$1,878.
In June 2022, the Group acquired an additional 5.77% stake of Lavoro Agrocomercial S.A. paid in cash for R$16,782. The carrying amount of the 5.77% non-controlling interest was R$9,769. The Group recognized a decrease in non-controlling interest of R$9,769 and a decrease in net investment of the Parent of R$7,013.
In June 2022, the Group acquired an additional 7.65% stake of Produtec Comércio e Representações S.A. paid in cash for R$17,569. The carrying amount of the 6.89% non-controlling interest was R$23,203. The Group recognized a decrease in non-controlling interest of R$23,203 and an increase in net investment of the Parent of R$5,634.
The effect on the total net investment during the year is summarized as follow:
In the year ended June 30, 2022:
| Carrying amount of non-controlling interests acquired | 32,972 |
| Difference between consideration paid in shares and non-controlling interest acquired | (1,878) |
| Total carrying amount of non-controlling interests acquired, net | 31,094 |
| Consideration paid to non-controlling interests | (34,351) |
| Excess of consideration paid recognized in net investment of the Parent | (3,257) |
Acquisitions of non-controlling interests in the year ended June 30, 2021:
In fiscal year ended June 30, 2021, the Group acquired an additional 8.94% stake of Lavoro Agrocomercial paid in cash for R$79,493. The carrying amount of the 8.94% non-controlling interest was R$57,422. The Group recognized a decrease in non-controlling interests of R$57,422 and a decrease in net investment of the Parent of R$22,071, as follows:
| Carrying amount of non-controlling interests acquired | 57,422 |
| Consideration paid in cash to non-controlling interests | (79,493) |
| Excess of consideration paid recognized in net investment of the Parent | (22,071) |
|
|
|
|
|
Notes to the consolidated financial statements (In thousands of Brazilian reais - R$, except if otherwise indicated) |
| (b) | After reorganization |
The following table illustrates the impact of the closing of SPAC Transaction on the shareholders’ equity of the Lavoro:
| Ordinary authorized and issued shares | Number of shares | Share capital | Additional Paid-in Capital | |||
| Net investment | - | - | - | |||
| Shares issued to the shareholders of Lavoro Agro Limited | 98,726,401 | 514 | 1,464,083 | |||
| Shares issued to the shareholders of TPB Acquisition Corp | 14,875,879 | 77 | 670,256 | |||
| As of June 30, 2023 | 113,602,280 | 591 | 2,134,339 |
Ordinary Shares
A Lavoro ordinary shares have a par value of US$0.001 and are entitled to one vote per share.
Other capital reserves
Other capital reserves is comprised of a reserve set-up by the Group share-based payment (an equity-settled share-based compensation plan).
Share based payment
Accounting policy for share based payment
Equity-settled transactions
The cost of equity-settled transactions is determined by the fair value at the date when the grant is made using an appropriate valuation model. That cost is recognized in personnel expenses (Note 29), together with a corresponding increase in equity (other capital reserves), over the period in which the service and, where applicable, the performance conditions are fulfilled (the vesting period). The cumulative expense recognized for equity-settled transactions at each reporting date until the vesting date reflects the extent to which the vesting period has expired and the Group’s best estimate of the number of equity instruments that will ultimately vest.
Service conditions are not taken into account when determining the grant date fair value of awards, but the likelihood of the conditions being met is assessed as part of the Group’s best estimate of the number of equity instruments that will ultimately vest. Market performance conditions are reflected within the grant date fair value. Any other conditions attached to an award, but without an associated service requirement, are considered to be non-vesting conditions.
No expense is recognized for awards that do not ultimately vest because non-market performance and/or service conditions have not been met. Where awards include a market or non-vesting condition, the transactions are treated as vested irrespective of whether the market or non-vesting condition is satisfied, provided that all other performance and/or service conditions are satisfied.
|
|
|
|
|
Notes to the consolidated financial statements (In thousands of Brazilian reais - R$, except if otherwise indicated) |
When the terms of an equity-settled award are modified, the minimum expense recognized is the grant date fair value of the unmodified award, provided the original vesting terms of the award are met. An additional expense, measured as at the date of modification, is recognized for any modification that increases the total fair value of the share-based payment transaction, or is otherwise beneficial to the employee. Where an award is cancelled by the entity or by the counterparty, any remaining element of the fair value of the award is expensed immediately through profit or loss.
Share-based payment (“SBP”)
On August 17, 2022, the Group approved the Lavoro Agro Holding S.A. Long-Term Incentive Policy (the “Lavoro Share Plan”). Under the Lavoro Share Plan, individuals selected by the Lavoro board of directors (“Selected Employees”) are eligible to receive incentive compensation consisting of cash, assets or share options issued by Lavoro Agro Limited, in an amount linked to the appreciation in the Lavoro Agro Limited share price at the time of the liquidity event, upon the satisfaction of certain conditions, as described below.
As of June 30, 2023, Lavoro has granted 49,518,732 share options as incentive compensation to Selected Employees. Share options granted under the Lavoro Share Plan will vest in the event the following market conditions are met (the “Market Conditions”):
(i) the occurrence of a liquidity event satisfying a minimum internal rate of return specified in the Lavoro Share Plan; and
(ii) the price per share obtained under such liquidity event must be greater than or equal to one of the following amounts:
(a) a pre-established reference price multiplied by three; or
(b) an amount calculated in accordance with a pre-established formula, in each case specified under the Lavoro Share Plan.
Moreover, upon the satisfaction of the Market Conditions, such share options will vest according to the following schedule (the “Service Conditions”):
(i) one-third of the options vest on the third anniversary of the grant date;
(ii) one-third of the options vest on the fourth anniversary of the grant date; and
(iii) one-third of the options vest on the fifth anniversary of the grant date.
The Lavoro Share Plan has a term of five years: if the Market Conditions have not been satisfied within this year, all options granted under the Lavoro Share Plan will be extinguished, with no further payment or incentive obligation remaining due by Lavoro. The consummation of the SPAC Transaction (see note 1) did not satisfy the Market Conditions.
As of February 28, 2023, the shareholders of Lavoro approved the Lavoro Share Plan. As a result, Lavoro reserved for issuance the number of ordinary shares equal to the number of Lavoro Share Plan
|
|
|
|
|
Notes to the consolidated financial statements (In thousands of Brazilian reais - R$, except if otherwise indicated) |
Shares under the Lavoro Share Plan, as adjusted in accordance with the Business Combination Agreement, in an amount of 1,663,405 ordinary shares.
The exercise price of the share-based payment is equal to the options price agreed with the employee in the contracts, representing the amount of R$1 monetarily adjusted until the date on which the liquidity event occurs.
The fair value of share options granted is estimated at the date of grant considering the terms and conditions using the Black-Scholes model, taking into account the terms and conditions on which the share options were granted. The model also takes into account historical and expected dividends, and the share price volatility of Lavoro.
On May 26, 2023 the Board of Directors approved a long-term incentive plan (the “New Lavoro Equity Plan”) in which eligible participants may include members of our management, our employees and our directors. Beneficiaries under the New Lavoro Equity Plan will be granted equity awards pursuant to the terms and conditions of the New Lavoro Equity Plan and any applicable award agreement.
The expense recognized for employee services received during the year and the number of options granted is shown in the following tables:
| Other capital reserves | |
| At June 30, 2022 | - |
| Share-based payments expense during the year | 14,533 |
| At June 30, 2023 | 14,533 |
| Options granted | |
| At June 30, 2022 | - |
| Granted options | 49,518,732 |
| Canceled | (3,800,000) |
| At June 30, 2023 | 45,718,732 |
The weighted average fair value of the options granted during the period was R$0.44 per option. The significant data included in the model were: weighted average share price of R$2.88 on the grant date, exercise price presented above, volatility of 33.88%, no dividend yield, an expected option life of 3.37 years and a risk-free annual interest rate of 12.45%.
|
|
|
|
|
Notes to the consolidated financial statements (In thousands of Brazilian reais - R$, except if otherwise indicated) |
Earnings per share
Earnings (loss) per share is calculated by dividing the profit (loss) for the period attributable to net investment of the parent/equity holders of the parent by the weighted average number of common shares available during the fiscal year. Diluted earnings (loss) per share is calculated by adjusting the weighted average number of common shares, presuming the conversion of all the potential diluted common shares.
The number of ordinary shares issued by Lavoro, as a result of the corporate reorganization is reflected retroactively, for purposes of calculating earnings per share in all prior periods presented.
The table below show data used in calculating basic and diluted earnings (loss) per share attributable to the net investment of the parent/equity holders of the parent:
|
|
|
|
|
Notes to the consolidated financial statements (In thousands of Brazilian reais - R$, except if otherwise indicated) |
| 2023 | 2022 | 2021 | ||||
| Weighted average ordinary shares of Lavoro | 113,602 | 113,602 | 113,602 | |||
| Effects of dilution from: | ||||||
| Share-based payment (i) | 1,605 | - | - | |||
| Number of ordinary shares adjusted for the effect of dilution | 115,207 | 113,602 | 113,602 | |||
| Profit (loss) for the period attributable to net investment of the parent/equity holders of the parent | (260,710) | 78,170 | 38,390 | |||
| Basic earnings (loss) per share | (2.29) | 0.69 | 0.34 | |||
| Diluted earnings (loss) per share | (2.29) | 0.69 | 0.34 |
(i) Based on the numbers of shares reserved by Lavoro Limited to the Lavoro Share Plan, as explained above.
The Group reported a loss for the year ended June 30, 2023, accordingly the ordinary shares related to the share-based payment have a non-dilutive effect and therefore were not considered in the total number of shares outstanding to determine the diluted earnings (loss) per share.
All public and private warrants are out of the money as of June 30, 2023; therefore, the approximately 6,012,085 and 4,071,507 public and private warrants, respectively, were not included in the calculation of the diluted earnings (loss) per share. Similarly, the 3,060,662 Founder Shares were not considered in the calculation of the diluted earnings (loss) per share due to the Group’s market share price.
| 28. | Revenue from contracts with customers |
Accounting policy
Revenue from contracts with customers is recognized when control of the goods or services are transferred to the customer at an amount that reflects the consideration to which the Group expects to be entitled in exchange for those goods or services.
Revenue from the sale of agricultural inputs is recognized at the point in time when control of the product is transferred to the customer as follows:
| (i) | Retail sales – Sale of products in retail locations, or delivered to the customers, including crop protection, fertilizers, seeds and specialty inputs; |
| (ii) | Grains – Sale of grains as a result of Barter transactions (Note 11); |
| (iii) | Private Label products – Products delivered to the client such as biological, special fertilizers and off-patent. |
|
|
|
|
|
Notes to the consolidated financial statements (In thousands of Brazilian reais - R$, except if otherwise indicated) |
When products are delivered to the customer revenue is recognized when the customer receives the product at the specified location. The Group engages third parties to provide freight services.
The Group provides pulverization services. The Group recognizes revenues from these services when the customer receives and consumes the benefits provided to them, at the time the pulverization services take place.
The Group generally acts as a principal as it has the primary responsibility for delivering the contracted goods, bears the inventory risk, and has discretion to establish the price.
Revenue from contracts with customers is recognized at an amount that reflects the consideration to which the Group expects to be entitled in exchange for those goods or services. For sales of grains see Note 11.
Sales prices are substantially based on international benchmark market prices, which are variable and subject to global supply and demand, and other market factors. There are no general warranties to the customers. Returns and incentives are estimated based on historical and forecasted data, contractual terms, and current conditions. Transportation costs are generally recovered from the customer through sales pricing and is included in cost of goods sold.
Trade receivables usually include a significant financing component. As such, the transaction price is discounted, using the interest rate implicit in the contract (i.e., the interest rate that discounts the trade receivable amount to the cash selling price) and revenue is recognized for such amount. A significant financing component is recognized as financial income under the amortized cost method. The average monthly interest rate applied was 0.96% for June 2023 and 1% for June 2022 and 2021. Below is revenue from contracts with customers disaggregated by product line and geographic location:
|
|
|
|
|
Notes to the consolidated financial statements (In thousands of Brazilian reais - R$, except if otherwise indicated) |
| 2023 | 2022 | 2021 | ||||
| Inputs Retails sales | ||||||
| Brazil | 6,950,340 | 5,555,066 | 3,439,049 | |||
| Colombia | 1,145,520 | 1,066,548 | 758,423 | |||
| 8,095,860 | 6,621,614 | 4,197,472 | ||||
| Private Label products | ||||||
| Crop Care | 557,167 | 331,527 | 41,138 | |||
| Grains (ii) | ||||||
| Brazil | 633,565 | 693,525 | 759,521 | |||
| Colombia | 33,360 | 21,780 | 30,251 | |||
| 666,925 | 715,305 | 789,772 | ||||
| Services | ||||||
| Colombia | 27,461 | 78,088 | 70,163 | |||
| Total Revenues | 9,347,413 | 7,746,534 | 5,098,545 | |||
| Summarized by region | ||||||
| Brazil | 8,141,072 | 6,580,118 | 4,239,708 | |||
| Colombia | 1,206,341 | 1,166,416 | 858,837 |
| (i) | Sales between the Crop Care Cluster and the Brazil Cluster. |
| (ii) | As explained in Note 11, the Group receives grains from certain customers in exchange to the product sold. The fair value of such non-cash consideration received from the customer is included in the transaction price and measured when the Group obtains control of the grains. The Group estimates the fair value of the non-cash consideration by reference to its market price. |
| 29. | Costs and expenses by nature |
Accounting policy
| (a) | Cost of goods sold |
The cost of goods sold comprises the cost of purchases, net of rebates, discounts and commercial agreements received from suppliers, variations in inventories and logistics costs (inbound and outbound). The cost of goods sold includes the cost of the logistics operations managed or outsourced by the Group, including storage, handling and freight costs incurred until goods are ready to be sold.
Trade payables include a significant financing component. As such, trade payables are discounted, using the interest rate implicit in the contract (i.e., the interest rate that discounts the trade payable amount to the purchase paid in cash) and inventory is recorded at such amount. A significant financing component is recognized as financial expense under the amortized cost method. The average monthly interest rate applied was 1.58% per month for June 2023 and 1.18% for June 2022 and 2021.
|
|
|
|
|
Notes to the consolidated financial statements (In thousands of Brazilian reais - R$, except if otherwise indicated) |
| (b) | Sales, general and administrative expenses |
Sales, general and administrative expenses refer to indirect expenses and the cost of the corporate departments, information technology, treasury function, sales force personnel and marketing and advertising expenses.
The breakdown of costs and expenses by nature is as follows:
|
|
|
|
|
Notes to the consolidated financial statements (In thousands of Brazilian reais - R$, except if otherwise indicated) |
| 2023 | 2022 | 2021 | ||||
| Cost of inventory (i) | 7,519,405 | 6,368,444 | 4,357,001 | |||
| Personnel expenses | 628,222 | 485,643 | 286,086 | |||
| Maintenance of the units | 34,396 | 30,567 | 22,387 | |||
| Consulting, legal and other services | 118,610 | 118,056 | 67,836 | |||
| Freight on sales | 57,650 | 47,979 | 31,911 | |||
| Commissions | 52,040 | 33,874 | 42,447 | |||
| Storage | 7,613 | 5,363 | 8,425 | |||
| Travel | 33,543 | 23,605 | 18,444 | |||
| Depreciation | 16,408 | 9,697 | 5,717 | |||
| Amortization of intangibles | 67,928 | 57,607 | 29,717 | |||
| Amortization of right-of-use assets | 56,236 | 51,203 | 17,997 | |||
| Taxes and fees | 32,266 | 29,849 | 17,948 | |||
| Short term rentals | 22,365 | 11,733 | 20,525 | |||
| Business events | 9,333 | 4,893 | 1,951 | |||
| Marketing and advertising | 14,631 | 18,181 | 4,089 | |||
| Insurance | 7,679 | 3,395 | 2,877 | |||
| Utilities | 22,302 | 12,696 | 6,693 | |||
| Allowance for expected credit losses | 36,769 | 27,393 | 11,094 | |||
| Losses and damage of inventories | 19,127 | 23,339 | 9,808 | |||
| Fuels and lubricants | 29,527 | 23,705 | 4,373 | |||
| Legal fees | 4,336 | 7,025 | 3,208 | |||
| SPAC bonuses (ii) | 29,743 | - | - | |||
| Other administrative expenditures | 24,606 | 49,178 | 11,629 | |||
| Total | 8,844,734 | 7,443,425 | 4,982,163 | |||
| Classified as: | ||||||
| Cost of goods sold | 7,616,606 | 6,421,037 | 4,362,657 | |||
| Sales, general and administrative expenses | 1,228,128 | 1,022,388 | 619,506 |
| (i) | Includes fair value on inventory sold from acquired companies, in the amounts of R$ 26,914, R$ 27,005 and R$ 39,536 respectively for the years ended June 30, 2023, 2022 and 2021. |
| (ii) | Bonus paid to management specifically based on the SPAC process that resulted in Lavoro becoming a U.S. publicly listed company on the NASDAQ Global Market. |
|
|
|
|
|
Notes to the consolidated financial statements (In thousands of Brazilian reais - R$, except if otherwise indicated) |
| 30. | Finance income (costs) |
| 2023 | 2022 | 2021 | ||||
| Finance income | ||||||
| Interest from cash equivalents | 8,241 | 8,703 | 2,461 | |||
| Interest arising from revenue contracts | 250,337 | 407,449 | 204,744 | |||
| Foreign exchange differences | - | - | 12,759 | |||
| Gain on changes in fair value of derivative instruments | 79,375 | - | - | |||
| Gain on changes in fair value of commodity forward contracts | - | 9,200 | 6,337 | |||
| Interest from tax benefit (see note 23) | 27,153 | - | - | |||
| Other | 5,954 | 1,581 | 798 | |||
| Total | 371,060 | 426,933 | 227,099 | |||
| Finance costs | ||||||
| Interest on borrowings | (319,557) | (74,081) | (33,971) | |||
| Interest on leases | (16,977) | (13,217) | (5,076) | |||
| Interest on trade payables and acquisitions of subsidiary | (508,351) | (506,778) | (256,122) | |||
| Foreign exchange differences | (15,232) | (1,957) | - | |||
| Loss on changes in fair value of derivative instruments | - | (26,323) | (4,883) | |||
| Loss on fair value of commodity forward contracts | (98,674) | - | - | |||
| Other | (30,076) | (24,021) | (12,840) | |||
| Total | (988,867) | (646,377) | (312,892) | |||
| Finance costs, net | (617,807) | (219,444) | (85,793) |
| 31. | Other operating (expenses) income, net |
| 2023 | 2022 | 2021 | ||||
| Listing expense (ii) | (319,554) | - | - | |||
| Gain on bargain purchase (i) | - | 18,295 | - | |||
| Sales of fixed assets | 2,071 | 8,592 | 3,914 | |||
| Other operating income | 41,674 | 29,872 | 11,704 | |||
| Other operating income (expenses), net | (275,809) | 56,759 | 15,618 |
| (i) | Acquisition of Union. See note 21. |
| (ii) | This represents stock exchange listing service as a result of the SPAC Transaction. Refer to Note 22 for further discussion. |
| 32. | Non-cash transactions |
The Group carries out non-cash transactions which are not reflected in the statement of cash flows.
|
|
|
|
|
Notes to the consolidated financial statements (In thousands of Brazilian reais - R$, except if otherwise indicated) |
The Group had non-cash transactions related to the acquisition of subsidiaries through the issuance of shares and accounts payable as described in Note 20.
The Group had non-cash transactions related to the acquisition of non-controlling interest through the exchange of shares as described in Note 27.
The Group had non-cash transaction related to the SPAC Transaction as described in Note 22.
The Group also had non-cash additions to right-of-use assets and lease liabilities of R$89,895 in 2023 (R$124,740 in 2022 and R$21,606 in 2021).
· New financing transactions
Subsequent to June 30, 2023, through the date of this annual report, certain of our Brazilian and Colombian subsidiaries entered into a number of financing agreements totaling an aggregate principal amount of R$1,250.7 million, with interest rates ranging from CDI Rate plus 1.80% to 3.04% and maturities ranging from October 2023 to September 2024, and COP$24,244.1 million, with interest rates ranging from IBR Rate plus 3.20% to 5.60% and up to 16.60% at a fixed rate and maturities ranging from July 2024 to August 2028. These new financing transactions are in line with our business plan and reflect the seasonality of our business as the last quarter usually demands additional working capital.
| · | Closing of Referencia acquisition |
On February 28, 2023, the Group entered into an agreement for the acquisition of a 70% interest in Referencia Agroinsumos LTDA., or “Referencia Agro.” The consideration transferred for the acquisition amounted R$102,112 of which R$67,112 was paid in cash on the closing date, and the remaining R$35,000 will be paid in cash a year after the closing date.
This acquisition was completed on July 31, 2023, and the Group currently owns a 66.57% interest.
The following table summarizes the preliminary allocation of the consideration transferred as of July 29, 2022
| Cash paid | 67,112 | |
| Payable in installments | 35,000 | |
| Fair value of consideration transferred | 102,112 | |
| (-) Fair value of net assets acquired: | ||
| Assets | ||
| Cash and cash equivalents | 8,249 | |
| Trade receivables | 43,462 | |
| Inventories | 81,972 | |
| Property, plant and equipment | 1,504 | |
| Intangible | 34,731 | |
| Other assets | 8,157 | |
| 178,076 | ||
| Liabilities | ||
| Borrowings | 32,455 | |
| Trade payables | 61,178 | |
| Other liabilities | 42,205 | |
| 135,838 | ||
| Total identifiable net assets at fair value | 42,238 | |
| Preliminary goodwill arising on acquisition | 72,545 |
|
|
|
|
|
Notes to the consolidated financial statements (In thousands of Brazilian reais - R$, except if otherwise indicated) |
| · | Lavoro Limited Restricted Stock Unit Plan (“RSU Plan”) |
On August 16, 2023 and September 27, 2023, the board of directors of Lavoro (the “Board”) adopted the Lavoro Limited Restricted Stock Unit Plan (the “RSU Plan”), which provides for the grant of restricted stock units (“RSUs”) to participants identified by the Board.
As of the date of the issuance of the consolidated financial statements, 1,634,852 RSUs have been granted, with each RSU entitling the holder to one share of Lavoro stock after the vesting period, as detailed below:
| Options granted | |
| Granted options | 1,689,632 |
| Canceled | (92,556) |
| 1,597,076 |
|
|
|