000093709812/312023Q3FALSE141700009370982023-01-012023-09-3000009370982023-10-18xbrli:shares0000937098tnet:ProfessionalServicesMember2023-07-012023-09-30iso4217:USD0000937098tnet:ProfessionalServicesMember2022-07-012022-09-300000937098tnet:ProfessionalServicesMember2023-01-012023-09-300000937098tnet:ProfessionalServicesMember2022-01-012022-09-300000937098tnet:InsuranceServicesMember2023-07-012023-09-300000937098tnet:InsuranceServicesMember2022-07-012022-09-300000937098tnet:InsuranceServicesMember2023-01-012023-09-300000937098tnet:InsuranceServicesMember2022-01-012022-09-3000009370982023-07-012023-09-3000009370982022-07-012022-09-3000009370982022-01-012022-09-30iso4217:USDxbrli:shares00009370982023-09-3000009370982022-12-3100009370982023-06-3000009370982022-06-3000009370982021-12-310000937098us-gaap:CommonStockIncludingAdditionalPaidInCapitalMember2023-06-300000937098us-gaap:CommonStockIncludingAdditionalPaidInCapitalMember2022-06-300000937098us-gaap:CommonStockIncludingAdditionalPaidInCapitalMember2022-12-310000937098us-gaap:CommonStockIncludingAdditionalPaidInCapitalMember2021-12-310000937098us-gaap:CommonStockIncludingAdditionalPaidInCapitalMember2023-07-012023-09-300000937098us-gaap:CommonStockIncludingAdditionalPaidInCapitalMember2022-07-012022-09-300000937098us-gaap:CommonStockIncludingAdditionalPaidInCapitalMember2023-01-012023-09-300000937098us-gaap:CommonStockIncludingAdditionalPaidInCapitalMember2022-01-012022-09-300000937098us-gaap:CommonStockIncludingAdditionalPaidInCapitalMember2023-09-300000937098us-gaap:CommonStockIncludingAdditionalPaidInCapitalMember2022-09-300000937098us-gaap:RetainedEarningsMember2023-06-300000937098us-gaap:RetainedEarningsMember2022-06-300000937098us-gaap:RetainedEarningsMember2022-12-310000937098us-gaap:RetainedEarningsMember2021-12-310000937098us-gaap:RetainedEarningsMember2023-07-012023-09-300000937098us-gaap:RetainedEarningsMember2022-07-012022-09-300000937098us-gaap:RetainedEarningsMember2023-01-012023-09-300000937098us-gaap:RetainedEarningsMember2022-01-012022-09-300000937098us-gaap:RetainedEarningsMember2023-09-300000937098us-gaap:RetainedEarningsMember2022-09-300000937098us-gaap:AccumulatedOtherComprehensiveIncomeMember2023-06-300000937098us-gaap:AccumulatedOtherComprehensiveIncomeMember2022-06-300000937098us-gaap:AccumulatedOtherComprehensiveIncomeMember2022-12-310000937098us-gaap:AccumulatedOtherComprehensiveIncomeMember2021-12-310000937098us-gaap:AccumulatedOtherComprehensiveIncomeMember2023-07-012023-09-300000937098us-gaap:AccumulatedOtherComprehensiveIncomeMember2022-07-012022-09-300000937098us-gaap:AccumulatedOtherComprehensiveIncomeMember2023-01-012023-09-300000937098us-gaap:AccumulatedOtherComprehensiveIncomeMember2022-01-012022-09-300000937098us-gaap:AccumulatedOtherComprehensiveIncomeMember2023-09-300000937098us-gaap:AccumulatedOtherComprehensiveIncomeMember2022-09-3000009370982022-09-30tnet:segment0000937098us-gaap:SalesRevenueNetMemberus-gaap:NonUsMemberus-gaap:GeographicConcentrationRiskMember2023-01-012023-09-30xbrli:pure0000937098us-gaap:HealthCareMember2023-09-300000937098us-gaap:HealthCareMember2022-12-310000937098us-gaap:CashAndCashEquivalentsMember2023-09-300000937098tnet:AvailableForSaleMarketableSecuritiesMember2023-09-300000937098us-gaap:CashAndCashEquivalentsMember2022-12-310000937098tnet:AvailableForSaleMarketableSecuritiesMember2022-12-310000937098us-gaap:CashAndCashEquivalentsMembertnet:PayrollFundsCollectedMember2023-09-300000937098tnet:AvailableForSaleMarketableSecuritiesMembertnet:PayrollFundsCollectedMember2023-09-300000937098tnet:PayrollFundsCollectedMember2023-09-300000937098us-gaap:CashAndCashEquivalentsMembertnet:PayrollFundsCollectedMember2022-12-310000937098tnet:AvailableForSaleMarketableSecuritiesMembertnet:PayrollFundsCollectedMember2022-12-310000937098tnet:PayrollFundsCollectedMember2022-12-310000937098tnet:HealthBenefitClaimsCollateralMemberus-gaap:CashAndCashEquivalentsMember2023-09-300000937098tnet:AvailableForSaleMarketableSecuritiesMembertnet:HealthBenefitClaimsCollateralMember2023-09-300000937098tnet:HealthBenefitClaimsCollateralMember2023-09-300000937098tnet:HealthBenefitClaimsCollateralMemberus-gaap:CashAndCashEquivalentsMember2022-12-310000937098tnet:AvailableForSaleMarketableSecuritiesMembertnet:HealthBenefitClaimsCollateralMember2022-12-310000937098tnet:HealthBenefitClaimsCollateralMember2022-12-310000937098us-gaap:CashAndCashEquivalentsMembertnet:WorkersCompensationClaimsCollateralMember2023-09-300000937098tnet:AvailableForSaleMarketableSecuritiesMembertnet:WorkersCompensationClaimsCollateralMember2023-09-300000937098tnet:WorkersCompensationClaimsCollateralMember2023-09-300000937098us-gaap:CashAndCashEquivalentsMembertnet:WorkersCompensationClaimsCollateralMember2022-12-310000937098tnet:AvailableForSaleMarketableSecuritiesMembertnet:WorkersCompensationClaimsCollateralMember2022-12-310000937098tnet:WorkersCompensationClaimsCollateralMember2022-12-310000937098tnet:InsuranceCarriersSecurityDepositsMemberus-gaap:CashAndCashEquivalentsMember2023-09-300000937098tnet:InsuranceCarriersSecurityDepositsMembertnet:AvailableForSaleMarketableSecuritiesMember2023-09-300000937098tnet:InsuranceCarriersSecurityDepositsMember2023-09-300000937098tnet:InsuranceCarriersSecurityDepositsMemberus-gaap:CashAndCashEquivalentsMember2022-12-310000937098tnet:InsuranceCarriersSecurityDepositsMembertnet:AvailableForSaleMarketableSecuritiesMember2022-12-310000937098tnet:InsuranceCarriersSecurityDepositsMember2022-12-310000937098us-gaap:MoneyMarketFundsMemberus-gaap:FairValueInputsLevel1Memberus-gaap:FairValueMeasurementsRecurringMember2023-09-300000937098us-gaap:MoneyMarketFundsMemberus-gaap:FairValueInputsLevel1Memberus-gaap:FairValueMeasurementsRecurringMemberus-gaap:CashAndCashEquivalentsMember2023-09-300000937098us-gaap:InvestmentsMemberus-gaap:MoneyMarketFundsMemberus-gaap:FairValueInputsLevel1Memberus-gaap:FairValueMeasurementsRecurringMember2023-09-300000937098tnet:RestrictedCashAndCashEquivalentsAndInvestmentsMemberus-gaap:MoneyMarketFundsMemberus-gaap:FairValueInputsLevel1Memberus-gaap:FairValueMeasurementsRecurringMember2023-09-300000937098us-gaap:FairValueInputsLevel2Memberus-gaap:FairValueMeasurementsRecurringMemberus-gaap:USTreasurySecuritiesMember2023-09-300000937098us-gaap:FairValueInputsLevel2Memberus-gaap:FairValueMeasurementsRecurringMemberus-gaap:CashAndCashEquivalentsMemberus-gaap:USTreasurySecuritiesMember2023-09-300000937098us-gaap:FairValueInputsLevel2Memberus-gaap:InvestmentsMemberus-gaap:FairValueMeasurementsRecurringMemberus-gaap:USTreasurySecuritiesMember2023-09-300000937098tnet:RestrictedCashAndCashEquivalentsAndInvestmentsMemberus-gaap:FairValueInputsLevel2Memberus-gaap:FairValueMeasurementsRecurringMemberus-gaap:USTreasurySecuritiesMember2023-09-300000937098us-gaap:FairValueMeasurementsRecurringMember2023-09-300000937098us-gaap:FairValueMeasurementsRecurringMemberus-gaap:CashAndCashEquivalentsMember2023-09-300000937098us-gaap:InvestmentsMemberus-gaap:FairValueMeasurementsRecurringMember2023-09-300000937098tnet:RestrictedCashAndCashEquivalentsAndInvestmentsMemberus-gaap:FairValueMeasurementsRecurringMember2023-09-300000937098us-gaap:FairValueInputsLevel2Memberus-gaap:AssetBackedSecuritiesMemberus-gaap:FairValueMeasurementsRecurringMember2023-09-300000937098us-gaap:FairValueInputsLevel2Memberus-gaap:AssetBackedSecuritiesMemberus-gaap:FairValueMeasurementsRecurringMemberus-gaap:CashAndCashEquivalentsMember2023-09-300000937098us-gaap:FairValueInputsLevel2Memberus-gaap:InvestmentsMemberus-gaap:AssetBackedSecuritiesMemberus-gaap:FairValueMeasurementsRecurringMember2023-09-300000937098tnet:RestrictedCashAndCashEquivalentsAndInvestmentsMemberus-gaap:FairValueInputsLevel2Memberus-gaap:AssetBackedSecuritiesMemberus-gaap:FairValueMeasurementsRecurringMember2023-09-300000937098us-gaap:FairValueInputsLevel2Memberus-gaap:FairValueMeasurementsRecurringMemberus-gaap:CorporateDebtSecuritiesMember2023-09-300000937098us-gaap:FairValueInputsLevel2Memberus-gaap:FairValueMeasurementsRecurringMemberus-gaap:CorporateDebtSecuritiesMemberus-gaap:CashAndCashEquivalentsMember2023-09-300000937098us-gaap:FairValueInputsLevel2Memberus-gaap:InvestmentsMemberus-gaap:FairValueMeasurementsRecurringMemberus-gaap:CorporateDebtSecuritiesMember2023-09-300000937098tnet:RestrictedCashAndCashEquivalentsAndInvestmentsMemberus-gaap:FairValueInputsLevel2Memberus-gaap:FairValueMeasurementsRecurringMemberus-gaap:CorporateDebtSecuritiesMember2023-09-300000937098us-gaap:FairValueInputsLevel2Memberus-gaap:FairValueMeasurementsRecurringMemberus-gaap:USGovernmentAgenciesDebtSecuritiesMember2023-09-300000937098us-gaap:FairValueInputsLevel2Memberus-gaap:FairValueMeasurementsRecurringMemberus-gaap:USGovernmentAgenciesDebtSecuritiesMemberus-gaap:CashAndCashEquivalentsMember2023-09-300000937098us-gaap:FairValueInputsLevel2Memberus-gaap:InvestmentsMemberus-gaap:FairValueMeasurementsRecurringMemberus-gaap:USGovernmentAgenciesDebtSecuritiesMember2023-09-300000937098tnet:RestrictedCashAndCashEquivalentsAndInvestmentsMemberus-gaap:FairValueInputsLevel2Memberus-gaap:FairValueMeasurementsRecurringMemberus-gaap:USGovernmentAgenciesDebtSecuritiesMember2023-09-300000937098us-gaap:FairValueInputsLevel2Memberus-gaap:FairValueMeasurementsRecurringMemberus-gaap:USTreasurySecuritiesMember2023-09-300000937098us-gaap:FairValueInputsLevel2Memberus-gaap:FairValueMeasurementsRecurringMemberus-gaap:CashAndCashEquivalentsMemberus-gaap:USTreasurySecuritiesMember2023-09-300000937098us-gaap:FairValueInputsLevel2Memberus-gaap:InvestmentsMemberus-gaap:FairValueMeasurementsRecurringMemberus-gaap:USTreasurySecuritiesMember2023-09-300000937098tnet:RestrictedCashAndCashEquivalentsAndInvestmentsMemberus-gaap:FairValueInputsLevel2Memberus-gaap:FairValueMeasurementsRecurringMemberus-gaap:USTreasurySecuritiesMember2023-09-300000937098us-gaap:FairValueInputsLevel2Memberus-gaap:FairValueMeasurementsRecurringMemberus-gaap:CertificatesOfDepositMember2023-09-300000937098us-gaap:FairValueInputsLevel2Memberus-gaap:FairValueMeasurementsRecurringMemberus-gaap:CertificatesOfDepositMemberus-gaap:CashAndCashEquivalentsMember2023-09-300000937098us-gaap:FairValueInputsLevel2Memberus-gaap:InvestmentsMemberus-gaap:FairValueMeasurementsRecurringMemberus-gaap:CertificatesOfDepositMember2023-09-300000937098tnet:RestrictedCashAndCashEquivalentsAndInvestmentsMemberus-gaap:FairValueInputsLevel2Memberus-gaap:FairValueMeasurementsRecurringMemberus-gaap:CertificatesOfDepositMember2023-09-300000937098us-gaap:FairValueInputsLevel2Memberus-gaap:OtherDebtSecuritiesMemberus-gaap:FairValueMeasurementsRecurringMember2023-09-300000937098us-gaap:FairValueInputsLevel2Memberus-gaap:OtherDebtSecuritiesMemberus-gaap:FairValueMeasurementsRecurringMemberus-gaap:CashAndCashEquivalentsMember2023-09-300000937098us-gaap:FairValueInputsLevel2Memberus-gaap:InvestmentsMemberus-gaap:OtherDebtSecuritiesMemberus-gaap:FairValueMeasurementsRecurringMember2023-09-300000937098tnet:RestrictedCashAndCashEquivalentsAndInvestmentsMemberus-gaap:FairValueInputsLevel2Memberus-gaap:OtherDebtSecuritiesMemberus-gaap:FairValueMeasurementsRecurringMember2023-09-300000937098us-gaap:MoneyMarketFundsMemberus-gaap:FairValueInputsLevel1Memberus-gaap:FairValueMeasurementsRecurringMember2022-12-310000937098us-gaap:MoneyMarketFundsMemberus-gaap:FairValueInputsLevel1Memberus-gaap:FairValueMeasurementsRecurringMemberus-gaap:CashAndCashEquivalentsMember2022-12-310000937098us-gaap:InvestmentsMemberus-gaap:MoneyMarketFundsMemberus-gaap:FairValueInputsLevel1Memberus-gaap:FairValueMeasurementsRecurringMember2022-12-310000937098tnet:RestrictedCashAndCashEquivalentsAndInvestmentsMemberus-gaap:MoneyMarketFundsMemberus-gaap:FairValueInputsLevel1Memberus-gaap:FairValueMeasurementsRecurringMember2022-12-310000937098us-gaap:FairValueInputsLevel2Memberus-gaap:FairValueMeasurementsRecurringMemberus-gaap:USTreasurySecuritiesMember2022-12-310000937098us-gaap:FairValueInputsLevel2Memberus-gaap:FairValueMeasurementsRecurringMemberus-gaap:CashAndCashEquivalentsMemberus-gaap:USTreasurySecuritiesMember2022-12-310000937098us-gaap:FairValueInputsLevel2Memberus-gaap:InvestmentsMemberus-gaap:FairValueMeasurementsRecurringMemberus-gaap:USTreasurySecuritiesMember2022-12-310000937098tnet:RestrictedCashAndCashEquivalentsAndInvestmentsMemberus-gaap:FairValueInputsLevel2Memberus-gaap:FairValueMeasurementsRecurringMemberus-gaap:USTreasurySecuritiesMember2022-12-310000937098us-gaap:FairValueMeasurementsRecurringMember2022-12-310000937098us-gaap:FairValueMeasurementsRecurringMemberus-gaap:CashAndCashEquivalentsMember2022-12-310000937098us-gaap:InvestmentsMemberus-gaap:FairValueMeasurementsRecurringMember2022-12-310000937098tnet:RestrictedCashAndCashEquivalentsAndInvestmentsMemberus-gaap:FairValueMeasurementsRecurringMember2022-12-310000937098us-gaap:FairValueInputsLevel2Memberus-gaap:AssetBackedSecuritiesMemberus-gaap:FairValueMeasurementsRecurringMember2022-12-310000937098us-gaap:FairValueInputsLevel2Memberus-gaap:AssetBackedSecuritiesMemberus-gaap:FairValueMeasurementsRecurringMemberus-gaap:CashAndCashEquivalentsMember2022-12-310000937098us-gaap:FairValueInputsLevel2Memberus-gaap:InvestmentsMemberus-gaap:AssetBackedSecuritiesMemberus-gaap:FairValueMeasurementsRecurringMember2022-12-310000937098tnet:RestrictedCashAndCashEquivalentsAndInvestmentsMemberus-gaap:FairValueInputsLevel2Memberus-gaap:AssetBackedSecuritiesMemberus-gaap:FairValueMeasurementsRecurringMember2022-12-310000937098us-gaap:FairValueInputsLevel2Memberus-gaap:FairValueMeasurementsRecurringMemberus-gaap:CorporateDebtSecuritiesMember2022-12-310000937098us-gaap:FairValueInputsLevel2Memberus-gaap:FairValueMeasurementsRecurringMemberus-gaap:CorporateDebtSecuritiesMemberus-gaap:CashAndCashEquivalentsMember2022-12-310000937098us-gaap:FairValueInputsLevel2Memberus-gaap:InvestmentsMemberus-gaap:FairValueMeasurementsRecurringMemberus-gaap:CorporateDebtSecuritiesMember2022-12-310000937098tnet:RestrictedCashAndCashEquivalentsAndInvestmentsMemberus-gaap:FairValueInputsLevel2Memberus-gaap:FairValueMeasurementsRecurringMemberus-gaap:CorporateDebtSecuritiesMember2022-12-310000937098us-gaap:FairValueInputsLevel2Memberus-gaap:FairValueMeasurementsRecurringMemberus-gaap:USGovernmentAgenciesDebtSecuritiesMember2022-12-310000937098us-gaap:FairValueInputsLevel2Memberus-gaap:FairValueMeasurementsRecurringMemberus-gaap:USGovernmentAgenciesDebtSecuritiesMemberus-gaap:CashAndCashEquivalentsMember2022-12-310000937098us-gaap:FairValueInputsLevel2Memberus-gaap:InvestmentsMemberus-gaap:FairValueMeasurementsRecurringMemberus-gaap:USGovernmentAgenciesDebtSecuritiesMember2022-12-310000937098tnet:RestrictedCashAndCashEquivalentsAndInvestmentsMemberus-gaap:FairValueInputsLevel2Memberus-gaap:FairValueMeasurementsRecurringMemberus-gaap:USGovernmentAgenciesDebtSecuritiesMember2022-12-310000937098us-gaap:FairValueInputsLevel2Memberus-gaap:FairValueMeasurementsRecurringMemberus-gaap:USTreasurySecuritiesMember2022-12-310000937098us-gaap:FairValueInputsLevel2Memberus-gaap:FairValueMeasurementsRecurringMemberus-gaap:CashAndCashEquivalentsMemberus-gaap:USTreasurySecuritiesMember2022-12-310000937098us-gaap:FairValueInputsLevel2Memberus-gaap:InvestmentsMemberus-gaap:FairValueMeasurementsRecurringMemberus-gaap:USTreasurySecuritiesMember2022-12-310000937098tnet:RestrictedCashAndCashEquivalentsAndInvestmentsMemberus-gaap:FairValueInputsLevel2Memberus-gaap:FairValueMeasurementsRecurringMemberus-gaap:USTreasurySecuritiesMember2022-12-310000937098us-gaap:FairValueInputsLevel2Memberus-gaap:FairValueMeasurementsRecurringMemberus-gaap:CertificatesOfDepositMember2022-12-310000937098us-gaap:FairValueInputsLevel2Memberus-gaap:FairValueMeasurementsRecurringMemberus-gaap:CertificatesOfDepositMemberus-gaap:CashAndCashEquivalentsMember2022-12-310000937098us-gaap:FairValueInputsLevel2Memberus-gaap:InvestmentsMemberus-gaap:FairValueMeasurementsRecurringMemberus-gaap:CertificatesOfDepositMember2022-12-310000937098tnet:RestrictedCashAndCashEquivalentsAndInvestmentsMemberus-gaap:FairValueInputsLevel2Memberus-gaap:FairValueMeasurementsRecurringMemberus-gaap:CertificatesOfDepositMember2022-12-310000937098us-gaap:FairValueInputsLevel2Memberus-gaap:OtherDebtSecuritiesMemberus-gaap:FairValueMeasurementsRecurringMember2022-12-310000937098us-gaap:FairValueInputsLevel2Memberus-gaap:OtherDebtSecuritiesMemberus-gaap:FairValueMeasurementsRecurringMemberus-gaap:CashAndCashEquivalentsMember2022-12-310000937098us-gaap:FairValueInputsLevel2Memberus-gaap:InvestmentsMemberus-gaap:OtherDebtSecuritiesMemberus-gaap:FairValueMeasurementsRecurringMember2022-12-310000937098tnet:RestrictedCashAndCashEquivalentsAndInvestmentsMemberus-gaap:FairValueInputsLevel2Memberus-gaap:OtherDebtSecuritiesMemberus-gaap:FairValueMeasurementsRecurringMember2022-12-310000937098tnet:A2029NotesPayableMember2023-09-300000937098tnet:A2031NotesPayableMember2023-09-300000937098tnet:A2029NotesPayableMember2022-12-310000937098tnet:A2029NotesPayableMemberus-gaap:SeniorNotesMember2023-09-300000937098tnet:A2029NotesPayableMemberus-gaap:SeniorNotesMember2022-12-310000937098tnet:A2031NotesPayableMemberus-gaap:SeniorNotesMember2023-09-300000937098tnet:A2031NotesPayableMemberus-gaap:SeniorNotesMember2022-12-310000937098us-gaap:RevolvingCreditFacilityMembertnet:A2021RevolvingCreditFacilityMemberus-gaap:LineOfCreditMember2023-03-310000937098us-gaap:RevolvingCreditFacilityMembertnet:A2021RevolvingCreditFacilityMemberus-gaap:LineOfCreditMember2023-03-012023-03-310000937098us-gaap:RevolvingCreditFacilityMembertnet:A2021RevolvingCreditFacilityMemberus-gaap:LineOfCreditMember2023-04-300000937098us-gaap:RevolvingCreditFacilityMembertnet:A2021RevolvingCreditFacilityMemberus-gaap:LineOfCreditMember2023-09-012023-09-300000937098tnet:A2029NotesPayableMemberus-gaap:SeniorNotesMember2021-02-280000937098tnet:A2031NotesPayableMemberus-gaap:SeniorNotesMember2023-08-310000937098tnet:A2031NotesPayableMemberus-gaap:DebtInstrumentRedemptionPeriodOneMemberus-gaap:SeniorNotesMembertnet:PartialRedemptionMember2023-08-012023-08-310000937098tnet:A2031NotesPayableMemberus-gaap:DebtInstrumentRedemptionPeriodOneMemberus-gaap:SeniorNotesMember2023-08-012023-08-310000937098us-gaap:RevolvingCreditFacilityMembertnet:A2021RevolvingCreditFacilityMemberus-gaap:LineOfCreditMember2023-07-310000937098us-gaap:RevolvingCreditFacilityMembertnet:A2021RevolvingCreditFacilityMemberus-gaap:LineOfCreditMember2023-08-310000937098srt:MinimumMembertnet:LondonInterbankOfferedRateMemberus-gaap:RevolvingCreditFacilityMembertnet:A2021RevolvingCreditFacilityMemberus-gaap:LineOfCreditMember2023-01-012023-09-300000937098srt:MaximumMembertnet:LondonInterbankOfferedRateMemberus-gaap:RevolvingCreditFacilityMembertnet:A2021RevolvingCreditFacilityMemberus-gaap:LineOfCreditMember2023-01-012023-09-300000937098srt:MinimumMemberus-gaap:BaseRateMemberus-gaap:RevolvingCreditFacilityMembertnet:A2021RevolvingCreditFacilityMemberus-gaap:LineOfCreditMember2023-01-012023-09-300000937098us-gaap:BaseRateMembersrt:MaximumMemberus-gaap:RevolvingCreditFacilityMembertnet:A2021RevolvingCreditFacilityMemberus-gaap:LineOfCreditMember2023-01-012023-09-300000937098us-gaap:RevolvingCreditFacilityMembertnet:SecuredOvernightFinancingRateMembertnet:A2021RevolvingCreditFacilityMemberus-gaap:LineOfCreditMember2023-09-300000937098srt:MinimumMemberus-gaap:RevolvingCreditFacilityMembertnet:SecuredOvernightFinancingRateMembertnet:A2021RevolvingCreditFacilityMemberus-gaap:LineOfCreditMember2023-01-012023-09-300000937098srt:MaximumMemberus-gaap:RevolvingCreditFacilityMembertnet:SecuredOvernightFinancingRateMembertnet:A2021RevolvingCreditFacilityMemberus-gaap:LineOfCreditMember2023-01-012023-09-300000937098us-gaap:RevolvingCreditFacilityMembertnet:AdjustedTermSOFRRateMembertnet:A2021RevolvingCreditFacilityMemberus-gaap:LineOfCreditMember2023-01-012023-09-300000937098us-gaap:RevolvingCreditFacilityMembertnet:A2021RevolvingCreditFacilityMemberus-gaap:LineOfCreditMemberus-gaap:FederalFundsEffectiveSwapRateMember2023-01-012023-09-300000937098tnet:OneMonthTermSOFRSecuredOvernightFinancingRateMemberus-gaap:RevolvingCreditFacilityMembertnet:A2021RevolvingCreditFacilityMemberus-gaap:LineOfCreditMember2023-01-012023-09-300000937098srt:MinimumMemberus-gaap:RevolvingCreditFacilityMembertnet:A2021RevolvingCreditFacilityMemberus-gaap:LineOfCreditMember2023-09-300000937098srt:MaximumMemberus-gaap:RevolvingCreditFacilityMembertnet:A2021RevolvingCreditFacilityMemberus-gaap:LineOfCreditMember2023-09-300000937098us-gaap:RevolvingCreditFacilityMembertnet:SecuredOvernightFinancingRateMembertnet:A2021RevolvingCreditFacilityMembertnet:CreditRatingBelowInvestmentGradeMemberus-gaap:LineOfCreditMember2023-01-012023-09-300000937098us-gaap:BaseRateMemberus-gaap:RevolvingCreditFacilityMembertnet:A2021RevolvingCreditFacilityMembertnet:CreditRatingBelowInvestmentGradeMemberus-gaap:LineOfCreditMember2023-01-012023-09-3000009370982020-09-29tnet:retirement_plan0000937098tnet:TimeBasedRestrictedStockUnitsMember2023-01-012023-09-300000937098srt:MinimumMembertnet:TimeBasedRestrictedStockUnitsMember2023-01-012023-09-300000937098srt:MaximumMembertnet:TimeBasedRestrictedStockUnitsMember2023-01-012023-09-300000937098tnet:PerformanceBasedRestrictedStockUnitsandRestrictedStockAwardsMemberus-gaap:ShareBasedCompensationAwardTrancheOneMember2023-01-012023-09-300000937098tnet:TimeBasedRestrictedStockUnitsMember2022-12-310000937098tnet:TimeBasedRestrictedStockUnitsMember2023-09-300000937098tnet:PerformanceBasedRestrictedStockUnitsMember2022-12-310000937098tnet:PerformanceBasedRestrictedStockUnitsMember2023-01-012023-09-300000937098tnet:PerformanceBasedRestrictedStockUnitsMember2023-09-300000937098us-gaap:CostOfSalesMember2023-07-012023-09-300000937098us-gaap:CostOfSalesMember2022-07-012022-09-300000937098us-gaap:CostOfSalesMember2023-01-012023-09-300000937098us-gaap:CostOfSalesMember2022-01-012022-09-300000937098us-gaap:SellingAndMarketingExpenseMember2023-07-012023-09-300000937098us-gaap:SellingAndMarketingExpenseMember2022-07-012022-09-300000937098us-gaap:SellingAndMarketingExpenseMember2023-01-012023-09-300000937098us-gaap:SellingAndMarketingExpenseMember2022-01-012022-09-300000937098us-gaap:GeneralAndAdministrativeExpenseMember2023-07-012023-09-300000937098us-gaap:GeneralAndAdministrativeExpenseMember2022-07-012022-09-300000937098us-gaap:GeneralAndAdministrativeExpenseMember2023-01-012023-09-300000937098us-gaap:GeneralAndAdministrativeExpenseMember2022-01-012022-09-300000937098tnet:SystemsDevelopmentAndProgrammingCostsMember2023-07-012023-09-300000937098tnet:SystemsDevelopmentAndProgrammingCostsMember2022-07-012022-09-300000937098tnet:SystemsDevelopmentAndProgrammingCostsMember2023-01-012023-09-300000937098tnet:SystemsDevelopmentAndProgrammingCostsMember2022-01-012022-09-300000937098tnet:PerformanceBasedRestrictedStockUnitsandRestrictedStockAwardsMember2023-01-012023-09-300000937098us-gaap:RestrictedStockMember2023-07-012023-09-300000937098us-gaap:RestrictedStockMember2022-07-012022-09-300000937098us-gaap:RestrictedStockMember2023-01-012023-09-300000937098us-gaap:RestrictedStockMember2022-01-012022-09-300000937098us-gaap:StockOptionMember2023-07-012023-09-300000937098us-gaap:StockOptionMember2022-07-012022-09-300000937098us-gaap:StockOptionMember2023-01-012023-09-300000937098us-gaap:StockOptionMember2022-01-012022-09-300000937098us-gaap:EmployeeStockMember2023-07-012023-09-300000937098us-gaap:EmployeeStockMember2022-07-012022-09-300000937098us-gaap:EmployeeStockMember2023-01-012023-09-300000937098us-gaap:EmployeeStockMember2022-01-012022-09-3000009370982020-02-2800009370982022-02-2800009370982022-11-3000009370982023-02-2800009370982023-07-3100009370982023-08-012023-08-3100009370982023-09-012023-09-300000937098tnet:AlexWarrenMember2023-01-012023-09-300000937098tnet:AlexWarrenMember2023-07-012023-09-300000937098tnet:AlexWarrenMember2023-09-30
UNITED STATES
SECURITIES AND EXCHANGE COMMISSION
WASHINGTON, DC 20549
FORM 10-Q
(Mark One)
☒ QUARTERLY REPORT PURSUANT TO SECTION 13 OR 15(d) OF THE SECURITIES EXCHANGE ACT OF 1934
For the quarterly period ended September 30, 2023
or
☐ TRANSITION REPORT PURSUANT TO SECTION 13 OR 15(d) OF THE SECURITIES EXCHANGE ACT OF 1934
For the transition period from to
Commission File Number: 001-36373
TRINET GROUP, INC.
(Exact Name of Registrant as Specified in its Charter)
|
|
|
|
|
|
|
|
|
|
|
|
Delaware |
|
95-3359658 |
|
(State or other jurisdiction of
incorporation or organization)
|
|
(I.R.S. Employer
Identification No.)
|
| One Park Place, |
Suite 600 |
|
|
Dublin, |
CA |
|
94568 |
| (Address of principal executive offices) |
|
(Zip Code) |
Registrant’s telephone number, including area code: (510) 352-5000
Securities registered pursuant to Section 12(b) of the Act:
|
|
|
|
|
|
|
|
|
| Title of each class |
Trading Symbol(s) |
Name of each exchange on which registered |
Common stock par value $0.000025 per share |
TNET |
New York Stock Exchange |
Indicate by check mark whether the registrant (1) has filed all reports required to be filed by Section 13 or 15(d) of the Securities Exchange Act of 1934 during the preceding 12 months (or for such shorter period that the registrant was required to file such reports), and (2) has been subject to such filing requirements for the past 90 days. Yes x No o
Indicate by check mark whether the registrant has submitted electronically every Interactive Data File required to be submitted pursuant to Rule 405 of Regulation S-T (§ 232.405 of this chapter) during the preceding 12 months (or for such shorter period that the registrant was required to submit such files). Yes x No o
Indicate by check mark whether the registrant is a large accelerated filer, an accelerated filer, a non-accelerated filer, a smaller reporting company, or an emerging growth company. See the definitions of “large accelerated filer,” “accelerated filer,” “smaller reporting company,” and “emerging growth company” in Rule 12b-2 of the Exchange Act.
|
|
|
|
|
|
|
|
|
|
|
|
Large accelerated filer |
x |
Accelerated filer |
o |
|
|
|
|
| Non-accelerated filer |
o |
Smaller reporting company |
☐ |
|
|
|
|
|
|
Emerging growth company |
☐ |
If an emerging growth company, indicate by check mark if the registrant has elected not to use the extended transition period for complying with any new or revised financial accounting standards provided pursuant to Section 13(a) of the Exchange Act. Yes o No o
Indicate by check mark whether the registrant is a shell company (as defined in Rule 12b-2 of the Exchange Act). Yes ☐ No x
The number of shares of Registrant’s Common Stock outstanding as of October 18, 2023 was 50,508,283.
TRINET GROUP, INC.
Form 10-Q - Quarterly Report
For the Quarterly Period Ended September 30, 2023
TABLE OF CONTENTS
|
|
|
|
|
|
|
|
|
|
Form 10-Q
Cross Reference
|
Page |
|
|
|
|
|
|
|
Part I, Item 1. |
|
|
|
|
|
|
|
|
|
|
|
|
|
|
|
|
|
|
|
|
|
|
|
|
|
|
|
|
|
|
|
|
|
|
|
|
|
|
|
|
|
|
|
|
|
|
|
|
|
|
|
|
|
|
|
|
|
|
|
Part I, Item 2. |
|
|
Part I, Item 3. |
|
|
Part I, Item 4. |
|
|
Part II, Item 1. |
|
|
Part II, Item 1A. |
|
|
Part II, Item 2. |
|
|
Part II, Item 3. |
|
|
Part II, Item 4. |
|
|
Part II, Item 5. |
|
|
Part II, Item 6. |
|
|
|
|
|
|
|
|
|
|
|
|
|
|
|
|
|
|
|
|
|
|
|
|
|
|
|
|
|
|
|
| TRINET |
2 |
2023 Q3 FORM 10-Q |
Glossary of Acronyms and Abbreviations
Acronyms and abbreviations are used throughout this report, particularly in Part I, Item 1. Unaudited Condensed Consolidated Financial Statements and Part I, Item 2. Management's Discussion and Analysis of Financial Condition and Results of Operations.
|
|
|
|
|
|
|
|
|
|
|
|
| 2021 Credits |
Our announced 2021 credits, which provided eligible clients with discretionary credits, subject to certain predefined conditions. |
| 2022 Credits |
Includes both of our announced 2022 credits, each of which provides eligible clients with discretionary credits, subject to certain predefined conditions. |
| 2021 Credit Agreement |
Our credit agreement dated February 26, 2021, as amended, supplemented or modified from time to time, most recently August 16, 2023. |
|
|
| 2021 Revolver |
Our $700 million revolving line of credit included in our 2021 Credit Agreement |
| 2029 Notes |
Our $500 million senior unsecured notes maturing in March 2029 |
|
|
| 2031 Notes |
Our $400 million senior unsecured notes maturing in August 2031 |
| AFS |
Available-for-sale |
|
|
|
|
| CARES Act |
Coronavirus Aid Relief and Economic Security Act |
|
|
| CEO |
Chief Executive Officer |
| CFO |
Chief Financial Officer |
| Clarus R+D |
Clarus R+D Solutions, LLC |
| COBRA |
Consolidated Omnibus Budget Reconciliation Act |
| Colleague |
TriNet’s internal employees (as distinguished from WSEs and HRIS Users) |
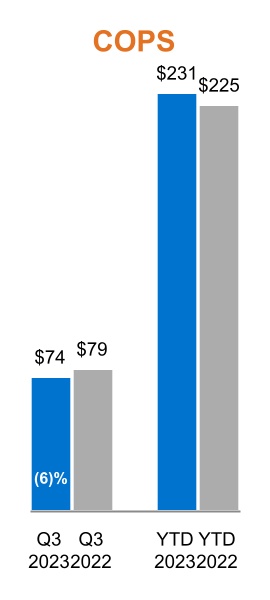
| COPS |
Cost of providing services |
|
|
| COVID-19 |
Novel coronavirus |
|
|
|
|
| D&A |
Depreciation and amortization expenses |
| EBITDA |
Earnings before interest expense, taxes, depreciation and amortization of intangible assets |
|
|
| EPS |
Earnings Per Share |
| ERISA |
Employee Retirement Income Security Act |
| ESAC |
Employer Services Assurance Corporation |
|
|
| ETR |
Effective tax rate |
|
|
| FFCRA |
Families First Coronavirus Response Act |
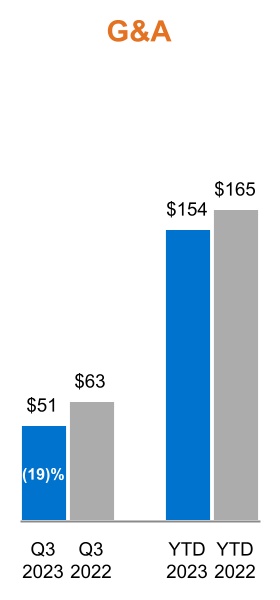
| G&A |
General and administrative |
| GAAP |
Generally Accepted Accounting Principles in the United States |
|
|
|
|
| HCM |
Human capital management |
| HR |
Human Resources |
| HRIS |
Human resources information system |
| HRIS User |
A client employee who is not co-employed by a TriNet PEO (for example, employees of a TriNet Zenefits client) |
|
|
|
|
|
|
| IRS |
Internal Revenue Service |
| ICR |
Insurance cost ratio |
| ISR |
Insurance service revenues |
|
|
|
|
| LIBOR |
London Inter-bank Offered Rate |
|
|
|
|
| MD&A |
Management's Discussion and Analysis of Financial Condition and Results of Operations |
|
|
|
|
|
|
| OE |
Operating expenses |
|
|
| PEO |
Professional Employer Organization |
| PFC |
Payroll funds collected |
|
|
| PPP |
Paycheck Protection Program, a loan program administered by the U.S. Small Business Administration |
| PSR |
Professional service revenues |
| R+D |
Research and Development |
| Recovery Credit |
Our 2020 Recovery Credit to provide eligible clients with one-time reductions against fees for future services |
| Recovery Credits |
Collectively, our Recovery Credit, 2021 Credits, and 2022 Credits |
| Reg FD |
Regulation Fair Disclosure |
| ROU |
Right-of-use |
| RSA |
Restricted Stock Award |
| RSU |
Restricted Stock Unit |
|
|
|
|
|
|
|
|
|
|
|
|
|
|
|
|
|
|
|
|
|
|
|
|
|
|
|
|
|
|
|
|
|
|
| TRINET |
3 |
2023 Q3 FORM 10-Q |
|
|
|
|
|
|
| SBC |
Stock Based Compensation |
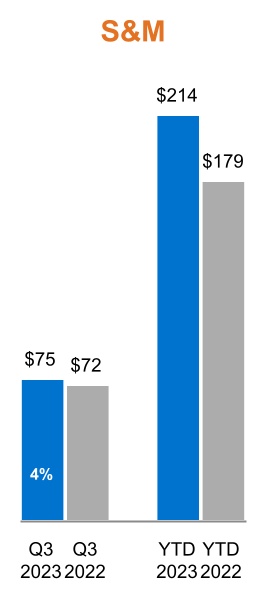
| S&M |
Sales and marketing |
| S&P |
Standard & Poor's |
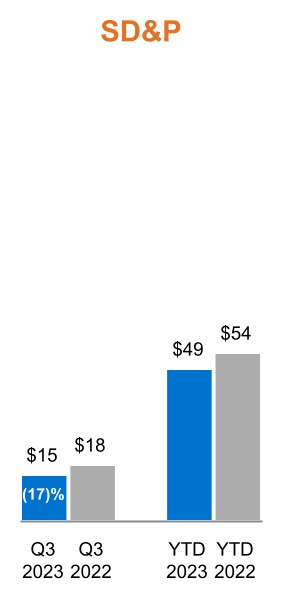
| SD&P |
Systems development and programming |
| SEC |
U.S. Securities and Exchange Commission |
| SMB |
Small and medium-size business |
|
|
|
|
| U.S. |
United States |
|
|
| WSE |
A worksite employee who is co-employed by, or otherwise receiving services from a TriNet PEO |
| YTD |
Year to date |
| Zenefits |
YourPeople, Inc. (dba Zenefits) and its subsidiaries |
|
|
|
|
|
|
|
|
|
|
|
|
| TRINET |
4 |
2023 Q3 FORM 10-Q |
|
|
|
|
|
|
| FORWARD LOOKING STATEMENTS AND OTHER FINANCIAL INFORMATION |
|
Cautionary Note Regarding Forward-Looking Statements
For purposes of this Quarterly Report on Form 10-Q (Form 10-Q), the terms “TriNet,” “the Company,” “we,” “us” and “our” refer to TriNet Group, Inc., and its subsidiaries. This Form 10-Q contains statements that are not historical in nature, are predictive in nature, or that depend upon or refer to future events or conditions or otherwise contain forward-looking statements within the meaning of Section 21 of the Securities Exchange Act of 1934, as amended, and the Private Securities Litigation Reform Act of 1995. Forward-looking statements are often identified by the use of words such as, but not limited to, "ability," “anticipate,” “believe,” “can,” “continue,” “could,” “design,” “estimate,” “expect,” “forecast,” “hope,” "impact," “intend,” “may,” “outlook,” “plan,” “potential,” “predict,” “project,” “seek,” “should,” “strategy,” “target,” "value," “will,” “would” and similar expressions or variations intended to identify forward-looking statements. Examples of forward-looking statements include, among others, TriNet’s expectations regarding: the impact of the Zenefits and Clarus R+D acquisitions on our business; our ability to successfully diversify our overall service and technology offerings to support SMBs throughout their lifecycle; our plans and ability to grow our client base; the impact of our ongoing efforts to ensure that our billing practices best match the expectation of our customers and the impact on our WSE count; our expectations regarding medical utilization rates by our WSEs and the impact of inflation on our insurance costs; the effect that our stock repurchase and tender offer programs will have on our business; the repayment or voluntary redemption of our notes; our ability to leverage our scale and industry HR experience to deliver vertical focused offerings and the impact of such offerings; planned improvements to our technology platform and HRIS software; our ability to improve operating efficiencies; the impact of our client service initiatives and whether they enhance client experience and satisfaction; our continued ability to provide access to a broad range of benefit programs on a cost-effective basis; our expectations regarding the volume and severity of insurance claims and insurance claim trends; the effectiveness of our risk strategies for, and management of, workers' compensation, health benefit insurance costs and deductibles, and EPLI risk; the metrics that may be indicators of future financial performance; the relative value of our benefit offerings versus those SMBs can independently obtain; the impact that our benefit offerings have for SMBs seeking to attract and retain employees; the principal competitive drivers in our market; the impact of our plans to improve our sales performance, grow new clients, and manage client attrition; our investment strategy and its impact on our ability to generate future interest income, net income, and Adjusted EBITDA; seasonal trends and their impact on our business; fluctuations in the period-to-period timing of when we incur certain operating expenses; the estimates and assumptions we use to prepare our financial statements; our belief that we can meet our present and reasonably foreseeable operating cash needs and future commitments through existing liquid assets and continuing cash flows from corporate operating activities; and other expectations, outlooks and forecasts on our future business, operational and financial performance.
Important factors that could cause actual results, level of activity, performance or achievements to differ materially from those expressed or implied by these forward-looking statements are discussed above and throughout our Annual Report on Form 10-K for the year ended December 31, 2022 filed with the SEC on February 15, 2023 (our 2022 Form 10-K), including those appearing under the heading “Risk Factors” in Item 1A, and under the heading “Management’s Discussion and Analysis of Financial Condition and Results of Operations” in Part II, Item 7 of our 2022 Form 10-K, and those appearing in the other periodic filings we make with the SEC, and including risk factors associated with: our ability to manage unexpected changes in workers’ compensation and health insurance claims and costs by worksite employees; our ability to mitigate the unique business risks we face as a co-employer; the effects of volatility in the financial and economic environment on the businesses that make up our client base; loss of clients for reasons beyond our control and the short-term contracts we typically use with our clients; the impact of regional or industry-specific economic and health factors on our operations; the impact of failures or limitations in the business systems and service centers we rely upon; the impact of our Recovery Credits on our business and client loyalty and retention; changes in our insurance coverage or our relationships with key insurance carriers; our ability to improve our services and technology to satisfy client and regulatory expectations; our ability to effectively integrate businesses we have acquired or may acquire in the future; our ability to effectively manage and improve our operational effectiveness and resiliency; our ability to attract and retain qualified personnel; the effects of increased competition and our ability to compete effectively; the impact on our business of cyber-attacks, breaches, disclosures and other data-related incidents; our ability to protect against and remediate cyber-attacks, breaches, disclosures and other data-related incidents, whether intentional or inadvertent and whether attributable to us or our service providers; our ability to comply with evolving data privacy and security laws; our ability to manage changes in, uncertainty regarding, or adverse application of the complex laws and regulations that govern our business; changing laws and regulations governing health insurance and employee benefits; our ability to be recognized as an employer of worksite employees and for our benefits plans to satisfy all requirements under federal and state regulations; changes in the laws and regulations that govern what it means to be an employer, employee or independent contractor; the impact of new and changing laws regarding remote work; our ability to comply with the licensing requirements that govern our HCM solutions; the outcome of existing and future legal and tax
|
|
|
|
|
|
|
|
|
|
|
|
| TRINET |
5 |
2023 Q3 FORM 10-Q |
|
|
|
|
|
|
| FORWARD LOOKING STATEMENTS AND OTHER FINANCIAL INFORMATION |
|
proceedings; fluctuation in our results of operations and stock price due to factors outside of our control; our ability to comply with the restrictions of our credit facility and meet our debt obligations; and the impact of concentrated ownership in our stock by Atairos Group, Inc. and other large stockholders. Any of these factors could cause our actual results to differ materially from our anticipated results.
Forward-looking statements are not guarantees of future performance but are based on management’s expectations as of the date of this Form 10-Q and assumptions that are inherently subject to uncertainties, risks and changes in circumstances that are difficult to predict. Forward-looking statements involve known and unknown risks, uncertainties and other factors that may cause actual results, performance or achievements to be materially different from our current expectations and any past results, performance or achievements. Given these risks and uncertainties, readers are cautioned not to place undue reliance on such forward-looking statements.
The information provided in this Form 10-Q is based upon the facts and circumstances known as of the date of this Form 10-Q, and any forward-looking statements made by us in this Form 10-Q speak only as of the date of this Form 10-Q. We undertake no obligation to revise or update any of the information provided in this Form 10-Q, except as required by law.
The MD&A of this Form 10-Q includes references to our performance measures presented in conformity with GAAP and other non-GAAP financial measures that we use to manage our business, to make planning decisions, to allocate resources and to use as performance measures in our executive compensation plans. Refer to the Non-GAAP Financial Measures within our MD&A for definitions and reconciliations from GAAP measures.
Website Disclosures
We use our website (www.trinet.com) to announce material non-public information to the public and to comply with our disclosure obligations under Regulation Fair Disclosure (Reg FD). We also use our website to communicate with the public about our Company, our services, and other matters. Our SEC filings, press releases and recent public conference calls and webcasts can also be found on our website. The information we post on our website could be deemed to be material information under Reg FD. We encourage investors and others interested in our Company to review the information we post on our website. Information contained in or accessible through our website is not a part of this report.
Our Company is the sole owner of the trademark “TriNet” and other trademarks appearing in this report. Our Company does not intend to use or display trade names or trademarks owned by others in a manner that would imply any form of association with any of those companies.
|
|
|
|
|
|
|
|
|
|
|
|
| TRINET |
6 |
2023 Q3 FORM 10-Q |
|
|
|
|
|
|
| MANAGEMENT'S DISCUSSION AND ANALYSIS |
|
Management’s Discussion and Analysis of Financial Condition and Results of Operations
Executive Summary
Overview
TriNet is a leading provider of comprehensive and flexible HCM solutions designed to address a wide range of SMB needs as they change over time. Our flexible HCM solutions free SMBs from HR complexities and empower SMBs to focus on what matters most - growing their business and enabling their people.
TriNet offers access to human capital expertise, benefits, payroll, risk mitigation and compliance, all enabled by industry leading technology capabilities. TriNet's suite of products also includes services and software-based solutions to help streamline workflows by connecting HR, benefits, payroll, time and attendance, and employee engagement. Clients can use our industry tailored PEO services and technology platform to receive the full benefit of our HCM services enabling their WSEs to participate in our TriNet-sponsored employee benefit plans. Clients can alternatively choose to use our self-directed, cloud-based HRIS software solution and add HR services such as payroll and access to benefits management as needed. By providing PEO and HRIS services, we believe that we can support a wider range of SMBs and create a pipeline of HRIS clients that may be able to benefit from and transition to TriNet’s higher-touch PEO services at future points in their business lifecycle.
Operational Highlights
Our consolidated results for the nine months ended September 30, 2023 reflect our continuing efforts to serve our clients through the current economic uncertainty and invest in our platform.
So far in 2023 we:
•improved customer retention and sales performance,
•utilized our scale and knowledge to assist our WSEs, PEO and HRIS clients during and following the liquidity challenges in regional banks ensuring that all of our clients were able to successfully run payroll during that time,
•executed a series of transactions to rebalance our capital structure in order to achieve our targeted leverage ratios, including:
◦issued $400 million of our senior unsecured notes maturing in August 2031,
◦executed our 2023 Credit Amendment, to among other things (1) increase the aggregate capacity under our 2021 Revolver from $500 million to $700 million, and (2) extend the maturity date of our 2021 Revolver to August 16, 2028,
◦completed approximately $1 billion in share repurchases of TriNet common stock through a public tender offer in August and a private repurchase from our largest stockholder, Atairos Group, Inc. in September,
•hosted the 4th annual TriNet PeopleForce, our showcase client and prospect conference focused on business transformation, agility and innovation for SMBs, and
•successfully completed the migration of our applications to the cloud.
|
|
|
|
|
|
|
|
|
|
|
|
| TRINET |
7 |
2023 Q3 FORM 10-Q |
|
|
|
|
|
|
| MANAGEMENT'S DISCUSSION AND ANALYSIS |
|
Performance Highlights
Our results for the third quarter and nine months ended September 30, 2023, when compared to the same periods of 2022, are noted below:
Q3 2023
|
|
|
|
|
|
|
|
|
|
|
|
|
|
|
|
|
|
|
|
|
|
|
|
|
|
|
|
$1.2B |
|
$116M |
|
84% |
|
Total revenues |
|
Operating income |
|
Insurance cost ratio |
|
(2) |
% |
decrease |
|
(3) |
% |
decrease |
|
1 |
% |
increase |
|
|
|
|
|
|
|
|
|
|
$94M |
|
$1.63 |
|
$109M |
|
Net income |
|
Diluted EPS |
|
Adjusted Net income * |
|
22 |
% |
increase |
|
33 |
% |
increase |
|
5 |
% |
increase |
|
|
|
|
|
|
|
|
|
|
333,286 |
|
335,741 |
|
210,863 |
|
Average WSEs ** |
|
Total WSEs ** |
|
Average HRIS Users |
|
(5) |
% |
decrease |
|
(5) |
% |
decrease |
|
(15) |
% |
decrease |
|
|
|
|
|
|
|
|
|
| * |
|
| ** |
Total WSEs includes approximately 4,600 additional service recipients and Average WSEs includes approximately 1,500 additional service recipients, in each case identified as a result of our ongoing effort to ensure that our billing practices best match the expectations of our customers. For details, refer to the heading "Operating Metrics – Worksite Employees (WSEs).” |
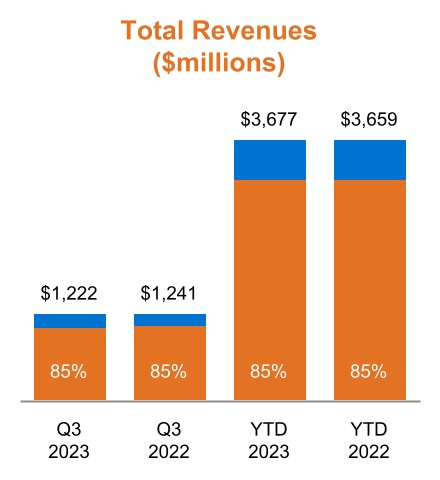
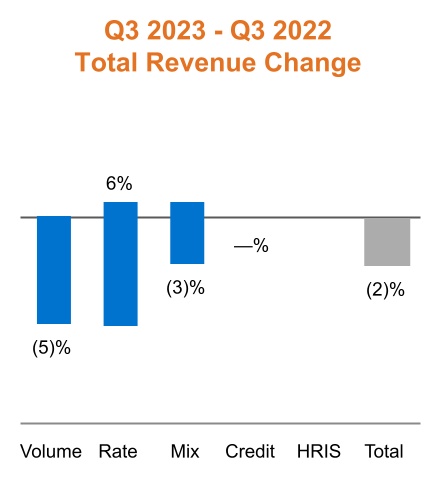
Our total revenues decreased 2% compared to the same period in 2022, driven by lower volume due to decreases in Average WSEs. This decrease was partially offset by insurance and services fee rate increases.
During the third quarter of 2023, our Average WSEs and Total WSEs decreased 5% compared to the same periods in 2022 primarily due to the cumulative impact of lower hiring in our installed base during the past twelve months, particularly within our Technology vertical, which did not offset our normal attrition. This trend was partially offset by stronger new client additions and retention during the third quarter of 2023.
Our ICR was 1% higher compared to the same period in 2022 driven by increased health benefits utilization rates and inflation in health costs.
Lower operating expenses and lower investment losses, and higher interest income, partially offset by lower revenues, resulted in increases of net income and Adjusted Net income of 22% and 5%, respectively, as compared to the same periods in 2022.
YTD 2023
|
|
|
|
|
|
|
|
|
|
|
|
|
|
|
|
|
|
|
|
|
|
|
|
|
|
|
|
$3.7B |
|
$382M |
|
83% |
|
Total revenues |
|
Operating income |
|
Insurance cost ratio |
|
— |
% |
flat |
|
(14) |
% |
decrease |
|
1 |
% |
increase |
|
|
|
|
|
|
|
|
|
|
$308M |
|
$5.20 |
|
$365M |
|
Net income |
|
Diluted EPS |
|
Adjusted Net income * |
|
— |
% |
flat |
|
8 |
% |
increase |
|
(3) |
% |
decrease |
|
|
|
|
|
|
|
|
|
|
329,257 |
|
335,741 |
|
219,058 |
|
Average WSEs ** |
|
Total WSEs ** |
|
Average HRIS Users |
|
(6) |
% |
decrease |
|
(5) |
% |
decrease |
|
(13) |
% |
decrease |
|
|
|
|
|
|
|
|
|
| * |
|
| ** |
Total WSEs includes approximately 4,600 additional service recipients and Average WSEs includes approximately 1,500 additional service recipients, in each case identified as a result of our ongoing effort to ensure that our billing practices best match the expectations of our customers. For details, refer to the heading "Operating Metrics – Worksite Employees (WSEs).” |
|
|
|
|
|
|
|
|
|
|
|
|
| TRINET |
8 |
2023 Q3 FORM 10-Q |
|
|
|
|
|
|
| MANAGEMENT'S DISCUSSION AND ANALYSIS |
|
Results of Operations
The following table summarizes our results of operations for the third quarter and nine months ended September 30, 2023 when compared to the same periods of 2022. For details of the critical accounting judgments and estimates that could affect our Results of Operations, see the
Critical Accounting Judgments and Estimates section within the MD&A in Item 7 of our 2022 Form 10-K.
|
|
|
|
|
|
|
|
|
|
|
|
|
|
|
|
|
|
|
|
|
|
|
|
| |
Three Months Ended September 30, |
|
Nine Months Ended September 30, |
| (in millions, except operating metrics data) |
2023 |
2022 |
% Change |
|
2023 |
2022 |
% Change |
| Income Statement Data: |
|
|
|
|
|
|
|
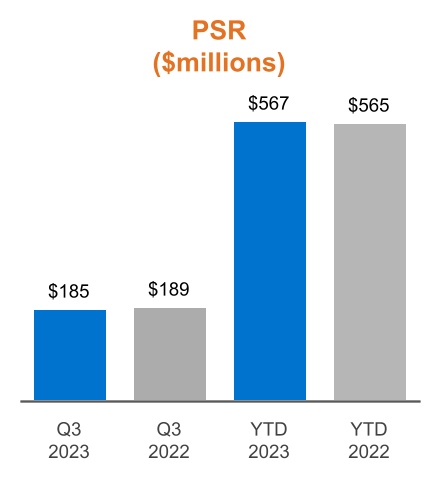
| Professional service revenues |
$ |
185 |
|
$ |
189 |
|
(2) |
% |
|
$ |
567 |
|
$ |
565 |
|
— |
% |
| Insurance service revenues |
1,037 |
|
1,052 |
|
(1) |
|
|
3,110 |
|
3,094 |
|
1 |
|
| Total revenues |
1,222 |
|
1,241 |
|
(2) |
|
|
3,677 |
|
3,659 |
|
— |
|
| Insurance costs |
874 |
|
872 |
|
— |
|
|
2,594 |
|
2,547 |
|
2 |
|
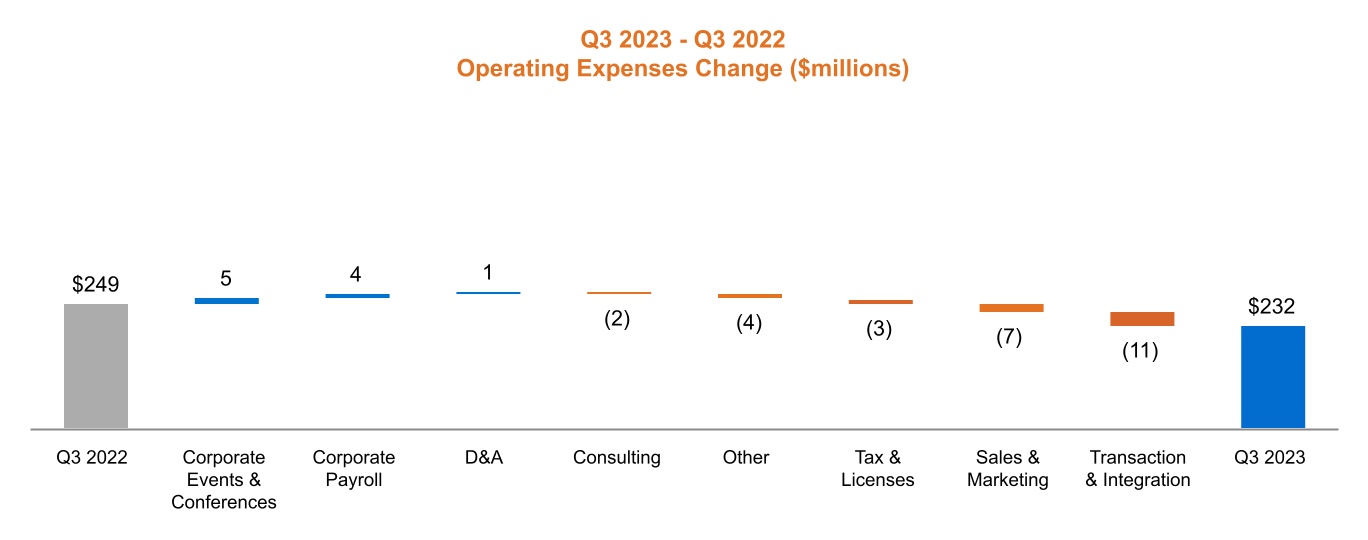
| Operating expenses |
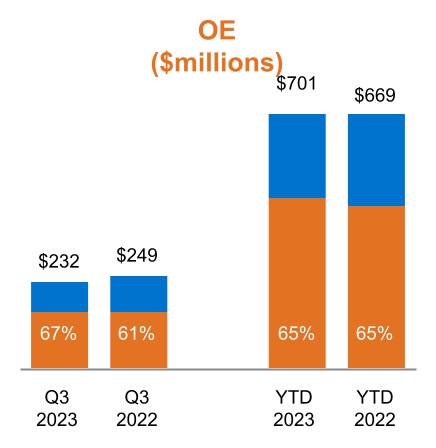
232 |
|
249 |
|
(7) |
|
|
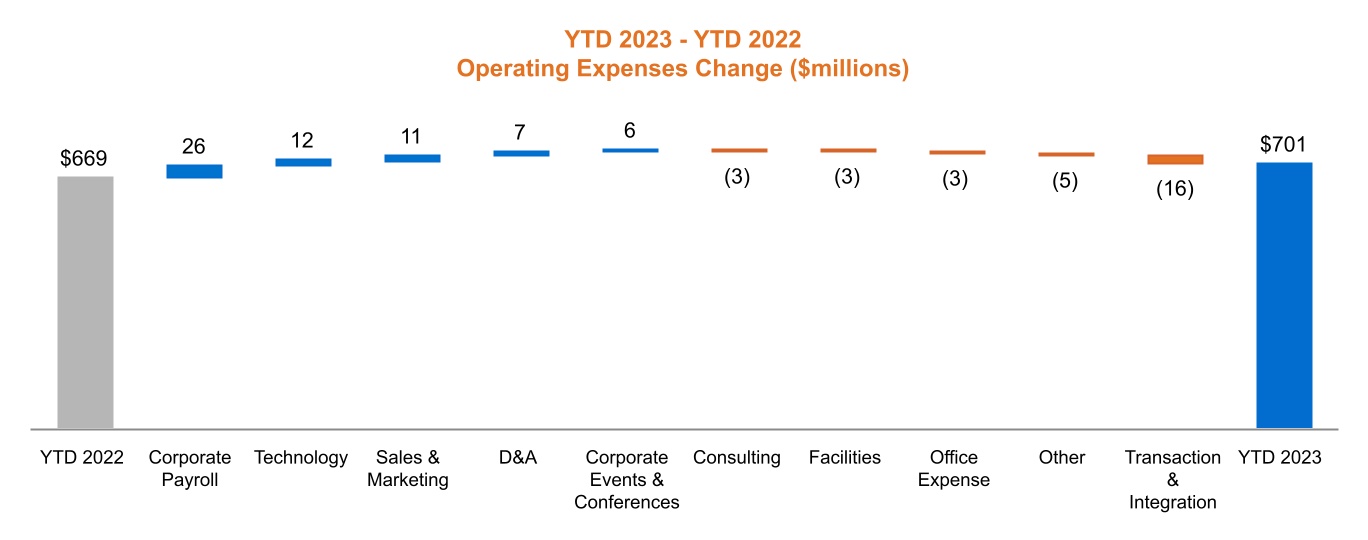
701 |
|
669 |
|
5 |
|
| Total costs and operating expenses |
1,106 |
|
1,121 |
|
(1) |
|
|
3,295 |
|
3,216 |
|
2 |
|
| Operating income |
116 |
|
120 |
|
(3) |
|
|
382 |
|
443 |
|
(14) |
|
| Other income (expense): |
|
|
|
|
|
|
|
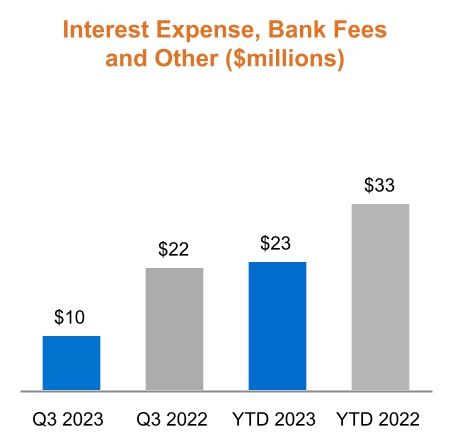
| Interest expense, bank fees and other |
(10) |
|
(22) |
|
(55) |
|
|
(23) |
|
(33) |
|
(30) |
|
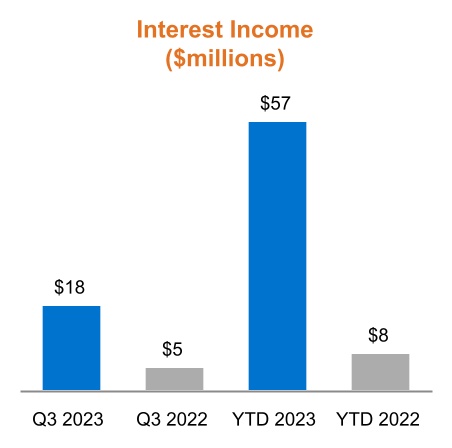
| Interest income |
18 |
|
5 |
|
260 |
|
|
57 |
|
8 |
|
613 |
|
|
|
|
|
|
|
|
|
|
|
|
|
|
|
|
|
| Income before provision for income taxes |
124 |
|
103 |
|
20 |
|
|
416 |
|
418 |
|
— |
|
| Income taxes |
30 |
|
26 |
|
15 |
|
|
108 |
|
111 |
|
(3) |
|
| Net income |
$ |
94 |
|
$ |
77 |
|
22 |
% |
|
$ |
308 |
|
$ |
307 |
|
— |
% |
|
|
|
|
|
|
|
|
|
|
|
|
|
|
|
|
| Cash Flow Data: |
|
|
|
|
|
|
|
| Net cash provided by (used in) operating activities |
|
|
|
|
(43) |
|
76 |
|
(157) |
|
| Net cash used in investing activities |
|
|
|
|
(57) |
|
(205) |
|
(72) |
|
| Net cash used in financing activities |
|
|
|
|
(523) |
|
(392) |
|
33 |
|
|
|
|
|
|
|
|
|
Non-GAAP measures (1): |
|
|
|
|
|
|
|
|
|
|
|
|
|
|
|
|
|
|
|
|
|
|
|
|
|
|
|
|
|
|
|
| Adjusted EBITDA |
$ |
172 |
|
173 |
|
(1) |
|
|
$ |
557 |
|
577 |
|
(3) |
|
| Adjusted Net income |
$ |
109 |
|
104 |
|
5 |
|
|
$ |
365 |
|
378 |
|
(3) |
|
| Corporate Operating Cash Flows |
|
|
|
|
386 |
|
436 |
|
(11) |
|
|
|
|
|
|
|
|
|
| Operating Metrics: |
|
|
|
|
|
|
|
| Insurance Cost Ratio |
84 |
% |
83 |
% |
1 |
% |
|
83 |
% |
82 |
% |
1 |
% |
Average WSEs (2) |
333,286 |
|
351,888 |
|
(5) |
% |
|
329,257 |
|
348,833 |
|
(6) |
% |
Total WSEs (2) |
335,741 |
|
351,839 |
|
(5) |
% |
|
335,741 |
|
351,839 |
|
(5) |
% |
Average HRIS Users (3) |
210,863 |
|
247,375 |
|
(15) |
% |
|
219,058 |
|
251,707 |
|
(13) |
% |
|
|
|
|
|
|
|
|
|
|
|
|
|
|
|
|
|
|
|
|
|
|
|
|
(1) Refer to Non-GAAP measures definitions and reconciliations from GAAP measures under the heading "Non-GAAP Financial Measures".
(2) Total WSEs includes approximately 4,600 additional service recipients and Average WSEs includes approximately 1,500 additional service recipients for the third quarter of 2023, in each case identified as a result of our ongoing effort to ensure that our billing practices best match the expectations of our customers. For details, refer to the heading "Operating Metrics – Worksite Employees (WSEs)".
(3) For the nine months ended September 30, 2022, reflects HRIS Users from February 15, 2022, the date on which we acquired Zenefits, to the end of the period.
The following table summarizes our balance sheet data as of September 30, 2023 compared to December 31, 2022.
|
|
|
|
|
|
|
|
|
|
|
|
|
|
|
|
|
|
|
| (in millions) |
September 30,
2023 |
|
December 31,
2022 |
|
% Change |
|
| Balance Sheet Data: |
|
|
|
|
|
|
|
|
|
|
|
|
|
| Working capital |
$ |
150 |
|
|
$ |
338 |
|
|
(56) |
% |
|
| Total assets |
2,966 |
|
|
3,443 |
|
|
(14) |
|
|
| Debt |
1,091 |
|
|
496 |
|
|
120 |
|
|
| Total stockholders’ equity |
10 |
|
|
775 |
|
|
(99) |
|
|
|
|
|
|
|
|
|
|
|
|
|
|
| TRINET |
9 |
2023 Q3 FORM 10-Q |
|
|
|
|
|
|
| MANAGEMENT'S DISCUSSION AND ANALYSIS |
|
Non-GAAP Financial Measures
In addition to financial measures presented in accordance with GAAP, we monitor other non-GAAP financial measures that we use to manage our business, to make planning decisions, to allocate resources and to use as performance measures in our executive compensation plan. These key financial measures provide an additional view of our operational performance over the long-term and provide information that we use to maintain and grow our business.
The presentation of these non-GAAP financial measures is used to enhance the understanding of certain aspects of our financial performance. It is not meant to be considered in isolation from, superior to, or as a substitute for the directly comparable financial measures prepared in accordance with GAAP.
|
|
|
|
|
|
|
|
|
| Non-GAAP Measure |
Definition |
How We Use The Measure |
|
|
|
|
|
|
|
|
|
Adjusted EBITDA |
• Net income, excluding the effects of:
- income tax provision,
- interest expense, bank fees and other,
- depreciation,
- amortization of intangible assets,
- stock based compensation expense,
- amortization of cloud computing arrangements, and
- transaction and integration costs.
|
• Provides period-to-period comparisons on a consistent basis and an understanding as to how our management evaluates the effectiveness of our business strategies by excluding certain non-recurring costs, which include transaction and integration costs, as well as certain non-cash charges such as depreciation and amortization, and stock-based compensation and certain impairment charges recognized based on the estimated fair values. We believe these charges are either not directly resulting from our core operations or not indicative of our ongoing operations.
• Enhances comparisons to the prior period and, accordingly, facilitates the development of future projections and earnings growth prospects.
• Provides a measure, among others, used in the determination of incentive compensation for management.
• We also sometimes refer to Adjusted EBITDA margin, which is the ratio of Adjusted EBITDA to total revenues. |
Adjusted Net Income |
• Net income, excluding the effects of:
- effective income tax rate (1),
- stock based compensation,
- amortization of intangible assets, net,
- non-cash interest expense,
- transaction and integration costs, and
- the income tax effect (at our effective tax rate (1) of these pre-tax adjustments.
|
• Provides information to our stockholders and board of directors to understand how our management evaluates our business, to monitor and evaluate our operating results, and analyze profitability of our ongoing operations and trends on a consistent basis by excluding certain non-cash charges. |
| Corporate Operating Cash Flows |
• Net cash provided by (used in) operating activities, excluding the effects of:
- Assets associated with WSEs (accounts receivable, unbilled revenue, prepaid expenses, other payroll assets and other current assets) and
- Liabilities associated with WSEs (client deposits and other client liabilities, accrued wages, payroll tax liabilities and other payroll withholdings, accrued health insurance costs, accrued workers' compensation costs, insurance premiums and other payables, and other current liabilities). |
• Provides information that our stockholders and management can use to evaluate our cash flows from operations independent of the current assets and liabilities associated with our WSEs. • Enhances comparisons to prior periods and, accordingly, used as a liquidity measure to manage liquidity between corporate and WSE related activities, and to help determine and plan our cash flow and capital strategies.
|
|
|
|
(1) Non-GAAP effective tax rate is 25.6% for the third quarter and full year of 2023 and 25.5% for the third quarter and full year of 2022, which excludes the income tax impact from stock-based compensation, changes in uncertain tax positions, and nonrecurring benefits or expenses from federal legislative changes.
|
|
|
|
|
|
|
|
|
|
|
|
| TRINET |
10 |
2023 Q3 FORM 10-Q |
|
|
|
|
|
|
| MANAGEMENT'S DISCUSSION AND ANALYSIS |
|
Reconciliation of GAAP to Non-GAAP Measures
The table below presents a reconciliation of Net income to Adjusted EBITDA:
|
|
|
|
|
|
|
|
|
|
|
|
|
|
|
|
|
|
|
Three Months Ended September 30, |
|
Nine Months Ended September 30, |
(in millions) |
2023 |
2022 |
|
2023 |
2022 |
Net income |
$ |
94 |
|
$ |
77 |
|
|
$ |
308 |
|
$ |
307 |
|
Provision for income taxes |
30 |
|
26 |
|
|
108 |
|
111 |
|
Stock based compensation |
15 |
|
16 |
|
|
43 |
|
46 |
|
Interest expense, bank fees and other (1) |
10 |
|
22 |
|
|
23 |
|
33 |
|
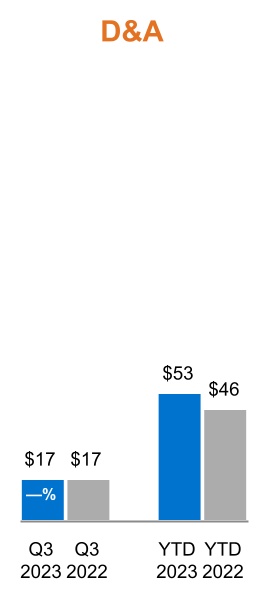
| Depreciation and amortization of intangible assets |
17 |
|
17 |
|
|
53 |
|
46 |
|
| Amortization of cloud computing arrangements |
3 |
|
1 |
|
|
7 |
|
3 |
|
| Transaction and integration costs |
3 |
|
14 |
|
|
15 |
|
31 |
|
| Adjusted EBITDA |
$ |
172 |
|
$ |
173 |
|
|
$ |
557 |
|
$ |
577 |
|
Adjusted EBITDA Margin |
14.1 |
% |
14.0 |
% |
|
15.1 |
% |
15.7 |
% |
(1) 2022 Interest expense, bank fees and other includes $17M of realized investments losses on sales and impairments related to AFS securities.
The table below presents a reconciliation of Net income to Adjusted Net Income:
|
|
|
|
|
|
|
|
|
|
|
|
|
|
|
|
|
|
|
Three Months Ended September 30, |
|
Nine Months Ended September 30, |
(in millions) |
2023 |
2022 |
|
2023 |
2022 |
Net income |
$ |
94 |
|
$ |
77 |
|
|
$ |
308 |
|
$ |
307 |
|
| Effective income tax rate adjustment |
(2) |
|
— |
|
|
1 |
|
4 |
|
| Stock based compensation |
15 |
|
16 |
|
|
43 |
|
46 |
|
| Amortization of other intangible assets, net |
5 |
|
5 |
|
|
16 |
|
13 |
|
| Non-cash interest expense |
— |
|
1 |
|
|
1 |
|
1 |
|
| Transaction and integration costs |
3 |
|
14 |
|
|
15 |
|
31 |
|
| Income tax impact of pre-tax adjustments |
(6) |
|
(9) |
|
|
(19) |
|
(24) |
|
| Adjusted Net Income |
$ |
109 |
|
$ |
104 |
|
|
$ |
365 |
|
$ |
378 |
|
The table below presents a reconciliation of net cash provided by operating activities to Corporate Operating Cash Flows:
|
|
|
|
|
|
|
|
|
|
Nine Months Ended
September 30, |
| (in millions) |
2023 |
2022 |
| Net cash provided by (used in) operating activities |
$ |
(43) |
|
$ |
76 |
|
| Less: Change in WSE related other current assets |
(134) |
|
(101) |
|
| Less: Change in WSE related liabilities |
(295) |
|
(259) |
|
| Net cash used in operating activities - WSE |
$ |
(429) |
|
$ |
(360) |
|
| Net cash provided by operating activities - Corporate |
$ |
386 |
|
$ |
436 |
|
|
|
|
|
|
|
|
|
|
|
|
|
| TRINET |
11 |
2023 Q3 FORM 10-Q |
|
|
|
|
|
|
| MANAGEMENT'S DISCUSSION AND ANALYSIS |
|
Operating Metrics
Worksite Employees (WSE)
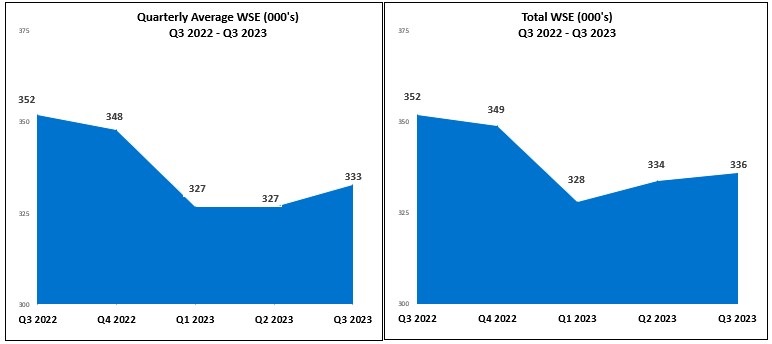
Average WSE change is a volume measure we use to monitor the performance of our business. Our clients generally change their payroll service providers at the beginning of the payroll tax and benefits enrollment year; as a result, we have historically experienced our highest volumes of new clients and terminating clients in the month of January. Client attrition, new client additions and increases in employment within our installed client base all impact our Average WSEs and Total WSEs as we move through a calendar year.
We provide WSE services to individuals from the date of their hire by a TriNet client through the end of their employment and also during the post-employment period. As a result, we define WSEs to include co-employees and other individuals receiving TriNet services, such as individuals who receive COBRA benefits or are subject to K-1 tax reporting. As part of an ongoing effort to ensure that our billing practices best match the expectations of our customers, we determined in the third quarter that we under counted certain individuals who receive TriNet services in counting Total WSEs and Average WSEs. This increased our reported Total WSEs by approximately 4,600 for September 30, 2023 and Average WSEs by approximately 1,500 for the third quarter of 2023. We intend to continue our ongoing effort to ensure that our billing practices best match the expectations of our customers and we may identify additional service recipients in the future that should be included in Total WSEs and Average WSEs.
Average WSEs decreased 5% when comparing the third quarter of 2023 to the same period in 2022 primarily due to lower hiring in our installed base across most verticals during the past twelve months, especially within our Technology vertical. This trend was partially offset by stronger new client additions and retention in 2023.
Total WSEs can be used to estimate our beginning WSEs for the next period and, as a result, can be used as an indicator of our potential future success in generating revenue, growing our business and retaining clients. Total WSEs decreased 5% when compared to the same period in 2022, due to net client attrition over the past year, partially offset by improvements in new client additions and retention during 2023.
Anticipated revenues for future periods can diverge from the revenue expectation derived from Average WSEs or Total WSEs due to pricing differences across our HR solutions and services and the degree to which clients and WSEs elect to participate in our solutions during future periods. In addition to focusing on growing our Average WSE and Total WSE counts, we also focus on pricing strategies, benefit participation and service differentiation to expand our revenue opportunities. We report the impact of client and WSE participation differences as a change in mix.
We continue to invest in efforts intended to enhance client experience, improve our new sales performance, and manage client attrition, through product development as well as operational and process improvements. In addition to focusing on retaining and growing our WSE base, we continue to review acquisition opportunities that would expand our product offering and provide further scale.
|
|
|
|
|
|
|
|
|
|
|
|
| TRINET |
12 |
2023 Q3 FORM 10-Q |
|
|
|
|
|
|
| MANAGEMENT'S DISCUSSION AND ANALYSIS |
|
HRIS Users
Average HRIS Users is a volume measure we use to monitor the performance of our cloud-based HRIS services. Average HRIS Users for the third quarter and nine months ended September 30, 2023 was 210,863, and 219,058, respectively. Average HRIS Users for the third quarter and nine months ended 2022 was 247,375 and 251,707, respectively. The decrease in Average HRIS Users was primarily driven by client attrition outpacing new client additions.
Insurance Cost Ratio (ICR)
ICR is a performance measure calculated as the ratio of insurance costs to insurance service revenues. We believe that ICR promotes an understanding of our insurance cost trends and our ability to align our relative pricing to risk performance.
We purchase workers' compensation and health benefits coverage for our WSEs. Under the insurance policies for this coverage, we bear claims costs up to a defined deductible amount. Our insurance costs, which comprise a significant portion of our overall costs, are significantly affected by our WSEs’ health and workers' compensation insurance claims experience. We set our insurance service fees for workers’ compensation and health benefits in advance for fixed benefit periods. As a result, increases in insurance costs above our projections, reflected as a higher ICR, result in lower net income. Decreases in insurance costs below our projections, reflected as a lower ICR, result in higher net income, but can be an indicator that insurance costs are developing more slowly than our projections, which are reflected in our fees, and this can have a negative impact on client retention and new sales.
Under our fully-insured workers' compensation insurance policies, we assume the risk for losses up to $1 million per claim occurrence (deductible layer). The ultimate cost of the workers’ compensation services provided cannot be known until all the claims are settled. Our ability to predict these costs is limited by unexpected increases in frequency or severity of claims, which can vary due to changes in the cost of treatments or claim settlements.
Under our risk-based health insurance policies, we assume the risk of variability in future health claims costs for our enrollees. This variability typically results from changing trends in the volume, severity and ultimate cost of medical and pharmaceutical claims, due to changes to the components of medical cost trend, which we define as changes in participant use of services, including the introduction of new treatment options, changes in treatment guidelines and mandates, and changes in the mix, cost of providing treatment and timing of services provided to plan participants. These trends change, and other seasonal trends and variability may develop. As a result, it is difficult for us to predict our insurance costs with accuracy and a significant increase in these costs could have a material adverse effect on our business.
|
|
|
|
|
|
|
|
|
|
|
|
|
|
|
|
|
|
| |
Three Months Ended September 30, |
|
Nine Months Ended September 30, |
| (in millions) |
2023 |
2022 |
|
2023 |
2022 |
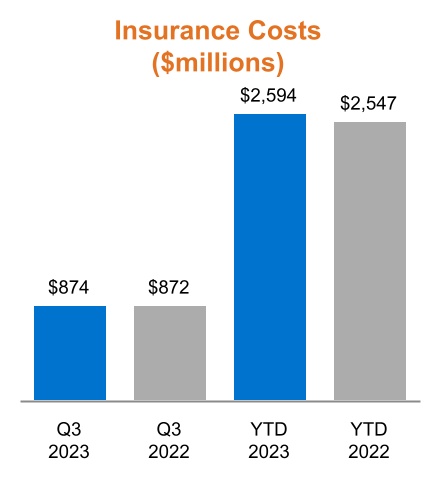
| Insurance costs |
$ |
874 |
|
$ |
872 |
|
|
$ |
2,594 |
|
$ |
2,547 |
|
| Insurance service revenues |
1,037 |
|
1,052 |
|
|
3,110 |
|
3,094 |
|
| Insurance Cost Ratio |
84 |
% |
83 |
% |
|
83 |
% |
82 |
% |
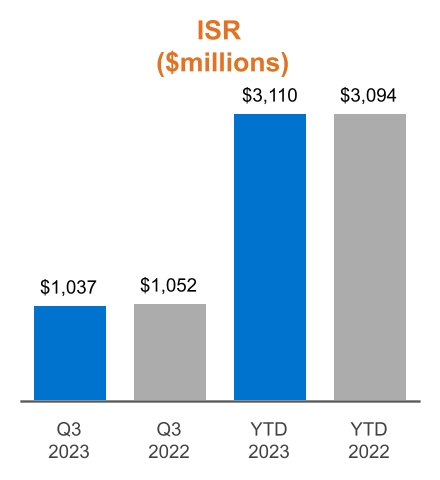
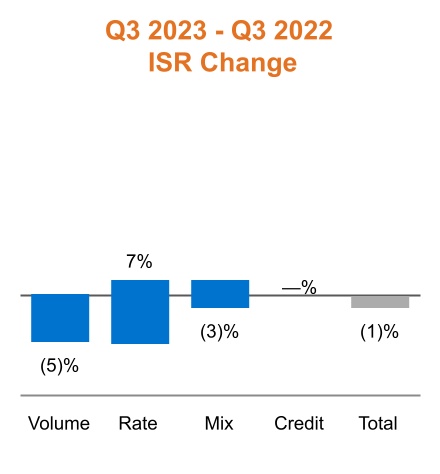
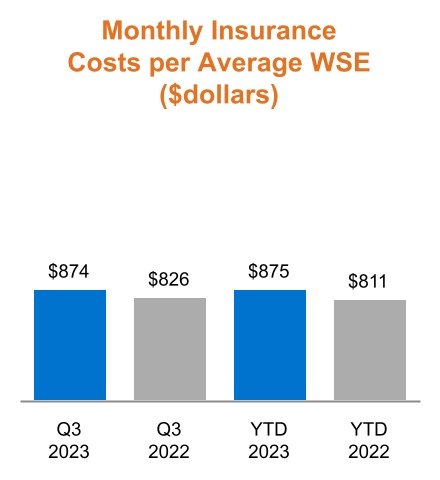
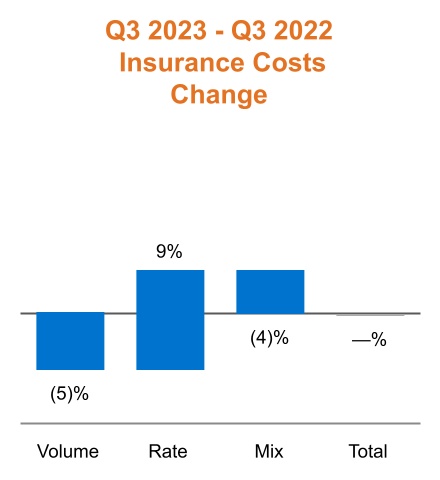
ICR increased slightly for the third quarter as compared to the same period in 2022 primarily driven by lower ISR. The decrease in ISR for the third quarter was primarily driven by lower volume due to lower Average WSEs and lower health plan enrollment, partially offset by higher rates. Insurance costs increased in the third quarter as compared to the same period in 2022, despite the lower enrollments, due to higher costs associated with medical services utilization.
ICR increased slightly for the nine months ended September 30, 2023 as insurance costs grew at a higher rate than ISR. Insurance costs increased for the nine months ended September 30, 2023 due to higher costs associated with medical services utilization, in particular outpatient services and pharmacy costs. This was partially offset by lower volume due to lower Average WSEs.
Total Revenues
Our revenues consist of PSR and ISR. PSR represents fees charged to clients for processing payroll-related transactions on behalf of our PEO and HRIS clients, access to our HR expertise, employment and benefit law compliance services, other HR-related services and fees charged to access our cloud-based HRIS services. ISR
|
|
|
|
|
|
|
|
|
|
|
|
| TRINET |
13 |
2023 Q3 FORM 10-Q |
|
|
|
|
|
|
| MANAGEMENT'S DISCUSSION AND ANALYSIS |
|
consists of insurance-related billings and administrative fees collected from clients and withheld from WSEs for workers' compensation insurance and health benefit insurance plans provided by third-party insurance carriers.
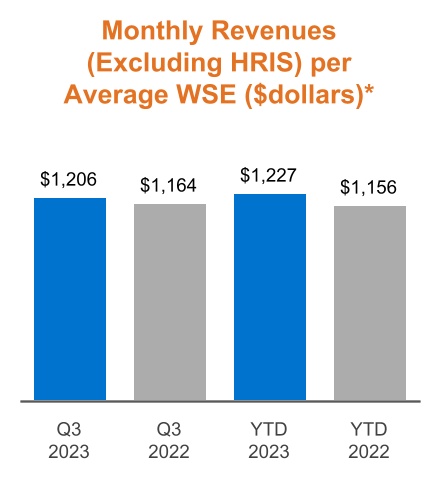
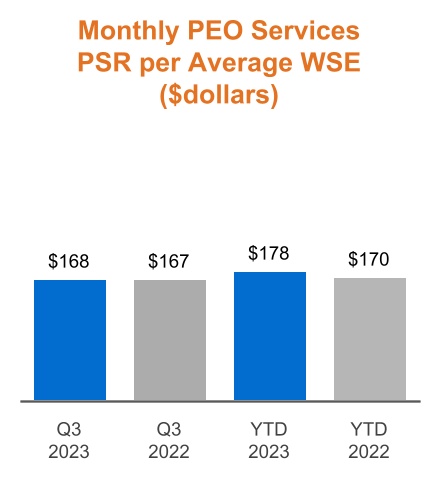
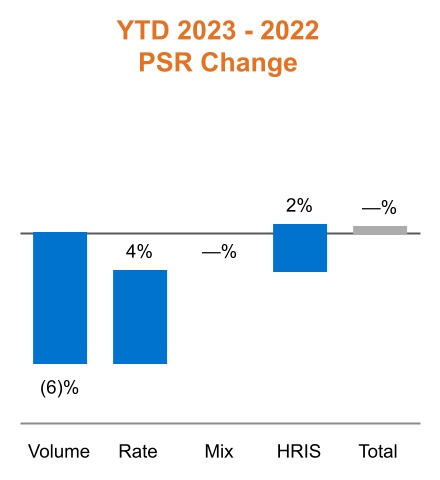
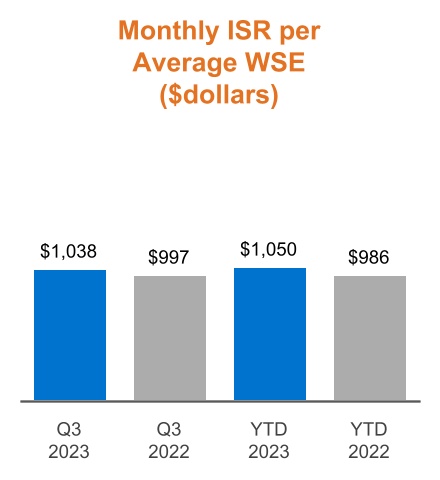
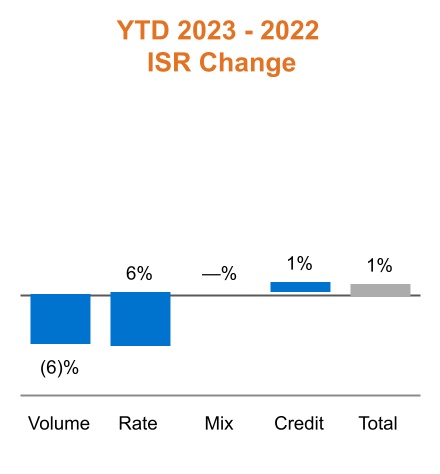
Monthly total revenues per Average WSE is a measure we use to monitor our PEO pricing strategies. This measure increased 4% and 6% during the third quarter and nine months ended September 30, 2023, respectively, compared to the same periods in 2022.
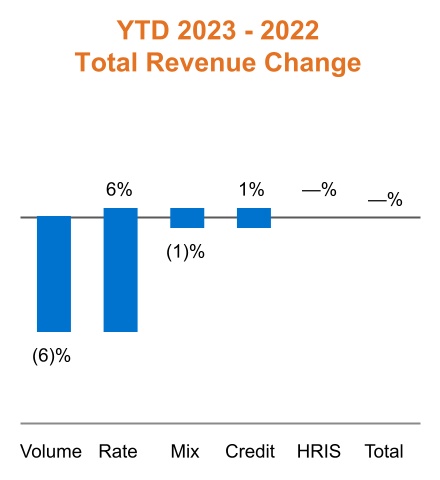
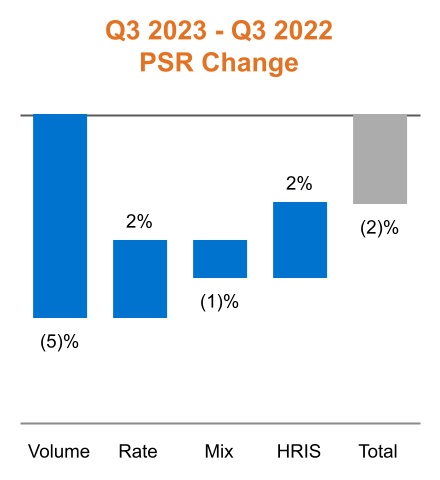
We also use the following measures to further analyze changes in total revenue:
•Volume - the percentage change in period over period Average WSEs,
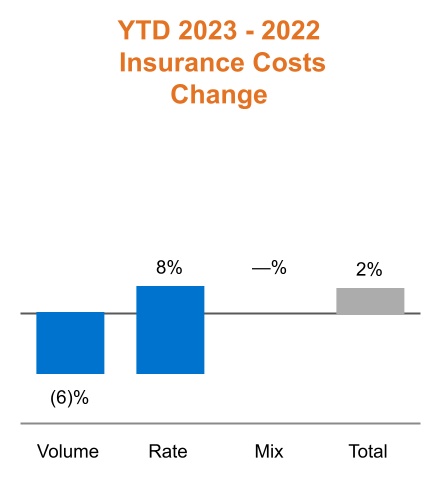
•Rate - the combined weighted average percentage changes in service fees for each vertical service and changes in service fees associated with each insurance service offering,
•Mix - the change in composition of Average WSEs within our verticals combined with the composition of our enrolled WSEs within our insurance service offerings and the composition of products and services our clients receive, including Clarus R+D,
•Credit - the weighted average change in amounts recognized for our previously announced 2022 Credits, and
•HRIS - incremental HRIS cloud services revenue.
|
|
|
|
|
|
|
|
|
|
|
|
|
|
|
|
|
PSR |
|
|
|
|
|
|
|
|
|
|
ISR - % represents proportion of insurance service revenues to total revenues |
|
|
|
|
|
|
|
|
|
|
|
|
|
|
|
|
|
|
|
*Total revenues generated from PEO services only |
|
|
The decline in total revenue for the third quarter ended 2023 was primarily driven by lower average volume from our PEO services and lower health plan enrollment, partially offset by rate increases. Total revenue for the nine months ended September 30, 2023 was effectively flat as the decrease in volume related to lower Average WSEs was offset by increases in rates.
|
|
|
|
|
|
|
|
|
|
|
|
| TRINET |
14 |
2023 Q3 FORM 10-Q |
|
|
|
|
|
|
| MANAGEMENT'S DISCUSSION AND ANALYSIS |
|
Operating Income
Our operating income consists of total revenues less insurance costs and OE. Our insurance costs include insurance premiums for coverage provided by insurance carriers, expenses for claims costs and risk management and administrative services, and changes in accrued costs related to contractual obligations with our workers' compensation and health benefit carriers. Our OE consists primarily of our colleagues' compensation related expenses, which includes payroll, payroll taxes, SBC, bonuses, commissions and other payroll-and benefits-related costs.
The table below provides a view of the changes in components of operating income for the third quarter and nine months ended September 30, 2023, as compared to the same periods in 2022.
|
|
|
|
|
|
|
|
|
|
| (in millions) |
|
| $120 |
|
Third Quarter 2022 Operating Income |
|
-19 |
|
|
Lower total revenues primarily driven by lower average volume from our PEO services and lower health plan enrollment, partially offset by rate increases. |
|
-2 |
|
|
Flat insurance costs as higher health cost rates were offset by lower health plan enrollment and lower volume due to lower Average WSEs. |
|
+17 |
|
|
Lower OE primarily as a result of lower spend in consulting, facilities, and tax and licenses, partially offset by higher conference and event expenses. |
| $116 |
|
Third Quarter 2023 Operating Income |
|
|
|
|
|
|
|
|
|
|
| (in millions) |
|
| $443 |
|
YTD 2022 Operating Income |
|
+18 |
|
|
Higher total revenues primarily driven by rate increases and that no reduction in revenue was recognized in 2023 related to our 2022 Credits, partially offset by lower Average WSEs. |
|
-47 |
|
|
Higher insurance costs primarily as a result of higher health cost rates, partially offset by lower Average WSEs. |
|
-32 |
|
|
Higher OE primarily as a result of higher compensation, S&M and technology spend to improve client experience, enhance service offerings, and improve processes, including a full nine months of supporting the HRIS product, together with higher sales and marketing expenses to support sales efforts. This was partially offset by lower spend in consulting and facilities. |
| $382 |
|
YTD 2023 Operating Income |
|
|
|
|
|
|
|
|
|
|
|
|
| TRINET |
15 |
2023 Q3 FORM 10-Q |
|
|
|
|
|
|
| MANAGEMENT'S DISCUSSION AND ANALYSIS |
|
Professional Service Revenues
Our PEO and HRIS clients are primarily billed on a fee per WSE or HRIS User per month per transaction. Our vertical approach provides us the flexibility to offer our PEO clients in different industries with varied services at different prices, which we believe potentially reduces the value of solely using Average WSE and Total WSE counts as indicators of future potential revenue performance.
PSR from PEO Services customers and HRIS cloud services clients was as follows:
|
|
|
|
|
|
|
|
|
|
|
|
|
|
|
|
|
|
|
Three Months Ended September 30, |
|
Nine Months Ended September 30, |
| (in millions) |
2023 |
2022 |
|
2023 |
2022 |
| PEO Services |
$ |
168 |
|
$ |
177 |
|
|
$ |
527 |
|
$ |
535 |
|
HRIS Cloud Services |
17 |
|
12 |
|
12 |
|
40 |
|
30 |
|
| Total |
$ |
185 |
|
$ |
189 |
|
|
$ |
567 |
|
$ |
565 |
|
We also analyze changes in PSR with the following measures:
•Volume - the percentage change in period over period Average WSEs,
•Rate - the weighted average percentage change in fees for each vertical,
•Mix - the change in composition of Average WSEs across our verticals and the composition of products and services our clients receive, including Clarus R+D, and
•HRIS - incremental HRIS cloud services revenue.
The decrease in PSR for the third quarter of 2023 was primarily driven by lower Average WSEs, primarily in our Technology vertical due to client attrition and lower client hiring within our installed base during the past twelve months. The decrease was partially offset by rate increases from our PEO services and higher HRIS cloud service revenue. The increase in HRIS revenues relates to the impact of termination agreements in the broker partner product as we refine our strategic broker strategy.
|
|
|
|
|
|
|
|
|
|
|
|
| TRINET |
16 |
2023 Q3 FORM 10-Q |
|
|
|
|
|
|
| MANAGEMENT'S DISCUSSION AND ANALYSIS |
|
PSR was flat for the nine months ended September 30, 2023 as rate increases from our PEO services, as well as the higher HRIS revenue were offset by lower WSEs, primarily in our Technology vertical due to client attrition and lower client hiring within our installed base.
Insurance Service Revenues
ISR consists of insurance services-related billings and administrative fees collected from PEO clients and withheld from WSE payroll for health benefits and workers' compensation insurance provided by third-party insurance carriers.
We use the following measures to analyze changes in ISR:
•Volume - the percentage change in period over period Average WSEs,
•Rate - the weighted average percentage change in fees associated with each of our insurance service offerings,
•Mix - all other changes including the composition of our enrolled WSEs within our insurance service offerings (health plan enrollment), and
•Credit - the weighted average amounts recognized for our previously announced 2022 Credits.
The decrease in ISR for the third quarter was primarily driven by lower volume due to lower Average WSEs and lower health plan enrollment, offset by rate increases.
The increase in ISR for the nine months ended September 30, 2023 was primarily driven by rate increases. In addition, as part of our 2022 Credit program, we recognized a $25 million reduction in revenue in the second quarter of 2022, which did not recur in 2023. This was partially offset by lower volume due to lower Average WSEs.
|
|
|
|
|
|
|
|
|
|
|
|
| TRINET |
17 |
2023 Q3 FORM 10-Q |
|
|
|
|
|
|
| MANAGEMENT'S DISCUSSION AND ANALYSIS |
|
Insurance Costs
Insurance costs include insurance premiums for coverage provided by insurance carriers, expenses for claims costs and other risk management and administrative services, reimbursement of claims payments made by insurance carriers or third-party administrators below a predefined deductible limit, and changes in accrued costs related to contractual obligations with our workers' compensation and health benefit carriers.
We use the following measures to analyze changes in insurance costs:
•Volume - the percentage change in period over period Average WSEs,
•Rate - the weighted average percentage change in cost trend associated with each of our insurance service offerings, and
•Mix - all other changes including the composition of our enrolled WSEs within our insurance service offerings (health plan enrollment).
Insurance costs were approximately flat for the third quarter as higher rates were offset by lower health plan enrollment and lower volume due to lower Average WSEs. The increase in insurance costs for the nine months ended September 30, 2023 was primarily driven by higher rates, partially offset by lower volume due to lower Average WSEs. The rate increases were primarily driven by higher costs associated with medical services utilization, in particular outpatient services and pharmacy costs.
|
|
|
|
|
|
|
|
|
|
|
|
| TRINET |
18 |
2023 Q3 FORM 10-Q |
|
|
|
|
|
|
| MANAGEMENT'S DISCUSSION AND ANALYSIS |
|
Operating Expenses
OE includes COPS, S&M, G&A, SD&P, and D&A.
We had approximately 3,600 corporate employees as of September 30, 2023 primarily across the U.S. but also in India and Canada. Compensation costs for our colleagues include payroll, payroll taxes, SBC, bonuses, commissions and other payroll- and benefits-related costs. Compensation-related expense represented 67% and 61% of our OE in the third quarters of 2023 and 2022 and 65% in the nine months ended September 30, 2023 and 2022.
Transaction and integration costs associated with our acquisitions of Zenefits and Clarus R+D are included in G&A. These costs include advisory, legal, and employee retention costs tied to ongoing employment.
During the third quarter and nine months ended September 30, 2023, OE decreased 7% and increased 5%, respectively, when compared to the same periods in 2022. During the third quarter and nine months ended September 30, 2023, the ratio of OE to total revenues was 19%.
|
|
|
|
|
|
|
|
|
|
|
|
|
|
|
|
|
|
|
|
|
|
|
|
|
|
|
|
|
|
|
|
|
|
|
|
% represents portion of compensation related expense included in operating expenses |
We analyze and present our OE based upon the business functions COPS, S&M, G&A and SD&P and D&A. The charts below provide a view of the expenses of the business functions. Dollars are presented in millions and percentages represent year-over-year change.
|
|
|
|
|
|
|
|
|
|
|
|
| TRINET |
19 |
2023 Q3 FORM 10-Q |
|
|
|
|
|
|
| MANAGEMENT'S DISCUSSION AND ANALYSIS |
|
|
|
|
|
|
|
|
|
|
| (in millions) |
|
| $249 |
Q3 2022 Operating Expenses |
|
-5 |
|
COPS decreased, driven primarily by lower spend in tax and licenses, corporate insurance, and office expenses. |
|
+3 |
|
S&M increased, driven primarily by higher conferences and events expenses and higher compensation from the growth in our sales force, partially offset by lower advertising expenses. |
|
-12 |
|
G&A decreased, driven primarily by lower transaction and integration expenses as well as lower consulting, facilities and recruiting expenses. |
|
-3 |
|
SD&P decreased, driven primarily by lower compensation and consulting expenses. |
|
— |
|
D&A was consistent with the prior period. |
|
$232 |
Q3 2023 Operating Expenses |
|
|
|
|
|
|
|
|
|
|
| (in millions) |
|
| $669 |
|
YTD 2022 Operating Expenses |
|
+6 |
|
|
COPS increased, driven primarily by higher compensation expense to support WSEs and incremental costs related to our HRIS cloud services, partially offset by lower corporate insurance and office expenses. |
|
+35 |
|
|
S&M increased, driven primarily by higher compensation from the growth in our sales force, higher conference and events expenses and higher broker commissions |
|
-11 |
|
|
G&A decreased, driven primarily by transaction and integration expenses as well as lower costs in consulting, facilities and recruiting expenses. |
|
-5 |
|
|
SD&P decreased, driven primarily by lower compensation and consulting expenses. |
|
+7 |
|
|
D&A increased, due to the amortization of intangible assets recognized for the Zenefits and Clarus R+D acquisitions. |
| $701 |
|
YTD 2023 Operating Expenses |
|
|
|
|
|
|
|
|
|
|
|
|
| TRINET |
20 |
2023 Q3 FORM 10-Q |
|
|
|
|
|
|
| MANAGEMENT'S DISCUSSION AND ANALYSIS |
|
The primary spend type drivers to the changes in our OE are presented below:
Other Income (Expense)
Other income (expense) consists primarily of interest and dividend income from cash and investments and interest expense on our outstanding debt.
|
|
|
|
|
|
|
|
|
|
|
|
| TRINET |
21 |
2023 Q3 FORM 10-Q |
|
|
|
|
|
|
| MANAGEMENT'S DISCUSSION AND ANALYSIS |
|
The growth in interest income for the third quarter and nine months ended September 30, 2023 was primarily driven by higher interest earned on cash deposits due to higher market interest rates in 2023.
The lower interest expense, bank fees and other for the third quarter and nine months ended September 30, 2023 was primarily due to the $17M of realized investments losses on sales and impairments related to AFS securities in the third quarter of 2022, which did not reoccur in the current year. This was partially offset by the additional interest on our newly issued 2031 Notes and our $200 million drawdown of our 2021 Revolver in order to partially fund share repurchases in the third quarter of 2023. In addition, we incurred additional interest expense earlier in 2023 related to our temporary draw-down under our 2021 Revolver following the Silicon Valley Bank failure.
Income Taxes
Our ETR was 24% and 26% for the third quarter of 2023 and 2022, respectively and 26% and 27% for the nine months ended September 30, 2023 and 2022, respectively. The decrease in rates was primarily due to an increase in excludable income for state tax purposes, an increase in tax benefits related to stock-based compensation and a decrease in nondeductible compensation.
|
|
|
|
|
|
|
|
|
|
|
|
| TRINET |
22 |
2023 Q3 FORM 10-Q |
|
|
|
|
|
|
| MANAGEMENT'S DISCUSSION AND ANALYSIS |
|
Liquidity and Capital Resources
Liquidity
Liquidity is a measure of our ability to access sufficient cash flows to meet the short-term and long-term cash requirements of our business operations. Our principal source of liquidity for operations is derived from cash provided by operating activities. We rely on cash provided by operating activities to meet our short-term liquidity requirements, which primarily relate to the payment of corporate payroll and other operating costs, and capital expenditures. Our cash flow related to WSE payroll and benefits is generally matched by advance collection from our PEO clients. To minimize the credit risk associated with remitting the payroll and associated taxes and benefits costs, we require PEO clients to prefund the payroll and related payroll taxes and benefits costs.
We believe that we can meet our present and reasonably foreseeable operating cash needs and future commitments through existing liquid assets and continuing cash flows from corporate operating activities. We hold both corporate cash and cash associated with WSEs across multiple financial institutions to reduce concentrations of counterparty risk.
Included in our balance sheets are assets and liabilities resulting from transactions directly or indirectly associated with WSEs, including payroll and related taxes and withholdings, our sponsored workers' compensation and health insurance programs, and other benefit programs. Although we are not subject to regulatory restrictions that require us to do so, we distinguish and manage our corporate assets and liabilities separately from those current assets and liabilities held by us to satisfy our employer obligations associated with our WSEs as follows:
|
|
|
|
|
|
|
|
|
|
|
|
|
|
|
|
|
|
|
|
|
|
|
|
|
September 30, 2023 |
|
December 31, 2022 |
| (in millions) |
Corporate |
WSE |
Total |
|
Corporate |
WSE |
Total |
| Current assets: |
|
|
|
|
|
|
|
| Cash and cash equivalents |
$ |
170 |
|
$ |
— |
|
$ |
170 |
|
|
$ |
354 |
|
$ |
— |
|
$ |
354 |
|
| Investments |
75 |
|
— |
|
75 |
|
|
76 |
|
— |
|
76 |
|
| Restricted cash, cash equivalents and investments |
21 |
|
812 |
|
833 |
|
|
22 |
|
1,241 |
|
1,263 |
|
| Other current assets |
86 |
|
689 |
|
775 |
|
|
78 |
|
555 |
|
633 |
|
| Total current assets |
$ |
352 |
|
$ |
1,501 |
|
$ |
1,853 |
|
|
$ |
530 |
|
$ |
1,796 |
|
$ |
2,326 |
|
|
|
|
|
|
|
|
|
|
|
|
|
|
|
|
|
|
|
|
|
|
|
|
|
|
|
|
|
|
|
|
|
| Total current liabilities |
$ |
202 |
|
$ |
1,501 |
|
$ |
1,703 |
|
|
$ |
192 |
|
$ |
1,796 |
|
$ |
1,988 |
|
|
|
|
|
|
|
|
|
| Working capital |
$ |
150 |
|
$ |
— |
|
$ |
150 |
|
|
$ |
338 |
|
$ |
— |
|
$ |
338 |
|
|
|
|
|
|
|
|
|
|
|
|
|
|
|
|
|
As of September 30, 2023, we did not have any material off-balance sheet arrangements that are reasonably likely to have a current or future effect on our financial condition, results of operations, liquidity, capital expenditures or capital resources.
Working capital for WSEs related activities
We designate funds to ensure that we have adequate current assets to satisfy our current obligations associated with WSEs. We manage our WSE payroll and benefits obligations through collections of payments from our clients which generally occur two to three days in advance of client payroll dates. We regularly review our short-term obligations associated with our WSEs (such as payroll and related taxes, insurance premium and claim payments) and designate funds required to fulfill these short-term obligations, which we refer to as PFC. PFC is included in current assets as restricted cash, cash equivalents and investments.
We manage our sponsored benefit and workers' compensation insurance obligations by maintaining collateral funds in restricted cash, cash equivalents and investments. These collateral amounts are generally determined at the beginning of each plan year and we may be required by our insurance carriers to adjust our collateral balances when facts and circumstances change. We regularly review our collateral balances with our insurance carriers and anticipate funding further collateral in the future based upon our capital requirements. We classify our restricted cash, cash equivalents and investments as current and noncurrent assets to match against the anticipated timing of payments to carriers.
|
|
|
|
|
|
|
|
|
|
|
|
| TRINET |
23 |
2023 Q3 FORM 10-Q |
|
|
|
|
|
|
| MANAGEMENT'S DISCUSSION AND ANALYSIS |
|
Working capital for corporate purposes
Corporate working capital as of September 30, 2023 decreased $188 million from December 31, 2022, primarily driven by the $184 million decrease in corporate unrestricted cash and cash equivalents driven by our stock repurchases in the third quarter of 2023.
We use our available cash and cash equivalents to satisfy our operational and regulatory requirements and to fund capital expenditures. We believe that we can meet our present and reasonably foreseeable operating cash needs and future commitments through existing liquid assets, continuing cash flows from corporate operating activities and the potential issuance of debt or equity securities. We believe our existing corporate cash and cash equivalents and positive working capital will be sufficient to meet our working capital expenditure needs for at least the next twelve months.
Cash Flows
The following table presents our cash flow activities for the stated periods:
|
|
|
|
|
|
|
|
|
|
|
|
|
|
|
|
|
|
|
|
|
|
|
|
| |
Nine Months Ended September 30, |
| (in millions) |
2023 |
|
2022 |
|
Corporate |
WSE |
Total |
|
Corporate |
WSE |
Total |
| Net cash provided by (used in): |
|
|
|
|
|
|
|
| Operating activities |
$ |
386 |
|
$ |
(429) |
|
$ |
(43) |
|
|
$ |
436 |
|
$ |
(360) |
|
$ |
76 |
|
| Investing activities |
(56) |
|
(1) |
|
(57) |
|
|
(199) |
|
(6) |
|
(205) |
|
| Financing activities |
(523) |
|
— |
|
(523) |
|
|
(392) |
|
— |
|
(392) |
|
|
|
|
|
|
|
|
|
| Net decrease in cash and cash equivalents, unrestricted and restricted |
$ |
(193) |
|
$ |
(430) |
|
$ |
(623) |
|
|
$ |
(155) |
|
$ |
(366) |
|
$ |
(521) |
|
| Cash and cash equivalents, unrestricted and restricted: |
|
|
|
|
|
|
|
| Beginning of period |
$ |
406 |
|
$ |
1,131 |
|
$ |
1,537 |
|
|
$ |
660 |
|
$ |
1,078 |
|
$ |
1,738 |
|
| End of period |
$ |
213 |
|
$ |
701 |
|
$ |
914 |
|
|
$ |
505 |
|
$ |
712 |
|
$ |
1,217 |
|
|
|
|
|
|
|
|
|
| Net increase (decrease) in cash and cash equivalents: |
|
|
|
|
|
|
|
| Unrestricted |
$ |
(184) |
|
$ |
— |
|
$ |
(184) |
|
|
$ |
(158) |
|
$ |
— |
|
$ |
(158) |
|
| Restricted |
$ |
(9) |
|
$ |
(430) |
|
$ |
(439) |
|
|
$ |
3 |
|
$ |
(366) |
|
$ |
(363) |
|
Operating Activities
Components of net cash provided by (used in) operating activities are as follows:
|
|
|
|
|
|
|
|
|
| |
Nine Months Ended September 30, |
| (in millions) |
2023 |
2022 |
| Net cash provided by (used in) operating activities |
$ |
(43) |
|
$ |
76 |
|
| Net cash used in operating activities - WSE |
(429) |
|
(360) |
|
| Net cash provided by operating activities - Corporate |
386 |
|
436 |
|
The year-over-year change in net cash used in operating activities for WSE purposes was primarily driven by timing of client payments, payments of payroll and payroll taxes, settlement of our previously announced 2022 Credits, and insurance claim activities. We expect the changes in restricted cash and cash equivalents to correspond to WSE cash provided by (or used in) operations as we manage our obligations associated with WSEs through restricted cash.
Our corporate operating cash flows in the nine months ended September 30, 2023 decreased, when compared to the same period in 2022, primarily due to the timing of our payments of corporate obligations.
|
|
|
|
|
|
|
|
|
|
|
|
| TRINET |
24 |
2023 Q3 FORM 10-Q |
|
|
|
|
|
|
| MANAGEMENT'S DISCUSSION AND ANALYSIS |
|
Investing Activities
Cash used in investing activities for the periods presented below primarily consisted of purchases of investments, capital expenditures and acquisition of business, partially offset by proceeds from the sale and maturity of investments.
|
|
|
|
|
|
|
|
|
| |
Nine Months Ended September 30, |
| (in millions) |
2023 |
2022 |
| Investments: |
|
|
| Purchases of investments |
$ |
(226) |
|
$ |
(337) |
|
| Proceeds from sale and maturity of investments |
223 |
|
390 |
|
| Acquisition of subsidiaries |
— |
|
(219) |
|
| Cash used in investments |
$ |
(3) |
|
$ |
(166) |
|
|
|
|
|
|
|
|
|
|
|
|
|
| Cash used in capital expenditures |
$ |
(54) |
|
$ |
(39) |
|
| Cash used in investing activities |
$ |
(57) |
|
$ |
(205) |
|
Investments
We invest a portion of available cash in investment-grade securities with effective maturities less than five years that are classified on our balance sheets as investments. We consider industry and issuer concentrations in our investment policy.
We also invest funds held as collateral to satisfy our long-term obligation towards workers' compensation liabilities. These investments are classified on our balance sheets as restricted cash, cash equivalents and investments. We review the amount and the anticipated holding period of these investments regularly in conjunction with our estimated long-term workers' compensation liabilities and anticipated claims payment trend. At September 30, 2023, our investments had a weighted average duration of less than two years and an average S&P credit rating of AA.
As of September 30, 2023, we held approximately $1.4 billion in restricted and unrestricted cash, cash equivalents and investments, of which $170 million was unrestricted cash and cash equivalents and $218 million was unrestricted investments. Refer to
Note 2 in the condensed consolidated financial statements and related notes included in this Form 10-Q.
Capital Expenditures
During the nine months ended September 30, 2023 and 2022, we continued to make investments in software and hardware and we enhanced our existing service offerings and technology platform. We expect capital investments in our software and hardware to continue in the future.
We had lower cash used in investing activities in the nine months ended September 30, 2023 as compared to the same period in 2022 primarily as a result of our acquisitions of Zenefits and Clarus in 2022.
Financing Activities
Net cash used in financing activities in the nine months ended September 30, 2023 and 2022 consisted of our debt and equity-related activities.
|
|
|
|
|
|
|
|
|
| |
Nine Months Ended September 30, |
| (in millions) |
2023 |
2022 |
| Financing activities |
|
|
|
|
|
|
|
|
| Repurchase of common stock, net of issuance costs |
(1,114) |
|
(392) |
|
| Proceeds from issuance of 2031 Notes |
400 |
|
— |
|
|
|
|
|
|
|
|
|
|
| Payment of long-term financing fees and debt issuance costs |
(9) |
|
— |
|
| Proceeds from revolving credit agreement borrowings |
695 |
|
— |
|
| Repayment of borrowings under revolving credit facility |
(495) |
|
|
| Cash used in financing activities |
$ |
(523) |
|
$ |
(392) |
|
In February 2023, our board of directors authorized a $300 million incremental increase to our ongoing stock repurchase program initiated in May 2014. In July 2023, our board of directors authorized a further $1 billion incremental increase to this stock repurchase program. We use this program to return value to our stockholders and to offset dilution from the issuance of stock under our equity-based incentive plan and employee purchase plan.
|
|
|
|
|
|
|
|
|
|
|
|
| TRINET |
25 |
2023 Q3 FORM 10-Q |
|
|
|
|
|
|
| MANAGEMENT'S DISCUSSION AND ANALYSIS |
|
On August 28, 2023, we completed a public tender offer through which we repurchased 5,981,308 shares of common stock at a price of $107.00 per share, for total consideration of approximately $640 million. On September 13, 2023, we repurchased 3,364,486 shares of common stock at a price of $107.00 per share, for total consideration of approximately $360 million, through a private repurchase from our largest stockholder, Atairos Group, Inc.
During the nine months ended September 30, 2023, we repurchased 10,611,683 shares of our common stock for approximately $1.1 billion through our existing stock repurchase program in addition to 56,519 shares acquired to satisfy tax withholding obligations related to stock based compensation vesting. As of September 30, 2023, approximately $446 million remained available for repurchase under all authorizations by our board of directors. We plan to use current cash and cash generated from ongoing operating activities to fund this stock repurchase program.
In March 2023, to ensure that we maintained liquidity during the regional banking liquidity challenges, we drew down the available $495 million of capacity under our 2021 Revolver. As concerns about market liquidity subsided, we repaid $200 million in March and $295 million in April. In September of 2023, we drew down $200 million under our 2021 Revolver to partially fund our announced share repurchases in the third quarter of 2023.
In August 2023, we issued $400 million aggregate principal amount of our 2031 Notes to partially fund share repurchases in the third quarter of 2023. Refer to
Note 5 in the condensed consolidated financial statements and related notes included in this Form 10-Q for further information.
In August 2023, concurrently with the issuance of the 2031 Notes, we amended certain provisions of our 2021 Credit Agreement, dated February 26, 2021, as amended, to, among other things (1) increasing the aggregate capacity under our 2021 Revolver from $500 million to $700 million and (2) extending the maturity date of our 2021 Revolver to August 16, 2028.
Capital Resources
As of September 30, 2023, $500 million and $400 million aggregate principal of our 2029 Notes and 2031 Notes was outstanding, respectively. The indenture governing our 2029 Notes and 2031 Notes each includes restrictive covenants limiting our ability to: (i) create liens on certain assets to secure debt; (ii) grant a subsidiary guarantee of certain debt without also providing a guarantee of the 2029 Notes or 2031 Notes, as applicable; and (iii) consolidate or merge with or into, or sell or otherwise dispose of all or substantially all of our assets to, another person, subject, in each case, to certain customary exceptions.
Our 2021 Credit Agreement includes a $700 million revolving credit facility. In September of 2023, we drew down $200 million of this revolver to partially fund our third quarter of 2023 share repurchases. The 2021 Credit Agreement includes negative covenants that limit our ability to incur indebtedness and liens, sell assets and make restricted payments, including dividends and investments, subject to certain exceptions. In addition, the 2021 Credit Agreement also contains other customary affirmative and negative covenants and customary events of default. The 2021 Credit Agreement also contains a financial covenant that requires the Company to maintain certain maximum total net leverage ratios.
We were in compliance with all financial covenants under our 2021 Credit Agreement, 2029 Notes and 2031 Notes at September 30, 2023.
Critical Accounting Policies, Estimates and Judgments
There have been no material changes to our critical accounting policies, estimates and judgments as discussed in our 2022 Form 10-K.
Recent Accounting Pronouncements
There have been no material changes to our recent accounting pronouncements as discussed in our 2022 Form 10-K.
|
|
|
|
|
|
|
|
|
|
|
|
| TRINET |
26 |
2023 Q3 FORM 10-Q |
|
|
|
|
|
|
|
QUANTITATIVE AND QUALITATIVE DISCLOSURES ABOUT MARKET RISK
AND CONTROLS AND PROCEDURES
|
|
Quantitative and Qualitative Disclosures About Market Risk
Our exposure to changes in interest rates relates primarily to our investment portfolio. Changes in U.S. interest rates affect the interest earned on the Company's cash, cash equivalents and the fair value of our investments.
Our cash equivalents consist primarily of money market mutual funds, which are not significantly exposed to interest rate risk. Our investments are subject to interest rate risk because these securities generally include a fixed interest rate. As a result, the market values of these securities are affected by changes in prevailing interest rates. We attempt to limit our exposure to interest rate risk and credit risk by investing in instruments that meet the minimum credit quality, liquidity, diversification and other requirements of our investment policy. Our investments consist of liquid, investment-grade securities. The risk of rate changes on investment balances was not material at September 30, 2023 and December 31, 2022.
As of September 30, 2023, we had drawn down $200 million under our floating rate 2021 Revolver. The impact of a 100 basis point increase or decrease in market interest rates to interest expense on our 2021 Revolver as of September 30, 2023 over the next twelve months was not material.
|
|
|
|
|
|
|
|
|
|
|
|
| TRINET |
27 |
2023 Q3 FORM 10-Q |
|
|
|
|
|
|
|
QUANTITATIVE AND QUALITATIVE DISCLOSURES ABOUT MARKET RISK
AND CONTROLS AND PROCEDURES
|
|
Controls and Procedures
Evaluation of Disclosure Controls and Procedures
We have, with the participation of our CEO and our CFO, evaluated the effectiveness of our disclosure controls and procedures as of September 30, 2023, as defined in Rules 13a-15(e) and 15d-15(e) under the Securities Exchange Act of 1934, as amended, or the Exchange Act.
Based on the evaluation of our disclosure controls and procedures as of September 30, 2023, our CEO and CFO have concluded that the Company’s disclosure controls and procedures were effective as of such date in ensuring that (i) information required to be disclosed by the Company in reports that it files or submits under the Exchange Act is accumulated and communicated to the Company’s management, including the CEO and CFO, to allow timely decisions regarding required disclosure and (ii) such information is recorded, processed, summarized and reported within the time periods specified in the SEC rules and forms.
We have concluded that the condensed consolidated financial statements included in this Quarterly Report on Form 10-Q fairly present, in all material respects, our financial position, results of operations and cash flows for the periods presented in conformity with GAAP.
Changes in Internal Control Over Financial Reporting
There were no changes in our internal control over financial reporting identified in connection with the evaluation required by Rule 13a-15(d) and 15d-15(d) of the Exchange Act that occurred during the quarter ended September 30, 2023, that have materially affected, or are reasonably likely to materially affect, our internal control over financial reporting.
Limitations on Effectiveness of Controls and Procedures
In designing and evaluating the disclosure controls and procedures, management recognizes that any controls and procedures, no matter how well designed and operated, can provide only reasonable assurance of achieving the desired control objectives. In addition, the design of disclosure controls and procedures must reflect the fact that there are resource constraints and that management is required to apply judgment in evaluating the benefits of possible controls and procedures relative to their costs.
|
|
|
|
|
|
|
|
|
|
|
|
| TRINET |
28 |
2023 Q3 FORM 10-Q |
TRINET GROUP, INC.
CONDENSED CONSOLIDATED STATEMENTS OF INCOME AND COMPREHENSIVE INCOME (Unaudited)
|
|
|
|
|
|
|
|
|
|
|
|
|
|
|
|
|
|
| |
Three Months Ended September 30, |
|
Nine Months Ended September 30, |
| (in millions except per share data) |
2023 |
2022 |
|
2023 |
2022 |
Professional service revenues |
$ |
185 |
|
$ |
189 |
|
|
$ |
567 |
|
$ |
565 |
|
Insurance service revenues |
1,037 |
|
1,052 |
|
|
3,110 |
|
3,094 |
|
Total revenues |
1,222 |
|
1,241 |
|
|
3,677 |
|
3,659 |
|
Insurance costs |
874 |
|
872 |
|
|
2,594 |
|
2,547 |
|
Cost of providing services |
74 |
|
79 |
|
|
231 |
|
225 |
|
Sales and marketing |
75 |
|
72 |
|
|
214 |
|
179 |
|
General and administrative |
51 |
|
63 |
|
|
154 |
|
165 |
|
Systems development and programming |
15 |
|
18 |
|
|
49 |
|
54 |
|
Depreciation and amortization of intangible assets |
17 |
|
17 |
|
|
53 |
|
46 |
|
Total costs and operating expenses |
1,106 |
|
1,121 |
|
|
3,295 |
|
3,216 |
|
Operating income |
116 |
|
120 |
|
|
382 |
|
443 |
|
Other income (expense): |
|
|
|
|
|
Interest expense, bank fees and other |
(10) |
|
(22) |
|
|
(23) |
|
(33) |
|
Interest income |
18 |
|
5 |
|
|
57 |
|
8 |
|
Income before provision for income taxes |
124 |
|
103 |
|
|
416 |
|
418 |
|
Income taxes |
30 |
|
26 |
|
|
108 |
|
111 |
|
Net income |
$ |
94 |
|
$ |
77 |
|
|
$ |
308 |
|
$ |
307 |
|
| Other comprehensive income (loss), net of income taxes |
(2) |
|
7 |
|
|
(3) |
|
(4) |
|
Comprehensive income |
$ |
92 |
|
$ |
84 |
|
|
$ |
305 |
|
$ |
303 |
|
|
|
|
|
|
|
Net income per share: |
|
|
|
|
|
Basic |
$ |
1.65 |
|
$ |
1.23 |
|
|
$ |
5.23 |
|
$ |
4.85 |
|
Diluted |
$ |
1.63 |
|
$ |
1.22 |
|
|
$ |
5.20 |
|
$ |
4.81 |
|
Weighted average shares: |
|
|
|
|
|
Basic |
57 |
|
62 |
|
|
59 |
|
63 |
|
Diluted |
58 |
|
63 |
|
|
59 |
|
64 |
|
See accompanying notes.
|
|
|
|
|
|
|
|
|
|
|
|
| TRINET |
29 |
2023 Q3 FORM 10-Q |
TRINET GROUP, INC.
CONDENSED CONSOLIDATED BALANCE SHEETS (Unaudited)
|
|
|
|
|
|
|
|
|
|
|
|
|
|
|
|
|
September 30, |
|
December 31, |
| (in millions, except share and per share data) |
|
2023 |
|
2022 |
| ASSETS |
|
|
|
|
| Current assets: |
|
|
|
|
Cash and cash equivalents |
|
$ |
170 |
|
|
$ |
354 |
|
Investments |
|
75 |
|
|
76 |
|
Restricted cash, cash equivalents and investments |
|
833 |
|
|
1,263 |
|
Accounts receivable, net |
|
21 |
|
|
19 |
|
Unbilled revenue, net |
|
404 |
|
|
375 |
|
Prepaid expenses, net |
|
75 |
|
|
71 |
|
| Other payroll assets |
|
226 |
|
|
122 |
|
Other current assets |
|
49 |
|
|
46 |
|
| Total current assets |
|
1,853 |
|
|
2,326 |
|
Restricted cash, cash equivalents and investments, noncurrent |
|
154 |
|
|
153 |
|
Investments, noncurrent |
|
143 |
|
|
151 |
|
| Property and equipment, net |
|
16 |
|
|
24 |
|
Operating lease right-of-use asset |
|
24 |
|
|
31 |
|
Goodwill |
|
462 |
|
|
462 |
|
| Software and other intangible assets, net |
|
169 |
|
|
163 |
|
Other assets |
|
145 |
|
|
133 |
|
| Total assets |
|
$ |
2,966 |
|
|
$ |
3,443 |
|
| Liabilities and stockholders' equity |
|
|
|
|
| Current liabilities: |
|
|
|
|
Accounts payable and other current liabilities |
|
$ |
109 |
|
|
$ |
98 |
|
|
|
|
|
|
|
|
|
|
|
Client deposits and other client liabilities |
|
73 |
|
|
106 |
|
Accrued wages |
|
458 |
|
|
437 |
|
Accrued health insurance costs, net |
|
183 |
|
|
174 |
|
Accrued workers' compensation costs, net |
|
51 |
|
|
54 |
|
Payroll tax liabilities and other payroll withholdings |
|
804 |
|
|
1,087 |
|
Operating lease liabilities |
|
15 |
|
|
15 |
|
Insurance premiums and other payables |
|
10 |
|
|
17 |
|
| Total current liabilities |
|
1,703 |
|
|
1,988 |
|
Long-term debt, noncurrent |
|
1,091 |
|
|
496 |
|
Accrued workers' compensation costs, noncurrent, net |
|
122 |
|
|
128 |
|
Deferred taxes |
|
5 |
|
|
8 |
|
Operating lease liabilities, noncurrent |
|
30 |
|
|
41 |
|
Other non-current liabilities |
|
5 |
|
|
7 |
|
| Total liabilities |
|
2,956 |
|
|
2,668 |
|
Commitments and contingencies (see Note 6) |
|
|
|
|
| Stockholders' equity: |
|
|
|
|
| Preferred stock |
|
— |
|
|
— |
|
($0.000025 par value per share; 20,000,000 shares authorized; no shares issued or outstanding at September 30, 2023 and December 31, 2022) |
|
|
|
|
| Common stock and additional paid-in capital |
|
953 |
|
|
899 |
|
($0.000025 par value per share; 750,000,000 shares authorized; 50,507,590 and 60,555,661 shares issued and outstanding at September 30, 2023 and December 31, 2022, respectively) |
|
|
|
|
| Accumulated deficit |
|
(935) |
|
|
(119) |
|
| Accumulated other comprehensive loss |
|
(8) |
|
|
(5) |
|
| Total stockholders' equity |
|
10 |
|
|
775 |
|
| Total liabilities & stockholders' equity |
|
$ |
2,966 |
|
|
$ |
3,443 |
|
See accompanying notes.
|
|
|
|
|
|
|
|
|
|
|
|
| TRINET |
30 |
2023 Q3 FORM 10-Q |
TRINET GROUP, INC.
CONDENSED CONSOLIDATED STATEMENTS OF STOCKHOLDERS' EQUITY (Unaudited)
|
|
|
|
|
|
|
|
|
|
|
|
|
|
|
|
|
|
|
Three Months Ended September 30, |
|
Nine Months Ended September 30, |
(in millions)
|
2023 |
2022 |
|
2023 |
2022 |
| Total Stockholders' Equity, beginning balance |
$ |
915 |
|
$ |
763 |
|
|
$ |
775 |
|
$ |
881 |
|
| Common Stock and Additional Paid-In Capital |
|
|
|
|
|
Beginning balance |
934 |
|
861 |
|
|
899 |
|
808 |
|
Issuance of common stock from exercise of stock options |
3 |
|
— |
|
|
3 |
|
1 |
|
Issuance of common stock for employee stock purchase plan |
— |
|
— |
|
|
6 |
|
5 |
|
| Issuance of common stock for the acquisition of Zenefits |
— |
|
— |
|
|
— |
|
17 |
|
|
|
|
|
|
|
Stock based compensation expense |
16 |
|
17 |
|
|
45 |
|
47 |
|
|
|
|
|
|
|
Ending balance |
953 |
|
878 |
|
|
953 |
|
878 |
|
|
|
|
|
|
|
| Retained Earnings (Accumulated Deficit) |
|
|
|
|
|
Beginning balance |
(13) |
|
(86) |
|
|
(120) |
|
74 |
|
Net income |
94 |
|
77 |
|
|
308 |
|
307 |
|
|
|
|
|
|
|
Repurchase of common stock |
(1,004) |
|
(1) |
|
|
(1,102) |
|
(383) |
|
| Stock repurchase excise tax |
(7) |
|
— |
|
|
(7) |
|
— |
|
Awards effectively repurchased for required employee withholding taxes |
(5) |
|
(7) |
|
|
(14) |
|
(15) |
|
Ending balance |
(935) |
|
(17) |
|
|
(935) |
|
(17) |
|
|
|
|
|
|
|
| Accumulated Other Comprehensive Income |
|
|
|
|
|
Beginning balance |
(6) |
|
(12) |
|
|
(5) |
|
(1) |
|
| Other comprehensive income (loss) |
(2) |
|
7 |
|
|
(3) |
|
(4) |
|
Ending balance |
(8) |
|
(5) |
|
|
(8) |
|
(5) |
|
Total Stockholders' Equity, ending balance |
$ |
10 |
|
$ |
856 |
|
|
$ |
10 |
|
$ |
856 |
|
|
|
|
|
|
|
See accompanying notes.
|
|
|
|
|
|
|
|
|
|
|
|
| TRINET |
31 |
2023 Q3 FORM 10-Q |
TRINET GROUP, INC.
CONDENSED CONSOLIDATED STATEMENTS OF CASH FLOWS (Unaudited)
|
|
|
|
|
|
|
|
|
| |
Nine Months Ended September 30, |
| (in millions) |
2023 |
2022 |
Operating activities |
|
|
Net income |
$ |
308 |
|
$ |
307 |
|
Adjustments to reconcile net income to net cash provided by operating activities: |
|
|
| Depreciation and amortization of intangible assets |
53 |
|
48 |
|
| Amortization of deferred costs |
31 |
|
26 |
|
| Amortization of ROU asset, lease modification, impairment, and abandonment |
5 |
|
15 |
|
| Stock based compensation |
43 |
|
46 |
|
Deferred income taxes |
(2) |
|
1 |
|
|
|
|
Provision for doubtful accounts |
2 |
|
1 |
|
|
|
|
| Losses and impairment on investments |
— |
|
18 |
|
| Losses from disposition of assets |
— |
|
3 |
|
| Other |
1 |
|
— |
|
Changes in operating assets and liabilities: |
|
|
Accounts receivable, net |
(4) |
|
10 |
|
| Unbilled revenue, net |
(29) |
|
(38) |
|
| Prepaid expenses, net |
(4) |
|
3 |
|
| Other assets |
(44) |
|
(30) |
|
| Other payroll assets |
(104) |
|
(56) |
|
| Accounts payable and other liabilities |
9 |
|
5 |
|
| Client deposits and other client liabilities |
(33) |
|
(43) |
|
| Accrued wages |
21 |
|
40 |
|
| Accrued health insurance costs, net |
9 |
|
(10) |
|
| Accrued workers' compensation costs, net |
(9) |
|
(5) |
|
| Payroll taxes payable and other payroll withholdings |
(283) |
|
(252) |
|
| Operating lease liabilities |
(13) |
|
(13) |
|
|
|
|
|
|
|
| Net cash provided by (used in) operating activities |
(43) |
|
76 |
|
Investing activities |
|
|
Purchases of marketable securities |
(226) |
|
(337) |
|
| Proceeds from sale and maturity of marketable securities |
223 |
|
390 |
|
| Acquisitions of property and equipment |
(54) |
|
(39) |
|
| Acquisition of subsidiary, net of cash acquired |
— |
|
(219) |
|
Net cash used in investing activities |
(57) |
|
(205) |
|
Financing activities |
|
|
Repurchase of common stock |
(1,109) |
|
(383) |
|
Proceeds from issuance of common stock |
9 |
|
6 |
|
|
|
|
|
|
|
| Proceeds from issuance of 2031 Notes |
400 |
|
— |
|
Awards effectively repurchased for required employee withholding taxes |
(14) |
|
(15) |
|
Proceeds from revolving credit agreement borrowings |
695 |
|
— |
|
| Payment of long-term financing fees and debt issuance costs |
(9) |
|
— |
|
|
|
|
|
|
|
|
|
|
| Repayment of borrowings under revolving credit facility |
(495) |
|
— |
|
| Net cash used in financing activities |
(523) |
|
(392) |
|
|
|
|
| Net decrease in cash and cash equivalents, unrestricted and restricted |
(623) |
|
(521) |
|
Cash and cash equivalents, unrestricted and restricted: |
|
|
Beginning of period |
1,537 |
|
1,738 |
|
End of period |
$ |
914 |
|
$ |
1,217 |
|
|
|
|
Supplemental disclosures of cash flow information |
|
|
Interest paid |
$ |
21 |
|
$ |
18 |
|
| Income taxes paid, net |
$ |
89 |
|
$ |
60 |
|
Supplemental schedule of noncash investing and financing activities |
|
|
| Payable for purchase of property and equipment |
$ |
2 |
|
$ |
7 |
|
| Acquisitions of subsidiaries paid in stock |
$ |
— |
|
$ |
4 |
|
See accompanying notes.
|
|
|
|
|
|
|
|
|
|
|
|
| TRINET |
32 |
2023 Q3 FORM 10-Q |
NOTES TO CONDENSED CONSOLIDATED FINANCIAL STATEMENTS
(Unaudited)
NOTE 1. DESCRIPTION OF BUSINESS AND SIGNIFICANT ACCOUNTING POLICIES
Description of Business
TriNet Group, Inc. (TriNet, or the Company, we, our and us) provides comprehensive HCM solutions for small and medium-size businesses under both a co-employment model and an administrative services only model. These HCM solutions include multi-state payroll processing and tax administration, employee benefits programs, including health insurance and retirement plans, workers' compensation insurance and claims management, employment and benefit law compliance, and other HR-related services. Through our PEO service model, we are the employer of record for certain employment-related administrative and regulatory purposes for the WSEs, including:
•compensation through wages and salaries,
•certain employer payroll-related tax payments,
•employee payroll-related tax withholdings and payments,
•employee benefit programs, including health and life insurance, and
•workers' compensation coverage.
Our clients are responsible for the day-to-day job responsibilities of the WSEs.
Through our HCM services model, we provide cloud-based HCM services to small and medium-size businesses that allows them to manage hiring, onboarding and managing employee information, payroll processing and payroll tax administration, health insurance, and other benefits, from a single cloud-based software platform. We are not the co-employer or employer of record for such users.
We operate in one reportable segment. All of our service revenues are generated from external clients. Less than 1% of our revenue is generated outside of the U.S.
Basis of Presentation
These unaudited condensed consolidated financial statements and accompanying notes have been prepared in accordance with accounting principles generally accepted in the United States of America for interim financial reporting and the instructions to Form 10-Q and Rule 10-01 of Regulation S-X of the Rules and Regulations of the Securities and Exchange Commission. Certain information and note disclosures included in our annual financial statements prepared in accordance with GAAP have been condensed or omitted pursuant to such rules and regulations. In the opinion of management, the condensed consolidated financial statements reflect all adjustments, that are normal and recurring in nature, necessary for fair financial statement presentation. The results of operations for the three and nine months ended September 30, 2023 are not necessarily indicative of the operating results anticipated for the full year. These financial statements should be read in conjunction with the audited Consolidated Financial Statements included in Part II, Item 8. Financial Statements and Supplementary Data of our Annual Report on Form 10-K for the year ended December 31, 2022. Certain prior year amounts have been reclassified to conform to current period presentation.
Reclassifications
Certain prior year amounts within operating activities of the Consolidated Statement of Cash Flows have been reclassified to conform to current period presentation. In particular, the amortization of deferred costs, consisting of costs to obtain contracts with customers, cloud computing implementation and debt issuance costs, were previously included in depreciation and amortization and are now separately classified as Amortization of deferred costs.
Use of Estimates
The preparation of financial statements in conformity with GAAP requires us to make estimates and assumptions that affect certain reported amounts and related disclosures.
These estimates are based on historical experience and on various other assumptions that we believe to be reasonable from the facts available to us. Some of the assumptions are highly uncertain at the time of estimation. To the extent actual experience differs from the assumptions used, our condensed consolidated financial statements could be materially affected.
|
|
|
|
|
|
|
|
|
|
|
|
| TRINET |
33 |
2023 Q3 FORM 10-Q |
Revenue Recognition
Variable Consideration and Pricing Allocation
From time to time, we may offer credits to our clients considered to be variable consideration. Incentive credits related to contract renewals are recorded as a reduction to revenue as part of the transaction price at contract inception and are allocated among the performance obligations based on their relative standalone selling prices.
We allocate the total transaction price to each performance obligation based on the estimated relative standalone selling prices of the promised services underlying each performance obligation. The transaction price for the payroll and payroll tax processing performance obligations is determined upon establishment of the contract that contains the final terms of the arrangement, including the description and price of each service purchased. The estimated service fee is determined based on observable inputs and include the following key assumptions: target profit margin, pricing strategies including the mix of services purchased and competitive factors, and client and industry specifics.
The fees for access to health benefits and workers' compensation insurance performance obligations is determined during the new client on-boarding and enrollment processes based on the types of benefits coverage the WSEs have elected and the applicable risk profile of the client. We estimate our service fees based on actuarial forecasts of our expected insurance premiums and loss sensitive premium costs and amounts to cover our costs to administer these programs.
We require our clients to prefund payroll and related taxes and other withholding liabilities before payroll is processed or due for payment. Under the provision of our contracts with clients, we generally will process the payment of a client’s payroll only when the client successfully funds the amount required. As a result, there is no financing arrangement for the contracts. However, certain contracts to provide payroll and payroll tax processing services permit the client to pay certain payroll tax components ratably over periods of up to 12 months rather than as payroll tax is otherwise determined and due, which may be considered a significant financing arrangement under ASC Topic 606. However, as the period between our performing the service under the contract and when the client pays for the service is less than one year, we have elected, as a practical expedient, not to adjust the transaction price.
In previous years, we created our previously announced Recovery Credits to assist in the economic recovery of our existing PEO clients and enhance our ability to retain these clients. These credits were based on the performance of our insurance costs and were recorded as a reduction to insurance services revenues and included in client deposits and other client liabilities on the balance sheet. The change in balance for the liability for credits previously accrued is the following:
|
|
|
|
|
|
|
|
|
|
|
|
|
|
|
|
|
|
|
Three Months Ended September 30, |
|
Nine Months Ended September 30, |
| (in millions) |
2023 |
2022 |
|
2023 |
2022 |
| Balance at beginning of period |
$ |
50 |
|
$ |
26 |
|
|
$ |
75 |
|
$ |
48 |
|
| (+) Accruals |
— |
|
— |
|
|
— |
|
25 |
|
| (-) Distributions to clients |
(8) |
|
(1) |
|
|
(33) |
|
(48) |
|
| Balance at end of period |
$ |
42 |
|
$ |
25 |
|
|
$ |
42 |
|
$ |
25 |
|
Accrued Health Insurance Costs
We sponsor and administer a number of employee benefit plans for our PEO WSEs, including group health, dental, and vision as an employer plan sponsor under section 3(5) of the ERISA. In the nine months ended September 30, 2023, the majority of our group health insurance costs related to risk-based plans. Our remaining group health insurance costs were for guaranteed-cost policies.
Accrued health insurance costs are established to provide for the estimated unpaid costs of reimbursing the carriers for paying claims within the deductible layer in accordance with risk-based health insurance policies. These accrued costs include estimates for reported losses, plus estimates for claims incurred but not paid. We assess accrued health insurance costs regularly based upon actuarial studies that include other relevant factors such as current and historical claims payment patterns, plan enrollment and medical trend rates.
|
|
|
|
|
|
|
|
|
|
|
|
| TRINET |
34 |
2023 Q3 FORM 10-Q |
In certain carrier contracts we are required to prepay our obligations for the expected claims activity for subsequent periods. These prepaid balances by agreement permit net settlement of obligations and offset the accrued health insurance costs. As of September 30, 2023 and December 31, 2022, prepayments and miscellaneous receivables offsetting accrued health insurance costs were $49 million and $57 million, respectively. When the prepaid amount is in excess of our recorded liability the net asset position is included in prepaid expenses. As of September 30, 2023 and December 31, 2022, accrued health insurance costs offsetting prepaid expenses were $78 million and $73 million, respectively.
|
|
|
|
|
|
|
|
|
|
|
|
| TRINET |
35 |
2023 Q3 FORM 10-Q |
NOTE 2. CASH, CASH EQUIVALENTS AND INVESTMENTS - UNRESTRICTED AND RESTRICTED
Under the terms of the agreements with certain of our workers' compensation and health benefit insurance carriers, we are required to maintain collateral in trust accounts for the benefit of specified insurance carriers and to reimburse the carriers’ claim payments within our deductible layer. We invest a portion of the collateral amounts in marketable securities. We report the current and noncurrent portions of these trust accounts as restricted cash, cash equivalents and investments on the consolidated balance sheets.
We require our clients to prefund their payroll and related taxes and other withholding liabilities before payroll is processed or due for payment. This prefund is included in restricted cash, cash equivalents and investments as payroll funds collected, which is designated to pay pending payrolls, payroll tax liabilities and other payroll withholdings.
We also invest available corporate funds, primarily in fixed income securities which meet the requirements of our corporate investment policy and are classified as AFS.
Our total cash, cash equivalents and investments are summarized below:
|
|
|
|
|
|
|
|
|
|
|
|
|
|
|
|
|
|
|
|
|
|
|
|
|
|
|
September 30, 2023 |
|
December 31, 2022 |
| (in millions) |
Cash and cash equivalents |
Available-for-sale marketable securities |
|
Total |
|
Cash and cash equivalents |
Available-for-sale marketable securities |
|
Total |
| Cash and cash equivalents |
$ |
170 |
|
$ |
— |
|
|
$ |
170 |
|
|
$ |
354 |
|
$ |
— |
|
|
$ |
354 |
|
| Investments |
— |
|
75 |
|
|
75 |
|
|
— |
|
76 |
|
|
76 |
|
| Restricted cash, cash equivalents and investments: |
|
|
|
|
|
|
|
|
|
| Payroll funds collected |
635 |
|
— |
|
|
635 |
|
|
1,062 |
|
— |
|
|
1,062 |
|
| Collateral for health benefits claims |
31 |
|
110 |
|
|
141 |
|
|
29 |
|
110 |
|
|
139 |
|
| Collateral for workers' compensation claims |
55 |
|
— |
|
|
55 |
|
|
58 |
|
— |
|
|
58 |
|
|
|
|
|
|
|
|
|
|
|
| Other security deposits |
2 |
|
— |
|
|
2 |
|
|
4 |
|
— |
|
|
4 |
|
| Total restricted cash, cash equivalents and investments |
723 |
|
110 |
|
|
833 |
|
|
1,153 |
|
110 |
|
|
1,263 |
|
| Investments, noncurrent |
— |
|
143 |
|
|
143 |
|
|
— |
|
151 |
|
|
151 |
|
| Restricted cash, cash equivalents and investments, noncurrent |
|
|
|
|
|
|
|
|
|
| Collateral for workers' compensation claims |
21 |
|
133 |
|
|
154 |
|
|
27 |
|
123 |
|
|
150 |
|
| Other security deposits |
— |
|
|
|
— |
|
|
3 |
|
— |
|
|
3 |
|
| Total |
$ |
914 |
|
$ |
461 |
|
|
$ |
1,375 |
|
|
$ |
1,537 |
|
$ |
460 |
|
|
$ |
1,997 |
|
|
|
|
|
|
|
|
|
|
|
|
|
| TRINET |
36 |
2023 Q3 FORM 10-Q |
NOTE 3. INVESTMENTS
The following tables summarize our financial instruments by significant categories and fair value measurement on a recurring basis as of September 30, 2023 and December 31, 2022 and the amortized cost, gross unrealized gains, gross unrealized losses, fair value of our AFS investments:
|
|
|
|
|
|
|
|
|
|
|
|
|
|
|
|
|
|
|
|
|
|
|
|
|
|
|
| (in millions) |
Fair Value Level |
Amortized Cost |
Gross Unrealized Gains |
Gross Unrealized Losses |
Fair Value |
Cash and Cash Equivalents |
Investments |
Restricted Cash, Cash Equivalents and Investments |
| September 30, 2023 |
|
|
|
|
|
|
|
|
| Cash equivalents: |
|
|
|
|
|
|
|
|
| Money market mutual funds |
Level 1 |
$ |
134 |
|
$ |
— |
|
$ |
— |
|
$ |
134 |
|
$ |
47 |
|
$ |
— |
|
$ |
87 |
|
| U.S. treasuries |
Level 2 |
4 |
|
— |
|
— |
|
4 |
|
4 |
|
— |
|
— |
|
| Total cash equivalents |
|
138 |
|
— |
|
— |
|
138 |
51 |
|
— |
|
87 |
|
| AFS Investments: |
|
|
|
|
|
|
|
|
| Asset-backed securities |
Level 2 |
45 |
|
— |
|
(1) |
|
44 |
|
— |
|
44 |
|
— |
|
| Corporate bonds |
Level 2 |
131 |
|
— |
|
(1) |
|
130 |
|
— |
|
102 |
|
28 |
|
| Agency securities |
Level 2 |
40 |
|
— |
|
(1) |
|
39 |
|
— |
|
11 |
|
28 |
|
| U.S. treasuries |
Level 2 |
241 |
|
— |
|
(5) |
|
236 |
|
— |
|
57 |
|
179 |
|
| Certificate of deposit |
Level 2 |
7 |
|
— |
|
— |
|
7 |
|
— |
|
— |
|
7 |
|
| Other debt securities |
Level 2 |
5 |
|
— |
|
— |
|
5 |
|
— |
|
5 |
|
— |
|
| Total AFS Investments |
|
$ |
469 |
|
$ |
— |
|
$ |
(8) |
|
$ |
461 |
|
$ |
— |
|
$ |
219 |
|
$ |
242 |
|
|
|
|
|
|
|
|
|
|
|
|
|
|
|
|
|
|
|
|
|
|
|
|
|
|
|
|
| (in millions) |
Fair Value Level |
Amortized Cost |
Gross Unrealized Gains |
Gross Unrealized Losses |
Fair Value |
Cash and Cash Equivalents |
Investments |
Restricted Cash, Cash Equivalents and Investments |
| December 31, 2022 |
|
|
|
|
|
|
|
|
| Cash equivalents: |
|
|
|
|
|
|
|
|
| Money market mutual funds |
Level 1 |
$ |
314 |
|
$ |
— |
|
$ |
— |
|
$ |
314 |
|
$ |
225 |
|
$ |
— |
|
$ |
89 |
|
| U.S. treasuries |
Level 2 |
18 |
|
— |
|
— |
|
18 |
18 |
|
— |
|
— |
|
| Total cash equivalents |
|
332 |
|
— |
|
— |
|
332 |
243 |
|
— |
|
89 |
|
| AFS Investments: |
|
|
|
|
|
|
|
|
| Asset-backed securities |
Level 2 |
42 |
|
— |
|
(2) |
|
40 |
|
— |
|
40 |
|
— |
|
| Corporate bonds |
Level 2 |
140 |
|
— |
|
(1) |
|
139 |
|
— |
|
112 |
|
27 |
|
| Agency securities |
Level 2 |
33 |
|
— |
|
(1) |
|
32 |
|
— |
|
5 |
|
27 |
|
| U.S. treasuries |
Level 2 |
229 |
|
— |
|
— |
|
229 |
|
— |
|
62 |
|
167 |
|
| Certificate of deposit |
Level 2 |
12 |
|
— |
|
— |
|
12 |
|
— |
|
— |
|
12 |
|
| Other debt securities |
Level 2 |
8 |
|
— |
|
— |
|
8 |
|
— |
|
7 |
|
1 |
|
| Total AFS Investments |
|
$ |
464 |
|
$ |
— |
|
$ |
(4) |
|
$ |
460 |
|
$ |
— |
|
$ |
226 |
|
$ |
234 |
|
Fair Value of Financial Instruments
We use an independent pricing source to determine the fair value of our securities. The independent pricing source utilizes various pricing models for each asset class, including the market approach. The inputs and assumptions for the pricing models are market observable inputs including trades of comparable securities, dealer quotes, credit spreads, yield curves and other market-related data.
We have not adjusted the prices obtained from the independent pricing service and we believe the prices received from the independent pricing service are representative of the prices that would be received to sell the assets at the measurement date (exit price).
|
|
|
|
|
|
|
|
|
|
|
|
| TRINET |
37 |
2023 Q3 FORM 10-Q |
The carrying value of the Company's cash equivalents and restricted cash equivalents approximate their fair values due to their short-term maturities.
We did not have any Level 3 financial instruments recognized in our condensed consolidated balance sheets as of September 30, 2023 and December 31, 2022. There were no transfers between levels as of September 30, 2023 and December 31, 2022.
Sales and Maturities
The fair value of debt investments by contractual maturity are shown below:
|
|
|
|
|
|
|
|
|
|
|
|
| (in millions) |
|
September 30, 2023 |
|
| One year or less |
|
$ |
117 |
|
|
| Over one year through five years |
|
312 |
|
|
| Over five years through ten years |
|
12 |
|
|
| Over ten years |
|
20 |
|
|
| Total fair value |
|
$ |
461 |
|
|
The gross proceeds from sales and maturities of AFS securities for the three and nine months ended September 30, 2023 and September 30, 2022 are presented below. We had immaterial gross realized gains and losses from sales of investments for the nine months ended September 30, 2023 and $11 million of gross realized losses and immaterial gross realized gains for the three and nine months ended September 30, 2022.
|
|
|
|
|
|
|
|
|
|
|
|
|
|
|
|
|
|
|
Three Months Ended September 30, |
|
Nine Months Ended September 30, |
| (in millions) |
2023 |
2022 |
|
2023 |
2022 |
|
|
|
|
|
|
|
|
|
|
|
|
| Gross proceeds from sales |
$ |
31 |
|
$ |
177 |
|
|
$ |
115 |
|
$ |
219 |
|
| Gross proceeds from maturities |
19 |
|
49 |
|
|
108 |
|
181 |
|
| Total |
$ |
50 |
|
$ |
226 |
|
|
$ |
223 |
|
$ |
400 |
|
Fair Value of Long-Term Debt
The fair value of our 2029 Notes and 2031 Notes was obtained from a third-party pricing service and is based on observable market inputs. As such, the fair value of the senior notes is considered Level 2 in the hierarchy for fair value measurement. As of September 30, 2023, our 2029 Notes and 2031 Notes were carried at their cost, net of issuance costs, and had a fair value of $423 million and $396 million, respectively. As of December 31, 2022, our 2029 Notes were carried at their cost, net of issuance costs, and had a fair value of $413 million.
Our 2021 Revolver is a floating rate debt. At September 30, 2023 and December 31, 2022, the fair value of our 2021 Revolver approximated its carrying value (exclusive of issuance costs). The fair value of our floating rate debt is estimated based on a discounted cash flow, which incorporates credit spreads, market interest rates and contractual maturities to estimate the fair value and is considered Level 3 in the hierarchy for fair value measurement.
|
|
|
|
|
|
|
|
|
|
|
|
| TRINET |
38 |
2023 Q3 FORM 10-Q |
NOTE 4. ACCRUED WORKERS' COMPENSATION COSTS
The following table summarizes the accrued workers’ compensation cost activity for the three and nine months ended September 30, 2023 and 2022:
|
|
|
|
|
|
|
|
|
|
|
|
|
|
|
|
|
|
|
Three Months Ended
September 30, |
|
Nine Months Ended
September 30, |
| (in millions) |
2023 |
2022 |
|
2023 |
2022 |
| Total accrued costs, beginning of period |
$ |
178 |
|
$ |
189 |
|
|
$ |
189 |
|
$ |
198 |
|
| Incurred |
|
|
|
|
|
| Current year |
13 |
|
18 |
|
|
47 |
|
51 |
|
| Prior years |
(2) |
|
(3) |
|
|
(25) |
|
(23) |
|
| Total incurred |
11 |
|
15 |
|
|
22 |
|
28 |
|
| Paid |
|
|
|
|
|
| Current year |
(4) |
|
(4) |
|
|
(6) |
|
(6) |
|
| Prior years |
(7) |
|
(8) |
|
|
(27) |
|
(28) |
|
| Total paid |
(11) |
|
(12) |
|
|
(33) |
|
(34) |
|
| Total accrued costs, end of period |
$ |
178 |
|
$ |
192 |
|
|
$ |
178 |
|
$ |
192 |
|
The following summarizes workers' compensation liabilities on the condensed consolidated balance sheets:
|
|
|
|
|
|
|
|
|
| (in millions) |
September 30, 2023 |
December 31, 2022 |
| Total accrued costs, end of period |
$ |
178 |
|
$ |
189 |
|
| Collateral paid to carriers and offset against accrued costs |
(5) |
|
(7) |
|
| Total accrued costs, net of carrier collateral offset |
$ |
173 |
|
$ |
182 |
|
|
|
|
Payable in less than 1 year
(net of collateral paid to carriers of $1 and $2 at September 30, 2023 and December 31, 2022, respectively) |
$ |
51 |
|
$ |
54 |
|
Payable in more than 1 year
(net of collateral paid to carriers of $4 and $5 at September 30, 2023 and December 31, 2022, respectively) |
122 |
|
128 |
|
| Total accrued costs, net of carrier collateral offset |
$ |
173 |
|
$ |
182 |
|
|
|
|
Incurred claims related to prior years represents changes in estimates for ultimate losses on workers' compensation claims. For the three and nine months ended September 30, 2023, the favorable development is due to lower than expected reported claim frequency and severity for the more recent years.
As of September 30, 2023 and December 31, 2022, we had $43 million for both periods of collateral held by insurance carriers of which $5 million and $7 million at September 30, 2023 and December 31, 2022, respectively was offset against accrued workers' compensation costs as the agreements permit and are net settled of insurance obligations against collateral held.
|
|
|
|
|
|
|
|
|
|
|
|
| TRINET |
39 |
2023 Q3 FORM 10-Q |
NOTE 5. LONG-TERM DEBT AND REVOLVING CREDIT AGREEMENTS
The following table summarizes our senior notes payable at September 30, 2023 and December 31, 2022:
|
|
|
|
|
|
|
|
|
|
|
|
|
|
|
|
|
|
|
|
|
|
|
|
| (Dollars in millions) |
Annual contractual interest rate |
Effective interest rate |
Principal amount |
Deferred issuance costs |
Less: current portion |
Long-term debt, noncurrent |
September 30, 2023 |
December 31, 2022 |
|
|
|
|
|
|
|
|
|
|
|
|
|
|
|
|
| 2029 Notes |
3.50 |
% |
3.67 |
% |
$ |
500 |
|
$ |
(4) |
|
$ |
— |
|
$ |
496 |
|
$ |
496 |
|
| 2031 Notes |
7.125 |
% |
7.290 |
% |
$ |
400 |
|
$ |
(5) |
|
$ |
— |
|
$ |
395 |
|
$ |
— |
|
In March 2023, as a precaution to ensure we maintained liquidity during the uncertainty of the banking crisis that followed the failure of Silicon Valley Bank, we drew down the available $495 million of capacity under our 2021 Revolver. As concerns about market liquidity subsided, we repaid $200 million in March and the remaining $295 million in April. In September of 2023, we drew down $200 million of this revolver to partially fund our third quarter of 2023 share repurchases.
In February 2021, we issued $500 million aggregate principal of 3.50% senior unsecured notes maturing in March 2029 (our 2029 Notes). In August 2023, we issued $400 million aggregate principal of 7.125% senior unsecured notes maturing in August 2031 (our 2031 Notes). Interest payments on the 2031 Notes are due semi-annually in arrears on February 15 and August 15, beginning on February 15, 2024. We used the net proceeds to fund an equity tender offer and a private share repurchase, each of which were executed in the third quarter of 2023 (including the related fees and expenses).
We may voluntarily redeem all or a part of the 2031 Notes on or after August 15, 2026, on any one or more occasions, at the redemption prices set forth in the indenture governing the 2031 Notes, plus, in each case, accrued and unpaid interest thereon, if any, to, but excluding, the applicable redemption date. In addition, at any time prior to August 15, 2026, we may on any one or more occasions redeem up to 40% of the aggregate principal amount of the 2031 Notes outstanding under the indenture governing the 2031 Notes with the net cash proceeds of one or more equity offerings at a redemption price equal to 107.125% of the principal amount of the 2031 Notes then outstanding, plus accrued and unpaid interest thereon, if any, to, but excluding the applicable redemption date. At any time prior to August 15, 2026, we may also redeem all or a part of the 2031 Notes at a redemption price equal to 100% of the principal amount of the 2031 Notes redeemed plus a “make-whole” premium as of, and accrued and unpaid interest, if any, to, but excluding, the applicable redemption date.
In August 2023, concurrently with the issuance of the 2031 Notes, we amended certain provisions of our credit agreement, dated February 26, 2021, as amended, to, among other things (1) increasing the aggregate capacity under our 2021 Revolver from $500 million to $700 million and (2) extending the maturity date of our 2021 Revolver to August 16, 2028.
The annual interest rate for borrowings under our 2021 Revolver was previously calculated based on an applicable LIBOR tenor of our choosing, plus a margin of 1.25% to 2.00%, or, at our option, the alternative base rate (ABR), plus a margin of 0.25% to 1.00%. In the second quarter of 2023, we replaced the interest rate based on LIBOR and related LIBOR-based mechanics with an interest rate based on the forward-looking Secured Overnight Financing Rate (Term SOFR). Term SOFR loans will be charged interest at the Term SOFR rate (subject to a 0.00% floor), plus a margin between 1.25% and 2.00%, depending on the borrower’s total net leverage ratio, plus a credit adjustment spread of 10 basis points for all tenors (such Term SOFR rate plus the credit adjustment spread, the "Adjusted Term SOFR Rate"). The applicable Term SOFR or ABR margin is based on our Total Leverage Ratio, as defined in the 2021 Credit Agreement. The ABR is the highest of (a) the applicable Federal Reserve Bank of New York rate in effect on such day (which rate is the greater of the Federal funds Effective Rate in effect on such day and the Overnight Bank Funding Rate in effect on such day), as defined in our 2021 Credit Agreement plus 0.50% (b) the prime rate in effect on such day, and (c) the Adjusted Term SOFR Rate for a one month interest period, as published by two U.S. Government Securities Business Days prior to such day daily plus 1.00%. The interest rate for 2023 borrowings under our 2021 Revolver was 7.875% - 8.125%.
In the event TriNet Group, Inc. receives a Corporate Issuer Credit Rating that is one level below investment grade rating or higher from at least two Nationally Recognized Statistical Rating Organizations, then rating based pricing applies and, for so long as rating-based pricing applies, irrespective of the Total Leverage Ratio, the Term SOFR margin will be 1.125% and the ABR margin will be 0.125%.
|
|
|
|
|
|
|
|
|
|
|
|
| TRINET |
40 |
2023 Q3 FORM 10-Q |
The indenture governing our 2029 Notes and 2031 Notes each includes restrictive covenants limiting our ability to: (i) create liens on certain assets to secure debt; (ii) grant a subsidiary guarantee of certain debt without also providing a guarantee of the 2029 Notes or 2031 Notes, as applicable; and (iii) consolidate or merge with or into, or sell or otherwise dispose of all or substantially all of our assets to, another person, subject, in each case, to certain customary exceptions.
The 2021 Credit Agreement includes negative covenants that limit our ability to incur indebtedness and liens, sell assets and make restricted payments, including dividends and investments, subject to certain exceptions. In addition, the 2021 Credit Agreement also contains other customary affirmative and negative covenants and customary events of default. The 2021 Credit Agreement also contains a financial covenant that requires the Company to maintain certain maximum total net leverage ratios. We were in compliance with all financial covenants under the 2021 Credit Agreement, 2029 Notes and 2031 Notes at September 30, 2023.
NOTE 6. COMMITMENTS AND CONTINGENCIES
Contingencies
On September 29, 2020, a class action was filed in the United States District Court for the Middle District of Florida against the directors of certain TriNet subsidiaries and other TriNet employees on behalf of a putative class of participants in two retirement plans available to TriNet’s eligible worksite employees, the TriNet 401(k) Plan and the TriNet Select 401(k) Plan. The complaint is similar to claims recently brought against a number of employers including PEOs and generally alleges that the defendants violated certain fiduciary obligations to Plan participants under the Employee Retirement Income Security Act of 1974 with respect to overseeing plan investment and recordkeeping fees. On October 21, 2022, the court issued an order declining to certify a class with respect to claims against the TriNet 401(k) Plan, but certified a class with respect to claims against the TriNet Select 401(k) Plan. On April 26, 2023, the court entered an order granting TriNet's motion for summary judgment on all remaining claims. No appeal was timely filed and the matter is closed.
We are and, from time to time, have been and may in the future become involved in various litigation matters, legal proceedings, and claims arising in the ordinary course of our business, including disputes with our clients or various class action, collective action, representative action, and other proceedings arising from the nature of our co-employment relationship with our clients and WSEs in which we are named as a defendant. In addition, due to the nature of our co-employment relationship with our clients and WSEs, we could be subject to liability for federal and state law violations, even if we do not participate in such violations. While our agreements with our clients contain indemnification provisions related to the conduct of our clients, we may not be able to avail ourselves of such provisions in every instance. We have accrued our current best estimates of probable losses with respect to these matters, which are individually and in aggregate immaterial to our consolidated financial statements.
While the outcome of the matters described above cannot be predicted with certainty, management currently does not believe that any such claims or proceedings will have a materially adverse effect on our consolidated financial position, results of operations, or cash flows. However, the unfavorable resolution of any particular matter or our reassessment of our exposure for any of the above matters based on additional information obtained in the future could have a material impact on our consolidated financial position, results of operations, or cash flows.
NOTE 7. STOCK BASED COMPENSATION
Restricted Stock Units (RSUs)
Time-based RSUs generally vest over a four-year term. Performance-based RSUs are subject to vesting requirements and are earned, in part, based on certain financial performance metrics as defined in the grant notice. Actual number of shares earned may range from 0% to 200% of the target award. Performance-based awards granted in 2023 and 2022 are earned based on a single-year performance period subject to subsequent multi-year time-based vesting with 50% of the shares earned vesting in one year after the performance period and the remaining shares in the year after. RSUs are generally forfeited if the participant terminates service prior to vesting.
|
|
|
|
|
|
|
|
|
|
|
|
| TRINET |
41 |
2023 Q3 FORM 10-Q |
The following tables summarize RSU activity for the nine months ended September 30, 2023:
Time-based RSUs
|
|
|
|
|
|
|
|
|
|
|
|
|
|
|
|
Total Number
of RSUs
|
|
Total Number
of Shares
|
Weighted-Average
Grant Date
Fair Value
|
| Nonvested at December 31, 2022 |
1,198,561 |
|
|
1,198,561 |
|
$ |
80.75 |
|
| Granted |
755,789 |
|
|
755,789 |
|
77.56 |
|
| Vested |
(464,051) |
|
|
(464,051) |
|
76.36 |
|
| Forfeited |
(89,029) |
|
|
(89,029) |
|
82.57 |
|
| Nonvested at September 30, 2023 |
1,401,270 |
|
|
1,401,270 |
|
$ |
80.02 |
|
Performance-based RSUs
|
|
|
|
|
|
|
|
|
|
|
|
|
|
Total Number
of RSUs
|
|
Total Number of Shares |
Weighted-Average
Grant Date
Fair Value
|
| Nonvested at December 31, 2022 |
202,586 |
|
|
202,586 |
|
$ |
86.82 |
|
| Granted |
177,067 |
|
|
177,067 |
|
79.05 |
|
|
|
|
|
|
|
|
|
|
|
|
|
|
|
|
| Nonvested at September 30, 2023 |
379,653 |
|
|
379,653 |
|
$ |
83.20 |
|
Stock Based Compensation
Stock based compensation expense for stock-based awards made to our employees pursuant to our equity plans were as follows:
|
|
|
|
|
|
|
|
|
|
|
|
|
|
|
|
|
|
| |
Three Months Ended September 30, |
|
Nine Months Ended September 30, |
| (in millions) |
2023 |
2022 |
|
2023 |
2022 |
| Cost of providing services |
$ |
3 |
|
$ |
3 |
|
|
$ |
10 |
|
$ |
10 |
|
| Sales and marketing |
2 |
|
2 |
|
|
6 |
|
5 |
|
| General and administrative |
9 |
|
9 |
|
|
24 |
|
28 |
|
| Systems development and programming costs |
1 |
|
2 |
|
|
3 |
|
3 |
|
| Total stock based compensation expense |
$ |
15 |
|
$ |
16 |
|
|
$ |
43 |
|
$ |
46 |
|
| Total stock based compensation capitalized |
$ |
1 |
|
$ |
— |
|
|
$ |
2 |
|
$ |
1 |
|
|
|
|
|
|
|
|
|
|
|
|
|
NOTE 8. STOCKHOLDERS’ EQUITY
Common Stock
The following table shows the beginning and ending balances of our issued and outstanding common stock for the three and nine months ended September 30, 2023 and 2022:
|
|
|
|
|
|
|
|
|
|
|
|
|
|
|
|
|
|
|
Three Months Ended
September 30, |
|
Nine Months Ended
September 30, |
|
2023 |
2022 |
|
2023 |
2022 |
| Shares issued and outstanding, beginning balance |
59,674,960 |
|
62,087,303 |
|
|
60,555,661 |
|
65,968,224 |
|
Issuance of common stock from vested restricted stock units |
161,125 |
|
199,171 |
|
|
464,051 |
|
496,051 |
|
Issuance of common stock from exercise of stock options |
73,818 |
|
21,750 |
|
|
155,485 |
|
94,139 |
|
Issuance of common stock for employee stock purchase plan |
— |
|
— |
|
|
104,017 |
|
73,808 |
|
Issuance of common stock for the acquisition of Zenefits |
— |
|
— |
|
|
— |
|
193,221 |
|
Repurchase of common stock |
(9,345,794) |
|
— |
|
|
(10,611,683) |
|
(4,419,423) |
|
Awards effectively repurchased for required employee withholding taxes |
(56,519) |
|
(78,718) |
|
|
(159,941) |
|
(176,514) |
|
Shares issued and outstanding, ending balance |
50,507,590 |
|
62,229,506 |
|
|
50,507,590 |
|
62,229,506 |
|
|
|
|
|
|
|
|
|
|
|
|
|
| TRINET |
42 |
2023 Q3 FORM 10-Q |
Stock Repurchases
In February 2020, our board of directors authorized a $300 million incremental increase to our ongoing stock repurchase program. In February 2022 and November 2022, our board of directors authorized a further $300 million and $200 million, respectively, incremental increase to this stock repurchase program. In February 2023 and July 2023, our board of directors authorized a further $300 million and $1 billion, respectively, incremental increase to this stock repurchase program. This repurchase authorization has no expiration.
In August 2023, we completed a tender offer through which we repurchased 5,981,308 shares of common stock at a price of $107.00 per share, for total consideration of approximately $640 million. In September 2023, we repurchased 3,364,486 shares of common stock at a price of $107.00 per share, for total consideration of approximately $360 million, through a purchase agreement with our largest stockholder, Atairos Group, Inc.
NOTE 9. INCOME TAXES
Our ETR was 24% and 26% for the third quarter of 2023 and 2022, respectively and 26% and 27% for the nine months ended September 30, 2023 and 2022, respectively. The decrease in rates was primarily due to an increase in excludable income for state tax purposes, an increase in tax benefits related to stock-based compensation and a decrease in nondeductible compensation.
We are subject to tax in U.S. federal and various state and local jurisdictions, as well as Canada and India. We are open to federal and significant state income tax examinations for tax years 2016 and subsequent years.
NOTE 10. EARNINGS PER SHARE
Basic EPS is computed based on the weighted average shares of common stock outstanding during the period. Diluted EPS is computed based on those shares used in the basic EPS computation, plus potentially dilutive shares issuable under our equity-based compensation plans using the treasury stock method. Shares that are potentially anti-dilutive are excluded.
The following table presents the computation of our basic and diluted EPS attributable to our common stock:
|
|
|
|
|
|
|
|
|
|
|
|
|
|
|
|
|
|
| |
Three Months Ended
September 30, |
|
Nine Months Ended
September 30, |
| (in millions, except per share data) |
2023 |
2022 |
|
2023 |
2022 |
| Net income |
$ |
94 |
|
$ |
77 |
|
|
$ |
308 |
|
$ |
307 |
|
| Weighted average shares of common stock outstanding |
57 |
|
62 |
|
|
59 |
|
63 |
|
| Basic EPS |
$ |
1.65 |
|
$ |
1.23 |
|
|
$ |
5.23 |
|
$ |
4.85 |
|
| Net income |
$ |
94 |
|
$ |
77 |
|
|
$ |
308 |
|
$ |
307 |
|
| Weighted average shares of common stock outstanding |
57 |
|
62 |
|
|
59 |
|
63 |
|
| Dilutive effect of stock options and restricted stock units |
1 |
|
1 |
|
|
— |
|
1 |
|
| Weighted average shares of common stock outstanding |
58 |
|
63 |
|
|
59 |
|
64 |
|
| Diluted EPS |
$ |
1.63 |
|
$ |
1.22 |
|
|
$ |
5.20 |
|
$ |
4.81 |
|
|
|
|
|
|
|
Common stock equivalents excluded from income per diluted share because of their anti-dilutive effect |
— |
|
1 |
|
|
1 |
|
1 |
|
|
|
|
|
|
|
|
|
|
|
|
|
| TRINET |
43 |
2023 Q3 FORM 10-Q |
Legal Proceedings
For the information required in this section, refer to
Note 6 in the condensed consolidated financial statements and related notes included in this Form 10-Q.
Risk Factors
There have been no material changes in our risk factors disclosed in Part 1, Item 1A, of our 2022 Form 10-K.
Unregistered Sales of Equity Securities and Use of Proceeds
(a) Sales of Unregistered Securities
Not applicable.
(b) Use of Proceeds from Sales of Unregistered Securities
Not applicable.
(c) Issuer Purchases of Equity Securities
The following table provides information about our purchases of TriNet common stock during the quarter ended September 30, 2023:
|
|
|
|
|
|
|
|
|
|
|
|
|
|
|
|
|
|
|
|
|
|
|
|
|
|
| Period |
Total Number of
Shares
Purchased (1) (2)
|
|
Weighted Average Price
Paid Per Share |
|
Total Number of
Shares
Purchased as Part of Publicly
Announced Plans |
|
|
|
Approximate Dollar Value ($ millions)
of Shares that May Yet be Purchased
Under the Plans (3) |
| July 1 - July 31, 2023 |
2,697 |
|
|
$ |
95.20 |
|
|
— |
|
|
|
|
$ |
1,446 |
|
| August 1 - August 31, 2023 |
6,034,609 |
|
|
$ |
107.00 |
|
|
5,981,308 |
|
|
|
|
$ |
806 |
|
| September 1 - September 30, 2023 |
3,365,007 |
|
|
$ |
107.00 |
|
|
3,364,486 |
|
|
|
|
$ |
446 |
|
| Total |
9,402,313 |
|
|
|
|
9,345,794 |
|
|
|
|
|
(1) In May 2014, our board of directors approved a stock repurchase program pursuant to which we are authorized to repurchase our common stock in privately negotiated and/or open market transactions, including under plans complying with Rule 10b5-1 under the Securities Exchange Act of 1934. From time to time, our board of directors authorizes increases to our stock repurchase program and approved an aggregate total of $2,715 million as of September 30, 2023. The total remaining authorization for future stock repurchases under our stock repurchase program was $446 million as of September 30, 2023. The program does not have an expiration date.
(2) Includes shares surrendered by employees to us to satisfy tax withholding obligations that arose upon vesting of restricted stock units granted pursuant to approved plans.
(3) We repurchased a total of approximately $1 billion of our outstanding stock during the three months ended September 30, 2023.
We use our stock repurchase program to return value to our stockholders and to offset dilution from the issuance of stock under our equity-based incentive plans and employee purchase plan. We plan to use current cash and cash generated from ongoing operating activities to fund our stock repurchase program.
Defaults Upon Senior Securities
Not applicable.
Mine Safety Disclosures
Not applicable.
Other Information
On August 3, 2023, Alex Warren, our Chief Revenue Officer, adopted a new written trading plan intended to satisfy the affirmative defense conditions of Rule 10b5-1(c) under the Exchange Act (the “Warren Plan”). The first possible trade date under the Warren Plan is November 17, 2023, and the end date of the Warren Plan is January 7, 2025 (subject to customary exceptions), for a duration of approximately one year and five months. The Warren Plan calls for the sale of an amount of shares that Mr. Warren could receive upon the future vesting of certain outstanding and expected equity awards, net of any shares withheld by us to satisfy applicable taxes. The exact number of shares to be sold pursuant to the Warren Plan depends on the number of shares to be withheld by us and the amount of any additional equity awards that may be granted and that will vest during the duration of the Warren Plan, among other
|
|
|
|
|
|
|
|
|
|
|
|
| TRINET |
44 |
2023 Q3 FORM 10-Q |
factors. For purposes of this disclosure, without taking into account any future equity awards or subtracting any shares to be withheld upon future vesting events, the aggregate number of shares currently expected to be sold pursuant to the Warren Plan is 32,217.
|
|
|
|
|
|
|
|
|
|
|
|
| TRINET |
45 |
2023 Q3 FORM 10-Q |
Exhibits
Incorporated herein by reference is a list of the exhibits contained in the Exhibit Index below.
EXHIBIT INDEX
|
|
|
|
|
|
|
|
|
|
|
|
|
|
|
|
|
|
|
|
|
|
|
|
|
|
|
|
|
|
|
|
|
|
|
|
|
|
|
|
|
|
|
Incorporated by Reference |
|
|
| Exhibit No. |
|
Exhibit |
|
Form |
|
File No. |
|
Exhibit |
|
Filing Date |
|
Filed Herewith |
| 3.1 |
|
|
|
8-K |
|
001-36373 |
|
3.1 |
|
5/30/2023 |
|
|
|
|
|
|
|
|
|
|
|
|
|
|
|
| 3.2 |
|
|
|
8-K |
|
001-36373 |
|
3.1 |
|
3/27/2023 |
|
|
| 4.1 |
|
|
|
8-K |
|
001-36373 |
|
4.1 |
|
2/2/2017 |
|
|
|
|
|
|
|
|
|
|
|
|
|
|
|
|
|
|
|
|
|
|
|
|
|
|
|
|
|
|
|
|
|
|
|
|
|
|
|
|
|
|
|
|
|
|
|
|
|
|
|
|
|
|
|
|
|
|
|
|
|
|
|
|
|
|
|
|
|
|
|
|
|
|
|
|
|
|
|
|
|
|
|
|
|
|
|
|
|
|
|
|
|
|
|
|
|
|
|
|
|
|
|
|
|
|
|
|
|
|
|
|
|
|
|
|
|
|
|
|
|
|
|
|
|
|
|
|
|
|
|
|
|
|
|
|
|
|
|
|
|
|
|
|
|
|
|
|
|
|
|
|
|
|
|
|
|
|
|
|
|
|
|
|
|
|
|
|
|
|
|
| 4.2 |
|
|
|
8-K |
|
001-36373 |
|
4.1 |
|
8/16/2023 |
|
|
| 4.3 |
|
|
|
|
|
|
|
|
|
|
|
X |
| 10.1 |
|
|
|
8-K |
|
001-36373 |
|
10.1 |
|
8/16/2023 |
|
|
| 10.2 |
|
|
|
8-K |
|
001-36373 |
|
10.1 |
|
7/31/2023 |
|
|
| 31.1 |
|
|
|
|
|
|
|
|
|
|
|
X |
| 31.2 |
|
|
|
|
|
|
|
|
|
|
|
X |
32.1* |
|
|
|
|
|
|
|
|
|
|
|
X |
101.INS |
|
XBRL Instance Document - the instance document does not appear in the Interactive Data File because its XBRL tags are embedded within the Inline XBRL document |
|
|
|
|
|
|
|
|
|
|
101.SCH |
|
XBRL Taxonomy Extension Schema Linkbase Document |
|
|
|
|
|
|
|
|
|
|
101.CAL |
|
XBRL Taxonomy Extension Calculation Linkbase Document |
|
|
|
|
|
|
|
|
|
|
101.DEF |
|
XBRL Taxonomy Extension Definition Linkbase Document |
|
|
|
|
|
|
|
|
|
|
101.LAB |
|
XBRL Taxonomy Extension Label Linkbase Document |
|
|
|
|
|
|
|
|
|
|
101.PRE |
|
XBRL Taxonomy Extension Presentation Linkbase Document |
|
|
|
|
|
|
|
|
|
|
| 104 |
|
Cover Page Interactive Data File (embedded with the Inline XBRL document) |
|
|
|
|
|
|
|
|
|
|
|
|
|
|
|
|
|
|
|
|
|
|
| * |
Document has been furnished, is deemed not filed and is not to be incorporated by reference into any of TriNet Group, Inc.’s filings under the Securities Act of 1933, as amended, or the Securities Exchange Act of 1934, as amended, irrespective of any general incorporation language contained in any such filing. |
|
|
|
|
|
|
|
|
|
|
|
|
| TRINET |
46 |
2023 Q3 FORM 10-Q |
SIGNATURES
Pursuant to the requirements of the Securities Exchange Act of 1934, as amended, the registrant has duly caused this report to be signed on its behalf by the undersigned thereunto duly authorized.
|
|
|
|
|
|
|
|
|
|
|
|
| |
TRINET GROUP, INC. |
| |
|
| Date: October 25, 2023 |
|
By: |
/s/ Burton M. Goldfield |
| |
|
|
Burton M. Goldfield |
| |
|
|
Chief Executive Officer |
| |
|
|
|
| Date: October 25, 2023 |
|
By: |
/s/ Kelly Tuminelli |
| |
|
|
Kelly Tuminelli |
|
|
|
Chief Financial Officer |
|
|
|
|
|
|
|
|
|
|
|
|
|
|
|
|
|
|
|
|
|
|
|
|
|
|
|
|
| TRINET |
47 |
2023 Q3 FORM 10-Q |
EX-4.3
2
exhibit43.htm
EX-4.3
Document
FIRST SUPPLEMENTAL INDENTURE
First Supplemental Indenture (this “Supplemental Indenture”), dated as of August 16, 2023, among Clarus R&D Solutions, LLC, ManageYourPeople, LLC, PayYourPeople, LLC, TriNet HR III-B, Inc., TriNet HR II-A, Inc., TriNet HR X, Inc., TriNet HR XI, Inc. and YourPeople, Inc. (the “Guaranteeing Subsidiaries” and each a “Guaranteeing Subsidiary”), each a subsidiary of TriNet Group, Inc., a Delaware corporation (the “Company”) and U.S. Bank Trust Company, National Association, as successor in interest to U.S. Bank National Association, as trustee (the “Trustee”).
WITNESSETH
WHEREAS, each of the Issuer and the Guarantors (as defined in the Indenture referred to below) has heretofore executed and delivered to the Trustee an indenture (the “Indenture”), dated as of February 26, 2021, providing for the issuance of an unlimited aggregate principal amount of 3.500% Senior Notes due 2029 (the “Notes”);
WHEREAS, the Indenture provides that under certain circumstances the Guaranteeing Subsidiaries shall execute and deliver to the Trustee a supplemental indenture pursuant to which the Guaranteeing Subsidiaries shall unconditionally Guarantee all of the Issuer’s Obligations under the Notes and the Indenture on the terms and conditions set forth herein and under the Indenture; and
WHEREAS, pursuant to Section 9.1 of the Indenture, the Trustee is authorized to execute and deliver this Supplemental Indenture without the consent of Holders of the Notes.
NOW THEREFORE, in consideration of the foregoing and for other good and valuable consideration, the receipt of which is hereby acknowledged, the parties mutually covenant and agree for the equal and ratable benefit of the Holders as follows:
1.Capitalized Terms. Capitalized terms used herein without definition shall have the meanings assigned to them in the Indenture.
2.Guarantor. Each Guaranteeing Subsidiary hereby agrees to be a Guarantor under the Indenture and to be bound by the terms of the Indenture applicable to Guarantors, including Article X thereof.
3.Governing Law. THIS SUPPLEMENTAL INDENTURE WILL BE GOVERNED BY, AND CONSTRUED IN ACCORDANCE WITH, THE LAWS OF THE STATE OF NEW YORK.
4.Waiver of Jury Trial. EACH GUARANTEEING SUBSIDIARY AND THE TRUSTEE HEREBY IRREVOCABLY WAIVES, TO THE FULLEST EXTENT PERMITTED BY APPLICABLE LAW, ANY AND ALL RIGHT TO TRIAL BY JURY IN ANY LEGAL PROCEEDING ARISING OUT OF OR RELATING TO THIS SUPPLEMENTAL INDENTURE, THE INDENTURE, THE NOTES, THE GUARANTEES OR THE TRANSACTIONS CONTEMPLATED HEREBY OR THEREBY.
5.Counterparts. The parties may sign any number of copies of this Supplemental Indenture. Each signed copy shall be an original, but all of them together represent the same agreement.
6.Headings. The headings of the Sections of this Supplemental Indenture have been inserted for convenience of reference only, are not to be considered a part of this Supplemental Indenture and shall in no way modify or restrict any of the terms or provisions hereof.
7.The Trustee. The Trustee makes no representation or warranty as to the validity or sufficiency of this Supplemental Indenture or with respect to the recitals contained herein, all of which recitals are made solely by the other parties hereto.
[Signature page follows]
IN WITNESS WHEREOF, the parties hereto have caused this Supplemental Indenture to be duly executed, all as of the date first above written.
|
|
|
|
|
|
|
CLARUS R&D SOLUTIONS, LLC |
| |
|
| |
By: /s/ Alex Warren |
|
Name: Alex Warren |
|
|
|
Title: Chief Executive Officer and President |
|
|
|
|
|
|
|
MANAGEYOURPEOPLE, LLC |
| |
|
| |
By: /s/ Thomas Rose |
|
Name: Thomas Rose |
|
|
|
Title: Chief Executive Officer and President |
|
|
|
|
|
|
|
PAYYOURPEOPLE, LLC |
| |
|
| |
By: /s/ Thomas Rose |
|
Name: Thomas Rose |
|
|
|
Title: Chief Executive Officer and President |
|
|
|
|
|
|
|
TRINET HR III-B, INC. |
| |
|
| |
By: /s/ Burton M. Goldfield |
|
Name: Burton M. Goldfield |
|
|
|
Title: Chief Executive Officer and President |
|
|
|
|
|
|
|
TRINET HR II-A, INC. |
| |
|
| |
By: /s/ Alex Warren |
|
Name: Alex Warren |
|
|
|
Title: Chief Executive Officer and President |
|
|
|
|
|
|
|
TRINET HR HR X, INC. |
| |
|
| |
By: /s/ Alex Warren |
|
Name: Alex Warren |
|
|
|
Title: Chief Executive Officer and President |
|
|
|
|
|
|
|
TRINET HR HR XI, INC. |
| |
|
| |
By: /s/ Alex Warren |
|
Name: Alex Warren |
|
|
|
Title: Chief Executive Officer and President |
|
|
|
|
|
|
|
YOURPEOPLE, INC. |
| |
|
| |
By: /s/ Thomas Rose |
|
Name: Thomas Rose |
|
|
|
Title: Chief Executive Officer and President |
|
|
|
|
|
|
|
U.S. BANK TRUST COMPANY, |
| |
NATIONAL ASSOCIATION, as Trustee |
|
|
| |
By: /s/ David Jason |
|
Name: David Jason |
|
|
|
Title: Vice President |
EX-31.1
3
tnet-093023xexhibit311.htm
EX-31.1
Document
Exhibit 31.1
CERTIFICATION OF PRINCIPAL EXECUTIVE OFFICER
PURSUANT TO SECTION 302 OF THE SARBANES-OXLEY ACT OF 2002
I, Burton M. Goldfield, certify that:
1.I have reviewed this quarterly report on Form 10-Q of TriNet Group, Inc.;
2.Based on my knowledge, this report does not contain any untrue statement of a material fact or omit to state a material fact necessary to make the statements made, in light of the circumstances under which such statements were made, not misleading with respect to the period covered by this report;
3.Based on my knowledge, the financial statements, and other financial information included in this report, fairly present in all material respects the financial condition, results of operations and cash flows of the registrant as of, and for, the periods presented in this report;
4.The registrant’s other certifying officer and I are responsible for establishing and maintaining disclosure controls and procedures (as defined in Exchange Act Rules 13a-15(e) and 15d-15(e)) and internal control over financial reporting (as defined in Exchange Act Rules 13a-15(f) and 15d-15(f)) for the registrant and have:
(a) designed such disclosure controls and procedures, or caused such disclosure controls and procedures to be designed under our supervision, to ensure that material information relating to the registrant, including its consolidated subsidiaries, is made known to us by others within those entities, particularly during the period in which this report is being prepared;
(b) designed such internal control over financial reporting, or caused such internal control over financial reporting to be designed under our supervision, to provide reasonable assurance regarding the reliability of financial reporting and the preparation of financial statements for external purposes in accordance with generally accepted accounting principles;
(c) evaluated the effectiveness of the registrant’s disclosure controls and procedures and presented in this report our conclusions about the effectiveness of the disclosure controls and procedures, as of the end of the period covered by this report based on such evaluation; and
(d) disclosed in this report any change in the registrant’s internal control over financial reporting that occurred during the registrant’s most recent fiscal quarter (the registrant’s fourth fiscal quarter in the case of an annual report) that has materially affected, or is reasonably likely to materially affect, the registrant’s internal control over financial reporting; and
5.The registrant’s other certifying officer and I have disclosed, based on our most recent evaluation of internal control over financial reporting, to the registrant’s auditors and the audit committee of the registrant’s board of directors (or persons performing the equivalent functions):
(a) all significant deficiencies and material weaknesses in the design or operation of internal control over financial reporting which are reasonably likely to adversely affect the registrant’s ability to record, process, summarize and report financial information; and
(b) any fraud, whether or not material, that involves management or other employees who have a significant role in the registrant’s internal control over financial reporting.
|
|
|
| Date: October 25, 2023 |
|
|
| /s/ Burton M. Goldfield |
| Burton M. Goldfield |
| President and Chief Executive Officer |
EX-31.2
4
tnet-093023xexhibit312.htm
EX-31.2
Document
Exhibit 31.2
CERTIFICATION OF PRINCIPAL FINANCIAL OFFICER
PURSUANT TO SECTION 302 OF THE SARBANES-OXLEY ACT OF 2002
I, Kelly Tuminelli, certify that:
1.I have reviewed this quarterly report on Form 10-Q of TriNet Group, Inc.;
2.Based on my knowledge, this report does not contain any untrue statement of a material fact or omit to state a material fact necessary to make the statements made, in light of the circumstances under which such statements were made, not misleading with respect to the period covered by this report;
3.Based on my knowledge, the financial statements, and other financial information included in this report, fairly present in all material respects the financial condition, results of operations and cash flows of the registrant as of, and for, the periods presented in this report;
4.The registrant’s other certifying officer and I are responsible for establishing and maintaining disclosure controls and procedures (as defined in Exchange Act Rules 13a-15(e) and 15d-15(e)) and internal control over financial reporting (as defined in Exchange Act Rules 13a-15(f) and 15d-15(f)) for the registrant and have:
(a) designed such disclosure controls and procedures, or caused such disclosure controls and procedures to be designed under our supervision, to ensure that material information relating to the registrant, including its consolidated subsidiaries, is made known to us by others within those entities, particularly during the period in which this report is being prepared;
(b) designed such internal control over financial reporting, or caused such internal control over financial reporting to be designed under our supervision, to provide reasonable assurance regarding the reliability of financial reporting and the preparation of financial statements for external purposes in accordance with generally accepted accounting principles;
(c) evaluated the effectiveness of the registrant’s disclosure controls and procedures and presented in this report our conclusions about the effectiveness of the disclosure controls and procedures, as of the end of the period covered by this report based on such evaluation; and
(d) disclosed in this report any change in the registrant’s internal control over financial reporting that occurred during the registrant’s most recent fiscal quarter (the registrant’s fourth fiscal quarter in the case of an annual report) that has materially affected, or is reasonably likely to materially affect, the registrant’s internal control over financial reporting; and
5.The registrant’s other certifying officer and I have disclosed, based on our most recent evaluation of internal control over financial reporting, to the registrant’s auditors and the audit committee of the registrant’s board of directors (or persons performing the equivalent functions):
(a) all significant deficiencies and material weaknesses in the design or operation of internal control over financial reporting which are reasonably likely to adversely affect the registrant’s ability to record, process, summarize and report financial information; and
(b) any fraud, whether or not material, that involves management or other employees who have a significant role in the registrant’s internal control over financial reporting.
|
|
|
| Date: October 25, 2023 |
| |
| |
/s/ Kelly Tuminelli |
| Kelly Tuminelli |
|
| Chief Financial Officer |
EX-32.1
5
tnet-093023xexhibit321.htm
EX-32.1
Document
Exhibit 32.1
CERTIFICATION PURSUANT TO 18 U.S.C. SECTION 1350,
AS ADOPTED PURSUANT TO SECTION 906
OF THE SARBANES-OXLEY ACT OF 2002
In connection with the Quarterly Report of TriNet Group, Inc., a Delaware corporation (the “Company”), on Form 10-Q for the period ending September 30, 2023 as filed with the U.S. Securities and Exchange Commission on the date hereof (the “Report”), each of the undersigned officers of the Company does hereby certify, pursuant to 18 U.S.C. § 1350 (section 906 of the Sarbanes-Oxley Act of 2002), that:
(1)The Report containing the financial statements fully complies with the requirements of section 13(a) or 15(d) of the Securities Exchange Act of 1934 (15 U.S.C. 78m or 78o(d)); and
(2)The information contained in the Report fairly presents, in all material respects, the financial condition and results of operations of the Company.
The foregoing certification (i) is given to such officers’ knowledge, based upon such officers’ investigation as such officers reasonably deem appropriate; and (ii) is being furnished solely pursuant to 18 U.S.C. § 1350 (section 906 of the Sarbanes-Oxley Act of 2002) and is not being filed as part of the Report or as a separate disclosure document and is not to be incorporated by reference into any filing of the Company under the Securities Act of 1933, as amended, or the Securities Exchange Act of 1934, as amended (whether made before or after the date of the Report), irrespective of any general incorporation language contained in such filing.
|
|
|
|
|
|
| Date: October 25, 2023 |
/s/ Burton M. Goldfield |
| |
Burton M. Goldfield |
| |
Chief Executive Officer |
|
|
| |
|
| Date: October 25, 2023 |
/s/ Kelly Tuminelli |
|
Kelly Tuminelli |
|
|
|
Chief Financial Officer |