Document
ACI Worldwide, Inc. Reports Financial Results for the
Quarter Ended September 30, 2024
Q3 2024 HIGHLIGHTS
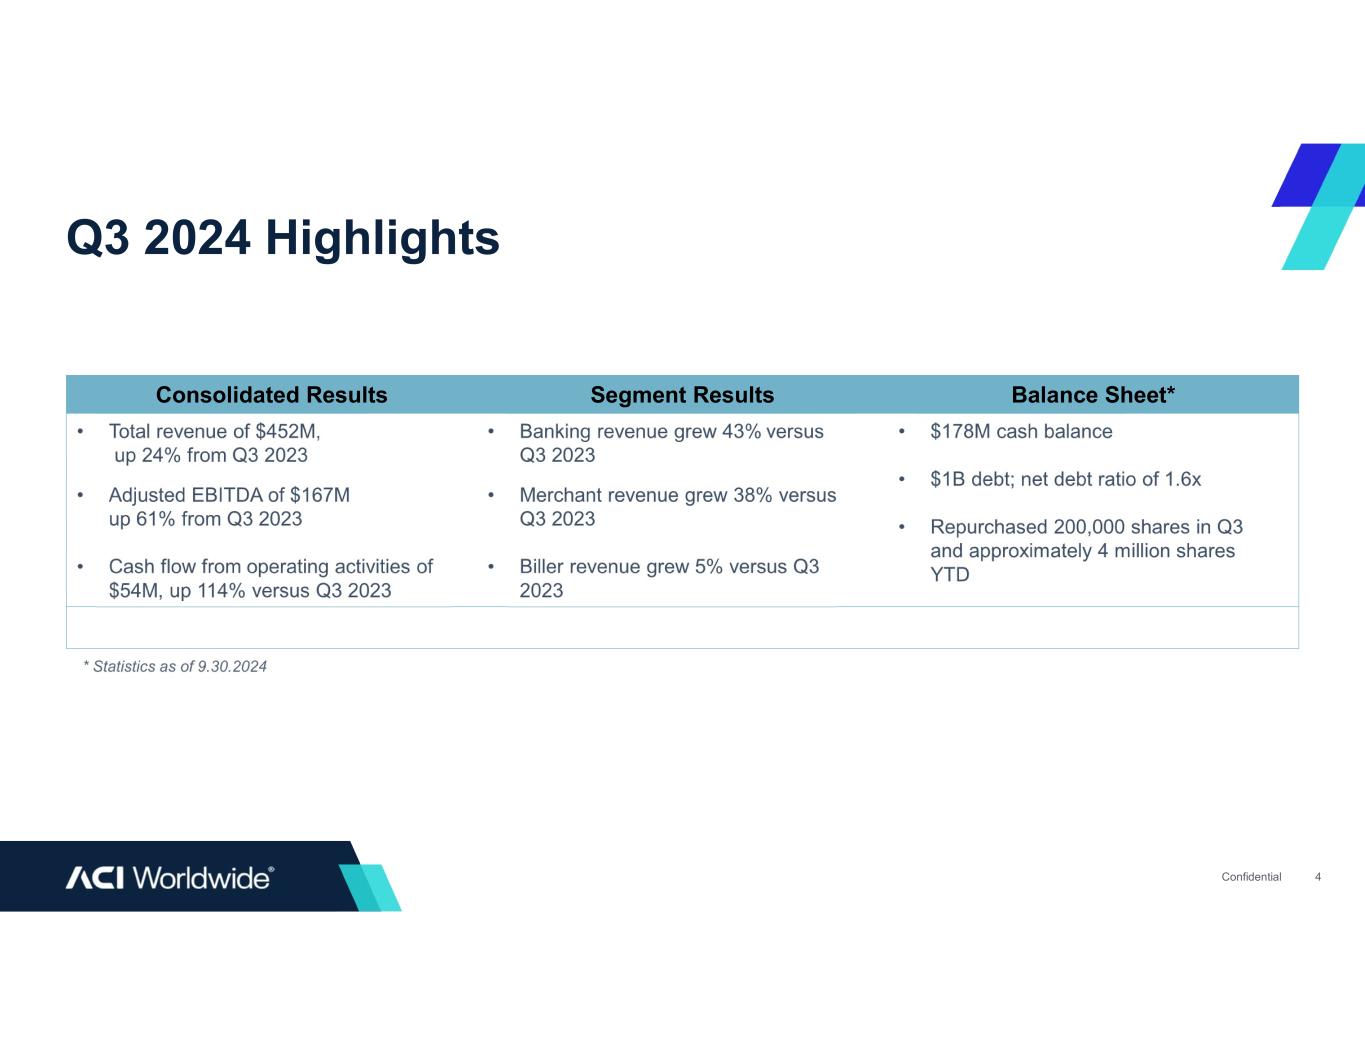
•Revenue up 24% versus Q3 2023
•Net income up 115% versus Q3 2023
•Adjusted EBITDA up 61% versus Q3 2023
•Cash flow from operating activities up 114% versus Q3 2023
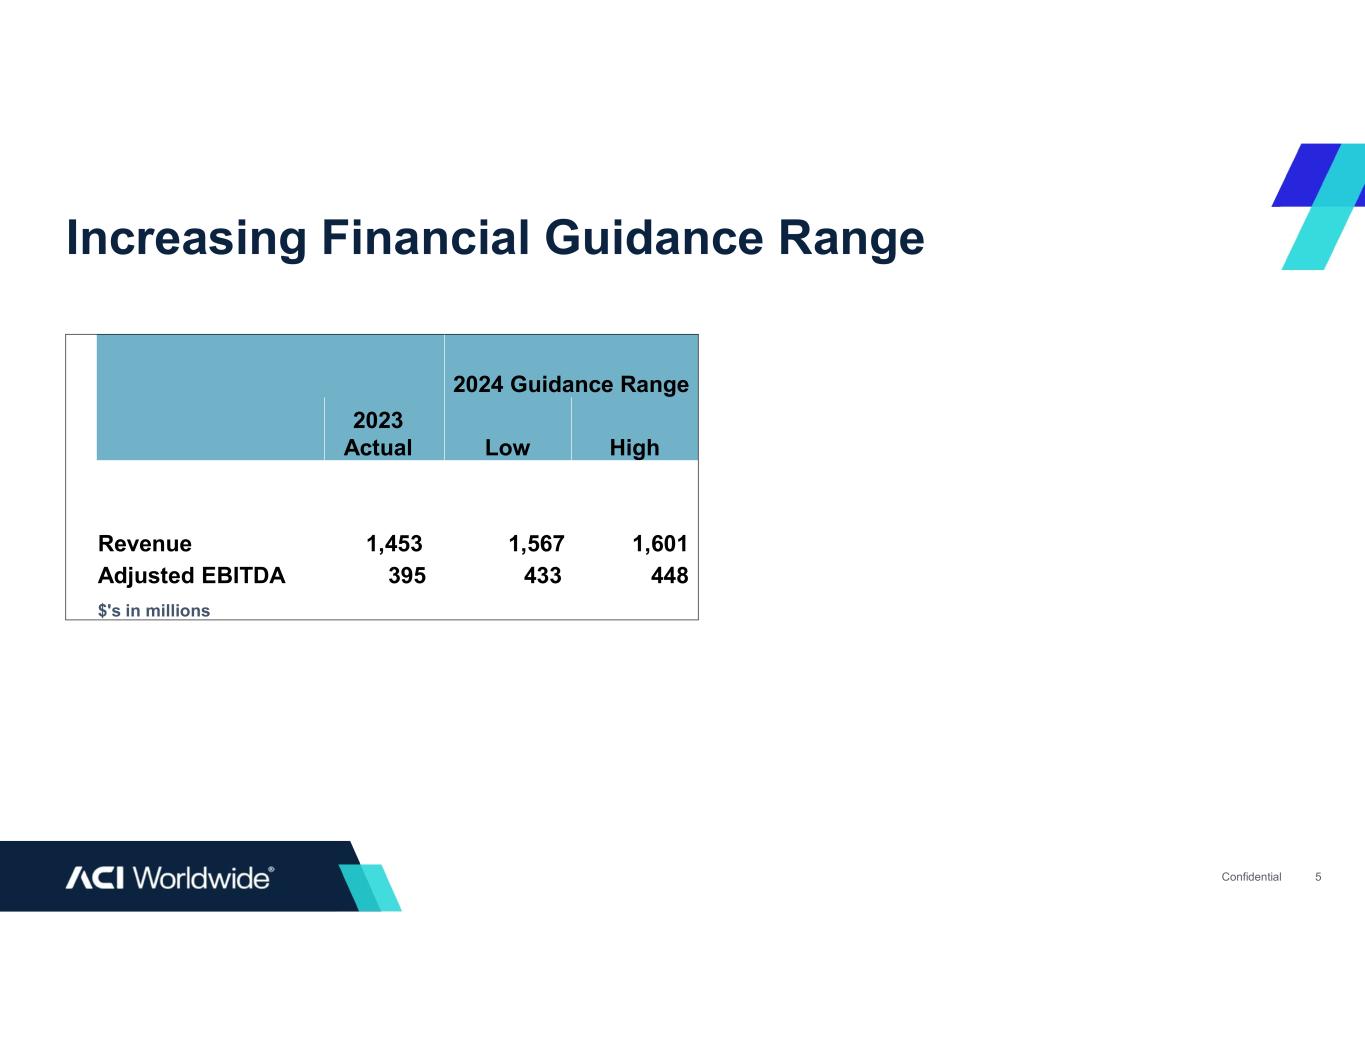
•Raising guidance range for full-year 2024
OMAHA, Neb. — November 7, 2024 — ACI Worldwide (NASDAQ: ACIW), an original innovator in global payments technology, announced financial results today for the quarter ended September 30, 2024.
“We are very pleased with our third quarter results and the continued positive momentum in the business. We saw particular strength within our Bank and Merchant segments and are once again raising our full-year outlook,” said Thomas Warsop, president and CEO of ACI Worldwide. “This year the team has done a tremendous job signing renewal contracts earlier in the year. This initiative is enabling our commercial team to spend more time on prospects and winning new business, which has allowed us to outperform our forecasts. Further, signing these new contracts earlier in the year helps reduce the heavy seasonality we have historically seen and simply reduces the risk of attaining our full-year financial guidance.
“Our pipelines remain strong across our segments, and we are well-positioned for future growth as we continue to invest in innovation, execute on our strategy, and deliver value to our customers and shareholders.”
“Our cash flow from operating activities increased 114% over Q3 last year and we exited the quarter with net debt leverage ratio of 1.6x adjusted EBITDA, with approximately $650 million in liquidity,” said Scott Behrens, chief financial officer of ACI Worldwide. “Our strong cash flow growth and our lowest leverage in over a decade, combined with our improved outlook for 2024 and our expectations for continued strength in 2025, enable us to reduce our long-term stated leverage target from 2.5x to 2.0x. We will continue to maintain a disciplined, long-term focused capital allocation strategy that balances re-investment in the business, accretive M&A and share repurchases, while maintaining a strong balance sheet with ample liquidity and financial flexibility.”
FINANCIAL SUMMARY
In Q3 2024, revenue was $452 million, up 24% from Q3 2023. Net income was $81 million, up 115% from $38 million in Q3 2023. Adjusted EBITDA in Q3 2024 was $167 million, up 61% from Q3 2023. Cash flow from operating activities in Q3 2024 was $54 million, up 114% from $25 million in Q3 2023.
•Bank segment revenue increased 43% in Q3 2024 and Bank segment adjusted EBITDA increased 69% versus Q3 2023.
•Merchant segment revenue increased 38% in Q3 2024 and Merchant segment adjusted EBITDA increased 159% versus Q3 2023.
•Biller segment revenue increased 5% in Q3 2024 and Biller segment adjusted EBITDA decreased 21%. Q3 2023 included certain one-time non-recurring margin benefits that did not recur in Q3 2024.
ACI ended Q3 2024 with $178 million in cash on hand and a debt balance of $1 billion, which represents a net debt leverage ratio of 1.6x adjusted EBITDA.
During the quarter the company repurchased approximately 200,000 shares for $8 million in capital and year-to-date 2024 has repurchased approximately 4 million shares for $128 million in capital. At the end of the quarter, the company had $372 million remaining available on the share repurchase authorization.
RAISING 2024 GUIDANCE
For the full year of 2024, we are raising our guidance for both revenue and adjusted EBITDA. We now expect revenue to be in the range of $1.567 billion to $1.601 billion, up from the range of $1.557 billion to $1.591 billion. We now expect adjusted EBITDA to be in the range of $433 million to $448 million, up from the range of $423 million to $438 million.
CONFERENCE CALL TO DISCUSS FINANCIAL RESULTS
Today, management will host a conference call at 8:30 a.m. ET to discuss these results. Interested persons may access a real-time audio broadcast of the teleconference at http://investor.aciworldwide.com/ or use the following number for dial-in participation: toll-free 1 (888) 660-6377 and conference code 3153574.
About ACI Worldwide
ACI Worldwide, an original innovator in global payments technology, delivers transformative software solutions that power intelligent payments orchestration in real time so banks, billers, and merchants can drive growth, while continuously modernizing their payment infrastructures, simply and securely. With nearly 50 years of trusted payments expertise, we combine our global footprint with a local presence to offer enhanced payment experiences to stay ahead of constantly changing payment challenges and opportunities.
© Copyright ACI Worldwide, Inc. 2024.
ACI, ACI Worldwide, ACI Payments, Inc., ACI Pay, Speedpay and all ACI product/solution names are trademarks or registered trademarks of ACI Worldwide, Inc., or one of its subsidiaries, in the United States, other countries or both. Other parties' trademarks referenced are the property of their respective owners.
For more information contact:
Investor Relations
John Kraft
239-403-4627 / john.kraft@aciworldwide.com
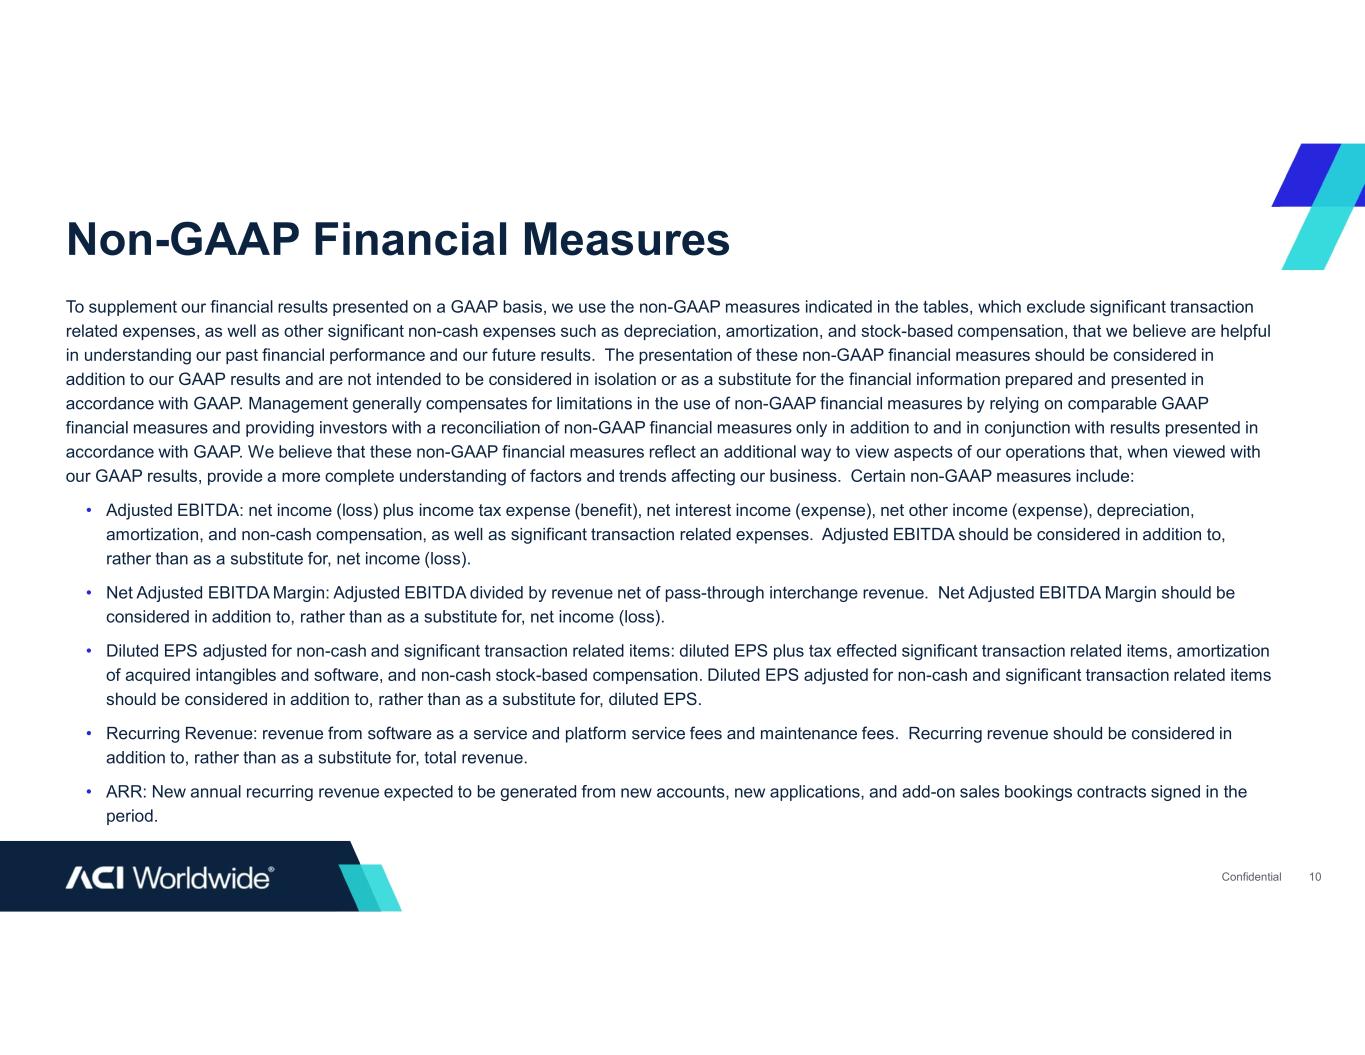
SVP, Head of Strategy and Finance To supplement our financial results presented on a GAAP basis, we use the non-GAAP measures indicated in the tables, which exclude significant transaction-related expenses, as well as other significant non-cash expenses such as depreciation, amortization, and stock-based compensation, that we believe are helpful in understanding our past financial performance and our future results. The presentation of these non-GAAP financial measures should be considered in addition to our GAAP results and are not intended to be considered in isolation or as a substitute for the financial information prepared and presented in accordance with GAAP. Management generally compensates for limitations in the use of non-GAAP financial measures by relying on comparable GAAP financial measures and providing investors with a reconciliation of non-GAAP financial measures only in addition to and in conjunction with results presented in accordance with GAAP.
We believe that these non-GAAP financial measures reflect an additional way to view aspects of our operations that, when viewed with our GAAP results, provide a more complete understanding of factors and trends affecting our business. Certain non-GAAP measures include:
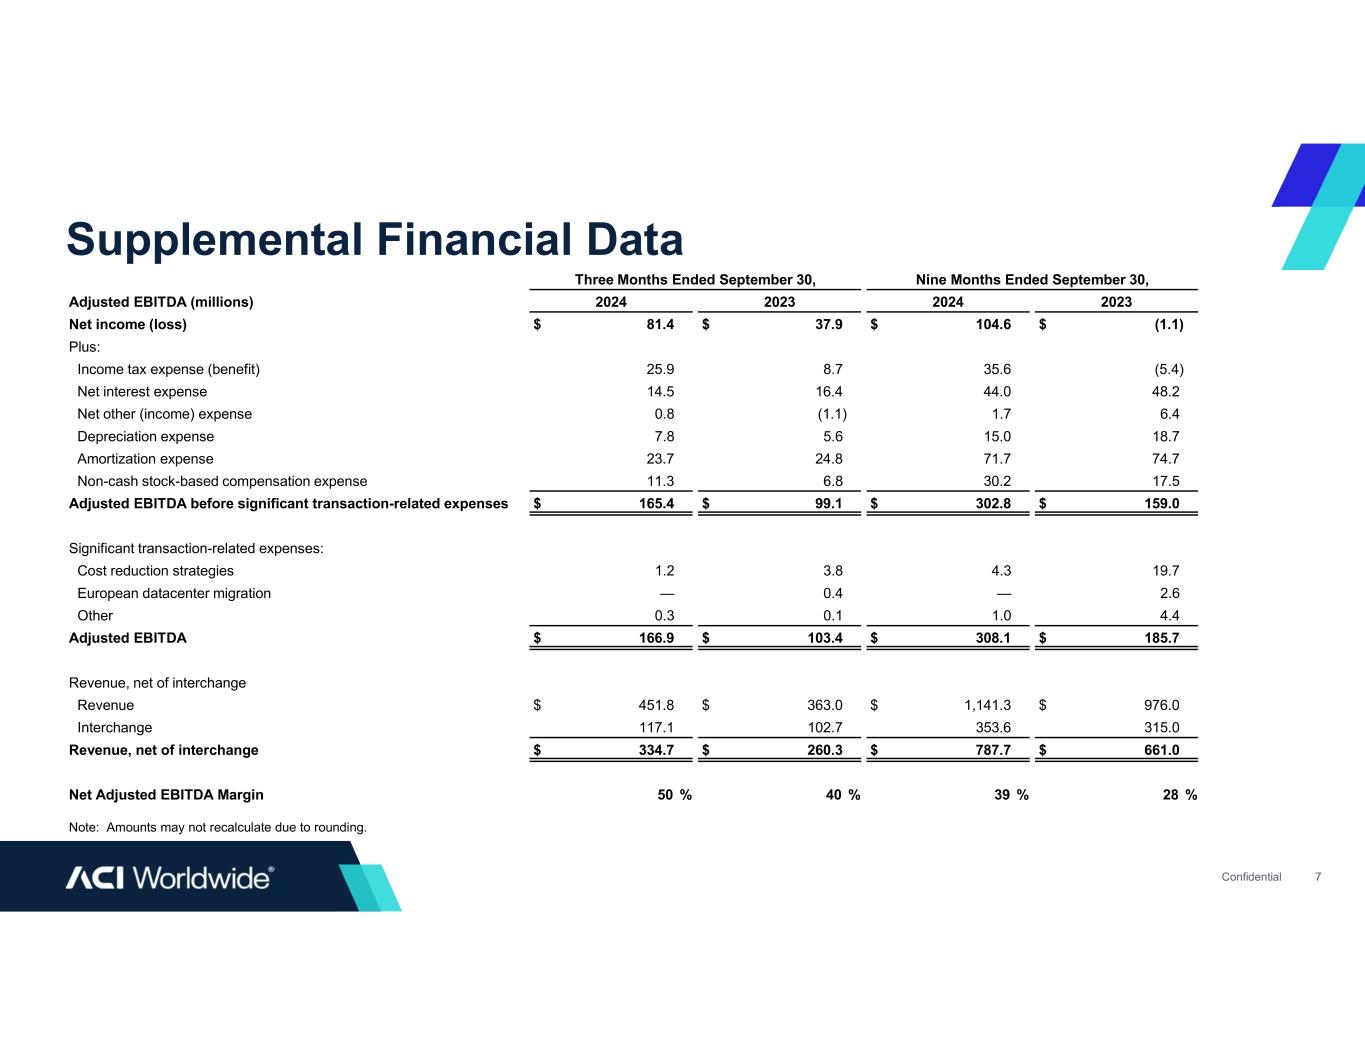
•Adjusted EBITDA: net income (loss) plus income tax expense (benefit), net interest income (expense), net other income (expense), depreciation, amortization and stock-based compensation, as well as significant transaction-related expenses. Adjusted EBITDA should be considered in addition to, rather than as a substitute for, net income (loss).
•Net Adjusted EBITDA Margin: Adjusted EBITDA divided by revenue net of pass-through interchange revenue. Net Adjusted EBITDA Margin should be considered in addition to, rather than as a substitute for, net income (loss).
•Diluted EPS adjusted for non-cash and significant transaction related items: diluted EPS plus tax effected significant transaction related items, amortization of acquired intangibles and software, and non-cash stock-based compensation. Diluted EPS adjusted for non-cash and significant transaction related items should be considered in addition to, rather than as a substitute for, diluted EPS.
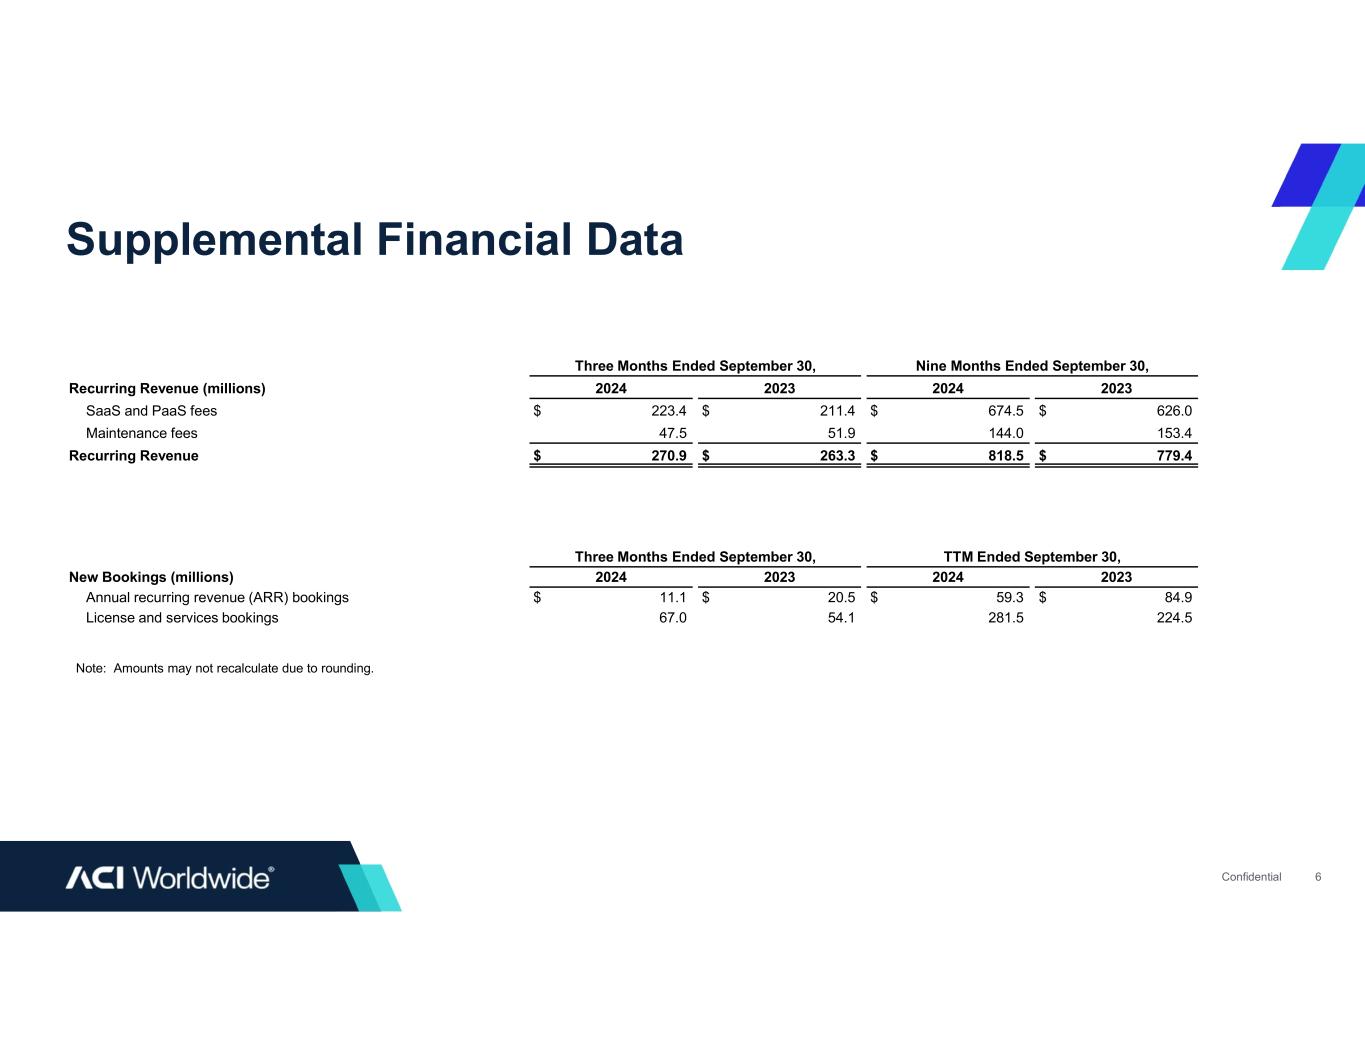
•Recurring Revenue: revenue from software as a service and platform as a service fees and maintenance fees. Recurring revenue should be considered in addition to, rather than as a substitute for, total revenue.
•ARR: New annual recurring revenue expected to be generated from new accounts, new applications, and add-on sales bookings contracts signed in the period.
FORWARD-LOOKING STATEMENTS
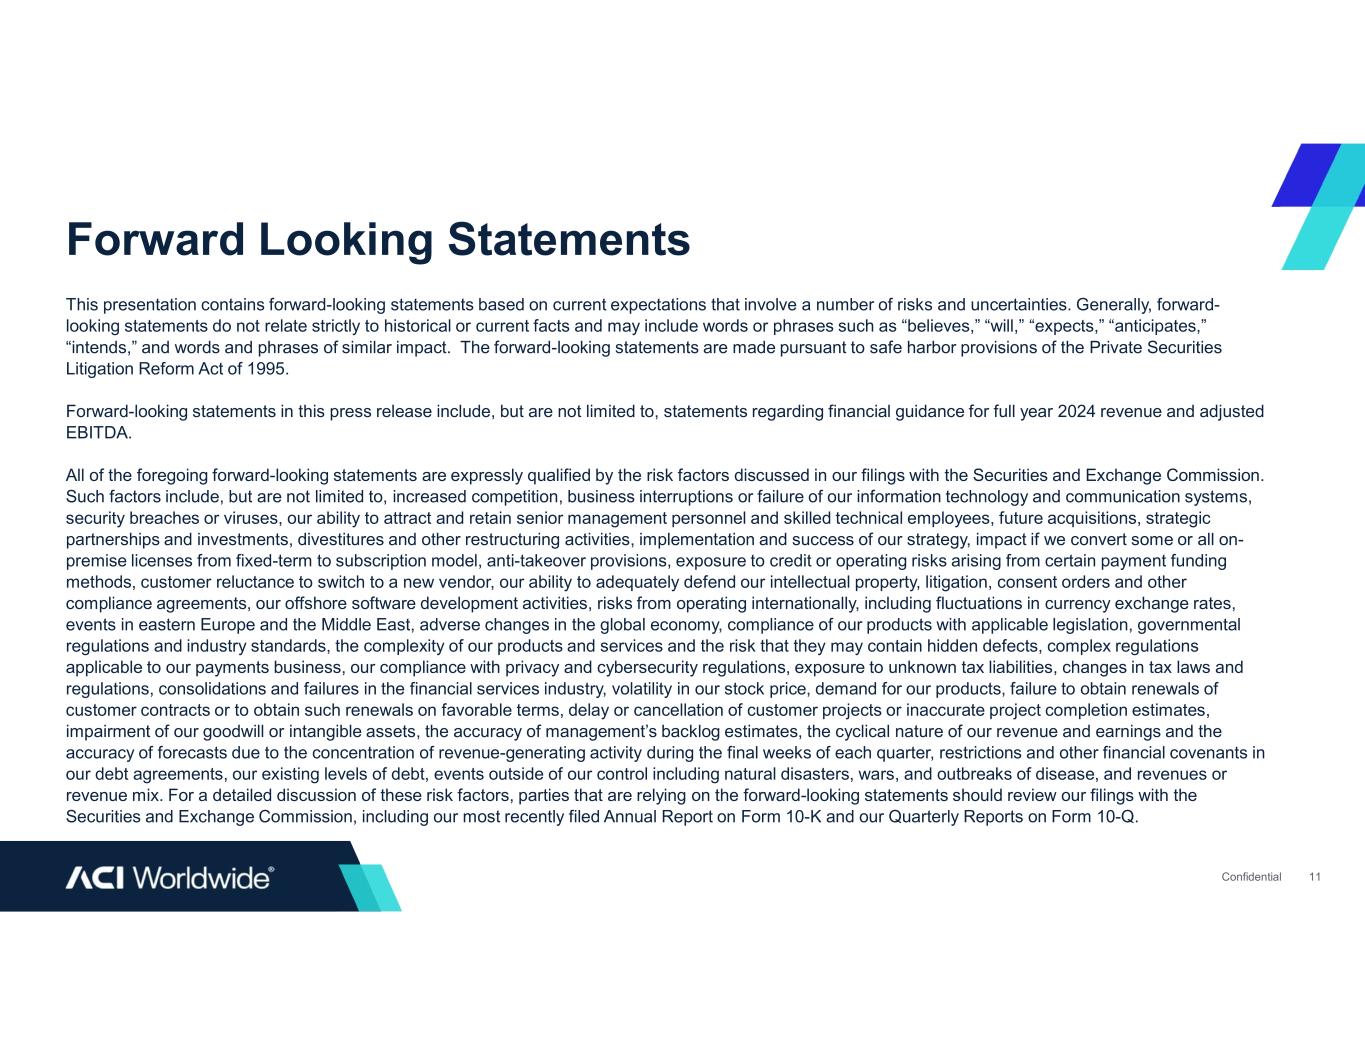
This press release contains forward-looking statements based on current expectations that involve a number of risks and uncertainties. Generally, forward-looking statements do not relate strictly to historical or current facts and may include words or phrases such as “believes,” “will,” “expects,” “anticipates,” “intends,” and words and phrases of similar impact. The forward-looking statements are made pursuant to safe harbor provisions of the Private Securities Litigation Reform Act of 1995.
Forward-looking statements in this press release include, but are not limited to: (i) the continued positive momentum in the business, (ii) our pipelines remain strong across our segments, and we are well-positioned for future growth as we continue to invest in innovation, execute on our strategy, and deliver value to our customers and shareholders, (iii) we will continue to maintain a disciplined, long-term focused capital allocation strategy that balances re-investment in the business, accretive M&A and share repurchases, while maintaining a strong balance sheet with ample liquidity and financial flexibility, and (iv) target leverage and full-year 2024 revenue and adjusted EBITDA financial guidance.
All of the foregoing forward-looking statements are expressly qualified by the risk factors discussed in our filings with the Securities and Exchange Commission. Such factors include, but are not limited to, increased competition, business interruptions or failure of our information technology and communication systems, security breaches or viruses, our ability to attract and retain senior management personnel and skilled technical employees, future acquisitions, strategic partnerships and investments, divestitures and other restructuring activities, implementation and success of our strategy, impact if we convert some or all on-premise licenses from fixed-term to subscription model, anti-takeover provisions, exposure to credit or operating risks arising from certain payment funding methods, customer reluctance to switch to a new vendor, our ability to adequately defend our intellectual property, litigation, consent orders and other compliance agreements, our offshore software development activities, risks from operating internationally, including fluctuations in currency exchange rates, events in eastern Europe and the Middle East, adverse changes in the global economy, compliance of our products with applicable legislation, governmental regulations and industry standards, the complexity of our products and services and the risk that they may contain hidden defects, complex regulations applicable to our payments business, our compliance with privacy and cybersecurity regulations, exposure to unknown tax liabilities, changes in tax laws and regulations, consolidations and failures in the financial services industry, volatility in our stock price, demand for our products, failure to obtain renewals of customer contracts or to obtain such renewals on favorable terms, delay or cancellation of customer projects or inaccurate project completion estimates, impairment of our goodwill or intangible assets, the accuracy of management’s backlog estimates, the cyclical nature of our revenue and earnings and the accuracy of forecasts due to the concentration of revenue-generating activity during the final weeks of each quarter, restrictions and other financial covenants in our debt agreements, our existing levels of debt, events outside of our control including natural disasters, wars, and outbreaks of disease, and revenues or revenue mix. For a detailed discussion of these risk factors, parties that are relying on the forward-looking statements should review our filings with the Securities and Exchange Commission, including our most recently filed Annual Report on Form 10-K and our Quarterly Reports on Form 10-Q.
ACI WORLDWIDE, INC. AND SUBSIDIARIES
CONDENSED CONSOLIDATED BALANCE SHEETS
(unaudited and in thousands)
|
|
|
|
|
|
|
|
|
|
|
|
|
September 30, 2024 |
|
December 31, 2023 |
| ASSETS |
|
|
|
| Current assets |
|
|
|
| Cash and cash equivalents |
$ |
177,860 |
|
|
$ |
164,239 |
|
| Receivables, net of allowances |
424,518 |
|
|
452,337 |
|
| Settlement assets |
428,479 |
|
|
723,039 |
|
| Prepaid expenses |
31,878 |
|
|
31,479 |
|
| Other current assets |
22,865 |
|
|
35,551 |
|
| Total current assets |
1,085,600 |
|
|
1,406,645 |
|
| Noncurrent assets |
|
|
|
| Accrued receivables, net |
338,977 |
|
|
313,983 |
|
| Property and equipment, net |
31,441 |
|
|
37,856 |
|
| Operating lease right-of-use assets |
29,181 |
|
|
34,338 |
|
| Software, net |
90,313 |
|
|
108,418 |
|
| Goodwill |
1,226,026 |
|
|
1,226,026 |
|
| Intangible assets, net |
172,310 |
|
|
195,646 |
|
| Deferred income taxes, net |
64,674 |
|
|
58,499 |
|
| Other noncurrent assets |
54,463 |
|
|
63,328 |
|
| TOTAL ASSETS |
$ |
3,092,985 |
|
|
$ |
3,444,739 |
|
| LIABILITIES AND STOCKHOLDERS’ EQUITY |
|
|
|
| Current liabilities |
|
|
|
| Accounts payable |
$ |
47,912 |
|
|
$ |
45,964 |
|
| Settlement liabilities |
428,080 |
|
|
721,164 |
|
| Employee compensation |
42,806 |
|
|
53,892 |
|
| Current portion of long-term debt |
34,910 |
|
|
74,405 |
|
| Deferred revenue |
68,550 |
|
|
59,580 |
|
| Other current liabilities |
75,036 |
|
|
82,244 |
|
| Total current liabilities |
697,294 |
|
|
1,037,249 |
|
| Noncurrent liabilities |
|
|
|
| Deferred revenue |
19,315 |
|
|
24,780 |
|
| Long-term debt |
959,387 |
|
|
963,599 |
|
| Deferred income taxes, net |
38,439 |
|
|
40,735 |
|
| Operating lease liabilities |
23,601 |
|
|
29,074 |
|
| Other noncurrent liabilities |
25,319 |
|
|
25,005 |
|
| Total liabilities |
1,763,355 |
|
|
2,120,442 |
|
| Commitments and contingencies |
|
|
|
| Stockholders’ equity |
|
|
|
| Preferred stock |
— |
|
|
— |
|
| Common stock |
702 |
|
|
702 |
|
| Additional paid-in capital |
725,724 |
|
|
712,994 |
|
| Retained earnings |
1,499,530 |
|
|
1,394,967 |
|
| Treasury stock |
(791,353) |
|
|
(674,896) |
|
| Accumulated other comprehensive loss |
(104,973) |
|
|
(109,470) |
|
| Total stockholders’ equity |
1,329,630 |
|
|
1,324,297 |
|
| TOTAL LIABILITIES AND STOCKHOLDERS’ EQUITY |
$ |
3,092,985 |
|
|
$ |
3,444,739 |
|
ACI WORLDWIDE, INC. AND SUBSIDIARIES
CONDENSED CONSOLIDATED STATEMENTS OF OPERATIONS
(unaudited and in thousands, except per share amounts)
|
|
|
|
|
|
|
|
|
|
|
|
|
|
|
|
|
|
|
|
|
|
|
|
|
Three Months Ended
September 30, |
|
Nine Months Ended
September 30, |
|
2024 |
|
2023 |
|
2024 |
|
2023 |
| Revenues |
|
|
|
|
|
|
|
| Software as a service and platform as a service |
$ |
223,367 |
|
|
$ |
211,369 |
|
|
$ |
674,498 |
|
|
$ |
625,975 |
|
| License |
157,429 |
|
|
79,679 |
|
|
252,984 |
|
|
142,681 |
|
| Maintenance |
47,559 |
|
|
51,942 |
|
|
144,046 |
|
|
153,436 |
|
| Services |
23,397 |
|
|
20,025 |
|
|
69,722 |
|
|
53,924 |
|
| Total revenues |
451,752 |
|
|
363,015 |
|
|
1,141,250 |
|
|
976,016 |
|
| Operating expenses |
|
|
|
|
|
|
|
| Cost of revenue (1) |
197,351 |
|
|
177,625 |
|
|
591,696 |
|
|
537,522 |
|
| Research and development |
37,660 |
|
|
33,739 |
|
|
108,063 |
|
|
106,122 |
|
| Selling and marketing |
28,691 |
|
|
29,442 |
|
|
83,992 |
|
|
98,166 |
|
| General and administrative |
33,949 |
|
|
29,821 |
|
|
84,942 |
|
|
92,675 |
|
| Depreciation and amortization |
31,515 |
|
|
30,464 |
|
|
86,710 |
|
|
93,439 |
|
| Total operating expenses |
329,166 |
|
|
301,091 |
|
|
955,403 |
|
|
927,924 |
|
| Operating income |
122,586 |
|
|
61,924 |
|
|
185,847 |
|
|
48,092 |
|
| Other income (expense) |
|
|
|
|
|
|
|
| Interest expense |
(18,356) |
|
|
(19,840) |
|
|
(55,837) |
|
|
(58,641) |
|
| Interest income |
3,871 |
|
|
3,495 |
|
|
11,833 |
|
|
10,458 |
|
| Other, net |
(823) |
|
|
1,084 |
|
|
(1,692) |
|
|
(6,403) |
|
| Total other income (expense) |
(15,308) |
|
|
(15,261) |
|
|
(45,696) |
|
|
(54,586) |
|
| Income (loss) before income taxes |
107,278 |
|
|
46,663 |
|
|
140,151 |
|
|
(6,494) |
|
| Income tax expense (benefit) |
25,851 |
|
|
8,752 |
|
|
35,588 |
|
|
(5,387) |
|
| Net income (loss) |
$ |
81,427 |
|
|
$ |
37,911 |
|
|
$ |
104,563 |
|
|
$ |
(1,107) |
|
| Income (loss) per common share |
|
|
|
|
|
|
|
| Basic |
$ |
0.78 |
|
|
$ |
0.35 |
|
|
$ |
0.99 |
|
|
$ |
(0.01) |
|
| Diluted |
$ |
0.77 |
|
|
$ |
0.35 |
|
|
$ |
0.98 |
|
|
$ |
(0.01) |
|
| Weighted average common shares outstanding |
|
|
|
|
|
|
|
| Basic |
104,770 |
|
|
108,667 |
|
|
105,651 |
|
|
108,428 |
|
| Diluted |
106,018 |
|
|
108,933 |
|
|
106,552 |
|
|
108,428 |
|
(1) The cost of revenue excludes charges for depreciation and amortization.
ACI WORLDWIDE, INC. AND SUBSIDIARIES
CONDENSED CONSOLIDATED STATEMENTS OF CASH FLOWS
(unaudited and in thousands)
|
|
|
|
|
|
|
|
|
|
|
|
|
|
|
|
|
|
|
|
|
|
|
|
|
Three Months Ended
September 30, |
|
Nine Months Ended
September 30, |
|
2024 |
|
2023 |
|
2024 |
|
2023 |
| Cash flows from operating activities: |
|
|
|
|
|
|
|
| Net income (loss) |
$ |
81,427 |
|
|
$ |
37,911 |
|
|
$ |
104,563 |
|
|
$ |
(1,107) |
|
| Adjustments to reconcile net income (loss) to net cash flows from operating activities: |
|
|
|
|
|
|
|
| Depreciation |
7,804 |
|
|
5,631 |
|
|
14,999 |
|
|
18,722 |
|
| Amortization |
23,711 |
|
|
24,832 |
|
|
71,711 |
|
|
74,716 |
|
| Amortization of operating lease right-of-use assets |
2,338 |
|
|
2,699 |
|
|
7,337 |
|
|
9,190 |
|
| Amortization of deferred debt issuance costs |
659 |
|
|
923 |
|
|
2,257 |
|
|
3,415 |
|
| Deferred income taxes |
(3,745) |
|
|
(2,566) |
|
|
(2,229) |
|
|
(25,207) |
|
| Stock-based compensation expense |
11,346 |
|
|
6,822 |
|
|
30,165 |
|
|
17,537 |
|
|
|
|
|
|
|
|
|
| Other |
2,247 |
|
|
1,857 |
|
|
180 |
|
|
2,168 |
|
| Changes in operating assets and liabilities: |
|
|
|
|
|
|
|
| Receivables |
(95,899) |
|
|
(39,844) |
|
|
3,699 |
|
|
42,012 |
|
| Accounts payable |
(4,091) |
|
|
(5,244) |
|
|
758 |
|
|
(7,198) |
|
| Accrued employee compensation |
8,759 |
|
|
1,749 |
|
|
(11,125) |
|
|
(2,879) |
|
| Deferred revenue |
(6,433) |
|
|
(8,296) |
|
|
1,884 |
|
|
4,404 |
|
| Other current and noncurrent assets and liabilities |
25,885 |
|
|
(1,208) |
|
|
8,067 |
|
|
(52,999) |
|
| Net cash flows from operating activities |
54,008 |
|
|
25,266 |
|
|
232,266 |
|
|
82,774 |
|
| Cash flows from investing activities: |
|
|
|
|
|
|
|
| Purchases of property and equipment |
(3,509) |
|
|
(3,380) |
|
|
(8,463) |
|
|
(7,956) |
|
| Purchases of software and distribution rights |
(4,154) |
|
|
(7,550) |
|
|
(23,178) |
|
|
(22,571) |
|
|
|
|
|
|
|
|
|
|
|
|
|
|
|
|
|
| Net cash flows from investing activities |
(7,663) |
|
|
(10,930) |
|
|
(31,641) |
|
|
(30,527) |
|
| Cash flows from financing activities: |
|
|
|
|
|
|
|
| Proceeds from issuance of common stock |
732 |
|
|
696 |
|
|
2,129 |
|
|
2,122 |
|
| Proceeds from exercises of stock options |
1,202 |
|
|
263 |
|
|
1,954 |
|
|
3,132 |
|
| Repurchase of stock-based compensation awards for tax withholdings |
(2,960) |
|
|
(883) |
|
|
(9,299) |
|
|
(4,203) |
|
| Repurchases of common stock |
(7,996) |
|
|
— |
|
|
(127,670) |
|
|
— |
|
|
|
|
|
|
|
|
|
|
|
|
|
|
|
|
|
| Proceeds from revolving credit facility |
20,000 |
|
|
20,000 |
|
|
184,000 |
|
|
75,000 |
|
| Repayment of revolving credit facility |
(25,000) |
|
|
(6,000) |
|
|
(177,000) |
|
|
(51,000) |
|
| Proceeds from term portion of credit agreement |
— |
|
|
— |
|
|
500,000 |
|
|
— |
|
| Repayment of term portion of credit agreement |
(9,375) |
|
|
(19,475) |
|
|
(547,823) |
|
|
(53,556) |
|
| Payments on or proceeds from other debt, net |
(630) |
|
|
(643) |
|
|
(9,299) |
|
|
(12,473) |
|
| Payments for debt issuance costs |
— |
|
|
— |
|
|
(5,141) |
|
|
(2,160) |
|
| Net increase (decrease) in settlement assets and liabilities |
23,855 |
|
|
19,452 |
|
|
17,704 |
|
|
(4,635) |
|
| Net cash flows from financing activities |
(172) |
|
|
13,410 |
|
|
(170,445) |
|
|
(47,773) |
|
| Effect of exchange rate fluctuations on cash |
(1,621) |
|
|
(1,039) |
|
|
(331) |
|
|
4,388 |
|
| Net increase in cash and cash equivalents |
44,552 |
|
|
26,707 |
|
|
29,849 |
|
|
8,862 |
|
| Cash and cash equivalents, including settlement deposits, beginning of period |
224,118 |
|
|
196,827 |
|
|
238,821 |
|
|
214,672 |
|
| Cash and cash equivalents, including settlement deposits, end of period |
$ |
268,670 |
|
|
$ |
223,534 |
|
|
$ |
268,670 |
|
|
$ |
223,534 |
|
| Reconciliation of cash and cash equivalents to the Consolidated Balance Sheets |
|
|
|
|
|
|
|
| Cash and cash equivalents |
$ |
177,860 |
|
|
$ |
139,520 |
|
|
$ |
177,860 |
|
|
$ |
139,520 |
|
| Settlement deposits |
90,810 |
|
|
84,014 |
|
|
90,810 |
|
|
84,014 |
|
| Total cash and cash equivalents |
$ |
268,670 |
|
|
$ |
223,534 |
|
|
$ |
268,670 |
|
|
$ |
223,534 |
|
|
|
|
|
|
|
|
|
|
|
|
|
|
|
|
|
|
|
|
|
|
|
|
|
|
Three Months Ended
September 30, |
|
Nine Months Ended
September 30, |
| Adjusted EBITDA (millions) |
2024 |
|
2023 |
|
2024 |
|
2023 |
| Net income (loss) |
$ |
81.4 |
|
|
$ |
37.9 |
|
|
$ |
104.6 |
|
|
$ |
(1.1) |
|
| Plus: |
|
|
|
|
|
|
|
| Income tax expense (benefit) |
25.9 |
|
|
8.7 |
|
|
35.6 |
|
|
(5.4) |
|
| Net interest expense |
14.5 |
|
|
16.4 |
|
|
44.0 |
|
|
48.2 |
|
| Net other (income) expense |
0.8 |
|
|
(1.1) |
|
|
1.7 |
|
|
6.4 |
|
| Depreciation expense |
7.8 |
|
|
5.6 |
|
|
15.0 |
|
|
18.7 |
|
| Amortization expense |
23.7 |
|
|
24.8 |
|
|
71.7 |
|
|
74.7 |
|
| Non-cash stock-based compensation expense |
11.3 |
|
|
6.8 |
|
|
30.2 |
|
|
17.5 |
|
| Adjusted EBITDA before significant transaction-related expenses |
$ |
165.4 |
|
|
$ |
99.1 |
|
|
$ |
302.8 |
|
|
$ |
159.0 |
|
| Significant transaction-related expenses: |
|
|
|
|
|
|
|
| Cost reduction strategies |
1.2 |
|
|
3.8 |
|
|
4.3 |
|
|
19.7 |
|
| European datacenter migration |
— |
|
|
0.4 |
|
|
— |
|
|
2.6 |
|
|
|
|
|
|
|
|
|
| Other |
0.3 |
|
|
0.1 |
|
|
1.0 |
|
|
4.4 |
|
| Adjusted EBITDA |
$ |
166.9 |
|
|
$ |
103.4 |
|
|
$ |
308.1 |
|
|
$ |
185.7 |
|
| Revenue, net of interchange: |
|
|
|
|
|
|
|
| Revenue |
$ |
451.8 |
|
|
$ |
363.0 |
|
|
$ |
1,141.3 |
|
|
$ |
976.0 |
|
| Interchange |
117.1 |
|
|
102.7 |
|
|
353.6 |
|
|
315.0 |
|
| Revenue, net of interchange |
$ |
334.7 |
|
|
$ |
260.3 |
|
|
$ |
787.7 |
|
|
$ |
661.0 |
|
|
|
|
|
|
|
|
|
| Net Adjusted EBITDA Margin |
50 |
% |
|
40 |
% |
|
39 |
% |
|
28 |
% |
|
|
|
|
|
|
|
|
|
|
|
|
|
|
|
|
|
|
|
|
|
|
|
|
|
Three Months Ended
September 30, |
|
Nine Months Ended
September 30, |
| Segment Information (millions) |
2024 |
|
2023 |
|
2024 |
|
2023 |
| Revenue |
|
|
|
|
|
|
|
| Banks |
$ |
222.0 |
|
|
$ |
155.7 |
|
|
$ |
471.1 |
|
|
$ |
361.2 |
|
| Merchants |
50.2 |
|
|
36.3 |
|
|
123.9 |
|
|
107.6 |
|
| Billers |
179.6 |
|
|
171.0 |
|
|
546.3 |
|
|
507.2 |
|
| Total |
$ |
451.8 |
|
|
$ |
363.0 |
|
|
$ |
1,141.3 |
|
|
$ |
976.0 |
|
| Recurring Revenue |
|
|
|
|
|
|
|
| Banks |
$ |
55.6 |
|
|
$ |
58.2 |
|
|
$ |
167.1 |
|
|
$ |
171.2 |
|
| Merchants |
35.7 |
|
|
34.1 |
|
|
105.1 |
|
|
101.0 |
|
| Billers |
179.6 |
|
|
171.0 |
|
|
546.3 |
|
|
507.2 |
|
| Total |
$ |
270.9 |
|
|
$ |
263.3 |
|
|
$ |
818.5 |
|
|
$ |
779.4 |
|
| Segment Adjusted EBITDA |
|
|
|
|
|
|
|
| Banks |
$ |
153.9 |
|
|
$ |
91.0 |
|
|
$ |
274.8 |
|
|
$ |
167.3 |
|
| Merchants |
26.7 |
|
|
10.3 |
|
|
52.7 |
|
|
26.8 |
|
| Billers |
30.9 |
|
|
39.2 |
|
|
99.1 |
|
|
100.1 |
|
|
|
|
|
|
|
|
|
|
|
|
|
|
|
|
|
|
|
|
|
|
|
|
|
|
|
|
|
|
|
|
|
Note: Amounts may not recalculate due to rounding.
|
|
|
|
|
|
|
|
|
|
|
|
|
|
|
|
|
|
|
|
|
|
|
|
|
Three Months Ended September 30, |
|
2024 |
|
2023 |
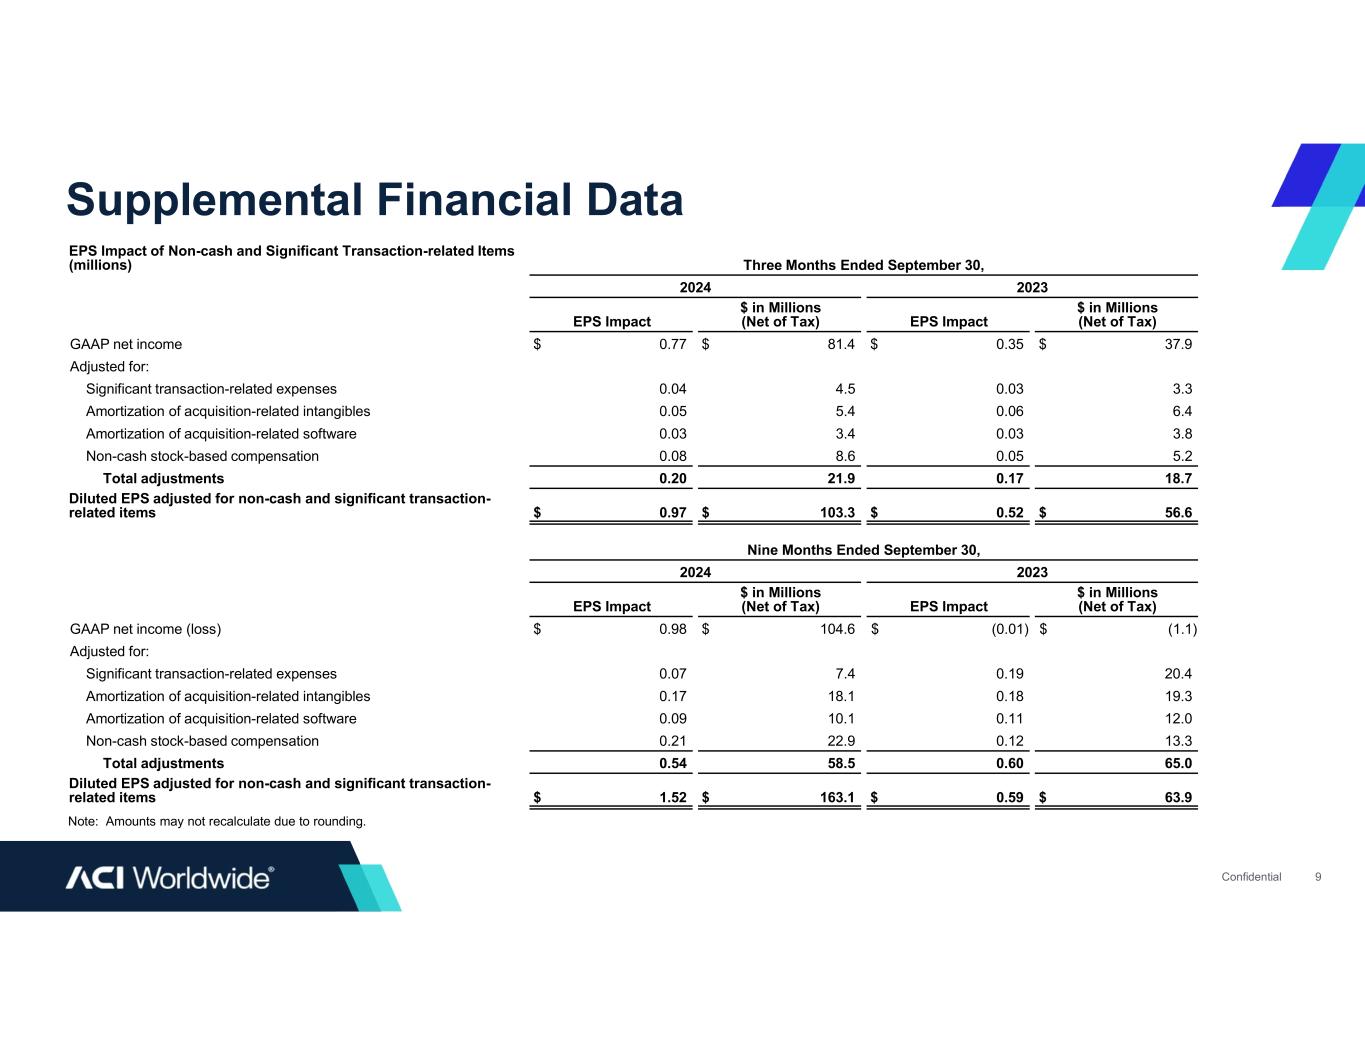
| EPS Impact of Non-cash and Significant Transaction-related Items (millions) |
EPS Impact |
|
$ in Millions
(Net of Tax) |
|
EPS Impact |
|
$ in Millions
(Net of Tax) |
| GAAP net income |
$ |
0.77 |
|
|
$ |
81.4 |
|
|
$ |
0.35 |
|
|
$ |
37.9 |
|
| Adjusted for: |
|
|
|
|
|
|
|
|
|
|
|
|
|
|
|
| Significant transaction-related expenses |
0.04 |
|
|
4.5 |
|
|
0.03 |
|
|
3.3 |
|
| Amortization of acquisition-related intangibles |
0.05 |
|
|
5.4 |
|
|
0.06 |
|
|
6.4 |
|
| Amortization of acquisition-related software |
0.03 |
|
|
3.4 |
|
|
0.03 |
|
|
3.8 |
|
| Non-cash stock-based compensation |
0.08 |
|
|
8.6 |
|
|
0.05 |
|
|
5.2 |
|
| Total adjustments |
$ |
0.20 |
|
|
$ |
21.9 |
|
|
$ |
0.17 |
|
|
$ |
18.7 |
|
| Diluted EPS adjusted for non-cash and significant transaction-related items |
$ |
0.97 |
|
|
$ |
103.3 |
|
|
$ |
0.52 |
|
|
$ |
56.6 |
|
|
|
|
|
|
|
|
|
|
|
|
|
|
|
|
|
|
|
|
|
|
|
|
|
|
|
|
|
|
|
|
|
|
|
|
|
|
|
|
|
|
|
|
|
|
|
|
|
|
|
|
|
|
|
|
|
|
|
|
|
|
|
|
|
|
|
|
|
|
|
|
|
|
|
|
|
|
|
|
|
|
|
|
|
|
|
|
|
|
|
|
|
|
|
|
|
|
|
|
|
|
|
|
|
|
|
|
|
|
|
|
|
|
|
|
|
|
|
|
Nine Months Ended September 30, |
|
2024 |
|
2023 |
| EPS Impact of Non-cash and Significant Transaction-related Items (millions) |
EPS Impact |
|
$ in Millions
(Net of Tax) |
|
EPS Impact |
|
$ in Millions
(Net of Tax) |
| GAAP net income (loss) |
$ |
0.98 |
|
|
$ |
104.6 |
|
|
$ |
(0.01) |
|
|
$ |
(1.1) |
|
| Adjusted for: |
|
|
|
|
|
|
|
|
|
|
|
|
|
|
|
| Significant transaction-related expenses |
0.07 |
|
|
7.4 |
|
|
0.19 |
|
|
20.4 |
|
| Amortization of acquisition-related intangibles |
0.17 |
|
|
18.1 |
|
|
0.18 |
|
|
19.3 |
|
| Amortization of acquisition-related software |
0.09 |
|
|
10.1 |
|
|
0.11 |
|
|
12.0 |
|
| Non-cash stock-based compensation |
0.21 |
|
|
22.9 |
|
|
0.12 |
|
|
13.3 |
|
| Total adjustments |
$ |
0.54 |
|
|
$ |
58.5 |
|
|
$ |
0.60 |
|
|
$ |
65.0 |
|
| Diluted EPS adjusted for non-cash and significant transaction-related items |
$ |
1.52 |
|
|
$ |
163.1 |
|
|
$ |
0.59 |
|
|
$ |
63.9 |
|
|
|
|
|
|
|
|
|
|
|
|
|
|
|
|
|
|
|
|
|
|
|
|
|
|
|
|
|
|
|
|
|
|
|
|
|
|
|
|
|
|
|
|
|
|
|
|
|
|
|
|
|
|
|
|
|
|
|
|
|
|
|
|
|
|
|
|
|
|
|
|
|
|
|
|
|
|
|
|
|
|
|
|
|
|
|
|
|
|
|
|
|
|
|
|
|
|
|
|
|
|
|
|
|
|
|
|
|
|
|
|
|
|
|
|
|
|
|
|
Three Months Ended
September 30, |
|
Nine Months Ended
September 30, |
| Recurring Revenue (millions) |
2024 |
|
2023 |
|
2024 |
|
2023 |
| SaaS and PaaS fees |
$ |
223.4 |
|
|
$ |
211.4 |
|
|
$ |
674.5 |
|
|
$ |
626.0 |
|
| Maintenance fees |
47.5 |
|
|
51.9 |
|
|
144.0 |
|
|
153.4 |
|
| Recurring Revenue |
$ |
270.9 |
|
|
$ |
263.3 |
|
|
$ |
818.5 |
|
|
$ |
779.4 |
|
|
|
|
|
|
|
|
|
|
|
|
|
|
|
|
|
|
|
|
|
|
|
|
|
| New Bookings (millions) |
Three Months Ended
September 30, |
|
TTM Ended September 30, |
|
2024 |
|
2023 |
|
2024 |
|
2023 |
| Annual recurring revenue (ARR) bookings |
$ |
11.1 |
|
|
$ |
20.5 |
|
|
$ |
59.3 |
|
|
$ |
84.9 |
|
| License and services bookings |
67.0 |
|
|
54.1 |
|
|
281.5 |
|
|
224.5 |
|
Note: Amounts may not recalculate due to rounding.


