
Title of each class |
Trading Symbol(s) |
Name of each exchange on which registered |
American Depositary Shares |
NOK |
New York Stock Exchange |
Shares |
New York Stock Exchange(1) |
Indicate by check mark if the registrant is a well-known seasoned issuer, as defined in Rule 405 of the Securities Act. |
Yes ☒ |
No ☐ |
If this report is an annual or transition report, indicate by check mark if the registrant is not required to file reports pursuant to Section 13 or 15(d) of the Exchange Act. |
Yes ☐ |
No ☒ |
Indicate by check mark whether the registrant: (1) has filed all reports required to be filed by Section 13 or 15(d) of the Exchange Act during the preceding 12 months (or for
such shorter period that the registrant was required to file such reports), and (2) has been subject to such filing requirements for the past 90 days.
|
Yes ☒ |
No ☐ |
Indicate by check mark whether the registrant has submitted electronically every Interactive Data File required to be submitted pursuant to Rule 405 of Regulation S-T
(§232.405 of this chapter) during the preceding 12 months (or for such shorter period that the registrant was required to submit such files).
|
Yes ☒ |
No ☐ |
Indicate by check mark whether the registrant is a large accelerated filer, an accelerated filer, a non-accelerated filer, a smaller reporting company, or an emerging growth
company. See the definitions of “large accelerated filer,” “accelerated filer,” “smaller reporting company” or “emerging growth company” in Rule 12b-2 of the Exchange Act.
(Check one):
|
Large accelerated filer ☒ |
Accelerated filer ☐ |
Non-accelerated filer ☐ |
Smaller reporting company ☐ |
Emerging growth company ☐ |
Indicate by check mark whether the registrant has filed a report on and attestation to its management’s assessment of the effectiveness of its internal control over financial reporting
under Section 404(b) of the Sarbanes Oxley Act (15 U.S.C. 7262(b)) by the registered public accounting firm that prepared or issued its audit report.
|
☒ |
If securities are registered pursuant to Section 12(b) of the Act, indicate by check mark whether the financial statements of the registrant included in the filing reflect the correction of
an error to previously issued financial statements.
|
☐ |
Indicate by check mark whether any of those error corrections are restatements that required a recovery analysis of incentive-based compensation received by any of the registrant’s
executive officers during the relevant recovery period pursuant to §240.10D-1(b).
|
☐ |
Indicate by check mark which basis of accounting the registrant has used to prepare the financial statements included in this filing: |
U.S. GAAP ☐ |
|
International Financial Reporting Standards as issued by the International Accounting Standards Board ☒ |
|
Other ☐ |
If “Other” has been checked in response to the previous question, indicate by check mark which financial statement item the registrant has elected to follow. |
Item 17 ☐ |
Item 18 ☐ |
If this is an annual report, indicate by check mark whether the registrant is a shell company (as defined in Rule 12b-2 of the Exchange Act). |
Yes ☐ |
No ☒ |
Form 20-F
Item Number
|
Form 20-F Heading |
Section in Document |
|
ITEM |
1 |
IDENTITY OF DIRECTORS, SENIOR
MANAGEMENT AND ADVISERS
|
N/A |
ITEM |
2 |
OFFER STATISTICS AND EXPECTED
TIMETABLE
|
N/A |
ITEM |
3 |
KEY INFORMATION |
|
3A |
[Reserved] |
||
3B |
Capitalization and Indebtedness |
N/A |
|
3C |
Reasons for the Offer and Use of Proceeds |
N/A |
|
3D |
Risk Factors |
Operating and financial review and prospects—Risk factors |
|
ITEM |
4 |
INFORMATION ON THE COMPANY |
|
4A |
History and Development of the Company |
Cover page; Business overview; Introduction and use of certain terms; Business overview—Our history; Operating and financial review and prospects—Liquidity and capital
resources; General Facts on Nokia—Alternative performance measures; Operating and financial review and prospects—Significant subsequent events; Other information—
Investor information
|
|
4B |
Business Overview |
Business overview—Nokia in 2023; Business overview—Our strategy; Business Overview—Our business groups; Financial statements—Notes to the consolidated financial
statements—Note 2.2. Segment information; General facts on Nokia—Government regulation
|
|
4C |
Organizational Structure |
Business overview—Nokia in 2023; Financial statements—Notes to the consolidated financial statements—Note 2.2. Segment information; Financial statements—Notes to
the consolidated financial statements—Note 6.2. Principal Group companies; Financial statements—Notes to the consolidated financial statements—Note 6.3. Significant
partly-owned subsidiaries
|
|
4D |
Property, Plants and Equipment |
Financial statements—Notes to the consolidated financial statements—Note 4.2. Property, plant and equipment; Financial statements—Notes to the consolidated financial
statements—Note 4.3. Leases; Business overview—Supply chain, sourcing and manufacturing
|
|
4A |
UNRESOLVED STAFF COMMENTS |
None |
|
ITEM |
5 |
OPERATING AND FINANCIAL REVIEW AND
PROSPECTS
|
|
5A |
Operating Results |
Business overview—Our strategy; General facts on Nokia—Government regulation; Financial statements—Notes to the consolidated financial statements—Section 2. Results
for the year; Financial statements—Notes to the consolidated financial statements—Note 5.4. Financial risk management; Operating and financial review and prospects—
Operating and financial review
|
|
5B |
Liquidity and Capital Resources |
Operating and financial review and prospects—Liquidity and capital resources; Financial statements—Notes to the consolidated financial statements—Note 5.2. Financial
assets and liabilities; Financial statements—Notes to the consolidated financial statements—Note 5.3. Derivative and firm commitment assets and liabilities; Financial
statements—Notes to the consolidated financial statements—Note 6.1. Commitments, contingencies and legal proceedings; Financial statements—Notes to the
consolidated financial statements—Note 5.4. Financial risk management
|
|
5C |
Research and Development, Patents and
Licenses etc.
|
Business overview—Our strategy; Business overview—Nokia Technologies; Operating and financial review and prospects—Results of operations; Operating and financial
review and prospects—Results of segments
|
|
5D |
Trend Information |
Business overview—Nokia in 2023; Business overview—Our strategy |
|
5E |
Critical Accounting Estimates |
N/A |
|
ITEM |
6 |
DIRECTORS, SENIOR MANAGEMENT AND
EMPLOYEES
|
|
6A |
Directors and senior management |
Corporate governance—Corporate Governance Statement |
|
6B |
Compensation |
Corporate governance—Compensation; Financial statements—Notes to the consolidated financial statements—Note 6.4. Related party transactions; Corporate Governance
—Remuneration; Financial Statements—Notes to the consolidated financial statements—Note 3.2. Remuneration of key management
|
|
6C |
Board Practices |
Corporate governance—Corporate governance statement; Corporate governance—Remuneration—Remuneration governance |
|
6D |
Employees |
Operating and financial review and prospects—Sustainability and corporate responsibility |
|
6E |
Share Ownership |
Business Overview—Nokia in 2023; Corporate governance—Remuneration—Remuneration Report 2023; Corporate governance—Corporate governance statement; Financial
statements—Notes to the consolidated financial statements—Note 3.3. Share-based payments
|
|
Form 20-F
Item Number
|
Form 20-F Heading |
Section in Document |
|
6F |
Disclosure of a registrant’s action to
recover erroneously awarded
compensation
|
N/A |
|
ITEM |
7 |
MAJOR SHAREHOLDERS AND RELATED
PARTY TRANSACTIONS
|
|
7A |
Major Shareholders |
Operating and financial review and prospects—Shares and shareholders |
|
7B |
Related Party Transactions |
Financial statements—Notes to the consolidated financial statements—Note 6.4. Related party transactions |
|
7C |
Interests of Experts and Counsel |
N/A |
|
ITEM |
8 |
FINANCIAL INFORMATION |
|
8A |
Consolidated Statements and Other
Financial Information
|
Financial statements; Reports of independent registered public accounting firm; Operating and financial review and prospects—Shares and shareholders—Dividend and
share buybacks; Financial statements—Notes to the consolidated financial statements—Note 6.1. Commitments, contingencies and legal proceedings
|
|
8B |
Significant Changes |
Operating and financial review and prospects—Significant subsequent events; Financial statements—Notes to the consolidated financial statements—Notes 6.5. Subsequent
events
|
|
ITEM |
9 |
THE OFFER AND LISTING |
|
9A |
Offer and Listing Details |
Operating and financial review and prospects—Shares and shareholders; Other information—Investor information—Stock exchanges |
|
9B |
Plan of Distribution |
N/A |
|
9C |
Markets |
Operating and financial review and prospects—Shares and shareholders; Financial statements—Notes to the consolidated financial statements—Note 1.1. Corporate
information; Investor information; Other information—Investor information—Stock exchanges
|
|
9D |
Selling Shareholders |
N/A |
|
9E |
Dilution |
N/A |
|
9F |
Expenses of the Issue |
N/A |
|
ITEM |
10 |
ADDITIONAL INFORMATION |
|
10A |
Share capital |
N/A |
|
10B |
Memorandum and Articles of Association |
Operating and financial review and prospects—Articles of Association; Other information—Exhibits |
|
10C |
Material Contracts |
N/A |
|
10D |
Exchange Controls |
General facts on Nokia—Controls and procedures—Exchange controls |
|
10E |
Taxation |
General facts on Nokia—Taxation |
|
10F |
Dividends and Paying Agents |
N/A |
|
10G |
Statement by Experts |
N/A |
|
10H |
Documents on Display |
Other information—Investor information—Documents on display |
|
10I |
Subsidiary Information |
N/A |
|
ITEM |
11 |
QUANTITATIVE AND QUALITATIVE
DISCLOSURES ABOUT MARKET RISK
|
Business overview—Our strategy; Operating and financial review and prospects—Risk factors—Financial and tax-related uncertainties; Financial statements—Notes to the
consolidated financial statements—Note 5.4. Financial risk management; Financial statements—Notes to the consolidated financial statements—Note 4.5. Trade receivables
and other customer-related balances
|
ITEM |
12 |
DESCRIPTION OF SECURITIES OTHER THAN
EQUITY SECURITIES
|
|
12A |
Debt Securities |
N/A |
|
12B |
Warrants and Rights |
N/A |
|
12C |
Other Securities |
N/A |
|
12D |
American Depositary Shares |
General facts on Nokia—American Depositary Shares; Introduction and use of certain terms |
|
ITEM |
13 |
DEFAULTS, DIVIDEND ARREARAGES AND
DELINQUENCIES
|
None |
Form 20-F
Item Number
|
Form 20-F Heading |
Section in Document |
|
ITEM |
14 |
MATERIAL MODIFICATIONS TO THE RIGHTS
OF SECURITY HOLDERS AND USE OF
PROCEEDS
|
None |
ITEM |
15 |
CONTROLS AND PROCEDURES |
Corporate governance—Corporate governance statement—Risk management, internal control and internal audit functions at Nokia; General facts on Nokia—Controls and
procedures
|
ITEM |
16 |
[Reserved] |
|
16A |
AUDIT COMMITTEE FINANCIAL EXPERT |
Corporate governance—Corporate governance statement—Board of Directors—Committees of the Board of Directors |
|
16B |
CODE OF ETHICS |
Corporate governance—Corporate governance statement—Regulatory Framework; Operating and financial review and prospects—Sustainability and corporate
responsibility; Other information—Exhibits
|
|
16C |
PRINCIPAL ACCOUNTANT FEES AND
SERVICES
|
Corporate governance—Corporate governance statement—Auditor fees and services; Corporate governance—Corporate governance statement—Audit Committee pre-
approval policies and procedures
|
|
16D |
EXEMPTIONS FROM THE LISTING
STANDARDS FOR AUDIT COMMITTEES
|
None |
|
16E |
PURCHASES OF EQUITY SECURITIES BY THE
ISSUER AND AFFILIATED PURCHASERS
|
Operating and financial review and prospects—Shares and shareholders—Purchases of equity securities by the Company and affiliated purchasers
Corporate Governance—Compensation
|
|
16F |
CHANGE IN REGISTRANT’S CERTIFYING
ACCOUNTANT
|
N/A |
|
16G |
CORPORATE GOVERNANCE |
Corporate governance—Corporate governance statement—Regulatory framework |
|
16H |
MINE SAFETY DISCLOSURE |
None |
|
16I |
DISCLOSURE REGARDING FOREIGN
JURISDICTIONS THAT PREVENT
INSPECTIONS
|
N/A |
|
16J |
INSIDER TRADING POLICIES |
N/A |
|
16K |
CYBERSECURITY |
Corporate governance—Corporate Governance Statement—Risk management, internal control and internal audit functions at Nokia; Operating and financial review and
prospects—Risk factors—Risks impacting our competitiveness
|
|
ITEM |
17 |
FINANCIAL STATEMENTS |
Financial statements |
ITEM |
18 |
FINANCIAL STATEMENTS |
Financial statements |
ITEM |
19 |
EXHIBITS |
Other information—Exhibits |

Business
overview
|
Corporate
governance
|
Operating and financial
review and prospects
|
General facts
on Nokia
|
Financial
statements
|
Other
information
|
2 |
|||||||

Business
overview
|
Corporate
governance
|
Operating and financial
review and prospects
|
General facts
on Nokia
|
Financial
statements
|
Other
information
|
3 |
|||||||
Dividend proposed in respect
of 2023(2)
|
Share buyback program announced in
January 2024 to return up to
|
EUR 0.13 |
EUR 600m |
per share |
over 2 years |
For the year ended 31 December |
|||
EURm |
2023 |
2022 |
2021 |
Net sales |
22 258 |
24 911 |
22 202 |
Gross profit |
8 687 |
10 222 |
8 834 |
Gross margin |
39.0% |
41.0% |
39.8% |
Operating profit |
1 688 |
2 318 |
2 158 |
Operating margin |
7.6% |
9.3% |
9.7% |
Profit for the year(1) |
674 |
4 210 |
1 654 |
EUR |
|||
Earnings per share, diluted(1) |
0.12 |
0.74 |
0.29 |
Proposed dividend per share(2) |
0.13 |
0.12 |
0.08 |
At 31 December |
|||
EURm |
2023 |
2022 |
2021 |
Net cash and interest-bearing financial investments(3) |
4 323 |
4 767 |
4 615 |
Business
overview
|
Corporate
governance
|
Operating and financial
review and prospects
|
General facts
on Nokia
|
Financial
statements
|
Other
information
|
4 |
|||||||
Business
overview
|
Corporate
governance
|
Operating and financial
review and prospects
|
General facts
on Nokia
|
Financial
statements
|
Other
information
|
5 |
|||||||
Share of suppliers achieving satisfactory
sustainability score(1) from supplier performance
evaluation(2)
%
|
||
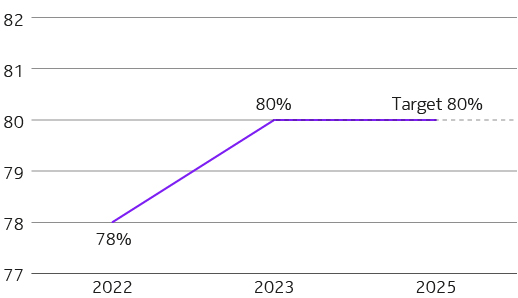 |
(1)Based on aggregated
weighted share.
(2)Based on Corporate
Responsibility onsite
audit programs,
EcoVadis, CDP,
Conflict minerals.
|
|
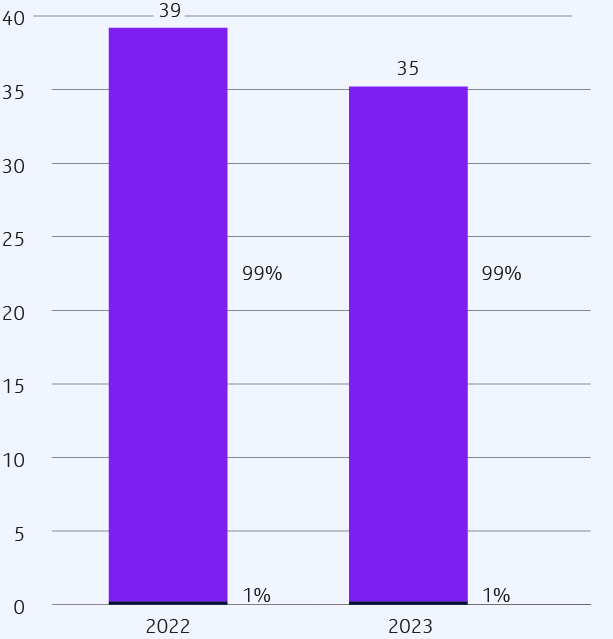
Share of CO2e reduction achieved by final assembly
suppliers towards zero emissions target(1)
Million metric tons CO2e / %
|
||
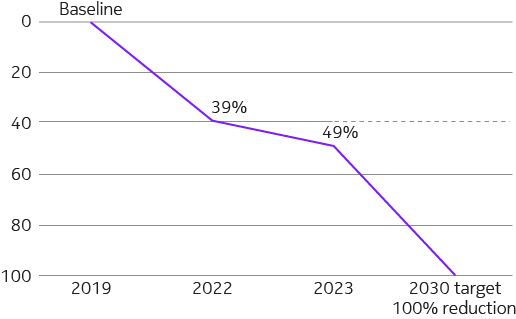 |
(1)Against 2019 baseline. |
Business
overview
|
Corporate
governance
|
Operating and financial
review and prospects
|
General facts
on Nokia
|
Financial
statements
|
Other
information
|
6 |
|||||||


Gender split at the end of 2023 |
||
18 900
Female
|
62 100
Male
|
3 500
Blank(1)
|
(1)Detail on employee level not collected or is blank | ||
Business
overview
|
Corporate
governance
|
Operating and financial
review and prospects
|
General facts
on Nokia
|
Financial
statements
|
Other
information
|
7 |
|||||||
ESG Rankings
and ratings
|
Score
(range: top/bottom)
|
Latest result |
||
 |
83.03% (industry
average: 72.36%)
|
2023 Jan |
||
Clean 200 |
82nd out of 200 |
2023 Feb |
||
 |
24th out of 200 |
2023 Mar |
||
 |
Top 1% – Platinum |
2023 Mar |
||
 |
Recognized as one of the 2023 World’s
Most Ethical Companies ®
|
2023 Mar |
||
 |
ESG Score 4.7/5.0 |
2023 Jun |
||
 |
AAA (AAA/CCC) |
2023 Aug |
||
 |
Prime, B- (A+/D-) |
2023 Oct |
||
 |
Ambassador status |
2023 Oct |
||
 |
11.2 (low risk of experiencing material
financial impacts from ESG factors).
Jan 2024: Sustainalytics’ 2024 Top-Rated
ESG Companies List(3)
|
2024 Jan |
||
 |
A- (A/D-) |
2024 Feb |
||
(3)Refers to 2023 result, received in January 2024. | ||||


Network
Infrastructure
|
||||
Network Infrastructure provides the
equipment, software and services that enable
all of the physical links that power networks.
Its product offering includes IP routing and
switching products, and the equipment to
power fiber networks along with subsea and
terrestrial optical networks. Its customers
include communications service providers,
webscales and hyperscalers, digital industries
and governments.
|
||||
Segment net sales
(EURm)
|
Segment operating
margin (%)
|
|||
-11% |
‘+’90 bps |
|||
Mobile
Networks
|
||||
Mobile Networks creates products and
services covering all mobile technology
generations. Its portfolio includes products
for radio access networks (RAN) and
microwave radio (MWR) links for transport
networks, solutions for network management,
as well as network planning, optimization,
network deployment and technical
support services.
|
||||
Segment net sales
(EURm)
|
Segment operating
margin (%)
|
|||
-8% |
‘-’140 bps |
|||
Cloud and
Network Services
|
||||
Cloud and Network Services enables
communications service providers (CSPs)
and enterprises to deploy and monetize 5G,
cloud-native software and as-a-service
delivery models.
|
||||
Segment net sales
(EURm)
|
Segment operating
margin (%)
|
|||
-4% |
‘+’260 bps |
|||
Nokia
Technologies
|
||||
Nokia Technologies is responsible for
managing Nokia’s patent portfolio and
monetizing Nokia’s intellectual property
including patents, technologies and the
Nokia brand.
|
||||
Segment net sales
(EURm)
|
Segment operating
margin (%)
|
|||
-32% |
–810 bps |
|||
Business
overview
|
Corporate
governance
|
Operating and financial
review and prospects
|
General facts
on Nokia
|
Financial
statements
|
Other
information
|
8 |
|||||||
READ MORE ON PAGES 23 TO 24 |
→ |
READ MORE ON PAGES 25 TO 26 |
→ |
READ MORE ON PAGES 27 TO 28 |
→ |
READ MORE ON PAGES 29 TO 30 |
→ |
Business
overview
|
Corporate
governance
|
Operating and financial
review and prospects
|
General facts
on Nokia
|
Financial
statements
|
Other
information
|
9 |
|||||||

Business
overview
|
Corporate
governance
|
Operating and financial
review and prospects
|
General facts
on Nokia
|
Financial
statements
|
Other
information
|
10 |
|||||||
Business
overview
|
Corporate
governance
|
Operating and financial
review and prospects
|
General facts
on Nokia
|
Financial
statements
|
Other
information
|
11 |
|||||||

Business
overview
|
Corporate
governance
|
Operating and financial
review and prospects
|
General facts
on Nokia
|
Financial
statements
|
Other
information
|
12 |
|||||||

1 |
Communications service
providers (CSPs)
|
2 |
Enterprises |
Business
overview
|
Corporate
governance
|
Operating and financial
review and prospects
|
General facts
on Nokia
|
Financial
statements
|
Other
information
|
13 |
|||||||
3 |
Licensees |
1 |
2 |
3 |
|||||||||||
CSPs |
Enterprise |
Licensees |
|||||||||||
Focus on connectivity
strengths
and using cost optimization
via automation and asset
carve outs to fund both
fiber and 5G investments
Favoring cloud
strengths
in vendor and partner
ecosystem
Network monetization
targeting enterprise and
edge use cases
|
Enterprise verticals
Digitalization and automation
of operations in industrial segments
Transition to software-centric
operations and adoption of industrial operational
technology (OT) edge and on-premise clouds
Energy and manufacturing
as early adopters of private wireless and
automation solutions
Federal, state government
and cities network modernization acceleration
|
Patent portfolio
with long lifetime
the vast majority of Nokia’s
patents still in force in ten
years’ time
New inventions
every year
In 2023, Nokia filed patent
applications on more than
2 300 new inventions,
enabling 5G networks,
connected 5G devices
and more
Annual number of
patent filings expected
to grow
due to continued
investments in R&D and
standardization
Entire industries
powered by our
fundamental cellular
and multimedia
inventions
providing us with the
opportunity to expand our
licensing coverage; we are
making good progress in
our growth areas of
consumer electronics,
automotive and IoT
|
|||||||||||
Webscalers
Edge computing
as a growth engine – industrial automation
workloads across on-premise, edge, public cloud
Partnering with CSPs
to co-locate edge stacks and building an
ecosystem for low-latency apps
Targeting telco and network
workloads to run on their cloud infrastructure
Collaborating with CSPs
in the transformation of network operations
|
|||||||||||||
Business
overview
|
Corporate
governance
|
Operating and financial
review and prospects
|
General facts
on Nokia
|
Financial
statements
|
Other
information
|
14 |
|||||||
Grow CSP business
faster than market
|
1 |
Expand the share of
enterprise in our business
|
2 |
Actively manage
our portfolio
|
3 |
|||||
CSPs will continue to be our biggest
customer segment. We will leverage our
strong technological position, investment
in technology leadership and emerging
opportunities to grow our share in key
markets, with geopolitical considerations
supporting this ambition.
|
Enterprise verticals and webscalers are
deploying campus networks, wide area
private wireless networks, enterprise
physical networks and data centers at an
accelerated rate to digitalize their operations.
Being a technology leader in all these
domains, we pursue these opportunities
to grow our enterprise business.
|
Maintaining our portfolio segments at
number one or number two position,
through several routes including active
portfolio management, is critical for a
profitable and sustainable business.
There may be cases where a leadership
position is not possible and for these
cases, we will consider alternatives.
|
||||||||
Secure business longevity
in Nokia Technologies
|
4 |
Build new
business models
|
5 |
Develop ESG into a
competitive advantage
|
6 |
|||||
We are investing to ensure the sustained
competitiveness of our patent portfolio.
We will continue to pursue opportunities
from sectors outside mobile devices, such
as automotive, consumer electronics, IoT
and video services.
|
To broaden our customer base and
change our margin profile, we see potential
in new platform business models within
the broader ecosystem. We engage with
service providers, webscalers, industrial
giants and emerging players like app
developers and start-ups, to drive the
creation of new products, services, and
solutions, and to explore new business
models including Cloud RAN, Network as
Code and as-a-Service.
|
ESG is increasingly important for
customers, investors, regulators, partners
and Nokia employees. There is space in our
industry to become the ‘trusted provider’
and Nokia aims to claim this position.
Our ESG strategy lays out how we will do
this and our specific areas of focus.
|
||||||||
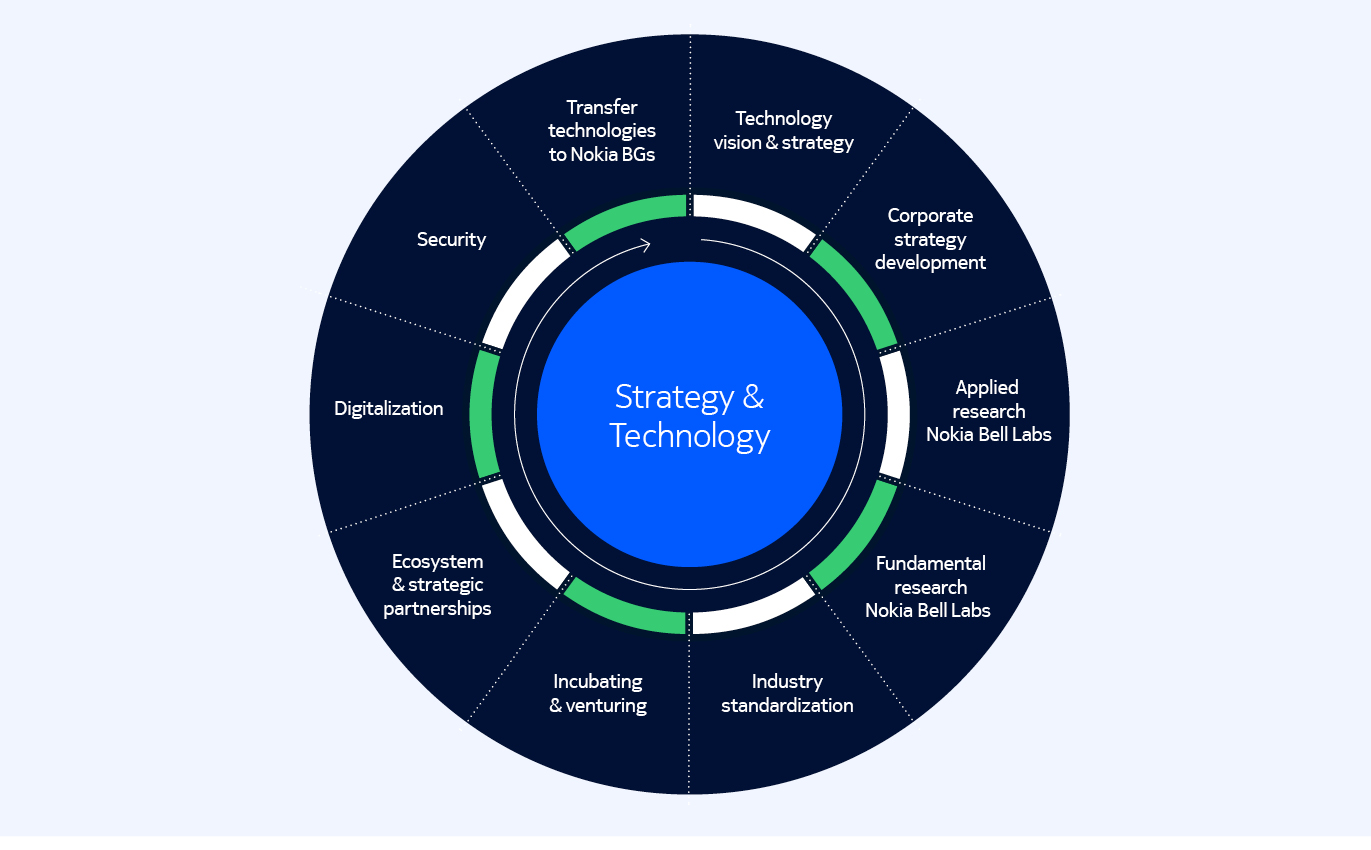
The six pillars are underpinned by four enablers: | |||||||
Develop future-
fit-talent
|
Invest in long-term
research
|
Digitalize our own
operations
|
Refresh
our brand
|
||||
We have launched and are
executing a new people strategy
focused on growth, skills and
development. We build the right
future skills for our employees in
the technical domains identified
in our technology vision and
strategy, and the commercial
skills to support our expansion
into new domains.
|
Sustained technology leadership
is a key driver of our success:
it requires us to anticipate, shape
and invest in the next technology
waves and breakthroughs. We
continue to invest in long-term
research to ensure a leadership
position in line with our Technology
Vision 2030. We are also deeply
engaged in leading and influencing
standards and developing standard
essential patents.
|
We are increasing the digitalization
of our own operations to lead by
example with a set of ambitious,
company-wide strategic initiatives
to increase the company’s
performance and competitiveness,
focused on efficiency, productivity
and agility in internal operations,
customer experience and R&D.
|
To ensure Nokia is recognized
as a B2B technology innovation
leader, we refreshed our brand
in 2023. Our new visual identity
is emblematic of an energized,
dynamic and modern Nokia.
|
||||
Business
overview
|
Corporate
governance
|
Operating and financial
review and prospects
|
General facts
on Nokia
|
Financial
statements
|
Other
information
|
15 |
|||||||
Business
overview
|
Corporate
governance
|
Operating and financial
review and prospects
|
General facts
on Nokia
|
Financial
statements
|
Other
information
|
16 |
|||||||
Business
overview
|
Corporate
governance
|
Operating and financial
review and prospects
|
General facts
on Nokia
|
Financial
statements
|
Other
information
|
17 |
|||||||
Business
overview
|
Corporate
governance
|
Operating and financial
review and prospects
|
General facts
on Nokia
|
Financial
statements
|
Other
information
|
18 |
|||||||
Business
overview
|
Corporate
governance
|
Operating and financial
review and prospects
|
General facts
on Nokia
|
Financial
statements
|
Other
information
|
19 |
|||||||
Business
overview
|
Corporate
governance
|
Operating and financial
review and prospects
|
General facts
on Nokia
|
Financial
statements
|
Other
information
|
20 |
|||||||
Business
overview
|
Corporate
governance
|
Operating and financial
review and prospects
|
General facts
on Nokia
|
Financial
statements
|
Other
information
|
21 |
|||||||
Business
overview
|
Corporate
governance
|
Operating and financial
review and prospects
|
General facts
on Nokia
|
Financial
statements
|
Other
information
|
22 |
|||||||

Business
overview
|
Corporate
governance
|
Operating and financial
review and prospects
|
General facts
on Nokia
|
Financial
statements
|
Other
information
|
23 |
|||||||

Business
overview
|
Corporate
governance
|
Operating and financial
review and prospects
|
General facts
on Nokia
|
Financial
statements
|
Other
information
|
24 |
|||||||

Business
overview
|
Corporate
governance
|
Operating and financial
review and prospects
|
General facts
on Nokia
|
Financial
statements
|
Other
information
|
25 |
|||||||

Business
overview
|
Corporate
governance
|
Operating and financial
review and prospects
|
General facts
on Nokia
|
Financial
statements
|
Other
information
|
26 |
|||||||

Business
overview
|
Corporate
governance
|
Operating and financial
review and prospects
|
General facts
on Nokia
|
Financial
statements
|
Other
information
|
27 |
|||||||
Business
overview
|
Corporate
governance
|
Operating and financial
review and prospects
|
General facts
on Nokia
|
Financial
statements
|
Other
information
|
28 |
|||||||


Business
overview
|
Corporate
governance
|
Operating and financial
review and prospects
|
General facts
on Nokia
|
Financial
statements
|
Other
information
|
29 |
|||||||
Business
overview
|
Corporate
governance
|
Operating and financial
review and prospects
|
General facts
on Nokia
|
Financial
statements
|
Other
information
|
30 |
|||||||

Business
overview
|
Corporate
governance
|
Operating and financial
review and prospects
|
General facts
on Nokia
|
Financial
statements
|
Other
information
|
31 |
|||||||

Country |
Location and products(1) |
Productive
capacity, net
(m2)(2)
|
China |
Suzhou: radio frequency systems(3) |
13 500 |
Finland |
Oulu: base stations |
10 000 |
France |
Calais: submarine cables |
61 000 |
Germany |
Hannover: radio frequency systems(4) |
23 500 |
India |
Chennai: base stations, radio controllers and transmission systems, fixed networks |
15 500 |
UK |
Greenwich: submarine cables |
11 000 |
Business
overview
|
Corporate
governance
|
Operating and financial
review and prospects
|
General facts
on Nokia
|
Financial
statements
|
Other
information
|
32 |
|||||||

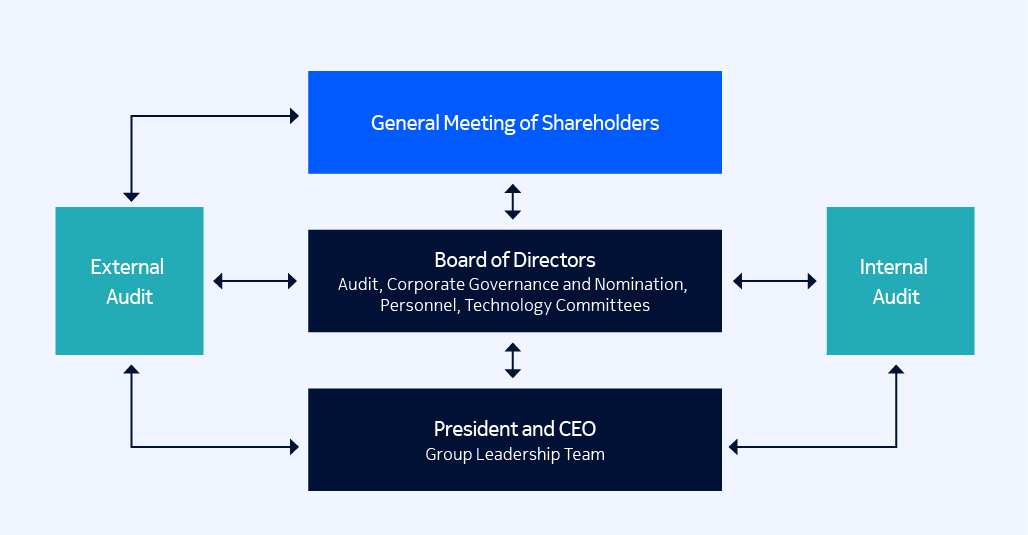
General Meeting of Shareholders |
|
Board of Directors |
|
Group Leadership Team and the President and CEO |
|
Remuneration |
|
Remuneration Report 2023 |
|
Letter from the Chair of the Personnel Committee of the Board |
|
The updated Remuneration Policy for the Board of Directors |
|
The updated Remuneration Policy for the President and CEO |
|
Remuneration of the Nokia Group Leadership Team in 2023 |
|
Business
overview
|
Corporate
governance
|
Operating and financial
review and prospects
|
General facts
on Nokia
|
Financial
statements
|
Other
information
|
33 |
|||||||
Select highlights in our corporate
governance during 2023
■Our 2023 Annual General Meeting saw a record
number of shareholders and votes represented
and strong shareholder support for all the
Board’s proposals.
■We were proud to lead the introduction of the
individual director election method in the Finnish
market and provide our shareholders with the
opportunity to consider each candidate separately
in our 2023 Annual General Meeting.
■We implemented the Executive Officer Clawback
Policy, meeting the NYSE listing standards issued
in response to the US Securities and Exchange
Commission’s 2023 rules implementing the
incentive-based compensation recovery provisions
of the Dodd-Frank Act. In addition, we refreshed
our all-employee Clawback Policy on incentive
compensation.
■We were pleased to host multiple meetings with our
largest shareholders to discuss Nokia’s sustainability,
remuneration and governance approach.
|
||
Business
overview
|
Corporate
governance
|
Operating and financial
review and prospects
|
General facts
on Nokia
|
Financial
statements
|
Other
information
|
34 |
|||||||
Business
overview
|
Corporate
governance
|
Operating and financial
review and prospects
|
General facts
on Nokia
|
Financial
statements
|
Other
information
|
35 |
|||||||
Business
overview
|
Corporate
governance
|
Operating and financial
review and prospects
|
General facts
on Nokia
|
Financial
statements
|
Other
information
|
36 |
|||||||
Gender |
Year of Birth |
Nationality |
Tenure(1) |
Independent of the
company and major
shareholders
|
Shares(2) |
ADSs(2) |
|
Sari Baldauf (Chair) |
Female |
1955 |
Finnish |
5 |
Independent |
290 575 |
|
Søren Skou (Vice Chair) |
Male |
1964 |
Danish |
4 |
Independent |
89 325 |
|
Timo Ahopelto |
Male |
1975 |
Finnish |
0 |
Independent |
21 418 |
|
Elizabeth Crain |
Female |
1964 |
American |
0 |
Independent |
22 771 |
|
Thomas Dannenfeldt |
Male |
1966 |
German |
3 |
Independent |
117 597 |
|
Lisa Hook |
Female |
1958 |
American |
1 |
Independent |
35 626 |
|
Jeanette Horan |
Female |
1955 |
British |
6 |
Independent |
116 476 |
|
Thomas Saueressig |
Male |
1985 |
German |
1 |
Independent |
34 705 |
|
Carla Smits-Nusteling |
Female |
1966 |
Dutch |
7 |
Independent |
135 973 |
|
Kai Öistämö |
Male |
1964 |
Finnish |
1 |
Independent |
35 724 |
|
(1)Terms as Nokia Board member before the Annual General Meeting on 4 April 2023.
(2)The number of shares or ADSs includes shares and ADSs received as director compensation as well as shares and ADSs acquired through other means. Stock options or other
equity awards that are deemed as being beneficially owned under the applicable SEC rules are not included.
| |||||||
Business Exec
role with P&L
responsibility
|
External
boardroom
roles/
Governance
expertise
|
Finance and
accounting
|
Legal /Public
policy/
Compliance
|
Communications
service provider
market segment
|
Enterprise
market
segment
|
Technology |
Cybersecurity |
Environmental/
Social issues
|
|
Current Board
members
|
|||||||||
Sari Baldauf |
✔ |
✔ |
✔ |
✔ |
✔ |
✔ |
|||
Søren Skou |
✔ |
✔ |
✔ |
✔ |
✔ |
||||
Timo Ahopelto |
✔ |
✔ |
✔ |
✔ |
✔ |
||||
Elizabeth Crain |
✔ |
✔ |
✔ |
✔ |
|||||
Thomas Dannenfeldt |
✔ |
✔ |
✔ |
✔ |
✔ |
||||
Lisa Hook |
✔ |
✔ |
✔ |
✔ |
✔ |
✔ |
✔ |
||
Jeanette Horan |
✔ |
✔ |
✔ |
✔ |
✔ |
||||
Thomas Saueressig |
✔ |
✔ |
✔ |
✔ |
✔ |
✔ |
✔ |
||
Carla Smits-Nusteling |
✔ |
✔ |
✔ |
✔ |
|||||
Kai Öistämö |
✔ |
✔ |
✔ |
✔ |
✔ |
✔ |
|||
Proposed new Board
member
|
|||||||||
Michael McNamara |
✔ |
✔ |
✔ |
✔ |
✔ |
Business
overview
|
Corporate
governance
|
Operating and financial
review and prospects
|
General facts
on Nokia
|
Financial
statements
|
Other
information
|
37 |
|||||||
Business
overview
|
Corporate
governance
|
Operating and financial
review and prospects
|
General facts
on Nokia
|
Financial
statements
|
Other
information
|
38 |
|||||||
 |
 |
 |
 |
||||
Chair Sari Baldauf |
Vice Chair Søren Skou |
Timo Ahopelto |
Elizabeth Crain |
||||
b. 1955 |
b. 1964 |
b. 1975 |
b. 1964 |
||||
Business
overview
|
Corporate
governance
|
Operating and financial
review and prospects
|
General facts
on Nokia
|
Financial
statements
|
Other
information
|
39 |
|||||||
 |
 |
 |
||||||
Thomas Dannenfeldt |
Lisa Hook |
Jeanette Horan |
||||||
b. 1966 |
b. 1958 |
b. 1955 |
||||||
Business
overview
|
Corporate
governance
|
Operating and financial
review and prospects
|
General facts
on Nokia
|
Financial
statements
|
Other
information
|
40 |
|||||||
 |
 |
 |
||||||
Thomas Saueressig |
Carla Smits-Nusteling |
Kai Öistämö |
||||||
b. 1985 |
b. 1966 |
b. 1964 |
||||||
Business
overview
|
Corporate
governance
|
Operating and financial
review and prospects
|
General facts
on Nokia
|
Financial
statements
|
Other
information
|
41 |
|||||||
Business
overview
|
Corporate
governance
|
Operating and financial
review and prospects
|
General facts
on Nokia
|
Financial
statements
|
Other
information
|
42 |
|||||||
January |
February/March |
April |
May |
July |
September/October |
November |
|
Board |
–Business and financial
reviews
–Q4 and 2022 financials
–AGM proposals, incl. profit
distribution
–Annual Policy and Charter
review
–Board evaluation
–Review of CEO’s
performance,
remuneration and targets
|
–Annual report and 20-F
–Remuneration Report
2022
|
–Annual General Meeting
(AGM) and appointing
Board Chair, Vice Chair and
Committee members
–Business and financial
reviews
–Strategy
–Q1 financials
|
–Business and financial
reviews
–Strategy
–Geopolitical update
–Product and customer
security update
–Digitalization update
–Ethics & compliance update
–Litigation update
–People strategy and Group
Leadership Team (GLT)
succession approach update
|
–Business and financial
reviews
–Q2 financials
–Strategy
–Annual ESG review
|
–Annual strategy meeting
–Geopraphical market
deep-give
–Business and financial
reviews
–Q3 financials
|
–Business and financial
reviews
–Strategy
–Long-range forecast and
annual target setting
–Key risks review
–GLT succession planning
update
–Investors’ feedback on
governance, remuneration
and sustainability
|
Corporate
Governance and
Nomination
Committee
|
–AGM proposals on Board
composition and
remuneration
–Independence review
–Corporate governance
statement
|
–Committee compositions
–Future Board composition
–AGM shareholder feedback
|
–Planning of Board
composition proposal
|
–Corporate governance and
ESG-related developments
in regulation
–Planning of Board
composition proposal
–Board evaluation approach
|
–Board remuneration review
and benchmarking
–Annual assessment of
director commitments
–Finalizing Board
composition proposal to
the AGM
–Annual Charter review
|
||
Personnel
Committee
|
–Incentive achievements for
2022
–CEO and GLT performance
–Incentive targets and
objectives for 2023
–Long-term Incentive Plan
(LTI) grant proposal for
2023
–Remuneration Report 2022
|
–LTI design for 2024–2026
–Equity plan status
–AGM shareholder feedback
–GLT remuneration
–Culture update
–GLT succession approach
–Clawback Policy related
regulation
|
–Remuneration Policy 2024
structure review
–Executive Clawback Policy
–LTI design for 2024–2026
–Human capital risk review,
including physical safety
–Committee adviser’s
market and benchmarking
update
|
–Incentive Compensation
Clawback Policy
–LTI design for 2024–2026
–Human capital update
–Remuneration Policy 2024
including shareholder
consultation
|
–2024 incentive targets
–LTI Plan 2024–2026
–Investor feedback
–Planning of Remuneration
Report for 2023
–GLT succession planning
–Executive shareholding
assessment
–Annual Charter review
|
||
Audit
Committee
|
–Q4 and 2022 financials
–Auditor reporting
–Ethics and compliance,
internal audit and internal
controls updates
–AGM proposals to the
Board
–Annual Policy review
|
–Annual report and 20-F
for 2022, including
Sustainability reporting
–Auditor reporting
–Internal controls update
|
–Q1 financials
–Auditor reporting
–Ethics and compliance,
internal audit and internal
controls updates
–Treasury update
–IT and service security
update
–Tax update
–Conflict Minerals Report
|
–Q2 financials
–Auditor reporting
–Ethics and compliance,
internal audit and internal
controls updates
–Finance IT and
digitalization
|
–Q3 financials
–Auditor reporting
–Ethics and compliance,
internal audit and internal
controls updates
–ESG disclosure and
reporting developments,
processes and controls
–IT and service security
updates
|
–Treasury update
–Pensions update
–Audit, internal audit and
internal controls updates
–Privacy update
–Annual Charter and Policy
review
|
|
Technology
Committee
|
–Updates on major
innovation and technology
trends
–Review of strategic
technology initiatives
|
–Updates on major
innovation and technology
trends
–Review of strategic
technology initiatives
–Cybersecurity: product and
customer safety
|
–Sustainability technology
strategy
–Updates on major
innovation and technology
trends
–Review of strategic
technology initiatives
|
–Updates on major
innovation and technology
trends
–Review of strategic
technology initiatives
–Cybersecurity: product and
customer security
|
Business
overview
|
Corporate
governance
|
Operating and financial
review and prospects
|
General facts
on Nokia
|
Financial
statements
|
Other
information
|
43 |
|||||||
Board meeting attendance |
Board and Committee meeting
attendance(1)
|
||||
Member |
Meetings |
% |
Meetings |
% |
|
Sari Baldauf (Chair) |
15/15 |
100 |
28/28 |
100 |
|
Søren Skou (Vice Chair) |
15/15 |
100 |
23/23 |
100 |
|
Timo Ahopelto (as of 4 April 2023) |
11/11 |
100 |
18/18 |
100 |
|
Bruce Brown (until 4 April 2023) |
4/4 |
100 |
8/8 |
100 |
|
Elizabeth Crain (as of 4 April 2023) |
11/11 |
100 |
19/19 |
100 |
|
Thomas Dannenfeldt |
15/15 |
100 |
26/26 |
100 |
|
Lisa Hook |
15/15 |
100 |
24/24 |
100 |
|
Jeanette Horan |
14/15 |
93 |
24/25 |
96 |
|
Edward Kozel (until 4 April 2023) |
4/4 |
100 |
7/7 |
100 |
|
Thomas Saueressig |
15/15 |
100 |
19/19 |
100 |
|
Carla Smits-Nusteling |
15/15 |
100 |
26/26 |
100 |
|
Kai Öistämö |
15/15 |
100 |
24/24 |
100 |
|
Average attendance (%) |
99.4 |
99.7 |
|||
Business
overview
|
Corporate
governance
|
Operating and financial
review and prospects
|
General facts
on Nokia
|
Financial
statements
|
Other
information
|
44 |
|||||||
Member |
Attendance
(meetings)
|
Attendance (%) |
Carla Smits-Nusteling (Chair) |
6/6 |
100 |
Timo Ahopelto (as of 4 April 2023) |
4/4 |
100 |
Elizabeth Crain (as of 4 April 2023) |
4/4 |
100 |
Thomas Dannenfeldt |
6/6 |
100 |
Lisa Hook (until 4 April 2023) |
2/2 |
100 |
Jeanette Horan |
6/6 |
100 |
Edward Kozel (until 4 April 2023) |
2/2 |
100 |
Average attendance (%) |
100 |
Business
overview
|
Corporate
governance
|
Operating and financial
review and prospects
|
General facts
on Nokia
|
Financial
statements
|
Other
information
|
45 |
|||||||
Member |
Attendance
(meetings)
|
Attendance (%) |
Søren Skou (Chair as of 4 April 2023) |
3/3 |
100 |
Sari Baldauf |
5/5 |
100 |
Bruce Brown (until 4 April 2023) |
2/2 |
100 |
Lisa Hook (as of 4 April 2023) |
3/3 |
100 |
Carla Smits-Nusteling |
5/5 |
100 |
Kai Öistämö |
5/5 |
100 |
Average attendance (%) |
100 |
Business
overview
|
Corporate
governance
|
Operating and financial
review and prospects
|
General facts
on Nokia
|
Financial
statements
|
Other
information
|
46 |
|||||||
Member |
Attendance
(meetings)
|
Attendance (%) |
Thomas Dannenfeldt (Chair as of
4 April 2023)
|
5/5 |
100 |
Sari Baldauf |
5/5 |
100 |
Bruce Brown (until 4 April 2023) |
1/1 |
100 |
Elizabeth Crain (as of 4 April 2023) |
4/4 |
100 |
Lisa Hook (as of 4 April 2023) |
4/4 |
100 |
Søren Skou |
5/5 |
100 |
Average attendance (%) |
100 |
Business
overview
|
Corporate
governance
|
Operating and financial
review and prospects
|
General facts
on Nokia
|
Financial
statements
|
Other
information
|
47 |
|||||||
Member |
Attendance
(meetings)
|
Attendance (%) |
Kai Öistämö (Chair) |
4/4 |
100 |
Timo Ahopelto (as of 4 April 2023) |
3/3 |
100 |
Sari Baldauf (as of 4 April 2023) |
3/3 |
100 |
Bruce Brown (until 4 April 2023) |
1/1 |
100 |
Jeanette Horan |
4/4 |
100 |
Edward Kozel (until 4 April 2023) |
1/1 |
100 |
Thomas Saueressig |
4/4 |
100 |
Average attendance (%) |
100 |
Business
overview
|
Corporate
governance
|
Operating and financial
review and prospects
|
General facts
on Nokia
|
Financial
statements
|
Other
information
|
48 |
|||||||
Name |
Position |
Gender |
Year of birth |
Nationality |
On GLT since |
Shares |
Pekka Lundmark |
President and CEO |
Male |
1963 |
Finnish |
2020 |
1 473 060 |
Nishant Batra |
Chief Strategy and Technology Officer |
Male |
1978 |
Indian |
2021 |
484 473 |
Ricky Corker |
Chief Customer Experience Officer |
Male |
1967 |
Australian |
2019 |
437 199 |
Federico Guillén |
President of Network Infrastructure |
Male |
1963 |
Spanish |
2016 |
453 764 |
Amy Hanlon-Rodemich |
Chief People Officer |
Female |
1972 |
American |
2022 |
- |
Jenni Lukander |
President of Nokia Technologies |
Female |
1974 |
Finnish |
2019 |
102 297 |
Esa Niinimäki |
Chief Legal Officer |
Male |
1976 |
Finnish |
2023 |
33 588 |
Raghav Sahgal |
President of Cloud and Network Services |
Male |
1962 |
American |
2020 |
569 659 |
Melissa Schoeb |
Chief Corporate Affairs Officer |
Female |
1968 |
American |
2021 |
161 367 |
Tommi Uitto |
President of Mobile Networks |
Male |
1969 |
Finnish |
2019 |
246 945 |
Marco Wirén |
Chief Financial Officer |
Male |
1966 |
Finnish/Swedish |
2020 |
277 610 |
Business
overview
|
Corporate
governance
|
Operating and financial
review and prospects
|
General facts
on Nokia
|
Financial
statements
|
Other
information
|
49 |
|||||||
 |
 |
 |
 |
|||||
Pekka Lundmark |
Nishant Batra |
Ricky Corker |
Federico Guillén |
|||||
b. 1963 |
b. 1978 |
b. 1967 |
b. 1963 |
|||||
Business
overview
|
Corporate
governance
|
Operating and financial
review and prospects
|
General facts
on Nokia
|
Financial
statements
|
Other
information
|
50 |
|||||||
 |
 |
 |
 |
|||||
Amy Hanlon-Rodemich |
Jenni Lukander |
Esa Niinimäki |
Raghav Sahgal |
|||||
b. 1972 |
b. 1974 |
b. 1976 |
b. 1962 |
|||||
Business
overview
|
Corporate
governance
|
Operating and financial
review and prospects
|
General facts
on Nokia
|
Financial
statements
|
Other
information
|
51 |
|||||||
 |
 |
 |
||||||
Melissa Schoeb |
Tommi Uitto |
Marco Wirén |
||||||
b. 1968 |
b. 1969 |
b. 1966 |
||||||
Business
overview
|
Corporate
governance
|
Operating and financial
review and prospects
|
General facts
on Nokia
|
Financial
statements
|
Other
information
|
52 |
|||||||
Business
overview
|
Corporate
governance
|
Operating and financial
review and prospects
|
General facts
on Nokia
|
Financial
statements
|
Other
information
|
53 |
|||||||
Business
overview
|
Corporate
governance
|
Operating and financial
review and prospects
|
General facts
on Nokia
|
Financial
statements
|
Other
information
|
54 |
|||||||
EURm |
2023 |
2022 |
Audit fees(1) |
20.2 |
22.7 |
Audit-related fees(2) |
1.7 |
0.8 |
Tax fees(3) |
0.4 |
0.4 |
All other fees(4) |
0.3 |
0.2 |
Total |
22.6 |
24.1 |
Business
overview
|
Corporate
governance
|
Operating and financial
review and prospects
|
General facts
on Nokia
|
Financial
statements
|
Other
information
|
55 |
|||||||
Business
overview
|
Corporate
governance
|
Operating and financial
review and prospects
|
General facts
on Nokia
|
Financial
statements
|
Other
information
|
56 |
|||||||

Business
overview
|
Corporate
governance
|
Operating and financial
review and prospects
|
General facts
on Nokia
|
Financial
statements
|
Other
information
|
57 |
|||||||
Delivering the next year’s step in the strategic plan – STI | |
Operating Profit 60% |
Cash Release 20% |
Continued focus on profitability |
Achieve a strong cash position |
Health & safety 10% – Lost
Time Injury Frequency Rate
(with a fatality modifier)
|
Diversity 10% |
Deliver on our focus on the
continued health and safety
of our employees
|
Deliver on our commitment to
become a more diverse employer
|
Delivering sustainable value – LTI | |
50% relative TSR, 40% cumulative reported EPS (adjusted for
impairments and M&A), 10% carbon emission reduction (Scope 1,
2 and 3)
| |
A more rounded and balanced approach reflecting performance over
the long term in growing the business and in delivering shareholder
value whilst working towards our 2030 goal of 50% carbon emission
reduction
| |
Business
overview
|
Corporate
governance
|
Operating and financial
review and prospects
|
General facts
on Nokia
|
Financial
statements
|
Other
information
|
58 |
|||||||
Year |
Aggregate remuneration of
the Board of Directors
(EUR)(1)
|
President and CEO actual
remuneration (EUR)(2)
|
Average salaries and wages
(EUR)(3)
|
Net sales (EURm) |
Total shareholder return
(rebased to 100 at 31 Dec
2018)(4)
|
2019 |
2 219 000 |
3 897 625 |
61 980 |
23 315 |
66.90 |
2020 |
2 016 000 |
3 587 781 |
65 787 |
21 852 |
63.95 |
2021 |
1 821 000 |
4 908 244 |
70 411 |
22 202 |
113.13 |
2022 |
2 280 000 |
4 316 606 |
74 100 |
24 911 |
88.94 |
2023 |
2 503 000 |
3 738 560 |
69 074 |
22 258 |
64.68 |
(1)Aggregate total remuneration paid to the members of the Board during the financial year as annual fee and meeting fee, as applicable, and as approved by general meetings
of shareholders. The value depends on the number of members elected to the Board for each term as well as on the composition of the Board committees and travel
required. During the term that began from the Annual General Meeting 2021, the Board had eight members only, compared to ten members during the following terms.
(2)The President and CEO actual remuneration represents the aggregate total of the two CEOs in 2020.
(3)Average salaries and wages are based on average employee numbers and their total salaries and wages as reported in the Company’s financial statements.
(4)Total shareholder return on last trading day of the previous year.
| |||||
Business
overview
|
Corporate
governance
|
Operating and financial
review and prospects
|
General facts
on Nokia
|
Financial
statements
|
Other
information
|
59 |
|||||||
Board remuneration for the term that began at the Annual General Meeting held on 4 April 2023 and ends at the close of the
Annual General Meeting in 2024 consisted of the following fees.
|
Annual fee |
EUR |
Chair |
440 000 |
Vice Chair |
210 000 |
Member |
185 000 |
Chair of Audit Committee |
30 000 |
Member of Audit Committee |
15 000 |
Chair of Personnel Committee |
30 000 |
Member of Personnel Committee |
15 000 |
Chair of Technology Committee |
20 000 |
Member of Technology Committee |
10 000 |
Meeting fee(1) |
EUR |
Meeting requiring intercontinental travel |
5 000 |
Meeting requiring continental travel |
2 000 |
The following table outlines the total annual remuneration paid in 2023 to the members of the Board for their services, as
resolved by the shareholders at the Annual General Meeting.
|
Annual fees
(EUR)
|
Meeting fees
(EUR)(1)
|
Total
remuneration paid
(EUR)
|
60% of annual fees
and all meeting fees
paid in cash (EUR)
|
40% of annual
fees paid in shares
(EUR)
|
Number of shares
(approximately 40%
of the annual fee)
|
|
Sari Baldauf (Chair) |
465 000 |
10 000 |
475 000 |
289 000 |
186 000 |
47 427 |
Søren Skou (Vice Chair) |
225 000 |
14 000 |
239 000 |
149 000 |
90 000 |
22 948 |
Timo Ahopelto |
210 000 |
10 000 |
220 000 |
136 000 |
84 000 |
21 418 |
Bruce Brown (until 4 April 2023)(2) |
— |
5 000 |
5 000 |
5 000 |
— |
— |
Elizabeth Crain |
215 000 |
15 000 |
230 000 |
144 000 |
86 000 |
21 928 |
Thomas Dannenfeldt |
230 000 |
9 000 |
239 000 |
147 000 |
92 000 |
23 458 |
Lisa Hook |
200 000 |
17 000 |
217 000 |
137 000 |
80 000 |
20 399 |
Jeanette Horan |
210 000 |
10 000 |
220 000 |
136 000 |
84 000 |
21 418 |
Edward Kozel (until 4 April 2023)(2) |
— |
5 000 |
5 000 |
5 000 |
— |
— |
Thomas Saueressig |
195 000 |
14 000 |
209 000 |
131 000 |
78 000 |
19 889 |
Carla Smits-Nusteling |
215 000 |
14 000 |
229 000 |
143 000 |
86 000 |
21 928 |
Kai Öistämö |
205 000 |
10 000 |
215 000 |
133 000 |
82 000 |
20 908 |
Total |
2 370 000 |
133 000 |
2 503 000 |
1 555 000 |
948 000 |
241 721 |
(1)Meeting fees include all meeting fees paid for the term that ended at the Annual General Meeting held on 4 April 2023 and meeting fees accrued and paid in 2023 for the
term that began at the same meeting.
(2)Stepped down at the Annual General Meeting on 4 April 2023 and received only one meeting fee in 2023.
| ||||||
Business
overview
|
Corporate
governance
|
Operating and financial
review and prospects
|
General facts
on Nokia
|
Financial
statements
|
Other
information
|
60 |
|||||||
EUR |
2023 |
Pay mix(1) |
2022 |
Pay mix(1) |
Salary |
1 322 750 |
36% |
1 300 000 |
31% |
Short-term incentive(2) |
1 079 695 |
30% |
2 342 438 |
56% |
Long-term incentive |
1 240 359 |
34% |
560 318 |
13% |
Other compensation(3) |
95 756 |
113 850 |
||
Total |
3 738 560 |
4 316 606 |
Metric |
Weight |
Target |
STI outcome
(% of target)
|
Economic Profit(1) |
70% |
EUR 1 851 million |
37% |
Diversity |
10% |
Female percentage of global external hires of 28% |
90% |
Carbon emission reduction Scope 1&2 |
5% |
221 652 tCO2e |
225% |
Carbon emission reduction Scope 3 |
5% |
■Finalize Nokia’s Net Zero Roadmap and transition plan
■Achieve each business group’s committed roadmap milestones towards
higher energy-efficient products and services
|
83.03% |
Personal strategic objectives |
10% |
■Define the 2030 technology and business vision
■Develop alternative value creation strategies beyond the 3-year long-range plan
|
150% |
Total STI outcome |
100% |
65.30% |
Business
overview
|
Corporate
governance
|
Operating and financial
review and prospects
|
General facts
on Nokia
|
Financial
statements
|
Other
information
|
61 |
|||||||
Performance share awards granted during the year(2) |
Units granted |
Grant date face value
(EUR)(3)
|
Grant date |
Vesting |
2023 LTI performance shares |
635 700 |
2 434 731 |
6 July 2023 |
Q3 2026 |
Restricted share awards vested during the year |
Units granted |
Target |
Achievement |
Units vested |
Value of vested
award(1) (EUR)
|
2020 Restricted Share award final tranche (3/3) |
117 467 |
N/A |
N/A |
117 467 |
380 590 |
LTI performance shares vested during the year |
Units granted |
Target share
price (EUR)
|
Share price
achievement
(EUR)
|
Vesting outcome
(% of target)
|
Units vested |
Value of vested
award(1) (EUR)
|
2020 LTI performance shares |
671 800 |
3.67 |
3.21 |
39.5% |
265 361 |
859 770 |
eLTI matching performance shares vested during the year |
Units granted |
Target share
price (EUR)
|
Share price
achievement
(EUR)
|
Vesting outcome
(% of target)
|
Units vested |
2020 eLTI matching performance shares |
1 390 894 |
5.35 |
3.72 |
0.00 |
0 |
Business
overview
|
Corporate
governance
|
Operating and financial
review and prospects
|
General facts
on Nokia
|
Financial
statements
|
Other
information
|
62 |
|||||||
Pekka Lundmark |
Units |
Value(1) (EUR) |
Beneficially owned shares at 31 December 2023 |
1 473 060 |
4 495 779 |
Unvested shares under outstanding Nokia equity plans(2) |
2 910 980 |
8 884 310 |
Total |
4 384 040 |
13 380 089 |
Termination by |
Reason |
Notice |
Compensation |
Nokia |
Cause |
None |
The President and CEO is entitled to no additional remuneration and all unvested
equity awards would be forfeited after termination.
|
Nokia |
Reasons other
than cause
|
Up to 12 months |
The President and CEO is entitled to a severance payment equaling up to
12 months’ remuneration (including annual base salary, benefits, and target short-
term incentive) and unvested equity awards would be forfeited after termination.
|
President
and CEO
|
Any reason |
12 months |
The President and CEO may terminate his service agreement at any time with
12 months’ notice. The President and CEO would either continue to receive salary
and benefits during the notice period or, at Nokia’s discretion, a lump sum of
equivalent value. Additionally, the President and CEO would be entitled to any
short- or long-term incentives that would normally vest during the notice period.
Any unvested equity awards would be forfeited after termination.
|
President
and CEO
|
Nokia’s material
breach of the
service agreement
|
Up to 12 months |
In the event that the President and CEO terminates his service agreement based
on a final arbitration award demonstrating Nokia’s material breach of the service
agreement, he is entitled to a severance payment equaling up to 12 months’
remuneration (including annual base salary, benefits and target incentive). Any
unvested equity awards would be forfeited after termination.
|
Business
overview
|
Corporate
governance
|
Operating and financial
review and prospects
|
General facts
on Nokia
|
Financial
statements
|
Other
information
|
63 |
|||||||
Fees |
Fees consist of annual fees and meeting fees.
Approximately 40% of the annual fee is paid in
Nokia shares purchased from the market on
behalf of the Board members or alternatively
delivered as treasury shares held by the
Company. The balance is paid in cash, most of
which is typically used to cover taxes arising
from the paid remuneration.
Meeting fees are paid in cash.
|
Incentives |
Non-executive directors are not eligible to
participate in any Nokia incentive plans and do
not receive performance shares, restricted
shares or any other equity-based or other
form of variable compensation for their duties
as members of the Board.
|
Pensions |
Non-executive directors do not participate in
any Nokia pension plans.
|
Share
ownership
requirement
|
Members of the Board shall normally retain
until the end of their directorship such
number of shares that corresponds to the
number of shares they have received as Board
remuneration during their first three years of
service on the Board (the net amount received
after deducting those shares needed to offset
any costs relating to the acquisition of the
shares, including taxes).
|
Other |
Directors are compensated for travel and
accommodation expenses as well as other
costs directly related to Board and Committee
work. These are paid in cash.
|
Business
overview
|
Corporate
governance
|
Operating and financial
review and prospects
|
General facts
on Nokia
|
Financial
statements
|
Other
information
|
64 |
|||||||
Remuneration element |
Purpose and link to strategy |
Operation including maximum opportunity |
Performance conditions |
Base salary |
To attract and retain individuals with
the requisite level of knowledge,
skills and experience to lead our
businesses
|
Base salary is normally reviewed annually taking into consideration a variety of
factors, including but not limited to, performance of the Company and the
individual, remuneration of our external peer group, changes in individual
responsibilities and employee salary increases.
|
Whilst there are no performance targets attached to the payment of base
salary, performance is considered as context in the annual salary review.
|
Pension |
To provide retirement benefit
aligned with local country practice
|
Pension arrangements reflect the relevant market practice and may evolve year on
year. The President and CEO may participate in the applicable pension programs
available to other executives in the country of employment.
The current President and CEO participates in the Finnish statutory Employee’s
Pension Act (TyEL); there is no supplementary pension plan.
The retirement age is the statutory retirement age in Finland.
|
N/A |
Benefits |
To provide a competitive level of
benefits and to support recruitment
and retention
|
Benefits will be provided in line with local market practice in the country of
employment and may evolve year on year. Benefits may include, for example, a
company car (or cash equivalent), risk benefits (for example life and disability
insurance) and employer contributions to insurance plans (for example medical
insurance).
Additional benefits and allowances may be offered in certain circumstances such
as relocation support, expatriate allowances, and temporary living and
transportation expenses aligned with Nokia’s mobility policy.
|
N/A |
Short-term incentive
(STI)
|
To incentivize and reward
performance against delivery
of the annual business plan
|
STI is based on performance against one-year financial and non-financial targets
and normally paid in cash.
Minimum payout is 0% of base salary.
Target opportunity is 125% of base salary.
Maximum opportunity is 281.25% of base salary.
The Company Clawback Policies apply.
|
Performance measures, weightings and targets for the selected measures are
set at the start of the year annually by the Board of Directors to ensure they
continue to support Nokia’s short-term business strategy. These measures
can vary from year to year to reflect business priorities and may include a
balance of financial, key operational and non-financial measures.
Although the performance measures and weighting may differ year on year
reflecting the business priorities, in any given year, a minimum of 60% of
measures will be based on financial criteria.
Performance metrics and weightings are disclosed retrospectively in the
annual Remuneration Report.
|
Long-term incentive
(LTI) – performance
share award
|
To reward for delivery of sustainable
long-term performance, align the
President and CEO’s interests with
those of shareholders and aid
retention
|
Long-term incentive awards may be made annually in shares, vesting normally
after three years dependent on the achievement of stretching performance
conditions measured over a three-year period.
Target award level is 200% of base salary at the date of grant, with maximum
vesting of 400% of base salary.
The Company Clawback Policies apply.
|
Performance measures, weightings and targets for the selected measures
are set by the Board of Directors to ensure they continue to support Nokia’s
long-term business strategy and financial success.
Targets are set in the context of Nokia’s long-term plans and analyst
forecasts, ensuring that they are considered both achievable and
sufficiently stretching.
The Committee may choose different measures and weightings each year
based on the business plan and these will consist of at least 60% financial
measures and/or share price-related measures. Performance metrics and
weightings are disclosed retrospectively in the annual Remuneration Report.
|
Business
overview
|
Corporate
governance
|
Operating and financial
review and prospects
|
General facts
on Nokia
|
Financial
statements
|
Other
information
|
65 |
|||||||
Remuneration element |
Purpose and link to strategy |
Operation including maximum opportunity |
Performance conditions |
Enhanced LTI (eLTI) –
co-investment
arrangement
|
To further align the President
and CEO’s interests with Nokia’s
long-term success and shareholder
interests
|
To further align the President and CEO’s interests with Nokia’s long-term success
and shareholder interests eLTI is only granted in exceptional circumstances.
The President and CEO may be invited, at the discretion of the Board, to
purchase investment shares of up to 200% of base salary, and in return,
receive two matching shares for every one investment share purchased.
The matching shares are delivered in the form of performance shares, typically
subject to the same performance conditions as for the LTI performance share
award, with a three-year performance and vesting period.
The minimum vesting of the matching shares is 0% of base salary and maximum
vesting is two times grant level.
The Company Clawback Policies apply.
|
The performance metrics, targets and weightings for the matching shares
are typically the same as those for LTI performance shares granted in the
same year.
|
Shareholding
requirement
|
To align the President and CEO’s
interests with shareholder interests
and ensure any decisions made
are in the long-term interest of
the Company
|
The President and CEO is required to build and maintain a shareholding equivalent
to 300% of base salary, to be achieved normally within five years of appointment.
|
N/A |
Business
overview
|
Corporate
governance
|
Operating and financial
review and prospects
|
General facts
on Nokia
|
Financial
statements
|
Other
information
|
66 |
|||||||
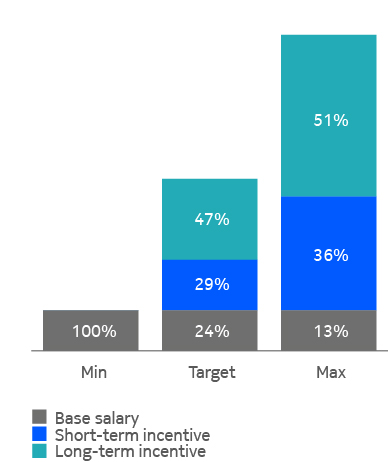
Business
overview
|
Corporate
governance
|
Operating and financial
review and prospects
|
General facts
on Nokia
|
Financial
statements
|
Other
information
|
67 |
|||||||
Business
overview
|
Corporate
governance
|
Operating and financial
review and prospects
|
General facts
on Nokia
|
Financial
statements
|
Other
information
|
68 |
|||||||
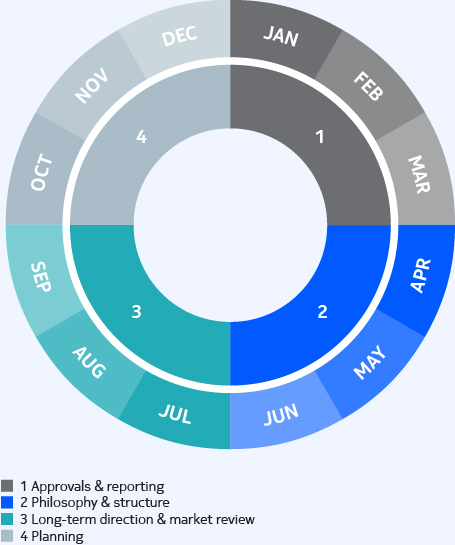
At the end of 2023, the Group Leadership Team consisted of 11 persons split between Finland, other European countries,
Singapore and the United States. For information regarding the current Group Leadership Team composition, refer to the
Corporate Governance Statement.
|
Name |
Position in 2023 |
Appointment date |
Pekka Lundmark |
President and CEO |
1 August 2020 |
Nishant Batra |
Chief Strategy and Technology Officer |
18 January 2021 |
Ricky Corker |
Chief Customer Experience Officer |
1 January 2019 |
Federico Guillén |
President of Network Infrastructure |
8 January 2016 |
Amy Hanlon-Rodemich |
Chief People Officer |
24 October 2022 |
Jenni Lukander |
President of Nokia Technologies |
1 August 2019 |
Esa Niinimäki |
Chief Legal Officer |
25 January 2023 |
Raghav Sahgal |
President of Cloud and Network Services |
1 June 2020 |
Melissa Schoeb |
Chief Corporate Affairs Officer |
12 April 2021 |
Tommi Uitto |
President of Mobile Networks |
31 January 2019 |
Marco Wirén |
Chief Financial Officer |
1 September 2020 |
Remuneration of the Group Leadership Team members in 2023
Remuneration of the Group Leadership Team (excluding the President and CEO) in 2022 and 2023, in the aggregate, was as follows:
|
EURm⁽¹⁾ |
2023 |
2022 |
Salary, short-term incentives and other compensation(2) |
10.8 |
13.6 |
Long-term incentives(3) |
2.5 |
7.0 |
Total |
13.3 |
20.6 |
(1)The values represent each member’s time on the Group Leadership Team.
(2)Short-term incentives represent amounts earned in respect of 2023 performance. Other compensation includes mobility-related payments, local benefits and pension costs.
(3)The amounts represent the equity awards that vested in 2023 and 2022.
| ||
The members of the Group Leadership Team (excluding the President and CEO) were awarded the following equity awards under the
Nokia equity program in 2023:
|
Award |
Units awarded(1) |
Grant date fair value (EUR) |
Grant date |
Vesting |
Performance share award(2) |
1 858 500 |
7 118 055 |
6 July 2023 |
Q3 2026 |
Restricted share award(3) |
1 454 000 |
4 376 540 |
15 December 2023 |
Q4 2024, Q4 2025 |
(1)Includes units awarded to persons who were Group Leadership Team members during 2023.
(2)The 2023 performance shares have a three-year performance period based on absolute total shareholder return. The maximum payout is 200% subject to maximum
performance against the performance criteria. Vesting is subject to continued employment.
(3)Vesting of each tranche of the restricted share awards is conditional on continued employment.
| ||||
Business
overview
|
Corporate
governance
|
Operating and financial
review and prospects
|
General facts
on Nokia
|
Financial
statements
|
Other
information
|
69 |
|||||||
Shares receivable through
performance
shares at grant
|
Shares receivable through
performance
shares at maximum(4)
|
Shares receivable through
restricted shares
|
|
Number of equity awards held by the Group Leadership Team(1) |
9 556 958 |
19 113 916 |
1 454 000 |
% of the outstanding shares(2) |
0.17% |
0.35% |
0.03% |
% of the total outstanding equity incentives (per instrument)(3) |
22.19% |
23.26% |
1.55% |
Business
overview
|
Corporate
governance
|
Operating and financial
review and prospects
|
General facts
on Nokia
|
Financial
statements
|
Other
information
|
70 |
|||||||
ABB |
IBM |
Adobe |
Infineon Technologies |
Airbus |
Juniper Networks |
ASML |
Kone |
Atos |
Motorola Solutions |
BAE Systems |
NXP Semiconductors |
Capgemini |
Oracle |
Ciena |
Philips |
Cisco Systems |
SAP |
Corning |
Siemens Healthineers |
Dell Technologies |
VMware |
Ericsson |
Vodafone Group |
Hewlett Packard Enterprise |
Wärtsilä |
HP |
Business
overview
|
Corporate
governance
|
Operating and financial
review and prospects
|
General facts
on Nokia
|
Financial
statements
|
Other
information
|
71 |
|||||||

Business
overview
|
Corporate
governance
|
Operating and financial
review and prospects
|
General facts
on Nokia
|
Financial
statements
|
Other
information
|
72 |
|||||||
EURm (except for percentage and personnel data) |
2023 |
2022 |
2021 |
From the consolidated income statement |
|||
Net sales |
22 258 |
24 911 |
22 202 |
Operating profit |
1 688 |
2 318 |
2 158 |
% of net sales |
7.6% |
9.3% |
9.7% |
Profit before tax |
1 499 |
2 184 |
1 926 |
Profit from continuing operations |
674 |
4 210 |
1 654 |
Profit/(loss) from discontinued operations |
5 |
49 |
(9) |
Profit for the year |
679 |
4 259 |
1 645 |
From the consolidated statement of financial position |
|||
Non-current assets |
21 694 |
22 677 |
20 452 |
Current assets |
18 087 |
20 266 |
19 597 |
Assets held for sale |
79 |
— |
— |
Total assets |
39 860 |
42 943 |
40 049 |
Total shareholders' equity |
20 537 |
21 333 |
17 360 |
Non-controlling interests |
91 |
93 |
102 |
Total equity |
20 628 |
21 426 |
17 462 |
Interest-bearing liabilities(1) |
4 191 |
4 477 |
4 653 |
Lease liabilities(1) |
997 |
1 042 |
1 009 |
Provisions(1) |
1 262 |
1 435 |
1 569 |
Other liabilities(1) |
12 782 |
14 563 |
15 356 |
Total shareholders’ equity and liabilities |
39 860 |
42 943 |
40 049 |
Other information |
|||
Research and development expenses |
(4 327) |
(4 550) |
(4 214) |
% of net sales |
(19.4)% |
(18.3)% |
(19.0)% |
Capital expenditure(2) |
(652) |
(601) |
(560) |
% of net sales |
(2.9)% |
(2.4)% |
(2.5)% |
Personnel expenses |
(7 470) |
(7 903) |
(7 541) |
Average number of employees |
86 689 |
86 896 |
87 927 |
Order backlog, EUR billion |
22.0 |
19.5 |
20.3 |
EURm (except for percentage and personnel data) |
2023 |
2022 |
2021 |
Key financial indicators and ratios |
|||
Earnings per share attributable to equity holders of the parent |
|||
Basic earnings per share, EUR |
|||
Continuing operations |
0.12 |
0.75 |
0.29 |
Profit for the year |
0.12 |
0.76 |
0.29 |
Diluted earnings per share, EUR |
|||
Continuing operations |
0.12 |
0.74 |
0.29 |
Profit for the year |
0.12 |
0.75 |
0.29 |
Proposed dividend per share, EUR(3) |
0.13 |
0.12 |
0.08 |
Return on capital employed %(2) |
6.7% |
9.5% |
10.1% |
Return on shareholders’ equity %(2) |
3.2% |
22.0% |
10.9% |
Equity ratio %(2) |
51.8% |
49.9% |
43.6% |
Net debt to equity (gearing) %(2) |
(21.0)% |
(22.2)% |
(26.4)% |
Cash and cash equivalents |
6 234 |
5 467 |
6 691 |
Total cash and interest-bearing financial investments(2) |
8 514 |
9 244 |
9 268 |
Net cash and interest-bearing financial investments(2) |
4 323 |
4 767 |
4 615 |
Net cash flows from operating activities |
1 317 |
1 474 |
2 625 |
Free cash flow(2)(4) |
665 |
873 |
2 065 |
Business
overview
|
Corporate
governance
|
Operating and financial
review and prospects
|
General facts
on Nokia
|
Financial
statements
|
Other
information
|
73 |
|||||||
Business
overview
|
Corporate
governance
|
Operating and financial
review and prospects
|
General facts
on Nokia
|
Financial
statements
|
Other
information
|
74 |
|||||||
2023 |
2022 |
|||||
EURm |
% of
net sales
|
EURm |
% of
net sales
|
Year-on-year
change %
|
||
Net sales |
22 258 |
100.0 |
24 911 |
100.0 |
(11) |
|
Cost of sales |
(13 571) |
(61.0) |
(14 689) |
(59.0) |
(8) |
|
Gross profit |
8 687 |
39.0 |
10 222 |
41.0 |
(15) |
|
Research and development expenses |
(4 327) |
(19.4) |
(4 550) |
(18.3) |
(5) |
|
Selling, general and administrative
expenses
|
(2 929) |
(13.2) |
(3 013) |
(12.1) |
(3) |
|
Other operating income and expenses |
257 |
1.2 |
(341) |
(1.4) |
(175) |
|
Operating profit |
1 688 |
7.6 |
2 318 |
9.3 |
(27) |
|
Share of results of associated companies
and joint ventures
|
(39) |
(0.2) |
(26) |
(0.1) |
50 |
|
Financial income and expenses |
(150) |
(0.7) |
(108) |
(0.4) |
39 |
|
Profit before tax |
1 499 |
6.7 |
2 184 |
8.8 |
(31) |
|
Income tax (expense)/benefit |
(825) |
(3.7) |
2 026 |
8.1 |
(141) |
|
Profit for the year from continuing
operations
|
674 |
3.0 |
4 210 |
16.9 |
(84) |
|
Attributable to: |
||||||
Equity holders of the parent |
660 |
3.0 |
4 201 |
16.9 |
(84) |
|
Non-controlling interests |
14 |
0.1 |
9 |
— |
56 |
|
EURm |
2023 |
2022 |
Year-on-year
change %
|
Asia Pacific |
2 291 |
2 648 |
(13) |
Europe(1) |
5 873 |
6 662 |
(12) |
Greater China |
1 303 |
1 581 |
(18) |
India |
2 842 |
1 290 |
120 |
Latin America |
1 046 |
1 223 |
(14) |
Middle East & Africa |
2 050 |
1 969 |
4 |
North America |
5 733 |
8 388 |
(32) |
Submarine Networks |
1 120 |
1 150 |
(3) |
Total |
22 258 |
24 911 |
(11) |
EURm |
2023 |
2022 |
Year-on-year
change %
|
Communications service providers |
17 652 |
19 921 |
(11) |
Enterprise |
2 282 |
1 997 |
14 |
Licensees |
1 085 |
1 595 |
(32) |
Other(1) |
1 239 |
1 398 |
(11) |
Total |
22 258 |
24 911 |
(11) |
Business
overview
|
Corporate
governance
|
Operating and financial
review and prospects
|
General facts
on Nokia
|
Financial
statements
|
Other
information
|
75 |
|||||||
Business
overview
|
Corporate
governance
|
Operating and financial
review and prospects
|
General facts
on Nokia
|
Financial
statements
|
Other
information
|
76 |
|||||||
2023 |
2022 |
|||||
EURm |
% of net
sales
|
EURm |
% of net
sales
|
Year-on-year
change %
|
||
Net sales(1) |
8 037 |
100.0 |
9 047 |
100.0 |
(11) |
|
Cost of sales |
(4 987) |
(62.1) |
(5 739) |
(63.4) |
(13) |
|
Gross profit |
3 050 |
37.9 |
3 308 |
36.6 |
(8) |
|
Research and development expenses |
(1 259) |
(15.7) |
(1 307) |
(14.4) |
(4) |
|
Selling, general and administrative
expenses
|
(818) |
(10.2) |
(833) |
(9.2) |
(2) |
|
Other operating income and expenses |
81 |
1.0 |
(66) |
(0.7) |
(223) |
|
Operating profit |
1 054 |
13.1 |
1 102 |
12.2 |
(4) |
|
Business
overview
|
Corporate
governance
|
Operating and financial
review and prospects
|
General facts
on Nokia
|
Financial
statements
|
Other
information
|
77 |
|||||||
2023 |
2022 |
|||||
EURm |
% of net
sales
|
EURm |
% of net
sales
|
Year-on-year
change %
|
||
Net sales |
9 797 |
100.0 |
10 671 |
100.0 |
(8) |
|
Cost of sales |
(6 364) |
(65.0) |
(6 575) |
(61.6) |
(3) |
|
Gross profit |
3 433 |
35.0 |
4 096 |
38.4 |
(16) |
|
Research and development expenses |
(2 010) |
(20.5) |
(2 234) |
(20.9) |
(10) |
|
Selling, general and administrative
expenses
|
(822) |
(8.4) |
(865) |
(8.1) |
(5) |
|
Other operating income and expenses |
122 |
1.2 |
(57) |
(0.5) |
(315) |
|
Operating profit |
723 |
7.4 |
940 |
8.8 |
(23) |
|
Business
overview
|
Corporate
governance
|
Operating and financial
review and prospects
|
General facts
on Nokia
|
Financial
statements
|
Other
information
|
78 |
|||||||
2023 |
2022 |
|||||
EURm |
% of net
sales
|
EURm |
% of net
sales
|
Year-on-year
change %
|
||
Net sales |
3 220 |
100.0 |
3 351 |
100.0 |
(4) |
|
Cost of sales |
(1 944) |
(60.4) |
(2 011) |
(60.0) |
(3) |
|
Gross profit |
1 276 |
39.6 |
1 340 |
40.0 |
(5) |
|
Research and development expenses |
(577) |
(17.9) |
(577) |
(17.2) |
— |
|
Selling, general and administrative
expenses
|
(494) |
(15.3) |
(544) |
(16.2) |
(9) |
|
Other operating income and expenses |
50 |
1.6 |
(42) |
(1.3) |
(219) |
|
Operating profit |
255 |
7.9 |
177 |
5.3 |
44 |
|
Business
overview
|
Corporate
governance
|
Operating and financial
review and prospects
|
General facts
on Nokia
|
Financial
statements
|
Other
information
|
79 |
|||||||
2023 |
2022 |
|||||
EURm |
% of net
sales
|
EURm |
% of net
sales
|
Year-on-year
change %
|
||
Net sales |
1 085 |
100.0 |
1 595 |
100.0 |
(32) |
|
Cost of sales |
— |
— |
(5) |
(0.3) |
(100) |
|
Gross profit |
1 085 |
100.0 |
1 590 |
99.7 |
(32) |
|
Research and development expenses |
(224) |
(20.6) |
(214) |
(13.4) |
5 |
|
Selling, general and administrative
expenses
|
(140) |
(12.9) |
(136) |
(8.5) |
3 |
|
Other operating income and expenses |
13 |
1.2 |
(32) |
(2.0) |
(141) |
|
Operating profit |
734 |
67.6 |
1 208 |
75.7 |
(39) |
|
Business
overview
|
Corporate
governance
|
Operating and financial
review and prospects
|
General facts
on Nokia
|
Financial
statements
|
Other
information
|
80 |
|||||||
2023 |
2022 |
|||||
EURm |
% of net
sales
|
EURm |
% of net
sales
|
Year-on-year
change %
|
||
Net sales |
130 |
100.0 |
295 |
100.0 |
(56) |
|
Cost of sales |
(136) |
(104.6) |
(307) |
(104.1) |
(56) |
|
Gross profit |
(6) |
(4.6) |
(12) |
(4.1) |
(50) |
|
Research and development expenses |
(120) |
(92.3) |
(117) |
(39.7) |
3 |
|
Selling, general and administrative
expenses
|
(216) |
(166.2) |
(226) |
(76.6) |
(4) |
|
Other operating income and expenses |
(49) |
(37.7) |
37 |
12.5 |
(232) |
|
Operating loss |
(391) |
(300.8) |
(318) |
(107.8) |
23 |
|
Business
overview
|
Corporate
governance
|
Operating and financial
review and prospects
|
General facts
on Nokia
|
Financial
statements
|
Other
information
|
81 |
|||||||
Business
overview
|
Corporate
governance
|
Operating and financial
review and prospects
|
General facts
on Nokia
|
Financial
statements
|
Other
information
|
82 |
|||||||
Business
overview
|
Corporate
governance
|
Operating and financial
review and prospects
|
General facts
on Nokia
|
Financial
statements
|
Other
information
|
83 |
|||||||
2023 |
2022 |
||||
Currency |
Net sales |
Total costs |
Net sales |
Total costs |
|
EUR |
~25% |
~30% |
~25% |
~25% |
|
USD |
~50% |
~45% |
~50% |
~50% |
|
CNY |
~5% |
~5% |
~5% |
~5% |
|
INR |
~5% |
~5% |
~0% |
~5% |
|
Other |
~15% |
~15% |
~20% |
~15% |
|
Total |
~100% |
~100% |
~100% |
~100% |
|
Business
overview
|
Corporate
governance
|
Operating and financial
review and prospects
|
General facts
on Nokia
|
Financial
statements
|
Other
information
|
84 |
|||||||

Business
overview
|
Corporate
governance
|
Operating and financial
review and prospects
|
General facts
on Nokia
|
Financial
statements
|
Other
information
|
85 |
|||||||
5 ESG pillars |
|||||||||
 |
 |
 |
|||||||
Environment |
Industrial digitalization |
Security and privacy |
|||||||
Be the leader in energy efficiency
and circular practices
|
We provide connectivity and
digital solutions that sustainably
transform physical industries
|
Security and privacy become a
cornerstone of our reputation
and product proposition
|
|||||||
 |
 |
||||||||
Bridging the digital divide |
Responsible business |
||||||||
We are a bridge for digital inclusion
through our connectivity and digital
skill building solutions
|
Take a proactive and values-driven
role in driving responsible business
practices internally and in our
value chain
|
||||||||
Business
overview
|
Corporate
governance
|
Operating and financial
review and prospects
|
General facts
on Nokia
|
Financial
statements
|
Other
information
|
86 |
|||||||
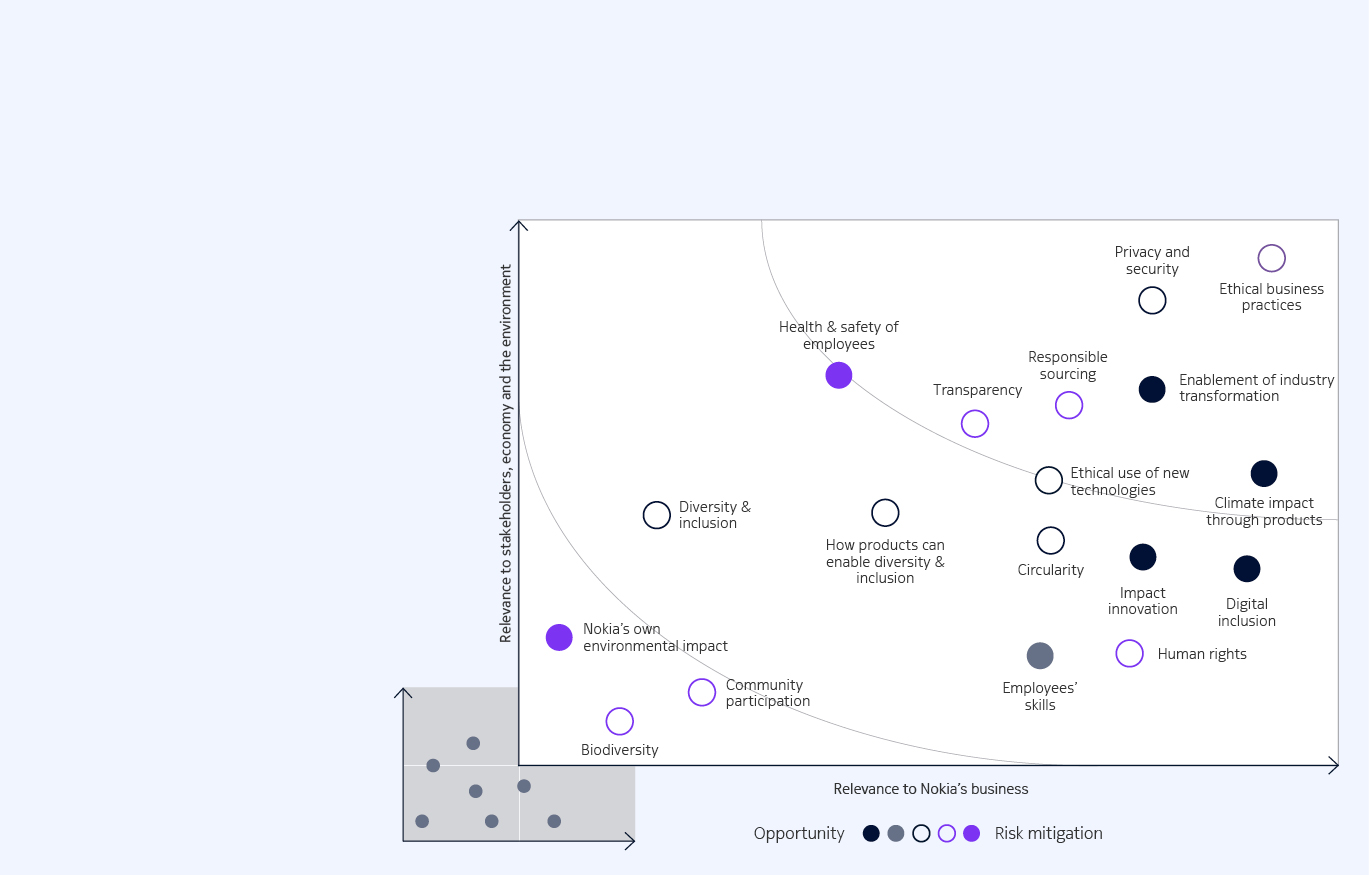

Business
overview
|
Corporate
governance
|
Operating and financial
review and prospects
|
General facts
on Nokia
|
Financial
statements
|
Other
information
|
87 |
|||||||
 |
 |
 |
||
Promote inclusive and sustainable
economic growth, employment and
decent work
|
Build resilient infrastructure,
promote sustainable industrialization
and foster innovation
|
Take urgent action to combat climate
change and its impacts
|
||
In 2023, Nokia deployed the Rural
Connect Solution in Middle East and
Africa to connect the unconnected and
bridge the coverage gap in remote areas
of sub-Saharan Africa. The solution
takes a new approach to evolving radio
access network sites with a focus on
reducing energy consumption. It
incorporates baseband units with
AirScale power rectifiers and long-lasting
lithium batteries in a compact, portable
package that can be installed almost
anywhere.
Nokia is collaborating with UNICEF to
bridge the digital divide by helping to
improve digital education and training in
schools in select parts of Senegal, West
Africa. The principal beneficiaries are
teachers, as well as middle school
students in underserved areas. The
scope of work includes specific sessions
on digital skills, as well as upgrading
equipment and connectivity.
|
In 2023, Nokia partnered with DXC
Technology, to launch DXC Signal Private
LTE and 5G, a managed secure private
wireless network and digitalization
platform solution that helps industrial
enterprises digitally transform their
operations, especially in key market
segments including manufacturing,
energy, healthcare, logistics,
transportation, and education.
During the year we also announced that
we will work with US energy provider
Xcel Energy to help modernize grid
operations. The project will include the
deployment of Nokia private LTE
network technology, helping support
secure, reliable data connectivity and
new levels of automation. The network
technologies will back a growing mix of
renewable power sources for Xcel
Energy and optimize the delivery of
electricity to its millions of customers.
|
In 2023, Nokia announced a new update
in its optics portfolio with the sixth-
generation super-coherent photonic
service engine, PSE-6s, which can reduce
network power consumption in optical
transport by up to 60% per bit. We also
announced Habrok massive MIMO
radios, which offer improved energy
efficiency by using up to 30%
less energy through a combination
of software, hardware and services.
During the year we also communicated
that we helped Vietnamese
communications service provider
MobiFone achieve overall energy savings
of almost 14% in the first trial of our
new Digital Design service. The service
analyzes each individual cell in the
network and recommends the most
appropriate radio link power balance
to reduce transmit power.
Nokia joined with Orange under the
Switch to Circular Economy Value Chains
initiative, run by UNIDO (United Nations
Industrial Development Organization).
The project aims to support corporates
in accelerating their circularity efforts,
including with their partners in developing
countries. Nokia will work closely with
Orange to further develop circular
approaches in network equipment,
including setting up a new refurbishment
and repair center in Egypt, which will
extend the lifetime of Nokia products.
|
Strategic
focus area
|
Target
year
|
Base
year
|
Target |
2023 results |
Status |
Environment | |||||
Climate |
2030 |
2019 |
Our science-based target (SBT(1)): Reduce
our greenhouse gas (GHG) emissions across
our value chain (Scope 1, 2 and 3) by 50%
between 2019 and 2030, and reach net zero
by 2050.
|
Emissions covered by our SBT were 34 319 800 tons CO2e,(2) which is a 9% decrease from 2022.
Despite this decrease, our current SBT emissions are now at the same level as the 2019
baseline year. This means that the 2030 SBT is still not on track with a linear reduction
trajectory. While we continue to accelerate innovations in product energy efficiency and
supplier collaboration, the availability and take-up of renewable energy by Nokia's customers
must rapidly increase to support the achievement of the interim target.
|
Not on track |
2030 |
2019 |
Our final assembly suppliers reach zero
emissions by 2030.
|
Our final assembly suppliers’ emissions were 38 500 tons CO2e, which is a 49% reduction
from 2019.
|
On track |
|
2030 |
2019 |
Our suppliers reduce GHG emissions by 50%
by 2030.(3)
|
Our suppliers’ emissions were 540 500 tons CO2e, which is a 82% reduction from 2019.
However, as this includes emissions data from hundreds of suppliers and the quality of
allocated emissions data has been of concern, we are conscious that some of the reductions
may be due to the quality of the data reported.
|
On track |
|
2030 |
2019 |
Our logistics’ GHG emissions reduced by 73%
by 2030.
|
Our logistics emissions were 140 900 tons CO2e, which is a 54% decrease from 2019. |
On track |
|
2023 |
N/A |
Reach 75% renewable electricity in our own
facilities.
|
Reached 75% renewable electricity in our own facilities. |
Achieved |
|
2023 |
2019 |
Reach 65% reduction of our facilities' GHG
emissions compared to 2019.
|
Reached 69% reduction of our facilities’ GHG emissions. |
Achieved |
|
Circularity |
2030 |
2019 |
95% circularity rate for waste from our
offices, labs, manufacturing, installation and
product takeback by 2030.
|
We have recognized areas where a high circularity rate has already been achieved and also
areas requiring further action. There are still data gaps to be closed but data accuracy has
increased. Annual waste circularity outcome for 2023 was 86%.
|
On track |
Bridging the digital divide | |||||
Connecting the
unconnected
and under-
served
|
2030 |
2021 |
Helping our customers to connect the next
2 billion measured by number of subscriptions
in Nokia radio customers’ networks by 2030.
|
In line with Nokia’s long term goal, we work with our customers to provide broadband based
digital services on more subscriptions. The number of mobile broadband subscriptions in
Nokia radio customers’ networks has increased from 2022 to the end of 2023 by 372 million
(2022-2023: 772 million)(4).
|
On track |
2025 |
2021 |
Harness Nokia technology, capabilities and
funds to improve the lives of 1 500 000
through social digitalization projects,
digital skills building, and connecting the
unconnected or underserved by 2025(5).
|
We reached 130 832 reported direct beneficiaries(6) through social digitalization projects,
building digital skills, connecting the unconnected or underserved and improving inclusion,
equity and diversity. The current total reported direct beneficiaries for 2022 and 2023
were 691 534.
|
On track |
|
Business
overview
|
Corporate
governance
|
Operating and financial
review and prospects
|
General facts
on Nokia
|
Financial
statements
|
Other
information
|
88 |
|||||||
Strategic
focus area
|
Target
year
|
Base
year
|
Target |
2023 results |
Status |
Security and privacy | |||||
Security and
privacy
|
2023 |
N/A |
95% mandatory training completion related
to privacy.
|
In 2023, the mandatory training completion rate was 98%. |
Achieved |
Responsible Business | |||||
Health & safety |
2030 |
2016 |
100% of suppliers delivering high-risk activity
to meet “H&S preferred supplier” status
(score 4 or more out of 5) in our Health &
Safety Maturity Assessment.
|
18% of relevant suppliers met H&S “Preferred” supplier status. To reach the 2030 target,
Nokia continues to work with our supplier base, engaging and promoting the supplier safety
competences, offering safety training and setting supplier workshops in order to improve
supplier Health and Safety awareness and capability.
|
On track |
2023 |
N/A |
Zero critical or fatal incidents for employees
and suppliers.
|
In 2023, there were zero work-related fatal incidents involving employees. However, we
regret three work-related fatal incidents resulting in the death of one contractor/
subcontractor and two third-parties.(7)
|
Not achieved |
|
Inclusion &
diversity
|
2023 |
N/A |
Reach a minimum of 27% female hires in
global external recruits.
|
28% of external recruits were women. We achieved the 2023 target via increased marketing,
communication and talent attraction activities to make Nokia’s employer brand stand out for
diversity-friendly employment policies and attract diverse talent.
|
Reached |
Ethics &
compliance
|
2030 |
2016 |
Maintain 85% favorability of employee/line
manager engagement on ethics and compliance.
|
In 2023, 85% of employees said that their line manager talked to the team about the
importance of ethics and compliance.
|
Achieved |
2023 |
N/A |
Ethical Business Training completed by 95%
of employees.
|
98% of employees completed Ethical Business Training. |
Achieved |
|
Responsible
sourcing
|
2025 |
N/A |
98% 3TG traceability and conflict-free status
to smelter level in our supply chain as well as
conflict-free status of the smelters. Extended
due diligence and conflict-free status of
cobalt, mica and two additional minerals.
|
As of 2023, we have achieved 81% traceability to the smelter level in our supply chain as well
as conflict-free status of the smelters. We have also extended and conducted due diligence
for cobalt and mica and mapped the supply chains for additional minerals. For those due-
diligence will follow in the next years.
|
On track |
2025 |
2020 |
80% of suppliers achieve satisfactory
sustainability score (based on aggregated
weighted share) from supplier performance
evaluation (based on Corporate Responsibility
onsite audit programs, EcoVadis, CDP,
Conflict minerals).
|
80% of suppliers, on average, received a satisfactory sustainability score in our assessment
programs.
|
On track |
|
Business
overview
|
Corporate
governance
|
Operating and financial
review and prospects
|
General facts
on Nokia
|
Financial
statements
|
Other
information
|
89 |
|||||||
Business
overview
|
Corporate
governance
|
Operating and financial
review and prospects
|
General facts
on Nokia
|
Financial
statements
|
Other
information
|
90 |
|||||||
Nokia Board
of Directors
|
■Approves ESG strategy and evaluates ESG practices, related risks and target setting as well as their implementation and effectiveness.
■Specific sustainability topics are reviewed by Board Committees based on their responsibilities, including ESG reporting, materiality assessment,
ethics and compliance, cybersecurity, privacy, culture, human capital management and embedding sustainability in our technologies.
|
||
 |
|||
Group
Leadership
Team
|
■Reviews and approves implementation of and changes to sustainability-related policies, management and operational frameworks, strategy,
targets and performance, annual sustainability report and links to rewarding.
■Conducts sustainability review and provides feedback a minimum two times per year and as topic-specific areas require
■CEO, CFO and business group presidents review additional sustainability topics a minimum of two times per year as part of Nokia business reviews.
|
||
|
|
|
|
||||
Sustainability Council
■Steers the alignment of
sustainability strategy, priorities,
and the implementation of
sustainability activities across Nokia
■Contributes to the sustainability
strategy and materiality
assessment, and reviews
sustainability targets and
performance
■Provides additional insight to
sustainability-related risks and
opportunities
|
Donations and
Sponsorships Committee
■Sets principles for allocation
of corporate donations and
investments for universities
and communities
■Approves funds for donation
allocation and reviews major
sponsorships
■Assesses the impact of all
donation programs
|
Inclusion and Diversity
Steering Committee
■Reviews annual Inclusion and
Diversity (I&D) plans
■Sets Nokia-level I&D ambitions
and measures impact and targets
■Evaluates business group-level
I&D actions and provides feedback
to business groups
|
Human Rights Due
Diligence Council
■Governs high-level alignment
on Nokia’s Human Rights Policy
and implementing procedures
■Steers decisions on Nokia
businesses from a human rights
point of view.
■Ensures alignment between all
business groups and functions
and that appropriate
mitigations are put in place
|
||||
Members
Senior leaders from units representing
all business groups, Customer
Experience, Corporate Affairs, People,
Finance, Strategy and Technology and
Legal and Compliance. Convened ten
times in 2023.
|
Members
Chief Financial Officer, Chief Corporate
Affairs Officer, Chief People Officer, VP
Technology Leadership, Chief
Compliance Officer, Head of Customer
Experience Finance. Convened once
in 2023.
|
Members
Chief Legal Officer, Head of Inclusion
& Diversity, other senior leaders from
business groups, Human Resources,
ESG and legal, and representatives
from employee resource groups.
Did not convene in 2023(1).
|
Members
Chief Legal Officer, Chief Corporate
Affairs Officer, Chief Compliance
Officer, VP Sustainability, VP Technology
Leadership, other senior leaders per
need. Head of Human Rights, and Legal
Counsel. Convened twice in 2023.
|
||||
|
|
||||||
ESG function
The corporate ESG function drives the implementation of the ESG strategy and
actions needed to achieve targets at the operational level. Subject matter experts
contribute fact-based input to the different functions and business groups.
Ensures corporate sustainability reporting is in line with requirements and regulations.
|
Ethics and Compliance function
Supports employees with training and guidance, fostering ethical decision-making
and choices that are consistent with our values, policies, and laws. Promotes an
open reporting culture and oversees robust and impartial concern reporting,
investigation and remediation processes.
|
||||||
(1) Due to reorganization the Inclusion and Diversity Steering Committee did not meet during 2023 and the Sustainability governance model will be reviewed and updated in 2024. |
|||||||
Business
overview
|
Corporate
governance
|
Operating and financial
review and prospects
|
General facts
on Nokia
|
Financial
statements
|
Other
information
|
91 |
|||||||

Business
overview
|
Corporate
governance
|
Operating and financial
review and prospects
|
General facts
on Nokia
|
Financial
statements
|
Other
information
|
92 |
|||||||
Business
overview
|
Corporate
governance
|
Operating and financial
review and prospects
|
General facts
on Nokia
|
Financial
statements
|
Other
information
|
93 |
|||||||
Business
overview
|
Corporate
governance
|
Operating and financial
review and prospects
|
General facts
on Nokia
|
Financial
statements
|
Other
information
|
94 |
|||||||
Business
overview
|
Corporate
governance
|
Operating and financial
review and prospects
|
General facts
on Nokia
|
Financial
statements
|
Other
information
|
95 |
|||||||

Business
overview
|
Corporate
governance
|
Operating and financial
review and prospects
|
General facts
on Nokia
|
Financial
statements
|
Other
information
|
96 |
|||||||
Business
overview
|
Corporate
governance
|
Operating and financial
review and prospects
|
General facts
on Nokia
|
Financial
statements
|
Other
information
|
97 |
|||||||

Business
overview
|
Corporate
governance
|
Operating and financial
review and prospects
|
General facts
on Nokia
|
Financial
statements
|
Other
information
|
98 |
|||||||
Our Code of Conduct and the 14 main policy areas |
|||||||||
We do business the right way
■Conflict of interest
■Dealing with government officials
■Fair competition
■Improper payments (anti-corruption)
■Trade compliance
■Working with third parties
|
We respect our people and
community
■Environment
■Fair employment
■Health, safety & labor conditions
■Human rights
■Privacy
|
We safeguard our assets
■Controllership
■Intellectual property & confidential
information
■Insider trading
|
|||||||
Four defining principles |
||||||||||||
We follow the laws of the
countries where we do
business and adhere to
Nokia’s policies and
procedures
|
We personally set the
example for each other and
our stakeholders by
being honest and fair
|
We promote a culture of
integrity through mutual
respect, trust in each other
and high standards of ethics
in all our business dealings
|
We hold each other
accountable to the Code of
Conduct and if we are aware
of potential violations, we
promptly report them
|
|||||||||
Business
overview
|
Corporate
governance
|
Operating and financial
review and prospects
|
General facts
on Nokia
|
Financial
statements
|
Other
information
|
99 |
|||||||
Business
overview
|
Corporate
governance
|
Operating and financial
review and prospects
|
General facts
on Nokia
|
Financial
statements
|
Other
information
|
100 |
|||||||

Business
overview
|
Corporate
governance
|
Operating and financial
review and prospects
|
General facts
on Nokia
|
Financial
statements
|
Other
information
|
101 |
|||||||


Business
overview
|
Corporate
governance
|
Operating and financial
review and prospects
|
General facts
on Nokia
|
Financial
statements
|
Other
information
|
102 |
|||||||


Business
overview
|
Corporate
governance
|
Operating and financial
review and prospects
|
General facts
on Nokia
|
Financial
statements
|
Other
information
|
103 |
|||||||


Business
overview
|
Corporate
governance
|
Operating and financial
review and prospects
|
General facts
on Nokia
|
Financial
statements
|
Other
information
|
104 |
|||||||
Business
overview
|
Corporate
governance
|
Operating and financial
review and prospects
|
General facts
on Nokia
|
Financial
statements
|
Other
information
|
105 |
|||||||
Business
overview
|
Corporate
governance
|
Operating and financial
review and prospects
|
General facts
on Nokia
|
Financial
statements
|
Other
information
|
106 |
|||||||

31 December |
2023 |
2022 |
2021 |
2020 |
2019 |
Share capital, EURm |
246 |
246 |
246 |
246 |
246 |
Shares, (000s) |
5 613 497 |
5 632 298 |
5 675 461 |
5 653 886 |
5 640 536 |
Shares held by the Group, (000s) |
87 896 |
45 282 |
40 468 |
36 390 |
34 955 |
Number of shares excluding
shares held by the Group, (000s)
|
5 525 601 |
5 587 016 |
5 634 993 |
5 617 496 |
5 605 581 |
Average number of shares
excluding shares held by the
Group during the year
|
|||||
Basic, (000s)(1) |
5 549 468 |
5 614 182 |
5 630 025 |
5 612 418 |
5 599 912 |
Diluted, (000s)(1) |
5 585 923 |
5 670 020 |
5 684 235 |
5 612 418 |
5 626 375 |
Number of registered
shareholders(2)
|
247 893 |
238 359 |
233 844 |
246 886 |
248 526 |
Business
overview
|
Corporate
governance
|
Operating and financial
review and prospects
|
General facts
on Nokia
|
Financial
statements
|
Other
information
|
107 |
|||||||
For the year ended 31 December, Continuing operations |
2023 |
2022 |
2021 |
2020 |
2019 |
Earnings per share, basic, EUR |
0.12 |
0.75 |
0.29 |
(0.45) |
0.00 |
Earnings per share, diluted, EUR |
0.12 |
0.74 |
0.29 |
(0.45) |
0.00 |
P/E ratio |
25.42 |
5.77 |
19.22 |
neg. |
— |
Proposed dividend per share, EUR(1) |
0.13 |
0.12 |
0.08 |
0.00 |
0.00 |
Total dividends, EURm(1)(2) |
730 |
676 |
449 |
— |
— |
Payout ratio(1) |
1.08 |
0.16 |
0.28 |
— |
— |
Dividend yield %(1) |
4.26 |
2.77 |
1.44 |
— |
— |
31 December |
2023 |
2022 |
2021 |
2020 |
2019 |
Shareholders’ equity per share, EUR |
3.72 |
3.82 |
3.08 |
2.22 |
2.73 |
Share price(3) |
3.05 |
4.33 |
5.57 |
3.15 |
3.30 |
Market capitalization, EURm |
16 853 |
24 192 |
31 409 |
17 701 |
18 476 |
For the year ended 31 December |
2023 |
2022 |
2021 |
2020 |
2019 |
Number of shares traded during the
year (000s)(1)
|
7 754 279 |
10 294 615 |
16 560 334 |
13 903 762 |
11 003 630 |
Average number of shares excluding
shares held by the Group during the year
(000s)
|
5 549 468 |
5 614 182 |
5 630 025 |
5 612 418 |
5 599 912 |
Share turnover % |
140 |
183 |
294 |
248 |
196 |
EUR |
High |
Low |
Value |
2023 Full year High/Low |
4.70 |
2.70 |
|
2023 Full year Average (Volume-weighted) |
3.73 |
||
Year-end value 31 December 2023 |
3.05 |
||
Year-end value 31 December 2022 |
4.33 |
||
Change from 31 December 2022 to 31 December 2023 |
(29.6)% |
USD |
High |
Low |
Value |
2023 Full year High/Low |
5.04 |
2.94 |
|
2023 Full year Average (Volume-weighted) |
4.05 |
||
Year-end value 31 December 2023 |
3.42 |
||
Year-end value 31 December 2022 |
4.64 |
||
Change from 31 December 2022 to 31 December 2023 |
(26.3)% |
EUR |
High |
Low |
Value |
2023 Full year High/Low |
4.70 |
2.70 |
|
2023 Full year Average (Volume-weighted) |
3.76 |
||
Year-end value 31 December 2023 |
3.06 |
||
Year-end value 31 December 2022 |
4.34 |
||
Change from 31 December 2022 to 31 December 2023 |
(29.5)% |
Business
overview
|
Corporate
governance
|
Operating and financial
review and prospects
|
General facts
on Nokia
|
Financial
statements
|
Other
information
|
108 |
|||||||
Period |
Total number of shares
purchased
|
Average price paid per
share, EUR
|
Total number of shares
purchased as part of
publicly announced
plans or programs
|
Maximum value of
shares that may yet be
purchased under the
plans or programs, EUR
|
January |
6 156 200 |
4.44 |
6 156 200 |
272 653 299 |
February |
5 991 500 |
4.40 |
5 991 500 |
246 290 179 |
March |
6 871 300 |
4.39 |
6 871 300 |
216 111 864 |
April |
5 556 000 |
4.19 |
5 556 000 |
192 858 651 |
May |
7 845 100 |
3.77 |
7 845 100 |
163 286 436 |
June |
7 725 400 |
3.83 |
7 725 400 |
133 733 303 |
July |
8 004 933 |
3.69 |
8 004 933 |
104 229 737 |
August |
9 117 690 |
3.55 |
9 117 690 |
71 835 889 |
September |
8 030 700 |
3.68 |
8 030 700 |
42 257 048 |
October |
9 510 000 |
3.26 |
9 510 000 |
11 213 435 |
November |
3 492 188 |
3.21 |
3 492 188 |
— |
December |
— |
— |
— |
— |
Total |
78 301 011 |
3.83 |
78 301 011 |
— |
Business
overview
|
Corporate
governance
|
Operating and financial
review and prospects
|
General facts
on Nokia
|
Financial
statements
|
Other
information
|
109 |
|||||||
Shareholder |
Total number
of shares 000s
|
% of all shares |
% of all voting
rights
|
Solidium Oy |
325 000 |
5.79 |
5.79 |
Keskinäinen Työeläkevakuutusyhtiö Varma |
80 236 |
1.43 |
1.43 |
Keskinäinen Eläkevakuutusyhtiö Ilmarinen |
75 227 |
1.34 |
1.34 |
Keskinäinen Työeläkevakuutusyhtiö Elo |
46 066 |
0.82 |
0.82 |
Valtion Eläkerahasto |
37 000 |
0.66 |
0.66 |
Oy Lival Ab |
17 310 |
0.31 |
0.31 |
Svenska Litteratursällskapet i Finland r.f. |
15 217 |
0.27 |
0.27 |
OP Finland Fund |
14 833 |
0.26 |
0.26 |
Nordea Bank Abp |
14 047 |
0.25 |
0.25 |
Sijoitusrahasto Seligson & Co |
13 639 |
0.24 |
0.24 |
By number of shares owned |
Number of
shareholders
|
% of
shareholders
|
Total number
of shares
|
% of all shares |
1–100 |
64 068 |
25.85 |
3 099 887 |
0.06 |
101–1 000 |
113 516 |
45.79 |
50 199 617 |
0.89 |
1 001–10 000 |
61 876 |
24.96 |
193 112 400 |
3.44 |
10 001–100 000 |
7 916 |
3.19 |
195 350 157 |
3.48 |
100 001–500 000 |
408 |
0.17 |
79 398 334 |
1.41 |
500 001–1 000 000 |
37 |
0.02 |
25 598 078 |
0.46 |
1 000 001–5 000 000 |
44 |
0.02 |
99 933 974 |
1.78 |
Over 5 000 000 |
28 |
0.01 |
4 966 804 118 |
88.48 |
Total |
247 893 |
100 |
5 613 496 565 |
100 |
By nationality |
% of shares |
Non-Finnish shareholders |
74.45 |
Finnish shareholders |
25.55 |
Total |
100.00 |
By shareholder category (Finnish shareholders) |
% of shares |
Corporations |
3.37 |
Households |
7.79 |
Financial and insurance institutions |
2.80 |
Non-profit organizations |
1.23 |
Governmental bodies (incl. pension insurance companies) |
10.36 |
Total |
25.55 |
Business
overview
|
Corporate
governance
|
Operating and financial
review and prospects
|
General facts
on Nokia
|
Financial
statements
|
Other
information
|
110 |
|||||||
Business
overview
|
Corporate
governance
|
Operating and financial
review and prospects
|
General facts
on Nokia
|
Financial
statements
|
Other
information
|
111 |
|||||||
Business
overview
|
Corporate
governance
|
Operating and financial
review and prospects
|
General facts
on Nokia
|
Financial
statements
|
Other
information
|
112 |
|||||||
Business
overview
|
Corporate
governance
|
Operating and financial
review and prospects
|
General facts
on Nokia
|
Financial
statements
|
Other
information
|
113 |
|||||||
Business
overview
|
Corporate
governance
|
Operating and financial
review and prospects
|
General facts
on Nokia
|
Financial
statements
|
Other
information
|
114 |
|||||||
Business
overview
|
Corporate
governance
|
Operating and financial
review and prospects
|
General facts
on Nokia
|
Financial
statements
|
Other
information
|
115 |
|||||||
Business
overview
|
Corporate
governance
|
Operating and financial
review and prospects
|
General facts
on Nokia
|
Financial
statements
|
Other
information
|
116 |
|||||||
Business
overview
|
Corporate
governance
|
Operating and financial
review and prospects
|
General facts
on Nokia
|
Financial
statements
|
Other
information
|
117 |
|||||||
Business
overview
|
Corporate
governance
|
Operating and financial
review and prospects
|
General facts
on Nokia
|
Financial
statements
|
Other
information
|
118 |
|||||||
Business
overview
|
Corporate
governance
|
Operating and financial
review and prospects
|
General facts
on Nokia
|
Financial
statements
|
Other
information
|
119 |
|||||||
Business
overview
|
Corporate
governance
|
Operating and financial
review and prospects
|
General facts
on Nokia
|
Financial
statements
|
Other
information
|
120 |
|||||||
Business
overview
|
Corporate
governance
|
Operating and financial
review and prospects
|
General facts
on Nokia
|
Financial
statements
|
Other
information
|
121 |
|||||||
Business
overview
|
Corporate
governance
|
Operating and financial
review and prospects
|
General facts
on Nokia
|
Financial
statements
|
Other
information
|
122 |
|||||||
Business
overview
|
Corporate
governance
|
Operating and financial
review and prospects
|
General facts
on Nokia
|
Financial
statements
|
Other
information
|
123 |
|||||||
Business
overview
|
Corporate
governance
|
Operating and financial
review and prospects
|
General facts
on Nokia
|
Financial
statements
|
Other
information
|
124 |
|||||||
Business
overview
|
Corporate
governance
|
Operating and financial
review and prospects
|
General facts
on Nokia
|
Financial
statements
|
Other
information
|
125 |
|||||||
Business
overview
|
Corporate
governance
|
Operating and financial
review and prospects
|
General facts
on Nokia
|
Financial
statements
|
Other
information
|
126 |
|||||||
Business
overview
|
Corporate
governance
|
Operating and financial
review and prospects
|
General facts
on Nokia
|
Financial
statements
|
Other
information
|
127 |
|||||||
Business
overview
|
Corporate
governance
|
Operating and financial
review and prospects
|
General facts
on Nokia
|
Financial
statements
|
Other
information
|
128 |
|||||||
Business
overview
|
Corporate
governance
|
Operating and financial
review and prospects
|
General facts
on Nokia
|
Financial
statements
|
Other
information
|
129 |
|||||||
Business
overview
|
Corporate
governance
|
Operating and financial
review and prospects
|
General facts
on Nokia
|
Financial
statements
|
Other
information
|
130 |
|||||||

Business
overview
|
Corporate
governance
|
Operating and financial
review and prospects
|
General facts
on Nokia
|
Financial
statements
|
Other
information
|
131 |
|||||||
Service |
Fees, USD |
Issuance of ADSs |
Up to 5 cents per ADS(1) |
Cancellation of ADSs |
Up to 5 cents per ADS(1) |
Distribution of cash dividends or other
cash distributions
|
Up to 2 cents per ADS |
Distribution of ADSs pursuant to
(i) stock dividends, free stock
distributions or (ii) exercises of rights
to purchase additional ADSs
|
Up to 5 cents per ADS |
Distribution of securities other than
ADSs or rights to purchase additional
ADSs
|
Up to 5 cents per ADS(1) |
ADS transfer fee |
1.50 cents per transfer(1) |
Category |
Payment, USD |
Settlement infrastructure fees (including
the Depositary Trust Company fees)
|
1 047 044.65 |
Proxy process expenses (including
printing, postage and distribution)
|
1 853 812.02 |
Legal fees |
— |
NYSE listing fees |
500 000.00 |
Investor relations expenses |
9 095.92 |
Total |
3 409 952.59 |
Business
overview
|
Corporate
governance
|
Operating and financial
review and prospects
|
General facts
on Nokia
|
Financial
statements
|
Other
information
|
132 |
|||||||
Business
overview
|
Corporate
governance
|
Operating and financial
review and prospects
|
General facts
on Nokia
|
Financial
statements
|
Other
information
|
133 |
|||||||
Business
overview
|
Corporate
governance
|
Operating and financial
review and prospects
|
General facts
on Nokia
|
Financial
statements
|
Other
information
|
134 |
|||||||
Business
overview
|
Corporate
governance
|
Operating and financial
review and prospects
|
General facts
on Nokia
|
Financial
statements
|
Other
information
|
135 |
|||||||
Business
overview
|
Corporate
governance
|
Operating and financial
review and prospects
|
General facts
on Nokia
|
Financial
statements
|
Other
information
|
136 |
|||||||
Business
overview
|
Corporate
governance
|
Operating and financial
review and prospects
|
General facts
on Nokia
|
Financial
statements
|
Other
information
|
137 |
|||||||
EURm |
2023 |
2022 |
2021 |
Profit before tax |
1 499 |
2 184 |
1 926 |
Interest expense on interest-bearing liabilities |
201 |
103 |
113 |
Total |
1 700 |
2 287 |
2 039 |
Average capital and reserves attributable to equity holders
of the parent(1)
|
20 935 |
19 347 |
14 913 |
Average non-controlling interests(1) |
92 |
98 |
91 |
Average interest-bearing liabilities(1) |
4 334 |
4 565 |
5 115 |
Total capital employed |
25 361 |
24 010 |
20 119 |
Return on capital employed % |
6.7% |
9.5% |
10.1% |
EURm |
2023 |
2022 |
2021 |
Profit/(loss) for the year attributable to equity holders of
the parent
|
665 |
4 250 |
1 623 |
Average capital and reserves attributable to equity holders
of the parent(1)
|
20 935 |
19 347 |
14 913 |
Return on shareholders’ equity % |
3.2% |
22.0% |
10.9% |
EURm |
2023 |
2022 |
2021 |
Total capital and reserves attributable to equity holders of
the parent
|
20 537 |
21 333 |
17 360 |
Non-controlling interests |
91 |
93 |
102 |
Shareholders’ equity |
20 628 |
21 426 |
17 462 |
Total assets |
39 860 |
42 943 |
40 049 |
Equity ratio % |
51.8% |
49.9% |
43.6% |
Business
overview
|
Corporate
governance
|
Operating and financial
review and prospects
|
General facts
on Nokia
|
Financial
statements
|
Other
information
|
138 |
|||||||
EURm |
2023 |
2022 |
2021 |
Cash and cash equivalents |
6 234 |
5 467 |
6 691 |
Current interest-bearing financial investments |
1 565 |
3 080 |
2 577 |
Non-current interest-bearing financial investments |
715 |
697 |
— |
Total cash and interest-bearing financial investments |
8 514 |
9 244 |
9 268 |
EURm |
2023 |
2022 |
2021 |
Total cash and interest-bearing financial investments |
|||
Cash and cash equivalents |
6 234 |
5 467 |
6 691 |
Current interest-bearing financial investments |
1 565 |
3 080 |
2 577 |
Non-current interest-bearing financial investments |
715 |
697 |
— |
Interest-bearing liabilities |
|||
Long-term interest-bearing liabilities |
(3 637) |
(4 249) |
(4 537) |
Short-term interest-bearing liabilities |
(554) |
(228) |
(116) |
Net cash and interest-bearing financial investments |
4 323 |
4 767 |
4 615 |
EURm |
2023 |
2022 |
2021 |
Interest-bearing liabilities |
|||
Long-term interest-bearing liabilities |
3 637 |
4 249 |
4 537 |
Short-term interest-bearing liabilities |
554 |
228 |
116 |
Total cash and interest-bearing financial investments |
|||
Cash and cash equivalents |
(6 234) |
(5 467) |
(6 691) |
Current interest-bearing financial investments |
(1 565) |
(3 080) |
(2 577) |
Non-current interest-bearing financial investments |
(715) |
(697) |
— |
Net debt |
(4 323) |
(4 767) |
(4 615) |
Total capital and reserves attributable to equity holders of
the parent
|
20 537 |
21 333 |
17 360 |
Non-controlling interests |
91 |
93 |
102 |
Shareholders’ equity |
20 628 |
21 426 |
17 462 |
Net debt to equity (gearing) % |
(21.0)% |
(22.2)% |
(26.4)% |
Business
overview
|
Corporate
governance
|
Operating and financial
review and prospects
|
General facts
on Nokia
|
Financial
statements
|
Other
information
|
139 |
|||||||
EURm |
2023 |
2022 |
2021 |
Net cash flows from operating activities |
1 317 |
1 474 |
2 625 |
Purchase of property, plant and equipment and intangible
assets (capital expenditures)
|
(652) |
(601) |
(560) |
Free cash flow |
665 |
873 |
2 065 |
EURm |
2023 |
2022 |
2021 |
Purchase of property, plant and equipment and intangible
assets
|
(652) |
(601) |
(560) |
Capital expenditure |
(652) |
(601) |
(560) |
EURm |
2023 |
2022 |
2021 |
Operating profit |
1 688 |
2 318 |
2 158 |
Restructuring and associated charges |
356 |
177 |
263 |
Amortization of acquired intangible assets |
352 |
411 |
391 |
Costs associated with country exit |
(49) |
98 |
— |
Impairment and write-off of assets, net of reversals |
25 |
97 |
45 |
Settlement of legal disputes |
— |
— |
(80) |
Gain on sale of fixed assets |
— |
— |
(53) |
Other |
3 |
8 |
51 |
Comparable operating profit |
2 375 |
3 109 |
2 775 |
EURm |
2023 |
2022 |
2021 |
Comparable operating profit |
2 375 |
3 109 |
2 775 |
Net sales |
22 258 |
24 911 |
22 202 |
Comparable operating margin % |
10.7% |
12.5% |
12.5% |
Business
overview
|
Corporate
governance
|
Operating and financial
review and prospects
|
General facts
on Nokia
|
Financial
statements
|
Other
information
|
140 |
|||||||

Consolidated statement of cash flows |
|
1.3. Use of estimates and critical accounting
judgments
|
|
Section 2:
Results for the year
|
|
Section 3:
Compensation and benefits
|
|
Section 4:
Operating assets and liabilities
|
|
Section 5:
Capital and financial instruments
|
|
Section 6:
Other information
|
|
Business
overview
|
Corporate
governance
|
Operating and financial
review and prospects
|
General facts
on Nokia
|
Financial
statements
|
Other
information
|
141 |
|||||||
EURm |
Note |
2023 |
2022 |
2021 |
Net sales |
2.1, 2.2 |
22 258 |
24 911 |
22 202 |
Cost of sales |
2.3 |
(13 571) |
(14 689) |
(13 368) |
Gross profit |
8 687 |
10 222 |
8 834 |
|
Research and development expenses |
2.3 |
(4 327) |
(4 550) |
(4 214) |
Selling, general and administrative expenses |
2.3 |
(2 929) |
(3 013) |
(2 792) |
Other operating income |
2.3 |
166 |
98 |
443 |
Other operating expenses |
2.3 |
91 |
(439) |
(113) |
Operating profit |
1 688 |
2 318 |
2 158 |
|
Share of results of associates and joint ventures |
6.4 |
(39) |
(26) |
9 |
Financial income(1) |
2.4 |
425 |
178 |
69 |
Financial expenses(1) |
2.4 |
(575) |
(286) |
(310) |
Profit before tax |
1 499 |
2 184 |
1 926 |
|
Income tax (expense)/benefit |
2.5 |
(825) |
2 026 |
(272) |
Profit from continuing operations |
674 |
4 210 |
1 654 |
|
Profit/(loss) from discontinued operations |
5 |
49 |
(9) |
|
Profit for the year |
679 |
4 259 |
1 645 |
|
Attributable to: |
||||
Equity holders of the parent |
665 |
4 250 |
1 623 |
|
Non-controlling interests |
14 |
9 |
22 |
|
Earnings per share attributable to equity holders of the parent |
2.6 |
EUR |
EUR |
EUR |
Basic |
||||
Profit from continuing operations |
0.12 |
0.75 |
0.29 |
|
Profit for the year |
0.12 |
0.76 |
0.29 |
|
Diluted |
||||
Profit from continuing operations |
0.12 |
0.74 |
0.29 |
|
Profit for the year |
0.12 |
0.75 |
0.29 |
(1)In 2023, Nokia changed the presentation of net interest income on defined benefit plans within financial income and expenses. The comparative amounts for 2022 and 2021
have been recast accordingly. Refer to Note 2.4. Financial income and expenses for more information.
|
Business
overview
|
Corporate
governance
|
Operating and financial
review and prospects
|
General facts
on Nokia
|
Financial
statements
|
Other
information
|
142 |
|||||||
EURm |
Note |
2023 |
2022 |
2021 |
Profit for the year |
679 |
4 259 |
1 645 |
|
Items that will not be reclassified to profit or loss |
||||
Remeasurements of defined benefit plans |
(343) |
(424) |
3 040 |
|
Income tax related to items that will not be reclassified to profit or loss |
2.5 |
61 |
77 |
(755) |
Total of items that will not be reclassified to profit or loss |
(282) |
(347) |
2 285 |
|
Items that may be reclassified to profit or loss |
||||
Translation differences |
||||
Exchange differences on translating foreign operations |
(554) |
696 |
1 160 |
|
Transfer to income statement |
19 |
14 |
(7) |
|
Net investment hedges |
||||
Net fair value gains/(losses) |
135 |
(127) |
(249) |
|
Cash flow and other hedges |
||||
Net fair value losses |
(24) |
(15) |
(10) |
|
Transfer to income statement |
(37) |
98 |
10 |
|
Financial assets at fair value through other comprehensive income |
||||
Net fair value losses |
(110) |
(264) |
(25) |
|
Transfer to income statement |
120 |
218 |
32 |
|
Other decrease, net |
(4) |
(3) |
— |
|
Income tax related to items that may be reclassified to profit or loss |
2.5 |
(10) |
(21) |
2 |
Total of items that may be reclassified to profit or loss |
(465) |
596 |
913 |
|
Other comprehensive (loss)/income, net of tax |
(747) |
249 |
3 198 |
|
Total comprehensive (loss)/income for the year |
(68) |
4 508 |
4 843 |
|
Attributable to: |
||||
Equity holders of the parent |
(78) |
4 500 |
4 814 |
|
Non-controlling interests |
10 |
8 |
29 |
Business
overview
|
Corporate
governance
|
Operating and financial
review and prospects
|
General facts
on Nokia
|
Financial
statements
|
Other
information
|
143 |
|||||||
EURm |
Note |
2023 |
2022 |
ASSETS |
|||
Non-current assets |
|||
Goodwill |
4.1 |
5 504 |
5 667 |
Other intangible assets |
4.1 |
1 086 |
1 263 |
Property, plant and equipment |
4.2 |
1 951 |
2 015 |
Right-of-use assets |
4.3 |
906 |
929 |
Investments in associated companies and joint ventures |
6.4 |
88 |
199 |
Non-current interest-bearing financial investments |
5.2, 5.4 |
715 |
697 |
Other non-current financial assets |
5.2, 5.4 |
1 100 |
1 080 |
Defined benefit pension assets |
3.4 |
6 258 |
6 754 |
Deferred tax assets |
2.5 |
3 873 |
3 834 |
Other non-current receivables |
4.6 |
213 |
239 |
Total non-current assets |
21 694 |
22 677 |
|
Current assets |
|||
Inventories |
4.4 |
2 719 |
3 265 |
Trade receivables |
4.5, 5.2, 5.4 |
4 921 |
5 549 |
Contract assets |
4.5 |
1 136 |
1 203 |
Current income tax assets |
2.5 |
307 |
153 |
Other current receivables |
4.6 |
764 |
934 |
Current interest-bearing financial investments |
5.2, 5.4 |
1 565 |
3 080 |
Other current financial and firm commitment assets |
5.2, 5.3, 5.4 |
441 |
615 |
Cash and cash equivalents |
5.2, 5.4 |
6 234 |
5 467 |
Total current assets |
18 087 |
20 266 |
|
Assets held for sale |
6.4 |
79 |
— |
Total assets |
39 860 |
42 943 |
|
EURm |
Note |
2023 |
2022 |
SHAREHOLDERS’ EQUITY AND LIABILITIES |
|||
Equity |
|||
Share capital |
246 |
246 |
|
Share premium |
628 |
503 |
|
Treasury shares |
(352) |
(352) |
|
Translation differences |
(249) |
169 |
|
Fair value and other reserves |
3 605 |
3 905 |
|
Reserve for invested unrestricted equity |
15 255 |
15 487 |
|
Retained earnings |
1 404 |
1 375 |
|
Total shareholders’ equity |
20 537 |
21 333 |
|
Non-controlling interests |
91 |
93 |
|
Total equity |
5.1 |
20 628 |
21 426 |
Non-current liabilities |
|||
Long-term interest-bearing liabilities |
5.2, 5.3, 5.4 |
3 637 |
4 249 |
Long-term lease liabilities |
5.4 |
799 |
858 |
Defined benefit pension and post-employment liabilities |
3.4 |
2 299 |
2 459 |
Deferred tax liabilities |
2.5 |
725 |
332 |
Contract liabilities |
4.5 |
210 |
120 |
Other non-current liabilities |
4.6 |
111 |
103 |
Provisions |
4.7 |
518 |
622 |
Total non-current liabilities |
8 299 |
8 743 |
|
Current liabilities |
|||
Short-term interest-bearing liabilities |
5.2, 5.3, 5.4 |
554 |
228 |
Short-term lease liabilities |
5.4 |
198 |
184 |
Other financial and firm commitment liabilities |
5.2, 5.3, 5.4 |
830 |
1 038 |
Contract liabilities |
4.5 |
2 157 |
1 977 |
Current income tax liabilities |
2.5 |
203 |
185 |
Trade payables |
5.2, 5.4 |
3 423 |
4 730 |
Other current liabilities |
4.6 |
2 824 |
3 619 |
Provisions |
4.7 |
744 |
813 |
Total current liabilities |
10 933 |
12 774 |
|
Total liabilities |
19 232 |
21 517 |
|
Total shareholders’ equity and liabilities |
39 860 |
42 943 |
Business
overview
|
Corporate
governance
|
Operating and financial
review and prospects
|
General facts
on Nokia
|
Financial
statements
|
Other
information
|
144 |
|||||||
EURm |
Note |
2023 |
2022 |
2021 |
Profit for the year |
679 |
4 259 |
1 645 |
|
Adjustments, total(1) |
2 559 |
(446) |
1 713 |
|
Change in net working capital(2) |
(1 282) |
(1 843) |
(268) |
|
Cash flows from operations |
1 956 |
1 970 |
3 090 |
|
Interest received |
178 |
65 |
41 |
|
Interest paid |
4.3, 5.2 |
(241) |
(180) |
(192) |
Income taxes paid, net |
(576) |
(381) |
(314) |
|
Net cash flows from operating activities |
1 317 |
1 474 |
2 625 |
|
Purchase of property, plant and equipment and intangible assets |
(652) |
(601) |
(560) |
|
Proceeds from sale of property, plant and equipment and intangible assets |
189 |
33 |
103 |
|
Acquisition of businesses, net of cash acquired |
(19) |
(20) |
(33) |
|
Proceeds from disposal of businesses, net of cash disposed |
17 |
— |
— |
|
Purchase of interest-bearing financial investments |
(1 855) |
(3 595) |
(1 845) |
|
Proceeds from interest-bearing financial investments |
3 382 |
2 397 |
398 |
|
Purchase of other non-current financial assets |
(83) |
(115) |
(77) |
|
Proceeds from other non-current financial assets |
34 |
49 |
277 |
|
Other |
30 |
(28) |
(58) |
|
Net cash flows from/(used in) investing activities |
1 043 |
(1 880) |
(1 795) |
|
Acquisition of treasury shares |
5.1 |
(300) |
(300) |
— |
Proceeds from long-term borrowings |
5.4 |
496 |
8 |
17 |
Repayment of long-term borrowings |
5.4 |
(798) |
(2) |
(927) |
(Repayment of)/proceeds from short-term borrowings |
5.4 |
(40) |
27 |
(67) |
Payment of principal portion of lease liabilities |
4.3, 5.4 |
(239) |
(217) |
(226) |
Dividends paid |
5.1 |
(621) |
(353) |
(9) |
Net cash flows used in financing activities |
(1 502) |
(837) |
(1 212) |
|
Translation differences |
(91) |
19 |
133 |
|
Net increase/(decrease) in cash and cash equivalents |
767 |
(1 224) |
(249) |
|
Cash and cash equivalents at 1 January |
5 467 |
6 691 |
6 940 |
|
Cash and cash equivalents at 31 December |
6 234 |
5 467 |
6 691 |
|
The consolidated statement of cash flows combines cash flows from both continuing and discontinued operations. | ||||
The notes are an integral part of these consolidated financial statements. | ||||
(1) Adjustments |
|||
EURm |
2023 |
2022 |
2021 |
Depreciation and amortization |
1 087 |
1 140 |
1 095 |
Share-based payments |
202 |
149 |
108 |
Impairment charges |
25 |
152 |
40 |
Restructuring charges |
316 |
125 |
183 |
Loss/(gain) from other non-current
financial assets
|
56 |
(27) |
(188) |
Gain on sale of property, plant and
equipment
|
(143) |
(35) |
(59) |
Financial income and expenses |
148 |
28 |
240 |
Income tax expense/(benefit) |
825 |
(2 030) |
273 |
Other adjustments, net |
43 |
52 |
21 |
Total |
2 559 |
(446) |
1 713 |
(2) Change in net working capital | |||
EURm |
2023 |
2022 |
2021 |
Decrease/(increase) in receivables |
304 |
(451) |
239 |
Decrease/(increase) in inventories |
443 |
(991) |
(48) |
Decrease in non-interest-bearing liabilities |
(2 029) |
(401) |
(459) |
Total |
(1 282) |
(1 843) |
(268) |
Business
overview
|
Corporate
governance
|
Operating and financial
review and prospects
|
General facts
on Nokia
|
Financial
statements
|
Other
information
|
145 |
|||||||
EURm |
Note |
Share capital |
Share premium |
Treasury
shares
|
Translation
differences
|
Fair value and
other reserves
|
Reserve for
invested
unrestricted
equity
|
Retained
earnings/
(Accumulated
deficit)
|
Total
shareholders’
equity
|
Non-controlling
interests
|
Total equity |
1 January 2021 |
246 |
443 |
(352) |
(1 295) |
1 910 |
15 656 |
(4 143) |
12 465 |
80 |
12 545 |
|
Profit for the year |
1 623 |
1 623 |
22 |
1 645 |
|||||||
Other comprehensive income |
5.1 |
899 |
2 309 |
(17) |
3 191 |
7 |
3 198 |
||||
Total comprehensive income for the year |
— |
— |
— |
899 |
2 309 |
— |
1 606 |
4 814 |
29 |
4 843 |
|
Share-based payments |
108 |
108 |
108 |
||||||||
Settlement of share-based payments |
(97) |
70 |
(27) |
(27) |
|||||||
Dividends |
5.1 |
— |
(7) |
(7) |
|||||||
Total transactions with owners |
— |
11 |
— |
— |
— |
70 |
— |
81 |
(7) |
74 |
|
31 December 2021 |
246 |
454 |
(352) |
(396) |
4 219 |
15 726 |
(2 537) |
17 360 |
102 |
17 462 |
|
Profit for the year |
4 250 |
4 250 |
9 |
4 259 |
|||||||
Other comprehensive income |
5.1 |
565 |
(314) |
(1) |
250 |
(1) |
249 |
||||
Total comprehensive income for the year |
— |
— |
— |
565 |
(314) |
— |
4 249 |
4 500 |
8 |
4 508 |
|
Share-based payments |
149 |
149 |
149 |
||||||||
Settlement of share-based payments |
(100) |
73 |
(27) |
(27) |
|||||||
Acquisition of treasury shares(1) |
5.1 |
(300) |
(12) |
(312) |
(312) |
||||||
Cancellation of treasury shares(1) |
5.1 |
300 |
(300) |
— |
— |
||||||
Dividends |
5.1 |
(337) |
(337) |
(17) |
(354) |
||||||
Total transactions with owners |
— |
49 |
— |
— |
— |
(239) |
(337) |
(527) |
(17) |
(544) |
|
31 December 2022 |
246 |
503 |
(352) |
169 |
3 905 |
15 487 |
1 375 |
21 333 |
93 |
21 426 |
|
Profit for the year |
665 |
665 |
14 |
679 |
|||||||
Other comprehensive loss |
5.1 |
(418) |
(300) |
(25) |
(743) |
(4) |
(747) |
||||
Total comprehensive income for the year |
— |
— |
— |
(418) |
(300) |
— |
640 |
(78) |
10 |
(68) |
|
Share-based payments |
202 |
202 |
202 |
||||||||
Settlement of share-based payments |
(77) |
59 |
(18) |
(18) |
|||||||
Acquisition of treasury shares(1) |
5.1 |
(303) |
12 |
(291) |
(291) |
||||||
Cancellation of treasury shares(1) |
5.1 |
303 |
(303) |
— |
— |
||||||
Disposal of subsidiaries |
— |
(2) |
(2) |
||||||||
Dividends |
5.1 |
(611) |
(611) |
(10) |
(621) |
||||||
Total transactions with owners |
— |
125 |
— |
— |
— |
(232) |
(611) |
(718) |
(12) |
(730) |
|
31 December 2023 |
246 |
628 |
(352) |
(249) |
3 605 |
15 255 |
1 404 |
20 537 |
91 |
20 628 |
Business
overview
|
Corporate
governance
|
Operating and financial
review and prospects
|
General facts
on Nokia
|
Financial
statements
|
Other
information
|
146 |
|||||||
Section 1 |
Business
overview
|
Corporate
governance
|
Operating and financial
review and prospects
|
General facts
on Nokia
|
Financial
statements
|
Other
information
|
147 |
|||||||
Key accounting estimates and
judgments
|
Note |
Judgment related to recognition
of deferred tax assets
|
2.5. Income taxes |
Estimate of pension and other
post-employment benefit
obligations
|
3.4. Pensions and other
post-employment benefits
|
Business
overview
|
Corporate
governance
|
Operating and financial
review and prospects
|
General facts
on Nokia
|
Financial
statements
|
Other
information
|
148 |
|||||||
Business
overview
|
Corporate
governance
|
Operating and financial
review and prospects
|
General facts
on Nokia
|
Financial
statements
|
Other
information
|
149 |
|||||||
Section 2 |
Business
overview
|
Corporate
governance
|
Operating and financial
review and prospects
|
General facts
on Nokia
|
Financial
statements
|
Other
information
|
150 |
|||||||
Business
overview
|
Corporate
governance
|
Operating and financial
review and prospects
|
General facts
on Nokia
|
Financial
statements
|
Other
information
|
151 |
|||||||
EURm |
2023 |
2022 |
2021 |
Asia Pacific |
2 291 |
2 648 |
2 472 |
Europe |
5 873 |
6 662 |
6 313 |
Greater China |
1 303 |
1 581 |
1 512 |
India |
2 842 |
1 290 |
1 035 |
Latin America |
1 046 |
1 223 |
983 |
Middle East & Africa |
2 050 |
1 969 |
1 771 |
North America |
5 733 |
8 388 |
7 187 |
Submarine Networks |
1 120 |
1 150 |
929 |
Total |
22 258 |
24 911 |
22 202 |
EURm |
2023 |
2022 |
2021 |
Communications service providers |
17 652 |
19 921 |
17 977 |
Enterprise |
2 282 |
1 997 |
1 575 |
Licensees |
1 085 |
1 595 |
1 502 |
Other(1) |
1 239 |
1 398 |
1 148 |
Total |
22 258 |
24 911 |
22 202 |
2023 |
2022 |
|
Within 1 year |
51% |
75% |
2-3 years |
30% |
21% |
More than 3 years |
19% |
4% |
Total |
100% |
100% |
Business
overview
|
Corporate
governance
|
Operating and financial
review and prospects
|
General facts
on Nokia
|
Financial
statements
|
Other
information
|
152 |
|||||||
Business
overview
|
Corporate
governance
|
Operating and financial
review and prospects
|
General facts
on Nokia
|
Financial
statements
|
Other
information
|
153 |
|||||||
EURm |
Network
Infrastructure(1)
|
Mobile
Networks
|
Cloud and
Network
Services
|
Nokia
Technologies
|
Group
Common and
Other
|
Eliminations
and
unallocated
items(2)
|
Nokia Group |
2023 |
|||||||
Net sales to external customers |
8 039 |
9 791 |
3 219 |
1 085 |
124 |
— |
22 258 |
Net sales to other segments |
(2) |
6 |
1 |
— |
6 |
(11) |
— |
Operating profit/(loss) |
1 054 |
723 |
255 |
734 |
(391) |
(687) |
1 688 |
Share of results of associated companies and
joint ventures
|
— |
(30) |
7 |
12 |
— |
(28) |
(39) |
Financial income and expenses |
(150) |
||||||
Profit before tax |
1 499 |
||||||
Other segment items |
|||||||
Depreciation and amortization |
(235) |
(366) |
(81) |
(39) |
(14) |
(352) |
(1 087) |
2022 |
|||||||
Net sales to external customers |
9 044 |
10 658 |
3 350 |
1 583 |
276 |
— |
24 911 |
Net sales to other segments |
3 |
13 |
1 |
12 |
19 |
(48) |
— |
Operating profit/(loss) |
1 102 |
940 |
177 |
1 208 |
(318) |
(791) |
2 318 |
Share of results of associated companies and
joint ventures
|
— |
(11) |
6 |
(8) |
— |
(13) |
(26) |
Financial income and expenses |
(108) |
||||||
Profit before tax |
2 184 |
||||||
Other segment items |
|||||||
Depreciation and amortization |
(229) |
(347) |
(91) |
(34) |
(28) |
(411) |
(1 140) |
2021 |
|||||||
Net sales to external customers |
7 673 |
9 711 |
3 088 |
1 490 |
240 |
— |
22 202 |
Net sales to other segments |
1 |
6 |
1 |
12 |
17 |
(37) |
— |
Operating profit/(loss) |
784 |
765 |
166 |
1 185 |
(125) |
(617) |
2 158 |
Share of results of associated companies and
joint ventures
|
(1) |
6 |
6 |
(2) |
— |
— |
9 |
Financial income and expenses |
(241) |
||||||
Profit before tax |
1 926 |
||||||
Other segment items |
|||||||
Depreciation and amortization |
(208) |
(338) |
(95) |
(33) |
(30) |
(391) |
(1 095) |
(1)Includes IP Networks net sales of EUR 2 606 million (EUR 3 063 million in 2022 and EUR 2 679 million in 2021), Optical Networks net sales of EUR 1 942 million (EUR 1 891 million
in 2022 and EUR 1 708 million in 2021), Fixed Networks net sales of EUR 2 369 million (EUR 2 943 million in 2022 and EUR 2 358 million in 2021) and Submarine Networks net
sales of EUR 1 120 million (EUR 1 150 million in 2022 and EUR 929 million in 2021).
(2)Unallocated items comprise costs related to intangible asset amortization, restructuring-related charges, impairments and certain other items.
|
EURm |
2023 |
2022 |
2021 |
|
Total segment operating profit |
2 375 |
3 109 |
2 775 |
|
Restructuring and associated
charges
|
(356) |
(177) |
(263) |
|
Amortization of acquired
intangible assets
|
(352) |
(411) |
(391) |
|
Costs associated with country exit |
49 |
(98) |
— |
|
Impairment and write-off of
assets, net of reversals
|
(25) |
(97) |
(45) |
|
Settlement of legal disputes |
— |
— |
80 |
|
Gain on sale of fixed assets |
— |
— |
53 |
|
Other |
(3) |
(8) |
(51) |
|
Operating profit for the Group |
1 688 |
2 318 |
2 158 |
Business
overview
|
Corporate
governance
|
Operating and financial
review and prospects
|
General facts
on Nokia
|
Financial
statements
|
Other
information
|
154 |
|||||||
EURm |
2023 |
2022 |
2021 |
Finland |
1 192 |
1 697 |
1 605 |
United States |
5 373 |
7 949 |
6 791 |
India |
2 835 |
1 283 |
1 022 |
France |
792 |
862 |
847 |
Great Britain |
786 |
759 |
650 |
Other |
11 280 |
12 361 |
11 287 |
Total |
22 258 |
24 911 |
22 202 |
EURm |
2023 |
2022 |
Finland |
1 549 |
1 365 |
United States |
4 383 |
5 032 |
France |
2 139 |
2 180 |
Other |
1 376 |
1 297 |
Total |
9 447 |
9 874 |
EURm |
2023 |
2022 |
2021 |
Personnel expenses |
7 470 |
7 903 |
7 541 |
Cost of material |
7 825 |
8 481 |
6 320 |
Project subcontracting and other
customer contract expenses
|
2 949 |
3 156 |
4 225 |
Depreciation and amortization |
1 087 |
1 140 |
1 095 |
IT services |
399 |
376 |
230 |
Impairment charges |
25 |
90 |
39 |
Other |
981 |
1 545 |
1 037 |
Total operating expenses |
20 736 |
22 691 |
20 487 |
EURm |
2023 |
2022 |
2021 |
Cost of sales |
153 |
85 |
133 |
Research and development expenses |
61 |
37 |
73 |
Selling, general and administrative
expenses
|
137 |
46 |
78 |
Total restructuring charges |
351 |
168 |
284 |
Business
overview
|
Corporate
governance
|
Operating and financial
review and prospects
|
General facts
on Nokia
|
Financial
statements
|
Other
information
|
155 |
|||||||
EURm |
2023 |
2022 |
2021 |
Gain on sale of property, plant and equipment including divested
business
|
168 |
7 |
66 |
Subsidies and government grants |
— |
20 |
43 |
(Losses)/gains from venture funds |
(56) |
27 |
188 |
Settlements and resolutions of legal disputes |
— |
— |
90 |
Other |
54 |
44 |
56 |
Total |
166 |
98 |
443 |
EURm |
2023 |
2022 |
2021 |
Expected credit losses on trade receivables |
(4) |
(107) |
16 |
Impairment of disposal groups |
— |
(72) |
— |
Changes in provisions |
37 |
(134) |
(77) |
Foreign exchange gains/(losses) on hedging forecasted sales and
purchases
|
80 |
(107) |
45 |
Other |
(22) |
(19) |
(97) |
Total |
91 |
(439) |
(113) |
EURm |
2023 |
2022 |
2021 |
Interest income on financial investments |
199 |
69 |
21 |
Interest income on financing components of other contracts |
21 |
13 |
28 |
Net interest income on defined benefit plans(1) |
187 |
92 |
26 |
Other financial income(2) |
18 |
4 |
(6) |
Total |
425 |
178 |
69 |
EURm |
2023 |
2022 |
2021 |
Interest expense on interest-bearing liabilities |
(201) |
(103) |
(113) |
Negative interest on financial investments |
(3) |
(27) |
(29) |
Interest expense on financing components of other contracts(1) |
(126) |
(66) |
(40) |
Interest expense on lease liabilities |
(28) |
(26) |
(24) |
Net fair value (losses)/gains on hedged items under fair value hedge
accounting
|
(93) |
262 |
25 |
Net fair value gains/(losses) on hedging instruments under fair value
hedge accounting
|
89 |
(265) |
(25) |
Net foreign exchange (losses)/gains |
(187) |
20 |
(60) |
Other financial expenses(2) |
(26) |
(81) |
(44) |
Total |
(575) |
(286) |
(310) |
Business
overview
|
Corporate
governance
|
Operating and financial
review and prospects
|
General facts
on Nokia
|
Financial
statements
|
Other
information
|
156 |
|||||||
Business
overview
|
Corporate
governance
|
Operating and financial
review and prospects
|
General facts
on Nokia
|
Financial
statements
|
Other
information
|
157 |
|||||||
EURm |
2023 |
2022 |
2021 |
Current tax expense |
(431) |
(426) |
(409) |
Deferred tax (expense)/benefit |
(394) |
2 452 |
137 |
Total |
(825) |
2 026 |
(272) |
EURm |
2023 |
2022 |
2021 |
Income tax expense at statutory rate |
(300) |
(437) |
(385) |
Permanent differences |
139 |
87 |
47 |
Non-creditable withholding taxes |
(41) |
(72) |
(37) |
Income taxes for prior years(1) |
22 |
3 |
95 |
Effect of different tax rates of subsidiaries operating in other jurisdictions |
(140) |
(68) |
(57) |
Effect of deferred tax assets not recognized(2) |
(524) |
(107) |
(77) |
Benefit arising from previously unrecognized deferred tax assets(3) |
25 |
2 646 |
187 |
Net (increase)/decrease in uncertain tax positions |
(15) |
9 |
(29) |
Change in income tax rates |
32 |
24 |
17 |
Income taxes on undistributed earnings |
(23) |
(59) |
(33) |
Total |
(825) |
2 026 |
(272) |
2023 |
2022 |
||||||
Deferred |
Deferred |
Net |
Deferred |
Deferred |
Net |
||
EURm |
tax assets |
tax liabilities |
balance |
tax assets |
tax liabilities |
balance |
|
Tax losses carried forward and
unused tax credits
|
1 083 |
(21) |
1 011 |
— |
|||
Undistributed earnings |
— |
(215) |
— |
(193) |
|||
Intangible assets and property,
plant and equipment
|
2 962 |
(312) |
3 267 |
(309) |
|||
Right-of-use assets |
— |
(177) |
— |
(177) |
|||
Defined benefit pension assets |
— |
(1 913) |
— |
(1 989) |
|||
Other non-current assets |
83 |
(37) |
66 |
(30) |
|||
Inventories |
185 |
(18) |
216 |
(18) |
|||
Other current assets |
221 |
(93) |
225 |
(95) |
|||
Lease liabilities |
156 |
— |
176 |
— |
|||
Defined benefit pension and other
post-employment liabilities
|
991 |
— |
925 |
— |
|||
Other non-current liabilities |
14 |
(1) |
18 |
— |
|||
Provisions |
245 |
(138) |
311 |
(73) |
|||
Other current liabilities |
301 |
(184) |
326 |
(154) |
|||
Other temporary differences |
33 |
(17) |
27 |
(28) |
|||
Total before netting |
6 274 |
(3 126) |
3 148 |
6 568 |
(3 066) |
3 502 |
|
Netting of deferred tax assets and
liabilities
|
(2 401) |
2 401 |
— |
(2 734) |
2 734 |
— |
|
Total after netting |
3 873 |
(725) |
3 148 |
3 834 |
(332) |
3 502 |
|
Business
overview
|
Corporate
governance
|
Operating and financial
review and prospects
|
General facts
on Nokia
|
Financial
statements
|
Other
information
|
158 |
|||||||
EURm |
2023 |
2022 |
2021 |
1 January |
3 502 |
990 |
1 562 |
Recognized in income statement, continuing operations |
(394) |
2 452 |
137 |
Recognized in other comprehensive income |
51 |
56 |
(753) |
Other |
(3) |
2 |
(6) |
Translation differences |
(8) |
2 |
50 |
31 December |
3 148 |
3 502 |
990 |
EURm |
2023 |
2022 |
Temporary differences |
1 743 |
1 579 |
Tax losses carried forward |
19 482 |
18 324 |
Tax credits |
344 |
311 |
Total |
21 569 |
20 214 |
2023 |
2022 |
||||||
EURm |
Recognized |
Unrecognized |
Total |
Recognized |
Unrecognized |
Total |
|
Tax losses carried forward |
|||||||
Within 10 years |
1 375 |
1 025 |
2 400 |
1 344 |
1 247 |
2 591 |
|
Thereafter |
17 |
— |
17 |
— |
4 |
4 |
|
No expiry |
2 229 |
18 457 |
20 686 |
2 095 |
17 073 |
19 168 |
|
Total |
3 621 |
19 482 |
23 103 |
3 439 |
18 324 |
21 763 |
|
Tax credits |
|||||||
Within 10 years |
143 |
329 |
472 |
85 |
286 |
371 |
|
Thereafter |
48 |
1 |
49 |
47 |
4 |
51 |
|
No expiry |
154 |
14 |
168 |
117 |
21 |
138 |
|
Total |
345 |
344 |
689 |
249 |
311 |
560 |
|
2023 |
2022 |
2021 |
|||||||||
EURm |
Gross |
Tax |
Net |
Gross |
Tax |
Net |
Gross |
Tax |
Net |
||
Remeasurements of defined benefit
plans
|
(343) |
61 |
(282) |
(424) |
77 |
(347) |
3 040 |
(755) |
2 285 |
||
Translation differences |
(535) |
7 |
(528) |
710 |
1 |
711 |
1 153 |
2 |
1 155 |
||
Net investment hedges |
135 |
(27) |
108 |
(127) |
(20) |
(147) |
(249) |
— |
(249) |
||
Cash flow and other hedges |
(61) |
10 |
(51) |
83 |
(15) |
68 |
— |
— |
— |
||
Financial assets at fair value through
other comprehensive income
|
10 |
— |
10 |
(46) |
13 |
(33) |
7 |
— |
7 |
||
Other decrease |
(4) |
— |
(4) |
(3) |
— |
(3) |
— |
— |
— |
||
Total |
(798) |
51 |
(747) |
193 |
56 |
249 |
3 951 |
(753) |
3 198 |
||
Business
overview
|
Corporate
governance
|
Operating and financial
review and prospects
|
General facts
on Nokia
|
Financial
statements
|
Other
information
|
159 |
|||||||
Accounting policies
Basic earnings per share is calculated by dividing the profit or loss attributable to equity holders of the parent by the
weighted average number of shares outstanding during the year. Diluted earnings per share is calculated by adjusting
the profit or loss attributable to equity holders of the parent, and the weighted average number of shares outstanding,
for the effects of all dilutive potential ordinary shares. Potential ordinary shares are excluded from the calculation of
diluted earnings per share when they are determined to be antidilutive.
|
EURm |
2023 |
2022 |
2021 |
Profit or loss attributable to equity holders of the parent |
|||
Continuing operations |
660 |
4 201 |
1 632 |
Discontinued operations |
5 |
49 |
(9) |
Profit for the year |
665 |
4 250 |
1 623 |
Number of shares (000s) |
|||
Weighted average number of shares outstanding |
5 549 468 |
5 614 182 |
5 630 025 |
Effect of potentially dilutive shares |
|||
Performance shares |
8 190 |
46 187 |
50 300 |
Restricted shares and other |
28 265 |
9 651 |
3 910 |
Total effect of potentially dilutive shares |
36 455 |
55 838 |
54 210 |
Adjusted weighted average number of shares |
5 585 923 |
5 670 020 |
5 684 235 |
Earnings per share, EUR |
|||
Basic earnings per share |
|||
Continuing operations |
0.12 |
0.75 |
0.29 |
Discontinued operations |
0.00 |
0.01 |
0.00 |
Profit for the year |
0.12 |
0.76 |
0.29 |
Diluted earnings per share |
|||
Continuing operations |
0.12 |
0.74 |
0.29 |
Discontinued operations |
0.00 |
0.01 |
0.00 |
Profit for the year |
0.12 |
0.75 |
0.29 |
Business
overview
|
Corporate
governance
|
Operating and financial
review and prospects
|
General facts
on Nokia
|
Financial
statements
|
Other
information
|
160 |
|||||||
Section 3 |
EURm |
2023 |
2022 |
2021 |
Salaries and wages(1) |
5 988 |
6 439 |
6 191 |
Pensions and other post-
employment benefits
|
|||
Defined contribution plans |
251 |
241 |
223 |
Defined benefit plans(2) |
156 |
193 |
183 |
Share-based payments |
202 |
149 |
118 |
Social security costs |
873 |
881 |
826 |
Total |
7 470 |
7 903 |
7 541 |
2023 |
2022 |
2021 |
|
Average number of employees |
86 689 |
86 896 |
87 927 |
EURm |
2023 |
2022 |
2021 |
Short-term benefits |
13 |
17 |
20 |
Post-employment benefits(1) |
1 |
1 |
2 |
Share-based payments |
13 |
13 |
12 |
Termination benefits(2) |
— |
1 |
— |
Total |
27 |
32 |
34 |
EUR |
2023 |
2022 |
2021 |
Base salary |
1 322 750 |
1 300 000 |
1 300 000 |
Cash incentive payments |
1 079 695 |
2 342 438 |
2 975 781 |
Share-based payment
expenses(1)
|
5 041 885 |
5 425 169 |
4 263 505 |
Pension expenses |
422 274 |
406 806 |
589 873 |
Other benefits(2) |
95 756 |
113 850 |
35 731 |
Total |
7 962 360 |
9 588 263 |
9 164 890 |
Business
overview
|
Corporate
governance
|
Operating and financial
review and prospects
|
General facts
on Nokia
|
Financial
statements
|
Other
information
|
161 |
|||||||
The annual remuneration paid to the members of the Board of Directors, as decided by the Annual General Meetings in the respective years: |
2023 |
2022 |
2021 |
|||||||||
Annual fee(1)
EUR
|
Meeting fees(2)
EUR
|
Shares received(3)
number
|
Annual fee(1)
EUR
|
Meeting fees(2)
EUR
|
Shares received(3)
number
|
Annual fee(1)
EUR
|
Meeting fees(2)
EUR
|
Shares received(3)
number
|
|||
Sari Baldauf, Chair (4)(5) |
465 000 |
10 000 |
47 427 |
440 000 |
— |
36 217 |
440 000 |
— |
43 711 |
||
Søren Skou, Vice Chair(4) |
225 000 |
14 000 |
22 948 |
210 000 |
9 000 |
17 285 |
175 000 |
7 000 |
17 385 |
||
Timo Ahopelto(5)(6) |
210 000 |
10 000 |
21 418 |
— |
— |
— |
— |
— |
— |
||
Bruce Brown |
— |
5 000 |
— |
210 000 |
17 000 |
17 285 |
200 000 |
7 000 |
19 868 |
||
Elizabeth Crain(4)(6) |
215 000 |
15 000 |
21 928 |
— |
— |
— |
— |
— |
— |
||
Thomas Dannenfeldt(4)(6) |
230 000 |
9 000 |
23 458 |
200 000 |
9 000 |
16 462 |
185 000 |
7 000 |
18 378 |
||
Lisa Hook(4) |
200 000 |
17 000 |
20 399 |
185 000 |
7 000 |
15 227 |
— |
— |
— |
||
Jeanette Horan(5)(6) |
210 000 |
10 000 |
21 418 |
195 000 |
— |
16 050 |
185 000 |
7 000 |
18 378 |
||
Edward Kozel |
— |
5 000 |
— |
205 000 |
12 000 |
16 874 |
195 000 |
7 000 |
19 372 |
||
Thomas Saueressig(5) |
195 000 |
14 000 |
19 889 |
180 000 |
7 000 |
14 816 |
— |
— |
— |
||
Carla Smits-Nusteling(6) |
215 000 |
14 000 |
21 928 |
200 000 |
9 000 |
16 462 |
190 000 |
9 000 |
18 875 |
||
Kari Stadigh |
— |
— |
— |
— |
— |
— |
200 000 |
7 000 |
19 868 |
||
Kai Öistämö(5) |
205 000 |
10 000 |
20 908 |
180 000 |
5 000 |
14 816 |
— |
— |
— |
||
Total |
2 370 000 |
133 000 |
2 205 000 |
75 000 |
1 770 000 |
51 000 |
|||||
(1)Annual fees consist of Board member fees and Committee chair and member fees.
(2)Meeting fees include all meeting fees paid for the term that ended at the Annual General Meeting held on 4 April 2023, and meeting fees accrued and paid in 2023 for the term that began at the same meeting.
(3)Approximately 40% of each Board member’s annual compensation is paid in Nokia shares purchased from the market, and the remaining approximately 60% is paid in cash.
(4)Annual fees in 2023 include EUR 30 000 for Thomas Dannenfeldt as Chair and EUR 15 000 for Sari Baldauf, Elizabeth Crain, Lisa Hook and Søren Skou as members of the Personnel Committee.
(5)Annual fees in 2023 include EUR 20 000 for Kai Öistämö as Chair and EUR 10 000 for, Timo Ahopelto, Sari Baldauf, Jeanette Horan and Thomas Saueressig as members of the Technology Committee.
(6)Annual fees in 2023 include EUR 30 000 for Carla Smits-Nusteling as Chair and EUR 15 000 for Timo Ahopelto, Elizabeth Crain, Thomas Dannenfeldt and Jeanette Horan as members of the Audit Committee.
|
Business
overview
|
Corporate
governance
|
Operating and financial
review and prospects
|
General facts
on Nokia
|
Financial
statements
|
Other
information
|
162 |
|||||||
Plan |
Performance
shares
outstanding
at target
|
Confirmed
payout
(% of target)
|
Performance
period
|
Settlement year |
2020 |
— |
38% |
2020-2023 |
2023 |
2021 |
16 086 604 |
12% |
2021-2023 |
2024 |
2022 |
12 141 600 |
— |
2022-2024 |
2025 |
2023 |
15 118 600 |
— |
2023-2025 |
2026 |
Business
overview
|
Corporate
governance
|
Operating and financial
review and prospects
|
General facts
on Nokia
|
Financial
statements
|
Other
information
|
163 |
|||||||
Performance shares |
Restricted shares |
||||
Number of shares
outstanding at target
|
Weighted average grant
date fair value (EUR)
|
Number of shares
outstanding
|
Weighted average grant
date fair value (EUR)
|
||
1 January 2021 |
99 472 193 |
4 527 593 |
|||
Granted |
17 749 650 |
5.11 |
25 046 200 |
5.05 |
|
Forfeited |
(5 783 031) |
(783 950) |
|||
Vested(1) |
(31 611 804) |
(2 026 150) |
|||
31 December 2021 |
79 827 008 |
26 763 693 |
|||
Granted |
12 661 300 |
3.49 |
32 238 100 |
4.15 |
|
Forfeited |
(2 450 396) |
(1 695 734) |
|||
Vested(1) |
(26 290 064) |
(2 778 431) |
|||
31 December 2022 |
63 747 848 |
54 527 628 |
|||
Granted |
15 207 400 |
3.10 |
45 322 400 |
3.36 |
|
Forfeited |
(3 916 744) |
(1 998 801) |
|||
Vested(1) |
(31 691 700) |
(3 175 287) |
|||
31 December 2023 |
43 346 804 |
94 675 940 |
|||
(1)Vested performance shares at target are to be multiplied by the confirmed payout (% of target) to calculate the total number of Nokia shares settled. | |||||
Estimation of grant date fair values | |
Plan |
Grant date fair value |
ATSR |
Estimated considering the dividend-adjusted Nokia share price at the end of the performance period of the plan and the target payout
levels set for the plan.
|
RTSR |
Estimated considering a combination of the dividend-adjusted Nokia share price compared with benchmark companies’ share prices at
the end of the performance period of the plan and the target payout levels set for the plan.
|
Restricted
Shares
|
Estimated using the grant date market price of the Nokia share less the present value of dividends expected to be paid during the
vesting period.
|
Business
overview
|
Corporate
governance
|
Operating and financial
review and prospects
|
General facts
on Nokia
|
Financial
statements
|
Other
information
|
164 |
|||||||
EURm |
Defined
benefit
obligation
|
Fair value of
plan assets
|
Effects of
asset ceiling
|
Net defined
benefit
balance
|
2023 |
||||
United States, Pension |
(11 325) |
16 285 |
— |
4 960 |
United States, OPEB |
(1 471) |
675 |
— |
(796) |
Germany |
(2 037) |
1 199 |
— |
(838) |
United Kingdom |
(782) |
957 |
— |
175 |
Other |
(1 253) |
1 798 |
(87) |
458 |
Total |
(16 868) |
20 914 |
(87) |
3 959 |
2022 |
||||
United States, Pension |
(12 340) |
17 726 |
— |
5 386 |
United States, OPEB |
(1 615) |
637 |
— |
(978) |
Germany |
(1 957) |
1 179 |
— |
(778) |
United Kingdom |
(730) |
942 |
— |
212 |
Other |
(1 670) |
2 207 |
(84) |
453 |
Total |
(18 312) |
22 691 |
(84) |
4 295 |
EURm |
2023 |
2022 |
Wholly funded |
12 782 |
14 330 |
Partly funded |
3 149 |
3 009 |
Unfunded |
937 |
973 |
Total |
16 868 |
18 312 |
Business
overview
|
Corporate
governance
|
Operating and financial
review and prospects
|
General facts
on Nokia
|
Financial
statements
|
Other
information
|
165 |
|||||||
Business
overview
|
Corporate
governance
|
Operating and financial
review and prospects
|
General facts
on Nokia
|
Financial
statements
|
Other
information
|
166 |
|||||||
Defined benefit obligation |
2023 |
2022 |
|||||||
EURm |
United States
pension
|
United States
OPEB
|
Other pension |
Total |
United States
pension
|
United States
OPEB
|
Other pension |
Total |
|
1 January |
(12 340) |
(1 615) |
(4 357) |
(18 312) |
(14 892) |
(2 015) |
(5 797) |
(22 704) |
|
Current service cost |
(83) |
— |
(74) |
(157) |
(113) |
— |
(92) |
(205) |
|
Interest expense |
(563) |
(73) |
(173) |
(809) |
(363) |
(50) |
(94) |
(507) |
|
Past service cost |
(9) |
— |
3 |
(6) |
— |
— |
2 |
2 |
|
Settlements(1) |
— |
— |
501 |
501 |
— |
— |
54 |
54 |
|
Total |
(655) |
(73) |
257 |
(471) |
(476) |
(50) |
(130) |
(656) |
|
Remeasurements: |
|||||||||
Gain/(loss) from change in demographic assumptions |
66 |
1 |
(12) |
55 |
— |
(6) |
2 |
(4) |
|
(Loss)/gain from change in financial assumptions |
(114) |
(26) |
(161) |
(301) |
2 689 |
398 |
1 447 |
4 534 |
|
Experience (loss)/gain |
(43) |
28 |
(11) |
(26) |
(159) |
(12) |
(149) |
(320) |
|
Total |
(91) |
3 |
(184) |
(272) |
2 530 |
380 |
1 300 |
4 210 |
|
Translation differences |
431 |
57 |
(12) |
476 |
(869) |
(114) |
54 |
(929) |
|
Contributions from plan participants |
— |
(60) |
(24) |
(84) |
— |
(59) |
(35) |
(94) |
|
Benefits paid |
1 330 |
229 |
249 |
1 808 |
1 367 |
253 |
240 |
1 860 |
|
Other |
— |
(12) |
(1) |
(13) |
— |
(10) |
11 |
1 |
|
Total |
1 761 |
214 |
212 |
2 187 |
498 |
70 |
270 |
838 |
|
31 December |
(11 325) |
(1 471) |
(4 072) |
(16 868) |
(12 340) |
(1 615) |
(4 357) |
(18 312) |
|
Weighted average duration of the defined benefit obligation (in years) |
7.7 |
8.8 |
10.6 |
8.5 |
7.6 |
8.7 |
9.3 |
8.1 |
|
Business
overview
|
Corporate
governance
|
Operating and financial
review and prospects
|
General facts
on Nokia
|
Financial
statements
|
Other
information
|
167 |
|||||||
Fair value of plan assets |
2023 |
2022 |
|||||||
EURm |
United States
pension
|
United States
OPEB
|
Other pension |
Total |
United States
pension
|
United States
OPEB
|
Other pension |
Total |
|
1 January |
17 726 |
637 |
4 328 |
22 691 |
20 987 |
759 |
5 382 |
27 128 |
|
Interest income |
820 |
28 |
171 |
1 019 |
517 |
18 |
87 |
622 |
|
Administrative expenses and interest on asset ceiling |
(17) |
— |
(4) |
(21) |
(18) |
— |
(5) |
(23) |
|
Settlements(1) |
— |
— |
(494) |
(494) |
— |
— |
(44) |
(44) |
|
Total |
803 |
28 |
(327) |
504 |
499 |
18 |
38 |
555 |
|
Remeasurements: |
|||||||||
Return on plan assets, excluding amounts included in interest income |
(186) |
62 |
48 |
(76) |
(3 577) |
(110) |
(959) |
(4 646) |
|
Total |
(186) |
62 |
48 |
(76) |
(3 577) |
(110) |
(959) |
(4 646) |
|
Translation differences |
(624) |
(21) |
28 |
(617) |
1 271 |
38 |
(66) |
1 243 |
|
Contributions: |
|||||||||
Employers |
27 |
7 |
41 |
75 |
28 |
9 |
47 |
84 |
|
Plan participants |
— |
60 |
24 |
84 |
— |
59 |
35 |
94 |
|
Benefits paid |
(1 330) |
(229) |
(181) |
(1 740) |
(1 367) |
(253) |
(138) |
(1 758) |
|
Section 420 transfer(2) |
(131) |
131 |
— |
— |
(117) |
117 |
— |
— |
|
Other |
— |
— |
(7) |
(7) |
2 |
— |
(11) |
(9) |
|
Total |
(2 058) |
(52) |
(95) |
(2 205) |
(183) |
(30) |
(133) |
(346) |
|
31 December |
16 285 |
675 |
3 954 |
20 914 |
17 726 |
637 |
4 328 |
22 691 |
|
The impact of the asset ceiling limitation |
2023 |
2022 |
|||||||
EURm |
United States
pension
|
United States
OPEB
|
Other pension |
Total |
United States
pension
|
United States
OPEB
|
Other pension |
Total |
|
1 January |
— |
— |
(84) |
(84) |
— |
— |
(92) |
(92) |
|
Interest expense |
— |
— |
(2) |
(2) |
— |
— |
— |
— |
|
Remeasurements: |
|||||||||
Change in asset ceiling, excluding amounts included in interest expense |
— |
— |
5 |
5 |
— |
— |
12 |
12 |
|
Translation differences |
— |
— |
(6) |
(6) |
— |
— |
(4) |
(4) |
|
31 December |
— |
— |
(87) |
(87) |
— |
— |
(84) |
(84) |
|
Net balances |
2023 |
2022 |
|||||||
EURm |
United States
pension
|
United States
OPEB
|
Other pension |
Total |
United States
pension
|
United States
OPEB
|
Other pension |
Total |
|
31 December |
4 960 |
(796) |
(205) |
3 959 |
5 386 |
(978) |
(113) |
4 295 |
|
Consisting of: |
|||||||||
Net pension assets |
5 217 |
— |
1 041 |
6 258 |
5 658 |
— |
1 096 |
6 754 |
|
Net pension liabilities |
(257) |
(796) |
(1 246) |
(2 299) |
(272) |
(978) |
(1 209) |
(2 459) |
|
Business
overview
|
Corporate
governance
|
Operating and financial
review and prospects
|
General facts
on Nokia
|
Financial
statements
|
Other
information
|
168 |
|||||||
EURm |
2023 |
2022 |
2021 |
Current service cost(1) |
157 |
205 |
196 |
Past service cost(1) |
6 |
(2) |
(17) |
Net interest(2) |
(187) |
(92) |
(26) |
Settlements(1) |
(7) |
(10) |
4 |
Total |
(31) |
101 |
157 |
EURm |
2023 |
2022 |
2021 |
Return on plan assets, excluding amounts included in interest income |
(76) |
(4 646) |
853 |
Gain/(loss) from change in demographic assumptions |
55 |
(4) |
(13) |
(Loss)/gain from change in financial assumptions |
(301) |
4 534 |
989 |
Experience (loss)/gain |
(26) |
(320) |
30 |
Change in asset ceiling, excluding amounts included in interest expense |
5 |
12 |
1 181 |
Total |
(343) |
(424) |
3 040 |
Discount rate |
Mortality table |
|||
2023 |
2022 |
2023 |
||
United States |
4.7% |
4.9% |
Pri-2012 w/MP-2020
Mortality projection scale
|
|
Germany |
3.2% |
3.7% |
Heubeck 2018G |
|
United Kingdom(1) |
4.5% |
4.8% |
CMI 2021 |
|
Total weighted average for all countries |
4.4% |
4.7% |
||
2023 |
2022 |
Change in
assumption
|
Increase in
assumption(1)
EURm
|
Decrease in
assumption(1)
EURm
|
|
Discount rate for determining
present values
|
4.4% |
4.7% |
1.0% |
1 279 |
(1 547) |
Pension growth rate |
3.3% |
2.2% |
1.0% |
(266) |
214 |
Inflation rate |
2.3% |
2.1% |
1.0% |
(294) |
270 |
Life expectancy |
87-88 yrs |
87-89 yrs |
1 year |
(626) |
587 |
Business
overview
|
Corporate
governance
|
Operating and financial
review and prospects
|
General facts
on Nokia
|
Financial
statements
|
Other
information
|
169 |
|||||||
2023 |
2022 |
||||||||
EURm |
Quoted |
Unquoted |
Total |
% |
Quoted |
Unquoted |
Total |
% |
|
Equity securities |
1 242 |
— |
1 242 |
6 |
1 086 |
— |
1 086 |
5 |
|
Fixed income securities |
14 952 |
140 |
15 092 |
72 |
16 070 |
164 |
16 234 |
71 |
|
Insurance contracts |
— |
807 |
807 |
4 |
— |
790 |
790 |
4 |
|
Real estate |
— |
1 012 |
1 012 |
5 |
— |
1 297 |
1 297 |
6 |
|
Short-term investments |
397 |
— |
397 |
2 |
482 |
— |
482 |
2 |
|
Private equity and other |
106 |
2 258 |
2 364 |
11 |
93 |
2 709 |
2 802 |
12 |
|
Total |
16 697 |
4 217 |
20 914 |
100 |
17 731 |
4 960 |
22 691 |
100 |
|
Most short-term investments including cash, equities and fixed-income securities have quoted market prices in active markets.
Equity securities represent investments in equity funds and direct investments, which have quoted market prices in an active
market. Fixed income securities represent direct investments in government and corporate bonds, as well as investments in
bond funds, which have quoted market prices in an active market. Insurance contracts are customary pension insurance
contracts structured under domestic law in the respective countries. Real estate investments are investments in commercial
properties or real estate funds, which invest in a diverse range of real estate properties.
Short-term investments are liquid assets or cash, which are being held for a short period of time, with the primary purpose of
controlling the tactical asset allocation. Private equity net asset values (NAVs) are determined by the asset managers based on
inputs such as operating results, discounted future cash flows and market-based comparable data. Assets invested in alternative
asset classes such as private equity, real estate and absolute return, are measured using latest available valuations provided by
the asset managers, reviewed by Nokia, and adjusted for subsequent cash flows.
|
Business
overview
|
Corporate
governance
|
Operating and financial
review and prospects
|
General facts
on Nokia
|
Financial
statements
|
Other
information
|
170 |
|||||||
US Pension |
US OPEB |
Other
countries
|
Total |
|||||||
EURm |
Management |
Occupational |
Supplemental
plans
|
Formerly union
represented
|
Non-union
represented
|
|||||
2024 |
1 058 |
217 |
25 |
65 |
57 |
273 |
1 695 |
|||
2025 |
950 |
202 |
25 |
56 |
57 |
248 |
1 538 |
|||
2026 |
909 |
190 |
24 |
55 |
58 |
252 |
1 488 |
|||
2027 |
861 |
177 |
23 |
47 |
58 |
252 |
1 418 |
|||
2028 |
811 |
165 |
23 |
77 |
58 |
252 |
1 386 |
|||
2029-2033 |
3 374 |
655 |
99 |
309 |
292 |
1 391 |
6 120 |
|||
Business
overview
|
Corporate
governance
|
Operating and financial
review and prospects
|
General facts
on Nokia
|
Financial
statements
|
Other
information
|
171 |
|||||||
Section 4 |
Business
overview
|
Corporate
governance
|
Operating and financial
review and prospects
|
General facts
on Nokia
|
Financial
statements
|
Other
information
|
172 |
|||||||
EURm |
Goodwill |
Intangible
assets
|
Total |
||
2023 |
|||||
Acquisition cost at 1 January |
6 799 |
9 778 |
16 577 |
||
Additions |
— |
299 |
299 |
||
Disposals, retirements and reclassifications |
(22) |
(23) |
(45) |
||
Translation differences |
(148) |
(161) |
(309) |
||
Acquisition cost at 31 December |
6 629 |
9 893 |
16 522 |
||
Accumulated amortization and impairment charges at 1 January |
(1 132) |
(8 515) |
(9 647) |
||
Amortization |
— |
(423) |
(423) |
||
Impairment charges |
— |
(26) |
(26) |
||
Disposals, retirements and reclassifications |
— |
17 |
17 |
||
Translation differences |
7 |
140 |
147 |
||
Accumulated amortization and impairment charges at 31 December |
(1 125) |
(8 807) |
(9 932) |
||
Net book value at 1 January |
5 667 |
1 263 |
6 930 |
||
Net book value at 31 December |
5 504 |
1 086 |
6 590 |
||
2022 |
|||||
Acquisition cost at 1 January |
6 552 |
9 499 |
16 051 |
||
Additions |
— |
49 |
49 |
||
Disposals, retirements and reclassifications |
— |
(19) |
(19) |
||
Translation differences |
247 |
249 |
496 |
||
Acquisition cost at 31 December |
6 799 |
9 778 |
16 577 |
||
Accumulated amortization and impairment charges at 1 January |
(1 121) |
(7 879) |
(9 000) |
||
Amortization |
— |
(465) |
(465) |
||
Disposals, retirements and reclassifications |
— |
19 |
19 |
||
Translation differences |
(11) |
(190) |
(201) |
||
Accumulated amortization and impairment charges at 31 December |
(1 132) |
(8 515) |
(9 647) |
||
Net book value at 1 January |
5 431 |
1 620 |
7 051 |
||
Net book value at 31 December |
5 667 |
1 263 |
6 930 |
EURm |
2023 |
2022 |
|
Customer relationships |
605 |
923 |
|
Patents and licenses |
316 |
151 |
|
Technologies and IPR&D |
31 |
83 |
|
Tradenames and other |
134 |
106 |
|
Total |
1 086 |
1 263 |
Business
overview
|
Corporate
governance
|
Operating and financial
review and prospects
|
General facts
on Nokia
|
Financial
statements
|
Other
information
|
173 |
|||||||
EURm |
2023 |
2022 |
|
Network Infrastructure |
2 739 |
2 812 |
|
Mobile Networks |
2 228 |
2 284 |
|
Cloud and Network Services |
537 |
571 |
Terminal growth rate |
Post-tax discount rate |
||||
Key assumption % |
2023 |
2022 |
2023 |
2022 |
|
Network Infrastructure |
1.0 |
1.6 |
9.3 |
9.0 |
|
Mobile Networks |
1.0 |
1.3 |
8.3 |
7.7 |
|
Cloud and Network
Services
|
1.0 |
1.8 |
7.7 |
7.0 |
|
Business
overview
|
Corporate
governance
|
Operating and financial
review and prospects
|
General facts
on Nokia
|
Financial
statements
|
Other
information
|
174 |
|||||||
Buildings and constructions |
|
Buildings and constructions |
20–33 years |
Light buildings and constructions |
3–20 years |
Vessels |
|
Cable-laying vessels |
15–40 years |
Cable-laying accessories |
4–10 years |
Machinery and equipment |
|
Production machinery and measuring and
test equipment
|
1–5 years |
Other machinery and equipment |
3–10 years |
EURm |
Land, buildings,
constructions
and vessels
|
Machinery,
equipment and
other
|
Assets under
construction
|
Total |
|||
2023 |
|||||||
Acquisition cost at 1 January |
1 409 |
3 589 |
248 |
5 246 |
|||
Additions |
33 |
314 |
115 |
462 |
|||
Reclassifications |
107 |
85 |
(192) |
— |
|||
Disposals and retirements |
(88) |
(374) |
(1) |
(463) |
|||
Translation differences |
(27) |
(67) |
(3) |
(97) |
|||
Acquisition cost at 31 December |
1 434 |
3 547 |
167 |
5 148 |
|||
Accumulated depreciation at 1 January |
(575) |
(2 656) |
— |
(3 231) |
|||
Depreciation |
(90) |
(358) |
— |
(448) |
|||
Disposals and retirements |
79 |
333 |
— |
412 |
|||
Translation differences |
17 |
53 |
— |
70 |
|||
Accumulated depreciation at 31 December |
(569) |
(2 628) |
— |
(3 197) |
|||
Net book value at 1 January |
834 |
933 |
248 |
2 015 |
|||
Net book value at 31 December |
865 |
919 |
167 |
1 951 |
|||
2022 |
|||||||
Acquisition cost at 1 January |
1 228 |
3 371 |
280 |
4 879 |
|||
Additions |
55 |
361 |
166 |
582 |
|||
Reclassifications |
160 |
40 |
(200) |
— |
|||
Disposals and retirements |
(49) |
(191) |
(1) |
(241) |
|||
Translation differences |
15 |
8 |
3 |
26 |
|||
Acquisition cost at 31 December |
1 409 |
3 589 |
248 |
5 246 |
|||
Accumulated depreciation at 1 January |
(495) |
(2 460) |
— |
(2 955) |
|||
Depreciation |
(87) |
(363) |
— |
(450) |
|||
Impairment charges |
(33) |
(12) |
— |
(45) |
|||
Disposals and retirements |
46 |
185 |
— |
231 |
|||
Translation differences |
(6) |
(6) |
— |
(12) |
|||
Accumulated depreciation at 31 December |
(575) |
(2 656) |
— |
(3 231) |
|||
Net book value at 1 January |
733 |
911 |
280 |
1 924 |
|||
Net book value at 31 December |
834 |
933 |
248 |
2 015 |
Business
overview
|
Corporate
governance
|
Operating and financial
review and prospects
|
General facts
on Nokia
|
Financial
statements
|
Other
information
|
175 |
|||||||
Buildings |
3–15 years |
Other |
3–5 years |
EURm |
Buildings |
Other |
Total |
2023 |
|||
Acquisition cost at 1 January |
1 423 |
241 |
1 664 |
Additions(1) |
74 |
129 |
203 |
Retirements |
(39) |
(96) |
(135) |
Translation differences |
(24) |
1 |
(23) |
Acquisition cost at 31 December |
1 434 |
275 |
1 709 |
Accumulated depreciation at
1 January
|
(589) |
(146) |
(735) |
Depreciation |
(140) |
(76) |
(216) |
Impairment charges |
2 |
— |
2 |
Retirements |
39 |
96 |
135 |
Translation differences |
11 |
— |
11 |
Accumulated depreciation at
31 December
|
(677) |
(126) |
(803) |
Net book value at 1 January |
834 |
95 |
929 |
Net book value at 31 December |
757 |
149 |
906 |
2022 |
|||
Acquisition cost at 1 January |
1 318 |
223 |
1 541 |
Additions(1) |
184 |
73 |
257 |
Retirements |
(85) |
(52) |
(137) |
Translation differences |
6 |
(3) |
3 |
Acquisition cost at 31 December |
1 423 |
241 |
1 664 |
Accumulated depreciation at
1 January
|
(533) |
(124) |
(657) |
Depreciation |
(150) |
(75) |
(225) |
Impairment charges |
6 |
— |
6 |
Retirements |
85 |
52 |
137 |
Translation differences |
3 |
1 |
4 |
Accumulated depreciation at
31 December
|
(589) |
(146) |
(735) |
Net book value at 1 January |
785 |
99 |
884 |
Net book value at 31 December |
834 |
95 |
929 |
(1) Additions comprise new lease contracts as well as modifications and
remeasurements of existing lease contracts.
| |||
EURm |
2023 |
2022 |
2021 |
Depreciation of right-of-use assets |
(216) |
(225) |
(214) |
Interest expense on lease liabilities |
(28) |
(26) |
(24) |
Impairment charges, net of
reversals
|
2 |
6 |
(25) |
Total |
(242) |
(245) |
(263) |
EURm |
2023 |
2022 |
2021 |
Payment of principal portion of
lease liabilities
|
(239) |
(217) |
(226) |
Interest paid on lease liabilities |
(28) |
(26) |
(24) |
Total |
(267) |
(243) |
(250) |
Business
overview
|
Corporate
governance
|
Operating and financial
review and prospects
|
General facts
on Nokia
|
Financial
statements
|
Other
information
|
176 |
|||||||
EURm |
2023 |
2022 |
Raw materials and semi-finished goods |
1 156 |
1 075 |
Finished goods |
980 |
1 375 |
Contract work in progress |
583 |
815 |
Total |
2 719 |
3 265 |
Business
overview
|
Corporate
governance
|
Operating and financial
review and prospects
|
General facts
on Nokia
|
Financial
statements
|
Other
information
|
177 |
|||||||
Customer-related balances
Nokia aims to ensure the highest possible quality in trade receivables and contract assets as well as customer or third-party loan
receivables. The Credit Risk Management Standard Operating Procedure, approved by the CFO, lays out the framework for the
management of business-related credit risks. The Credit Risk Management Standard Operating Procedure sets out that credit
decisions are based on credit evaluation in each business, including credit rating and limits for larger exposures, according to
defined principles. Group level limit approvals are required for material credit exposures. Credit risks are monitored in each
business and, where appropriate, mitigated on a case-by-case basis with the use of letters of credit, collaterals, sponsor
guarantees, credit insurance and sale of selected receivables.
|
Aging of trade receivables and other customer-related balances at 31 December | |||||
Past due |
|||||
EURm |
Current |
1-30 days |
31-180
days
|
> 180 days |
Total |
2023 |
|||||
Trade receivables(1) |
4 404 |
157 |
279 |
430 |
5 270 |
Contract assets |
1 136 |
— |
— |
— |
1 136 |
Customer financing-related loan receivables |
207 |
1 |
20 |
88 |
316 |
Total gross receivables |
5 747 |
158 |
299 |
518 |
6 722 |
Expected credit loss allowance(2)(3) |
(207) |
(8) |
(80) |
(302) |
(597) |
Total net receivables |
5 540 |
150 |
219 |
216 |
6 125 |
2022 |
|||||
Trade receivables(1) |
5 117 |
210 |
267 |
355 |
5 949 |
Contract assets |
1 203 |
— |
— |
— |
1 203 |
Customer financing-related loan receivables |
212 |
8 |
5 |
79 |
304 |
Total gross receivables |
6 532 |
218 |
272 |
434 |
7 456 |
Expected credit loss allowance(2)(3) |
(361) |
(15) |
(65) |
(203) |
(644) |
Total net receivables |
6 171 |
203 |
207 |
231 |
6 812 |
(1) Nokia’s payment terms are 104 days on average.
(2) The total expected credit loss allowance includes EUR 318 million (EUR 311 million in 2022) of credit-impaired assets relating to certain emerging market customers.
(3) In 2023, the decrease in the expected credit loss allowance includes EUR 29 million transferred to other provisions. In 2022, the expected credit loss allowance included
EUR 33 million transferred from other provisions.
| |||||
The reversal of expected credit loss charged to the income statement in 2023 was EUR 16 million. The expected credit loss
charged to the income statement was EUR 160 million in 2022 and EUR 10 million in 2021.
|
Business
overview
|
Corporate
governance
|
Operating and financial
review and prospects
|
General facts
on Nokia
|
Financial
statements
|
Other
information
|
178 |
|||||||
Customer |
2023 |
2022 |
Customer 1 |
12.2% |
4.5% |
Customer 2 |
3.6% |
3.5% |
Customer 3 |
3.4% |
3.3% |
Total |
19.2% |
11.3% |
Country |
2023 |
2022 |
Country 1(1) |
19.0% |
14.7% |
Country 2 |
11.7% |
10.8% |
Country 3 |
6.1% |
7.3% |
Total |
36.8% |
32.8% |
EURm |
2023 |
2022 |
R&D tax credits |
127 |
114 |
Indirect tax receivables |
45 |
46 |
Other |
41 |
79 |
Total |
213 |
239 |
EURm |
2023 |
2022 |
VAT and other indirect tax receivables |
302 |
457 |
Prepayments related to contract manufacturing |
128 |
62 |
IT-related prepaid expenses |
59 |
41 |
R&D tax credits and grant receivables |
46 |
28 |
Divestment-related receivables |
28 |
26 |
Other |
201 |
320 |
Total |
764 |
934 |
EURm |
2023 |
2022 |
Salaries, wages and social charges |
42 |
46 |
Other |
69 |
57 |
Total |
111 |
103 |
EURm |
2023 |
2022 |
Salaries, wages and social charges |
1 176 |
1 669 |
Accrued expenses related to customer projects |
442 |
466 |
Discounts without performance obligations |
404 |
539 |
VAT and other indirect tax payables |
323 |
328 |
Other(1) |
479 |
617 |
Total |
2 824 |
3 619 |
Business
overview
|
Corporate
governance
|
Operating and financial
review and prospects
|
General facts
on Nokia
|
Financial
statements
|
Other
information
|
179 |
|||||||
Warranty provision
Nokia provides for the estimated liability to repair or replace
products under standard warranty at the time revenue is
recognized. The provision estimate is based on historical
experience of the level of repairs and replacements. Cash
outflows related to the warranty provision are generally
expected to occur in the next 18 months.
|
Project loss provision
Nokia provides for onerous contracts based on the lower of
the expected cost of fulfilling the contract and the expected
cost of terminating the contract. An onerous contract is a
contract in which the unavoidable costs of meeting the
obligations under the contract exceed the economic
benefits expected to be received under it. Project loss
provisions relate to contracts with customers and are
evaluated at a contract level. The majority of the project
loss provision utilization is expected to occur over the next
two years.
|
|
Litigation and environmental provisions
Nokia provides for the estimated future settlements related
to legal proceedings based on the probable outcome of the
claims. Nokia also provides for environmental remediation
when Nokia becomes obliged, legally or constructively, to
rectify environmental damage relating to soil, groundwater,
surface water or sediment contamination. Cash outflows
related to the litigation and environmental liabilities are
inherently uncertain and generally occur over several periods.
For a presentation of legal matters potentially affecting
Nokia, refer to Note 6.1. Commitments, contingencies and
legal proceedings.
|
||
Other provisions
Nokia provides for various legal and constructive obligations
such as material liability, indirect tax provisions, divestment-
related provisions, employee-related provisions other than
restructuring provisions and asset retirement obligations.
Cash outflows related to other provisions are generally
expected to occur over the next two years.
|
||
Litigation and |
Project |
|||||
EURm |
Restructuring |
Warranty |
environmental(2) |
losses |
Other |
Total |
1 January 2023 |
193 |
221 |
253 |
207 |
561 |
1 435 |
Charged to income statement |
||||||
Additions |
316 |
177 |
52 |
10 |
204 |
759 |
Reversals |
— |
(51) |
(13) |
— |
(199) |
(263) |
Total charged to income statement |
316 |
126 |
39 |
10 |
5 |
496 |
Utilized during year(1) |
(254) |
(147) |
(29) |
(107) |
(109) |
(646) |
Translation differences and other |
— |
— |
(12) |
— |
(11) |
(23) |
31 December 2023 |
255 |
200 |
251 |
110 |
446 |
1 262 |
Non-current |
75 |
20 |
156 |
89 |
178 |
518 |
Current |
180 |
180 |
95 |
21 |
268 |
744 |
(1)The utilization of restructuring provision includes items transferred to accrued expenses, of which EUR 65 million remained in accrued expenses at 31 December 2023.
(2)Environmental provision was EUR 154 million at 31 December 2023 (EUR 155 million at 31 December 2022).
|
Business
overview
|
Corporate
governance
|
Operating and financial
review and prospects
|
General facts
on Nokia
|
Financial
statements
|
Other
information
|
180 |
|||||||
Section 5 |
Number of shares 000s |
2023 |
2022 |
2021 |
1 January |
5 587 016 |
5 634 993 |
5 617 496 |
Settlement of share-based
payments
|
16 886 |
15 986 |
17 497 |
Acquisition of treasury shares |
(78 301) |
(63 963) |
— |
31 December |
5 525 601 |
5 587 016 |
5 634 993 |
Business
overview
|
Corporate
governance
|
Operating and financial
review and prospects
|
General facts
on Nokia
|
Financial
statements
|
Other
information
|
181 |
|||||||
Changes in other comprehensive income by component of equity |
Fair value and other reserves |
|||||
EURm |
Translation
differences(1)
|
Pension
remeasurements
|
Hedging reserve |
Cost of hedging
reserve
|
Fair value
reserve
|
1 January 2021 |
(1 295) |
1 940 |
2 |
(10) |
(22) |
Foreign exchange translation differences |
1 162 |
— |
— |
— |
— |
Net investment hedging losses |
(249) |
— |
— |
— |
— |
Remeasurements of defined benefit plans |
— |
2 302 |
— |
— |
— |
Net fair value (losses)/gains |
— |
— |
(15) |
5 |
(25) |
Transfer to income statement |
(7) |
— |
6 |
4 |
32 |
Movement attributable to non-controlling interests |
(7) |
— |
— |
— |
— |
31 December 2021 |
(396) |
4 242 |
(7) |
(1) |
(15) |
Foreign exchange translation differences |
697 |
— |
— |
— |
— |
Net investment hedging losses |
(147) |
— |
— |
— |
— |
Remeasurements of defined benefit plans |
— |
(349) |
— |
— |
— |
Net fair value gains/(losses) |
— |
— |
24 |
(27) |
(208) |
Transfer to income statement |
14 |
— |
61 |
10 |
175 |
Movement attributable to non-controlling interests |
1 |
— |
— |
— |
— |
31 December 2022 |
169 |
3 893 |
78 |
(18) |
(48) |
Foreign exchange translation differences |
(547) |
— |
— |
— |
— |
Net investment hedging gains |
105 |
— |
— |
3 |
— |
Remeasurements of defined benefit plans |
— |
(261) |
— |
— |
— |
Net fair value gains/(losses) |
— |
— |
2 |
(25) |
(87) |
Transfer to income statement |
19 |
— |
(66) |
38 |
96 |
Movement attributable to non-controlling interests |
5 |
— |
— |
— |
— |
31 December 2023 |
(249) |
3 632 |
14 |
(2) |
(39) |
(1)At 31 December 2023 translation differences include a EUR 186 million gain related to net investment hedging (EUR 80 million gain in 2022 and EUR 226 million gain in 2021). |
Business
overview
|
Corporate
governance
|
Operating and financial
review and prospects
|
General facts
on Nokia
|
Financial
statements
|
Other
information
|
182 |
|||||||
Business
overview
|
Corporate
governance
|
Operating and financial
review and prospects
|
General facts
on Nokia
|
Financial
statements
|
Other
information
|
183 |
|||||||
Business
overview
|
Corporate
governance
|
Operating and financial
review and prospects
|
General facts
on Nokia
|
Financial
statements
|
Other
information
|
184 |
|||||||
Business
overview
|
Corporate
governance
|
Operating and financial
review and prospects
|
General facts
on Nokia
|
Financial
statements
|
Other
information
|
185 |
|||||||
2023 |
2022 |
||||||||||||||||||||
Carrying amounts |
Fair value(1) |
Carrying amounts |
Fair value(1) |
||||||||||||||||||
Fair value through profit or loss |
Fair value
through other
comprehensive
income(2)
|
Fair value through profit or loss |
Fair value
through other
comprehensive
income(2)
|
||||||||||||||||||
EURm |
Amortized cost |
Level 1 |
Level 2 |
Level 3 |
Level 2 |
Total |
Total |
Amortized cost |
Level 1 |
Level 2 |
Level 3 |
Level 2 |
Total |
Total |
|||||||
Non-current interest-bearing financial investments |
715 |
— |
— |
— |
— |
715 |
717 |
697 |
— |
— |
— |
— |
697 |
659 |
|||||||
Investments in venture funds |
— |
5 |
— |
779 |
— |
784 |
784 |
— |
5 |
— |
823 |
— |
828 |
828 |
|||||||
Other non-current financial assets(3) |
161 |
— |
96 |
— |
59 |
316 |
316 |
183 |
— |
91 |
— |
27 |
301 |
301 |
|||||||
Other current financial assets(3) |
263 |
— |
— |
— |
22 |
285 |
285 |
296 |
— |
— |
— |
36 |
332 |
332 |
|||||||
Derivative assets(4) |
— |
— |
134 |
— |
— |
134 |
134 |
— |
— |
239 |
— |
— |
239 |
239 |
|||||||
Trade receivables(3) |
— |
— |
— |
— |
4 921 |
4 921 |
4 921 |
— |
— |
— |
— |
5 549 |
5 549 |
5 549 |
|||||||
Current interest-bearing financial investments |
874 |
— |
691 |
— |
— |
1 565 |
1 565 |
1 447 |
— |
1 633 |
— |
— |
3 080 |
3 080 |
|||||||
Cash and cash equivalents |
4 791 |
— |
1 443 |
— |
— |
6 234 |
6 234 |
4 176 |
— |
1 291 |
— |
— |
5 467 |
5 467 |
|||||||
Total financial assets |
6 804 |
5 |
2 364 |
779 |
5 002 |
14 954 |
14 956 |
6 799 |
5 |
3 254 |
823 |
5 612 |
16 493 |
16 455 |
|||||||
Long-term interest-bearing liabilities |
3 637 |
— |
— |
— |
— |
3 637 |
3 614 |
4 249 |
— |
— |
— |
— |
4 249 |
4 230 |
|||||||
Other long-term financial liabilities |
33 |
— |
— |
28 |
— |
61 |
61 |
— |
— |
— |
48 |
— |
48 |
48 |
|||||||
Short-term interest-bearing liabilities |
554 |
— |
— |
— |
— |
554 |
555 |
228 |
— |
— |
— |
— |
228 |
228 |
|||||||
Other short-term financial liabilities |
65 |
— |
— |
471 |
— |
536 |
536 |
75 |
— |
— |
502 |
— |
577 |
577 |
|||||||
Derivative liabilities(4) |
— |
— |
286 |
— |
— |
286 |
286 |
— |
— |
496 |
— |
— |
496 |
496 |
|||||||
Discounts without performance obligations(3) |
404 |
— |
— |
— |
— |
404 |
404 |
539 |
— |
— |
— |
— |
539 |
539 |
|||||||
Trade payables |
3 423 |
— |
— |
— |
— |
3 423 |
3 423 |
4 730 |
— |
— |
— |
— |
4 730 |
4 730 |
|||||||
Total financial liabilities |
8 116 |
— |
286 |
499 |
— |
8 901 |
8 879 |
9 821 |
— |
496 |
550 |
— |
10 867 |
10 848 |
|||||||
Business
overview
|
Corporate
governance
|
Operating and financial
review and prospects
|
General facts
on Nokia
|
Financial
statements
|
Other
information
|
186 |
|||||||
Business
overview
|
Corporate
governance
|
Operating and financial
review and prospects
|
General facts
on Nokia
|
Financial
statements
|
Other
information
|
187 |
|||||||
Interest-bearing loans and other borrowings
All borrowings presented in the table below are senior unsecured and have no financial covenants.
| ||||||
Carrying amount EURm(1) |
||||||
Issuer/borrower |
Instrument |
Currency |
Nominal (million) |
Final maturity |
2023 |
2022 |
Nokia Corporation |
2.00% Senior Notes(2) |
EUR |
378 |
3/2024 |
375 |
736 |
Nokia Corporation |
EIB R&D Loan |
EUR |
500 |
2/2025 |
500 |
500 |
Nokia Corporation |
NIB R&D Loan(3) |
EUR |
167 |
5/2025 |
167 |
250 |
Nokia Corporation |
2.375% Senior Notes(2) |
EUR |
292 |
5/2025 |
289 |
478 |
Nokia Corporation |
2.00% Senior Notes(2) |
EUR |
630 |
3/2026 |
614 |
716 |
Nokia Corporation |
4.375% Senior Notes |
USD |
500 |
6/2027 |
430 |
436 |
Nokia of America Corporation |
6.50% Senior Notes |
USD |
74 |
1/2028 |
67 |
70 |
Nokia Corporation |
3.125% Senior Notes |
EUR |
500 |
5/2028 |
479 |
457 |
Nokia of America Corporation |
6.45% Senior Notes |
USD |
206 |
3/2029 |
187 |
194 |
Nokia Corporation |
4.375% Sustainability-
linked Senior Notes(4)
|
EUR |
500 |
8/2031 |
510 |
— |
Nokia Corporation |
6.625% Senior Notes |
USD |
500 |
5/2039 |
463 |
478 |
Nokia Corporation and various subsidiaries |
Other borrowings |
110 |
162 |
|||
Total |
4 191 |
4 477 |
||||
(1)Carrying amount includes EUR 31 million of fair value losses (EUR 120 million in 2022) related to fair value hedge accounting relationships, including EUR 156 million of fair
value gains (EUR 180 million in 2022) related to discontinued fair value hedge accounting relationships that are amortized over the life of the respective senior notes.
(2)In February 2023 Nokia purchased in a tender offer EUR 372 million (49.66% of the nominal amount) of the notes due 15 March 2024, EUR 208 million (41.57% of the nominal
amount) of the notes due 15 May 2025 and EUR 120 million (15.96% of the nominal amount) of the notes due 11 March 2026.
(3)The remaining loan from the Nordic Investment Bank (NIB) is repayable in two equal annual installments in 2024 and 2025.
(4)The bond has a one-time redemption premium at maturity of EUR 4 million in case Nokia does not meet its commitment to reduce its greenhouse gas emissions (in tCO2e)
across its value chain (Scope 1, 2, and 3) by 50% between 2019 and 2030. This target is one of Nokia’s key sustainability targets and has been selected to be the Sustainability
Performance Target in Nokia’s Sustainable Finance Framework that enables the issuance of sustainability-linked financing instruments.
| ||||||
Changes in level 3 financial assets and liabilities measured at fair value | |||||
2023 |
2022 |
||||
EURm |
Financial assets |
Financial liabilities |
Financial assets |
Financial liabilities |
|
1 January |
823 |
(550) |
750 |
(590) |
|
Net (losses)/gains in income statement |
(76) |
31 |
13 |
24 |
|
Additions(1) |
56 |
— |
101 |
— |
|
Deductions(1) |
(24) |
19 |
(39) |
20 |
|
Transfers out of level 3 |
— |
— |
(4) |
— |
|
Other movements |
— |
1 |
2 |
(4) |
|
31 December |
779 |
(499) |
823 |
(550) |
|
(1)For level 3 financial assets, additions mainly include capital contributions to venture funds and deductions mainly include distributions from venture funds. | |||||
A net loss of EUR 42 million (net gain of EUR 23 million in 2022) related to level 3 financial instruments held at 31 December was
included in the profit and loss during 2023.
| |||||
Business
overview
|
Corporate
governance
|
Operating and financial
review and prospects
|
General facts
on Nokia
|
Financial
statements
|
Other
information
|
188 |
|||||||
Business
overview
|
Corporate
governance
|
Operating and financial
review and prospects
|
General facts
on Nokia
|
Financial
statements
|
Other
information
|
189 |
|||||||
Business
overview
|
Corporate
governance
|
Operating and financial
review and prospects
|
General facts
on Nokia
|
Financial
statements
|
Other
information
|
190 |
|||||||
2023 |
2022 |
||||||||||
Assets |
Liabilities |
Assets |
Liabilities |
||||||||
EURm |
Fair value(1) |
Notional(2) |
Fair value(1) |
Notional(2) |
Fair value(1) |
Notional(2) |
Fair value(1) |
Notional(2) |
|||
Cash flow hedges |
|||||||||||
Foreign exchange forward contracts |
26 |
1 206 |
(19) |
1 039 |
77 |
1 775 |
(30) |
1 034 |
|||
Currency options bought |
3 |
466 |
— |
— |
2 |
173 |
— |
— |
|||
Currency options sold |
— |
— |
— |
23 |
— |
— |
— |
— |
|||
Fuel hedges |
— |
— |
(1) |
50 |
2 |
33 |
— |
— |
|||
Cash flow and fair value hedges(3) |
|||||||||||
Cross-currency swaps |
— |
— |
(144) |
905 |
— |
— |
(123) |
938 |
|||
Fair value hedges |
|||||||||||
Interest rate swaps |
24 |
1 195 |
(28) |
1 105 |
— |
— |
(99) |
2 500 |
|||
Foreign exchange forward contracts |
14 |
627 |
(59) |
1 337 |
19 |
393 |
(163) |
1 981 |
|||
Firm commitments |
22 |
1 788 |
(9) |
434 |
117 |
1 842 |
(28) |
384 |
|||
Hedges on net investment in foreign subsidiaries |
|||||||||||
Foreign exchange forward contracts |
6 |
1 111 |
— |
81 |
— |
3 509 |
(9) |
1 103 |
|||
Derivatives not designated in hedge accounting relationships carried at fair value through profit and loss |
|||||||||||
Foreign exchange forward contracts |
58 |
6 889 |
(35) |
6 012 |
86 |
5 625 |
(72) |
6 968 |
|||
Currency options bought |
— |
10 |
— |
— |
— |
18 |
— |
— |
|||
Embedded derivatives(4) |
3 |
620 |
— |
— |
51 |
2 495 |
— |
— |
|||
Other derivatives |
— |
12 |
— |
— |
2 |
5 |
— |
— |
|||
Total |
156 |
13 924 |
(295) |
10 986 |
356 |
15 868 |
(524) |
14 908 |
|||
(1)Included in other current financial and firm commitment assets and other financial and firm commitment liabilities in the statement of financial position.
(2)Includes the gross amount of all notional values for contracts that have not yet been settled or canceled. The amount of notional value outstanding is not necessarily a measure or indication of market risk as the exposure of certain contracts may be offset by that of
other contracts.
(3)Cross-currency swaps have been designated partly as fair value hedges and partly as cash flow hedges.
(4)Embedded derivatives are related to customer contracts.
| |||||||||||
Notional (million in currency) |
Fair value EURm |
||||||||
Entity |
Instrument |
Currency |
Maturity |
2023 |
2022 |
2023 |
2022 |
||
Nokia Corporation |
Interest rate swaps |
EUR |
3/2024 |
378 |
750 |
2 |
(12) |
||
Nokia Corporation |
Interest rate swaps |
EUR |
5/2025 |
292 |
500 |
— |
(17) |
||
Nokia Corporation |
Interest rate swaps |
EUR |
3/2026 |
630 |
750 |
(13) |
(34) |
||
Nokia Corporation |
Cross-currency swaps |
USD |
6/2027 |
500 |
500 |
(28) |
(26) |
||
Nokia Corporation |
Interest rate swaps |
EUR |
5/2028 |
500 |
500 |
(13) |
(36) |
||
Nokia Corporation |
Interest rate swaps |
EUR |
8/2031 |
500 |
— |
20 |
— |
||
Nokia Corporation |
Cross-currency swaps |
USD |
5/2039 |
500 |
500 |
(116) |
(97) |
||
Total |
(148) |
(222) |
|||||||
Business
overview
|
Corporate
governance
|
Operating and financial
review and prospects
|
General facts
on Nokia
|
Financial
statements
|
Other
information
|
191 |
|||||||
Business
overview
|
Corporate
governance
|
Operating and financial
review and prospects
|
General facts
on Nokia
|
Financial
statements
|
Other
information
|
192 |
|||||||
EURm |
USD |
CNY |
JPY |
INR |
2023 |
||||
Foreign exchange exposure designated as hedged item for cash flow hedging, net(1) |
606 |
(232) |
281 |
(153) |
Foreign exchange exposure designated as hedged item for fair value hedging for FX risk, net(2) |
1 354 |
— |
— |
— |
Foreign exchange exposure designated as hedged item for net investment hedging(3) |
— |
788 |
— |
184 |
Foreign exchange exposure from interest-bearing liabilities(4) |
(750) |
— |
— |
— |
Foreign exchange exposure from items on the statement of financial position, excluding interest-bearing liabilities, net |
2 475 |
(804) |
147 |
(346) |
Other foreign exchange derivatives, carried at fair value through profit and loss, net(5) |
(205) |
720 |
(100) |
(38) |
2022 |
||||
Foreign exchange exposure designated as hedged item for cash flow hedging, net(1) |
854 |
(402) |
311 |
(68) |
Foreign exchange exposure designated as hedged item for fair value hedging for FX risk, net(2) |
1 458 |
— |
— |
— |
Foreign exchange exposure designated as hedged item for net investment hedging(3) |
3 007 |
866 |
— |
192 |
Foreign exchange exposure from interest-bearing liabilities(4) |
(758) |
— |
— |
— |
Foreign exchange exposure from items on the statement of financial position, excluding interest-bearing liabilities, net |
(2 709) |
(888) |
204 |
(272) |
Other foreign exchange derivatives, carried at fair value through profit and loss, net(5) |
4 214 |
892 |
(151) |
(1 117) |
EURm |
Cash flow hedges(1) |
Net investment hedges(1) |
Fair value hedges for FX risk(1) |
Fair value and cash flow hedges(1) |
2023 |
||||
Carrying amount of hedging instruments |
2 |
5 |
(45) |
(174) |
Notional amount of hedging instruments |
(968) |
(1 166) |
(1 354) |
3 205 |
Notional amount of hedged items |
968 |
1 166 |
1 354 |
(3 205) |
Change in intrinsic value of hedging instruments since 1 January |
22 |
132 |
40 |
89 |
Change in value of hedged items used to determine hedge effectiveness |
(15) |
(132) |
(42) |
(93) |
2022 |
||||
Carrying amount of hedging instruments |
46 |
(9) |
(145) |
(247) |
Notional amount of hedging instruments |
(1 350) |
(4 299) |
(1 456) |
3 438 |
Notional amount of hedged items |
1 353 |
4 299 |
1 458 |
(3 438) |
Change in intrinsic value of hedging instruments since 1 January |
(12) |
(126) |
(111) |
(265) |
Change in value of hedged items used to determine hedge effectiveness |
20 |
126 |
112 |
262 |
Business
overview
|
Corporate
governance
|
Operating and financial
review and prospects
|
General facts
on Nokia
|
Financial
statements
|
Other
information
|
193 |
|||||||
The VaR risk measures for Nokia’s sensitivity to foreign exchange risks are presented in the Total VaR column and the simulated
impact to financial statements is presented in the profit, other comprehensive income (OCI) and cumulative translation
adjustment (CTA) columns in the table below.
| |||||||||
2023 |
2022 |
||||||||
Simulated impact on financial statements |
Simulated impact on financial statements |
||||||||
EURm |
Total VaR |
Profit |
OCI |
CTA |
Total VaR |
Profit |
OCI |
CTA |
|
31 December |
72 |
67 |
18 |
— |
38 |
40 |
33 |
— |
|
Average for the year |
32 |
25 |
23 |
— |
31 |
36 |
48 |
— |
|
Range for the year |
19-72 |
12-67 |
9-40 |
0-0 |
12-67 |
17-59 |
31-70 |
0-0 |
|
The most significant foreign exchange hedging instruments under cash flow, net investment and fair value hedge accounting at
31 December:
| ||||||||
Maturity breakdown of notional amounts (EURm)(1) |
||||||||
Currency |
Fair value
(EURm)
|
Weighted
average
hedged rate
|
Total |
Within 3
months
|
Between 3
and 12
months
|
Between 1
and 3 years
|
Beyond 3
years
|
|
2023 |
||||||||
Cash flow hedge accounting |
GBP |
(1) |
0.8640 |
(219) |
(63) |
(156) |
— |
— |
USD |
5 |
1.0881 |
(860) |
(231) |
(629) |
— |
— |
|
USD |
(2) |
1.0832 |
257 |
— |
119 |
131 |
7 |
|
Net investment hedge accounting |
CNY |
4 |
7.8152 |
(788) |
(788) |
— |
— |
— |
Fair value hedge accounting for FX risk |
USD |
(45) |
1.1196 |
(1 354) |
(427) |
(301) |
(616) |
(10) |
2022 |
||||||||
Cash flow hedge accounting |
GBP |
5 |
0.8593 |
(235) |
(76) |
(159) |
— |
— |
JPY |
5 |
138.8404 |
(235) |
(66) |
(169) |
— |
— |
|
USD |
22 |
1.0394 |
(1 261) |
(347) |
(914) |
— |
— |
|
USD |
12 |
1.0868 |
423 |
— |
193 |
217 |
13 |
|
Net investment hedge accounting |
CNY |
(8) |
7.4193 |
(866) |
(866) |
— |
— |
— |
USD |
(3) |
1.0563 |
(3 007) |
(3 007) |
— |
— |
— |
|
Fair value hedge accounting for FX risk |
USD |
(145) |
1.1358 |
(1 456) |
(448) |
(213) |
(787) |
(8) |
(1) Negative notional amounts indicate that hedges sell currency, and positive notional amounts indicate that hedges buy currency. | ||||||||
Business
overview
|
Corporate
governance
|
Operating and financial
review and prospects
|
General facts
on Nokia
|
Financial
statements
|
Other
information
|
194 |
|||||||
Interest rate profile of items under interest rate risk management at 31 December: | |||||
2023 |
2022 |
||||
EURm |
Fixed rate |
Floating rate(1) |
Fixed rate |
Floating rate(1) |
|
Non-current interest-bearing financial investments |
715 |
— |
697 |
— |
|
Current interest-bearing financial investments |
510 |
1 055 |
912 |
2 168 |
|
Cash and cash equivalents |
55 |
6 179 |
346 |
5 121 |
|
Interest-bearing liabilities |
(3 483) |
(708) |
(3 658) |
(819) |
|
Financial assets and liabilities before derivatives |
(2 203) |
6 526 |
(1 703) |
6 470 |
|
Interest rate derivatives |
3 057 |
(3 057) |
3 216 |
(3 216) |
|
Financial assets and liabilities after derivatives |
854 |
3 469 |
1 513 |
3 254 |
|
(1)All cash equivalents and derivative transaction-related collaterals with initial maturity of three months or less are considered floating rate for the purposes of interest rate risk
management.
| |||||
Nokia’s sensitivity to interest rate exposure in the investment and debt portfolios is presented in the fair value column in the table
below with simulated impact to the financial statements presented in the profit and other comprehensive income (OCI) columns.
| |||||||
2023 |
2022 |
||||||
Impact on |
Impact on |
Impact on |
Impact on |
Impact on |
Impact on |
||
EURm |
fair value |
profit |
OCI |
fair value |
profit |
OCI |
|
Interest rates - increase by 100 basis points |
(6) |
3 |
1 |
(2) |
3 |
(1) |
|
Interest rates - decrease by 100 basis points |
8 |
(4) |
(1) |
4 |
(2) |
(1) |
|
Business
overview
|
Corporate
governance
|
Operating and financial
review and prospects
|
General facts
on Nokia
|
Financial
statements
|
Other
information
|
195 |
|||||||
Outstanding non-current and current interest-bearing financial investments, cash equivalents and cash classified by credit
rating grades ranked in line with S&P Global Ratings categories at 31 December:
| ||||||||
Cash equivalents and interest-bearing financial investments |
||||||||
EURm |
Rating(1) |
Cash |
Due within 3
months
|
Due between 3
and 12 months
|
Due between 1
and 3 years
|
Due between 3
and 5 years
|
Due beyond 5
years
|
Total(2)(3) |
2023 |
AAA |
— |
1 443 |
25 |
— |
— |
— |
1 468 |
AA+ - AA- |
1 042 |
149 |
74 |
— |
8 |
— |
1 273 |
|
A+ - A- |
2 183 |
1 340 |
301 |
255 |
245 |
23 |
4 347 |
|
BBB+ - BBB- |
456 |
242 |
134 |
230 |
227 |
— |
1 289 |
|
Other |
133 |
4 |
— |
— |
— |
— |
137 |
|
Total |
3 814 |
3 178 |
534 |
485 |
480 |
23 |
8 514 |
|
2022 |
AAA |
— |
1 046 |
— |
— |
— |
— |
1 046 |
AA+ - AA- |
683 |
643 |
250 |
— |
— |
— |
1 576 |
|
A+ - A- |
1 553 |
2 314 |
865 |
190 |
234 |
203 |
5 359 |
|
BBB+ - BBB- |
39 |
477 |
52 |
291 |
197 |
70 |
1 126 |
|
Other |
123 |
6 |
— |
— |
8 |
— |
137 |
|
Total |
2 398 |
4 486 |
1 167 |
481 |
439 |
273 |
9 244 |
|
(1)Bank Parent Company ratings are used here for bank groups. Actual bank subsidiary ratings may differ from the Bank Parent Company rating.
(2)Non-current and current interest-bearing financial investments and cash equivalents include bank deposits, structured deposits, investments in money market funds and
investments in fixed income instruments.
(3)Instruments that include a call feature have been presented at their final maturities. Instruments that are contractually due beyond three months include EUR 332 million
(EUR 551 million in 2022) of instruments that have a call period of less than three months.
| ||||||||
The following table sets out financial assets and liabilities subject to offsetting under enforceable master netting agreements
and similar arrangements at 31 December. To reconcile the items presented to the statement of financial position, items that
are not subject to offsetting would need to be included, refer to Note 5.3. Derivative and firm commitment assets and liabilities.
| ||||
Related amounts not set off in the statement of financial position |
||||
EURm |
Net amounts of financial assets/
(liabilities) presented in the
statement of financial position
|
Financial instruments
assets/(liabilities)
|
Cash collateral
(received)/pledged
|
Net amount |
2023 |
||||
Derivative assets |
131 |
(115) |
(15) |
1 |
Derivative liabilities |
(285) |
115 |
164 |
(6) |
Total |
(154) |
— |
149 |
(5) |
2022 |
||||
Derivative assets |
182 |
(158) |
(20) |
4 |
Derivative liabilities |
(496) |
158 |
327 |
(11) |
Total |
(314) |
— |
307 |
(7) |
The financial instruments subject to enforceable master netting agreements and similar arrangements are not offset in the
statement of financial position as there is no intention to settle net or realize the asset and settle the liability simultaneously.
|
Business
overview
|
Corporate
governance
|
Operating and financial
review and prospects
|
General facts
on Nokia
|
Financial
statements
|
Other
information
|
196 |
|||||||
Nokia’s significant credit facilities and funding programs at 31 December: | |||||
Utilized (million) |
|||||
Committed/uncommitted |
Financing arrangement |
Currency |
Nominal (million) |
2023 |
2022 |
Committed |
Revolving Credit Facility(1) |
EUR |
1 500 |
— |
— |
Uncommitted |
Finnish Commercial Paper Programme |
EUR |
750 |
— |
— |
Uncommitted |
Euro-Commercial Paper Programme |
EUR |
1 500 |
— |
— |
Uncommitted |
Euro Medium Term Note Programme(2) |
EUR |
5 000 |
2 300 |
2 500 |
Total |
2 300 |
2 500 |
|||
(1)The facility has its maturity in June 2026, except for EUR 88 million having its maturity in June 2024.
(2)All euro-denominated bonds have been issued under the Euro Medium Term Note Programme.
| |||||
Changes in lease liabilities, interest-bearing liabilities and associated derivatives arising from financing activities: | |||||
EURm |
Long-term
interest-bearing
liabilities
|
Short-term
interest-bearing
liabilities
|
Derivatives held
to hedge long-
term
borrowings(1)
|
Lease liabilities(2) |
Total |
1 January 2023 |
4 249 |
228 |
246 |
1 042 |
5 765 |
Cash flows |
(283) |
(40) |
(19) |
(239) |
(581) |
Non-cash changes: |
|||||
Changes in foreign exchange rates |
(34) |
(3) |
25 |
(12) |
(24) |
Changes in fair value |
83 |
— |
(79) |
— |
4 |
Reclassification between long-term and short-term |
(374) |
374 |
— |
— |
— |
Additions(3) |
— |
— |
— |
206 |
206 |
Other |
(4) |
(5) |
1 |
— |
(8) |
31 December 2023 |
3 637 |
554 |
174 |
997 |
5 362 |
1 January 2022 |
4 537 |
116 |
53 |
1 009 |
5 715 |
Cash flows |
(1) |
27 |
7 |
(217) |
(184) |
Non-cash changes: |
|||||
Changes in foreign exchange rates |
69 |
1 |
(57) |
8 |
21 |
Changes in fair value |
(282) |
— |
243 |
— |
(39) |
Reclassification between long-term and short-term |
(84) |
84 |
— |
— |
— |
Additions(3) |
— |
— |
— |
242 |
242 |
Other |
10 |
— |
— |
— |
10 |
31 December 2022 |
4 249 |
228 |
246 |
1 042 |
5 765 |
(1)Includes derivatives designated in fair value and cash flow hedge accounting relationships as well as derivatives not designated in hedge accounting relationship but hedging
identifiable long-term borrowing exposure.
(2)Includes non-current and current lease liabilities.
(3)Includes new lease contracts as well as modifications and remeasurements of existing lease contracts.
| |||||
Business
overview
|
Corporate
governance
|
Operating and financial
review and prospects
|
General facts
on Nokia
|
Financial
statements
|
Other
information
|
197 |
|||||||
2023 |
2022 |
||||||||||||
Due |
Due |
||||||||||||
EURm |
within 3
months
|
between 3 and
12 months
|
between 1
and 3 years
|
between 3
and 5 years
|
beyond 5
years
|
Total |
within 3
months
|
between 3 and
12 months
|
between 1
and 3 years
|
between 3
and 5 years
|
beyond 5
years
|
Total |
|
Non-current financial assets |
|||||||||||||
Non-current interest-bearing financial investments |
— |
— |
394 |
385 |
— |
779 |
5 |
7 |
376 |
275 |
104 |
767 |
|
Other non-current financial assets(1) |
— |
— |
60 |
8 |
46 |
114 |
— |
— |
30 |
2 |
46 |
78 |
|
Current financial assets |
|||||||||||||
Other current financial assets excluding derivatives(1) |
216 |
31 |
— |
— |
— |
247 |
207 |
77 |
— |
— |
— |
284 |
|
Current interest-bearing financial investments(2) |
998 |
595 |
— |
— |
— |
1 593 |
2 146 |
946 |
— |
— |
— |
3 092 |
|
Cash and cash equivalents(2) |
6 017 |
52 |
30 |
138 |
26 |
6 263 |
4 947 |
31 |
136 |
200 |
195 |
5 509 |
|
Cash flows related to derivative financial assets net settled: |
|||||||||||||
Derivative contracts – receipts |
(7) |
(2) |
(11) |
(12) |
(10) |
(42) |
— |
— |
— |
— |
— |
— |
|
Cash flows related to derivative financial assets gross settled: |
|||||||||||||
Derivative contracts – receipts |
8 407 |
1 582 |
358 |
6 |
— |
10 353 |
9 170 |
2 109 |
297 |
20 |
— |
11 596 |
|
Derivative contracts – payments |
(8 349) |
(1 560) |
(353) |
(6) |
— |
(10 268) |
(9 089) |
(2 038) |
(282) |
(20) |
— |
(11 429) |
|
Trade receivables |
3 834 |
1 316 |
184 |
— |
— |
5 334 |
4 885 |
1 004 |
123 |
2 |
— |
6 014 |
|
Non-current financial and lease liabilities |
|||||||||||||
Long-term interest-bearing liabilities |
(33) |
(115) |
(1 766) |
(1 200) |
(1 528) |
(4 642) |
(43) |
(98) |
(2 182) |
(1 397) |
(1 628) |
(5 348) |
|
Long-term lease liabilities |
— |
— |
(353) |
(199) |
(304) |
(856) |
— |
— |
(340) |
(200) |
(327) |
(867) |
|
Other non-current financial liabilities |
— |
— |
(11) |
(11) |
(11) |
(33) |
— |
— |
(17) |
— |
— |
(17) |
|
Current financial and lease liabilities |
|||||||||||||
Short-term interest-bearing liabilities |
(473) |
(98) |
— |
— |
— |
(571) |
(131) |
(99) |
— |
— |
— |
(230) |
|
Short-term lease liabilities |
(44) |
(179) |
— |
— |
— |
(223) |
(61) |
(162) |
— |
— |
— |
(223) |
|
Other financial liabilities excluding derivatives(3) |
(458) |
(24) |
— |
— |
— |
(482) |
(482) |
(20) |
— |
— |
— |
(502) |
|
Cash flows related to derivative financial liabilities net settled: |
|||||||||||||
Derivative contracts - payments |
(4) |
(29) |
(41) |
(12) |
— |
(86) |
5 |
(31) |
(1) |
7 |
7 |
(13) |
|
Cash flows related to derivative financial liabilities gross settled: |
|||||||||||||
Derivative contracts – receipts |
6 475 |
1 322 |
735 |
541 |
767 |
9 840 |
8 832 |
1 271 |
919 |
573 |
826 |
12 421 |
|
Derivative contracts – payments |
(6 553) |
(1 353) |
(806) |
(551) |
(858) |
(10 121) |
(8 992) |
(1 303) |
(1 003) |
(542) |
(778) |
(12 618) |
|
Discounts without performance obligations |
(151) |
(212) |
(40) |
(1) |
— |
(404) |
(205) |
(211) |
(121) |
(2) |
— |
(539) |
|
Trade payables |
(3 154) |
(204) |
(64) |
— |
(1) |
(3 423) |
(4 561) |
(165) |
(3) |
— |
(1) |
(4 730) |
|
Commitments given and obtained |
|||||||||||||
Loan commitments given undrawn(4) |
(1) |
(4) |
— |
— |
— |
(5) |
(13) |
(13) |
— |
— |
— |
(26) |
|
Loan commitments obtained undrawn(5) |
(1) |
86 |
1 408 |
— |
— |
1 493 |
(1) |
(3) |
80 |
1 410 |
— |
1 486 |
|
(1)Other non-current financial assets and other current financial assets excluding derivatives include mainly customer financing-related loan receivables.
(2)Instruments that include a call feature have been presented at their final maturities. Instruments that are contractually due beyond three months include EUR 332 million (EUR 551 million in 2022) of instruments that have a call period of less than three months.
(3)Other financial liabilities excluding derivatives include a conditional obligation to China Huaxin presented in the earliest period as the exercise period is open.
(4)Loan commitments given undrawn have been included in the earliest period in which they could be drawn or called.
(5)Loan commitments obtained undrawn have been included based on the period in which they expire. These amounts include related commitment fees.
| |||||||||||||
Business
overview
|
Corporate
governance
|
Operating and financial
review and prospects
|
General facts
on Nokia
|
Financial
statements
|
Other
information
|
198 |
|||||||
Section 6 |
EURm |
Within 1 year |
1-5 years |
More than 5
years
|
2023 |
|||
Purchase obligations |
3 630 |
767 |
14 |
Lease commitments(1) |
— |
54 |
570 |
2022 |
|||
Purchase obligations |
5 308 |
509 |
79 |
Lease commitments(1) |
— |
31 |
192 |
EURm |
2023 |
2022 |
Guarantees on behalf of Group companies |
||
Guarantees issued by financial institutions |
||
Commercial guarantees(1) |
1 477 |
1 238 |
Non-commercial guarantees |
615 |
538 |
Corporate guarantees(2) |
||
Commercial guarantees(1) |
325 |
504 |
Non-commercial guarantees |
35 |
32 |
Financing commitments |
||
Customer finance commitments(3) |
5 |
26 |
Venture fund commitments(4) |
381 |
433 |
Business
overview
|
Corporate
governance
|
Operating and financial
review and prospects
|
General facts
on Nokia
|
Financial
statements
|
Other
information
|
199 |
|||||||
Business
overview
|
Corporate
governance
|
Operating and financial
review and prospects
|
General facts
on Nokia
|
Financial
statements
|
Other
information
|
200 |
|||||||
Company name |
Country of incorporation |
Parent holding % |
Group ownership
interest %
|
Nokia Solutions and Networks Oy |
Finland |
100.0 |
100.0 |
Nokia of America Corporation |
United States |
— |
100.0 |
Nokia Shanghai Bell Co., Ltd.(1) |
China |
— |
50.0 |
Nokia Solutions and Networks B.V. |
Netherlands |
— |
100.0 |
Nokia Technologies Oy |
Finland |
100.0 |
100.0 |
Nokia Participations |
France |
— |
100.0 |
Alcatel Lucent |
France |
— |
100.0 |
Nokia Networks France |
France |
— |
100.0 |
Nokia Solutions and Networks India Private Limited |
India |
— |
100.0 |
Nokia Solutions and Networks Japan G.K. |
Japan |
— |
100.0 |
Nokia Solutions and Networks Branch Operations Oy |
Finland |
— |
100.0 |
Alcatel Submarine Networks |
France |
— |
100.0 |
Nokia Arabia Limited |
Saudi Arabia |
— |
100.0 |
Nokia Solutions and Networks do Brasil Telecomunicações Ltda. |
Brazil |
— |
100.0 |
Nokia Solutions and Networks Taiwan Co., Ltd. |
Taiwan |
— |
100.0 |
Nokia Spain, S.A. |
Spain |
— |
100.0 |
Nokia UK Limited |
United Kingdom |
— |
100.0 |
Nokia Solutions and Networks System Technology (Beijing) Co., Ltd.(2) |
China |
— |
50.0 |
Nokia Canada Inc. |
Canada |
— |
100.0 |
Nokia Solutions and Networks Italia S.p.A. |
Italy |
— |
100.0 |
Nokia Solutions and Networks Australia Pty Ltd |
Australia |
— |
100.0 |
(1)Nokia Group owns 50% plus 1 share of Nokia Shanghai Bell Co., Ltd. with China Huaxin, an entity controlled by the Chinese government, holding the remaining ownership
interests. Nokia Shanghai Bell Co., Ltd. is the parent company of the Nokia Shanghai Bell Group (NSB Group). Refer to Note 6.3. Significant partly-owned subsidiaries.
(2)Nokia Solutions and Network System Technology (Beijing) Co., Ltd. is a wholly-owned subsidiary of Nokia Shanghai Bell Co., Ltd. and the Nokia Group has control over this
subsidiary through its holding in the NSB Group.
| |||
Business
overview
|
Corporate
governance
|
Operating and financial
review and prospects
|
General facts
on Nokia
|
Financial
statements
|
Other
information
|
201 |
|||||||
EURm |
2023 |
2022 |
Summarized income statement |
||
Net sales(1) |
979 |
1 316 |
Operating loss |
(6) |
(149) |
Loss for the year |
(26) |
(148) |
Loss for the year attributable to: |
||
Equity holders of the parent |
(26) |
(148) |
Non-controlling interests(2) |
— |
— |
Summarized statement of financial position |
||
Non-current assets |
400 |
487 |
Non-current liabilities |
(100) |
(129) |
Non-current net assets |
300 |
358 |
Current assets(3) |
1 642 |
1 939 |
Current liabilities |
(900) |
(1 185) |
Current net assets |
742 |
754 |
Net assets(4) |
1 042 |
1 112 |
Non-controlling interests(2) |
— |
— |
Summarized statement of cash flows |
||
Net cash flows from operating activities |
51 |
38 |
Net cash flows from/(used in) investing activities |
2 |
(33) |
Net cash flows used in financing activities |
(41) |
(4) |
Translation differences |
(38) |
(8) |
Net decrease in cash and cash equivalents |
(26) |
(7) |
Business
overview
|
Corporate
governance
|
Operating and financial
review and prospects
|
General facts
on Nokia
|
Financial
statements
|
Other
information
|
202 |
|||||||
EURm |
2023 |
2022 |
2021 |
||
Sales |
46 |
74 |
87 |
||
Purchases |
(141) |
(127) |
(144) |
||
Trade receivables |
18 |
36 |
45 |
||
Trade payables |
(31) |
(26) |
(29) |
Business
overview
|
Corporate
governance
|
Operating and financial
review and prospects
|
General facts
on Nokia
|
Financial
statements
|
Other
information
|
203 |
|||||||
Business
overview
|
Corporate
governance
|
Operating and financial
review and prospects
|
General facts
on Nokia
|
Financial
statements
|
Other
information
|
204 |
|||||||
Business
overview
|
Corporate
governance
|
Operating and financial
review and prospects
|
General facts
on Nokia
|
Financial
statements
|
Other
information
|
205 |
|||||||
Business
overview
|
Corporate
governance
|
Operating and financial
review and prospects
|
General facts
on Nokia
|
Financial
statements
|
Other
information
|
206 |
|||||||

Business
overview
|
Corporate
governance
|
Operating and financial
review and prospects
|
General facts
on Nokia
|
Financial
statements
|
Other
information
|
207 |
|||||||
1 |
|
8 |
|
11 |
|
12.1 |
|
12.2 |
|
13 |
|
15.1 |
|
97.1 |
|
101 |
Interactive Data Files (Inline XBRL – Related Documents). |
104 |
Cover Page Interactive Data File (formatted as inline XBRL and contained in Exhibit
101).
|
Business
overview
|
Corporate
governance
|
Operating and financial
review and prospects
|
General facts
on Nokia
|
Financial
statements
|
Other
information
|
208 |
|||||||
Business
overview
|
Corporate
governance
|
Operating and financial
review and prospects
|
General facts
on Nokia
|
Financial
statements
|
Other
information
|
209 |
|||||||
Business
overview
|
Corporate
governance
|
Operating and financial
review and prospects
|
General facts
on Nokia
|
Financial
statements
|
Other
information
|
210 |
|||||||
Business
overview
|
Corporate
governance
|
Operating and financial
review and prospects
|
General facts
on Nokia
|
Financial
statements
|
Other
information
|
211 |
|||||||
Symbol |
Trading currency |
|
Nasdaq Helsinki (since 1915) |
NOKIA |
EUR |
New York Stock Exchange (since 1994) |
NOK |
USD |
Euronext Paris (since 2015) |
NOKIA |
EUR |
Business
overview
|
Corporate
governance
|
Operating and financial
review and prospects
|
General facts
on Nokia
|
Financial
statements
|
Other
information
|
212 |
|||||||
Business
overview
|
Corporate
governance
|
Operating and financial
review and prospects
|
General facts
on Nokia
|
Financial
statements
|
Other
information
|
213 |
|||||||
| /s/ PEKKA LUNDMARK | |||||
| PEKKA LUNDMARK President and Chief Executive Officer |
|||||
| Date: 29 February 2024 | |||||
| /s/ MARCO WIRÉN | |||||
| MARCO WIRÉN | |||||
| Chief Financial Officer | |||||
| /s/ PEKKA LUNDMARK | ||||||||
| Name: | PEKKA LUNDMARK | |||||||
| Title: | President and Chief Executive Officer | |||||||
| /s/ MARCO WIRÉN | ||||||||
| Name: | MARCO WIRÉN | |||||||
| Title: | Chief Financial Officer | |||||||
| /s/ Deloitte Oy | ||||||||
| Deloitte Oy | ||||||||
| Helsinki, Finland | ||||||||
| 29 February 2024 | ||||||||
 |
1 / 6 |
Nokia Corporation - Executive Officer Clawback Policy |
© 2023 Nokia |
|
2 / 6 |
Nokia Corporation - Executive Officer Clawback Policy |
© 2023 Nokia |
|
3 / 6 |
Nokia Corporation - Executive Officer Clawback Policy |
© 2023 Nokia |
|
4 / 6 |
Nokia Corporation - Executive Officer Clawback Policy |
© 2023 Nokia |
|
5 / 6 |
Nokia Corporation - Executive Officer Clawback Policy |
© 2023 Nokia |
|
6 / 6 |
Nokia Corporation - Executive Officer Clawback Policy |
© 2023 Nokia |