SECURITIES AND EXCHANGE COMMISSION
WASHINGTON, D.C. 20549
FORM 8-K
CURRENT REPORT PURSUANT
TO SECTION 13 OR 15(d) OF THE
SECURITIES EXCHANGE ACT OF 1934
July 15, 2025
Date of Report (Date of earliest event reported)

UNITY BANCORP, INC.
(Exact Name of Registrant as Specified in its Charter)
New Jersey
(State or Other Jurisdiction of Incorporation)
1-12431 |
22-3282551 |
(Commission File Number) |
(IRS Employer Identification No.) |
64 Old Highway 22
Clinton, NJ 08809
(Address of Principal Executive Office)
(908) 730-7630
(Registrant’s Telephone Number, Including Area Code)
Check the appropriate box below if the Form 8-K filing is intended to simultaneously satisfy the filing obligation of the registrant under any of the following provisions:
☐ |
Written communications pursuant to Rule 425 under the Securities Act (17 CFR 230.425) |
☐ |
Soliciting material pursuant to Rule 14a12 under the Exchange Act (17 CFR 240.14a-12) |
☐ |
Pre-commencement communications pursuant to Rule 14d-2(b) under the Exchange Act (17 CFR 240.14d-2(b)) |
☐ |
Pre-commencement communications pursuant to Rule 13e-4(c) under the Exchange Act (17 CFR 240.13e-4(c)) |
Securities registered pursuant to Section 12(b) of the Act:
Title of each class |
Trading Symbol(s) |
Name of each exchange on which registered |
Common stock |
UNTY |
NASDAQ |
Indicate by check mark whether the registrant is an emerging growth company as defined in Rule 405 of the Securities Act of 1933 (§230.405 of this chapter) or Rule 12b-2 of the Securities Exchange Act of 1934 (§240.12b-2 of this chapter).
Emerging growth company ☐
If an emerging growth company, indicate by check mark if the registrant has elected not to use the extended transition period for complying with any new or revised financial accounting standards provided pursuant to Section 13(a) of the Exchange Act. ☐
Item 2.02 Results of Operation and Financial Condition
The Registrant issued a press release on July 15, 2025 announcing results for the three months and six months ended June 30, 2025, the full text of which is incorporated by reference to this Item.
Item 9.01 Financial Statements and Exhibits
(d) Exhibits
SIGNATURES
Pursuant to the requirements of the Securities Exchange Act of 1934, the Registrant has duly caused this Report to be signed on its behalf by the undersigned hereunto duly authorized.
|
UNITY BANCORP, INC. |
|
|
(Registrant) |
|
|
|
|
Date: July 15, 2025 |
|
|
|
By: |
/s/ George Boyan |
|
|
George Boyan |
|
|
Executive Vice President and Chief Financial Officer |
Exhibit 99.1
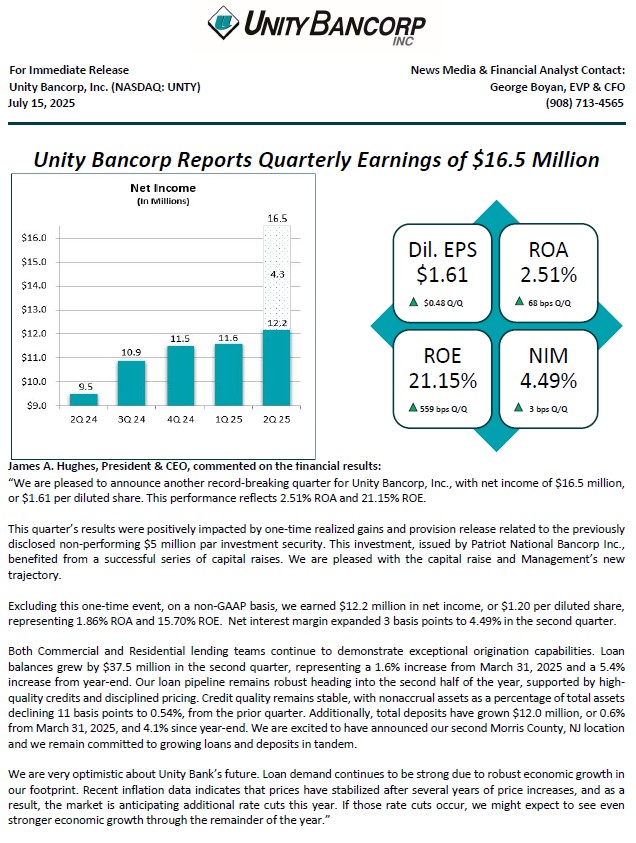
Clinton, NJ -- Unity Bancorp, Inc. (NASDAQ: UNTY), parent company of Unity Bank, reported net income of $16.5 million, or $1.61 per diluted share, for the quarter ended June 30, 2025, compared to net income of $11.6 million, or $1.13 per diluted share for the quarter ended March 31, 2025. For the six months ended June 30, 2025, Unity Bancorp reported net income of $28.1 million, or $2.74 per diluted share, compared to net income of $19.0 million, or $1.86 per diluted share, for the six months ended June 30, 2024. The increase in net income for the three and six months ended June 30, 2025 was partially attributable to pre-tax one-time gains of $3.5 million realized on the sale of securities and $2.0 million release for credit losses on securities, each related to securities of Patriot National Bancorp, Inc. held by the Company.
Second Quarter Earnings Highlights
| ● | Net interest income, the primary driver of earnings, was $28.6 million for the quarter ended June 30, 2025, an increase of $1.3 million, as compared to $27.3 million for the quarter ended March 31, 2025. Net interest margin (“NIM”) increased 3 basis points to 4.49% for the quarter ended June 30, 2025, compared to the quarter ended March 31, 2025. The increase was due to the yield on interest-earning assets increasing. |
| ● | The provision for credit losses on loans was $1.7 million for the quarter ended June 30, 2025, compared to $1.4 million for the quarter ended March 31, 2025. The provision in the current quarter was primarily driven by loan growth. |
| ● | During the quarter ended June 30, 2025, with respect to the debt securities held by the Company issued by Patriot National Bancorp, Inc., the Company elected to convert a portion of the principal and past due interest into shares of Patriot National Bancorp, Inc. common stock, bringing the Company’s total holdings to 4.4 million shares. The Company sold all 4.4 million shares, resulting in $6.5 million in net proceeds and a realized gain of $3.5 million. The Company was also able to release $2.0 million from reserve for credit losses on securities. As of June 30, 2025, the Company holds $2.0 million in par of the modified senior debt position in the AFS portfolio with a carrying value of $1.0 million. |
| ● | Noninterest income was $5.8 million for the quarter ended June 30, 2025, compared to $2.1 million for the quarter ended March 31, 2025. The $3.7 million increase was primarily due to the one-time realized gain of $3.5 million discussed above. The increase was complemented by increases of gains on sale of mortgage loans and partially offset by lower service & loan fee income. |
| ● | Noninterest expense was $13.0 million for the quarter ended June 30, 2025, compared to $12.6 million for the quarter ended March 31, 2025. Increases were predominately recognized in the compensation and benefits and loan related expense categories. The increase was partially offset by one-time director fees recognized during the quarter ended March 31, 2025. |
| ● | The effective tax rate was 23.4% for the quarter ended June 30, 2025, compared to 24.8% for the quarter ended March 31, 2025. |
Balance Sheet Highlights
| ● | Total gross loans increased $121.9 million, or 5.4%, from December 31, 2024, primarily due to increases in the commercial and residential mortgage loan categories. This was partially offset by decreases in the residential construction loan category. |
| ● | As of June 30, 2025, the allowance for credit losses as a percentage of gross loans was 1.22%. |
| ● | Total deposits increased $87.1 million, or 4.1%, from December 31, 2024. As of June 30, 2025, 19.5% of total deposits were uninsured or uncollateralized. The Company’s deposit composition as of June 30, 2025, consisted of 21.2% in noninterest bearing demand deposits, 16.2% in interest-bearing demand deposits, 23.2% in savings deposits and 39.4% in time deposits. |
| ● | As of June 30, 2025, investments comprised 4.8% of total assets. Available for sale debt securities (“AFS”) were $92.5 million or 3.2% of total assets. Held to maturity (“HTM”) debt securities were $36.4 million or 1.2% of total assets. As of June 30, 2025, pre-tax net unrealized losses on AFS and HTM were $2.8 million and $6.8 million, respectively. These pre-tax unrealized losses represent approximately 2.9% of the Company’s Tier 1 capital. Equity securities were $10.4 million or 0.4% of total assets as of June 30, 2025. |
| ● | Borrowed funds increased $156.6 million from December 31, 2024. Borrowed funds were entirely comprised of borrowings from the FHLB. |
| ● | Shareholders’ equity was $319.8 million as of June 30, 2025, compared to $295.6 million as of December 31, 2024. The $24.2 million increase was primarily driven by 2025 earnings, partially offset by dividend payments and share repurchase activity. Unity Bancorp repurchased 50,000 shares for a weighted average cost of $38.78 for the three and six months ended June 30, 2025. |
| ● | Book value per common share was $31.88 as of June 30, 2025, compared to $29.48 as of December 31, 2024. This increase primarily reflects retained earnings offset partially by share repurchases. |
| ● | Below is a summary of Unity Bancorp’s regulatory capital ratios: |
| o | The Leverage Ratio increased 28 basis points to 12.50% at June 30, 2025, compared to 12.22% at December 31, 2024. |
| o | The Common Equity Tier 1 Capital Ratio increased 6 basis points to 13.96% at June 30, 2025, compared to 13.90% at December 31, 2024. |
| o | The Tier 1 Capital Ratio increased 2 basis points to 14.39% at June 30, 2025, compared to 14.37% at December 31, 2024. |
| o | The Total Capital Ratio increased 3 basis points, to 15.65% at June 30, 2025, compared to 15.62% at December 31, 2024. |
| ● | At June 30, 2025, the Company held $293.7 million of cash and cash equivalents. The Company also maintained approximately $457.8 million of funding available from various sources, including the FHLB, FRB Discount Window and other lines of credit. Total available funding plus cash on hand represented 176.3% of uninsured or uncollateralized deposits. |
| ● | As of June 30, 2025, nonaccrual assets were $15.8 million, compared to $17.9 million as of March 31, 2025. The ratio of nonaccrual loans to total loans was 0.66% as of June 30, 2025. The ratio of nonaccrual assets to total assets was 0.54% as of June 30, 2025. |
Other Highlights
| ❖ | Unity Bank announced its intention to open a new branch in Madison, New Jersey. This branch will increase the total number of branches to 22, and is expected to open in the Fall of 2025. This location will continue Unity Bank’s growth trajectory and strengthens our Morris County presence. |
| ❖ | In April 2025, Unity Bancorp, Inc. was included in the Hovde Groups annual high-performer list. This list highlights the Company’s sustained excellence in financial management and customer service. |
Unity Bancorp, Inc. is a financial services organization headquartered in Clinton, New Jersey, with approximately $2.9 billion in assets and $2.2 billion in deposits. Unity Bank, the Company’s wholly owned subsidiary, provides financial services to retail, corporate and small business customers through its robust branch network located in Bergen, Hunterdon, Middlesex, Morris, Ocean, Somerset, Union, and Warren Counties in New Jersey and Northampton County in Pennsylvania. For additional information about Unity, visit our website at www.unitybank.com , or call 800-618-BANK.
This news release contains certain forward-looking statements, either expressed or implied, which are provided to assist the reader in understanding anticipated future financial performance. These statements may be identified by use of the words “believe”, “expect”, “intend”, “anticipate”, “estimate”, “project” or similar expressions. These statements involve certain risks, uncertainties, estimates and assumptions made by management, which are subject to factors beyond the Company’s control that could impede its ability to achieve these goals. These factors include those items included in our Annual Report on Form 10-K under the heading “Item IA-Risk Factors” as amended or supplemented by our subsequent filings with the SEC, as well as general economic conditions, trends in interest rates, the ability of our borrowers to repay their loans, our ability to manage and reduce the level of our nonperforming assets, results of regulatory exams, and the impact of any health crisis or national disasters on the Bank, its employees and customers, among other factors.
UNITY BANCORP, INC.
SUMMARY FINANCIAL HIGHLIGHTS
|
|
|
|
|
|
|
|
|
|
|
|
June 30, 2025 vs. |
|
||
|
|
|
|
|
|
|
|
|
|
|
|
March 31, 2025 |
|
June 30, 2024 |
|
(In thousands, except percentages and per share amounts) |
|
June 30, 2025 |
|
March 31, 2025 |
|
June 30, 2024 |
|
|
% |
|
% |
|
|||
BALANCE SHEET DATA |
|
|
|
|
|
|
|
|
|
|
|
|
|
|
|
Total assets |
|
$ |
2,928,523 |
|
$ |
2,767,943 |
|
$ |
2,597,707 |
|
|
5.8 |
% |
12.7 |
% |
Total deposits |
|
|
2,187,366 |
|
|
2,175,398 |
|
|
2,010,831 |
|
|
0.6 |
|
8.8 |
|
Total gross loans |
|
|
2,382,594 |
|
|
2,345,130 |
|
|
2,170,535 |
|
|
1.6 |
|
9.8 |
|
Total securities |
|
|
139,348 |
|
|
142,092 |
|
|
145,187 |
|
|
(1.9) |
|
(4.0) |
|
Total shareholders' equity |
|
|
319,840 |
|
|
306,142 |
|
|
273,395 |
|
|
4.5 |
|
17.0 |
|
Allowance for credit losses |
|
|
29,012 |
|
|
27,651 |
|
|
26,107 |
|
|
4.9 |
|
11.1 |
|
|
|
|
|
|
|
|
|
|
|
|
|
|
|
|
|
FINANCIAL DATA - QUARTER TO DATE |
|
|
|
|
|
|
|
|
|
|
|
|
|
|
|
Income before provision for income taxes |
|
$ |
21,528 |
|
$ |
15,424 |
|
$ |
12,552 |
|
|
39.6 |
|
71.5 |
|
Provision for income taxes |
|
|
5,037 |
|
|
3,826 |
|
|
3,098 |
|
|
31.7 |
|
62.6 |
|
Net income |
|
$ |
16,491 |
|
$ |
11,598 |
|
$ |
9,454 |
|
|
42.2 |
|
74.4 |
|
|
|
|
|
|
|
|
|
|
|
|
|
|
|
|
|
Net income per common share - Basic |
|
$ |
1.64 |
|
$ |
1.15 |
|
$ |
0.94 |
|
|
42.6 |
|
74.5 |
|
Net income per common share - Diluted |
|
|
1.61 |
|
|
1.13 |
|
|
0.93 |
|
|
42.5 |
|
73.1 |
|
|
|
|
|
|
|
|
|
|
|
|
|
|
|
|
|
PERFORMANCE RATIOS - QUARTER TO DATE (annualized) |
|
|
|
|
|
|
|
|
|
|
|
|
|
|
|
Return on average assets |
|
|
2.51 |
% |
|
1.83 |
% |
|
1.56 |
% |
|
|
|
|
|
Return on average equity |
|
|
21.15 |
|
|
15.56 |
|
|
14.07 |
|
|
|
|
|
|
Efficiency ratio** |
|
|
42.31 |
|
|
42.89 |
|
|
47.10 |
|
|
|
|
|
|
Cost of funds |
|
|
2.46 |
|
|
2.46 |
|
|
2.73 |
|
|
|
|
|
|
Net interest margin |
|
|
4.49 |
|
|
4.46 |
|
|
4.01 |
|
|
|
|
|
|
Noninterest expense to average assets |
|
|
1.98 |
|
|
1.99 |
|
|
1.98 |
|
|
|
|
|
|
|
|
|
|
|
|
|
|
|
|
|
|
|
|
|
|
FINANCIAL DATA - YEAR TO DATE |
|
|
|
|
|
|
|
|
|
|
|
|
|
|
|
Income before provision for income taxes |
|
$ |
36,952 |
|
|
|
|
$ |
25,336 |
|
|
|
|
45.8 |
|
Provision for income taxes |
|
|
8,863 |
|
|
|
|
|
6,296 |
|
|
|
|
40.8 |
|
Net income |
|
$ |
28,089 |
|
|
|
|
$ |
19,040 |
|
|
|
|
47.5 |
|
|
|
|
|
|
|
|
|
|
|
|
|
|
|
|
|
Net income per common share - Basic |
|
$ |
2.79 |
|
|
|
|
$ |
1.89 |
|
|
|
|
47.6 |
|
Net income per common share - Diluted |
|
|
2.74 |
|
|
|
|
|
1.86 |
|
|
|
|
47.3 |
|
|
|
|
|
|
|
|
|
|
|
|
|
|
|
|
|
PERFORMANCE RATIOS - YEAR TO DATE |
|
|
|
|
|
|
|
|
|
|
|
|
|
|
|
Return on average assets |
|
|
2.18 |
% |
|
|
|
|
1.57 |
% |
|
|
|
|
|
Return on average equity |
|
|
18.42 |
|
|
|
|
|
14.28 |
|
|
|
|
|
|
Efficiency ratio** |
|
|
42.59 |
|
|
|
|
|
47.33 |
|
|
|
|
|
|
Cost of funds |
|
|
2.46 |
|
|
|
|
|
2.70 |
|
|
|
|
|
|
Net interest margin |
|
|
4.48 |
|
|
|
|
|
4.05 |
|
|
|
|
|
|
Noninterest expense to average assets |
|
|
1.99 |
|
|
|
|
|
1.99 |
|
|
|
|
|
|
|
|
|
|
|
|
|
|
|
|
|
|
|
|
|
|
SHARE INFORMATION |
|
|
|
|
|
|
|
|
|
|
|
|
|
|
|
Market price per share |
|
$ |
47.08 |
|
$ |
40.70 |
|
$ |
29.57 |
|
|
15.7 |
|
59.2 |
|
Dividends paid (QTD) |
|
|
0.14 |
|
|
0.14 |
|
|
0.13 |
|
|
- |
|
7.7 |
|
Book value per common share |
|
|
31.88 |
|
|
30.38 |
|
|
27.41 |
|
|
4.9 |
|
16.3 |
|
Average diluted shares outstanding (QTD) |
|
|
10,212 |
|
|
10,247 |
|
|
10,149 |
|
|
(0.3) |
|
0.6 |
|
|
|
|
|
|
|
|
|
|
|
|
|
|
|
|
|
UNITY BANCORP CAPITAL RATIOS |
|
|
|
|
|
|
|
|
|
|
|
|
|
|
|
Total equity to total assets |
|
|
10.92 |
% |
|
11.06 |
% |
|
10.52 |
% |
|
(1.3) |
|
3.8 |
|
Leverage ratio |
|
|
12.50 |
|
|
12.32 |
|
|
11.67 |
|
|
1.5 |
|
7.1 |
|
Common Equity Tier 1 Capital Ratio |
|
|
13.96 |
|
|
13.87 |
|
|
13.31 |
|
|
0.6 |
|
4.9 |
|
Risk-based Tier 1 Capital Ratio |
|
|
14.39 |
|
|
14.33 |
|
|
13.80 |
|
|
0.4 |
|
4.3 |
|
Risk-based Total Capital Ratio |
|
|
15.65 |
|
|
15.58 |
|
|
15.05 |
|
|
0.4 |
|
4.0 |
|
|
|
|
|
|
|
|
|
|
|
|
|
|
|
|
|
CREDIT QUALITY AND RATIOS |
|
|
|
|
|
|
|
|
|
|
|
|
|
|
|
Nonaccrual assets |
|
$ |
15,840 |
|
$ |
17,990 |
|
$ |
15,193 |
|
|
(12.0) |
|
4.3 |
|
QTD annualized net (chargeoffs) to QTD average loans |
|
|
(0.06) |
% |
|
(0.09) |
% |
|
(0.04) |
% |
|
|
|
|
|
Allowance for credit losses to total loans |
|
|
1.22 |
|
|
1.18 |
|
|
1.20 |
|
|
|
|
|
|
Nonaccrual loans to total loans |
|
|
0.66 |
|
|
0.72 |
|
|
0.56 |
|
|
|
|
|
|
Nonaccrual assets to total assets |
|
|
0.54 |
|
|
0.65 |
|
|
0.58 |
|
|
|
|
|
|
** The efficiency ratio is a non-GAAP measure, calculated based on the noninterest expense divided by the sum of net interest income plus non interest income, excluding net gains and losses on securities. | |||||||||||||||
|
|
|
|
|
|
|
|
|
|
|
|
|
|
|
|
UNITY BANCORP, INC.
CONSOLIDATED BALANCE SHEETS
|
|
|
|
|
|
|
|
|
|
|
|
June 30, 2025 vs. |
|
||
|
|
|
|
|
|
|
|
|
|
|
|
December 31, 2024 |
|
June 30, 2024 |
|
(In thousands, except percentages) |
|
June 30, 2025 |
|
December 31, 2024 |
|
June 30, 2024 |
|
|
% |
|
% |
|
|||
|
|
|
|
|
|
|
|
|
|
|
|
|
|
|
|
ASSETS |
|
|
|
|
|
|
|
|
|
|
|
|
|
|
|
Cash and due from banks |
|
$ |
26,045 |
|
$ |
20,206 |
|
$ |
31,180 |
|
|
28.9 |
% |
(16.5) |
% |
Interest-bearing deposits |
|
|
267,688 |
|
|
160,232 |
|
|
166,238 |
|
|
67.1 |
|
61.0 |
|
Cash and cash equivalents |
|
|
293,733 |
|
|
180,438 |
|
|
197,418 |
|
|
62.8 |
|
48.8 |
|
Securities: |
|
|
|
|
|
|
|
|
|
|
|
|
|
|
|
Debt securities available for sale, at market value, net of valuation allowance |
|
|
92,491 |
|
|
93,884 |
|
|
99,081 |
|
|
(1.5) |
|
(6.7) |
|
Debt securities held to maturity, at book value |
|
|
36,434 |
|
|
41,294 |
|
|
36,157 |
|
|
(11.8) |
|
0.8 |
|
Equity securities, at market value |
|
|
10,423 |
|
|
9,850 |
|
|
9,949 |
|
|
5.8 |
|
4.8 |
|
Total securities |
|
|
139,348 |
|
|
145,028 |
|
|
145,187 |
|
|
(3.9) |
|
(4.0) |
|
Loans: |
|
|
|
|
|
|
|
|
|
|
|
|
|
|
|
Loans held for sale |
|
|
13,352 |
|
|
12,163 |
|
|
15,159 |
|
|
9.8 |
|
(11.9) |
|
SBA loans held for investment |
|
|
38,059 |
|
|
38,309 |
|
|
39,751 |
|
|
(0.7) |
|
(4.3) |
|
Commercial loans |
|
|
1,511,129 |
|
|
1,411,629 |
|
|
1,318,208 |
|
|
7.0 |
|
14.6 |
|
Residential mortgage loans |
|
|
666,560 |
|
|
630,927 |
|
|
624,949 |
|
|
5.6 |
|
6.7 |
|
Consumer loans |
|
|
82,564 |
|
|
76,711 |
|
|
69,280 |
|
|
7.6 |
|
19.2 |
|
Residential construction loans |
|
|
70,930 |
|
|
90,918 |
|
|
103,188 |
|
|
(22.0) |
|
(31.3) |
|
Total loans |
|
|
2,382,594 |
|
|
2,260,657 |
|
|
2,170,535 |
|
|
5.4 |
|
9.8 |
|
Allowance for credit losses |
|
|
(29,012) |
|
|
(26,788) |
|
|
(26,107) |
|
|
8.3 |
|
11.1 |
|
Net loans |
|
|
2,353,582 |
|
|
2,233,869 |
|
|
2,144,428 |
|
|
5.4 |
|
9.8 |
|
Premises and equipment, net |
|
|
18,561 |
|
|
18,778 |
|
|
19,073 |
|
|
(1.2) |
|
(2.7) |
|
Bank owned life insurance ("BOLI") |
|
|
26,108 |
|
|
25,773 |
|
|
25,483 |
|
|
1.3 |
|
2.5 |
|
Deferred tax assets |
|
|
14,784 |
|
|
14,106 |
|
|
13,294 |
|
|
4.8 |
|
11.2 |
|
Federal Home Loan Bank ("FHLB") stock |
|
|
19,730 |
|
|
12,507 |
|
|
14,957 |
|
|
57.8 |
|
31.9 |
|
Accrued interest receivable |
|
|
12,411 |
|
|
12,691 |
|
|
13,257 |
|
|
(2.2) |
|
(6.4) |
|
Goodwill |
|
|
1,516 |
|
|
1,516 |
|
|
1,516 |
|
|
- |
|
- |
|
Prepaid expenses and other assets |
|
|
48,750 |
|
|
9,311 |
|
|
23,094 |
|
|
*NM |
|
*NM |
|
Total assets |
|
$ |
2,928,523 |
|
$ |
2,654,017 |
|
$ |
2,597,707 |
|
|
10.3 |
% |
12.7 |
% |
|
|
|
|
|
|
|
|
|
|
|
|
|
|
|
|
LIABILITIES AND SHAREHOLDERS' EQUITY |
|
|
|
|
|
|
|
|
|
|
|
|
|||
Liabilities: |
|
|
|
|
|
|
|
|
|
|
|
|
|
|
|
Deposits: |
|
|
|
|
|
|
|
|
|
|
|
|
|
|
|
Noninterest-bearing demand |
|
$ |
464,610 |
|
$ |
440,803 |
|
$ |
422,001 |
|
|
5.4 |
% |
10.1 |
% |
Interest-bearing demand |
|
|
321,863 |
|
|
321,780 |
|
|
301,480 |
|
|
- |
|
6.8 |
|
Savings |
|
|
505,706 |
|
|
491,175 |
|
|
505,586 |
|
|
3.0 |
|
- |
|
Brokered deposits |
|
|
237,978 |
|
|
217,931 |
|
|
221,990 |
|
|
9.2 |
|
7.2 |
|
Time deposits |
|
|
657,209 |
|
|
628,624 |
|
|
559,774 |
|
|
4.5 |
|
17.4 |
|
Total deposits |
|
|
2,187,366 |
|
|
2,100,313 |
|
|
2,010,831 |
|
|
4.1 |
|
8.8 |
|
Borrowed funds |
|
|
377,107 |
|
|
220,504 |
|
|
274,798 |
|
|
71.0 |
|
37.2 |
|
Subordinated debentures |
|
|
10,310 |
|
|
10,310 |
|
|
10,310 |
|
|
- |
|
- |
|
Accrued interest payable |
|
|
1,463 |
|
|
1,702 |
|
|
1,657 |
|
|
(14.0) |
|
(11.7) |
|
Accrued expenses and other liabilities |
|
|
32,437 |
|
|
25,605 |
|
|
26,716 |
|
|
26.7 |
|
21.4 |
|
Total liabilities |
|
|
2,608,683 |
|
|
2,358,434 |
|
|
2,324,312 |
|
|
10.6 |
|
12.2 |
|
Shareholders' equity: |
|
|
|
|
|
|
|
|
|
|
|
|
|
|
|
Common stock |
|
|
104,674 |
|
|
103,936 |
|
|
102,226 |
|
|
0.7 |
|
2.4 |
|
Retained earnings |
|
|
252,606 |
|
|
227,331 |
|
|
207,534 |
|
|
11.1 |
|
21.7 |
|
Treasury stock, at cost |
|
|
(35,515) |
|
|
(33,577) |
|
|
(33,285) |
|
|
5.8 |
|
6.7 |
|
Accumulated other comprehensive loss |
|
|
(1,925) |
|
|
(2,107) |
|
|
(3,080) |
|
|
(8.6) |
|
(37.5) |
|
Total shareholders' equity |
|
|
319,840 |
|
|
295,583 |
|
|
273,395 |
|
|
8.2 |
|
17.0 |
|
Total liabilities and shareholders' equity |
|
$ |
2,928,523 |
|
$ |
2,654,017 |
|
$ |
2,597,707 |
|
|
10.3 |
% |
12.7 |
% |
|
|
|
|
|
|
|
|
|
|
|
|
|
|
|
|
Shares issued |
|
|
11,672 |
|
|
11,616 |
|
|
11,555 |
|
|
|
|
|
|
Shares outstanding |
|
|
10,032 |
|
|
10,026 |
|
|
9,975 |
|
|
|
|
|
|
Treasury shares |
|
|
1,640 |
|
|
1,590 |
|
|
1,580 |
|
|
|
|
|
|
|
|
|
|
|
|
|
|
|
|
|
|
|
|
|
|
*NM=Not meaningful |
|
|
|
|
|
|
|
|
|
|
|
|
|
|
|
UNITY BANCORP, INC.
QTD CONSOLIDATED STATEMENTS OF INCOME
|
|
|
|
|
|
|
|
|
|
|
|
June 30, 2025 vs. |
|
||||||||||
|
|
For the three months ended |
|
|
March 31, 2025 |
|
June 30, 2024 |
|
|||||||||||||||
(In thousands, except percentages and per share amounts) |
|
June 30, 2025 |
|
March 31, 2025 |
|
June 30, 2024 |
|
|
$ |
|
% |
|
$ |
|
% |
|
|||||||
INTEREST INCOME |
|
|
|
|
|
|
|
|
|
|
|
|
|
|
|
|
|
|
|
|
|
|
|
Interest-bearing deposits |
|
$ |
487 |
|
$ |
332 |
|
$ |
435 |
|
|
$ |
155 |
|
|
46.7 |
% |
$ |
52 |
|
|
12.0 |
% |
FHLB stock |
|
|
130 |
|
|
182 |
|
|
180 |
|
|
|
(52) |
|
|
(28.6) |
|
|
(50) |
|
|
(27.8) |
|
Securities: |
|
|
|
|
|
|
|
|
|
|
|
|
|
|
|
|
|
|
|
|
|
|
|
Taxable |
|
|
1,735 |
|
|
1,786 |
|
|
1,749 |
|
|
|
(51) |
|
|
(2.9) |
|
|
(14) |
|
|
(0.8) |
|
Tax-exempt |
|
|
17 |
|
|
18 |
|
|
17 |
|
|
|
(1) |
|
|
(5.6) |
|
|
- |
|
|
- |
|
Total securities |
|
|
1,752 |
|
|
1,804 |
|
|
1,766 |
|
|
|
(52) |
|
|
(2.9) |
|
|
(14) |
|
|
(0.8) |
|
Loans: |
|
|
|
|
|
|
|
|
|
|
|
|
|
|
|
|
|
|
|
|
|
|
|
SBA loans |
|
|
856 |
|
|
934 |
|
|
1,287 |
|
|
|
(78) |
|
|
(8.4) |
|
|
(431) |
|
|
(33.5) |
|
Commercial loans |
|
|
25,736 |
|
|
24,260 |
|
|
21,160 |
|
|
|
1,476 |
|
|
6.1 |
|
|
4,576 |
|
|
21.6 |
|
Residential mortgage loans |
|
|
10,390 |
|
|
9,947 |
|
|
9,316 |
|
|
|
443 |
|
|
4.5 |
|
|
1,074 |
|
|
11.5 |
|
Consumer loans |
|
|
1,491 |
|
|
1,346 |
|
|
1,390 |
|
|
|
145 |
|
|
10.8 |
|
|
101 |
|
|
7.3 |
|
Residential construction loans |
|
|
1,758 |
|
|
1,996 |
|
|
2,453 |
|
|
|
(238) |
|
|
(11.9) |
|
|
(695) |
|
|
(28.3) |
|
Total loans |
|
|
40,231 |
|
|
38,483 |
|
|
35,606 |
|
|
|
1,748 |
|
|
4.5 |
|
|
4,625 |
|
|
13.0 |
|
Total interest income |
|
|
42,600 |
|
|
40,801 |
|
|
37,987 |
|
|
|
1,799 |
|
|
4.4 |
|
|
4,613 |
|
|
12.1 |
|
INTEREST EXPENSE |
|
|
|
|
|
|
|
|
|
|
|
|
|
|
|
|
|
|
|
|
|
|
|
Interest-bearing demand deposits |
|
|
1,898 |
|
|
1,622 |
|
|
2,010 |
|
|
|
276 |
|
|
17.0 |
|
|
(112) |
|
|
(5.6) |
|
Savings deposits |
|
|
2,718 |
|
|
2,593 |
|
|
3,349 |
|
|
|
125 |
|
|
4.8 |
|
|
(631) |
|
|
(18.8) |
|
Brokered deposits |
|
|
1,786 |
|
|
1,787 |
|
|
2,181 |
|
|
|
(1) |
|
|
(0.1) |
|
|
(395) |
|
|
(18.1) |
|
Time deposits |
|
|
6,560 |
|
|
6,415 |
|
|
5,832 |
|
|
|
145 |
|
|
2.3 |
|
|
728 |
|
|
12.5 |
|
Borrowed funds and subordinated debentures |
|
|
1,081 |
|
|
1,133 |
|
|
1,191 |
|
|
|
(52) |
|
|
(4.6) |
|
|
(110) |
|
|
(9.2) |
|
Total interest expense |
|
|
14,043 |
|
|
13,550 |
|
|
14,563 |
|
|
|
493 |
|
|
3.6 |
|
|
(520) |
|
|
(3.6) |
|
Net interest income |
|
|
28,557 |
|
|
27,251 |
|
|
23,424 |
|
|
|
1,306 |
|
|
4.8 |
|
|
5,133 |
|
|
21.9 |
|
Provision for credit losses, loans |
|
|
1,725 |
|
|
1,358 |
|
|
266 |
|
|
|
367 |
|
|
27.0 |
|
|
1,459 |
|
|
548.5 |
|
Provision (Release) for credit losses, off-balance sheet |
|
|
136 |
|
|
(41) |
|
|
13 |
|
|
|
177 |
|
|
431.7 |
|
|
123 |
|
|
946.2 |
|
(Release) Provision for credit losses, securities |
|
|
(2,036) |
|
|
- |
|
|
646 |
|
|
|
(2,036) |
|
|
*NM |
|
|
(2,682) |
|
|
*NM |
|
Net interest income after provision for credit losses |
|
|
28,732 |
|
|
25,934 |
|
|
22,499 |
|
|
|
2,798 |
|
|
10.8 |
|
|
6,233 |
|
|
27.7 |
|
NONINTEREST INCOME |
|
|
|
|
|
|
|
|
|
|
|
|
|
|
|
|
|
|
|
|
|
|
|
Branch fee income |
|
|
465 |
|
|
447 |
|
|
266 |
|
|
|
18 |
|
|
4.0 |
|
|
199 |
|
|
74.8 |
|
Service and loan fee income |
|
|
536 |
|
|
864 |
|
|
467 |
|
|
|
(328) |
|
|
(38.0) |
|
|
69 |
|
|
14.8 |
|
Gain on sale of SBA loans held for sale, net |
|
|
163 |
|
|
139 |
|
|
305 |
|
|
|
24 |
|
|
17.3 |
|
|
(142) |
|
|
(46.6) |
|
Gain on sale of mortgage loans, net |
|
|
435 |
|
|
168 |
|
|
266 |
|
|
|
267 |
|
|
158.9 |
|
|
169 |
|
|
63.5 |
|
BOLI income |
|
|
183 |
|
|
151 |
|
|
189 |
|
|
|
32 |
|
|
21.2 |
|
|
(6) |
|
|
(3.2) |
|
Net securities gains (losses) |
|
|
3,600 |
|
|
(49) |
|
|
20 |
|
|
|
3,649 |
|
|
*NM |
|
|
3,580 |
|
|
*NM |
|
Other income |
|
|
433 |
|
|
381 |
|
|
520 |
|
|
|
52 |
|
|
13.6 |
|
|
(87) |
|
|
(16.7) |
|
Total noninterest income |
|
|
5,815 |
|
|
2,101 |
|
|
2,033 |
|
|
|
3,714 |
|
|
176.8 |
|
|
3,782 |
|
|
186.0 |
|
NONINTEREST EXPENSE |
|
|
|
|
|
|
|
|
|
|
|
|
|
|
|
|
|
|
|
|
|
|
|
Compensation and benefits |
|
|
8,160 |
|
|
7,902 |
|
|
7,121 |
|
|
|
258 |
|
|
3.3 |
|
|
1,039 |
|
|
14.6 |
|
Processing and communications |
|
|
980 |
|
|
986 |
|
|
840 |
|
|
|
(6) |
|
|
(0.6) |
|
|
140 |
|
|
16.7 |
|
Occupancy |
|
|
809 |
|
|
880 |
|
|
815 |
|
|
|
(71) |
|
|
(8.1) |
|
|
(6) |
|
|
(0.7) |
|
Furniture and equipment |
|
|
787 |
|
|
746 |
|
|
819 |
|
|
|
41 |
|
|
5.5 |
|
|
(32) |
|
|
(3.9) |
|
Professional services |
|
|
350 |
|
|
364 |
|
|
405 |
|
|
|
(14) |
|
|
(3.8) |
|
|
(55) |
|
|
(13.6) |
|
Advertising |
|
|
456 |
|
|
391 |
|
|
397 |
|
|
|
65 |
|
|
16.6 |
|
|
59 |
|
|
14.9 |
|
Loan related expenses |
|
|
265 |
|
|
46 |
|
|
351 |
|
|
|
219 |
|
|
476.1 |
|
|
(86) |
|
|
(24.5) |
|
Deposit insurance |
|
|
313 |
|
|
241 |
|
|
321 |
|
|
|
72 |
|
|
29.9 |
|
|
(8) |
|
|
(2.5) |
|
Director fees |
|
|
265 |
|
|
495 |
|
|
231 |
|
|
|
(230) |
|
|
(46.5) |
|
|
34 |
|
|
14.7 |
|
Other expenses |
|
|
634 |
|
|
560 |
|
|
680 |
|
|
|
74 |
|
|
13.2 |
|
|
(46) |
|
|
(6.8) |
|
Total noninterest expense |
|
|
13,019 |
|
|
12,611 |
|
|
11,980 |
|
|
|
408 |
|
|
3.2 |
|
|
1,039 |
|
|
8.7 |
|
Income before provision for income taxes |
|
|
21,528 |
|
|
15,424 |
|
|
12,552 |
|
|
|
6,104 |
|
|
39.6 |
|
|
8,976 |
|
|
71.5 |
|
Provision for income taxes |
|
|
5,037 |
|
|
3,826 |
|
|
3,098 |
|
|
|
1,211 |
|
|
31.7 |
|
|
1,939 |
|
|
62.6 |
|
Net income |
|
$ |
16,491 |
|
$ |
11,598 |
|
$ |
9,454 |
|
|
$ |
4,893 |
|
|
42.2 |
% |
$ |
7,037 |
|
|
74.4 |
% |
|
|
|
|
|
|
|
|
|
|
|
|
|
|
|
|
|
|
|
|
|
|
|
|
Effective tax rate |
|
|
23.4 |
% |
|
24.8 |
% |
|
24.7 |
% |
|
|
|
|
|
|
|
|
|
|
|
|
|
|
|
|
|
|
|
|
|
|
|
|
|
|
|
|
|
|
|
|
|
|
|
|
|
Net income per common share - Basic |
|
$ |
1.64 |
|
$ |
1.15 |
|
$ |
0.94 |
|
|
|
|
|
|
|
|
|
|
|
|
|
|
Net income per common share - Diluted |
|
|
1.61 |
|
|
1.13 |
|
|
0.93 |
|
|
|
|
|
|
|
|
|
|
|
|
|
|
|
|
|
|
|
|
|
|
|
|
|
|
|
|
|
|
|
|
|
|
|
|
|
|
Weighted average common shares outstanding - Basic |
|
|
10,033 |
|
|
10,054 |
|
|
10,016 |
|
|
|
|
|
|
|
|
|
|
|
|
|
|
Weighted average common shares outstanding - Diluted |
|
|
10,212 |
|
|
10,247 |
|
|
10,149 |
|
|
|
|
|
|
|
|
|
|
|
|
|
|
*NM=Not meaningful |
|
|
|
|
|
|
|
|
|
|
|
|
|
|
|
|
|
|
|
|
|
|
|
UNITY BANCORP, INC.
YTD CONSOLIDATED STATEMENTS OF INCOME
|
|
|
|
|
|
|
|
|
|
|
||||
|
|
For the six months ended June 30, |
|
|
Current YTD vs. Prior YTD |
|
||||||||
(In thousands, except percentages and per share amounts) |
|
2025 |
|
2024 |
|
|
$ |
|
% |
|
||||
INTEREST INCOME |
|
|
|
|
|
|
|
|
|
|
|
|
|
|
Interest-bearing deposits |
|
$ |
819 |
|
$ |
855 |
|
|
$ |
(36) |
|
|
(4.2) |
% |
FHLB stock |
|
|
312 |
|
|
460 |
|
|
|
(148) |
|
|
(32.2) |
|
Securities: |
|
|
|
|
|
|
|
|
|
|
|
|
|
|
Taxable |
|
|
3,521 |
|
|
3,598 |
|
|
|
(77) |
|
|
(2.1) |
|
Tax-exempt |
|
|
35 |
|
|
35 |
|
|
|
- |
|
|
- |
|
Total securities |
|
|
3,556 |
|
|
3,633 |
|
|
|
(77) |
|
|
(2.1) |
|
Loans: |
|
|
|
|
|
|
|
|
|
|
|
|
|
|
SBA loans |
|
|
1,790 |
|
|
2,628 |
|
|
|
(838) |
|
|
(31.9) |
|
Commercial loans |
|
|
49,996 |
|
|
41,990 |
|
|
|
8,006 |
|
|
19.1 |
|
Residential mortgage loans |
|
|
20,337 |
|
|
18,535 |
|
|
|
1,802 |
|
|
9.7 |
|
Consumer loans |
|
|
2,837 |
|
|
2,792 |
|
|
|
45 |
|
|
1.6 |
|
Residential construction loans |
|
|
3,754 |
|
|
5,031 |
|
|
|
(1,277) |
|
|
(25.4) |
|
Total loans |
|
|
78,714 |
|
|
70,976 |
|
|
|
7,738 |
|
|
10.9 |
|
Total interest income |
|
|
83,401 |
|
|
75,924 |
|
|
|
7,477 |
|
|
9.8 |
|
INTEREST EXPENSE |
|
|
|
|
|
|
|
|
|
|
|
|
|
|
Interest-bearing demand deposits |
|
|
3,520 |
|
|
3,720 |
|
|
|
(200) |
|
|
(5.4) |
|
Savings deposits |
|
|
5,311 |
|
|
6,493 |
|
|
|
(1,182) |
|
|
(18.2) |
|
Brokered deposits |
|
|
3,573 |
|
|
4,476 |
|
|
|
(903) |
|
|
(20.2) |
|
Time deposits |
|
|
12,975 |
|
|
10,531 |
|
|
|
2,444 |
|
|
23.2 |
|
Borrowed funds and subordinated debentures |
|
|
2,214 |
|
|
3,439 |
|
|
|
(1,225) |
|
|
(35.6) |
|
Total interest expense |
|
|
27,593 |
|
|
28,659 |
|
|
|
(1,066) |
|
|
(3.7) |
|
Net interest income |
|
|
55,808 |
|
|
47,265 |
|
|
|
8,543 |
|
|
18.1 |
|
Provision for credit losses, loans |
|
|
3,083 |
|
|
907 |
|
|
|
2,176 |
|
|
239.9 |
|
Provision for credit losses, off-balance sheet |
|
|
95 |
|
|
15 |
|
|
|
80 |
|
|
533.3 |
|
(Release) Provision for credit losses, securities |
|
|
(2,036) |
|
|
646 |
|
|
|
(2,682) |
|
|
*NM |
|
Net interest income after provision for credit losses |
|
|
54,666 |
|
|
45,697 |
|
|
|
8,969 |
|
|
19.6 |
|
NONINTEREST INCOME |
|
|
|
|
|
|
|
|
|
|
|
|
|
|
Branch fee income |
|
|
912 |
|
|
509 |
|
|
|
403 |
|
|
79.2 |
|
Service and loan fee income |
|
|
1,400 |
|
|
924 |
|
|
|
476 |
|
|
51.5 |
|
Gain on sale of SBA loans held for sale, net |
|
|
302 |
|
|
543 |
|
|
|
(241) |
|
|
(44.4) |
|
Gain on sale of mortgage loans, net |
|
|
603 |
|
|
586 |
|
|
|
17 |
|
|
2.9 |
|
BOLI income |
|
|
334 |
|
|
254 |
|
|
|
80 |
|
|
31.5 |
|
Net securities gains |
|
|
3,551 |
|
|
74 |
|
|
|
3,477 |
|
|
*NM |
|
Other income |
|
|
814 |
|
|
861 |
|
|
|
(47) |
|
|
(5.5) |
|
Total noninterest income |
|
|
7,916 |
|
|
3,751 |
|
|
|
4,165 |
|
|
111.0 |
|
NONINTEREST EXPENSE |
|
|
|
|
|
|
|
|
|
|
|
|
|
|
Compensation and benefits |
|
|
16,062 |
|
|
14,478 |
|
|
|
1,584 |
|
|
10.9 |
|
Processing and communications |
|
|
1,966 |
|
|
1,746 |
|
|
|
220 |
|
|
12.6 |
|
Occupancy |
|
|
1,689 |
|
|
1,613 |
|
|
|
76 |
|
|
4.7 |
|
Furniture and equipment |
|
|
1,533 |
|
|
1,503 |
|
|
|
30 |
|
|
2.0 |
|
Professional services |
|
|
714 |
|
|
841 |
|
|
|
(127) |
|
|
(15.1) |
|
Advertising |
|
|
847 |
|
|
797 |
|
|
|
50 |
|
|
6.3 |
|
Loan related expenses |
|
|
311 |
|
|
735 |
|
|
|
(424) |
|
|
(57.7) |
|
Deposit insurance |
|
|
554 |
|
|
660 |
|
|
|
(106) |
|
|
(16.1) |
|
Director fees |
|
|
760 |
|
|
478 |
|
|
|
282 |
|
|
59.0 |
|
Other expenses |
|
|
1,194 |
|
|
1,261 |
|
|
|
(67) |
|
|
(5.3) |
|
Total noninterest expense |
|
|
25,630 |
|
|
24,112 |
|
|
|
1,518 |
|
|
6.3 |
|
Income before provision for income taxes |
|
|
36,952 |
|
|
25,336 |
|
|
|
11,616 |
|
|
45.8 |
|
Provision for income taxes |
|
|
8,863 |
|
|
6,296 |
|
|
|
2,567 |
|
|
40.8 |
|
Net income |
|
$ |
28,089 |
|
$ |
19,040 |
|
|
$ |
9,049 |
|
|
47.5 |
% |
|
|
|
|
|
|
|
|
|
|
|
|
|
|
|
Effective tax rate |
|
|
24.0 |
% |
|
24.9 |
% |
|
|
|
|
|
|
|
|
|
|
|
|
|
|
|
|
|
|
|
|
|
|
Net income per common share - Basic |
|
$ |
2.79 |
|
$ |
1.89 |
|
|
|
|
|
|
|
|
Net income per common share - Diluted |
|
|
2.74 |
|
|
1.86 |
|
|
|
|
|
|
|
|
|
|
|
|
|
|
|
|
|
|
|
|
|
|
|
Weighted average common shares outstanding - Basic |
|
|
10,043 |
|
|
10,072 |
|
|
|
|
|
|
|
|
Weighted average common shares outstanding - Diluted |
|
|
10,229 |
|
|
10,212 |
|
|
|
|
|
|
|
|
*NM=Not meaningful |
|
|
|
|
|
|
|
|
|
|
|
|
|
|
UNITY BANCORP, INC.
QUARTER TO DATE NET INTEREST MARGIN
|
|
For the three months ended |
|
||||||||||||||||
(Dollar amounts in thousands, interest amounts and |
|
June 30, 2025 |
|
June 30, 2024 |
|
||||||||||||||
interest rates/yields on a fully tax-equivalent basis) |
|
Average Balance |
|
Interest |
|
Rate/Yield |
|
Average Balance |
|
Interest |
|
Rate/Yield |
|
||||||
ASSETS |
|
|
|
|
|
|
|
|
|
|
|
|
|
|
|
|
|
|
|
Interest-earning assets: |
|
|
|
|
|
|
|
|
|
|
|
|
|
|
|
|
|
|
|
Interest-bearing deposits |
|
$ |
43,985 |
|
$ |
487 |
|
|
4.44 |
% |
$ |
32,237 |
|
$ |
435 |
|
|
5.43 |
% |
FHLB stock |
|
|
7,626 |
|
|
130 |
|
|
6.82 |
|
|
7,951 |
|
|
180 |
|
|
9.12 |
|
Securities: |
|
|
|
|
|
|
|
|
|
|
|
|
|
|
|
|
|
|
|
Taxable |
|
|
138,283 |
|
|
1,735 |
|
|
5.02 |
|
|
140,501 |
|
|
1,749 |
|
|
4.98 |
|
Tax-exempt |
|
|
1,471 |
|
|
20 |
|
|
5.59 |
|
|
1,571 |
|
|
18 |
|
|
4.55 |
|
Total securities (A) |
|
|
139,754 |
|
|
1,755 |
|
|
5.02 |
|
|
142,072 |
|
|
1,767 |
|
|
4.97 |
|
Loans: |
|
|
|
|
|
|
|
|
|
|
|
|
|
|
|
|
|
|
|
SBA loans |
|
|
48,646 |
|
|
856 |
|
|
7.04 |
|
|
57,704 |
|
|
1,287 |
|
|
8.92 |
|
Commercial loans |
|
|
1,497,021 |
|
|
25,736 |
|
|
6.80 |
|
|
1,300,754 |
|
|
21,160 |
|
|
6.44 |
|
Residential mortgage loans |
|
|
658,239 |
|
|
10,390 |
|
|
6.31 |
|
|
625,086 |
|
|
9,316 |
|
|
5.96 |
|
Consumer loans |
|
|
82,265 |
|
|
1,491 |
|
|
7.17 |
|
|
69,943 |
|
|
1,390 |
|
|
7.86 |
|
Residential construction loans |
|
|
72,525 |
|
|
1,758 |
|
|
9.59 |
|
|
112,272 |
|
|
2,453 |
|
|
8.64 |
|
Total loans (B) |
|
|
2,358,696 |
|
|
40,231 |
|
|
6.75 |
|
|
2,165,759 |
|
|
35,606 |
|
|
6.50 |
|
Total interest-earning assets |
|
$ |
2,550,061 |
|
$ |
42,603 |
|
|
6.70 |
% |
$ |
2,348,019 |
|
$ |
37,988 |
|
|
6.51 |
% |
|
|
|
|
|
|
|
|
|
|
|
|
|
|
|
|
|
|
|
|
Noninterest-earning assets: |
|
|
|
|
|
|
|
|
|
|
|
|
|
|
|
|
|
|
|
Cash and due from banks |
|
|
21,601 |
|
|
|
|
|
|
|
|
23,547 |
|
|
|
|
|
|
|
Allowance for credit losses |
|
|
(28,067) |
|
|
|
|
|
|
|
|
(26,202) |
|
|
|
|
|
|
|
Other assets |
|
|
95,195 |
|
|
|
|
|
|
|
|
90,971 |
|
|
|
|
|
|
|
Total noninterest-earning assets |
|
|
88,729 |
|
|
|
|
|
|
|
|
88,316 |
|
|
|
|
|
|
|
Total assets |
|
$ |
2,638,790 |
|
|
|
|
|
|
|
$ |
2,436,335 |
|
|
|
|
|
|
|
|
|
|
|
|
|
|
|
|
|
|
|
|
|
|
|
|
|
|
|
LIABILITIES AND SHAREHOLDERS' EQUITY |
|
|
|
|
|
|
|
|
|
|
|
|
|
|
|
|
|
|
|
Interest-bearing liabilities: |
|
|
|
|
|
|
|
|
|
|
|
|
|
|
|
|
|
|
|
Interest-bearing demand deposits |
|
$ |
354,353 |
|
$ |
1,898 |
|
|
2.15 |
% |
$ |
337,629 |
|
$ |
2,010 |
|
|
2.39 |
% |
Savings deposits |
|
|
487,307 |
|
|
2,718 |
|
|
2.24 |
|
|
504,685 |
|
|
3,349 |
|
|
2.67 |
|
Brokered deposits |
|
|
207,128 |
|
|
1,786 |
|
|
3.46 |
|
|
228,276 |
|
|
2,181 |
|
|
3.84 |
|
Time deposits |
|
|
682,426 |
|
|
6,560 |
|
|
3.86 |
|
|
535,444 |
|
|
5,832 |
|
|
4.38 |
|
Total interest-bearing deposits |
|
|
1,731,214 |
|
|
12,962 |
|
|
3.00 |
|
|
1,606,034 |
|
|
13,372 |
|
|
3.35 |
|
Borrowed funds and subordinated debentures |
|
|
118,166 |
|
|
1,081 |
|
|
3.62 |
|
|
129,763 |
|
|
1,191 |
|
|
3.63 |
|
Total interest-bearing liabilities |
|
$ |
1,849,380 |
|
$ |
14,043 |
|
|
3.05 |
% |
$ |
1,735,797 |
|
$ |
14,563 |
|
|
3.37 |
% |
|
|
|
|
|
|
|
|
|
|
|
|
|
|
|
|
|
|
|
|
Noninterest-bearing liabilities: |
|
|
|
|
|
|
|
|
|
|
|
|
|
|
|
|
|
|
|
Noninterest-bearing demand deposits |
|
|
442,151 |
|
|
|
|
|
|
|
|
401,146 |
|
|
|
|
|
|
|
Other liabilities |
|
|
34,464 |
|
|
|
|
|
|
|
|
29,139 |
|
|
|
|
|
|
|
Total noninterest-bearing liabilities |
|
|
476,615 |
|
|
|
|
|
|
|
|
430,285 |
|
|
|
|
|
|
|
Total shareholders' equity |
|
|
312,795 |
|
|
|
|
|
|
|
|
270,253 |
|
|
|
|
|
|
|
Total liabilities and shareholders' equity |
|
$ |
2,638,790 |
|
|
|
|
|
|
|
$ |
2,436,335 |
|
|
|
|
|
|
|
|
|
|
|
|
|
|
|
|
|
|
|
|
|
|
|
|
|
|
|
Net interest spread |
|
|
|
|
$ |
28,560 |
|
|
3.66 |
% |
|
|
|
$ |
23,425 |
|
|
3.13 |
% |
Tax-equivalent basis adjustment |
|
|
|
|
|
(3) |
|
|
|
|
|
|
|
|
(1) |
|
|
|
|
Net interest income |
|
|
|
|
$ |
28,557 |
|
|
|
|
|
|
|
$ |
23,424 |
|
|
|
|
Net interest margin |
|
|
|
|
|
|
|
|
4.49 |
% |
|
|
|
|
|
|
|
4.01 |
% |
|
|
|
|
|
|
|
|
|
|
|
|
|
|
|
|
|
|
|
|
| (A) | Yields related to securities exempt from federal and state income taxes are stated on a fully tax-equivalent basis. They are reduced by the nondeductible portion of interest expense, assuming a federal tax rate of 21 percent and applicable state rates. |
| (B) | The loan averages are stated net of unearned income, and the averages include loans on which the accrual of interest has been discontinued. |
UNITY BANCORP, INC.
QUARTER TO DATE NET INTEREST MARGIN
|
|
For the three months ended |
|
||||||||||||||||
(Dollar amounts in thousands, interest amounts and |
|
June 30, 2025 |
|
March 31, 2025 |
|
||||||||||||||
interest rates/yields on a fully tax-equivalent basis) |
|
Average Balance |
|
Interest |
|
Rate/Yield |
|
Average Balance |
|
Interest |
|
Rate/Yield |
|
||||||
ASSETS |
|
|
|
|
|
|
|
|
|
|
|
|
|
|
|
|
|
|
|
Interest-earning assets: |
|
|
|
|
|
|
|
|
|
|
|
|
|
|
|
|
|
|
|
Interest-bearing deposits |
|
$ |
43,985 |
|
$ |
487 |
|
|
4.44 |
% |
$ |
30,259 |
|
$ |
332 |
|
|
4.45 |
% |
FHLB stock |
|
|
7,626 |
|
|
130 |
|
|
6.82 |
|
|
7,459 |
|
|
182 |
|
|
9.90 |
|
Securities: |
|
|
|
|
|
|
|
|
|
|
|
|
|
|
|
|
|
|
|
Taxable |
|
|
138,283 |
|
|
1,735 |
|
|
5.02 |
|
|
142,847 |
|
|
1,786 |
|
|
5.00 |
|
Tax-exempt |
|
|
1,471 |
|
|
20 |
|
|
5.59 |
|
|
1,596 |
|
|
18 |
|
|
4.59 |
|
Total securities (A) |
|
|
139,754 |
|
|
1,755 |
|
|
5.02 |
|
|
144,443 |
|
|
1,804 |
|
|
5.00 |
|
Loans: |
|
|
|
|
|
|
|
|
|
|
|
|
|
|
|
|
|
|
|
SBA loans |
|
|
48,646 |
|
|
856 |
|
|
7.04 |
|
|
49,638 |
|
|
934 |
|
|
7.53 |
|
Commercial loans |
|
|
1,497,021 |
|
|
25,736 |
|
|
6.80 |
|
|
1,446,998 |
|
|
24,260 |
|
|
6.71 |
|
Residential mortgage loans |
|
|
658,239 |
|
|
10,390 |
|
|
6.31 |
|
|
639,742 |
|
|
9,947 |
|
|
6.22 |
|
Consumer loans |
|
|
82,265 |
|
|
1,491 |
|
|
7.17 |
|
|
75,156 |
|
|
1,346 |
|
|
7.16 |
|
Residential construction loans |
|
|
72,525 |
|
|
1,758 |
|
|
9.59 |
|
|
84,414 |
|
|
1,996 |
|
|
9.46 |
|
Total loans (B) |
|
|
2,358,696 |
|
|
40,231 |
|
|
6.75 |
|
|
2,295,948 |
|
|
38,483 |
|
|
6.70 |
|
Total interest-earning assets |
|
$ |
2,550,061 |
|
$ |
42,603 |
|
|
6.70 |
% |
$ |
2,478,109 |
|
$ |
40,801 |
|
|
6.68 |
% |
|
|
|
|
|
|
|
|
|
|
|
|
|
|
|
|
|
|
|
|
Noninterest-earning assets: |
|
|
|
|
|
|
|
|
|
|
|
|
|
|
|
|
|
|
|
Cash and due from banks |
|
|
21,601 |
|
|
|
|
|
|
|
|
23,117 |
|
|
|
|
|
|
|
Allowance for credit losses |
|
|
(28,067) |
|
|
|
|
|
|
|
|
(27,455) |
|
|
|
|
|
|
|
Other assets |
|
|
95,195 |
|
|
|
|
|
|
|
|
91,553 |
|
|
|
|
|
|
|
Total noninterest-earning assets |
|
|
88,729 |
|
|
|
|
|
|
|
|
87,215 |
|
|
|
|
|
|
|
Total assets |
|
$ |
2,638,790 |
|
|
|
|
|
|
|
$ |
2,565,324 |
|
|
|
|
|
|
|
|
|
|
|
|
|
|
|
|
|
|
|
|
|
|
|
|
|
|
|
LIABILITIES AND SHAREHOLDERS' EQUITY |
|
|
|
|
|
|
|
|
|
|
|
|
|
|
|
|
|
|
|
Interest-bearing liabilities: |
|
|
|
|
|
|
|
|
|
|
|
|
|
|
|
|
|
|
|
Interest-bearing demand deposits |
|
$ |
354,353 |
|
$ |
1,898 |
|
|
2.15 |
% |
$ |
341,991 |
|
$ |
1,622 |
|
|
1.92 |
% |
Savings deposits |
|
|
487,307 |
|
|
2,718 |
|
|
2.24 |
|
|
495,051 |
|
|
2,593 |
|
|
2.12 |
|
Brokered deposits |
|
|
207,128 |
|
|
1,786 |
|
|
3.46 |
|
|
213,517 |
|
|
1,787 |
|
|
3.39 |
|
Time deposits |
|
|
682,426 |
|
|
6,560 |
|
|
3.86 |
|
|
637,936 |
|
|
6,415 |
|
|
4.08 |
|
Total interest-bearing deposits |
|
|
1,731,214 |
|
|
12,962 |
|
|
3.00 |
|
|
1,688,495 |
|
|
12,417 |
|
|
2.98 |
|
Borrowed funds and subordinated debentures |
|
|
118,166 |
|
|
1,081 |
|
|
3.62 |
|
|
119,135 |
|
|
1,133 |
|
|
3.80 |
|
Total interest-bearing liabilities |
|
$ |
1,849,380 |
|
$ |
14,043 |
|
|
3.05 |
% |
$ |
1,807,630 |
|
$ |
13,550 |
|
|
3.04 |
% |
|
|
|
|
|
|
|
|
|
|
|
|
|
|
|
|
|
|
|
|
Noninterest-bearing liabilities: |
|
|
|
|
|
|
|
|
|
|
|
|
|
|
|
|
|
|
|
Noninterest-bearing demand deposits |
|
|
442,151 |
|
|
|
|
|
|
|
|
425,569 |
|
|
|
|
|
|
|
Other liabilities |
|
|
34,464 |
|
|
|
|
|
|
|
|
29,833 |
|
|
|
|
|
|
|
Total noninterest-bearing liabilities |
|
|
476,615 |
|
|
|
|
|
|
|
|
455,402 |
|
|
|
|
|
|
|
Total shareholders' equity |
|
|
312,795 |
|
|
|
|
|
|
|
|
302,292 |
|
|
|
|
|
|
|
Total liabilities and shareholders' equity |
|
$ |
2,638,790 |
|
|
|
|
|
|
|
$ |
2,565,324 |
|
|
|
|
|
|
|
|
|
|
|
|
|
|
|
|
|
|
|
|
|
|
|
|
|
|
|
Net interest spread |
|
|
|
|
$ |
28,560 |
|
|
3.66 |
% |
|
|
|
$ |
27,251 |
|
|
3.64 |
% |
Tax-equivalent basis adjustment |
|
|
|
|
|
(3) |
|
|
|
|
|
|
|
|
- |
|
|
|
|
Net interest income |
|
|
|
|
$ |
28,557 |
|
|
|
|
|
|
|
$ |
27,251 |
|
|
|
|
Net interest margin |
|
|
|
|
|
|
|
|
4.49 |
% |
|
|
|
|
|
|
|
4.46 |
% |
|
|
|
|
|
|
|
|
|
|
|
|
|
|
|
|
|
|
|
|
| (A) | Yields related to securities exempt from federal and state income taxes are stated on a fully tax-equivalent basis. They are reduced by the nondeductible portion of interest expense, assuming a federal tax rate of 21 percent and applicable state rates. |
| (B) | The loan averages are stated net of unearned income, and the averages include loans on which the accrual of interest has been discontinued. |
UNITY BANCORP, INC.
YTD NET INTEREST MARGIN
|
|
For the six months ended |
|
||||||||||||||||
(Dollar amounts in thousands, interest amounts and |
|
June 30, 2025 |
|
June 30, 2024 |
|
||||||||||||||
interest rates/yields on a fully tax-equivalent basis) |
|
Average Balance |
|
Interest |
|
Rate/Yield |
|
Average Balance |
|
Interest |
|
Rate/Yield |
|
||||||
ASSETS |
|
|
|
|
|
|
|
|
|
|
|
|
|
|
|
|
|
|
|
Interest-earning assets: |
|
|
|
|
|
|
|
|
|
|
|
|
|
|
|
|
|
|
|
Interest-bearing deposits |
|
$ |
37,161 |
|
$ |
819 |
|
|
4.44 |
% |
$ |
31,461 |
|
$ |
855 |
|
|
5.46 |
% |
FHLB stock |
|
|
7,543 |
|
|
312 |
|
|
8.34 |
|
|
9,476 |
|
|
460 |
|
|
9.76 |
|
Securities: |
|
|
|
|
|
|
|
|
|
|
|
|
|
|
|
|
|
|
|
Taxable |
|
|
140,552 |
|
|
3,521 |
|
|
5.01 |
|
|
137,688 |
|
|
3,598 |
|
|
5.23 |
|
Tax-exempt |
|
|
1,533 |
|
|
38 |
|
|
5.07 |
|
|
1,615 |
|
|
36 |
|
|
4.51 |
|
Total securities (A) |
|
|
142,085 |
|
|
3,559 |
|
|
5.01 |
|
|
139,303 |
|
|
3,634 |
|
|
5.22 |
|
Loans: |
|
|
|
|
|
|
|
|
|
|
|
|
|
|
|
|
|
|
|
SBA loans |
|
|
49,139 |
|
|
1,790 |
|
|
7.25 |
|
|
59,020 |
|
|
2,628 |
|
|
8.86 |
|
Commercial loans |
|
|
1,472,148 |
|
|
49,996 |
|
|
6.75 |
|
|
1,291,176 |
|
|
41,990 |
|
|
6.43 |
|
Residential mortgage loans |
|
|
649,041 |
|
|
20,337 |
|
|
6.27 |
|
|
625,269 |
|
|
18,535 |
|
|
5.93 |
|
Consumer loans |
|
|
78,730 |
|
|
2,837 |
|
|
7.17 |
|
|
70,096 |
|
|
2,792 |
|
|
7.88 |
|
Residential construction loans |
|
|
78,437 |
|
|
3,754 |
|
|
9.52 |
|
|
120,996 |
|
|
5,031 |
|
|
8.22 |
|
Total loans (B) |
|
|
2,327,495 |
|
|
78,714 |
|
|
6.73 |
|
|
2,166,557 |
|
|
70,976 |
|
|
6.48 |
|
Total interest-earning assets |
|
$ |
2,514,284 |
|
$ |
83,404 |
|
|
6.69 |
% |
$ |
2,346,797 |
|
$ |
75,925 |
|
|
6.51 |
% |
|
|
|
|
|
|
|
|
|
|
|
|
|
|
|
|
|
|
|
|
Noninterest-earning assets: |
|
|
|
|
|
|
|
|
|
|
|
|
|
|
|
|
|
|
|
Cash and due from banks |
|
|
22,354 |
|
|
|
|
|
|
|
|
23,383 |
|
|
|
|
|
|
|
Allowance for credit losses |
|
|
(27,763) |
|
|
|
|
|
|
|
|
(26,130) |
|
|
|
|
|
|
|
Other assets |
|
|
93,385 |
|
|
|
|
|
|
|
|
92,486 |
|
|
|
|
|
|
|
Total noninterest-earning assets |
|
|
87,976 |
|
|
|
|
|
|
|
|
89,739 |
|
|
|
|
|
|
|
Total assets |
|
$ |
2,602,260 |
|
|
|
|
|
|
|
$ |
2,436,536 |
|
|
|
|
|
|
|
|
|
|
|
|
|
|
|
|
|
|
|
|
|
|
|
|
|
|
|
LIABILITIES AND SHAREHOLDERS' EQUITY |
|
|
|
|
|
|
|
|
|
|
|
|
|
|
|
|
|
|
|
Interest-bearing liabilities: |
|
|
|
|
|
|
|
|
|
|
|
|
|
|
|
|
|
|
|
Interest-bearing demand deposits |
|
$ |
348,206 |
|
$ |
3,520 |
|
|
2.04 |
% |
$ |
331,229 |
|
$ |
3,720 |
|
|
2.26 |
% |
Savings deposits |
|
|
491,158 |
|
|
5,311 |
|
|
2.18 |
|
|
503,878 |
|
|
6,493 |
|
|
2.59 |
|
Brokered deposits |
|
|
210,305 |
|
|
3,573 |
|
|
3.43 |
|
|
235,934 |
|
|
4,476 |
|
|
3.82 |
|
Time deposits |
|
|
660,304 |
|
|
12,975 |
|
|
3.96 |
|
|
500,305 |
|
|
10,531 |
|
|
4.23 |
|
Total interest-bearing deposits |
|
|
1,709,973 |
|
|
25,379 |
|
|
2.99 |
|
|
1,571,346 |
|
|
25,220 |
|
|
3.23 |
|
Borrowed funds and subordinated debentures |
|
|
118,648 |
|
|
2,214 |
|
|
3.71 |
|
|
165,550 |
|
|
3,439 |
|
|
4.11 |
|
Total interest-bearing liabilities |
|
$ |
1,828,621 |
|
$ |
27,593 |
|
|
3.04 |
% |
$ |
1,736,896 |
|
$ |
28,659 |
|
|
3.32 |
% |
|
|
|
|
|
|
|
|
|
|
|
|
|
|
|
|
|
|
|
|
Noninterest-bearing liabilities: |
|
|
|
|
|
|
|
|
|
|
|
|
|
|
|
|
|
|
|
Noninterest-bearing demand deposits |
|
|
433,906 |
|
|
|
|
|
|
|
|
402,497 |
|
|
|
|
|
|
|
Other liabilities |
|
|
32,161 |
|
|
|
|
|
|
|
|
28,943 |
|
|
|
|
|
|
|
Total noninterest-bearing liabilities |
|
|
466,067 |
|
|
|
|
|
|
|
|
431,440 |
|
|
|
|
|
|
|
Total shareholders' equity |
|
|
307,572 |
|
|
|
|
|
|
|
|
268,200 |
|
|
|
|
|
|
|
Total liabilities and shareholders' equity |
|
$ |
2,602,260 |
|
|
|
|
|
|
|
$ |
2,436,536 |
|
|
|
|
|
|
|
|
|
|
|
|
|
|
|
|
|
|
|
|
|
|
|
|
|
|
|
Net interest spread |
|
|
|
|
$ |
55,811 |
|
|
3.65 |
% |
|
|
|
$ |
47,266 |
|
|
3.19 |
% |
Tax-equivalent basis adjustment |
|
|
|
|
|
(3) |
|
|
|
|
|
|
|
|
(1) |
|
|
|
|
Net interest income |
|
|
|
|
$ |
55,808 |
|
|
|
|
|
|
|
$ |
47,265 |
|
|
|
|
Net interest margin |
|
|
|
|
|
|
|
|
4.48 |
% |
|
|
|
|
|
|
|
4.05 |
% |
|
|
|
|
|
|
|
|
|
|
|
|
|
|
|
|
|
|
|
|
UNITY BANCORP, INC.
QUARTERLY ALLOWANCE FOR CREDIT LOSSES AND ASSET QUALITY SCHEDULES
Amounts in thousands, except percentages |
|
June 30, 2025 |
|
March 31, 2025 |
|
December 31, 2024 |
|
September 30, 2024 |
|
June 30, 2024 |
|
|||||
ALLOWANCE FOR CREDIT LOSSES: |
|
|
|
|
|
|
|
|
|
|
|
|
|
|
|
|
Balance, beginning of period |
|
$ |
27,651 |
|
$ |
26,788 |
|
$ |
27,002 |
|
$ |
26,107 |
|
$ |
26,080 |
|
Provision for credit losses on loans |
|
|
1,725 |
|
|
1,358 |
|
|
470 |
|
|
1,029 |
|
|
266 |
|
|
|
|
29,376 |
|
|
28,146 |
|
|
27,472 |
|
|
27,136 |
|
|
26,346 |
|
Less: Chargeoffs |
|
|
|
|
|
|
|
|
|
|
|
|
|
|
|
|
SBA loans |
|
|
105 |
|
|
350 |
|
|
300 |
|
|
70 |
|
|
- |
|
Commercial loans |
|
|
100 |
|
|
2 |
|
|
350 |
|
|
46 |
|
|
138 |
|
Residential mortgage loans |
|
|
282 |
|
|
130 |
|
|
150 |
|
|
- |
|
|
- |
|
Consumer loans |
|
|
21 |
|
|
50 |
|
|
93 |
|
|
68 |
|
|
130 |
|
Residential construction loans |
|
|
- |
|
|
- |
|
|
- |
|
|
- |
|
|
- |
|
Total chargeoffs |
|
|
508 |
|
|
532 |
|
|
893 |
|
|
184 |
|
|
268 |
|
Add: Recoveries |
|
|
|
|
|
|
|
|
|
|
|
|
|
|
|
|
SBA loans |
|
|
2 |
|
|
5 |
|
|
26 |
|
|
7 |
|
|
6 |
|
Commercial loans |
|
|
102 |
|
|
5 |
|
|
171 |
|
|
9 |
|
|
12 |
|
Residential mortgage loans |
|
|
- |
|
|
- |
|
|
- |
|
|
- |
|
|
- |
|
Consumer loans |
|
|
40 |
|
|
27 |
|
|
12 |
|
|
34 |
|
|
11 |
|
Residential construction loans |
|
|
- |
|
|
- |
|
|
- |
|
|
- |
|
|
- |
|
Total recoveries |
|
|
144 |
|
|
37 |
|
|
209 |
|
|
50 |
|
|
29 |
|
Net chargeoffs |
|
|
(364) |
|
|
(495) |
|
|
(684) |
|
|
(134) |
|
|
(239) |
|
Balance, end of period |
|
$ |
29,012 |
|
$ |
27,651 |
|
$ |
26,788 |
|
$ |
27,002 |
|
$ |
26,107 |
|
|
|
|
|
|
|
|
|
|
|
|
|
|
|
|
|
|
ASSET QUALITY INFORMATION: |
|
|
|
|
|
|
|
|
|
|
|
|
|
|
|
|
|
|
|
|
|
|
|
|
|
|
|
|
|
|
|
|
|
Nonaccrual loans: |
|
|
|
|
|
|
|
|
|
|
|
|
|
|
|
|
SBA loans |
|
$ |
4,177 |
|
$ |
3,231 |
|
$ |
3,850 |
|
$ |
3,646 |
|
$ |
3,813 |
|
Commercial loans |
|
|
3,512 |
|
|
4,821 |
|
|
2,974 |
|
|
3,674 |
|
|
2,321 |
|
Residential mortgage loans |
|
|
7,980 |
|
|
8,622 |
|
|
5,711 |
|
|
5,053 |
|
|
5,336 |
|
Consumer loans |
|
|
- |
|
|
- |
|
|
- |
|
|
100 |
|
|
105 |
|
Residential construction loans |
|
|
171 |
|
|
171 |
|
|
547 |
|
|
547 |
|
|
547 |
|
Total nonaccrual loans |
|
|
15,840 |
|
|
16,845 |
|
|
13,082 |
|
|
13,020 |
|
|
12,122 |
|
Debt securities available for sale, net of valuation allowance |
|
|
- |
|
|
1,145 |
|
|
1,964 |
|
|
2,859 |
|
|
3,071 |
|
Nonaccrual assets |
|
|
15,840 |
|
|
17,990 |
|
|
15,046 |
|
|
15,879 |
|
|
15,193 |
|
|
|
|
|
|
|
|
|
|
|
|
|
|
|
|
|
|
Loans 90 days past due & still accruing |
|
$ |
2,876 |
|
$ |
1,123 |
|
$ |
760 |
|
$ |
- |
|
$ |
373 |
|
|
|
|
|
|
|
|
|
|
|
|
|
|
|
|
|
|
Nonaccrual loans to total loans |
|
|
0.66 |
% |
|
0.72 |
% |
|
0.58 |
% |
|
0.59 |
% |
|
0.56 |
% |
Nonaccrual assets to total assets |
|
|
0.54 |
|
|
0.65 |
|
|
0.57 |
|
|
0.60 |
|
|
0.58 |
|
|
|
|
|
|
|
|
|
|
|
|
|
|
|
|
|
|
Allowance for credit losses to: |
|
|
|
|
|
|
|
|
|
|
|
|
|
|
|
|
Total loans at quarter end |
|
|
1.22 |
% |
|
1.18 |
% |
|
1.18 |
% |
|
1.22 |
% |
|
1.20 |
% |
Total nonaccrual loans |
|
|
183.16 |
|
|
164.15 |
|
|
204.77 |
|
|
207.39 |
|
|
215.37 |
|
UNITY BANCORP, INC.
QUARTERLY FINANCIAL DATA
(In thousands, except %'s, employee, office and per share amounts) |
|
June 30, 2025 |
|
March 31, 2025 |
|
December 31, 2024 |
|
September 30, 2024 |
|
June 30, 2024 |
|
|||||
SUMMARY OF INCOME: |
|
|
|
|
|
|
|
|
|
|
|
|
|
|
|
|
Total interest income |
|
$ |
42,600 |
|
$ |
40,801 |
|
$ |
40,264 |
|
$ |
39,550 |
|
$ |
37,987 |
|
Total interest expense |
|
|
14,043 |
|
|
13,550 |
|
|
13,774 |
|
|
14,694 |
|
|
14,563 |
|
Net interest income |
|
|
28,557 |
|
|
27,251 |
|
|
26,490 |
|
|
24,856 |
|
|
23,424 |
|
(Release) Provision for credit losses |
|
|
(175) |
|
|
1,317 |
|
|
1,300 |
|
|
1,080 |
|
|
925 |
|
Net interest income after provision for credit losses |
|
|
28,732 |
|
|
25,934 |
|
|
25,190 |
|
|
23,776 |
|
|
22,499 |
|
Total noninterest income |
|
|
5,815 |
|
|
2,101 |
|
|
1,916 |
|
|
2,803 |
|
|
2,033 |
|
Total noninterest expense |
|
|
13,019 |
|
|
12,611 |
|
|
12,617 |
|
|
12,012 |
|
|
11,980 |
|
Income before provision for income taxes |
|
|
21,528 |
|
|
15,424 |
|
|
14,489 |
|
|
14,567 |
|
|
12,552 |
|
Provision for income taxes |
|
|
5,037 |
|
|
3,826 |
|
|
2,984 |
|
|
3,662 |
|
|
3,098 |
|
Net income |
|
$ |
16,491 |
|
$ |
11,598 |
|
$ |
11,505 |
|
$ |
10,905 |
|
$ |
9,454 |
|
|
|
|
|
|
|
|
|
|
|
|
|
|
|
|
|
|
Net income per common share - Basic |
|
$ |
1.64 |
|
$ |
1.15 |
|
$ |
1.15 |
|
$ |
1.09 |
|
$ |
0.94 |
|
Net income per common share - Diluted |
|
|
1.61 |
|
|
1.13 |
|
|
1.13 |
|
|
1.07 |
|
|
0.92 |
|
|
|
|
|
|
|
|
|
|
|
|
|
|
|
|
|
|
COMMON SHARE DATA: |
|
|
|
|
|
|
|
|
|
|
|
|
|
|
|
|
Market price per share |
|
$ |
47.08 |
|
$ |
40.70 |
|
$ |
43.61 |
|
$ |
34.06 |
|
$ |
29.57 |
|
Dividends paid |
|
|
0.14 |
|
|
0.14 |
|
|
0.13 |
|
|
0.13 |
|
|
0.13 |
|
Book value per common share |
|
|
31.88 |
|
|
30.38 |
|
|
29.48 |
|
|
28.48 |
|
|
27.41 |
|
|
|
|
|
|
|
|
|
|
|
|
|
|
|
|
|
|
Weighted average common shares outstanding - Basic |
|
|
10,033 |
|
|
10,054 |
|
|
10,002 |
|
|
9,978 |
|
|
10,016 |
|
Weighted average common shares outstanding - Diluted |
|
|
10,212 |
|
|
10,247 |
|
|
10,204 |
|
|
10,148 |
|
|
10,149 |
|
Issued common shares |
|
|
11,672 |
|
|
11,666 |
|
|
11,616 |
|
|
11,570 |
|
|
11,555 |
|
Outstanding common shares |
|
|
10,032 |
|
|
10,076 |
|
|
10,026 |
|
|
9,980 |
|
|
9,975 |
|
Treasury shares |
|
|
1,640 |
|
|
1,590 |
|
|
1,590 |
|
|
1,590 |
|
|
1,580 |
|
|
|
|
|
|
|
|
|
|
|
|
|
|
|
|
|
|
PERFORMANCE RATIOS (Annualized): |
|
|
|
|
|
|
|
|
|
|
|
|
|
|
|
|
Return on average assets |
|
|
2.51 |
% |
|
1.83 |
% |
|
1.83 |
% |
|
1.76 |
% |
|
1.56 |
% |
Return on average equity |
|
|
21.15 |
|
|
15.56 |
|
|
15.77 |
|
|
15.55 |
|
|
14.07 |
|
Efficiency ratio** |
|
|
42.31 |
|
|
42.89 |
|
|
44.44 |
|
|
44.23 |
|
|
47.10 |
|
|
|
|
|
|
|
|
|
|
|
|
|
|
|
|
|
|
BALANCE SHEET DATA: |
|
|
|
|
|
|
|
|
|
|
|
|
|
|
|
|
Total assets |
|
$ |
2,928,523 |
|
$ |
2,767,943 |
|
$ |
2,654,017 |
|
$ |
2,635,319 |
|
$ |
2,597,707 |
|
Total securities |
|
|
139,348 |
|
|
142,092 |
|
|
145,028 |
|
|
143,712 |
|
|
145,187 |
|
Total loans |
|
|
2,382,594 |
|
|
2,345,130 |
|
|
2,260,657 |
|
|
2,217,393 |
|
|
2,170,535 |
|
Allowance for credit losses |
|
|
29,012 |
|
|
27,651 |
|
|
26,788 |
|
|
27,002 |
|
|
26,107 |
|
Total deposits |
|
|
2,187,366 |
|
|
2,175,398 |
|
|
2,100,313 |
|
|
2,046,137 |
|
|
2,010,831 |
|
Total shareholders' equity |
|
|
319,840 |
|
|
306,142 |
|
|
295,583 |
|
|
284,257 |
|
|
273,395 |
|
|
|
|
|
|
|
|
|
|
|
|
|
|
|
|
|
|
TAX EQUIVALENT YIELDS AND RATES: |
|
|
|
|
|
|
|
|
|
|
|
|
|
|
|
|
Interest-earning assets |
|
|
6.70 |
% |
|
6.68 |
% |
|
6.64 |
% |
|
6.62 |
% |
|
6.51 |
% |
Interest-bearing liabilities |
|
|
3.05 |
|
|
3.04 |
|
|
3.13 |
|
|
3.34 |
|
|
3.37 |
|
Net interest spread |
|
|
3.66 |
|
|
3.64 |
|
|
3.51 |
|
|
3.28 |
|
|
3.14 |
|
Net interest margin |
|
|
4.49 |
|
|
4.46 |
|
|
4.37 |
|
|
4.16 |
|
|
4.01 |
|
|
|
|
|
|
|
|
|
|
|
|
|
|
|
|
|
|
CREDIT QUALITY: |
|
|
|
|
|
|
|
|
|
|
|
|
|
|
|
|
Nonaccrual assets |
|
$ |
15,840 |
|
$ |
17,990 |
|
$ |
15,046 |
|
$ |
15,879 |
|
$ |
15,193 |
|
QTD annualized net chargeoffs to QTD average loans |
|
|
(0.06) |
% |
|
(0.09) |
% |
|
(0.12) |
% |
|
(0.02) |
% |
|
(0.04) |
% |
Allowance for credit losses to total loans |
|
|
1.22 |
|
|
1.18 |
|
|
1.18 |
|
|
1.22 |
|
|
1.20 |
|
Nonaccrual loans to total loans |
|
|
0.66 |
|
|
0.72 |
|
|
0.58 |
|
|
0.59 |
|
|
0.56 |
|
Nonaccrual assets to total assets |
|
|
0.54 |
|
|
0.65 |
|
|
0.57 |
|
|
0.60 |
|
|
0.58 |
|
|
|
|
|
|
|
|
|
|
|
|
|
|
|
|
|
|
UNITY BANCORP CAPITAL RATIOS: |
|
|
|
|
|
|
|
|
|
|
|
|
|
|
|
|
Total equity to total assets |
|
|
10.92 |
% |
|
11.06 |
% |
|
11.14 |
% |
|
10.79 |
% |
|
10.52 |
% |
Leverage ratio |
|
|
12.50 |
|
|
12.32 |
|
|
12.22 |
|
|
11.94 |
|
|
11.67 |
|
Common Equity Tier 1 Capital Ratio |
|
|
13.96 |
|
|
13.87 |
|
|
13.90 |
|
|
13.50 |
|
|
13.31 |
|
Risk-based Tier 1 Capital Ratio |
|
|
14.39 |
|
|
14.33 |
|
|
14.37 |
|
|
13.98 |
|
|
13.80 |
|
Risk-based Total Capital Ratio |
|
|
15.65 |
|
|
15.58 |
|
|
15.62 |
|
|
15.23 |
|
|
15.05 |
|
|
|
|
|
|
|
|
|
|
|
|
|
|
|
|
|
|
Number of banking offices |
|
|
21 |
|
|
21 |
|
|
21 |
|
|
21 |
|
|
21 |
|
Employee Full-Time Equivalent |
|
|
237 |
|
|
227 |
|
|
224 |
|
|
222 |
|
|
217 |
|
** The efficiency ratio is a non-GAAP measure, calculated based on the noninterest expense divided by the sum of net interest income plus non interest income, excluding net gains and losses on securities. |
|
|||||||||||||||
UNITY BANCORP, INC.
LOAN PORTFOLIO COMPOSITION
In thousands, except percentages |
|
June 30, 2025 |
|
% |
|
December 31, 2024 |
|
% |
||
Loans Held for Sale |
|
$ |
13,352 |
|
0.6% |
|
$ |
12,163 |
|
0.5% |
|
|
|
|
|
|
|
|
|
|
|
SBA Loans |
|
|
38,059 |
|
1.6% |
|
|
38,309 |
|
1.7% |
|
|
|
|
|
|
|
|
|
|
|
Commercial Loans |
|
|
|
|
|
|
|
|
|
|
Commercial construction |
|
|
101,990 |
|
4.3% |
|
|
130,193 |
|
5.8% |
SBA 504 |
|
|
49,947 |
|
2.1% |
|
|
48,479 |
|
2.1% |
Commercial & industrial |
|
|
164,176 |
|
6.9% |
|
|
147,186 |
|
6.5% |
Commercial mortgage - owner occupied |
|
|
631,441 |
|
26.5% |
|
|
577,541 |
|
25.6% |
Commercial mortgage - nonowner occupied |
|
|
474,499 |
|
19.9% |
|
|
428,600 |
|
19.0% |
Other |
|
|
89,076 |
|
3.7% |
|
|
79,630 |
|
3.5% |
Total Commercial Loans |
|
|
1,511,129 |
|
63.4% |
|
|
1,411,629 |
|
62.5% |
|
|
|
|
|
|
|
|
|
|
|
Residential Mortgage Loans |
|
|
666,560 |
|
28.0% |
|
|
630,927 |
|
27.9% |
|
|
|
|
|
|
|
|
|
|
|
Consumer Loans |
|
|
|
|
|
|
|
|
|
|
Home equity |
|
|
79,828 |
|
3.3% |
|
|
73,223 |
|
3.2% |
Consumer other |
|
|
2,736 |
|
0.1% |
|
|
3,488 |
|
0.2% |
Total Consumer Loans |
|
|
82,564 |
|
3.4% |
|
|
76,711 |
|
3.4% |
|
|
|
|
|
|
|
|
|
|
|
Residential Construction Loans |
|
|
70,930 |
|
3.0% |
|
|
90,918 |
|
4.0% |
|
|
|
|
|
|
|
|
|
|
|
Total Gross Loans |
|
$ |
2,382,594 |
|
100.0% |
|
$ |
2,260,657 |
|
100.0% |
UNITY BANCORP, INC.
QUARTERLY NON-GAAP RECONCILIATION
|
|
For the three months ended |
|
|||||||
(In thousands, except percentages and per share amounts) |
|
June 30, 2025 |
|
March 31, 2025 |
|
June 30, 2024 |
|
|||
Adjusted net income: |
|
|
|
|
|
|
|
|
|
|
Net income (GAAP) |
|
$ |
16,491 |
|
$ |
11,598 |
|
$ |
9,454 |
|
Non-recurring transactions: |
|
|
|
|
|
|
|
|
|
|
Less: Release of credit losses, securities |
|
|
(2,036) |
|
|
- |
|
|
- |
|
Less: Net securities gains pertaining to one-time sales |
|
|
(3,509) |
|
|
- |
|
|
- |
|
Add: Adjusted (provision) for income taxes |
|
|
1,301 |
|
|
- |
|
|
- |
|
Adjusted net income (non-GAAP) |
|
$ |
12,247 |
|
$ |
11,598 |
|
$ |
9,454 |
|
|
|
|
|
|
|
|
|
|
|
|
Adjusted net income per common share: |
|
|
|
|
|
|
|
|
|
|
Weighted average common shares outstanding - Basic |
|
|
10,033 |
|
|
10,054 |
|
|
10,016 |
|
Weighted average common shares outstanding - Diluted |
|
|
10,212 |
|
|
10,247 |
|
|
10,149 |
|
|
|
|
|
|
|
|
|
|
|
|
Net income per common share - Basic (GAAP) |
|
$ |
1.64 |
|
$ |
1.15 |
|
$ |
0.94 |
|
Net income per common share - Diluted (GAAP) |
|
|
1.61 |
|
|
1.13 |
|
|
0.93 |
|
|
|
|
|
|
|
|
|
|
|
|
Adjusted net income per common share - Basic (non-GAAP) |
|
$ |
1.22 |
|
$ |
|
|
$ |
|
|
Adjusted net income per common share - Diluted (non-GAAP) |
|
|
1.20 |
|
|
|
|
|
|
|
|
|
|
|
|
|
|
|
|
|
|
Adjusted return on average assets: |
|
|
|
|
|
|
|
|
|
|
Total average assets |
|
|
2,638,790 |
|
|
2,565,324 |
|
|
2,436,335 |
|
|
|
|
|
|
|
|
|
|
|
|
Return on average assets (GAAP) |
|
|
2.51 |
% |
|
1.83 |
% |
|
1.56 |
% |
Adjusted return on average assets (non-GAAP) |
|
|
1.86 |
|
|
|
|
|
|
|
|
|
|
|
|
|
|
|
|
|
|
Adjusted return on average equity: |
|
|
|
|
|
|
|
|
|
|
Total average equity |
|
|
312,795 |
|
|
302,292 |
|
|
270,253 |
|
|
|
|
|
|
|
|
|
|
|
|
Return on average equity (GAAP) |
|
|
21.15 |
% |
|
15.56 |
% |
|
14.07 |
% |
Adjusted return on average equity (non-GAAP) |
|
|
15.70 |
|
|
|
|
|
|
|