|
|
CMB.TECH NV
|
|
|
|
|
(Registrant)
|
|
|
|
|
|
|
|
|
Dated: August 28, 2025
|
|
|
|
|
|
|
|
|
|
|
By:
|
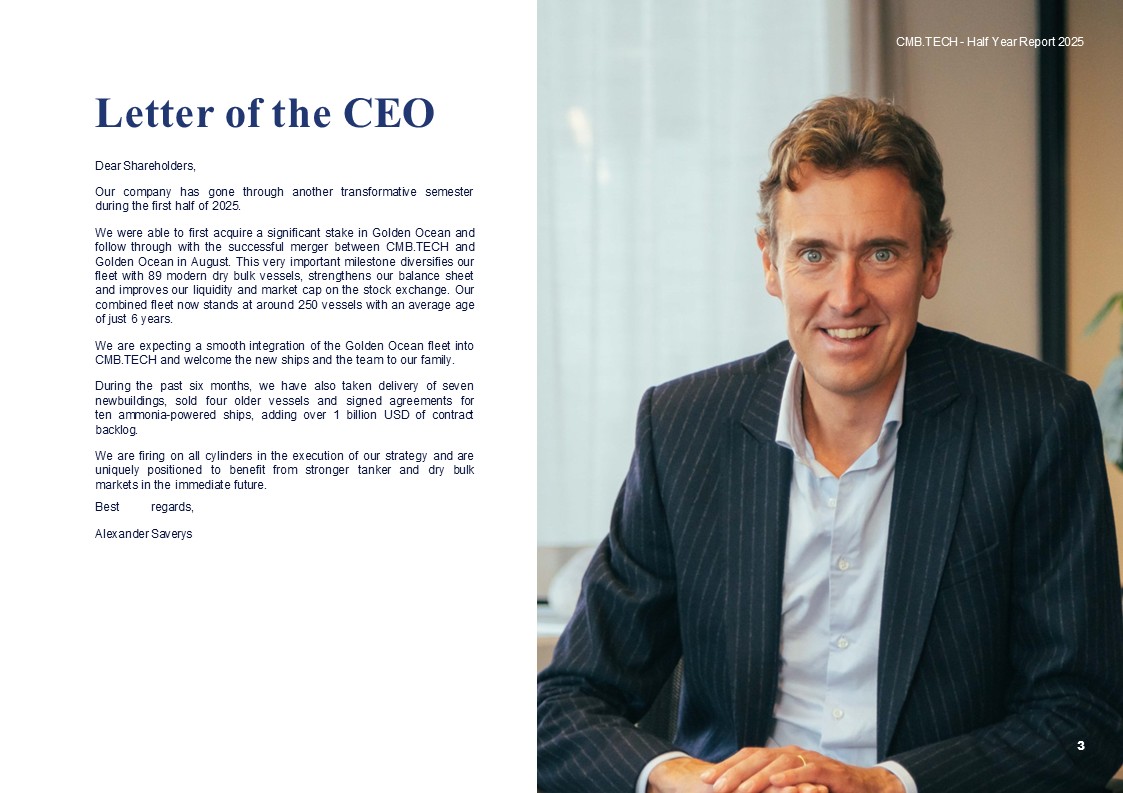
/s/ Ludovic Saverys
|
|
|
|
|
Ludovic Saverys
|
|
|
|
|
Chief Financial Officer
|
|
 |
 |
PRESS RELEASE
Thursday 28 August 2025 – 07:00
a.m. CET
|
|
Regulated information
|
||
|
o
|
CMB.TECH completed the merger with Golden Ocean on 20 August
|
|
o
|
CMB.TECH is listed on NYSE (CMBT), EURONEXT Brussels (CMBT) and EURONEXT Oslo (CMBTO)
|
|
o
|
Supervisory Board changes: resignation of Mr. Marc Saverys, appointment of Debemar BV, permanently represented by Mr. Patrick De
Brabandere as chairman and cooptation of Mrs. Gudrun Janssens
|
|
o
|
Net loss of -7.6 million USD in Q2 2025
|
|
o
|
CMB.TECH’s contract backlog stands at 2.93 billion USD
|
|
o
|
Interim dividend declared of 0.05 USD, payable on or about 9 October
|
|
o
|
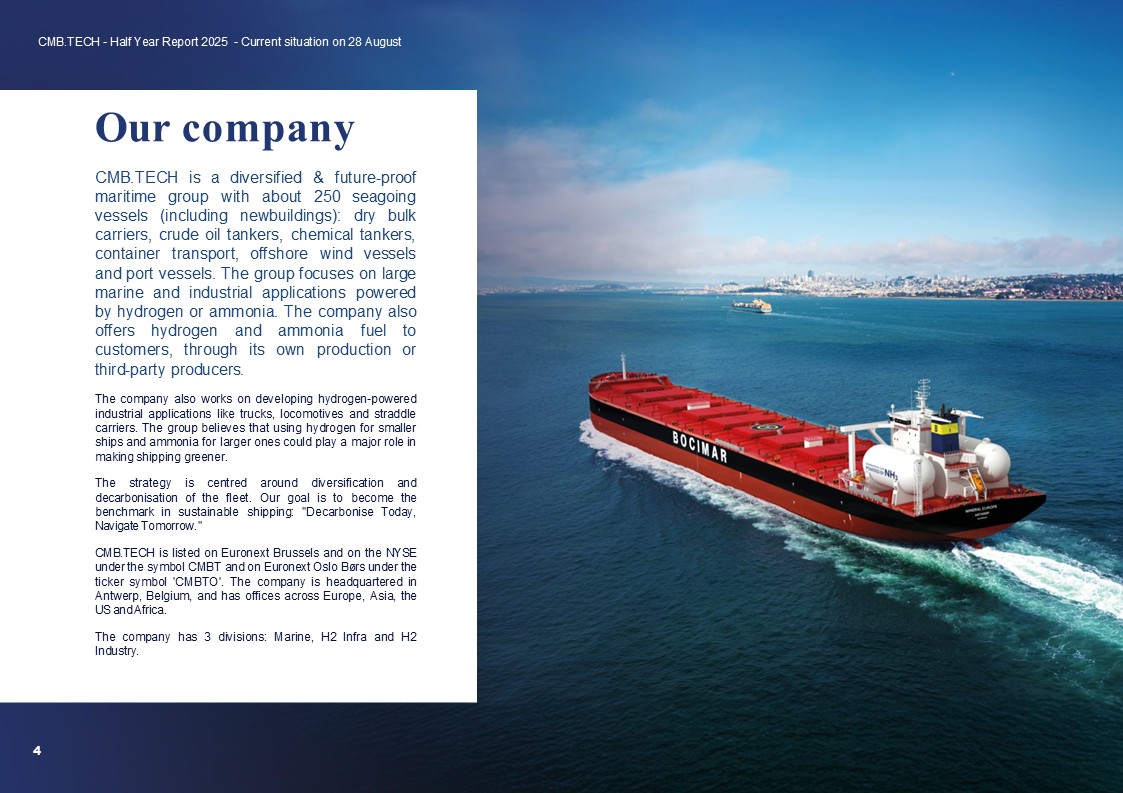
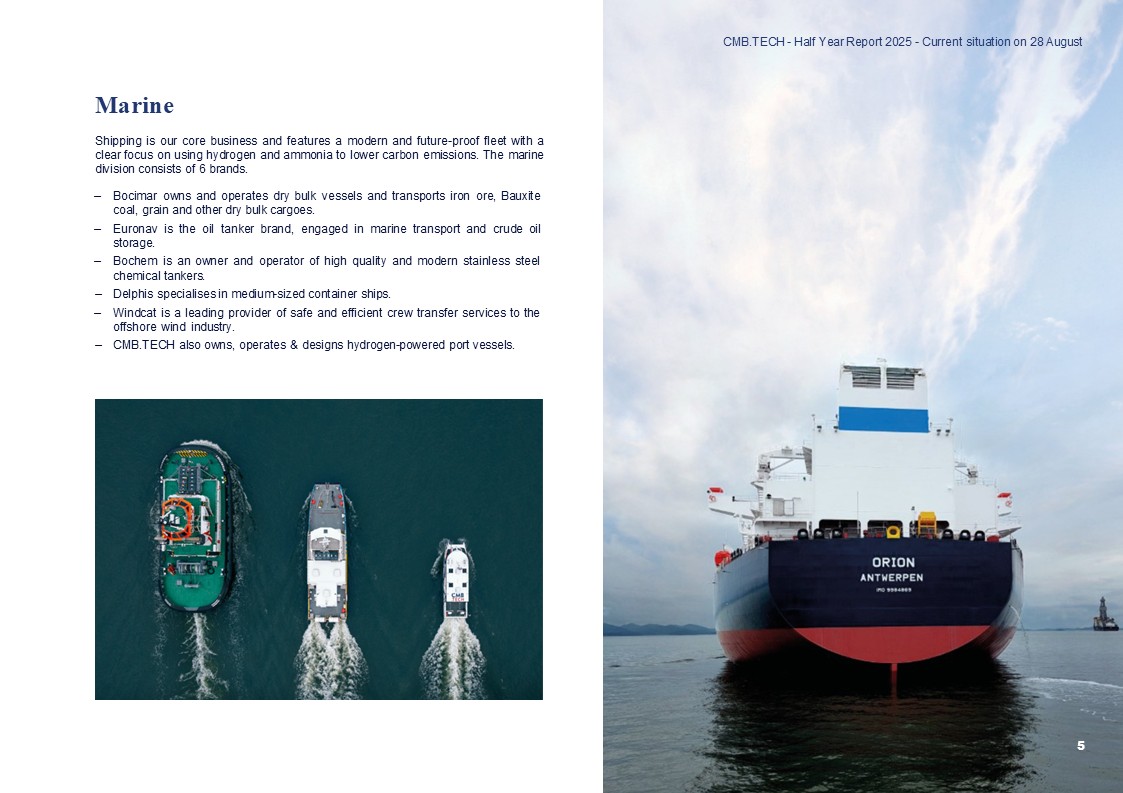
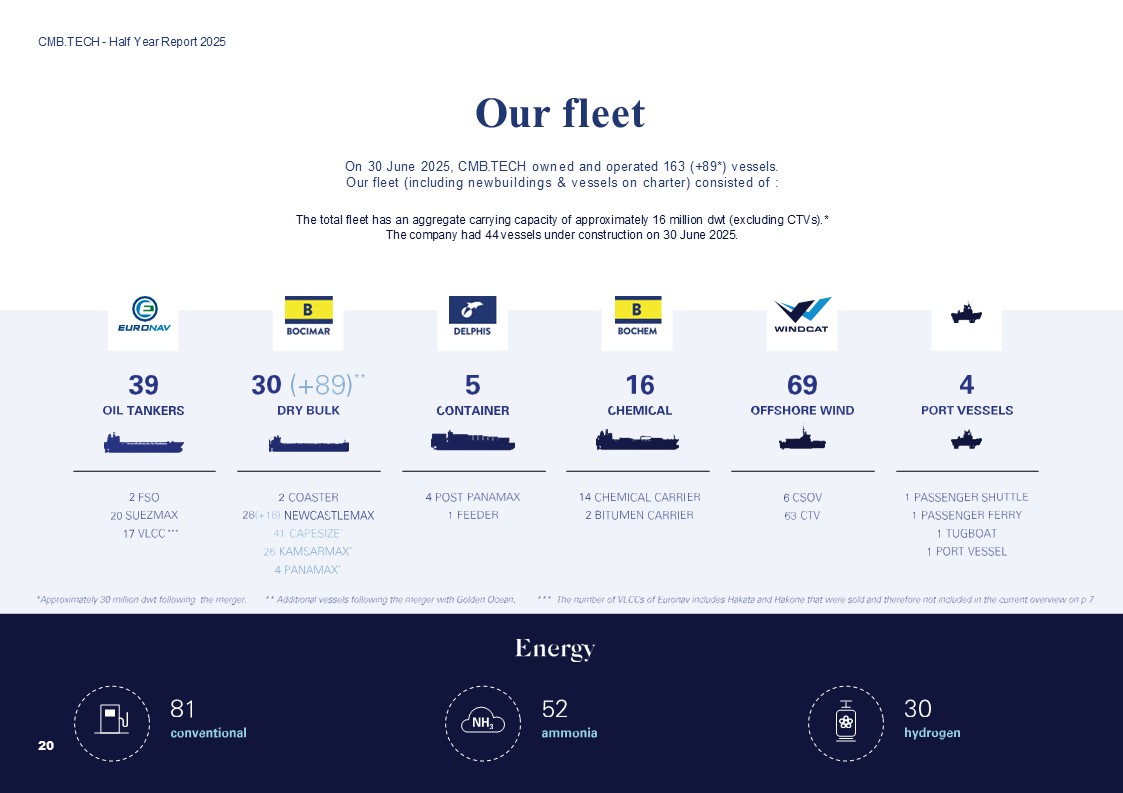
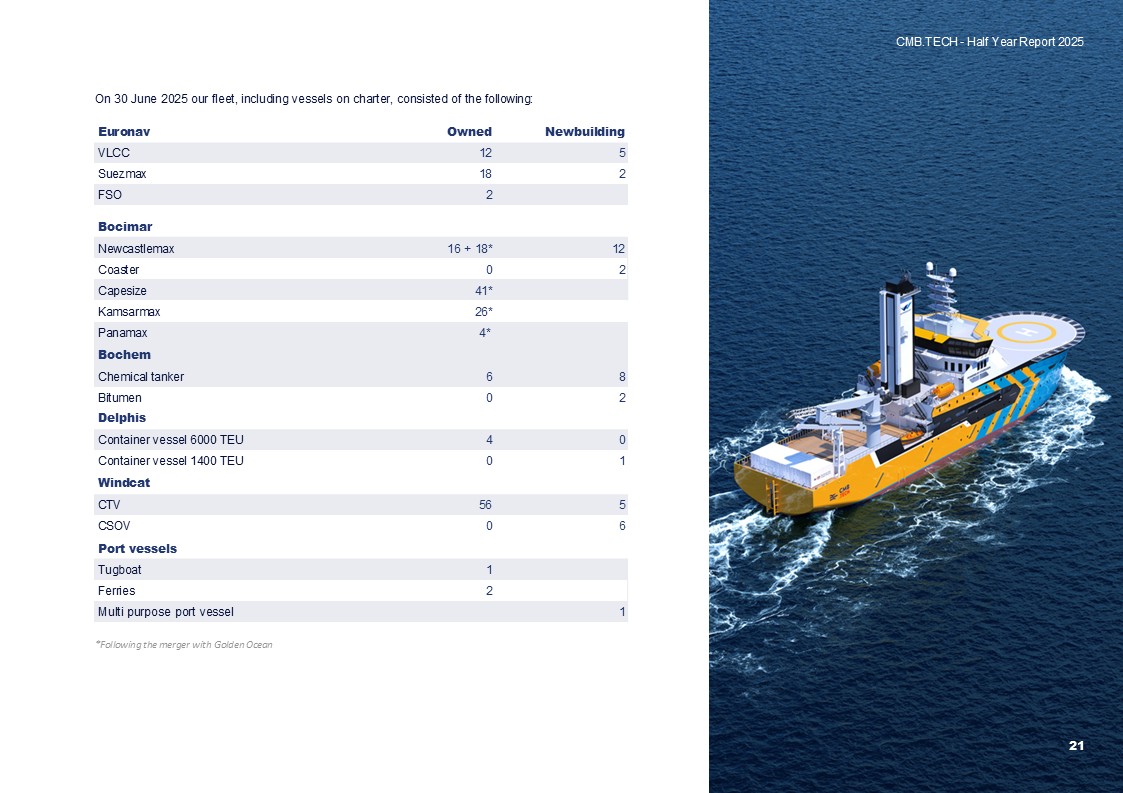
Following the merger, CMB.TECH owns and operates a combined diversified fleet
of around 250 vessels, including dry bulk vessels, crude oil tankers, chemical tankers, container ships, offshore wind vessels and port vessels.
|
|
o
|
Delivery of 8 newbuilding vessels (Q2 – Quarter to date):
|
|
➢
|
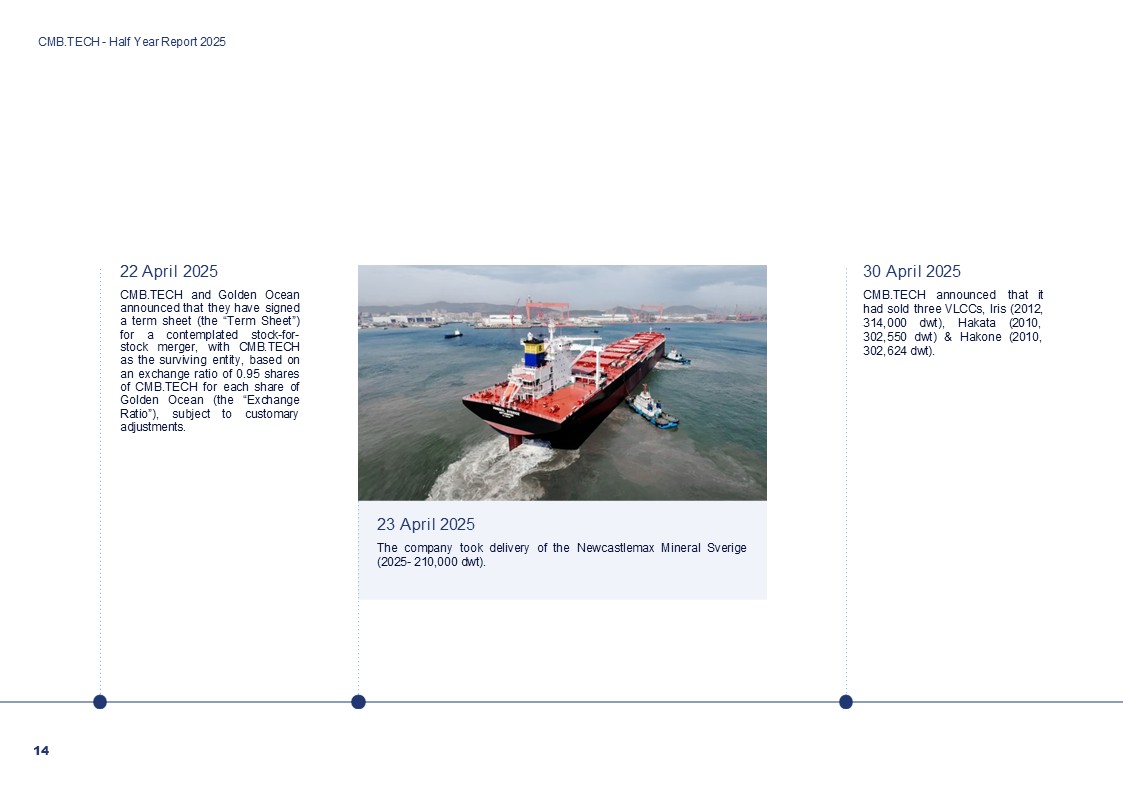
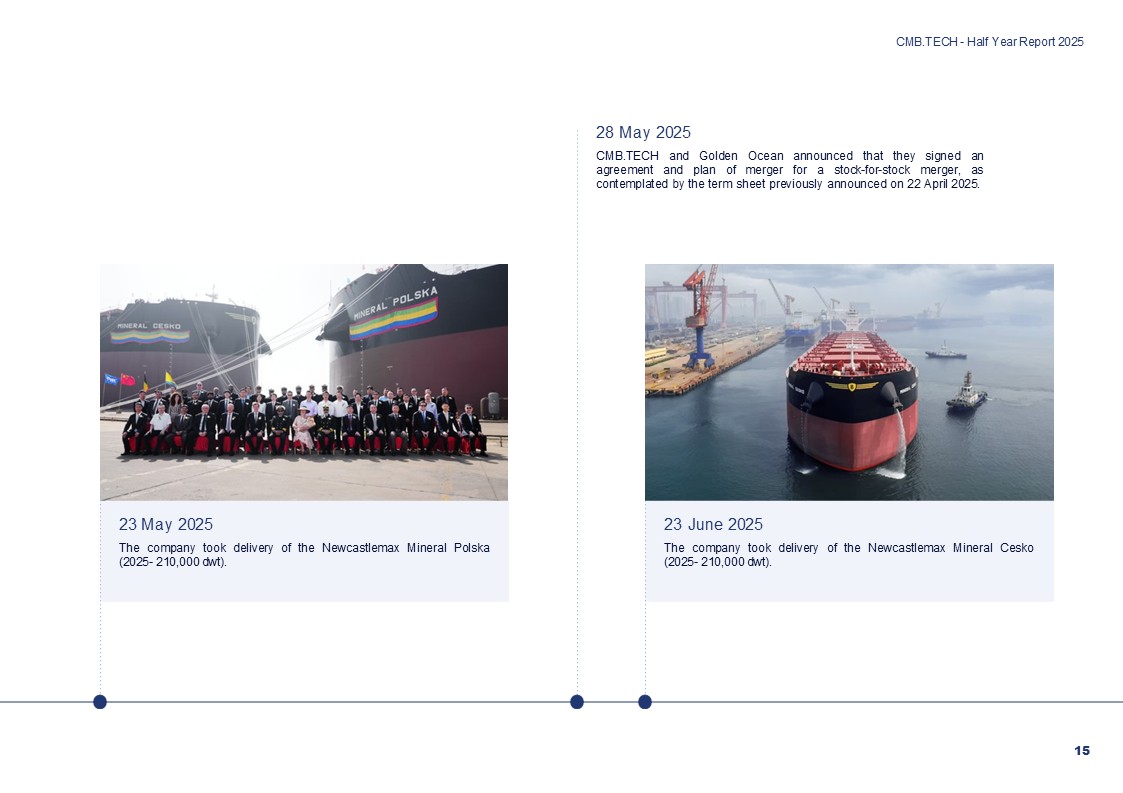
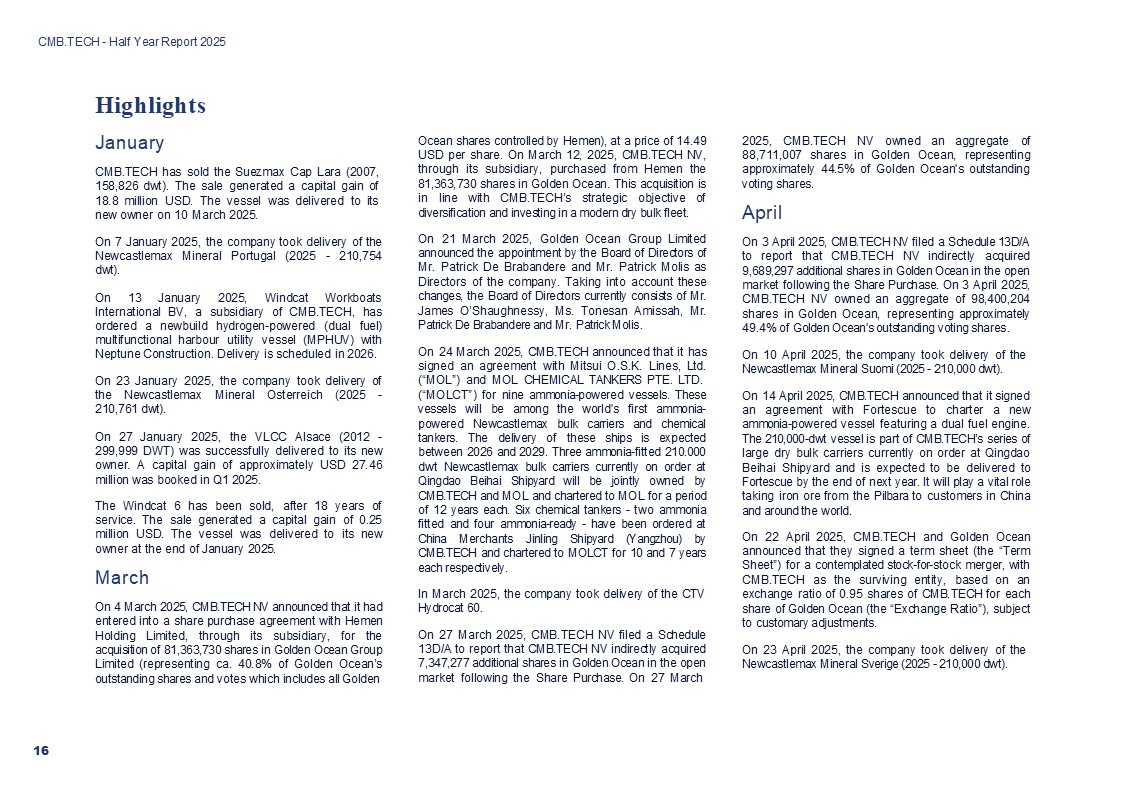
Super-Eco Newcastlemax: Mineral Suomi, Mineral Sverige, Mineral Polska, Mineral Cesko and Mineral Slovensko
|
|
➢
|
CSOV: Windcat Rotterdam
|
|
➢
|
CTV: TSM Windcat 59, Windcat 58
|
|
o
|
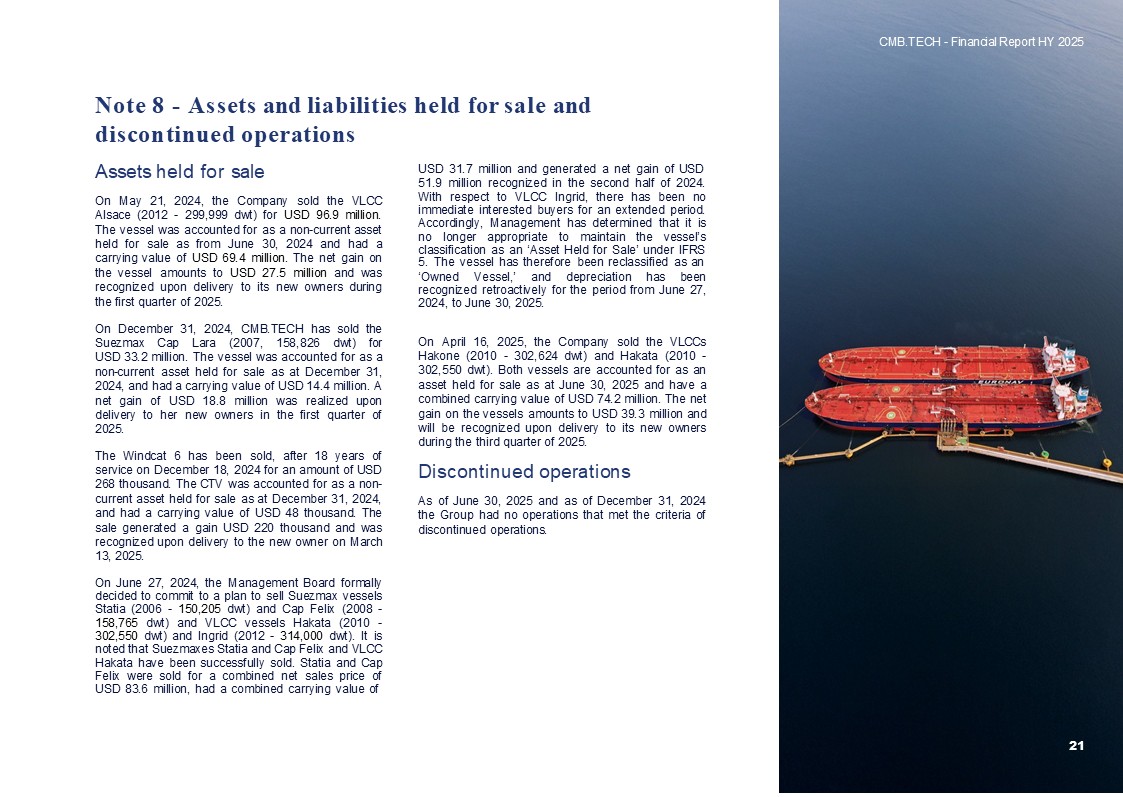
Previously announced sale of VLCC Iris (2012- 314,000 dwt) generated a capital gain of approx. 57.1 million USD during Q2.
|
|
o
|
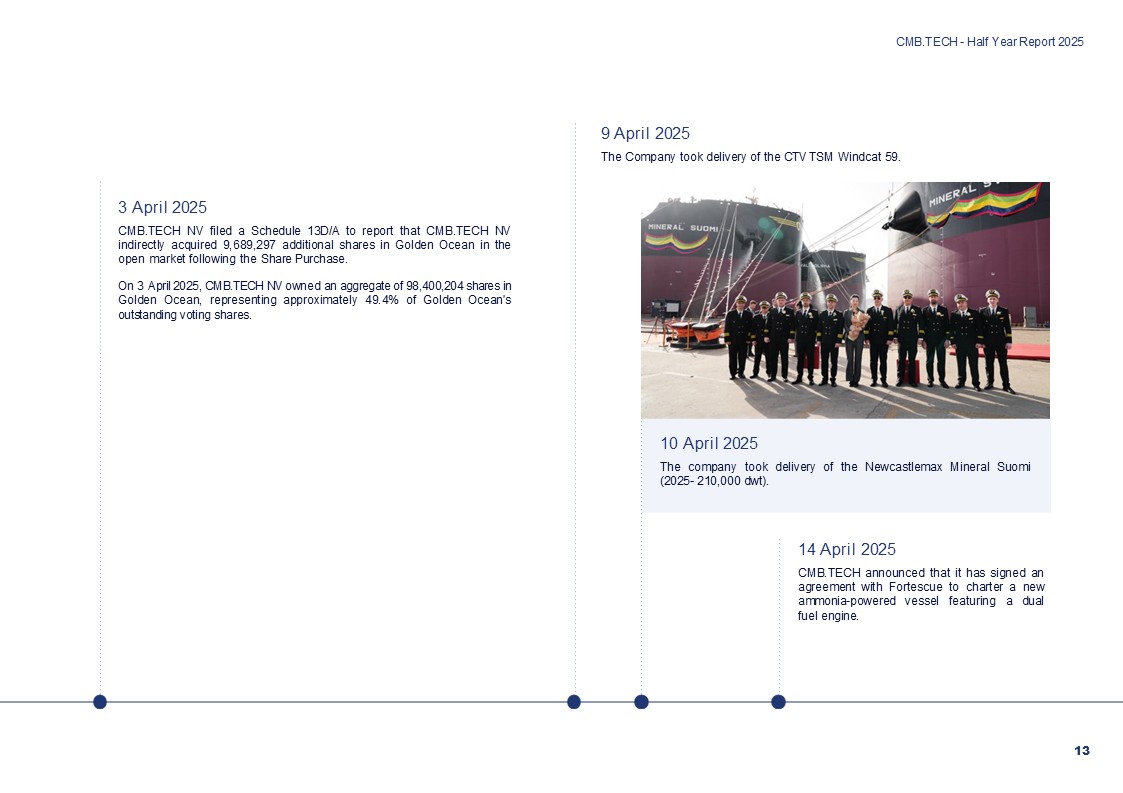
Delivery of Hakata (2010 - 302,550 dwt) & Hakone (2010 - 302,624 dwt) to its new owners as part of CMB.TECH’s fleet
rejuvenation strategy. The sales will generate a total capital gain of approx. 39.3 million USD in Q3 2025.
|
|
o
|
Sale of Sofia (2010 - 165,000 dwt). Delivery will be in Q4 2025. The sale will generate a capital gain of 20.4 million USD in Q4
2025.
|
|
CMB.TECH
|
||||||
|
Head of Marketing &
Communications
Katrien Hennin
|
Tel: +32 499393470
katrien.hennin@cmb.tech
|
Head of Investor
Relations
Joris Daman
|
Tel: +32 498617111
joris.daman@cmb.tech
|
|||
|
|
|
PRESS RELEASE
Thursday 28 August 2025 – 07:00
a.m. CET
|
|
Regulated information
|
||
|
The most important key figures (unaudited) are:
|
|||||||||||
|
(in thousands of USD)
|
Second Quarter 2025
|
Second Quarter 2024
|
YTD 2025
|
YTD 2024
|
|||||||
|
Revenue
|
387,808
|
252,000
|
622,852
|
492,377
|
|||||||
|
Other operating income
|
13,021
|
30,649
|
20,155
|
38,245
|
|||||||
|
Raw materials and consumables
|
(2,319)
|
(435)
|
(5,128)
|
(1,678)
|
|||||||
|
Voyage expenses and commissions
|
(81,338)
|
(48,986)
|
(123,742)
|
(85,903)
|
|||||||
|
Vessel operating expenses
|
(113,644)
|
(50,541)
|
(175,473)
|
(100,013)
|
|||||||
|
Charter hire expenses
|
(1,307)
|
1
|
(1,620)
|
(17)
|
|||||||
|
General and administrative expenses
|
(33,548)
|
(18,581)
|
(56,395)
|
(36,287)
|
|||||||
|
Gains on disposal of vessels/ other tangible assets
|
57,340
|
94,985
|
103,791
|
502,547
|
|||||||
|
Depreciation
|
(108,698)
|
(41,639)
|
(164,369)
|
(81,877)
|
|||||||
|
Impairment losses
|
(3,573)
|
—
|
(3,573)
|
—
|
|||||||
|
Net finance expenses
|
(118,225)
|
(30,540)
|
(182,440)
|
(45,980)
|
|||||||
|
Share of profit (loss) of equity accounted investees
|
1,622
|
2,029
|
1,571
|
2,570
|
|||||||
|
Profit (loss) before income tax
|
(2,861)
|
188,942
|
35,629
|
683,984
|
|||||||
|
Income tax benefit (expense)
|
(4,723)
|
(4,572)
|
(2,840)
|
(4,364)
|
|||||||
|
Profit (loss) for the period
|
(7,584)
|
184,371
|
32,789
|
679,620
|
|||||||
|
Attributable to:
|
|||||||||||
|
Owners of the Company
|
7,768
|
184,371
|
51,766
|
679,620
|
|||||||
|
Non-controlling interest
|
(15,352)
|
—
|
(18,977)
|
—
|
|||||||
|
Information per share:
|
||||||||||
|
(in USD per share)
|
Second Quarter 2025
|
Second Quarter 2024
|
YTD 2025
|
YTD 2024
|
||||||
|
Weighted average number of shares (basic) *
|
194,216,835
|
194,250,949
|
194,216,835
|
197,886,375
|
||||||
|
Profit (loss) for the period
|
-0.04
|
0.95
|
0.17
|
3.43
|
||||||
|
*
|
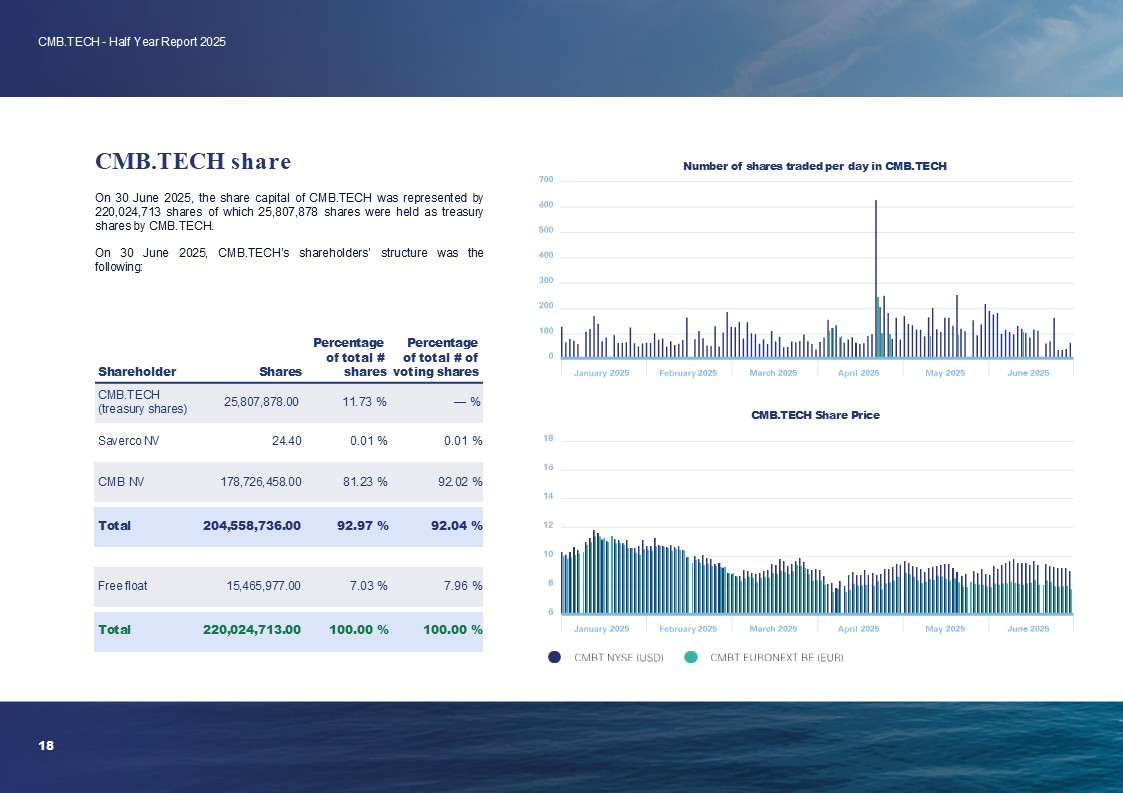
The number of shares issued on 30 June 2025 is 220,024,713. However, the number of shares excluding the owned shares held
by CMB.TECH at 30 June 2025 is 194,216,835.
|
|
EBITDA reconciliation (unaudited):
|
|||||||||||
|
(in thousands of USD)
|
Second Quarter 2025
|
Second Quarter 2024
|
YTD 2025
|
YTD 2024
|
|||||||
|
Profit (loss) for the period
|
(7,584)
|
184,371
|
32,789
|
679,620
|
|||||||
|
+ Net interest expenses
|
118,225
|
30,626
|
182,440
|
45,886
|
|||||||
|
+ Depreciation of tangible and intangible assets
|
108,698
|
41,639
|
164,369
|
81,877
|
|||||||
|
+ Income tax expense (benefit)
|
4,723
|
4,572
|
2,840
|
4,364
|
|||||||
|
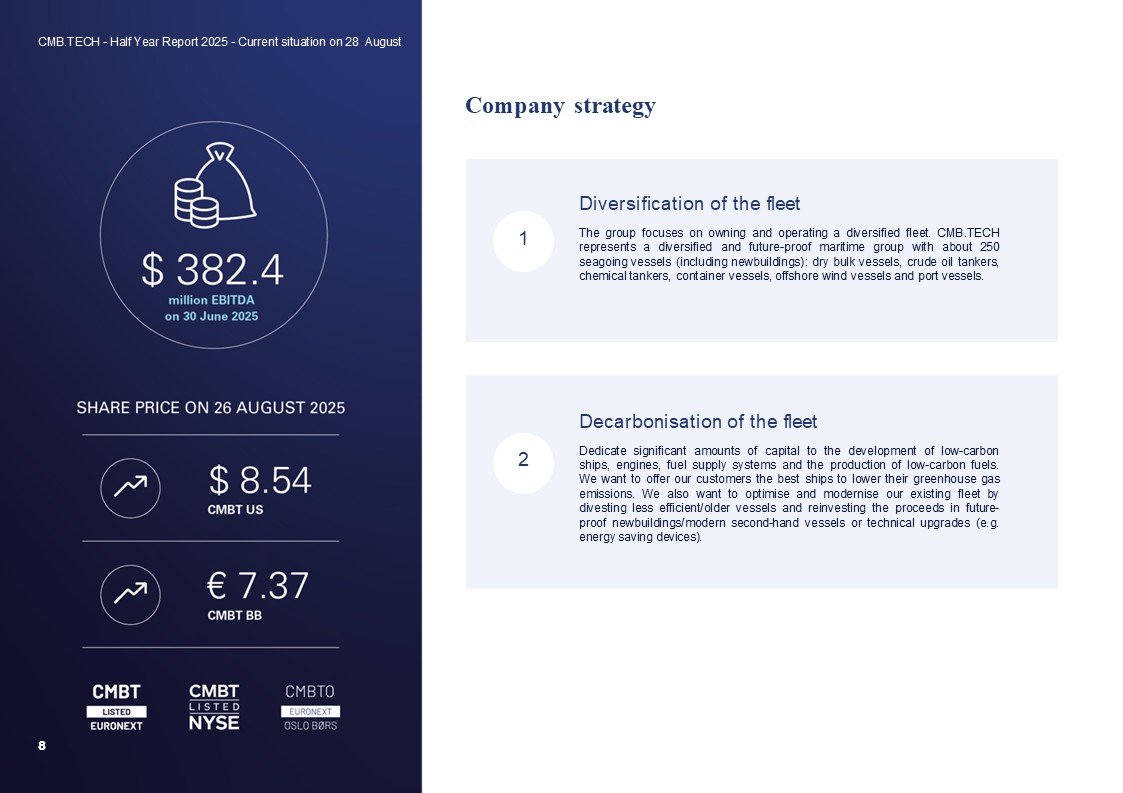
EBITDA (unaudited)
|
224,062
|
261,208
|
382,438
|
811,747
|
|||||||
|
CMB.TECH
|
||||||
|
Head of Marketing &
Communications
Katrien Hennin
|
Tel: +32 499393470
katrien.hennin@cmb.tech
|
Head of Investor
Relations
Joris Daman
|
Tel: +32 498617111
joris.daman@cmb.tech
|
|||
|
|
|
PRESS RELEASE
Thursday 28 August 2025 – 07:00
a.m. CET
|
|
Regulated information
|
||
|
EBITDA per share:
|
|||||||||||
|
(in USD per share)
|
Second Quarter 2025
|
Second Quarter 2024
|
YTD 2025
|
YTD 2024
|
|||||||
|
Weighted average number of shares (basic)
|
194,216,835
|
194,250,949
|
194,216,835
|
197,886,375
|
|||||||
|
EBITDA
|
1.15
|
1.34
|
1.97
|
4.10
|
|||||||
|
COUPON 43
|
Ex-dividend date
|
Record date
|
Payment date
|
|
Euronext
|
1 October 2025
|
2 October 2025
|
9 October 2025
|
|
NYSE
|
2 October 2025
|
2 October 2025
|
9 October 2025
|
|
OSE
|
1 October 2025
|
2 October 2025
|
on or about 9 October 2025
|
|
CMB.TECH
|
||||||
|
Head of Marketing &
Communications
Katrien Hennin
|
Tel: +32 499393470
katrien.hennin@cmb.tech
|
Head of Investor
Relations
Joris Daman
|
Tel: +32 498617111
joris.daman@cmb.tech
|
|||
|
|
|
PRESS RELEASE
Thursday 28 August 2025 – 07:00
a.m. CET
|
|
Regulated information
|
||
|
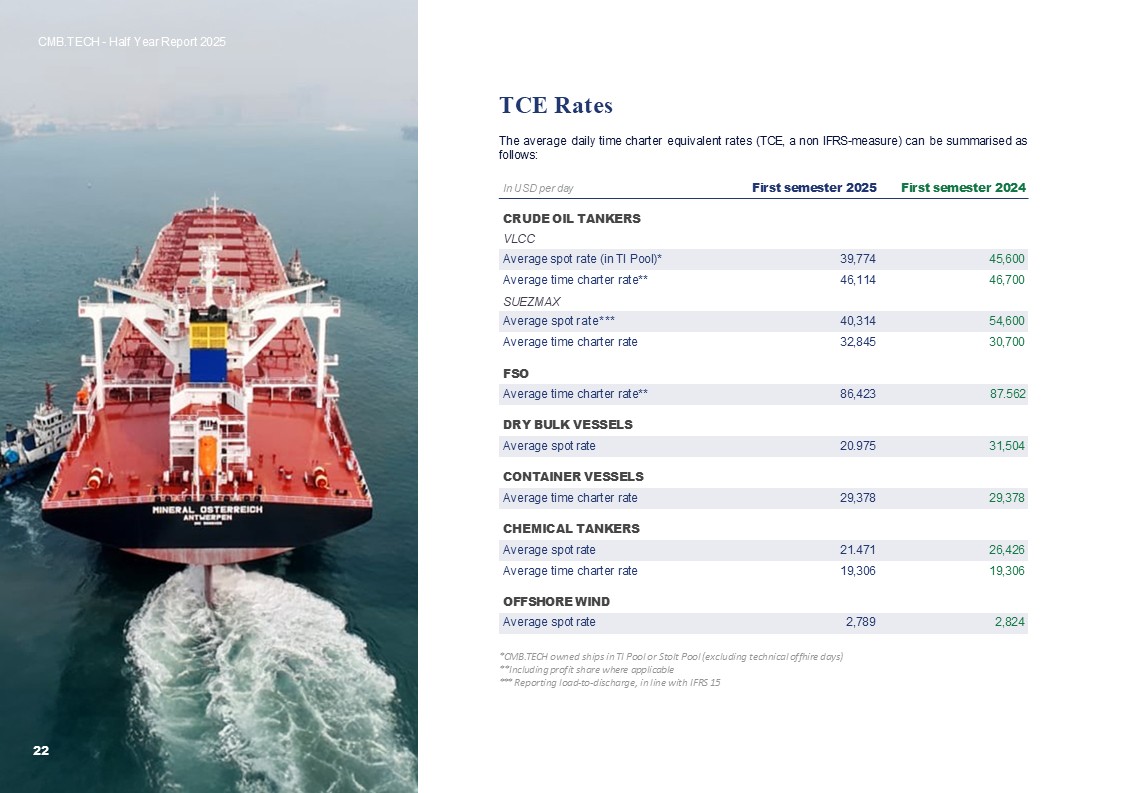
In USD per day
|
Q2 2025
|
Q2 2024
|
First semester 2025
|
First semester 2024
|
|
TANKERS
|
||||
|
VLCC
|
||||
|
Average spot rate (in TI Pool)*
|
44,981
|
50,500
|
39,774
|
45,600
|
|
Average time charter rate**
|
46,094
|
47,000
|
46,114
|
46,700
|
|
SUEZMAX
|
||||
|
Average spot rate***
|
40,160
|
49,500
|
40,314
|
54,600
|
|
Average time charter rate
|
33,023
|
30,750
|
32,845
|
30,700
|
|
DRY-BULK VESSELS
|
||||
|
Average spot rate***
|
23,081
|
36,731
|
20.975
|
31,504
|
|
CONTAINER VESSELS
|
||||
|
Average time charter rate
|
29,378
|
29,378
|
29,378
|
29,378
|
|
CHEMICAL TANKERS
|
||||
|
Average spot rate*
|
22,411
|
27,307
|
21.471
|
26,426
|
|
Average time charter rate
|
19,306
|
19,306
|
19,306
|
19,306
|
|
OFF-SHORE WIND (CTV)
|
||||
|
Average time charter rate
|
3,146
|
2,759
|
2,789
|
2,824
|
|
CMB.TECH
|
||||||
|
Head of Marketing &
Communications
Katrien Hennin
|
Tel: +32 499393470
katrien.hennin@cmb.tech
|
Head of Investor
Relations
Joris Daman
|
Tel: +32 498617111
joris.daman@cmb.tech
|
|||
|
|
|
PRESS RELEASE
Thursday 28 August 2025 – 07:00
a.m. CET
|
|
Regulated information
|
||
|
•
|
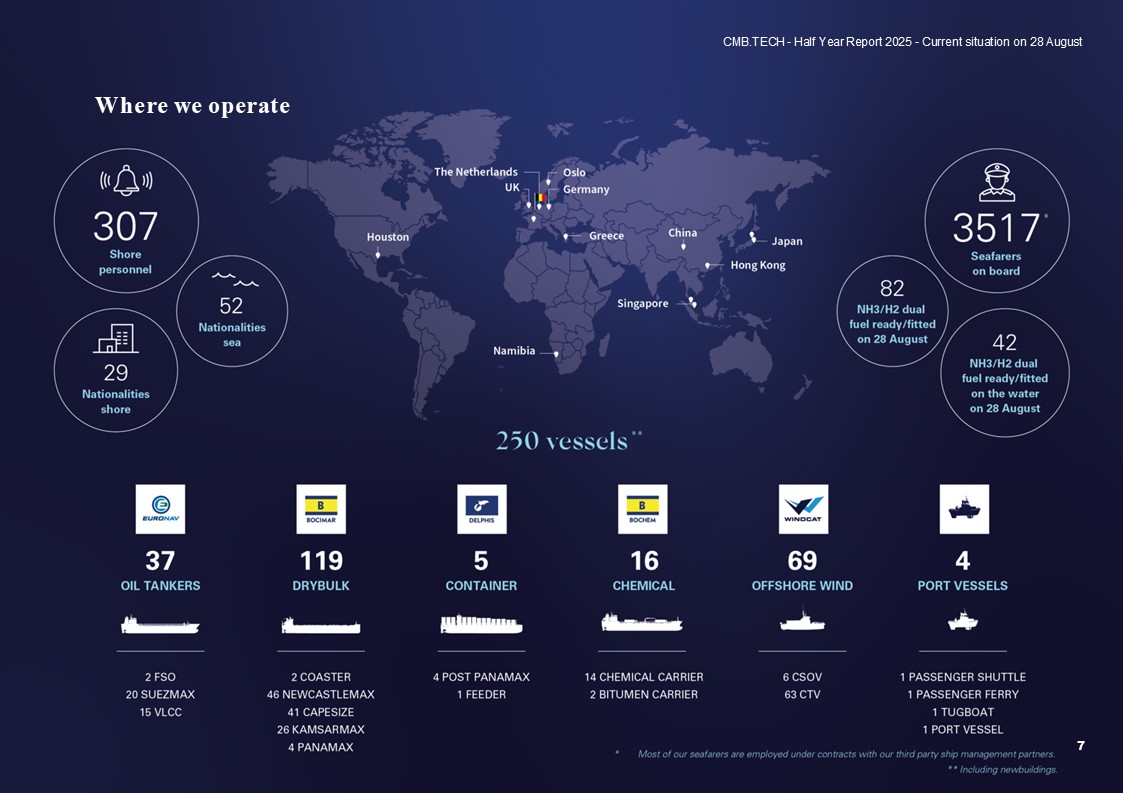
A combined diversified fleet of around 250 vessels,
including dry bulk vessels, crude oil tankers, chemical tankers, container ships, offshore wind vessels and port vessels
|
|
•
|
A future-proof fleet with more than 80 hydrogen- and ammonia-ready vessels, offering low-carbon fuel optionality
|
|
•
|
Fair market value of the fleet of approximately USD 11.1
billion, underscoring scale and asset values
|
|
•
|
Young and fuel-efficient fleet with an average age
of 6.1 years
|
|
•
|
Solid revenue visibility with a contract backlog of
approximately USD 3.0 billion, supporting predictable cash flows and shareholder returns
|
|
•
|
Global capital market presence with listings in New York,
Brussels and Oslo, with 38% expected free float providing trading liquidity
|
|
•
|
Robust liquidity position exceeding USD 400 million,
including cash on hand and undrawn credit facilities, providing financial flexibility and growth capacity
|
|
CMB.TECH
|
||||||
|
Head of Marketing &
Communications
Katrien Hennin
|
Tel: +32 499393470
katrien.hennin@cmb.tech
|
Head of Investor
Relations
Joris Daman
|
Tel: +32 498617111
joris.daman@cmb.tech
|
|||
|
|
|
PRESS RELEASE
Thursday 28 August 2025 – 07:00
a.m. CET
|
|
Regulated information
|
||
|
-
|
Mrs Gudrun Janssens oversees BIMCO's EU-related marine environment, safety and technical affairs from the
Brussels office. She has significant expertise in ship recycling. She studied Chemistry with a focus on environmental sciences and began her professional career at the Public Waste Agency of Flanders in 2000.
As a senior policy advisor and member of the Belgian delegation to the IMO, she was involved in shaping the
Belgian policy on ship waste management and ship recycling for over 15 years. Gudrun also worked for the European Community of Shipowners’ Associations (ECSA) and the Royal Belgian Shipowners Associations as Head of Environmental and
Technical Affairs, managing environmental and climate-related shipping issues at both European and international levels.
|
|
CMB.TECH
|
||||||
|
Head of Marketing &
Communications
Katrien Hennin
|
Tel: +32 499393470
katrien.hennin@cmb.tech
|
Head of Investor
Relations
Joris Daman
|
Tel: +32 498617111
joris.daman@cmb.tech
|
|||
|
|
|
PRESS RELEASE
Thursday 28 August 2025 – 07:00
a.m. CET
|
|
Regulated information
|
||
|
CMB.TECH
|
||||||
|
Head of Marketing &
Communications
Katrien Hennin
|
Tel: +32 499393470
katrien.hennin@cmb.tech
|
Head of Investor
Relations
Joris Daman
|
Tel: +32 498617111
joris.daman@cmb.tech
|
|||
|
|
|
PRESS RELEASE
Thursday 28 August 2025 – 07:00
a.m. CET
|
|
Regulated information
|
||
|
•
|
Euronav VLCC achieved average TCE of USD 44,981 per day in Q2, and Q3 2025 spot rate (to date): 77% fixed at USD
32,056 per day
|
|
•
|
Euronav Suezmax achieved average TCE of USD 40,160 per day in Q2, and Q3 2025 spot rate (to date): 76% fixed at
USD 39,364 per day
|
|
CMB.TECH
|
||||||
|
Head of Marketing &
Communications
Katrien Hennin
|
Tel: +32 499393470
katrien.hennin@cmb.tech
|
Head of Investor
Relations
Joris Daman
|
Tel: +32 498617111
joris.daman@cmb.tech
|
|||
|
|
|
PRESS RELEASE
Thursday 28 August 2025 – 07:00
a.m. CET
|
|
Regulated information
|
||
|
CMB.TECH
|
||||||
|
Head of Marketing &
Communications
Katrien Hennin
|
Tel: +32 499393470
katrien.hennin@cmb.tech
|
Head of Investor
Relations
Joris Daman
|
Tel: +32 498617111
joris.daman@cmb.tech
|
|||
|
|
|
PRESS RELEASE
Thursday 28 August 2025 – 07:00
a.m. CET
|
|
Regulated information
|
||
|
•
|
Bocimar Newcastlemax fleet achieved average TCE of USD 23,081 per day in Q2 – 23.5% above the Q1 5TC Baltic
Capesize Index (USD 18,681 USD /day). Q3 2025 spot rate (to date): 88% fixed at USD 28,323 per day
|
|
•
|
Golden Ocean Newcastlemax/Capesize fleet achieved Q2 2025 TCE actuals at 18,577 USD/day, and Q3 TCE quarter to
date rates at 23,600 USD/day (71% fixed).
|
|
•
|
Golden Ocean Kamsarmax/Panamax Q2 2025 TCE achieved actuals at 10,552 USD/day, and Q3 TCE quarter to date rates
at 13,600 USD/day (94% fixed)
|
|
CMB.TECH
|
||||||
|
Head of Marketing &
Communications
Katrien Hennin
|
Tel: +32 499393470
katrien.hennin@cmb.tech
|
Head of Investor
Relations
Joris Daman
|
Tel: +32 498617111
joris.daman@cmb.tech
|
|||
|
|
|
PRESS RELEASE
Thursday 28 August 2025 – 07:00
a.m. CET
|
|
Regulated information
|
||
|
•
|
Bochem achieved TCE Q2 2025 of USD 22,411 per day USD/day (spot pool)
|
|
•
|
Q3 2025 spot rates quarter-to-date: USD 17,244 per day
|
|
CMB.TECH
|
||||||
|
Head of Marketing &
Communications
Katrien Hennin
|
Tel: +32 499393470
katrien.hennin@cmb.tech
|
Head of Investor
Relations
Joris Daman
|
Tel: +32 498617111
joris.daman@cmb.tech
|
|||
|
|
|
PRESS RELEASE
Thursday 28 August 2025 – 07:00
a.m. CET
|
|
Regulated information
|
||
|
•
|
Windcat CTVs achieved TCE Q2 2025 of USD 3,146 per day (utilisation 90.9%)
|
|
•
|
Windcat CTV Q3 2025 spot rates to-date: so far 91.5% fixed at USD 3,335 per day
|
|
CMB.TECH
|
||||||
|
Head of Marketing &
Communications
Katrien Hennin
|
Tel: +32 499393470
katrien.hennin@cmb.tech
|
Head of Investor
Relations
Joris Daman
|
Tel: +32 498617111
joris.daman@cmb.tech
|
|||
|
|
|
PRESS RELEASE
Thursday 28 August 2025 – 07:00
a.m. CET
|
|
Regulated information
|
||
|
Webcast Information
|
|
|
Event Type:
|
Audio webcast with user-controlled slide presentation
|
|
Event Date:
|
28 August 2025
|
|
Event Time:
|
8 a.m. EST / 2 p.m. CET
|
|
Event Title:
|
“Q2 2025 Earnings Conference Call”
|
|
Event Site/URL:
|
https://events.teams.microsoft.com/event/4c5a9385-1280-4ac8-a49b-2384494ac75d@d0b2b045-83aa-4027-8cf2-ea360b91d5e4
|
|
CMB.TECH
|
||||||
|
Head of Marketing &
Communications
Katrien Hennin
|
Tel: +32 499393470
katrien.hennin@cmb.tech
|
Head of Investor
Relations
Joris Daman
|
Tel: +32 498617111
joris.daman@cmb.tech
|
|||
|
|
|
PRESS RELEASE
Thursday 28 August 2025 – 07:00
a.m. CET
|
|
Regulated information
|
||
|
CMB.TECH
|
||||||
|
Head of Marketing &
Communications
Katrien Hennin
|
Tel: +32 499393470
katrien.hennin@cmb.tech
|
Head of Investor
Relations
Joris Daman
|
Tel: +32 498617111
joris.daman@cmb.tech
|
|||
|
|
|
PRESS RELEASE
Thursday 28 August 2025 – 07:00
a.m. CET
|
|
Regulated information
|
||
|
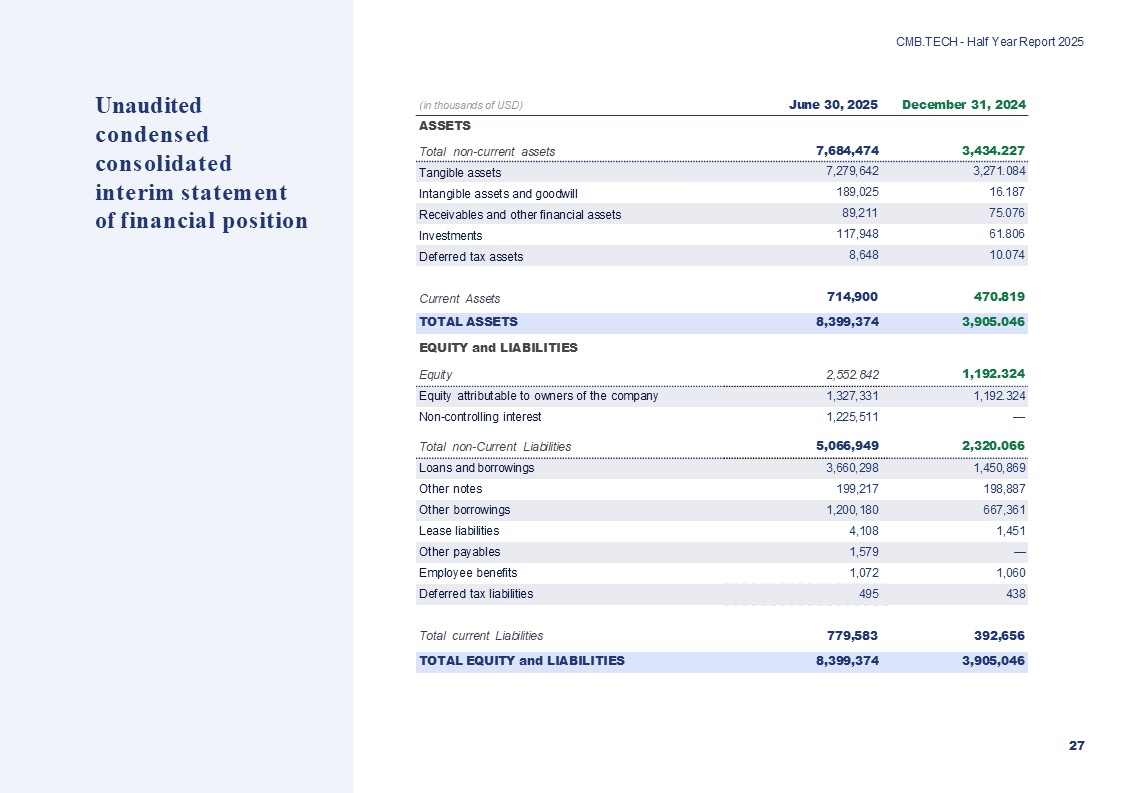
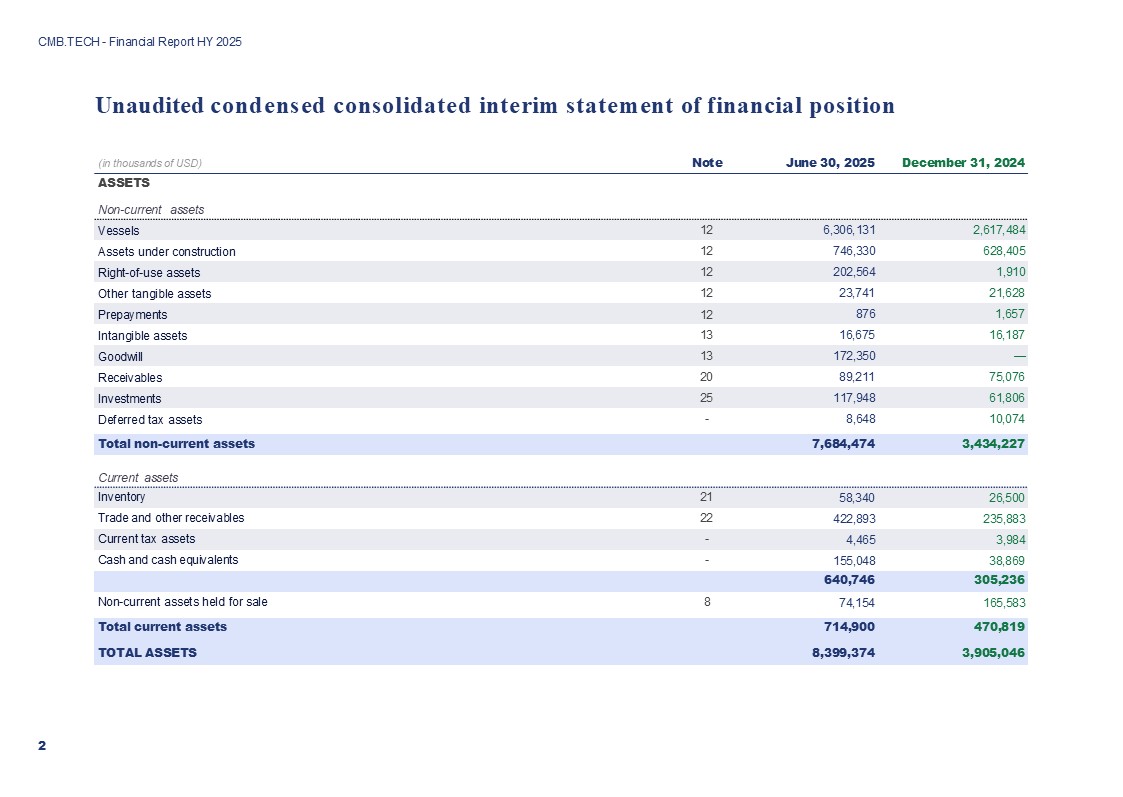
June 30, 2025
|
December 31, 2024
|
|||||
|
ASSETS
|
||||||
|
Non-current assets
|
||||||
|
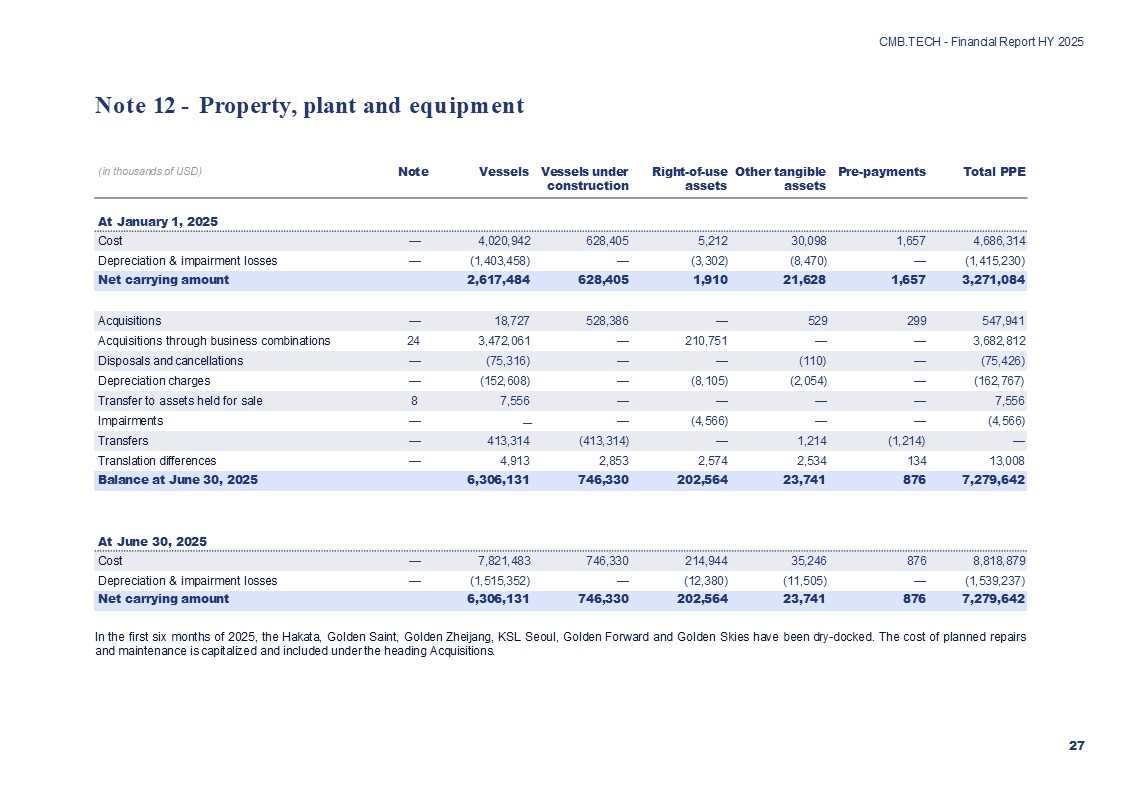
Vessels
|
6,306,131
|
2,617,484
|
||||
|
Assets under construction
|
746,330
|
628,405
|
||||
|
Right-of-use assets
|
202,564
|
1,910
|
||||
|
Other tangible assets
|
23,741
|
21,628
|
||||
|
Prepayments
|
876
|
1,657
|
||||
|
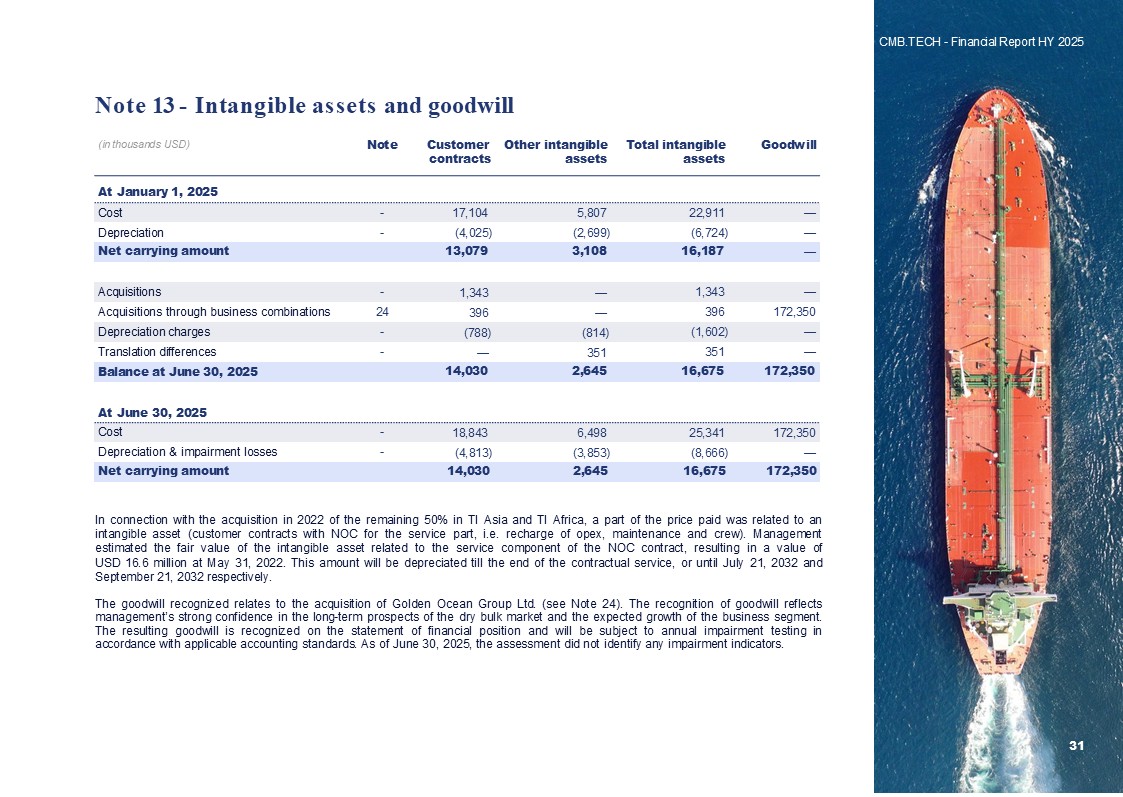
Intangible assets
|
16,675
|
16,187
|
||||
|
Goodwill
|
172,350
|
—
|
||||
|
Receivables
|
89,211
|
75,076
|
||||
|
Investments
|
117,948
|
61,806
|
||||
|
Deferred tax assets
|
8,648
|
10,074
|
||||
|
Total non-current assets
|
7,684,474
|
3,434,227
|
||||
|
Current assets
|
||||||
|
Inventory
|
58,340
|
26,500
|
||||
|
Trade and other receivables
|
422,893
|
235,883
|
||||
|
Current tax assets
|
4,465
|
3,984
|
||||
|
Cash and cash equivalents
|
155,048
|
38,869
|
||||
|
640,746
|
305,236
|
|||||
|
Non-current assets held for sale
|
74,154
|
165,583
|
||||
|
Total current assets
|
714,900
|
470,819
|
||||
|
TOTAL ASSETS
|
8,399,374
|
3,905,046
|
||||
|
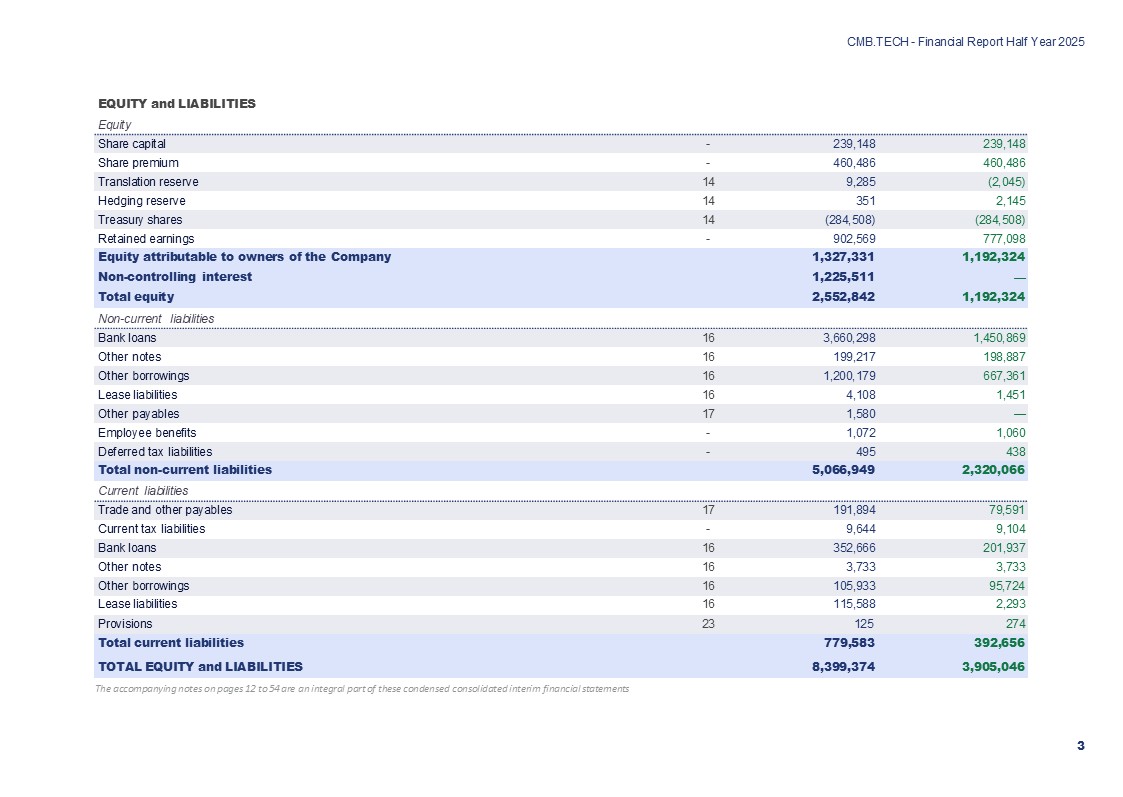
EQUITY and LIABILITIES
|
||||||
|
Equity
|
||||||
|
Share capital
|
239,148
|
239,148
|
||||
|
Share premium
|
460,486
|
460,486
|
||||
|
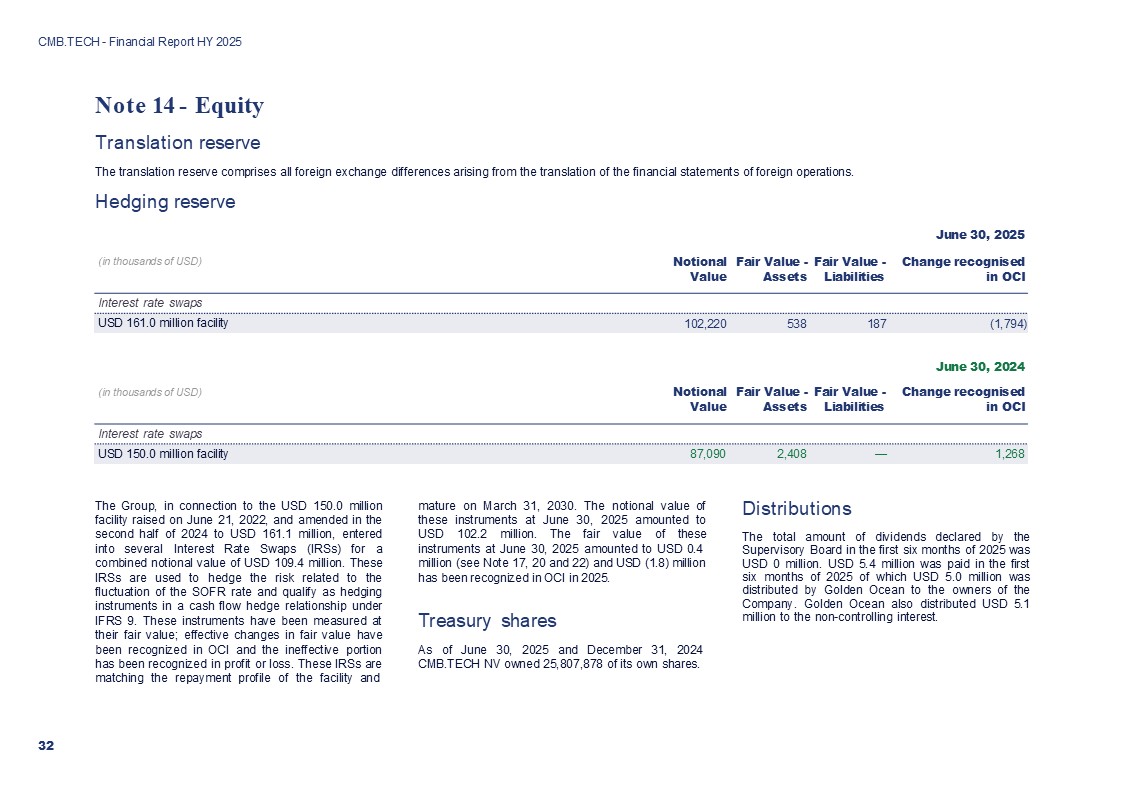
Translation reserve
|
9,285
|
(2,045)
|
||||
|
Hedging reserve
|
351
|
2,145
|
||||
|
Treasury shares
|
(284,508)
|
(284,508)
|
||||
|
Retained earnings
|
902,569
|
777,098
|
||||
|
Equity attributable to owners of the Company
|
1,327,331
|
1,192,324
|
||||
|
Non-controlling interest
|
1,225,511
|
—
|
||||
|
Total equity
|
2,552,842
|
1,192,324
|
||||
|
Non-current liabilities
|
||||||
|
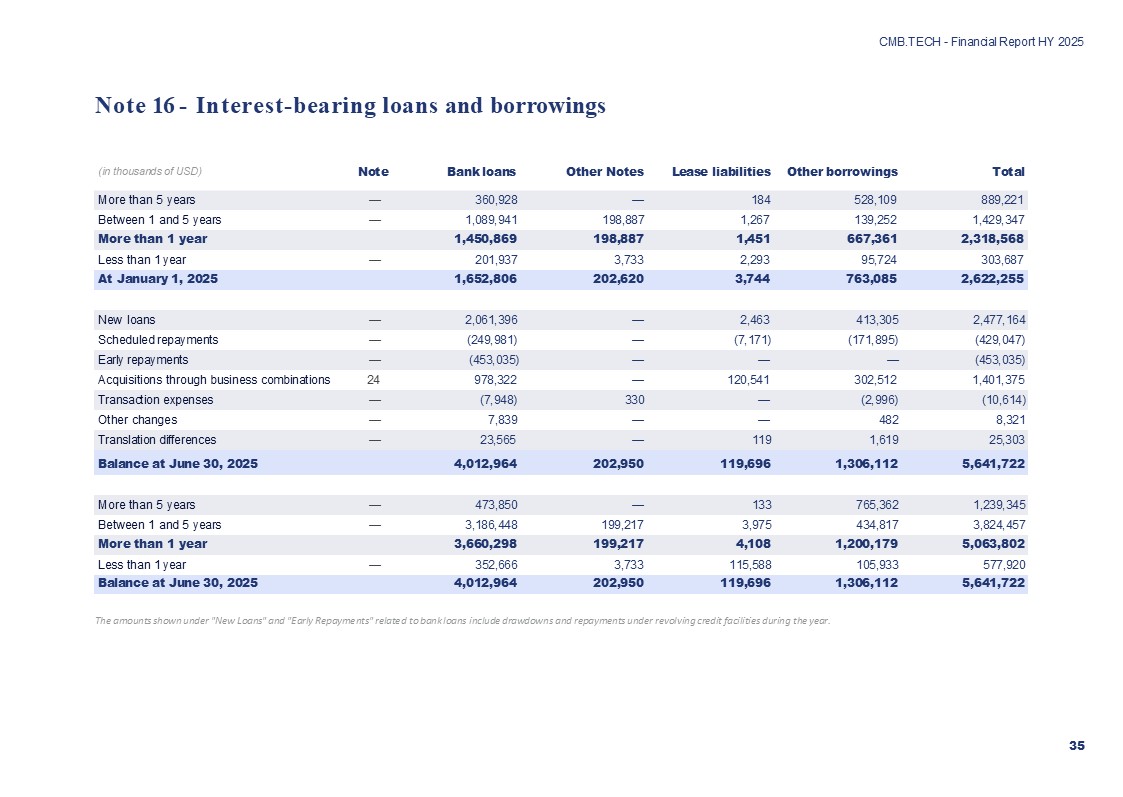
Bank loans
|
3,660,298
|
1,450,869
|
||||
|
Other notes
|
199,217
|
198,887
|
||||
|
Other borrowings
|
1,200,179
|
667,361
|
||||
|
Lease liabilities
|
4,108
|
1,451
|
||||
|
Other payables
|
1,580
|
—
|
||||
|
Employee benefits
|
1,072
|
1,060
|
||||
|
Deferred tax liabilities
|
495
|
438
|
||||
|
Total non-current liabilities
|
5,066,949
|
2,320,066
|
||||
|
Current liabilities
|
||||||
|
Trade and other payables
|
191,894
|
79,591
|
||||
|
Current tax liabilities
|
9,644
|
9,104
|
||||
|
Bank loans
|
352,666
|
201,937
|
||||
|
Other notes
|
3,733
|
3,733
|
||||
|
Other borrowings
|
105,933
|
95,724
|
||||
|
Lease liabilities
|
115,588
|
2,293
|
||||
|
Provisions
|
125
|
274
|
||||
|
Total current liabilities
|
779,583
|
392,656
|
||||
|
TOTAL EQUITY and LIABILITIES
|
8,399,374
|
3,905,046
|
||||
|
CMB.TECH
|
||||||
|
Head of Marketing &
Communications
Katrien Hennin
|
Tel: +32 499393470
katrien.hennin@cmb.tech
|
Head of Investor
Relations
Joris Daman
|
Tel: +32 498617111
joris.daman@cmb.tech
|
|||
|
|
|
PRESS RELEASE
Thursday 28 August 2025 – 07:00
a.m. CET
|
|
Regulated information
|
||
|
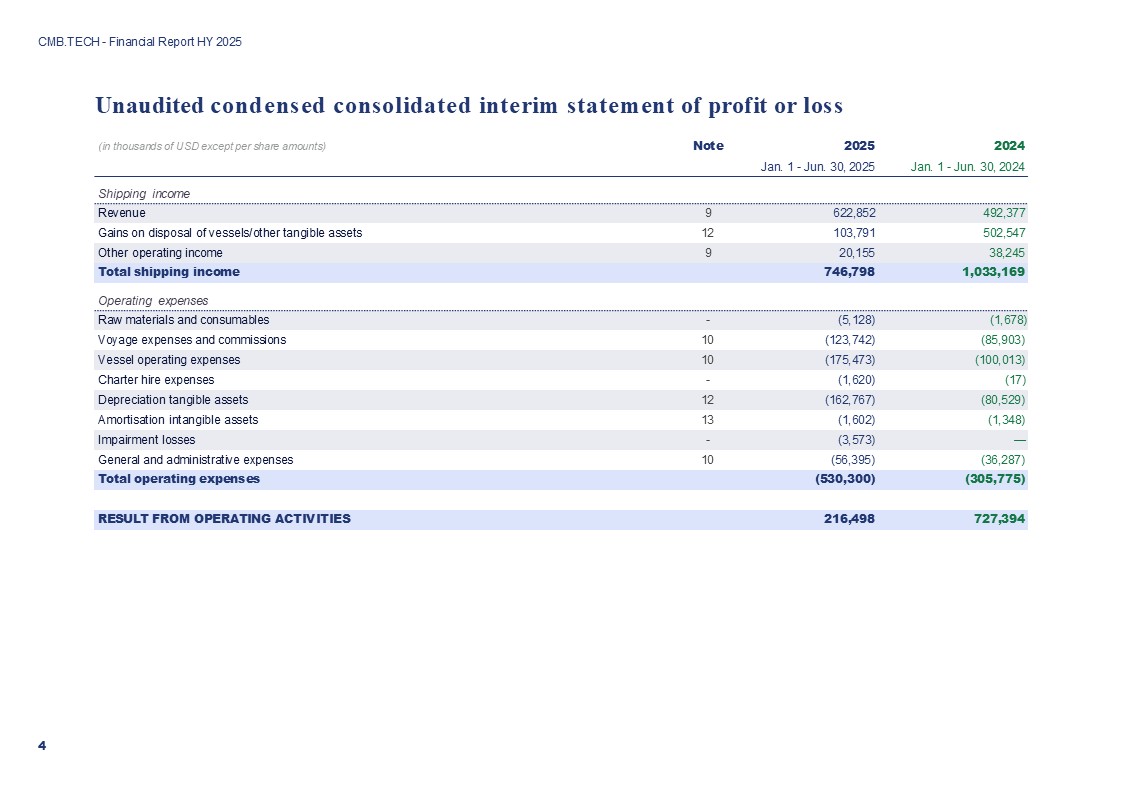
2025
|
2024
|
|||||
|
Jan. 1 - June 30, 2025
|
Jan. 1 - June 30, 2024
|
|||||
|
Shipping income
|
||||||
|
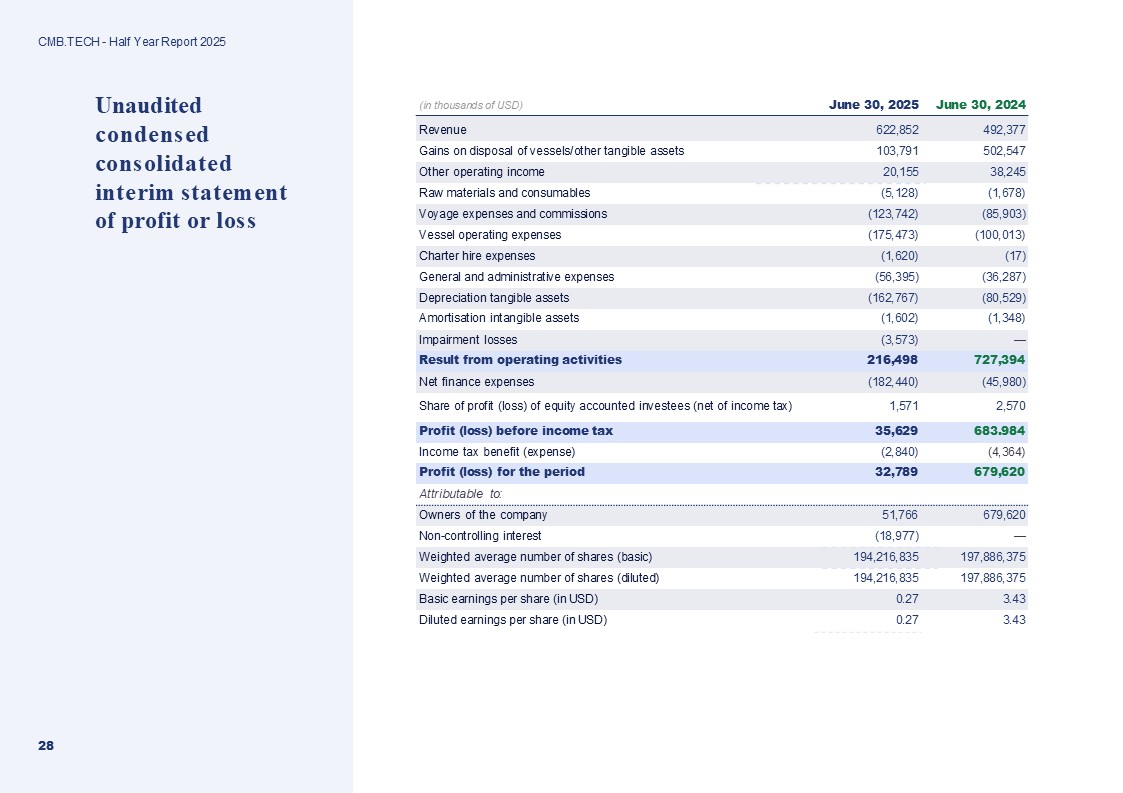
Revenue
|
622,852
|
492,377
|
||||
|
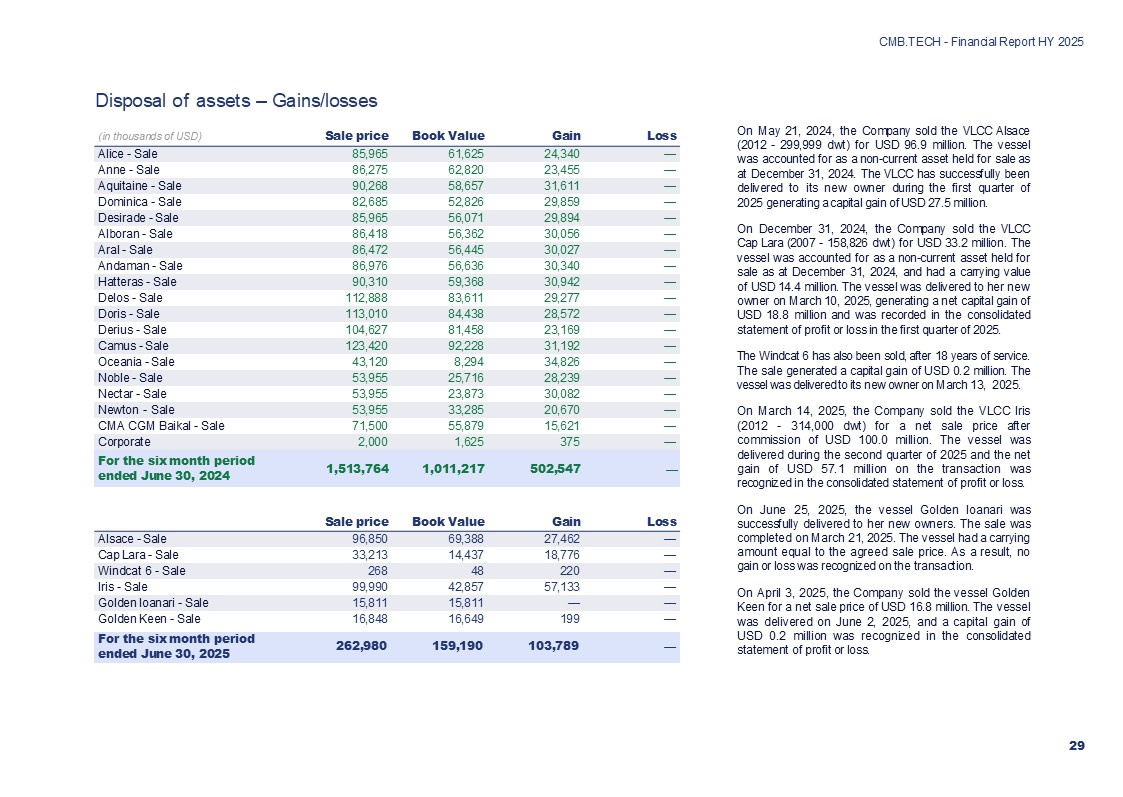
Gains on disposal of vessels/other tangible assets
|
103,791
|
502,547
|
||||
|
Other operating income
|
20,155
|
38,245
|
||||
|
Total shipping income
|
746,798
|
1,033,169
|
||||
|
Operating expenses
|
||||||
|
Raw materials and consumables
|
(5,128)
|
(1,678)
|
||||
|
Voyage expenses and commissions
|
(123,742)
|
(85,903)
|
||||
|
Vessel operating expenses
|
(175,473)
|
(100,013)
|
||||
|
Charter hire expenses
|
(1,620)
|
(17)
|
||||
|
Depreciation tangible assets
|
(162,767)
|
(80,529)
|
||||
|
Amortisation intangible assets
|
(1,602)
|
(1,348)
|
||||
|
Impairment losses
|
(3,573)
|
—
|
||||
|
General and administrative expenses
|
(56,395)
|
(36,287)
|
||||
|
Total operating expenses
|
(530,300)
|
(305,775)
|
||||
|
RESULT FROM OPERATING ACTIVITIES
|
216,498
|
727,394
|
||||
|
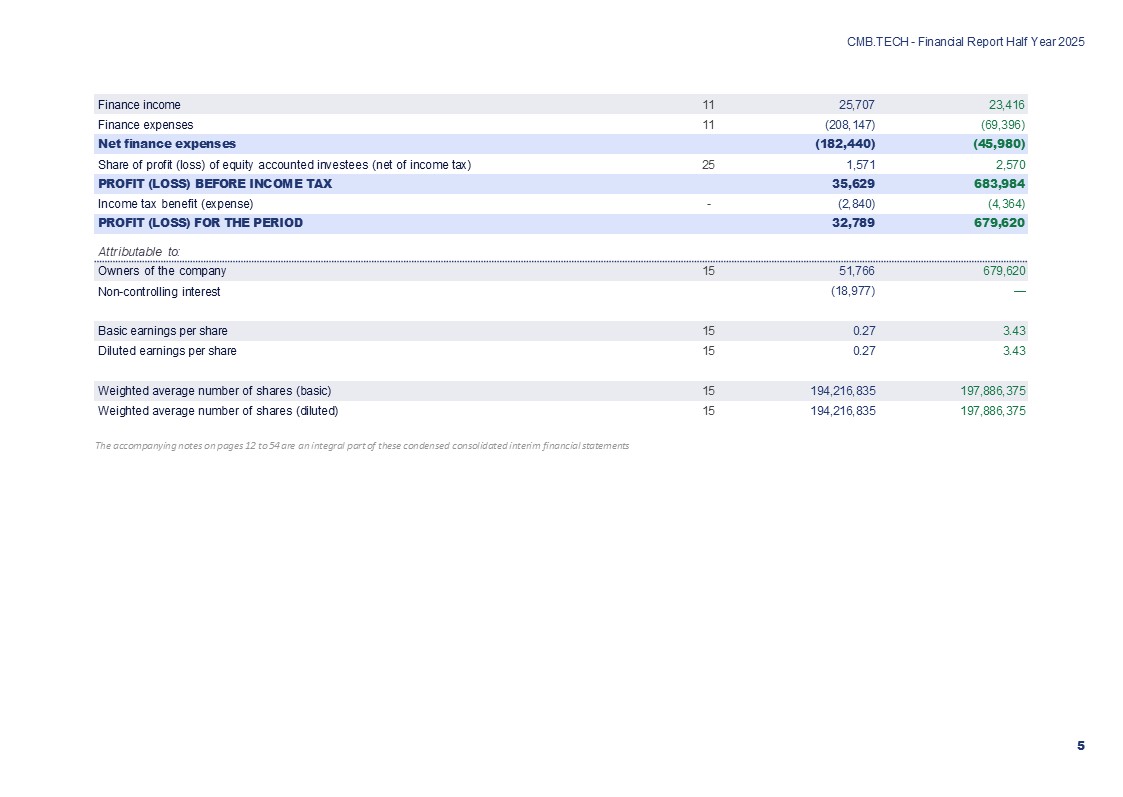
Finance income
|
25,707
|
23,416
|
||||
|
Finance expenses
|
(208,147)
|
(69,396)
|
||||
|
Net finance expenses
|
(182,440)
|
(45,980)
|
||||
|
Share of profit (loss) of equity accounted investees (net of income tax)
|
1,571
|
2,570
|
||||
|
PROFIT (LOSS) BEFORE INCOME TAX
|
35,629
|
683,984
|
||||
|
Income tax benefit (expense)
|
(2,840)
|
(4,364)
|
||||
|
PROFIT (LOSS) FOR THE PERIOD
|
32,789
|
679,620
|
||||
|
Attributable to:
|
||||||
|
Owners of the company
|
51,766
|
679,620
|
||||
|
Non-controlling interest
|
(18,977)
|
—
|
||||
|
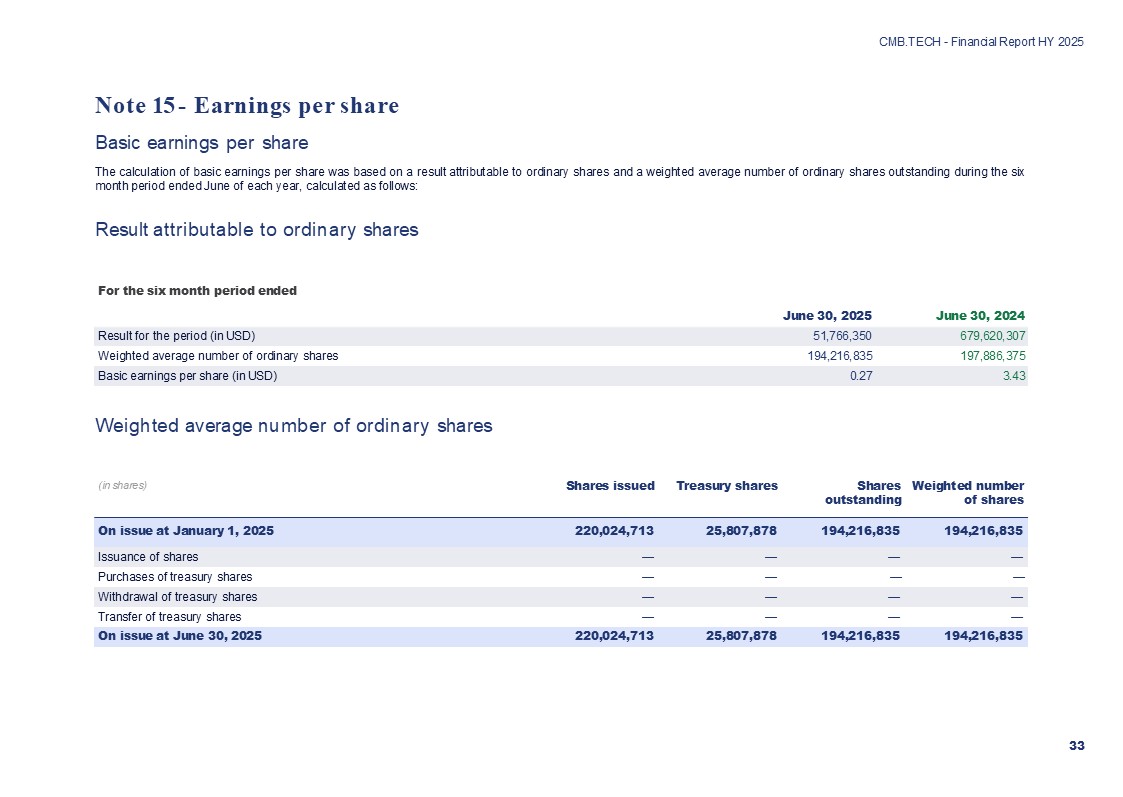
Basic earnings per share
|
0.27
|
3.43
|
||||
|
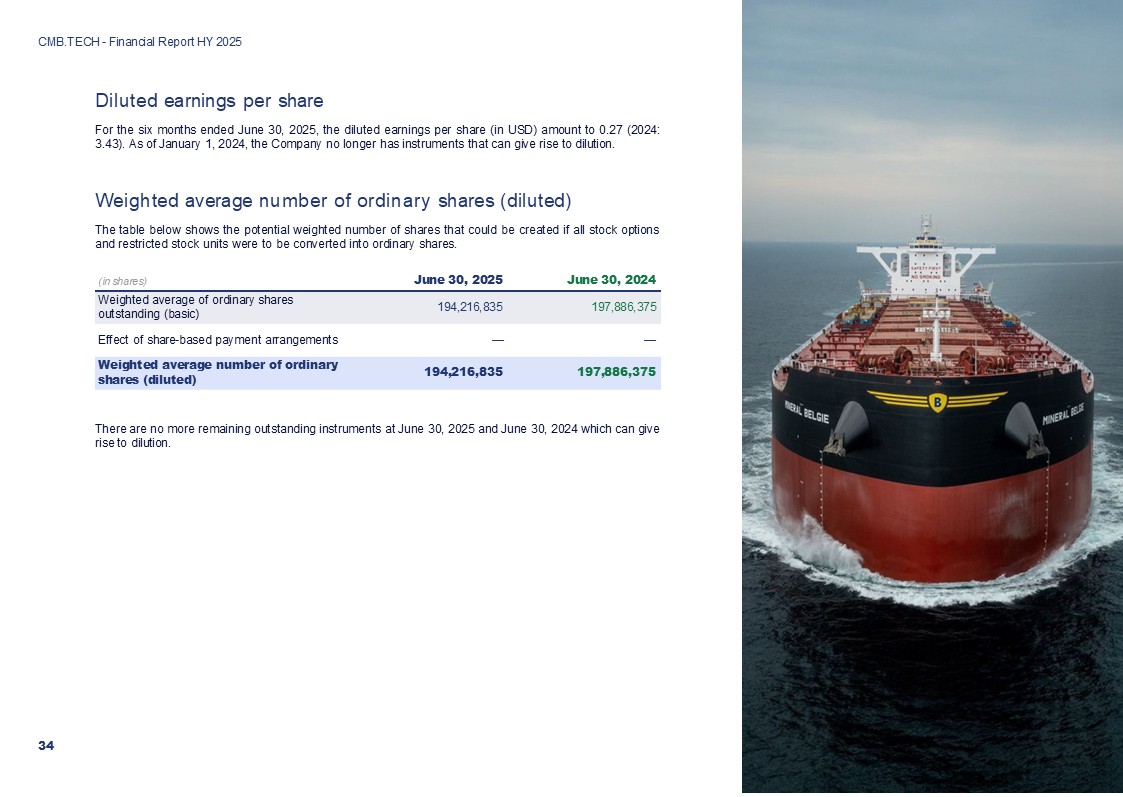
Diluted earnings per share
|
0.27
|
3.43
|
||||
|
Weighted average number of shares (basic)
|
194,216,835
|
197,886,375
|
||||
|
Weighted average number of shares (diluted)
|
194,216,835
|
197,886,375
|
||||
|
CMB.TECH
|
||||||
|
Head of Marketing &
Communications
Katrien Hennin
|
Tel: +32 499393470
katrien.hennin@cmb.tech
|
Head of Investor
Relations
Joris Daman
|
Tel: +32 498617111
joris.daman@cmb.tech
|
|||
|
|
|
PRESS RELEASE
Thursday 28 August 2025 – 07:00
a.m. CET
|
|
Regulated information
|
||
|
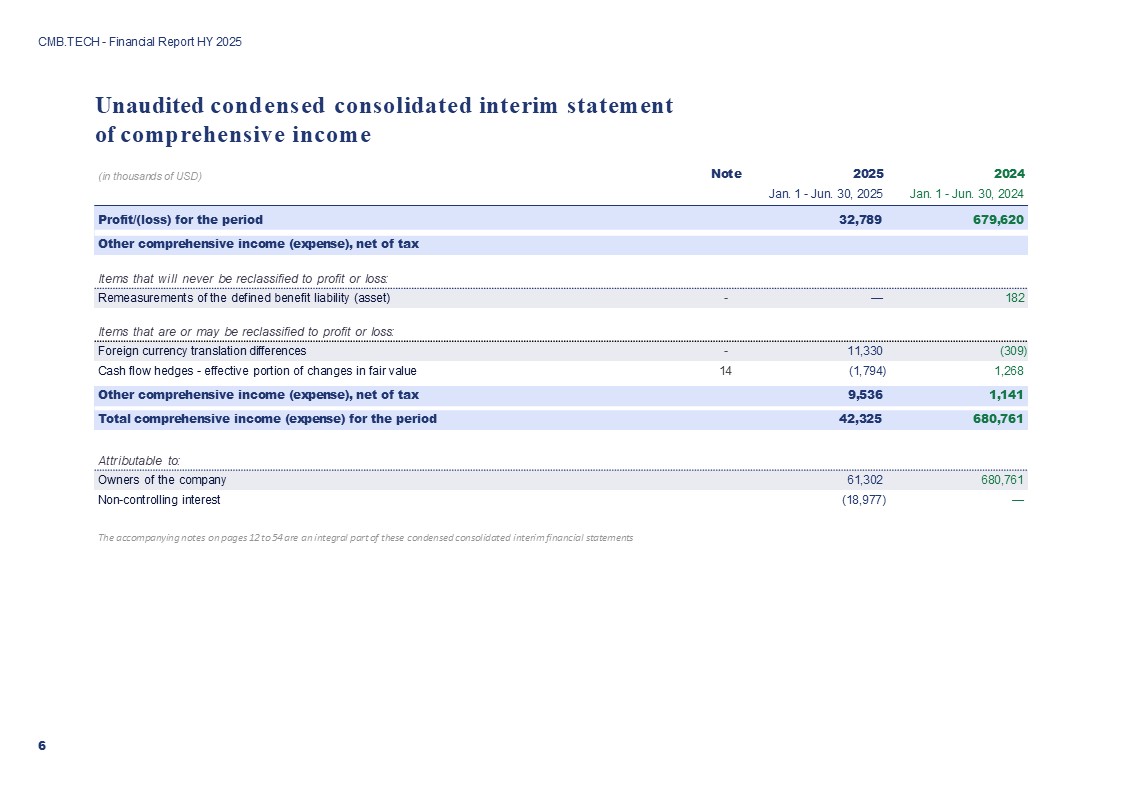
2025
|
2024
|
|||||
|
Jan. 1 - June 30, 2025
|
Jan. 1 - June 30, 2024
|
|||||
|
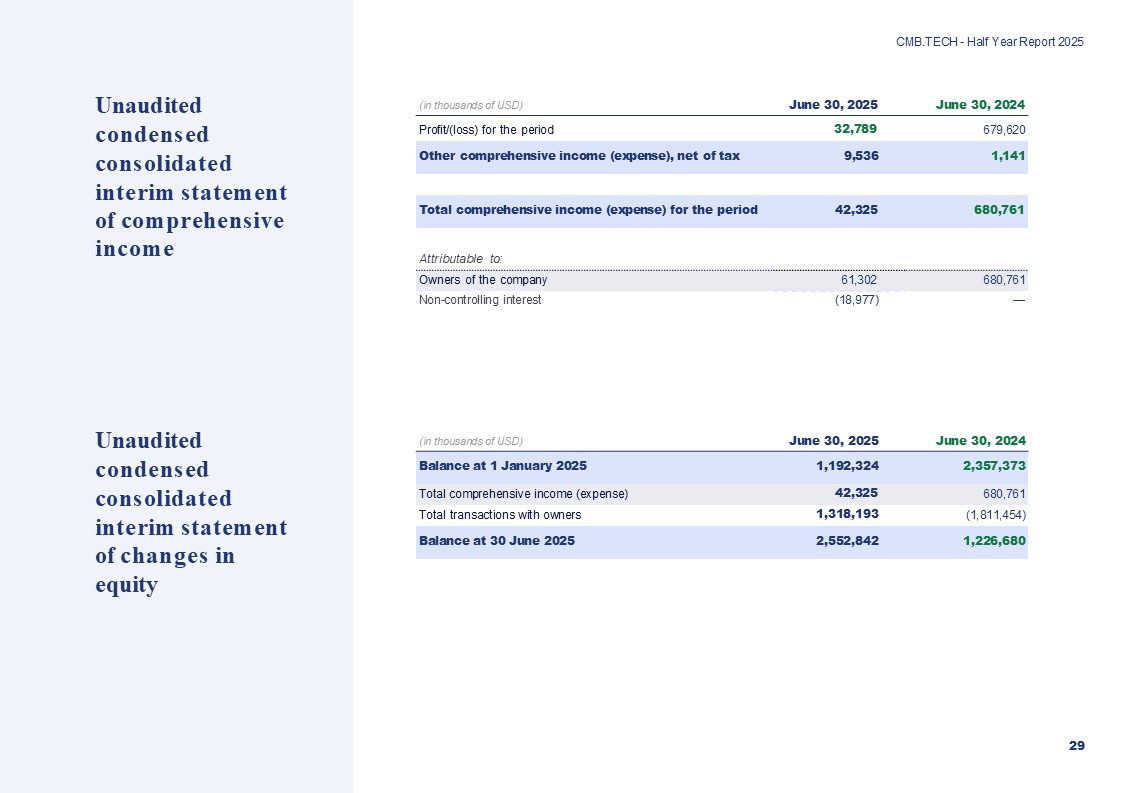
Profit/(loss) for the period
|
32,789
|
679,620
|
||||
|
Other comprehensive income (expense), net of tax
|
||||||
|
Items that will never be reclassified to profit or loss:
|
||||||
|
Remeasurements of the defined benefit liability (asset)
|
—
|
182
|
||||
|
Items that are or may be reclassified to profit or loss:
|
||||||
|
Foreign currency translation differences
|
11,330
|
(309)
|
||||
|
Cash flow hedges - effective portion of changes in fair value
|
(1,794)
|
1,268
|
||||
|
Other comprehensive income (expense), net of tax
|
9,536
|
1,141
|
||||
|
Total comprehensive income (expense) for the period
|
42,325
|
680,761
|
||||
|
Attributable to:
|
||||||
|
Owners of the company
|
61,302
|
680,761
|
||||
|
Non-controlling interest
|
(18,977)
|
—
|
||||
|
CMB.TECH
|
||||||
|
Head of Marketing &
Communications
Katrien Hennin
|
Tel: +32 499393470
katrien.hennin@cmb.tech
|
Head of Investor
Relations
Joris Daman
|
Tel: +32 498617111
joris.daman@cmb.tech
|
|||
|
|
|
PRESS RELEASE
Thursday 28 August 2025 – 07:00
a.m. CET
|
|
Regulated information
|
||
|
Share capital
|
Share premium
|
Translation reserve
|
Hedging reserve
|
Treasury shares
|
Retained earnings
|
Equity attributable to owners of the Company
|
Non-controlling interest
|
Total equity
|
|
|
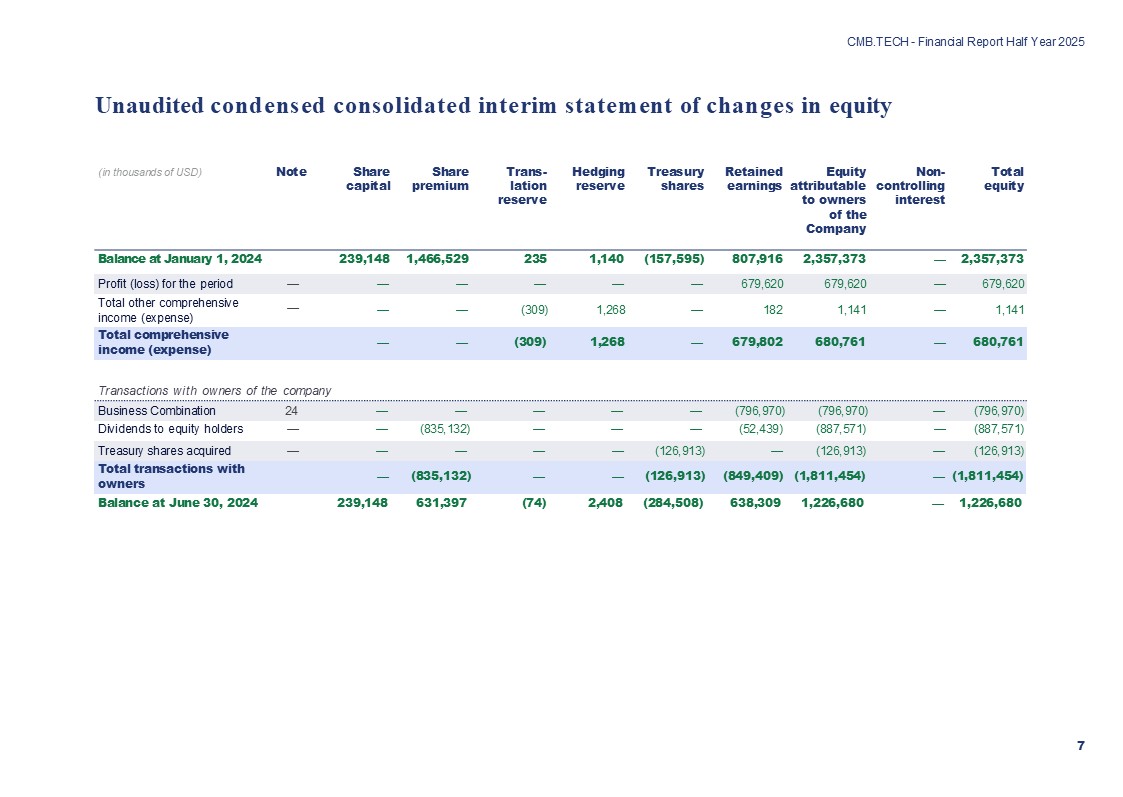
Balance at January 1, 2024
|
239,148
|
1,466,529
|
235
|
1,140
|
(157,595)
|
807,916
|
2,357,373
|
—
|
2,357,373
|
|
Profit (loss) for the period
|
—
|
—
|
—
|
—
|
—
|
679,620
|
679,620
|
—
|
679,620
|
|
Total other comprehensive income (expense)
|
—
|
—
|
(309)
|
1,268
|
—
|
182
|
1,141
|
—
|
1,141
|
|
Total comprehensive income (expense)
|
—
|
—
|
(309)
|
1,268
|
—
|
679,802
|
680,761
|
—
|
680,761
|
|
Transactions with owners of the company
|
|||||||||
|
Business Combination
|
—
|
—
|
—
|
—
|
—
|
(796,970)
|
(796,970)
|
—
|
(796,970)
|
|
Dividends to equity holders
|
—
|
(835,132)
|
—
|
—
|
—
|
(52,439)
|
(887,571)
|
(887,571)
|
|
|
Treasury shares acquired
|
—
|
—
|
—
|
—
|
(126,913)
|
—
|
(126,913)
|
—
|
(126,913)
|
|
Total transactions with owners
|
—
|
(835,132)
|
—
|
—
|
(126,913)
|
(849,409)
|
(1,811,454)
|
—
|
(1,811,454)
|
|
Balance at June 30, 2024
|
239,148
|
631,397
|
(74)
|
2,408
|
(284,508)
|
638,309
|
1,226,680
|
—
|
1,226,680
|
|
Share capital
|
Share premium
|
Translation reserve
|
Hedging reserve
|
Treasury shares
|
Retained earnings
|
Equity attributable to owners of the Company
|
Non-controlling interest
|
Total equity
|
|
|
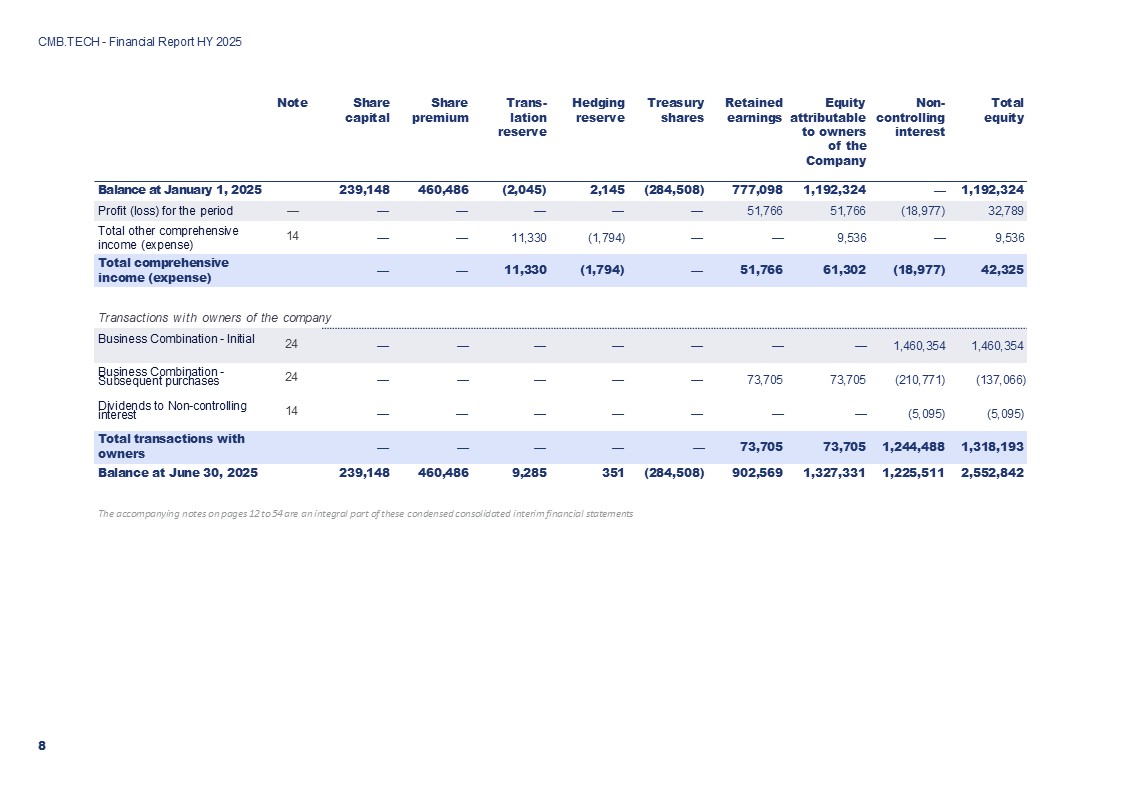
Balance at January 1, 2025
|
239,148
|
460,486
|
(2,045)
|
2,145
|
(284,508)
|
777,098
|
1,192,324
|
—
|
1,192,324
|
|
Profit (loss) for the period
|
—
|
—
|
—
|
—
|
—
|
51,766
|
51,766
|
(18,977)
|
32,789
|
|
Total other comprehensive income (expense)
|
—
|
—
|
11,330
|
(1,794)
|
—
|
—
|
9,536
|
—
|
9,536
|
|
Total comprehensive income (expense)
|
—
|
—
|
11,330
|
(1,794)
|
—
|
51,766
|
61,302
|
(18,977)
|
42,325
|
|
Transactions with owners of the company
|
|||||||||
|
Business Combination - Initial purchase
|
—
|
—
|
—
|
—
|
—
|
—
|
—
|
1,460,354
|
1,460,354
|
|
Business Combination - Subsequent purchases
|
—
|
—
|
—
|
—
|
—
|
73,705
|
73,705
|
(210,771)
|
(137,066)
|
|
Dividends to Non-controlling interest
|
—
|
—
|
—
|
—
|
—
|
—
|
—
|
(5,095)
|
(5,095)
|
|
Total transactions with owners
|
—
|
—
|
—
|
—
|
—
|
73,705
|
73,705
|
1,244,488
|
1,318,193
|
|
Balance at June 30, 2025
|
239,148
|
460,486
|
9,285
|
351
|
(284,508)
|
902,569
|
1,327,331
|
1,225,511
|
2,552,842
|
|
CMB.TECH
|
||||||
|
Head of Marketing &
Communications
Katrien Hennin
|
Tel: +32 499393470
katrien.hennin@cmb.tech
|
Head of Investor
Relations
Joris Daman
|
Tel: +32 498617111
joris.daman@cmb.tech
|
|||
|
|
|
PRESS RELEASE
Thursday 28 August 2025 – 07:00
a.m. CET
|
|
Regulated information
|
||
|
2025
|
2024
|
|||||
|
Jan. 1 - June 30, 2025
|
Jan. 1 - June 30, 2024
|
|||||
|
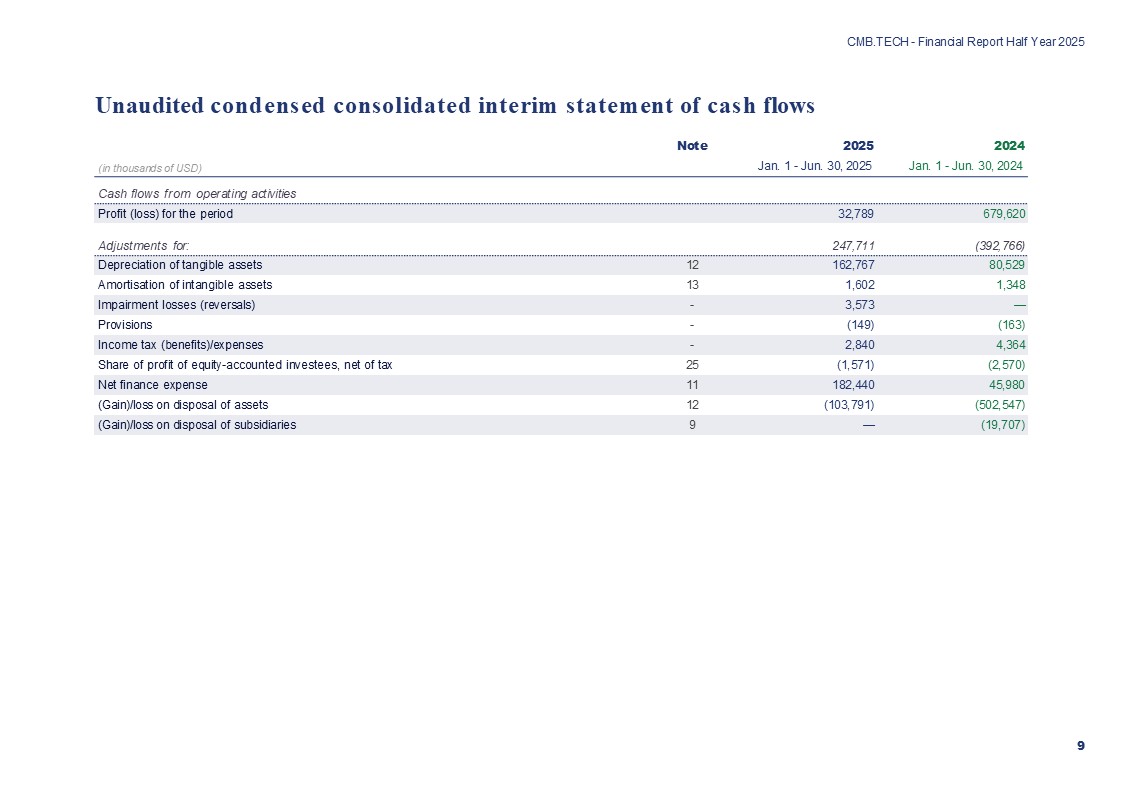
Cash flows from operating activities
|
||||||
|
Profit (loss) for the period
|
32,789
|
679,620
|
||||
|
Adjustments for:
|
247,711
|
(392,766)
|
||||
|
Depreciation of tangible assets
|
162,767
|
80,529
|
||||
|
Amortisation of intangible assets
|
1,602
|
1,348
|
||||
|
Impairment losses (reversals)
|
3,573
|
—
|
||||
|
Provisions
|
(149)
|
(163)
|
||||
|
Income tax (benefits)/expenses
|
2,840
|
4,364
|
||||
|
Share of profit of equity-accounted investees, net of tax
|
(1,571)
|
(2,570)
|
||||
|
Net finance expense
|
182,440
|
45,980
|
||||
|
(Gain)/loss on disposal of assets
|
(103,791)
|
(502,547)
|
||||
|
(Gain)/loss on disposal of subsidiaries
|
—
|
(19,707)
|
||||
|
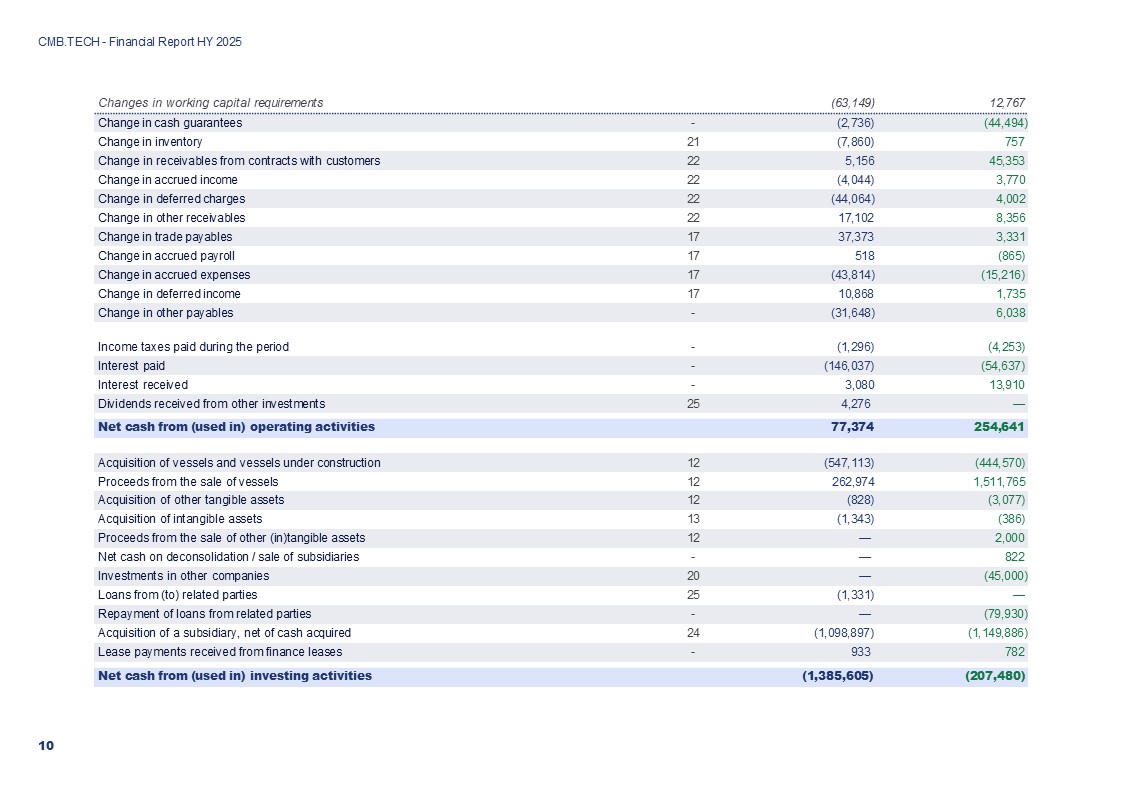
Changes in working capital requirements
|
(63,149)
|
12,767
|
||||
|
Change in cash guarantees
|
(2,736)
|
(44,494)
|
||||
|
Change in inventory
|
(7,860)
|
757
|
||||
|
Change in receivables from contracts with customers
|
5,156
|
45,353
|
||||
|
Change in accrued income
|
(4,044)
|
3,770
|
||||
|
Change in deferred charges
|
(44,064)
|
4,002
|
||||
|
Change in other receivables
|
17,102
|
8,356
|
||||
|
Change in trade payables
|
37,373
|
3,331
|
||||
|
Change in accrued payroll
|
518
|
(865)
|
||||
|
Change in accrued expenses
|
(43,814)
|
(15,216)
|
||||
|
Change in deferred income
|
10,868
|
1,735
|
||||
|
Change in other payables
|
(31,648)
|
6,038
|
||||
|
Income taxes paid during the period
|
(1,296)
|
(4,253)
|
||||
|
Interest paid
|
(146,037)
|
(54,637)
|
||||
|
Interest received
|
3,080
|
13,910
|
||||
|
Dividends received from other investments
|
4,276
|
—
|
||||
|
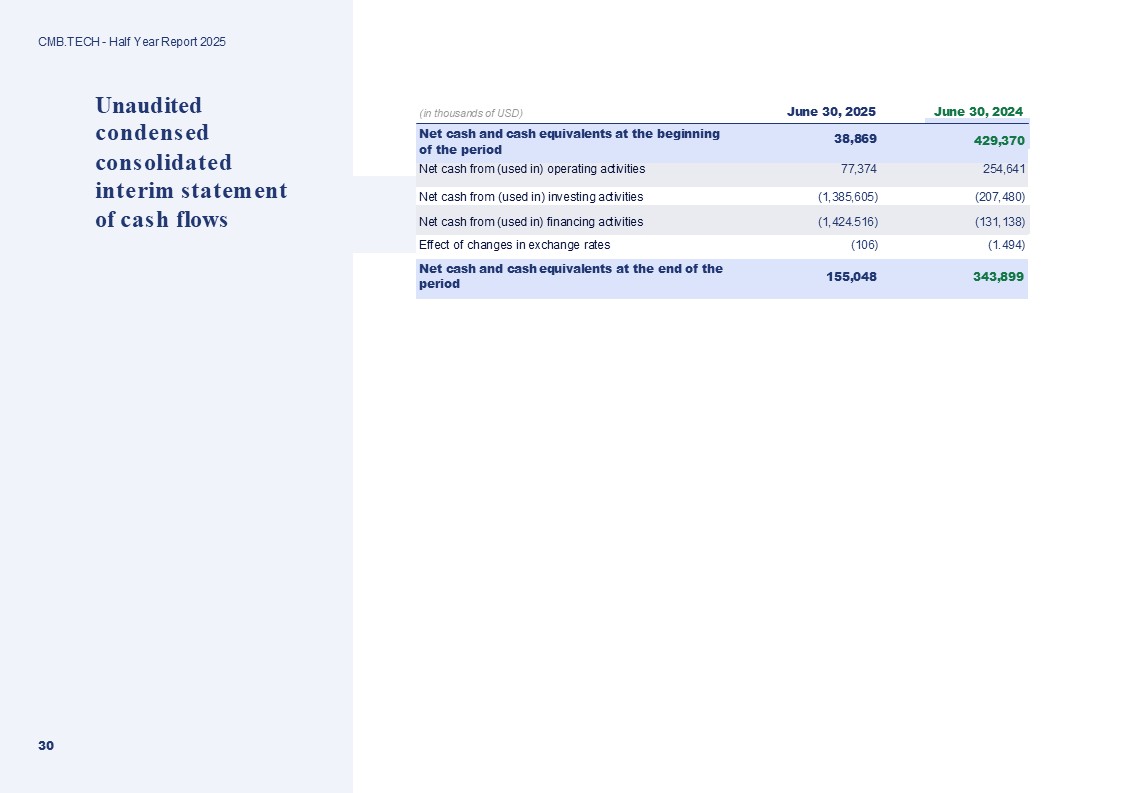
Net cash from (used in) operating activities
|
77,374
|
254,641
|
||||
|
Acquisition of vessels and vessels under construction
|
(547,113)
|
(444,570)
|
||||
|
Proceeds from the sale of vessels
|
262,974
|
1,511,765
|
||||
|
Acquisition of other tangible assets
|
(828)
|
(3,077)
|
||||
|
Acquisition of intangible assets
|
(1,343)
|
(386)
|
||||
|
Proceeds from the sale of other (in)tangible assets
|
—
|
2,000
|
||||
|
Net cash on deconsolidation / sale of subsidiaries
|
—
|
822
|
||||
|
Investments in other companies
|
—
|
(45,000)
|
||||
|
Loans from (to) related parties
|
(1,331)
|
—
|
||||
|
Acquisition of a subsidiary, net of cash acquired
|
(1,098,897)
|
(1,149,886)
|
||||
|
Repayment of loans from related parties
|
—
|
(79,930)
|
||||
|
Lease payments received from finance leases
|
933
|
782
|
||||
|
Net cash from (used in) investing activities
|
(1,385,605)
|
(207,480)
|
||||
|
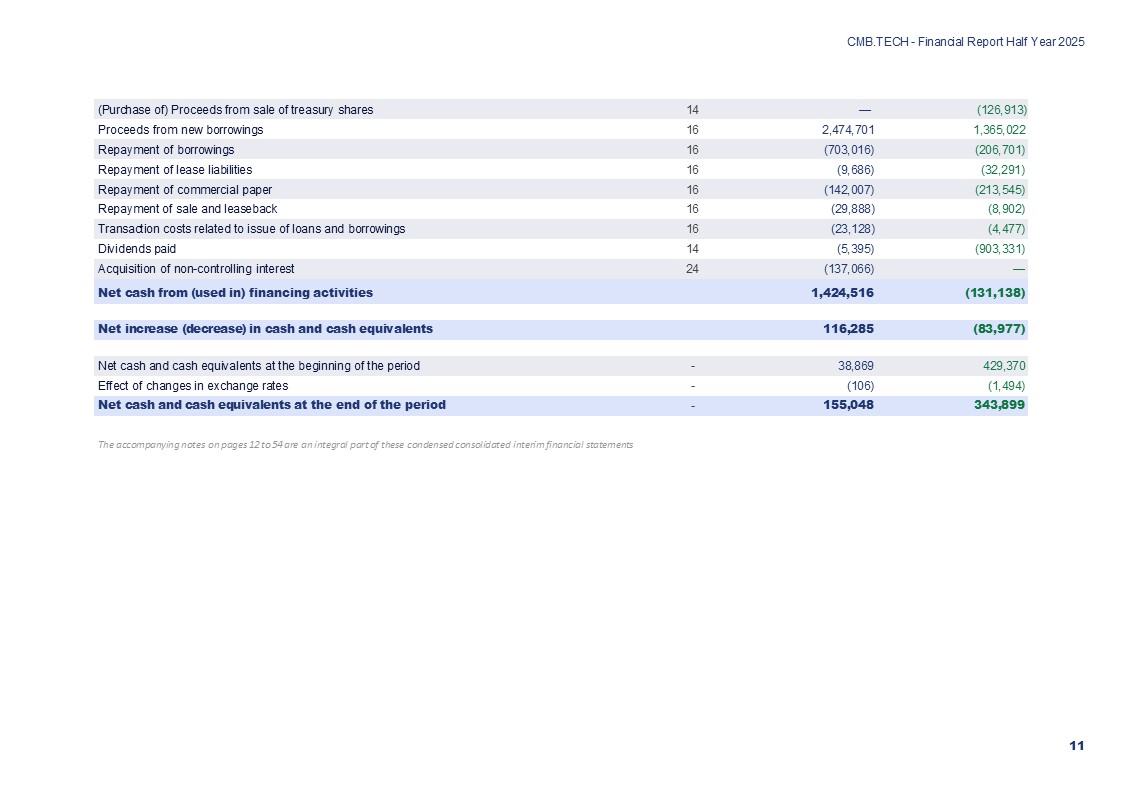
(Purchase of) Proceeds from sale of treasury shares
|
—
|
(126,913)
|
||||
|
Proceeds from new borrowings
|
2,474,701
|
1,365,022
|
||||
|
Repayment of borrowings
|
(703,016)
|
(206,701)
|
||||
|
Repayment of lease liabilities
|
(9,686)
|
(32,291)
|
||||
|
Repayment of commercial paper
|
(142,007)
|
(213,545)
|
||||
|
Repayment of sale and leaseback
|
(29,888)
|
(8,902)
|
||||
|
Transaction costs related to issue of loans and borrowings
|
(23,128)
|
(4,477)
|
||||
|
Dividends paid
|
(5,395)
|
(903,331)
|
||||
|
Acquisition of non-controlling interest
|
(137,066)
|
—
|
||||
|
Net cash from (used in) financing activities
|
1,424,516
|
(131,138)
|
||||
|
Net increase (decrease) in cash and cash equivalents
|
116,285
|
(83,977)
|
||||
|
Net cash and cash equivalents at the beginning of the period
|
38,869
|
429,370
|
||||
|
Effect of changes in exchange rates
|
(106)
|
(1,494)
|
||||
|
Net cash and cash equivalents at the end of the period
|
155,048
|
343,899
|
||||
|
CMB.TECH
|
||||||
|
Head of Marketing &
Communications
Katrien Hennin
|
Tel: +32 499393470
katrien.hennin@cmb.tech
|
Head of Investor
Relations
Joris Daman
|
Tel: +32 498617111
joris.daman@cmb.tech
|
|||