Document
Exhibit 99.1
FOR IMMEDIATE RELEASE 
July 30, 2026
Darling Ingredients Inc. Reports Second Quarter 2026 Results
•Net income of $387.3 million, or $2.41 per GAAP diluted share, compared to net income of $12.7 million, or $0.08 per GAAP diluted share for the second quarter 2025
•Total net sales were $1.7 billion, compared to $1.5 billion for second quarter 2025
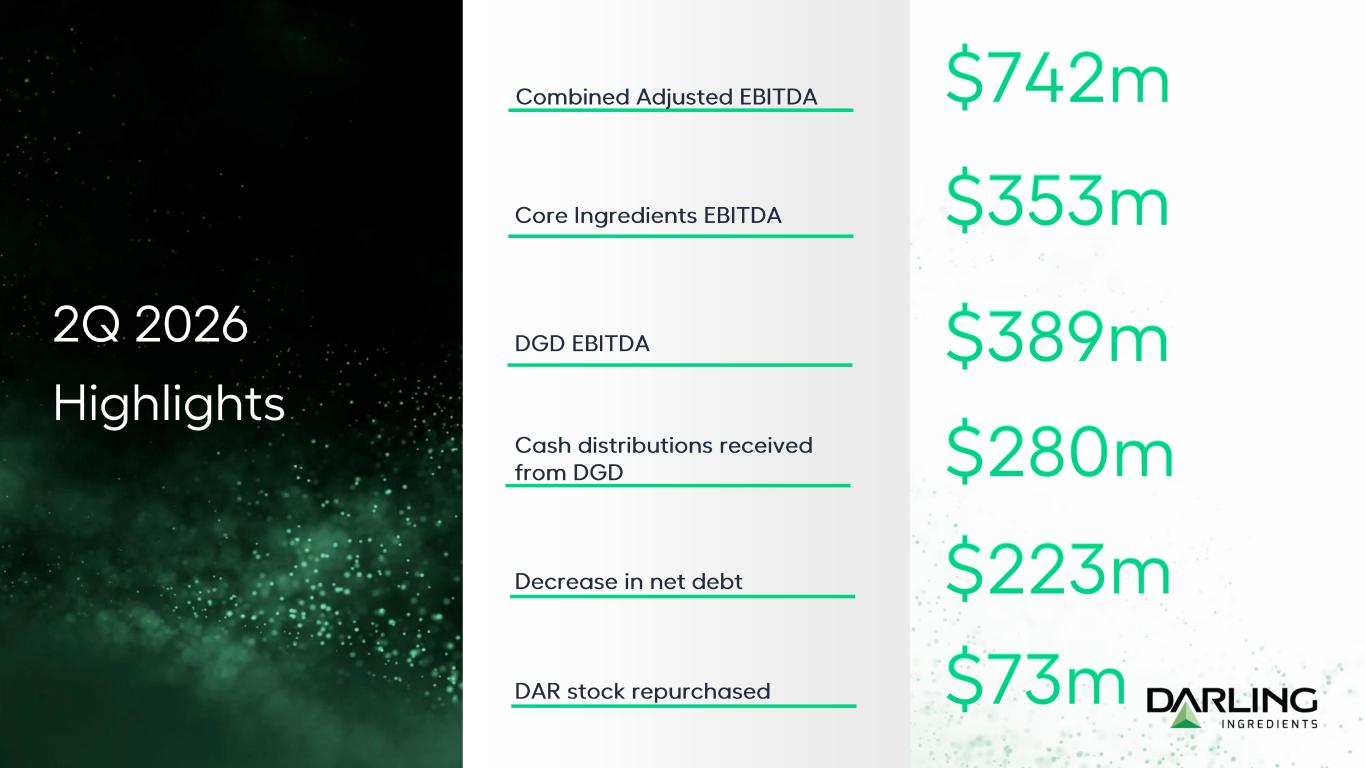
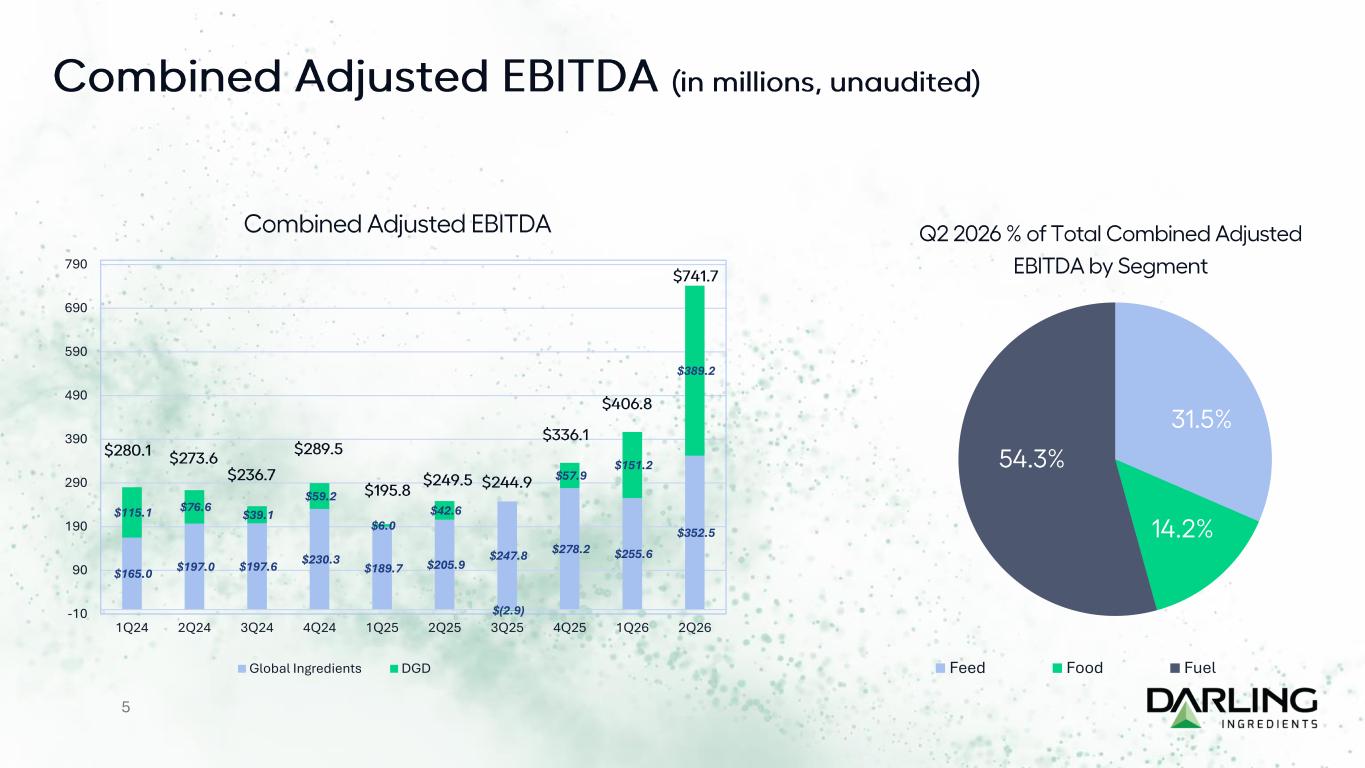
•Combined Adjusted EBITDA was $741.7 million, compared to $249.5 million for second quarter 2025
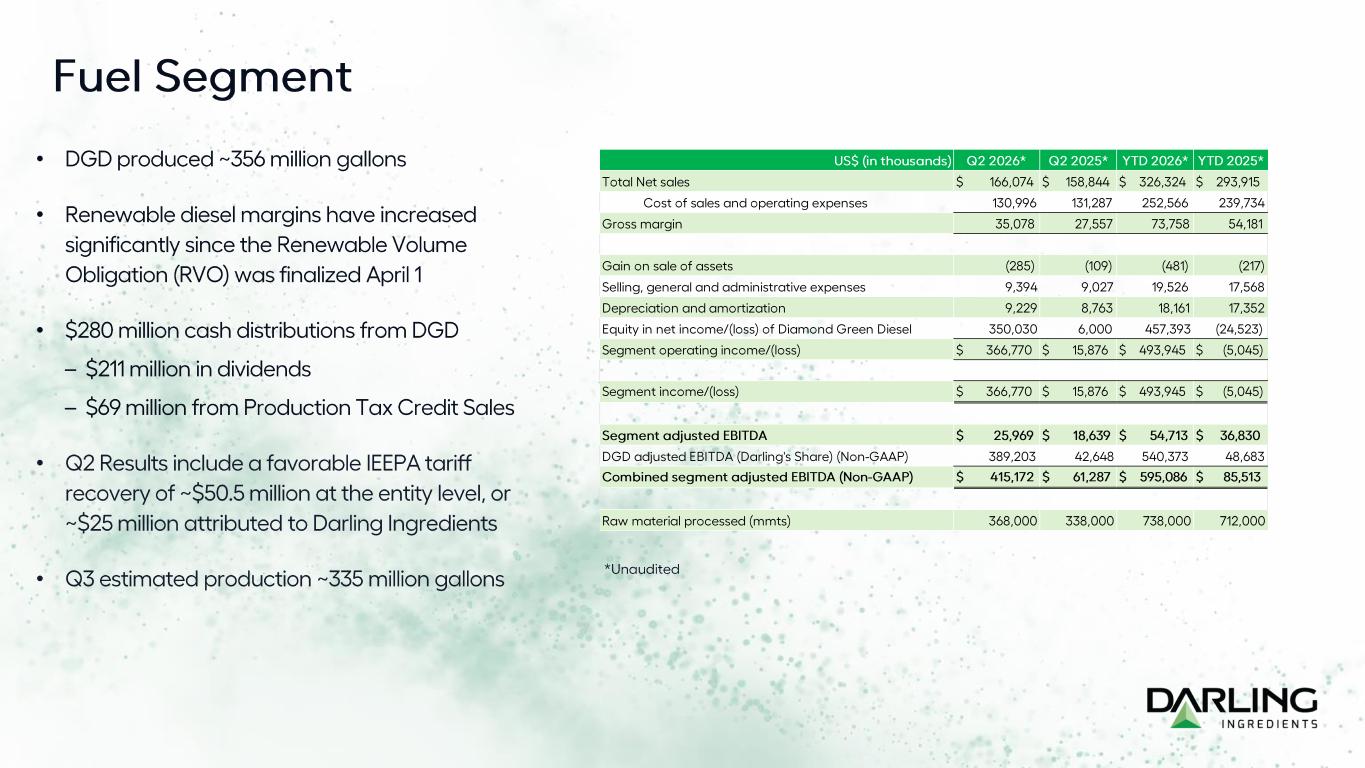
•Received $280.0 million in cash distributions from Diamond Green Diesel
•Reduced net debt by $223.0 million
•Repurchased $73.0 million in common stock
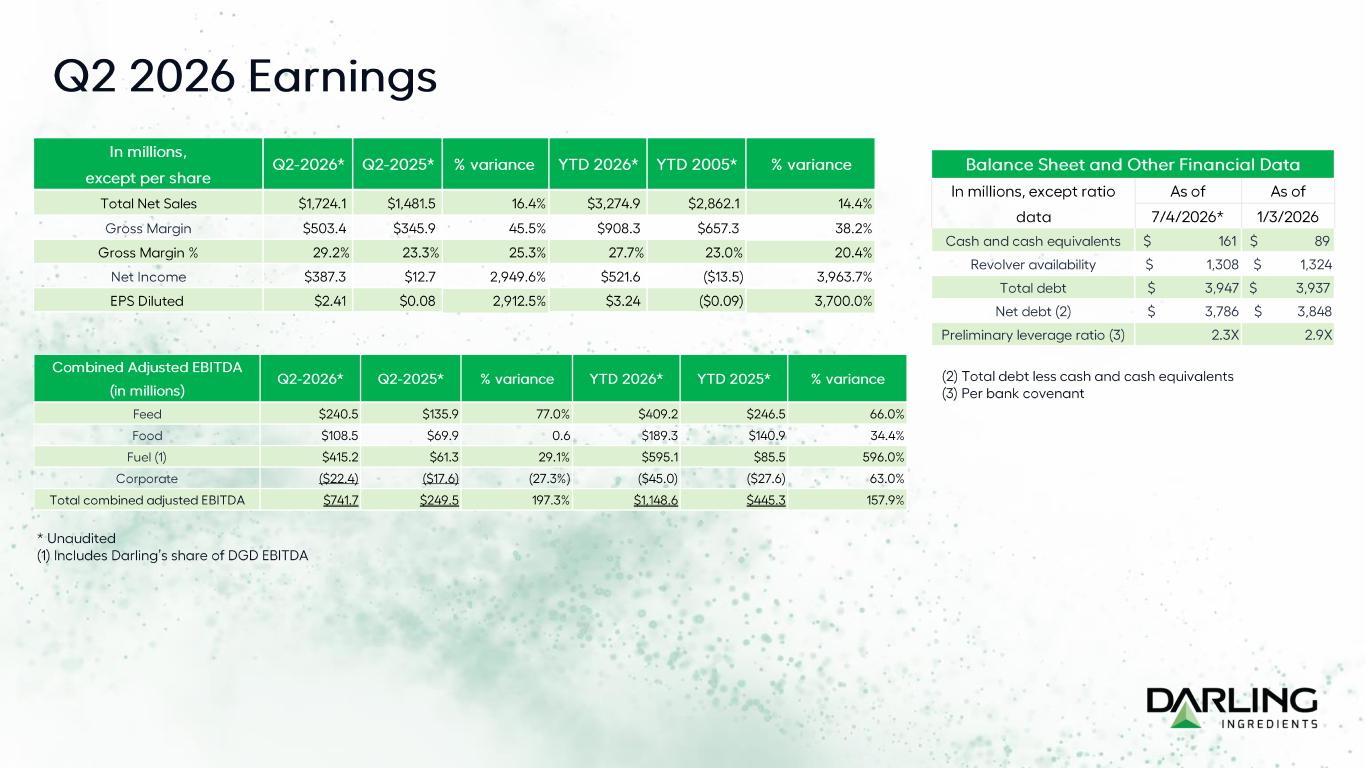
IRVING, TEXAS - Darling Ingredients Inc. (NYSE: DAR) today reported net income of $387.3 million or $2.41 per GAAP diluted share for the second quarter of 2026, compared to net income of $12.7 million, or $0.08 per GAAP diluted share, for the second quarter of 2025. The company also reported total net sales of $1.7 billion for the second quarter of 2026, compared with total net sales of $1.5 billion for the same period a year ago.
“Momentum continues to build across our business, which is reflected in our strong second quarter performance,” said Randall C. Stuewe, Chairman and Chief Executive Officer. “We stayed focused on the things we can control, including strong operational execution and margin management, which enabled us to generate strong cash flow, pay down debt, repurchase shares and further strengthen our financial position.”
For the six months ended July 4, 2026, Darling Ingredients reported net income of $521.6 million, or $3.24 per GAAP diluted share, compared to a net loss of $13.5 million, or ($0.09) per GAAP diluted share for the same period a year ago. Net sales for the first six months of 2026 were $3.3 billion, compared to $2.9 billion for the same period in 2025.
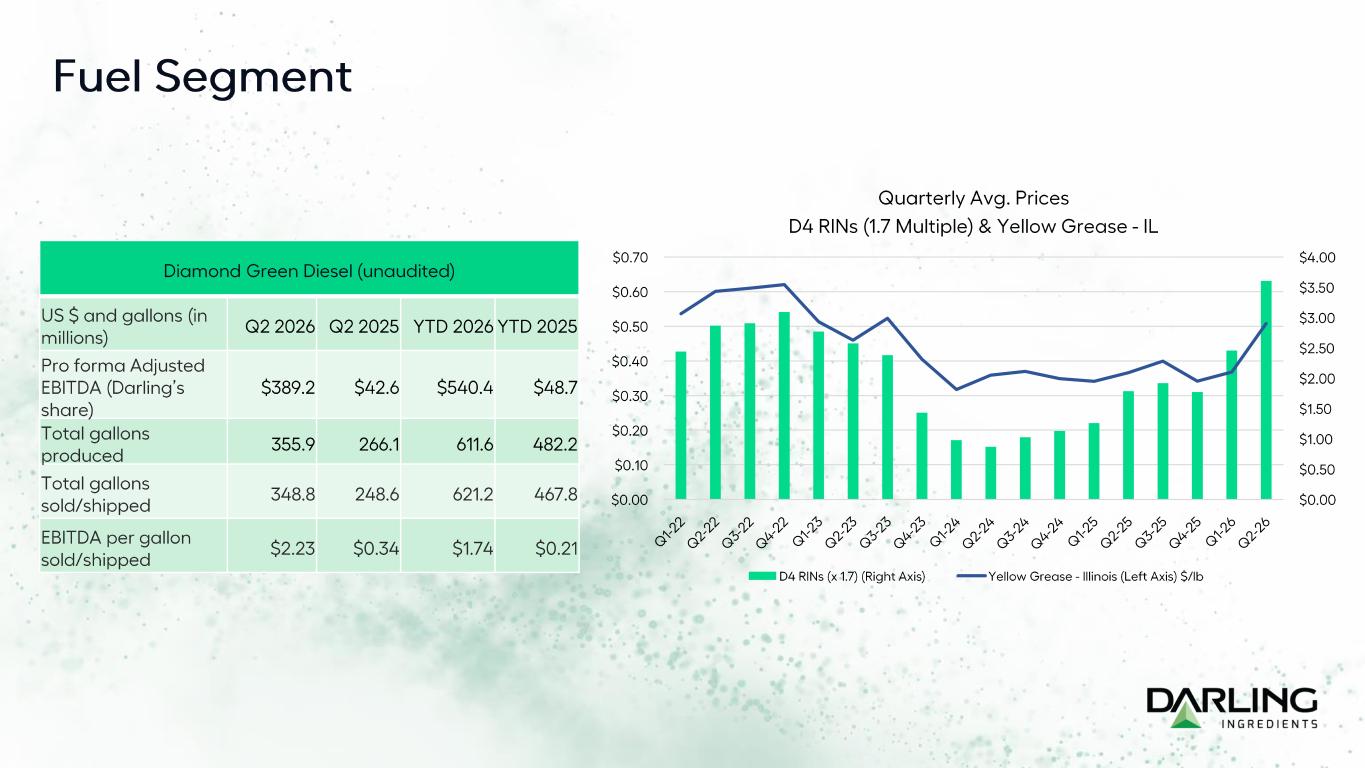
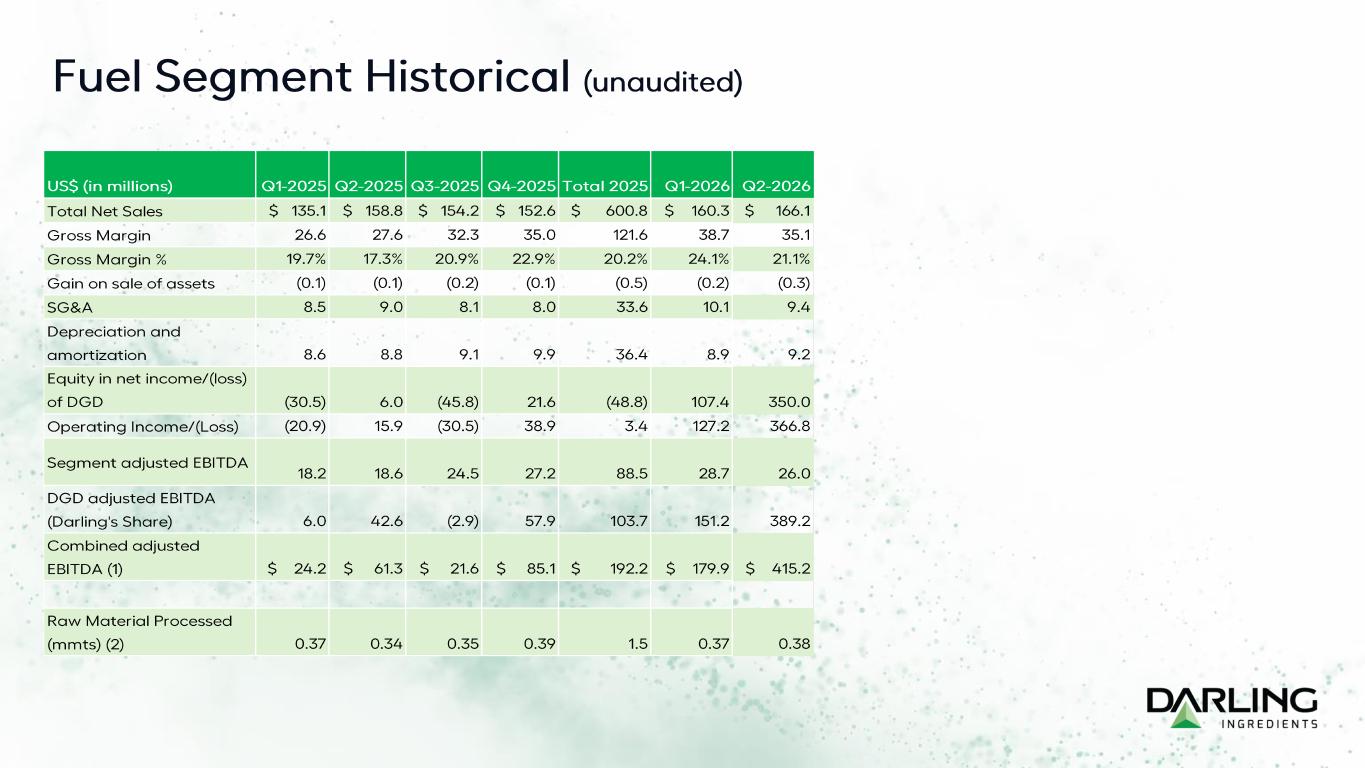
For the three months ended June 30, 2026, Diamond Green Diesel (DGD) sold 348.8 million gallons of renewable fuels at an average of $2.23 per gallon EBITDA. For the first six months of 2026, DGD sold 621.2 million gallons of renewable fuels at an average of $1.74 per gallon EBITDA. The company received approximately $211 million in dividends and approximately $69 million from Production Tax Credit sales from DGD.
Combined Adjusted EBITDA for the second quarter of 2026 was $741.7 million, compared to $249.5 million for the same period in 2025. For the first six months ending July 4, 2026, combined adjusted EBITDA was $1.15 billion, compared to $445.3 million for the same period in 2025.
As of July 4, 2026, Darling Ingredients had $160.7 million in cash and cash equivalents, and $1.3 billion available under its committed revolving credit agreement. Total debt outstanding as of July 4, 2026, was $3.9 billion. The preliminary leverage ratio as measured by the company’s bank covenant was 2.3X as of July 4, 2026. Capital expenditures were approximately $224.0 million year-to-date 2026. The company estimates capital expenditures to be approximately $450.0 million for fiscal year 2026.
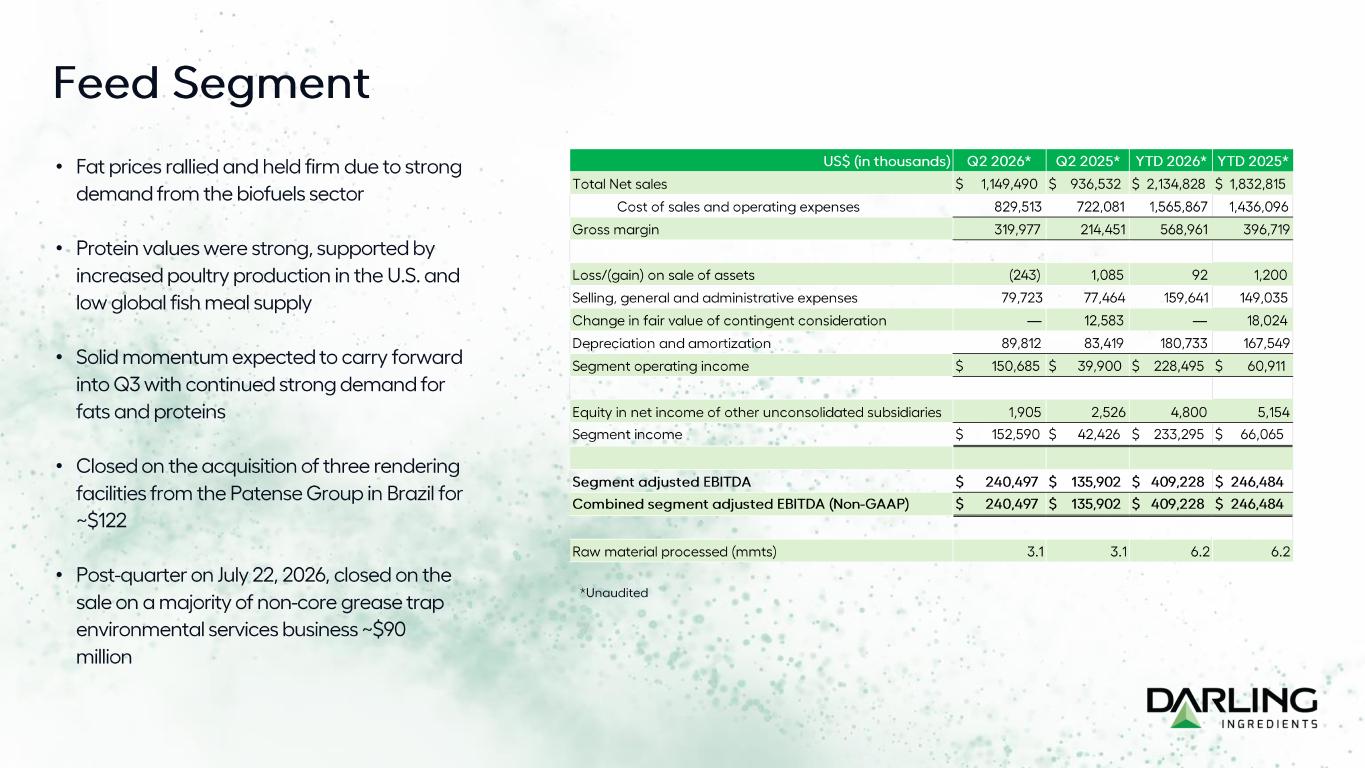
During the quarter, the company closed on the acquisition of three rendering facilities from the Patense Group in Brazil for approximately $122 million. On July 22, 2026, the company closed on the sale of a majority of its non-core grease trap environmental services business for approximately $90.0 million to Waste Resource Management.
“Importantly, we believe the opportunities we outlined at Investor Day remain ahead of us, and our second-quarter performance demonstrates meaningful progress toward capturing that value. We feel very good about the balance of 2026 and the outlook for 2027. The fundamentals of our business remain strong, and we are well positioned to deliver continued earnings growth, cash generation and value for our shareholders,” Stuewe said.
The company expects to continue to deleverage and anticipates ending fiscal year 2026 with net debt at or below $3 billion and bank leverage ratio below 2X.
As previously announced, Darling Ingredients will provide financial guidance exclusively for its core ingredients business (all segments excluding DGD). For third quarter 2026, the company estimates core ingredients business Adjusted EBITDA to be approximately $325-340 million.
Darling Ingredients Inc. and Subsidiaries
Consolidated Statements of Operations
For the Three and Six Months Ended July 4, 2026 and June 28, 2025
(in thousands, except per share data, unaudited)
|
|
|
|
|
|
|
|
|
|
|
|
|
|
|
|
|
|
|
|
|
|
|
|
|
|
|
|
|
|
|
|
|
|
|
|
|
|
|
|
|
Three Months Ended |
|
Six Months Ended |
|
|
|
$ Change |
|
|
|
$ Change |
|
July 4, |
|
June 28, |
|
Favorable |
|
July 4, |
|
June 28, |
|
Favorable |
|
2026 |
|
2025 |
|
(Unfavorable) |
|
2026 |
|
2025 |
|
(Unfavorable) |
| Net sales to third parties |
$ |
1,310,614 |
|
|
$ |
1,189,988 |
|
|
$ |
120,626 |
|
|
$ |
2,612,753 |
|
|
$ |
2,352,630 |
|
|
$ |
260,123 |
|
| Net sales to related party - Diamond Green Diesel |
413,464 |
|
|
291,530 |
|
|
121,934 |
|
|
662,146 |
|
|
509,482 |
|
|
152,664 |
|
| Total net sales |
1,724,078 |
|
|
1,481,518 |
|
|
242,560 |
|
|
3,274,899 |
|
|
2,862,112 |
|
|
412,787 |
|
| Costs and expenses: |
|
|
|
|
|
|
|
|
|
|
|
| Cost of sales and operating expenses (excludes depreciation and amortization, shown separately below) |
1,220,705 |
|
|
1,135,601 |
|
|
(85,104) |
|
|
2,366,605 |
|
|
2,204,844 |
|
|
(161,761) |
|
| (Gain)/loss on sale of assets |
(116) |
|
|
952 |
|
|
1,068 |
|
|
87 |
|
|
1,014 |
|
|
927 |
|
| Selling, general and administrative expenses |
150,950 |
|
|
138,069 |
|
|
(12,881) |
|
|
300,017 |
|
|
259,625 |
|
|
(40,392) |
|
| Restructuring and asset impairment charges |
3,933 |
|
|
— |
|
|
(3,933) |
|
|
4,297 |
|
|
— |
|
|
(4,297) |
|
| Acquisition and integration costs |
13,218 |
|
|
3,383 |
|
|
(9,835) |
|
|
18,188 |
|
|
4,917 |
|
|
(13,271) |
|
| Change in fair value of contingent consideration |
— |
|
|
12,583 |
|
|
12,583 |
|
|
— |
|
|
18,024 |
|
|
18,024 |
|
| Depreciation and amortization |
130,180 |
|
|
121,062 |
|
|
(9,118) |
|
|
261,089 |
|
|
244,897 |
|
|
(16,192) |
|
| Total costs and expenses |
1,518,870 |
|
|
1,411,650 |
|
|
(107,220) |
|
|
2,950,283 |
|
|
2,733,321 |
|
|
(216,962) |
|
| Equity in net income/(loss) of Diamond Green Diesel |
350,030 |
|
|
6,000 |
|
|
344,030 |
|
|
457,393 |
|
|
(24,523) |
|
|
481,916 |
|
| Operating income |
555,238 |
|
|
75,868 |
|
|
479,370 |
|
|
782,009 |
|
|
104,268 |
|
|
677,741 |
|
| Other expense: |
|
|
|
|
|
|
|
|
|
|
|
| Interest expense |
(55,526) |
|
|
(51,873) |
|
|
(3,653) |
|
|
(109,643) |
|
|
(109,840) |
|
|
197 |
|
| Loss on early retirement of debt |
— |
|
|
(2,978) |
|
|
2,978 |
|
|
— |
|
|
(2,978) |
|
|
2,978 |
|
| Foreign currency gain/(loss) |
208 |
|
|
1,313 |
|
|
(1,105) |
|
|
3,351 |
|
|
(49) |
|
|
3,400 |
|
| Other expense, net |
(1,918) |
|
|
(6,526) |
|
|
4,608 |
|
|
(4,928) |
|
|
(3,193) |
|
|
(1,735) |
|
| Total other expense |
(57,236) |
|
|
(60,064) |
|
|
2,828 |
|
|
(111,220) |
|
|
(116,060) |
|
|
4,840 |
|
|
|
|
|
|
|
|
|
|
|
|
|
| Equity in net income of other unconsolidated subsidiaries |
1,905 |
|
|
2,526 |
|
|
(621) |
|
|
4,800 |
|
|
5,154 |
|
|
(354) |
|
| Income/(loss) from operations before income taxes |
499,907 |
|
|
18,330 |
|
|
481,577 |
|
|
675,589 |
|
|
(6,638) |
|
|
682,227 |
|
| Income tax expense |
110,638 |
|
|
4,065 |
|
|
(106,573) |
|
|
149,264 |
|
|
2,911 |
|
|
(146,353) |
|
| Net income/(loss) |
389,269 |
|
|
14,265 |
|
|
375,004 |
|
|
526,325 |
|
|
(9,549) |
|
|
535,874 |
|
|
|
|
|
|
|
|
|
|
|
|
|
| Net income attributable to noncontrolling interests |
(1,957) |
|
|
(1,604) |
|
|
(353) |
|
|
(4,700) |
|
|
(3,950) |
|
|
(750) |
|
| Net income/(loss) attributable to Darling |
$ |
387,312 |
|
|
$ |
12,661 |
|
|
$ |
374,651 |
|
|
$ |
521,625 |
|
|
$ |
(13,499) |
|
|
$ |
535,124 |
|
|
|
|
|
|
|
|
|
|
|
|
|
| Basic income/(loss) per share: |
$ |
2.44 |
|
|
$ |
0.08 |
|
|
$ |
2.36 |
|
|
$ |
3.29 |
|
|
$ |
(0.09) |
|
|
$ |
3.38 |
|
| Diluted income/(loss) per share: |
$ |
2.41 |
|
|
$ |
0.08 |
|
|
$ |
2.33 |
|
|
$ |
3.24 |
|
|
$ |
(0.09) |
|
|
$ |
3.33 |
|
|
|
|
|
|
|
|
|
|
|
|
|
| Number of diluted common shares: |
160,627 |
|
|
159,734 |
|
|
|
|
160,830 |
|
|
158,436 |
|
|
|
Segment Financial Tables (in thousands, unaudited)
|
|
|
|
|
|
|
|
|
|
|
|
|
|
|
|
|
|
|
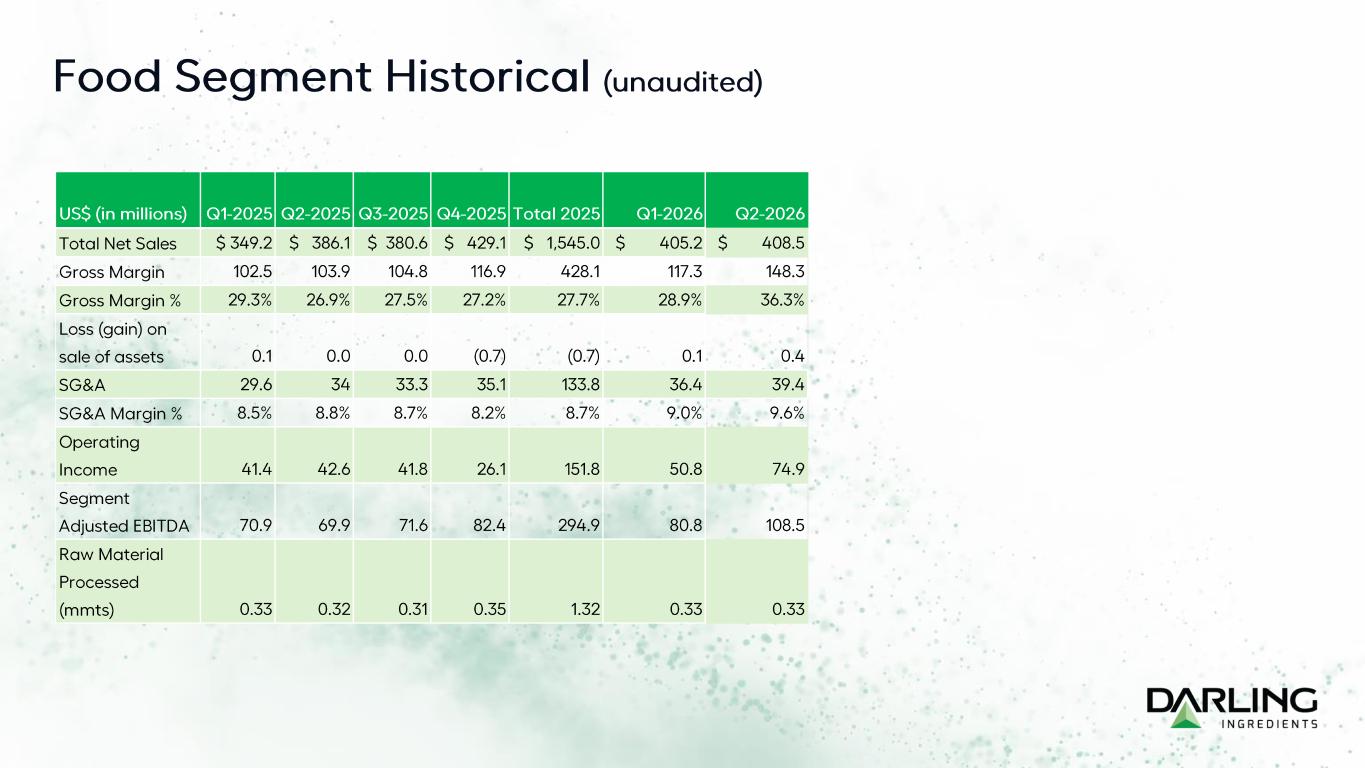
Feed Ingredients |
Food Ingredients |
Fuel Ingredients |
Corporate |
Total |
| Three Months Ended July 4, 2026 |
|
|
|
|
|
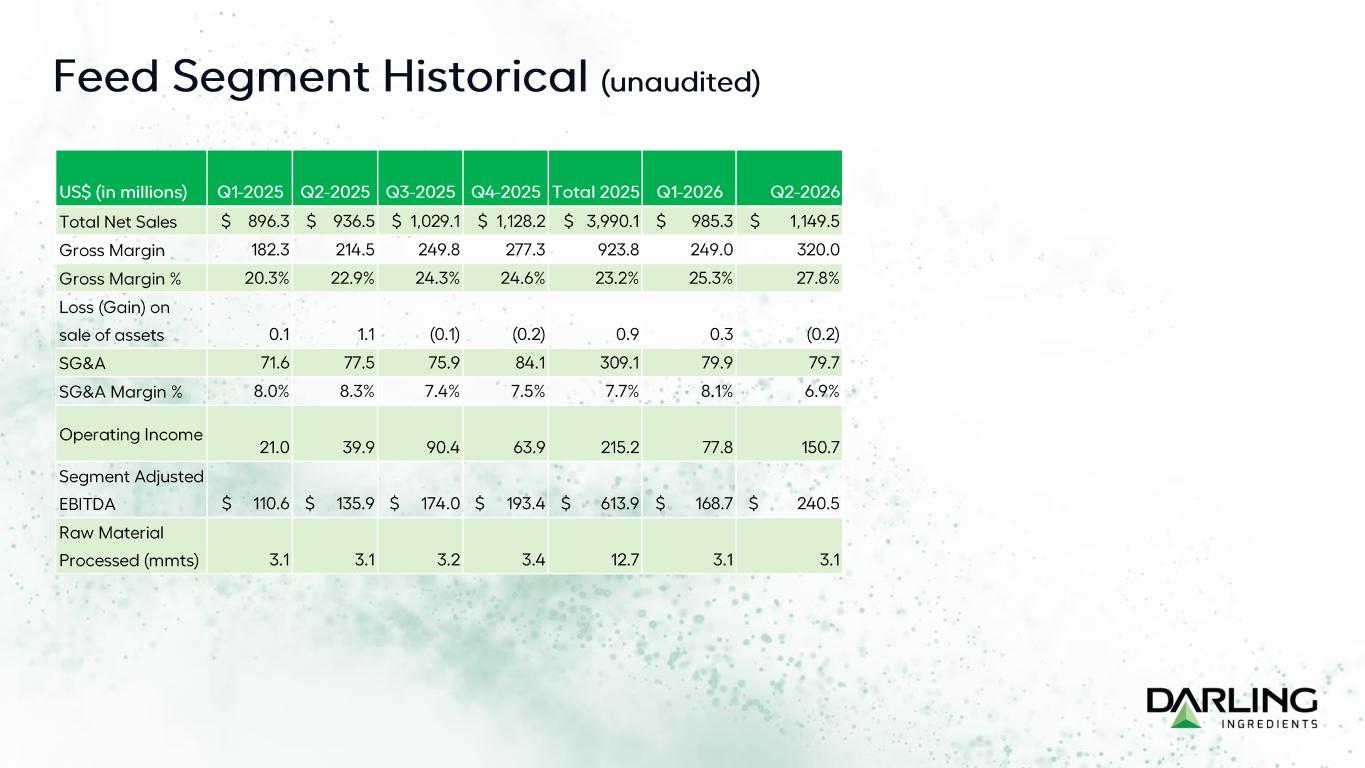
| Total net sales |
$ |
1,149,490 |
|
$ |
408,514 |
|
$ |
166,074 |
|
$ |
— |
|
$ |
1,724,078 |
|
| Cost of sales and operating expenses |
829,513 |
|
260,196 |
|
130,996 |
|
— |
|
1,220,705 |
|
| Gross margin |
319,977 |
|
148,318 |
|
35,078 |
|
— |
|
503,373 |
|
|
|
|
|
|
|
| Loss/(gain) on sale of assets |
(243) |
|
412 |
|
(285) |
|
— |
|
(116) |
|
| Selling, general and administrative expenses |
79,723 |
|
39,426 |
|
9,394 |
|
22,407 |
|
150,950 |
|
| Restructuring and asset impairment charges |
— |
|
3,933 |
|
— |
|
— |
|
3,933 |
|
| Acquisition and integration costs |
— |
|
— |
|
— |
|
13,218 |
|
13,218 |
|
|
|
|
|
|
|
| Depreciation and amortization |
89,812 |
|
29,635 |
|
9,229 |
|
1,504 |
|
130,180 |
|
| Equity in net income of Diamond Green Diesel |
— |
|
— |
|
350,030 |
|
— |
|
350,030 |
|
| Segment operating income/(loss) |
$ |
150,685 |
|
$ |
74,912 |
|
$ |
366,770 |
|
$ |
(37,129) |
|
$ |
555,238 |
|
| Equity in net income of other unconsolidated subsidiaries |
1,905 |
|
— |
|
— |
|
— |
|
1,905 |
|
| Segment income/(loss) |
152,590 |
|
74,912 |
|
366,770 |
|
(37,129) |
|
557,143 |
|
|
|
|
|
|
— |
|
| Segment Adjusted EBITDA (Non-GAAP) |
$ |
240,497
|
|
$ |
108,480
|
|
$ |
25,969
|
|
$ |
(22,407) |
|
$ |
352,539
|
|
| DGD Adjusted EBITDA (Darling's Share) (Non-GAAP) |
— |
|
— |
|
389,203 |
|
— |
|
389,203 |
|
| Combined Adjusted EBITDA (Non-GAAP) |
$ |
240,497
|
|
$ |
108,480
|
|
$ |
415,172
|
|
$ |
(22,407) |
|
$ |
741,742
|
|
|
|
|
|
|
|
|
|
|
|
|
|
| Reconciliation of Net Income/(Loss) to (Non-GAAP) Segment Adjusted EBITDA and (Non-GAAP) Combined Adjusted EBITDA: |
| Net income/(loss) attributable to Darling |
$ |
152,590 |
|
$ |
74,912 |
|
$ |
366,770 |
|
$ |
(206,960) |
|
$ |
387,312 |
|
| Net income attributable to noncontrolling interests |
— |
|
— |
|
— |
|
1,957 |
|
1,957 |
|
| Income tax expense |
— |
|
— |
|
— |
|
110,638 |
|
110,638 |
|
| Interest expense |
— |
|
— |
|
— |
|
55,526 |
|
55,526 |
|
|
|
|
|
|
|
| Foreign currency gain |
— |
|
— |
|
— |
|
(208) |
|
(208) |
|
| Other expense, net |
— |
|
— |
|
— |
|
1,918 |
|
1,918 |
|
| Segment income/(loss) |
$ |
152,590 |
|
$ |
74,912 |
|
$ |
366,770 |
|
$ |
(37,129) |
|
$ |
557,143 |
|
| Restructuring and asset impairment charges |
— |
|
3,933 |
|
— |
|
— |
|
3,933 |
|
| Acquisition and integration costs |
— |
|
— |
|
— |
|
13,218 |
|
13,218 |
|
|
|
|
|
|
|
| Depreciation and amortization |
89,812 |
|
29,635 |
|
9,229 |
|
1,504 |
|
130,180 |
|
| Equity in net income of Diamond Green Diesel |
— |
|
— |
|
(350,030) |
|
— |
|
(350,030) |
|
| Equity in net income of other unconsolidated subsidiaries |
(1,905) |
|
— |
|
— |
|
— |
|
(1,905) |
|
| Segment Adjusted EBITDA (Non-GAAP) |
$ |
240,497
|
|
$ |
108,480
|
|
$ |
25,969
|
|
$ |
(22,407) |
|
$ |
352,539
|
|
| DGD Adjusted EBITDA (Darling's Share) (Non-GAAP) * |
— |
|
— |
|
389,203 |
|
— |
|
389,203 |
|
| Combined Adjusted EBITDA (Non-GAAP) |
$ |
240,497
|
|
$ |
108,480
|
|
$ |
415,172
|
|
$ |
(22,407) |
|
$ |
741,742
|
|
|
|
|
|
|
|
| *See reconciliation of DGD Net Income/(Loss) to (Non-GAAP) DGD Adjusted EBITDA below the DGD Consolidated Statements of Operations |
|
|
|
|
|
|
|
|
|
|
|
|
|
|
|
|
|
|
|
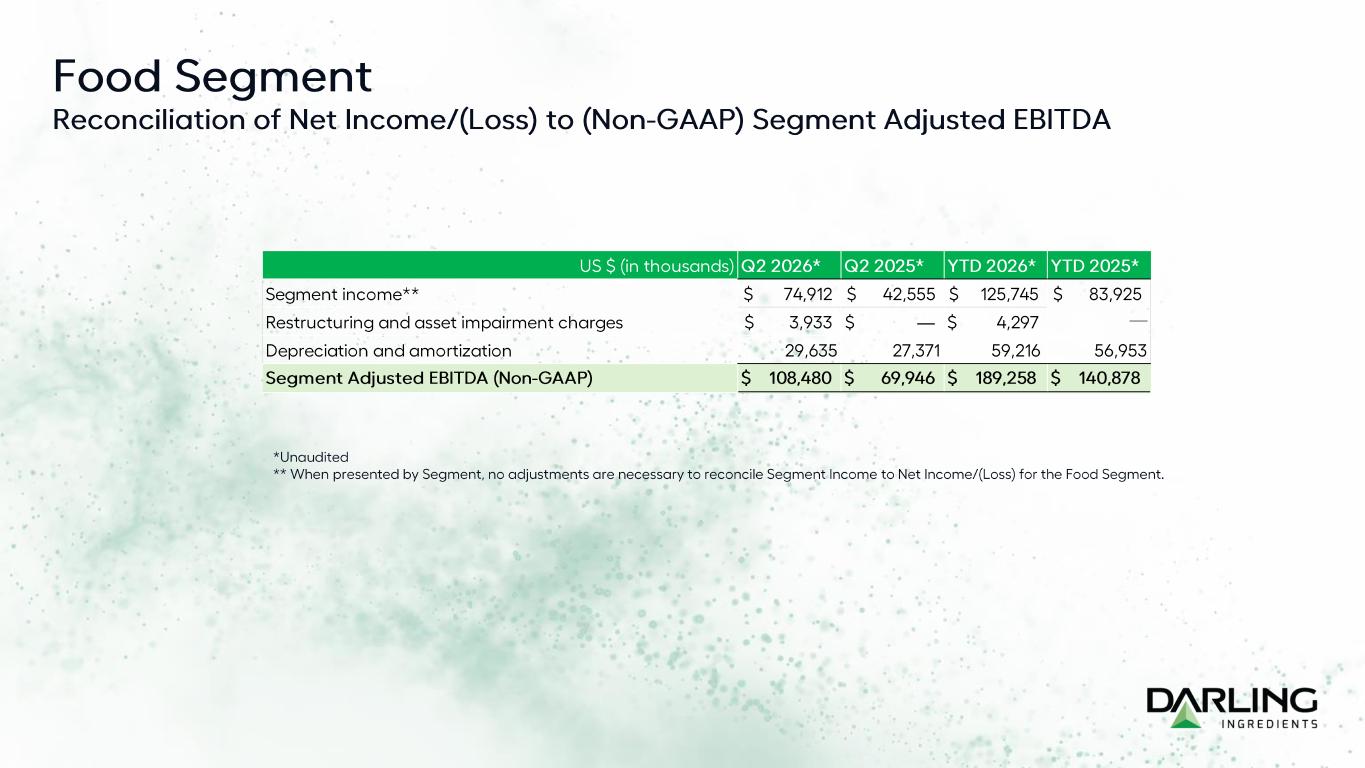
Feed Ingredients |
Food Ingredients |
Fuel Ingredients |
Corporate |
Total |
| Three Months Ended June 28, 2025 |
|
|
|
|
|
| Total net sales |
$ |
936,532 |
|
$ |
386,142 |
|
$ |
158,844 |
|
$ |
— |
|
$ |
1,481,518 |
|
| Cost of sales and operating expenses |
722,081 |
|
282,233 |
|
131,287 |
|
— |
|
1,135,601 |
|
| Gross margin |
214,451 |
|
103,909 |
|
27,557 |
|
— |
|
345,917 |
|
|
|
|
|
|
|
| Loss (gain) on sale of assets |
1,085 |
|
(24) |
|
(109) |
|
— |
|
952 |
|
| Selling, general and administrative expenses |
77,464 |
|
33,987 |
|
9,027 |
|
17,591 |
|
138,069 |
|
|
|
|
|
|
|
| Acquisition and integration costs |
— |
|
— |
|
— |
|
3,383 |
|
3,383 |
|
| Change in fair value of contingent consideration |
12,583 |
|
— |
|
— |
|
— |
|
12,583 |
|
| Depreciation and amortization |
83,419 |
|
27,391 |
|
8,763 |
|
1,489 |
|
121,062 |
|
| Equity in net income of Diamond Green Diesel |
— |
|
— |
|
6,000 |
|
— |
|
6,000 |
|
| Segment operating income/(loss) |
$ |
39,900 |
|
$ |
42,555 |
|
$ |
15,876 |
|
$ |
(22,463) |
|
$ |
75,868 |
|
| Equity in net income of other unconsolidated subsidiaries |
2,526 |
|
— |
|
— |
|
— |
|
2,526 |
|
| Segment income/(loss) |
42,426 |
|
42,555 |
|
15,876 |
|
(22,463) |
|
78,394 |
|
| Segment Adjusted EBITDA (Non-GAAP) |
$ |
135,902
|
|
$ |
69,946
|
|
$ |
18,639
|
|
$ |
(17,591) |
|
$ |
206,896
|
|
| DGD Adjusted EBITDA (Darling's Share) (Non-GAAP) |
— |
|
— |
|
42,648 |
|
— |
|
$ |
42,648 |
|
| Combined Adjusted EBITDA (Non-GAAP) |
$ |
135,902
|
|
$ |
69,946
|
|
$ |
61,287
|
|
$ |
(17,591) |
|
$ |
249,544
|
|
|
|
|
|
|
|
|
|
|
|
|
|
| Reconciliation of Net Income/(Loss) to (Non-GAAP) Segment Adjusted EBITDA and (Non-GAAP) Combined Adjusted EBITDA: |
| Net income/(loss) attributable to Darling |
$ |
42,426 |
|
$ |
42,555 |
|
$ |
15,876 |
|
$ |
(88,196) |
|
$ |
12,661 |
|
| Net income attributable to noncontrolling interests |
— |
|
— |
|
— |
|
1,604 |
|
1,604 |
|
| Income tax expense |
— |
|
— |
|
— |
|
4,065 |
|
4,065 |
|
| Interest expense |
— |
|
— |
|
— |
|
51,873 |
|
51,873 |
|
| Loss on early retirement of debt |
— |
|
— |
|
— |
|
2,978 |
|
2,978 |
|
| Foreign currency gain |
— |
|
— |
|
— |
|
(1,313) |
|
(1,313) |
|
| Other expense, net |
— |
|
— |
|
— |
|
6,526 |
|
6,526 |
|
| Segment income/(loss) |
$ |
42,426 |
|
$ |
42,555 |
|
$ |
15,876 |
|
$ |
(22,463) |
|
$ |
78,394 |
|
| Acquisition and integration costs |
— |
|
— |
|
— |
|
3,383 |
|
3,383 |
|
| Change in fair value of contingent consideration |
12,583 |
|
— |
|
— |
|
— |
|
12,583 |
|
| Depreciation and amortization |
83,419 |
|
27,391 |
|
8,763 |
|
1,489 |
|
121,062 |
|
| Equity in net income of Diamond Green Diesel |
— |
|
— |
|
(6,000) |
|
— |
|
(6,000) |
|
| Equity in net income of other unconsolidated subsidiaries |
(2,526) |
|
— |
|
— |
|
— |
|
(2,526) |
|
| Segment Adjusted EBITDA (Non-GAAP) |
$ |
135,902
|
|
$ |
69,946
|
|
$ |
18,639
|
|
$ |
(17,591) |
|
$ |
206,896
|
|
| DGD Adjusted EBITDA (Darling's Share) (Non-GAAP) * |
— |
|
— |
|
42,648 |
|
— |
|
42,648 |
|
| Combined Adjusted EBITDA (Non-GAAP) |
$ |
135,902
|
|
$ |
69,946
|
|
$ |
61,287
|
|
$ |
(17,591) |
|
$ |
249,544
|
|
|
|
|
|
|
|
| *See reconciliation of DGD Net Income/(Loss) to (Non-GAAP) DGD Adjusted EBITDA below the DGD Consolidated Statements of Operations |
|
|
|
|
|
|
|
|
|
|
|
|
|
|
|
|
|
|
|
Feed Ingredients |
Food Ingredients |
Fuel Ingredients |
Corporate |
Total |
| Six Months Ended July 4, 2026 |
|
|
|
|
|
| Total net sales |
$ |
2,134,828 |
|
$ |
813,747 |
|
$ |
326,324 |
|
$ |
— |
|
$ |
3,274,899 |
|
| Cost of sales and operating expenses |
1,565,867 |
|
548,172 |
|
252,566 |
|
— |
|
2,366,605 |
|
| Gross margin |
568,961 |
|
265,575 |
|
73,758 |
|
— |
|
908,294 |
|
|
|
|
|
|
|
| Loss/(gain) on sale of assets |
92 |
|
476 |
|
(481) |
|
— |
|
87 |
|
| Selling, general and administrative expenses |
159,641 |
|
75,841 |
|
19,526 |
|
45,009 |
|
300,017 |
|
| Restructuring and asset impairment charges |
— |
|
4,297 |
|
— |
|
— |
|
4,297 |
|
| Acquisition and integration costs |
— |
|
— |
|
— |
|
18,188 |
|
18,188 |
|
|
|
|
|
|
|
| Depreciation and amortization |
180,733 |
|
59,216 |
|
18,161 |
|
2,979 |
|
261,089 |
|
| Equity in net income of Diamond Green Diesel |
— |
|
— |
|
457,393 |
|
— |
|
457,393 |
|
| Segment operating income/(loss) |
$ |
228,495 |
|
$ |
125,745 |
|
$ |
493,945 |
|
$ |
(66,176) |
|
$ |
782,009 |
|
| Equity in net income of other unconsolidated subsidiaries |
4,800 |
|
— |
|
— |
|
— |
|
4,800 |
|
| Segment income/(loss) |
233,295 |
|
125,745 |
|
493,945 |
|
(66,176) |
|
786,809 |
|
|
|
|
|
|
— |
|
| Segment Adjusted EBITDA (Non-GAAP) |
$ |
409,228
|
|
$ |
189,258
|
|
$ |
54,713
|
|
$ |
(45,009) |
|
$ |
608,190
|
|
| DGD Adjusted EBITDA (Darling's Share) (Non-GAAP) |
— |
|
— |
|
540,373 |
|
— |
|
540,373 |
|
| Combined Adjusted EBITDA (Non-GAAP) |
$ |
409,228
|
|
$ |
189,258
|
|
$ |
595,086
|
|
$ |
(45,009) |
|
$ |
1,148,563
|
|
|
|
|
|
|
|
|
|
|
|
|
|
| Reconciliation of Net Income/(Loss) to (Non-GAAP) Segment Adjusted EBITDA and (Non-GAAP) Combined Adjusted EBITDA: |
| Net income/(loss) attributable to Darling |
$ |
233,295 |
|
$ |
125,745 |
|
$ |
493,945 |
|
$ |
(331,360) |
|
$ |
521,625 |
|
| Net income attributable to noncontrolling interests |
— |
|
— |
|
— |
|
4,700 |
|
4,700 |
|
| Income tax expense |
— |
|
— |
|
— |
|
149,264 |
|
149,264 |
|
| Interest expense |
— |
|
— |
|
— |
|
109,643 |
|
109,643 |
|
|
|
|
|
|
|
| Foreign currency gain |
— |
|
— |
|
— |
|
(3,351) |
|
(3,351) |
|
| Other expense, net |
— |
|
— |
|
— |
|
4,928 |
|
4,928 |
|
| Segment income/(loss) |
$ |
233,295 |
|
$ |
125,745 |
|
$ |
493,945 |
|
$ |
(66,176) |
|
$ |
786,809 |
|
| Restructuring and asset impairment charges |
— |
|
4,297 |
|
— |
|
— |
|
4,297 |
|
| Acquisition and integration costs |
— |
|
— |
|
— |
|
18,188 |
|
18,188 |
|
|
|
|
|
|
|
| Depreciation and amortization |
180,733 |
|
59,216 |
|
18,161 |
|
2,979 |
|
261,089 |
|
| Equity in net income of Diamond Green Diesel |
— |
|
— |
|
(457,393) |
|
— |
|
(457,393) |
|
| Equity in net income of other unconsolidated subsidiaries |
(4,800) |
|
— |
|
— |
|
— |
|
(4,800) |
|
| Segment Adjusted EBITDA (Non-GAAP) |
$ |
409,228
|
|
$ |
189,258
|
|
$ |
54,713
|
|
$ |
(45,009) |
|
$ |
608,190
|
|
| DGD Adjusted EBITDA (Darling's Share) (Non-GAAP) * |
— |
|
— |
|
540,373 |
|
— |
|
540,373 |
|
| Combined Adjusted EBITDA (Non-GAAP) |
$ |
409,228
|
|
$ |
189,258
|
|
$ |
595,086
|
|
$ |
(45,009) |
|
$ |
1,148,563
|
|
|
|
|
|
|
|
| *See reconciliation of DGD Net Income/(Loss) to (Non-GAAP) DGD Adjusted EBITDA below the DGD Consolidated Statements of Operations |
|
|
|
|
|
|
|
|
|
|
|
|
|
|
|
|
|
|
|
Feed Ingredients |
Food Ingredients |
Fuel Ingredients |
Corporate |
Total |
| Six Months Ended June 28, 2025 |
|
|
|
|
|
| Total net sales |
$ |
1,832,815 |
|
$ |
735,382 |
|
$ |
293,915 |
|
$ |
— |
|
$ |
2,862,112 |
|
| Cost of sales and operating expenses |
1,436,096 |
|
529,014 |
|
239,734 |
|
— |
|
2,204,844 |
|
| Gross margin |
396,719 |
|
206,368 |
|
54,181 |
|
— |
|
657,268 |
|
|
|
|
|
|
|
| Loss/(gain) on sale of assets |
1,200 |
|
31 |
|
(217) |
|
— |
|
1,014 |
|
| Selling, general and administrative expenses |
149,035 |
|
65,459 |
|
17,568 |
|
27,563 |
|
259,625 |
|
|
|
|
|
|
|
| Acquisition and integration costs |
— |
|
— |
|
— |
|
4,917 |
|
4,917 |
|
| Change in fair value of contingent consideration |
18,024 |
|
— |
|
— |
|
— |
|
18,024 |
|
| Depreciation and amortization |
167,549 |
|
56,953 |
|
17,352 |
|
3,043 |
|
244,897 |
|
| Equity in net loss of Diamond Green Diesel |
— |
|
— |
|
(24,523) |
|
— |
|
(24,523) |
|
| Segment operating income/(loss) |
$ |
60,911 |
|
$ |
83,925 |
|
$ |
(5,045) |
|
$ |
(35,523) |
|
$ |
104,268 |
|
| Equity in net income of other unconsolidated subsidiaries |
5,154 |
|
— |
|
— |
|
— |
|
5,154 |
|
| Segment income/(loss) |
66,065 |
|
83,925 |
|
(5,045) |
|
(35,523) |
|
109,422 |
|
|
|
|
|
|
— |
|
| Segment Adjusted EBITDA (Non-GAAP) |
$ |
246,484
|
|
$ |
140,878
|
|
$ |
36,830
|
|
$ |
(27,563) |
|
$ |
396,629
|
|
| DGD Adjusted EBITDA (Darling's Share) (Non-GAAP) |
— |
|
— |
|
48,683 |
|
— |
|
48,683 |
|
| Combined Adjusted EBITDA (Non-GAAP) |
$ |
246,484
|
|
$ |
140,878
|
|
$ |
85,513
|
|
$ |
(27,563) |
|
$ |
445,312
|
|
|
|
|
|
|
|
|
|
|
|
|
|
| Reconciliation of Net Income/(Loss) to (Non-GAAP) Segment Adjusted EBITDA and (Non-GAAP) Combined Adjusted EBITDA: |
| Net income/(loss) attributable to Darling |
$ |
66,065 |
|
$ |
83,925 |
|
$ |
(5,045) |
|
$ |
(158,444) |
|
$ |
(13,499) |
|
| Net income attributable to noncontrolling interests |
— |
|
— |
|
— |
|
3,950 |
|
3,950 |
|
| Income tax expense |
— |
|
— |
|
— |
|
2,911 |
|
2,911 |
|
| Interest expense |
— |
|
— |
|
— |
|
109,840 |
|
109,840 |
|
| Loss on early retirement of debt |
— |
|
— |
|
— |
|
2,978 |
|
2,978 |
|
| Foreign currency loss |
— |
|
— |
|
— |
|
49 |
|
49 |
|
| Other expense, net |
— |
|
— |
|
— |
|
3,193 |
|
3,193 |
|
| Segment income/(loss) |
$ |
66,065 |
|
$ |
83,925 |
|
$ |
(5,045) |
|
$ |
(35,523) |
|
$ |
109,422 |
|
|
|
|
|
|
|
| Acquisition and integration costs |
— |
|
— |
|
— |
|
4,917 |
|
4,917 |
|
| Change in fair value of contingent consideration |
18,024 |
|
— |
|
— |
|
— |
|
18,024 |
|
| Depreciation and amortization |
167,549 |
|
56,953 |
|
17,352 |
|
3,043 |
|
244,897 |
|
| Equity in net loss of Diamond Green Diesel |
— |
|
— |
|
24,523 |
|
— |
|
24,523 |
|
| Equity in net income of other unconsolidated subsidiaries |
(5,154) |
|
— |
|
— |
|
— |
|
(5,154) |
|
| Segment Adjusted EBITDA (Non-GAAP) |
$ |
246,484
|
|
$ |
140,878
|
|
$ |
36,830
|
|
$ |
(27,563) |
|
$ |
396,629
|
|
| DGD Adjusted EBITDA (Darling's Share) (Non-GAAP) * |
— |
|
— |
|
48,683 |
|
— |
|
48,683 |
|
| Combined Adjusted EBITDA (Non-GAAP) |
$ |
246,484
|
|
$ |
140,878
|
|
$ |
85,513
|
|
$ |
(27,563) |
|
$ |
445,312
|
|
|
|
|
|
|
|
| *See reconciliation of DGD Net Income/(Loss) to (Non-GAAP) DGD Adjusted EBITDA below the DGD Consolidated Statements of Operations |
Darling Ingredients Inc. and Subsidiaries
Balance Sheet Disclosures
As of July 4, 2026 and January 3, 2026
(in thousands)
|
|
|
|
|
|
|
|
|
|
|
|
|
|
|
(unaudited) |
|
|
|
July 4, |
|
January 3, |
|
2026 |
|
2026 |
| Cash and cash equivalents |
$ |
160,742 |
|
|
$ |
88,671 |
|
| Property, plant and equipment, net |
$ |
2,828,494 |
|
|
$ |
2,796,139 |
|
| Current portion of long-term debt |
$ |
96,761 |
|
|
$ |
75,217 |
|
| Long-term debt, net of current portion |
$ |
3,850,963 |
|
|
$ |
3,862,243 |
|
|
|
|
|
|
|
|
|
| Other Financial Data |
| As of July 4, 2026 |
|
(unaudited) |
|
|
|
July 4, |
|
|
|
2026 |
|
|
| Net debt (1) |
$ |
3,786,982 |
|
|
|
| Revolver availability |
$ |
1,308,043 |
|
|
|
| Capital expenditures - YTD |
$ |
223,626 |
|
|
|
| Preliminary Leverage Ratio |
2.30X |
|
|
| (1) Total debt less cash and cash equivalents. |
|
|
|
|
|
|
|
|
|
|
|
Diamond Green Diesel Joint Venture
Consolidated Statements of Operations
For the Three and Six Months Ended June 30, 2026 and June 30, 2025
(in thousands, unaudited)
|
|
|
|
|
|
|
|
|
|
|
|
|
|
|
|
|
|
|
|
|
|
|
|
|
|
|
|
|
|
|
|
|
|
|
|
|
|
|
|
|
|
|
|
|
|
|
|
|
|
|
|
|
|
|
|
|
|
|
|
Three Months Ended |
|
Six Months Ended |
|
|
|
|
| |
|
|
|
|
|
|
|
|
|
|
|
|
|
|
|
|
|
|
|
June 30, |
|
June 30, |
|
|
June 30, |
|
June 30, |
|
|
|
|
|
|
|
|
|
|
|
|
|
|
2026 |
|
2025 |
|
|
2026 |
|
2025 |
|
|
|
|
|
|
|
|
|
|
|
|
| Revenues: |
|
|
|
|
|
|
|
|
|
|
|
|
|
|
|
|
|
|
|
|
|
| Operating revenues |
|
$ |
2,681,999 |
|
|
$ |
1,097,831 |
|
|
|
$ |
4,096,045 |
|
|
$ |
1,997,740 |
|
|
|
|
|
|
|
|
|
|
|
|
|
| Expenses: |
|
|
|
|
|
|
|
|
|
|
|
|
|
|
|
|
|
|
|
|
|
| Total costs and expenses less lower of cost or market inventory valuation adjustment and depreciation, amortization and accretion expense |
|
1,896,706 |
|
|
1,119,445 |
|
|
|
3,097,797 |
|
|
2,096,551 |
|
|
|
|
|
|
|
|
|
|
|
|
|
| Lower of cost or market (LCM) inventory valuation adjustment |
|
— |
|
|
(111,245) |
|
|
|
(96,720) |
|
|
(202,249) |
|
|
|
|
|
|
|
|
|
|
|
|
|
| Depreciation, amortization and accretion expense |
|
71,020 |
|
|
61,529 |
|
|
|
148,948 |
|
|
129,001 |
|
|
|
|
|
|
|
|
|
|
|
|
|
| Total costs and expenses |
|
1,967,726 |
|
|
1,069,729 |
|
|
|
3,150,025 |
|
|
2,023,303 |
|
|
|
|
|
|
|
|
|
|
|
|
|
| Operating income/(loss) |
|
714,273 |
|
|
28,102 |
|
|
|
946,020 |
|
|
(25,563) |
|
|
|
|
|
|
|
|
|
|
|
|
|
| Other income |
|
3,697 |
|
|
2,181 |
|
|
|
5,211 |
|
|
5,883 |
|
|
|
|
|
|
|
|
|
|
|
|
|
| Interest and debt expense, net |
|
(10,739) |
|
|
(12,844) |
|
|
|
(21,895) |
|
|
(22,150) |
|
|
|
|
|
|
|
|
|
|
|
|
|
| Income/(loss) before income tax expense |
|
707,231 |
|
|
17,439 |
|
|
|
929,336 |
|
|
(41,830) |
|
|
|
|
|
|
|
|
|
|
|
|
|
| Income tax expense |
|
$ |
284 |
|
|
$ |
1,105 |
|
|
|
$ |
328 |
|
|
$ |
1,144 |
|
|
|
|
|
|
|
|
|
|
|
|
|
| Net income/(loss) |
|
$ |
706,947 |
|
|
$ |
16,334 |
|
|
|
$ |
929,008 |
|
|
$ |
(42,974) |
|
|
|
|
|
|
|
|
|
|
|
|
|
|
|
|
|
|
|
|
|
|
|
|
|
|
|
|
|
|
|
|
|
|
|
|
|
|
|
|
|
|
|
|
|
|
|
|
|
|
|
|
|
|
|
|
|
| Reconciliation of DGD Net Income/(Loss) to (Non-GAAP) DGD Adjusted EBITDA: |
|
|
|
|
|
|
|
|
|
|
|
|
|
|
| Net income/(loss) |
|
$ |
706,947 |
|
|
$ |
16,334 |
|
|
|
$ |
929,008 |
|
|
$ |
(42,974) |
|
|
|
|
|
|
|
|
|
|
|
|
|
| Income tax expense |
|
284 |
|
|
1,105 |
|
|
|
328 |
|
|
1,144 |
|
|
|
|
|
|
|
|
|
|
|
|
|
| Interest and debt expense, net |
|
10,739 |
|
|
12,844 |
|
|
|
21,895 |
|
|
22,150 |
|
|
|
|
|
|
|
|
|
|
|
|
|
| Other income |
|
(3,697) |
|
|
(2,181) |
|
|
|
(5,211) |
|
|
(5,883) |
|
|
|
|
|
|
|
|
|
|
|
|
|
| Operating income/(loss) |
|
714,273 |
|
|
28,102 |
|
|
|
946,020 |
|
|
(25,563) |
|
|
|
|
|
|
|
|
|
|
|
|
|
| Depreciation, amortization and accretion expense |
|
71,020 |
|
|
61,529 |
|
|
|
148,948 |
|
|
129,001 |
|
|
|
|
|
|
|
|
|
|
|
|
|
| DGD Adjusted EBITDA (Non-GAAP) |
|
785,293 |
|
|
89,631 |
|
|
|
1,094,968 |
|
|
103,438 |
|
|
|
|
|
|
|
|
|
|
|
|
|
| Less: Discount and Broker Fees |
|
(6,887) |
|
|
(4,335) |
|
|
|
(14,222) |
|
|
(6,073) |
|
|
|
|
|
|
|
|
|
|
|
|
|
| DGD Adjusted EBITDA (Non-GAAP) after Discount and Broker Fees |
|
778,406 |
|
|
85,296 |
|
|
1,080,746 |
|
97,365 |
|
|
|
|
|
|
|
|
|
|
|
|
| Darling's Share 50% |
|
50 |
% |
|
50 |
% |
|
|
50 |
% |
|
50 |
% |
|
|
|
|
|
|
|
|
|
|
|
|
| DGD Adjusted EBITDA (Darling's Share) (Non-GAAP) |
|
$ |
389,203 |
|
|
$ |
42,648 |
|
|
|
$ |
540,373 |
|
|
$ |
48,683 |
|
|
|
|
|
|
|
|
|
|
|
|
|
Diamond Green Diesel Joint Venture
Consolidated Balance Sheets
June 30, 2026 and December 31, 2025
(in thousands)
|
|
|
|
|
|
|
|
|
|
|
|
|
June 30, |
|
December 31, |
|
2026 |
|
2025 |
|
(unaudited) |
|
|
| Assets: |
|
|
|
| Cash |
$ |
387,284 |
|
|
$ |
195,765 |
|
| Total other current assets |
2,175,210 |
|
|
1,199,194 |
|
| Property, plant and equipment, net |
3,601,119 |
|
|
3,702,254 |
|
| Other assets |
122,119 |
|
|
139,765 |
|
| Total assets |
$ |
6,285,732 |
|
|
$ |
5,236,978 |
|
|
|
|
|
| Liabilities and members' equity: |
|
|
|
| Revolver |
$ |
— |
|
|
$ |
— |
|
| Total other current portion of long term debt |
28,443 |
|
|
29,487 |
|
| Total other current liabilities |
630,098 |
|
|
332,256 |
|
| Total long term debt |
663,293 |
|
|
677,671 |
|
| Total other long term liabilities |
17,796 |
|
|
17,748 |
|
|
|
|
|
| Total members' equity |
4,946,102 |
|
|
4,179,816 |
|
| Total liabilities and members' equity |
$ |
6,285,732 |
|
|
$ |
5,236,978 |
|
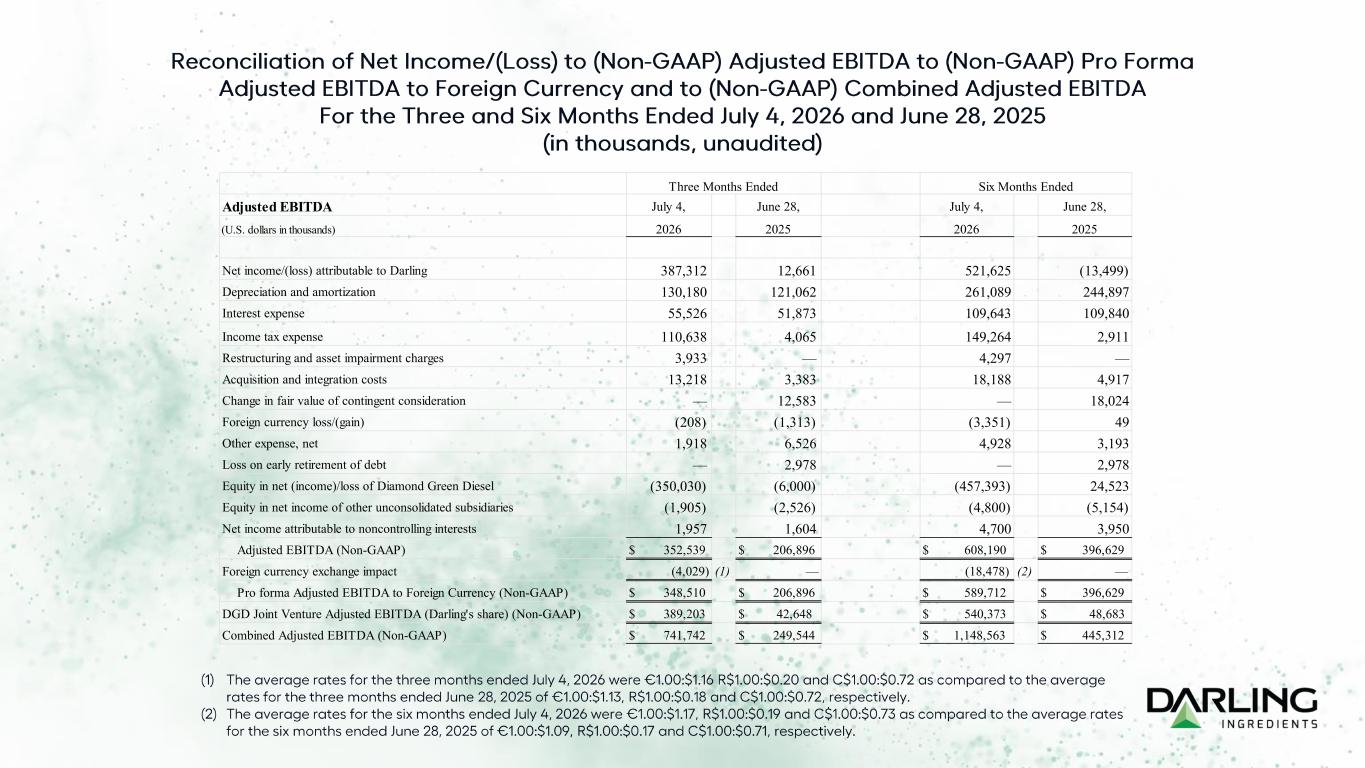
Reconciliation of Net Income/(Loss) to (Non-GAAP) Adjusted EBITDA to (Non-GAAP) Pro Forma
Adjusted EBITDA to Foreign Currency and to (Non-GAAP) Combined Adjusted EBITDA
For the Three and Six Months Ended July 4, 2026 and June 28, 2025
(in thousands, unaudited)
|
|
|
|
|
|
|
|
|
|
|
|
|
|
|
|
|
|
|
|
|
|
|
|
|
|
|
|
Three Months Ended |
|
Six Months Ended |
|
|
|
|
|
|
| Adjusted EBITDA |
July 4, |
|
June 28, |
|
July 4, |
|
June 28, |
|
| (U.S. dollars in thousands) |
2026 |
|
2025 |
|
2026 |
|
2025 |
|
|
|
|
|
|
|
|
|
|
| Net income/(loss) attributable to Darling |
$ |
387,312 |
|
|
$ |
12,661 |
|
|
$ |
521,625 |
|
|
$ |
(13,499) |
|
|
| Depreciation and amortization |
130,180 |
|
|
121,062 |
|
|
261,089 |
|
|
244,897 |
|
|
| Interest expense |
55,526 |
|
|
51,873 |
|
|
109,643 |
|
|
109,840 |
|
|
|
|
|
|
|
|
|
|
|
| Income tax expense |
110,638 |
|
|
4,065 |
|
|
149,264 |
|
|
2,911 |
|
|
| Restructuring and asset impairment charges |
3,933 |
|
|
— |
|
|
4,297 |
|
|
— |
|
|
| Acquisition and integration costs |
13,218 |
|
|
3,383 |
|
|
18,188 |
|
|
4,917 |
|
|
| Change in fair value of contingent consideration |
— |
|
|
12,583 |
|
|
— |
|
|
18,024 |
|
|
| Foreign currency loss/(gain) |
(208) |
|
|
(1,313) |
|
|
(3,351) |
|
|
49 |
|
|
| Other expense, net |
1,918 |
|
|
6,526 |
|
|
4,928 |
|
|
3,193 |
|
|
| Loss on early retirement of debt |
— |
|
|
2,978 |
|
|
— |
|
|
2,978 |
|
|
| Equity in net (income)/loss of Diamond Green Diesel |
(350,030) |
|
|
(6,000) |
|
|
(457,393) |
|
|
24,523 |
|
|
| Equity in net income of other unconsolidated subsidiaries |
(1,905) |
|
|
(2,526) |
|
|
(4,800) |
|
|
(5,154) |
|
|
| Net income attributable to noncontrolling interests |
1,957 |
|
|
1,604 |
|
|
4,700 |
|
|
3,950 |
|
|
| Adjusted EBITDA (Non-GAAP) |
$ |
352,539 |
|
|
$ |
206,896 |
|
|
$ |
608,190 |
|
|
$ |
396,629 |
|
|
| Foreign currency exchange impact |
(4,029) |
|
(1) |
— |
|
|
(18,478) |
|
(2) |
— |
|
|
| Pro forma Adjusted EBITDA to Foreign Currency (Non-GAAP) |
$ |
348,510 |
|
|
$ |
206,896 |
|
|
$ |
589,712 |
|
|
$ |
396,629 |
|
|
| DGD Joint Venture Adjusted EBITDA (Darling's share) (Non-GAAP) |
$ |
389,203 |
|
|
$ |
42,648 |
|
|
$ |
540,373 |
|
|
$ |
48,683 |
|
|
| Combined Adjusted EBITDA (Non-GAAP) |
$ |
741,742 |
|
|
$ |
249,544 |
|
|
$ |
1,148,563 |
|
|
$ |
445,312 |
|
|
|
|
|
|
|
|
|
|
|
| (1) The average rates for the three months ended July 4, 2026 were €1.00:$1.16 R$1.00:$0.20 and C$1.00:$0.72 as compared to the average rates for the three months ended June 28, 2025 of €1.00:$1.13, R$1.00:$0.18 and C$1.00:$0.72, respectively. |
|
|
|
(2) The average rates for the six months ended July 4, 2026 were €1.00:$1.17, R$1.00:$0.19 and C$1.00:$0.73 as compared to the average rates for the six months ended June 28, 2025 of €1.00:$1.09, R$1.00:$0.17 and C$1.00:$0.71, respectively.
|
|
|
About Darling Ingredients
A pioneer in circularity, Darling Ingredients Inc. (NYSE: DAR) takes material from the animal agriculture and food industries, and transforms them into valuable ingredients that nourish people, feed animals and crops, and fuel the world with renewable energy. The company operates over 260 facilities in more than 15 countries and processes about 15% of the world’s animal agricultural by-products, produces about 30% of the world’s collagen (both gelatin and hydrolyzed collagen), and is one of the largest producers of renewable energy. To learn more, visit darlingii.com. Follow us on LinkedIn.
Darling Ingredients will host a conference call on July 30, 2026, at 9 a.m. Eastern Time (8 a.m. Central Time) to discuss second quarter financial results and provide an update on company operations.
To access the call as a listener, please register for the audio-only webcast.
To join the call as a participant to ask a question, please register in advance to receive a confirmation email with the dial-in number and PIN for immediate access on July 30 or call 833-461-5787 (United States) or 626-884-3620 (international) using access code 745365725.
A replay of the call will be available online via the webcast registration link two hours after the call ends. A transcript will be posted at darlingii.com/investors within 24 hours.
Use of Non-GAAP Financial Measures:
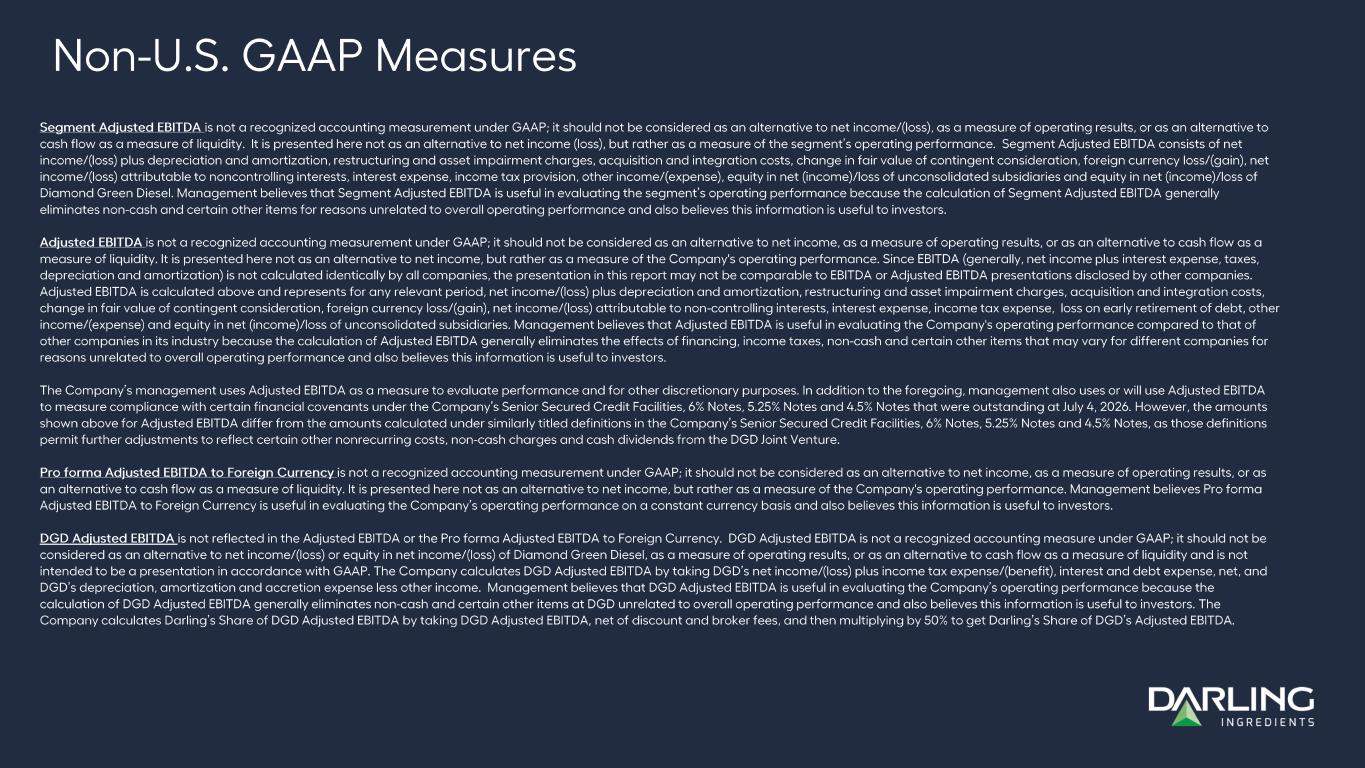
Segment Adjusted EBITDA is not a recognized accounting measurement under GAAP; it should not be considered as an alternative to net income/(loss), as a measure of operating results, or as an alternative to cash flow as a measure of liquidity. It is presented here not as an alternative to net income (loss), but rather as a measure of the segment’s operating performance. Segment Adjusted EBITDA consists of net income/(loss) plus depreciation and amortization, restructuring and asset impairment charges, acquisition and integration costs, change in fair value of contingent consideration, foreign currency loss/(gain), net income/(loss) attributable to noncontrolling interests, interest expense, income tax provision, other income/(expense), equity in net (income)/loss of unconsolidated subsidiaries and equity in net (income)/loss of Diamond Green Diesel. Management believes that Segment Adjusted EBITDA is useful in evaluating the segment’s operating performance because the calculation of Segment Adjusted EBITDA generally eliminates non-cash and certain other items for reasons unrelated to overall operating performance and also believes this information is useful to investors.
Adjusted EBITDA is not a recognized accounting measurement under GAAP; it should not be considered as an alternative to net income, as a measure of operating results, or as an alternative to cash flow as a measure of liquidity. It is presented here not as an alternative to net income, but rather as a measure of the Company's operating performance. Since EBITDA (generally, net income plus interest expense, taxes, depreciation and amortization) is not calculated identically by all companies, the presentation in this report may not be comparable to EBITDA or Adjusted EBITDA presentations disclosed by other companies. Adjusted EBITDA is calculated above and represents for any relevant period, net income/(loss) plus depreciation and amortization, restructuring and asset impairment charges, acquisition and integration costs, change in fair value of contingent consideration, foreign currency loss/(gain), net income/(loss) attributable to non-controlling interests, interest expense, income tax expense, loss on early retirement of debt, other income/(expense) and equity in net (income)/loss of unconsolidated subsidiaries. Management believes that Adjusted EBITDA is useful in evaluating the Company's operating performance compared to that of other companies in its industry because the calculation of Adjusted EBITDA generally eliminates the effects of financing, income taxes, non-cash and certain other items that may vary for different companies for reasons unrelated to overall operating performance and also believes this information is useful to investors.
The Company’s management uses Adjusted EBITDA as a measure to evaluate performance and for other discretionary purposes. In addition to the foregoing, management also uses or will use Adjusted EBITDA to measure compliance with certain financial covenants under the Company’s Senior Secured Credit Facilities, 6% Notes, 5.25% Notes and 4.5% Notes that were outstanding at July 4, 2026. However, the amounts shown above for Adjusted EBITDA differ from the amounts calculated under similarly titled definitions in the Company’s Senior Secured Credit Facilities, 6% Notes, 5.25% Notes and 4.5% Notes, as those definitions permit further adjustments to reflect certain other nonrecurring costs, non-cash charges and cash dividends from the DGD Joint Venture.
Information reconciling forward-looking Adjusted EBITDA to net income is unavailable to the Company without unreasonable effort. The Company is not able to provide reconciliations of forward-looking Adjusted EBITDA to net income because certain items required for such reconciliations are outside of the Company’s control and/or cannot be reasonably predicted, such as the impact of volatile commodity prices on the Company’s operations, impact of foreign currency exchange fluctuations, depreciation and amortization and the provision for income taxes. Preparation of such reconciliations for Darling Ingredients Inc. would require a forward-looking balance sheet, statement of operations and statement of cash flows, prepared in accordance with GAAP for each entity, and such forward-looking financial statements are unavailable to the Company without unreasonable effort. The Company provides guidance for its Adjusted EBITDA outlook that it believes will be achieved; however, it cannot accurately predict all the components of the Adjusted EBITDA calculation.
Pro forma Adjusted EBITDA to Foreign Currency is not a recognized accounting measurement under GAAP; it should not be considered as an alternative to net income, as a measure of operating results, or as an alternative to cash flow as a measure of liquidity. It is presented here not as an alternative to net income, but rather as a measure of the Company's operating performance. Management believes Pro forma Adjusted EBITDA to Foreign Currency is useful in evaluating the Company’s operating performance on a constant currency basis and also believes this information is useful to investors.
DGD Adjusted EBITDA is not reflected in the Adjusted EBITDA or the Pro forma Adjusted EBITDA to Foreign Currency. DGD Adjusted EBITDA is not a recognized accounting measure under GAAP; it should not be considered as an alternative to net income/(loss) or equity in net income/(loss) of Diamond Green Diesel, as a measure of operating results, or as an alternative to cash flow as a measure of liquidity and is not intended to be a presentation in accordance with GAAP. The Company calculates DGD Adjusted EBITDA by taking DGD’s net income/(loss) plus income tax expense/(benefit), interest and debt
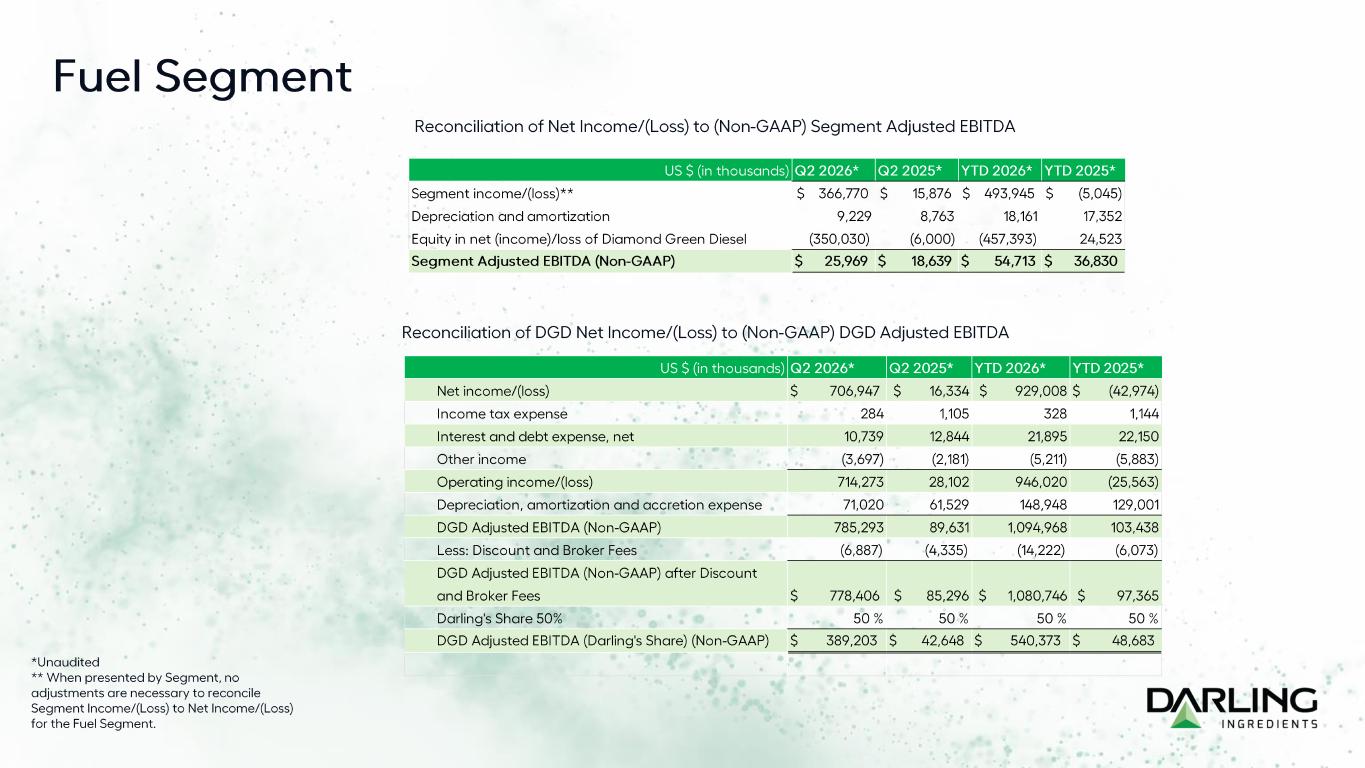
expense, net, and DGD’s depreciation, amortization and accretion expense less other income. Management believes that DGD Adjusted EBITDA is useful in evaluating the Company’s operating performance because the calculation of DGD Adjusted EBITDA generally eliminates non-cash and certain other items at DGD unrelated to overall operating performance and also believes this information is useful to investors. The Company calculates Darling’s Share of DGD Adjusted EBITDA by taking DGD Adjusted EBITDA, net of discount and broker fees, and then multiplying by 50% to get Darling’s Share of DGD’s Adjusted EBITDA.
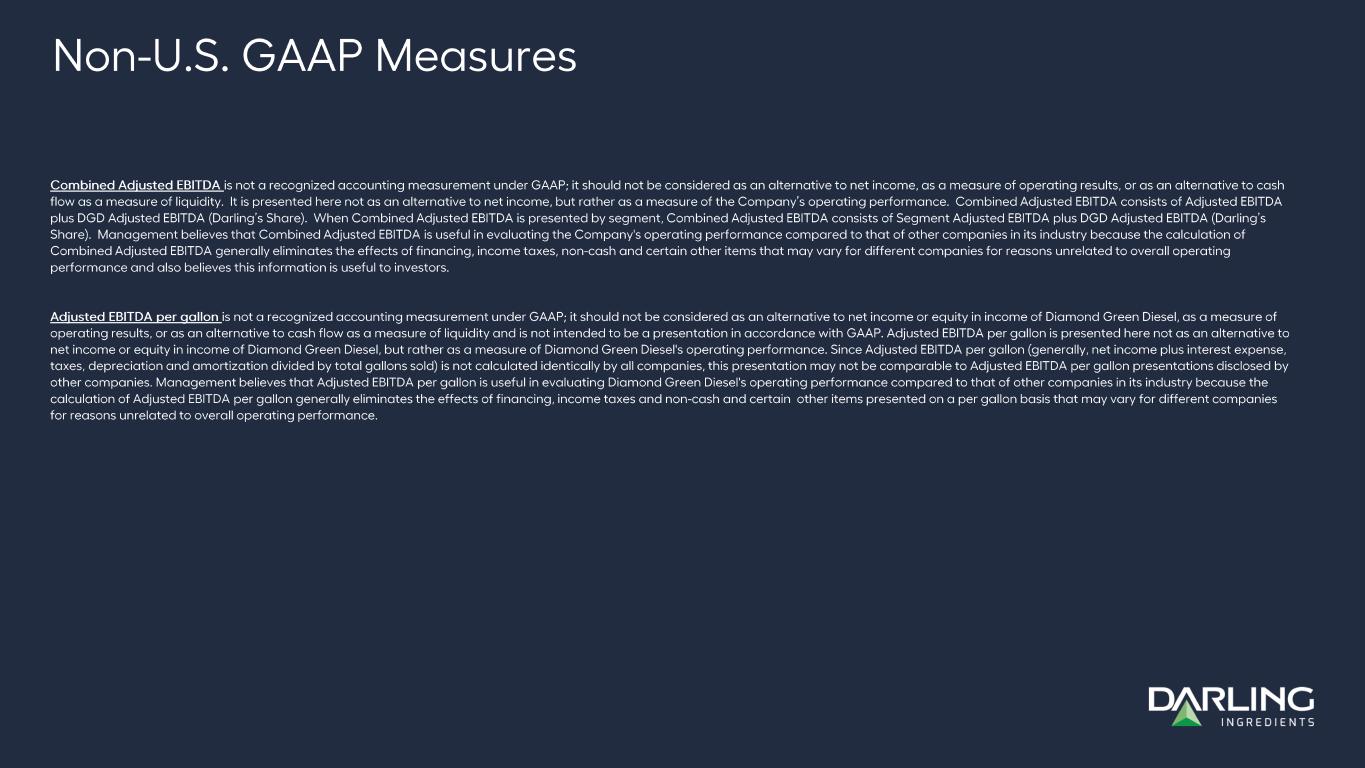
Combined Adjusted EBITDA is not a recognized accounting measurement under GAAP; it should not be considered as an alternative to net income, as a measure of operating results, or as an alternative to cash flow as a measure of liquidity. It is presented here not as an alternative to net income, but rather as a measure of the Company’s operating performance. Combined Adjusted EBITDA consists of Adjusted EBITDA plus DGD Adjusted EBITDA (Darling’s Share). When Combined Adjusted EBITDA is presented by segment, Combined Adjusted EBITDA consists of Segment Adjusted EBITDA plus DGD Adjusted EBITDA (Darling’s Share). Management believes that Combined Adjusted EBITDA is useful in evaluating the Company's operating performance compared to that of other companies in its industry because the calculation of Combined Adjusted EBITDA generally eliminates the effects of financing, income taxes, non-cash and certain other items that may vary for different companies for reasons unrelated to overall operating performance and also believes this information is useful to investors.
Adjusted EBITDA per gallon is not a recognized accounting measurement under GAAP; it should not be considered as an alternative to net income or equity in income of Diamond Green Diesel, as a measure of operating results, or as an alternative to cash flow as a measure of liquidity and is not intended to be a presentation in accordance with GAAP. Adjusted EBITDA per gallon is presented here not as an alternative to net income or equity in income of Diamond Green Diesel, but rather as a measure of Diamond Green Diesel's operating performance. Since Adjusted EBITDA per gallon (generally, net income plus interest expense, taxes, depreciation and amortization divided by total gallons sold) is not calculated identically by all companies, this presentation may not be comparable to Adjusted EBITDA per gallon presentations disclosed by other companies. Management believes that Adjusted EBITDA per gallon is useful in evaluating Diamond Green Diesel's operating performance compared to that of other companies in its industry because the calculation of Adjusted EBITDA per gallon generally eliminates the effects of financing, income taxes and non-cash and certain other items presented on a per gallon basis that may vary for different companies for reasons unrelated to overall operating performance.
Cautionary Statements Regarding Forward-Looking Information:
This media release includes “forward-looking” statements that are subject to risks and uncertainties that could cause actual results to differ materially from those expressed or implied in the statements. Statements that are not statements of historical facts are forward-looking statements and are made pursuant to the safe harbor provisions of the Private Securities Litigation Reform Act of 1995. Words such as “estimate,” “guidance,” “outlook,” “project,” “planned,” “contemplate,” “potential,” “possible,” “proposed,” “intend,” “believe,” “anticipate,” “expect,” “may,” “will,” “would,” “should,” “could,” and similar expressions are intended to identify forward-looking statements. All statements other than statements of historical facts included in this release are forward-looking statements. Forward-looking statements are based on the Company's current expectations and assumptions regarding its business, the economy and other future conditions. The Company cautions readers that any such forward-looking statements it makes are not guarantees of future performance and that actual results may differ materially from anticipated results or expectations expressed in its forward-looking statements as a result of a variety of factors, including many that are beyond the Company's control.
Important factors that could cause actual results to differ materially from the Company’s expectations include: existing and unknown future limitations on the ability of the Company's direct and indirect subsidiaries to make their cash flow available to the Company for payments on the Company's indebtedness or other purposes; reduced demands or prices for biofuels, biogases or renewable electricity; global demands for grain and oilseed commodities, which have exhibited volatility, and can impact the cost of feed for cattle, hogs and poultry, thus affecting available rendering feedstock and selling prices for the Company’s products; reductions in raw material volumes available to the Company due to weak margins in the meat production industry as a result of higher feed costs, reduced consumer demand, reduced volume due to government regulations affecting animal production or other factors, reduced volume from food service establishments, or otherwise; reduced demand for animal feed; reduced finished product prices, including a decline in fat, used cooking oil, protein or collagen (including, without limitation, collagen peptides and gelatin) finished product prices; changes to government policies around the world relating to renewable fuels and greenhouse gas (“GHG”) emissions that adversely affect prices, margins or markets (including for the DGD Joint Venture), including programs like renewable fuel standards, low carbon fuel standards, renewable fuel mandates and tax credits for biofuels, or loss or diminishment of tax credits due to failure to satisfy any eligibility requirements, including, without limitation, in relation to the blenders tax credit or the Clean Fuels Production Credit (“CFPC”); climate related adverse results, including with respect to the Company’s climate goals, targets or commitments; possible product recall resulting from developments relating to the discovery of unauthorized adulterations to food or food additives or products which do not meet specifications, contract requirements or regulatory standards; the occurrence of 2009 H1N1 flu (initially known as “Swine Flu”), highly pathogenic strains of avian influenza (collectively known as “Bird Flu”), severe acute respiratory syndrome
(“SARS”), bovine spongiform encephalopathy (or “BSE”), porcine epidemic diarrhea (“PED”) or other diseases associated with animal origin in the U.S. or elsewhere, such as the outbreak of African Swine Fever in China and elsewhere; the occurrence of pandemics, epidemics or disease outbreaks; unanticipated costs and/or reductions in raw material volumes related to the Company’s compliance with the existing or unforeseen new U.S. or foreign (including, without limitation, China) regulations (including new or modified animal feed, Bird Flu, SARS, PED, BSE or ASF or similar or unanticipated regulations) affecting the industries in which the Company operates or its value added products; risks associated with the DGD Joint Venture, including possible unanticipated operating disruptions and/or a decline in margins on the products produced by the DGD Joint Venture; risks and uncertainties relating to international sales and operations, including imposition of tariffs, quotas, trade barriers and other trade protections by the U.S. or foreign countries; tax changes, such as global minimum tax measures, or issues related to administration, guidance and/or regulations associated with biofuel policies, including CFPC, and risks associated with the qualification and sale of such credits; difficulties or a significant disruption (including, without limitation, due to cyber-attack) in the Company’s information systems, networks or the confidentiality, availability or integrity of our data or failure to implement new systems and software successfully; risks relating to possible third-party claims of intellectual property infringement; increased contributions to the Company’s pension and benefit plans, including multiemployer and employer-sponsored defined benefit pension plans as required by legislation, regulation or other applicable U.S. or foreign law or resulting from a U.S. mass withdrawal event; bad debt write-offs; loss of or failure to obtain necessary permits and registrations; the potential for future terrorist attacks, responses to terrorist attacks and other acts of war or hostility, including the ongoing conflicts in the Middle East, Africa, North Korea and Ukraine; uncertainty regarding any administration changes in the U.S. or elsewhere around the world, including, without limitation, impacts to trade, tariffs and/or policies impacting the Company (such as biofuel policies and mandates); and/or unfavorable export or import markets. These factors, coupled with volatile prices for natural gas and diesel fuel, inflation rates, climate conditions, currency exchange fluctuations, general performance of the U.S. and global economies, disturbances in world financial, credit, commodities and stock markets, and any decline in consumer confidence and discretionary spending, including the inability of consumers and companies to obtain credit due to lack of liquidity in the financial markets, among others, could cause actual results to vary materially from the forward-looking statements included in this media release or negatively impact the Company’s results of operations. Among other things, future profitability may be affected by the Company’s ability to grow its business, which faces competition from companies that may have substantially greater resources than the Company. The Company’s announced share repurchase program may be suspended or discontinued at any time and purchases of shares under the program are subject to market conditions and other factors, which are likely to change from time to time. For more detailed discussion of these factors and other risks and uncertainties regarding the Company, its business and the industries in which it operates, see the Company’s filings with the SEC, including the Risk Factors discussion in Item 1A of Part I of the Company's Annual Report on Form 10-K for the fiscal year ended January 3, 2026. The Company cautions readers that all forward-looking statements speak only as of the date made, and the Company undertakes no obligation to update any forward-looking statements, whether as a result of changes in circumstances, new events or otherwise.
# # #
Darling Ingredients Contacts
Investors: Suann Guthrie
Senior VP, Investor Relations and Global Affairs
(469) 214-8202; suann.guthrie@darlingii.com
Media: Jillian Fleming
Director, Global Communications
(972) 541-7115; jillian.fleming@darlingii.com
 エドガーで原本を確認する