UNITED STATES
SECURITIES AND EXCHANGE COMMISSION
Washington, D.C. 20549
FORM 8-K
CURRENT REPORT
Pursuant to Section 13 OR 15(d) of the Securities Exchange Act of 1934
Date of Report (Date of earliest event reported): April 30, 2024
UFP INDUSTRIES, INC.
(Exact name of registrant as specified in its charter)
Registrant's telephone number, including area code: (616) 364-6161
None
(Former name or former address, if changed since last report)
Check the appropriate box below if the Form 8-K filing is intended to simultaneously satisfy the filing obligation of the registrant under any of the following provisions:
☐ Written communications pursuant to Rule 425 under the Securities Act (17 CFR 230.425).
☐ Soliciting material pursuant to Rule 14a-12 under the Exchange Act (17 CFR 240.14a-12).
☐ Pre-commencement communications pursuant to Rule 14d-2(b) under the Exchange Act (17 CFR 240.14d-2(b)).
☐ Pre-commencement communications pursuant to Rule 13e-4(c) under the Exchange Act (17 CFR 240.13e-4(c)).
Securities registered pursuant to Section 12(b) of the Act:
Title of each class |
Trading Symbol(s) |
Name of each exchange on which registered |
Common Stock |
UFPI |
The NASDAQ Stock Market, LLC |
Indicate by check mark whether the registrant is an emerging growth company as defined in Rule 405 of the Securities Act of 1933 (§230.405 of this chapter) or Rule 12b-2 of the Securities Exchange Act of 1934 (§240.12b-2 of this chapter).
Emerging growth company ☐
If an emerging growth company, indicate by check mark if the registrant has elected not to use the extended transition period for complying with any new or revised financial accounting standards provided pursuant to Section 13(a) of the Exchange Act. ☐
Item 7.01. Regulation FD Disclosure.
Attached as Exhibit 99.1 is the Company's current version of its first quarter 2024 Investor Relations Presentation provided to investors and posted on the Company's investor website at ufpinvestor.com.
The information in this Form 8-K and the attached Exhibit shall not be deemed filed for purposes of Section 18 of the Securities Exchange Act of 1934, as amended, nor shall they be deemed incorporated by reference in any filing under the Securities Act of 1933, as amended.
Item 9.01. Exhibits.
Exhibits
99.1 |
|
|
|
104 |
Cover Page Interactive File (the cover page XBRL tags are embedded in the Inline XBRL document). |
2
SIGNATURE
Pursuant to the requirements of the Securities Exchange Act of 1934, the registrant has duly caused this report to be signed on its behalf by the undersigned thereunto duly authorized.
Dated: April 30, 2024 |
UFP INDUSTRIES, INC. |
|
|
(Registrant) |
|
|
|
|
|
By: |
/s/ Michael R. Cole |
|
|
Michael R. Cole |
|
|
Principal Financial Officer and Treasurer |
3
|
S INVESTOR RELATIONS PRESENTATION Results through March 30, 2024 Mixed materials structural crate UFP Packaging Deckorators Surestone composite decking, ProWood Fencing UFP Retail Solutions Commercial wood truss UFP Construction |
|
Please be aware that statements included in this presentation that are not historical are forward-looking statements within the meaning of Section 21E of the Securities Exchange Act, as amended, and are based on management’s beliefs, assumptions, current expectations, estimates, and projections about the markets we serve, the economy, and the company itself. Words like “anticipates,” “believes,” “confident,” “estimates,” “expects,” “forecasts,” likely,” “plans,” “projects,” “should,” variations of such words, and similar expressions identify such forward-looking statements. These statements do not guarantee future performance and involve certain risks, uncertainties and assumptions that are difficult to predict with regard to timing, extent, likelihood and degree of occurrence. The Company does not undertake to update forward-looking statements to reflect facts, circumstances, assumptions or events that occur after the date the forward-looking statements are made. Actual results could differ materially from those included in such forward-looking statements. Investors are cautioned that all forward-looking statements involve risks and uncertainty. Among the factors that could cause actual results to differ materially from forward-looking statements are the following: Fluctuations in the price of lumber; adverse or unusual weather conditions; adverse conditions in the markets we serve; government regulations, particularly involving environmental and safety regulations; and our ability to make successful business acquisitions. Certain of these risk factors as well as other risk factors and additional information are included in the Company's reports on Form 10-K and 10-Q on file with the Securities and Exchange Commission. Non-GAAP Financial Information: This presentation includes certain financial information not prepared in accordance with U.S. GAAP. Because not all companies calculate non-GAAP financial information identically (or at all), the presentations herein may not be comparable to other similarly titled measures used by other companies. Management uses Adjusted EBITDA and return on invested capital, non-GAAP financial measures, in order to evaluate historical and ongoing operations. Management believes that these non-GAAP financial measures are useful in order to enable investors to perform meaningful comparisons of historical and current performance. These non-GAAP financial measures are intended to supplement and should be read together with the financial results. These non-GAAP financial measures should not be considered an alternative or substitute for, and should not be considered superior to, the reported financial results. Accordingly, users of this financial information should not place undue reliance on the non-GAAP financial measures. This presentation is the property of UFP Industries, Inc. Any redistribution, retransmission, or reprinting of this presentation in any form without the express written consent of UFP Industries is strictly prohibited. UFP INDUSTRIES, INC. 2 |
|
The operating segments of UFP Industries – UFP Packaging, UFP Construction and UFP Retail Solutions – manufacture and sell a wide variety of value-added products used in residential and commercial construction, outdoor living, packaging and other industrial applications worldwide. NO MISSION STATEMENT. JUST PEOPLE ON A MISSION. 3 |
|
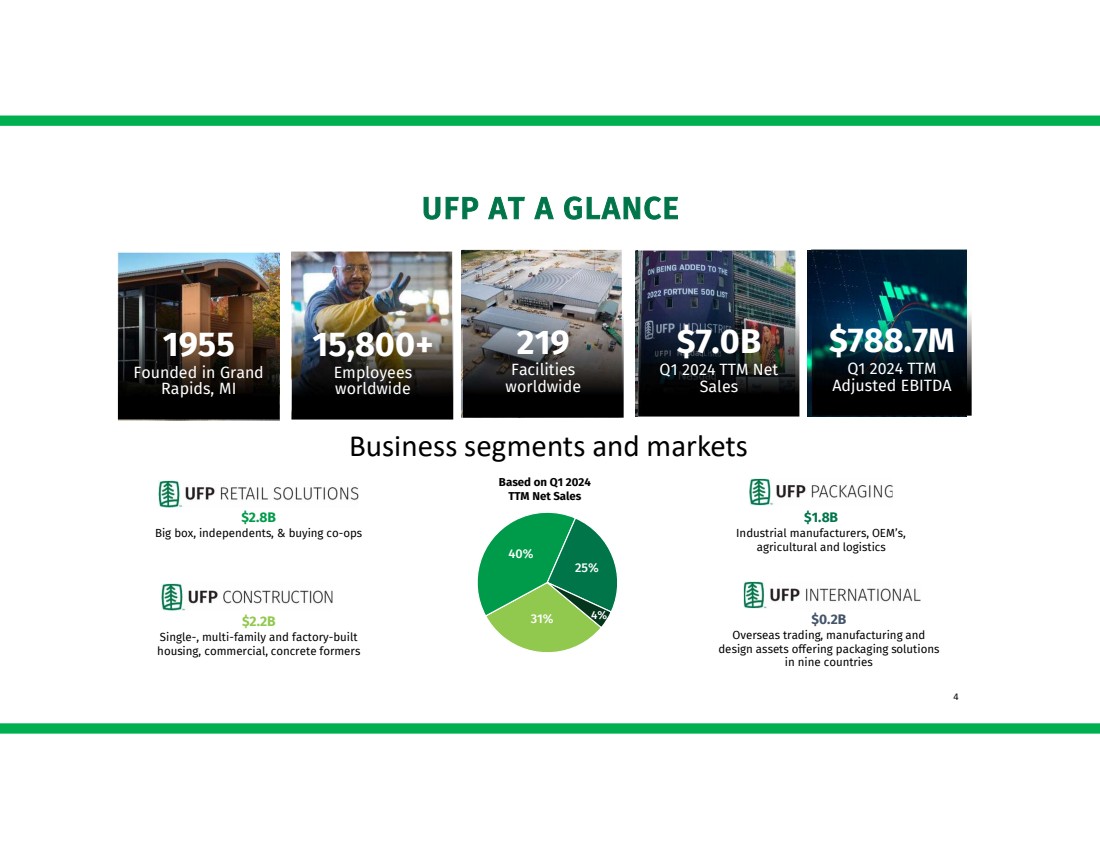
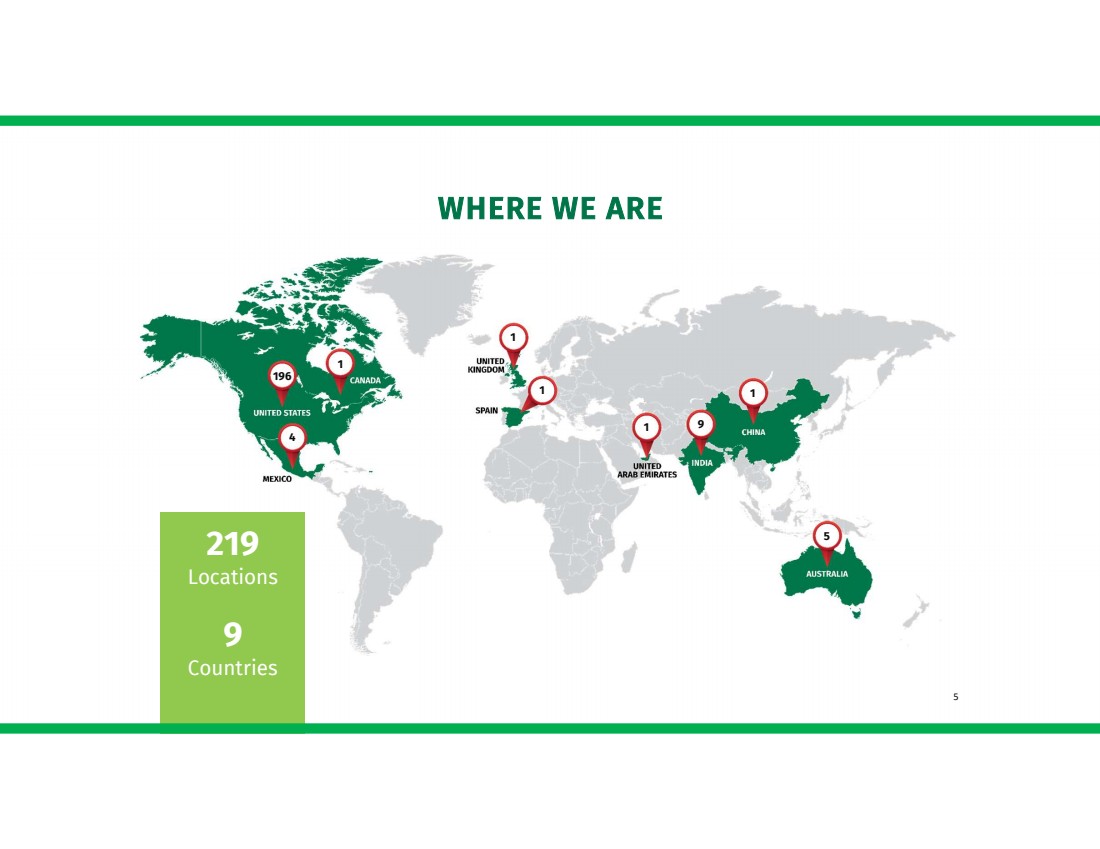
15,800+ Employees worldwide 219 Facilities worldwide 1955 Founded in Grand Rapids, MI $7.0B Q1 2024 TTM Net Sales 40% 31% 25% 4% Based on Q1 2024 TTM Net Sales $2.8B Big box, independents, & buying co-ops $1.8B Industrial manufacturers, OEM’s, agricultural and logistics UFP AT A GLANCE $2.2B Single-, multi-family and factory-built housing, commercial, concrete formers $0.2B Overseas trading, manufacturing and design assets offering packaging solutions in nine countries $788.7M Q1 2024 TTM Adjusted EBITDA Business segments and markets 4 |
|
WHERE WE ARE 196 1 4 1 1 9 1 5 219 Locations 9 Countries 5 1 |
|
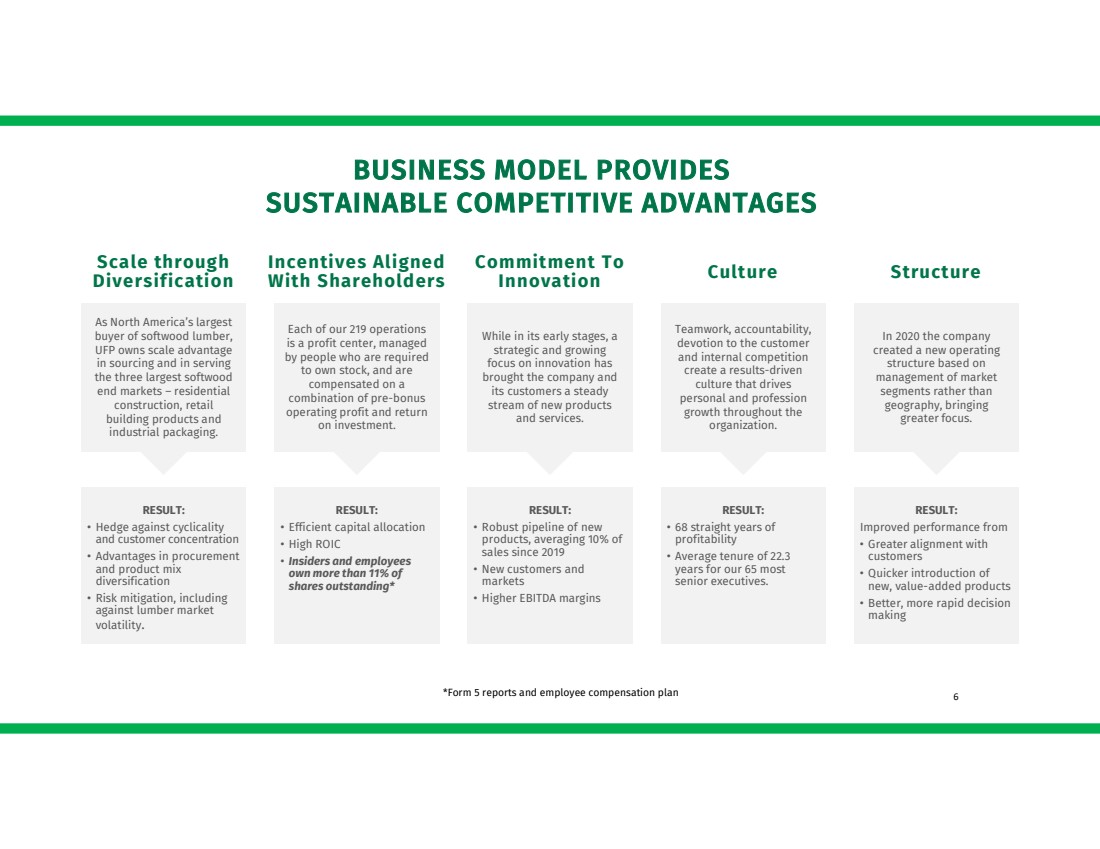
BUSINESS MODEL PROVIDES SUSTAINABLE COMPETITIVE ADVANTAGES 6 As North America’s largest buyer of softwood lumber, UFP owns scale advantage in sourcing and in serving the three largest softwood end markets – residential construction, retail building products and industrial packaging. While in its early stages, a strategic and growing focus on innovation has brought the company and its customers a steady stream of new products and services. Scale through Diversification Incentives Aligned With Shareholders Commitment To Innovation RESULT: • Hedge against cyclicality and customer concentration • Advantages in procurement and product mix diversification • Risk mitigation, including against lumber market volatility. RESULT: • Efficient capital allocation • High ROIC • Insiders and employees own more than 11% of shares outstanding* RESULT: • Robust pipeline of new products, averaging 10% of sales since 2019 • New customers and markets • Higher EBITDA margins Teamwork, accountability, devotion to the customer and internal competition create a results-driven culture that drives personal and profession growth throughout the organization. RESULT: • 68 straight years of profitability • Average tenure of 22.3 years for our 65 most senior executives. Culture Each of our 219 operations is a profit center, managed by people who are required to own stock, and are compensated on a combination of pre-bonus operating profit and return on investment. In 2020 the company created a new operating structure based on management of market segments rather than geography, bringing greater focus. Structure RESULT: Improved performance from • Greater alignment with customers • Quicker introduction of new, value-added products • Better, more rapid decision making *Form 5 reports and employee compensation plan |
|
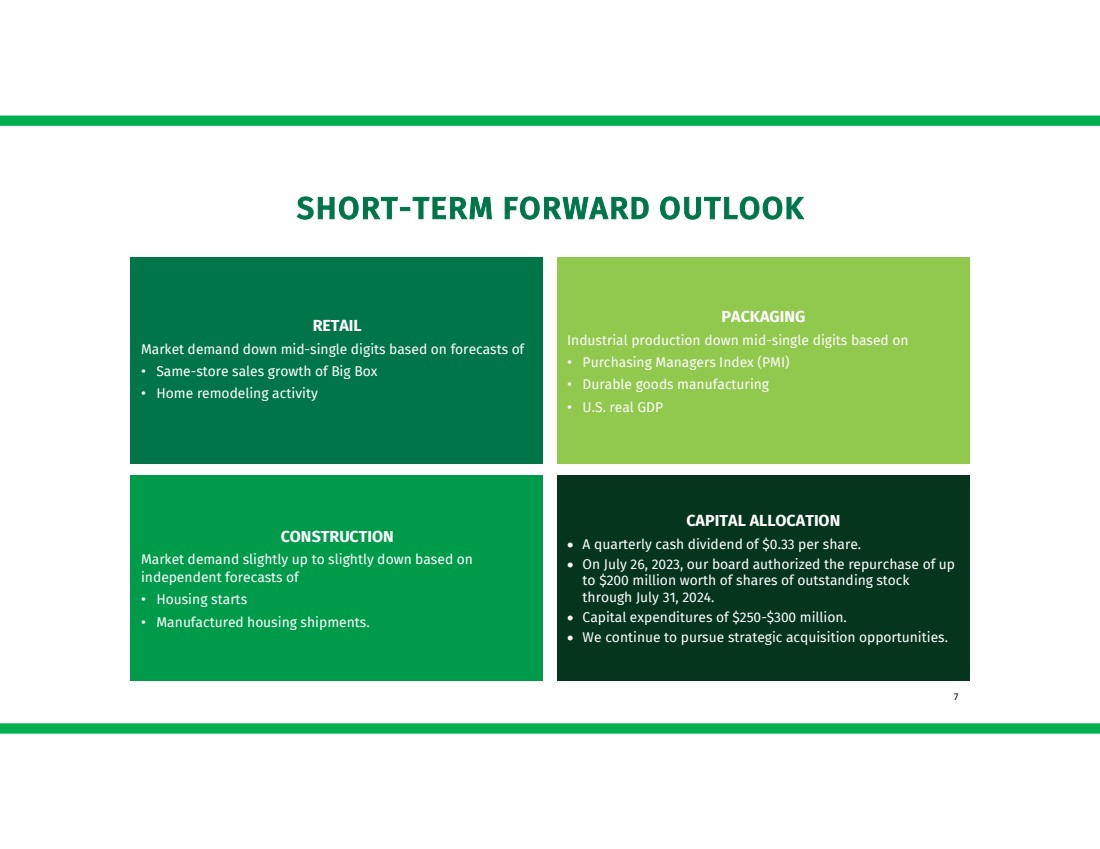
SHORT-TERM FORWARD OUTLOOK RETAIL Market demand down mid-single digits based on forecasts of • Same-store sales growth of Big Box • Home remodeling activity PACKAGING Industrial production down mid-single digits based on • Purchasing Managers Index (PMI) • Durable goods manufacturing • U.S. real GDP CONSTRUCTION Market demand slightly up to slightly down based on independent forecasts of • Housing starts • Manufactured housing shipments. CAPITAL ALLOCATION A quarterly cash dividend of $0.33 per share. On July 26, 2023, our board authorized the repurchase of up to $200 million worth of shares of outstanding stock through July 31, 2024. Capital expenditures of $250-$300 million. We continue to pursue strategic acquisition opportunities. 7 |
|
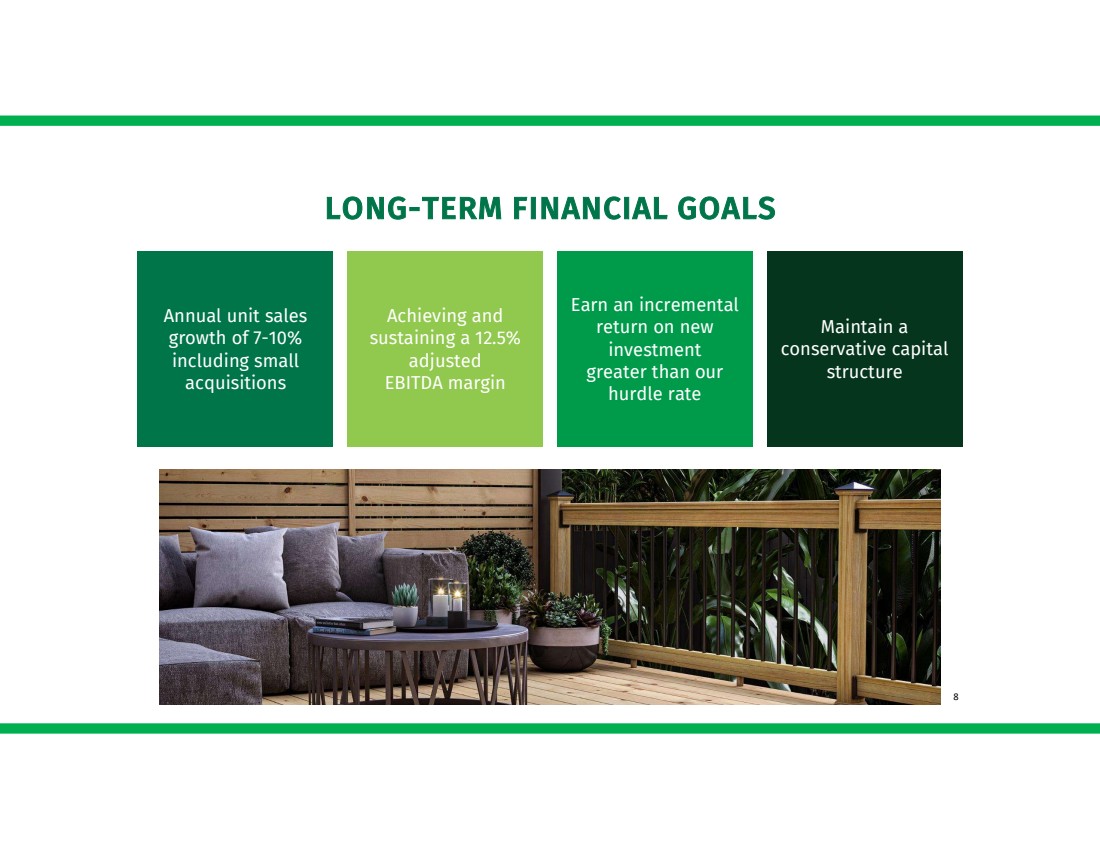
Annual unit sales growth of 7-10% including small acquisitions Achieving and sustaining a 12.5% adjusted EBITDA margin Earn an incremental return on new investment greater than our hurdle rate Maintain a conservative capital structure LONG-TERM FINANCIAL GOALS 8 |
|
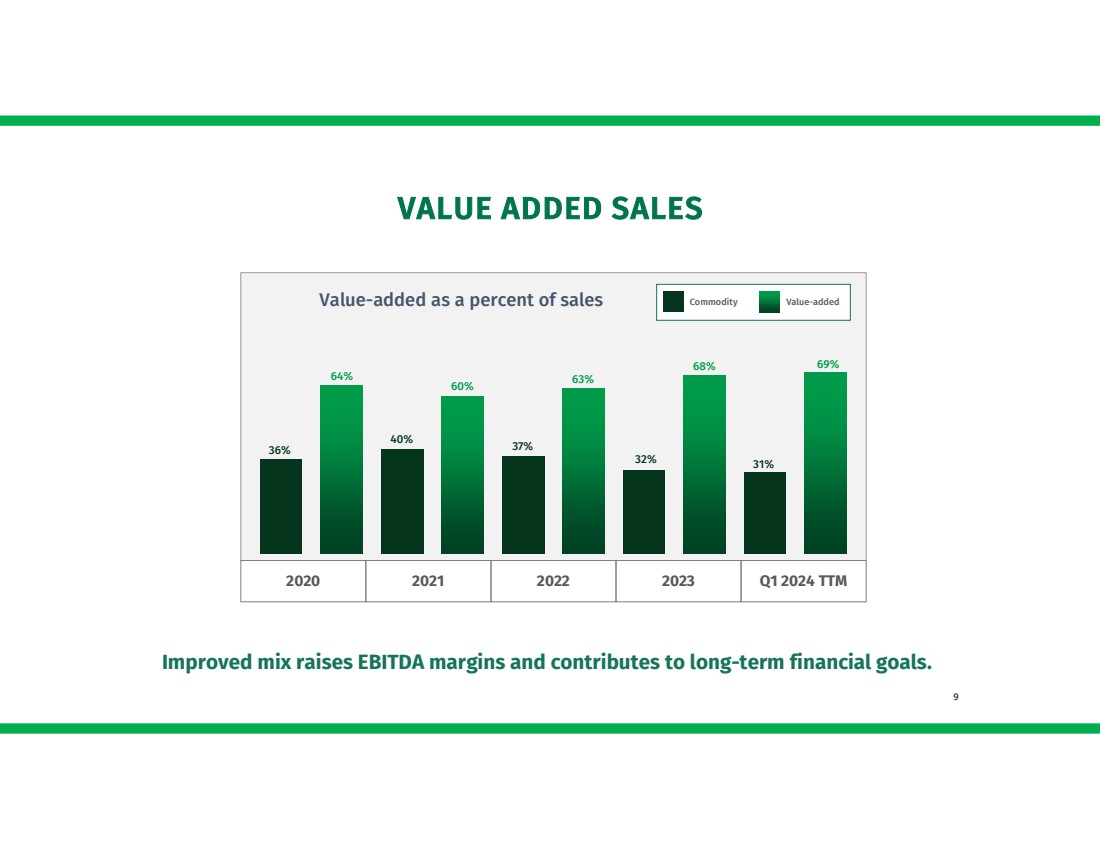
2013 36% 64% 40% 60% 37% 63% 32% 68% 31% 69% Value-added as a percent of sales VALUE ADDED SALES Commodity Value-added 2020 2021 2022 2023 Q1 2024 TTM Improved mix raises EBITDA margins and contributes to long-term financial goals. 9 |
|
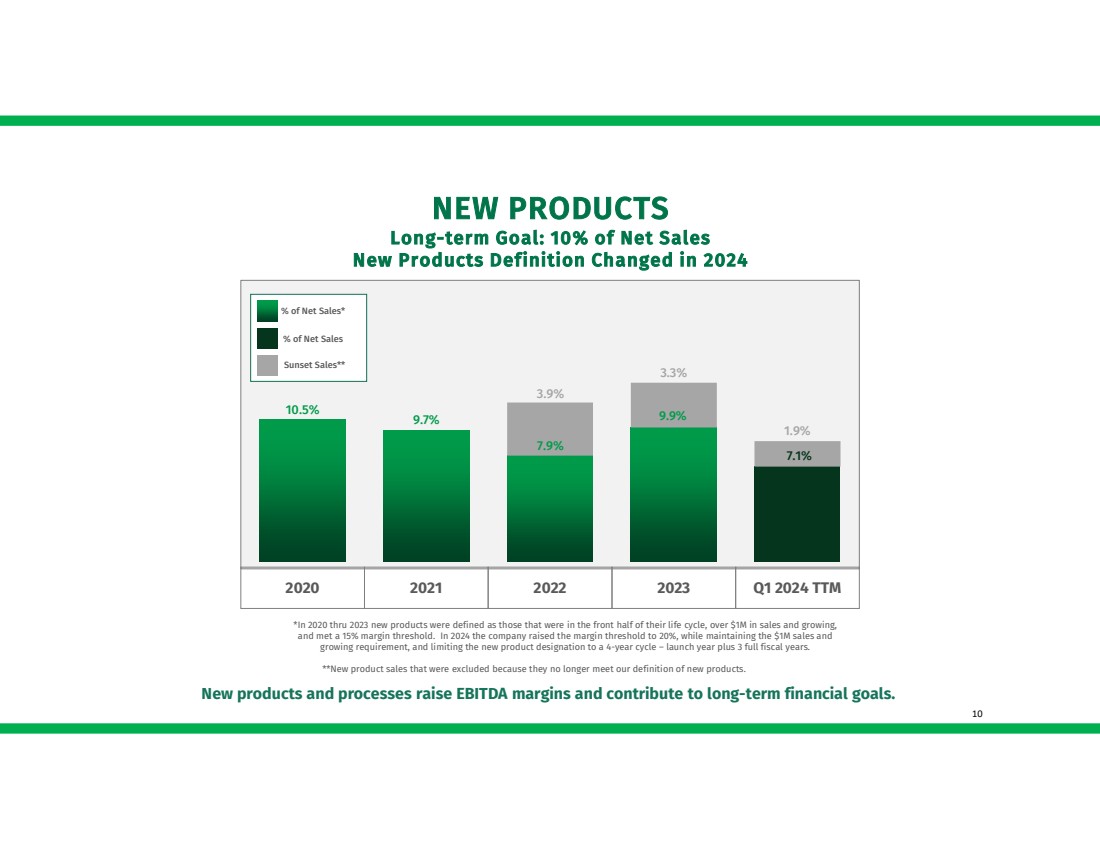
NEW PRODUCTS Long-term Goal: 10% of Net Sales New Products Definition Changed in 2024 10.5% 9.7% 9.9% 7.9% 7.1% 2020 2021 2022 2023 Q1 2024 TTM % of Net Sales 3.9% *In 2020 thru 2023 new products were defined as those that were in the front half of their life cycle, over $1M in sales and growing, and met a 15% margin threshold. In 2024 the company raised the margin threshold to 20%, while maintaining the $1M sales and growing requirement, and limiting the new product designation to a 4-year cycle – launch year plus 3 full fiscal years. **New product sales that were excluded because they no longer meet our definition of new products. Sunset Sales** 10 New products and processes raise EBITDA margins and contribute to long-term financial goals. 1.9% 3.3% % of Net Sales* |
|
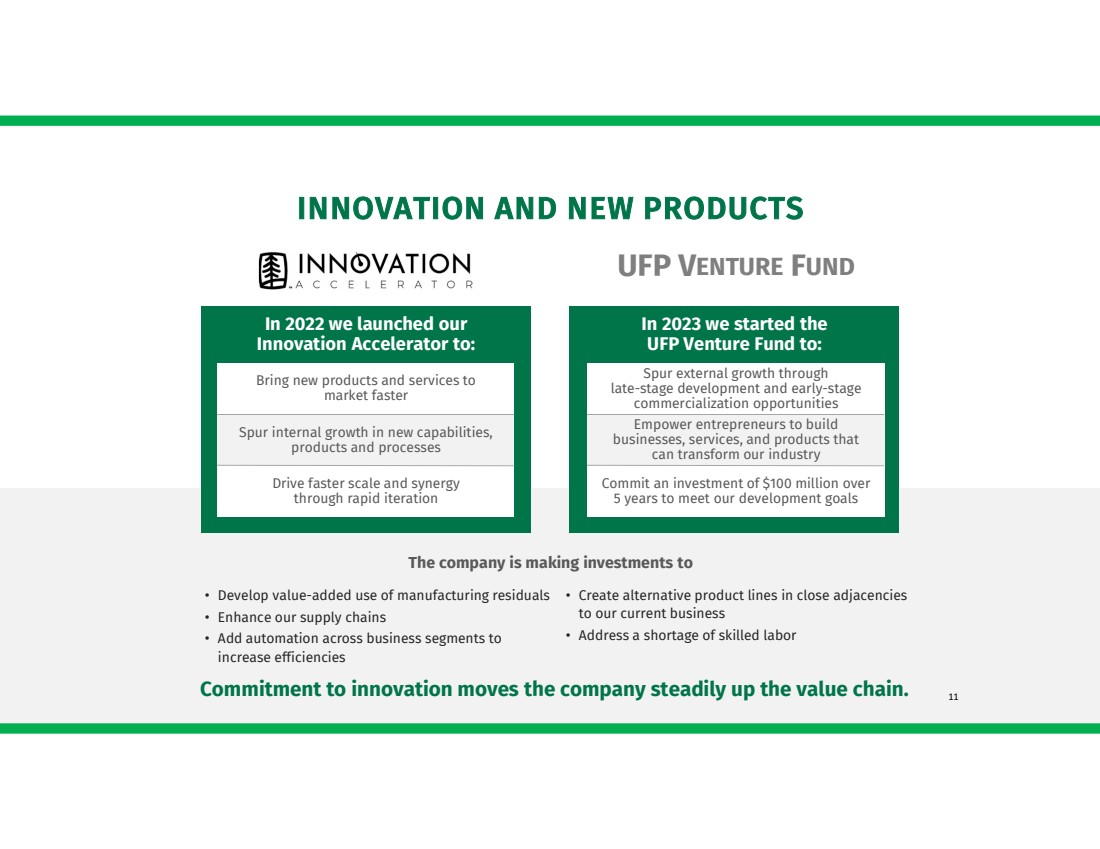
• Create alternative product lines in close adjacencies to our current business • Address a shortage of skilled labor The company is making investments to Commitment to innovation moves the company steadily up the value chain. INNOVATION AND NEW PRODUCTS In 2022 we launched our Innovation Accelerator to: Bring new products and services to market faster Spur internal growth in new capabilities, products and processes Drive faster scale and synergy through rapid iteration In 2023 we started the UFP Venture Fund to: Spur external growth through late-stage development and early-stage commercialization opportunities Empower entrepreneurs to build businesses, services, and products that can transform our industry Commit an investment of $100 million over 5 years to meet our development goals UFP VENTURE FUND 11 • Develop value-added use of manufacturing residuals • Enhance our supply chains • Add automation across business segments to increase efficiencies |
|
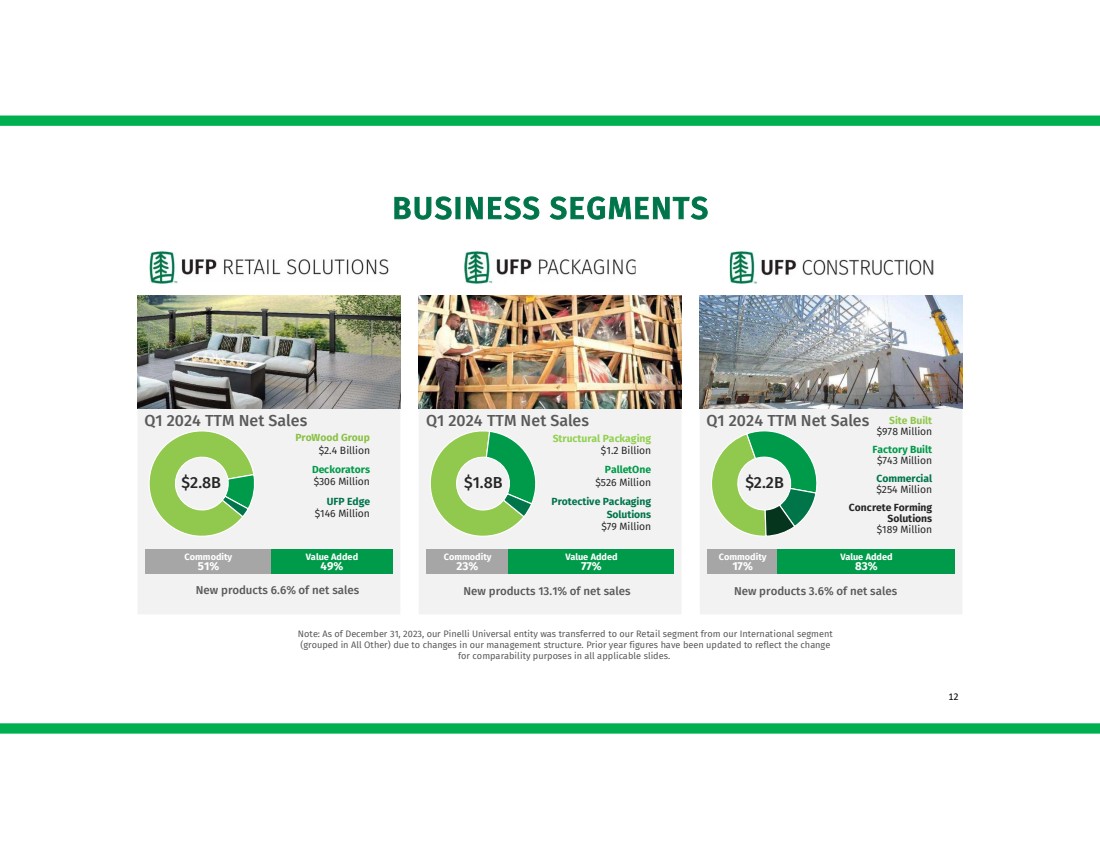
BUSINESS SEGMENTS Commodity 51% Value Added 49% Commodity 23% Value Added 77% Commodity 17% Value Added 83% ProWood Group $2.4 Billion Deckorators $306 Million UFP Edge $146 Million Structural Packaging $1.2 Billion PalletOne $526 Million Protective Packaging Solutions $79 Million Site Built $978 Million Factory Built $743 Million Commercial $254 Million Concrete Forming Solutions $189 Million $2.8B $1.8B $2.2B Q1 2024 TTM Net Sales Q1 2024 TTM Net Sales Q1 2024 TTM Net Sales 12 New products 6.6% of net sales New products 13.1% of net sales New products 3.6% of net sales Note: As of December 31, 2023, our Pinelli Universal entity was transferred to our Retail segment from our International segment (grouped in All Other) due to changes in our management structure. Prior year figures have been updated to reflect the change for comparability purposes in all applicable slides. |
|
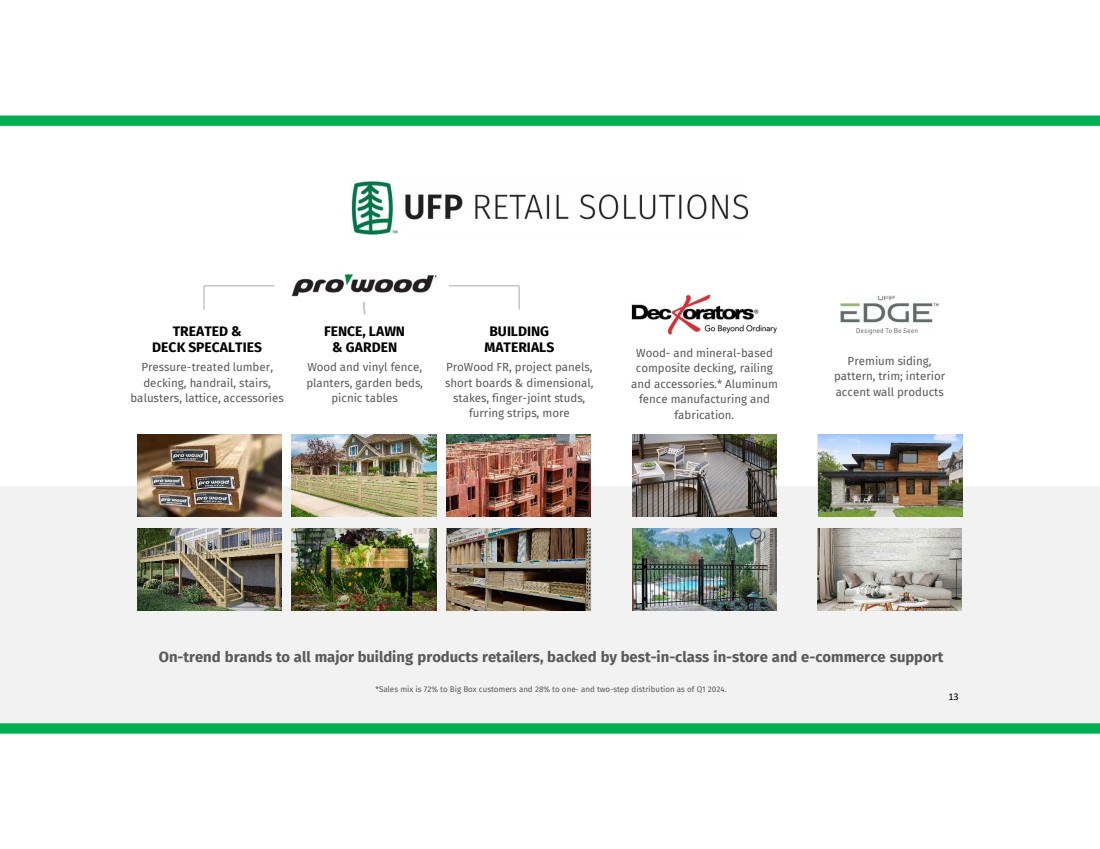
On-trend brands to all major building products retailers, backed by best-in-class in-store and e-commerce support *Sales mix is 72% to Big Box customers and 28% to one- and two-step distribution as of Q1 2024. Premium siding, pattern, trim; interior accent wall products Wood- and mineral-based composite decking, railing and accessories.* Aluminum fence manufacturing and fabrication. TREATED & DECK SPECALTIES Pressure-treated lumber, decking, handrail, stairs, balusters, lattice, accessories FENCE, LAWN & GARDEN Wood and vinyl fence, planters, garden beds, picnic tables BUILDING MATERIALS ProWood FR, project panels, short boards & dimensional, stakes, finger-joint studs, furring strips, more 13 |
|
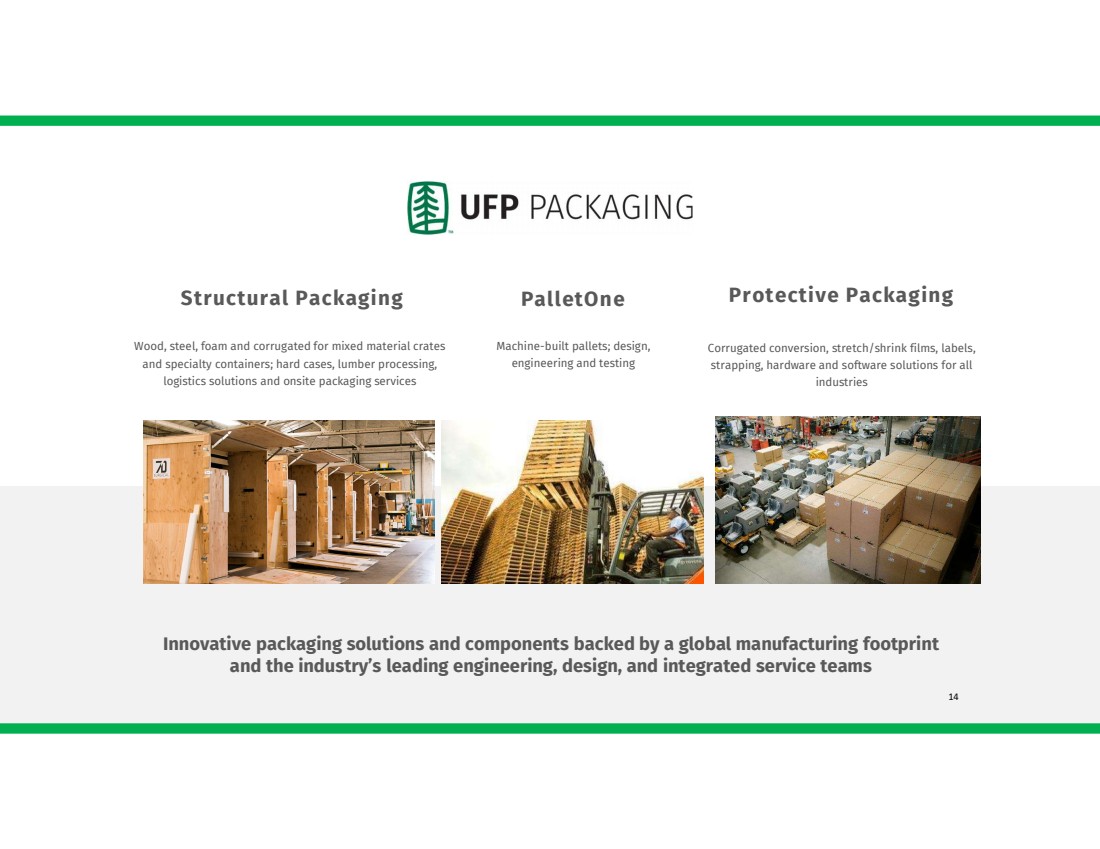
Innovative packaging solutions and components backed by a global manufacturing footprint and the industry’s leading engineering, design, and integrated service teams Structural Packaging Wood, steel, foam and corrugated for mixed material crates and specialty containers; hard cases, lumber processing, logistics solutions and onsite packaging services PalletOne Machine-built pallets; design, engineering and testing Protective Packaging Corrugated conversion, stretch/shrink films, labels, strapping, hardware and software solutions for all industries 14 |
|
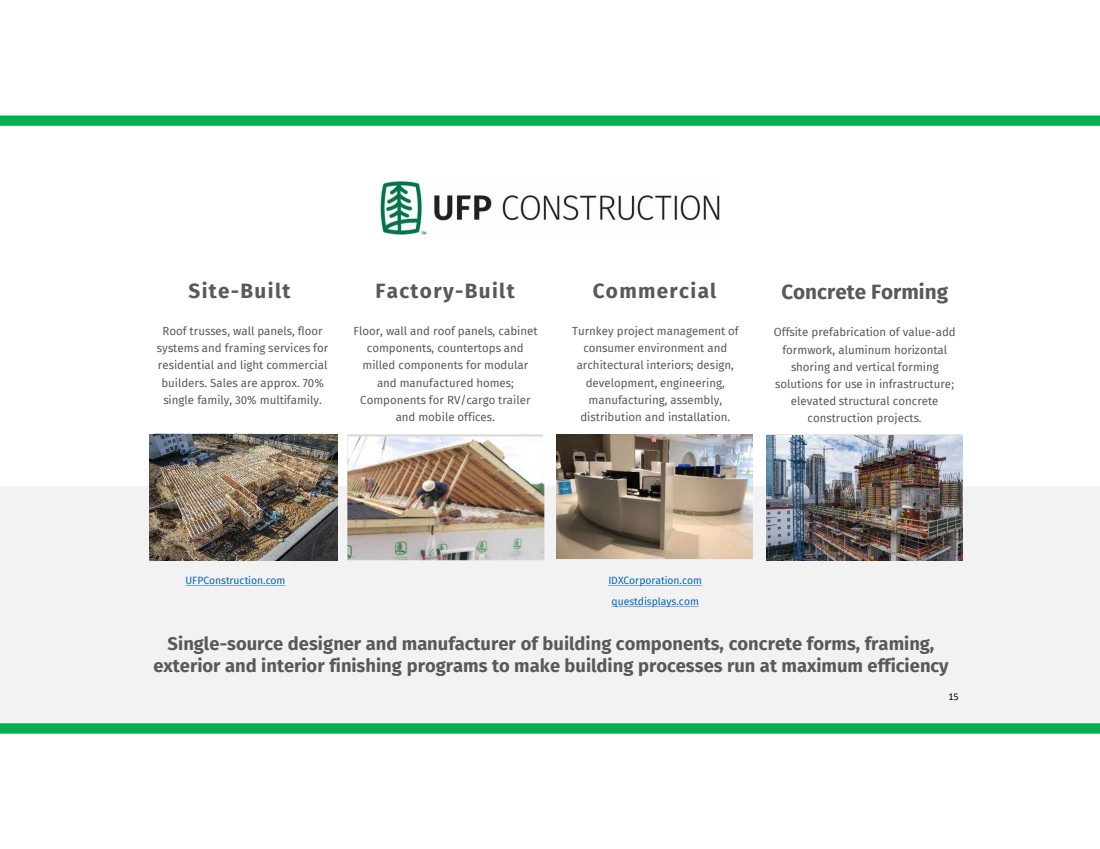
Floor, wall and roof panels, cabinet components, countertops and milled components for modular and manufactured homes; Components for RV/cargo trailer and mobile offices. Offsite prefabrication of value-add formwork, aluminum horizontal shoring and vertical forming solutions for use in infrastructure; elevated structural concrete construction projects. Roof trusses, wall panels, floor systems and framing services for residential and light commercial builders. Sales are approx. 70% single family, 30% multifamily. Turnkey project management of consumer environment and architectural interiors; design, development, engineering, manufacturing, assembly, distribution and installation. Single-source designer and manufacturer of building components, concrete forms, framing, exterior and interior finishing programs to make building processes run at maximum efficiency IDXCorporation.com questdisplays.com UFPConstruction.com Site-Built Factory-Built Commercial Concrete Forming 15 |
|
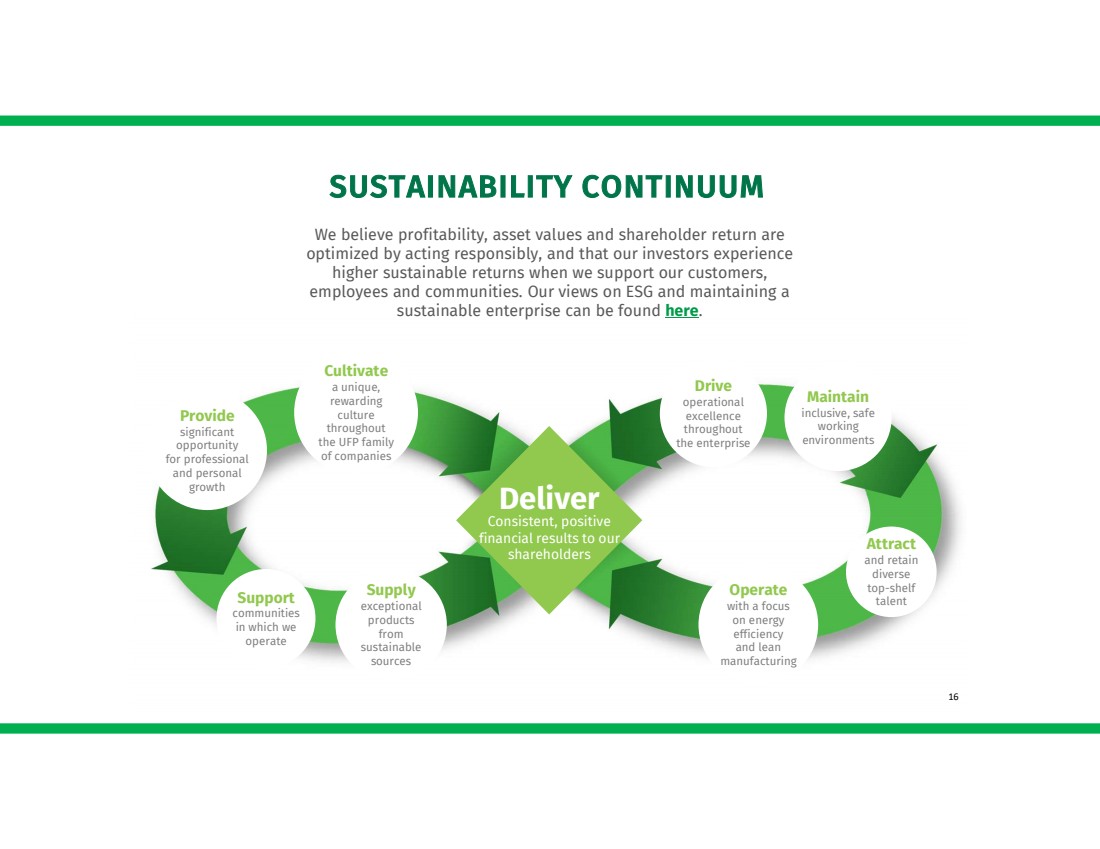
Drive operational excellence throughout the enterprise Cultivate a unique, rewarding culture throughout the UFP family of companies Provide significant opportunity for professional and personal growth Support communities in which we operate Supply exceptional products from sustainable sources Maintain inclusive, safe working environments Attract and retain diverse top-shelf talent Operate with a focus on energy efficiency and lean manufacturing Deliver Consistent, positive financial results to our shareholders We believe profitability, asset values and shareholder return are optimized by acting responsibly, and that our investors experience higher sustainable returns when we support our customers, employees and communities. Our views on ESG and maintaining a sustainable enterprise can be found here. SUSTAINABILITY CONTINUUM 16 |
|
FINANCIALS 17 |
|
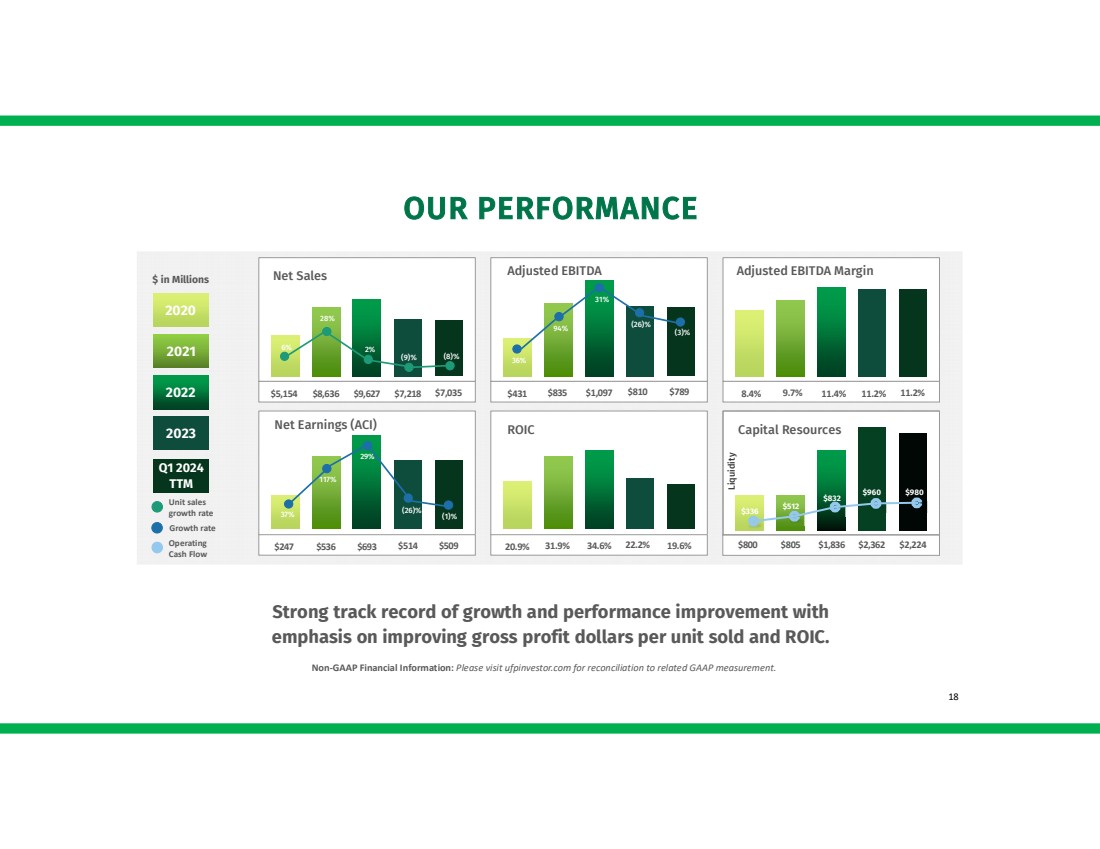
OUR PERFORMANCE Net Earnings (ACI) ROIC 2020 2022 2021 Unit sales growth rate $ in Millions Growth rate Strong track record of growth and performance improvement with emphasis on improving gross profit dollars per unit sold and ROIC. 2023 Non-GAAP Financial Information: Please visit ufpinvestor.com for reconciliation to related GAAP measurement. Net Sales Adjusted EBITDA Adjusted EBITDA Margin 18 Q1 2024 TTM $5,154 $8,636 $9,627 $7,218 $7,035 $431 $835 $1,097 $810 $789 8.4% 9.7% 11.4% 11.2% 11.2% $247 $536 $693 $514 $509 20.9% 31.9% 34.6% 22.2% 19.6% 36% 94% 31% (26)% 37% 117% 29% (26)% (1)% 6% 28% 2% (9)% (8)% (3)% Liquidity Capital Resources $800 $805 $1,836 $2,362 $2,224 $336 $512 $832 $960 $980 Operating Cash Flow |
|
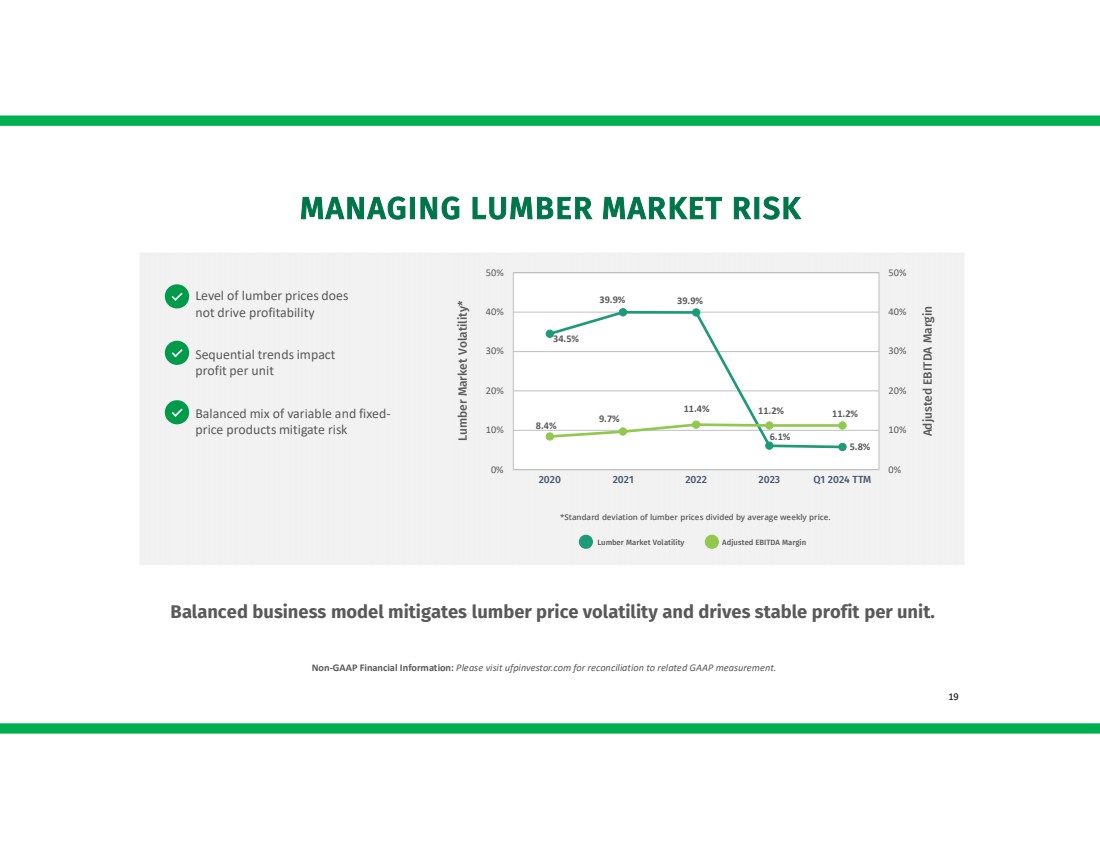
MANAGING LUMBER MARKET RISK Adjusted EBITDA Margin Lumber Market Volatility* 34.5% 39.9% 39.9% 6.1% 5.8% 8.4% 9.7% 11.4% 11.2% 11.2% 0% 10% 20% 30% 40% 50% 0% 10% 20% 30% 40% 50% 2020 2021 2022 2023 Q1 2024 TTM Lumber Market Volatility Adjusted EBITDA Margin *Standard deviation of lumber prices divided by average weekly price. Balanced business model mitigates lumber price volatility and drives stable profit per unit. Level of lumber prices does not drive profitability Sequential trends impact profit per unit Balanced mix of variable and fixed-price products mitigate risk Non-GAAP Financial Information: Please visit ufpinvestor.com for reconciliation to related GAAP measurement. 19 |
|
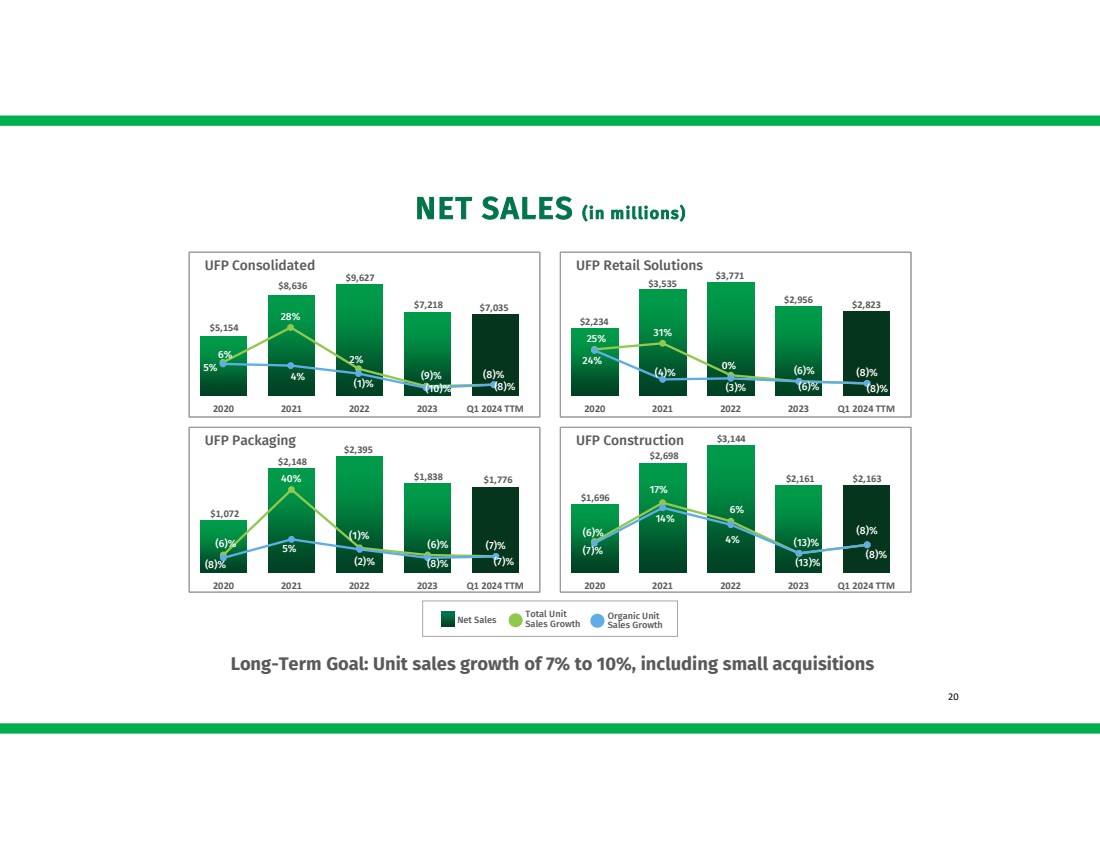
NET SALES (in millions) $5,154 $8,636 $9,627 $7,218 $7,035 2020 2021 2022 2023 Q1 2024 TTM UFP Consolidated $2,234 $3,535 $3,771 $2,956 $2,823 2020 2021 2022 2023 Q1 2024 TTM UFP Retail Solutions $1,072 $2,148 $2,395 $1,838 $1,776 2020 2021 2022 2023 Q1 2024 TTM UFP Packaging $1,696 $2,698 $3,144 $2,161 $2,163 2020 2021 2022 2023 Q1 2024 TTM UFP Construction Organic Unit Sales Growth Total Unit Sales Growth Net Sales Long-Term Goal: Unit sales growth of 7% to 10%, including small acquisitions (6)% 40% (1)% (8)% (7)% (8)% 5% (2)% (6)% (7)% (6)% 17% 6% (13)% (8)% (7)% 14% 4% (13)% (8)% 25% 31% 0% (6)% (8)% 24% (4)% (3)% (6)% (8)% 6% 28% 2% (9)% (8)% 5% 4% (1)% (10)% (8)% 20 |
|
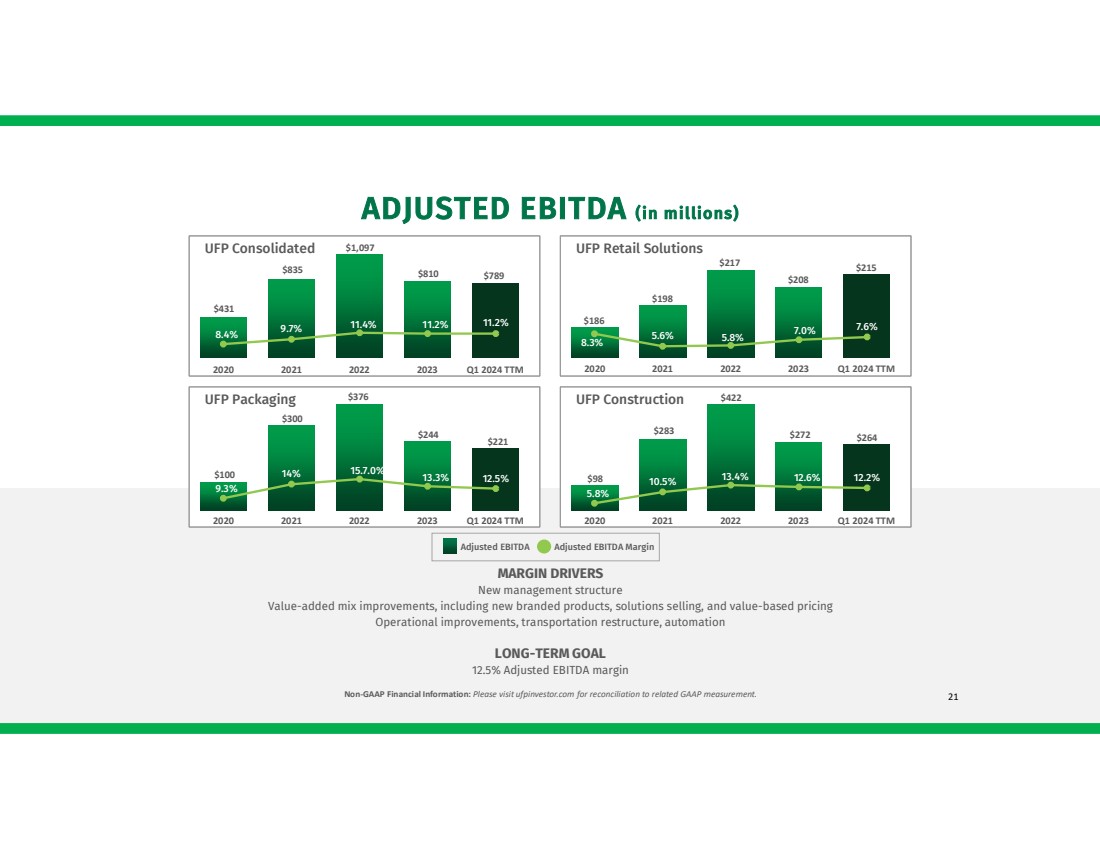
$431 $835 $1,097 $810 $789 2020 2021 2022 2023 Q1 2024 TTM UFP Consolidated $186 $198 $217 $208 $215 2020 2021 2022 2023 Q1 2024 TTM UFP Retail Solutions $100 $300 $376 $244 $221 2020 2021 2022 2023 Q1 2024 TTM UFP Packaging $98 $283 $422 $272 $264 2020 2021 2022 2023 Q1 2024 TTM UFP Construction 8.3% 5.6% 5.8% 7.0% 7.6% 9.3% 14% 15.7.0% 13.3% 12.5% 5.8% 10.5% 13.4% 12.6% 12.2% ADJUSTED EBITDA (in millions) 8.4% 9.7% 11.4% 11.2% 11.2% Non-GAAP Financial Information: Please visit ufpinvestor.com for reconciliation to related GAAP measurement. MARGIN DRIVERS New management structure Value-added mix improvements, including new branded products, solutions selling, and value-based pricing Operational improvements, transportation restructure, automation LONG-TERM GOAL 12.5% Adjusted EBITDA margin Adjusted EBITDA Adjusted EBITDA Margin 21 |
|
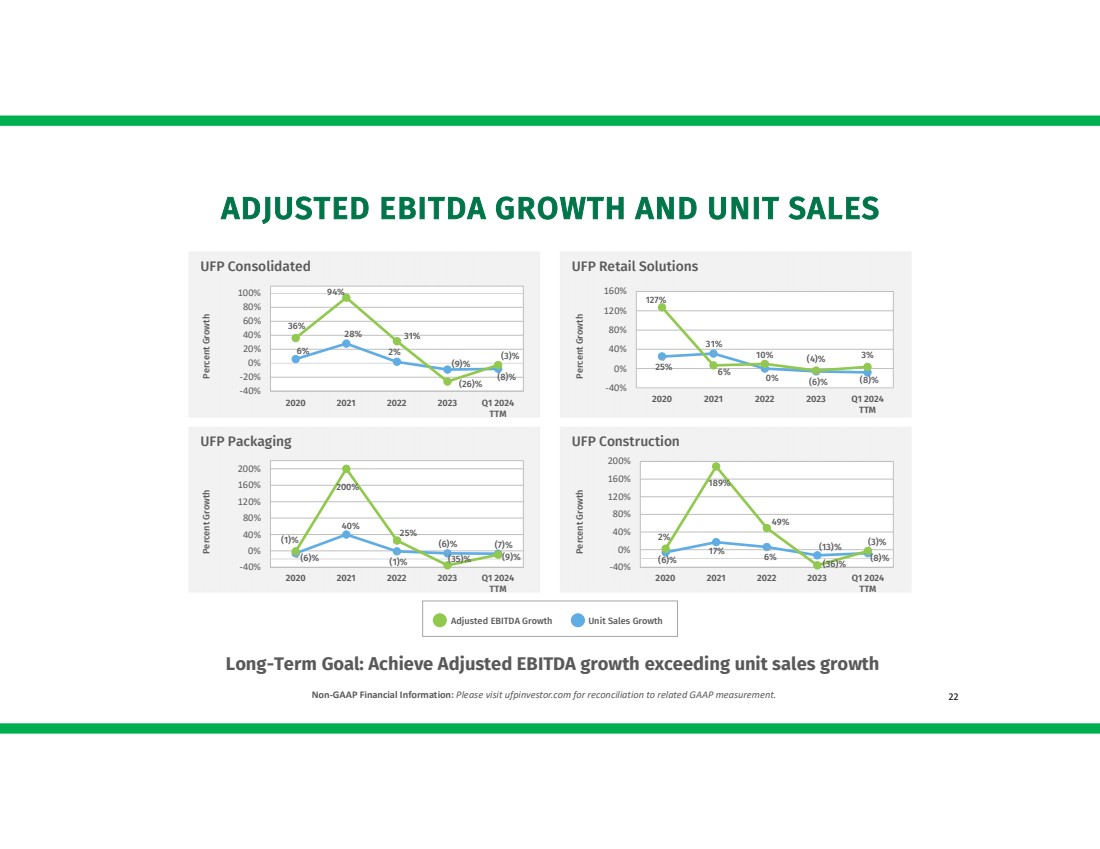
UFP Consolidated UFP Retail Solutions UFP Packaging UFP Construction ADJUSTED EBITDA GROWTH AND UNIT SALES 6% 28% 2% (9)% (8)% 36% 94% 31% (26)% (3)% -40% -20% 0% 20% 40% 60% 80% 100% 2020 2021 2022 2023 Q1 2024 TTM (6)% 40% (1)% (6)% (7)% (1)% 200% 25% (35)% (9)% -40% 0% 40% 80% 120% 160% 200% 2020 2021 2022 2023 Q1 2024 TTM 25% 31% 0% (6)% (8)% 127% 6% 10% (4)% 3% -40% 0% 40% 80% 120% 160% 2020 2021 2022 2023 Q1 2024 TTM (6)% 17% 6% (13)% (8)% 2% 189% 49% (36)% (3)% -40% 0% 40% 80% 120% 160% 200% 2020 2021 2022 2023 Q1 2024 TTM Percent Growth Percent Growth Percent Growth Percent Growth Long-Term Goal: Achieve Adjusted EBITDA growth exceeding unit sales growth Adjusted EBITDA Growth Unit Sales Growth Non-GAAP Financial Information: Please visit ufpinvestor.com for reconciliation to related GAAP measurement. 22 |
|
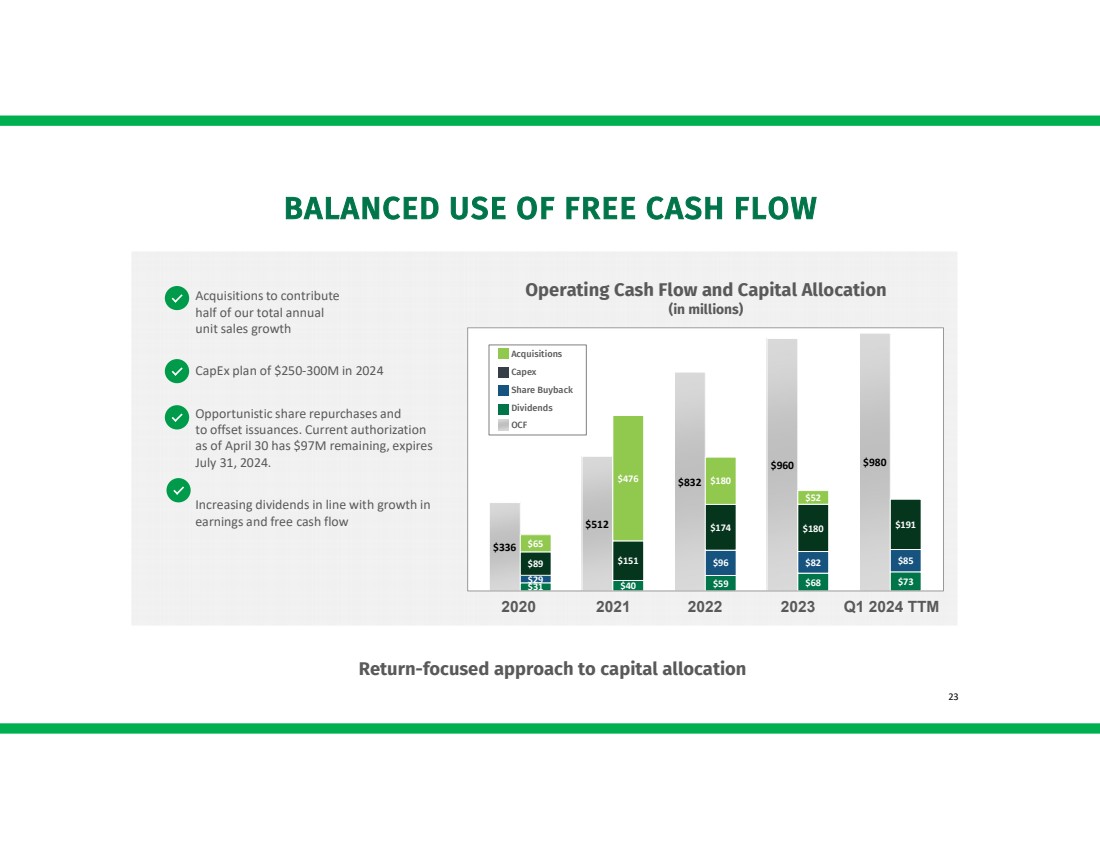
BALANCED USE OF FREE CASH FLOW Acquisitions to contribute half of our total annual unit sales growth CapEx plan of $250-300M in 2024 Opportunistic share repurchases and to offset issuances. Current authorization as of April 30 has $97M remaining, expires July 31, 2024. Increasing dividends in line with growth in earnings and free cash flow Return-focused approach to capital allocation $336 $512 $832 $960 $980 $31 $29 $40 $59 $68 $73 $96 $82 $85 $89 $151 $174 $180 $191 $65 $476 $180 $52 Acquisitions Capex Share Buyback Dividends OCF 2020 2021 2022 2023 Operating Cash Flow and Capital Allocation (in millions) Q1 2024 TTM 23 |
|
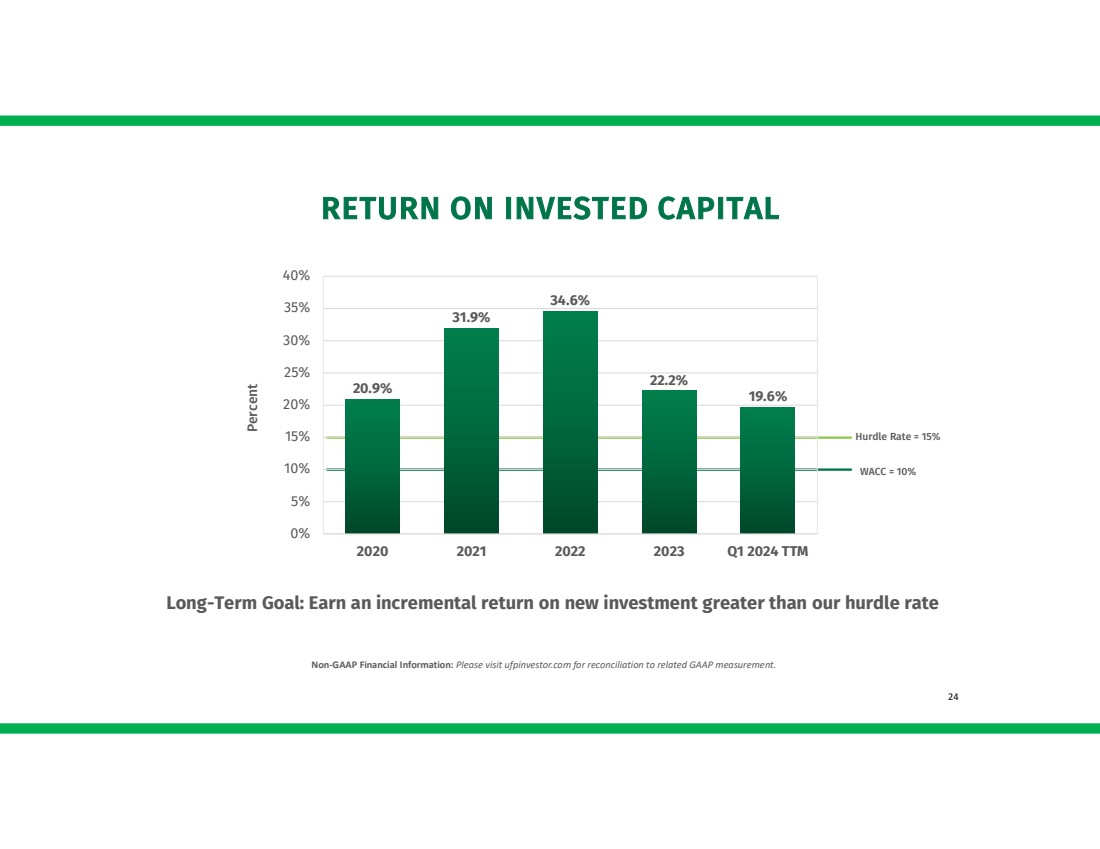
RETURN ON INVESTED CAPITAL Hurdle Rate = 15% Percent20.9% 31.9% 34.6% 22.2% 19.6% 0% 5% 10% 15% 20% 25% 30% 35% 40% 2020 2021 2022 2023 Q1 2024 TTM WACC = 10% Long-Term Goal: Earn an incremental return on new investment greater than our hurdle rate Non-GAAP Financial Information: Please visit ufpinvestor.com for reconciliation to related GAAP measurement. 24 |
|
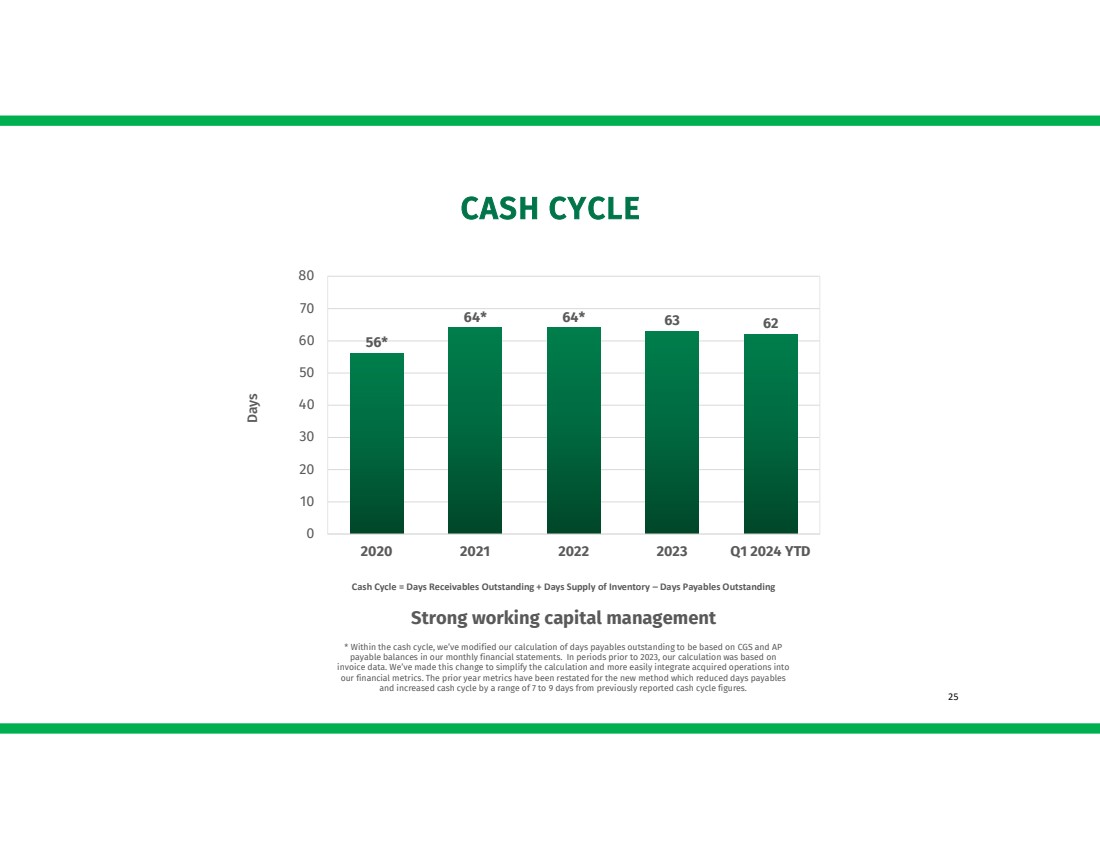
CASH CYCLE Cash Cycle = Days Receivables Outstanding + Days Supply of Inventory – Days Payables Outstanding 56* 64* 64* 63 62 0 10 20 30 40 50 60 70 80 2020 2021 2022 2023 Q1 2024 YTD Days * Within the cash cycle, we’ve modified our calculation of days payables outstanding to be based on CGS and AP payable balances in our monthly financial statements. In periods prior to 2023, our calculation was based on invoice data. We’ve made this change to simplify the calculation and more easily integrate acquired operations into our financial metrics. The prior year metrics have been restated for the new method which reduced days payables and increased cash cycle by a range of 7 to 9 days from previously reported cash cycle figures. Strong working capital management 25 |
|
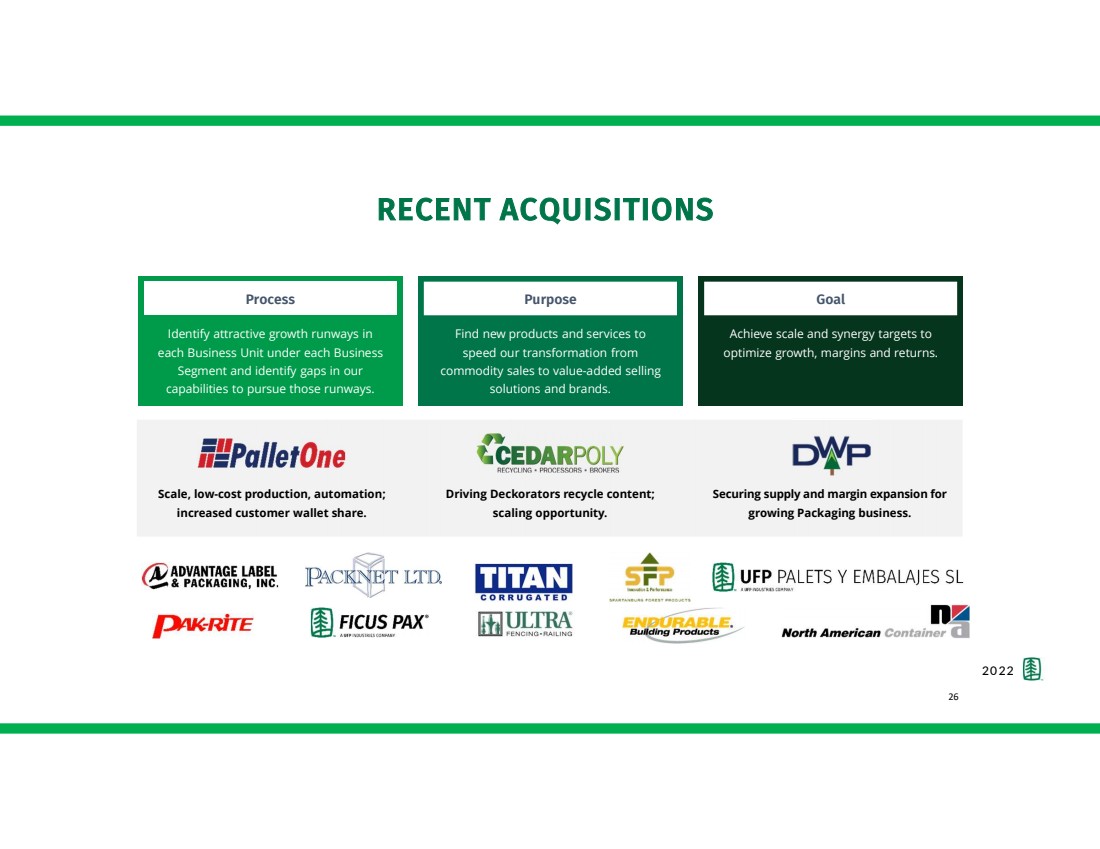
Process Identify attractive growth runways in each Business Unit under each Business Segment and identify gaps in our capabilities to pursue those runways. Find new products and services to speed our transformation from commodity sales to value-added selling solutions and brands. Purpose Achieve scale and synergy targets to optimize growth, margins and returns. Goal Scale, low-cost production, automation; increased customer wallet share. Driving Deckorators recycle content; scaling opportunity. Securing supply and margin expansion for growing Packaging business. 20 22 RECENT ACQUISITIONS 26 |
|
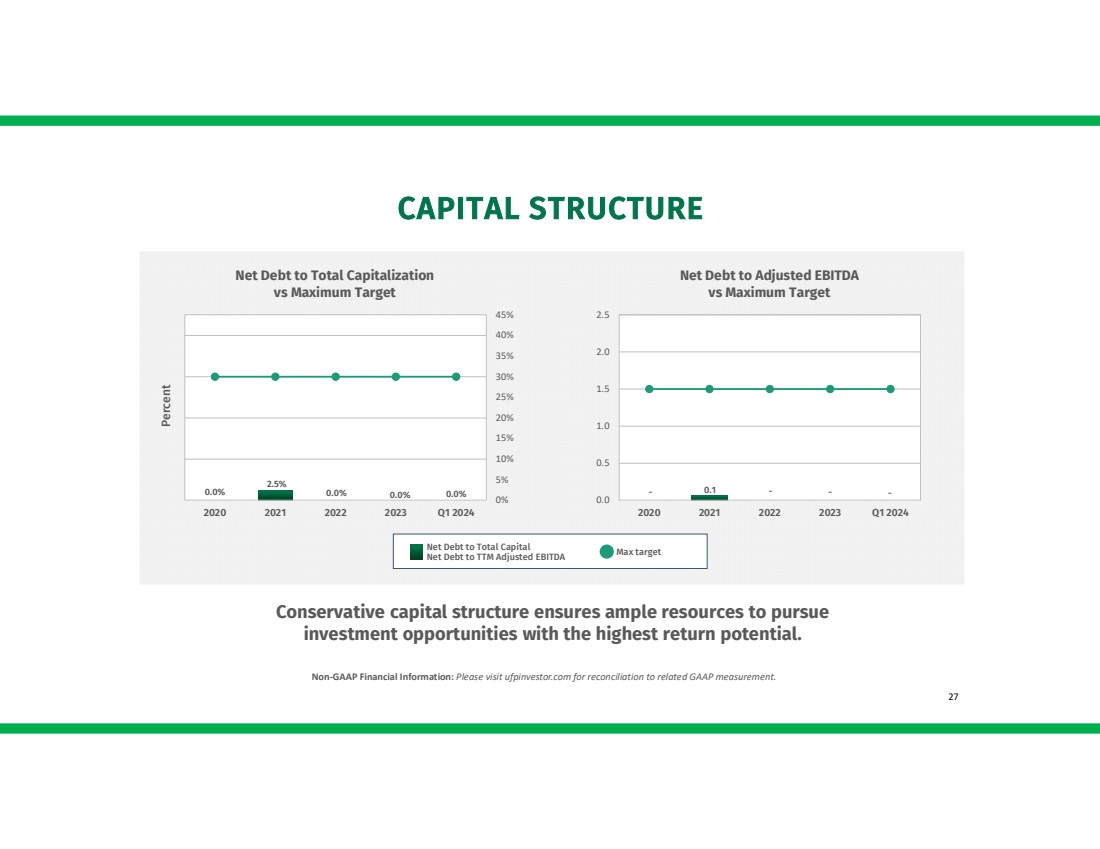
CAPITAL STRUCTURE Conservative capital structure ensures ample resources to pursue investment opportunities with the highest return potential. Net Debt to Total Capitalization vs Maximum Target Net Debt to Adjusted EBITDA vs Maximum Target 0.0% 2.5% 0.0% 0.0% 0.0% 0% 5% 10% 15% 20% 25% 30% 35% 40% 45% 2020 2021 2022 2023 Q1 2024 - 0.1 - - - 0.0 0.5 1.0 1.5 2.0 2.5 2020 2021 2022 2023 Q1 2024 Max target Net Debt to Total Capital Net Debt to TTM Adjusted EBITDA Percent Non-GAAP Financial Information: Please visit ufpinvestor.com for reconciliation to related GAAP measurement. 27 |
|
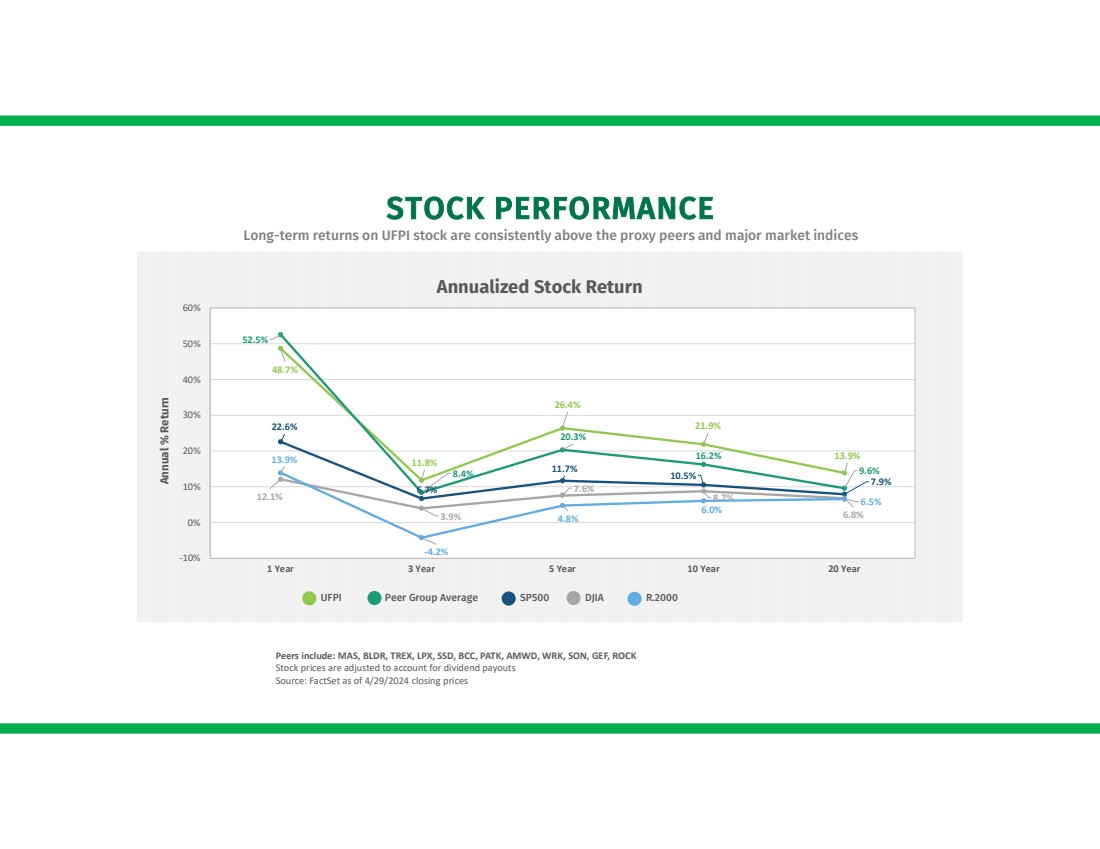
STOCK PERFORMANCE Long-term returns on UFPI stock are consistently above the proxy peers and major market indices Peers include: MAS, BLDR, TREX, LPX, SSD, BCC, PATK, AMWD, WRK, SON, GEF, ROCK Stock prices are adjusted to account for dividend payouts Source: FactSet as of 4/29/2024 closing prices 48.7% 11.8% 26.4% 21.9% 13.9% 52.5% 8.4% 20.3% 16.2% 9.6% 22.6% 6.7% 11.7% 10.5% 7.9% 12.1% 3.9% 7.6% 8.7% 6.8% 13.9% -4.2% 4.8% 6.0% 6.5% -10% 0% 10% 20% 30% 40% 50% 60% 1 Year 3 Year 5 Year 10 Year 20 Year Annual % Return Annualized Stock Return UFPI Peer Group Average SP500 DJIA R.2000 |
|
QUARTERLY RESULTS 29 |
|
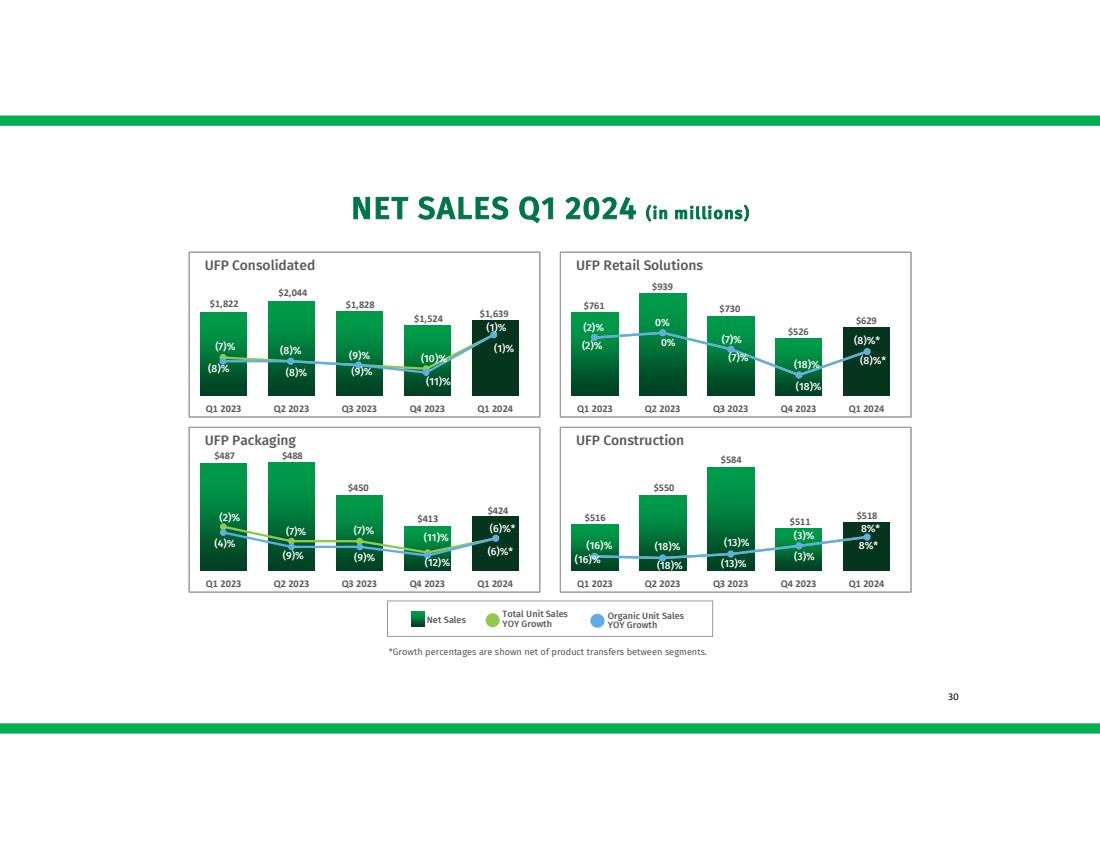
NET SALES Q1 2024 (in millions) $1,822 $2,044 $1,828 $1,524 $1,639 Q1 2023 Q2 2023 Q3 2023 Q4 2023 Q1 2024 UFP Consolidated $761 $939 $730 $526 $629 Q1 2023 Q2 2023 Q3 2023 Q4 2023 Q1 2024 UFP Retail Solutions $487 $488 $450 $413 $424 Q1 2023 Q2 2023 Q3 2023 Q4 2023 Q1 2024 UFP Packaging $516 $550 $584 $511 $518 Q1 2023 Q2 2023 Q3 2023 Q4 2023 Q1 2024 UFP Construction (7)% (8)% (9)% (10)% (1)% (8)% (8)% (9)% (11)% (1)% (2)% 0% (7)% (18)% (8)%* (2)% 0% (7)% (18)% (8)%* (2)% (7)% (7)% (12)% (6)%* (4)% (9)% (9)% (11)% (6)%* (16)% (18)% (13)% (3)% 8%* (16)% (18)% (13)% (3)% 8%* Organic Unit Sales YOY Growth Total Unit Sales YOY Growth Net Sales 30 *Growth percentages are shown net of product transfers between segments. |
|
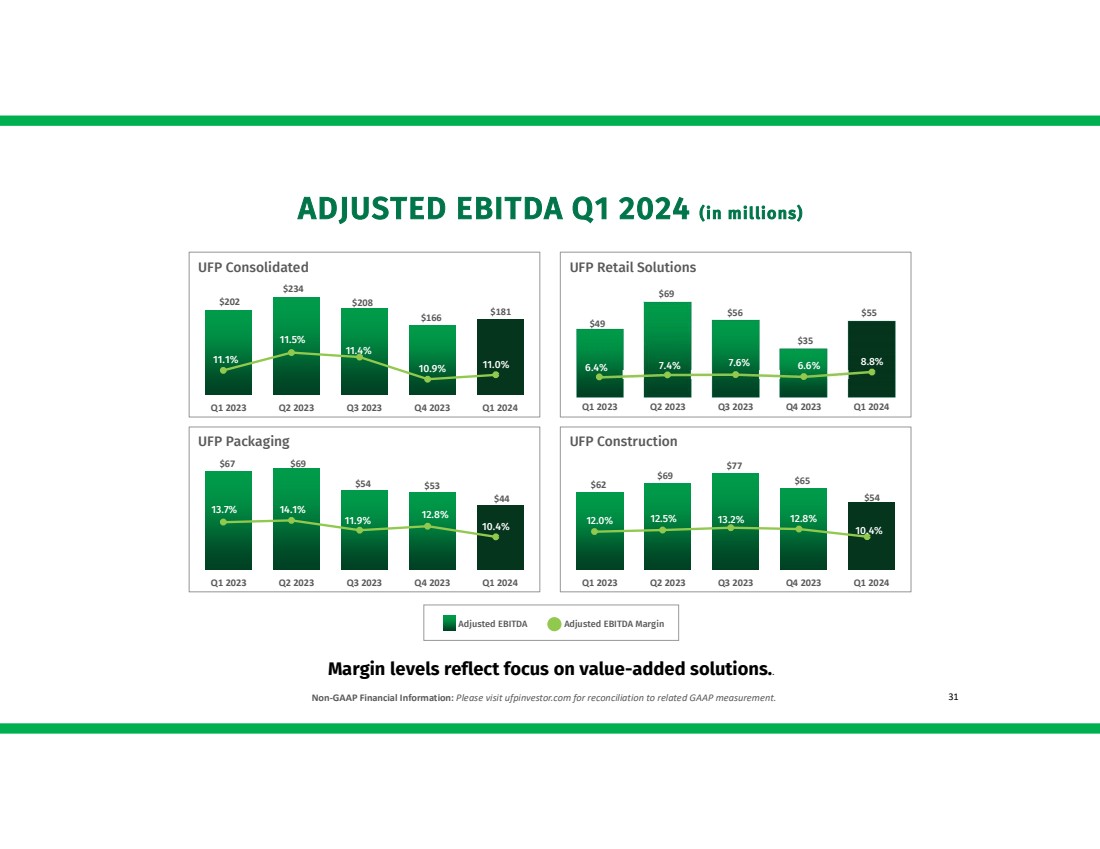
ADJUSTED EBITDA Q1 2024 (in millions) $202 $234 $208 $166 $181 Q1 2023 Q2 2023 Q3 2023 Q4 2023 Q1 2024 UFP Consolidated $49 $69 $56 $35 $55 Q1 2023 Q2 2023 Q3 2023 Q4 2023 Q1 2024 UFP Retail Solutions $67 $69 $54 $53 $44 Q1 2023 Q2 2023 Q3 2023 Q4 2023 Q1 2024 UFP Packaging $62 $69 $77 $65 $54 Q1 2023 Q2 2023 Q3 2023 Q4 2023 Q1 2024 UFP Construction 11.1% 11.5% 11.4% 10.9% 11.0% 6.4% 7.4% 7.6% 6.6% 8.8% 13.7% 14.1% 11.9% 12.8% 10.4% 12.0% 12.5% 13.2% 12.8% 10.4% Adjusted EBITDA Adjusted EBITDA Margin Non-GAAP Financial Information: Please visit ufpinvestor.com for reconciliation to related GAAP measurement. Margin levels reflect focus on value-added solutions.. 31 |
|
2801 E. Beltline Ave. NE Grand Rapids, MI 49506 (800) 598-9663 - UFPI.com THANK YOU 32 |