| Washington | 0-20355 | 91-1223280 | ||||||||||||
| (State or other jurisdiction of incorporation) |
(Commission File No.) |
(I.R.S. Employer Identification No.) |
||||||||||||
| ☐ | Written communications pursuant to Rule 425 under the Securities Act (17 CFR 230.425) | ||||
| ☐ | Soliciting material pursuant to Rule 14a-12 under the Exchange Act (17 CFR 240.14a-12) | ||||
| ☐ | Pre-commencement communications pursuant to Rule 14d-2(b) under the Exchange Act (17 CFR 240.14d-2(b)) | ||||
| ☐ | Pre-commencement communications pursuant to Rule 13e-4(c) under the Exchange Act (17 CFR 240.13e-4(c)) | ||||
| Title of each class | Trading Symbol(s) | Name of each exchange on which registered | ||||||||||||
| Common Stock, par value $.005 per share | COST | NASDAQ | ||||||||||||
| COSTCO WHOLESALE CORPORATION | |||||||||||
| Dated: December 12, 2024 | By: | /s/ Gary Millerchip | |||||||||
| Gary Millerchip | |||||||||||
| Executive Vice President and Chief Financial Officer | |||||||||||

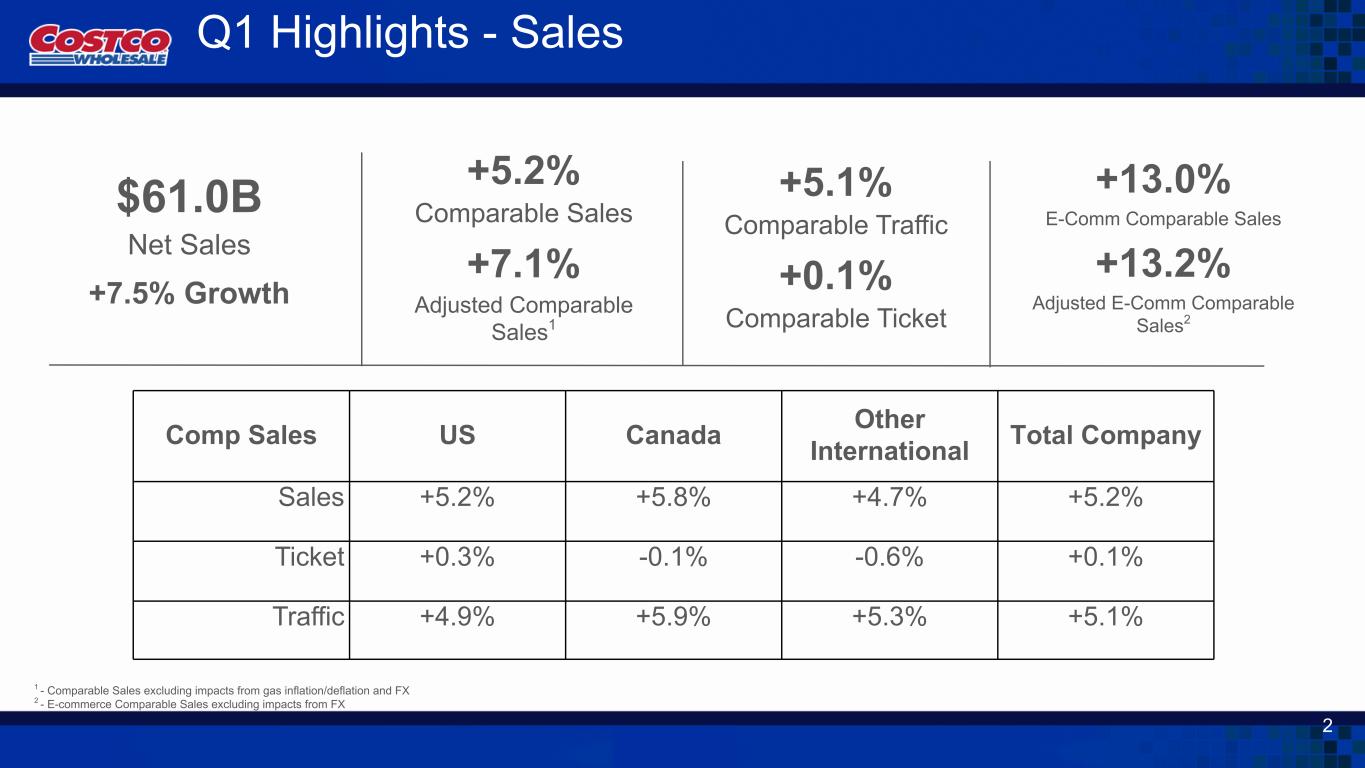
| 12 Weeks | 12 Weeks | ||||||||||
| Adjusted* | |||||||||||
| U.S. | 5.2% | 7.2% | |||||||||
| Canada | 5.8% | 6.7% | |||||||||
| Other International | 4.7% | 7.1% | |||||||||
| Total Company | 5.2% | 7.1% | |||||||||
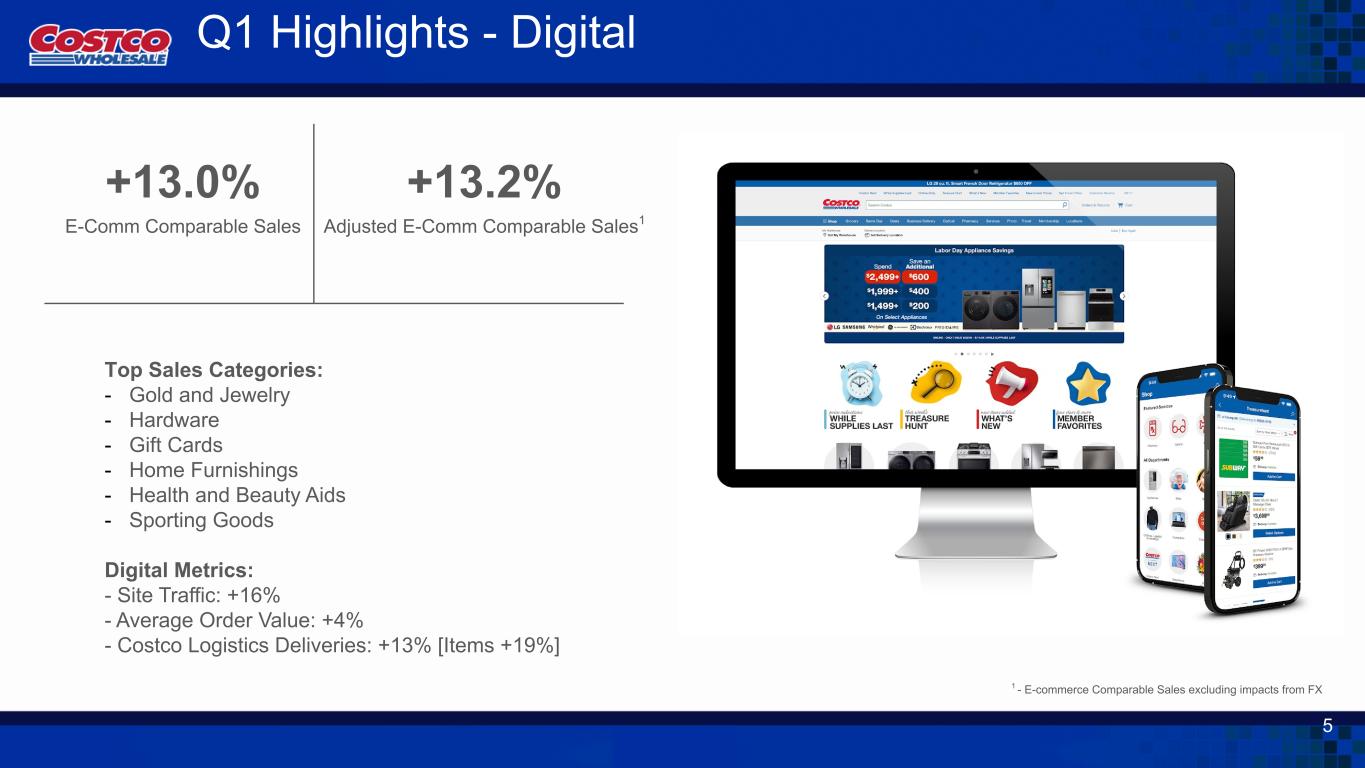
| E-commerce | 13.0% | 13.2% | |||||||||


| 12 Weeks Ended | |||||||||||
| November 24, 2024 |
November 26, 2023 |
||||||||||
| REVENUE | |||||||||||
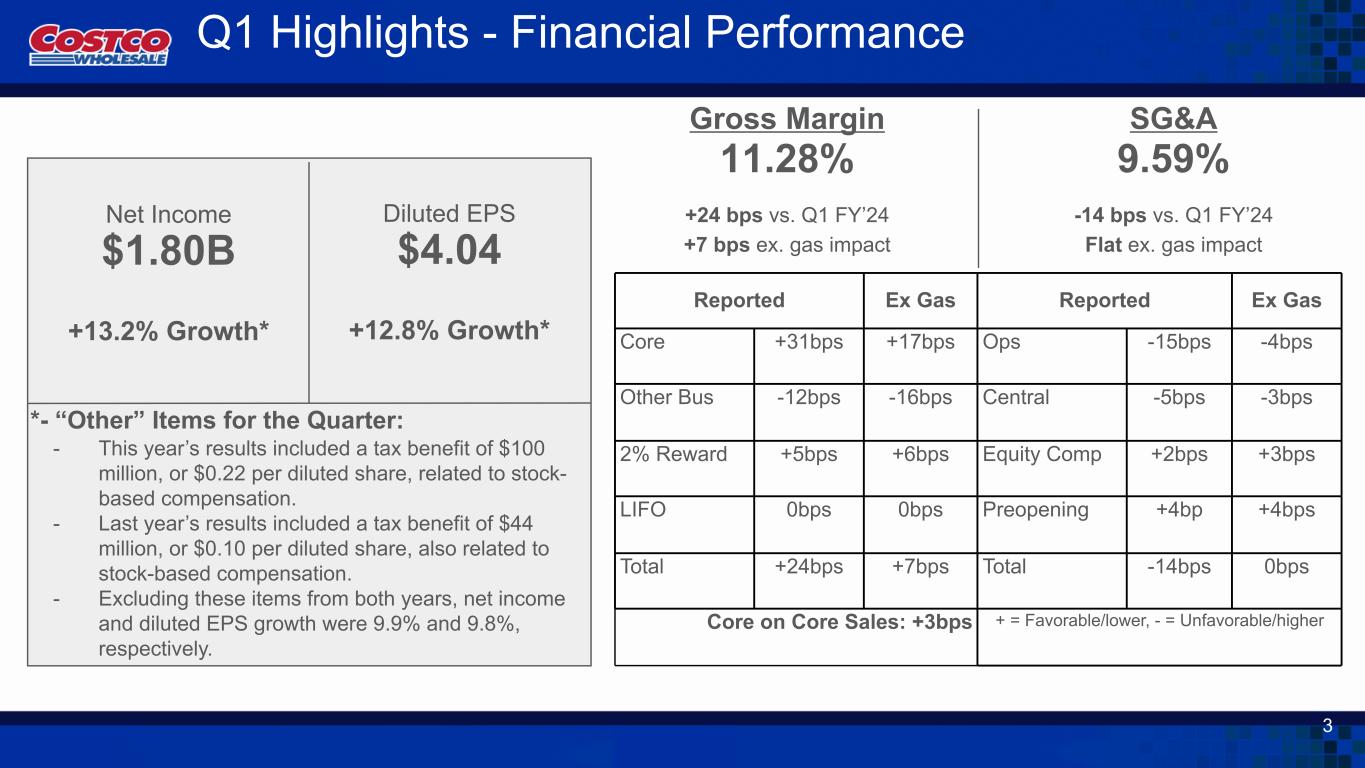
| Net sales | $ | 60,985 | $ | 56,717 | |||||||
| Membership fees | 1,166 | 1,082 | |||||||||
| Total revenue | 62,151 | 57,799 | |||||||||
| OPERATING EXPENSES | |||||||||||
| Merchandise costs | 54,109 | 50,457 | |||||||||
| Selling, general and administrative | 5,846 | 5,358 | |||||||||
| Operating income | 2,196 | 1,984 | |||||||||
| OTHER INCOME (EXPENSE) | |||||||||||
| Interest expense | (37) | (38) | |||||||||
| Interest income and other, net | 147 | 160 | |||||||||
| INCOME BEFORE INCOME TAXES | 2,306 | 2,106 | |||||||||
| Provision for income taxes | 508 | 517 | |||||||||
| NET INCOME | $ | 1,798 | $ | 1,589 | |||||||
| NET INCOME PER COMMON SHARE: | |||||||||||
| Basic | $ | 4.05 | $ | 3.58 | |||||||
| Diluted | $ | 4.04 | $ | 3.58 | |||||||
| Shares used in calculation (000's): | |||||||||||
| Basic | 443,988 | 443,827 | |||||||||
| Diluted | 444,891 | 444,403 | |||||||||

| November 24, 2024 |
September 1, 2024 |
||||||||||
| ASSETS | |||||||||||
| CURRENT ASSETS | |||||||||||
| Cash and cash equivalents | $ | 10,907 | $ | 9,906 | |||||||
| Short-term investments | 920 | 1,238 | |||||||||
| Receivables, net | 2,963 | 2,721 | |||||||||
| Merchandise inventories | 20,979 | 18,647 | |||||||||
| Other current assets | 1,754 | 1,734 | |||||||||
| Total current assets | 37,523 | 34,246 | |||||||||
| OTHER ASSETS | |||||||||||
| Property and equipment, net | 29,336 | 29,032 | |||||||||
| Operating lease right-of-use assets | 2,539 | 2,617 | |||||||||
| Other long-term assets | 3,988 | 3,936 | |||||||||
| TOTAL ASSETS | $ | 73,386 | $ | 69,831 | |||||||
| LIABILITIES AND EQUITY | |||||||||||
| CURRENT LIABILITIES | |||||||||||
| Accounts payable | $ | 21,793 | $ | 19,421 | |||||||
| Accrued salaries and benefits | 4,785 | 4,794 | |||||||||
| Accrued member rewards | 2,444 | 2,435 | |||||||||
| Deferred membership fees | 2,683 | 2,501 | |||||||||
| Other current liabilities | 6,584 | 6,313 | |||||||||
| Total current liabilities | 38,289 | 35,464 | |||||||||
| OTHER LIABILITIES | |||||||||||
| Long-term debt, excluding current portion | 5,745 | 5,794 | |||||||||
| Long-term operating lease liabilities | 2,288 | 2,375 | |||||||||
| Other long-term liabilities | 2,613 | 2,576 | |||||||||
| TOTAL LIABILITIES | 48,935 | 46,209 | |||||||||
| COMMITMENTS AND CONTINGENCIES | |||||||||||
| EQUITY | |||||||||||
Preferred stock $0.005 par value; 100,000,000 shares authorized; no shares issued and outstanding |
— | — | |||||||||
| Common stock $0.005 par value; 900,000,000 shares authorized; 443,942,000 and 443,126,000 shares issued and outstanding | 2 | 2 | |||||||||
| Additional paid-in capital | 7,901 | 7,829 | |||||||||
| Accumulated other comprehensive loss | (2,152) | (1,828) | |||||||||
| Retained earnings | 18,700 | 17,619 | |||||||||
| TOTAL EQUITY | 24,451 | 23,622 | |||||||||
| TOTAL LIABILITIES AND EQUITY | $ | 73,386 | $ | 69,831 | |||||||

| 12 Weeks Ended | |||||||||||
| November 24, 2024 |
November 26, 2023 |
||||||||||
| CASH FLOWS FROM OPERATING ACTIVITIES | |||||||||||
| Net income | $ | 1,798 | $ | 1,589 | |||||||
Adjustments to reconcile net income to net cash provided by operating activities: |
|||||||||||
| Depreciation and amortization | 548 | 501 | |||||||||
| Non-cash lease expense | 72 | 74 | |||||||||
| Stock-based compensation | 463 | 444 | |||||||||
| Other non-cash operating activities, net | (72) | 43 | |||||||||
Changes in working capital |
451 | 2,000 | |||||||||
| Net cash provided by operating activities | 3,260 | 4,651 | |||||||||
| CASH FLOWS FROM INVESTING ACTIVITIES | |||||||||||
| Purchases of short-term investments | (247) | (200) | |||||||||
| Maturities and sales of short-term investments | 541 | 878 | |||||||||
| Additions to property and equipment | (1,264) | (1,040) | |||||||||
| Other investing activities, net | (15) | (4) | |||||||||
| Net cash used in investing activities | (985) | (366) | |||||||||
| CASH FLOWS FROM FINANCING ACTIVITIES | |||||||||||
| Repayments of short-term borrowings | (194) | (173) | |||||||||
| Proceeds from short-term borrowings | 133 | 144 | |||||||||
| Proceeds from issuance of long-term debt | — | 498 | |||||||||
| Tax withholdings on stock-based awards | (389) | (292) | |||||||||
| Repurchases of common stock | (207) | (162) | |||||||||
| Cash dividend payments | (515) | (905) | |||||||||
| Financing lease payments and other financing activities, net | (21) | (84) | |||||||||
| Net cash used in financing activities | (1,193) | (974) | |||||||||
EFFECT OF EXCHANGE RATE CHANGES ON CASH AND CASH EQUIVALENTS |
(81) | — | |||||||||
| Net change in cash and cash equivalents | 1,001 | 3,311 | |||||||||
| CASH AND CASH EQUIVALENTS BEGINNING OF YEAR | 9,906 | 13,700 | |||||||||
| CASH AND CASH EQUIVALENTS END OF YEAR | $ | 10,907 | $ | 17,011 | |||||||
